Experimental study on Performance and Emissions of a Spark Ignition Engine fueled with Gasoline –...
24
The 23 rd . International Conference On: Environmental Protection is a Must. 11 – 13 May 2013, Alexandria, Egypt 1 Experimental Study on Performance and Emissions of Turbojet Engine Fueled by Alternative Biodiesel Mohamed Noureldin Ibrahim 1 , Ahmed Hamza H. Ali 1 and S. Ookawara 1, 2 1 Energy Resources Engineering Department, Egypt- Japan University of Science and Technology E-JUST, New Borg Elarab, Alexandria 21934, Egypt 2 Department of Chemical Engineering, Graduate School of Science and Engineering, Tokyo Institute of Technology, Tokyo, Japan (Email: [email protected], [email protected] ) (Email: [email protected]) Abstract The effect of two different kinds of biodiesel on performance characteristics and emissions of turbojet engine is investigated experimentally and compared with the engine recommended fuel (JetA-1) in this work. Two different kinds of biodiesel that are Cotton Methyl Ester (CTME) and Corn Methyl Ester (CRME) and their blends of 10%, 20% and 50% biodiesel/JetA1 by volume are produced, characterized and investigated experimentally in this study. The turbojet engine used in this work is fully equipped with pressure, flow, temperature, thrust and speed sensors in addition to data acquisition system and control unit. Exhaust gas analyzer is used at turbojet engine exit to measure the exhaust gases composition that are O 2 , CO, CO 2 , HC, NO x , and SO 2 . The performance characteristics of the engine are identified by engine speed, static thrust, thrust-specific fuel consumption (TSFC) and thermal efficiency. The results show that biodiesel fuels have a higher density, kinematic viscosity, flash point and pour point than JetA-1 fuel, while, their calorific value, carbon and hydrogen contents is close to JetA-1 fuel. Moreover, the results show that the performance parameters for biodiesel are close to those for JetA-1. The static thrust for JetA-1 and all tested biodiesel fuel are very close while the TSFC for biodiesel fuel blends is lower than JetA-1. As expected the engine efficiency of biodiesel was higher than Jet A-1 because of the oxygen content on biodiesel chemical composition which leads to a leaner and more complete combustion. JetA-1 fuel has higher combustor exit temperature and exhaust gas temperature compared with biodiesel fuel blends. Biodiesel fuels and its blends have higher O 2 concentration in the exhaust compared
-
Upload
independent -
Category
Documents
-
view
4 -
download
0
Transcript of Experimental study on Performance and Emissions of a Spark Ignition Engine fueled with Gasoline –...

The 23rd. International Conference On: Environmental Protection is a Must. 11 – 13 May 2013, Alexandria, Egypt
1
Experimental Study on Performance and Emissions of
Turbojet Engine Fueled by Alternative Biodiesel
Mohamed Noureldin Ibrahim1, Ahmed Hamza H. Ali
1 and S. Ookawara
1, 2
1Energy Resources Engineering Department, Egypt- Japan University of Science and Technology E-JUST,
New Borg Elarab, Alexandria 21934, Egypt 2Department of Chemical Engineering, Graduate School of Science and Engineering, Tokyo Institute of
Technology, Tokyo, Japan
(Email: [email protected], [email protected] ) (Email: [email protected])
Abstract
The effect of two different kinds of biodiesel on performance characteristics
and emissions of turbojet engine is investigated experimentally and
compared with the engine recommended fuel (JetA-1) in this work. Two
different kinds of biodiesel that are Cotton Methyl Ester (CTME) and Corn
Methyl Ester (CRME) and their blends of 10%, 20% and 50%
biodiesel/JetA1 by volume are produced, characterized and investigated
experimentally in this study. The turbojet engine used in this work is fully
equipped with pressure, flow, temperature, thrust and speed sensors in
addition to data acquisition system and control unit. Exhaust gas analyzer is
used at turbojet engine exit to measure the exhaust gases composition that
are O2, CO, CO2, HC, NOx, and SO2. The performance characteristics of the
engine are identified by engine speed, static thrust, thrust-specific fuel
consumption (TSFC) and thermal efficiency. The results show that
biodiesel fuels have a higher density, kinematic viscosity, flash point and
pour point than JetA-1 fuel, while, their calorific value, carbon and
hydrogen contents is close to JetA-1 fuel. Moreover, the results show that
the performance parameters for biodiesel are close to those for JetA-1. The
static thrust for JetA-1 and all tested biodiesel fuel are very close while the
TSFC for biodiesel fuel blends is lower than JetA-1. As expected the engine
efficiency of biodiesel was higher than Jet A-1 because of the oxygen
content on biodiesel chemical composition which leads to a leaner and more
complete combustion. JetA-1 fuel has higher combustor exit temperature
and exhaust gas temperature compared with biodiesel fuel blends. Biodiesel
fuels and its blends have higher O2 concentration in the exhaust compared

The 23rd. International Conference On: Environmental Protection is a Must. 11 – 13 May 2013, Alexandria, Egypt
2
with JetA-1 fuel while JetA-1 has a higher CO and HC concentration
compared with other biodiesel fuels. Biodiesel fuels have higher CO2 and
NOx emissions and a lower SO2 compared to JetA-1. Biodiesel is more
environmental friendly than JetA-1 fuel.
1. Introduction
Biodiesel is a renewable fuel source, comprised of mono-alkyl
methyl esters of long chain fatty acids derived from vegetable oils and
considered as nontoxic, biodegradable fuel, and reduces serious air
pollutants. Blending biodiesel with petrol and fossil fuels makes it possible
to be used directly in the combustion engines without any engine
modifications and reduces the emissions of CO, HC and SO2 that exhausted
from the engine. However, as the biodiesel blend amount increases those
gases emissions decreases. Testing the effect of biodiesel fuels on diesel
engine performance and emissions has been widely covered by many
researchers unlike the performance of the gas turbine engines fueled by
biodiesel fuels. Habib et Al. [1] studied the performance and emission of a
30 kW gas turbine engine using Jet A of 100% (B100) and 50% (B50)
blends of Soy Methyl Ester (SME), Canola Methyl Ester (CME) and
Recycled Rapeseed Methyl Ester (RRME). They reported that the CO2
emissions values for the B50 for all biodiesel fuels didn't change
significantly from Jet A correspondence value. However, the CO2
concentration in the exhaust for pure biofuels (B100) was slightly higher
than that for Jet A and this may returns to that the equivalence ratios for
biofuels were lower than Jet A, while the equivalence ratio "Φ" is defined as
the ratio between actual air to fuel ratio to the stoichiometric air to fuel ratio
and it defines the deviation of the mixture from stoichiometric conditions as
following: Φ<1 for lean condition and as the value of Φ become smaller
than 1 the combustion process become leaner, while Φ=1for stoichiometric
condition, however Φ>1 for rich condition. Therefore, a leaner combustion
achieved and resulting in higher CO2 concentration in the exhaust and
consequently lower CO emissions for all biofuels. Also, B50 for all tested
biodiesel fuels produced lower CO thrust specific emission index than the
B100 blends, while the thrust specific emission index is defined as the mass
of pollutant emitted per unit time per unit thrust generated. Moreover, Habib
et Al. [1] cited that NO emissions form Jet A fuel was higher than NO
emissions for all biofuels blends fuels, in addition, NO formation was not
dominated by the thermal mechanism as the turbine inlet temperatures were
comparable for all fuels. Also, they added that the B50 of different biofuels
produced lower NO per unit thrust than biofuels of B100. Nascimento et al.
[2] investigated the performance and emissions of a 30kW diesel micro-
turbine engine at full and partial loads for steady state operating conditions.

The 23rd. International Conference On: Environmental Protection is a Must. 11 – 13 May 2013, Alexandria, Egypt
3
They used different blends (B5-B100) of castor biodiesel. They cited that
the NOx emissions for pure biodiesel were lower than the emissions for
diesel fuel and as known NOx emissions have three formation mechanisms:
thermal NOx, Prompt NOx and Fuel NOx. Thermal NOx formed due to high
temperature oxidation of the atmospheric nitrogen atom founded in the
combustion air, while, prompt NOx formed by the reaction of atmospheric
nitrogen with radicals such as HC that derived from the fuel and the Fuel
NOx is generated mainly by oxidation of the nitrogen atom founded in the
chemical composition of the fuel and as there is no nitrogen atoms founded
in the fuel chemical composition so the generated NOx emissions are from
thermal and prompt mechanisms. Also, they cited that, no SO2 emissions for
the case of biodiesel fuel were found in the engine exhaust gases as the
biodiesel fuels have no sulfur in their composition. For CO emissions,
Nascimento et al. [2] pointed that CO for pure biodiesel was higher than the
emissions for conventional diesel and this due to the poor atomization and
evaporation characteristics of biodiesel fuels. For the same injection system
and different fuels with different viscosities, as the viscosity of the fuel
become higher the efficiency of the atomization process of the fuel become
lower and the size of fuel droplets become larger in the fuel spray and
consequently the air and fuel mixing process become harder and a rich
mixture is formed and consequently a rich combustion process happened
which is the main reason for CO and HC formation. Due to that castor
biodiesel presents higher viscosity than diesel and there were no
modifications with engine fuel injection, the size of the droplets and the
primary-zone equivalence ratio must be different for biodiesel and diesel.
Rehman et al. [3] used Jatropha oil blended with diesel fuel in a gas turbine
engine used for power generation. They indicated that CO emissions for
different blends of biodiesel were lower than diesel. The cited that this is
due to higher oxygen content of jatropha oil which improves combustion
process, therefore, CO emissions for B25 are lower than that of B15 due to
more oxygen content in B25 than in B15. Moreover, HC emissions for the
case of B15 and B25 are lower when compared with the case of diesel fuel
due to higher fuel oxygen content of biodiesel. Also, the HC emissions for
the case of B25 are lower than that for B15 again and this is due reason
related to the percent of oxygen in fuel. In their study, NOx emissions
(thermal NOx and prompt NOx) for B15 and B25 were higher than that
obtained with diesel fuel. This is due to that the cetane number for the
biodiesel is higher than diesel fuel and the NOx emission for B25 is higher
than that of B15 which can again be attributed to the same reasons
combined with higher cycle temperature achieved during the combustion
process. Lee et al. [4] simulated a combustor of 60KW industrial gas turbine
and compared the combustion performance of DME (dimethyl ether) with

The 23rd. International Conference On: Environmental Protection is a Must. 11 – 13 May 2013, Alexandria, Egypt
4
methane in terms of NOx emissions, CO emissions and the combustion
chamber outlet temperature. They reported that, low NOx and CO emissions
were found during the test of DME. Also, low flue gas temperature at the
combustion chamber outlet was found of DME combustion, therefore
reduces the thermal failure of turbine blades. Krishna [5] tested biodiesel
blends as a fuel in unmodified 30kW power generation micro gas turbine.
Through his experiment, the biodiesel was added to the blend to reduce the
sulfur contents of the fuel, consequentially the emission of sulfur dioxide.
For CO and NOx emissions, Krishna [5] reported that the CO emission for
biodiesel was lower than the case of diesel fuel and the NOx level was lower
with the increase of biodiesel in the blend and it is lowest value with pure
biodiesel of B100. Purssi et al. [6] measured the emissions concentration of
different blends of biodiesel fuels at different injection temperature on
micro gas turbine engine. They cited that, the higher the injection
temperature, the lower the CO and NOx concentration in the exhaust stream.
Also, the CO emissions for vegetable oil at nominal condition were almost
same for the case diesel fuel. While at higher load CO emissions for SVO
were higher than the case of diesel fuel. Moreover, they reported that higher
NOX emissions were observed for SVO than for the case of diesel fuel and
this may be due to existence of a small amount of nitrogen in the vegetable
oil leading to the possibility of fuel NOx formation. Nascimento et al. [7]
investigated 30KW diesel micro gas turbine engine using palm biodiesel,
castor biodiesel and soybean biodiesel fuels. They reported that palm and
castor Biodiesel fuels produced larger CO emissions than for the case of
diesel fuel with quantitative values of 4 and 3 mg/(kW.hr) respectively at
full load. This unlike the soybean biodiesel fuel case which produced CO
emissions with value lower than 2 mg/(kW.hr). For NOx emissions, they
reported that the NOx reduction was about 26.60% for castor biodiesel,
12.66% for soybean biodiesel and 22.78% for palm Biodiesel compared to
diesel fuel for the case of the engine operated at the full load and there was
no significant reduction at partial or medium engine loads. Allouis et al. [8]
measured the ultrafine particles at the exhaust of a power generation micro
gas turbine fueled by liquid fuels including diesel fuel, a mixture of the
diesel fuel with a biodiesel and kerosene. They reported that an increase of
the turbine load combined with addition of 50% of biodiesel lead to do no
changes in the size of the ultrafine particles in the exhaust, however, it leads
to decrease of the amount of formed particles while for the case of kerosene
it produces larger amount of ultrafine particles in exhaust. Throughout their
study the particle sizes were measured with the diesel fuel and compared
with the results on a diesel engine operated at the same conditions and using
the same fuel and producing the same power, diesel engines emits larger
amounts of ultra-fine particles compared to the gas turbine engine and the

The 23rd. International Conference On: Environmental Protection is a Must. 11 – 13 May 2013, Alexandria, Egypt
5
emitted particles have the same size of the particles produced by the gas
turbine. Nascimento and Santos [9] presented overview for experiments
done by seven researchers during eleven years from 1995 to 2006. Those
researchers utilized biodiesel to drive gas turbine engines mostly used for
power generation. Throughout their studies, they used castor biodiesel,
biogas, rapeseed biodiesel, soybean biodiesel, sunflower biodiesel and
animal fats. They concluded that using castor biodiesel fuels and preheat it
to 40 oC leads to reduction in emissions of CO and NOx in the exhaust gases
compared with conventional diesel, in addition to CO2 emissions were
reduced for the case when the engine was fueled by biodiesel. Moreover,
biodiesel fuels didn't show a noticeable increase in emissions of particulate
matter compared to the jet fuel. However, sometimes an increase of CO
content in the exhaust gases with the increase in the percentage of biodiesel
in the blend and that was due to the reduction in combustion efficiency.
They cited that burning biodiesel from rapeseed, sunflower and animal fats
showed a significant increase in emissions of CO and CO2 at full load and
reduction in NOx emissions.
Through the literature review, clearly the performance and emission
of gas turbine engines operated with biodiesel were widely covered;
however, most of the tested gas turbine engines in the literature are
industrial type that used for power generation. While, there are limited
research work in the literature investigating both the performance and
emission of a turbojet engines used for aviation and military applications
when its fueled with biodiesel. Moreover, there are still some types of
biodiesel fuels such as corn and cotton biodiesel have not been investigated
for performance and emissions of turbojet engines.
Therefore, this study aims to investigate experimentally the
performance and emissions of turbojet engine when fueled by two different
types of biodiesel fuels named Cotton Methyl Ester (CTME) and Corn
Methyl Ester (CRME) and their blends of B10, B20 and B50 with JetA-1
fuel compared with JetA-1 fuel at different throttle valve position of 10%,
30%, 50%, 70% and 90% of the full open respectively.
2. Biodiesel Production and Characterization
In this study, biodiesel fuels are produced through a chemical
process called transesterification. The aim from the production process is to
reduce the high viscosity of the used oils. Through transesterification
process the large branched triglyceride molecules of vegetable oils and fats
transformed into smaller straight long chain molecules which are almost
similar in size to the molecules of the species present in diesel fuel and
glycerin. At first, the oil should be wormed up to 40oC and filtered to
remove solid particles. The second step is to prepare the catalyst which is

The 23rd. International Conference On: Environmental Protection is a Must. 11 – 13 May 2013, Alexandria, Egypt
6
sodium methoxide by adding 5.5 (g/l oil) of NaOH to 250 (ml/l oil) of
methanol and mixing them together until the NaOH is completely dissolved
in the solution. After that, the oil should be heated up to 110-120oC and then
the oil should be removed away from the heater and adding sodium
methoxides as drops and mix it strongly for 15-20 min with a good mixing
device. After 2-5 hr., the biodiesel is float on top of the mixture, while, the
denser glycerin is congealed on the bottom of the container, the biodiesel
can be separated easily by draining it out of the container. Then, wash the
biodiesel for 2 or 3 times with water to ensure removal of any glycerin and
soap. After washing biodiesel, the last step is to remove residual water in the
biodiesel by heating the washed biodiesel up to 100oC to ensure the
complete removal of the residual water from washed biodiesel. The
produced biodiesel fuels are characterized according to ASTM D6751,
ASTM D97 and ASTM D240 standards as shown in Table 1. It is clear from
Table 1 that biodiesel fuels have a higher density, kinematic viscosity, flash
point and pour point than JetA-1 fuel, while, their calorific value, carbon
and hydrogen contents is very close to JetA-1 fuel. However, the JetA-1 fuel
has higher sulfur content than other biodiesel fuels. Blending biodiesel with
JetA-1 can be a suggestion to overcome the problem of the higher viscosity
of the pure biodiesel fuels.
Table 1. Physical and Chemical Properties of Pure Biodiesel Fuels and Jet A-1
Properties Test Code JetA-1 CTME
B100
CRME
B100
Density at 15.5oC ASTM D-1298 0.797 0.8938 0.8924
Kinematic Viscosity, cSt, at
40oC
ASTM D-445 1.08 7.34 6.92
Pour Point oC ASTM D-97 -43 -3 -12
Flash Point oC ASTM D-93 39 175 173
Sulfur Content, ppm ASTM D-4294 50.3 15.2 10.2
Higher Calorific Value
(kJ/kg) ASTM D-240 46329 44649 44914
Lower Calorific Value
(KJ/kg) ASTM D-240 43465 42189 42376
Hydrogen Content (%mass) 13.48 11.58 11.6
Carbon content (% mass) 86.51 88.42 88.4
3. Experimental Setup
A turbojet engine test facility that fully equipped with the required
measuring sensors is used in this study to investigate the performance and
emissions of different types of biodiesel fuels. The test facility contains
turbojet engine which generates up to 230 N of thrust and equipped with
pressure, flow, temperature, thrust and speed sensors in addition to data
The 23rd. International Conference On: Environmental Protection is a Must. 11 – 13 May 2013, Alexandria, Egypt
7
acquisition system and control unit (ECU). The exhaust gases are passed
after engine exit through water cooled sampling probe that is fixed at the
engine nozzle exit. The probe catches the cooled exhaust sample that
transferred to exhaust gas analyzer by a long hose. The basic turbojet engine
specifications are given in Table 2. The fuel throttle valve is controlled
using ECU unit and consequently control the engine speed. A 4.5% of
lubricating oil is added to fuel tank and mixed with the used fuel as there is
no separate oil tank, also, the engine is supplied with two fuel filters one is
placed inside the fuel tank at the start of the suction line and the other is
placed before the fuel pump. Propane canister is used in the engine start up
in order to make engines reaches its operating temperature rapidly.
Table 2: Olympus E-start HP gas turbine main data
Engine Type Turbojet – Single spool
Engine Name Olympus E-start HP gas turbine
Diameter 131 mm
Length 384 mm
Turbine weight 2850 g
Compressor Single stage radial compressor
Combustion Chamber Annular combustion chamber
Turbine Single stage axial flow turbine.
Pressure ratio at max. rpm 3.8 :1
Maximum RPM 108,500 rpm
Thrust at max. RPM 230 N
Thrust at min. RPM 13 N
Mass flow at max. rpm 450 g/sec
Fuel consumption at max. rpm 640 g/min
Normal EGT 700 oC
Max. EGT 750 oC
Fuel Type Liquid fuel ( Kerosene or JetA-1)
The engine is equipped with five k-type thermocouples and pressure
sensors to measure temperature and pressure at the compressor inlet,
compressor exit, turbine inlet, turbine exit and thrust nozzle exit. Also, the
engine is equipped with turbine flow meter, thrust cell and shaft speed
sensor to measure fuel flow rate, static thrust and engine rotational speed
respectively. The detailed sensors specifications are shown in Table 3. The
schematic diagram shown at figure 1 indicates the layout of the connection
between engine, sensors, control unit and user pc. Sensors and equipment
allow to measure and calculate static thrust, thrust-specific fuel consumption
(TSFC), engine efficiency, exhausts gas speed and intake air speed. A fuel

The 23rd. International Conference On: Environmental Protection is a Must. 11 – 13 May 2013, Alexandria, Egypt
8
manifold is added to the gas turbine fuel delivery system to allow the engine
to start on Jet A-1, switch to the test fuel for the experiment, and then end
experiments with Jet A-1 to purge the biofuel from the system and this
prevent the damage of the fuel delivery system.
Table 3: The engine quipped Sensors and their specifications
Sensor Type Specification
Temperature sensors K-Type thermocouples
Pressure sensors 0-15 psi Honeywell manufacture
Fuel Flow meter 0.1 to 2.5 l/min turbine flow meter and
measures up to 15 CST viscosity fluids
Speed sensor (rpm) 0-130,000 rpm Armfield shaft speed
sensor
Thrust (force) sensor 0-20 kg thrust cell
Figure 1. Turbojet Engine schematic diagram with measuring sensors.
The E-Instrument industrial combustion and emissions analyzer
E8500 is used to measure the exhaust concentrations of O2, CO, NO, NO2,
CxHy and CO2. A fabricated water cooled probe is fixed to the outlet of
nozzle of the engine to enable the sudden cooling of the exhaust sample for
emissions measurements. The gas samples were pretreated to remove
particulate and moisture before deliver into the analyzers. The Exhaust gas
analyzer specifications are provided in Table 4.

The 23rd. International Conference On: Environmental Protection is a Must. 11 – 13 May 2013, Alexandria, Egypt
9
Table 4: The measuring ranges of E-Instrument Industrial Combustion and
Emissions Analyzer E8500
Emission Sensor Type Range Least Count
CO2 NDIR 0 - 20 % 0.1 %
CO (Low range) Electrochemical 0 - 8000 ppm 1 ppm
CO (High range) NDIR 0 - 15 % 0.01 %
O2 Electrochemical 0 - 25 % 0.1 %
CxHy NDIR 0 - 3 % 0.01%
NO Electrochemical 0 - 4000 ppm 1 ppm
NO2 Electrochemical 0 - 1000 ppm 1 ppm
SO2 Electrochemical 0 - 4000 ppm 1 ppm
4. Presentation Parameters
4.1 Engine Efficiency
The engine efficiency represents the energy conversion within the turbojet
engine itself and sometimes is called as internal energy. The efficiency for
the turbojet engine is defined as the ratio between the power imparted to
engine airflow and the rate of energy supplied in the fuel. Also, it defines
how efficiently the chemical energy stored in the fuel is converted to kinetic
energy of the exhaust gases and accounts for both combustion efficiency
and thermodynamic cycle efficiency [1]. The efficiency is calculated as
follows:
[( )]( )
(1)
Where T is the thrust and it is measured using the load cell, u is the
air inlet velocity and it can be calculated from the air mass flow rate and
cross section area of the inlet duct, ue is the exhaust velocity and it
calculated from the exhaust mass flow rate and cross section area of the
nozzle, ṁf is the fuel mass flow rate and its measured by a rotor flow meter,
f is the fuel to air ratio is calculated from mass flow rate of the fuel and
mass flow rate of the air, also, CV is the fuel calorific value and it measured
according to ASTM D-240.

The 23rd. International Conference On: Environmental Protection is a Must. 11 – 13 May 2013, Alexandria, Egypt
10
4.2 Exhaust Emissions
Equivalence ratio "Φ" is defined as the ratio between the actual air to
fuel ratio to the stoichiometric air to fuel ratio and it is used to define the
deviation of the mixture from stoichiometric conditions and given by:
)
) (2)
5. Results and Discussion
The turbojet engine performance and emissions when fueled by
CTME and CRME biodiesel fuels and their blends of B10, B20 and B50
with JetA-1 fuel are characterized at different engine throttle valve position
of 10%, 30%, 50%, 70% and 90% and compared with the case of 100%
JetA-1 and the results as shown through figures (2-13) respectively. In the
following results discussion, the throttle valve position of 50% is taken as
the normal operating condition for the turbojet engine. Therefore, the
performance parameters and emissions for different fuels are compared at
50% throttle valve position. Moreover, the effect of increasing biodiesel
percentage in the blend on the engine performance and emissions of the
engine has been discussed through the following sections.
5.1 Engine Performance
5.1.1 Effect of Biodiesel Fuel Blends on Engine Static Thrust
The measured engine static thrust as a function of the fuel mass flow
rate is shown in figure 2. Clearly from the figure, it can be seen that as the
fuel mass flow rate increased the engine rotational speed increases,
consequently both the rate of intake air and exhaust gases are increased too
which resulted in higher static thrust value. For the presented results in the
figure, the fuel mass flow rate is ranged from 9.06 kg/hr to 41.41 kg/hr and
the correspondence engine static thrust is ranged from 24.02N to194N,
respectively. For the throttle valve position of 50%, which represent the
normal operating conditions of the turbojet engine, the engine static thrust is
ranged from the lowest value 123.17N for CRME B50 to the highest value
of 139.18N that recorded for JetA-1 fuel. Therefore, the maximum deviation
in the engine thrust value for CRME B50 from that of JetA-1value is lower
by about 11.5%. While, increasing the biodiesel fuel percentage in the blend
have no significant effect on the engine static thrust. However, based on the
fact that the biodiesel fuels has higher viscosity, therefore, a the percent of
biodiesel fuel increase in the blend leads to decrease the fuel mass flow rate
followed by the decrease in both engine rotational speed ant the static thrust.
Therefore, for all runs the JetA-1 fuel has the highest static thrust at most of
throttle valve positions and static thrust decreases by increasing the blend
ratios. From these results it can be concluded that the static thrust value for

The 23rd. International Conference On: Environmental Protection is a Must. 11 – 13 May 2013, Alexandria, Egypt
11
biodiesel fuel is not lower than 11.5% as well as and not higher than 1.62%
compared with standard engine JetA-1 fuel. Moreover, at throttle valve
position of 50%, the biodiesel fuels CTME blends have higher static thrust
compared to CRME fuel blends.
5.1.2 Effect of Biodiesel Fuel Blends on Engine Speed
The effect of different blends of biodiesel fuel on engine rotational
speed as a function of the fuel mass flow rate is shown in figure 3. As can
be seen from the figure, in general the engine speed is a direct function of
fuel mass flow rate, from the figure as the fuel mass flow rate changed from
9.06 kg/hr to 41.41 kg/hr the engine speed is increased from 46072.5 rpm to
103066 rpm. Comparing different blends of biodiesel fuels with JetA-1 fuel
at throttle valve position of 50%, the highest engine speed is recorded for
JetA-1 with a value of 90931.64 rpm while the lowest engine speed is
recorded for CRME B10 with a value 86214.33 rpm which is about 5.18%
lower than the JetA-1fuel case. In basic, the engine speed is a function of
fuel mass flow rate, at throttle position of 50% the JetA-1 has the highest
value of the fuel mass flow rate of 26.74 kg/hr while CTME B50 and
CRME B50 achieve the lowest fuel mass flow rate with a values of 24.27
kg/hr and 24.12 kg/hr respectively, that are lower than JetA-1 by about
9.45%. This was explained in the previous section due to higher biodiesel
fuels viscosity. Since biodiesel fuels have higher viscosity compared to
JetA-1, the engine fuel gear pump outlet pressure is decreased when
operated with biodiesel fuels and that leads to decrease in fuel mass flow
rate. When the fuel mass flow rate decrease, the energy input to the engine
decrease and engine output power decrease and leads to decrease in engine
speed by 5.18% compared with JetA-1.Generally, the highest engine
rotational speeds is counted for JetA-1 fuel at any operating condition.
Comparing biodiesel fuels with JetA-1, the engines speed for biodiesel fuel
is changing from -6.5% to 1.78%. However, it can be concluded the turbojet
engine speed is slightly affected inversely when fueled with CTME and
CRME biofuels and their blends due to their higher viscosity.
5.1.3 Effect of Biodiesel Fuel Blends on Thrust Specific Fuel
Consumption (TSFC)
The engine thrust specific fuel consumption (TSFC) defines the
mass of fuel required to provide the net thrust for a given period of time in
addition to it defines the fuel consumption efficiency within the turbojet
engine. Figure 4 shows the fuel TSFC as a function of fuel mass flow rate
(different throttle valve positions) for different biodiesel fuels blends.
Comparing biodiesel blends results with JetA-1 at throttle position of 50%,
the highest TSFC is recorded for CTME B20 with value of 0.2 kg/N.hr

The 23rd. International Conference On: Environmental Protection is a Must. 11 – 13 May 2013, Alexandria, Egypt
12
Figure 2. Effect of biodiesel fuels blend on engine static thrust at different fuel mass flow rate
(a) CTME (b) CRME
while the lowest value is recorded for CTME B50 with value of 0.18
kg/N.hr with changes by ratios ranged from -3.22% to 5.25% compared
with JetA-1. However, the lower value of TSFC for biodiesel fuels and
blends compared with the case of JetA-1 for experiment runs shown in
figure 4 are in agreement with similar results presented in Habib et al. [4].
Also it can be seen from figure 4 that, as the blend of biofuel increases the
value of TSFC is decreases. This due to that the viscosity and density of the
fuel are increase with the increase of blend of the biofuel (see table 1).
Therefore, it can be concluded that the decrease in the value of TSFC is
attributed to the increase in both fuel viscosity and density. On the contrary,
it was expected that the TSFC of biofuels will be higher than that of JetA-1
fuel as the calorific value of biofuels is lower than JetA-1 (see table 1).
Based on the fact that for same power as the calorific value of the fuel
decreases, the fuel consumption will increase. However, the obtained result
reveals that the fuel consumption of biofuels is lower than that of JetA-1
which means that the effect of fuel both density and viscosity of fuels
overcomes the effect of the calorific value and leads to increase in fuel
consumption.

The 23rd. International Conference On: Environmental Protection is a Must. 11 – 13 May 2013, Alexandria, Egypt
13
Figure 4. Effect of biodiesel fuels blend on
engine TSFC at different fuel mass flow
rates (a) CTME (b) CRME
Figure 3. Effect of biodiesel fuels blend on
engine speed at different fuel mass flow
rate (a) CTME (b) CRME
5.1.4 Effect of Biodiesel Fuel Blends on Engine Efficiency
The effect of different biodiesel blends on engine efficiency at
different fuel mass flow rates compared with JetA-1 fuel is shown in figure
5. Engine efficiency is calculated for different blends by eq. (1) for CTME
and CRME with B10, B20 and B50 respectively.
As shown in figure 5, the efficiency increases from 1.43% to 8.65% while
the fuel mass flow rate increased from 9.06 kg/hr to 41.41 kg/hr. As the fuel
mass flow rate increased the engine rotational speed increased and
consequently the air suction rate (air mass flow rate) increases. In
quantitative values at the throttle valve opening of 50% of full open, the
engine efficiency is ranged from 6.98% for CRME B20 to 7.7% for CTME
B50 and comparing this results with the values of efficiency when using
JetA-1 fuel the variation in the efficiency is ranged of -4.25% to 5.62%
compared with JetA-1 fuel value. From the presented results, the highest
engine efficiency value is obtained for CTME of B50 and it is higher than
the JetA-1 by about 13.74%. In general, the efficiency of biodiesel is higher
than JetA-1 in most of the turbojet engine operating conditions. It can be
concluded that the engine efficiency increases with the increase of the
biofuel percent in the blend. Increasing in engine efficiency with biofuels is
attributed to the presence of oxygen molecule in biodiesel composition

The 23rd. International Conference On: Environmental Protection is a Must. 11 – 13 May 2013, Alexandria, Egypt
14
which leads to leaner combustion process and consequently closes to
complete combustion process.
Figure 5. Effect of biodiesel fuels blend on
engine efficiency at different fuel mass flow
rate (a) CTME (b) CRME
Figure 4. Effect of biodiesel fuels blend on
engine TSFC at different fuel mass flow
rates (a) CTME (b) CRME
5.1.5 Effect of Biodiesel Fuel Blends on Combustor Exit Temperature
and Exhaust Gas Temperature
The temperature at the combustor exit (T3 in Figure 1) is shown in
figure 6 as a function of fuel mass flow rate for Jet-A1 and CTME and
CRME and there blends of B10, B20 and B50 fuels. As shown at the
experimental setup section, the combustor exit temperature (CET) is
measured after the stage of combustor and before the turbine stage (in some
literatures it called as turbine inlet temperature (TIT)). The values of CET
were ranged from 638.9 K to 976.9 K, as the fuel mass flow rate changed
from 9.06 kg/hr to 41.41 kg/hr respectively. At the throttle valve setting of
10% and 30% the CET values are decreased until it reaches the minimum at
throttle valve opening of 30%, then it start to increase again with the
increase of throttle valve opening. The results in quantitative values are
given at the throttle valve opening of 50% of full opening, the CET values
are varied from 672.41 K to 820.56 K while the value of 672.41 K is
counted for CRME B10 which is lower than the value of JetA-1 with about
18.05% and the highest value of CET at 50% throttle valve position which
is 820.56 K is achieved by JetA-. It is clear from figure 6 that the CET for

The 23rd. International Conference On: Environmental Protection is a Must. 11 – 13 May 2013, Alexandria, Egypt
15
JetA-1 is higher than biodiesel fuel blends for most of the throttle valve
opening positions. This may be due to that the biodiesel fuel blends mass
flow rate is lower than that of JetA-1in addition to lower calorific values of
biodiesel fuels as shown in table 1. The values of exhaust gas temperature
(EGT) for CTME and CRME and there blends of B10, B20 and B50 as
function of the throttle valve opening are shown in figure 7. The EGT is
measured at the nozzle exit point T5 in figure 1. The values of EGT are
changing from 711.64 K to 874.16 K while the fuel mass flow rate changes
from 9.06 kg/hr to 41.41 kg/hr. The difference in temperature between CET
and EGT is indication for amount of losses of thermal energy in the engine
at the different fuel flow rates and engine speeds, for the presented ranges of
CET, EGT and fuel mass flow rate. The increases in EGT at the same value
of the CET is due to the percentage of heat loss is decreased at higher fuel
mass flow rate. In quantitative values at the throttle valve opening of 50% of
full open, the EGT changed from 740.57 K to 779.72 K while the lowest
value is counted for CRME B20 which is lower than the value of JetA-1
with about 5.02% and the highest value is achieved by JetA-1. The
presented results show that the value of EGT for different CTME biofuels is
close to the EGT value for JetA-1 fuel at most of throttle valve setting
position. While, for CRME fuel blends JetA-1 fuel has higher EGT than that
of biodiesel fuels this may be due to that the biofuels mass flow rates are at
most of the throttle valve positions lower than that of JetA-1 fuel and the
calorific value of biodiesel fuels are lower than that of JetA-1.
5.2 Exhaust Emissions
5.2.1 Effect of Biodiesel Fuel Blends on Oxygen O2
The amount of oxygen in the exhaust plotted as function of the
equivalence ratio at different throttle position settings of (10%, 30%, 50%,
70% and 90%) for different fuels like JetA-1, CTME and CRME and their
blends of B10, B20 and B50 are shown in Figure 8. As shown in the figure
8, increasing the percentage of biodiesel in the blend leads to lower ranges
of the equivalence ratios of the blend and leads to a leaner combustion
process. The ranges of equivalence ratios calculated from equ.2 for this
turbojet engine indicate that a very lean combustion process as they are
(0.13-0.19) for jetA-1, (0.1263-0.1872) for CTME B10, (0.1239-0.1835) for
CTME B20, (0.1135 – 0.1661) for CTME B10, while for CRME B10 is
(0.127-0.183), CRME B20 is (0.123 – 0.181) and (0.1187-0.1736) for
CRME B50 From these values, the equivalence ratio range for B50 of any
fuel is lower than ranges for B20, and the equivalence ratio range for B20 is
lower than B10 . While the highest range of the equivalence ratio is
achieved by JetA-1 fuel. The lower the range of the equivalence ratio, the

The 23rd. International Conference On: Environmental Protection is a Must. 11 – 13 May 2013, Alexandria, Egypt
16
Figure 7. Effect of biodiesel fuels blend on
exhaust gas temperature at different fuel
mass flow rate (a) CTME (b) CRME
Figure 6. Effect of biodiesel fuels blend on
combustor exit temperature at different
fuel mass flow rate (a) CTME (b) CRME
better and leaner combustion process. The amount of oxygen in the exhaust
is decreased with increasing of equivalence ratio. At throttle valve position
of 50%, the lowest value of O2 in the exhaust is about 16.7% by volume
analysis and achieved by JetA-1. While CTMR B50 has a value of 17.7% by
volume analysis for O2 in the exhaust which is higher than JetA-1
corresponding value by 5.9% and CRME B20 has a value of 17.5% by
volume analysis for O2 in the exhaust which is higher than JetA-1
corresponding value by 4.79%. Generally, it can be concluded that, the more
the biodiesel percentage in the blend, the more oxygen emits in the exhaust.
This may be attributed to two reasons, the first one is due to the existence of
the oxygen molecules in the chemical composition of the biodiesel fuel, and
the second reason is due to that biodiesel fuel blends have lower
equivalence ratios compared to JetA-1 and consequently leaner combustion
process.
5.2.2 Effect of Biodiesel Fuel Blends on Carbon Monoxide CO
For the same injection system and different fuels with different
viscosities, as the viscosity of the fuel become higher the efficiency of the
atomization process of the fuel become lower and the size of fuel droplets
become larger in the fuel spray and consequently the air and fuel mixing

The 23rd. International Conference On: Environmental Protection is a Must. 11 – 13 May 2013, Alexandria, Egypt
17
process become harder and a rich mixture is formed at some spots and
consequently a rich combustion process which is the main reason for
formation of CO. It was expected that the carbon monoxide emission will
increase with the increase of the biodiesel percent in the blend as a result of
viscosity increase. Figure 9 shows the carbon monoxide emission is plotted
versus equivalence ratio at different throttle position 10%, 30%, 50%, 70%
and 90% for jetA-1, CTME and CRME and their different blends
respectively. From the figure it is clear that at throttle position of 50%,
CRME B20 has the highest CO emission with 3.39% higher value than that
of JetA-1. Also, CTME B20 achieves the lowest value of CO emission and
it is about 4.47% lower than the corresponding value of JetA-1. At throttle
positions ranged from 10% to 50%, JetA-1 fuel has higher carbon monoxide
emissions than other biodiesel fuels and their different blends and carbon
monoxide emissions become lower by increasing the amount of biodiesel in
the blend while from throttle position of 50% to 90% CO emission for all
fuels has a much closed values. Also, form figure 9, it is clear that CO is
decreasing with the equivalence ratio for all studied fuels. This attributed to
the amount of air in the combustor, as the equivalence ratio increased, the
amount of air inside the combustor decreased and it became difficult to
oxidize the carbon monoxide and more CO produced at the exhaust.
Generally, comparing the amount of CO emission with JetA-1 to the amount
of CO emits by biodiesel blends at all the throttle positions is lower and
have better combustion process. For biodiesel fuels, B10 emits higher CO
emission than B20 and B20 has a higher CO emission than B50. Therefore,
from the figure with assuming the same trend of the curves, using pure
biodiesel may lead to significant decrease in CO emission, however, pure
biodiesel still not tested in the turbojet engine used in the current study due
its higher viscosity. Also, using pure biodiesel may cause some atomization
problems and leads to higher CO in the exhaust.
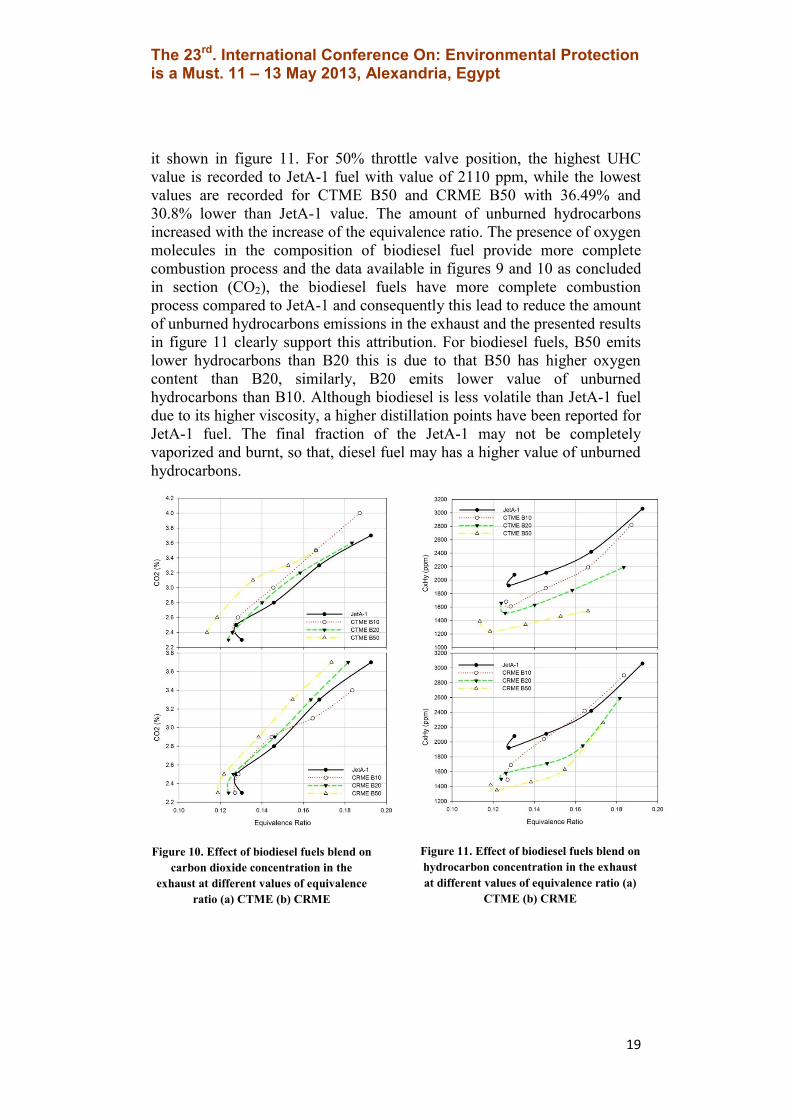
5.2.3 Effect of Biodiesel Fuel Blends on Carbon Dioxide CO2
The engine CO2 emission is measured and plotted versus the equivalence
ratio at different throttle valve positions of 10, 30, 50, 70 and 90% as shown
in figure 10. Comparing the results of JetA-1 fuel with biodiesel blends at
50% throttle valve position, the lowest CO2 value is achieved by JetA-1
with percent value of 2.8%, while CTME B50 and CRME B50 have CO2
emissions with percentage of 10.71% and 3.57% higher than that of JetA-1.
For all cases shown in figure 10, CO2 emission is increased with the
increase of equivalence ratio. Biodiesel fuels have higher CO2 emissions
than JetA-1 fuel, this is due to lower values of equivalence ratios of
biodiesel fuels, therefore a leaner combustion occurs and resulting in a
higher CO2 emission in the exhaust. The CO2 emission is a good indication

The 23rd. International Conference On: Environmental Protection is a Must. 11 – 13 May 2013, Alexandria, Egypt
18
for combustion process efficiency. For biodiesel fuels, B50 has lower range
of equivalence ratio and consequently a higher CO2 emission than B20
while B20 has higher CO2 emissions than B10. Also, from figures 9 and 10
it can note that JetA-1 fuel has higher CO and lower CO2 emissions
comparing with other biodiesel fuels. After the combustion process, the
carbon atom in the fuels is divided into CO and CO2 in the emissions. For
JetA-1, the part of the carbon atom exists in the fuel composition that
combusted to form CO2 is lower than that of biodiesel fuels and
consequently the part of carbon atom that used to form CO in jetA-1 is
higher than that of biodiesel fuels Table (1) shows that the biodiesel fuels
have a higher carbon content than JetA-1 as CTME has (88.42 %) by mass
and CRME (88.4 %) by mass and JetA-1 (86.51%) by mass. Therefore, both
CO2 and CO concentrations in the exhaust give indication for complete
combustion process. As biodiesel fuel have higher CO2 concentration and
lower CO compared with JetA-1, thus the biodiesel fuels have a more
complete combustion process compared to JetA-1 fuel.
Figure 9. Effect of biodiesel fuels blend on
carbon monoxide concentration in the
exhaust at different values of equivalence
ratio (a) CTME (b) CRME
Figure 8. Effect of biodiesel fuels blend on
oxygen concentration in the exhaust at
different values of equivalence ratio (a)
CTME (b) CRME
5.2.4 Effect of Biodiesel Fuel Blends on Unburned Hydrocarbons CxHy
Substituting JetA-1 Fuel with biodiesel leads to noticeable decrease
in the amount of the unburned hydrocarbons (UHC) in the exhaust gasses as
The 23rd. International Conference On: Environmental Protection is a Must. 11 – 13 May 2013, Alexandria, Egypt
19
it shown in figure 11. For 50% throttle valve position, the highest UHC
value is recorded to JetA-1 fuel with value of 2110 ppm, while the lowest
values are recorded for CTME B50 and CRME B50 with 36.49% and
30.8% lower than JetA-1 value. The amount of unburned hydrocarbons
increased with the increase of the equivalence ratio. The presence of oxygen
molecules in the composition of biodiesel fuel provide more complete
combustion process and the data available in figures 9 and 10 as concluded
in section (CO2), the biodiesel fuels have more complete combustion
process compared to JetA-1 and consequently this lead to reduce the amount
of unburned hydrocarbons emissions in the exhaust and the presented results
in figure 11 clearly support this attribution. For biodiesel fuels, B50 emits
lower hydrocarbons than B20 this is due to that B50 has higher oxygen
content than B20, similarly, B20 emits lower value of unburned
hydrocarbons than B10. Although biodiesel is less volatile than JetA-1 fuel
due to its higher viscosity, a higher distillation points have been reported for
JetA-1 fuel. The final fraction of the JetA-1 may not be completely
vaporized and burnt, so that, diesel fuel may has a higher value of unburned
hydrocarbons.
Figure 11. Effect of biodiesel fuels blend on
hydrocarbon concentration in the exhaust
at different values of equivalence ratio (a)
CTME (b) CRME
Figure 10. Effect of biodiesel fuels blend on
carbon dioxide concentration in the
exhaust at different values of equivalence
ratio (a) CTME (b) CRME

The 23rd. International Conference On: Environmental Protection is a Must. 11 – 13 May 2013, Alexandria, Egypt
20
5.2.5 Effect of Biodiesel Fuel Blends on Nitrogen Oxides NOx
Fig 12 shows the NOx emission for CTME, CRME and JetA-1 and
their different blends of B10, B20 and B50 at different throttle valve
position of 10, 30, 50, 70 and 90% respectively. The highest value is
achieved by CTME B10 that higher than JetA-1 with 27.27% while CRME
B10, B20 has a value higher than JetA-1 by 18.18%. The lowest value is
achieved by CTME B20 with 36.3% lower than JetA-1. The results show
that NOx emissions increase with increasing of equivalence ratio. The NOx
emission for biodiesel fuel is higher than JetA-1 at different values of
equivalence ratios. As shown in figure 12, the percent of biodiesel increase
in the blend, the amount of emitted NOx increase too in addition, for
biodiesel fuel, B50 have higher NOx emissions than B20 and B20 has higher
NOx emissions than B10.
5.2.6 Effect of Biodiesel Fuel Blends on Sulfur Dioxide SO2
Fig 13 shows the variation of sulfur dioxide with different values of
the equivalence ratio for different fuels of JetA-1, CTME and CRME and
their different blends of B10, B20 and B50 respectively. From the figure, it
is clear that SO2 emissions increased with the increase of equivalence ratio.
As shown in the figure 13, the highest level of sulfur dioxide is emitted
when the engine is operated with JetA-1 fuel. At the throttle valve position
of 50%, CTME B50 have lower SO2 value with74.35% lower than JetA-1,
while, CRME B50 has lower value than JetA-1 by 61.53%. However,
increasing the amount of biodiesel fuels in the blend with JetA-1 fuel, the
amount of emitted sulfur dioxide decreases, this is due to that pure biodiesel
fuels have very low sulfur content comparing with JetA-1 and blending any
percent of biodiesel with JetA-1 will reduces the sulfur content in the fuel
and consequently the sulfur dioxide emissions. For example, CRME has a
sulfur content of 10.2 ppm while CTME has about 15.2 ppm of sulfur,
however JetA-1 fuel has 50.3 ppm as shown in table 1. Thus, the sulfur
content of CRME and CTME is lower than that of JetA-1 by 79.72% and
69.78% respectively, and blending CRME B50 fuel reduces the sulfur
content to 30.25 ppm which is lower than JetA-1 fuel by 39.86%. As shown
in figure 13, for biodiesel fuels, CRME B50 emits lower sulfur dioxide than
CRME B20 and CRME B20 emits sulfur dioxide lower than CRME B10
and all of CRME blends have a lower sulfur dioxide comparing to JetA-1.
However, the sulfur dioxide emission for CTME is higher than CRME as
the sulfur content of CTME is higher than CRME as shown in table 1.
Blending JetA-1 fuel with biodiesel reduces the harmful effect of the toxic

The 23rd. International Conference On: Environmental Protection is a Must. 11 – 13 May 2013, Alexandria, Egypt
21
SO2 and consequently reduces the possibility of formation H2SO4 which is
formed by oxidation of SO2 in the presence of water.
Figure 13. Effect of biodiesel fuels blend on
sulfur dioxide concentration in the exhaust
at different values of equivalence ratio (a)
CTME (b) CRME
Figure 12. Effect of biodiesel fuels blend on
nitric oxides concentration in the exhaust
at different values of equivalence ratio (a)
CTME (b) CRME
6. Conclusions
This study investigated experimentally the performance and
emissions of turbojet engine when fueled by two different types of
biodiesel fuels named Cotton Methyl Ester (CTME) and Corn
Methyl Ester (CRME) and their blends of B10, B20 and B50 with
JetA-1 fuel compared with JetA-1 fuel at different throttle valve
position of 10%, 30%, 50%, 70% and 90% of the full open
respectively. The following can be concluded from obtained results.
Biodiesel fuels have a higher density, kinematic viscosity, flash point
and pour point than JetA-1 fuel, while, their calorific value, carbon and
hydrogen contents is very close to JetA-1 fuel. However, the JetA-1 fuel
has higher sulfur content than other biodiesel fuels. Blending biodiesel
with JetA-1 can be a suggestion to overcome the problem of the higher
viscosity of the pure biodiesel fuels.

The 23rd. International Conference On: Environmental Protection is a Must. 11 – 13 May 2013, Alexandria, Egypt
22
Static thrust value for biodiesel fuel is not lower than 11.5% as well as
and not higher than 1.62% compared with standard engine JetA-1 fuel.
Moreover, at throttle valve position of 50%, the biodiesel fuels CTME
blends have higher static thrust compared to CRME fuel blends.
TSFC for biodiesel blends is lower than JetA-1 and the decrease in the
value of TSFC is attributed to the increase in both fuel viscosity and
density. On the contrary, it was expected that the TSFC of biofuels will
be higher than that of JetA-1 fuel as the calorific value of biofuels is
lower than JetA-1 (see table 1). Based on the fact that for same power as
the calorific value of the fuel decreases, the fuel consumption will
increase. However, the obtained result reveals that the fuel consumption
of biofuels is lower than that of JetA-1 which means that the effect of
fuel both density and viscosity of fuels overcomes the effect of the
calorific value and leads to increase in fuel consumption.
The efficiency of biodiesel is higher than JetA-1 in most of the turbojet
engine operating conditions. The engine efficiency increases with the
increase of the biofuel percent in the blend. Increasing in engine
efficiency with biofuels is attributed to the presence of oxygen molecule
in biodiesel composition which leads to leaner combustion process and
consequently closes to complete combustion process.
The CET for JetA-1 is higher than biodiesel fuel blends for most of the
throttle valve opening positions. This may be due to that the biodiesel
fuel blends mass flow rate is lower than that of JetA-1in addition to
lower calorific values of biodiesel fuels.
The value of EGT for different CTME biofuels is close to the EGT value
for JetA-1 fuel at most of throttle valve setting position. While, for
CRME fuel blends JetA-1 fuel has higher EGT than that of biodiesel
fuels this may be due to that the biofuels mass flow rates are at most of
the throttle valve positions lower than that of JetA-1 fuel and the
calorific value of biodiesel fuels are lower than that of JetA-1
The highest range of the equivalence ratio is achieved by JetA-1 fuel
and by increasing the fuel blend, the range of the equivalence ratio
become lower.
The more the biodiesel percentage in the blend, the more oxygen emits
in the exhaust. This may be attributed to two reasons, the first one is due
to the existence of the oxygen molecules in the chemical composition of
the biodiesel fuel, and the second reason is due to that biodiesel fuel
blends have lower equivalence ratios compared to JetA-1 and
consequently leaner combustion process.
The CO emissions comes from the turbojet engine refers that there is no
atomization problem happened when biodiesel fuel is used and blended
with jetA-1 up to 50%. But the only problem is counted for the fuel
The 23rd. International Conference On: Environmental Protection is a Must. 11 – 13 May 2013, Alexandria, Egypt
23
pump which was needed to be replaced as it was damaged by using a
biodiesel fuels with such viscosities.
Comparing the amount of CO emission for JetA-1 with the amount of
CO emits by biodiesel blends at all the throttle positions is lower and has
better combustion process. For biodiesel fuels, B10 emits higher CO
emission than B20 and B20 has a higher CO emission than B50. In the
exhaust, and in this study, the lowest value of Carbon monoxide is
counted for B50.
Carbon dioxide emission for biodiesel fuel is higher than that of JetA-1
due to the lower ranges of equivalence ratios for biodiesel blends.
The biodiesel fuels have a higher carbon content than JetA-1 as CTME
has (88.42 %) by mass and CRME (88.4 %) by mass and JetA-1
(86.51%) by mass. Therefore, both CO2 and CO concentrations in the
exhaust give indication for complete combustion process. As biodiesel
fuel have higher CO2 concentration and lower CO compared with JetA-
1, thus the biodiesel fuels have a more complete combustion process
compared to JetA-1 fuel.
Biodiesel fuel blends have lower values of unburned hydrocarbons
compared with JetA-1. This is due to higher oxygen content in biodiesel
fuels and lower ranges for equivalence ratios which leads to a leaner
combustion process. Also, the biodiesel is less volatile than JetA-1 fuel
due to its higher viscosity, a higher distillation points have been reported
for JetA-1 fuel. The final fraction of the JetA-1 may not be completely
vaporized and burnt, so that, diesel fuel may has a higher value of
unburned hydrocarbons.
The NOx emission for biodiesel fuel is higher than JetA-1 at different
values of equivalence ratios. As the percent of biodiesel increase in the
blend, the amount of emitted NOx increase too in addition, for biodiesel
fuel, B50 have higher NOx emissions than B20 and B20 has higher NOx
emissions than B10.
The highest level of sulfur dioxide is emitted when the engine is
operated with JetA-1 fuel. By increasing the amount of biodiesel fuels in
the blend with JetA-1 fuel, the amount of emitted sulfur dioxide
decreased, this is due to that pure biodiesel fuels have very low sulfur
content comparing with JetA-1 and blending any percent of biodiesel
with JetA-1 reduces the sulfur content in the fuel and consequently the
sulfur dioxide emissions. However, the sulfur dioxide emission for
CTME is higher than CRME as the sulfur content of CTME is higher
than CRME

The 23rd. International Conference On: Environmental Protection is a Must. 11 – 13 May 2013, Alexandria, Egypt
24
Acknowledgement
The author Mohamed Noureldin Ibrahim would like to acknowledge
the Mission Department, Ministry of Higher Education of the Government
of Egypt for the scholarship to study M.Sc. Degree at the Egypt Japan
University of Science and Technology, E-JUST.
References
[1] Zehra Habib, Ramkumar Parthasarathy, Subramanyam Gollahalli,
Performance and emission characteristics of biofuel in a small-scale gas
turbine engine, Applied Energy 87 (2010) 1701–1709.
[2] Marco Antônio Rosa do Nascimento, Electo S. Lora, Paulo S.P. Corre,
Rubenildo V. Andrade, Manuel A. Rendon, Osvaldo J. Venturini, Guido
A.S. Ramirez, Biodiesel fuel in diesel micro-turbine engines: Modelling and
experimental evaluation, Energy 33 (2008) 233–240.
[3] A. Rehman, Deepak R. Phalke, Rajesh Pandey, Alternative fuel for gas
turbine: Esterified Jatropha Oil-Diesel blend, Renewable Energy 36 (2011)
2635-2640.
[4] Min Chul Lee, Seok Bin Seo, Jae Hwa Chung, Yong Jin Joo, Dal Hong
Ahn, Combustion performance test of a new fuel DME to adapt to a gas
turbine for power generation, Fuel 87 (2008) 2162–2167.
[5] C. R. Krishna, Performance of the Capstone C30 Microturbine on
Biodiesel Blends, 2007, Brookhaven National Laboratory.
[6] M. Prussi, D. Chiaramonti, G. Riccio, F. Martelli, L. Pari, Straight
vegetable oil use in Micro-Gas Turbines: System adaptation and testing,
Applied Energy 89 (2012) 287–295.
[7] Marco Antônio Rosa do Nascimento, Guido A. Sierra R., Electo E. Silva
Lora, Manuel A. Rendon, Performance and Emission Experimental
Evaluation and Comparison of a Regenerative Gas Microturbine Using
Biodiesel from Various Sources as Fuel, ASME Journal of Energy
Resources Technology Vol. 133 (2011) 022201-022206.
[8] C. Allouis, F. Beretta, P. Minutolo, R. Pagliara, M. Sirignano, L.A. Sgro,
A. D’Anna, 2010, Measurements of ultrafine particles from a gas-turbine
burning biofuels, Experimental Thermal and Fluid Science 34 (2010) 258–
261.
[9] Marco Antônio Rosa do Nascimento and Eraldo Cruz dos Santos,
Advances in Gas Turbine Technology, 2011, Croatia, Chap. 6.