Investigations Concerning the Laser Ignition of Energetic ...
Upload
khangminh22Category
view
0download
0
This is a repository copy of Natural gas fueled compression ignition engine performance and emissions maps with diesel and RME pilot fuels.
White Rose Research Online URL for this paper:http://eprints.whiterose.ac.uk/94753/
Version: Accepted Version
Article:
Imran, S, Emberson, DR, Diez, A et al. (3 more authors) (2014) Natural gas fueled compression ignition engine performance and emissions maps with diesel and RME pilot fuels. Applied Energy, 124. pp. 354-365. ISSN 0306-2619
https://doi.org/10.1016/j.apenergy.2014.02.067
© 2014, Elsevier. Licensed under the Creative Commons Attribution-NonCommercial-NoDerivatives 4.0 International http://creativecommons.org/licenses/by-nc-nd/4.0/
[email protected]://eprints.whiterose.ac.uk/
Reuse
Unless indicated otherwise, fulltext items are protected by copyright with all rights reserved. The copyright exception in section 29 of the Copyright, Designs and Patents Act 1988 allows the making of a single copy solely for the purpose of non-commercial research or private study within the limits of fair dealing. The publisher or other rights-holder may allow further reproduction and re-use of this version - refer to the White Rose Research Online record for this item. Where records identify the publisher as the copyright holder, users can verify any specific terms of use on the publisher’s website.
Takedown
If you consider content in White Rose Research Online to be in breach of UK law, please notify us by emailing [email protected] including the URL of the record and the reason for the withdrawal request.
Natural gas fueled compression ignition engine
performance and emissions maps with diesel and RME
pilot fuels
S. Imrana,d, D. R. Embersona, A. Diezb, D. Wena, R. J. Crookesa, T.Korakianitisc,∗
aSchool of Engineering and Materials Science, Queen Mary University of London, MileEnd Road, E1 4NS, UK
bMechanical Engineering Department,IYTE Izmir Institute of Technology,Urla - Izmir35430 Turkey
cParks College of Engineering, Aviation and Technology, Saint Louis University, St.Louis, Missouri 63103, USA
dDepartment of Mechanical Engineering University of Engineering and TechnologyLahore (City Campus), Lahore Pakistan
Abstract
When natural gas is port/manifold injected into a compression ignition en-
gine, the mixture of air and the natural gas is compressed during the compres-
sion stroke of the engine. Due to the difference in the values of specific heat
capacity ratio between air and natural gas, the temperature and pressure at
the time of pilot fuel injection are different when compared to a case where
only air is compressed. Also, the presence of natural gas affects the peak
in-cylinder (adiabatic flame) temperature. This significantly affects the per-
formance as well as emissions characteristics of natural gas based dual fueling
in CI engine. Natural Gas has been extensively tested in a single cylinder
∗Corresponding author. Parks College of Engineering, Aviation and Technology, SaintLouis University, St. Louis, Missouri 63103, USA
Email address: Email forward for life [email protected] (T.Korakianitis)
Preprint submitted to (Applied Energy ) April 30, 2016
compression ignition engine to obtain performance and emissions maps.Two
pilot fuels, diesel and RME,have been used to pilot natural gas combustion.
The performance of the two liquid fuels used as pilots has also been assessed
and compared. Tests were conducted at 48 different operating conditions (six
different speeds and eight different power output conditions for each speed)
for single fueling cases. Both the diesel and RME based single fueling cases
were used as baselines to compare the natural gas based dual fueling where
data was collected at 36 operating conditions (six different speeds and six dif-
ferent power output conditions for each speed). Performance and emissions
characteristics were mapped on speed vs brake power plots. The thermal
efficiency values of the natural gas dual fueling were lower when compared to
the respective pilot fuel based single fueling apart from the highest powers.
The effect of engine speed on volumetric efficiency in case of the natural gas
based dual fueling was significantly different from what was observed with
the single fueling. Contours of specific NOX for diesel and RME based single
fueling differ significantly when these fuels were used to pilot natural gas
combustion. For both of the single fueling cases, maximum specific NOX
were centered at the intersection of medium speeds and medium powers and
they decrease in all directions from this region of maximum values. On the
other hand, an opposite trend was observed with dual fueling cases where
minimum specific NOX were observed at the center of the map and they
increase in all direction from this region of minimum NOX. RME piloted
specific NOX at the highest speeds were the only exception to this trend.
Higher specific HC and lower specific CO2 emissions were observed in case
of natural gas based dual fueling. The emissions were measured in g/MJ of
2
engine power.
Removed the citation from the abstract
Keywords: contours, performance maps, natural gas, diesel, RME,
combustion, fuels
Nomenclature1
Greek
γ specific heat ratio
Abbreviations
CO2 carbon dioxide
NOX oxides of nitrogen
CO carbon mono oxide
HC hydro carbons
CI compression ignition
DME dimethyl ether
IC internal combustion
CR compression ratio
RME rape methyl ester
SI spark ignition
SFC specific fuel consumption
1. Introduction2
Natural gas has long been considered an alternative fuel for the trans-3
portation sector and has been used to fuel vehicles since the 1930’s. Natural4
gas is the cleanest fossil fuel available and its proven reserves are 5288.55
3
trillion cubic feet, much larger than crude oil [1]. Low carbon content and6
clean burn features (low soot and smoke) have helped the proliferation of7
natural gas as an alternate fuel with the introduction of ever more strin-8
gent emissions standards. Natural gas has properties that are very similar9
to those of methane (CH4), which is its primary constituent. It also contains10
heavier hydrocarbons such as ethane (C2H6), propane (C3H8), and butane11
(C4H10), and inert diluents such as molecular nitrogen (N2) and carbon diox-12
ide (CO2) [3–6].13
Natural gas has a low cetane number (compared to diesel fuel) [2, 5, 6],14
but it has a high specific heat capacity ratio γ (when compared with air). The15
poor ignition characteristics (extended ignition delay) of low cetane number16
fuels in CI engines often prevents ignition entirely at the temperatures found17
under compression in a CI engine.18
Various ignition strategies are used to ignite natural gas in unmodified CI19
engines. A high cetane liquid fuel such as diesel [6–8] or RME [6] have been20
widely used as an initial source of ignition using the dual fuel concept [9].21
The natural gas is most often inducted into the engine in the air intake22
manifold with the high cetane fuel directly injected into the cylinder. To23
ensure ignition and sustain acceptable combustion there is a lower limit of24
the quantity of the high cetane fuel that must be injected [9].25
The adiabatic flame temperature of methane in air for phi=1 and phi=0.526
have been presented by Karim [14]. Assuming an initial temperature of27
around 800K at TDC, the difference in peak temperature (adiabatic flame28
temperature) between the methane mixture of phi=1 and phi=0.5 is in ex-29
cess of 600K. The effect of difference in the specific heat capacity ratios of30
4
air and natural gas, on the in-cylinder temperature at the end of compres-31
sion, can be evaluated by using a freely available program REFPROP [15].32
When a sample calculation is made at a pressure of 2.5 MPa and a temper-33
ature of 500K, it yields γ=1.3559 for air and γ=1.3985 for a stoichiometric34
mixture of methane and air. With inlet temperature (T1) set at 300K, the35
peak compression temperature (T2) can be calculated by using the following36
relationship37
T2 = T1.r(γ−1)c (1)
where rc is the compression ratio of the engine used in these tests. The38
peak compression temperatures calculated in this manner are 837K for air39
and 750K for the stoichiometric methane/air mixture. As analyzed above,40
the presence of natural gas reduces the peak temperature by 100K and the41
adiabatic flame temperature by 500K42
The higher specific heat capacity ratio of natural gas lowers in-cylinder43
charge temperature and increases ignition delay compared to the baseline44
diesel operation and hence is critical from an emissions perspective [10, 11].45
Due to these competing factors dual fueling with natural gas needs to be46
investigated across a wider range of engine operating conditions to assess47
the affect of engine speed and load (power output) in addition to the above48
mentioned factors.49
Dual fueling of CI engine with natural gas has demonstrated a slight re-50
duction of brake thermal efficiency when compared to fueling with standard51
mineral diesel [7, 8, 12–14] whereas higher thermal efficiency values were re-52
ported at higher loads [16]. Concerning total brake specific fuel consumption,53
it is revealed that it becomes inferior under dual fuel operation compared to54
5
normal diesel operation at the same engine operating conditions because of55
the smaller heating value of natural gas. At high load, the values of total56
brake specific fuel consumption under dual fuel operation tend to converge57
with that of normal diesel operation [7].58
NOX is strongly dependent on local temperatures so most NOX is ex-59
pected to form in the region around the pilot spray where high temperatures60
exist and the equivalence ratio is close to stoichiometric [17]. Earlier and61
faster combustion events increase the duration for which in-cylinder condi-62
tions are suitable for NOX formation [18]. The use of natural gas under dual63
fueling in CI engines significantly affect NOX emissions: the NOX concen-64
tration under dual fuel operation is lower when compared to normal diesel65
operation. At the same time, a significant decrease in soot emissions un-66
der dual fuel operation has also been reported [3]. On the other hand, CO67
and HC emissions levels have been reported to be considerably higher when68
compared to normal diesel operation [7, 10–12, 19].69
Whereas literature has been reported on natural gas combustion and70
emissions under dual fueling conditions in CI engines, most of the studies71
lack one or the other important aspects. The studies are either restricted72
to various loads/powers at one engine speed (neglecting the effect of engine73
speed) or one or two load/power conditions at various speeds (neglecting74
load variations). There is a scarcity of engine “fuel maps” in the open liter-75
ature (these are the full contours of thermal efficiency or brake specific fuel76
consumption plotted throughout the power vs speed range of the engine, or77
the torque vs speed range of the engine). Sample fuel maps can be found78
in [20–22]. One such plot of thermal efficiency contours with dual-fueling has79
6
been presented previously to demonstrate the thermal efficiency within the80
operating range of the test engine used in this paper [11]. Maps showing the81
thermal efficiency as well as specific emissions contours on the power-speed82
plots are seldom found in the open literature [23].83
The choice of pilot fuel has also been limited to either diesel or biodiesel84
only and the performance of these two pilots has hardly been investigated and85
compared over a wider range of operating conditions in compression ignition86
environment. The study presented here is an effort to fill these gaps in the87
literature available on natural gas based dual fueling in CI engines.88
A specific engine model may be used as a power source for many different89
applications, each with its own different load characteristics. For instance90
the same engine can be used to power: two different-size cars; a small marine91
vessel; an electricity generator; and in several other applications. The pro-92
cedure of selecting the engine (prime mover) while considering the engine’s93
contours of thermal efficiency on the power-speed range of the engine, and94
concurrently the load line of the powered device, has been briefly described95
in [6]. Much of the automotive sales literature available will quote the max-96
imum torque at one engine speed, maximum power at another engine speed97
(though the engine may be rarely operating at these conditions), and the av-98
erage fuel consumption and total emissions over one or two strictly-specified99
drive cycles (which may or may not be representative of the intended use of100
the buyer). In research papers laboratory experiments of engine performance101
and emissions are usually conducted at constant equivalence ratio, or con-102
stant brake mean effective pressure, or occasionally at constant speed. All103
of these representations are of some use to the average consumer, but they104
7
do little to represent or explain the overall thermal efficiency and emissions105
characteristics of engines throughout their operating range.106
In the work presented in this paper both speed and power are consid-107
ered for diesel and RME piloted natural gas combustion in a direct injection108
CI engine. The results are presented as iso-contours of thermal efficiency,109
volumetric efficiency and brake specific emissions on a power-speed graph110
throughout the operating range of the engine. The engine is a standard111
test engine, typical of the majority of such engines used in the developing112
economies of the world; and though more-modern engines may have higher113
thermal efficiency and lower emissions, the shape and regions of contours114
presented in this paper are representative of those shapes for typical CI en-115
gines and are applicable to all engine performance and emissions contours.116
This is a novel approach to representing these data, especially for CI en-117
gines. As one example of the utility of the considerations presented in this118
paper, the specific NOX emissions contours presented later illustrate that119
for the baseline single-fuel diesel configuration the region of high specific120
NOX emissions is at intermediate engine speed and power, dropping off at121
high and low values of engine speed and power, helping to explain the NOX122
emission trends presented elsewhere in the literature; while the dual-fueling123
specific NOX emissions contours show monotonically increasing trends with124
increasing engine load and increasing engine speed.125
2. Experimental Set Up126
A four-stroke single-cylinder Gardner 1L2 compression ignition engine127
was used, the specifications of which are shown in Table 1. Fig1 illustrates128
8
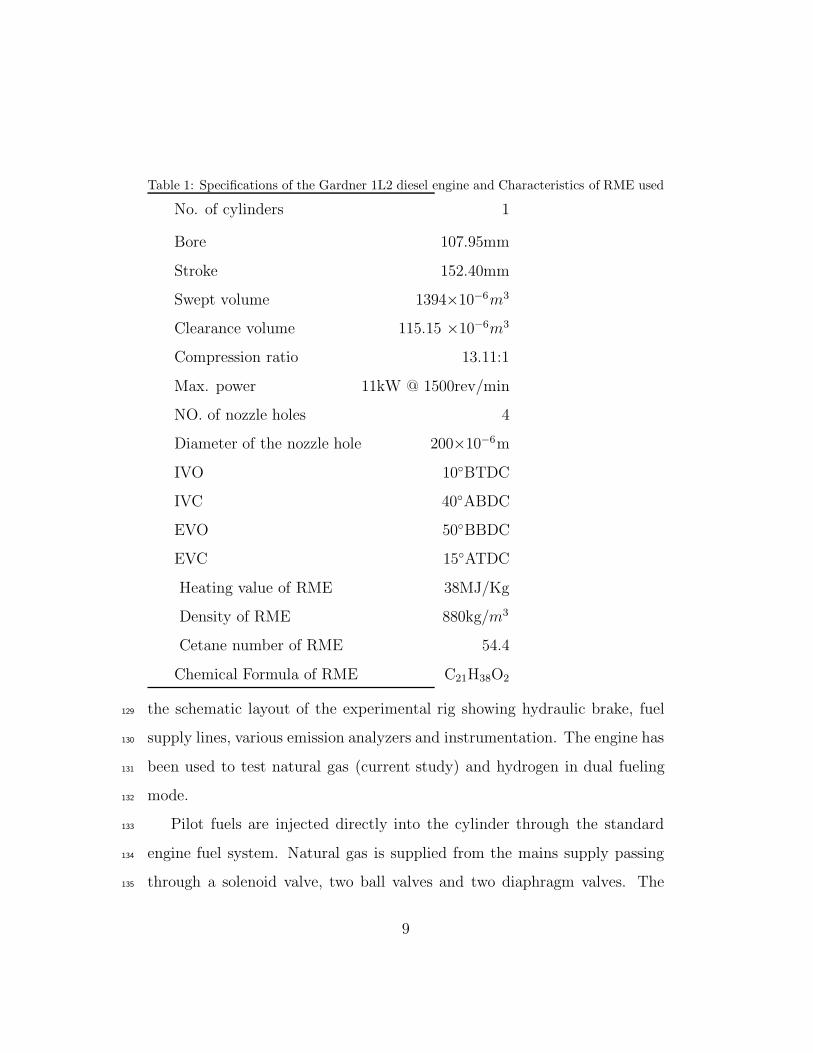
Table 1: Specifications of the Gardner 1L2 diesel engine and Characteristics of RME used
No. of cylinders 1
Bore 107.95mm
Stroke 152.40mm
Swept volume 1394×10−6m3
Clearance volume 115.15 ×10⁻⁶m3
Compression ratio 13.11:1
Max. power 11kW @ 1500rev/min
NO. of nozzle holes 4
Diameter of the nozzle hole 200×10−6m
IVO 10◦BTDC
IVC 40◦ABDC
EVO 50◦BBDC
EVC 15◦ATDC
Heating value of RME 38MJ/Kg
Density of RME 880kg/m3
Cetane number of RME 54.4
Chemical Formula of RME C21H38O2
the schematic layout of the experimental rig showing hydraulic brake, fuel129
supply lines, various emission analyzers and instrumentation. The engine has130
been used to test natural gas (current study) and hydrogen in dual fueling131
mode.132
Pilot fuels are injected directly into the cylinder through the standard133
engine fuel system. Natural gas is supplied from the mains supply passing134
through a solenoid valve, two ball valves and two diaphragm valves. The135
9
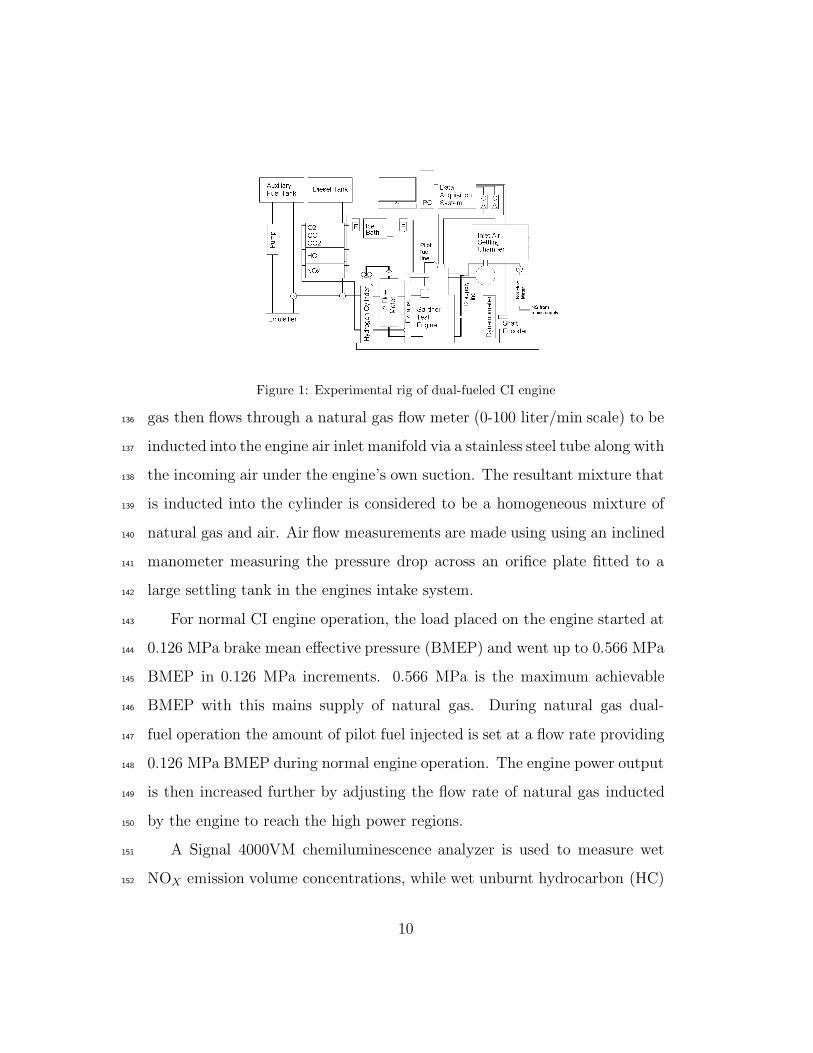
Figure 1: Experimental rig of dual-fueled CI engine
gas then flows through a natural gas flow meter (0-100 liter/min scale) to be136
inducted into the engine air inlet manifold via a stainless steel tube along with137
the incoming air under the engine’s own suction. The resultant mixture that138
is inducted into the cylinder is considered to be a homogeneous mixture of139
natural gas and air. Air flow measurements are made using using an inclined140
manometer measuring the pressure drop across an orifice plate fitted to a141
large settling tank in the engines intake system.142
For normal CI engine operation, the load placed on the engine started at143
0.126 MPa brake mean effective pressure (BMEP) and went up to 0.566 MPa144
BMEP in 0.126 MPa increments. 0.566 MPa is the maximum achievable145
BMEP with this mains supply of natural gas. During natural gas dual-146
fuel operation the amount of pilot fuel injected is set at a flow rate providing147
0.126 MPa BMEP during normal engine operation. The engine power output148
is then increased further by adjusting the flow rate of natural gas inducted149
by the engine to reach the high power regions.150
A Signal 4000VM chemiluminescence analyzer is used to measure wet151
NOX emission volume concentrations, while wet unburnt hydrocarbon (HC)152
10
emission volume concentrations are measured by a Rotork Analysis model153
523 flame ionization detector (FID) analyzer (both analyzers sampled ex-154
haust gas via a heated line at 160◦C). A Servomex 4210C exhaust gas ana-155
lyzer measured dry volume concentrations of carbon monoxide (CO), carbon156
dioxide (CO2) and oxygen (O2) concentrations using non-dispersive infra-157
red sensors and a paramagnetic sensor respectively.158
The results were calculated as described in previous publications [11, 24].159
Contours of thermal efficiency and emissions were plotted on brake power vs160
engine rotational speed (r/min) figures.161
3. Pressure and rate of energy release data on selected operating162
conditions163
This section presents pressure and rate of energy release data to support164
the claims made in the following section. Figures 2(a) and 2(b) present the165
in-cylinder pressure and the rate of energy release for diesel and RME fuelling166
at a BMEP of 0.125 MPa while operating at 1000 rev/min. Figures 3(a)167
and 3(b) present the in-cylinder pressure and the rate of energy release for168
diesel and RME fueling at a BMEP of 0.503 MPa while operating at 1000169
rev/min. While operating at lower load, higher peak in-cylinder pressure has170
been observed when compared to RME. Shorter ignition in case of RME has171
caused the peak pressure to occur slightly earlier. When the rate of energy172
release curves for the two fuels were compared, diesel has shown clearly higher173
rate of energy release peaks. Both peaks for the rate of energy release higher174
lower and occur earlier when compared to the ones obtained with diesel. At175
higher loads, the two fuels have shown similar peak pressures with diesel176
11

2
2.5
3
3.5
4
4.5
5
νδερ
Πρε
σσυρε
/ Μ
πα
Dιεσελ
0
0.5
1
1.5
2
−30 −20 −10 0 10 20 30
Ιν−Χ
ψλι
ν
Χρανκ Ανγλε/Dεγρεεσ ΑΤDΧ
ΡΜΕ
(a)
1
1.5
2
2.5
Εν
εργ
ψ Ρ
ελεα
σε /
Μϑ
Dιεσελ
ΡΜΕ
0
0.5
−30 −20 −10 0 10 20 30
Ρατ
ε ο
φ Ε
Χρανκ Ανγλε / Dεγρεεσ ΑΤDΧ
(b)
Figure 2: Experimentally obtained in-cylinder pressure (a) and rate of energy release (b)
for for diesel and RME at a BMEP of 0.125 MPa and 1000 rev/min
3
4
5
6
νδ
ερ Π
ρεσσ
υρε
/ Μ
Πα
Dιεσελ
0
1
2
−30 −20 −10 0 10 20 30
Ιν−Χ
ψλι
ν
Χρανκ Ανγλε/Dεγρεεσ ΑΤDΧ
ΡΜΕ
(a)
1
1.5
2
2.5
Εν
εργ
ψ Ρ
ελεα
σε /
Μϑ
Dιεσελ
ΡΜΕ
0
0.5
1
−30 −20 −10 0 10 20 30
Ρατ
ε ο
φ Ε
Χρανκ Ανγλε / Dεγρεεσ ΑΤDΧ
(b)
Figure 3: Experimentally obtained in-cylinder pressure (a) and rate of energy release (b)
for diesel and RME at a BMEP of 0.503 MPa and 1000 rev/min
producing slightly higher peak pressure but the difference in peak pressures177
for the two fuels is reduced when when compared to the lower load case.178
Similar to the lower load case, the first rate of energy release peak diesel is179
significantly higher but the second peak for RME is higher when compared180
12
3
4
5
6
νσδ
ερ Π
ρεσσ
υρε
/ Μ
Πα
Dιεσελ
0
1
2
−30 −20 −10 0 10 20 30
Ιν−Χ
ψλι
ν
Χρανκ Ανγλε/ Dεγρεεσ ΑΤDΧ
Dιεσελ_Νατυραλ Γασ
(a)
1
1.5
2
2.5
Ενερ
γψ Ρ
ελεα
σε /
Μϑ
0
0.5
1
−30 −20 −10 0 10 20 30
Ρατ
ε ο
φ Ε
Χρανκ ανγλε / Dεγρεεσ ΑΤDΧ
Dιεσελ
Dιεσελ_Νατυραλ Γασ
(b)
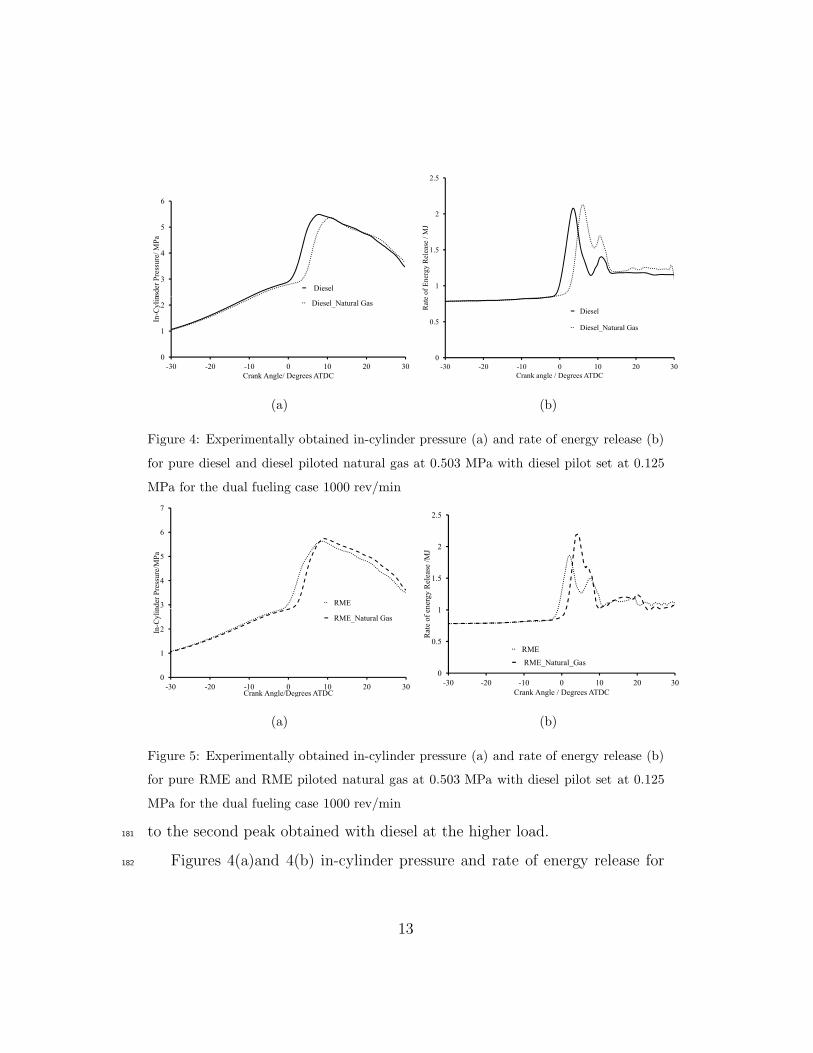
Figure 4: Experimentally obtained in-cylinder pressure (a) and rate of energy release (b)
for pure diesel and diesel piloted natural gas at 0.503 MPa with diesel pilot set at 0.125
MPa for the dual fueling case 1000 rev/min
3
4
5
6
7
νδ
ερ Π
ρεσσ
υρε
/ΜΠ
α
ΡΜΕ
0
1
2
−30 −20 −10 0 10 20 30
Ιν−Χ
ψλι
ν
Χρανκ Ανγλε/Dεγρεεσ ΑΤDΧ
ΡΜΕ_Νατυραλ Γασ
(a)
1
1.5
2
2.5
ενερ
γψ
Ρελ
εασε
/Μ
ϑ
0
0.5
1
−30 −20 −10 0 10 20 30
Ρατ
ε οφ
ε
Χρανκ Ανγλε / Dεγρεεσ ΑΤDΧ
ΡΜΕ
ΡΜΕ_Νατυραλ_Γασ
(b)
Figure 5: Experimentally obtained in-cylinder pressure (a) and rate of energy release (b)
for pure RME and RME piloted natural gas at 0.503 MPa with diesel pilot set at 0.125
MPa for the dual fueling case 1000 rev/min
to the second peak obtained with diesel at the higher load.181
Figures 4(a)and 4(b) in-cylinder pressure and rate of energy release for182
13
pure diesel and diesel piloted natural gas at 0.503 MPa with diesel pilot set183
at 0.125 MPa for the dual fuelling case 1000 rev/min. At a relatively lower184
load (0.38 MPa), diesel piloted natural gas has produced lower peak pressure185
when compared to the pure diesel based single fueling whereas similar peak186
pressures are observed when the two cases are compared at a higher BMEP187
(0.503 MPa). The rate of energy release peaks for the dual fueling case188
are comparable to the ones obtained with diesel based single fueling but189
these occur slightly later in the cycle. Figures 5(a) and 5(b) present the190
in-cylinder pressure and the rate of energy release for pure RME and RME191
piloted natural gas at 0.503 MPa with RME pilot set at 0.125 MPa for the192
dual fueling case 1000 rev/min. RME based dual fueling of natural gas has193
exhibited similar peak pressure but clearly higher first rate of energy release194
peak when compared to the RME based single fueling.195
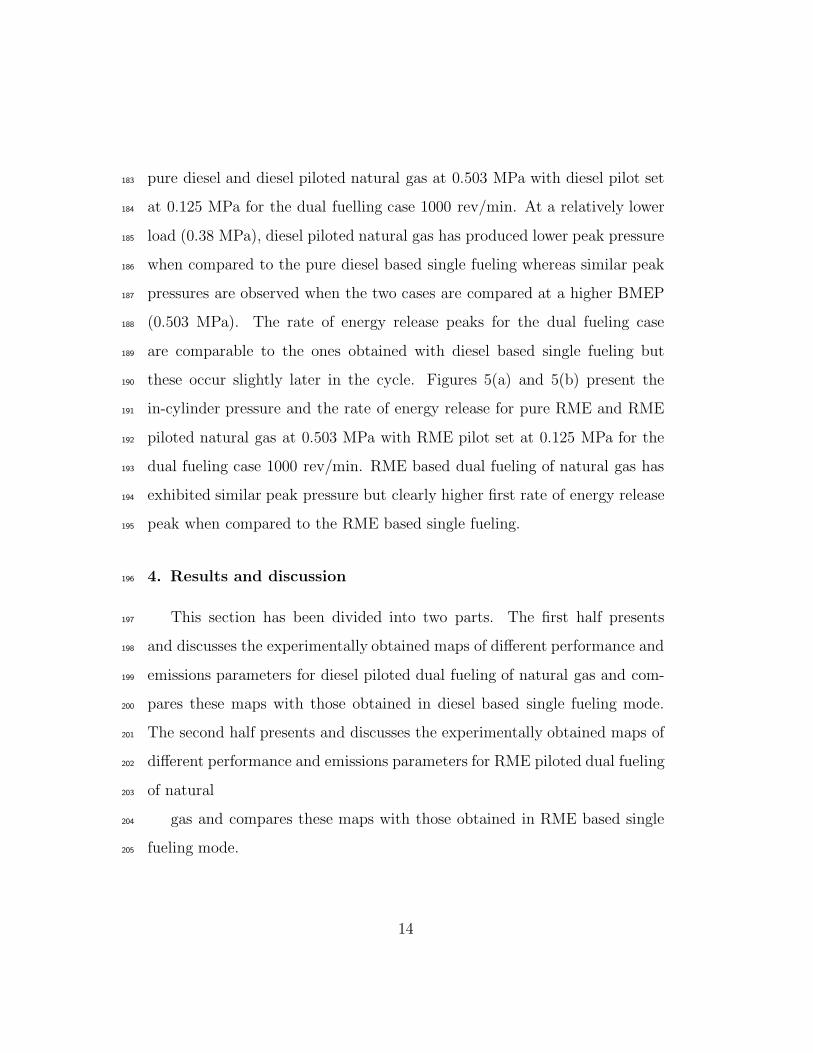
4. Results and discussion196
This section has been divided into two parts. The first half presents197
and discusses the experimentally obtained maps of different performance and198
emissions parameters for diesel piloted dual fueling of natural gas and com-199
pares these maps with those obtained in diesel based single fueling mode.200
The second half presents and discusses the experimentally obtained maps of201
different performance and emissions parameters for RME piloted dual fueling202
of natural203
gas and compares these maps with those obtained in RME based single204
fueling mode.205
14
4.1. Diesel Plus NG206
Maps for thermal efficiency, volumetric efficiency, specific NOX, specific207
HC and specific CO2 have been presented for diesel based single fueling and208
diesel piloted dual fueling of natural gas.209
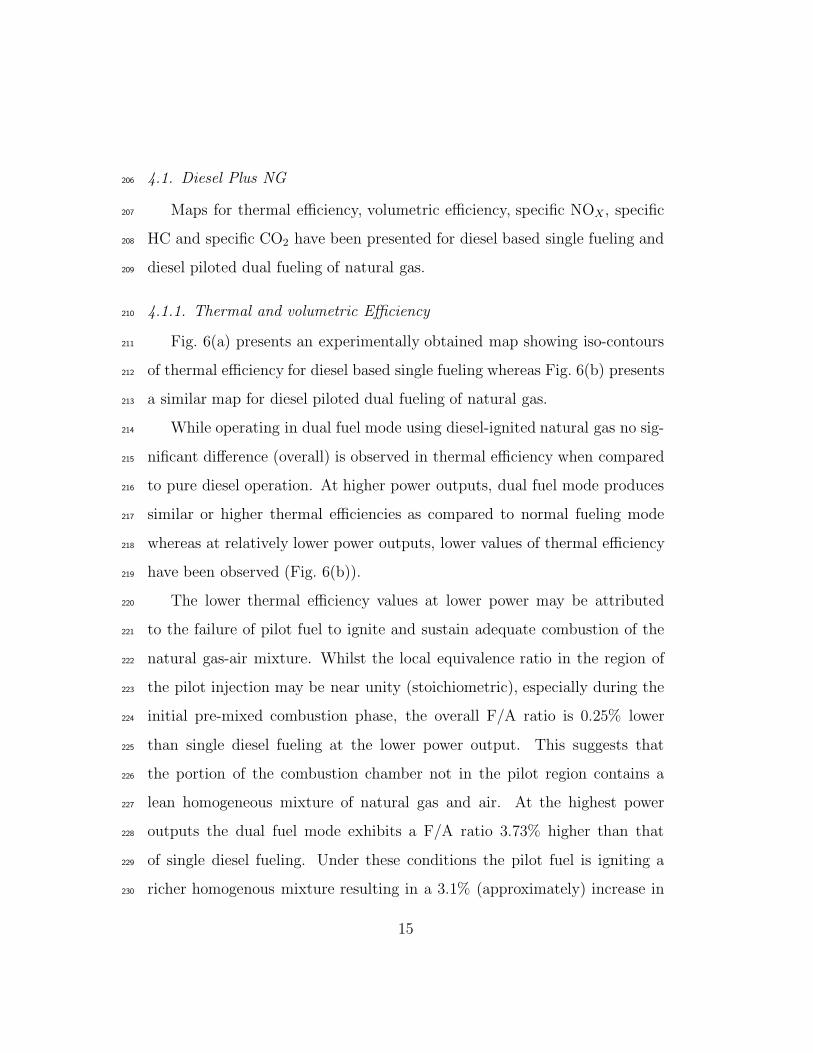
4.1.1. Thermal and volumetric Efficiency210
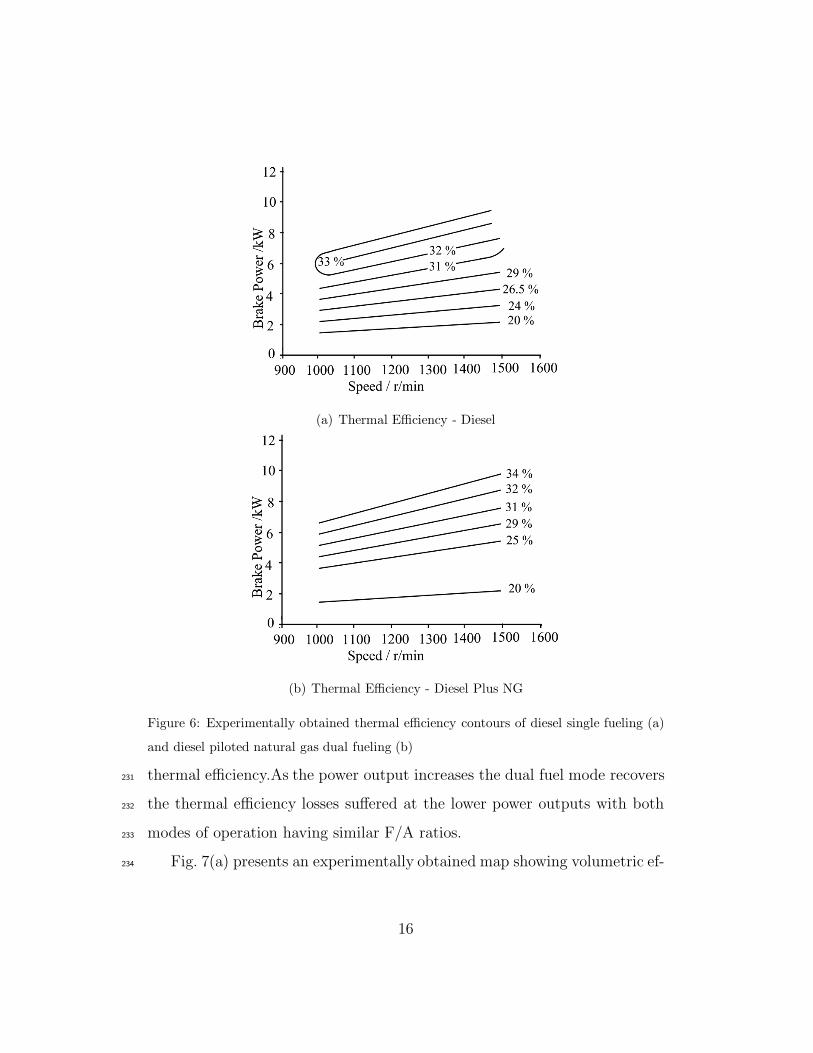
Fig. 6(a) presents an experimentally obtained map showing iso-contours211
of thermal efficiency for diesel based single fueling whereas Fig. 6(b) presents212
a similar map for diesel piloted dual fueling of natural gas.213
While operating in dual fuel mode using diesel-ignited natural gas no sig-214
nificant difference (overall) is observed in thermal efficiency when compared215
to pure diesel operation. At higher power outputs, dual fuel mode produces216
similar or higher thermal efficiencies as compared to normal fueling mode217
whereas at relatively lower power outputs, lower values of thermal efficiency218
have been observed (Fig. 6(b)).219
The lower thermal efficiency values at lower power may be attributed220
to the failure of pilot fuel to ignite and sustain adequate combustion of the221
natural gas-air mixture. Whilst the local equivalence ratio in the region of222
the pilot injection may be near unity (stoichiometric), especially during the223
initial pre-mixed combustion phase, the overall F/A ratio is 0.25% lower224
than single diesel fueling at the lower power output. This suggests that225
the portion of the combustion chamber not in the pilot region contains a226
lean homogeneous mixture of natural gas and air. At the highest power227
outputs the dual fuel mode exhibits a F/A ratio 3.73% higher than that228
of single diesel fueling. Under these conditions the pilot fuel is igniting a229
richer homogenous mixture resulting in a 3.1% (approximately) increase in230
15
(a) Thermal Efficiency - Diesel
(b) Thermal Efficiency - Diesel Plus NG
Figure 6: Experimentally obtained thermal efficiency contours of diesel single fueling (a)
and diesel piloted natural gas dual fueling (b)
thermal efficiency.As the power output increases the dual fuel mode recovers231
the thermal efficiency losses suffered at the lower power outputs with both232
modes of operation having similar F/A ratios.233
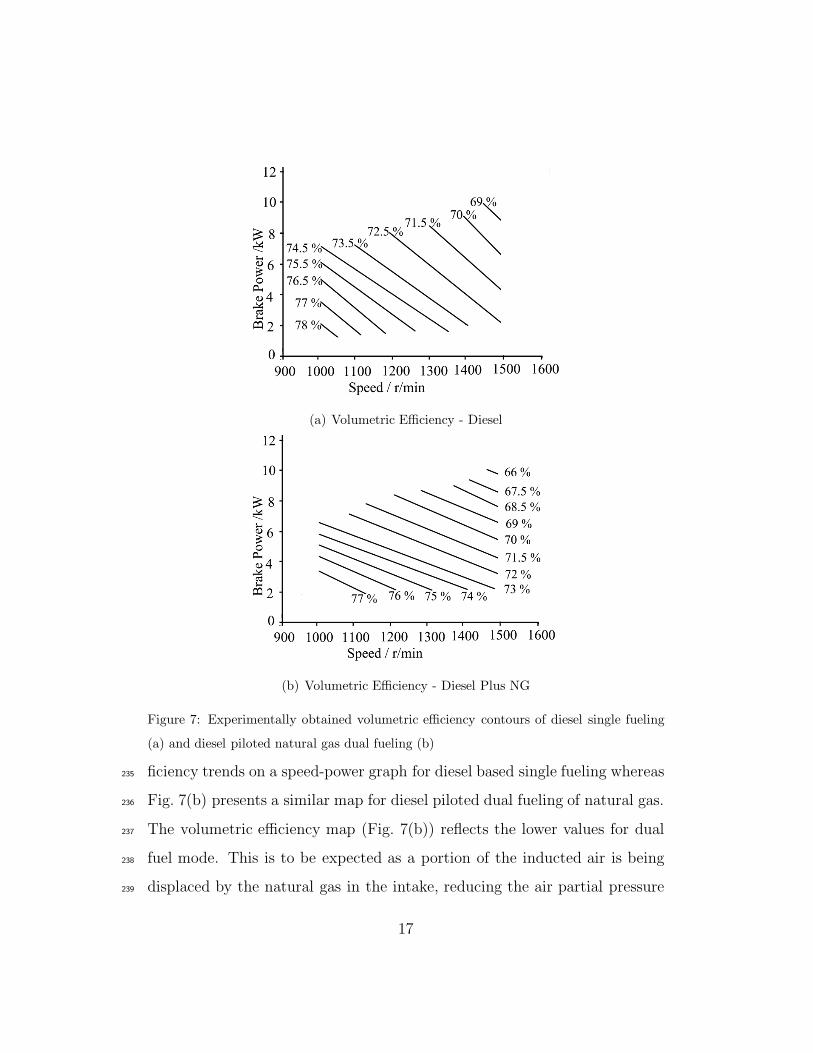
Fig. 7(a) presents an experimentally obtained map showing volumetric ef-234
16
(a) Volumetric Efficiency - Diesel
(b) Volumetric Efficiency - Diesel Plus NG
Figure 7: Experimentally obtained volumetric efficiency contours of diesel single fueling
(a) and diesel piloted natural gas dual fueling (b)
ficiency trends on a speed-power graph for diesel based single fueling whereas235
Fig. 7(b) presents a similar map for diesel piloted dual fueling of natural gas.236
The volumetric efficiency map (Fig. 7(b)) reflects the lower values for dual237
fuel mode. This is to be expected as a portion of the inducted air is being238
displaced by the natural gas in the intake, reducing the air partial pressure239
17
below that of the mixture pressure. Also as to be expected is the drop of240
volumetric efficiency as the engine speed increases for both modes of opera-241
tion (Fig. 7(a) and 7(b)). The frictional losses in the air intake are known242
to increase as the square of engine speed [22] . The slope of the volumetric243
efficiency contours is flatter for natural gas dual fueling with diesel than for244
baseline diesel operation and the values are lower. This is a consequence of245
the method used to introduce natural gas into the engine. As the natural246
gas has been introduced via manifold injection, a portion of the intake air247
is displaced by the natural gas, reducing the measured volume flow rate of248
air into the engine. This leads to a reduction of the engine’s volumetric flow249
rate. The slope of the iso-contours differs due to a change in the scaling of250
volumetric efficiency with engine speed. As the amount of natural gas added251
is increased to meet the increase in speed demand, larger amounts of air are252
displaced. As the natural gas is introduced at the manifold and does not flow253
through the entire intake system but the air does, the scaling law as noted254
by Heywood [22] does not hold.255
4.1.2. Specific NOX256
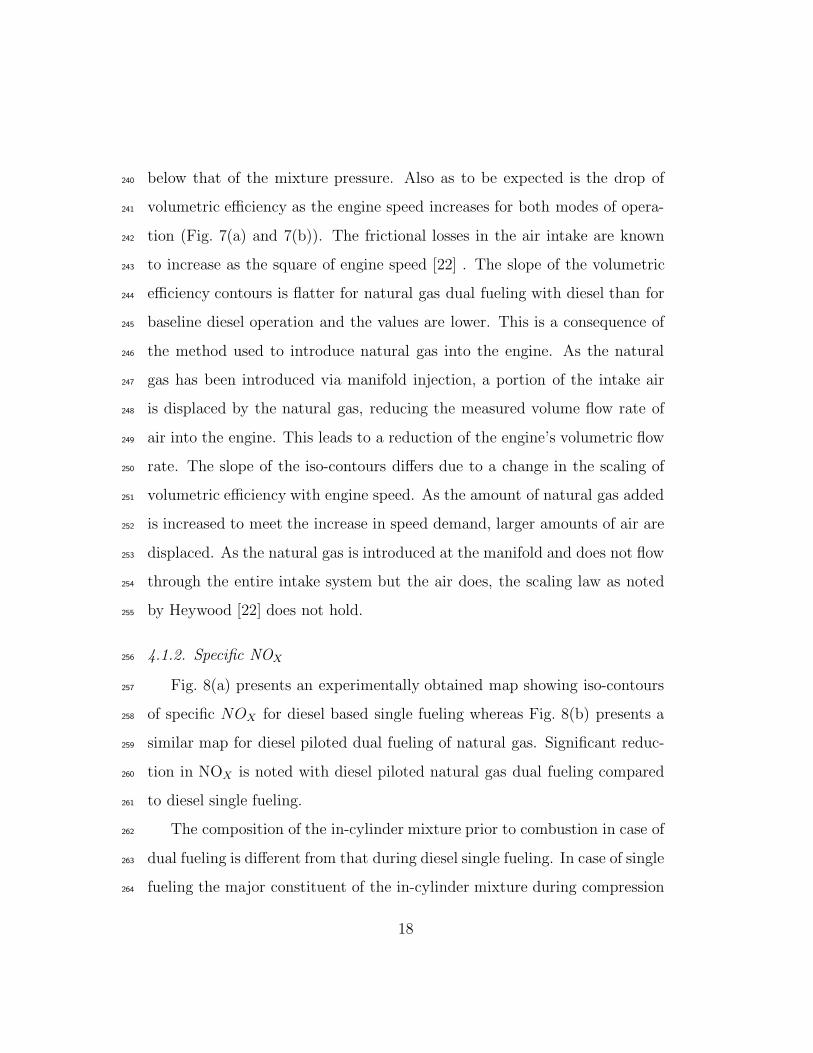
Fig. 8(a) presents an experimentally obtained map showing iso-contours257
of specific NOX for diesel based single fueling whereas Fig. 8(b) presents a258
similar map for diesel piloted dual fueling of natural gas. Significant reduc-259
tion in NOX is noted with diesel piloted natural gas dual fueling compared260
to diesel single fueling.261
The composition of the in-cylinder mixture prior to combustion in case of262
dual fueling is different from that during diesel single fueling. In case of single263
fueling the major constituent of the in-cylinder mixture during compression264
18
(a) Specific NOX /g/MJ - Diesel
(b) Specific NOX/ g/MJ - Diesel Plus NG
Figure 8: Experimentally obtained specific NOX contours for diesel single fueling (a)and
diesel piloted natural gas dual fueling (b).
stroke is air along with a fraction of the residual gases from the previous265
combustion event. Whereas in case of dual fueling, the mixture during com-266
pression stroke is composed of a homogeneous mixture of air , natural gas267
and residual gases. Fig. 9 shows the variation of the specific heat at constant268
19
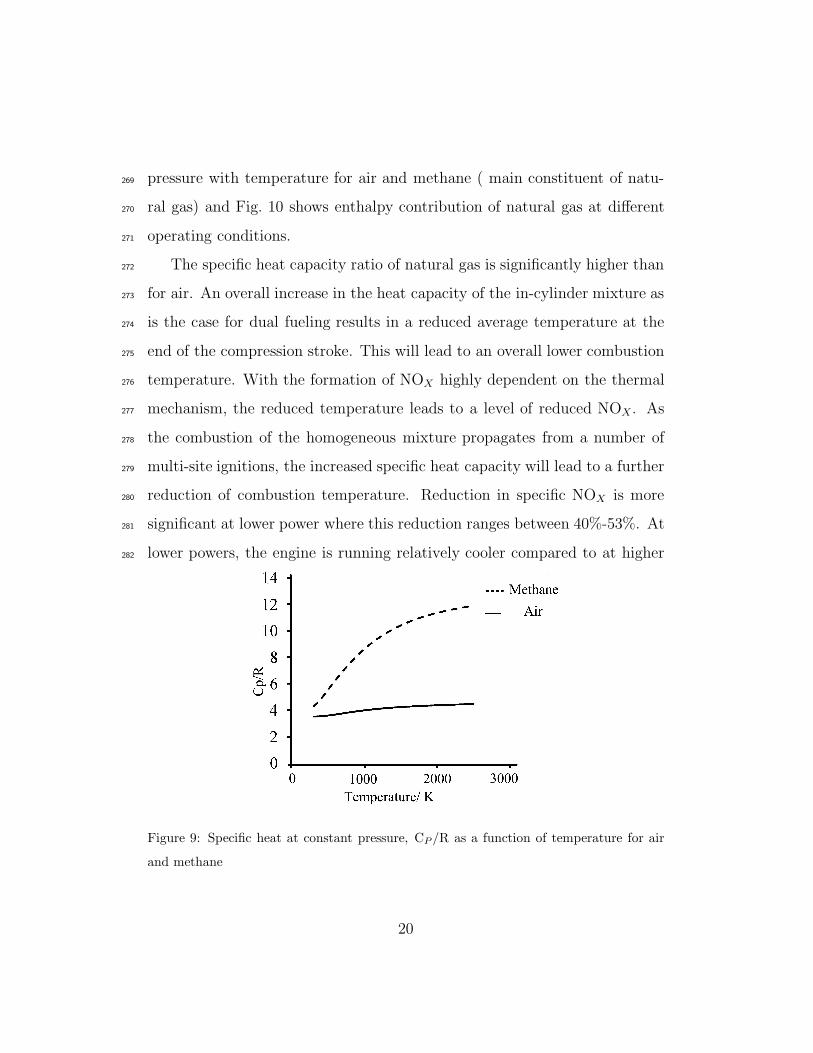
pressure with temperature for air and methane ( main constituent of natu-269
ral gas) and Fig. 10 shows enthalpy contribution of natural gas at different270
operating conditions.271
The specific heat capacity ratio of natural gas is significantly higher than272
for air. An overall increase in the heat capacity of the in-cylinder mixture as273
is the case for dual fueling results in a reduced average temperature at the274
end of the compression stroke. This will lead to an overall lower combustion275
temperature. With the formation of NOX highly dependent on the thermal276
mechanism, the reduced temperature leads to a level of reduced NOX. As277
the combustion of the homogeneous mixture propagates from a number of278
multi-site ignitions, the increased specific heat capacity will lead to a further279
reduction of combustion temperature. Reduction in specific NOX is more280
significant at lower power where this reduction ranges between 40%-53%. At281
lower powers, the engine is running relatively cooler compared to at higher282
Figure 9: Specific heat at constant pressure, CP /R as a function of temperature for air
and methane
20
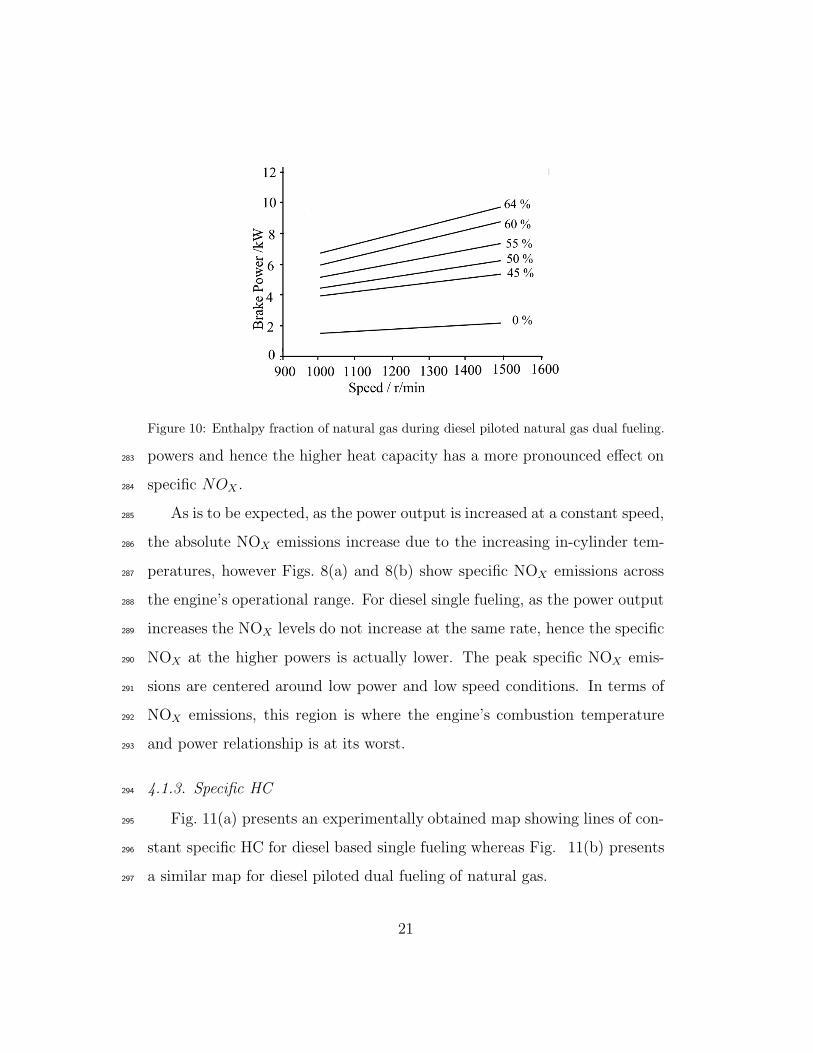
Figure 10: Enthalpy fraction of natural gas during diesel piloted natural gas dual fueling.
powers and hence the higher heat capacity has a more pronounced effect on283
specific NOX .284
As is to be expected, as the power output is increased at a constant speed,285
the absolute NOX emissions increase due to the increasing in-cylinder tem-286
peratures, however Figs. 8(a) and 8(b) show specific NOX emissions across287
the engine’s operational range. For diesel single fueling, as the power output288
increases the NOX levels do not increase at the same rate, hence the specific289
NOX at the higher powers is actually lower. The peak specific NOX emis-290
sions are centered around low power and low speed conditions. In terms of291
NOX emissions, this region is where the engine’s combustion temperature292
and power relationship is at its worst.293
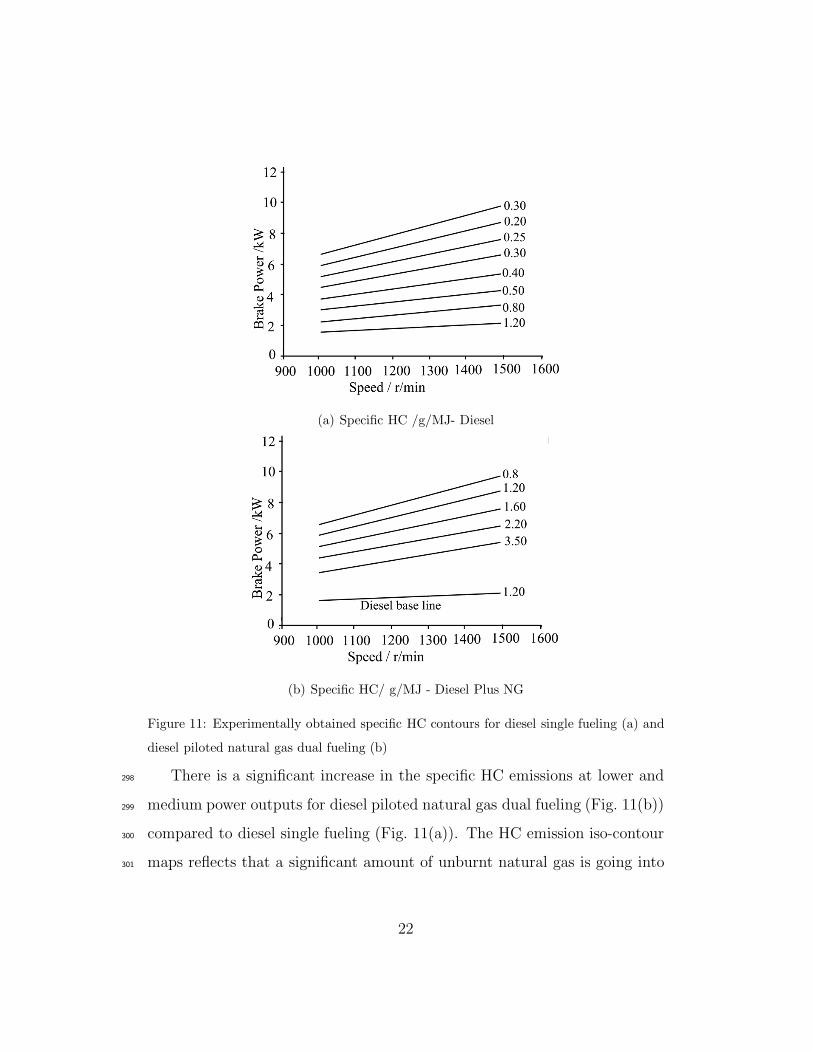
4.1.3. Specific HC294
Fig. 11(a) presents an experimentally obtained map showing lines of con-295
stant specific HC for diesel based single fueling whereas Fig. 11(b) presents296
a similar map for diesel piloted dual fueling of natural gas.297
21
(a) Specific HC /g/MJ- Diesel
(b) Specific HC/ g/MJ - Diesel Plus NG
Figure 11: Experimentally obtained specific HC contours for diesel single fueling (a) and
diesel piloted natural gas dual fueling (b)
There is a significant increase in the specific HC emissions at lower and298
medium power outputs for diesel piloted natural gas dual fueling (Fig. 11(b))299
compared to diesel single fueling (Fig. 11(a)). The HC emission iso-contour300
maps reflects that a significant amount of unburnt natural gas is going into301
22
the engine exhaust. One possible explanation for this inefficient burning302
may be poor flame propagation throughout the homogeneous natural gas-air303
mixture.304
The equivalence ratio (φ) threshold for dual fuel modes is 0.4. Below305
this threshold value, the HC emissions increase whereas increasing φ beyond306
this value results in a decrease in HC emissions. The equivalence ratio in307
this case ranges between 0.44 and 0.79 and this is reflected in gradual de-308
crease of HC emissions as the load increases. When natural gas contributes309
approximately 45% of the total enthalpy (Fig. 10) the specific HC emissions310
increase by about 800%. As the load is increased, the difference between the311
two modes (single and dual fuel modes) in terms of specific HC emissions312
is narrowed down. At maximum load conditions when natural gas enthalpy313
fraction is more than 60%, the dual fuel case produces 250% more specific314
HC emissions when compared to the diesel single fueling which reflects a315
percentage decrease of about 20% when compared to the case when natural316
gas contributed about 45% of the total enthalpy required. These higher HC317
numbers in dual fueling case can again be attributed to deteriorated com-318
bustion (especially in the pre-mixed phase) due to low temperature of the319
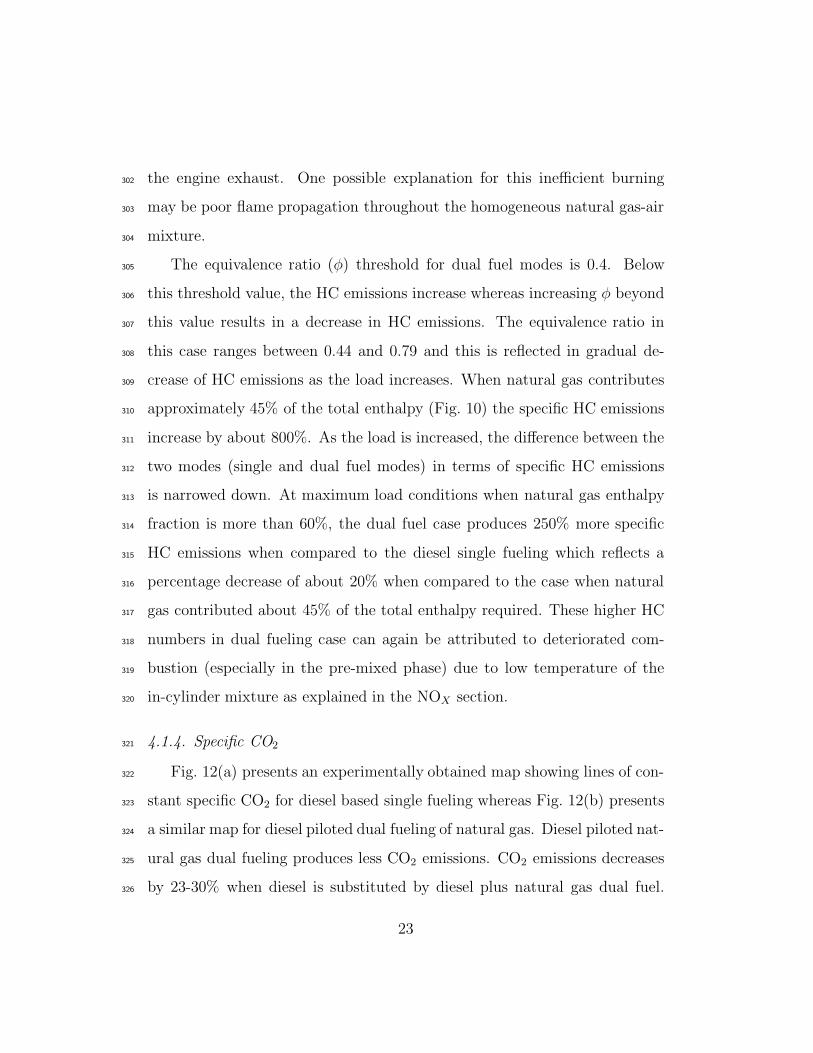
in-cylinder mixture as explained in the NOX section.320
4.1.4. Specific CO2321
Fig. 12(a) presents an experimentally obtained map showing lines of con-322
stant specific CO2 for diesel based single fueling whereas Fig. 12(b) presents323
a similar map for diesel piloted dual fueling of natural gas. Diesel piloted nat-324
ural gas dual fueling produces less CO2 emissions. CO2 emissions decreases325
by 23-30% when diesel is substituted by diesel plus natural gas dual fuel.326
23
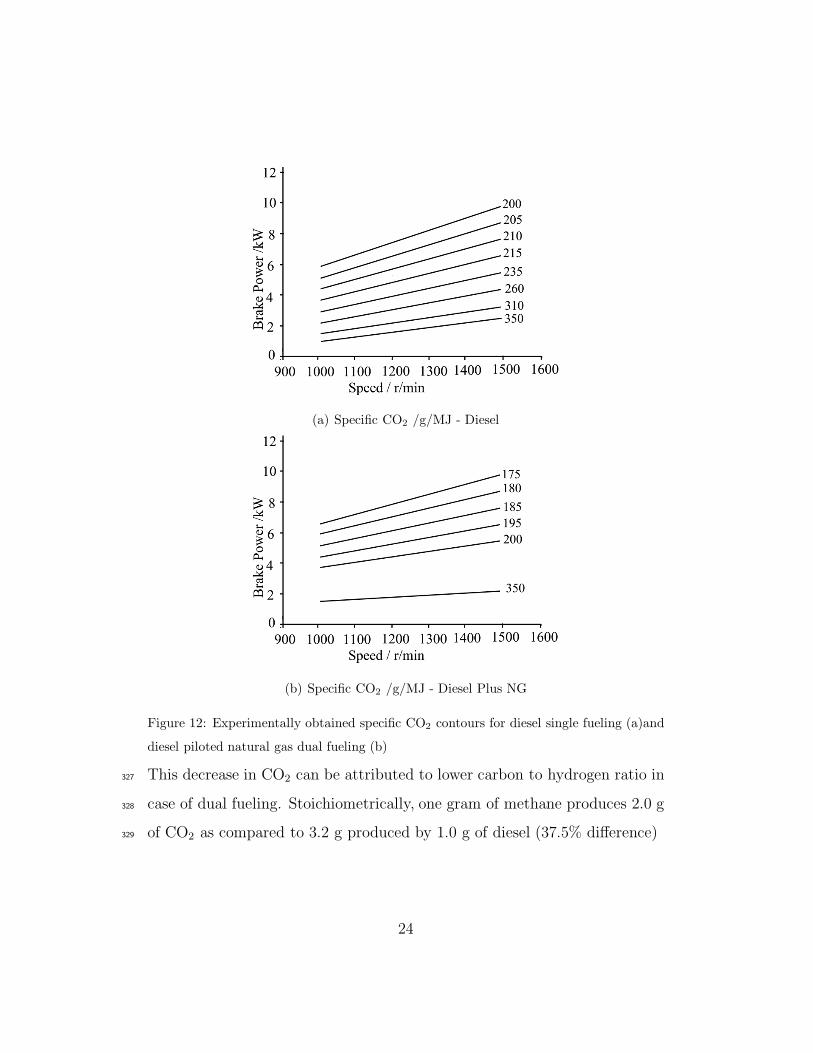
(a) Specific CO2 /g/MJ - Diesel
(b) Specific CO2 /g/MJ - Diesel Plus NG
Figure 12: Experimentally obtained specific CO2 contours for diesel single fueling (a)and
diesel piloted natural gas dual fueling (b)
This decrease in CO2 can be attributed to lower carbon to hydrogen ratio in327
case of dual fueling. Stoichiometrically, one gram of methane produces 2.0 g328
of CO2 as compared to 3.2 g produced by 1.0 g of diesel (37.5% difference)329
24
4.2. RME Plus NG330
Maps for thermal efficiency, volumetric efficiency, specific NOX, specific331
HC and specific CO2 have been presented for RME based single fueling and332
RME piloted dual fueling of natural gas.333
4.2.1. Thermal and volumetric Efficiency334
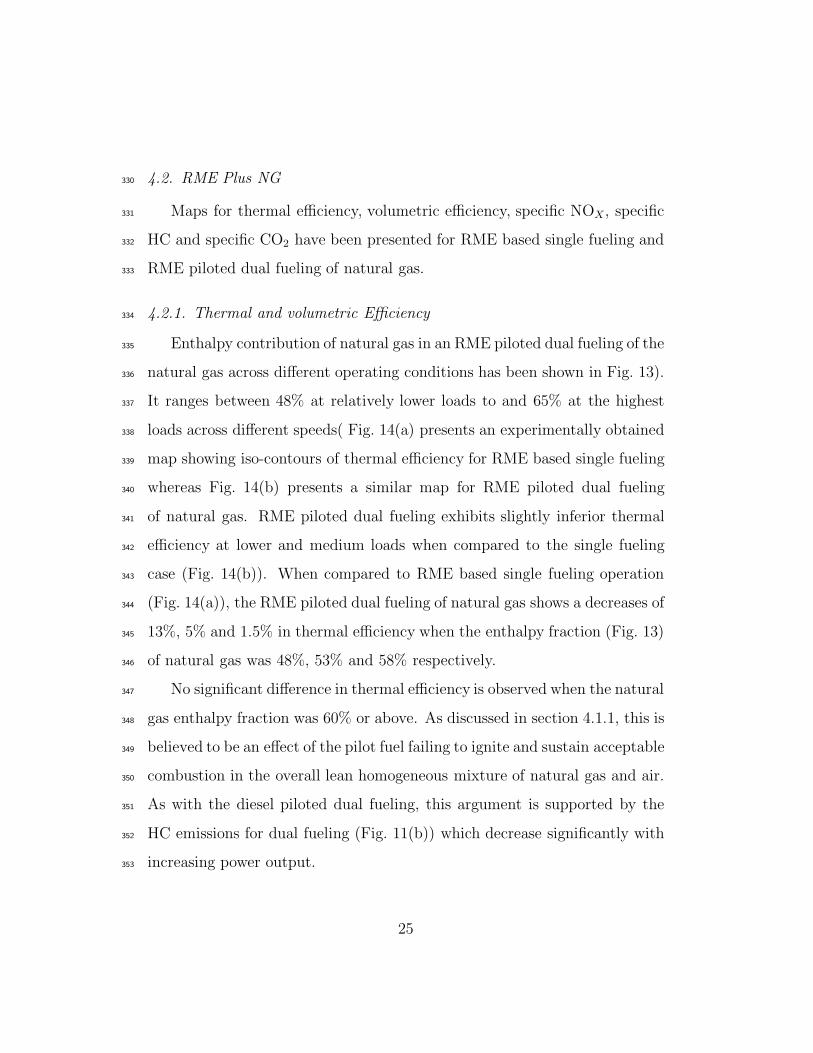
Enthalpy contribution of natural gas in an RME piloted dual fueling of the335
natural gas across different operating conditions has been shown in Fig. 13).336
It ranges between 48% at relatively lower loads to and 65% at the highest337
loads across different speeds( Fig. 14(a) presents an experimentally obtained338
map showing iso-contours of thermal efficiency for RME based single fueling339
whereas Fig. 14(b) presents a similar map for RME piloted dual fueling340
of natural gas. RME piloted dual fueling exhibits slightly inferior thermal341
efficiency at lower and medium loads when compared to the single fueling342
case (Fig. 14(b)). When compared to RME based single fueling operation343
(Fig. 14(a)), the RME piloted dual fueling of natural gas shows a decreases of344
13%, 5% and 1.5% in thermal efficiency when the enthalpy fraction (Fig. 13)345
of natural gas was 48%, 53% and 58% respectively.346
No significant difference in thermal efficiency is observed when the natural347
gas enthalpy fraction was 60% or above. As discussed in section 4.1.1, this is348
believed to be an effect of the pilot fuel failing to ignite and sustain acceptable349
combustion in the overall lean homogeneous mixture of natural gas and air.350
As with the diesel piloted dual fueling, this argument is supported by the351
HC emissions for dual fueling (Fig. 11(b)) which decrease significantly with352
increasing power output.353
25
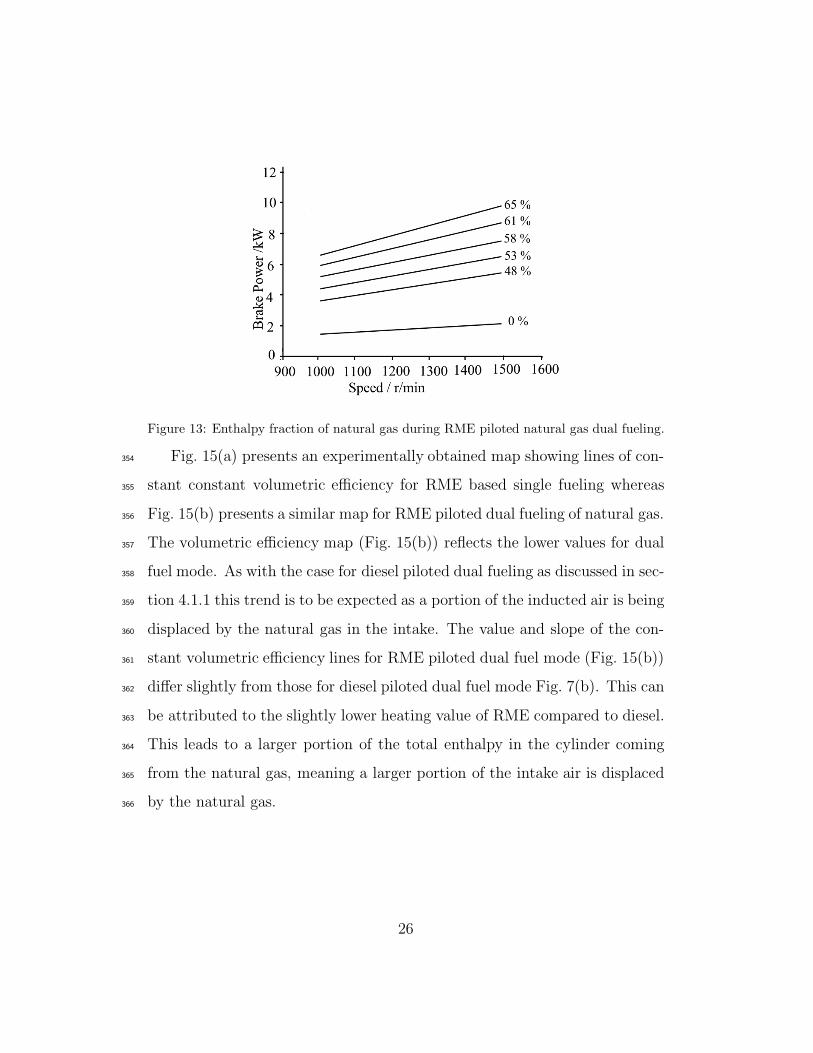
Figure 13: Enthalpy fraction of natural gas during RME piloted natural gas dual fueling.
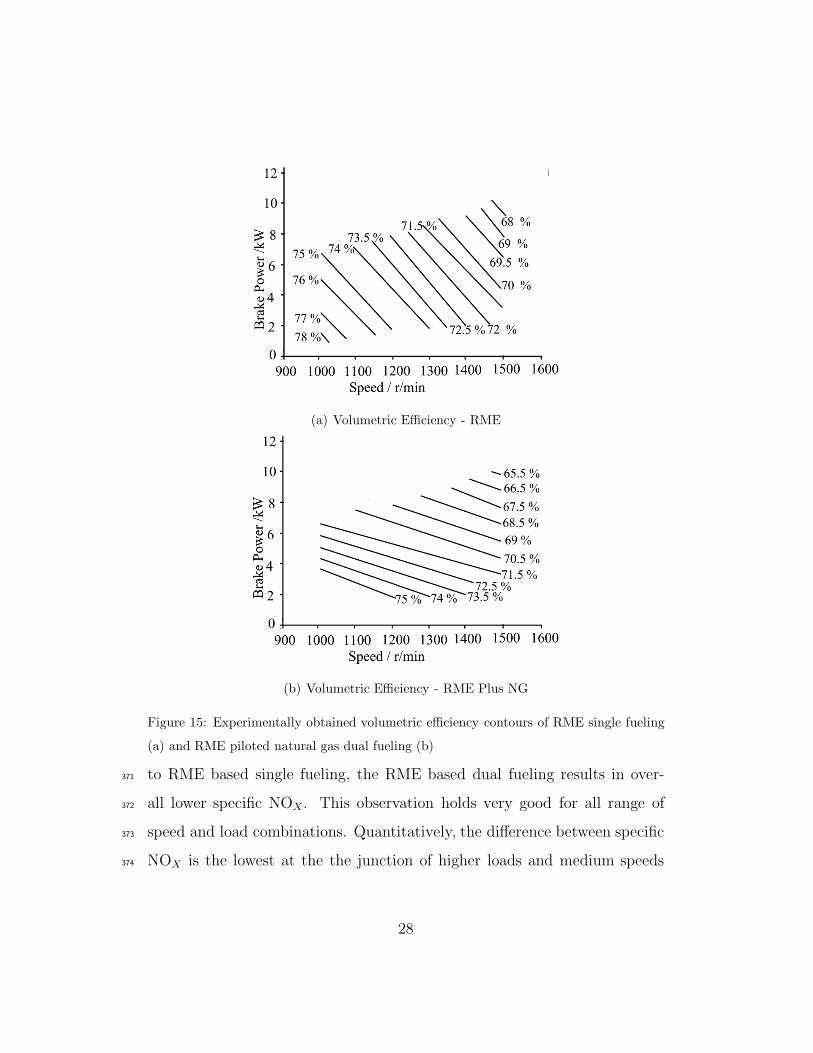
Fig. 15(a) presents an experimentally obtained map showing lines of con-354
stant constant volumetric efficiency for RME based single fueling whereas355
Fig. 15(b) presents a similar map for RME piloted dual fueling of natural gas.356
The volumetric efficiency map (Fig. 15(b)) reflects the lower values for dual357
fuel mode. As with the case for diesel piloted dual fueling as discussed in sec-358
tion 4.1.1 this trend is to be expected as a portion of the inducted air is being359
displaced by the natural gas in the intake. The value and slope of the con-360
stant volumetric efficiency lines for RME piloted dual fuel mode (Fig. 15(b))361
differ slightly from those for diesel piloted dual fuel mode Fig. 7(b). This can362
be attributed to the slightly lower heating value of RME compared to diesel.363
This leads to a larger portion of the total enthalpy in the cylinder coming364
from the natural gas, meaning a larger portion of the intake air is displaced365
by the natural gas.366
26
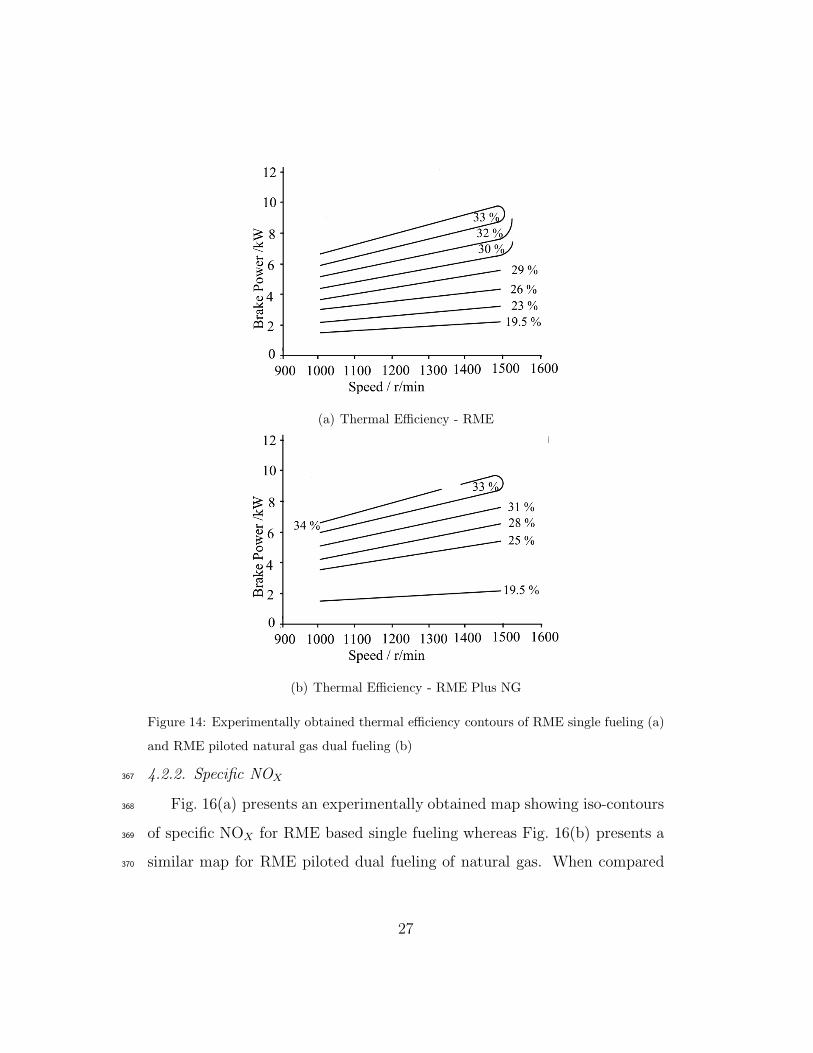
(a) Thermal Efficiency - RME
(b) Thermal Efficiency - RME Plus NG
Figure 14: Experimentally obtained thermal efficiency contours of RME single fueling (a)
and RME piloted natural gas dual fueling (b)
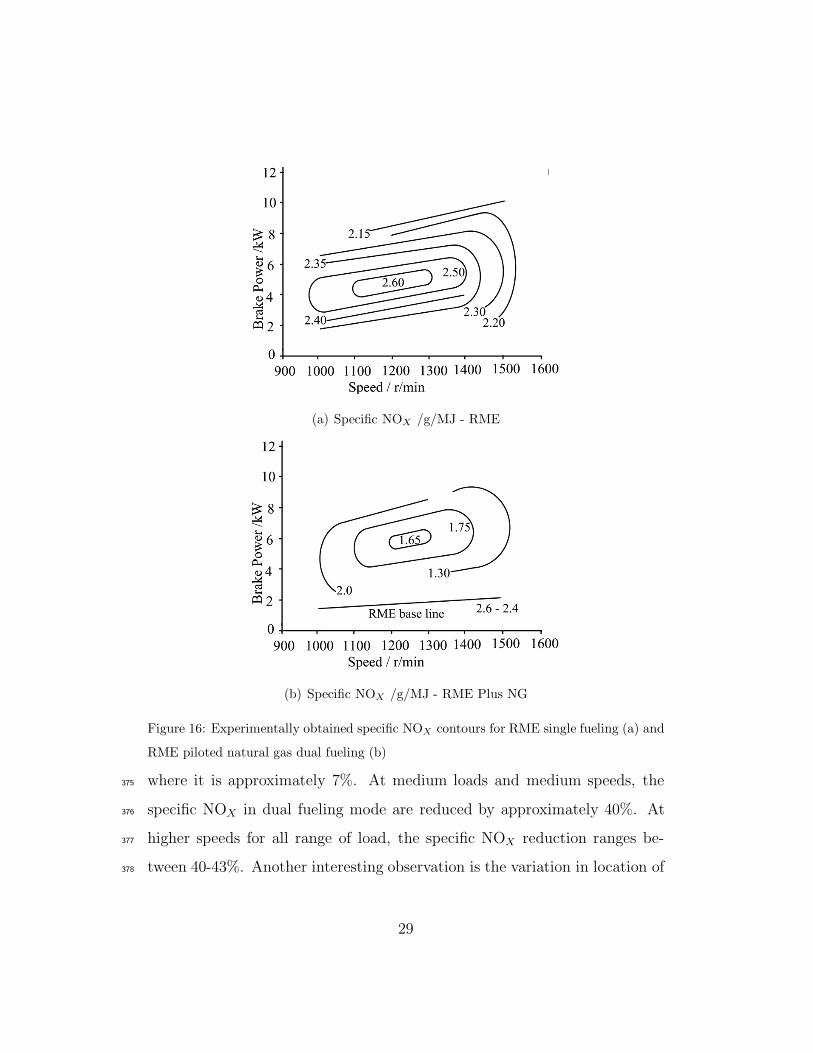
4.2.2. Specific NOX367
Fig. 16(a) presents an experimentally obtained map showing iso-contours368
of specific NOX for RME based single fueling whereas Fig. 16(b) presents a369
similar map for RME piloted dual fueling of natural gas. When compared370
27
(a) Volumetric Efficiency - RME
(b) Volumetric Efficiency - RME Plus NG
Figure 15: Experimentally obtained volumetric efficiency contours of RME single fueling
(a) and RME piloted natural gas dual fueling (b)
to RME based single fueling, the RME based dual fueling results in over-371
all lower specific NOX. This observation holds very good for all range of372
speed and load combinations. Quantitatively, the difference between specific373
NOX is the lowest at the the junction of higher loads and medium speeds374
28
(a) Specific NOX /g/MJ - RME
(b) Specific NOX /g/MJ - RME Plus NG
Figure 16: Experimentally obtained specific NOX contours for RME single fueling (a) and
RME piloted natural gas dual fueling (b)
where it is approximately 7%. At medium loads and medium speeds, the375
specific NOX in dual fueling mode are reduced by approximately 40%. At376
higher speeds for all range of load, the specific NOX reduction ranges be-377
tween 40-43%. Another interesting observation is the variation in location of378
29
(a) Specific HC /g/MJ - RME
(b) Specific HC /g/MJ- RME Plus NG
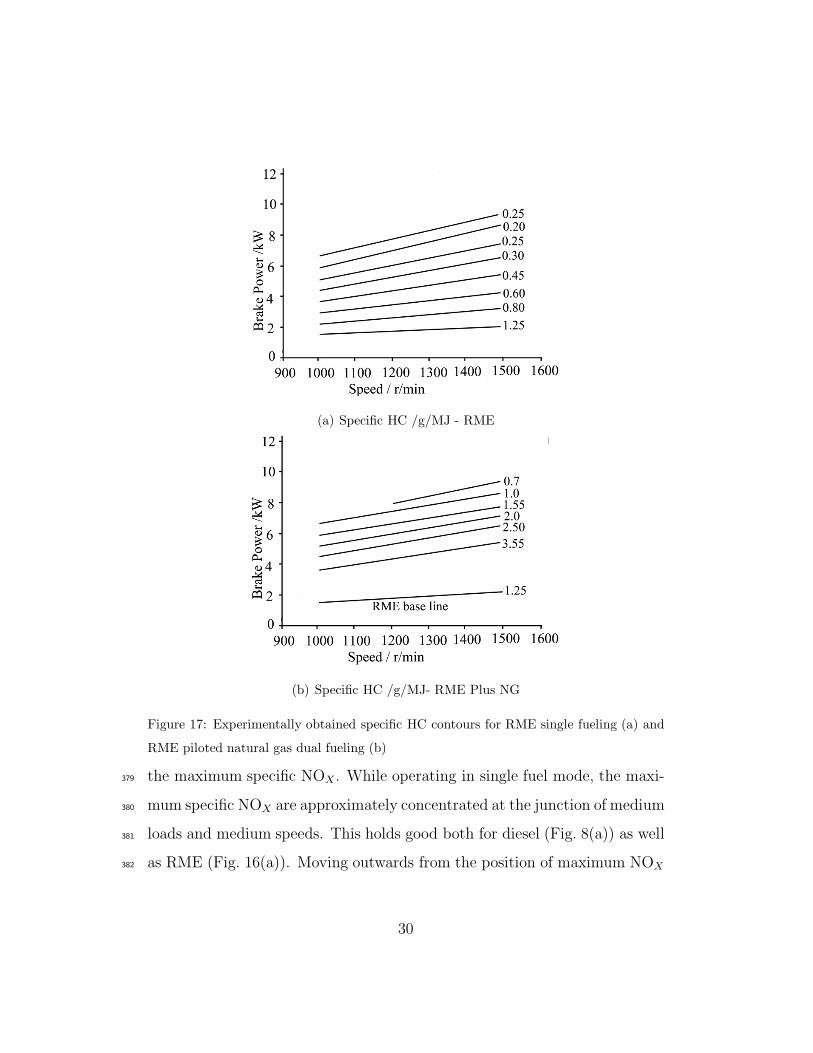
Figure 17: Experimentally obtained specific HC contours for RME single fueling (a) and
RME piloted natural gas dual fueling (b)
the maximum specific NOX. While operating in single fuel mode, the maxi-379
mum specific NOX are approximately concentrated at the junction of medium380
loads and medium speeds. This holds good both for diesel (Fig. 8(a)) as well381
as RME (Fig. 16(a)). Moving outwards from the position of maximum NOX382
30
(a) Specific CO2 /g/MJ - RME
(b) Specific CO2 /g/MJ - RME Plus NG
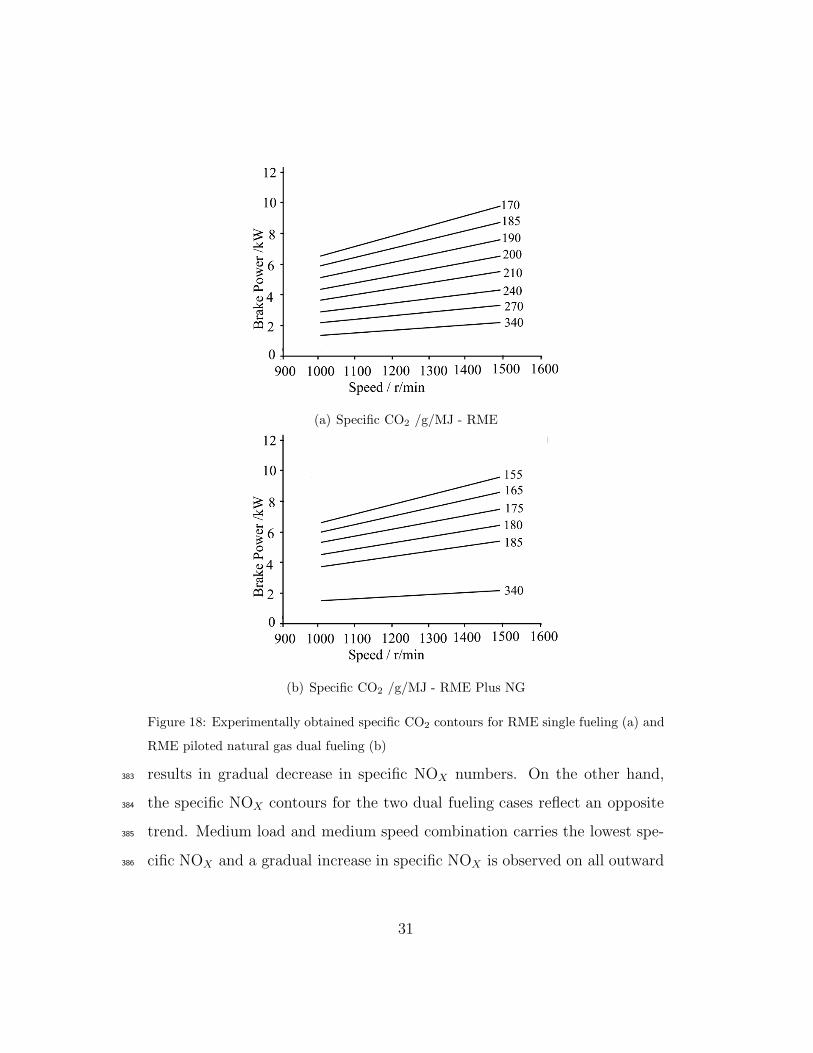
Figure 18: Experimentally obtained specific CO2 contours for RME single fueling (a) and
RME piloted natural gas dual fueling (b)
results in gradual decrease in specific NOX numbers. On the other hand,383
the specific NOX contours for the two dual fueling cases reflect an opposite384
trend. Medium load and medium speed combination carries the lowest spe-385
cific NOX and a gradual increase in specific NOX is observed on all outward386
31
contours. The only exception to this trend are the specific NOX contours387
at higher speeds. The specific NOX maps both for diesel (Fig. 8(b)) and388
RME (Fig. 16(b)) piloted dual fueling case reflect that the latter produces389
slightly higher specific NOX as compared to the former. This difference in390
specific NOX numbers for the two dual fueling cases can be explained by rel-391
atively higher absolute NOX numbers in case of RME and a slight variation392
in thermal efficiency (Figs 6(b) and 14(b)).393
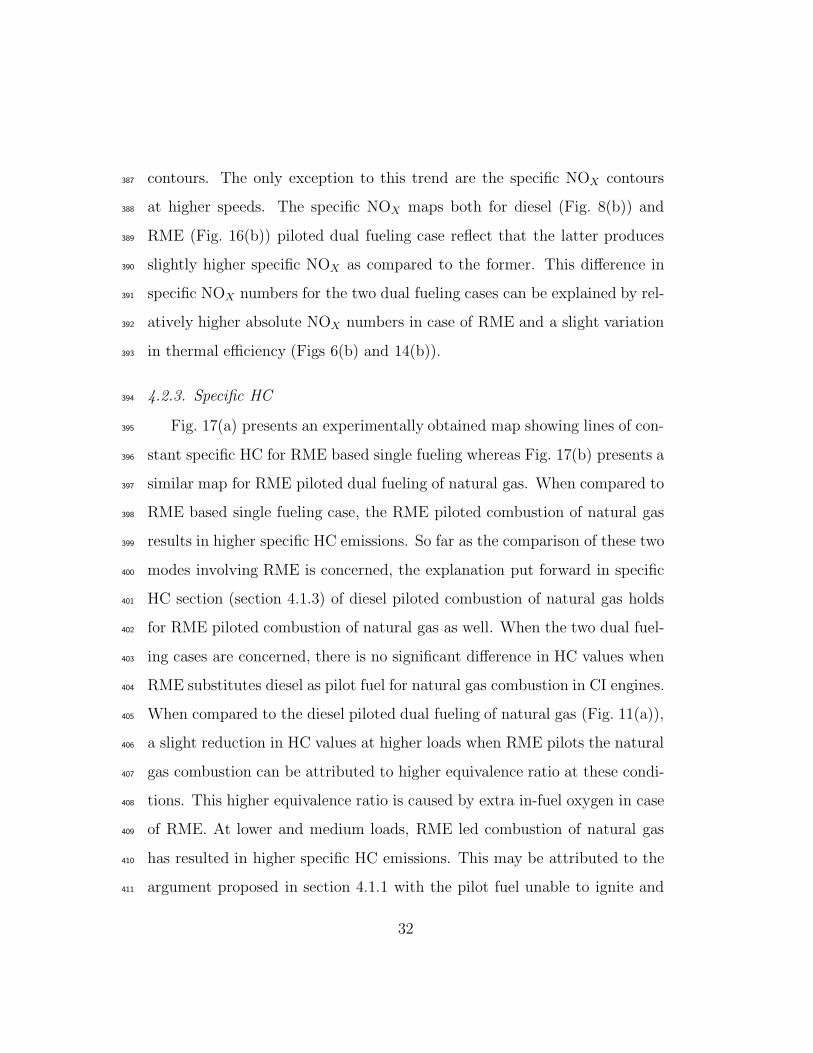
4.2.3. Specific HC394
Fig. 17(a) presents an experimentally obtained map showing lines of con-395
stant specific HC for RME based single fueling whereas Fig. 17(b) presents a396
similar map for RME piloted dual fueling of natural gas. When compared to397
RME based single fueling case, the RME piloted combustion of natural gas398
results in higher specific HC emissions. So far as the comparison of these two399
modes involving RME is concerned, the explanation put forward in specific400
HC section (section 4.1.3) of diesel piloted combustion of natural gas holds401
for RME piloted combustion of natural gas as well. When the two dual fuel-402
ing cases are concerned, there is no significant difference in HC values when403
RME substitutes diesel as pilot fuel for natural gas combustion in CI engines.404
When compared to the diesel piloted dual fueling of natural gas (Fig. 11(a)),405
a slight reduction in HC values at higher loads when RME pilots the natural406
gas combustion can be attributed to higher equivalence ratio at these condi-407
tions. This higher equivalence ratio is caused by extra in-fuel oxygen in case408
of RME. At lower and medium loads, RME led combustion of natural gas409
has resulted in higher specific HC emissions. This may be attributed to the410
argument proposed in section 4.1.1 with the pilot fuel unable to ignite and411
32
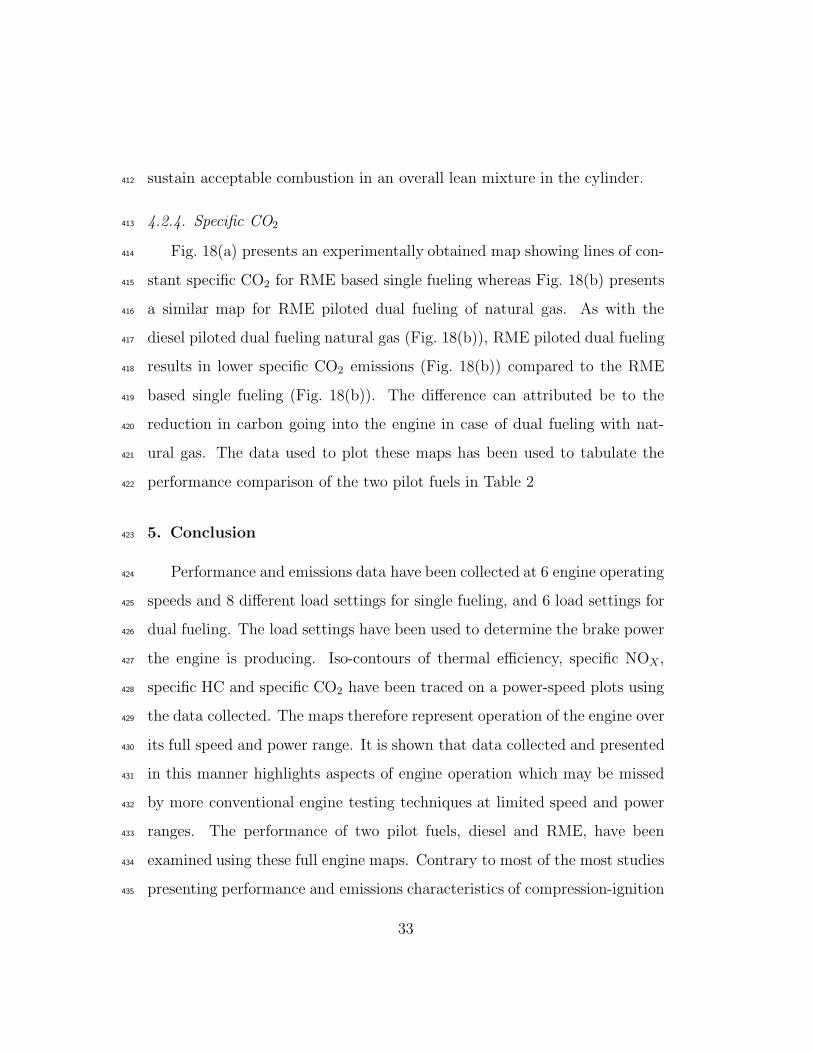
sustain acceptable combustion in an overall lean mixture in the cylinder.412
4.2.4. Specific CO2413
Fig. 18(a) presents an experimentally obtained map showing lines of con-414
stant specific CO2 for RME based single fueling whereas Fig. 18(b) presents415
a similar map for RME piloted dual fueling of natural gas. As with the416
diesel piloted dual fueling natural gas (Fig. 18(b)), RME piloted dual fueling417
results in lower specific CO2 emissions (Fig. 18(b)) compared to the RME418
based single fueling (Fig. 18(b)). The difference can attributed be to the419
reduction in carbon going into the engine in case of dual fueling with nat-420
ural gas. The data used to plot these maps has been used to tabulate the421
performance comparison of the two pilot fuels in Table 2422
5. Conclusion423
Performance and emissions data have been collected at 6 engine operating424
speeds and 8 different load settings for single fueling, and 6 load settings for425
dual fueling. The load settings have been used to determine the brake power426
the engine is producing. Iso-contours of thermal efficiency, specific NOX,427
specific HC and specific CO2 have been traced on a power-speed plots using428
the data collected. The maps therefore represent operation of the engine over429
its full speed and power range. It is shown that data collected and presented430
in this manner highlights aspects of engine operation which may be missed431
by more conventional engine testing techniques at limited speed and power432
ranges. The performance of two pilot fuels, diesel and RME, have been433
examined using these full engine maps. Contrary to most of the most studies434
presenting performance and emissions characteristics of compression-ignition435
33
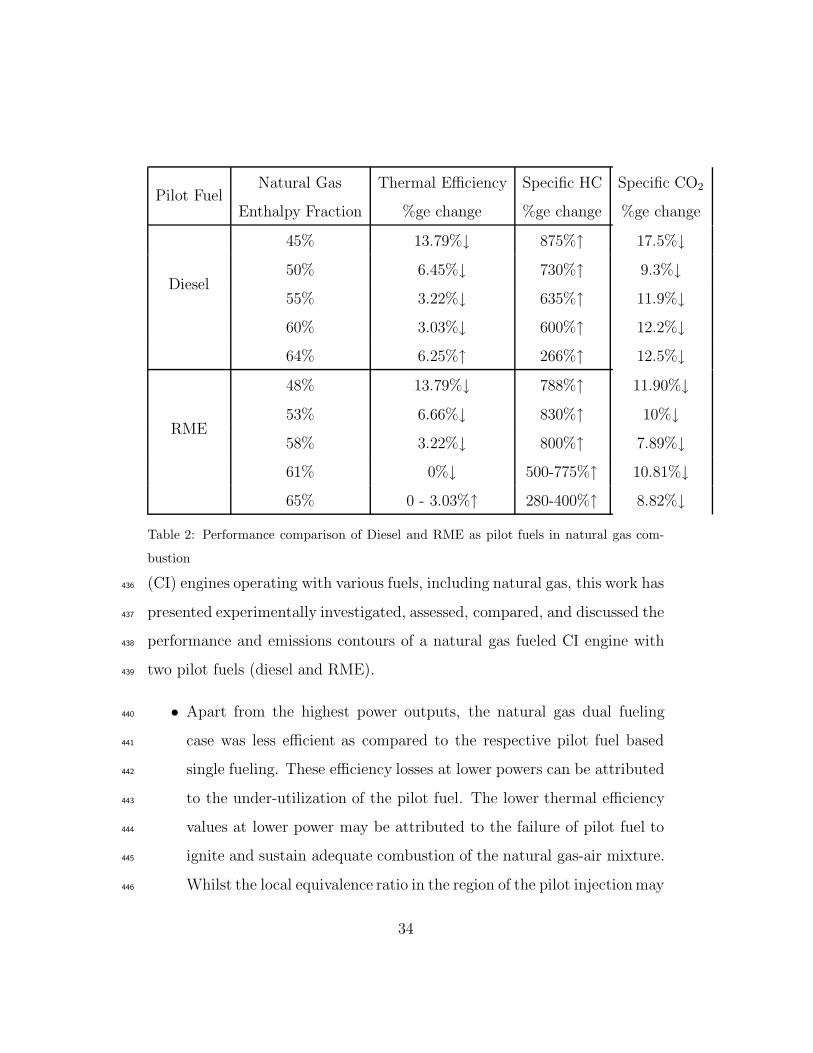
Pilot FuelNatural Gas
Enthalpy Fraction
Thermal Efficiency
%ge change
Specific HC
%ge change
Specific CO2
%ge change
Diesel
45% 13.79%↓ 875%↑ 17.5%↓
50% 6.45%↓ 730%↑ 9.3%↓
55% 3.22%↓ 635%↑ 11.9%↓
60% 3.03%↓ 600%↑ 12.2%↓
64% 6.25%↑ 266%↑ 12.5%↓
RME
48% 13.79%↓ 788%↑ 11.90%↓
53% 6.66%↓ 830%↑ 10%↓
58% 3.22%↓ 800%↑ 7.89%↓
61% 0%↓ 500-775%↑ 10.81%↓
65% 0 - 3.03%↑ 280-400%↑ 8.82%↓
Table 2: Performance comparison of Diesel and RME as pilot fuels in natural gas com-
bustion
(CI) engines operating with various fuels, including natural gas, this work has436
presented experimentally investigated, assessed, compared, and discussed the437
performance and emissions contours of a natural gas fueled CI engine with438
two pilot fuels (diesel and RME).439
• Apart from the highest power outputs, the natural gas dual fueling440
case was less efficient as compared to the respective pilot fuel based441
single fueling. These efficiency losses at lower powers can be attributed442
to the under-utilization of the pilot fuel. The lower thermal efficiency443
values at lower power may be attributed to the failure of pilot fuel to444
ignite and sustain adequate combustion of the natural gas-air mixture.445
Whilst the local equivalence ratio in the region of the pilot injection may446
34
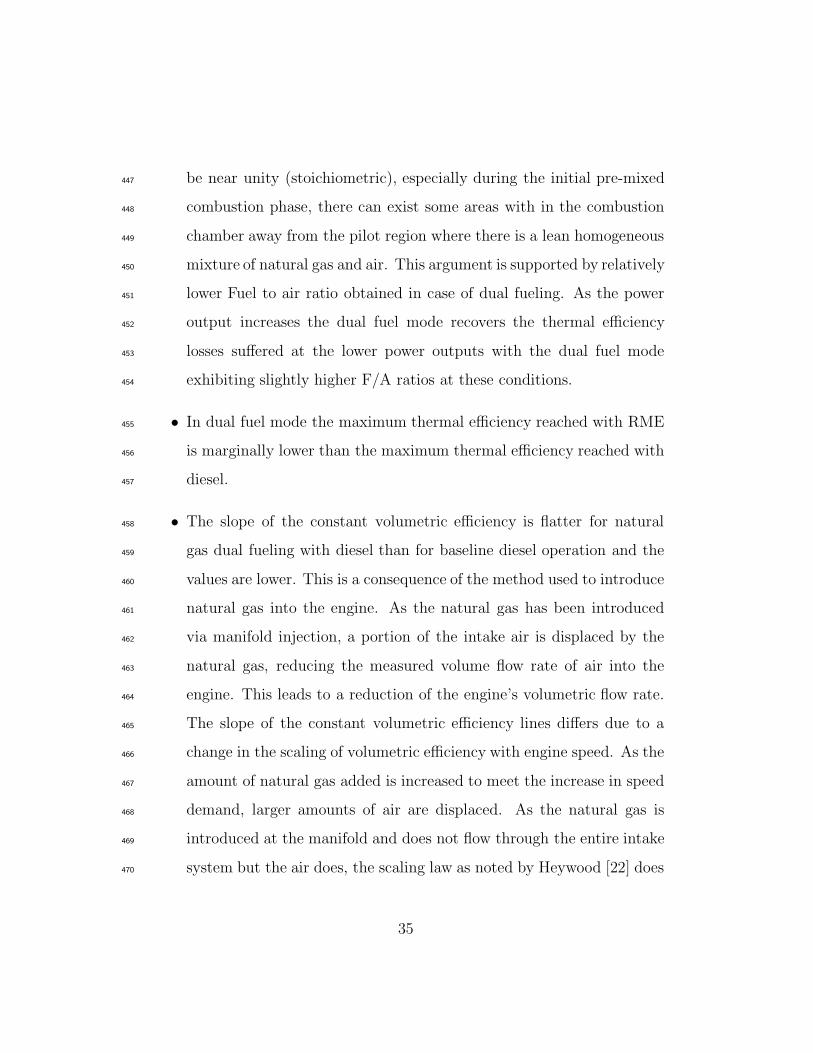
be near unity (stoichiometric), especially during the initial pre-mixed447
combustion phase, there can exist some areas with in the combustion448
chamber away from the pilot region where there is a lean homogeneous449
mixture of natural gas and air. This argument is supported by relatively450
lower Fuel to air ratio obtained in case of dual fueling. As the power451
output increases the dual fuel mode recovers the thermal efficiency452
losses suffered at the lower power outputs with the dual fuel mode453
exhibiting slightly higher F/A ratios at these conditions.454
• In dual fuel mode the maximum thermal efficiency reached with RME455
is marginally lower than the maximum thermal efficiency reached with456
diesel.457
• The slope of the constant volumetric efficiency is flatter for natural458
gas dual fueling with diesel than for baseline diesel operation and the459
values are lower. This is a consequence of the method used to introduce460
natural gas into the engine. As the natural gas has been introduced461
via manifold injection, a portion of the intake air is displaced by the462
natural gas, reducing the measured volume flow rate of air into the463
engine. This leads to a reduction of the engine’s volumetric flow rate.464
The slope of the constant volumetric efficiency lines differs due to a465
change in the scaling of volumetric efficiency with engine speed. As the466
amount of natural gas added is increased to meet the increase in speed467
demand, larger amounts of air are displaced. As the natural gas is468
introduced at the manifold and does not flow through the entire intake469
system but the air does, the scaling law as noted by Heywood [22] does470
35
not hold well.471
• Natural gas based dual fueling has resulted in significant reduction472
in NOX when compared to the diesel and RME based single fueling473
cases. This reduction in NOX is a direct consequence of difference in474
the in-cylinder mixture composition prior to ignition and combustion475
events. Significantly higher specific heat capacity of natural gas raises476
the overall specific heat capacity of the mixture and results in lower477
temperatures during compression stroke. Also the presence of natu-478
ral gas affect the peak in-cylinder (adiabatic) temperature. With the479
formation of NOX highly dependent on thermal mechanism, the lower480
in-cylinder temperature results in lower specific NOX as compared to481
the single fueling.482
• Specific NOX emissions in case of both single fueling cases are centered483
in the middle of the map and they decrease in all direction from this484
region of maximum specific NOX . On the other hand , an opposite485
trend is observed with natural gas dual fueling where minimum specific486
NOX are centered at the middle of the map and they increase in all487
directions from this region of minimum NOX.488
• At lower power outputs across all speeds, the specific HC emissions489
were significantly higher in case of dual fueling when compared to the490
respective pilot fuel based single fueling. This can be attributed to low491
in-cylinder temperature due to relatively higher specific heat capacity of492
the mixture. As the power was increased at constant speed, the specific493
HC emissions were significantly reduced, though still higher than the494
36
respective single fueling cases. Also, the equivalence ratio threshold for495
dual fuel modes is 0.4. Below this threshold value, the HC emissions496
increase whereas increasing equivalence ratio beyond this value results497
in a decrease in HC emissions.The equivalence ratio in this case ranges498
between 0.44 and 0.79 and this is reflected in gradual decrease of HC499
emissions as the load increase.500
• Studying the specific NOX and specific HC maps together has revealed501
that the of junction of lower powers and lower speeds is a region in the502
maps where the engine shows the worst trade-off between the NOX and503
HC emissions as the two emissions are higher in this region.504
References505
[1] Energy Information Administration US Department of Energy. Wash-506
ington, DC, 2002.507
[2] S.Orhan Akansu, Zafer Dulger, Nafiz Kahraman, and T.Nejat Vezirolu.508
Internal combustion engines fueled by natural gas and hydrogen mix-509
tures. International Journal of Hydrogen Energy, 29(14):1527 – 1539,510
2004.511
[3] Georgios Karavalakis, Thomas D. Durbin, Mark Villela, and J. Wayne512
Miller. Air pollutant emissions of light-duty vehicles operating on vari-513
ous natural gas compositions. Journal of Natural Gas Science and En-514
gineering, 4(0):8 – 16, 2012.515
[4] G.A Richards, M.M McMillian, R.S Gemmen, W.A Rogers, and S.R516
37
Cully. Issues for low-emission, fuel-flexible power systems. Progress in517
Energy and Combustion Science, 27(2):141 – 169, 2001.518
[5] R. Chandra, V.K. Vijay, P.M.V. Subbarao, and T.K. Khura. Perfor-519
mance evaluation of a constant speed ic engine on CNG, methane en-520
riched biogas and biogas. Applied Energy, 88(11):3969 – 3977, 2011.521
[6] T. Korakianitis, A. M. Namasivayam, and R. J. Crookes. Natural-gas522
fuelled spark-ignition (SI) and compression-ignition (CI) engine per-523
formance and emissions. Progress in Energy and Combustion Science,524
37(1):89–112, Jan 2011.525
[7] R.G Papagiannakis and D.T Hountalas. Combustion and exhaust emis-526
sion characteristics of a dual fuel compression ignition engine operated527
with pilot diesel fuel and natural gas. Energy Conversion and Manage-528
ment, 45(1819):2971 – 2987, 2004.529
[8] R.G. Papagiannakis, P.N. Kotsiopoulos, T.C. Zannis, E.A. Yfantis, D.T.530
Hountalas, and C.D. Rakopoulos. Theoretical study of the effects of en-531
gine parameters on performance and emissions of a pilot ignited natural532
gas diesel engine. Energy, 35(2):1129 – 1138, 2010. 21st International533
Conference, on Efficiency, Cost, Optimization, Simulation and Environ-534
mental Impact of Energy Systems.535
[9] T. White and B. Milton. Shock wave calibration of under-expanded536
natural gas fuel jets. Shock Waves, 18:353–364, 2008.537
[10] A. M. Namasivayam, T. Korakianitis, R. J. Crookes, K. D. H. Bob-538
Manuel, and J. Olsen. Biodiesel, emulsified biodiesel and dimethyl ether539
38
as pilot fuels for natural gas fuelled engines. Applied Energy, 87(3):769–540
778, Mar 2010.541
[11] T. Korakianitis, A. M. Namasivayam, and R. J. Crookes. Diesel and542
rapeseed methyl ester (rme) pilot fuels for hydrogen and natural gas543
dual-fuel combustion in compression-ignition engines. Fuel, 90(7):2384–544
2395, Jul 2011.545
[12] R.G. Papagiannakis, C.D. Rakopoulos, D.T. Hountalas, and D.C.546
Rakopoulos. Emission characteristics of high speed, dual fuel, com-547
pression ignition engine operating in a wide range of natural gas/diesel548
fuel proportions. Fuel, 89(7):1397 – 1406, 2010. 17th International Sym-549
posium on Alcohol Fuels.550
[13] G. P. McTaggart-Cowan, S. N. Rogak, S. R. Munshi, P. G. Hill, and551
W. K. Bushe. Combustion in a heavy-duty direct-injection engine us-552
ing hydrogen-methane blend fuels. International Journal of Engine Re-553
search, 10(1):1–13, February 2009.554
[14] G.A. Karim. A review of combustion processes in the dual fuel engine555
- the gas diesel-engine. Progress in Energy and Combustion Science,556
6(3):277–285, 1980.557
[15] G.A. Karim. NIST Reference Fluid Thermodynamic and Transport558
Properties Database, Version 9.1. National Institute of Standards and559
Technology,560
[16] Jin Kusaka, Takashi Okamoto, Yasuhiro Daisho, Ryouji Kihara, and561
Takeshi Saito. Combustion and exhaust gas emission characteristics of562
39
a diesel engine dual- fueled with natural gas. JSAE Review, 21(4):489 –563
496, 2000.564
[17] J. Stewart, A. Clarke, and R. Chen. An experimental study of the dual-565
fuel performance of a small compression ignition diesel engine operating566
with three gaseous fuels rid a-2785-2010. Proceedings of the Institu-567
tion of Mechanical Engineers Part D-journal of Automobile Engineering,568
221(D8):943–956, August 2007.569
[18] Paul Hellier, Nicos Ladommatos, Robert Allan, and John Rogerson. The570
influence of fatty acid ester alcohol moiety molecular structure on diesel571
combustion and emissions. Energy and Fuels, 26(3):1912–1927, 2012.572
[19] Seung Hyun Yoon and Chang Sik Lee. Experimental investigation573
on the combustion and exhaust emission characteristics of biogas and574
biodiesel dual-fuel combustion in a CI engine. Fuel Processing Technol-575
ogy, 92(5):992 – 1000, 2011.576
[20] Colin R Ferguson and Allan T Kirkpatrick. Internal Combustion En-577
gines, Applied Thernal Sciences. John Wiley and Sons, Inc, 2001.578
[21] Richard Stone. Introduction to internal combustion engines. Macmillan579
Educ, 2nd edition, 1992.580
[22] John B Heywood. Internal Combustion Engines Fundamentals.581
McGraw-Hill series in mechanical engineering. McGraw-Hill, Singapore,582
international edition, 1988.583
[23] R.G. Papagiannakis, C.D. Rakopoulos, D.T. Hountalas, and D.C.584
40
Rakopoulos. Emission characteristics of high speed, dual fuel, com-585
pression ignition engine operating in a wide range of natural gas/diesel586
fuel proportions. Fuel, 89(7):1397 – 1406, 2010. 17th International Sym-587
posium on Alcohol Fuels.588
[24] T. Korakianitis, A. M. Namasivayam, and R. J. Crookes. Hydrogen589
dual-fuelling of compression ignition engines with emulsified biodiesel590
as pilot fuel. International Journal of Hydrogen Energy, 35(24):13329–591
13344, Dec 2010.592
List of Figures593
1 Experimental rig of dual-fueled CI engine . . . . . . . . . . . . 10594
2 Experimentally obtained in-cylinder pressure (a) and rate of595
energy release (b) for for diesel and RME at a BMEP of 0.125596
MPa and 1000 rev/min . . . . . . . . . . . . . . . . . . . . . . 12597
3 Experimentally obtained in-cylinder pressure (a) and rate of598
energy release (b) for diesel and RME at a BMEP of 0.503599
MPa and 1000 rev/min . . . . . . . . . . . . . . . . . . . . . . 12600
4 Experimentally obtained in-cylinder pressure (a) and rate of601
energy release (b) for pure diesel and diesel piloted natural gas602
at 0.503 MPa with diesel pilot set at 0.125 MPa for the dual603
fueling case 1000 rev/min . . . . . . . . . . . . . . . . . . . . 13604
5 Experimentally obtained in-cylinder pressure (a) and rate of605
energy release (b) for pure RME and RME piloted natural gas606
at 0.503 MPa with diesel pilot set at 0.125 MPa for the dual607
fueling case 1000 rev/min . . . . . . . . . . . . . . . . . . . . 13608
41
6 Experimentally obtained thermal efficiency contours of diesel609
single fueling (a) and diesel piloted natural gas dual fueling (b) 16610
7 Experimentally obtained volumetric efficiency contours of diesel611
single fueling (a) and diesel piloted natural gas dual fueling (b) 17612
8 Experimentally obtained specific NOX contours for diesel sin-613
gle fueling (a)and diesel piloted natural gas dual fueling (b). . 19614
9 Specific heat at constant pressure, CP /R as a function of tem-615
perature for air and methane . . . . . . . . . . . . . . . . . . . 20616
10 Enthalpy fraction of natural gas during diesel piloted natural617
gas dual fueling. . . . . . . . . . . . . . . . . . . . . . . . . . . 21618
11 Experimentally obtained specific HC contours for diesel single619
fueling (a) and diesel piloted natural gas dual fueling (b) . . . 22620
12 Experimentally obtained specific CO2 contours for diesel single621
fueling (a)and diesel piloted natural gas dual fueling (b) . . . . 24622
13 Enthalpy fraction of natural gas during RME piloted natural623
gas dual fueling. . . . . . . . . . . . . . . . . . . . . . . . . . . 26624
14 Experimentally obtained thermal efficiency contours of RME625
single fueling (a) and RME piloted natural gas dual fueling (b) 27626
15 Experimentally obtained volumetric efficiency contours of RME627
single fueling (a) and RME piloted natural gas dual fueling (b) 28628
16 Experimentally obtained specific NOX contours for RME sin-629
gle fueling (a) and RME piloted natural gas dual fueling (b) . 29630
17 Experimentally obtained specific HC contours for RME single631
fueling (a) and RME piloted natural gas dual fueling (b) . . . 30632
42
18 Experimentally obtained specific CO2 contours for RME single633
fueling (a) and RME piloted natural gas dual fueling (b) . . . 31634
List of Tables635
1 Specifications of the Gardner 1L2 diesel engine and Charac-636
teristics of RME used . . . . . . . . . . . . . . . . . . . . . . . 9637
2 Performance comparison of Diesel and RME as pilot fuels in638
natural gas combustion . . . . . . . . . . . . . . . . . . . . . . 34639
43
Copyright © 2022 FDOKUMEN