Experimental study of pulsatile blood flow in micro channels
17
Experimental study of pulsatile blood flow in micro channels A.D. Anastasiou, A.S. Spyrogianni, S.V. Paras Laboratory of Chemical Process and Plant Design, Department of Chemical Engineering, Aristotle University of Thessaloniki, GREECE Tel.: +30 2310 996174; Fax: +30 2310 996209; e-mail: [email protected] Abstract The study of the blood rheology and of the dynamical characteristics of its flow is a very important step towards comprehension, prediction, diagnosis and therapy of many cardi- ovascular diseases. Blood is a complex multiphase system which in general exhibits a non- Newtonian behavior. Since, due to coagulation, conducting experiments with blood is a dif- ficult task, blood mimicking fluids, i.e., fluids with similar rheological properties, are used. In this study an aqueous glycerin solution containing small amounts of xanthan gum, which can be considered a successful blood analogue is employed, while a solution of glycerin is used as reference Newtonian fluid. The experiments are conducted in a 600μm hydraulic diameter micro channel (matching arteriole dimensions) comprising a bifurcation. With the aim of reproducing physiological flow conditions pulsatile flow is generated using a sy- ringe pumps. The local velocities in the micro channel were measured using micro Particle Image Velocimetry (μ-PIV), a non-intrusive technique. Consequently, the velocity distribu- tion and the wall shear stress as well as their variation during the period between two con- secutive pulses have been calculated. It was found that the assumption that blood behaves as Newtonian fluid does not hold true in arterioles and for low Reynolds numbers. The use of a Newtonian fluid leads to overestimated wall shear stresses and this difference ranges from 30 to 40%. Finally it was verified that the outer wall of the bifurcation due to lower shear stresses, is more predisposed to plaque formation as in large arteries. Keywords: Non-Newtonian fluid, pulsatile flow, μ-PIV, arterioles, wall shear stress, atherosclerosis
-
Upload
khangminh22 -
Category
Documents
-
view
4 -
download
0
Transcript of Experimental study of pulsatile blood flow in micro channels

Experimental study of pulsatile blood flow in micro channels A.D. Anastasiou, A.S. Spyrogianni, S.V. Paras
Laboratory of Chemical Process and Plant Design, Department of Chemical Engineering, Aristotle University of Thessaloniki, GREECE Tel.: +30 2310 996174; Fax: +30 2310 996209; e-mail: [email protected] Abstract
The study of the blood rheology and of the dynamical characteristics of its flow is a very
important step towards comprehension, prediction, diagnosis and therapy of many cardi-
ovascular diseases. Blood is a complex multiphase system which in general exhibits a non-
Newtonian behavior. Since, due to coagulation, conducting experiments with blood is a dif-
ficult task, blood mimicking fluids, i.e., fluids with similar rheological properties, are used.
In this study an aqueous glycerin solution containing small amounts of xanthan gum, which
can be considered a successful blood analogue is employed, while a solution of glycerin is
used as reference Newtonian fluid. The experiments are conducted in a 600μm hydraulic
diameter micro channel (matching arteriole dimensions) comprising a bifurcation. With the
aim of reproducing physiological flow conditions pulsatile flow is generated using a sy-
ringe pumps. The local velocities in the micro channel were measured using micro Particle
Image Velocimetry (μ-PIV), a non-intrusive technique. Consequently, the velocity distribu-
tion and the wall shear stress as well as their variation during the period between two con-
secutive pulses have been calculated. It was found that the assumption that blood behaves
as Newtonian fluid does not hold true in arterioles and for low Reynolds numbers. The use
of a Newtonian fluid leads to overestimated wall shear stresses and this difference ranges
from 30 to 40%. Finally it was verified that the outer wall of the bifurcation due to lower
shear stresses, is more predisposed to plaque formation as in large arteries.
Keywords: Non-Newtonian fluid, pulsatile flow, μ-PIV, arterioles, wall shear stress, atherosclerosis

Introduction
The study of blood velocity distribution in blood vessels can be proved very impor-
tant for medicine and biomedical engineering. Moreover, blood flow modeling is helpful in
therapy strategy; it can help to make the choice between surgical and interventional proce-
dures. Biomechanical studies can also be aimed at designing surgical repairements and im-
plantable medical devices and predicting effects of implanted prostheses and devices
(Thiriet, 2007). Recent papers (e.g. Chatzizisis and Giannoglou, 2006; Shaaban and
Duerinckx, 2000) report that local hemodynamic forces affect the generation and the pro-
gression rate of atherosclerosis. The aforementioned studies report that the atherosclerotic
plaques occur mainly in regions of curvature, bifurcation, and branching of the vessels. A
low wall shear stress promotes the formation of atherosclerotic plaque (Chatzizisis and
Giannoglou, 2006), while, on the other hand, high shear stresses can cause the release of
nitric oxide and prostacyclin which act as vasodilators and can protect the endothelial cells
(John, 2009).
Figure 1a (Chatzizisis and
Giannoglou, 2006) describes the ef-
fect of wall shear stress on the for-
mation and progression of atheros-
clerotic plaque. First the low blood
velocity, i.e. low wall shear stress,
leads to an increased concentration
of particles responsible for atheros-
clerosis, i.e low density lipoprotein,
while at the same time causes a raise
to endothelium layer permeability.
These phenomena enhance the sub-
endothelial migration of blood athe-
rogenic particles through endothe-
lium, promoting lesions forming
(Figure 2). The further progression
(a)
(b)
(c)
Figure 1: Plaque formation and progression due to low shear rates (Chatzizisis and Giannoglou, 2006).

of the lesion formation (Figure 1b) leads to an artery stenosis, which acts as a backward-
facing step. It is known (e.g. Mouza et al., 2005) that
the minimum wall shear stress on a stepped wall oc-
curs in the neighborhood of the reattaching flow re-
gion, that is just behind the backward-facing step.
This leads to a further development of the plaque
(Figure 1c). Considering all the aforementioned
phenomena it is obvious that biomechanical factors
are significant in atherosclerosis and their study can
be proved useful in predicting and treating the dis-
ease at an early stage.
Numerous works have been published concerning atherosclerosis and wall shear
stress for large arteries and specifically the coronary artery (e.g. Artoli et al., 2006;
Giannoglou et al., 2006; Gijsen et al., 1999a; Gijsen et al., 1999b; Huo and Kassab, 2006;
Long et al., 2000). On the contrary few researchers have studied the flow in small blood
vessels (Riva et al., 1985).
According to the Newton’s law of viscosity a fluid is considered Newtonian when its
viscosity is constant and independent of the shear stress. On the other hand fluids whose
shear stress vs. shear rate relationship does not follow this law are known as non-
Newtonian. Such a fluid is blood and its viscoelastic properties rely on its chemical compo-
sition (Fournier, 2007). Blood is a multiphase mixture of plasma, a Newtonian fluid, and
three main cell types, red blood cells, platelets and leukocytes. Under low shear stress con-
ditions normal red cells in plasma form linear aggregates (rouleaux) which disrupt flow
streamlines and greatly increase whole apparent blood viscosity. By increasing the shear
rates these aggregates are progressively deformed and consequently the apparent viscosity
decreases to the asymptotic limit of 3.5 cP (Fournier, 2007). The viscoelastic properties of
blood greatly affect its flow dynamics (Gijsen et al., 1999a). Many researchers made the
assumption that blood can be considered a Newtonian fluid, due to the high shear rates ex-
isting in large arteries (e.g., Long et al., 2000, Mabotuwana et al., 2007, Stamatopoulos et
al., 2010) but Gijsen et al. (1999a) proved that this is not accurate enough as the viscoelas-
tic properties affect the velocity distribution.
Figure 2: Lesion in an artery (A.D.A.M. Medical encyclopedia).

It is known that blood flow in vivo is unsteady. The pressure and the volumetric flow
rate of the blood vary with time over the period of heart relaxation and contraction. Blood
flow is divided into two phases: systole, during which heart is pumping the blood, and dias-
tole, during which heart is pumping no blood and ventricles are filled up. The pressure and
velocity pulse change with distance from the heart, the maximum pressure declines and the
pulse width broadens with increasing distance. In arterioles the pressure change is greatly
attenuated in contrast with some vessels (e.g. the external carotid artery and the femoral
artery), where there is a period of negative velocity (Truskey et al., 2004).
It is also known that in vivo the walls of blood vessels are not rigid. The effect of ar-
terial wall elasticity on the flow is difficult to be studied experimentally, because materials
that match the elastic behavior of arteries accurately are still not available. Although in
large arteries there is a significant change in vessel diameter during the pulse, in small ves-
sels i.e. arterioles, where the pressure change is greatly attenuated, it can be assumed that
the change in diameter is not significant and thus the walls can be considered rigid.
The scope of this study is to measure the velocity distribution of a blood analogue
fluid (since the use of real blood is problematic mainly due to coagulation and lack of opti-
cal transparency) in a bifurcation which is considered a high risk geometry. Apart from the
non-Newtonian blood analogue, a Newtonian fluid will be also employed with the intention
to study the way in which the different behavior of the fluid affects the wall shear stress
during pulsatile flow for relatively low Reynolds numbers. The wall shear stress as well as
its variation between two consecutive pulses will be calculated from the velocity data.
Velocity measurement methods
Measuring velocity in vivo is something difficult to achieve. In most works experi-
ments are conducted in vitro, using methods like Laser Doppler Anemometry (Gijsen et al.,
1999a, Gijsen et al., 1999b) and Ultrasonic Velocimetry (Siouffi et al., 1984). These tech-
niques can be used to measure two, and even three components of velocity.
A relatively new method for velocity measurements in micro channels is micro Par-
ticle Image Velocimetry (μ-PIV), which is a non-intrusive technique for measuring two di-
mensional velocity fields. There are several works that use μ-PIV to study biological sys-
tems (Jung Yeop Lee, 2007; Sugii et al., 2002; Vennemann et al., 2006). The flow tracing
particles are seeded in the fluid. The choice of these particles is crucial for the validity of
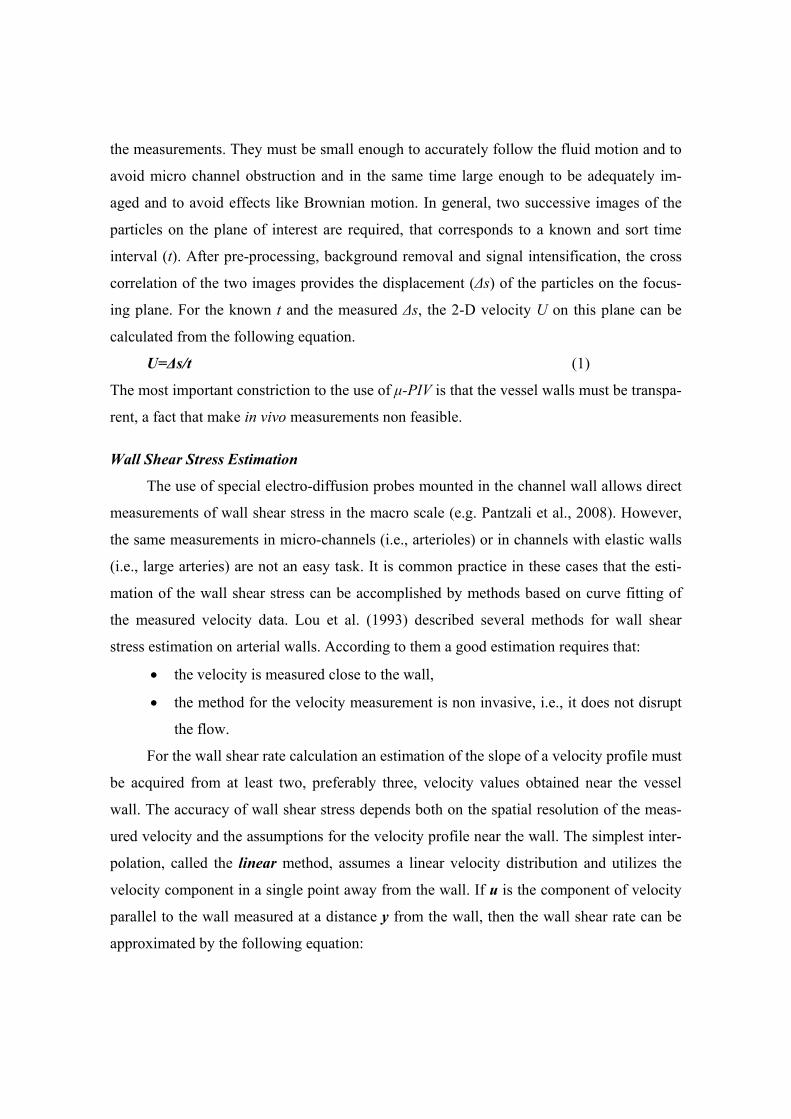
the measurements. They must be small enough to accurately follow the fluid motion and to
avoid micro channel obstruction and in the same time large enough to be adequately im-
aged and to avoid effects like Brownian motion. In general, two successive images of the
particles on the plane of interest are required, that corresponds to a known and sort time
interval (t). After pre-processing, background removal and signal intensification, the cross
correlation of the two images provides the displacement (Δs) of the particles on the focus-
ing plane. For the known t and the measured Δs, the 2-D velocity U on this plane can be
calculated from the following equation.
U=Δs/t (1)
The most important constriction to the use of μ-PIV is that the vessel walls must be transpa-
rent, a fact that make in vivo measurements non feasible.
Wall Shear Stress Estimation
The use of special electro-diffusion probes mounted in the channel wall allows direct
measurements of wall shear stress in the macro scale (e.g. Pantzali et al., 2008). However,
the same measurements in micro-channels (i.e., arterioles) or in channels with elastic walls
(i.e., large arteries) are not an easy task. It is common practice in these cases that the esti-
mation of the wall shear stress can be accomplished by methods based on curve fitting of
the measured velocity data. Lou et al. (1993) described several methods for wall shear
stress estimation on arterial walls. According to them a good estimation requires that:
the velocity is measured close to the wall,
the method for the velocity measurement is non invasive, i.e., it does not disrupt
the flow.
For the wall shear rate calculation an estimation of the slope of a velocity profile must
be acquired from at least two, preferably three, velocity values obtained near the vessel
wall. The accuracy of wall shear stress depends both on the spatial resolution of the meas-
ured velocity and the assumptions for the velocity profile near the wall. The simplest inter-
polation, called the linear method, assumes a linear velocity distribution and utilizes the
velocity component in a single point away from the wall. If u is the component of velocity
parallel to the wall measured at a distance y from the wall, then the wall shear rate can be
approximated by the following equation:

Shear Rate = u/y (2)
A second method, called the quadratic method, assumes a quadratic velocity distribu-
tion between the velocity measurements at two points, located at different distances close to
the wall. In another method, a third velocity is measured at a point between the two points
used in the quadratic method. A least-squares fit method is adopted to accommodate all
three points, or four points if the point at the wall is included (no slip condition), in a para-
bolic velocity profile. The benefit of the extra point is doubtful because it forces the veloci-
ty profiles to comply more with the data in the region farther away from the wall than with
the data closer to the wall. Moreover, a higher order polynomial is generally less robust be-
cause the result becomes sensitive to small amplitude as the order of the curve fitting in-
creases (Lou et al., 1993).
In the present work it
is assumed that the velocity
distribution near the wall is
linear. With the use of two
measurements near the wall
and a third which is the zero
velocity on the wall surface,
a fitting line is estimated
(Figure 3). The slope of this
line represents the shear rate
near the wall. Substituting this value to the corresponding equation of viscosity, which de-
pends on the fluid employed, a good estimation for the wall shear stress can be made. The
main assumptions of this method are:
The velocity is measured close to the wall.
The velocity distribution near the wall is linear.
Experimental procedure and setup
With the intention to simulate the non Newtonian behavior of human blood an analo-
gue was used. The analogue comprises 75% w/w distilled water, 25% w/w glycerin and
xanthan gum, which is a polysaccharide used as food additive and as rheology modifier and
Figure 3: Estimation of wall shear rate from velocity data.
Slope=Shear Rate

it is the cause of the non-Newtonian behavior of the fluid. The viscosity of this solution was
measured by a cone plate reometer (G1253-1006, Sigma-Alorich). In Figure 4 the viscosity
of the blood analogue is compared with the viscosity of real blood given by Cho & Kinsey
(1991) and Shin & Keum (2002). For shear rates ranging from 1 to 1000s-1 the viscosity of
the blood analogue employed is in very good agreement with blood viscosity. The shear
stress vs. shear rate relationship for the blood analogue follows the model by Herschel-
Bulkley (Eq. 3) and is used for estimating the wall shear stresses. As a reference to the
Newtonian behavior an aqueous solution of glycerin, with viscosity identical to the asymp-
totic viscosity of blood (3.5cP), was employed (62% w/w distilled water and 38% w/w gly-
cerin).
Shear Stress = A + B(Shear Rate)C (3)
where A: yield stress 0.02160 (Pa)
B: viscosity coefficient 0.01345 (Pa s1/c)
C: rate index 0.7812
Figure 4: Comparison of viscosity between real blood and the blood analogue.
Aiming to mimic physiological flow conditions, pulsatile flow is generated using a
syringe-pump (Alladdin, Al-2000). Assuming that flow rates in arterioles depend on the dis-
tance from the heart, two different pulses were used. As it is shown in Figure 5, the first

one corresponds to regions with high flow rates (case 1: 140-340ml/hr) while the second
one corresponds to regions with relatively low flow rates (case 2: 20-60ml/hr). In both cas-
es the pulse frequency is 1Hz, a rate that corresponds to 60 heart strokes per minute. For
these flow conditions the Reynolds (Re) number ranges from 9 to 21 (case 1) and from 1.1
to 3.5 (case 2). An important quantity to be taken into account in pulsatile flow is Womers-
ley number, which is the ratio of transient inertia over viscous forces and is defined as
/R , where ω is the angular frequency, ρ the density and μ the dynamic viscosi-
ty. For the present study Wormesley number retains a constant value (α=0.42), because
both the diameter of the micro channel and the frequency of the pulse are constant.
Figure 5: Schematic of pulse employed for: a) high flow rate and b) low flow rate.
All experiments were conducted in a 600μm hydraulic diameter micro channel
(matching arteriole dimensions) manufactured by laser ablation in a polymeric chip and
sealed with the same material. As the construction of a cylindrical micro channel is very
difficult the cross section of the experimental module is trapezoidal and this is not far from
the asymmetric geometry of human arteries. The geometric characteristics of the experi-
mental region are presented in Figure 6. The velocity data were acquired from the middle
plane of the bifurcation, i.e. 300μm over the channel bottom.
A backlight μ-PIV system was used to study the flow. A micro strobe emitting at
532nm was used to illuminate the measurement section of the micro channel. The flow was
recorded with a high sense CCD camera (Hisense MkII, 1.4 Mpixel, 70% quantum efficien-
cy), coupled to a Nikon microscope (Eclipse LV100). Polystyrene particles with mean di-
ameter of 1μm were added to the fluids for tracing the flow. In order to obtain magnified
images a 10X air immersion objective with NA=0.30, was used. Time delays between
frames were ranging from 100 to 350μs while the sampling rate was 5Hz (i.e. five mea-
(a) (b)

surements during each pulse were taken). The image processing and the velocity estima-
tions were performed using Flow Manager Software (by DantecDynamics). A typical ve-
locity measurement at the middle plane of the bifurcation is shown in Figure 7.
Figure 6: Bifurcation geometry and three positions of measurements.
Figure 7: Typical velocity measurement at the middle plane of the bifurcation.
Inner Wall
Outer Wall

To recapitulate, the following experimental conditions have been employed in order
to simulate in vivo flow conditions:
An aqueous glycerin solution containing a small amount of xanthan gum simu-
lates the viscoelastic properties of blood.
The flow is pulsatile.
The walls of the micro channel are rigid while the cross section of the micro
channel is trapezoid.
Results
In Figure 8 the velocity distribution at station 1 (at the parent channel) is presented
for both the Newtonian and the non-Newtonian blood analogue. The latter exhibits a flat
velocity profile, as expected.
Figure 8: Normalized velocity profiles for the Newtonian and non-Newtonian fluids at station 1.
For the flow conditions of case 1 it was observed that at station 2 the position of the
maximum axial velocity is shifted towards the inner channel wall. It is well known that in
curved conduits, transverse secondary flows arise as a result of the interplay between cen-
trifugal and viscous forces. Since the driving centrifugal force depends quadratically on the
average velocity, while the viscous force depends linearly on average velocity, secondary
flows are strongly suppressed for low velocities. According to Paras (1979), who conducted

experiments to simulate flow in human airways, for Re<30 the secondary flow decays be-
fore the first diameter downstream the junction. This is verified by observing Figure 9,
where the velocity profile is parabolic at station 1, the maximum velocity is shifted after
entering the bifurcation (station 2) and finally returns to the initial parabolic profile after a
length of one diameter (station 3). Paras (1979) suggests that for such low Re the third ve-
locity component (perpendicular to the main axis of the flow) is negligible and does not
practically affect the velocity profiles measured in the two dimensional plane.
Figure 9: Normalized velocity profiles for the Newtonian fluid at stations 1, 2 and 3.
Figure 10 presents velocity measurements for case 1 in the entrance of the bifurca-
tion (station 2) for both fluids tested (i.e. Newtonian and non-Newtonian) at three instants
of the pulse for Re from 9 to 21. The velocity data are normalized with respect to the max-
imum velocity of the corresponding fluid. It is obvious that the velocity distributions are
different. For the Newtonian fluid the maximum velocity is shifted from the centerline to-
wards the inner wall of the bifurcation, during the whole pulse cycle. This displacement is
not that intense in the case of non-Newtonian fluid, which returns to a parabolic profile to
the end of pulse.
In Figure 11 the velocity profiles for case 2 are presented. Measurements refer to the
entrance of the bifurcation (station 2). The Re number for these flow conditions ranges be-
tween 1.4 and 3.5. As before, the velocity data are normalized with respect to the maximum

Figure 10: Normalized velocity profiles for Newtonian and non-Newtonian fluid (case 1).
(a)
(b)
(c)

Figure 11: Normalized velocity profiles for Newtonian and non-Newtonian fluid (case 2).
(a)
(b)
(c)
velocity of the corresponding fluid. Comparing the distributions for the two fluids they are
found to be quite different. Although both profiles are parabolic during a full pulse, the
non-Newtonian fluid exhibits a flat velocity profile, as expected.
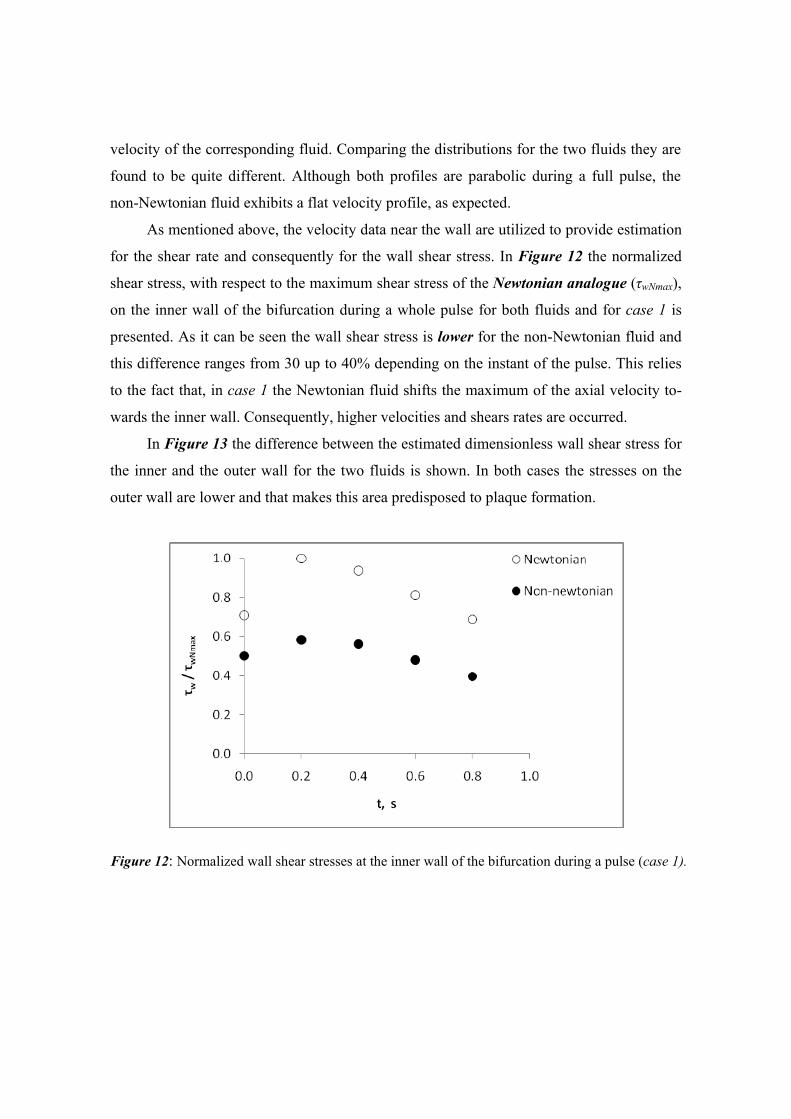
As mentioned above, the velocity data near the wall are utilized to provide estimation
for the shear rate and consequently for the wall shear stress. In Figure 12 the normalized
shear stress, with respect to the maximum shear stress of the Newtonian analogue (τwNmax),
on the inner wall of the bifurcation during a whole pulse for both fluids and for case 1 is
presented. As it can be seen the wall shear stress is lower for the non-Newtonian fluid and
this difference ranges from 30 up to 40% depending on the instant of the pulse. This relies
to the fact that, in case 1 the Newtonian fluid shifts the maximum of the axial velocity to-
wards the inner wall. Consequently, higher velocities and shears rates are occurred.
In Figure 13 the difference between the estimated dimensionless wall shear stress for
the inner and the outer wall for the two fluids is shown. In both cases the stresses on the
outer wall are lower and that makes this area predisposed to plaque formation.
Figure 12: Normalized wall shear stresses at the inner wall of the bifurcation during a pulse (case 1).

Figure 13: Normalized wall shear stresses at the inner and the outer wall for case 1: a) non-Newtonian fluid; b) Newtonian fluid.
Conclusions
The scope of this work is to study the pulsatile flow of blood at relatively low Rey-
nolds numbers in a micro channel that simulates a bifurcated arteriole. The common as-
sumption that blood behaves as Newtonian fluid was tested out. To summarize:
The velocity profiles of the two fluids tested for both cases studied (high and
low flow rate), as expected, are different. At the entrance of the bifurcation
non-Newtonian (a)
Newtonian (b)
the maximum of the profile is shifted towards the inner wall and thus the
shear stresses there are higher than those on the outer wall. This is in agree-
ment with relevant studies in larger human arteries and it means that the outer
wall of the arteriole is more vulnerable to atherosclerosis than the inner one.
It must be noted that the use of the Newtonian fluid gives raise to higher (30
to 40%) wall shear stress values in the bifurcation.
In conclusion, the assumption of the Newtonian behavior of blood does not hold true
for low Re number flow in small blood vessels. It is also verified that the shear thinning
behavior of blood significantly affects the velocity profiles and consequently the wall shear
stress and the hemodynamic forces. The role of the latter is crucial in the understanding,
diagnosis and treatment of cardiovascular diseases.
Acknowledgments: The authors wish to acknowledge Prof. G.D. Giannoglou and Prof. J.V. Soulis for their helpful comments and suggestions, and Dr. T. Goudoulas for his help in con-ducting the viscosity measurements.
References
Artoli, A. M., Hoekstra, A. G. & Sloot, P. M. A. 2006. Mesoscopic simulations of systolic flow in the human abdominal aorta. Journal of Biomechanics, 39, 873-884.
Chatzizisis, Y. S. & Giannoglou, G. D. 2006. Pulsatile flow: A critical modulator of the natural history of atherosclerosis. Medical Hypotheses, 67, 338-340.
Fournier, R. L. 2007. Basic Transport Phenomena in Biomedical Engineering, New York, Taylor & Francis Group, LLC.
Giannoglou, G. D., Chatzizisis, Y. S., Sianos, G., Tsikaderis, D., Matakos, A., Koutkias, V., Diamantopoulos, P., Maglaveras, N., Parcharidis, G. E. & Louridas, G. E. 2006. Integration of multi-modality imaging for accurate 3D reconstruction of human coronary arteries in vivo. Nuclear Instruments & Methods in Physics Research Section a-Accelerators Spectrometers Detectors and Associated Equipment, 569, 310-313.
Gijsen, F. J. H., Allanic, E., Van De Vosse, F. N. & Janssen, J. D. 1999a. The influence of the non-Newtonian properties of blood on the flow in large arteries: unsteady flow in a 90° curved tube. Journal of Biomechanics, 32, 705-713.
Gijsen, F. J. H., Van De Vosse, F. N. & Janssen, J. D. 1999b. The influence of the non-Newtonian properties of blood on the flow in large arteries: steady flow in a carotid bifurcation model. Journal of Biomechanics, 32, 601-608.
Huo, Y. & Kassab, G. S. 2006. Pulsatile blood flow in the entire coronary arterial tree: theory and experiment. Am J Physiol Heart Circ Physiol, 291, H1074-1087.
John, L. C. H. 2009. Biomechanics of Coronary Artery and Bypass Graft Disease: Potential New Approaches. The Annals of Thoracic Surgery, 87, 331-338.
Jung Yeop Lee, H. S. J. A. S. J. L. 2007. Micro-PIV measurements of blood flow in extraembryonic blood vessels of chicken embryos. Physiological Measurement, 28 1149–1162.
Long, Q., Xu, X. Y., Ariff, B., Thom, S. A., Hughes, A. D. & Stanton, A. V. 2000. Reconstruction of blood flow patterns in a human carotid bifurcation: A combined CFD and MRI study. Journal of Magnetic Resonance Imaging, 11, 299-311.
Lou, Z., Yang, W.-J. & Stein, P. D. 1993. Errors in the estimation of arterial wall shear rates that result from curve fitting of velocity profiles. Journal of Biomechanics, 26, 383-390.
Mabotuwana, T. D., Cheng, L. K. & Pullan, A. J. 2007. A model of blood flow in the mesenteric arterial system. BioMedical Engineering OnLine.
Mouza, A. A., Pantzali, M. N., Paras, S. V. & Tihon, J. 2005 Experimental and numerical study of backward-facing step flow. In: 5th Panhellenic Conference of Chemical Engineering, Thessaloniki, Greece.
Pantzali, M. N., Mouza, A. A. & Paras, S. V. 2008. Counter-current gas-liquid flow and incipient flooding in inclined small diameter tubes. Chemical Engineering Science, 63, 3966-3978.
Paras, S. V. 1979. Secondary flow near bifurcations at low Reynolds numbers. MSc Thesis, Chem. Eng. Dept., University of Washington, USA.
Riva, C., Grunwald, J., Sinclair, S. & Petrig, B. 1985. Blood velocity and volumetric flow rate in human retinal vessels. Invest. Ophthalmol. Vis. Sci., 26, 1124-1132.
Shaaban, A. M. & Duerinckx, A. J. 2000. Wall Shear Stress and Early Atherosclerosis: A Review. Am. J. Roentgenol., 174, 1657-1665.
Siouffi, M., Pelissier, R., Farahifar, D. & Rieu, R. 1984. The effect of unsteadiness on the flow through stenoses and bifurcations. Journal of Biomechanics, 17, 299-315.
Stamatopoulos, C., Papaharilaou, Y., Mathioulakis, D. S. & Katsamouris, A. 2010. Steady and unsteady flow within an axisymmetric tube dilatation. Experimental Thermal and Fluid Science, 34, 915-927.
Sugii, Y., Nishio, S. & Okamoto, K. 2002. In vivo PIV measurement of red blood cell velocity field in microvessels considering mesentery motion. Physiological Measurement, 23, 403-416.
Thiriet, M. 2007. Biology and Mechanics of Blood Flows Part II: Mechanics and Medical Aspects, Paris, Springer.
Truskey, G. A., Yuan, F. & Katz, D. F. 2004. Transport Phenomena in Biological Systems, Pearson Prentice Hall Bioengineering.
Vennemann, P., Kiger, K. T., Lindken, R., Groenendijk, B. C. W., Stekelenburg-De Vos, S., Ten Hagen, T. L. M., Ursem, N. T. C., Poelmann, R. E., Westerweel, J. & Hierck, B. P. 2006. In vivo micro particle image velocimetry measurements of blood-plasma in the embryonic avian heart. Journal of Biomechanics, 39, 1191-1200.