Photonic crystal to photonic crystal surface modes: narrow-bandpass filters
Upload
independentCategory
view
0download
0
Experimental measurement of quality factor enhancement using slow light modes in one
dimensional photonic crystal Damian Goldring,1,* Uriel Levy,2 Ido E. Dotan, 1 Alexander Tsukernik, 3 Mark Oksman1,
Idan Rubin,1 Yaara David,1 and David Mendlovic1
1 Physical Electronics Dep., Faculty of Engineering, Tel Aviv University, Tel Aviv 69978, Israel 2 Dept. Of Applied Physics, The Hebrew University of Jerusalem, Jerusalem 91904, Israel
3 Center of Nanoscience and Nanotechnology in Tel-Aviv University, Tel Aviv 69978, Israel. *Corresponding author: [email protected]
Abstract: we experimentally investigate the effects of slow light modes within a one dimensional photonic crystal resonator. We show that the slow light mode leads to significant increase in the quality factor of the resonator. We provide a theoretical analysis explaining our experimental results. We also include the effect of disorder to simulate the fabrication imperfection. Further results regarding the properties of the one dimensional photonic crystal are discussed.
©2008 Optical Society of America
OCIS codes: (130.5296) Photonic crystal waveguides; (230.5750) Resonators; (260.2030) Dispersion; (250.5300) Photonic integrated circuits;
References and links
1. Y. Okawachi, M. A. Foster, J. E. Sharping, A. L. Gaeta, Q. Xu and M. Lipson, “All-optical slow-light on a photonic chip,” Opt. Express, 14, 2318-2322 (2006)
2. J. E. Heebner and R. W. Boyd, “‘Slow’ and ‘fast’ light in resonator-coupled waveguides,” J. Mod. Opt. 49, 2629-2636 (2002).
3. M. Notomi, K. Yamada, A. Shinaya, J. Takahashi, C. Takahashi and J. Yokohama, “Single mode transmission within photonic bandgap of width-varied single-line-defect photonic crystal waveguides on SOI substrates,” Electron. Lett. 37, 293-295 (2001)
4. S. McNab, N. Moll, Y. Vlasov, “Ultra-low loss photonic integrated circuit with membrane-type photonic crystal waveguides,” Opt. Express 11, 2928-2939 (2003)
5. W. Bogaerts, D. tailaret, B. Luyssaert, P. Dumon, J. Van-Campenhount, P. Bienstman, D. Van-Thourhout, R. Baets, Wiaux and S. Beckx, “Basic structures for photonic integrated circuits in silicon-on-insulator,” Opt. Express 12, 1583-1591 (2004)
6. N. Wu, M. Javanmard, B. Momeni, M. Soltani, A. Adibi, “General methods for designing single mode planar photonic crystal waveguides in hexagonal lattice structures,” Opt. Express 11, 1371-1377 (2003)
7. M. Notomi, K. Yamada, A. Shinaya, J. Takahashi, C. Takahashi and J. Yokohama , “Structural Tuning of Guiding Modes of Line-Defect Waveguides of Silicon-on-Insulator Photonic Crystal Slabs,” IEEE J. of Quantum Electron. 38, 736-742 (2002)
8. M. Notomi, K. Yamada, A. Shinaya, J. Takahashi, C. Takahashi and J. Yokohama, “Extremely large group velocity dispersion of line defect waveguides in photonic crystals slabs,” Phys. Rev. Lett 87, 253902 (2001)
9. Yu. A. Vlasov, S. J. McNab, “Coupling into the slow light mode in slab-type photonic crystal waveguides,” Opt .Lett. 31, 50-52 (2006)
10. M. Povinelli, S. Johnson, J. Joannopoulos, “Slow-light, band-edge waveguides for tunable time delays,” Opt. Express 13, 7145-7159 (2005)
11. M. Soljacic, E. Lidorikis, L. Vestergaard Hau, J. D. Joannopoulus, “Enhancement of microcavities lifetime using highly dispersive materials,” Phys. Rev. E. 71, 026602 (2005)
12. D. Goldring, U. Levy and D. Mendlovic, “Highly dispersive micro-ring resonator based on one dimensional photonic crystal waveguide – Design and analysis,” Opt. Express 15, 3156-3168 (2007)
13. C. Sauvan, G. Lecamp, P. Lalanne and J.P. Hugonin, “Modal-reflectivity enhancement by geometry tuning in Photonic Crystal microcavities,” Opt. Express 13, 245-255 (2005)
14. J. D. Joannopoulos, R. D. Meade, and J. N. Winn, Photonic crystal: modeling the flow of light, (Princeton University Press., Princeton, NJ, 1995).
(C) 2008 OSA 14 April 2008 / Vol. 16, No. 8 / OPTICS EXPRESS 5585#91165 - $15.00 USD Received 2 Jan 2008; revised 2 Mar 2008; accepted 3 Mar 2008; published 7 Apr 2008
15. The 3D problem was reduced to a 2D problem using effective index method. The core’s index is chosen so that the effective index of the strip waveguide’s modes in 3D will be the same as or very close to the one in 2D.
16. B. E. A. Saleh, M. C. Teich, Fundamentals of photonics, (John Wiley &Sons, New York, 1991)
1. Introduction
Slow light, the expression associated with low group velocity of light, has become an important field of research during the last few years primarily due to technological advances that made it possible to realize on chip slow light devices. Several candidate technologies have been demonstrated for producing slow light on chip, for example, stimulated Raman scattering1 and different types of resonators2. A significant research effort is directed into slow light in photonic crystals (PhCs). PhCs designed to operate in the near infra-red wavelength regime have become accessible to researchers and engineers mostly thanks to semiconductors processing techniques and are now widely used3-5. Most PhC waveguides structures give rise to guided modes within the crystal’s band-gap region, i.e., a wavelength region where light waves cannot propagate, by generating defect modes within the band-gap6,7. The periodic nature of the PhC leads to enhanced dispersion of the optical mode especially at the band-edge8-10 wavelength region.
It has been argued in Ref. 11 that if a slow-light medium is embedded within an optical resonator, the low group velocity will result an increased quality factor. Additional simulative backing of the latter argument is given in Ref. 12. In this paper we experimentally demonstrate the increase in quality factor due to slow light modes within optical resonators as well as investigate other properties of the “slow light resonator” such as variations in Free-Spectral-Range (FSR), and losses. For these measurements, we use one-dimensional PhC waveguides sandwiched between a strip silicon waveguide. This configuration allows the realization of dispersive medium with slow light modes as well as a Fabry-Perot resonator, where the reflective mirrors are generated by the large mode mismatch between the PhC and the strip waveguides.
2. Theory and simulations
2.1 Device description and analysis
The device investigated in this paper consists of a PhC waveguide located inside a rectangular strip waveguide (see Fig. 1). The mode mismatch between the PhC and the strip waveguides can effectively be described as a partial mirror13. Thus, the investigated device operates as a Fabry-Perot (FP) resonator.
Fig. 1. Illustration of the investigated device – a 1D PhC waveguide.
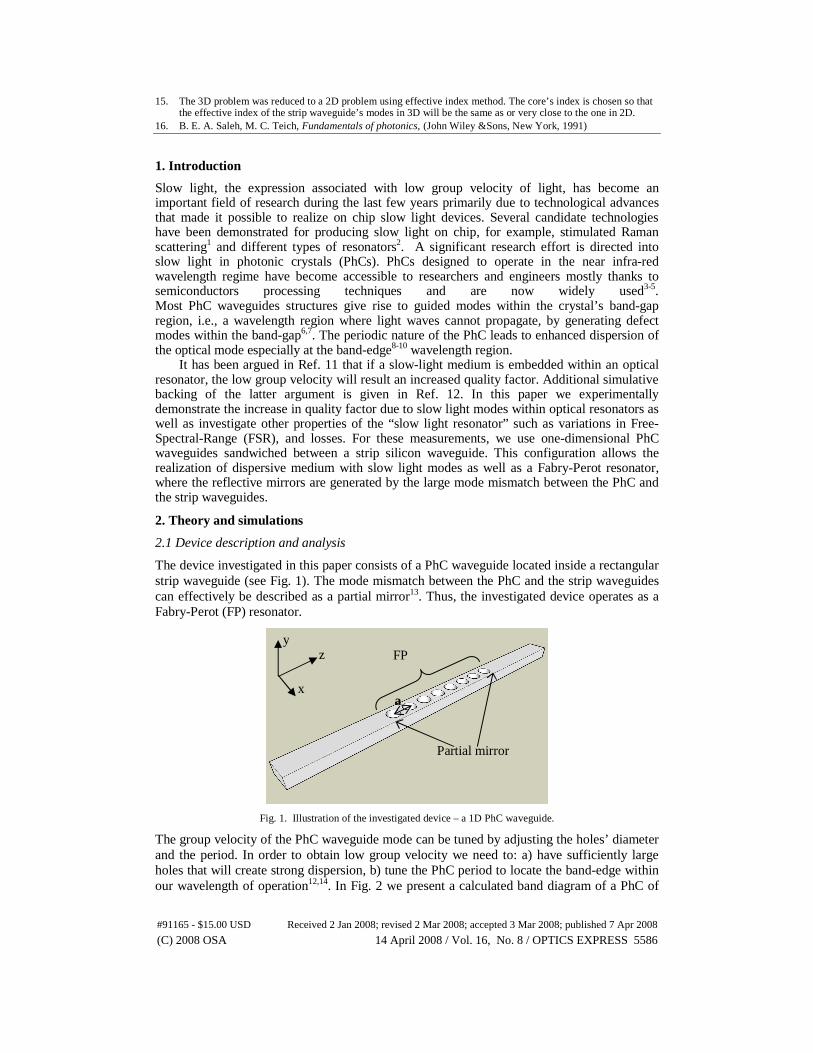
The group velocity of the PhC waveguide mode can be tuned by adjusting the holes’ diameter and the period. In order to obtain low group velocity we need to: a) have sufficiently large holes that will create strong dispersion, b) tune the PhC period to locate the band-edge within our wavelength of operation12,14. In Fig. 2 we present a calculated band diagram of a PhC of
FP
Partial mirror
a
z y
x
(C) 2008 OSA 14 April 2008 / Vol. 16, No. 8 / OPTICS EXPRESS 5586#91165 - $15.00 USD Received 2 Jan 2008; revised 2 Mar 2008; accepted 3 Mar 2008; published 7 Apr 2008
the type shown in Fig. 1. The calculation is done numerically using plane-wave-expansion (see Ref. 12 for details). The band-edge region and the light line are shown by arrows. Kz stands for the wave-vector along the direction of propagation – z.
Fig. 2. Band diagram of a 1D PhC waveguide of the type presented in Fig. 1.
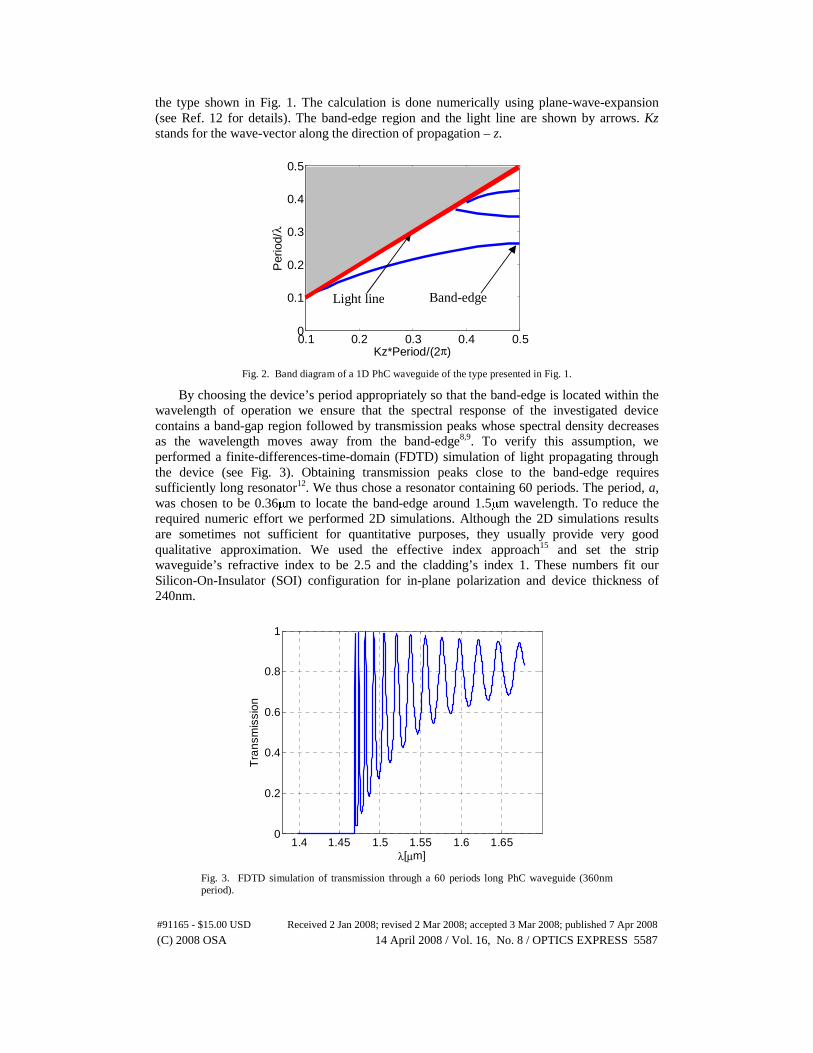
By choosing the device’s period appropriately so that the band-edge is located within the wavelength of operation we ensure that the spectral response of the investigated device contains a band-gap region followed by transmission peaks whose spectral density decreases as the wavelength moves away from the band-edge8,9. To verify this assumption, we performed a finite-differences-time-domain (FDTD) simulation of light propagating through the device (see Fig. 3). Obtaining transmission peaks close to the band-edge requires sufficiently long resonator12. We thus chose a resonator containing 60 periods. The period, a, was chosen to be 0.36μm to locate the band-edge around 1.5μm wavelength. To reduce the required numeric effort we performed 2D simulations. Although the 2D simulations results are sometimes not sufficient for quantitative purposes, they usually provide very good qualitative approximation. We used the effective index approach15 and set the strip waveguide’s refractive index to be 2.5 and the cladding’s index 1. These numbers fit our Silicon-On-Insulator (SOI) configuration for in-plane polarization and device thickness of 240nm.
1.4 1.45 1.5 1.55 1.6 1.650
0.2
0.4
0.6
0.8
1
λ[μm]
Tra
nsm
issi
on
Fig. 3. FDTD simulation of transmission through a 60 periods long PhC waveguide (360nm period).
0.1 0.2 0.3 0.4 0.50
0.1
0.2
0.3
0.4
0.5
Per
iod/
λ
Kz*Period/(2π)
Light line Band-edge
(C) 2008 OSA 14 April 2008 / Vol. 16, No. 8 / OPTICS EXPRESS 5587#91165 - $15.00 USD Received 2 Jan 2008; revised 2 Mar 2008; accepted 3 Mar 2008; published 7 Apr 2008

Fig. 3 shows that the expected spectral response is obtained. From this Fig. we can extract the group index of the PhC mode, the strip-PhC waveguide interface reflectivity9, and the quality factor of the resonator for each transmission peak, by using the following procedure. At first we define the visibility parameter as:
max min
max min
I IV
I I
−=
+ (1)
where Imax and Imin are the intensities at the transmission maxima and minima, respectively. The intensity reflectivity is then given by9:
( )21 1 V
RV
− −
≅ (2)
The group index can be evaluated using the distances between maxima, i.e.9:
20
2gnL
λλ
≅⋅Δ
(3)
where λ0 represents the maxima wavelengths, Δλ is the wavelength distance between adjacent maxima and L is the resonator’s length.
The quality factor of the resonator for each transmission peak is extracted using16:
0Q=λδλ
(4)
where δλ is the Full-Width-Half-Maximum (FWHM) of the resonance peak. Figure 4 presents the obtained group index and the reflection. As expected9 an increase in both group index and reflection is obtained as the wavelength approaches the band-edge.
Fig. 4. (a) Reflection and (b) group index of the 1D PhC waveguide as extracted from the simulation results presented in Fig. 3.
From Fig. 3 it is clear that the quality factor increases towards the band-edge. Yet the goal of this paper is to show that the low group velocity increases the quality factor. Unfortunately, the group index is not the only factor that may lead to the quality factor increase. The increase in reflection (because of higher mode mismatch) can also lead to quality factor increase. Thus,
1.45 1.5 1.55 1.6 1.650
0.2
0.4
0.6
0.8
λ[μm]
Reflection
1.45 1.5 1.55 1.6 1.650
2
4
6
8
10
12
λ[μm]
Group index
Band edge Band edge
a b
(C) 2008 OSA 14 April 2008 / Vol. 16, No. 8 / OPTICS EXPRESS 5588#91165 - $15.00 USD Received 2 Jan 2008; revised 2 Mar 2008; accepted 3 Mar 2008; published 7 Apr 2008

we need to separate the contribution of reflection increase and group index increase to the quality factor increase. In order to do so we have calculated the expected quality factor based on the extracted reflection (Qreflection) assuming constant refractive index in the wavelength region around the resonances. We compared the latter with the actual quality factor (Qtotal) using (4) to find out the contribution of group velocity to the quality factor.
Qreflection was calculated using FP formulation, i.e., the transmission of a FP resonator is given by:
( ) max2
221 sin
F
TT
Fυ
πυπ υ
=⎛ ⎞⎛ ⎞ ⎟⎜⎟⎜ ⎟+ ⎜⎟⎜ ⎟⎟⎜ ⎜ ⎟⎜⎝ ⎠ ⎝ ⎠
(5)
where ( )1F R Rπ= − is the finesse, ( )2F effc L nυ = ⋅ is the FSR, L is the
resonator’s length and υ is the field’s frequency. The resonance frequencies are given by -
res FNυ υ= . The corresponding frequencies where the transmission drops half maximum
are given by
( )1
1 2
2 sin 2F
res
Fυ πυ υ
π
− ⎡ ⎤⋅⎣ ⎦= ± (6)
Thus, the wavelength FWHM is given by:
( )2 1sin 2res
eff
F
L n
λ πδλ
π
− ⎡ ⎤⋅⎣ ⎦=
⋅ (7)
where resλ is the resonance wavelength. The quality factor is then calculated using (4). Note
that for the calculation we assumed ( ) 2.3effn λ = for all wavelength range.
The results are presented in Fig. 5 and confirm our hypothesis. In Fig. 5(a) we see that Qtotal is larger than Qreflection at the whole wavelength range. Moreover, in Fig. 5(b) we see that Qtotal increases faster than Qreflection as the wavelength of operation approaches the band-edge. Thus, it is clear that slow light plays an important role in increasing the quality factor.
(C) 2008 OSA 14 April 2008 / Vol. 16, No. 8 / OPTICS EXPRESS 5589#91165 - $15.00 USD Received 2 Jan 2008; revised 2 Mar 2008; accepted 3 Mar 2008; published 7 Apr 2008
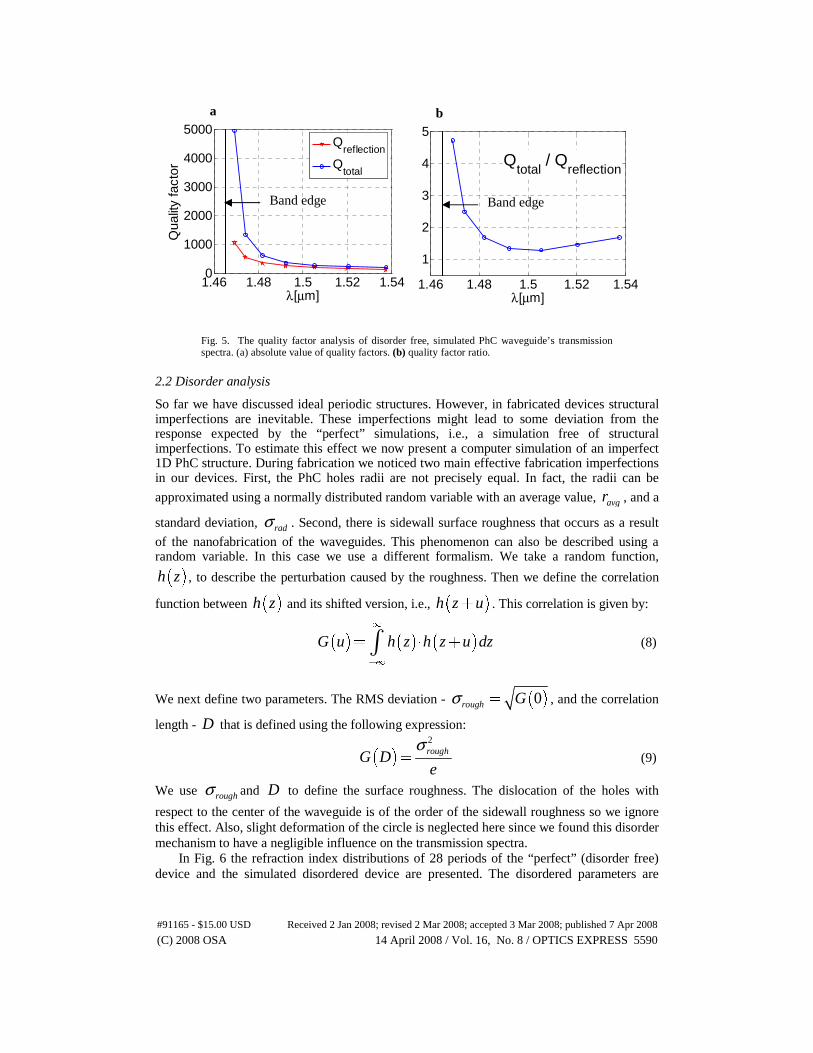
Fig. 5. The quality factor analysis of disorder free, simulated PhC waveguide’s transmission spectra. (a) absolute value of quality factors. (b) quality factor ratio.
2.2 Disorder analysis
So far we have discussed ideal periodic structures. However, in fabricated devices structural imperfections are inevitable. These imperfections might lead to some deviation from the response expected by the “perfect” simulations, i.e., a simulation free of structural imperfections. To estimate this effect we now present a computer simulation of an imperfect 1D PhC structure. During fabrication we noticed two main effective fabrication imperfections in our devices. First, the PhC holes radii are not precisely equal. In fact, the radii can be
approximated using a normally distributed random variable with an average value, avgr , and a
standard deviation, radσ . Second, there is sidewall surface roughness that occurs as a result
of the nanofabrication of the waveguides. This phenomenon can also be described using a random variable. In this case we use a different formalism. We take a random function,
( )h z , to describe the perturbation caused by the roughness. Then we define the correlation
function between ( )h z and its shifted version, i.e., ( )h z u+ . This correlation is given by:
( ) ( ) ( )G u h z h z u dz∞
−∞
= ⋅ +∫ (8)
We next define two parameters. The RMS deviation - ( )0rough Gσ = , and the correlation
length - D that is defined using the following expression:
( )2roughG De
σ= (9)
We use roughσ and D to define the surface roughness. The dislocation of the holes with
respect to the center of the waveguide is of the order of the sidewall roughness so we ignore this effect. Also, slight deformation of the circle is neglected here since we found this disorder mechanism to have a negligible influence on the transmission spectra. In Fig. 6 the refraction index distributions of 28 periods of the “perfect” (disorder free) device and the simulated disordered device are presented. The disordered parameters are
1.46 1.48 1.5 1.52 1.54
1
2
3
4
5
λ[μm]
Qtotal
/ Qreflection
1.46 1.48 1.5 1.52 1.540
1000
2000
3000
4000
5000
λ[μm]
Qua
lity
fact
or
Qreflection
Qtotal
a b
Band edge Band edge
(C) 2008 OSA 14 April 2008 / Vol. 16, No. 8 / OPTICS EXPRESS 5590#91165 - $15.00 USD Received 2 Jan 2008; revised 2 Mar 2008; accepted 3 Mar 2008; published 7 Apr 2008
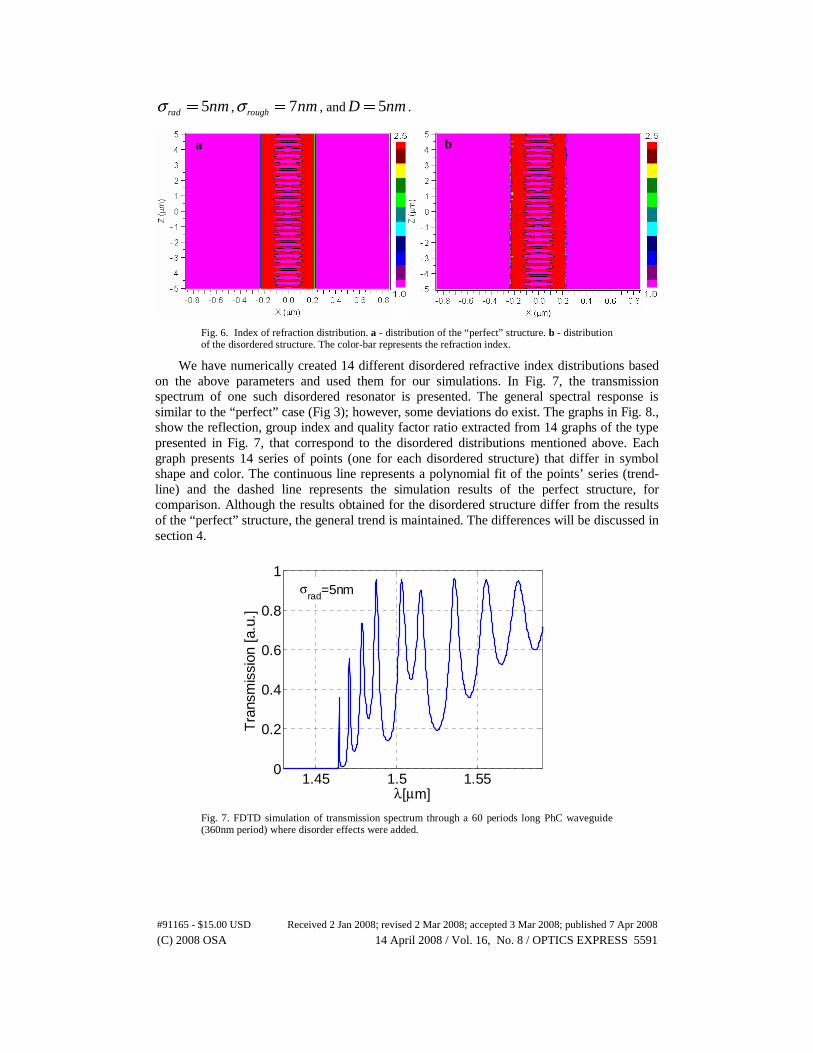
5rad nmσ = , 7rough nmσ = , and 5D nm= .
Fig. 6. Index of refraction distribution. a - distribution of the “perfect” structure. b - distribution of the disordered structure. The color-bar represents the refraction index.
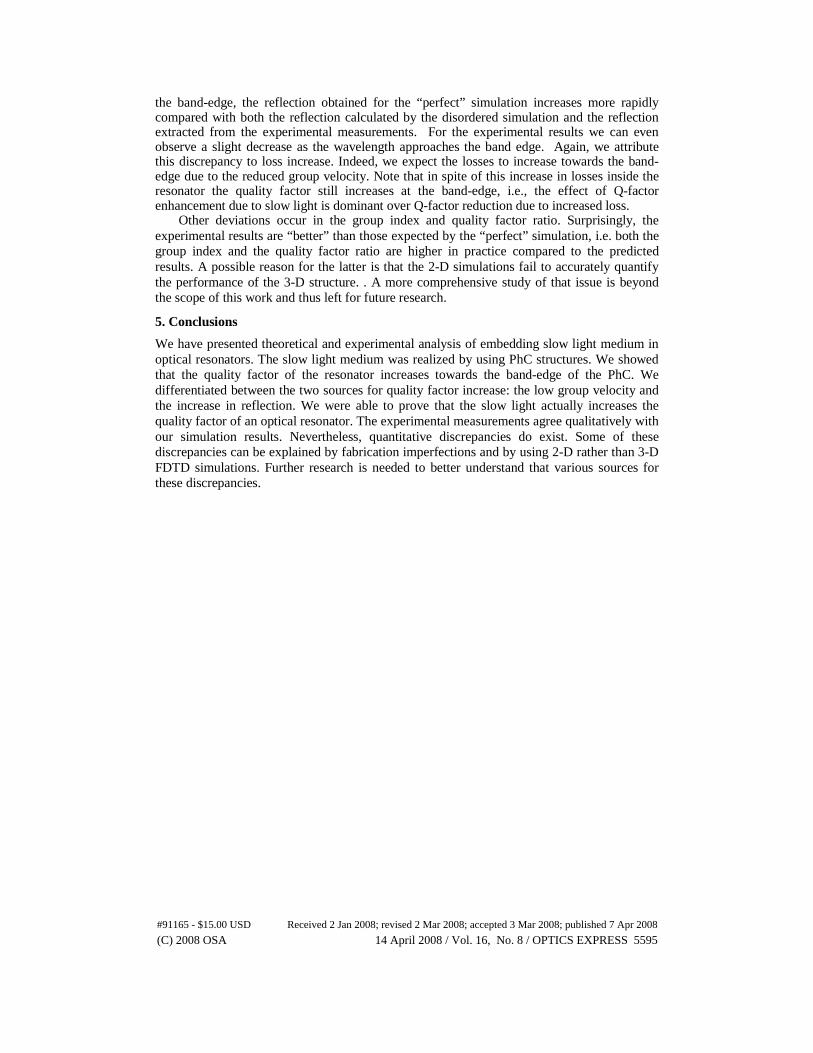
We have numerically created 14 different disordered refractive index distributions based on the above parameters and used them for our simulations. In Fig. 7, the transmission spectrum of one such disordered resonator is presented. The general spectral response is similar to the “perfect” case (Fig 3); however, some deviations do exist. The graphs in Fig. 8., show the reflection, group index and quality factor ratio extracted from 14 graphs of the type presented in Fig. 7, that correspond to the disordered distributions mentioned above. Each graph presents 14 series of points (one for each disordered structure) that differ in symbol shape and color. The continuous line represents a polynomial fit of the points’ series (trend-line) and the dashed line represents the simulation results of the perfect structure, for comparison. Although the results obtained for the disordered structure differ from the results of the “perfect” structure, the general trend is maintained. The differences will be discussed in section 4.
1.45 1.5 1.550
0.2
0.4
0.6
0.8
1
λ[μm]
Tra
nsm
issi
on [
a.u.
]
σrad=5nm
Fig. 7. FDTD simulation of transmission spectrum through a 60 periods long PhC waveguide (360nm period) where disorder effects were added.
a b
(C) 2008 OSA 14 April 2008 / Vol. 16, No. 8 / OPTICS EXPRESS 5591#91165 - $15.00 USD Received 2 Jan 2008; revised 2 Mar 2008; accepted 3 Mar 2008; published 7 Apr 2008

Fig. 8. (a) Reflection, (b) group index and c - quality factor enhancement extracted from the simulations of 14 disordered 1D PhC FP resonators’. Symbols represent the values extracted and the continuous line is the trend line calculated by a polynomial fit. Dashed line corresponds to the simulation results of the disorder-free device.
3. Fabrication and experimental results
We have fabricated and tested several 1-D PhC waveguides. We used Electron-Beam Lithography (EBL) to define the nanostructures followed by Reactive-Ion Etching (RIE) to transfer the patterns into the SOI substrate. The latter was composed of a 240nm thick top silicon layer, a 3μm thick oxide layer and a 600μm thick silicon handle layer. After etching, the structure was coated with 5μm thick SU8 polymer to form a top cladding layer. The refractive index of the SU8 layer was approximately 1.56.
Figure 9 depicts the fabrication result of a 1-D PhC waveguide made of air holes within a strip silicon waveguide. It also shows the measured transmission spectrum of the device. The PhC waveguide was 60 periods long, where each period length was approximately 360nm. The band-gap region is clearly observed at wavelengths below 1507nm. As expected the FSR of the FP oscillations increases as the wavelength moves away from the band-edge.
1.46 1.48 1.5 1.52 1.540
0.2
0.4
0.6
0.8
1
λ[μm]
Ref
lect
ion
1.46 1.48 1.5 1.52 1.541
2
3
4
5
6
7
λ[μm]
Qtotal
/Qreflection
1.46 1.48 1.5 1.52 1.54
2
4
6
8
10
12
λ[μm]
Gro
up in
dex
a b
c
(C) 2008 OSA 14 April 2008 / Vol. 16, No. 8 / OPTICS EXPRESS 5592#91165 - $15.00 USD Received 2 Jan 2008; revised 2 Mar 2008; accepted 3 Mar 2008; published 7 Apr 2008

Fig. 9. A scanning-electron-microscope (SEM) picture of the fabricated 1D PhC and the corresponding measured transmission spectrum.
We fabricated and measured four 1-D PhC devices similar to the above and evaluated the group index, reflection and quality factor. The dimensions of all four devices were approximately as presented in Fig. 9.
Fig. 10. (a) Reflection, (b) group index and (c) quality factor enhancement extracted from the experiment results of four SOI 1D PhC FP resonators’. Symbols represent the values extracted and the continuous line is the trend line calculated by a polynomial fit. Dashed line corresponds to the simulation results of the disorder free device. The x-axis shows wavelength difference with respect to the band-edge wavelength.
0 10 20 30 40
5
10
15
20
25
Δλ[nm]
Gro
up In
dex
0 10 20 30 40
0.2
0.4
0.6
0.8
Δλ[nm]
Ref
lect
ion
0 10 20 30 40
5
10
15
Δλ[nm]
Qtotal
/Qreflection
a b
c
1.48 1.5 1.52 1.54 1.56 1.580
1
2
3
x 10-4
λ[μm]
Tra
nsm
issi
on [
a.u.
]
475nm
(C) 2008 OSA 14 April 2008 / Vol. 16, No. 8 / OPTICS EXPRESS 5593#91165 - $15.00 USD Received 2 Jan 2008; revised 2 Mar 2008; accepted 3 Mar 2008; published 7 Apr 2008

The parameters (reflection, group index and quality factor ratio) extracted from the experimental results are presented in Fig. 10, in the same fashion as presented in the disordered structures simulations. The x-axis shows normalized wavelength, defined as the wavelength distance from the band-edge. As expected, the experimental results show an increase of the quality factor ratio when approaching the band-edge. The increase in the group index is also clearly observed from the results. An increase of the reflection is also measured; however, the qualitative behavior slightly differs from that expected by the simulations (will be discussed in section 4). Finally, Fig. 11 shows the measured total quality factor for the four 1-D PhC devices. As expected, the quality factor increases significantly as towards the band edge.
Fig. 11. Quality factor of four 1D PhC FPs extracted from the transmission spectrum measurements. Each FP device is represented with different marker type and color in the graph.
4. Discussion
The main purpose of this work was to experimentally demonstrate the hypothesis that slow light modes result an increase in the quality factor of optical resonators. Fig. 10 and Fig. 11 clearly prove this hypothesis. From Fig. 11 we see that the absolute value of the quality factor increases for all the measured devices as the wavelength approaches the band-edge (i.e., as the group index increases – also shown in the graphs). We also notice that the quality factor ratio increases as well towards the band-edge (Fig. 10), i.e., the increase of the quality factor cannot be fully attributed to increase in reflection of the PhC. We also notice that even further away from the band-edge the group index is about 5 and the quality factor ratio is about 2. Thus we conclude that even in that wavelength range the quality factor is larger than that expected only based on reflection values.
In addition, one can see that there is a good qualitative agreement between the experimental results and the disordered simulations. The trends are very similar and absolute values are also in reasonable agreement. A possible explanation for absolute deviations between the experimental result and the numerical simulations can be attributed to the fact that we used 2-D simulations, thus, absolute values are not expected to match exactly. Both disordered simulations and experimental results have some differences with respect to the “perfect” simulation. By observing the reflection graphs (Fig. 8 and Fig. 10), we notice that the reflection in both the disordered and experimental cases is essentially lower than that expected by the “perfect simulation. This can be explained by the fact that by extracting the reflection from the transmission graphs we actually extract the reflection multiplied by a factor smaller than 1 that represents losses in the resonator. These losses occur mainly due to fabrication imperfection. In addition, we specifically observe that as wavelength approaches
0 10 20 30 400
1000
2000
3000
4000
5000
Δλ[nm]
Total Quality factor
(C) 2008 OSA 14 April 2008 / Vol. 16, No. 8 / OPTICS EXPRESS 5594#91165 - $15.00 USD Received 2 Jan 2008; revised 2 Mar 2008; accepted 3 Mar 2008; published 7 Apr 2008
the band-edge, the reflection obtained for the “perfect” simulation increases more rapidly compared with both the reflection calculated by the disordered simulation and the reflection extracted from the experimental measurements. For the experimental results we can even observe a slight decrease as the wavelength approaches the band edge. Again, we attribute this discrepancy to loss increase. Indeed, we expect the losses to increase towards the band-edge due to the reduced group velocity. Note that in spite of this increase in losses inside the resonator the quality factor still increases at the band-edge, i.e., the effect of Q-factor enhancement due to slow light is dominant over Q-factor reduction due to increased loss.
Other deviations occur in the group index and quality factor ratio. Surprisingly, the experimental results are “better” than those expected by the “perfect” simulation, i.e. both the group index and the quality factor ratio are higher in practice compared to the predicted results. A possible reason for the latter is that the 2-D simulations fail to accurately quantify the performance of the 3-D structure. . A more comprehensive study of that issue is beyond the scope of this work and thus left for future research.
5. Conclusions
We have presented theoretical and experimental analysis of embedding slow light medium in optical resonators. The slow light medium was realized by using PhC structures. We showed that the quality factor of the resonator increases towards the band-edge of the PhC. We differentiated between the two sources for quality factor increase: the low group velocity and the increase in reflection. We were able to prove that the slow light actually increases the quality factor of an optical resonator. The experimental measurements agree qualitatively with our simulation results. Nevertheless, quantitative discrepancies do exist. Some of these discrepancies can be explained by fabrication imperfections and by using 2-D rather than 3-D FDTD simulations. Further research is needed to better understand that various sources for these discrepancies.
(C) 2008 OSA 14 April 2008 / Vol. 16, No. 8 / OPTICS EXPRESS 5595#91165 - $15.00 USD Received 2 Jan 2008; revised 2 Mar 2008; accepted 3 Mar 2008; published 7 Apr 2008
Copyright © 2022 FDOKUMEN