Experimental investigations on melting of lead in a cuboid with constant heat flux boundary...
13
Experimental investigations on melting of lead in a cuboid with constant heat flux boundary condition using thermal neutron radiography Lokendra Kumar a , B.S. Manjunath a , R.J. Patel a , S.G. Markandeya a , R.G. Agrawal a , Ashish Agrawal a , Y. Kashyap a , P.S. Sarkar a , Amar Sinha a , K.N. Iyer b , S.V. Prabhu b, * a Bhabha Atomic Research Centre, Mumbai, India b Department of Mechanical Engineering, Indian Institute of Technology, Bombay, Powai, Mumbai 400 076, India article info Article history: Received 26 December 2011 Received in revised form 19 June 2012 Accepted 27 June 2012 Available online xxx Keywords: Neutron radiography Melting Lead Constant heat flux Solideliquid interface FLUENT and Stefan number abstract Knowledge of the melting of lead (shielding material) in enclosures is of great importance in the design of transportation packages. An experimental investigation is carried out to study the melting of lead contained in a stainless steel cuboid. The size of the cuboid is 50 mm 50 mm 60 mm. Side vertical wall is maintained at a constant heat flux boundary condition. Visualisation of solideliquid interface movement during melting of lead is carried out using neutron radiography at beamline E12 in CIRUS reactor in BARC. The beamline flux is 10 6 Neutrons/cm 2 s. Neutron radiography is a non-intrusive method for the characterization of melt front of melting of opaque materials. This method demonstrates dynamic capture of the progress of solideliquid interface under the effects of natural convection in a non-intrusive manner. FLUENT is used as a numerical tool for the estimation of transient molten fraction and transient Nusselt number. Enthalpyeporosity method is employed for numerical investigation. Variation of molten fraction with time computed by numerical methodology compares reasonably well with those of experimental results. A correlation for average Nusselt number is suggested based on the numerical results and scale analysis. Ó 2012 Elsevier Masson SAS. All rights reserved. 1. Introduction Transportation packages carrying radioactive material should limit the damage to public during transportation as per the Trans- port Regulations of Atomic Energy Regulatory Board (AERB)/Inter- national Atomic Energy Agency (IAEA). Transportation packages should qualify the Performance Standards specified by IAEA/AERB. Thermal testing is one such performance standard for simulating fire during transportation. It specifies the package to be exposed for a period of 30 min to a thermal environment which provides a heat flux of at least equivalent to that of a hydrocarbon fuel/air fire with an average temperature of at least 800 C [1]. Under these test conditions, lead which is normally used as a shielding material starts melting. The solideliquid interface, wall temperature and molten fraction variation with time for a prescribed thermal boundary condition are important engineering parameters for evaluating the package performance. Hence it is very important to generate the accurate mapping of solideliquid interface using non- intrusive methods of measurement. Melting of metals finds appli- cations in material processing, metallurgy, purification of metals, zone melting etc. [2]. Methods for measuring solideliquid interface may be broadly classified as intrusive and non-intrusive methods. Intrusive methods are pouring out method, traversing probe method and thermocouple method. Non-intrusive methods are ultrasound diagnostic method, X-ray radiography, gamma ray radiography, resistance method and neutron radiography. In the pour out method, the liquid is poured out at a predetermined time through the sprue or through the tube. The interface is exposed and examined. Gau and Viskanta [3] conducted experimental investi- gations on the melting of gallium in a rectangular enclosure in which a single vertical wall was heated at constant wall tempera- ture boundary condition. The solideliquid interface was captured using pour out method. Experiments were carried out for low Stefan number (Ste ¼ 0.009e0.083). Aspect ratio of the enclosure was 0.286e0.714. Gau and Viskanta [4] also reported use of pour out method to study the influence of natural convection on the solideliquid interface motion during melting and solidification of Lipowitz metal in a rectangular cavity. Heating was carried out on the top and bottom wall of the rectangular enclosure. * Corresponding author. Tel.: þ91 22 25767515; fax: þ91 22 25726875. E-mail address: [email protected] (S.V. Prabhu). Contents lists available at SciVerse ScienceDirect International Journal of Thermal Sciences journal homepage: www.elsevier.com/locate/ijts 1290-0729/$ e see front matter Ó 2012 Elsevier Masson SAS. All rights reserved. http://dx.doi.org/10.1016/j.ijthermalsci.2012.06.014 International Journal of Thermal Sciences xxx (2012) 1e13 Please cite this article in press as: L. Kumar, et al., Experimental investigations on melting of lead in a cuboid with constant heat flux boundary condition using thermal neutron radiography, International Journal of Thermal Sciences (2012), http://dx.doi.org/10.1016/ j.ijthermalsci.2012.06.014
Transcript of Experimental investigations on melting of lead in a cuboid with constant heat flux boundary...

at SciVerse ScienceDirect
International Journal of Thermal Sciences xxx (2012) 1e13
Contents lists available
International Journal of Thermal Sciences
journal homepage: www.elsevier .com/locate/ i j ts
Experimental investigations on melting of lead in a cuboid with constant heat fluxboundary condition using thermal neutron radiography
Lokendra Kumar a, B.S. Manjunath a, R.J. Patel a, S.G. Markandeya a, R.G. Agrawal a, Ashish Agrawal a,Y. Kashyap a, P.S. Sarkar a, Amar Sinha a, K.N. Iyer b, S.V. Prabhu b,*
aBhabha Atomic Research Centre, Mumbai, IndiabDepartment of Mechanical Engineering, Indian Institute of Technology, Bombay, Powai, Mumbai 400 076, India
a r t i c l e i n f o
Article history:Received 26 December 2011Received in revised form19 June 2012Accepted 27 June 2012Available online xxx
Keywords:Neutron radiographyMeltingLeadConstant heat fluxSolideliquid interfaceFLUENT and Stefan number
* Corresponding author. Tel.: þ91 22 25767515; faxE-mail address: [email protected] (S.V. Prabhu).
1290-0729/$ e see front matter � 2012 Elsevier Mashttp://dx.doi.org/10.1016/j.ijthermalsci.2012.06.014
Please cite this article in press as: L. Kumar,condition using thermal neutron radj.ijthermalsci.2012.06.014
a b s t r a c t
Knowledge of the melting of lead (shielding material) in enclosures is of great importance in the designof transportation packages. An experimental investigation is carried out to study the melting of leadcontained in a stainless steel cuboid. The size of the cuboid is 50 mm � 50 mm � 60 mm. Side verticalwall is maintained at a constant heat flux boundary condition. Visualisation of solideliquid interfacemovement during melting of lead is carried out using neutron radiography at beamline E12 in CIRUSreactor in BARC. The beamline flux is 106 Neutrons/cm2 s. Neutron radiography is a non-intrusive methodfor the characterization of melt front of melting of opaque materials. This method demonstrates dynamiccapture of the progress of solideliquid interface under the effects of natural convection in a non-intrusivemanner. FLUENT is used as a numerical tool for the estimation of transient molten fraction and transientNusselt number. Enthalpyeporosity method is employed for numerical investigation. Variation of moltenfraction with time computed by numerical methodology compares reasonably well with those ofexperimental results. A correlation for average Nusselt number is suggested based on the numericalresults and scale analysis.
� 2012 Elsevier Masson SAS. All rights reserved.
1. Introduction
Transportation packages carrying radioactive material shouldlimit the damage to public during transportation as per the Trans-port Regulations of Atomic Energy Regulatory Board (AERB)/Inter-national Atomic Energy Agency (IAEA). Transportation packagesshould qualify the Performance Standards specified by IAEA/AERB.Thermal testing is one such performance standard for simulatingfire during transportation. It specifies the package to be exposed fora period of 30 min to a thermal environment which provides a heatflux of at least equivalent to that of a hydrocarbon fuel/air fire withan average temperature of at least 800 �C [1]. Under these testconditions, lead which is normally used as a shielding materialstarts melting. The solideliquid interface, wall temperature andmolten fraction variation with time for a prescribed thermalboundary condition are important engineering parameters forevaluating the package performance. Hence it is very important togenerate the accurate mapping of solideliquid interface using non-
: þ91 22 25726875.
son SAS. All rights reserved.
et al., Experimental investigatiography, International Jo
intrusive methods of measurement. Melting of metals finds appli-cations in material processing, metallurgy, purification of metals,zone melting etc. [2].
Methods for measuring solideliquid interface may be broadlyclassified as intrusive and non-intrusive methods. Intrusivemethods are pouring out method, traversing probe method andthermocouple method. Non-intrusive methods are ultrasounddiagnostic method, X-ray radiography, gamma ray radiography,resistance method and neutron radiography. In the pour outmethod, the liquid is poured out at a predetermined time throughthe sprue or through the tube. The interface is exposed andexamined. Gau and Viskanta [3] conducted experimental investi-gations on the melting of gallium in a rectangular enclosure inwhich a single vertical wall was heated at constant wall tempera-ture boundary condition. The solideliquid interface was capturedusing pour out method. Experiments were carried out for lowStefan number (Ste ¼ 0.009e0.083). Aspect ratio of the enclosurewas 0.286e0.714. Gau and Viskanta [4] also reported use of pourout method to study the influence of natural convection on thesolideliquid interface motion during melting and solidification ofLipowitz metal in a rectangular cavity. Heating was carried out onthe top and bottom wall of the rectangular enclosure.
ions on melting of lead in a cuboid with constant heat flux boundaryurnal of Thermal Sciences (2012), http://dx.doi.org/10.1016/
Nomenclature
A Surface area of the specimen (m2)A(g) Porosity functionC Mushy zone constantCp Specific heat of the liquid (J/kg K)g Acceleration due to gravity (m2/s)h Heat transfer coefficient from enclosure’s surface to
environment (W/m2 K)h Enthalpy (J/kg)hsf Latent heat of fusion (J/kg)H Height of the specimen (m)I Current (amp)k Thermal conductivity of the liquid (W/m K)L Length of the specimen (m)p Pressure (N/m2)q00cond Heat flux transferred to the wall, (W/m2)qloss Heat loss to the surrounding (W)S!
Source term in momentum equationt Time (s)T Temperature of phase change material (o C)Tw Wall Temperature (�C)DT Temperature difference between wall and melting
point (�C)V Voltage (V)V!
Velocity vector (m/s)x,y Co-ordinates (m)
Greek symbols:a Thermal diffusivity of liquid (m2/s)an Phase volume fractionq Dimensionless time (Ste* Fo)
q1 Dimensionless time marking when the mixed regimeends
q2 Dimensionless time marking when at the top is fullyfilled with liquid
q3 Dimensionless time marking when at the melting iscomplete
r Density of liquid (kg/m3)n Kinematic viscosity (m2/s)b Volumetric expansion coefficient (m3/m3 �
C)m Dynamic viscosity of fluid (kg/m s)g Liquid fraction
Dimensionless Numbers:
Fo Fourier numberatL2
Nu Nusselt number based on height e averagedtemperature
Pr Prandtl numbermCpk
Ra Rayleigh number based on the temperaturegbðTw � TmÞH3
anRa* Rayleigh number based on heat flux
gbq00condH4
kanSte Stefan Number based on constant wall temperature
CpðTw � TmÞhsf
Ste* Stefan Number based on constant heat fluxCpq00condLkhsf
Superscripts/subscriptsm Melting pointref Reference conditionw Wall
L. Kumar et al. / International Journal of Thermal Sciences xxx (2012) 1e132
In the traversing probe method, a vernier caliper is used tomeasure the distance traversed by the glass probe at thesolideliquid interface. Wolff and Viskanta [5,6] used traversingprobemethod to measure the solideliquid interface duringmeltingand solidification of tin in an enclosure. Experiments were per-formed in a rectangular test cell with two opposing sidewalls heldat constant but different temperatures, while the remaining wallswere well insulated. Gau and Viskanta [4] employed both pour outmethod and traversing probe method.
Thermocouples are reported to be used to track the solideliquidinterface. Wang and Fautrella [7] employed fifty thermocouples fortracking the solideliquid interface during the solidification of puretin influenced by thermally driven natural convection. Meantemperature gradient and mean cooling rate of the vertical wallswere controlled using two heat exchangers. Szekely and Chhabra[8] used thermocouples to study of the effect of natural convectionon the controlled solidification of lead under conditions of nearlyunidirectional heat flow within the system.
Using the difference in values of electrical resistance for solid andliquid, Garandent and Salvi [9] demonstrated the use of resistancesystem to measure the solideliquid interface movement of tin. Inultrasound technique, the solid and liquid phases separated by theinterface have different acoustic properties. This property isemployed to measure the thickness of each phase with proper cali-bration. Zhang et al. [10] conducted numerical and experimentalstudies onmelting behaviorof a puremetal (Gallium) in thepresenceof a staticmagneticfield. Thesolid thicknessat its sidecenterpositionwas measured by an ultrasound device and the solid/melt interfaceprofile was captured via reflection florescent-light photography.The ultrasound transducer continuously detected the solid/melt
Please cite this article in press as: L. Kumar, et al., Experimental investigatcondition using thermal neutron radiography, International Joj.ijthermalsci.2012.06.014
interface at the center of the sidewalls. These measured thicknessvalueswere comparedwith the thicknessdataobtained fromimages.
The X-ray visualisation technique based on the mass absorptionof the elements is also reported for understanding meltingphenomenon. Change in density of a substance caused by a phasetransformation from liquid to solid, commonly of magnitude of atleast 2%, results in a change of transmitted intensity of the X-raybeam. Yin and Koster [11] studied horizontal directional solidifica-tion (HDS) and horizontal directional melting (HDM) of pure Al andAle4.5%wt Cu alloy in real-time with in situ X-ray radioscopic vis-ualisation technology. Hytros et al. [12] used X-ray (6 MeV)computed tomography (CT) system formonitoring the solidificationfront in aluminum casting. Pure aluminum in a clayegraphitecrucible was melted in a resistance heater furnace and a coolingtube at the center of the crucible solidified the molten aluminum tosimulate the casting process. Outward progression of the solidifi-cation front was captured using X-ray tomography. In addition, thedensity being a function of temperature, the visualisation techniqueprovides temperature field visualisation through a variation in theX-ray absorption intensity. The densitymapswere constructed fromX-ray attenuation measurement of image and correlate well withtemperature measurements obtained independently by thermo-couples. Yin and Koster [13] and Derebail and Koster [14] conductedexperimental investigation on directional melting experiment ofa rectangular sheet of gallium and indium (5% by weight) in thepresence of horizontal temperature gradient. Real-time radioscopy(X-ray) was used to visualise the interface morphologies and theflow patterns. Campbell and Koster [15] also demonstrated theX-ray radioscopic method to track the solideliquid interface duringthe melting of gallium.
ions on melting of lead in a cuboid with constant heat flux boundaryurnal of Thermal Sciences (2012), http://dx.doi.org/10.1016/

L. Kumar et al. / International Journal of Thermal Sciences xxx (2012) 1e13 3
Gamma ray radiography involves the visualisation ofsolideliquid interface based upon the attenuation of gamma rays ofsufficient energy. For the energy of 1.3 Meve10 MeV of gamma-rays, the dominant interaction is Compton scattering, whichstrongly depends on the density of metals and only weakly on theenergy and the elemental composition. Hence, during the melting/solidification, the change in density is captured using gamma rayradiography. The choice of a radiation source depends on thethickness and density of the strand being cast. Chun et al. [16]presented three-dimensional gamma ray imaging technique fortracking the liquid solid interface for pure tin in a cylindricalgraphite crucible. The crucible was heated at the top by a bandheater and was cooled at the bottom by a water-cooled jacket.Barber et al. [17] used gamma-ray technique to observe the inter-face movement and shape in lead tin telluride during crystalgrowth in a Bridgman furnace.
Neutron is a subatomic particle without a net charge; conse-quently Coulomb attraction forces have no effect on it, when ittravels through matter. This fact makes it also useful for imagingapplications. Neutron transmission radiography is based on theapplication of the universal law of attenuation of radiation passingthrough matter. Because different materials have different attenu-ation behaviour, the neutron beam passing through a sample can beinterpreted as a signal carrying information about the compositionand structure of the sample [18]. Reijonen and Forsten [19] usedneutron radiography to evaluate the segregation concentration ofcadmium in SneCd alloys. Takenaka et al. [20] conducted experi-mental investigation on flow visualisation and solideliquid inter-face capturing by neutron radiography for the leadebismutheutectic. A tracer made of goldecadmium intermetallic compoundfor flow visualisation and dye made of leadebismuthecadmiumalloy for solideliquid interface were used. Kahle et al. [21]studied the interaction of two chemically distinct melts anddetermined the melt viscosities of silicates with the falling spheremethod using neutron radiography.
Intrusive methods (Pour method, traversing probe method andthermocouple method) disturb the melting and solidificationphenomenon of metals. Comparison of solideliquid interfaceinferred from pour out method [3] and X-ray radioscopic method[15] was not found very satisfactory. Campbell and Koster [15]attribute these differences to the movement of the interface inthe pour out method due to induced uncontrolled forced convec-tion during pouring. These methods alter the composition andproperties of the castings and are cumbersome to implement in anindustrial environment [16]. Since most metals have small atten-uation coefficients to neutron rays, neutron radiography is moresuitable to capture solideliquid interface of opaque materials inmetal containers like stainless steel.
Numerical methods are also used for mapping of solideliquidinterface and calculation of molten fraction. Assis et al. [22] per-formed experimental and numerical investigation on melting onRT27 (Rubitherm GmbH) under constant wall temperatureboundary condition (Ste � 0.2). Convection in liquid phase, volu-metric expansion due to melting, sinking of the solid in the liquid,close contact melting and thermal resistance of the test shell by thetransient numerical solution was conducted using FLUENT. Nusseltnumber and molten fraction is presented in terms of Fouriernumber, Stefan number and Grashof number by dimensionalanalysis. Shmueli et al. [23] carried out numerical investigation onthe melting of Rubitherm RT27 in a vertical cylindrical tube. Theeffect of mushy zone constant, influence of the pressureevelocitycoupling and the pressure discretization scheme on molten frac-tion variation is examined. They observed that the results wereextremely sensitive to the value of mushy constant chosen(105e1010). Pinelli and Piva [24] reported numerical investigation of
Please cite this article in press as: L. Kumar, et al., Experimental investigatcondition using thermal neutron radiography, International Joj.ijthermalsci.2012.06.014
melting of n-octadecane heated from above. Results show theconsideration of natural convection shows significant improve-ment in the agreement between numerical results and experi-mental data.
Review of the literature on the melting of metals suggests thatsolideliquid interface data is available only for constant walltemperature boundary condition and is limited to lower Stefannumbers. Hence, the objectives of the present work are
� To employ the neutron radiography technique to understandthe melting of pure metal like lead for higher Stefan numbers(0.4e0.86) under constant heat flux boundary condition.
� To numerically predict the variation of molten fraction withtime and compute Nusselt number as a function of Rayleighnumber, Stefan number and Prandtl number.
The experimental data would serve as a benchmark data foranalytical/numerical studies. These tests will also highlight theimportance of natural convection during melting.
2. Experimental e set up and procedure
2.1. Neutron radiography set-up
The CIRUS reactor at BARC is a 40MW (thermal) research reactorhaving natural uranium as fuel and heavy water as moderator. Abeamline equippedwith a specially designed collimator is designedto ensure good quality resolution imaging and provides highneutron to gamma ratio. The beam opening is 120 mm diameterand at sample position, the neutron flux is measured to be106 neutrons/cm2 s. The neutron imaging system uses a LiFeZnSconverter screen, a front coated aluminum glass mirror and anAndormake cooled CCD camera (DW432N). CCD camera has a pixelpitch of 22 m and the achieved resolution at the converter screen isaround 100 m. The CCD camera is properly shielded using leadblocks and borated polythene blocks. The schematic of the imagingsystem is shown in Fig. 1(a) and the actual photograph of theinstalled imaging system in Fig. 1(b). The CCD camera is connectedto a remote PC and its cooling power supply. The data from CCDcamera is readout with 1 m-s/pixel using frame grabber. Imageacquisition software is developed using Visual C language withvarious setting options such as acquisition time, detector cooling,different types of data file saving, number of images to acquire etc.
The minimum acquisition time is found out at the beginning ofthe experiment so that a good quality image is obtained for thistype of real-time studies. It is found out to be 10 s for imageacquisition, 1.7 s for readout and data transfer and 2.1 s for sleeptime. Hence, a total of 13.8 s is successive image acquisition time.Integrated images of 10 s were saved continuously during thecourse of the experiment. During the experimentation, the camerachip was kept cooled at �40 �C for very less thermionic noise.
2.2. Test section set up
The cuboidal enclosure is made of stainless steel sheet ofthickness 1 mm as shown in Fig. 2. The size of the specimen is50 � 50 � 60 mm3. Lead is filled in specimen. Air gap of 5 mm iskept above the lead to accommodate the volumetric expansion oflead during melting. This air gap also acts as a good heat insulator.Aspect ratio (Height to width) of the test section is 0.75. The frontsize of the test section is designed according to the limit of size ofthe converter screen (150 mm � 100 mm). Plate heater is attachedon one of the sidewalls. Plate heater is made of nichrome strip of0.1 mm thickness and 5 mm width placed on mica sheet. This issandwiched between two mica sheets as shown in Fig. 2. Asbestos
ions on melting of lead in a cuboid with constant heat flux boundaryurnal of Thermal Sciences (2012), http://dx.doi.org/10.1016/

Fig. 2. Schematic diagram of test section.
Fig. 1. (a) Schematic of the imaging system (b) The actual photograph of the imaging system as installed at E-12 Beamline, Cirus (BARC).
L. Kumar et al. / International Journal of Thermal Sciences xxx (2012) 1e134
sheet of thickness 6 mm and glass wool is used as insulation tominimize the heat loss at the heated side and the opposite side.Bakelite sheet of thickness of 14 mm is used to hold the insulatingmaterial and the heater. This Bakelite also acts as an insulating
Fig. 3. Actual photograph
Please cite this article in press as: L. Kumar, et al., Experimental investigatcondition using thermal neutron radiography, International Joj.ijthermalsci.2012.06.014
material. Asbestos strip is placed on the top and bottom walls forthe sake of insulation. The front and backward facingwalls are opento atmosphere so that the neutron beam faces no hindrance in itspath. The actual photograph of test section is shown in Fig. 3.
of the test specimen.
ions on melting of lead in a cuboid with constant heat flux boundaryurnal of Thermal Sciences (2012), http://dx.doi.org/10.1016/

Fig. 4. Matlab processing to capture the solideliquid interface (a) Raw image of neutron radiography (b) Rotated and cropped image of the portion having lead only (c) grayness ofa row along the length (x/L) (d) Capturing the interface using interface value.
L. Kumar et al. / International Journal of Thermal Sciences xxx (2012) 1e13 5
K-type thermocouples and thermal camera are used to measurethe temperature of the wall opposite to the heated surface.Controlled electric supply is applied using 0e240 V variac. Thecurrent and voltage are measured during the test to estimate thepower input. During the experiment, the heater is put on. Thesupply of power is kept constant during the experiment.
Table 1Thermophysical properties of lead.
Property of lead Value
Solid density (kg/m3) 11340Liquid density (kg/m3) 10640Dynamic viscosity (Pa-s) 2.39 � 10�3
Latent heat (J/kg) 2.43 � 104
Thermal conductivity (W/m-K) 16.10Specific heat (J/kg-K) 159.00Volumetric expansion coefficient (m3/m3 �
C) 0.000235Prandtl number 0.0236Melting Point (�C) 327Thermal diffusivity (m2/s) 9.52 � 10�6
2.3. Post-processing of neutron radiographic raw images
The images captured by the CCD camera of neutron radiographyset-up are in Tagged Image File Format (tif). A typical imagecaptured by CCD camera of neutron radiography set-up is shown inFig. 4(a). Image is then rotated and cropping is carried out to limitthe image to lead only as shown in Fig. 4(b).
Using the Matlab processor, the grayness of each row (y/H) ofthe image is shown along the longitudinal distance (x/L) as shownin Fig. 4(c). There is a clear difference between the grayness ofliquid and solid. The average value is used as value for interface.Interface captured using this method is shown in Fig. 4(d). Uncer-tainty in predicting solideliquid interface is around 8.7%.
2.4. Data reduction
The molten fraction obtained from the solideliquid interface isdefined as
Please cite this article in press as: L. Kumar, et al., Experimental investigatcondition using thermal neutron radiography, International Joj.ijthermalsci.2012.06.014
Molten fraction ¼ Liquid AreaTotal Area
(1)
For the estimation of heat loss to the environment, heat transfercoefficient (h) of the enclosure’s surface with air should be known.For this, enclosure is connected to the power supply. At steady state,all the power given to the enclosure would be dissipated. Hence,the heat transfer coefficient (h) is calculated using Newton’s law ofcooling which would include convection and radiation effects.
hA ¼ qlossðTw � TambÞ
¼ VIðTw � TambÞ
(2)
ions on melting of lead in a cuboid with constant heat flux boundaryurnal of Thermal Sciences (2012), http://dx.doi.org/10.1016/

L. Kumar et al. / International Journal of Thermal Sciences xxx (2012) 1e136
Twewall temperature of enclosureTambe ambient temperatureAe sur-facearea of the enclosureWall temperature (Tw) is measured usingthermal camera. h is found to be around 10.73 W/m2 K
Stefan number based on constant heat flux is given by
Ste* ¼ Cpq00condLkhsf
(3)
Fig. 5. Neutron radiography image durin
Please cite this article in press as: L. Kumar, et al., Experimental investigatcondition using thermal neutron radiography, International Joj.ijthermalsci.2012.06.014
q00cond ¼ Electric energy sup plied� heat lossArea of the heating plate
Electric energy sup plied ¼ VI
Heat loss ¼ ðTw � TambÞhA
(4)
The thermophysical properties taken for calculation for the leadare given in Table 1.
g the melting of lead for Ste* ¼ 0.40.
ions on melting of lead in a cuboid with constant heat flux boundaryurnal of Thermal Sciences (2012), http://dx.doi.org/10.1016/
L. Kumar et al. / International Journal of Thermal Sciences xxx (2012) 1e13 7
3. Results and discussions
3.1. Experimental results
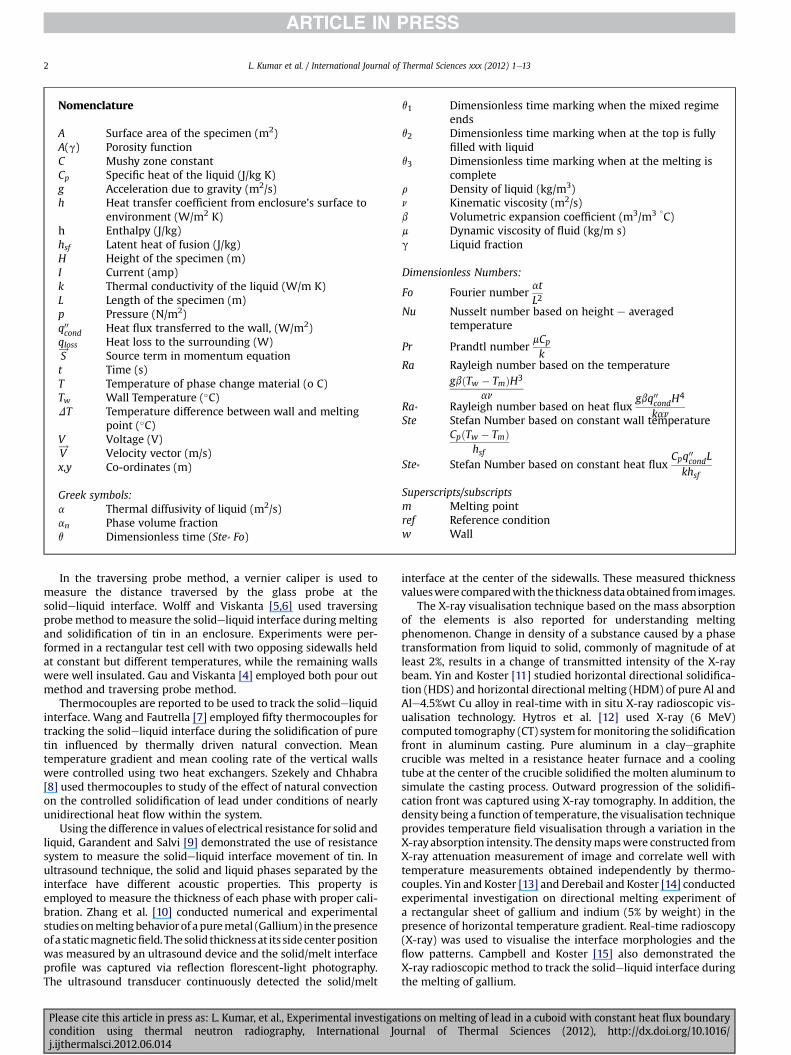
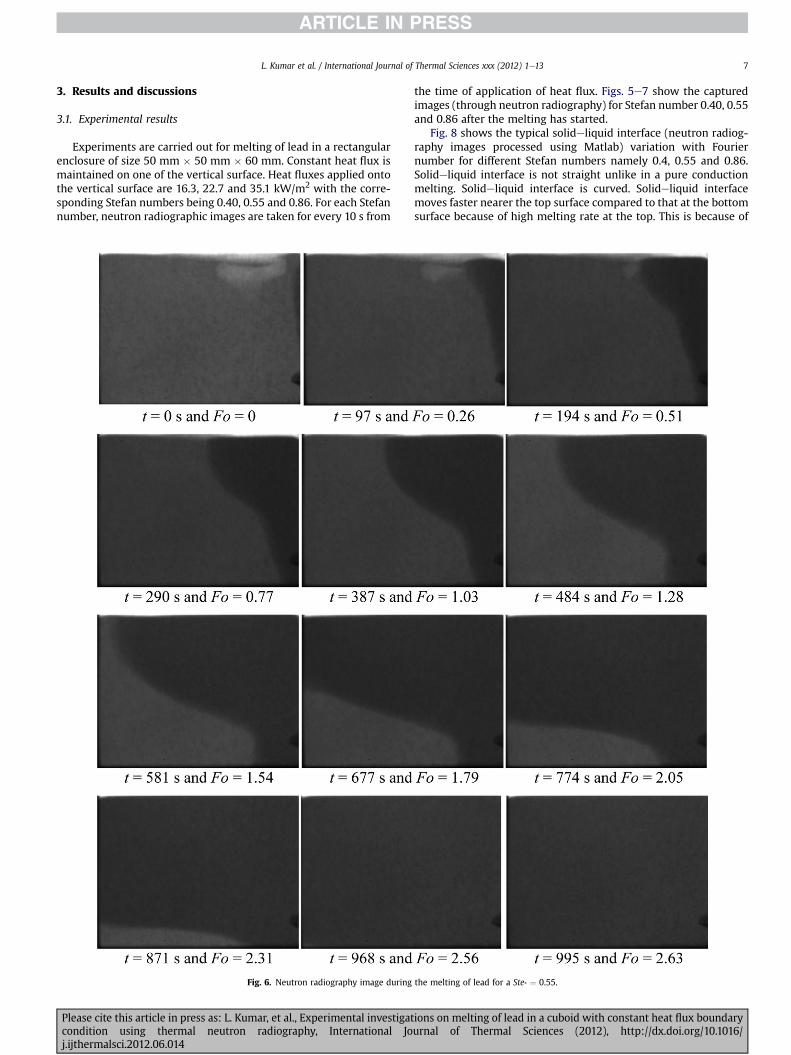
Experiments are carried out for melting of lead in a rectangularenclosure of size 50 mm � 50 mm � 60 mm. Constant heat flux ismaintained on one of the vertical surface. Heat fluxes applied ontothe vertical surface are 16.3, 22.7 and 35.1 kW/m2 with the corre-sponding Stefan numbers being 0.40, 0.55 and 0.86. For each Stefannumber, neutron radiographic images are taken for every 10 s from
Fig. 6. Neutron radiography image during
Please cite this article in press as: L. Kumar, et al., Experimental investigatcondition using thermal neutron radiography, International Joj.ijthermalsci.2012.06.014
the time of application of heat flux. Figs. 5e7 show the capturedimages (through neutron radiography) for Stefan number 0.40, 0.55and 0.86 after the melting has started.
Fig. 8 shows the typical solideliquid interface (neutron radiog-raphy images processed using Matlab) variation with Fouriernumber for different Stefan numbers namely 0.4, 0.55 and 0.86.Solideliquid interface is not straight unlike in a pure conductionmelting. Solideliquid interface is curved. Solideliquid interfacemoves faster nearer the top surface compared to that at the bottomsurface because of high melting rate at the top. This is because of
the melting of lead for a Ste* ¼ 0.55.
ions on melting of lead in a cuboid with constant heat flux boundaryurnal of Thermal Sciences (2012), http://dx.doi.org/10.1016/
L. Kumar et al. / International Journal of Thermal Sciences xxx (2012) 1e138
the dominance of natural convection. Similar observations arereported by Gau and Viskanta [3].
Maximum and minimum depths of interface are important inthe calculation of nuclear radiation leakage during melting of thelead which is a shielding material. Fig. 9 shows the variation ofmaximum and minimum depth of interface with time fordifferent Stefan numbers. Maximum depth is usually observed atthe top and minimum depth is observed at the bottom surface.These depths increase with time. The rate of increase ofmaximum depth is higher compared to the rate of increase of
Fig. 7. Neutron radiography image during
Please cite this article in press as: L. Kumar, et al., Experimental investigatcondition using thermal neutron radiography, International Joj.ijthermalsci.2012.06.014
minimum depth. This is because of the buoyancy-inducedconvection.
3.2. Numerical results
In the present investigation, numerical modeling is carried outfor melting of lead from a heated vertical wall in a cuboid enclosureof size of 50 � 50 � 60 mm3 as shown in Fig. 2. The enclosure ismodeled as two dimensional considering that melting front isplanar in depth. The thermophysical properties of phase change
the melting of lead for a Ste* ¼ 0.86.
ions on melting of lead in a cuboid with constant heat flux boundaryurnal of Thermal Sciences (2012), http://dx.doi.org/10.1016/

0 1 2 3Fo
0
0.4
0.8
0.2
0.6
1
Dep
thof
inte
rfac
e( x
/L) Ste* = 0.40
Maximum depth of inter face
Minimum depth of interface
0 400 800 1200Time (s)
0 400 800Time (s)
L. Kumar et al. / International Journal of Thermal Sciences xxx (2012) 1e13 9
material (lead) are assumed to be constant with respect totemperature. The values of thermophysical properties used innumerical calculation are listed in Table 1.
It is assumed that both solid and liquid phases are homogeneousand isotropic. The numerical approach extensively is described byAssis et al. [22]. Enthalpyeporosity approach is adopted. Therefore,the governing conservation equations used are:
Continuity equation
DanDt
¼ 0 (5)
Momentum equation
rDV!Dt
¼ �Vpþ mV2 V!þ rg þ S
!(6)
Energy equation
Fig. 8. Time wise variation of solideliquid interface during melting for different Stefannumbers.
0 0.2 0.4 0.6 0.8Fo
-0.1
0
0.1
0.2
0.3
0.4
Mol
ten
Fra
ctio
n
Grid Size0.5 mm × 0.5 mm
1 mm × 1 mm
0 100 200 300Time (s)
Fig. 10. Comparison of variation of grid size on molten fraction.
0 1 2 3Fo
0
0.4
0.8
0.2
0.6
1
Dep
thof
inte
rfac
e(x
/L) Ste
*= 0.55
Maximum depth of interf ace
Minimum depth of interface
0 0.5 1 1.5 2Fo
0
0.4
0.8
0.2
0.6
1
Dep
thof
inte
rfac
e( x
/L) Ste
*= 0.86
Maximum depth of interf ace
Minimum depth of interface
0 200 400 600Time (s)
Fig. 9. Variation of maximum and minimum depth of interface for different Stefannumbers.
Please cite this article in press as: L. Kumar, et al., Experimental investigations on melting of lead in a cuboid with constant heat flux boundarycondition using thermal neutron radiography, International Journal of Thermal Sciences (2012), http://dx.doi.org/10.1016/j.ijthermalsci.2012.06.014

Neutron radiography and Numerical resultSte* = 0.40 (Neutron radiography)
Ste* = 0.55 (Neutron radiography)
Ste = 0.86 (Neutron radiography)
Ste* = 0.40 (Numerical result)
Ste* = 0.55 (Numerical result)
Ste = 0.86 (Numerical result)
0 0.4 0.8 1.2 1.6 2Fo
0
0.4
0.8
Mol
ten
Fra
ctio
n
Mushy zone constantC = 106
C = 108
C = 1010
0 200 400 600
Time (s)
Fig. 12. Comparison of variation of mushy constant on molten fraction.
0 0.5 1 1.5 2 2.5
Fo
0
0.4
0.8
Mol
ten
Fra
ctio
n
Convergence CriteriaContinuity and Velocity - 10-3 Energy - 10-6
Continuity and Velocity - 10-5 Energy - 10-8
0 200 400 600 800Time (s)
Fig. 11. Influence of the convergence criterion on the molten fraction distribution.
L. Kumar et al. / International Journal of Thermal Sciences xxx (2012) 1e1310
rDhDt
¼ kV2T (7)
S!
is the momentum source term, h is the specific enthalpy. Specificenthalpy is defined as a sum of the sensible enthalpy�href þ
Z T
TefCpdT
�and the enthalpy change due to the phase
change (ghsf). href is the reference enthalpy at the referencetemperature Tref, hsf is the specific enthalpy of melting (latent heatof thematerial) and g is the liquid fraction during the phase change.Liquid fraction can be defined as follows:
g ¼ 0 if T < Tmg ¼ 1 if T>Tm0 < g < 1 if T ¼ Tm
(8)
For the assumed liquid fraction (g), Temperature (T) is calcu-lated. Temperature is used to update specific enthalpy whichfurther updates liquid fraction.
The source term S!
in the momentum equation, Equation (6), isgiven by S
! ¼ �AðgÞV! where A(g) is the ‘‘porosity function”defined by Brent et al. [25]. Definition of A(g) makes themomentum equation ‘‘mimic” CarmaneKozeny equations for flowin porous media
AðgÞ ¼ Cð1� gÞ2g3 þ 3
(9)
where 3¼ 0.001 is a small computational constant used to avoiddivision by zero, and C is a mushy zone constant. The grid was built
Table 2Input provided for simulation in FLUENT.
Models Model e Melting and solidification model withmushy zone constant of 108
Solver Unsteady timeFirst order implicit schemePressure based solver
Material Lead e value of properties are given in Table 1Solution Controls Pressure e Standard
Momentum e Second order upwindEnergy e First order upwind
Monitors Residuals Continuity e 10�3
Velocity e 10�3
Energy e 10�6
Iteration Time steps e 0.005 sResolution Dx ¼ 1 mm
Dy ¼ 1 mmGrid ¼ 60 � 45
Please cite this article in press as: L. Kumar, et al., Experimental investigatcondition using thermal neutron radiography, International Joj.ijthermalsci.2012.06.014
using the Gambit software. The numerical solution is obtainedusing the FLUENT. The boundary conditions for the momentumequation are no-slip and no-penetration at all solid boundaries. Inthe neutron radiography experiment, there is a temperaturegradient between the heated wall and opposite wall of the testsection. To simulate this temperature gradient in the numericalanalysis, simple steady state conduction is carried out with 327 �Cat the heated wall and lower temperature at the other end (valuefrom the neutron radiography experiment). This generatesa temperature gradient between the heated wall and oppositewall as in real experiment. This solution acts as the initialboundary condition for the subsequent numerical analysisinvolving melting. Three sides are insulated. Constant heat fluxboundary condition is applied on vertical heating wall. The cor-responding heat flux for Stefan numbers of 0.42, 0.58 and 0.9 is16.3 kW/m2, 22.7 kW/m2 and 35.1 kW/m2. Grid independencycheck is carried out with grid size of 0.5 mm � 0.5 mm and1 mm � 1 mm. Fig. 10 shows that the variation of molten fractionwith time is independent of grid size. For parametric study, a gridsize of 1 mm � 1 mm is used. Independence of the convergencecriterion on the variation of molten fraction with time is shown inFig. 11. For the parametric study, a convergence criterion of 10�3
for the velocity components and continuity and a convergence
0 1 2 3 4Fo
0
0.4
0.8
Mol
ten
Fra
ctio
n
* *
0 400 800 1200Time (s)
Fig. 13. Comparison of transient distribution of molten fraction obtained by experi-mental and numerical approach.
ions on melting of lead in a cuboid with constant heat flux boundaryurnal of Thermal Sciences (2012), http://dx.doi.org/10.1016/
L. Kumar et al. / International Journal of Thermal Sciences xxx (2012) 1e13 11
criterion of 10�6 for energy is used. Other inputs in the modelingare shown in Table 2. A typical simulation of complete meltingwould take around 24e28 h.
Shmueli et al. [23] adopted the mushy zone constant as 108 fornumerical results for melting of rubitherm RT27 in a verticalcylinder. In the present investigation, mushy zone constants of 106,108 and 1010 are explored. Molten fraction variation with time isindependent for different mushy constants as shown in Fig. 12. Thisis due to sharp melting point (327 �C) of lead.
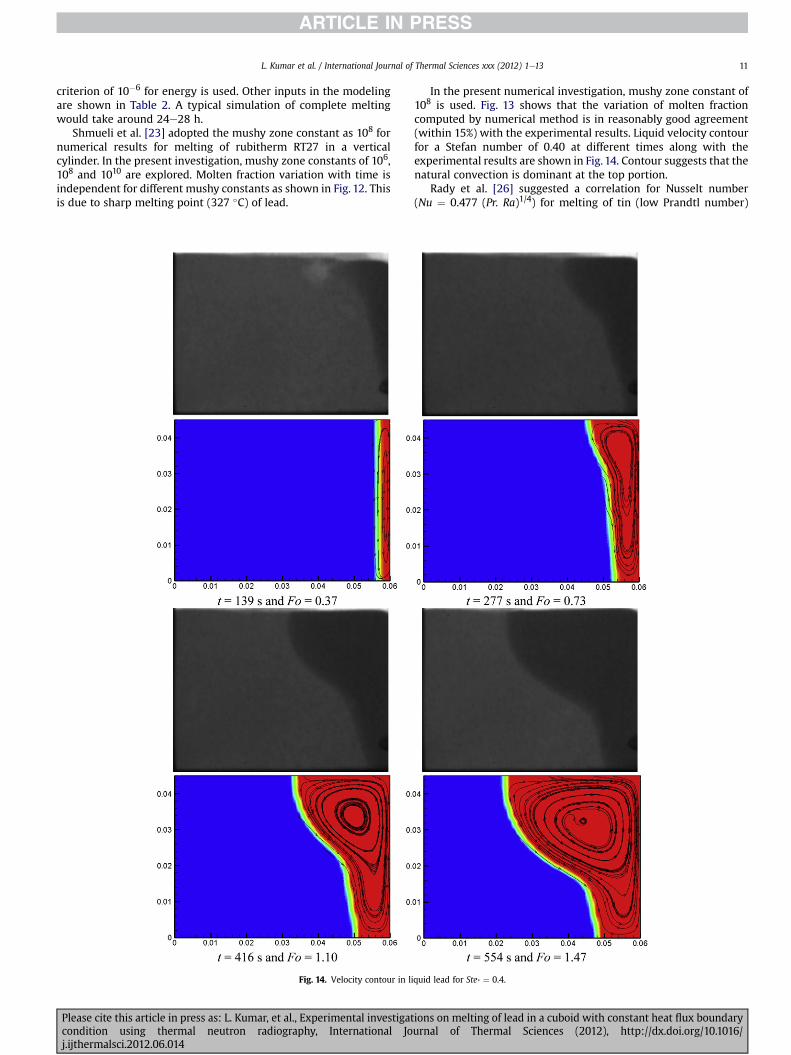
Fig. 14. Velocity contour in li
Please cite this article in press as: L. Kumar, et al., Experimental investigatcondition using thermal neutron radiography, International Joj.ijthermalsci.2012.06.014
In the present numerical investigation, mushy zone constant of108 is used. Fig. 13 shows that the variation of molten fractioncomputed by numerical method is in reasonably good agreement(within 15%) with the experimental results. Liquid velocity contourfor a Stefan number of 0.40 at different times along with theexperimental results are shown in Fig. 14. Contour suggests that thenatural convection is dominant at the top portion.
Rady et al. [26] suggested a correlation for Nusselt number(Nu ¼ 0.477 (Pr. Ra)1/4) for melting of tin (low Prandtl number)
quid lead for Ste* ¼ 0.4.
ions on melting of lead in a cuboid with constant heat flux boundaryurnal of Thermal Sciences (2012), http://dx.doi.org/10.1016/

Fig. 14. (continued).
L. Kumar et al. / International Journal of Thermal Sciences xxx (2012) 1e1312
under constant wall temperature boundary condition in a squarecavity under steady state conditions. Zhang and Bejan [27] sug-gested a correlation of Nu ¼ 0.491 (Ra*)1/5 under constant heat fluxboundary condition for melting of n-octadecane (high Prandtlnumber) in a rectangular enclosure. Fig. 15 shows the variation ofNu/(Pr. Ra*)1/5 with dimensionless time (q) for the present studyobtained from numerical results.
For the conduction and convection dominated region(q < 0.5 ¼ q1), (Nu/(Pr. Ra*)1/5) is decreasing with increase of q. Thiscan be suggested by the scale analysis also (In line with Jany andBejan [28], differ in case of low Prandtl number and heating atconstant heat flux boundary condition).
Please cite this article in press as: L. Kumar, et al., Experimental investigatcondition using thermal neutron radiography, International Joj.ijthermalsci.2012.06.014
Nuwq�1 þ q4Ra*Pr (10)
The constants of this equation are computed using numericalresults.
Nu ¼ 2:67q�1 þ 0:1q4ðRa*PrÞ for�q < 0:5 ¼ q1
�(11)
For convection dominated region, (q1 < q < q2 ¼ 1.2), (Nu/(Pr.Ra*)1/5) is constant with increase of q. From scale analysis forconvection dominated region, average Nusselt number is:
NuwðRa*PrÞ1=5 (12)
ions on melting of lead in a cuboid with constant heat flux boundaryurnal of Thermal Sciences (2012), http://dx.doi.org/10.1016/

Fig. 15. Variation of Nu/(Pr.Ra*)1/5 with dimensionless time (q) for different Stefannumbers.
L. Kumar et al. / International Journal of Thermal Sciences xxx (2012) 1e13 13
The constant of this equation is computed using numericalresults.
Nu ¼ 2:17ðRa*PrÞ0:2 for ðq1 < q < q2 ¼ 1:2Þ (13)
For the solid e shrinkage region, (Nu/(Pr. Ra*)1/5) decreases withincrease of q (q2 < q < q3 ¼ 1.9). Nusselt number in the early solidshrinkage regime is given by
Nuw�1� 0:46ðRa*PrÞ1=5ðq� q2Þ
�4=5(14)
The constants of this equation are computed using numericalresults.
Nu ¼ 6:28h1�0:46ðRa*PrÞ0:2ðq�q2Þ
i23 for ðq2< q< q3 ¼ 1:9Þ
(15)
4. Conclusions
Solideliquid interface during the melting of lead (opaquematerial) is captured using neutron radiography of flux of106 neutrons/cm2 s (Facility at beamline E12 in CIRUS reactor inBARC). Lead is contained in a 1 mm thick stainless steel cuboid ofsize of50mm� 50mm� 60mm. Side vertical wall is maintained ata constant heat flux boundary condition. All other walls are ther-mally insulated. Neutron radiography is able to capture thedynamic progress of solideliquid interface. Solideliquid interface isreported for three Stefan numbers namely 0.40, 0.55 and 0.86.These experimental results would serve as benchmark data formelting of lead. Enthalpyeporosity method in FLUENT is used forthe calculation of molten fraction variation with time. Moltenfraction and solideliquid interface is almost independent of mushyconstant for melting of lead. Molten fraction predicted fromnumerical results is in reasonably good agreement with that ofexperimental results. A correlation is derived for Nusselt numberusing scale analysis and numerical results.
Please cite this article in press as: L. Kumar, et al., Experimental investigatcondition using thermal neutron radiography, International Joj.ijthermalsci.2012.06.014
References
[1] Safety Requirements No. TS-R-1, Regulations for the Safe Transport ofRadioactive Material, IAEA Safety Standards, 2005, pp. 107.
[2] R. Viskanta, Heat transfer during melting and solidification of metals, J. HeatTransfer 110 (1988) 1205e1219.
[3] C. Gau, R. Viskanta, Melting and solidification of a pure metal on a verticalwall, J. Heat Transfer 108 (1986) 74e181.
[4] C. Gau, R. Viskanta, Melting and solidification of a metal system in a rectan-gular cavity, Int. J. Heat Mass Transfer 27 (1) (1984) 113e123.
[5] F. Wolff, R. Viskanta, Melting of a pure metal from a vertical wall, Exp. HeatTransfer 1 (1987) 17e30.
[6] F. Wolff, R. Viskanta, Solidification of a pure metal at a vertical wall in thepresence of liquid superheat, Int. J. Heat Mass Transfer 31 (8) (1988)1735e1744.
[7] X. Wang, Y. Fautrelle, An investigation of the influence of natural convectionon tin solidification using a quasi two-dimensional experimental benchmark,Int. J. Heat Mass Transfer 52 (2009) 5624e5633.
[8] J. Szekely, P.S. Chhabra, The effect of natural convection on the shape andmovement of the melt-solid interface in the controlled solidification of lead,Metal. Trans. 1 (1970) 1195e1203.
[9] J.P. Garandet, C. Salvi, Identification of furnace thermal characteristics fromresistance measurements, Int. J. Heat Mass Transfer 45 (2002) 1045e1054.
[10] H. Zhang, M. Charmchi, D. Veilluex, M. Faghri, Numerical and experimentalinvestigation of melting in the presence of a magnetic field: simulation oflow-gravity environment, J. Heat Transfer 129 (2007) 568e576.
[11] H. Yin, J.N. Koster, Radioscopic visualisation of melting, alloying and solidifi-cation of pure Al and AleCu, J. Alloys Compd 352 (2003) 175e189.
[12] M. Hytros, I. Jureidini, D. Kim, J.H. Chun, R. Lanza, N. Saka, High-energy X-raycomputed tomography of the progression of the solidification front in purealuminium, Metal. Mater. Trans. A 30 (1999) 1403e1410.
[13] H. Yin, J.N. Koster, Double-diffusive convective flow and interfacemorphology during transient Ga-5% in alloy melting, J. Cryst. Growth 217(2000) 170e182.
[14] R. Derebail, J.N. Koster, Visualisation study of melting and solidification inconvecting hypoeutectic GaeIn alloy, Int. J. Heat Mass Transfer 41 (16) (1998)2537e2548.
[15] T.A. Campbell, J.N. Koster, Visualisation of liquid/solid interface morphologiesin gallium subject to natural convection, J. Cryst. Growth 140 (1994) 414e425.
[16] J.H. Chun, R. Lanza, N. Saka, M. Hytros, Online monitoring of the solidificationfront in metal casting, Ann. CIRP 44 (1995) 181e184.
[17] P.G. Barber, R.K. Crouch, A.L. Fripp, W.J. Debnam, R.F. Berry, R. Simchick,A procedure to visualise the melt-solid interface in Bridgman grown germa-nium and lead tin telluride, J. Cryst. Growth 74 (1986) 228e230.
[18] H. Berger, Neutron Radiography, Elsevier Publishing Co., NewYork, 1965.[19] H. Reijonen, J. Forsten, Neutron radiography of solidifying SneCd alloys,
Metal. Trans. 2 (1971) 1921e1924.[20] N. Takenaka, T. Fujii, A. Ono, Y. Motomur, A. Turun, Flow visualisation of liquid
metals by neutron radiography, Fusion Eng. Des. 27 (1995) 607e613.[21] A. Kahle, B. Winkle, B. Hennion, P. Boutrouille, High-temperature furnace for
dynamic neutron radiography, Rev. Sci. Instrum. 74 (8) (2003) 3717e3721.[22] E. Assis, L. Katsman, G. Ziskind, R. Letan, Numerical and experimental study of
melting in a spherical shell, Int. J. Heat Mass Transfer 50 (2007) 1790e1804.[23] H. Shmueli, G. Ziskind, R. Letan, Melting in a vertical cylindrical tube:
numerical investigation and comparison with experiments, Int. J. Heat MassTransfer 53 (2010) 4082e4091.
[24] M. Pinelli, S. Piva, Solid/liquid phase change in presence of natural convec-tion: a thermal energy storage case study, J. Energy Res. Tech. 125 (2003)190e198.
[25] A.D. Brent, V.R. Voller, K.J. Reid, Enthalpyeporosity technique for modelingconvectionediffusion phase change: application to the melting of a puremetal, Num. Heat Transfer 13 (1988) 297e318.
[26] M.A. Rady, V.V. Satyamurty, A.K. Mohanty, Effects of liquid superheat duringsolidification of pure metals in a square cavity, Heat Mass Transfer 32 (1997)499e509.
[27] Z. Zhang, A. Bejan, Melting in an enclosure heated at constant rate, Int. J. HeatMass Transfer 13 (6) (1988) 1063e1071.
[28] P. Jany, A. Bejan, Scaling theory of melting with natural convection in anenclosure, Int. J. Heat Mass Transfer 31 (6) (1988) 1221e1235.
ions on melting of lead in a cuboid with constant heat flux boundaryurnal of Thermal Sciences (2012), http://dx.doi.org/10.1016/