Predicting Mass Transfer in Liquid–Liquid Extraction Columns
Fluid Phase Equilibria 201 (2002) 359–379
Experimental data and theoretical considerations onvapor–liquid and liquid–liquid equilibria of
hyperbranched polyglycerol and PVA solutions
M. Seilera,∗, W. Arlt a, H. Kautzb, H. Freyb
a Technical University of Berlin, Institut fuer Verfahrenstechnik, Fachgebiet Thermodynamik und ThermischeVerfahrenstechnik, Sekr. TK 7, Str. des 17 Juni 135, D-10623 Berlin, Germany
b Institut fuer Makromolekulare Chemie und Freiburger Materialforschungszentrum FMF,Stefan-Meier-Str. 21/31, D-79104 Freiburg, Germany
Received 22 January 2002; accepted 26 March 2002
Abstract
Hyperbranched polyglycerol (PG) samples of different molecular weight were synthesized by ring-openingpolymerization. Vapor–liquid equilibria (VLE) and liquid–liquid equilibria (LLE) of PG solutions were mea-sured in order to evaluate the potential of hyperbranched polymers for process engineering applications suchas extractive distillation and solvent extraction. The VLE experiments focused on the polyglycerol–ethanol–watersystem, which was contrasted with VLE results for the systems poly(vinyl alcohol) (PVA)–ethanol–water andethanediol–ethanol–water in order to discuss the impact of polymer branching, functional groups, molecularweight and selective interactions on the phase behavior of the azeotropic ethanol–water mixture. Furthermore,weight activity coefficients and Flory-Huggins parameters for PG in ethanol and in water were determined.For the system acetylated PG–tetrahydrofuran (THF)–water LLE results were reported and distribution coef-ficients as well as selectivities were discussed. For the analyzed polymer solutions, the extent of inter- andintramolecular hydrogen bond formation is the dominating impact factor on solvent activity and therefore de-termines partition coefficients and separation factors. Due to their remarkable solution properties, hyperbranched
Abbreviations: VLE, vapor–liquid equilibrium; LLE, liquid–liquid equilibrium; DB, degree of branching; UCST, uppercritical solution temperature; LCST, lower critical solution temperature; HSGC, headspace–gas chromatography; GC, gas chro-matograph; EPC, electronic pneumatics control; SEC, size exclusion chromatography; NMR, nuclear magnetic resonance; VPO,vapor pressure osmometry; EOS, equation of state; MALDI-TOF, matrix assisted laser desorption ionization time of flight; PVA,poly(vinyl alcohol); THF, tetrahydrofuran; DMF, dimethylformamide; PG, hyperbranched polyglycerol; ED, 1,2-ethanediol;wt.%, weight percent, mass percent
∗ Corresponding author. Tel.:+49-30-31422646; fax:+49-30-31422406.E-mail address:[email protected] (M. Seiler).
0378-3812/02/$ – see front matter © 2002 Elsevier Science B.V. All rights reserved.PII: S0378-3812(02)00082-1
360 M. Seiler et al. / Fluid Phase Equilibria 201 (2002) 359–379
polymers, such as PG can be used for the separation of azeotropic mixtures in the field of process engineering.© 2002 Elsevier Science B.V. All rights reserved.
Keywords:Hyperbranched polymers; Extractive distillation; Solvent extraction; Vapor–liquid equilibria; Liquid–liquidequilibria; Azeotropic mixtures
1. Introduction
Due to their unique structures, highly branched, three-dimensional polymers such as dendrimers[1]or hyperbranched polymers[2] attract increasing attention. Dendrimers are perfectly branched macro-molecules, with a degree of branching (DB) of 1.0, which are only accessible by time-consumingmulti-step syntheses. An economically interesting alternative are the randomly branched hyperbranchedpolymers, which can easily be produced on large scale by a one-pot polymerization of appropriate AB2
monomers[3]. Only recently, a method for the controlled synthesis of hyperbranched polymers was intro-duced (theoretical work:[4,5]; experimental work:[6,7]), giving access to well-defined polymer materialswith low polydispersities. During the past 10 years numerous interdisciplinary research projects on suchpolymers have been started and a wide variety of applications has been proposed[8–11]. Most of thepotential applications are based on the remarkable thermal, mechanical or solution properties of hyper-branched polymers, which can be tailored via the number (∼molar mass) and the nature of the functionalgroups. At the technical university (TU) of Berlin a widely accepted equation of state (EOS) has beenrecently developed[32]. One aim of the research work at the TU of Berlin is to test, if the entropicterm in this EOS reflects well the backbone structure of highly ordered polymers and if enthalpic effectssuch as the inter- and intramolecular hydrogen bond formation between highly branched polymers andcomponents of aqueous (azeotropic) systems are adequately taken into account.
Phase separation often occurs during the production and processing of polymers, which can be the resultof undesired incompatibility between polymers or insufficient solvent power. A detailed understandingof the phase behavior is therefore an essential prerequisite for polymer science and engineering. It isnoteworthy that—although the experimental characterization of the miscibility behavior of hyperbranchedpolymers is an important requirement for the successful development of applications—the understandingof the phase behavior of hyperbranched polymer solutions is still in its infancy.
An area of substantial industrial interest, where hyperbranched polymers could be applied, is the fieldof thermal process engineering, an area which has remained unconsidered in scientific discussions to date.Since the polarity of hyperbranched macromolecules can be adjusted by controlled functionalization ofthe end groups, selective solvents—consisting of either pure hyperbranched polymers or fractions of hy-perbranched additives—can be tailored. Therefore, processes such as extractive distillation, liquid–liquidextraction, absorption, and emulsion liquid membranes represent promising fields of application[8,12,13].
In general, water-soluble polymers are used in a variety of industrial applications. They are applied inthe field of petroleum extraction, metallurgy, pharmacology, the paper and coating industries as well asin biotechnology[22].
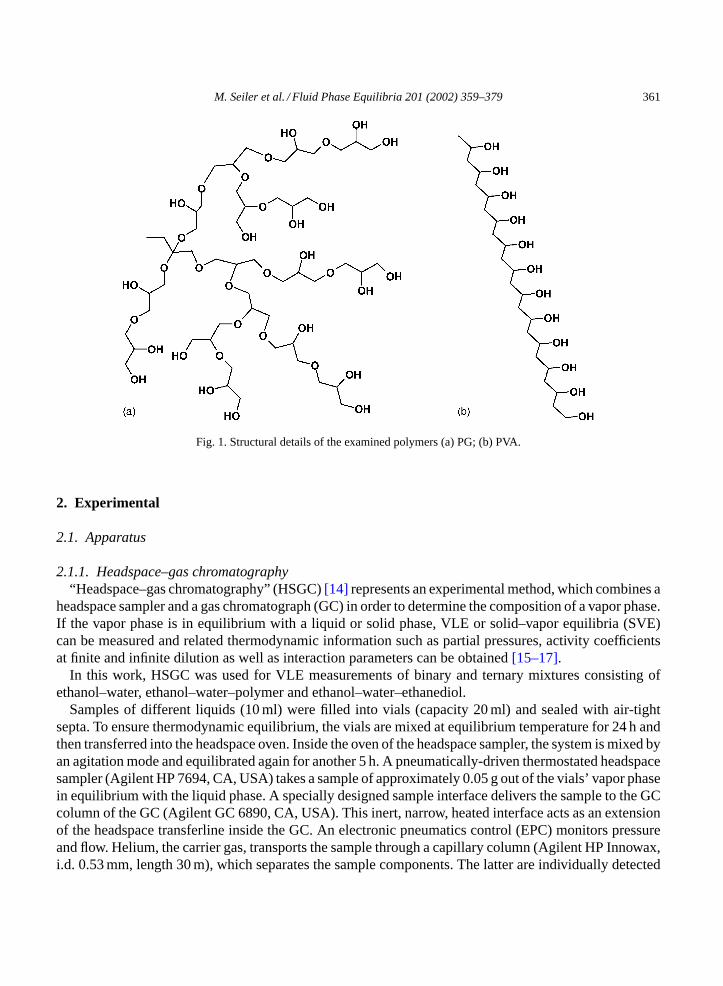
This paper focuses on vapor–liquid equilibria (VLE) and liquid–liquid equilibria (LLE) of binaryand ternary hyperbranched polyglycerol (PG) solutions. We aim to elucidate the impact of polymerbranching on the phase behavior of selected systems and to evaluate the potential of PGs (Fig. 1) asentrainers/selective solvents for extractive distillation and solvent extraction.
M. Seiler et al. / Fluid Phase Equilibria 201 (2002) 359–379 361
Fig. 1. Structural details of the examined polymers (a) PG; (b) PVA.
2. Experimental
2.1. Apparatus
2.1.1. Headspace–gas chromatography“Headspace–gas chromatography” (HSGC)[14] represents an experimental method, which combines a
headspace sampler and a gas chromatograph (GC) in order to determine the composition of a vapor phase.If the vapor phase is in equilibrium with a liquid or solid phase, VLE or solid–vapor equilibria (SVE)can be measured and related thermodynamic information such as partial pressures, activity coefficientsat finite and infinite dilution as well as interaction parameters can be obtained[15–17].
In this work, HSGC was used for VLE measurements of binary and ternary mixtures consisting ofethanol–water, ethanol–water–polymer and ethanol–water–ethanediol.
Samples of different liquids (10 ml) were filled into vials (capacity 20 ml) and sealed with air-tightsepta. To ensure thermodynamic equilibrium, the vials are mixed at equilibrium temperature for 24 h andthen transferred into the headspace oven. Inside the oven of the headspace sampler, the system is mixed byan agitation mode and equilibrated again for another 5 h. A pneumatically-driven thermostated headspacesampler (Agilent HP 7694, CA, USA) takes a sample of approximately 0.05 g out of the vials’ vapor phasein equilibrium with the liquid phase. A specially designed sample interface delivers the sample to the GCcolumn of the GC (Agilent GC 6890, CA, USA). This inert, narrow, heated interface acts as an extensionof the headspace transferline inside the GC. An electronic pneumatics control (EPC) monitors pressureand flow. Helium, the carrier gas, transports the sample through a capillary column (Agilent HP Innowax,i.d. 0.53 mm, length 30 m), which separates the sample components. The latter are individually detected
362 M. Seiler et al. / Fluid Phase Equilibria 201 (2002) 359–379
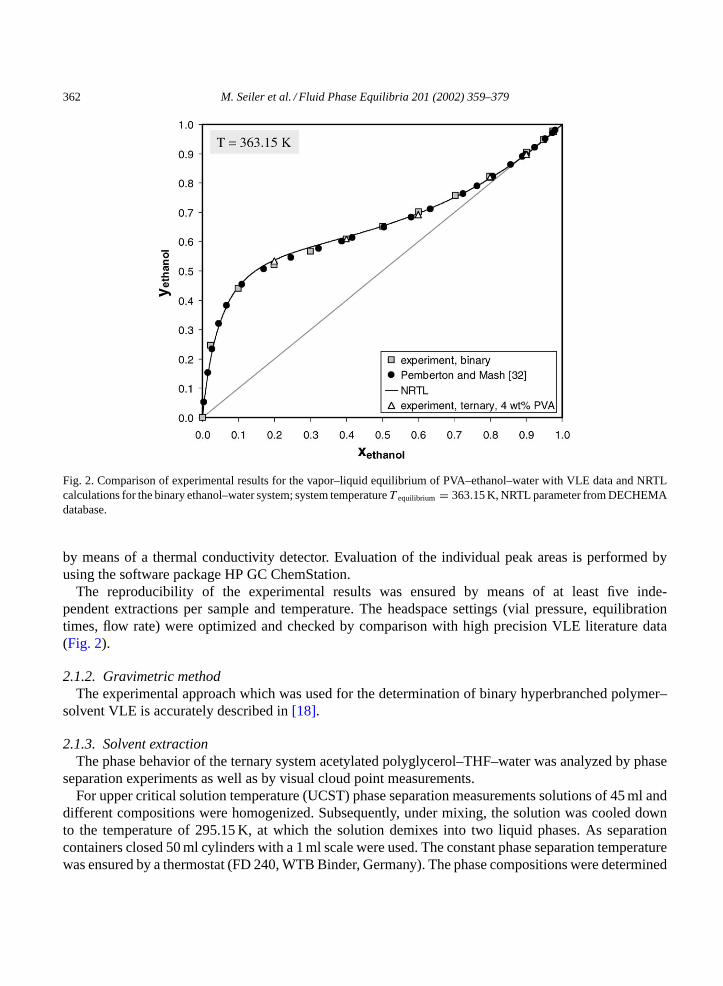
Fig. 2. Comparison of experimental results for the vapor–liquid equilibrium of PVA–ethanol–water with VLE data and NRTLcalculations for the binary ethanol–water system; system temperatureT equilibrium = 363.15 K, NRTL parameter from DECHEMAdatabase.
by means of a thermal conductivity detector. Evaluation of the individual peak areas is performed byusing the software package HP GC ChemStation.
The reproducibility of the experimental results was ensured by means of at least five inde-pendent extractions per sample and temperature. The headspace settings (vial pressure, equilibrationtimes, flow rate) were optimized and checked by comparison with high precision VLE literature data(Fig. 2).
2.1.2. Gravimetric methodThe experimental approach which was used for the determination of binary hyperbranched polymer–
solvent VLE is accurately described in[18].
2.1.3. Solvent extractionThe phase behavior of the ternary system acetylated polyglycerol–THF–water was analyzed by phase
separation experiments as well as by visual cloud point measurements.For upper critical solution temperature (UCST) phase separation measurements solutions of 45 ml and
different compositions were homogenized. Subsequently, under mixing, the solution was cooled downto the temperature of 295.15 K, at which the solution demixes into two liquid phases. As separationcontainers closed 50 ml cylinders with a 1 ml scale were used. The constant phase separation temperaturewas ensured by a thermostat (FD 240, WTB Binder, Germany). The phase compositions were determined

M. Seiler et al. / Fluid Phase Equilibria 201 (2002) 359–379 363
Table 1Synthesized PG samples
Sample Molar massMn (g/mol)b,c Number of hydroxyl groupsper macromoleculec
Mw/Mna DBb
PG1 1400 20 1.5 0.52PG2 4000 53 2.1 0.56PG3 6000 80 2.4 0.62PG4 6500 – 2.1 0.56
a Determined by SEC.b Calculated from13C-NMR spectra.c Calculated from1H-NMR spectra.
by taking samples of 20 ml out of each phase. The polymer concentration of a sample was obtained byflushing off the solvent and weighing the difference in mass of the sample flask. Subsequently, theevaporated solvent mixture was condensed and injected into the GC for determination of the respectivesolvent concentration.
2.2. Materials
2.2.1. Hyperbranched polymersPG was prepared following the procedure published recently[19,20], i.e. slow addition of glycidol
to a solution containing a partially deprotonated polyol-core at 120C. The hyperbranched polyglycerolsamples PG1–PG3, as listed inTable 1, were obtained.
Acetylated polyglycerol (sample PG4): 300 ml of acetic acid anhydride were added to 50 g of PG2,degassed and heated to reflux over night. Removal of excess anhydride and acetic acid by distillationand azeotropic drying with toluene resulted in a slightly colored viscous liquid (yield= 99%). FT-IRanalysis proved complete conversion of the hydroxyl groups.
2.2.2. Polymer characterizationComplete characterization of the polymer samples was carried out: size exclusion chromatography
(SEC) as well as vapor pressure osmometry (VPO) was used for the determination of the molar massdistribution.1H-NMR and13C-NMR were applied for the confirmation of molar masses and calculationof the degrees of branching DB (13C-NMR). Matrix assisted laser desorption ionization time of flight(MALDI-TOF) mass spectrometry evidenced complete incorporation of the core molecule, supported bysubdistribution-free spectra[21].
SEC measurements were performed with a Knauer microgel set C11, using dimethylformamide (DMF)as an eluent at 45C and a polymer laboratories evaporative mass detector EMD 960 operating at 110C.Poly(propylene oxides) 1.000, 2.000, 4.000 (Aldrich), 8.000, 12.000 (ARCO Chemical Co.) were used forcalibration.1H-NMR and13C-NMR spectra were recorded on a Bruker ARX 300 spectrometer, operatingat 300 and 75.4 MHz, respectively. MALDI-TOF measurements were performed with a Bruker Reflex IIMALDI-TOF mass spectrometer, equipped with a nitrogen laser delivering 3 ns laser pulses at 337 nm.-Cyano hydroxy cinnamic acid was used as matrix. FT-IR spectra were recorded on a Bruker IFS88FT-IR spectrometer on KBr.
364 M. Seiler et al. / Fluid Phase Equilibria 201 (2002) 359–379
2.2.3. Other materialsVLE measurements for the system poly(vinyl alcohol) (PVA)–ethanol–water were carried out, us-
ing a PVA sample of comparable molar mass to the synthesized PG samples. PVA was obtained fromPolysciences (Warrington, USA) with a molar mass ofMw = 6000 g/mol and 80 mol% hydrolyzedOH-groups.
The solvents ethanol, tetrahydrofuran (THF) and 1,2-ethanediol (ED) were provided from Merck(Germany) with a purity >99.8 mol%. Distilled water was degassed and repeatedly filtered using 0.02mMillipore filter in order to remove dust.
3. Results, theoretical considerations and discussion
3.1. Vapor–liquid equilibria
In order to discuss the impact of the polymer structure and the number of functional groups withina polymer on the phase behavior of selected systems, the following results will contrast water-solublepolymers with a different DB: PGs and PVA (Fig. 1). The latter polymer can be roughly considered to bea linear analog with respect to PG.
The profitability of applications for water-soluble polymers (seeSection 1) often depends on thephysical and chemical properties of the polymer, i.e. on the extent and kind of intermolecular interactions.Solubilities, selectivities, loading capacities, boiling and melting points of many organic compounds canbe explained by analyzing the major kinds of attractive intermolecular forces: the dipole–dipole forces ofpolar molecules, the London dispersion forces of nonpolar molecules showing temporary dipole moments,and the hydrogen bonding.
For the following aqueous polymer solutions, the extent of inter- and intramolecular hydrogen bond for-mation is the dominating impact factor on solvent activity and therefore determines partition coefficientsand separation factors.
In order to take the effects of intermolecular interaction and polymer structure adequately into ac-count, special attention is paid to reported molecular dynamics studies of the system PVA–water andPVA–water–ethanol, respectively. These studies provide useful microscopic information with regard tothe discussion of the system PG–ethanol–water.
3.1.1. Polymer–ethanol–water
3.1.1.1. PVA–ethanol–water.In Fig. 2 experimental results for the system PVA–ethanol–water arecontrasted with literature data and NRTL-calculation for the binary system, ethanol–water.
In order to understand the determining factors for the phase behavior of this and the following systems,the interactions between the individual components have to be analyzed.
Interpretation and conclusions from reported molecular dynamics simulation for a detailed under-standing of the underlying thermodynamic phenomena. Tamai et al.[23] as well as Müller-Plathe andvan Gunsteren[24] studied the solvation of PVA in water and in ethanol–water mixtures extensively bymeans of molecular dynamics simulation.
The simulations of Tamai et al. focus on a PVA chain surrounded by 215 water molecules.Under the pressure of 0.1 MPa the simulations are performed for the temperature range between 200
M. Seiler et al. / Fluid Phase Equilibria 201 (2002) 359–379 365
and 400 K. For the PVA molecule the degree of polymerization amounts to 21. The number of wa-ter molecules around the hydrophobic parts of PVA (region 2) decreases with temperature, while thenumber of water molecules in the bulk region (region 3, outside the regions around the hydrophilicPVA parts and the hydrophobic PVA parts) increases by approximately the same number. In contrastto the change in number of water molecules for the regions 2 and 3, the water molecules around the−OH-groups of PVA molecules (hydrophilic parts, region 1) remain inside of the hydration shell andhence an almost constant water fraction is the result. Moreover, for region 1, the total number of hy-drogen bonds per water molecule is approximately the same as for pure water. On average, the numberof water molecules for region 1 amounts to 39.9, for region 2 to 31.1 and for region 3 to 144.0 watermolecules[23].
The molecular dynamics simulations of Tamai et al. show, that each−OH-groups of PVA form hydrogenbonds with 1.8 water molecules[23]. The average number of hydrogen bonds between PVA and watermolecules as well as intermolecularily between PVA molecules decreases with rising temperature, sincethe hydrogen bonds are broken at high temperatures due to molecular motions[23]. Since the averagenumber of intermolecular polymer–polymer hydrogen bonds decreases more strongly with temperaturethan the average number of hydrogen bonds between water molecules and the hydrophilic PVA-groups,we conclude that the solubility of PVA in water increases for rising temperatures until the critical solutiontemperature is reached.1
Moreover, it is noteworthy, that—depending on molecular weight, amount of acetate groups withina PVA molecule, composition and temperature of the PVA system—the competition between hydrogenbonding forces, dispersion forces and the combinatorial entropy of mixing leads to different contributionsto the Helmholtz energy of mixing and therefore to different locations of the upper and lower criticalsolution temperature (UCST, LCST). Thus it appears that, for aqueous PVA solutions, also closed-loopbehavior is possible (such as measured by Rehage[25]).
For systems, in which the PVA is dissolved in a mixture of ethanol and water, the formation of hydrogenbonds between PVA molecules and water molecules dominates the microscopic solvation behavior ofPVA as well. This can be concluded from the partial radial distribution functiongAB(R), which describeshow many atoms of type A are on average at a distanceRof an atom of type B[26].
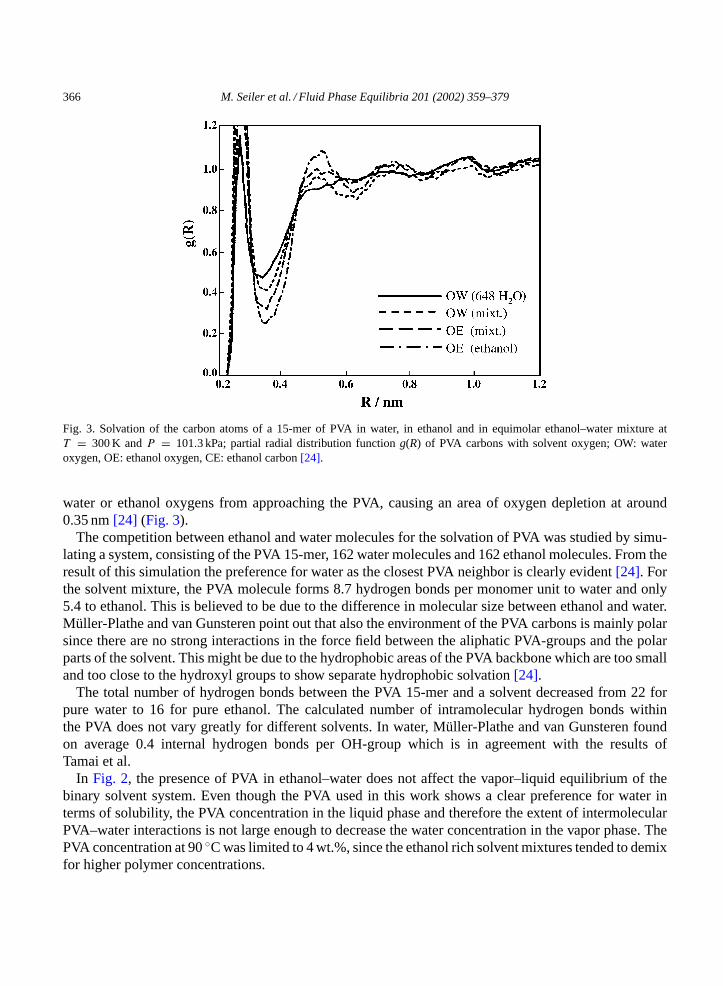
Müller-Plathe and van Gunsteren[24] studied solutions of a 15-mer of PVA in water, in ethanol and inan equimolar mixture of ethanol and water at 300 K and 101.3 kPa. InFig. 3the partial radial distributionfunction of the oxygen atoms of the PVA 15-mer is shown.
For all solvent systems (pure water, pure ethanol, and ethanol–water mixtures) a first peak at around0.3 nm can be observed which indicates hydrogen bonding of the first solvation shell to a solvent oxygenatom[24]. Integration over the first peak inFig. 3permits to conclude that the PVA oxygen possesses onaverage 2.5 water oxygens in its first solvation shell if the solvent is pure water, 1.0 water oxygens and0.7 ethanol oxygens, if the solvent contains equal amounts of water and ethanol, and 1.1 ethanol oxygensfor pure ethanol as solvent[24].
Müller-Plathe and van Gunsteren consider this as a qualitative indication that the hydroxyl groups ofPVA are more efficiently solvated by water than by the bulkier ethanol. But, on the other hand, if anethanol molecule is once hydrogen bonded to an OH-group of PVA, its aliphatic groups prevent further
1 According to Tamai et al. the number of PVA–water hydrogen bonds decreases from 1.8, for the temperature range from 200to 300 K, to 1.7 for 400 K. The number of intermolecular hydrogen bonds between PVA molecules decreases from 0.45, for thetemperature range from 200 to 250 K, to 0.2 for 400 K.
366 M. Seiler et al. / Fluid Phase Equilibria 201 (2002) 359–379
Fig. 3. Solvation of the carbon atoms of a 15-mer of PVA in water, in ethanol and in equimolar ethanol–water mixture atT = 300 K andP = 101.3 kPa; partial radial distribution functiong(R) of PVA carbons with solvent oxygen; OW: wateroxygen, OE: ethanol oxygen, CE: ethanol carbon[24].
water or ethanol oxygens from approaching the PVA, causing an area of oxygen depletion at around0.35 nm[24] (Fig. 3).
The competition between ethanol and water molecules for the solvation of PVA was studied by simu-lating a system, consisting of the PVA 15-mer, 162 water molecules and 162 ethanol molecules. From theresult of this simulation the preference for water as the closest PVA neighbor is clearly evident[24]. Forthe solvent mixture, the PVA molecule forms 8.7 hydrogen bonds per monomer unit to water and only5.4 to ethanol. This is believed to be due to the difference in molecular size between ethanol and water.Müller-Plathe and van Gunsteren point out that also the environment of the PVA carbons is mainly polarsince there are no strong interactions in the force field between the aliphatic PVA-groups and the polarparts of the solvent. This might be due to the hydrophobic areas of the PVA backbone which are too smalland too close to the hydroxyl groups to show separate hydrophobic solvation[24].
The total number of hydrogen bonds between the PVA 15-mer and a solvent decreased from 22 forpure water to 16 for pure ethanol. The calculated number of intramolecular hydrogen bonds withinthe PVA does not vary greatly for different solvents. In water, Müller-Plathe and van Gunsteren foundon average 0.4 internal hydrogen bonds per OH-group which is in agreement with the results ofTamai et al.
In Fig. 2, the presence of PVA in ethanol–water does not affect the vapor–liquid equilibrium of thebinary solvent system. Even though the PVA used in this work shows a clear preference for water interms of solubility, the PVA concentration in the liquid phase and therefore the extent of intermolecularPVA–water interactions is not large enough to decrease the water concentration in the vapor phase. ThePVA concentration at 90C was limited to 4 wt.%, since the ethanol rich solvent mixtures tended to demixfor higher polymer concentrations.
M. Seiler et al. / Fluid Phase Equilibria 201 (2002) 359–379 367
3.1.1.2. Polyglycerol–ethanol–water.The dimensions of polymers in organic solvents depend cruciallyon the sign and magnitude of the interactions between the chain segments and the molecules of the sur-rounding liquid. In “good” solvents, the intra-chain repulsion between the polymer segments as wellas the solvent–solute interaction expand the polymer dimensions, whereas in less favorable solventsa compensation of the attraction and repulsion forces occurs. As observed for many branched macro-molecules, polymer branching decreases the second virial coefficient in good solvents and lowers thetheta temperature for a polymer–solvent system (see for instance[27]).
Recently, Jang et al.[28] proposed a lattice model to describe LLE of dendritic polymer solutionsin consideration of hydrogen bonding, compressibility and highly branched polymer architecture. Fordendritic polymer–polar solvent systems they predicted a hydrogen bond energy, which is much higherbetween solvent molecules than that between the solvent and the functional endgroups of the polymer.Hydrogen bonds between solvent molecules dominate the phase behavior of those systems. As the numberof polymer endgroups increases exponentially with the generation number, the effect of hydrogen bondingbetween the solvent molecules and the functionalities grows2 [28]. At the same time, the molecular weightof the polymer increases with generation number, so that the solubility of a highly branched, hydrophilicpolymer in a polar solvent does not have to be necessarily better. With regard to the PG samples PG1,PG2 and PG3, for both ethanol and water the polymer solubility decreases with increasing molecularweight of the hyperbranched polymer.
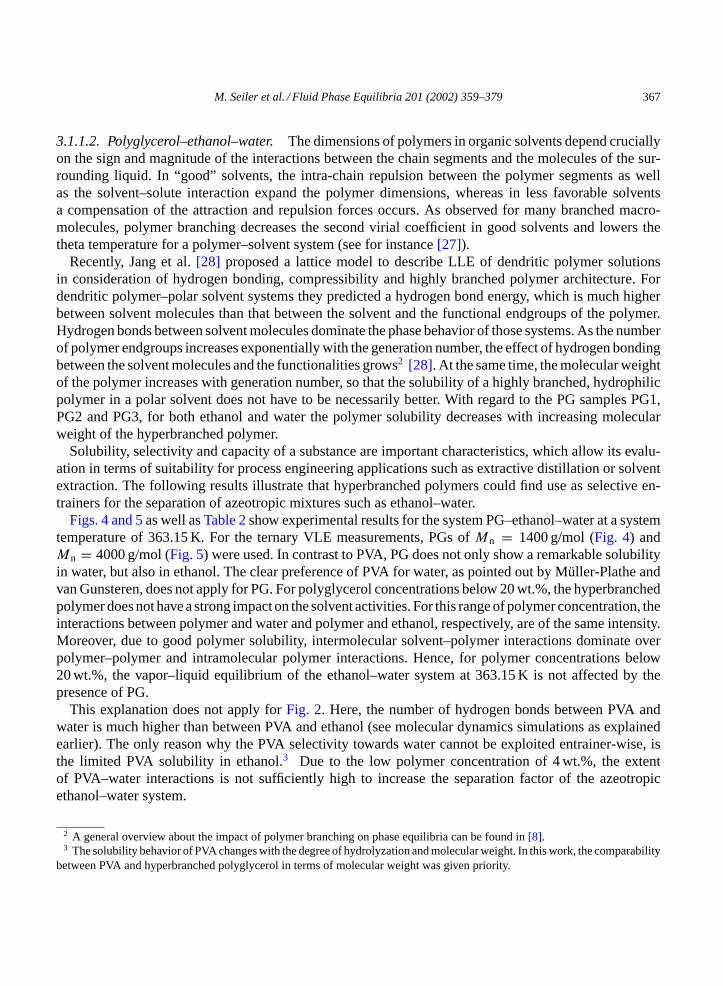
Solubility, selectivity and capacity of a substance are important characteristics, which allow its evalu-ation in terms of suitability for process engineering applications such as extractive distillation or solventextraction. The following results illustrate that hyperbranched polymers could find use as selective en-trainers for the separation of azeotropic mixtures such as ethanol–water.
Figs. 4 and 5as well asTable 2show experimental results for the system PG–ethanol–water at a systemtemperature of 363.15 K. For the ternary VLE measurements, PGs ofMn = 1400 g/mol (Fig. 4) andMn = 4000 g/mol (Fig. 5) were used. In contrast to PVA, PG does not only show a remarkable solubilityin water, but also in ethanol. The clear preference of PVA for water, as pointed out by Müller-Plathe andvan Gunsteren, does not apply for PG. For polyglycerol concentrations below 20 wt.%, the hyperbranchedpolymer does not have a strong impact on the solvent activities. For this range of polymer concentration, theinteractions between polymer and water and polymer and ethanol, respectively, are of the same intensity.Moreover, due to good polymer solubility, intermolecular solvent–polymer interactions dominate overpolymer–polymer and intramolecular polymer interactions. Hence, for polymer concentrations below20 wt.%, the vapor–liquid equilibrium of the ethanol–water system at 363.15 K is not affected by thepresence of PG.
This explanation does not apply forFig. 2. Here, the number of hydrogen bonds between PVA andwater is much higher than between PVA and ethanol (see molecular dynamics simulations as explainedearlier). The only reason why the PVA selectivity towards water cannot be exploited entrainer-wise, isthe limited PVA solubility in ethanol.3 Due to the low polymer concentration of 4 wt.%, the extentof PVA–water interactions is not sufficiently high to increase the separation factor of the azeotropicethanol–water system.
2 A general overview about the impact of polymer branching on phase equilibria can be found in[8].3 The solubility behavior of PVA changes with the degree of hydrolyzation and molecular weight. In this work, the comparability
between PVA and hyperbranched polyglycerol in terms of molecular weight was given priority.
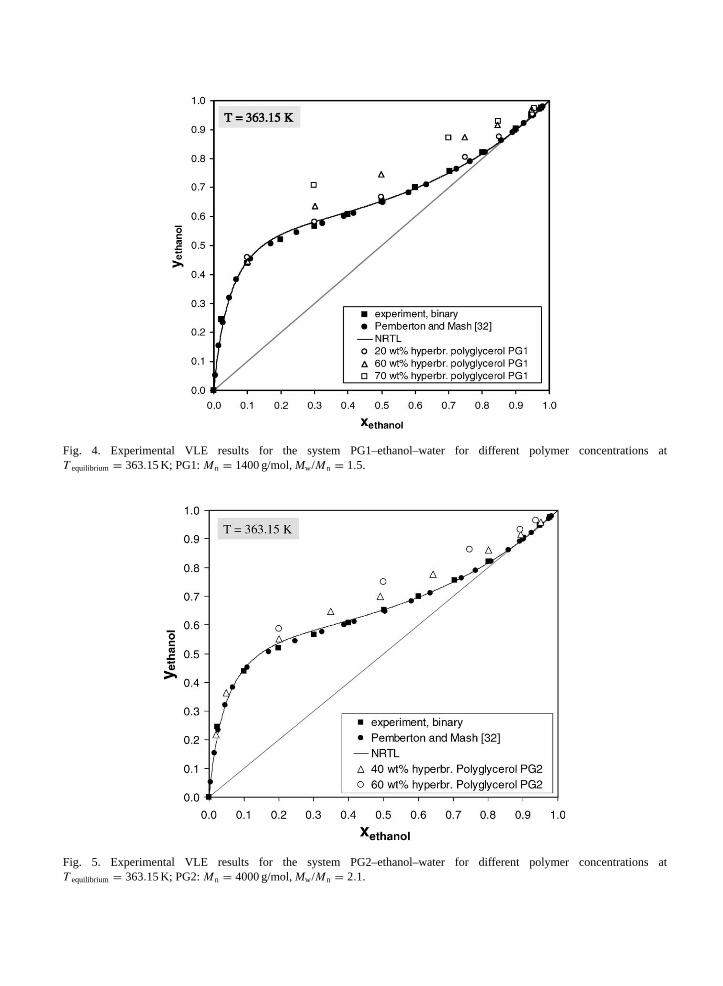
Fig. 4. Experimental VLE results for the system PG1–ethanol–water for different polymer concentrations atT equilibrium = 363.15 K; PG1:Mn = 1400 g/mol,Mw/Mn = 1.5.
Fig. 5. Experimental VLE results for the system PG2–ethanol–water for different polymer concentrations atT equilibrium = 363.15 K; PG2:Mn = 4000 g/mol,Mw/Mn = 2.1.
M. Seiler et al. / Fluid Phase Equilibria 201 (2002) 359–379 369
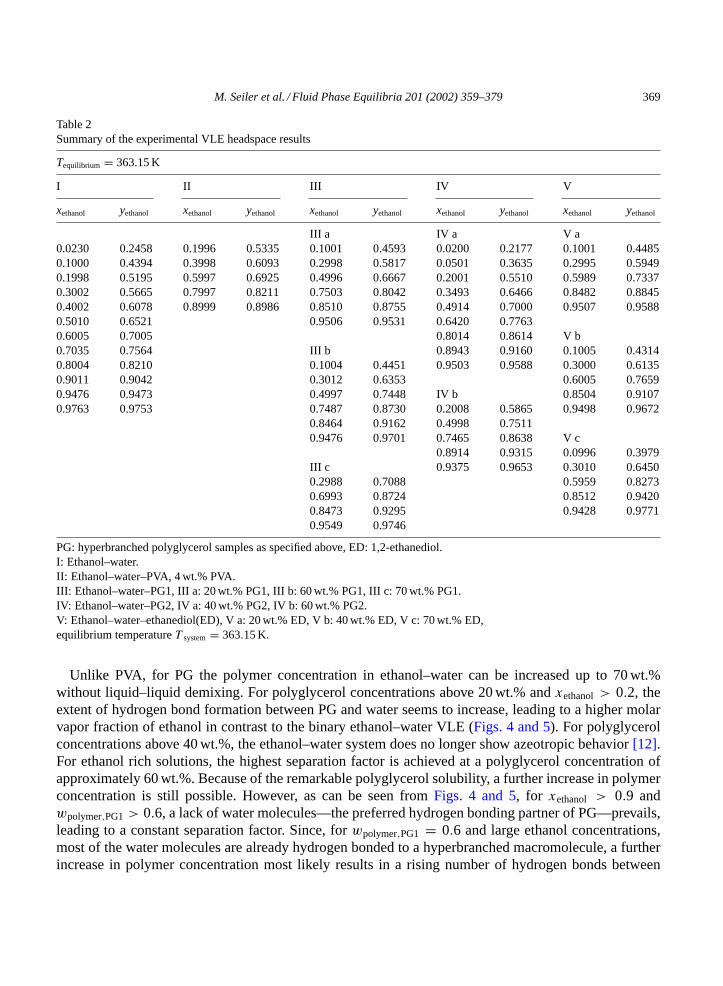
Table 2Summary of the experimental VLE headspace results
Tequilibrium = 363.15 K
I II III IV V
xethanol yethanol xethanol yethanol xethanol yethanol xethanol yethanol xethanol yethanol
III a IV a V a0.0230 0.2458 0.1996 0.5335 0.1001 0.4593 0.0200 0.2177 0.1001 0.44850.1000 0.4394 0.3998 0.6093 0.2998 0.5817 0.0501 0.3635 0.2995 0.59490.1998 0.5195 0.5997 0.6925 0.4996 0.6667 0.2001 0.5510 0.5989 0.73370.3002 0.5665 0.7997 0.8211 0.7503 0.8042 0.3493 0.6466 0.8482 0.88450.4002 0.6078 0.8999 0.8986 0.8510 0.8755 0.4914 0.7000 0.9507 0.95880.5010 0.6521 0.9506 0.9531 0.6420 0.77630.6005 0.7005 0.8014 0.8614 V b0.7035 0.7564 III b 0.8943 0.9160 0.1005 0.43140.8004 0.8210 0.1004 0.4451 0.9503 0.9588 0.3000 0.61350.9011 0.9042 0.3012 0.6353 0.6005 0.76590.9476 0.9473 0.4997 0.7448 IV b 0.8504 0.91070.9763 0.9753 0.7487 0.8730 0.2008 0.5865 0.9498 0.9672
0.8464 0.9162 0.4998 0.75110.9476 0.9701 0.7465 0.8638 V c
0.8914 0.9315 0.0996 0.3979III c 0.9375 0.9653 0.3010 0.64500.2988 0.7088 0.5959 0.82730.6993 0.8724 0.8512 0.94200.8473 0.9295 0.9428 0.97710.9549 0.9746
PG: hyperbranched polyglycerol samples as specified above, ED: 1,2-ethanediol.I: Ethanol–water.II: Ethanol–water–PVA, 4 wt.% PVA.III: Ethanol–water–PG1, III a: 20 wt.% PG1, III b: 60 wt.% PG1, III c: 70 wt.% PG1.IV: Ethanol–water–PG2, IV a: 40 wt.% PG2, IV b: 60 wt.% PG2.V: Ethanol–water–ethanediol(ED), V a: 20 wt.% ED, V b: 40 wt.% ED, V c: 70 wt.% ED,equilibrium temperatureT system= 363.15 K.
Unlike PVA, for PG the polymer concentration in ethanol–water can be increased up to 70 wt.%without liquid–liquid demixing. For polyglycerol concentrations above 20 wt.% andxethanol > 0.2, theextent of hydrogen bond formation between PG and water seems to increase, leading to a higher molarvapor fraction of ethanol in contrast to the binary ethanol–water VLE (Figs. 4 and 5). For polyglycerolconcentrations above 40 wt.%, the ethanol–water system does no longer show azeotropic behavior[12].For ethanol rich solutions, the highest separation factor is achieved at a polyglycerol concentration ofapproximately 60 wt.%. Because of the remarkable polyglycerol solubility, a further increase in polymerconcentration is still possible. However, as can be seen fromFigs. 4 and 5, for xethanol > 0.9 andwpolymer,PG1 > 0.6, a lack of water molecules—the preferred hydrogen bonding partner of PG—prevails,leading to a constant separation factor. Since, forwpolymer,PG1 = 0.6 and large ethanol concentrations,most of the water molecules are already hydrogen bonded to a hyperbranched macromolecule, a furtherincrease in polymer concentration most likely results in a rising number of hydrogen bonds between
370 M. Seiler et al. / Fluid Phase Equilibria 201 (2002) 359–379
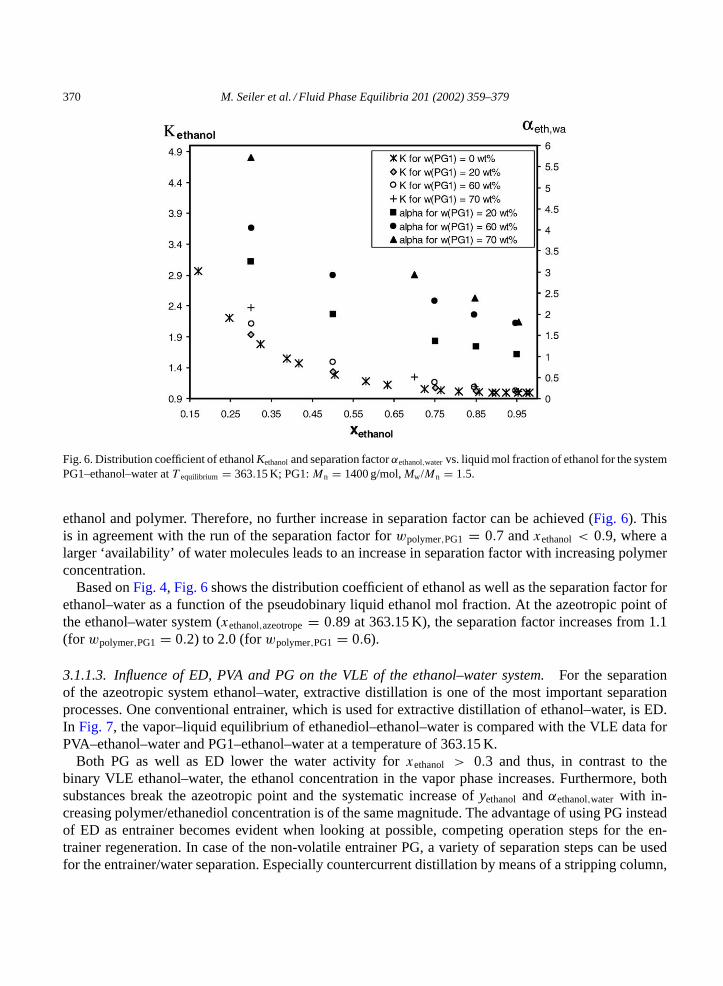
Fig. 6. Distribution coefficient of ethanolKethanoland separation factorαethanol,watervs. liquid mol fraction of ethanol for the systemPG1–ethanol–water atT equilibrium = 363.15 K; PG1:Mn = 1400 g/mol,Mw/Mn = 1.5.
ethanol and polymer. Therefore, no further increase in separation factor can be achieved (Fig. 6). Thisis in agreement with the run of the separation factor forwpolymer,PG1 = 0.7 andxethanol < 0.9, where alarger ‘availability’ of water molecules leads to an increase in separation factor with increasing polymerconcentration.
Based onFig. 4, Fig. 6shows the distribution coefficient of ethanol as well as the separation factor forethanol–water as a function of the pseudobinary liquid ethanol mol fraction. At the azeotropic point ofthe ethanol–water system (xethanol,azeotrope= 0.89 at 363.15 K), the separation factor increases from 1.1(for wpolymer,PG1 = 0.2) to 2.0 (forwpolymer,PG1 = 0.6).
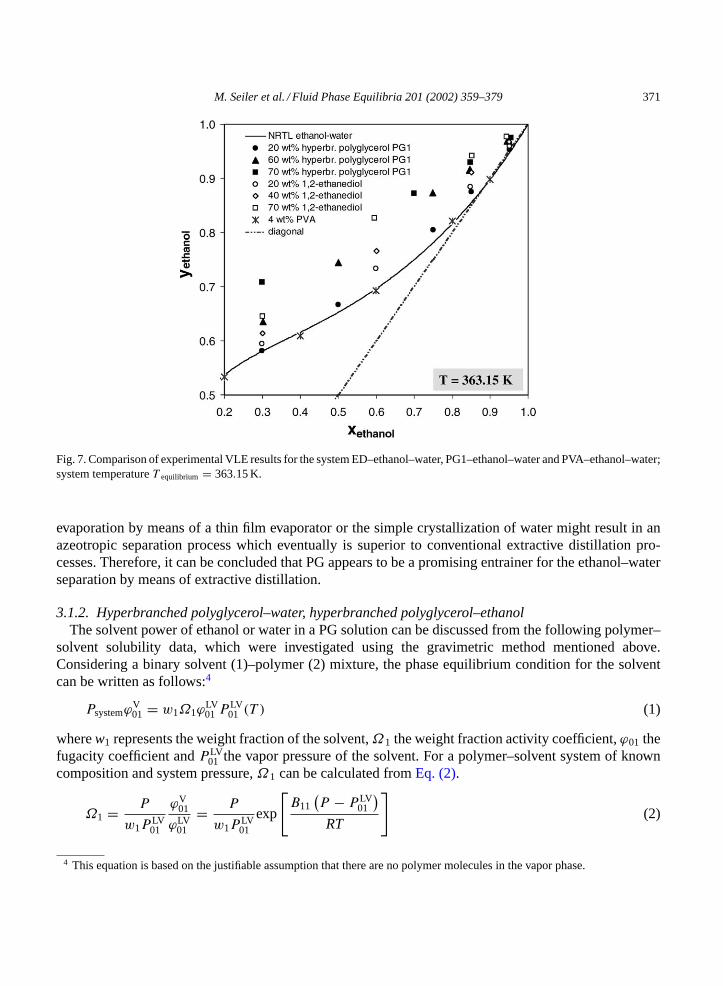
3.1.1.3. Influence of ED, PVA and PG on the VLE of the ethanol–water system.For the separationof the azeotropic system ethanol–water, extractive distillation is one of the most important separationprocesses. One conventional entrainer, which is used for extractive distillation of ethanol–water, is ED.In Fig. 7, the vapor–liquid equilibrium of ethanediol–ethanol–water is compared with the VLE data forPVA–ethanol–water and PG1–ethanol–water at a temperature of 363.15 K.
Both PG as well as ED lower the water activity forxethanol > 0.3 and thus, in contrast to thebinary VLE ethanol–water, the ethanol concentration in the vapor phase increases. Furthermore, bothsubstances break the azeotropic point and the systematic increase ofyethanol andαethanol,water with in-creasing polymer/ethanediol concentration is of the same magnitude. The advantage of using PG insteadof ED as entrainer becomes evident when looking at possible, competing operation steps for the en-trainer regeneration. In case of the non-volatile entrainer PG, a variety of separation steps can be usedfor the entrainer/water separation. Especially countercurrent distillation by means of a stripping column,
M. Seiler et al. / Fluid Phase Equilibria 201 (2002) 359–379 371
Fig. 7. Comparison of experimental VLE results for the system ED–ethanol–water, PG1–ethanol–water and PVA–ethanol–water;system temperatureT equilibrium = 363.15 K.
evaporation by means of a thin film evaporator or the simple crystallization of water might result in anazeotropic separation process which eventually is superior to conventional extractive distillation pro-cesses. Therefore, it can be concluded that PG appears to be a promising entrainer for the ethanol–waterseparation by means of extractive distillation.
3.1.2. Hyperbranched polyglycerol–water, hyperbranched polyglycerol–ethanolThe solvent power of ethanol or water in a PG solution can be discussed from the following polymer–
solvent solubility data, which were investigated using the gravimetric method mentioned above.Considering a binary solvent (1)–polymer (2) mixture, the phase equilibrium condition for the solventcan be written as follows:4
PsystemϕV01 = w1Ω1ϕ
LV01 P LV
01 (T ) (1)
wherew1 represents the weight fraction of the solvent,Ω1 the weight fraction activity coefficient,ϕ01 thefugacity coefficient andP LV
01 the vapor pressure of the solvent. For a polymer–solvent system of knowncomposition and system pressure,Ω1 can be calculated fromEq. (2).
Ω1 = P
w1PLV01
ϕV01
ϕLV01
= P
w1PLV01
exp
[B11
(P − P LV
01
)RT
](2)
4 This equation is based on the justifiable assumption that there are no polymer molecules in the vapor phase.

372 M. Seiler et al. / Fluid Phase Equilibria 201 (2002) 359–379
Table 3Experimental partial pressure data and Flory-Huggins interaction parametersχ for solvent–PG3 systems atT = 393.15 K
PG3–water atTequilibrium = 393.15 K PG3–ethanol atTequilibrium = 393.15 K
P (Pa) wpolymer χ12 P (Pa) wpolymer χ12
148470 0.855 0.97 169790 0.953 1.27130810 0.887 0.99 150450 0.961 1.31118930 0.903 1.00 128370 0.971 1.41101380 0.923 1.00 108330 0.978 1.5090380 0.934 1.01 101150 0.980 1.5179240 0.947 1.05 76480 0.988 1.7267730 0.958 1.09 68070 0.992 1.9949820 0.976 1.28 59570 0.994 2.1447960 0.977 1.28 48780 0.996 2.3333570 0.985 1.32 23690 0.999 2.984400 0.999 1.93
B11 is the second virial coefficient of the solvent and was determined using the method from Hayden andO’Connell[29]. By means of the weight activity coefficient of the solvent, the Flory-Huggins interactionparameterχ can be calculated from the following equation, based on Flory-Huggins theory (see forinstance[30]):
ln(Ω1w1) = ln(1 − Φ∗2) +
(1 − 1
r
)Φ∗
2 + χΦ∗22
wherer represents the segment number andΦ∗2 the segment fraction of the polymer[30]. The Flory-
Huggins interaction parameterχ characterizes the excess energy of interaction in solution per onemolecule of the solvent. The valuekTχ represents the difference in energy of the solvent moleculeimmersed in pure polymer compared with one surrounded by molecules of its own kind, i.e. in the puresolvent[31]. The Flory-Huggins interaction parameter is a useful measure of the solvent power. For theinvestigated systems PG–water and PG–ethanol, the experimental VLE data as well as the calculatedFlory-Huggins interaction parameterχ are summarized inTable 3.
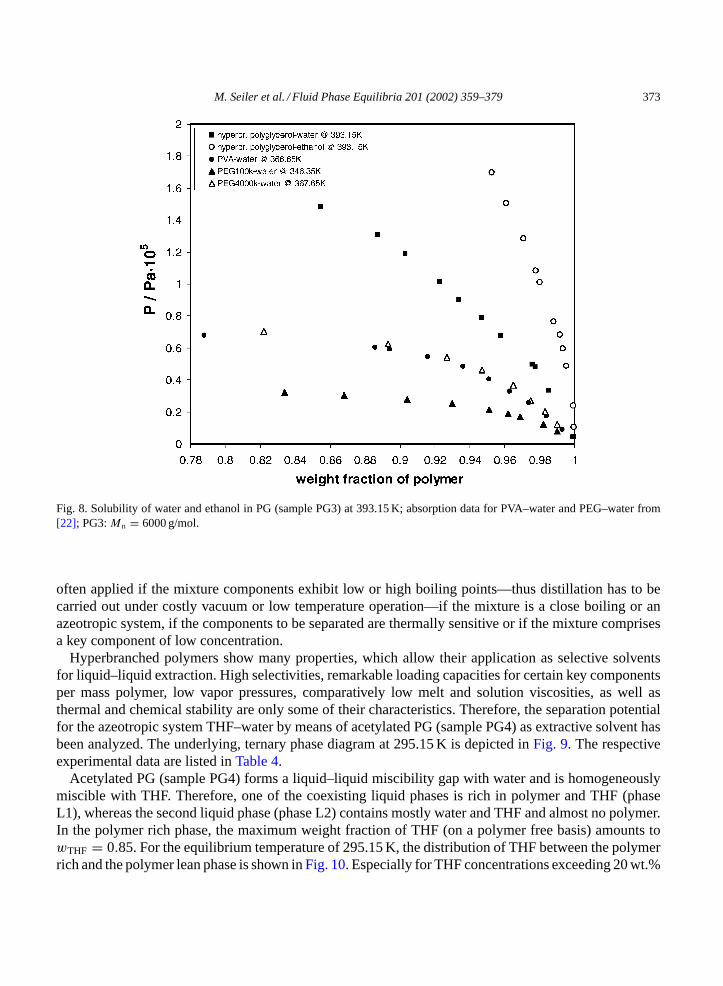
In Fig. 8, the experimental results are contrasted with measurements from Striolo and Prausnitz forPVA–water and poly(ethylene glycol)–water. Both the calculatedχ values (Table 3) and the solubilitydata (Fig. 8) show that water is a better solvent for PG3 (Mn = 6000 g/mol) than ethanol. This un-derlines the molecular dynamics simulation results of Müller-Plathe and van Gunsteren (seeSection3.1.1on ‘PVA–ethanol–water’). For a temperature of 393.15 K the solubility of water in PG is obvi-ously higher than for ethanol, resulting in a comparatively sharp rise of the isothermal partial pres-sure curve of ethanol. Comparing the solubility behavior of PEG (Mw = 4,000,000 g/mol) and PVA(Mw = 124,000–186,000 g/mol) at around 367 K, absorption of similar water concentrations can beobserved. By decreasing the temperature, the weight fraction activity coefficient of water in the PEG(Mw = 100,000 g/mol)—water system increases leading to a better water solubility in PEG.
3.2. LLE of acetylated polyglycerol–THF–water
Liquid–liquid extraction is a separation process which is in competition with rectification. Especiallywith the requirement of low energy consumption, liquid–liquid extraction is gaining importance. It is
M. Seiler et al. / Fluid Phase Equilibria 201 (2002) 359–379 373
Fig. 8. Solubility of water and ethanol in PG (sample PG3) at 393.15 K; absorption data for PVA–water and PEG–water from[22]; PG3:Mn = 6000 g/mol.
often applied if the mixture components exhibit low or high boiling points—thus distillation has to becarried out under costly vacuum or low temperature operation—if the mixture is a close boiling or anazeotropic system, if the components to be separated are thermally sensitive or if the mixture comprisesa key component of low concentration.
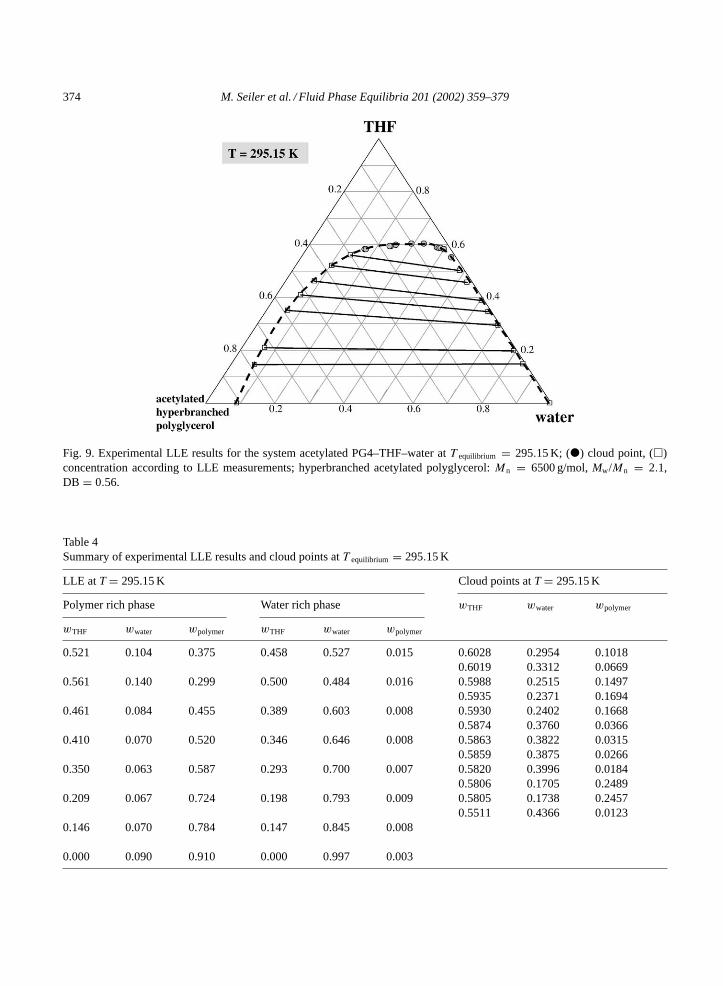
Hyperbranched polymers show many properties, which allow their application as selective solventsfor liquid–liquid extraction. High selectivities, remarkable loading capacities for certain key componentsper mass polymer, low vapor pressures, comparatively low melt and solution viscosities, as well asthermal and chemical stability are only some of their characteristics. Therefore, the separation potentialfor the azeotropic system THF–water by means of acetylated PG (sample PG4) as extractive solvent hasbeen analyzed. The underlying, ternary phase diagram at 295.15 K is depicted inFig. 9. The respectiveexperimental data are listed inTable 4.
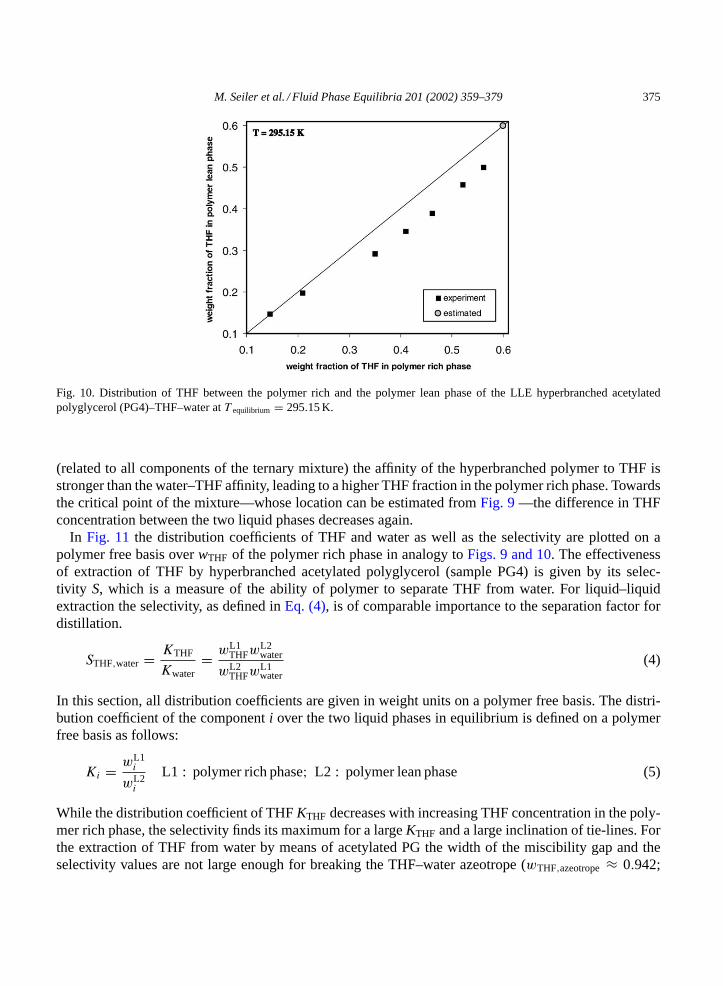
Acetylated PG (sample PG4) forms a liquid–liquid miscibility gap with water and is homogeneouslymiscible with THF. Therefore, one of the coexisting liquid phases is rich in polymer and THF (phaseL1), whereas the second liquid phase (phase L2) contains mostly water and THF and almost no polymer.In the polymer rich phase, the maximum weight fraction of THF (on a polymer free basis) amounts towTHF = 0.85. For the equilibrium temperature of 295.15 K, the distribution of THF between the polymerrich and the polymer lean phase is shown inFig. 10. Especially for THF concentrations exceeding 20 wt.%
374 M. Seiler et al. / Fluid Phase Equilibria 201 (2002) 359–379
Fig. 9. Experimental LLE results for the system acetylated PG4–THF–water atT equilibrium = 295.15 K; () cloud point, ()concentration according to LLE measurements; hyperbranched acetylated polyglycerol:Mn = 6500 g/mol,Mw/Mn = 2.1,DB = 0.56.
Table 4Summary of experimental LLE results and cloud points atT equilibrium = 295.15 K
LLE at T = 295.15 K Cloud points atT = 295.15 K
Polymer rich phase Water rich phase wTHF wwater wpolymer
wTHF wwater wpolymer wTHF wwater wpolymer
0.521 0.104 0.375 0.458 0.527 0.015 0.6028 0.2954 0.10180.6019 0.3312 0.0669
0.561 0.140 0.299 0.500 0.484 0.016 0.5988 0.2515 0.14970.5935 0.2371 0.1694
0.461 0.084 0.455 0.389 0.603 0.008 0.5930 0.2402 0.16680.5874 0.3760 0.0366
0.410 0.070 0.520 0.346 0.646 0.008 0.5863 0.3822 0.03150.5859 0.3875 0.0266
0.350 0.063 0.587 0.293 0.700 0.007 0.5820 0.3996 0.01840.5806 0.1705 0.2489
0.209 0.067 0.724 0.198 0.793 0.009 0.5805 0.1738 0.24570.5511 0.4366 0.0123
0.146 0.070 0.784 0.147 0.845 0.008
0.000 0.090 0.910 0.000 0.997 0.003
M. Seiler et al. / Fluid Phase Equilibria 201 (2002) 359–379 375
Fig. 10. Distribution of THF between the polymer rich and the polymer lean phase of the LLE hyperbranched acetylatedpolyglycerol (PG4)–THF–water atT equilibrium = 295.15 K.
(related to all components of the ternary mixture) the affinity of the hyperbranched polymer to THF isstronger than the water–THF affinity, leading to a higher THF fraction in the polymer rich phase. Towardsthe critical point of the mixture—whose location can be estimated fromFig. 9—the difference in THFconcentration between the two liquid phases decreases again.
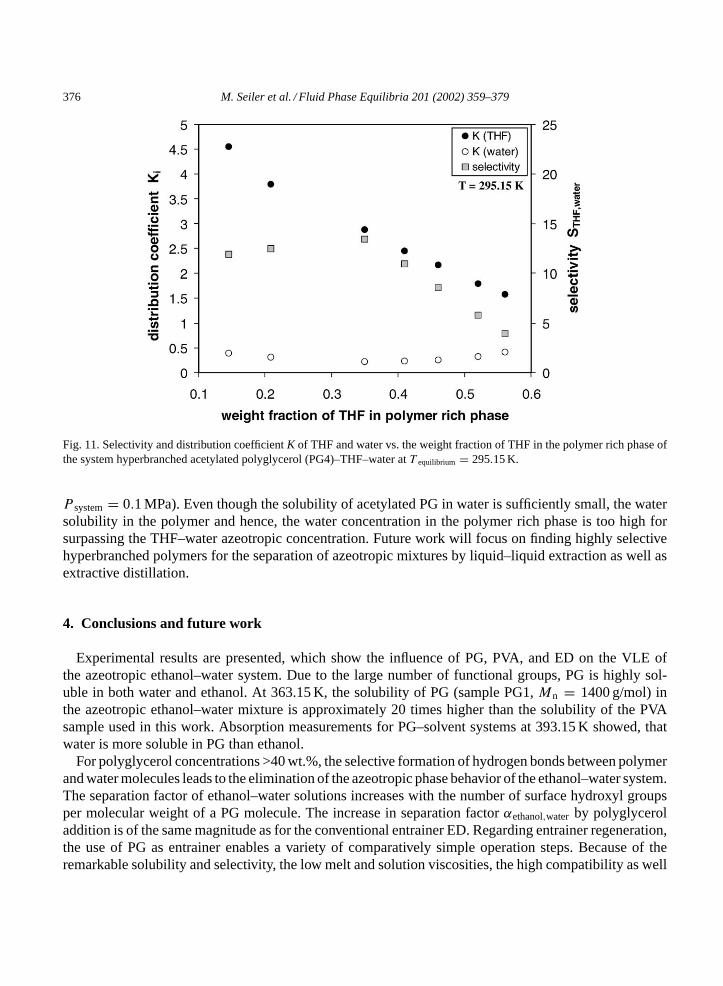
In Fig. 11 the distribution coefficients of THF and water as well as the selectivity are plotted on apolymer free basis overwTHF of the polymer rich phase in analogy toFigs. 9 and 10. The effectivenessof extraction of THF by hyperbranched acetylated polyglycerol (sample PG4) is given by its selec-tivity S, which is a measure of the ability of polymer to separate THF from water. For liquid–liquidextraction the selectivity, as defined inEq. (4), is of comparable importance to the separation factor fordistillation.
STHF,water = KTHF
Kwater= wL1
THFwL2water
wL2THFw
L1water
(4)
In this section, all distribution coefficients are given in weight units on a polymer free basis. The distri-bution coefficient of the componenti over the two liquid phases in equilibrium is defined on a polymerfree basis as follows:
Ki = wL1i
wL2i
L1 : polymer rich phase; L2 : polymer lean phase (5)
While the distribution coefficient of THFKTHF decreases with increasing THF concentration in the poly-mer rich phase, the selectivity finds its maximum for a largeKTHF and a large inclination of tie-lines. Forthe extraction of THF from water by means of acetylated PG the width of the miscibility gap and theselectivity values are not large enough for breaking the THF–water azeotrope (wTHF,azeotrope≈ 0.942;
376 M. Seiler et al. / Fluid Phase Equilibria 201 (2002) 359–379
Fig. 11. Selectivity and distribution coefficientK of THF and water vs. the weight fraction of THF in the polymer rich phase ofthe system hyperbranched acetylated polyglycerol (PG4)–THF–water atT equilibrium = 295.15 K.
P system= 0.1 MPa). Even though the solubility of acetylated PG in water is sufficiently small, the watersolubility in the polymer and hence, the water concentration in the polymer rich phase is too high forsurpassing the THF–water azeotropic concentration. Future work will focus on finding highly selectivehyperbranched polymers for the separation of azeotropic mixtures by liquid–liquid extraction as well asextractive distillation.
4. Conclusions and future work
Experimental results are presented, which show the influence of PG, PVA, and ED on the VLE ofthe azeotropic ethanol–water system. Due to the large number of functional groups, PG is highly sol-uble in both water and ethanol. At 363.15 K, the solubility of PG (sample PG1,Mn = 1400 g/mol) inthe azeotropic ethanol–water mixture is approximately 20 times higher than the solubility of the PVAsample used in this work. Absorption measurements for PG–solvent systems at 393.15 K showed, thatwater is more soluble in PG than ethanol.
For polyglycerol concentrations >40 wt.%, the selective formation of hydrogen bonds between polymerand water molecules leads to the elimination of the azeotropic phase behavior of the ethanol–water system.The separation factor of ethanol–water solutions increases with the number of surface hydroxyl groupsper molecular weight of a PG molecule. The increase in separation factorαethanol,water by polyglyceroladdition is of the same magnitude as for the conventional entrainer ED. Regarding entrainer regeneration,the use of PG as entrainer enables a variety of comparatively simple operation steps. Because of theremarkable solubility and selectivity, the low melt and solution viscosities, the high compatibility as well
M. Seiler et al. / Fluid Phase Equilibria 201 (2002) 359–379 377
as the comparatively simple entrainer regeneration, PG can be used as entrainer or entrainer additive forthe separation of azeotropic mixtures by extractive distillation[33].
The work of Müller-Plathe and van Gunsteren[24] shows that molecular dynamics simulations providea detailed insight in the underlying microscopic phenomena of aqueous PVA solutions. The simulation re-sults allow to quantify the extent of inter- and intramolecular hydrogen bond formation and hence to predictpartition coefficients and separation factors. Future work will include the synthesis of real linear analogswith regard to PG in order to focus explicitly on the impact of polymer branching on the phase behaviorof polymer solution. Subsequently, the precision of thermodynamic models such as the Perturbed-ChainSAFT EOS[32] and lattice cluster theory[28] in describing enthalpic and entropic effects on the phasebehavior of highly branched polymer solutions will be tested so that the adequate consideration of thedegree of polymer branching and the number and nature of polymer functionalities can be ensured.
The presented liquid–liquid equilibrium data of the system acetylated PG–THF–water indicate thathyperbranched polymers might also find use as extractive solvents for liquid–liquid extraction. In case ofthe azeotropic system THF–water, the selectivity of acetylated PG (sample PG4) was not sufficient to breakthe azeotrope. The recently developed methodologies for the synthesis of well-defined hyperbranchedpolymers allow the tailoring of a number of polymer properties such as selectivity, solubility, solutionviscosity, and glass transition temperature. Future work will focus on how this powerful tool can be usedfor process engineering applications by examining the underlying thermodynamic phenomena.
List of symbolsB second virial coefficient (m3/mol)K distribution coefficientk Boltzmann’s constant (J/K)M molecular weight (kg/kmol)P pressure (Pa)r number of segmentsS selectivityT temperature (K)w weight fractionx liquid phase mole fractiony vapor phase mole fraction
Greek lettersα separation factorγ activity coefficientφ volume fractionϕ fugacity coefficientχ Flory-Huggins interaction parameterΩ weight fraction activity coefficient
Subscripts0 pure substancei componenti

378 M. Seiler et al. / Fluid Phase Equilibria 201 (2002) 359–379
SuperscriptsV vapor phaseL liquid phaseLV at vapor–liquid equilibrium
Acknowledgements
The authors are indebted to Prof. G. Sadowski, University of Dortmund, who drew the attention tohyperbranched polymers during her time as research assistant at TU of Berlin. The authors thank theFonds der Chemischen Industrie for valuable financial support in the context of the docent stipend. Weacknowledge a scholarship by the Fonds der Chemischen Industrie as well as financial assistance in thecontext of the Robert Bosch and the Steinhofer awards. Experimental assistance of cand.-Ing. M. Buggertis appreciated.
References
[1] F. Vögtle, Dendrimers, Top. Curr. Chem., 197, Berlin/Heidelberg, 1998.[2] A. Sunder, J. Heinemann, H. Frey, Chem. Eur. J. 6 (2000) 2499–2506.[3] P.J. Flory, J. Am. Chem. Soc. 74 (1952) 2718–2723.[4] R. Hanselmann, D. Hölter, H. Frey, Macromolecules 31 (1998) 3790–3801.[5] W. Radke, G. Litvinenko, A.H.E. Mueller, Macromolecules 31 (1998) 239–248.[6] P. Bharati, J.S. Moore, J. Am. Chem. Soc. 119 (1997) 3391–3392.[7] P. Bharati, J.S. Moore, Macromolecules 33 (2000) 3212–3218.[8] M. Seiler, Chem. Eng. Technol. 25 (3) (2002) 237–253.[9] S. Mecking, R. Thomann, H. Frey, A. Sunder, Macromolecules 33 (2000) 3958–3960.
[10] A. Sunder, M. Krämer, R. Hanselmann, R. Mülhaupt, H. Frey, Angew. Chem. Int. Ed. Engl. 38 (1999) 3552–3555.[11] K. Inoue, Prog. Polym. Sci. 25 (2000) 453–571.[12] M. Seiler, C. Jork, T. Schneider, W. Arlt, Ionic liquids and hyperbranched polymers—promising new classes of selective
entrainers for extractive distillation (full paper), in: Proceedings of the International Conference on Distillation andAbsorption, Baden-Baden, Germany, 2002, ISBN 3-931-384-37-3, in press.
[13] M. Seiler, D. Köhler, W. Arlt, in: Proceedings of Fachausschußsitzungen on Thermische Zerlegung, Adsorption undExtraktion, Bingen/Rhein, Germany, 2002, in press.
[14] H. Hachenberg, K. Beringer, Die Headpsace-Gaschromatographie als Analysen und Meßmethode, Vieweg Verlag,Braunschweig/Wiesbaden, 1996.
[15] H.M. Petri, B.A. Wolf, Macromolecules 27 (1994) 2714–2718.[16] C.B. Castells, D.I. Eikens, P.W. Carr, J. Chem. Eng. Data 45 (2000) 369–375.[17] N. Schuld, B.A. Wolf, J. Polym. Sci. B Polym. Phys. 39 (2001) 651–662.[18] G. Sadowski, L.V. Mokrushina, W. Arlt, Fluid Phase Equilib. 139 (1997) 391–403.[19] A. Sunder, R. Hanselmann, H. Frey, R. Mülhaupt, Macromolecules 32 (1999) 4240–4246.[20] H. Kautz, A. Sunder, H. Frey, Macromol. Symp. 163 (2001) 67–74.[21] A. Burgath, A. Sunder, H. Frey, Macromol. Chem. Phys. 201 (2000) 782–791.[22] A. Striolo, J.M. Prausnitz, Polymer 41 (2000) 1109–1117.[23] Y. Tamai, H. Tanaka, K. Nakanishi, Mol. Simul. 16 (1996) 359–374.[24] F. Müller-Plathe, W.F. van Gunsteren, Polymer 9 (1997) 2259–2268.[25] G. Rehage, Kunststoffe 53 (9) (1963) 605–614.[26] M.P. Allen, D.J. Tildesley, Computer Simulation of Liquids, Oxford University Press, Oxford, 1987.[27] A. Striolo, J.M. Prausnitz, A. Bertucco, R.A. Kee, M. Gauthier, Polymer 42 (2001) 2579–2584.[28] J.G. Jang, J.Y. Huh, Y.C. Bae, Fluid Phase Equilib. 4842 (2001) 1–14.
M. Seiler et al. / Fluid Phase Equilibria 201 (2002) 359–379 379
[29] J.G. Hayden, J.P. O’Connell, Ind. Eng. Chem. Proc. Des. Dev. 14 (1975) 209–216.[30] J.M. Prausnitz, R.N. Lichtenthaler, E.G. de Azevedo, Molecular Thermodynamics of Fluid Phase Equilibria, 3rd Edition,
Prentice Hall, New Jersey, 1999.[31] P.J. Flory, Principles of Polymer Chemistry, Cornell University Press, Ithaca, 1952.[32] J. Groß, Entwicklung einer Zustandsgleichung für einfache, assoziierende und makromolekulare Stoffe, Dissertation,
Technical University of Berlin, 2001.[33] W. Arlt, M. Seiler, G. Sadowski, H. Frey, H. Kautz, DE Patent no. 10160518.8, 2001.
Copyright © 2022 FDOKUMEN