Patogénesis molecular, epidemiología y diagnóstico de Escherichia coli enteropatógena

Published Ahead of Print 29 September 2006. 2006, 188(23):8259. DOI: 10.1128/JB.00740-06. J. Bacteriol.
Scott A. Lesely, Bernhard Ø. Palsson and Sanjay AgarwallaEdwards, Andrei Osterman, Tomoya Baba, Hirotada Mori, Andrew R. Joyce, Jennifer L. Reed, Aprilfawn White, Robert
Escherichia coliGenes in Assessment of Conditionally Essential Experimental and Computational
http://jb.asm.org/content/188/23/8259Updated information and services can be found at:
These include:
REFERENCEShttp://jb.asm.org/content/188/23/8259#ref-list-1at:
This article cites 52 articles, 25 of which can be accessed free
CONTENT ALERTS more»articles cite this article),
Receive: RSS Feeds, eTOCs, free email alerts (when new
http://journals.asm.org/site/misc/reprints.xhtmlInformation about commercial reprint orders: http://journals.asm.org/site/subscriptions/To subscribe to to another ASM Journal go to:
on February 6, 2014 by guest
http://jb.asm.org/
Dow
nloaded from
on February 6, 2014 by guest
http://jb.asm.org/
Dow
nloaded from
JOURNAL OF BACTERIOLOGY, Dec. 2006, p. 8259–8271 Vol. 188, No. 230021-9193/06/$08.00�0 doi:10.1128/JB.00740-06Copyright © 2006, American Society for Microbiology. All Rights Reserved.
Experimental and Computational Assessment of ConditionallyEssential Genes in Escherichia coli�
Andrew R. Joyce,1,2† Jennifer L. Reed,2† Aprilfawn White,3,4 Robert Edwards,5,6 Andrei Osterman,6,7
Tomoya Baba,8 Hirotada Mori,8,9 Scott A. Lesely,3,4 Bernhard Ø. Palsson,2* and Sanjay Agarwalla3,4*†Program in Bioinformatics, University of California, San Diego, La Jolla, California 920931; Department of Bioengineering, University of
California, La Jolla, California 920932; The Joint Center for Structural Genomics3 and The Genomics Institute ofthe Novartis Research Foundation, San Diego, California 921214; Center for Microbial Sciences,
San Diego State University, San Diego, California 921825; Fellowship for the Interpretation ofGenomes, Burr Ridge, Illinois 605276; Burnham Institute for Medical Research, La Jolla,
California 92037;7 Graduate School of Biological Sciences, Nara Institute of Science andTechnology (NAIST), Ikoma, Nara, Japan8; and Advanced Institute of
Biosciences, Keio University, Tsuruoka, Yamagata 997-0017, Japan9
Received 22 May 2006/Accepted 9 September 2006
Genome-wide gene essentiality data sets are becoming available for Escherichia coli, but these data sets haveyet to be analyzed in the context of a genome scale model. Here, we present an integrative model-driven analysisof the Keio E. coli mutant collection screened in this study on glycerol-supplemented minimal medium. Out of3,888 single-deletion mutants tested, 119 mutants were unable to grow on glycerol minimal medium. Theseconditionally essential genes were then evaluated using a genome scale metabolic and transcriptional-regula-tory model of E. coli, and it was found that the model made the correct prediction in �91% of the cases. Thediscrepancies between model predictions and experimental results were analyzed in detail to indicate wheremodel improvements could be made or where the current literature lacks an explanation for the observedphenotypes. The identified set of essential genes and their model-based analysis indicates that our currentunderstanding of the roles these essential genes play is relatively clear and complete. Furthermore, byanalyzing the data set in terms of metabolic subsystems across multiple genomes, we can project whichmetabolic pathways are likely to play equally important roles in other organisms. Overall, this work establishesa paradigm that will drive model enhancement while simultaneously generating hypotheses that will ultimatelylead to a better understanding of the organism.
The advent of whole-genome sequencing and other high-throughput experimental technologies provides system levelmeasurements that are driving efforts to develop computa-tional models of the cell. The constraint-based reconstructionand analysis (COBRA) approach (36) has emerged in recentyears as a successful approach to modeling systems on a ge-nome scale. The COBRA approach begins with developing ametabolic network reconstruction based on the annotatedgenome sequence, known biochemistry, and other physio-logical data (38). Known constraints, such as enzymatic-reaction reversibility and maximum flux capacity, are thenimposed on the network reconstruction to generate a modelthat defines all attainable network states (36). A currentmetabolic and regulatory model of Escherichia coli contains932 unique metabolic reactions and Boolean logic state-ments for how 104 transcription factors regulate the expres-
sion of 479 out of the 906 metabolic genes (6). COBRAmethods are available to predict which metabolic and reg-ulatory genes are required for growth under given environ-mental conditions (7, 11, 43, 44).
Knowledge of which genes in an organism are essential andunder what conditions they are essential is of fundamental andpractical importance. This knowledge provides us with aunique tool to refine the interpretation of cellular networksand to map critical points in these networks. Examples ofapplications in which this information may be useful includeengineering industrial microbial strains, as well as developingnovel anti-infective agents. The importance of this emergingfield devoted to investigations of gene essentiality is widelyaccepted, as witnessed by the rapid accumulation of genome-wide essentiality data, which are now available for severalmodel and pathogenic microbial species (1, 3, 16, 17, 19, 25, 27,30, 42, 45, 48).
From a modeling perspective, a major limitation of the pre-vious gene essentiality studies of E. coli was that they wereperformed using only partial (18, 24, 52) (i.e., not all mutantswere evaluated) or heterogeneous (“historical” single-genestudies of a variety of strains and conditions compiled in theProfiling of E. coli Chromosome database [http://www.shigen.nig.ac.jp/ecoli/pec/]) data. Data provided by the first publishedgenome scale genetic-footprinting study of E. coli (16) aregenerally not amenable to immediate model-based interpreta-tion, as they (i) captured a rather complex phenotype (fitness
* Corresponding author. Mailing address for Bernhard Palsson(computational work): Department of Bioengineering, University ofCalifornia, San Diego, 9500 Gilman Dr. MC 0412, La Jolla, CA 92093-0412. Phone: (858) 534-5668. Fax: (858) 822-3120. E-mail: [email protected]. Mailing address for Sanjay Agarwalla (experimentalwork): The Genomics Institute of the Novartis Research Foundation,10675 John Jay Hopkins Drive, San Diego, CA 92121. Phone: (858)812-1500. Fax: (858) 812-1502. E-mail: [email protected].
† Andrew R. Joyce, Jennifer L. Reed, and Sanjay Agarwalla con-tributed equally to this work.
� Published ahead of print on 29 September 2006.
8259
on February 6, 2014 by guest
http://jb.asm.org/
Dow
nloaded from
within a competitive growth environment) and (ii) were ob-tained in undefined rich medium.
The recent release of the first complete collection of vi-able single-gene knockout E. coli strains (1) has opened anopportunity for systemic, genome scale gene essentialitystudies in minimal and defined growth media. The groupresponsible for generating this valuable resource also re-ported the first genome scale conditional-essentiality screenon rich medium and glucose-supplemented minimal me-dium (1). In this study, we used this strain collection tointegrate high-throughput experimental data and computa-tional modeling to assess E. coli gene essentiality for growthon glycerol-supplemented minimal medium. The results ofthis conditional-essentiality screen were analyzed in the con-text of the most current genome scale metabolic and tran-scriptional regulatory model (6).
A systematic cross-validation of genome scale gene essenti-ality data with in silico predictions would play a critical role inrefining the current metabolic reconstruction and the underly-ing model. At the same time, such an integrative analysis wouldassist in data analysis and interpretation in the structured-network context. For example, a recent study utilized the pre-viously described integrated E. coli transcriptional-regulatoryand metabolic model to validate its predictive capabilityagainst 13,750 growth phenotypes corresponding to 110 geneknockout strains grown under 125 different defined conditions(6). Discrepancies between the model predictions and experi-mental results pointed to poorly understood metabolic or reg-ulatory events requiring further experimental investigation.The gene deletions evaluated in this previous study, however,covered less than 11% of the genes included in the currentmodel.
Here, we identify the set of genes needed for growth onglycerol-supplemented minimal medium and analyze the re-sults using a genome scale metabolic and regulatory model. Weshow this approach to be useful for a rigorous global evalua-tion of the genome scale modeling predictive power whilesimultaneously identifying directions for model improvement.The gene essentiality data obtained in this study were generallyin good agreement with the model predictions, as well as withthe results of the previously reported screen on glucose-sup-plemented minimal medium (1). This work represents themost thorough assessment on a gene-by-gene basis of the E.coli constraint-based metabolic model and is the first model-based evaluation of a truly genomewide gene essentialityscreen on a single defined minimal medium for E. coli.
MATERIALS AND METHODS
High-throughput phenotyping of the E. coli gene knockout collection. A re-cently described collection of 3,888 E. coli single-gene deletion mutants wasconstructed (1; http://ecoli.naist.jp/) by the method of Datsenko and Wanner (9).To determine the phenotypes of deletion mutants in M9 minimal medium con-taining glycerol as the carbon source, the mutants were inoculated in LB mediumin the presence of kanamycin (30 mg/liter) using a 96-pin tool and were grownovernight at 37°C. The overnight cultures were washed twice with phosphate-buffered saline and then inoculated in glycerol-supplemented M9 liquid mediumwith kanamycin. The liquid culture was grown at 37°C with agitation for about24 h, and the optical density (OD) was measured at 600 nm. The ODs from allwells of a plate were averaged, and the mutants in the wells with less thanone-third of the average OD were considered nongrowers or slow growers. Theexperiment was done in triplicate, and mutants that were below the one-thirdaverage OD cutoff in at least two of three experiments were selected. This initial
screen yielded about 230 deletion mutants that had slow or no growth onM9-glycerol medium. A secondary screen using the same procedure was re-peated on this subset of mutants, using the same one-third of the average OD asthe cutoff and yielded a final set of 119 E. coli deletion mutants that representedthe conditionally essential complement of genes required for growth on glycerol.This second round of screening confirmed the genuine hits and eliminated falseand nonreproducible hits. Each liter of M9 medium (Sigma catalog no. 6030)contained Na2HPO4 · 7H2O (6.8g), KH2PO4 (3g), NaCl (0.5g), NH4Cl (1g),MgSO4 (2 mM), CaCl2 (0.1 mM), glycerol (1%), and kanamycin (10 mg).
For comparison with the conditionally essential genes reported in the recentlypublished data for growth on glucose-supplemented minimal medium (1), weselected the 119 slowest growers based on the observed OD at 24 h. This setcoincidently included nearly all of the strains with less than one-third of theaverage OD at 24 h for all strains tested.
Computational predictions for essentiality. A previously developed metabolicmodel of E. coli (6, 39) was used to predict the metabolic genes and reactionsessential for growth on glycerol minimal medium. The model was modified totake into account genetic differences between MG1655 and BW25113 and recentchanges in the genome annotation (40). Five metabolic reactions were removed(L-arabinose isomerase, L-ribulokinase, rhamnulokinase, L-rhamnose isomerase,and rhamnulose 1-phosphate aldolase), since the associated genes (araBAD,rhaBAD, and lacZ) are absent in the BW25113 strain that was the parentalbackground for the genetic manipulations. Based on recent updates to the E. coligenome annotation (40), two additional metabolic genes (dfp and coaE) werealso included in the metabolic model by associating them with three reactionsinvolved in coenzyme A (CoA) biosynthesis that previously had no genes asso-ciated with them. Furthermore, atpI was removed from the model, since evidencesuggested it did not participate in the ATP synthase complex (14). Additionalchanges in the genome annotation (40) also have merged (tdcG, araH, and ytfR)and split (dgoAD and glcEF) some genes included in the model. As a result, 899metabolic genes are accounted for in the metabolic model and an additional 104transcription factors are used in the combined metabolic and regulatory model.
Growth on glycerol minimal medium was simulated by maximizing fluxthrough a defined biomass objective function and allowing the uptake of glycerol,NH4, SO4, O2, and Pi and the free exchange of H�, H2O, and CO2 (see reference39 for further details). The biomass objective function is specified to define theweighted consumption of metabolites required to generate the cellular biomass.Simulations conducted in this manner represent approximations of the maximumattainable growth rate under the given environmental conditions and modelspecifications.
The maximum growth rates of gene knockout strains were calculated with eachgene independently removed from the network. When simulating the deletion ofa gene, all associated reactions were removed from the network except for thosereactions with isozymes. Gene deletions where the predicted maximum growthrate was zero were categorized as essential. To evaluate the effects of transcrip-tion factor mutants, a combined metabolic and regulatory model was used toevaluate whether the deletion of a transcription factor is lethal for growth onglycerol minimal medium (6, 39). The regulatory model contains Boolean logicstatements describing the transcription factors and environmental conditionsneeded for metabolic genes to be expressed (7, 8). All calculations with only themetabolic model were done using SimPheny (Genomatica, San Diego, CA), andLINDO (Lindo Systems, Inc., Chicago, IL) was used to calculate growth rates forthe combined metabolic and regulatory model.
Cross-genome comparison of conditionally essential genes. We used TheSEED genomic platform (http://theseed.uchicago.edu/FIG/index.cgi) for a cross-genome comparison of metabolic subsystems implicated by the set of condition-ally essential E. coli genes identified in this study. A subsystem is defined in TheSEED environment as a collection of functional roles (enzymes, transporters, orregulators) known to be involved in a well-defined biological process, such as asubnetwork (a cluster of pathways) associated with a particular aspect of metab-olism (e.g., glycolysis) (34). A populated subsystem is defined as a table oftentative role-to-gene connections asserted by curators for a broad range ofspecies containing a functional variant of this subsystem (51). In this study, weused The SEED tools to generalize the data from the described essentialityscreen in a broader phylogenetic context. This approach circumvents certainlimitations of traditional gene-by-gene comparisons, as there are reported caseswhere the same reaction or functional role can be implemented by nonortholo-gous enzymes in different species (28).
Briefly, a table was constructed that relates conditionally essential genes (bothidentified by the experiment and predicted by computational modeling) to TheSEED collection of metabolic subsystems. For further analysis, this table wassimplified to a set of binary associations (one gene to one “primary” subsystem)and limited to the approximately 20 key subsystems that contained more than
8260 JOYCE ET AL. J. BACTERIOL.
on February 6, 2014 by guest
http://jb.asm.org/
Dow
nloaded from
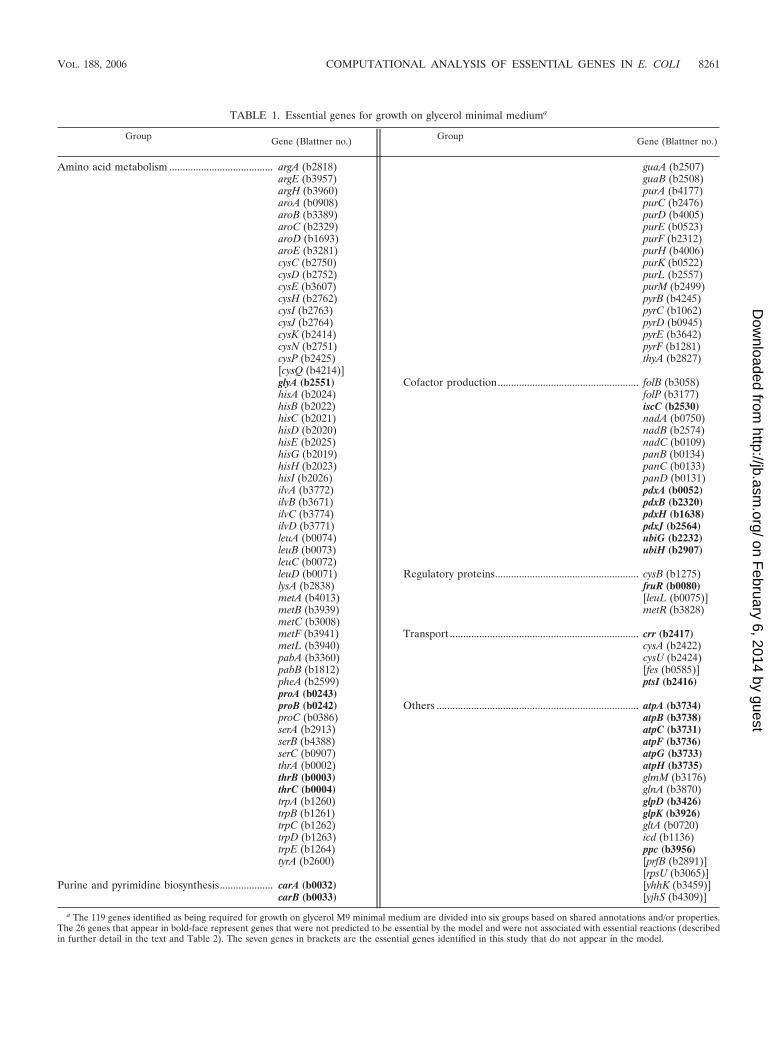
TABLE 1. Essential genes for growth on glycerol minimal mediuma
Group Gene (Blattner no.) Group Gene (Blattner no.)
Amino acid metabolism ....................................... argA (b2818) guaA (b2507)argE (b3957) guaB (b2508)argH (b3960) purA (b4177)aroA (b0908) purC (b2476)aroB (b3389) purD (b4005)aroC (b2329) purE (b0523)aroD (b1693) purF (b2312)aroE (b3281) purH (b4006)cysC (b2750) purK (b0522)cysD (b2752) purL (b2557)cysE (b3607) purM (b2499)cysH (b2762) pyrB (b4245)cysI (b2763) pyrC (b1062)cysJ (b2764) pyrD (b0945)cysK (b2414) pyrE (b3642)cysN (b2751) pyrF (b1281)cysP (b2425) thyA (b2827)[cysQ (b4214)]glyA (b2551) Cofactor production..................................................... folB (b3058)hisA (b2024) folP (b3177)hisB (b2022) iscC (b2530)hisC (b2021) nadA (b0750)hisD (b2020) nadB (b2574)hisE (b2025) nadC (b0109)hisG (b2019) panB (b0134)hisH (b2023) panC (b0133)hisI (b2026) panD (b0131)ilvA (b3772) pdxA (b0052)ilvB (b3671) pdxB (b2320)ilvC (b3774) pdxH (b1638)ilvD (b3771) pdxJ (b2564)leuA (b0074) ubiG (b2232)leuB (b0073) ubiH (b2907)leuC (b0072)leuD (b0071) Regulatory proteins...................................................... cysB (b1275)lysA (b2838) fruR (b0080)metA (b4013) [leuL (b0075)]metB (b3939) metR (b3828)metC (b3008)metF (b3941) Transport ....................................................................... crr (b2417)metL (b3940) cysA (b2422)pabA (b3360) cysU (b2424)pabB (b1812) [fes (b0585)]pheA (b2599) ptsI (b2416)proA (b0243)proB (b0242) Others ............................................................................ atpA (b3734)proC (b0386) atpB (b3738)serA (b2913) atpC (b3731)serB (b4388) atpF (b3736)serC (b0907) atpG (b3733)thrA (b0002) atpH (b3735)thrB (b0003) glmM (b3176)thrC (b0004) glnA (b3870)trpA (b1260) glpD (b3426)trpB (b1261) glpK (b3926)trpC (b1262) gltA (b0720)trpD (b1263) icd (b1136)trpE (b1264) ppc (b3956)tyrA (b2600) [prfB (b2891)]
[rpsU (b3065)]Purine and pyrimidine biosynthesis.................... carA (b0032) [yhhK (b3459)]
carB (b0033) [yjhS (b4309)]
a The 119 genes identified as being required for growth on glycerol M9 minimal medium are divided into six groups based on shared annotations and/or properties.The 26 genes that appear in bold-face represent genes that were not predicted to be essential by the model and were not associated with essential reactions (describedin further detail in the text and Table 2). The seven genes in brackets are the essential genes identified in this study that do not appear in the model.
VOL. 188, 2006 COMPUTATIONAL ANALYSIS OF ESSENTIAL GENES IN E. COLI 8261
on February 6, 2014 by guest
http://jb.asm.org/
Dow
nloaded from
two experimentally defined essential genes. We then examined operational vari-ants of these subsystems (as defined by a subsystem curator) over a diagnostic setof 31 species with available completely sequenced genomes spanning much of theknown bacterial phylogeny. For illustrative purposes, we used the same set ofgenomes as in the previous analysis of genetic-footprinting data (16) (see sup-plementary Table 4 [http://systemsbiology.ucsd.edu/publications/supplemental_material/JBact2006/]). For this simplified analysis, we monitored only the pres-ence or absence of at least a minimal functional variant for each subsystem andeach genome in the set. The results were hierarchically clustered for visualizationand analysis purposes (see Fig. 6) using the Hamming distance metric andaverage linkage.
Quantitative RT-PCR measurements of gene expression. Real-time RT-PCRwas used to quantify gene expression levels for genes related to glycerol metab-olism (glpK, glpD, glpB, gpsA, gldA, and dhaM). Total RNA was extracted fromcells harvested from mid-log-phase cultures of E. coli strain BW25113 (9) grownon glucose-supplemented (A600 � 0.5) and glycerol-supplemented (A600 � 0.3)M9 minimal medium (2 g/liter). Triplicate RNA samples (biological replicates)were stabilized using RNAProtect Bacterial Reagent (QIAGEN) and isolatedusing the RNeasy mini kit (QIAGEN). Synthesis of cDNA was performed usingSuperScript III (Invitrogen) and purified using the QIAquick PCR Purificationkit (QIAGEN).
The resulting cDNA samples were used in subsequent real-time reverse tran-scription (RT)-PCR assays using the QuantiTect SYBR Green PCR kit(QIAGEN) and iCycler iQ system (Bio-Rad). Nine replicate measurements(three technical replicates for each biological replicate) were performed for eachassayed gene under both growth conditions. The acyl carrier protein (ACP)-encoding gene acpP was used as a reference for each assay. A standard curve wasgenerated by varying amounts of genomic DNA with fixed primer concentrationsand was used to calculate primer efficiencies. The reported relative expressionlevels for each gene were determined by normalizing the amount of cDNAproduct to acpP cDNA quantified from the same cDNA sample.
RESULTS
By evaluating single-gene deletion strains for growth on glyc-erol-supplemented minimal medium, we identified genes es-sential for growth in a minimal-medium environment that arenot essential in a rich-medium environment. A genome scalemetabolic and regulatory model was used to evaluate the dataand to identify any discrepancies between the model and the
experimental data. In addition, the essential genes identified inthis study were compared to gene essentiality data for growthon glucose-supplemented minimal medium (1), and their phy-logenetic distribution across multiple genomes was evaluated.
Experimentally essential genes for growth on glycerol min-imal medium. Of the 3,888 single-gene deletion E. coli mutantsviable on rich medium and screened in this study, 119 werereproducibly incapable of growth on glycerol minimal medium(Table 1; for complete results, see supplementary Tables 1and 2 [http://systemsbiology.ucsd.edu/publications/supplemental_material/JBact2006/]). Most of these conditionally essentialgenes are involved in core metabolic processes: amino acidmetabolism (59 genes), nucleotide metabolism (19 genes), co-factor metabolism (15 genes), and transport (5 genes). Seven-teen genes are involved in other miscellaneous processes, andfour regulatory genes were also found to be conditionally es-sential.
Only seven (cysQ, fes, leuL, prfB, rpsU, yhhK, and yjhS) of the119 identified essential genes are not accounted for in thecurrent metabolic and regulatory model, since the genes do notencode metabolic enzymes or transcription factors with knownfunctions. While the specific role of cysQ in sulfate assimilationis unknown (33), it is an important component of cysteinebiosynthesis. fes is important for iron transport and utilizationof ions in low-concentration environments, such as that used inthis minimal-medium study (10). Alteration of transcriptionalattenuation (32) mediated regulation of the leuLABCD operon(50), which encodes the proteins critical for leucine biosynthe-sis, and likely explains the essentiality of the leader peptideencoded by leuL. Several other nonmodel genes encoding PrfB(a peptide chain release factor) and RpsU (30S ribosomalsubunit S21), as well as the observed conditional essentiality ofthe uncharacterized genes yhhK (a putative acyltransferase)and yjhS, cannot be readily interpreted without further exper-
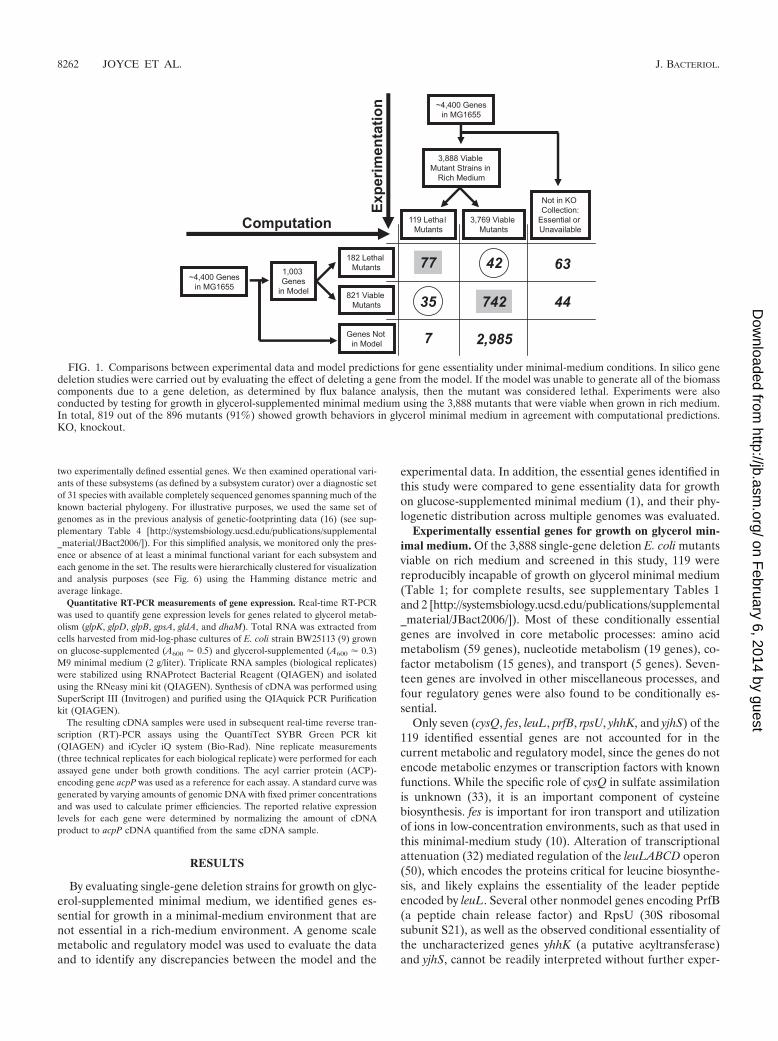
FIG. 1. Comparisons between experimental data and model predictions for gene essentiality under minimal-medium conditions. In silico genedeletion studies were carried out by evaluating the effect of deleting a gene from the model. If the model was unable to generate all of the biomasscomponents due to a gene deletion, as determined by flux balance analysis, then the mutant was considered lethal. Experiments were alsoconducted by testing for growth in glycerol-supplemented minimal medium using the 3,888 mutants that were viable when grown in rich medium.In total, 819 out of the 896 mutants (91%) showed growth behaviors in glycerol minimal medium in agreement with computational predictions.KO, knockout.
8262 JOYCE ET AL. J. BACTERIOL.
on February 6, 2014 by guest
http://jb.asm.org/
Dow
nloaded from
imental investigation. The remaining 112 essential genes andnonessential genes can be compared to predictions made withthe current metabolic and regulatory model.
Model-based evaluation of essential genes. Given that mostof the essential genes involve metabolic genes and metabolicregulators, we conducted a detailed comparison of the exper-imentally observed and computationally predicted essentialgenes (Fig. 1 and Table 1). Computational analysis of single-gene deletion events predicted 182 genes (177 metabolic and 5regulatory genes) to be lethal and thus required for growth inglycerol minimal medium. Nearly half of these genes were stillpredicted to be essential by the model even if all transportablemetabolites were allowed to be taken up by the cell simulta-neously, so they are likely to be essential for growth on richmedium, as well. Among the 182 model-predicted lethal mu-tants, 63 were not present in the analyzed collection. Althougha fraction of these missing mutants may reflect technical fail-ures, most of them are associated with genes expected to beessential under any environmental conditions. Such genes aretypically responsible for producing essential metabolites thatcannot be salvaged even from rich medium.
As shown in Fig. 1, �69% of experimentally identified con-ditionally essential genes covered by the model (77 of 112)were predicted to be essential by evaluating in silico single-gene deletions. An additional 8% of experimentally essentialgenes (9 of 112) would be correctly predicted by the model tobe essential if additional isozymes were not present, possibly
indicating that the expression of alternative isozyme-encodinggenes is not sufficient to compensate for growth on glycerolminimal medium. Alternatively, these nine cases may point toincorrect functional assignment of some paralogs.
This leaves 26 essential genes unexplained by the model, inwhich the experimentally observed essential genes are associatedwith predicted nonessential model genes (Table 2 and supple-mentary Table 3 [http://systemsbiology.ucsd.edu/publications/supplemental_material/JBact2006/]). Six genes out of these 26discrepancies (atpA, atpB, atpC, atpF, atpG, and atpH) are partof the ATP synthase complex. According to the model, thedeletion of the ATP synthase reaction should not be lethal butit should reduce the maximum growth rate by �75%, whichmay be close to the viability threshold used in this study.Interestingly, two other components of the ATP synthasecomplex (atpD and atpE) were deemed nonessential in ourexperimental screen.
An additional large subset of these discrepancies (9 of 26)appear to be caused by the existence of alternative pathwaysavailable within the metabolic model but whose genes areprobably not expressed in vivo under the conditions of thisscreen. For example, proA and proB can be functionally re-placed in the model by the combined action of argA, argB,argC, and argE gene products in proline biosynthesis, sinceboth result in the production of glutamate-5-semialdehyde(Fig. 2). However, this alternate pathway is observed experi-mentally only in double-deletion strains, where an argD dele-
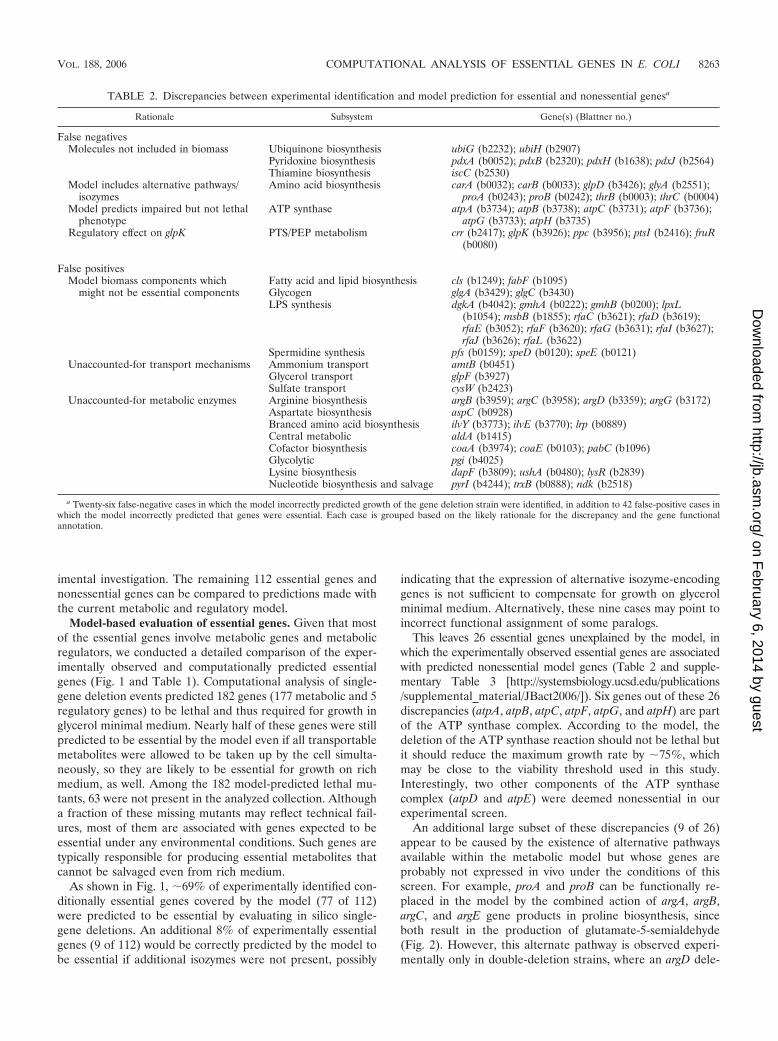
TABLE 2. Discrepancies between experimental identification and model prediction for essential and nonessential genesa
Rationale Subsystem Gene(s) (Blattner no.)
False negativesMolecules not included in biomass Ubiquinone biosynthesis ubiG (b2232); ubiH (b2907)
Pyridoxine biosynthesis pdxA (b0052); pdxB (b2320); pdxH (b1638); pdxJ (b2564)Thiamine biosynthesis iscC (b2530)
Model includes alternative pathways/isozymes
Amino acid biosynthesis carA (b0032); carB (b0033); glpD (b3426); glyA (b2551);proA (b0243); proB (b0242); thrB (b0003); thrC (b0004)
Model predicts impaired but not lethalphenotype
ATP synthase atpA (b3734); atpB (b3738); atpC (b3731); atpF (b3736);atpG (b3733); atpH (b3735)
Regulatory effect on glpK PTS/PEP metabolism crr (b2417); glpK (b3926); ppc (b3956); ptsI (b2416); fruR(b0080)
False positivesModel biomass components which
might not be essential componentsFatty acid and lipid biosynthesis cls (b1249); fabF (b1095)Glycogen glgA (b3429); glgC (b3430)LPS synthesis dgkA (b4042); gmhA (b0222); gmhB (b0200); lpxL
(b1054); msbB (b1855); rfaC (b3621); rfaD (b3619);rfaE (b3052); rfaF (b3620); rfaG (b3631); rfaI (b3627);rfaJ (b3626); rfaL (b3622)
Spermidine synthesis pfs (b0159); speD (b0120); speE (b0121)Unaccounted-for transport mechanisms Ammonium transport amtB (b0451)
Glycerol transport glpF (b3927)Sulfate transport cysW (b2423)
Unaccounted-for metabolic enzymes Arginine biosynthesis argB (b3959); argC (b3958); argD (b3359); argG (b3172)Aspartate biosynthesis aspC (b0928)Branced amino acid biosynthesis ilvY (b3773); ilvE (b3770); lrp (b0889)Central metabolic aldA (b1415)Cofactor biosynthesis coaA (b3974); coaE (b0103); pabC (b1096)Glycolytic pgi (b4025)Lysine biosynthesis dapF (b3809); ushA (b0480); lysR (b2839)Nucleotide biosynthesis and salvage pyrI (b4244); trxB (b0888); ndk (b2518)
a Twenty-six false-negative cases in which the model incorrectly predicted growth of the gene deletion strain were identified, in addition to 42 false-positive cases inwhich the model incorrectly predicted that genes were essential. Each case is grouped based on the likely rationale for the discrepancy and the gene functionalannotation.
VOL. 188, 2006 COMPUTATIONAL ANALYSIS OF ESSENTIAL GENES IN E. COLI 8263
on February 6, 2014 by guest
http://jb.asm.org/
Dow
nloaded from
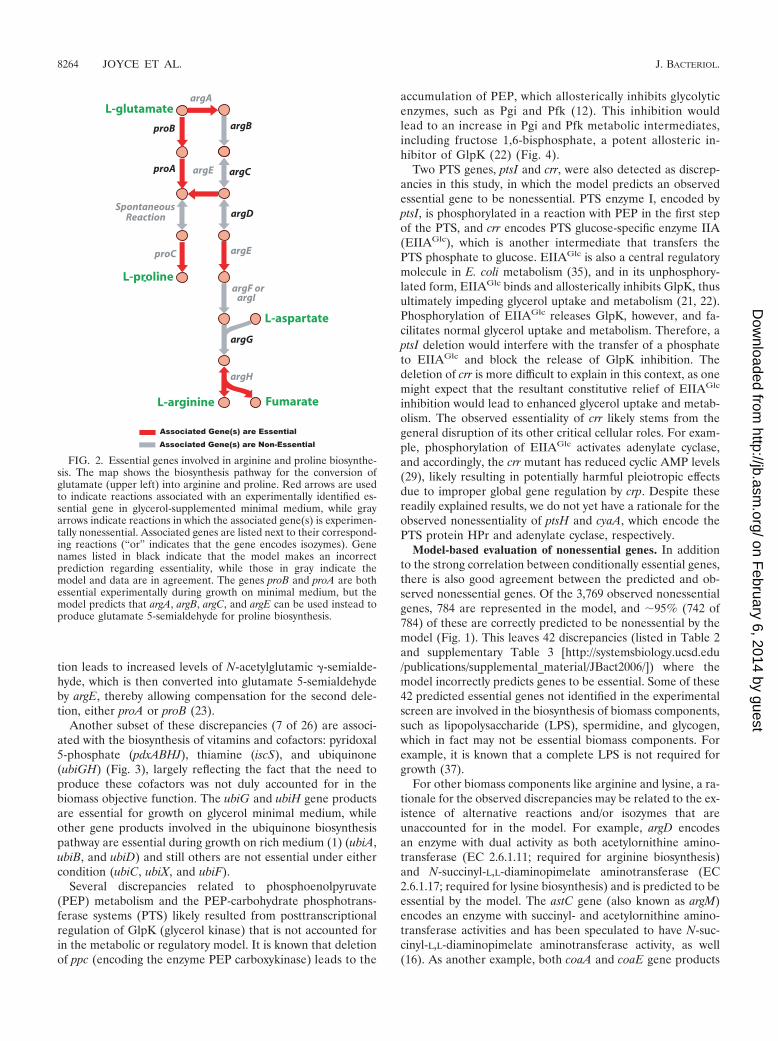
tion leads to increased levels of N-acetylglutamic �-semialde-hyde, which is then converted into glutamate 5-semialdehydeby argE, thereby allowing compensation for the second dele-tion, either proA or proB (23).
Another subset of these discrepancies (7 of 26) are associ-ated with the biosynthesis of vitamins and cofactors: pyridoxal5-phosphate (pdxABHJ), thiamine (iscS), and ubiquinone(ubiGH) (Fig. 3), largely reflecting the fact that the need toproduce these cofactors was not duly accounted for in thebiomass objective function. The ubiG and ubiH gene productsare essential for growth on glycerol minimal medium, whileother gene products involved in the ubiquinone biosynthesispathway are essential during growth on rich medium (1) (ubiA,ubiB, and ubiD) and still others are not essential under eithercondition (ubiC, ubiX, and ubiF).
Several discrepancies related to phosphoenolpyruvate(PEP) metabolism and the PEP-carbohydrate phosphotrans-ferase systems (PTS) likely resulted from posttranscriptionalregulation of GlpK (glycerol kinase) that is not accounted forin the metabolic or regulatory model. It is known that deletionof ppc (encoding the enzyme PEP carboxykinase) leads to the
accumulation of PEP, which allosterically inhibits glycolyticenzymes, such as Pgi and Pfk (12). This inhibition wouldlead to an increase in Pgi and Pfk metabolic intermediates,including fructose 1,6-bisphosphate, a potent allosteric in-hibitor of GlpK (22) (Fig. 4).
Two PTS genes, ptsI and crr, were also detected as discrep-ancies in this study, in which the model predicts an observedessential gene to be nonessential. PTS enzyme I, encoded byptsI, is phosphorylated in a reaction with PEP in the first stepof the PTS, and crr encodes PTS glucose-specific enzyme IIA(EIIAGlc), which is another intermediate that transfers thePTS phosphate to glucose. EIIAGlc is also a central regulatorymolecule in E. coli metabolism (35), and in its unphosphory-lated form, EIIAGlc binds and allosterically inhibits GlpK, thusultimately impeding glycerol uptake and metabolism (21, 22).Phosphorylation of EIIAGlc releases GlpK, however, and fa-cilitates normal glycerol uptake and metabolism. Therefore, aptsI deletion would interfere with the transfer of a phosphateto EIIAGlc and block the release of GlpK inhibition. Thedeletion of crr is more difficult to explain in this context, as onemight expect that the resultant constitutive relief of EIIAGlc
inhibition would lead to enhanced glycerol uptake and metab-olism. The observed essentiality of crr likely stems from thegeneral disruption of its other critical cellular roles. For exam-ple, phosphorylation of EIIAGlc activates adenylate cyclase,and accordingly, the crr mutant has reduced cyclic AMP levels(29), likely resulting in potentially harmful pleiotropic effectsdue to improper global gene regulation by crp. Despite thesereadily explained results, we do not yet have a rationale for theobserved nonessentiality of ptsH and cyaA, which encode thePTS protein HPr and adenylate cyclase, respectively.
Model-based evaluation of nonessential genes. In additionto the strong correlation between conditionally essential genes,there is also good agreement between the predicted and ob-served nonessential genes. Of the 3,769 observed nonessentialgenes, 784 are represented in the model, and �95% (742 of784) of these are correctly predicted to be nonessential by themodel (Fig. 1). This leaves 42 discrepancies (listed in Table 2and supplementary Table 3 [http://systemsbiology.ucsd.edu/publications/supplemental_material/JBact2006/]) where themodel incorrectly predicts genes to be essential. Some of these42 predicted essential genes not identified in the experimentalscreen are involved in the biosynthesis of biomass components,such as lipopolysaccharide (LPS), spermidine, and glycogen,which in fact may not be essential biomass components. Forexample, it is known that a complete LPS is not required forgrowth (37).
For other biomass components like arginine and lysine, a ra-tionale for the observed discrepancies may be related to the ex-istence of alternative reactions and/or isozymes that areunaccounted for in the model. For example, argD encodesan enzyme with dual activity as both acetylornithine amino-transferase (EC 2.6.1.11; required for arginine biosynthesis)and N-succinyl-L,L-diaminopimelate aminotransferase (EC2.6.1.17; required for lysine biosynthesis) and is predicted to beessential by the model. The astC gene (also known as argM)encodes an enzyme with succinyl- and acetylornithine amino-transferase activities and has been speculated to have N-suc-cinyl-L,L-diaminopimelate aminotransferase activity, as well(16). As another example, both coaA and coaE gene products
L-aspartate
L-arginine
L-glutamate
Fumarate
L-proline
proA
proB
argD
argB
argC
argG
argE
Spontaneous
proC
argF or
argH
argE
argA
Reaction
argI
FIG. 2. Essential genes involved in arginine and proline biosynthe-sis. The map shows the biosynthesis pathway for the conversion ofglutamate (upper left) into arginine and proline. Red arrows are usedto indicate reactions associated with an experimentally identified es-sential gene in glycerol-supplemented minimal medium, while grayarrows indicate reactions in which the associated gene(s) is experimen-tally nonessential. Associated genes are listed next to their correspond-ing reactions (“or” indicates that the gene encodes isozymes). Genenames listed in black indicate that the model makes an incorrectprediction regarding essentiality, while those in gray indicate themodel and data are in agreement. The genes proB and proA are bothessential experimentally during growth on minimal medium, but themodel predicts that argA, argB, argC, and argE can be used instead toproduce glutamate 5-semialdehyde for proline biosynthesis.
8264 JOYCE ET AL. J. BACTERIOL.
on February 6, 2014 by guest
http://jb.asm.org/
Dow
nloaded from
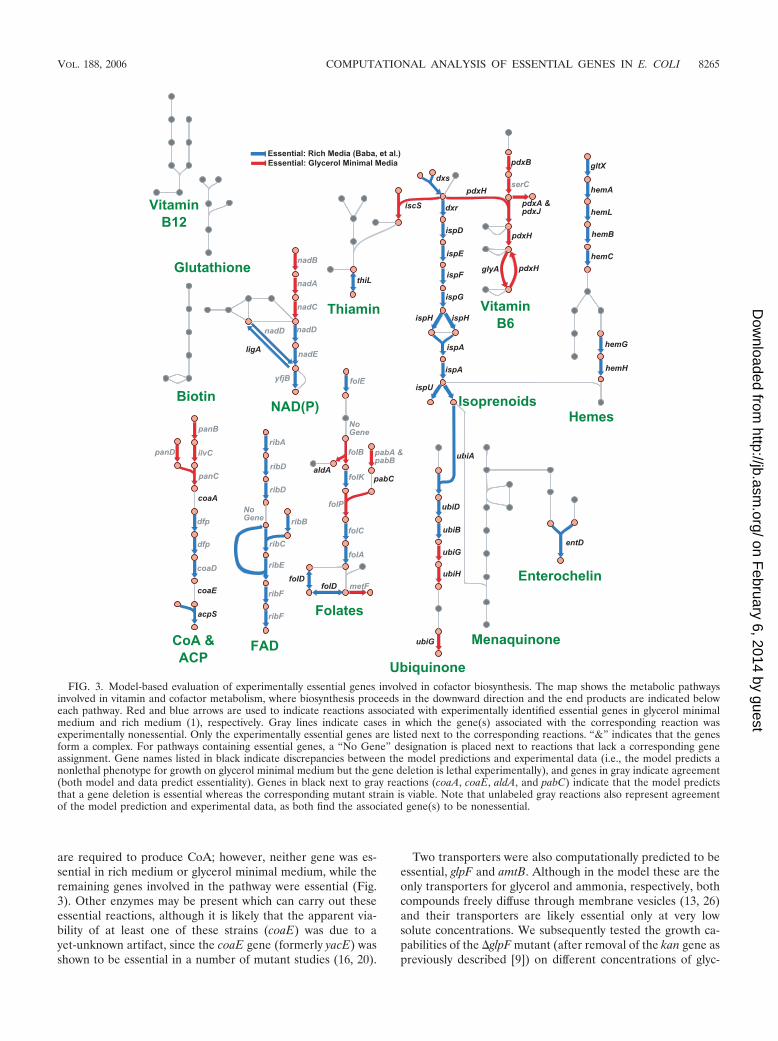
are required to produce CoA; however, neither gene was es-sential in rich medium or glycerol minimal medium, while theremaining genes involved in the pathway were essential (Fig.3). Other enzymes may be present which can carry out theseessential reactions, although it is likely that the apparent via-bility of at least one of these strains (coaE) was due to ayet-unknown artifact, since the coaE gene (formerly yacE) wasshown to be essential in a number of mutant studies (16, 20).
Two transporters were also computationally predicted to beessential, glpF and amtB. Although in the model these are theonly transporters for glycerol and ammonia, respectively, bothcompounds freely diffuse through membrane vesicles (13, 26)and their transporters are likely essential only at very lowsolute concentrations. We subsequently tested the growth ca-pabilities of the �glpF mutant (after removal of the kan gene aspreviously described [9]) on different concentrations of glyc-
FIG. 3. Model-based evaluation of experimentally essential genes involved in cofactor biosynthesis. The map shows the metabolic pathwaysinvolved in vitamin and cofactor metabolism, where biosynthesis proceeds in the downward direction and the end products are indicated beloweach pathway. Red and blue arrows are used to indicate reactions associated with experimentally identified essential genes in glycerol minimalmedium and rich medium (1), respectively. Gray lines indicate cases in which the gene(s) associated with the corresponding reaction wasexperimentally nonessential. Only the experimentally essential genes are listed next to the corresponding reactions. “&” indicates that the genesform a complex. For pathways containing essential genes, a “No Gene” designation is placed next to reactions that lack a corresponding geneassignment. Gene names listed in black indicate discrepancies between the model predictions and experimental data (i.e., the model predicts anonlethal phenotype for growth on glycerol minimal medium but the gene deletion is lethal experimentally), and genes in gray indicate agreement(both model and data predict essentiality). Genes in black next to gray reactions (coaA, coaE, aldA, and pabC) indicate that the model predictsthat a gene deletion is essential whereas the corresponding mutant strain is viable. Note that unlabeled gray reactions also represent agreementof the model prediction and experimental data, as both find the associated gene(s) to be nonessential.
VOL. 188, 2006 COMPUTATIONAL ANALYSIS OF ESSENTIAL GENES IN E. COLI 8265
on February 6, 2014 by guest
http://jb.asm.org/
Dow
nloaded from
erol to confirm this hypothesis. As the glycerol concentrationswere reduced (from 2 g/liter to 0.25 g/liter), the �glpF mutantstrain had increasingly lower growth rates than the BW25113parental strain (see the supplementary figure [http://systemsbiology.ucsd.edu/publications/supplemental_material/JBact2006/]). At a glycerol concentration of 0.125 g/liter, theparental strain was able to grow at a lower rate, whereasgrowth for the �glpF mutant strain was abolished. Similarobservations have been made in previous ammonium-limitedgrowth experiments for amtB mutants, and it was speculatedthat 10 �M NH4
� concentrations would be needed to seegrowth defects in �amtB strains (46).
Combined analysis of both essential and nonessential genesindicated a total of 68 discrepancies (only �8% of total pre-dictions) between experimental and computational essentialityassignments (Table 2). These discrepancies can be groupedinto three types, pointing to possible model improvements withrespect to boundary conditions (a formula for essential bio-mass components), gene-reaction associations (annotations),and quantitative constraints for the passive uptake of nutrients(nonspecific transport).
Comparison of genome scale conditional-essentiality datasets. In the recently published description of the “Keio collec-tion” (1), the authors described the conditional essentiality ofthe single-gene knockout strains when grown on glucose-sup-plemented minimal 3-N-(morpholino) propane sulfonate(MOPS) medium. Using this data set, we identified the 119slowest growers on glucose-supplemented minimal medium byranking the ODs measured at 24 h. For the purposes of thisanalysis, this subset represents the conditionally essential genesrequired for growth on glucose minimal medium. The collec-tion of conditionally essential genes largely overlaps the glu-cose-specific and glycerol-specific data sets (Fig. 5). The genesfound in this overlapping group primarily include those re-quired to form biomass components in the absence of richmedium, such as nucleotides and amino acids, as well as thoseneeded to generate required cofactors, such as NAD(P), CoA,folates, and pyridoxal 5-phosphate. Accordingly, these genesrepresent a conserved conditionally essential core that is re-quired for E. coli to grow under minimally supplementedgrowth conditions and is not required for growth under rich(i.e., LB medium) conditions.
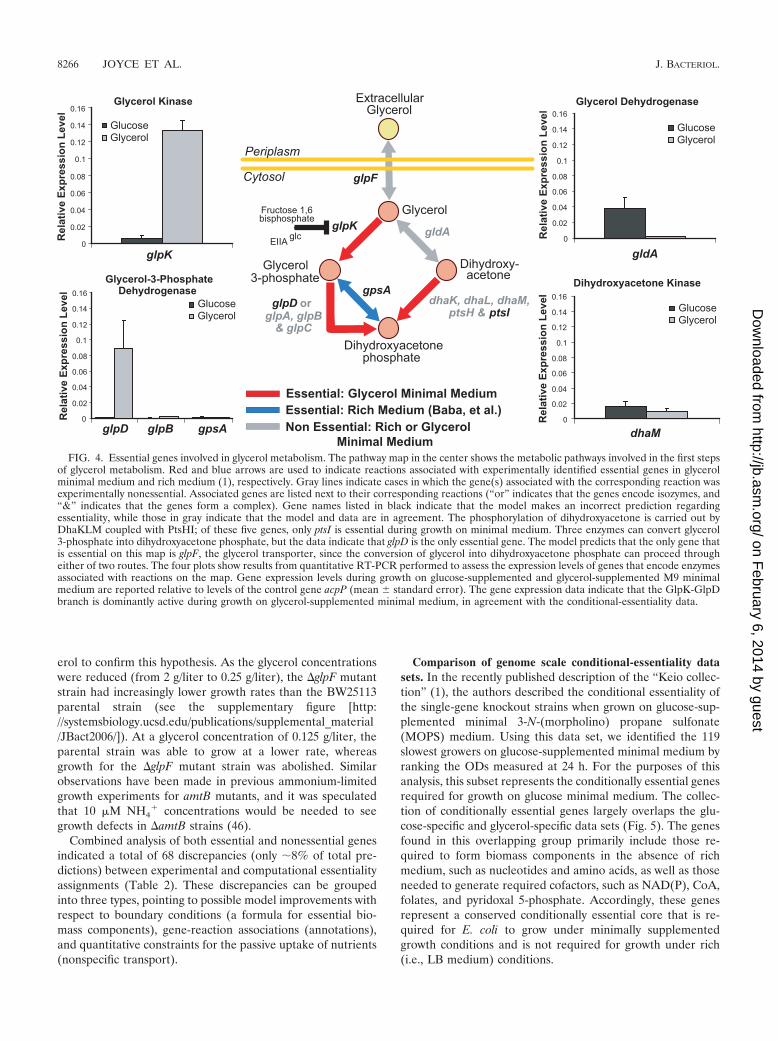
FIG. 4. Essential genes involved in glycerol metabolism. The pathway map in the center shows the metabolic pathways involved in the first stepsof glycerol metabolism. Red and blue arrows are used to indicate reactions associated with experimentally identified essential genes in glycerolminimal medium and rich medium (1), respectively. Gray lines indicate cases in which the gene(s) associated with the corresponding reaction wasexperimentally nonessential. Associated genes are listed next to their corresponding reactions (“or” indicates that the genes encode isozymes, and“&” indicates that the genes form a complex). Gene names listed in black indicate that the model makes an incorrect prediction regardingessentiality, while those in gray indicate that the model and data are in agreement. The phosphorylation of dihydroxyacetone is carried out byDhaKLM coupled with PtsHI; of these five genes, only ptsI is essential during growth on minimal medium. Three enzymes can convert glycerol3-phosphate into dihydroxyacetone phosphate, but the data indicate that glpD is the only essential gene. The model predicts that the only gene thatis essential on this map is glpF, the glycerol transporter, since the conversion of glycerol into dihydroxyacetone phosphate can proceed througheither of two routes. The four plots show results from quantitative RT-PCR performed to assess the expression levels of genes that encode enzymesassociated with reactions on the map. Gene expression levels during growth on glucose-supplemented and glycerol-supplemented M9 minimalmedium are reported relative to levels of the control gene acpP (mean � standard error). The gene expression data indicate that the GlpK-GlpDbranch is dominantly active during growth on glycerol-supplemented minimal medium, in agreement with the conditional-essentiality data.
8266 JOYCE ET AL. J. BACTERIOL.
on February 6, 2014 by guest
http://jb.asm.org/
Dow
nloaded from
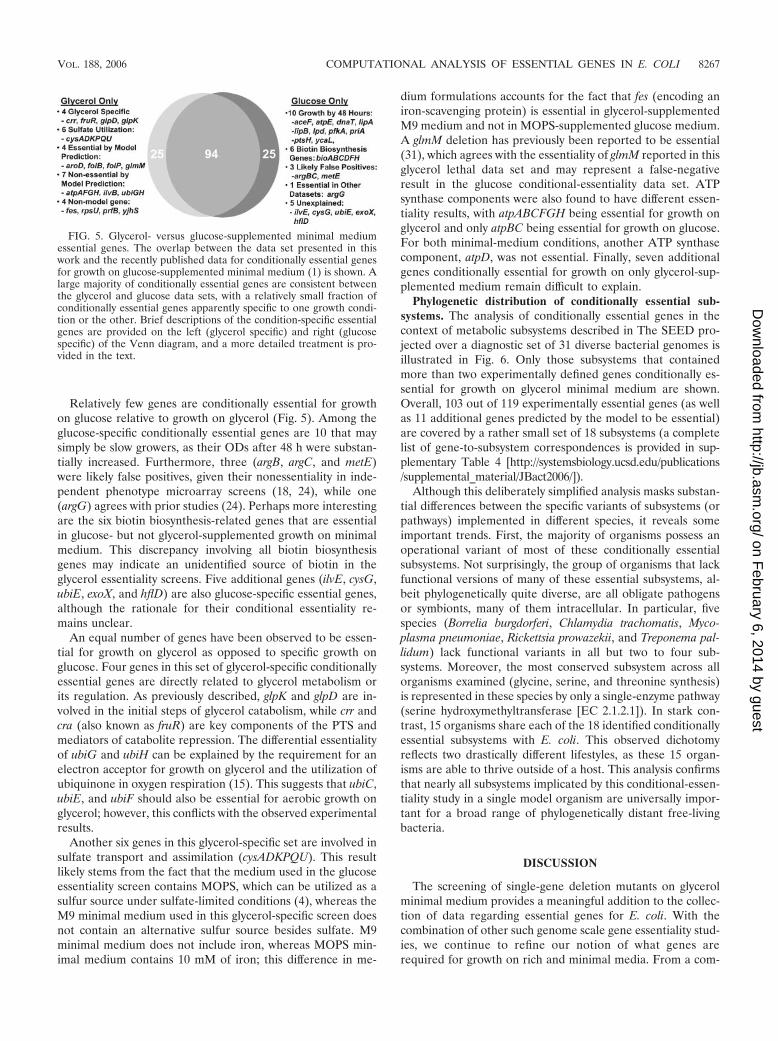
Relatively few genes are conditionally essential for growthon glucose relative to growth on glycerol (Fig. 5). Among theglucose-specific conditionally essential genes are 10 that maysimply be slow growers, as their ODs after 48 h were substan-tially increased. Furthermore, three (argB, argC, and metE)were likely false positives, given their nonessentiality in inde-pendent phenotype microarray screens (18, 24), while one(argG) agrees with prior studies (24). Perhaps more interestingare the six biotin biosynthesis-related genes that are essentialin glucose- but not glycerol-supplemented growth on minimalmedium. This discrepancy involving all biotin biosynthesisgenes may indicate an unidentified source of biotin in theglycerol essentiality screens. Five additional genes (ilvE, cysG,ubiE, exoX, and hflD) are also glucose-specific essential genes,although the rationale for their conditional essentiality re-mains unclear.
An equal number of genes have been observed to be essen-tial for growth on glycerol as opposed to specific growth onglucose. Four genes in this set of glycerol-specific conditionallyessential genes are directly related to glycerol metabolism orits regulation. As previously described, glpK and glpD are in-volved in the initial steps of glycerol catabolism, while crr andcra (also known as fruR) are key components of the PTS andmediators of catabolite repression. The differential essentialityof ubiG and ubiH can be explained by the requirement for anelectron acceptor for growth on glycerol and the utilization ofubiquinone in oxygen respiration (15). This suggests that ubiC,ubiE, and ubiF should also be essential for aerobic growth onglycerol; however, this conflicts with the observed experimentalresults.
Another six genes in this glycerol-specific set are involved insulfate transport and assimilation (cysADKPQU). This resultlikely stems from the fact that the medium used in the glucoseessentiality screen contains MOPS, which can be utilized as asulfur source under sulfate-limited conditions (4), whereas theM9 minimal medium used in this glycerol-specific screen doesnot contain an alternative sulfur source besides sulfate. M9minimal medium does not include iron, whereas MOPS min-imal medium contains 10 mM of iron; this difference in me-
dium formulations accounts for the fact that fes (encoding aniron-scavenging protein) is essential in glycerol-supplementedM9 medium and not in MOPS-supplemented glucose medium.A glmM deletion has previously been reported to be essential(31), which agrees with the essentiality of glmM reported in thisglycerol lethal data set and may represent a false-negativeresult in the glucose conditional-essentiality data set. ATPsynthase components were also found to have different essen-tiality results, with atpABCFGH being essential for growth onglycerol and only atpBC being essential for growth on glucose.For both minimal-medium conditions, another ATP synthasecomponent, atpD, was not essential. Finally, seven additionalgenes conditionally essential for growth on only glycerol-sup-plemented medium remain difficult to explain.
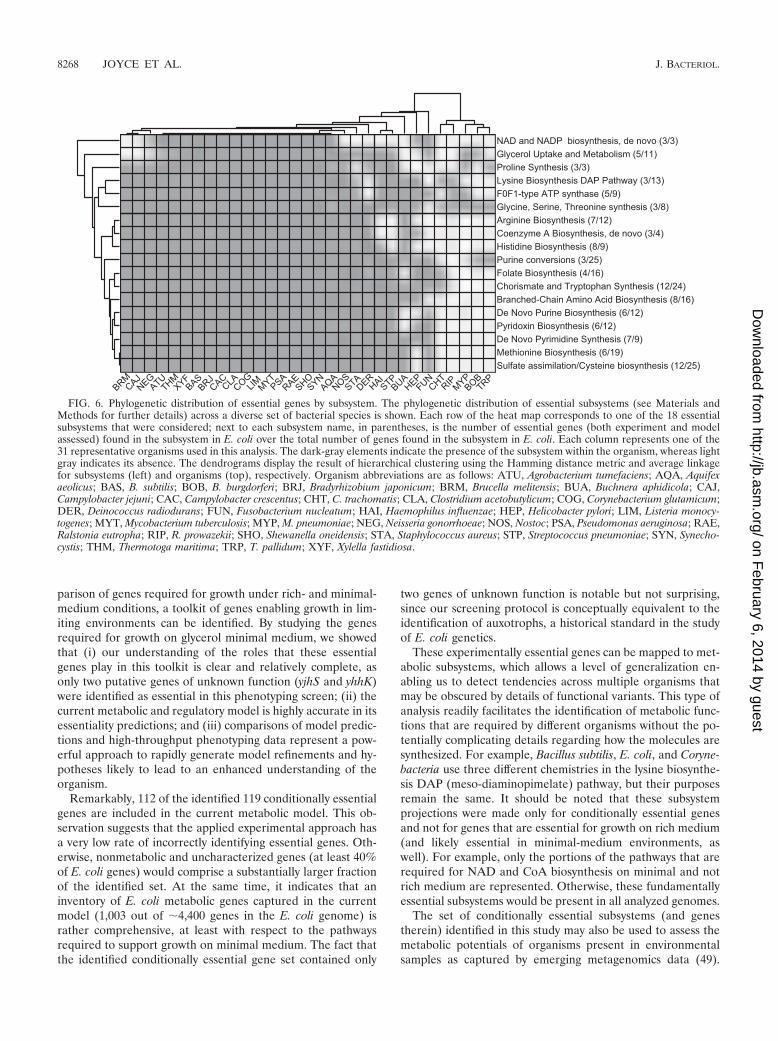
Phylogenetic distribution of conditionally essential sub-systems. The analysis of conditionally essential genes in thecontext of metabolic subsystems described in The SEED pro-jected over a diagnostic set of 31 diverse bacterial genomes isillustrated in Fig. 6. Only those subsystems that containedmore than two experimentally defined genes conditionally es-sential for growth on glycerol minimal medium are shown.Overall, 103 out of 119 experimentally essential genes (as wellas 11 additional genes predicted by the model to be essential)are covered by a rather small set of 18 subsystems (a completelist of gene-to-subsystem correspondences is provided in sup-plementary Table 4 [http://systemsbiology.ucsd.edu/publications/supplemental_material/JBact2006/]).
Although this deliberately simplified analysis masks substan-tial differences between the specific variants of subsystems (orpathways) implemented in different species, it reveals someimportant trends. First, the majority of organisms possess anoperational variant of most of these conditionally essentialsubsystems. Not surprisingly, the group of organisms that lackfunctional versions of many of these essential subsystems, al-beit phylogenetically quite diverse, are all obligate pathogensor symbionts, many of them intracellular. In particular, fivespecies (Borrelia burgdorferi, Chlamydia trachomatis, Myco-plasma pneumoniae, Rickettsia prowazekii, and Treponema pal-lidum) lack functional variants in all but two to four sub-systems. Moreover, the most conserved subsystem across allorganisms examined (glycine, serine, and threonine synthesis)is represented in these species by only a single-enzyme pathway(serine hydroxymethyltransferase [EC 2.1.2.1]). In stark con-trast, 15 organisms share each of the 18 identified conditionallyessential subsystems with E. coli. This observed dichotomyreflects two drastically different lifestyles, as these 15 organ-isms are able to thrive outside of a host. This analysis confirmsthat nearly all subsystems implicated by this conditional-essen-tiality study in a single model organism are universally impor-tant for a broad range of phylogenetically distant free-livingbacteria.
DISCUSSION
The screening of single-gene deletion mutants on glycerolminimal medium provides a meaningful addition to the collec-tion of data regarding essential genes for E. coli. With thecombination of other such genome scale gene essentiality stud-ies, we continue to refine our notion of what genes arerequired for growth on rich and minimal media. From a com-
FIG. 5. Glycerol- versus glucose-supplemented minimal mediumessential genes. The overlap between the data set presented in thiswork and the recently published data for conditionally essential genesfor growth on glucose-supplemented minimal medium (1) is shown. Alarge majority of conditionally essential genes are consistent betweenthe glycerol and glucose data sets, with a relatively small fraction ofconditionally essential genes apparently specific to one growth condi-tion or the other. Brief descriptions of the condition-specific essentialgenes are provided on the left (glycerol specific) and right (glucosespecific) of the Venn diagram, and a more detailed treatment is pro-vided in the text.
VOL. 188, 2006 COMPUTATIONAL ANALYSIS OF ESSENTIAL GENES IN E. COLI 8267
on February 6, 2014 by guest
http://jb.asm.org/
Dow
nloaded from
parison of genes required for growth under rich- and minimal-medium conditions, a toolkit of genes enabling growth in lim-iting environments can be identified. By studying the genesrequired for growth on glycerol minimal medium, we showedthat (i) our understanding of the roles that these essentialgenes play in this toolkit is clear and relatively complete, asonly two putative genes of unknown function (yjhS and yhhK)were identified as essential in this phenotyping screen; (ii) thecurrent metabolic and regulatory model is highly accurate in itsessentiality predictions; and (iii) comparisons of model predic-tions and high-throughput phenotyping data represent a pow-erful approach to rapidly generate model refinements and hy-potheses likely to lead to an enhanced understanding of theorganism.
Remarkably, 112 of the identified 119 conditionally essentialgenes are included in the current metabolic model. This ob-servation suggests that the applied experimental approach hasa very low rate of incorrectly identifying essential genes. Oth-erwise, nonmetabolic and uncharacterized genes (at least 40%of E. coli genes) would comprise a substantially larger fractionof the identified set. At the same time, it indicates that aninventory of E. coli metabolic genes captured in the currentmodel (1,003 out of �4,400 genes in the E. coli genome) israther comprehensive, at least with respect to the pathwaysrequired to support growth on minimal medium. The fact thatthe identified conditionally essential gene set contained only
two genes of unknown function is notable but not surprising,since our screening protocol is conceptually equivalent to theidentification of auxotrophs, a historical standard in the studyof E. coli genetics.
These experimentally essential genes can be mapped to met-abolic subsystems, which allows a level of generalization en-abling us to detect tendencies across multiple organisms thatmay be obscured by details of functional variants. This type ofanalysis readily facilitates the identification of metabolic func-tions that are required by different organisms without the po-tentially complicating details regarding how the molecules aresynthesized. For example, Bacillus subtilis, E. coli, and Coryne-bacteria use three different chemistries in the lysine biosynthe-sis DAP (meso-diaminopimelate) pathway, but their purposesremain the same. It should be noted that these subsystemprojections were made only for conditionally essential genesand not for genes that are essential for growth on rich medium(and likely essential in minimal-medium environments, aswell). For example, only the portions of the pathways that arerequired for NAD and CoA biosynthesis on minimal and notrich medium are represented. Otherwise, these fundamentallyessential subsystems would be present in all analyzed genomes.
The set of conditionally essential subsystems (and genestherein) identified in this study may also be used to assess themetabolic potentials of organisms present in environmentalsamples as captured by emerging metagenomics data (49).
FIG. 6. Phylogenetic distribution of essential genes by subsystem. The phylogenetic distribution of essential subsystems (see Materials andMethods for further details) across a diverse set of bacterial species is shown. Each row of the heat map corresponds to one of the 18 essentialsubsystems that were considered; next to each subsystem name, in parentheses, is the number of essential genes (both experiment and modelassessed) found in the subsystem in E. coli over the total number of genes found in the subsystem in E. coli. Each column represents one of the31 representative organisms used in this analysis. The dark-gray elements indicate the presence of the subsystem within the organism, whereas lightgray indicates its absence. The dendrograms display the result of hierarchical clustering using the Hamming distance metric and average linkagefor subsystems (left) and organisms (top), respectively. Organism abbreviations are as follows: ATU, Agrobacterium tumefaciens; AQA, Aquifexaeolicus; BAS, B. subtilis; BOB, B. burgdorferi; BRJ, Bradyrhizobium japonicum; BRM, Brucella melitensis; BUA, Buchnera aphidicola; CAJ,Campylobacter jejuni; CAC, Campylobacter crescentus; CHT, C. trachomatis; CLA, Clostridium acetobutylicum; COG, Corynebacterium glutamicum;DER, Deinococcus radiodurans; FUN, Fusobacterium nucleatum; HAI, Haemophilus influenzae; HEP, Helicobacter pylori; LIM, Listeria monocy-togenes; MYT, Mycobacterium tuberculosis; MYP, M. pneumoniae; NEG, Neisseria gonorrhoeae; NOS, Nostoc; PSA, Pseudomonas aeruginosa; RAE,Ralstonia eutropha; RIP, R. prowazekii; SHO, Shewanella oneidensis; STA, Staphylococcus aureus; STP, Streptococcus pneumoniae; SYN, Synecho-cystis; THM, Thermotoga maritima; TRP, T. pallidum; XYF, Xylella fastidiosa.
8268 JOYCE ET AL. J. BACTERIOL.
on February 6, 2014 by guest
http://jb.asm.org/
Dow
nloaded from
Researchers will be able to rapidly assess the pathways presentwithin an environmental sample and use the essentiality infor-mation to develop potential laboratory medium formulationsto facilitate further controlled study in the laboratory (47).Furthermore, the presence of certain pathways and the ab-sence of others may provide insights into the microenviron-ment from which the sample was taken and also indicate localintracommunity relationships between species that are presentin the sample. This subsystem-based essentiality analysis ap-proach could be a useful tool to add to the growing compen-dium of methods (5, 41) being developed to analyze and in-terpret these complex data.
Further analysis of the generated gene essentiality data setwas made using a metabolic and regulatory model allowing thedata to be easily placed into biological context. Discrepanciesbetween model and experiment can be used to improve thepredictive capabilities of the model by indicating regions thatare not captured accurately by the models or, more impor-tantly, can point to areas in metabolism or regulation thatrequire further experimental interrogation. For example, anumber of independent gene deletion studies have shown thatsome genes involved in arginine biosynthesis are not essential(18, 24), but without these enzymes, the current literaturecannot explain how this essential amino acid is synthesized.Therefore, further experiments need to be conducted to eitheridentify novel arginine biosynthetic genes or determine whichmultifunctional enzymes can compensate for any perturbationof the genes.
Additionally, based on the experimental results, severalmodel improvements are suggested. Since a number of exper-imentally essential genes are involved in cofactor biosynthesis,a number of cofactors should be included in the biomass ob-jective function used to conduct the growth prediction simula-tion. These cofactors include pyridoxal-5-phosphate, isopre-noids, hemes, ACP, and ubiquinone. These will help correctfor the false negatives (lethal phenotypes with nonlethal modelpredictions) that account for a large number of discrepanciesin both minimal- and rich-medium phenotypes (data not shownfor rich medium). A wild-type biomass composition does notalways correlate with an essential biomass composition; forexample, only a core and not a complete LPS is required forcell survival (37). Accordingly, the essentiality of these andother biomass components can be refined or relaxed based onthe nonessentiality of the corresponding biosynthetic-pathwaygenes. These issues are being addressed in a forthcoming up-dated metabolic reconstruction of E. coli (A. Feist and B. O.Palsson, personal communication) and represent a significantadvance.
Model improvements are also suggested with regard tothe first steps of glycerol metabolism (Fig. 4). As previouslynoted, analysis of the false positives suggests that glycerolimport can occur by passive transport across the cell mem-brane in the absence of the glpF-encoded transporter. Ad-ditionally, the initial enzymatic steps required to convertglycerol to dihydroxyacetone phosphate appear to be exclu-sively mediated by GlpK and GlpD rather than by GldA andthe DhaKLM-PtsHI complex. This pathway bias is likely dueto transcriptional regulatory effects. Indeed, the elevatedexpression of glpK and glpD during growth on glycerol re-vealed by quantitative RT-PCR (Fig. 4) further supports the
notion that the GlpK-GlpD branch is dominant under theseconditions. Furthermore, a recent study showed that theDhaR transcriptional regulator specifically upregulates thegenes encoding DhaKLM in the presence of dihydroxy-acetone, but not glycerol (2). Under the conditions utilizedin this study, quantitative RT-PCR of dhaM (Fig. 4) showedthat the dhaKLM genes are only minimally expressed, leav-ing the alternative glycerol metabolic pathway dormant.Including the recently characterized DhaR regulatory inter-action (2) in the integrated regulatory-metabolic model willreadily correct this discrepancy.
In summary, this high-throughput phenotyping screen pro-vides a significantly enhanced view of the conditionally essen-tial gene set required for growth under minimally supple-mented growth conditions and additionally represents the mostcomprehensive assessment of the constraint-based metabolicmodel of E. coli conducted to date. Moreover, this study fur-ther highlights the utility of using genome scale models as acontext for content in interpreting and analyzing complex high-throughput data sets. This powerful synergistic approach of notonly using models as data analysis tools, but also using high-throughput data as feedback for model improvement, is be-coming a paradigm that will continue to drive systems biologyresearch forward.
ACKNOWLEDGMENTS
We thank Adam Feist for his critical reading of the manuscript;Trina Patel, Vasiliy Portnoy, and Eric Knight for technical assistance;and Christian Barrett and other members of the Palsson laboratory forinsightful discussions and suggestions.
We gratefully acknowledge the support of the NIH Protein Struc-ture Initiative, grant numbers P50 GM62411 and U54 GM074898, andalso grant no. NIH R01 GM5708.
Bernhard Palsson has a financial interest in Genomatica, Inc. Al-though the NIH R01 GM5708 grant has been identified for conflict ofinterest management based on the overall scope of the project and itspotential to benefit Genomatica, Inc., the research findings included inthis publication do not necessarily directly relate to the interests ofGenomatica, Inc.
REFERENCES
1. Baba, T., T. Ara, M. Hasegawa, Y. Takai, Y. Okumura, M. Baba, K. A.Datsenko, M. Tomita, B. L. Wanner, and H. Mori. 2006. Construction ofEscherichia coli K-12 in-frame, single-gene knockout mutants: the Keio col-lection. Mol. Syst. Biol. [Online.] doi:10.1038/msb4100050.
2. Bachler, C., P. Schneider, P. Bahler, A. Lustig, and B. Erni. 2005. Esche-richia coli dihydroxyacetone kinase controls gene expression by binding totranscription factor DhaR. EMBO J. 24:283–293.
3. Boutros, M., A. A. Kiger, S. Armknecht, K. Kerr, M. Hild, B. Koch, S. A.Haas, R. Paro, N. Perrimon, and the Heidelberg Fly Array Consortium.2004. Genome-wide RNAi analysis of growth and viability in Drosophilacells. Science 303:832–835.
4. Cayley, S., M. T. Record, Jr., and B. A. Lewis. 1989. Accumulation of3-(N-morpholino)propanesulfonate by osmotically stressed Escherichia coliK-12. J. Bacteriol. 171:3597–3602.
5. Chen, K., and L. Pachter. 2005. Bioinformatics for whole-genome shotgunsequencing of microbial communities. PLOS Comput. Biol. 1:106–112.
6. Covert, M. W., E. M. Knight, J. L. Reed, M. J. Herrgard, and B. O. Palsson.2004. Integrating high-throughput and computational data elucidates bacte-rial networks. Nature 429:92–96.
7. Covert, M. W., and B. O. Palsson. 2002. Transcriptional regulation in con-straints-based metabolic models of Escherichia coli. J. Biol. Chem. 277:28058–28064.
8. Covert, M. W., C. H. Schilling, and B. Palsson. 2001. Regulation of geneexpression in flux balance models of metabolism. J. Theor. Biol. 213:73–88.
9. Datsenko, K. A., and B. L. Wanner. 2000. One-step inactivation of chromo-somal genes in Escherichia coli K-12 using PCR products. Proc. Natl. Acad.Sci. USA 97:6640–6645.
10. Earhardt, C. F. 1996. Uptake and metabolism of iron and molybdenum, p.1075–1090. In F. C. Neidhardt (ed.), Escherichia coli and Salmonella: cellularand molecular biology, vol. 1. ASM Press, Washington, D. C.
VOL. 188, 2006 COMPUTATIONAL ANALYSIS OF ESSENTIAL GENES IN E. COLI 8269
on February 6, 2014 by guest
http://jb.asm.org/
Dow
nloaded from
11. Edwards, J. S., R. U. Ibarra, and B. O. Palsson. 2001. In silico predictions ofEscherichia coli metabolic capabilities are consistent with experimental data.Nat. Biotechnol. 19:125–130.
12. Fraenkel, D. G. 1996. Glycolysis, p. 189–198. In F. C. Neidhardt (ed.),Escherichia coli and Salmonella, vol. 1. ASM Press, Washington, D.C.
13. Fu, D., A. Libson, L. J. Miercke, C. Weitzman, P. Nollert, J. Krucinski, andR. M. Stroud. 2000. Structure of a glycerol-conducting channel and the basisfor its selectivity. Science 290:481–486.
14. Gay, N. J. 1984. Construction and characterization of an Escherichia colistrain with a uncI mutation. J. Bacteriol. 158:820–825.
15. Gennis, R. B., and V. Stewart. 1996. Respiration, p. 217–261. In F. C.Neidhardt (ed.), Escherichia coli and Salmonella, vol. 1. ASM Press, Wash-ington, D.C.
16. Gerdes, S. Y., M. D. Scholle, J. W. Campbell, G. Balazsi, E. Ravasz, M. D.Daugherty, A. L. Somera, N. C. Kyrpides, I. Anderson, M. S. Gelfand, A.Bhattacharya, V. Kapatral, M. D’Souza, M. V. Baev, Y. Grechkin, F. Mseeh,M. Y. Fonstein, R. Overbeek, A. L. Barabasi, Z. N. Oltvai, and A. L. Oster-man. 2003. Experimental determination and system level analysis of essentialgenes in Escherichia coli MG1655. J. Bacteriol. 185:5673–5684.
17. Giaever, G., A. M. Chu, L. Ni, C. Connelly, L. Riles, S. Veronneau, S. Dow,A. Lucau-Danila, K. Anderson, B. Andre, A. P. Arkin, A. Astromoff, M.El-Bakkoury, R. Bangham, R. Benito, S. Brachat, S. Campanaro, M. Cur-tiss, K. Davis, A. Deutschbauer, K. D. Entian, P. Flaherty, F. Foury, D. J.Garfinkel, M. Gerstein, D. Gotte, U. Guldener, J. H. Hegemann, S. Hempel,Z. Herman, D. F. Jaramillo, D. E. Kelly, S. L. Kelly, P. Kotter, D. LaBonte,D. C. Lamb, N. Lan, H. Liang, H. Liao, L. Liu, C. Luo, M. Lussier, R. Mao,P. Menard, S. L. Ooi, J. L. Revuelta, C. J. Roberts, M. Rose, P. Ross-Macdonald, B. Scherens, G. Schimmack, B. Shafer, D. D. Shoemaker, S.Sookhai-Mahadeo, R. K. Storms, J. N. Strathern, G. Valle, M. Voet, G.Volckaert, C. Y. Wang, T. R. Ward, J. Wilhelmy, E. A. Winzeler, Y. Yang, G.Yen, E. Youngman, K. Yu, H. Bussey, J. D. Boeke, M. Snyder, P. Philippsen,R. W. Davis, and M. Johnston. 2002. Functional profiling of the Saccharo-myces cerevisiae genome. Nature 418:387–391.
18. Glasner, J. D., P. Liss, G. Plunkett III, A. Darling, T. Prasad, M. Rusch, A.Byrnes, M. Gilson, B. Biehl, F. R. Blattner, and N. T. Perna. 2003. ASAP, asystematic annotation package for community analysis of genomes. NucleicAcids Res. 31:147–151.
19. Glass, J. I., N. Assad-Garcia, N. Alperovich, S. Yooseph, M. R. Lewis, M.Maruf, C. A. Hutchison III, H. O. Smith, and J. C. Venter. 2006. Essentialgenes of a minimal bacterium. Proc. Natl. Acad. Sci. USA 103:425–430.
20. Hare, R. S., S. S. Walker, T. E. Dorman, J. R. Greene, L. M. Guzman, T. J.Kenney, M. C. Sulavik, K. Baradaran, C. Houseweart, H. Yu, Z. Foldes, A.Motzer, M. Walbridge, G. H. Shimer, Jr., and K. J. Shaw. 2001. Geneticfootprinting in bacteria. J. Bacteriol. 183:1694–1706.
21. Holtman, C. K., A. C. Pawlyk, N. Meadow, S. Roseman, and D. W. Pettigrew.2001. IIA(Glc) allosteric control of Escherichia coli glycerol kinase: bindingsite cooperative transitions and cation-promoted association by Zinc(II).Biochemistry 40:14302–14308.
22. Holtman, C. K., A. C. Pawlyk, N. D. Meadow, and D. W. Pettigrew. 2001.Reverse genetics of Escherichia coli glycerol kinase allosteric regulationand glucose control of glycerol utilization in vivo. J. Bacteriol. 183:3336–3344.
23. Itikawa, H., S. Baumberg, and H. J. Vogel. 1968. Enzymic basis for a geneticsuppression: accumulation and deacylation of N-acetylglutamic gamma-semialdehyde in enterobacterial mutants. Biochim. Biophys. Acta 159:547–550.
24. Ito, M., T. Baba, and H. Mori. 2005. Functional analysis of 1440 Escherichiacoli genes using the combination of knock-out library and phenotype mi-croarrays. Metab. Eng. 7:318–327.
25. Jacobs, M. A., A. Alwood, I. Thaipisuttikul, D. Spencer, E. Haugen, S. Ernst,O. Will, R. Kaul, C. Raymond, R. Levy, L. Chun-Rong, D. Guenthner, D.Bovee, M. V. Olson, and C. Manoil. 2003. Comprehensive transposon mutantlibrary of Pseudomonas aeruginosa. Proc. Natl. Acad. Sci. USA 100:14339–14344.
26. Khademi, S., J. O’Connell III, J. Remis, Y. Robles-Colmenares, L. J.Miercke, and R. M. Stroud. 2004. Mechanism of ammonia transport byAmt/MEP/Rh: structure of AmtB at 1.35 Å. Science 305:1587–1594.
27. Kobayashi, K., S. D. Ehrlich, A. Albertini, G. Amati, K. K. Andersen, M.Arnaud, K. Asai, S. Ashikaga, S. Aymerich, P. Bessieres, F. Boland, S. C.Brignell, S. Bron, K. Bunai, J. Chapuis, L. C. Christiansen, A. Danchin, M.Debarbouille, E. Dervyn, E. Deuerling, K. Devine, S. K. Devine, O. Dreesen,J. Errington, S. Fillinger, S. J. Foster, Y. Fujita, A. Galizzi, R. Gardan, C.Eschevins, T. Fukushima, K. Haga, C. R. Harwood, M. Hecker, D. Hosoya,M. F. Hullo, H. Kakeshita, D. Karamata, Y. Kasahara, F. Kawamura, K.Koga, P. Koski, R. Kuwana, D. Imamura, M. Ishimaru, S. Ishikawa, I. Ishio,D. Le Coq, A. Masson, C. Mauel, R. Meima, R. P. Mellado, A. Moir, S.Moriya, E. Nagakawa, H. Nanamiya, S. Nakai, P. Nygaard, M. Ogura, T.Ohanan, M. O’Reilly, M. O’Rourke, Z. Pragai, H. M. Pooley, G. Rapoport,J. P. Rawlins, L. A. Rivas, C. Rivolta, A. Sadaie, Y. Sadaie, M. Sarvas, T.
Sato, H. H. Saxild, E. Scanlan, W. Schumann, J. F. Seegers, J. Sekiguchi, A.Sekowska, S. J. Seror, M. Simon, P. Stragier, R. Studer, H. Takamatsu,T. Tanaka, M. Takeuchi, H. B. Thomaides, V. Vagner, J. M. van Dijl,K. Watabe, A. Wipat, H. Yamamoto, M. Yamamoto, Y. Yamamoto, K.Yamane, K. Yata, K. Yoshida, H. Yoshikawa, U. Zuber, and N. Ogasawara.2003. Essential Bacillus subtilis genes. Proc. Natl. Acad. Sci. USA 100:4678–4683.
28. Koonin, E. V. 2003. Comparative genomics, minimal gene-sets and the lastuniversal common ancestor. Nat. Rev. Microbiol. 1:127–136.
29. Levy, S., G. Q. Zeng, and A. Danchin. 1990. Cyclic AMP synthesis in Esch-erichia coli strains bearing known deletions in the pts phosphotransferaseoperon. Gene 86:27–33.
30. Maeda, I., Y. Kohara, M. Yamamoto, and A. Sugimoto. 2001. Large-scaleanalysis of gene function in Caenorhabditis elegans by high-throughputRNAi. Curr. Biol. 11:171–176.
31. Mengin-Lecreulx, D., and J. van Heijenoort. 1996. Characterization of theessential gene glmM encoding phosphoglucosamine mutase in Escherichiacoli. J. Biol. Chem. 271:32–39.
32. Merino, E., and C. Yanofsky. 2005. Transcription attenuation: a highlyconserved regulatory strategy used by bacteria. Trends Genet. 21:260–264.
33. Neuwald, A. F., B. R. Krishnan, I. Brikun, S. Kulakauskas, K. Suziedelis, T.Tomcsanyi, T. S. Leyh, and D. E. Berg. 1992. cysQ, a gene needed forcysteine synthesis in Escherichia coli K-12 only during aerobic growth. J.Bacteriol. 174:415–425.
34. Overbeek, R., T. Begley, R. M. Butler, J. V. Choudhuri, H. Y. Chuang, M.Cohoon, V. de Crecy-Lagard, N. Diaz, T. Disz, R. Edwards, M. Fonstein,E. D. Frank, S. Gerdes, E. M. Glass, A. Goesmann, A. Hanson, D. Iwata-Reuyl, R. Jensen, N. Jamshidi, L. Krause, M. Kubal, N. Larsen, B. Linke,A. C. McHardy, F. Meyer, H. Neuweger, G. Olsen, R. Olson, A. Osterman, V.Portnoy, G. D. Pusch, D. A. Rodionov, C. Ruckert, J. Steiner, R. Stevens,I. Thiele, O. Vassieva, Y. Ye, O. Zagnitko, and V. Vonstein. 2005. Thesubsystems approach to genome annotation and its use in the project toannotate 1000 genomes. Nucleic Acids Res. 33:5691–5702.
35. Postma, P. W., J. W. Lengeler, and G. R. Jacobson. 1996. Phosphoenolpyru-vate:carbohydrate phosphotransferase systems, p. 1149–1174. In F. C. Neid-hardt (ed.), Escherichia coli and Salmonella, vol. 1. ASM Press, Washington,D.C.
36. Price, N. D., J. L. Reed, and B. O. Palsson. 2004. Genome-scale models ofmicrobial cells: evaluating the consequences of constraints. Nat. Rev. Mi-crobiol. 2:886–897.
37. Raetz, C. R., and C. Whitfield. 2002. Lipopolysaccharide endotoxins. Annu.Rev. Biochem. 71:635–700.
38. Reed, J. L., I. Famili, I. Thiele, and B. O. Palsson. 2006. Towards multidi-mensional genome annotation. Nat. Rev. Genet. 7:130–141.
39. Reed, J. L., T. D. Vo, C. H. Schilling, and B. O. Palsson. 2003. An expandedgenome-scale model of Escherichia coli K-12 (iJR904 GSM/GPR). GenomeBiol. 4:R54.1–R54.12.
40. Riley, M., T. Abe, M. B. Arnaud, M. K. Berlyn, F. R. Blattner, R. R.Chaudhuri, J. D. Glasner, T. Horiuchi, I. M. Keseler, T. Kosuge, H. Mori,N. T. Perna, G. Plunkett III, K. E. Rudd, M. H. Serres, G. H. Thomas, N. R.Thomson, D. Wishart, and B. L. Wanner. 2006. Escherichia coli K-12: acooperatively developed annotation snapshot—2005. Nucleic Acids Res. 34:1–9.
41. Rodriguez-Brito, B., F. Rohwer, and R. Edwards. 2006. An application ofstatistics to comparative metagenomics. BMC Bioinform. 7:162.
42. Sassetti, C. M., D. H. Boyd, and E. J. Rubin. 2001. Comprehensive identi-fication of conditionally essential genes in mycobacteria. Proc. Natl. Acad.Sci. USA 98:12712–12717.
43. Segre, D., D. Vitkup, and G. M. Church. 2002. Analysis of optimality innatural and perturbed metabolic networks. Proc. Natl. Acad. Sci. USA 99:15112–15117.
44. Shlomi, T., O. Berkman, and E. Ruppin. 2005. Regulatory on/off minimiza-tion of metabolic flux changes after genetic perturbations. Proc. Natl. Acad.Sci. USA 102:7695–7700.
45. Song, J. H., K. S. Ko, J. Y. Lee, J. Y. Baek, W. S. Oh, H. S. Yoon, J. Y. Jeong,and J. Chun. 2005. Identification of essential genes in Streptococcus pneu-moniae by allelic replacement mutagenesis. Mol. Cell. 19:365–374.
46. Soupene, E., L. He, D. Yan, and S. Kustu. 1998. Ammonia acquisition inenteric bacteria: physiological role of the ammonium/methylammoniumtransport B (AmtB) protein. Proc. Natl. Acad. Sci. USA 95:7030–7034.
47. Strous, M., E. Pelletier, S. Mangenot, T. Rattei, A. Lehner, M. W. Taylor, M.Horn, H. Daims, D. Bartol-Mavel, P. Wincker, V. Barbe, N. Fonknechten, D.Vallenet, B. Segurens, C. Schenowitz-Truong, C. Medigue, A. Collingro, B.Snel, B. E. Dutilh, H. J. Op den Camp, C. van der Drift, I. Cirpus, K. T. vande Pas-Schoonen, H. R. Harhangi, L. van Niftrik, M. Schmid, J. Keltjens, J.van de Vossenberg, B. Kartal, H. Meier, D. Frishman, M. A. Huynen, H. W.
8270 JOYCE ET AL. J. BACTERIOL.
on February 6, 2014 by guest
http://jb.asm.org/
Dow
nloaded from
Mewes, J. Weissenbach, M. S. Jetten, M. Wagner, and D. Le Paslier. 2006.Deciphering the evolution and metabolism of an anammox bacterium froma community genome. Nature 440:790–794.
48. Thanassi, J. A., S. L. Hartman-Neumann, T. J. Dougherty, B. A. Dougherty,and M. J. Pucci. 2002. Identification of 113 conserved essential genes usinga high-throughput gene disruption system in Streptococcus pneumoniae. Nu-cleic Acids Res. 30:3152–3162.
49. Tringe, S. G., and E. M. Rubin. 2005. Metagenomics: DNA sequencing ofenvironmental samples. Nat. Rev. Genet. 6:805–814.
50. Wessler, S. R., and J. M. Calvo. 1981. Control of leu operon expression inEscherichia coli by a transcription attenuation mechanism. J. Mol. Biol.149:579–597.
51. Ye, Y., A. Osterman, R. Overbeek, and A. Godzik. 2005. Automatic detectionof subsystem/pathway variants in genome analysis. Bioinformatics 21(Suppl.1):i478–486.
52. Zhou, L., X. H. Lei, B. R. Bochner, and B. L. Wanner. 2003. Phenotypemicroarray analysis of Escherichia coli K-12 mutants with deletions of alltwo-component systems. J. Bacteriol. 185:4956–4972.
VOL. 188, 2006 COMPUTATIONAL ANALYSIS OF ESSENTIAL GENES IN E. COLI 8271
on February 6, 2014 by guest
http://jb.asm.org/
Dow
nloaded from
Copyright © 2022 FDOKUMEN