EXPECT MORE - AnnualReports.com
136
EXPECT MORE 0 200 400 600 800 1000 1200 2017 2016 2015 2014 2013 2008 2003 1998 1993 ANNUAL REPORT 2017 Loans, Net of Unearned Income (in millions)
-
Upload
khangminh22 -
Category
Documents
-
view
4 -
download
0
Transcript of EXPECT MORE - AnnualReports.com

20
17
FIR
ST
GU
AR
AN
TY
BA
NC
SH
AR
ES
, INC
. AN
NU
AL
RE
PO
RT
www.fgb.net
EXPECT MORE
0
200
400
600
800
1000
1200
201720162015201420132008200319981993
ANNUAL REPORT 2017
Loans, Net of Unearned Income(in millions)

EXPECTMORE
RELIABLE DEPENDABLE
P
REDICTABLE

0
500
1000
1500
2000
201720162015201420132008200319981993
MORE GROWTH MORE SERVICE
MORE OPPORTUNITIES
1
10
49
20
55
12
20
17 6
10
118
13
3
7 21
15
12
12
18
9
1622
5
19
144
23 26
2524
27
MORE LOCATIONS
MORE CONVENIENCE MORE TECHNOLOGY
Total Deposits
EXPECT MORE 1

Table of Contents
Financial Snapshot ....................................................................................................Page 3Expect More ...............................................................................................................Page 42017 Accomplishments and Highlights ..................................................................Page 6FGBI ............................................................................................................................Page 7Letter from the Chief Executive Officer & President, Alton B. Lewis ................Page 8Report from the Chief Financial Officer, Eric J. Dosch ........................................Page 9Report from Senior Vice President, Glenn A. Duhon, Sr. ...................................Page 10Report from Area President, Dallas/Fort Worth/Waco, J. Douglas Sanders .....Page 11First Guaranty Bank Board of Directors ................................................................Page 12First Guaranty Bank Advisory Board .....................................................................Page 13First Guaranty Bank Officers ...................................................................................Page 14Performance Graphs .................................................................................................Page 15First Guaranty Bank Banking Centers Map and ATM Locations .......................Page 19Bossier City Grand Opening ....................................................................................Page 20Texas Welcome ...........................................................................................................Page 21First Guaranty Bank Departments and Banking Centers
Departments and Guaranty Square – Hammond .......................................Page 22Abbeville ...........................................................................................................Page 30Amite ................................................................................................................Page 30Benton ..............................................................................................................Page 31Bossier City ......................................................................................................Page 31Denham Springs ..............................................................................................Page 32Denton ..............................................................................................................Page 32Dubach .............................................................................................................Page 33Fort Worth ........................................................................................................Page 33Garland .............................................................................................................Page 34Greensburg .......................................................................................................Page 34Guaranty West – Hammond ..........................................................................Page 35Haynesville .......................................................................................................Page 35Homer ...............................................................................................................Page 36Independence ..................................................................................................Page 36Jennings ............................................................................................................Page 37Kentwood .........................................................................................................Page 37Kentwood West ................................................................................................Page 38McKinney .........................................................................................................Page 38Montpelier ........................................................................................................Page 39Oil City .............................................................................................................Page 39Ponchatoula .....................................................................................................Page 40Berryland – Ponchatoula ...............................................................................Page 40Vivian ................................................................................................................Page 41Waco .................................................................................................................Page 41Walker ...............................................................................................................Page 42Watson ..............................................................................................................Page 42
Community Impact ...................................................................................................Page 43Earning & Dividends ................................................................................................Page 60Banks Headquartered in Louisiana .........................................................................Page 61Our Mission, Values and Goals ...............................................................................Page 62Financial Table of Contents ......................................................................................Page 63Market for Registrants Common Equity ................................................................Page 131Corporate Information ..............................................................................................Page 132
2 2017 ANNUAL REPORT FIRST GUARANTY BANCSHARES, INC.
Visit www.fgb.net for additional information.
NASDAQ Stock Ticker Symbol: FGBI
Follow us on Facebook, Twitter and LinkedIn.
www.facebook.com/FirstGuarantyBank
twitter.com/FGBank
www.linkedin.com/company/514157
www.youtube.com/user/FirstGuarantyBank

Financial Snapshot
Book Value Growth Per One 1993 Share[1] (per common share)
Cash Dividends on Common Stock(In thousands)
Book Value per one 1993 share has increased from $3.70 to $43.49 since 1993.
First Guaranty has paid $66,896,000 in Cash Dividends to common shareholders since 1993.
First Guaranty Bancshares, Inc.At December 31, 2017, total assets were $1.75 billion, net income was $11.75 million, earning per common share was $1.37. Return on average assets was 0.71% and return on average common equity was 8.59%. First Guaranty Bancshares, Inc. shares are traded at the NASDAQ Global Market Exchange and has paid quarterly dividends for 98 consecutive quarters at December 31, 2017. Our commitment to customer service, the dedicated leadership of our Board of Directors and the hard work of our employees are among the reasons shareholders and customers can expect more.
[1] Book value has been adjusted for cumulative stock splits and dividend of 2.66 times since 1993.
[2] Cash dividends from the perspective of one original share of common stock from 1993 to present, this considers the impact of stock splits and stock dividends.
Dividends Per One 1993 Common Share [2]
0
10
20
30
40
50
201720162015201420132008200319981993
0
1000
2000
3000
4000
5000
6000
2017201620152014201320122011201020092008200720062005200420032002200120001999199819971996199519941993
0.0
0.5
1.0
1.5
2.0
20172016201520142013200820072008200319981993
PERFORMANCE GRAPHS
ProfileFirst Guaranty Bancshares, Inc. is the holding company of First Guaranty Bank, which it wholly owns. The Bank is a full-service financial institution with a major presence throughout Louisiana and in northeast Texas, serving customers from 27 banking center locations. Headquartered in Hammond, Louisiana, the Company had 349 employees as of December 31, 2017.
EXPECT MORE 3
First Guaranty Bancshares, Inc., and its wholly-owned subsidiary First Guaranty Bank, advanced its fortress balance sheet goals and significantly improved shareholder value throughout 2017 while continuing on that solid path today. During the fourth quarter of 2017, First Guaranty declared and issued a 10% stock dividend to shareholders, along with our 98th consecutive quarterly cash dividend. Core income continues to increase and at year end totaled $12,672,000. Total shareholders' equity in First Guaranty Bancshares, Inc. increased by 16% in 2017 and book value per share increased from $14.86 to $16.35. Shareholders can expect more performance and balance sheet strength as our concentration and emphasis remains focused on our fortress balance sheet.
2017 brought a new Banking Center in Bossier City, Louisiana and acquisition of Synergy Bank in Texas, which added five Texas locations in Denton, Fort Worth, Garland, McKinney and Waco. Expect more growth as First Guaranty Bank continues to search for additional merger and acquisition opportunities to widen our footprint. In addition to a strong balance sheet, customers and shareholders can trust our well-established core values and performance focal point will remain steadfast. In this regard, First Guaranty takes great pride in being predictable and reliable. The Chairman, Board of Directors, Executive Management, Officers and employees challenge themselves to continuous improvement and are dedicated to this goal.
Customers depend on First Guaranty Bank to offer and provide the latest in technology and financial services to satisfy their banking needs. With First Guaranty, convenience and security are paramount to ensure all customer transactions are safe and secure whenever they utilize online banking, mobile banking, apps or ATMs. Commercial and personal customers enjoy our myriad of convenient products and services including bill pay, mobile check deposit and e-statements.
At First Guaranty, we understand that loans are vital to customers and that quick approval is important. The loan committee is responsive and responsible in all its lending practices. First Guaranty Bank offers home mortgages and consumer and business loans including term loans, automobile loans, real estate loans, interim construction loans, Small Business Administration loans, agricultural and equipment loans, as well as lines of credit and our letter of credit.
Combined with our wide range of financial products and services, First Guaranty strives to build and enhance each customer relationship. First Guaranty remains committed to customer satisfaction and employees pride themselves on offering the utmost respect and professionalism with all customers, associates and friends. As a company, as well as employees individually, First Guaranty gives back to the communities we serve with active involvement in civic and charitable organizations and events.
4 2017 ANNUAL REPORT FIRST GUARANTY BANCSHARES, INC.
MORE CONCERN & PROFESSIONALISM
MORE FROM US
Expect More

EXPECTMORE
RELIABLE DEPENDABLE
P
REDICTABLE
MORE COMMUNITY OUTREACH
First Guaranty is strong, safe and secure. Shareholders can expect more of the same leadership, guidance, concern and compassion. With continued emphasis on our fortress balance sheet, we aim to expect more core growth and outstanding performance. The Board of Directors, Advisory Board and Executive Management share their vision and insight with officers and employees. Together, our determined team of bankers work in concert to serve our customers, shareholders and to attract new customers with a high level of service. At First Guaranty, we greatly appreciate and depend upon our loyal customers at all our Banking Centers throughout all service areas.
Expect More….Expect First Guaranty Bank.
EXPECT MORE 5
MORE FUN
MORE LOANS

2017 Accomplishments and Highlights
2017 Accomplishments and Highlights
1. Grand Opening of Bossier City, Louisiana Banking Center.
2. Acquisition of Synergy Bank and addition of five new Texas locations.
3. Approved design for new building which will be located across from our headquarters.
4. Paid our 98th consecutive quarterly cash dividend.
5. Paid 10% common stock dividend to shareholders.
6. First Guaranty contributed $412,000 to our local communities in 2017 with 1,673 hours of service.
7. We set a new record from $949 million in loans to $1.149 billion loans outstanding at year end.
8. In November 2017, First Guaranty acquired a 50% ownership in Centurion Insurance Services, Inc. which provides First Guaranty the ability to increase non-interest income by selling insurance products.
9. First Guaranty Bank received approval to open a loan production office in Lake Charles, Louisiana. We anticipate opening this office in the second or third quarter of 2018. The Lake Charles MSA is projected to be one of the fastest growing regions in Louisiana.
1
10
49
20
55
12
20
17 6
10
118
13
3
7 21
15
12
12
18
9
1622
5
19
144
23 26
2524
27
As FGB expands geographically, we must expand in facilities, too. We are excited to begin the building of our world class FGB Center which will house our IT, Training, and Customer Support Departments, a new training facility and auditorium. The FGB Center will be located across the street from our headquarters in Hammond, LA. We are proud to be able to expand our walls and take advantage of advanced technology to train our team, run our systems, and serve our customers. We look forward to inviting you in for a look once completed.
FIRST GUARANTY BANK CENTER
6 2017 ANNUAL REPORT FIRST GUARANTY BANCSHARES, INC.

FGBI
FGBI – NASDAQ Trading Price by QuarterStock Ticker Symbol: FGBI
EXPECTMORE
RELIABLE DEPENDABLE
P
REDICTABLE
First Guaranty Bancshares, Inc. is traded on NASDAQ exchange at ticker symbol FGBI with a record of strength. Past performance is not indicative of future performance.
$15.50$17.05
$14.09 $14.55
$21.75
$14.77
10
14
18
22
26
30
12/29/179/29/176/30/173/31/1712/31/169/30/166/30/163/31/1612/31/1511/5/15
$22.00
$24.76 $24.49 $25.00
EXPECT MORE 7

Alton B. LewisVice Chairman of the Board and Chief Executive Officer/PresidentFIRST GUARANTY BANCSHARES, INC.Vice Chairman of the Board and Chief Executive Officer/PresidentFIRST GUARANTY BANK
8 2017 ANNUAL REPORT FIRST GUARANTY BANCSHARES, INC.
Dear Shareholders,
Expect More. We do expect more from ourselves and from First Guaranty Bank. Although we had a solid 2017 with core earnings increasing by 9% over 2016 to a total of $12,672,000, with a successful acquisition, merger and assimilation of Synergy Bank, with four more quarterly dividends totaling $5,210,000 paid to our shareholders, with a 10% stock dividend paid to our shareholders in December 2017, with shareholders’ equity and book value continuing to increase, and with steady progress toward a fortress balance sheet, we not only expect more; but, we demand more of ourselves and of First Guaranty Bank.
In 2017, our loan portfolio grew by $200 million despite selling off a $7 million student loan portfolio acquired in the Synergy merger. Our loan interest income increased by 18.8% over 2016. Our net interest income increased by 9.8% over 2016. Our book value per common share increased by $1.49. While our income was increasing, our non-performing assets declined by 34% from December 31, 2016 to December 31, 2017 as they dropped from $22.2 million to $14.7 million.
2017 marked a solid year of progress toward a fortress balance sheet. 2017 marked a solid year of progress toward enhanced shareholder value. 2017 marked a solid year of progress, building a stronger, smarter, and more competent team throughout First Guaranty Bancshares, Inc.; but we expect and demand more. We must continue to develop and improve our team. We must continue to improve our service to our customers and to improve the services and products that we offer to our customers. We must keep pace with new developments within banking and technology to ensure that First Guaranty Bancshares, Inc. remains a viable, profitable, and relevant factor in the banking industry. We must continue to build and diversify our loan portfolio and loan income. We must continue to build and diversify our non-loan products and income so as to strengthen First Guaranty Bancshares, Inc.’s ability to withstand any changes in economic condition. As our first step in this direction, First Guaranty Bancshares, Inc. has acquired a 50% ownership in Centurion Insurance Services, LLC of Charleston, West Virginia, a commercial insurance brokerage firm. We must maintain control of our interest expense and of our non-interest expense. We must continue to treat our employees fairly and equitably. We must continue to serve and support the communities in which we live. We must continue our progress toward a fortress balance sheet and toward enhanced shareholder value.
2017 set the stage for us to continue our progress in all of these areas and to continue to build a stronger, better, enhanced First Guaranty Bancshares, Inc.
Sincerely,
Letter from the Chief Executive Officer & President
Alton B. LewisChief Executive Officer & President

Eric J. DoschChief Financial Officer
Eric J. DoschChief Financial OfficerFIRST GUARANTY BANCSHARES, INC.Chief Financial OfficerFIRST GUARANTY BANK
First Guaranty Bancshares, Inc. continued to gain strength in 2017. We continued our momentum from 2016 as we completed our acquisition of Premier Bancshares, Inc. which expanded the First Guaranty franchise into Texas. First Guaranty paid a 10% common stock dividend in December 2017. First Guaranty purchased a 50% interest in an insurance brokerage agency that will broaden the services that we deliver to our customers. First Guaranty also opened a new branch in Bossier City, Louisiana which brings the total number of bank branches to 27 between Texas and Louisiana.
Loans grew by 21.1% or $200.1 million from $948.9 million in 2016 to $1.15 billion in 2017. This growth was driven by the acquired loans from the Premier acquisition and by our continued local loan growth. First Guaranty increased loan interest income $8.5 million in 2017. We have continued to execute our plan of growing loans as a percentage of our balance sheet. Our loan portfolio finished December 31, 2017 at 66% of total assets, an increase from 63% of total assets at December 31, 2016. Our average loan yield has remained consistently above 5.0% during the last three years. The average loan yield was 5.11% for 2017 with a net interest margin of 3.33%.
Total common shareholder’s equity increased $19.6 million from $124.3 million in 2016 to $144.0 million in 2017. Growth in shareholder’s equity was due to the Premier acquisition and First Guaranty’s 2017 earnings. Retained earnings increased $5.5 million from $39.0 million in 2016 to $44.5 million in 2017. Our tangible common equity ratio was 7.87% at December 31, 2017. The loan loss reserve was $9.2 million at 2017.
Earnings per common share were $1.37 in 2017. Tangible book value per share increased 7.5% from $14.50 at December 31, 2016 to $15.59 at December 31, 2017. Return on average assets was 0.71% for 2017. The efficiency ratio was 62.64% in 2017. Return on average common equity was 8.59% in 2017.
First Guaranty Bancshares paid a total of $5,210,000 in cash dividends to common shareholders in 2017. The Company has paid 98 consecutive quarters of dividends as of 12/31/2017.
First Guaranty continues to build strength for the future and we have increased our common capital. Our branch networks and markets now include the Dallas-Fort-Worth-Arlington and Waco, Texas MSAs. First Guaranty continues to maintain a leading deposit market share in the communities that we serve in Louisiana and we have significant opportunities to expand our deposit franchise in Texas. Our continuing investment in the education of our employees, planning and reporting systems has increased productivity. We believe that the combination of these efforts will lead to a strong and profitable future for First Guaranty Bancshares, Inc.
Sincerely,
EXPECT MORE 9
Report from the Chief Financial Officer

Glenn A. Duhon, Sr.Senior Vice President/Regional ManagerFIRST GUARANTY BANK
Glenn A. Duhon, Sr.Senior Vice President/Regional Manager
The Southwest Louisiana Region of First Guaranty Bank exceeded our 2017 loan goal, however, due to large payoffs, ended the year with less volume than 2016. Our loan goal was set at $30 million and the Region produced $36.4 million new loans. The Jennings Banking Center ended 2017 with $35.3 million in deposits and $25.6 million in loan volume - an increase of $6.7 million in loans and a decline of $800,000 in deposits. First Guaranty Bank’s Abbeville Banking Center had $82.3 million in loans and $125.1 million in deposits – a decrease of $17.6 million in loans and an increase of $6.2 million in deposits.
First Guaranty’s Southwest Louisiana customers can expect more banking services during 2018 and 2019 with increases in loans, deposits and customer satisfaction. With several new loans currently in the pipeline, we should see Southwest Louisiana’s loan volume increase. We are excited to be opening our new loan production office in Lake Charles to enable a lending presence, personal interaction with the local community and lending success.
We expect more for 2018 and 2019. We have several loans in the pipeline, plus we are in the process of opening a loan production office in Lake Charles, which should help increase the Southwest Louisiana Region’s loan volume.
Southwest Louisiana rice farmers produced good yields in 2017 with prices remaining the same as most farmers managed to meet their financial obligations. Area sugarcane farmers had excellent yields and prices allowing them to better their financial positions.
We believe that the experience and dedication of our employees, the support of our board of directors, combined with the trust and loyalty of our customers will allow this Southwest Louisiana Region continued success. First Guaranty Bank’s Southwest Louisiana Region expects more growth in our market share as we expand banking services, office locations and enhance our customer relationships.
Sincerely,
10 2017 ANNUAL REPORT FIRST GUARANTY BANCSHARES, INC.
Report from the Senior Vice President

J. Douglas SandersArea PresidentDallas/Fort Worth/Waco
Report from Area President Dallas/Fort Worth/Waco
J. Douglas SandersArea President Dallas/Fort Worth/WacoFIRST GUARANTY BANK
In June 2017 all of the Texas Synergy Bank employees became First Guaranty family members and the journey has been a nonstop learning experience. We have participated in several training classes at each level with FGB staff visiting all Texas locations and most, if not all, Texas staff members visiting the FGB Hammond headquarters. Allowing the Texas staff to meet the Louisiana staff to learn policies and procedures together has united our two cultures and has enabled everyone to feel their job has now become the new normal.
Our Texas loan balance at merger date was $128.0 million and we sold $7.3 million of student loans in August 2017. Our net loans grew to $150.8 million by the end of the year. Our total net growth following the planned sale of the student loans was $30.1 million or 25% through the remaining six months of 2017. We also generated $300,000 in gains on sale of loans from the SBA loan portfolio. This has improved non-interest income and should always help this category.
We consider the Dallas-Fort Worth metropolitan area to be our trade area within which we have many existing customers. There are over 7.1 million residents in this area and given the projections for growth, this merger will be the perfect recipe for our lenders. Our plan is to have all FGB lenders offering the SBA loan product in Texas as well as all 27 locations. We have seasoned underwriters and loan closers in our McKinney office that provide unmatched knowledge and service.
FGB Texas has four experienced commercial lenders and plans to add two additional lenders in our Waco and Denton banking centers as soon as possible.
We anticipate 2018 to be successful now that we have the initial training completed and a knowledgeable staff in place and ready to perform.
If you would like any additional information concerning our plan for Texas or need to discuss any matter regarding First Guaranty Bank in Texas please do not hesitate to contact me.
Sincerely,
EXPECT MORE 11

First Guaranty BankBOARD OF DIRECTORS
ANTHONY J. BERNER, JR.President, Pon Food Corporation
CHARLES BRISTERPresident, Brister’s Consulting and Rentals
GLORIA M. DYKESOwner, Dykes Beef Farm and Part Owner, Dykes Feed & Fertilizer, Inc.
DR. PHILLIP E. FINCHERRetired Economics/Finance ProfessorNorth Louisiana Advisory Board
ROBERT H. GABRIELPresident, Gabriel Building Supply Company
ANDREW GASAWAY, JR.Secretary to the BoardPresident, Gasaway-Gasaway-Bankston Architects
WILLIAM K. HOODChairman, Directors Loan Committee and Audit Committee of First Guaranty BankPresident, Hood Automotive Group
EDWIN L. HOOVER, JR.President, Encore Development Corporation
ALTON B. LEWISVice Chairman of the Board andChief Executive Officer/President,First Guaranty Bancshares, Inc.Vice Chairman of the Board andChief Executive Officer/PresidentFirst Guaranty Bank
BRUCE McANALLYRegistered Pharmacist
MORGAN S. NALTYInvestment Banking Executive & Partner,Johnson, Rice & Company, LLC
JACK M. REYNOLDSVice President, Pritchard Electric Co. andVice President, Trifecta Productions, LLC
MARSHALL T. REYNOLDSChairman of the Board,First Guaranty Bancshares, Inc.Chairman of the Board,First Guaranty BankChairman of the Board, Champion Industries
NANCY C. RIBASOwner/Manager, World Trend Properties andUniversity Motors
JACK ROSSIChairman, Audit Committee of First Guaranty Bancshares, Inc.CPA, consultant
RICHARD W. “DICKIE” SITMANBoard President, Dixie Electric Membership Corp., (Baton Rouge, Louisiana)Board Member CoBank ACB, (Denver, Colorado)
ANN A. SMITHTangipahoa Parish School Board Member(Former President and Finance Chair)Board of Supervisors of Southern University System, Chairwoman, Louisiana Office of Student Financial Advising Board (LOSFA), Chairwoman
EDGAR R. SMITH, IIIChairman and Chief Executive OfficerSmitty’s Supply, Inc.
Back row, left to right: Bruce McAnally, Jack M. Reynolds, Morgan S. Nalty, Marshall T. Reynolds, Alton B. Lewis, Charles Brister
Middle row, left to right: Robert H. Gabriel, Dr. Phillip E. Fincher, Gloria M. Dykes, Nancy C. Ribas, William K. Hood, Edgar R. Smith, III
Front row, left to right: Richard W. “Dickie” Sitman, Edwin L. Hoover, Jr., Andrew Gasaway, Anthony J. Berner, Jr.
Pictured at left: Ann A. Smith
Pictured at right: Jack Rossi
12 2017 ANNUAL REPORT FIRST GUARANTY BANCSHARES, INC.

Above photo:Thomas “Tommy” D. Crump, Jr., Gil Dowies, III, Dr. Phillip E. Fincher, John D. Gladney, M.D.
Pictured at left: Britt L. Synco
First Guaranty BankADVISORY BOARD
The members of the First Guaranty Bank Advisory Board include: Thomas D. “Tommy” Crump, Jr., Carrell G. “Gil” Dowies, III, Dr. Phillip E. Fincher, John D. Gladney, M.D. and Britt L. Synco.
These adept gentlemen assist the bank in moving forward by sharing their breadth of experience and providing critical insight into essential business interests including oil and gas production, agriculture and forestry. The Advisory Board works with the Board of Directors and management to develop lending and marketing philosophies to best affect First Guaranty Bank. With wholesale and retail expertise throughout north Louisiana, this group examines financial and civic activities.
EXPECT MORE 13

EXECUTIVEALTON B. LEWIS*President and CEO
Guaranty Square
ERIC J. DOSCH*Chief Financial Officer
Guaranty Square
Senior Vice Presidents
GLENN A. DUHON, SR.Regional Manager
Abbeville
THOMAS F. BROTHERSDirector of Internal Audit
RONALD R. FOSHEERegional Manager
Denham Springs
MICHAEL F. LOFASORegional Manager
Ponchatoula
BRANDON C. LONGChief Lending Officer
J. DOUGLAS SANDERSArea President
Dallas/Fort Worth/Waco
DESIREE B. SIMMONSLoan Administration, Marketing & Training
EVAN M. SINGERDirector of Mergers & Acquisitions
Regional ManagerGreensburg
J. RICHARD STARKOperations
CHRISTY L. WELLSRegional Manager
Hammond
Controller
ERIC M. FULLER
Vice Presidents
CHARLES L. BAGGS
ASHLEY N. BELL
BRENDA A. BRISCOE
CHERYL Q. BRUMFIELD
COLLEEN B. EBARB
RONALD W. EDMONDS
DENISE D. FLETCHER
HECTOR I. GARCIA, CIO
ADAM J. JOHNSTON
DIANNE E. KEEN
MICHAEL D. KNIGHTENMIKKI M. KELLEY
MICHAEL A. MOSBEY
RONALD C. PITTMAN
SCOTT B. SCHILLING
BRITTANY D. SHAW
LISA K. STOKER
RANDY S. VICKNAIR, CCO
MICHAEL A. WIGGINS
Assistant Vice Presidents
JAMES M. BAXTERDARRELL D. BRUCHHAUSC. GRAHAM CRUMPLANCE S. DAVISHARRISON P. GILLLUDRICK P. HIDALGOLESLIE A. HINZMANSHIRLEY P. JONESJOELLEN K. JUHASZ, BSA Officer
KEITH T. KLEINTRACY D. PERRYCRAIG E. SCELFOJOHN A. SYNCOD. LYNN TALLEYKRISTINA E. TERRY
Officers
REBECCA G. BROWNKENNETH M. BYRDLAURYN H. COBURNVANESSA R. DREWJEANNETTE N. ERNSTVICTOR M. GARCIADEV M. PATEL, Lending Officer
RAHUL R. PATEL, Lending Officer
DIANE PATTERSONKRISTIN M. WILLIAMS
First Guaranty BankOFFICERS
EXPECTMORE
RELIABLE DEPENDABLE
P
REDICTABLE
14 2017 ANNUAL REPORT FIRST GUARANTY BANCSHARES, INC.

Total Assets(in millions)
Total Assets(in thousands)
Tangible Common Equity has increased
$128.3 million since 1993.
First Guaranty Assets have increased
1,000% since 1993.
Tangible Common Equity(in thousands)
1993 $ 9,005
1998 $17,376
2003 $43,557
2008 $61,429
2013 $80,033
2014 $96,531
2015 $114,927
2016 $121,372
2017 $137,262
Tangible Common Equity [3]
(in thousands)
1993 $159
1998 $245
2003 $485
2008 $871
2013 $1,436
2014 $1,519
2015 $1,460
2016 $1,501
2017 $1,750
0
30000
60000
90000
120000
150000
201720162015201420132008200319981993
0
250000
500000
750000
1000000
1250000
1500000
1750000
2000000
201720162015201420132008200319981993
PERFORMANCE GRAPHS
EXPECT MORE 15
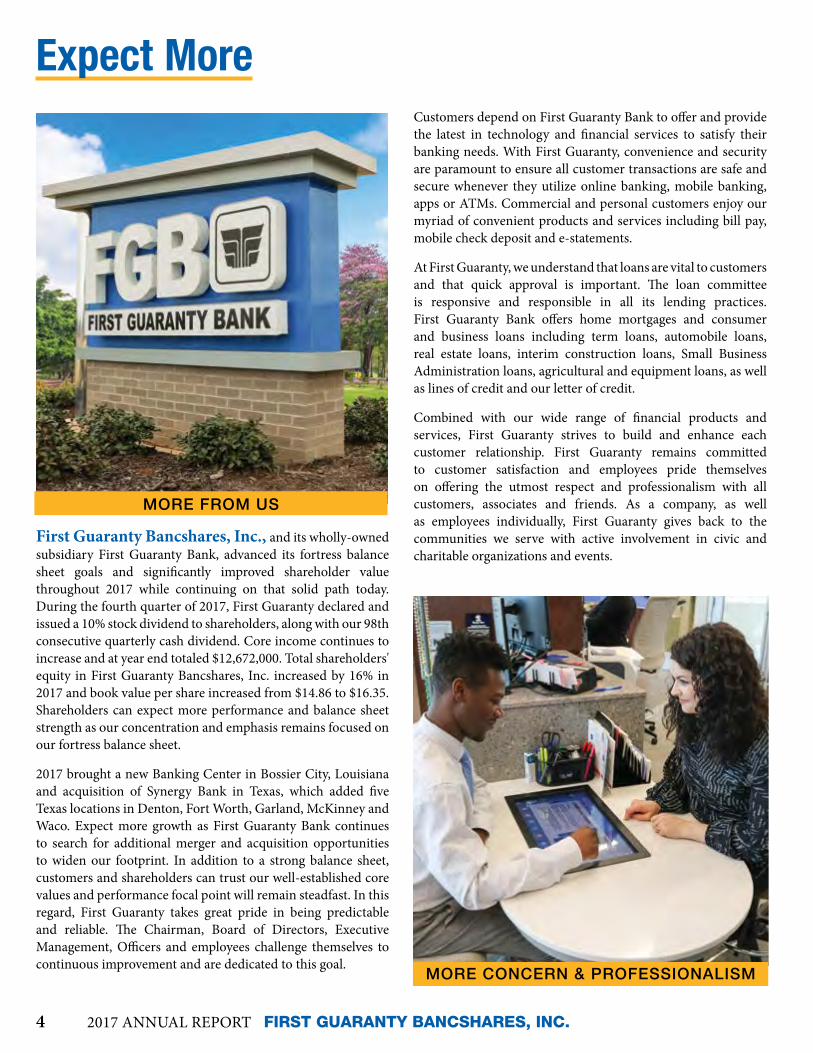
Net Income(in millions)
Total Deposits(in millions)
Total Deposits(in millions)
Net Income(in millions)
1993 $2.1
1998 $3.7
2003 $7.0
2008 $5.5
2013 $9.1
2014 $11.2
2015 $14.5
2016 $14.1
2017 $11.8
1993 $149
1998 $257
2003 $376
2008 $780
2013 $1,303
2014 $1,372
2015 $1,296
2016 $1,326
2017 $1,549
0
3
6
9
12
15
20172016201520142013200319981993
0
500
1000
1500
2000
201720162015201420132008200319981993
PERFORMANCE GRAPHS
16 2017 ANNUAL REPORT FIRST GUARANTY BANCSHARES, INC.
PERFORMANCE GRAPHS
Investments(in millions)
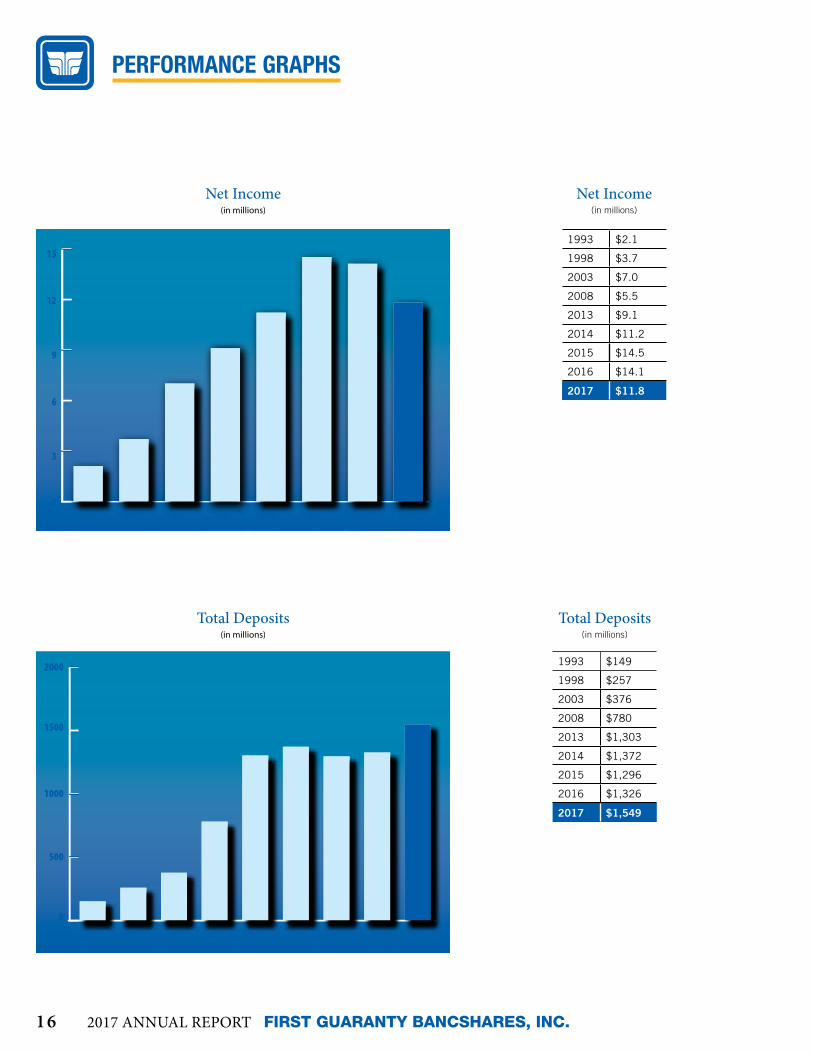
Loans, net of unearned income(in millions)
Loans, Net of Unearned Income(in millions)
Investments [4]
(in millions)
[3]Total equity less preferred equity, goodwill and acquisition intangibles, principally core deposit intangibles, net of accumulated amortization.
[4] Available for sale securities at fair value, held to maturity at amortized cost
1993 $105
1998 $177
2003 $381
2008 $606
2013 $703
2014 $790
2015 $842
2016 $949
2017 $1,149
1993 $30
1998 $73
2003 $59
2008 $139
2013 $635
2014 $642
2015 $546
2016 $499
2017 $502
0
100
200
300
400
500
600
700
800
201720162015201420132008200319981993
0
200
400
600
800
1000
1200
201720162015201420132008200319981993
EXPECT MORE 17

1
10
49
20
55
12
20
17 6
10
118
13
3
7 21
15
12
12
18
9
1622
5
19
144
23 26
2524
27EXPECTMORE
RELIABLE DEPENDABLE
P
REDICTABLE
TEXAS
18 2017 ANNUAL REPORT FIRST GUARANTY BANCSHARES, INC.

1
10
49
20
55
12
20
17 6
10
118
13
3
7 21
15
12
12
18
9
1622
5
19
144
23 26
2524
27 LOUISIANA
EXPECT MORE 19
SOUTH LOUISIANAABBEVILLE, LA 799 West Summers Drive
AMITE, LA 100 East Oak Street1014 West Oak Street
BEDICO, LA Bedico Supermarket28473 Highway 22
DENHAM SPRINGS, LA 2231 South Range Avenue
GREENSBURG, LA6151 Hwy. 10
HAMMOND, LA 1201 West University Avenue
2111 West Thomas Street
400 East Thomas
North Oaks Medical Center:4 Medical Center Drive
First Guaranty BankBANKING CENTERS
1. MAIN OFFICE Hammond - Guaranty Square
2. Hammond - Guaranty West3. Abbeville 4. Amite 5. Benton6. Bossier City7. Denham Springs 8. Dubach9. Greensburg
10. Haynesville11. Homer12. Independence13. Jennings14. Kentwood15. Kentwood West16. Montpelier17. Oil City18. Ponchatoula19. Ponchatoula - Berryland20. Vivian21. Walker22. Watson23. Denton24. Fort Worth25. Garland26. McKinney27. Waco
ATM LOCATIONSNorth Oaks Rehabilitation Center: 1900 South Morrison Boulevard
INDEPENDENCE, LA 455 Railroad Avenue
JENNINGS, LA 500 North Cary
KENTWOOD, LA 723 Avenue G
LIVINGSTON, LA(LPMC) Livingston Parish Medical Center:17199 Spring Ranch Rd.
LORANGER, LA 19518 Highway 40
MONTPELIER, LA35651 Hwy. 16
PONCHATOULA, LA500 W. Pine St.105 Berryland Shopping Center
ROBERT, LA Robert’s Supermarket - 22628 Highway 190
WALKER, LA 29815 Walker Road SouthWATSON, LA33818 Hwy. 16
NORTH LOUISIANA BENTON, LA 189 Burt Boulevard
BOSSIER CITY, LA 4221 Airline Drive
DUBACH, LA 117 East Hico Street
HAYNESVILLE, LA 10065 Highway 79
HOMER, LA Homer Memorial Hospital401 North 2nd Street
OIL CITY, LA 126 South Highway 1
VIVIAN, LA102 East Louisiana Avenue
TEXASMCKINNEY, TX 8951 Synergy Dr, #100
WACO, TX 7600 Woodway Drive

Bossier City Grand Opening
GRAND OPENINGBossier City is located in northern Louisiana on I-20, approximately 15 miles from the Texas state border and 185 miles east of Dallas, Texas. Our primary market area has a diversified economy with employment in services, government and wholesale/retail trade constituting the basis of the local economy, with service jobs being the largest component. The primary areas of services include health care, casino gaming industry and energy. Bossier Parish is also the home to the Barksdale Air Force Base, which has 12,000 employees.
20 2017 ANNUAL REPORT FIRST GUARANTY BANCSHARES, INC.

Our customers expect more. And we deliver. Not only in Louisiana, but in Texas, too. In 2017, FGB broadened our footprint as we embarked upon an acquisition of Synergy Bank. Over the course of 10 months we took the time to get to know our new team members, welcome them with open arms and educate them on FGB. Several visits were made by managers to learn of the staffing necessities as we worked towards continuing to meet the needs of our Texas customer base. We learned a lot along the way which will serve to make us better in the future.
Texas Welcome
Doug Sanders says, “Fort Worth has the best museums, second to none!”
Money Magazine ranked McKinney as the #1 Best Place to live in America (2014), based on excellent schools, beautiful natural parks, affordable and diverse housing, employment opportunities and a vibrant downtown.
The city of Garland where our FGB Banking Center is located is the third largest city in Dallas county. Garland, like the entire surrounding area, is experiencing growth in business and residents.
Located along the Brazos River between Dallas and Austin, Waco, Texas is home to Baylor University, Texas Ranger Museum, Mammoth National Monument, and much more!
Denton is undergoing a downtown revitalization.
Phot
o cr
edit:
Den
ton
Con
vent
ion
& V
isito
rs B
urea
u
EXPECT MORE 21

EXPECTMORE
RELIABLE DEPENDABLE
P
REDICTABLE
GUARANTY SQUARE (985) 345-7685 (888) 375-3093400 East Thomas StreetHammond, LA 70401
First Guaranty BankDEPARTMENTS & BANKING CENTERS
CASH MANAGEMENT:
Left: Vikki Dupaquier, Right: Hannah Winget
APPRAISAL REVIEW:
Back row: Amy Starkey
Middle row: Starr Bernier
Front row: Kristina Terry
BSA/FRAUD:
Above, left to right: Ashleigh Duroncelet, Evan Singer, JoEllen Juhasz, Casey Turner, Sharmaine Robertson
Pictured at right: Deborah Worthington (McKinney)
22 2017 ANNUAL REPORT FIRST GUARANTY BANCSHARES, INC.

COLLATERAL:
Back row, left to right: Cate Mathes, Kelli Jordan, Sue Thigpen, Paul Lee
Front row, left to right: Silvia Rodriguez, Robyn Giacone, Lauryn Coburn
COMPLIANCE:
Left to right: Rebecca Brown, Ann Morgan, Colleen Ebarb
CREDIT:
Back row, left to right: Nic Brennan, Randy Vicknair, Adam Smith, David Spier
Middle row, left to right: Jessica Hrenyk, Nicholas Byrd, Emily Creech, Megan Dvorak
Front row, left to right: Louis Cusimano, Melanie Gottschalck, Marisa Rodrigues, Brittany Saltzman, Colton McDaniel, Jakayla Brown
Pictured above: Keith Klein (McKinney)
Not Pictured: Michael Wiggins
EXPECT MORE 23

DEPOSIT OPERATIONS:
Back row, left to right: Megan Braden, Anna Smith, Divetta Stallworth, Glenda Saucier, Sandra Edwards, Tammy Graves
Front row, left to right: Letitia Cox, Shirley Jones, Lori Lloyd
CUSTOMER SUPPORT CENTER:
Back row, left to right: Jessica Spears, Danyelle Green, Alexander Gondolfi, Laura Ard, Pamela Stafford
Front row, left to right: Rhonda Mitchell, Davon Mitchell, Kelley Mackabee, Matt Bettencourtt, Shari Wheeler
EXECUTIVE:
Back row, left to right: Casie Qualls, Vanessa Drew, Kristin Williams
Front row, left to right: Alton Lewis, Jason Wilson
24 2017 ANNUAL REPORT FIRST GUARANTY BANCSHARES, INC.

HUMAN RESOURCES:
Back row, left to right: Chantelle Starkey, Landa Domangue
Front row, left to right: Mandi Aguillard, Mikki Kelley
FINANCE:
Pictured above: Charles Baggs (Waco)
Pictured at right: Back row, left to right: Michael Moye, Donna Scamardo, Diane Patterson, Heather Lee, Diane Lanier, Philip Qualls
Front row, left to right: Eric Fuller, Laquita Johnson, Katherine Campbell, Chandra McKinney, Eric Dosch
Not pictured: Sharon George (McKinney)
FRONT LINE:
Back row, left to right: Linda Miller, Latoya Williams, Craig Conners
Middle row, left to right: Jeannette Ernst, Brandi Steffek (floater), Danielle Day (floater)
Front row, left to right: Madison Amos, Bethany Traylor, Kelly Wall (floater)
EXPECT MORE 25

LENDING:
Back row, left to right: Evan Singer, Christy Wells, Craig Scelfo, Catherine Egnew, Michael Knighten
Front row, left to right: Tracy Nelson, Brandon Long, Vickie Jenkins
IT:
Fourth row, left to right: Donna Turnage, Allen Daussin, Austin Grant
Third row, left to right: Barry Hay, Keith Mills, David Couvillon
Second row, left to right: Moi Rodriguez, Hector Garcia
Front row, left to right: Craig Rachel, Star Lala
MARKETING:
Left to right: Jane Wear, Desiree Simmons, April Alford, Harli Manuel
Pictured above: Anthony Koernig (McKinney)
INTERNAL AUDIT, LOAN REVIEW, & INFORMATION SECURITY:
Back row, left to right: Michelle Dionne, Lana Quinn, Michael Mosbey, Nancy Rodriguez, Tae Anderson
Front row, left to right: Bill Worthy, Tom Brothers, Jason McKenzie
26 2017 ANNUAL REPORT FIRST GUARANTY BANCSHARES, INC.

MORTGAGE:
Back row, left to right: Susan Fitzgerald, Kelli Perry-Bennett, Laci Farkas, Melissa Duchmann
Front row, left to right: Amy Fabre, Mandy Lee, Amy Hopson, Bris’ Perry
LOAN OPS:
Back row, left to right: Donna Hodges, Keisha Smith, Kellie Weisler, Lynn Talley, Christy Frierson, Audrey Carter, Ariele Davis, Trinitrius Brown
Front row, left to right: Bonnie Garcia, Julie Carmo, Luke Lavergne, Star Spriggs, Sharon Rogers
LOAN OPS (McKinney)
Back row, left to right: Sydnee Philbert, Jenny Bae
Front row: Lisa Stoker
OPERATIONS:
Back row, left to right: Elisa Costanza, Betty Boney, Richard Stark, Tracey Robertson, Kendra Fairburn, Debbie Dubuisson, Elaine Conner
Front row, left to right: Desiree Theall, Carla Cook, Brittany Harness, Christe Feimster, Kerri Gladney
Pictured at right: Shane Hughes
EXPECT MORE 27

PURCHASING:
Back row: Joseph Ernest
Middle row: Teresa Wempren
Front row: Evan Singer
SPECIAL ASSETS:
Back row, left to right: Ronnie Pittman, Luke Hammonds
Front row, left to right: Lee Ann Sibley, Kriss Patterson
TRAINING:
Left to right: Shanon Dunn, Vikki Dupaquier, Miranda Derveloy
28 2017 ANNUAL REPORT FIRST GUARANTY BANCSHARES, INC.

Enjoying a Rare Snowstorm
EXPECT MORE 29

AMITE BANKING CENTER (985) 748-5111100 East Oak StreetAmite, LA 70422
ABBEVILLE BANKING CENTER (337) 893-1777 / (800) 306-3276799 West Summers DriveAbbeville, LA 70510
Back row, left to right: Liz Mckinzie, Miranda Rainey, Scott Schilling, Suzette Brooks, Jenny Sue Weedman
Front row, left to right: Blaire Holmes, Marsha Spring, Brittani Erdey
Not pictured: Stephanie Campo
Back row, left to right: Glenn Duhon, Charisse Stevens-Cormier, Tanya Mernard, Amy Broussard
Front row, left to right: Diane Frederick, Lisa Kritzer, Gretchen Meaux, April Frederick
30 2017 ANNUAL REPORT FIRST GUARANTY BANCSHARES, INC.

BENTON BANKING CENTER (318) 965-2221189 Burt BoulevardBenton, LA 71006
BOSSIER CITY CENTER (318) 383-5234 4221 Airline DriveBossier City , LA 71111
Back row, left to right: Greg Friesen, Marcus Rounds, Dennis Crumpton
Front row, left to right: Alisha Blankenship, Monique Rochelle, Donna Cummings
Not pictured: Sidney Lewis, Erin Carr
Back row, left to right: Terboris Posey, Joedi Snipes, Adam Johnston, Hannah Winget, Daniel Loe, Nikio Resse, Lynn Henry
Front row, left to right: Ellen Buskey, Angelena Warren, Irvin Williams, Jennifer Knapp, Erika Taylor
EXPECT MORE 31

DENHAM SPRINGS BANKING CENTER (225) 791-79642231 South Range AvenueDenham Springs, LA 70726
Back row, left to right: Ludrick Hidalgo, Sharon Moore, Danna Jo Erwin, Michelle Gehling, Lisa Thompson, Kevin Foster
Front row, left to right: Kelli Perry-Bennett, Courtney Ortego, Kandace Sparacino, Kathie Alimia
Pictured at left: Ronnie Foshee
DENTON BANKING CENTER (940) 383-0700 2209 W University Drive Denton , TX 76201
Back row, left to right: Leslie Hinzman, Karen Stevenson, Mahvash Becker
Front row: Brittany Fritze
Not Pictured: Sandra Whittington
32 2017 ANNUAL REPORT FIRST GUARANTY BANCSHARES, INC.

DUBACH BANKING CENTER (318) 777-3461117 East Hico StreetDubach, LA 71235
Back row, left to right: Sue Yates, Mic Baxter, Kristy Puckett
Middle row, left to right: Patty Duhart, Heather Croxton
Front row, left to right: Laurie Traylor, Diane Shoemaker
FORT WORTH BANKING CENTER (817) 502-66112001 N. Handley Ederville Road Fort Worth , TX 76118
Back row, left to right: Tiffany Alford, Indra Pant, Briana Ochoa, Matt Martinez, Amanda Rodriguez
Front row, left to right: Kenneth Byrd, Graham Crump
Not Pictured: Doug Sanders, Brittany Shaw
EXPECT MORE 33

GARLAND BANKING CENTER (214) 227-4550603 Main St, #101 Garland, TX 75040
Back row, left to right: Brenda Briscoe
Middle row, left to right: Tracy Perry, Perla Alvizo
Front row, left to right: Mary Atterbury, Jennifer Petty, Charles Baggs
GREENSBURG BANKING CENTER (225) 222-6101 / (800) 227-61016151 Highway 10Greensburg, LA 70441
Back row, left to right: Phylicia Vernon, Kaycee Bridges, Rhonda Miller
Front row, left to right: Brianna Scott, Melissa Smith, Courtne’ Coleman
Not pictured: Harrison Gill
Pictured at left: Evan Singer
34 2017 ANNUAL REPORT FIRST GUARANTY BANCSHARES, INC.

HAYNESVILLE BANKING CENTER (318) 624-117110065 Highway 79Haynesville, LA 70138
Left to right: Carla Goode, Julia Tabor, Tammy Burley
Not pictured: Aleshia Lee
HAMMOND – GUARANTY WEST BANKING CENTER(985) 375-03712111 West Thomas StreetHammond, LA 70401
Fourth row, left to right: Cheryl Brumfield, Lauren Small, Kenyatta Jackson
Third row, left to right: Chris Shaver, Janelle Heard, Ashley James
Second row, left to right: Stacy Williams, Jerika Williams, Tania Wren
Front row, left to right: Connie Miller, Karen Paille
Not Pictured: Denise Foster
EXPECT MORE 35

INDEPENDENCE BANKING CENTER (985) 878-6777455 West Railroad AvenueIndependence, LA 70443
Back row, left to right: Carmella Coslan, Tamara Neil, Cheryl Brumfield, Richard Hamilton
Front row, left to right: Karen Paille, Pam Brazil, Cherry Khurana, Devona Matthews
HOMER BANKING CENTER (318) 927-3000401 North 2nd StreetHomer, LA 71040
Back row, left to right: John Synco, Shirley White, Courtney Williams, Debbie Spigener, Dot Frazier, Ron Edmonds
Front row, left to right: Caroline Arnold, Candie White, Jamie Williams, Elaine Atencio, Kitsha Ridley
Not pictured: Caree Bailey, Sara Pennington (floater)
36 2017 ANNUAL REPORT FIRST GUARANTY BANCSHARES, INC.

KENTWOOD BANKING CENTER (985) 229-3361301 Avenue FKentwood, LA 70444
Back row, left to right: Ashlyne Richard, Lindsey George, Karen Griffin, Connie Butler
Front row, left to right: Angie Lott, Lance Davis, Nicole Brumfield, Christy Wright
Not Pictured: Lisa Rushing
JENNINGS BANKING CENTER (337) 824-1712500 North CaryJennings, LA 70546
Back row, left to right: Rahul Patel, Darrell Bruchhaus, Amber Leger
Front row, left to right: Trisha Patterson, Mona Fontenot
EXPECT MORE 37

KENTWOOD WEST (985) 229-6101723 Avenue GKentwood, LA 70444
Left to right: Christy Wright, Ruby Carter, Brittany Graham
MCKINNEY BANKING CENTER (972) 562-14008951 Synergy Drive, #100 McKinney , TX 75070
Back row, left to right: Danielle Carter, Dacina McNabb
Front row, left to right: Victor Garcia, Deborah King
38 2017 ANNUAL REPORT FIRST GUARANTY BANCSHARES, INC.

MONTPELIER BANKING CENTER (225) 777-430435651 Highway 16Montpelier, LA 70422
Back row, left to right: Liz Zito, Brianna Chaney
Front row, left to right: Betsy Ehret, Trella Page
OIL CITY BANKING CENTER (318) 995-6682126 South Highway 1Oil City, LA 71061
Back row, left to right: Elaine Bounds, Shannon Jackson, Glenda Graham, Andie Bruno, Emma Rolling
Front row, left to right: Mary Casey, Toni Harris
EXPECT MORE 39

PONCHATOULA-BERRYLAND BANKING CENTER(985) 386-5430105 Berryland Shopping CenterPonchatoula, LA 70454
Left to right: Joede Piazza, Nicole Morgan, Tammy Carraway, Kelly Ballex
PONCHATOULA BANKING CENTER (985) 386-2000500 West Pine StreetPonchatoula, LA 70454
Back row, left to right: Renee Stewart, Mike Lofaso, Denise Fletcher, Kristy Petit, Brandon Wear
Front row, left to right: Aimee Gervais, Misty Chauvin, Chassidy Beauchamp, Kelly Ballex, Anita Buckhanan
40 2017 ANNUAL REPORT FIRST GUARANTY BANCSHARES, INC.

VIVIAN BANKING CENTER (318) 375-3202102 East Louisiana AvenueVivian, LA 71082
Back row, left to right: Amber Smith, Tina Gay, Brandy Moon, Stacy Thompson
Front row, left to right: Bobbie Clark, Tessie Hasha, Frances Thompson
Not pictured: Cynthia Munoz
WACO BANKING CENTER (254) 399-07007600 Woodway Drive Waco , TX 76712
Back row, left to right: Stephen Senn, Federico Guerrero (Waco IT Staff)
Middle row, left to right: Jacea Robinson, Valarie Moon (Floater), Pamela Lambert
Front row, left to right: Torie Montgomery, Stacy Diaz, Dianne Keen
EXPECT MORE 41

WALKER BANKING CENTER (225) 664-554929815 South Walker DriveWalker, LA 70785
Back row, left to right: Sheila Lofton, Clint Trant, Sylvia Moore
Front row, left to right: Sara El Kadi, Robin Bonfanti, Mary Carroll
WATSON BANKING CENTER (225) 665-040033818 Highway 16Denham Springs, LA 70706
Left to right: Carrie Jarreau, Ludrick Hidalgo, Crystal Lipscomb
Not pictured: Judy Hughes, Dev Patel
42 2017 ANNUAL REPORT FIRST GUARANTY BANCSHARES, INC.

COMMUNITY IMPACT
Chassidy Beauchamp presented a contribution to Hannah Henderson, soccer team member for the PHS soccer booster club.
Terboris Posey presented a contribution to Katie Theriot Director of Business Development/Investor Relations at the Bossier Parish Chamber of Commerce for the upcoming Annual Gala.
Elaine Atencio presented a contribution to Randy Linder, Manager, for the Homer Golf Club.
Mary Casey presented a contribution to the DBMS Robotics program. The money will be used to purchase three new Lego EV3 robotics kits. Left to right: Mary Casey, Autumn Lantz (front), Abbi Clifton (back) Joseph Hinton (front) Ryder Briggs (back) Hayden Phipps, Kwame Johnson, Mark Kapera.
Community contributions are a priority budget item for First Guaranty Bank. Listed are the institutions, organizations and associations that we have assisted with contributions and sponsorships during 2017.
At First Guaranty Bank, our goal is to help improve the communities we serve. In addition to monetary contributions, our employees dedicated time, energy and effort to many of these worthy causes
First Guaranty Bank contributions for community support were $412,000 in 2017.
Brenda Briscoe presented a contribution to Gwendolyn Daniels, Garland MLK Events Coordinator for the NAACP Garland Unit.
EXPECT MORE 43

Mona Fontenot presented a contribution to Vera Abraham, Activity Coordinator, for Assist Agency.
Cheryl Brumfield and Karen Paille presented a contribution to Mrs. Cheryl Santangelo, Principal, faculty and the entire student body for Mater Dolorosa Catholic School.
Alton Lewis and Mike Knighten are presented with a beautiful carving from Southeastern Louisiana University Lions Athletic Association as a thank you for our contributions.
Clint Trant presented a contribution to Kathleen Abels with TARC.
Elaine Atencio presented a contribution to a few members of the Claiborne Academy Golf Team for the 9th Annual Joe Michael Golf Tournament.
Cheryl Brumfield presented a contribution to Toys for Tots – Tangipahoa Parish Non-profit Organization. Included in the photo are left to right are: Katie Cannon, Director for Tangipahoa Parish, Cheryl Brumfield and Heather Howell, Independence Chamber of Commerce President.
Community Impact
44 2017 ANNUAL REPORT FIRST GUARANTY BANCSHARES, INC.

Diane Shoemaker presented a contribution to Gail Colvin, President of DRABO, Dubach Restoration and Beautification Inc., for the Louisiana Chicken Festival.
Cheryl Brumfield and Stacy Williams presented a contribution to the Breast Cancer Foundation located in Amite. Left to right front: Stacy Williams, Annie Wren, Founder and President, Cheryl Brumfield and from left to right back: Glenda Cross, Chante Buchanan, and Junious Buchanan.
Harrison Gill presented a contribution to Sharon Birch; Administrator for a project at the St. Helena Parish Nursing Home.
Lance Davis presented a contribution to Robert Brister, President of Kentwood Rotary for the annual Kentwood Rotary Golf Tournament.
Amber Leger presented a contribution to Lynn Aube for the Jennings High School After Grad Party.
April Alford, Kristin Williams and Mackenzie Russell presented a contribution to Lisa Lambert from the City of Hammond for the Back to School Bash.
Community Impact
EXPECT MORE 45

Joedi Snipes and Adam Johnston presented a contribution to Shreveport Unlimited for the Mudbug Madness to Melanie Bacon.
Lee Ann Sibley presented a contribution to James Sparacello and Jill Hutchinson, both of the Tangipahoa Parish Sheriff ’s Office, for the upcoming rodeo.
Ronnie Pittman presented a contribution to Jodie Rohner from Crime stoppers Nite Out Against Crime.
Cheryl Brumfield and Stacy Williams presented a contribution to the Tangipahoa African American Heritage Museum and Veterans Archives for the upcoming Black Tie Affair. Left to right: Stacy Williams, Delmas Dunn, President of the Tangipahoa African American Heritage Museum and Veterans Archives, Cheryl Brumfield.
Luke Hammonds presented a contribution to Katherine Marquette, Executive Director for Hammond Regional Arts Center, for the upcoming Beer Fest.
Glenda Graham presented a contribution to Tammy Hawks, Committee Chair, for Gusher Days.
Community Impact
46 2017 ANNUAL REPORT FIRST GUARANTY BANCSHARES, INC.

Cheryl Brumfield presented a contribution to Chasity Collier, Principal of Independence High Magnet School, and Colby McDonald, Head Baseball Coach for the Independence High Magnet School Baseball Team.
Mona Fontenot presented a contribution to George Houssiere, volunteer for Louisiana Hospice & Palliative Care.
Alton Lewis presents a contribution to David Lobue and Mayor Panepinto as a sponsor for the upcoming Hammond Airshow.
Randy Vicknair presented a contribution to Southeastern Louisiana University’s Financial Management Association. Left to right: Sawyer Benson, Mason Case, Nicholas Brennan, Mr. Randy Vicknair, Austin Polk, Shelly Romine, Courtney Klug, Dr. Danielle Lewis, Sarah Beysselance, and Tarez Cowsar.
Diane Shoemaker presented a contribution to Pam Pruden, Principal at Dubach Elementary for the Adopt Our School program.
Adam Johnston presented a contribution to the Bossier Chamber of Commerce President/CEO of the Chamber, Lisa Johnson.
Community Impact
EXPECT MORE 47

Mike Lofaso presented a contribution for the Ponchatoula High School Lady Wave Volleyball to Alexandra Falk, member of the PHS Volleyball team.
Jeannette Ernst presented a contribution to Michael Pearson for the Knights of Columbus event.
A contribution was presented to the North Tangi Support Group for the Kentwood Mardi Gras Parade. Left to right: Greg Burton, President, Patsy Meyer, First Guaranty Bank, Ann Smith, First Guaranty Bank Director, and Lance Davis, First Guaranty Bank.
Adam Johnston presented a contribution to David M. Scruggs, Controller-Kenyan Companies, for the Piggly Wiggly Steak Cook-Off where the proceeds of the event go to St. Jude Children’s Research Hospital.
Cheryl Brumfield presented a contribution to Chasity Collier, Principal of Independence High Magnet School at Senior Awards Ceremony.
Community Impact
48 2017 ANNUAL REPORT FIRST GUARANTY BANCSHARES, INC.

Elaine Atencio presented a contribution to Coach Glen Kyle for the Homer High School football team.
The main office participated in an Options gift drive. Left to right: Starr Bernier, Kristina Terry, Emily Creech, Jaclyn Rice, Sylvia Bush, Amy Starkey.
April Alford and Star Lala presented a contribution to Richard Graves, president of Tangi Animal Friends. Mic Baxter presented a contribution to Deputy Emma
Williams, Elder Service Officer and Deputy Judy Burt, Office Manager for the Lincoln Parish Sheriff 's Department’s Senior Expo.
Jessica Hrenyk, Kristin Williams, Marisa Rodrigues, Melanie Gottschalck, and Desiree Simmons present a contribution to Michelle Biggs, Executive Director of Alumni Relations at Southeastern Louisiana University and Lynn Horgan, Director of Individual, Corporate and Foundation Relations.
Amber Dupre presented a beach bag contribution to Barbara Latiola for a door prize at the Jeff Davis Parish School Board Honor's Banquet.
Community Impact
EXPECT MORE 49

Denise Fletcher presented a contribution to Jack Catalanatto for the American Legion Post#47 Boys State Sponsorship.
Cheryl Brumfield presented a contribution and door prizes to Linda Wisinger, Principal at Mater Dolorosa Catholic School for the Annual Steak Dinner.
JoEllen Juhasz presented a contribution to Mark Burise, Sr. and Silvia Hymel, both with the City of Hammond, to sponsor three city league teams.
Glenda Graham presented a contribution for the Christmas on Caddo 2017 event to Mary Dunn, President of Christmas on Caddo Festival.
Kristin Williams presented a contribution to Mayor Panepinto, Desiree Dotey, Jacqueline Gordon, and students around the community for the Hammond Recreation Center Computer Lab.
Rahul Patel presented a contribution to Lake Charles Racquet Club. Left to right: Ed Neeley, Club Manager, Rahul Patel, and Bobby Walker, Head Pro.
Community Impact
50 2017 ANNUAL REPORT FIRST GUARANTY BANCSHARES, INC.

Community Impact
Harrison Gill presented a contribution to Dr. Kelli Joseph with the St. Helena Parish School Board for the children's summer camp.
Elaine Atencio presented a contribution to Chris Reed, Baseball Coach for Summerfield.
Ron Edmonds presented a contribution to Tim Brown for the Dixie Youth Baseball of Minden.
Cheryl Brumfield and Pam Brazil presented a contribution to the Loranger High School Volleyball Program. Left to right: Athletic Director and Football Coach Sam Messina, Cheryl Brumfield, Pamela Brazil, Volleyball Coach Tyra Starkey, Principal, Mr. Torrence Joseph.
Alton Lewis presents a contribution to Michelle Gallo, general manager of The Daily Star, Alexis Ducorbier, State Farm Insurance agent, and Phillip Monteleone, retired state trooper for the 2018 Hammond Northshore Airshow.
Alton Lewis and Desiree Simmons presented a contribution to Cristina Giambrone, MS Sr. Manager for the upcoming Bike MS event.
EXPECT MORE 51

Community Impact
Bernadette Kemp presented a contribution to Rob Carlisle, Chief Executive Officer and Ginger Cangelosi, Community Outreach Director with Child Advocacy Services.
Amber Leger presented a contribution to Tayton Poole for the Bethel after graduation party.
Cheryl Brumfield presented a contribution to Captain Roy Allbritton, Detective, for the Town of Independence Police Department.
Elaine Atencio presented a contribution to Bill Kennedy, Superintendent (right) and William Maddox, President, for Claiborne Parish Schools.
Lance Davis presented a contribution to Mack Patel of Gujarati Samaj of Mississippi, at their annual banquet.
Kristin Williams presents a contribution to Mr. Ricky Howes, President, Board Member and King Omega IV for the upcoming Krewe of Omega events.
52 2017 ANNUAL REPORT FIRST GUARANTY BANCSHARES, INC.

Community Impact
Terboris Perry presented a contribution to Emerie Eck Gentry, Donor Relations Manager with the Bossier Arts Council.
JoEllen Juhasz presented a contribution to Ginger Cangelosi and Seth Bleakley of Child Advocacy Services.
Denise Fletcher presented a contribution to May Stilley, Director of the new Ponchatoula Outreach Program.
Trisha Patterson presented a contribution to JHS Jazzer, Kaylin Wirtz.
Gwen Pete presented a contribution to Lisa Achane, volunteer for The Concern Youth Group.
Phylicia Vernon presented a contribution to Janice M. Holland, Coordinator for Toys for Tots.
EXPECT MORE 53

Community Impact
Donna Hodges presented a contribution to Derwin K. Miley, Captain at Hammond Fire Department for their upcoming event.
Misty Chauvin presented a contribution to Anthony Berner, Sr., Kiwanis member for the 2017 Ponchatoula Kiwanis Fall Festival.
Randy Vicknair and Michael Moye presented a contribution to Lynn Horgan for the SLU Foundation.
Eric Dosch presented a contribution to Lisa Patti, Coordinator of Chefs Evening and Malayne Sharp, Graduate Assistant for the upcoming Southeastern Louisiana University’s Chefs Evening event.
Ronnie Pittman, Randy Vicknair, Eric Dosch presented a contribution to Jay Artigues, Athletic Director, for Southeastern Athletics. Also in the photo is James Dosch.
Brandon Wear presented a contribution to Juanita Lee for the Ponchatoula High School Marching Band.
54 2017 ANNUAL REPORT FIRST GUARANTY BANCSHARES, INC.

Community Impact
Denise Fletcher presented a contribution to Katie Spratt Johnson of Ponchatoula High School Grand Slam Boosters.
Craig Scelfo presented a contribution to Pat Carpenter Bourgeois, President and CEO of the Special Olympics Louisiana for the Annual Trivia night.
Vanessa Drew presented a contribution to Louisiana Discovery Museum to Lauren Williams, Coordinator of Development and Carolyn Schwebel, Education Director and Program Team.
Melanie Gottschalk presented a contribution to Dr. Rick Settoon accepting as manager of the Southeastern Channel.
Casie N. Qualls presented a contribution to the Seniors at Sumner High School who are part of the group of the Tangipahoa Parish School Board’s Talented Theatre and Performing Arts.
Casie N. Qualls and Jason Wilson presented a contribution check to Karen Babin, Rick Wilke and Bud Antin with the Land Trust for Louisiana.
EXPECT MORE 55

Community Impact
Taraz Cowsar accepted a plaque from the Krewe of Omega on behalf of longtime sponsor First Guaranty Bank. In addition to sponsoring a buffet breakfast and Chamber After Hours for the Krewe, FGB was Omega's first Deluxe Hotspot.
Jane Wear presented a contribution for the Community Music School sponsorship to Jivka Duke, Director of Community Music School with Southeastern Louisiana University.
April Alford presented a contribution to sponsor the Summer Camp at the Hammond Recreation Center. Bank employees volunteered at the camp and presented financial literacy lessons. Accepting on behalf of the City of Hammond Recreation Department are Chris Mouswaswa, Recreation Supervisor, Desiree Dotey, Director, and Mayor Pete Panepinto.
Randy Vicknair presented a contribution to Jay Johnson, Assistant Dean, for the Southeastern Louisiana University Business week.
Casie N. Qualls presented a contribution to Carol Bruno, board member and Dennis Crocker, Fire Chief for the Tangi Rural Fire Protection District to purchase equipment to aid with Swift Water rescue in the Tangipahoa area.
Mona Fontenot presented a contribution to Sharon Compton with Hathaway High School for the Safe & Sober after Prom event.
56 2017 ANNUAL REPORT FIRST GUARANTY BANCSHARES, INC.

Community ImpactAAlpha Kappa Alpha Sorority –
Welcome ReceptionAARPAmeraCare Home Health and
Family HospiceAmerican Cancer SocietyAmerican Legion Auxiliary #47 –
Boys State and Girls StateAmerican Legion Post #141
(Vivian) – Boys StateAmerican Red CrossAmite Chamber of Commerce Amite High School – Baseball Sign Anna’s GraceAssist AgencyA Taste of BlanchardAutism Speaks
BThe Baton Rouge Chapter of the
Risk Management AssociationBethel Christian School –
GraduationThe Blood CenterBossier Arts Council – Artini
SponsorBossier Chamber of Commerce –
Annual Gala SponsorBossier Council on AgingBossier High School – Baseball
Sign SponsorBoys and Girls Club of Timber
RidgeBoy Scouts of America
CChef SoireeChild Advocacy Services – Button
of BraveryClaiborne Academy – Golf
Tournament, Sports Signage and Booster Club
Claiborne Chamber of CommerceClaiborne Charity Inc. – Golf
Tournament SponsorClaiborne Christmas CommitteeClaiborne Council on AgingClaiborne 4-H Livestock ClubClaiborne Memorial Medical
CenterClaiborne Parish Academic
BanquetClaiborne Parish LibraryClaiborne Parish School BoardClaiborne RehabilitationClaiborne Scholastic BanquetClaiborne Senior ApartmentsCommunity Relief 2017
Concerned Youth Club Corporation
Crimestoppers of TangipahoaCystic Fibrosis Foundation –
Louisiana Chapter – Stride Walks
DDelta Tau DeltaDenham Springs Council on AgingDonnie Bickham Middle School –
Robotics ProgramDubach School – Adopt-A-School,
Agents for ChangeDubach Restoration and
Beautification Organization – Chicken Festival Sponsor
EElton Elementary School – Positive
Behavior ProgramElton High SchoolErath High School
FFestival Acadiens Et CreoleFirst Baptist Church of Amite First Baptist Church GreensburgHerbert S. Ford Memorial Museum
GTown of GreensburgGujarati Samaj of Mississippi –
Banquet SponsorGusher Days
HCity of Hammond – Veterans
Breakfast, Hope Summer Camp, Back 2 School Bash
City of Hammond Recreation Department – Literacy Programs & Basketball, Baseball, Softball Sponsors
Hammond Air Show Foundation – Chappapella Sports Package
Hammond Area Recreation District
Hammond Chamber of CommerceHammond Downtown
Development District – Hot August Night Sponsor
Hammond Firefighters AssociationHammond High Magnet School –
Softball Hammond Police Union Local 345Hammond Regional Arts CenterHammond Senior Center – Tangi
Voluntary Council on Aging
Landa Domangue presented a contribution to Peggy Matheu, President of FeLions, Peggy Hoover, Treasurer, and Jan Labbe, Secretary for the FeLions, Salute the Lions event at Southeastern Louisiana University.
Philip Qualls presented a contribution to Roy Blackwood, Columbia theatre director, for the Columbia Theatre.
Ronnie Pittman presented a contribution to Brian Shirey of the Hammond Blues and BBQ.
EXPECT MORE 57

Community ImpactNNAACPNational Church ResidencesNational Night Out – Oil City
Town HallNesom Middle SchoolNorth Caddo Magnet High School
– Basketball ProgramNorth Caddo Medical Center
Foundation – Gold Buckle Sponsor
North Louisiana Economic Partnership
North Tangi Support Group – Mardi Gras Parade Sponsor
North Texas Association of Government – Ken Byrd Golf Tournament
North Vermilion High School
OOak Forest Academy – Football Options, Inc.Osyka Civic Club
PPecan VillaPilot Club of Denham SpringsPine View Middle SchoolPonchatoula Area RecreationPonchatoula Chamber of
CommercePonchatoula Council on AgingPonchatoula High School – Softball
Field Sign, Project Graduation, Lady Wave Volleyball/Basketball and Senior Breakfast
PHS Band BoostersPHS Soccer Booster ClubPonchatoula Lions ClubPonchatoula Youth Baseball –
Team SponsorCity of Ponchatoula – Student
Outreach
QQuinn Chapel AME Church
RRosaryville Student Life CenterRotary Club of HammondRotary Club of Oil City
SSHAPE (St. Helena Advocacy for
Parish Enrichment)St. Helena Council on AgingSt. Helena Forestry AssociationSt. Helena Parish School BoardSt. Helena Sheriff ’s DepartmentSt. Helena/Tangipahoa Dairy DaysSt. Tammany Project ChristmasDowntown Shreveport Unlimited
– Mud Bug Madness SponsorChuck Silcox Animal Care &
Control CenterSouth Tangipahoa Parish Port
CommissionSoutheast Community Health
SystemsSoutheastern Louisiana
University Alumni Association – Convocation Picnic Sponsors
Southeastern Louisiana University Athletic Association – Salute the Lions Sponsor, Champagne Bingo
and Sports PackageSoutheastern Louisiana University
Financial Management Association – Finance Conference
Southeastern Louisiana University Foundation –Chef ’s Evening Sponsor, SLU Channel Programming, College of Business, Community Music School Sponsorship, Partner and Columbia Theater for the Arts
Sponsor Special Olympics Louisiana –
Trivia Night SponsorSpecial Olympics TexasSpringfield Council on AgingSpringfield ElementarySummerfield High SchoolSumner High School
TTARC - RadiothonTangi Animal FriendsTangi Humane SocietyTangi Parish FairTangi Professional Women’s
OrganizationTangi Rural Fire ProtectionTangipahoa Master Gardner
AssociationTangipahoa Parish School System
– Talented TheatreTangipahoa Parish Sheriff 's Office
– Mounted Division FundraiserTangipahoa African American
Heritage Museum & Veterans Archive – Black Tie Event
Hammond Smokin’ Blues & BBQHathaway High School – Prom
Lock In, Stadium Sign Haynesville Beautification
CommitteeHaynesville Lions ClubHearts and Paws UnitedHomer Country Club – Golf
Tournament SponsorHomer Golf Club – Golf Course
SignHomer High School – Football
SponsorTown of Homer
IIndependence Chamber of
CommerceIndependence High School –
Baseball Sponsor, Graduation/Senior Awards
Independence Police DepartmentIndependence Police Reserve –
Police Car ContributionsIndependence Sicilian Heritage
FestivalIndependence Summer Baseball
Program SponsorIndian Bayou Community
Volunteer Fire DepartmentItalian FestivalTown of Independence – 4th of
July Festival
JJames Ward Elementary SchoolJeff Davis Chamber of CommerceJeff Davis Parish School Board and
Public SchoolsJennings High School – Operation
Graduation and JazzersJunior Achievement
KKentwood Baseball/Softball
Association – Signage and Tournament Sponsorship
Kentwood Council on AgingKentwood High SchoolKentwood Rotary ClubKiwanis Club of AmiteKiwanis Club of Denham SpringsKiwanis Club of HammondKiwanis Club of PonchatoulaKnights of ColumbusKrewe of Omega – Community
ProjectsKRLQ/KWXM Radio – Dubach
Chicken FestivalTown of Kentwood – School
Supply Giveaway
LLadies Top 28 TournamentLake Area Community Tennis
AssociatioinLake Claiborne Inc. – 4th of July
Fireworks SponsorLallie Kemp FoundationLand Trust for Southeast Louisiana
– Conservation Cup SponsorLake Charles Racquet Club –
Tennis TournamentLeadership LivingstonLeadership TangipahoaLincoln Parish Sheriff – Senior
Expo SponsorLivingston Council on AgingLivingston Parish Chamber of
CommerceLivingston Parish LibraryLivingston Parish School BoardLivingston Parish Sheriff ’s OfficeLoranger Cheer Booster ClubLoranger High School – Softball,
Volleyball and Football Programs and Signs; Project Graduation Sponsor
Loranger Youth BasketballLouisiana Bankers AssociationLouisiana Bankers Education
CouncilLouisiana Children’s Discovery
Center – Jazz Brunch Sponsor and Bubble Zone Exhibit
Louisiana Falcons BaseballLouisiana Hospice and Palliative
CareLouisiana Jumpstart CoalitionLouisiana MarathonLouisiana Redbud Festival
AssociationLSU Ag Center – 4-H Livestock
Show Sponsor
MMain Street Homer – Music on
Main and Revitalize ProgramMaltrait Memorial Spring BazaarMarsh MadnessMater Dolorosa Catholic School –
School Improvements and Steak Dinner Fundraiser
Maurepas Council on AgingMeaux/Nunez Volunteer Fire
DepartmentMinden Athletics – All Star Team Monterey Country Club – Golf
Tournament SponsorRichard Murphy Hospice
Foundation
58 2017 ANNUAL REPORT FIRST GUARANTY BANCSHARES, INC.

Tiger Athletic Foundation – LSU Baseball Sponsor
TK Breast Cancer FoundationToys for Tots Foundation – Gold
SponsorVillage of Tangipahoa –
Community Park Fundraiser
UUnited Way of Southeast Louisiana
– Corporate Match Contribution
VVermilion Council on AgingVivian Athletic AssociationTown of VivianVolunteers for Youth Justice
WVermilion Council on AgingVivian Athletic AssociationTown of VivianVolunteers for Youth Justice
#4:13 Softball
EXPECT MORE 59
2017 FGB Volunteer Results
Total Employee Community Service Hours Completed
1,673
Total Number of
Organizations Reached
213 Total
Num
ber o
f
Emplo
yee V
olunte
ers19
5

EARNINGS & DIVIDENDS
Earnings Total CommonDividends Paid
Cumulative Retained Earnings (Deficit)* Notable Events
1993 $2.1 million $ 200,000 $(4,984,000) ■ Investors purchased $3.6 million of common stock
1994 $1.7 million $ 601,000 $(3,879,070)
1995 $2.1 million $ 815,000 $(2,796,000) ■ Investors purchased $337,000 of common stock
1996 $3.3 million $1,020,000 $ (774,000) ■ Three-for-two stock split
1997 $3.4 million $1,223,000 $ 1,205,000
1998 $3.4 million $1,223,000 $ 3,482,000
1999 $3.4 million $1,316,000 $ 4,473,000 ■ Investors purchased $9.6 million of common stock ■ Acquired 13 branches from Bank One of Louisiana ■ Acquired First Southwest Bank
2000 $5.0 million $1,530,000 $ 5,027,000 ■ Gains from sale of acquired branches net of tax totaling $2.8 million
2001 $6.0 million $1,668,000 $ 8,638,000 ■ Acquired Woodlands Bancorp ■ Gains from sale of acquired branches net of tax totaling $1.3 million
2002 $3.5 million $1,751,000 $10,426,000
2003 $7.0 million $2,086,000 $13,967,000
2004 $8.6 million $2,752,000 $19,771,000
2005 $6.0 million $3,173,000 $23,351,000 ■ Four-for-three stock split
2006 $8.4 million $3,335,000 $28,402,000
2007 $9.8 million $3,503,000 $34,671,000 ■ Acquired Homestead Bancorp
2008 $5.5 million $3,558,000 $36,626,000
2009 $7.6 million $3,558,000 $40,069,000
2010 $10.0 million $3,558,000 $45,203,000
2011 $8.0 million $3,610,000 $47,650,000 ■ Acquired Greensburg Bancshares
2012 $12.1 million $4,035,000 $53,702,000 ■ 10% common stock dividend ■ Dividend rate per share remains $0.16 per quarter
2013 $9.1 million $4,027,000 $58,102,000 ■ Total loans exceeded $700 million
2014 $11.2 million $4,027,000 $64,905,000 ■ Retained earnings grew by $6.8 million ■ Total loans reached $790 million
2015 $14.5 million $4,247,000 $73,445,000 ■ 10% common stock dividend ■ Listed in NASDAQ ■ Redeemed SBLF Preferred Stock
2016 $14.1 million $4,870,000 $82,668,000 ■ Loans totaled $949 million ■ 94th consecutive quarterly dividend
2017 $11.8 million $5,210,000 $89,209,000
■ Grand opening of Bossier City, LA Banking Center ■ Acquisition of Synergy Bank and addition of five new Texas locations
■ 50% ownership in Centurion Insurance Services allowing First Guaranty to sell insurance products
$177.6 million $66,896,000
* Retained earnings has not been adjusted to consider stock splits or stock dividends. This better reflects earnings that have been retained as capital. Retained earnings is the product of Company earnings less common and preferred dividends. The accumulated deficits in 1993 through 1996 were due to losses incurred prior to 1993.
60 2017 ANNUAL REPORT FIRST GUARANTY BANCSHARES, INC.

1 Iberiabank Lafayette2 Origin Bank Choudrant3 Home Bank Lafayette4 MidSouth Bank, National Association Lafayette5 First Guaranty Bank Hammond6 Red River Bank Alexandria7 Investar Bank Baton Rouge8 Gulf Coast Bank and Trust Company New Orleans9 Business First Bank Baton Rouge10 Crescent Bank & Trust New Orleans11 First Bank and Trust New Orleans12 First American Bank and Trust Vacherie13 Citizens National Bank, N.A. Bossier City14 Sabine State Bank and Trust Company Many15 JD Bank Jennings16 First National Banker's Bank Baton Rouge17 First Federal Bank of Louisiana Lake Charles18 Fidelity Bank New Orleans19 Resource Bank Covington20 Liberty Bank and Trust Company New Orleans21 The Evangeline Bank and Trust Company Ville Platte22 United Community Bank Gonzales23 Progressive Bank Monroe24 Concordia Bank & Trust Company Vidalia25 Synergy Bank Houma26 Community Bank of Louisiana Mansfield27 South Louisiana Bank, Houma, Louisiana Houma28 Coastal Commerce Bank Houma29 Gibsland Bank & Trust Company Gibsland30 Home Federal Bank Shreveport31 Merchants & Farmers Bank & Trust Company Leesville32 Fifth District Savings Bank New Orleans33 Metairie Bank & Trust Company Metairie34 First National Bank of Louisiana Crowley35 BOM Bank Montgomery36 Gulf Coast Bank Abbeville37 Rayne State Bank & Trust Company Rayne38 Cross Keys Bank Saint Joseph39 Community First Bank New Iberia40 Florida Parishes Bank Hammond41 Bank of Commerce & Trust Co. Crowley42 Cottonport Bank Cottonport43 City Savings Bank & Trust Company Deridder44 MC Bank & Trust Company Morgan City45 Richland State Bank Rayville46 Citizens Bank & Trust Company Plaquemine47 Southern Heritage Bank Jonesville48 Farmers-Merchant Bank & Trust Company Breaux Bridge49 Delta Bank Vidalia50 St. Landry Bank and Trust Company Opelousas51 Bank of Ruston Ruston52 The Union Bank Marksville53 City Bank & Trust Co. Natchitoches54 First National Bank Arcadia55 Peoples Bank and Trust Company of Pointe Coupee Parish New Roads56 First National Bank in DeRidder DeRidder57 The First National Bank of Jeanerette Jeanerette58 Jonesboro State Bank Jonesboro59 Patterson State Bank Patterson60 Homeland Federal Savings Bank Columbia61 Guaranty Bank & Trust Company of Delhi, Louisiana Delhi62 Bank of Zachary Zachary
63 The Bank Jennings64 Bank of Coushatta Coushatta65 Citizens Savings Bank Bogalusa66 St. Landry Homestead Federal Savings Bank Opelousas67 Guaranty Bank and Trust Company New Roads68 Tri-Parish Bank Eunice69 American Bank & Trust Company Opelousas70 Catahoula - LaSalle Bank Jonesville71 Lakeside Bank Lake Charles72 Winnsboro State Bank & Trust Company Winnsboro73 Washington State Bank Washington74 Bank of Abbeville & Trust Company Abbeville75 Franklin State Bank & Trust Company Winnsboro76 Caldwell Bank & Trust Company Columbia77 Marion State Bank Marion78 Plaquemine Bank & Trust Company Plaquemine79 South Lafourche Bank & Trust Company Larose80 Citizens Progressive Bank Winnsboro81 Tensas State Bank Newellton82 Bank of Winnfield & Trust Company Winnfield83 Commercial Capital Bank Delhi84 Anthem Bank & Trust Plaquemine85 Hibernia Bank New Orleans86 Exchange Bank and Trust Company, Natchitoches, Louisiana Natchitoches87 Citizen's Bank & Trust Company of Vivian, Louisiana Vivian88 First National Bank USA Boutte89 Bank of St. Francisville Saint Francisville90 American Bank & Trust Company Covington91 Vermilion Bank & Trust Company Kaplan92 Bank of Sunset and Trust Company Sunset93 Landmark Bank Clinton94 Feliciana Bank & Trust Company Clinton95 State Bank & Trust Company Golden Meadow96 Citizens Bank & Trust Company Covington97 Farmers State Bank & Trust Co. Church Point98 Mississippi River Bank Belle Chasse99 Colfax Banking Company Colfax100 Heritage Bank of St. Tammany Covington101 Bank of Erath Erath102 Eureka Homestead Metairie103 Teche Bank & Trust Co. Saint Martinville104 Kaplan State Bank Kaplan105 Union Savings and Loan Association New Orleans106 Bank of Louisiana New Orleans107 Simmesport State Bank Simmesport108 Bank of Gueydan Gueydan109 Peoples Bank Chatham110 The Bank of Commerce White Castle111 Jackson Parish Bank Jonesboro112 Hodge Bank & Trust Company Hodge113 Beauregard FSB Deridder114 Abbevile Building & Loan (A State-Chartered Savings Bank) Abbeville115 Commerce Community Bank Oak Grove116 Rayne Building and Loan Association Rayne117 Sicily Island State Bank Sicily Island118 First National Bank of Benton Benton119 Progressive National Bank of DeSoto Parish Mansfield120 Basile State Bank Basile121 Bank of Oak Ridge Oak Ridge122 Mutual Savings and Loan Association Metairie123 The Mer Rouge State Bank Mer Rouge
Banks Headquartered in Louisiana Ranked by Asset Size as of December 31, 2017
EXPECT MORE 61

Our Mission
Our Values & Goals
The mission of First Guaranty Bank and First Guaranty Bancshares is to increase shareholder value while providing financial services for and contributing to the growth and welfare of the communities we serve.
Customers. We believe that every customer is our most important customer. We endeavor to provide levels of service that exceed their expectations.
Employees. We believe that our employees are our greatest asset as demonstrated in their professionalism and dedication. We encourage open communication and strive to cultivate an entrepreneurial environment in which our employees feel highly responsible for the performance of the Company. We believe in an environment where they will contribute new ideas and innovations that will help both us and them excel.
Shareholders. We seek to enhance shareholder value by continually improving the quality of assets, growth in earnings, return on equity and dividend payout.
Community. We strive to be a socially responsible corporate citizen by supporting community activities and encouraging employees to be actively involved in our communities. We are committed to the success of the communities that we serve, the same communities our employees call home. Our goals is to participate in making our communities better places in which to live, work and play.
62 2017 ANNUAL REPORT FIRST GUARANTY BANCSHARES, INC.

Selected Financial Data ................................................................................................ 64
Management’s Discussion and Analysisof Financial Condition and Results of Operation ................................................... 68
Report of Independent Registered Accounting Firm ............................................. 96
Consolidated Balance Sheets ....................................................................................... 97
Consolidated Statements of Income .......................................................................... 98
Consolidated Statements of Consolidated Income (Loss) ..................................... 99
Consolidated Statements of Shareholders’ Equity ................................................... 99
Consolidated Statements of Cash Flows ................................................................... 100
Notes to Consolidated Financial Statements ........................................................... 101
Financial Table of Contents
EXPECT MORE 63

Selected Financial DataThe following table presents consolidated selected financial data for First Guaranty. It does not purport to be complete and is qualified in its entirety by more detailed financial information and the audited consolidated financial statements contained elsewhere in this annual report.
At or For the Years Ended December 31,
2017 2016 2015 2014 2013
(in thousands except for % and share data)
Year End Balance Sheet Data:
Investment securities $ 501,656 $ 499,336 $ 546,121 $ 641,603 $ 634,504
Federal funds sold $ 823 $ 271 $ 582 $ 210 $ 665
Loans, net of unearned income $ 1,149,014 $ 948,921 $ 841,583 $ 790,321 $ 703,166
Allowance for loan losses $ 9,225 $ 11,114 $ 9,415 $ 9,105 $ 10,355
Total assets $ 1,750,430 $ 1,500,946 $1,459,753 $1,518,876 $ 1,436,441
Total deposits $ 1,549,286 $ 1,326,181 $1,295,870 $1,371,839 $ 1,303,099
Borrowings $ 52,938 $ 43,230 $ 42,221 $ 3,255 $ 6,288
Shareholders' equity $ 143,983 $ 124,349 $ 118,224 $ 139,583 $ 123,405
Common shareholders' equity $ 143,983 $ 124,349 $ 118,224 $ 100,148 $ 83,970
Performance Ratios and Other Data:
Return on average assets 0.71% 0.97% 0.97% 0.77% 0.65%
Return on average common equity 8.59% 11.18% 12.98% 11.40% 9.31%
Return on average tangible assets 0.73% 0.98% 0.99% 0.79% 0.67%
Return on average tangible common equity 9.15% 11.64% 13.60% 12.10% 9.99%
Net interest margin 3.33% 3.39% 3.26% 3.11% 2.92%
Average loans to average deposits 72.23% 68.57% 61.31% 55.72% 53.58%
Efficiency ratio(1) 62.64% 56.85% 55.11% 62.85% 65.61%
Efficiency ratio (excluding amortization of intangibles andsecurities transactions)(1) 63.38% 60.19% 57.74% 62.58% 67.17%
Full time equivalent employees (year end) 338 293 277 271 278
Capital Ratios:
Average shareholders' equity to average assets 8.31% 8.63% 9.88% 9.24% 9.28%
Average tangible equity to average tangible assets 8.01% 8.44% 9.67% 9.00% 9.02%
Common shareholders' equity to total assets 8.23% 8.28% 8.10% 6.59% 5.85%
Tier 1 leverage capital consolidated 8.27% 8.68% 8.17% 9.33% 9.14%
Tier 1 capital consolidated 10.35% 10.59% 10.85% 13.16% 13.61%
Total risk-based capital consolidated 12.14% 12.79% 13.13% 14.05% 14.71%
Common equity tier one capital consolidated 10.35% 10.59% 10.85% N/A N/A
Tangible common equity to tangible assets(2) 7.87% 8.10% 7.89% 6.37% 5.59%
64 2017 ANNUAL REPORT FIRST GUARANTY BANCSHARES, INC.

1. Efficiency ratio represents noninterest expense divided by the sum of net interest income and noninterest income. We calculate both a GAAP and a non-GAAP efficiency ratio. The GAAP-based efficiency ratio is noninterest expenses divided by net interest income plus noninterest income. See below for our reconciliation of non-GAAP financial measures to their most directly comparable GAAP financial measures under the caption “Selected Financial Data—Non-GAAP Financial Measures.”
2. We calculate tangible common equity as total shareholders’ equity less preferred stock, goodwill and acquisition intangibles, principally core deposit intangibles, net of accumulated amortization, and we calculate tangible assets as total assets less goodwill and core deposit intangibles. Tangible common equity to tangible assets is a non-GAAP financial measure, and, as we calculate tangible common equity to tangible assets, the most directly comparable GAAP financial measure is total shareholders’ equity to total assets. See below for our reconciliation of non-GAAP financial measures to their most directly comparable GAAP financial measures under the caption “Selected Historical Consolidated Financial and Other Data—Non-GAAP Financial Measures.”
3. We calculate tangible book value per common share as total shareholders’ equity less preferred stock, goodwill and acquisition intangibles, principally core deposit intangibles, net of accumulated amortization at the end of the relevant period, divided by the outstanding number of shares of our common stock at the end of the relevant period. Tangible book value per common share is a non-GAAP financial measure, and, as we calculate tangible book value per common share, the most directly comparable GAAP financial measure is book value per common share. See below for our reconciliation of non-GAAP financial measures to their most directly comparable GAAP financial measures under the caption “Selected Financial Data—Non-GAAP Financial Measures.”
4. Historical share and per share amounts have been adjusted to reflect the ten percent stock dividend paid December 14, 2017 to shareholders of record as of December 8, 2017.
Income Data:
Interest income $ 67,546 $ 58,532 $ 56,079 $ 53,297 $ 50,886
Interest expense $ 14,393 $ 10,140 $ 8,608 $ 9,202 $ 11,134
Net interest income $ 53,153 $ 48,392 $ 47,471 $ 44,095 $ 39,752
Provision for loan losses $ 3,822 $ 3,705 $ 3,864 $ 1,962 $ 2,520
Noninterest income (excluding securities transactions) $ 6,943 $ 5,656 $ 5,656 $ 5,882 $ 5,907
Securities gains $ 1,397 $ 3,799 $ 3,300 $ 295 $ 1,571
Noninterest expense $ 38,521 $ 32,885 $ 31,095 $ 31,594 $ 30,987
Earnings before income taxes $ 19,150 $ 21,257 $ 21,468 $ 16,716 $ 13,723
Net income $ 11,751 $ 14,093 $ 14,505 $ 11,224 $ 9,146
Net income available to common shareholders $ 11,751 $ 14,093 $ 14,121 $ 10,830 $ 8,433
Per Common Share Data: (4)
Net earnings $ 1.37 $ 1.68 $ 1.83 $ 1.42 $ 1.11
Cash dividends paid $ 0.60 $ 0.58 $ 0.54 $ 0.53 $ 0.53
Book value $ 16.35 $ 14.86 $ 14.13 $ 13.16 $ 11.03
Tangible book value (3) $ 15.59 $ 14.50 $ 13.73 $ 12.68 $ 10.52
Dividend payout ratio 44.34% 34.56% 30.07% 37.18% 47.75%
Weighted average number of shares outstanding 8,608,088 8,369,424 7,714,620 7,611,397 7,611,397
Number of shares outstanding 8,807,175 8,369,424 8,369,424 7,611,397 7,611,397
Asset Quality Ratios:
Non-performing assets to total assets 0.84% 1.48% 1.51% 0.99% 1.27%
Non-performing assets to total loans 1.28% 2.34% 2.62% 1.90% 2.60%
Non-performing loans to total loans 1.17% 2.30% 2.43% 1.62% 2.12%
Loan loss reserve to non-performing assets 62.88% 50.04% 42.74% 60.74% 56.72%
Net charge-offs to average loans 0.54% 0.23% 0.44% 0.45% 0.38%
Provision for loan loss to average loans 0.36% 0.42% 0.47% 0.27% 0.38%
Allowance for loan loss to total loans 0.80% 1.17% 1.12% 1.15% 1.47%
EXPECT MORE 65

Non-GAAP Financial MeasuresOur accounting and reporting policies conform to accounting principles generally accepted in the United States, or GAAP, and the prevailing practices in the banking industry. However, we also evaluate our performance based on certain additional metrics. Tangible book value per share and the ratio of tangible equity to tangible assets are not financial measures recognized under GAAP and, therefore, are considered non-GAAP financial measures.
Our management, banking regulators, many financial analysts and other investors use these non-GAAP financial measures to compare the capital adequacy of banking organizations with significant amounts of preferred equity and/or goodwill or other intangible assets, which
typically stem from the use of the purchase accounting method of accounting for mergers and acquisitions. Tangible equity, tangible assets, tangible book value per share or related measures should not be considered in isolation or as a substitute for total shareholders’ equity, total assets, book value per share or any other measure calculated in accordance with GAAP. Moreover, the manner in which we calculate tangible equity, tangible assets, tangible book value per share and any other related measures may differ from that of other companies reporting measures with similar names.
The following table reconciles, as of the dates set forth below, shareholders’ equity (on a GAAP basis) to tangible equity and total assets (on a GAAP basis) to tangible assets and calculates our tangible book value per share.
At December 31,
2017 2016 2015 2014 2013
(in thousands except for share data and %)
Tangible Common Equity
Total shareholders' equity $ 143,983 $ 124,349 $ 118,224 $ 139,583 $ 123,405
Adjustments:
Preferred - - - 39,435 39,435
Goodwill 3,472 1,999 1,999 1,999 1,999
Acquisition intangibles 3,249 978 1,298 1,618 1,938
Tangible common equity $ 137,262 $ 121,372 $ 114,927 $ 96,531 $ 80,033
Common shares outstanding 8,807,175 8,369,424 8,369,424 7,611,397 7,611,397
Book value per common share $ 16.35 $ 14.86 $ 14.13 $ 13.16 $ 11.03
Tangible book value per common share $ 15.95 $ 14.50 $ 13.73 $ 12.68 $ 10.52
Tangible Assets
Total Assets $ 1,750,430 $ 1,500,946 $ 1,459,753 $ 1,518,876 $ 1,436,441
Adjustments:
Goodwill 3,472 1,999 1,999 1,999 1,999
Acquisition intangibles 3,249 978 1,298 1,618 1,938
Tangible Assets $ 1,743,709 $ 1,497,969 $ 1,456,456 $1,515,259 $1,432,504
Tangible common equity to tangible assets 7.87% 8.10% 7.89% 6.37% 5.59%
66 2017 ANNUAL REPORT FIRST GUARANTY BANCSHARES, INC.
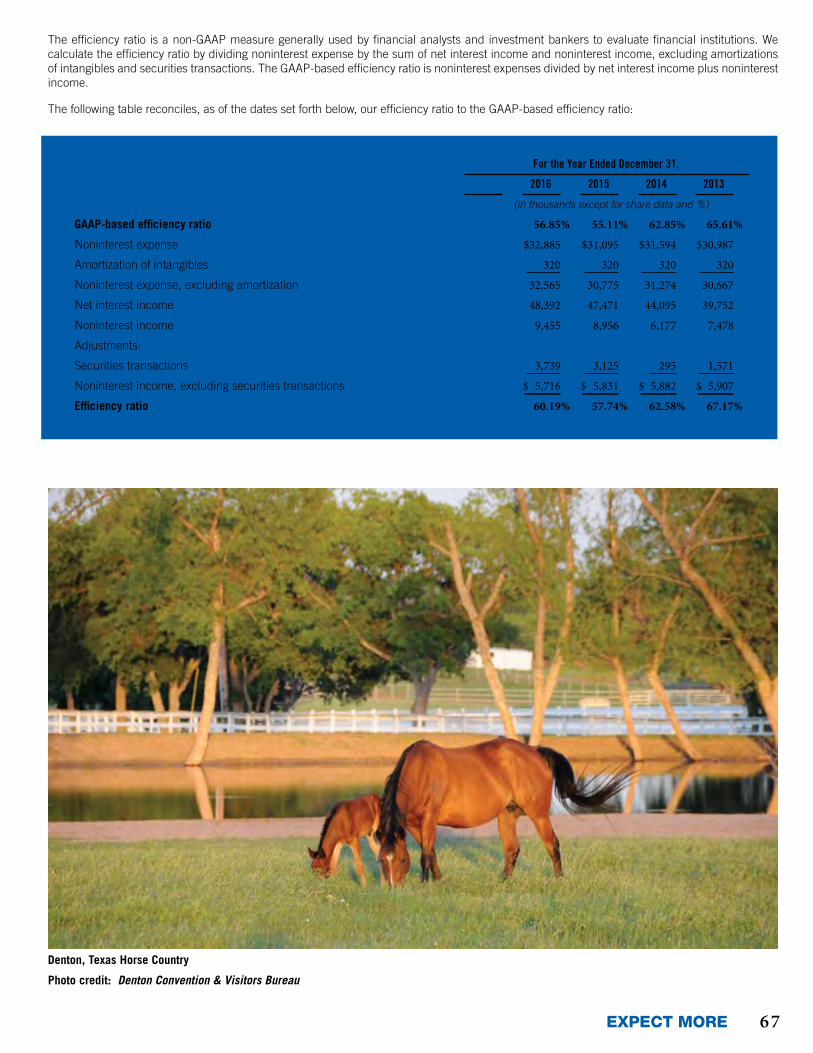
The efficiency ratio is a non-GAAP measure generally used by financial analysts and investment bankers to evaluate financial institutions. We calculate the efficiency ratio by dividing noninterest expense by the sum of net interest income and noninterest income, excluding amortizations of intangibles and securities transactions. The GAAP-based efficiency ratio is noninterest expenses divided by net interest income plus noninterest income.
The following table reconciles, as of the dates set forth below, our efficiency ratio to the GAAP-based efficiency ratio:
For the Year Ended December 31,
2017 2016 2015 2014 2013
(in thousands except for share data and %)
GAAP-based efficiency ratio 62.64% 56.85% 55.11% 62.85% 65.61%
Noninterest expense $38,521 $32,885 $31,095 $31,594 $30,987
Amortization of intangibles 432 320 320 320 320
Noninterest expense, excluding amortization 38,089 32,565 30,775 31,274 30,667
Net interest income 53,153 48,392 47,471 44,095 39,752
Noninterest income 8,340 9,455 8,956 6,177 7,478
Adjustments:
Securities transactions 1,397 3,739 3,125 295 1,571
Noninterest income, excluding securities transactions $ 6,943 $ 5,716 $ 5,831 $ 5,882 $ 5,907
Efficiency ratio 63.38% 60.19% 57.74% 62.58% 67.17%
Denton, Texas Horse Country
Photo credit: Denton Convention & Visitors Bureau
EXPECT MORE 67

Management’s Discussion and Analysis of Financial Condition and Results of OperationsThe following discussion and analysis of our financial condition and results of operations should be read in conjunction with Item 6, “Selected Financial Data” and our audited consolidated financial statements and the accompanying notes included elsewhere in this Annual Report. This discussion and analysis contains forward-looking statements that are subject to certain risks and uncertainties and are based on certain assumptions that we believe are reasonable but may prove to be inaccurate. Certain risks, uncertainties and other factors, including those set forth under “Forward-Looking Statements,” “Risk Factors” and elsewhere in this Annual Report, may cause actual results to differ materially from those projected results discussed in the forward-looking statements appearing in this discussion and analysis. We assume no obligation to update any of these forward-looking statements.
Special Note Regarding Forward-Looking StatementsCongress passed the Private Securities Litigation Act of 1995 in an effort to encourage corporations to provide information about a Company's anticipated future financial performance. This act provides a safe harbor for such disclosure, which protects us from unwarranted litigation, if actual results are different from Management expectations. This discussion and analysis contains forward-looking statements and reflects Management’s current views and estimates of future economic circumstances, industry conditions, company performance and financial results. The words “may,” “should,” “expect,” “anticipate,” “intend,” “plan,” “continue,” “believe,” “seek,” “estimate” and similar expressions are intended to identify forward-looking statements. These forward-looking statements are subject to a number of factors and uncertainties, including, changes in general economic conditions, either nationally or in our market areas, that are worse than expected; competition among depository and other financial institutions; inflation and changes in the interest rate environment that reduce our margins or reduce the fair value of financial instruments; adverse changes in the securities markets; changes in laws or government regulations or policies affecting financial institutions, including changes in regulatory fees and capital requirements; our ability to enter new markets successfully and capitalize on growth opportunities; our ability to successfully integrate acquired entities, if any; changes in consumer spending, borrowing and savings habits; changes in accounting policies and practices, as may be adopted by the bank regulatory agencies, the Financial Accounting Standards Board, the Securities and Exchange Commission and the Public Company Accounting Oversight Board; changes in our organization, compensation and benefit plans; changes in our financial condition or results of operations that reduce capital available to pay dividends; and changes in the financial condition or future prospects of issuers of securities that we own, which could cause our actual results and experience to differ from the anticipated results and expectations, expressed in such forward-looking statements.
OverviewFirst Guaranty Bancshares is a Louisiana-chartered bank holding company headquartered in Hammond, Louisiana. Our wholly-owned subsidiary, First Guaranty Bank, a Louisiana-chartered commercial bank, provides personalized commercial banking services primarily to Louisiana and Texas customers through 27 banking facilities primarily located in the MSAs of Hammond, Baton Rouge, Lafayette, Shreveport-Bossier City, Dallas-Fort Worth-Arlington, and Waco. We emphasize personal relationships and localized decision making to ensure that products and services are matched to customer needs. We compete for business principally on the basis of personal service to customers, customer access to officers and directors and competitive
interest rates and fees. First Guaranty entered the Texas markets in 2017 with the acquisition of Premier Bancshares, Inc. and its wholly owned subsidiary, Synergy Bank.
Total assets were $1.8 billion at December 31, 2017 and $1.5 billion at December 31, 2016. Total deposits were $1.5 billion at December 31, 2017 and $1.3 billion at December 31, 2016. Total loans were $1.1 billion at December 31, 2017, an increase of $200.1 million, or 21.1%, compared with December 31, 2016. Common shareholders’ equity was $144.0 million and $124.3 million at December 31, 2017 and December 31, 2016, respectively. The growth in assets and liabilities in 2017 as compared to 2016 was primarily due to the acquisition of Premier in June 2017.
Net income was $11.8 million, $14.1 million and $14.5 million for the years ended December 31, 2017, 2016 and 2015, respectively. We generate most of our revenues from interest income on loans, interest income on securities, sales of securities and service charges, commissions and fees. We incur interest expense on deposits and other borrowed funds and noninterest expense such as salaries and employee benefits and occupancy and equipment expenses. Net interest income is the difference between interest income earned on interest-earning assets such as loans and securities and interest expense paid on interest-bearing liabilities such as deposits and borrowings which are used to fund those assets. Net interest income is our largest source of revenue. To evaluate net interest income, we measure and monitor: (1) yields on our loans and other interest-earning assets; (2) the costs of our deposits and other funding sources; (3) our net interest spread and (4) our net interest margin. Net interest spread is the difference between rates earned on interest-earning assets and rates paid on interest-bearing liabilities. Net interest margin is calculated as net interest income divided by average interest-earning assets. Because noninterest-bearing sources of funds, such as noninterest-bearing deposits also fund interest-earning assets, net interest margin includes the benefit of these noninterest-bearing sources.
Changes in market interest rates and interest rates we earn on interest-earning assets or pay on interest-bearing liabilities, as well as the volume and types of interest-earning assets, interest-bearing and noninterest-bearing liabilities are usually the largest drivers of periodic changes in net interest spread, net interest margin and net interest income. Fluctuations in market interest rates are driven by many factors, including governmental monetary policies, inflation, deflation, macroeconomic developments, changes in unemployment, the money supply, political and international conditions and conditions in domestic and foreign financial markets. Periodic changes in the volume and types of loans in our loan portfolio are affected by, among other factors, economic and competitive conditions in Louisiana, Texas and our other out-of-state market areas. During the extended period of historically low interest rates, we continue to evaluate our investments in interest-earning assets in relation to the impact such investments have on our financial condition, results of operations and shareholders’ equity.
Financial highlights for 2017 and 2016:• During the fourth quarter of 2017, First Guaranty elected to become
a financial holding company because First Guaranty acquired a fifty percent ownership in an insurance brokerage in November 2017.
• First Guaranty completed its merger with Premier Bancshares, Inc. ("Premier") and its wholly owned subsidiary, Synergy Bank, on June 16, 2017. First Guaranty acquired a total of $158.3 million in assets and assumed an $137.4 million in liabilities. First Guaranty issued 397,988 shares of its common stock at a price of $25.86 and paid $10.3 million in cash to Premier shareholders (unadjusted for the 10% stock dividend in December 2017). Total consideration was $21.0 million. First Guaranty acquired a total of $128.0 million in
68 2017 ANNUAL REPORT FIRST GUARANTY BANCSHARES, INC.

loans, securities of $5.9 million, cash and due from banks of $4.5 million, Fed funds sold of $2.9 million, premises of $9.5 million, other real estate owned of $0.2 million and other assets that totaled $2.0 million. Intangibles recorded from the transaction were a total of $5.3 million, including goodwill of $1.5 million. Total assumed liabilities included deposits of $127.2 million, an FHLB advance of $9.7 million and other liabilities of $0.4 million. Expenses related to the merger totaled $1.4 million in 2017.
• Total assets at December 31, 2017 increased $249.5 million, or 16.6%, to $1.8 billion when compared to December 31, 2016. Total loans at December 31, 2017 were $1.1 billion, an increase of $200.1 million, or 21.1%, compared with December 31, 2016. Common shareholders' equity was $144.0 million and $124.3 million at December 31, 2017 and 2016, respectively.
• Net income for the years ended December 31, 2017 and 2016 was $11.8 million and $14.1 million, respectively.
• Earnings per common share were $1.37 and $1.68 for the years ended December 31, 2017 and 2016, respectively. Total weighted average shares outstanding were 8,608,088 at December 31, 2017 compared to 8,369,424 at December 31, 2016. The change in shares was due to First Guaranty's acquisition of Premier in June 2017 and the 10% common stock dividend issued in December 2017.
• Net interest income for 2017 was $53.2 million compared to $48.4 million for 2016.
• The provision for loan losses totaled $3.8 million for 2017 compared to $3.7 million in 2016.
• The net interest margin for 2017 was 3.33%, which was a decrease of six basis points from the net interest margin of 3.39% for 2016. First Guaranty attributed the decrease in the net interest margin to a rise in interest expense associated with deposits.
• Investment securities totaled $501.7 million at December 31, 2017, an increase of $2.3 million when compared to $499.3 million at December 31, 2016. At December 31, 2017, available for sale securities, at fair value, totaled $381.5 million, a decrease of $15.9 million when compared to $397.5 million at December 31, 2016. At December 31, 2017, held to maturity securities, at amortized cost, totaled $120.1 million, an increase of $18.3 million when compared to $101.9 million at December 31, 2016.
• Total loans net of unearned income were $1.1 billion at December 31, 2017 compared to $948.9 million at December 31, 2016. The net loan portfolio at December 31, 2017 totaled $1.1 billion, a net increase of $202.0 million from $937.8 million at December 31, 2016. Total loans net of unearned income are reduced by the allowance for loan losses which totaled $9.2 million at December 31, 2017 and $11.1 million at December 31, 2016.
• Total impaired loans decreased $13.2 million to $15.6 million at December 31, 2017 compared to $28.8 million at December 31, 2016.
• Nonaccrual loans decreased $9.1 million to $12.6 million at December 31, 2017 compared to $21.7 million at December 31, 2016.
• The allowance for loan losses was 0.80% of loans at December 31, 2017. The allowance for loan losses as a percentage of total loans was 0.90% prior to the inclusion of the acquired loans from Premier.
• Return on average assets was 0.71% and 0.97% for the years ended December 31, 2017 and 2016, respectively. Return on average common equity was 8.59% and 11.18% for 2017 and 2016, respectively. Return on average assets is calculated by dividing net income before preferred dividends by average assets. Return on average common equity is calculated by dividing net income to
common shareholders by average common equity.
• Book value per common share was $16.35 as of December 31, 2017 compared to $14.86 as of December 31, 2016. Tangible book value per common share was $15.59 as of December 31, 2017 compared to $14.50 as of December 31, 2016.
• The increase in book value was due primarily to the issuance of shares related to the acquisition of Premier adjusted for the 10% common stock dividend, the changes in accumulated other comprehensive income/loss ("AOCI") and an increase in retained earnings. AOCI is comprised of unrealized gains and losses on available for sale securities.
• First Guaranty's Board of Directors declared and First Guaranty paid cash dividends of $0.60 and $0.58 per common share in 2017 and 2016. First Guaranty has paid 98 consecutive quarterly dividends as of December 31, 2017.
• On December 22, 2017, the Tax Cuts and Jobs Act (the "Tax Act") was signed into law. The Tax Act permanently lowers the federal corporate income tax rate to 21% from the existing maximum rate of 35%, effective January 1, 2018. First Guaranty recorded a one-time income tax expense of $0.9 million in 2017 related to the estimated net impact from the remeasurement of deferred tax assets and liabilities.
Application of Critical Accounting Policies Our accounting and reporting policies conform to generally accepted accounting principles in the United States and to predominant accounting practices within the banking industry. Certain critical accounting policies require judgment and estimates which are used in the preparation of the financial statements.
Allowance for Loan Losses.
The allowance for loan losses is established through a provision for loan losses charged to expense. Loans are charged against the allowance for loan losses when management believes that the collectability of the principal is unlikely. The allowance, which is based on evaluation of the collectability of loans and prior loan loss experience, is an amount that, in the opinion of management, reflects the risks inherent in the existing loan portfolio and exists at the reporting date. The evaluations take into consideration a number of subjective factors including changes in the nature and volume of the loan portfolio, overall portfolio quality, review of specific problem loans, current economic conditions that may affect a borrower’s ability to pay, adequacy of loan collateral and other relevant factors. In addition, regulatory agencies, as an integral part of their examination process, periodically review the estimated losses on loans. Such agencies may require additional recognition of losses based on their judgments about information available to them at the time of their examination.
The following are general credit risk factors that affect our loan portfolio segments. These factors do not encompass all risks associated with each loan category. Construction and land development loans have risks associated with interim construction prior to permanent financing and repayment risks due to the future sale of developed property. Farmland and agricultural loans have risks such as weather, government agricultural policies, fuel and fertilizer costs, and market price volatility. One- to four-family residential, multi-family, and consumer credits are strongly influenced by employment levels, consumer debt loads and the general economy. Non-farm non-residential loans include both owner-occupied real estate and non-owner occupied real estate. Common risks associated with these properties is the ability to maintain tenant leases and keep lease income at a level able to service required debt and operating expenses. Commercial and industrial loans generally have non-real estate secured collateral which requires closer monitoring than real estate collateral.
EXPECT MORE 69

Although management uses available information to recognize losses on loans, because of uncertainties associated with local economic conditions, collateral values and future cash flows on impaired loans, it is reasonably possible that a material change could occur in the allowance for loan losses in the near term. However, the amount of the change that is reasonably possible cannot be estimated. The evaluation of the adequacy of loan collateral is often based upon estimates and appraisals. Because of changing economic conditions, the valuations determined from such estimates and appraisals may also change. Accordingly, we may ultimately incur losses that vary from management’s current estimates. Adjustments to the allowance for loan losses will be reported in the period such adjustments become known or can be reasonably estimated. All loan losses are charged to the allowance for loan losses when the loss actually occurs or when the collectability of the principal is unlikely. Recoveries are credited to the allowance at the time of recovery.
The allowance consists of specific, general, and unallocated components. The specific component relates to loans that are classified as doubtful, substandard, and impaired. For such loans that are also classified as impaired, an allowance is established when the discounted cash flows (or collateral value or observable market price) of the impaired loan is lower than the carrying value of that loan. Also, a specific reserve is allocated for our syndicated loans. The general component covers non-classified loans and special mention loans and is based on historical loss experience adjusted for qualitative factors. An unallocated component is maintained to cover uncertainties that could affect the estimate of probable losses.
The allowance for loan losses is reviewed on a monthly basis. The monitoring of credit risk also extends to unfunded credit commitments, such as unused commercial credit lines and letters of credit. A reserve is established as needed for estimates of probable losses on such commitments.
Other-Than-Temporary Impairment of Investment Securities.
Management evaluates securities for other-than-temporary impairment ("OTTI") at least on a quarterly basis, and more frequently when economic or market conditions warrant such an evaluation. Declines in the fair value of securities below their cost that are other-than-temporary are reflected as realized losses. In estimating other-than-temporary losses, management considers the length of time and extent that fair value has been less than cost and the financial condition and near term prospects of the issuer. Management also assesses whether it intends to sell, or it is more likely than not that it will be required to sell, a security in an unrealized loss position before recovery of its amortized cost basis. If either of the criteria regarding intent or requirement to sell is met, the entire difference between amortized cost and fair value is recognized as impairment through earnings. For debt securities that do not meet the aforementioned criteria, the amount of impairment is split into two components as follows: 1) OTTI related to credit loss, which must be recognized in the income statement and 2) OTTI related to other factors, which is recognized in other comprehensive income. The credit loss is defined as the difference between the present value of the cash flows expected to be collected and the amortized cost basis. For equity securities, the entire amount of impairment is recognized through earnings.
Valuation of Goodwill, Intangible Assets and Other Purchase Accounting Adjustments.
First Guaranty accounts for acquisitions in accordance with ASC Topic No. 805, Business Combinations, which requires the use of the acquisition method of accounting. Under this method, First Guaranty is required to record the assets acquired, including identified intangible assets, and liabilities assumed, at their respective fair values, which in many instances involves estimates based on third party valuations, such as appraisals, or internal valuations based on discounted cash
flow analyses or other valuation techniques. The determination of the useful lives of intangible assets is subjective, as is the appropriate amortization method for such intangible assets. In addition, business combinations typically result in recording goodwill.
Intangible assets are comprised of goodwill, core deposit intangibles and mortgage servicing rights. Goodwill and intangible assets deemed to have indefinite lives are no longer amortized, but are subject to annual impairment tests. Our goodwill is tested for impairment on an annual basis, or more often if events or circumstances indicate impairment may exist. Adverse changes in the economic environment, declining operations, or other factors could result in a decline in the implied fair value of goodwill. If the implied fair value is less than the carrying amount, a loss would be recognized in other noninterest expense to reduce the carrying amount to implied fair value of goodwill. Our goodwill impairment test includes two steps that are preceded by a "step zero" qualitative test. The qualitative test allows management to assess whether qualitative factors indicate that it is more likely than not that impairment exists. If it is not more likely than not that impairment exists, then the two step quantitative test would not be necessary. These qualitative indicators include factors such as earnings, share price, market conditions, etc. If the qualitative factors indicate that it is more likely than not that impairment exists, then the two step quantitative test would be necessary. Step one is used to identify potential impairment and compares the estimated fair value of a reporting unit with its carrying amount, including goodwill. If the estimated fair value of a reporting unit exceeds its carrying amount, goodwill of the reporting unit is considered not impaired. If the carrying amount of a reporting unit exceeds its estimated fair value, the second step of the goodwill impairment test is performed to measure the amount of impairment loss, if any. Step two of the goodwill impairment test compares the implied estimated fair value of reporting unit goodwill with the carrying amount of that goodwill. If the carrying amount of goodwill for that reporting unit exceeds the implied fair value of that unit's goodwill, an impairment loss is recognized in an amount equal to the excess. First Guaranty concluded goodwill was not impaired as of October 1, 2017. Further, no events or changes in circumstances between October 1, 2017 and December 31, 2017 indicated that it was more likely than not the fair value of any reporting unit had been reduced below its carrying value.
Goodwill impairment evaluations require management to utilize significant judgments and assumptions including, but not limited to, the general economic environment and banking industry, reporting unit future performance (i.e., forecasts), events or circumstances affecting a respective reporting unit (e.g., interest rate environment), and changes in First Guaranty's stock price, amongst other relevant factors. Management's judgments and assumptions are based on the best information available at the time. Results could vary in subsequent reporting periods if conditions differ substantially from the assumptions utilized in completing the evaluations.
Identifiable intangible assets are acquired assets that lack physical substance but can be distinguished from goodwill because of contractual or legal rights or because the assets are capable of being sold or exchanged either on their own or in combination with related contract, asset or liability. Our intangible assets primarily relate to core deposits. Management periodically evaluates whether events or circumstances have occurred that would result in impairment of value.
Financial Condition
First Guaranty completed the acquisition of Premier Bancshares, Inc. and its wholly owned subsidiary Synergy Bank, S.S.B. on June 16, 2017. This acquisition added five branches, an estimated $127.2 million in deposits, and an estimated $128.0 million in loans to First Guaranty's balance sheet. The results of operations since the date of acquisition reflect the impact of the transaction.
70 2017 ANNUAL REPORT FIRST GUARANTY BANCSHARES, INC.
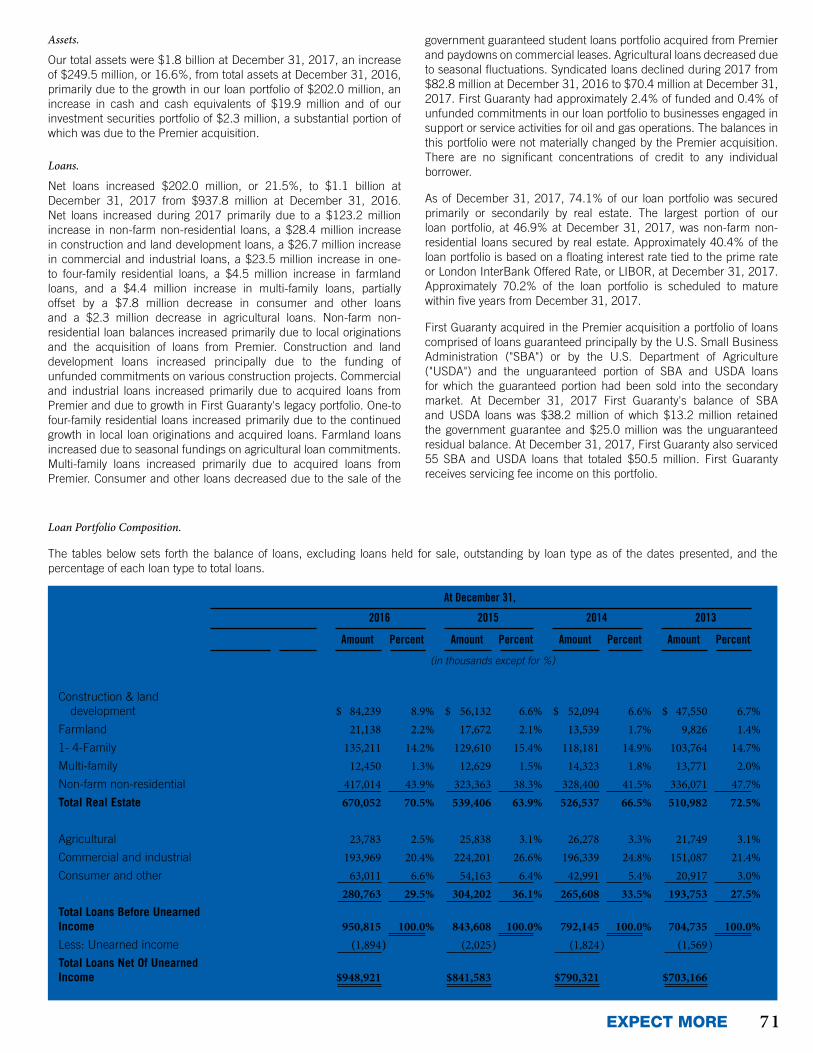
Assets.
Our total assets were $1.8 billion at December 31, 2017, an increase of $249.5 million, or 16.6%, from total assets at December 31, 2016, primarily due to the growth in our loan portfolio of $202.0 million, an increase in cash and cash equivalents of $19.9 million and of our investment securities portfolio of $2.3 million, a substantial portion of which was due to the Premier acquisition.
Loans.
Net loans increased $202.0 million, or 21.5%, to $1.1 billion at December 31, 2017 from $937.8 million at December 31, 2016. Net loans increased during 2017 primarily due to a $123.2 million increase in non-farm non-residential loans, a $28.4 million increase in construction and land development loans, a $26.7 million increase in commercial and industrial loans, a $23.5 million increase in one- to four-family residential loans, a $4.5 million increase in farmland loans, and a $4.4 million increase in multi-family loans, partially offset by a $7.8 million decrease in consumer and other loans and a $2.3 million decrease in agricultural loans. Non-farm non-residential loan balances increased primarily due to local originations and the acquisition of loans from Premier. Construction and land development loans increased principally due to the funding of unfunded commitments on various construction projects. Commercial and industrial loans increased primarily due to acquired loans from Premier and due to growth in First Guaranty's legacy portfolio. One-to four-family residential loans increased primarily due to the continued growth in local loan originations and acquired loans. Farmland loans increased due to seasonal fundings on agricultural loan commitments. Multi-family loans increased primarily due to acquired loans from Premier. Consumer and other loans decreased due to the sale of the
At December 31,
2017 2016 2015 2014 2013
Amount Percent Amount Percent Amount Percent Amount Percent Amount Percent
(in thousands except for %)
Real Estate:
Construction & land development $ 112,603 9.8% $ 84,239 8.9% $ 56,132 6.6% $ 52,094 6.6% $ 47,550 6.7%
Farmland 25,691 2.2% 21,138 2.2% 17,672 2.1% 13,539 1.7% 9,826 1.4%1- 4-Family 158,733 13.8% 135,211 14.2% 129,610 15.4% 118,181 14.9% 103,764 14.7%Multi-family 16,840 1.4% 12,450 1.3% 12,629 1.5% 14,323 1.8% 13,771 2.0%Non-farm non-residential 540,231 46.9% 417,014 43.9% 323,363 38.3% 328,400 41.5% 336,071 47.7%Total Real Estate 854,098 74.1% 670,052 70.5% 539,406 63.9% 526,537 66.5% 510,982 72.5%Non-Real Estate:
Agricultural 21,514 1.9% 23,783 2.5% 25,838 3.1% 26,278 3.3% 21,749 3.1%Commercial and industrial 220,700 19.2% 193,969 20.4% 224,201 26.6% 196,339 24.8% 151,087 21.4%Consumer and other 55,185 4.8% 63,011 6.6% 54,163 6.4% 42,991 5.4% 20,917 3.0%Total Non-Real Estate 297,399 25.9% 280,763 29.5% 304,202 36.1% 265,608 33.5% 193,753 27.5%Total Loans Before Unearned Income 1,151,497 100.0% 950,815 100.0% 843,608 100.0% 792,145 100.0% 704,735 100.0%Less: Unearned income (2,483) (1,894) (2,025) (1,824) (1,569)Total Loans Net Of Unearned Income $1,149,014 $948,921 $841,583 $790,321 $703,166
Loan Portfolio Composition.
The tables below sets forth the balance of loans, excluding loans held for sale, outstanding by loan type as of the dates presented, and the percentage of each loan type to total loans.
government guaranteed student loans portfolio acquired from Premier and paydowns on commercial leases. Agricultural loans decreased due to seasonal fluctuations. Syndicated loans declined during 2017 from $82.8 million at December 31, 2016 to $70.4 million at December 31, 2017. First Guaranty had approximately 2.4% of funded and 0.4% of unfunded commitments in our loan portfolio to businesses engaged in support or service activities for oil and gas operations. The balances in this portfolio were not materially changed by the Premier acquisition. There are no significant concentrations of credit to any individual borrower.
As of December 31, 2017, 74.1% of our loan portfolio was secured primarily or secondarily by real estate. The largest portion of our loan portfolio, at 46.9% at December 31, 2017, was non-farm non-residential loans secured by real estate. Approximately 40.4% of the loan portfolio is based on a floating interest rate tied to the prime rate or London InterBank Offered Rate, or LIBOR, at December 31, 2017. Approximately 70.2% of the loan portfolio is scheduled to mature within five years from December 31, 2017.
First Guaranty acquired in the Premier acquisition a portfolio of loans comprised of loans guaranteed principally by the U.S. Small Business Administration ("SBA") or by the U.S. Department of Agriculture ("USDA") and the unguaranteed portion of SBA and USDA loans for which the guaranteed portion had been sold into the secondary market. At December 31, 2017 First Guaranty's balance of SBA and USDA loans was $38.2 million of which $13.2 million retained the government guarantee and $25.0 million was the unguaranteed residual balance. At December 31, 2017, First Guaranty also serviced 55 SBA and USDA loans that totaled $50.5 million. First Guaranty receives servicing fee income on this portfolio.
EXPECT MORE 71
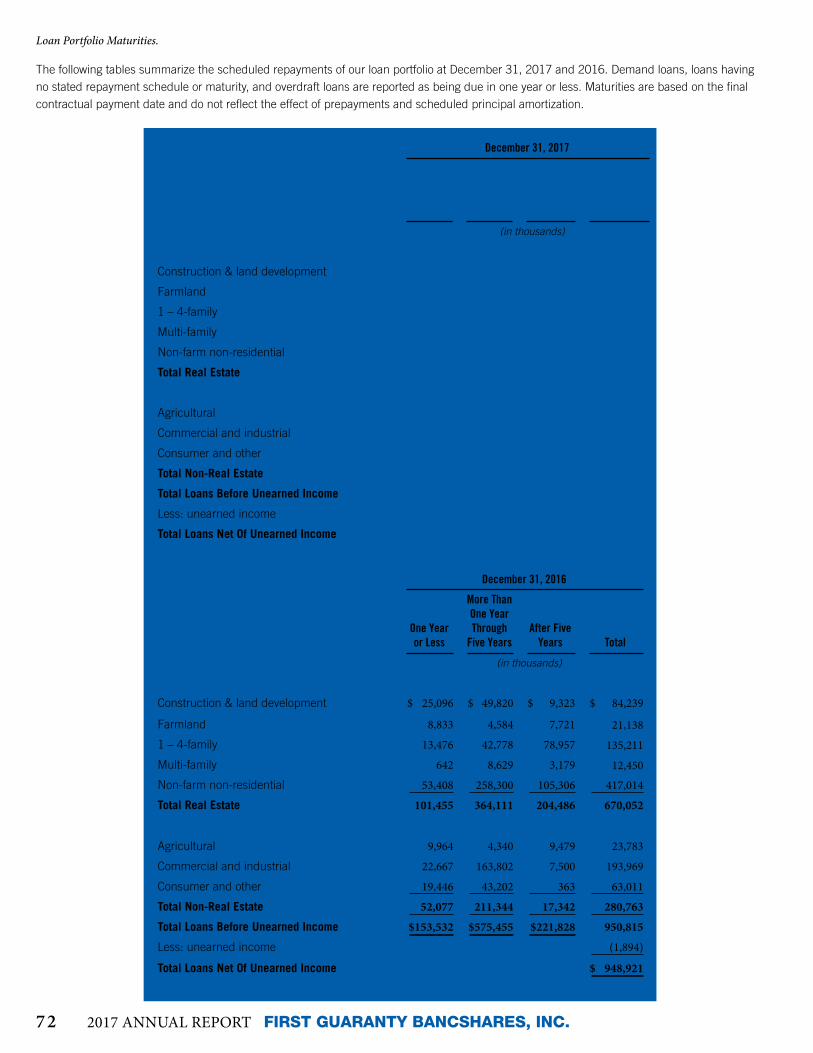
Loan Portfolio Maturities.
The following tables summarize the scheduled repayments of our loan portfolio at December 31, 2017 and 2016. Demand loans, loans having no stated repayment schedule or maturity, and overdraft loans are reported as being due in one year or less. Maturities are based on the final contractual payment date and do not reflect the effect of prepayments and scheduled principal amortization.
December 31, 2016
One Year or Less
More Than One Year Through
Five YearsAfter Five
Years Total
(in thousands)
Real Estate:
Construction & land development $ 25,096 $ 49,820 $ 9,323 $ 84,239
Farmland 8,833 4,584 7,721 21,138
1 – 4-family 13,476 42,778 78,957 135,211
Multi-family 642 8,629 3,179 12,450
Non-farm non-residential 53,408 258,300 105,306 417,014
Total Real Estate 101,455 364,111 204,486 670,052
Non-Real Estate:
Agricultural 9,964 4,340 9,479 23,783 Commercial and industrial 22,667 163,802 7,500 193,969
Consumer and other 19,446 43,202 363 63,011
Total Non-Real Estate 52,077 211,344 17,342 280,763
Total Loans Before Unearned Income $153,532 $575,455 $221,828 950,815
Less: unearned income (1,894)
Total Loans Net Of Unearned Income $ 948,921
December 31, 2017
One Year or Less
More Than One Year Through
Five YearsAfter Five
Years Total
(in thousands)
Real Estate:
Construction & land development $ 22,729 $ 71,796 $ 18,078 $ 112,603
Farmland 4,693 15,628 5,370 25,691
1 – 4-family 16,054 47,614 95,065 158,733
Multi-family 1,962 11,746 3,132 16,840
Non-farm non-residential 56,734 290,654 192,843 540,231
Total Real Estate 102,172 437,438 314,488 854,098
Non-Real Estate:
Agricultural 7,923 4,613 8,978 21,514
Commercial and industrial 40,145 170,103 10,452 220,700
Consumer and other 19,223 35,616 346 55,185
Total Non-Real Estate 67,291 210,332 19,776 297,399
Total Loans Before Unearned Income $169,463 $647,770 $334,264 1,151,497
Less: unearned income (2,483)
Total Loans Net Of Unearned Income $1,149,014
72 2017 ANNUAL REPORT FIRST GUARANTY BANCSHARES, INC.

The following table sets forth the scheduled repayments of fixed and adjustable-rate loans at December 31, 2017 that are contractually due after December 31, 2018.
As of December 31, 2017, $95.4 million of floating rate loans were at their interest rate floor. At December 31, 2016, $127.7 million of floating rate loans were at the floor rate. Nonaccrual loans have been excluded from these totals.
Due After December 31, 2017
(in thousands)
Fixed Floating Total
One to five years $390,333 $251,135 $641,468
Five to 15 years 124,215 70,273 194,488
Over 15 years 70,366 67,881 138,247
Subtotal $584,914 $389,289 $974,203
Nonaccrual loans 12,550
Total $961,653
Non-performing Assets.
Non-performing assets consist of non-performing loans and other real-estate owned. Non-performing loans (including nonaccruing troubled debt restructurings described below) are those on which the accrual of interest has stopped or loans which are contractually 90 days past due on which interest continues to accrue. Loans are ordinarily placed on nonaccrual status when principal and interest is delinquent for 90 days or more. However, management may elect to continue the accrual when the estimated net available value of collateral is sufficient to cover the principal balance and accrued interest. It is our policy to discontinue the accrual of interest income on any loan for which we have reasonable doubt as to the payment of interest or principal. When a loan is placed on nonaccrual status, unpaid interest credited to income is reversed. Nonaccrual loans are returned to accrual status when the financial position of the borrower indicates there is no longer any reasonable doubt as to the payment of principal or interest. Other real estate owned consists of property acquired through formal foreclosure, in-substance foreclosure or by deed in lieu of foreclosure.
TOTAL ASSETS In Billions
TOTAL LOANSIn Millions
0.0
0.5
1.0
1.5
2.0
201720162015201420130
200
400
600
800
1000
1200
20172016201520142013
EXPECT MORE 73
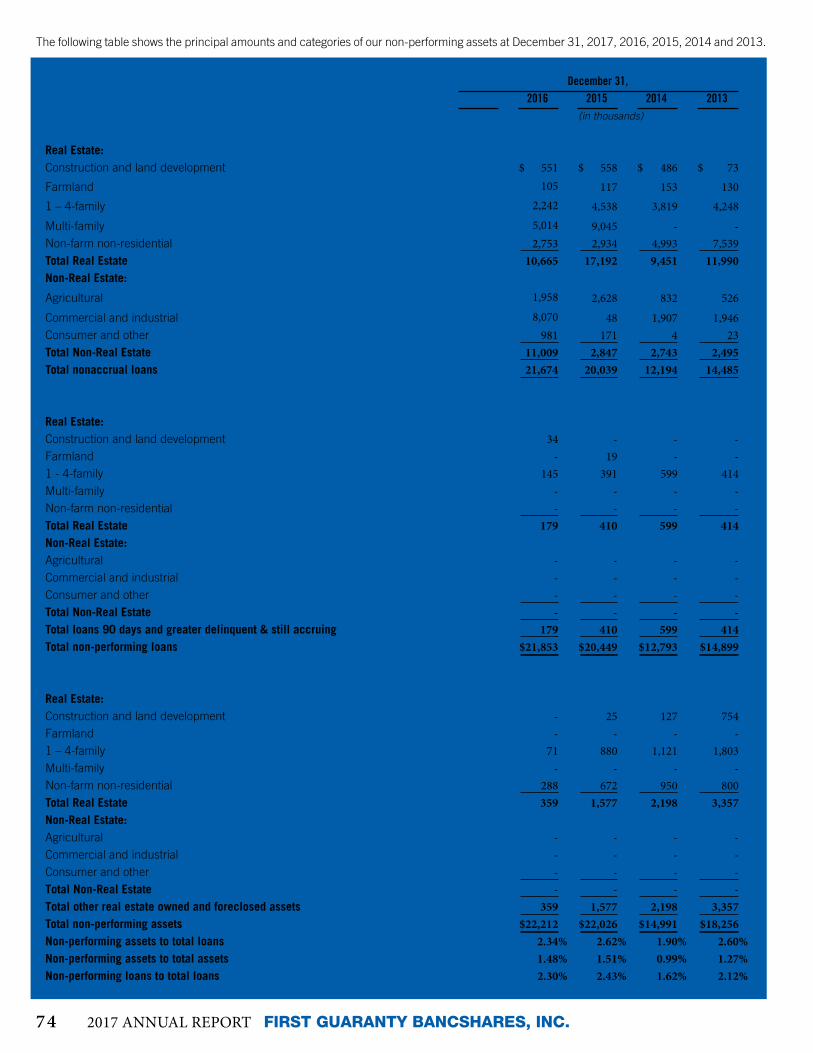
The following table shows the principal amounts and categories of our non-performing assets at December 31, 2017, 2016, 2015, 2014 and 2013.
December 31, 2017 2016 2015 2014 2013
(in thousands)
Nonaccrual loans:Real Estate:Construction and land development $ 371 $ 551 $ 558 $ 486 $ 73Farmland 65 105 117 153 1301 – 4-family 1,953 2,242 4,538 3,819 4,248
Multi-family - 5,014 9,045 - -Non-farm non-residential 3,758 2,753 2,934 4,993 7,539Total Real Estate 6,147 10,665 17,192 9,451 11,990Non-Real Estate:
Agricultural 1,496 1,958 2,628 832 526
Commercial and industrial 4,826 8,070 48 1,907 1,946Consumer and other 81 981 171 4 23Total Non-Real Estate 6,403 11,009 2,847 2,743 2,495Total nonaccrual loans 12,550 21,674 20,039 12,194 14,485
Loans 90 days and greater delinquent & still accruing:Real Estate:Construction and land development - 34 - - -Farmland - - 19 - -1 - 4-family - 145 391 599 414Multi-family - - - - -Non-farm non-residential - - - - -Total Real Estate - 179 410 599 414Non-Real Estate:Agricultural 41 - - - -Commercial and industrial 798 - - - -Consumer and other - - - - -Total Non-Real Estate 839 - - - -Total loans 90 days and greater delinquent & still accruing 839 179 410 599 414Total non-performing loans $13,389 $21,853 $20,449 $12,793 $14,899
Other real estate owned and foreclosed assets:Real Estate:Construction and land development 304 - 25 127 754Farmland - - - - -1 – 4-family 23 71 880 1,121 1,803Multi-family - - - - -Non-farm non-residential 954 288 672 950 800Total Real Estate 1,281 359 1,577 2,198 3,357Non-Real Estate:Agricultural - - - - -Commercial and industrial - - - - -Consumer and other - - - - -Total Non-Real Estate - - - - -Total other real estate owned and foreclosed assets 1,281 359 1,577 2,198 3,357Total non-performing assets $14,670 $22,212 $22,026 $14,991 $18,256Non-performing assets to total loans 1.28% 2.34% 2.62% 1.90% 2.60%Non-performing assets to total assets 0.84% 1.48% 1.51% 0.99% 1.27%Non-performing loans to total loans 1.17% 2.30% 2.43% 1.62% 2.12%
74 2017 ANNUAL REPORT FIRST GUARANTY BANCSHARES, INC.

For the years ended December 31, 2017 and 2016, gross interest income which would have been recorded had the non-performing loans been current in accordance with their original terms amounted to $1.5 million and $1.5 million, respectively. We recognized $79,000 and $0.1 million of interest income on such loans during the years ended December 31, 2017 and 2016, respectively. For the years ended December 31, 2017 and 2016, gross interest income which would have been recorded had the troubled debt restructured loans been current in accordance with their original terms amounted to $0.1 million and $0.1 million, respectively. We recognized $0.1 million and $0.3 million of interest income on such loans during the years ended December 31, 2017 and 2016, respectively.
Non-performing assets were $14.7 million, or 0.84%, of total assets at December 31, 2017, compared to $22.2 million, or 1.48%, of total assets at December 31, 2016, which represented a decrease in non-performing assets of $7.5 million. The decrease in non-performing assets occurred primarily as a result of a decrease in non-accrual loans from $21.7 million at December 31, 2016 to $12.6 million at December 31, 2017. The decrease in non-accrual loans was concentrated in multi-family loans and commercial and industrial loans. The decrease in non-accrual loans was partially offset by an increase in loans 90 days and greater still accruing of $0.7 million. First Guaranty acquired $0.1 million in non-accrual loans from Premier and $1.0 million in government guaranteed student loans that were 90 day plus and still accruing in June 2017. The student loans were sold during the third quarter of 2017. First Guaranty acquired $0.2 million in other real estate owned from Premier. Non-performing assets included $1.1 million, or 7.3% of non-performing assets are loans with a government guarantee. These are structured as net loss guarantees in which up to 90% of loss exposure is covered.
At December 31, 2017 nonaccrual loans totaled $12.6 million, a decrease of $9.1 million, or 42.1%, compared to nonaccrual loans of $21.7 million at December 31, 2016. The decrease in nonaccrual loans was associated with a $4.9 million multi-family loan that was returned to accrual status after observing reasonable payment performance over the last 24 months and a $3.2 million partial charge off of a non-performing commercial and industrial loan. Nonaccrual loans were concentrated in three loan relationships that totaled $8.1 million or 64.6% of nonaccrual loans at December 31, 2017.
At December 31, 2017 loans 90 days or greater delinquent and still accruing totaled $0.8 million, an increase of $0.7 million, compared to $0.2 million at December 31, 2016. These loans were comprised of a $0.8 million commercial and industrial loan and a $40,000 agricultural loan at December 31, 2017.
Other real estate owned at December 31, 2017 totaled $1.3 million, an increase of $0.9 million from $0.4 million at December 31, 2016. The increase in other real estate owned was primarily due to the addition of a $0.8 million non-farm non-residential property.
At December 31, 2017, our largest non-performing assets were comprised of the following non-accrual loans and other real estate owned: (1) a commercial and industrial loan that totaled $4.6 million that is a shared national credit involved in oil and gas support and service activity with a specific reserve of $0.5 million; (2) a non-farm non-residential loan that totaled $3.1 million; (3) an agricultural loan that totaled $0.4 million; and (4) a $0.8 million non-farm non-residential property. The commercial and industrial and agricultural loans have been charged down to their estimated fair value.
Troubled Debt Restructuring.
Another category of assets which contribute to our credit risk is troubled debt restructurings (“TDRs”). A TDR is a loan for which a concession has been granted to the borrower due to a deterioration of the borrower’s financial condition. Such concessions may include reduction in interest
rates, deferral of interest or principal payments, principal forgiveness and other actions intended to minimize the economic loss and to avoid foreclosure or repossession of the collateral. We strive to identify borrowers in financial difficulty early and work with them to modify to more affordable terms before such loan reaches nonaccrual status. In evaluating whether to restructure a loan, management analyzes the long-term financial condition of the borrower, including guarantor and collateral support, to determine whether the proposed concessions will increase the likelihood of repayment of principal and interest. TDRs that are not performing in accordance with their restructured terms and are either contractually 90 days past due or placed on nonaccrual status are reported as non-performing loans. Our policy provides that nonaccrual TDRs are returned to accrual status after a period of satisfactory and reasonable future payment performance under the terms of the restructuring. Satisfactory payment performance is generally no less than six consecutive months of timely payments and demonstrated ability to continue to repay.
The following is a summary of loans restructured as TDRs at December 31, 2017, 2016 and 2015:
At December 31,
2017 2016 2015
(in thousands)
TDRs:
In Compliance with Modified Terms $2,138 $2,987 $3,431 Past Due 30 through 89 days and still accruing - - -
Past Due 90 days and greater and still accruing - - -
Nonaccrual 334 361 368
Restructured Loans that subsequently defaulted - 100 1,908
Total TDR $2,472 $3,448 $5,707
At December 31, 2017, the outstanding balance of our troubled debt restructurings, was $2.5 million as compared to $3.4 million at December 31, 2016. At December 31, 2017, we had two outstanding TDRs: (1) a $2.1 million non-farm non-residential loan secured by commercial real estate, which was performing in accordance with its modified terms; and (2) a $0.3 million construction and land development loan secured by raw land that is on non-accrual. The restructuring of these loans was related to interest rate or amortization concessions. The decline in TDRs occurred primarily due to paydowns on the $2.1 million TDR that is in compliance with its modified terms and the charge off of a $0.1 million TDR that subsequently defaulted and was placed on non-accrual.
EXPECT MORE 75

Classified Assets. Federal regulations provide for the classification of loans and other assets, such as debt and equity securities considered by the FDIC to be of lesser quality, as “substandard,” “doubtful” or “loss.” An asset is considered “substandard” if it is inadequately protected by the current net worth and paying capacity of the obligor or of the collateral pledged, if any. “Substandard” assets include those characterized by the “distinct possibility” that the insured institution will sustain “some loss” if the deficiencies are not corrected. Assets classified as “doubtful” have all of the weaknesses inherent in those classified as “substandard,” with the added characteristic that the weaknesses present make “collection or liquidation in full,” on the basis of currently existing facts, conditions, and values, “highly questionable and improbable.” Assets classified as “loss” are those considered “uncollectible” and of such little value that their continuance as assets without the establishment of a specific allowance for loan losses is not warranted. Assets that do not currently expose the insured institution to sufficient risk to warrant classification in one of the aforementioned categories but possess weaknesses are designated as “special mention” by our management.
When an insured institution classifies problem assets as either substandard or doubtful, it may establish general allowances in an amount deemed prudent by management to cover losses that were both probable and reasonable to estimate. General allowances represent allowances which have been established to cover accrued losses associated with lending activities that were both probable and reasonable to estimate, but which, unlike specific allowances, have not been allocated to particular problem assets. When an insured institution classifies problem assets as “loss,” it is required either to establish a specific allowance for losses equal to 100% of that portion of the asset so classified or to charge-off such amount. An institution’s determination as to the classification of its assets and the amount of its valuation allowances is subject to review by the regulatory authorities, which may require the establishment of additional general or specific allowances.
In connection with the filing of our periodic regulatory reports and in accordance with our classification of assets policy, we continuously assess the quality of our loan portfolio and we regularly review the problem loans in our loan portfolio to determine whether any loans require classification in accordance with applicable regulations. Loans are listed on the “watch list” initially because of emerging financial weaknesses even though the loan is currently performing as agreed, or delinquency status, or if the loan possesses weaknesses although currently performing. Management reviews the status of our loan portfolio delinquencies, by product types, with the full board of directors on a monthly basis. Individual classified loan relationships are discussed as warranted. If a loan deteriorates in asset quality, the classification is changed to “special mention,” “substandard,” “doubtful” or “loss” depending on the circumstances and the evaluation. Generally, loans 90 days or more past due are placed on nonaccrual status and classified “substandard.”
We also employ a risk grading system for our loans to help assure that we are not taking unnecessary and/or unmanageable risk. The primary objective of the loan risk grading system is to establish a method of assessing credit risk to further enable management to measure loan portfolio quality and the adequacy of the allowance for loan losses. Further, we contract with an external loan review firm to complete a credit risk assessment of the loan portfolio on a regular basis to help determine the current level and direction of our credit risk. The external loan review firm communicates the results of their findings to the Bank’s audit committee. Any material issues discovered in an external loan review are also communicated to us immediately.
The following table sets forth our amounts of classified loans and loans designated as special mention at December 31, 2017, 2016 and 2015. Classified assets totaled $54.1 million at December 31, 2017, and included $13.4 million of non-performing loans..
The increase in classified assets at December 31, 2017 as compared to December 31, 2016 was due to a $7.5 million increase in substandard loans offset by a decrease in doubtful loans of $3.2 million. The increase in substandard loans was due primarily to the addition of loans acquired in the Premier acquisition with deteriorated credit quality. Substandard loans at December 31, 2017 consisted of $17.3 million in non-farm non-residential, $7.5 million in one- to four-family residential, $6.9 million in consumer and other loans, $6.8 million in multi-family, $5.2 million in commercial and industrial, $4.3 million in construction and land development, and the remaining $1.6 million comprised of farmland and agricultural loans. Doubtful loans decreased in 2017 by $3.2 million due to the partial charge off on a nonperforming commercial and industrial loan. Special mention loans increased by $8.2 million in 2017 primarily due to the downgrade of syndicated loans.
Allowance for Loan Losses
The allowance for loan losses is maintained to absorb potential losses in the loan portfolio. The allowance is increased by the provision for loan losses offset by recoveries of previously charged-off loans and is decreased by loan charge-offs. The provision is a charge to current expense to provide for current loan losses and to maintain the allowance commensurate with management’s evaluation of the risks inherent in the loan portfolio. Various factors are taken into consideration when determining the amount of the provision and the adequacy of the allowance. These factors include but are not limited to:
• past due and non-performing assets;
• specific internal analysis of loans requiring special attention;
• the current level of regulatory classified and criticized assets and the associated risk factors with each;
• changes in underwriting standards or lending procedures and policies;
• charge-off and recovery practices;
• national and local economic and business conditions;
• nature and volume of loans;
• overall portfolio quality;
• adequacy of loan collateral;
• quality of loan review system and degree of oversight by our board of directors;
• competition and legal and regulatory requirements on borrowers;
• examinations of the loan portfolio by federal and state regulatory agencies and examinations; and
• review by our internal loan review department and independent accountants.
The data collected from all sources in determining the adequacy of the allowance is evaluated on a regular basis by management with regard to current national and local economic trends, prior loss history, underlying collateral values, credit concentrations and industry risks. An estimate of potential loss on specific loans is developed in conjunction with an overall risk evaluation of the total loan portfolio. This evaluation is inherently subjective as it requires estimates that are susceptible to significant revision as new information becomes available.
The allowance consists of specific, general, and unallocated components. The specific component relates to loans that are classified as doubtful, substandard, and impaired. For such loans that are also classified as impaired, an allowance is established when the discounted cash flows (or collateral value or observable market price) of the impaired loan is lower than the carrying value of that loan. Also, a specific reserve is allocated for our syndicated loans, including shared national credits. The general component covers non-classified loans and special mention loans and is based on historical loss experience for the past three years adjusted for qualitative factors described above. An unallocated component is maintained to cover uncertainties that could affect the estimate of probable losses.
At December 31,
2017 2016 2015
(in thousands)
Classification of Loans:
Substandard $49,495 $41,992 $58,654
Doubtful 4,560 7,730 -
Total Classified Assets $54,055 $49,722 $58,654
Special Mention $25,929 $17,705 $10,752
76 2017 ANNUAL REPORT FIRST GUARANTY BANCSHARES, INC.

The allowance for losses was $9.2 million at December 31, 2017 compared to $11.1 million at December 31, 2016.
The balance in the allowance for loan losses is principally influenced by the provision for loan losses and by net loan loss experience. Additions to the allowance are charged to the provision for loan losses. Losses are charged to the allowance as incurred and recoveries on losses previously charged to the allowance are credited to the allowance at the time recovery is collected. The table below reflects the activity in the allowance for loan losses for the years indicated.
At or For the Years Ended December 31,
2017 2016 2015 2014 2013
(dollars in thousands)
Balance at beginning of year $ 11,114 $ 9,415 $ 9,105 $ 10,355 $ 10,342
Charge-offs:
Real Estate:
Construction and land development - - (559) (1,032) (233)
Farmland - - - - (31)
1 – 4-family residential (33) (244) (410) (589) (220)
Multi-family - - (947) - -
Non-farm non-residential (1,291) (1,373) (1,137) (1,515) (1,148)
Total Real Estate (1,324) (1,617) (3,053) (3,136) (1,632)
Non-Real Estate:
Agricultural (162) (83) (491) (2) (41)
Commercial and industrial loans (3,629) (579) (79) (266) (1,098)
Consumer and other (1,247) (635) (550) (289) (262)
Total Non-Real Estate (5,038) (1,297) (1,120) (557) (1,401)
Total charge-offs (6,362) (2,914) (4,173) (3,693) (3,033)
Recoveries:
Real Estate:
Construction and land development 43 4 5 6 10
Farmland - - - - 140
1 – 4-family residential 92 45 94 99 49
Multi-family 40 401 46 49 -
Non-farm non-residential 85 16 5 9 8
Total Real Estate 260 466 150 163 207
Non-Real Estate:
Agricultural 138 113 3 1 5
Commercial and industrial loans 30 146 315 118 71
Consumer and other 223 183 151 199 243
Total Non-Real Estate 391 442 469 318 319
Total recoveries 651 908 619 481 526
Net (charge-offs) recoveries (5,711) (2,006) (3,554) (3,212) (2,507)
Provision for loan losses 3,822 3,705 3,864 1,962 2,520
Balance at end of year $ 9,225 $11,114 $ 9,415 $ 9,105 $10,355
Ratios:
Net loan charge-offs to average loans 0.54% 0.23% 0.44% 0.45% 0.38%
Net loan charge-offs to loans at end of year 0.50% 0.21% 0.42% 0.41% 0.36%
Allowance for loan losses to loans at end of year 0.80% 1.17% 1.12% 1.15% 1.47%
Net loan charge-offs to allowance for loan losses 61.91% 18.05% 37.75% 35.28% 24.21%
Net loan charge-offs to provision charged to expense 149.42% 54.14% 91.98% 163.71% 99.48%
EXPECT MORE 77

A provision for loan losses of $3.8 million was made during the year ended December 31, 2017 as compared to $3.7 million for 2016. The provisions made in 2017 were taken to provide for current loan losses and to maintain the allowance proportionate to risks inherent in the loan portfolio.
Total charge-offs were $6.4 million during the year ended December 31, 2017 as compared to $2.9 million for 2016. Recoveries totaled $0.7 million for the year ended December 31, 2017 and $0.9 million during 2016. Comparing the year ended December 31, 2017 to the year ended December 31, 2016, the decrease in the allowance was primarily attributed to the decrease in the specific reserve associated with a nonperforming commercial and industrial loan. The decrease in the specific reserve was due to a $3.2 million partial charge off related to the credit that reduced the specific reserve to $0.5 million. There were changes within the specific components of the allowance balance. The primary changes were decreases in the balances associated with commercial and industrial, construction and land development, non-farm non-residential and one- to-four family loans. This decrease was partially offset by an increase in multi-family loans, consumer and other loans and agricultural loans.
The charged-off loan balances for the year ended December 31, 2017 were concentrated in five loan relationships which totaled $5.0 million, or 77.9%, of the total charged-off amount. The details of the $5.0 million in charged-off loans were as follows:
• First Guaranty charged off $0.7 million on a non-real estate commercial lease in the second quarter of 2017. This loan had no remaining principal balance at December 31, 2017.
• First Guaranty charged off $0.5 million on a non-farm non-residential real estate loan in the second quarter of 2017. This loan had no remaining principal balance at December 31, 2017.
• First Guaranty charged off $3.2 million on a commercial and industrial loan relationship in 2017. This relationship had a remaining principal balance of $4.6 million with a specific reserve of $0.5 million at December 31, 2017.
• First Guaranty charged off $0.4 million on a non-farm non-residential real estate loan in the fourth quarter of 2017. This loan had a remaining principal balance of $3.1 million at December 31, 2017.
• First Guaranty charged off $0.2 million on a commercial and industrial loan in the fourth quarter of 2017. This loan had no remaining principal balance at December 31, 2017.
• $1.4 million of charge-offs for 2017 were comprised of smaller loans and overdrawn deposit accounts.
Allocation of Allowance for Loan Losses.
TThe following tables set forth the allowance for loan losses allocated by loan category and the percent of loans in each category to total loans at the dates indicated. The allowance for loan losses allocated to each category is not necessarily indicative of future losses in any particular category and does not restrict the use of the allowance for losses in other categories.
At December 31,
2017 2016
Allowance for Loan Losses
Percent of Allowance to
Total Allowance for Loan Losses
Percent of Loans in Each Category to Total Loans
Allowance for Loan Losses
Percent of Allowance to
Total Allowance for Loan Losses
Percent of Loans in Each Category to
Total Loans
(dollars in thousands)
Real Estate:
Construction and land development $ 628 6.8% 9.8% $ 1,232 11.1% 8.9%
Farmland 5 0.1% 2.2% 19 0.2% 2.2%
1 - 4-family 1,078 11.7% 13.8% 1,204 10.8% 14.2%
Multi-family 994 10.8% 1.4% 591 5.3% 1.3%
Non-farm non-residential 2,811 30.4% 46.9% 3,451 31.0% 43.9%
Non-Real Estate:
Agricultural 187 2.0% 1.9% 74 0.7% 2.5%
Commercial and industrial 2,377 25.8% 19.2% 3,543 31.9% 20.4%
Consumer and other 1,125 12.2% 4.8% 972 8.7% 6.6%
Unallocated 20 0.2% -% 28 0.3% -%
Total Allowance $9,225 100.0% 100.0% $11,114 100.0% 100.0%
78 2017 ANNUAL REPORT FIRST GUARANTY BANCSHARES, INC.

At December 31,
2015 2014
Allowance for Loan Losses
Percent of Allowance to
Total Allowance for Loan Losses
Percent of Loans in Each Category to Total Loans
Allowance for Loan Losses
Percent of Allowance to
Total Allowance for Loan Losses
Percent of Loans in Each Category to Total Loans
(dollars in thousands)
Real Estate:
Construction and land development $ 962 10.2% 6.6% $ 702 7.7% 6.6%
Farmland 54 0.6% 2.1% 21 0.2% 1.7%
1 - 4-family 1,771 18.8% 15.4% 2,131 23.4% 14.9%
Multi-family 557 5.9% 1.5% 813 8.9% 1.8%
Non-farm non-residential 3,298 35.0% 38.3% 2,713 29.8% 41.5%
Non-Real Estate:
Agricultural 16 0.2% 3.1% 293 3.2% 3.3%
Commercial and industrial 2,527 26.9% 26.6% 1,797 19.8% 24.8%
Consumer and other 230 2.4% 6.4% 371 4.1% 5.4%
Unallocated - -% -% 264 2.9% -%
Total Allowance $ 9,415 100.0% 100.0% $ 9,105 100.0% 100.0%
At December 31,
2013
Allowance for Loan Losses
Percent of Allowance to Total
Allowance for Loan Losses
Percent of Loans in Each Category to Total Loans
(dollars in thousands)
Real Estate:
Construction and land development $ 1,530 14.8% 6.7%
Farmland 17 0.2% 1.4%
1 - 4-family 1,974 19.1% 14.7%
Multi-family 376 3.6% 2.0%
Non-farm non-residential 3,607 34.8% 47.7%
Non-Real Estate:
Agricultural 46 0.4% 3.1%
Commercial and industrial 2,176 21.0% 21.4%
Consumer and other 208 2.0% 3.0%
Unallocated 421 4.1% -%
Total Allowance $10,355 100.0% 100.0%
EXPECT MORE 79

Investment Securities.
Investment securities at December 31, 2017 totaled $501.7 million, an increase of $2.3 million, or 0.5%, compared to $499.3 million at December 31, 2016. Our investment securities portfolio is comprised of both available for sale securities and securities that we intend to hold to maturity. We purchase securities for our investment portfolio to provide a source of liquidity, to provide an appropriate return on funds invested, to manage interest rate risk and meet pledging requirements for public funds and borrowings. In particular, our held to maturity securities portfolio is used as collateral for our public funds deposits.
The securities portfolio consisted principally of U.S. Government and Government agency securities, agency mortgage-backed securities, corporate debt securities and municipal bonds. U.S. government agencies consist of FHLB, Federal Farm Credit Bank (“FFCB”), Freddie Mac and Fannie Mae obligations. Mortgage backed securities that we purchase are issued by Freddie Mac and Fannie Mae. Management monitors the securities portfolio for both credit and interest rate risk. We generally limit the purchase of corporate securities to individual issuers to manage concentration and credit risk. Corporate securities
generally have a maturity of 10 years or less. U.S. Government securities consist of U.S. Treasury bills that have maturities of less than 30 days. Government agency securities generally have maturities of 15 years or less. Agency mortgage backed securities have stated final maturities of 15 to 20 years.
At December 31, 2017, the U.S Government and Government agency securities and municipal bonds qualified as securities available to collateralize public funds. Securities pledged as collateral totaled $412.2 million at December 31, 2017 and $368.2 million at December 31, 2016. Our public funds deposits have a seasonal increase due to tax collections at the end of the year and the first quarter. We typically collateralize the seasonal public fund increases with short term instruments such as U.S. Treasuries or other agency backed securities.
The following table sets forth the amortized cost and fair values of our securities portfolio at the dates indicated.
At December 31,
2017 2016 2015
(in thousands)
Amortized Cost Fair Value
Amortized Cost Fair Value
Amortized Cost Fair Value
Available for sale:
U.S Treasuries $ 19,490 $ 19,486 $ 29,994 $ 29,994 $ 29,999 $ 29,999
U.S. Government Agencies 200,052 195,983 183,152 178,332 165,364 163,811
Corporate debt securities 91,770 91,485 132,448 131,972 105,680 105,136
Mutual funds or other equity securities 500 493 580 573 580 582
Municipal bonds 37,210 39,569 28,177 27,957 47,339 48,233
Collateralized mortgage obligations 1,191 1,185 - - - -
Mortgage-backed securities 33,680 33,334 29,181 28,645 28,891 28,608
Total available for sale securities 383,893 381,535 403,532 397,473 377,853 376,369
Held to maturity:
U.S. Government Agencies 28,169 27,499 18,167 17,512 77,343 76,622
Municipal bonds 5,322 5,325 - - - -
Mortgage-backed securities 86,630 85,733 83,696 82,394 92,409 91,526
Total held to maturity securities $120,121 $118,557 $101,863 $ 99,906 $169,752 $168,148
Our available for sale securities portfolio totaled $381.5 million at December 31, 2017, a decrease of $15.9 million, or 4.0%, compared to $397.5 million at December 31, 2016. The decrease was primarily due to the sale of $112.5 million in U.S. Government agency and U.S. Treasury securities and $36.4 million in corporate securities for which the proceeds were used to fund loan growth. Partially offsetting this decrease was the purchase of U.S. government agency securities used to collateralize public funds deposits. Acquired securities from Premier totaled $5.9 million and included $4.5 million in mortgage-backed securities and $1.4 million in collateralized mortgage obligations.
Our held to maturity securities portfolio had an amortized cost of $120.1 million at December 31, 2017, an increase of $18.3 million, or 17.9%, compared to $101.9 million at December 31, 2016. The increase was primarily due to the purchase of $15.2 million in mortgage-backed securities, $10.0 million in U.S. Government agency securities and $5.3 million in municipal securities used to collateralize public funds deposits. Partially offsetting this increase were early payoffs of existing securities and the continued amortization of our mortgage-backed securities.
80 2017 ANNUAL REPORT FIRST GUARANTY BANCSHARES, INC.

The following table sets forth the stated maturities and weighted average yields of our investment securities at December 31, 2017 and 2016.
At December 31, 2017
One Year or LessMore than One Year through Five Years
More than Five Years through Ten Years More than Ten Years
Carrying Value
Weighted Average
YieldCarrying
Value
Weighted Average
YieldCarrying
Value
Weighted Average
YieldCarrying
Value
Weighted Average
Yield
(in thousands except for %)
Available for sale:
U.S Treasuries $ 19,486 1.2% $ - -% $ - -% $ - -%
U.S. Government Agencies 2,979 1.0% 39,014 1.6% 141,325 2.4% 12,665 2.9%
Corporate and other debt securities 4,298 3.9% 29,437 3.2% 56,711 3.7% 1,039 5.5%
Mutual funds or other equity securities - -% - -% - -% 493 2.1%
Municipal bonds 2,470 3.0% 8,472 3.7% 16,733 3.4% 11,894 3.9%
Collateralized mortgage obligations - -% - -% - -% 1,185 2.1%
Mortgage-backed securities - -% - -% 1,441 2.0% 31,893 2.4%
Total available for sale securities $29,233 1.7% $ 76,923 2.4% $ 216,210 2.8% $ 59,169 2.8%
Held to maturity:
U.S. Government Agencies $ - -% $ 4,999 1.5% $ 18,170 2.3% $ 5,000 3.2%
Municipal bonds - -% 125 1.6% 315 2.4% 4,882 2.6%
Mortgage-backed securities - -% - -% 829 2.0% 85,801 2.4%
Total held to maturity securities $ - -% $ 5,124 1.5% $ 19,314 2.3% $95,683 2.5%
At December 31, 2016
One Year or LessMore than One Year through Five Years
More than Five Years through Ten Years More than Ten Years
Carrying Value
Weighted Average
YieldCarrying
Value
Weighted Average
YieldCarrying
Value
Weighted Average
YieldCarrying
Value
Weighted Average
Yield
(in thousands except for %)
Available for sale:
U.S Treasuries $ 29,994 0.4% $ - -% $ - -% $ - -%
U.S. Government Agencies - -% 44,401 1.0% 116,602 2.3% 17,329 2.8%
Corporate and other debt securities 6,454 3.8% 41,909 4.0% 82,472 3.6% 1,137 5.4%
Mutual funds or other equity securities - -% - -% - -% 573 2.2%
Municipal bonds 3,324 2.1% 6,301 2.7% 10,896 2.9% 7,436 2.9%
Mortgage-backed securities - -% - -% - -% 28,645 2.0%
Total available for sale securities $ 39,772 1.1% $ 92,611 2.5% $ 209,970 2.8% $ 55,120 2.5%
Held to maturity:
U.S. Government Agencies $ - -% $ 4,998 1.5% $ 13,169 2.0% $ - -%
Mortgage-backed securities - -% - -% - -% 83,696 2.1%
Total held to maturity securities $ - -% $ 4,998 1.5% $ 13,169 2.0% $83,696 2.1%
EXPECT MORE 81
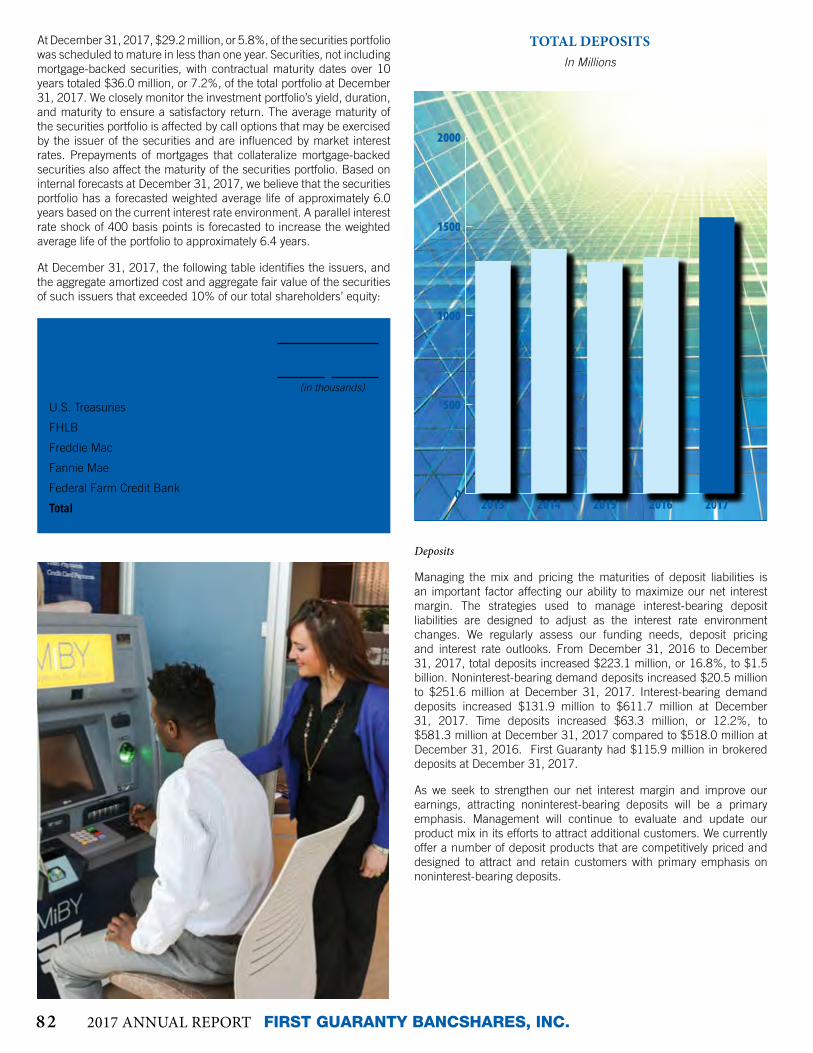
At December 31, 2017, $29.2 million, or 5.8%, of the securities portfolio was scheduled to mature in less than one year. Securities, not including mortgage-backed securities, with contractual maturity dates over 10 years totaled $36.0 million, or 7.2%, of the total portfolio at December 31, 2017. We closely monitor the investment portfolio’s yield, duration, and maturity to ensure a satisfactory return. The average maturity of the securities portfolio is affected by call options that may be exercised by the issuer of the securities and are influenced by market interest rates. Prepayments of mortgages that collateralize mortgage-backed securities also affect the maturity of the securities portfolio. Based on internal forecasts at December 31, 2017, we believe that the securities portfolio has a forecasted weighted average life of approximately 6.0 years based on the current interest rate environment. A parallel interest rate shock of 400 basis points is forecasted to increase the weighted average life of the portfolio to approximately 6.4 years.
At December 31, 2017, the following table identifies the issuers, and the aggregate amortized cost and aggregate fair value of the securities of such issuers that exceeded 10% of our total shareholders’ equity:
Deposits
Managing the mix and pricing the maturities of deposit liabilities is an important factor affecting our ability to maximize our net interest margin. The strategies used to manage interest-bearing deposit liabilities are designed to adjust as the interest rate environment changes. We regularly assess our funding needs, deposit pricing and interest rate outlooks. From December 31, 2016 to December 31, 2017, total deposits increased $223.1 million, or 16.8%, to $1.5 billion. Noninterest-bearing demand deposits increased $20.5 million to $251.6 million at December 31, 2017. Interest-bearing demand deposits increased $131.9 million to $611.7 million at December 31, 2017. Time deposits increased $63.3 million, or 12.2%, to $581.3 million at December 31, 2017 compared to $518.0 million at December 31, 2016. First Guaranty had $115.9 million in brokered deposits at December 31, 2017.
As we seek to strengthen our net interest margin and improve our earnings, attracting noninterest-bearing deposits will be a primary emphasis. Management will continue to evaluate and update our product mix in its efforts to attract additional customers. We currently offer a number of deposit products that are competitively priced and designed to attract and retain customers with primary emphasis on noninterest-bearing deposits.
TOTAL DEPOSITS In Millions
0
500
1000
1500
2000
20172016201520142013
At December 31, 2017
Amortized Cost Fair Value
(in thousands)
U.S. Treasuries $ 19,490 $ 19,486
FHLB 50,395 49,403
Freddie Mac 57,569 57,008
Fannie Mae 103,644 101,757
Federal Farm Credit Bank 136,923 134,381
Total $368,021 $ 362,035
82 2017 ANNUAL REPORT FIRST GUARANTY BANCSHARES, INC.

The following table sets forth the distribution of deposit accounts, by account type, for the dates indicated.
At December 31, 2017, public funds deposits totaled $640.7 million compared to $556.9 million at December 31, 2016. The change in balances from December 31, 2016 to December 31, 2017 was primarily due to the timing associated with seasonal tax collections. We have developed a program for the retention and management of public funds deposits. Since the end of 2012, we have maintained public funds deposits in excess of $400.0 million. These deposits are from public entities such as school districts, hospital districts, sheriff departments and municipalities. $591.2 million, or 92% of these accounts at December 31, 2017 are under fiscal agency agreements with terms of three years or less. Deposits under fiscal agency agreements are generally stable but public entities may maintain the ability to negotiate term deposits on a specific basis including with
other financial institutions. Three of these relationships account for approximately 40% of public fund deposits that are under fiscal agency agreements. These deposits generally have stable balances as we maintain both operating accounts and time deposits for these entities. There is a seasonal component to public deposit levels associated with annual tax collections. Public funds will increase at the end of the year and during the first quarter. Public funds deposit accounts are collateralized by FHLB letters of credit, by Louisiana municipal bonds and by eligible government and government agency securities such as those issued by the FHLB, FFCB, Fannie Mae, and Freddie Mac. We invest the majority of these public deposits in our investment portfolio, but have increasingly invested more public funds into loans during the last three years.
For the Years Ended December 31,
Total Deposits 2017 2016 2015
Average Balance Percent
Weighted Average
RateAverage Balance Percent
Weighted Average
RateAverage Balance Percent
Weighted Average
Rate
(in thousands except for %)
Noninterest-bearing Demand $ 244,949 16.7% -% $ 221,634 17.2% -% $ 211,584 15.9% -%
Interest-bearing Demand 539,399 36.9% 1.0% 415,410 32.3% 0.6% 401,617 30.2% 0.4%
Savings 102,779 7.0% 0.2% 89,279 7.0% 0.1% 77,726 5.8% -%
Time 575,666 39.4% 1.2% 558,982 43.5% 1.1% 640,134 48.1% 1.1%
Total Deposits $ 1,462,793 100.0% 0.9% $1,285,305 100.0% 0.7% $1,331,061 100.0% 0.6%
For the Years Ended December 31,
Individual and Business Deposits 2017 2016 2015
Average Balance Percent
Weighted Average
RateAverage Balance Percent
Weighted Average
RateAverage Balance Percent
Weighted Average
Rate
(in thousands except for %)
Noninterest-bearing Demand $ 240,337 28.0% -% $ 217,245 30.1% -% $ 207,334 27.6% -%
Interest-bearing Demand 187,439 21.8% 0.6% 117,221 16.2% 0.3% 112,864 15.0% 0.2%
Savings 82,442 9.6% 0.1% 72,647 10.0% 0.1% 65,775 8.7% 0.1%
Time 348,656 40.6% 1.3% 316,191 43.7% 1.3% 366,244 48.7% 1.4%
Total Individual and Business Deposits $ 858,874 100.0% 0.7% $ 723,304 100.0% 0.6% $ 752,217 100.0% 0.7%
For the Years Ended December 31,
Public Fund Deposits 2017 2016 2015
Average Balance Percent
Weighted Average
RateAverage Balance Percent
Weighted Average
RateAverage Balance Percent
Weighted Average
Rate
(in thousands except for %)
Noninterest-bearing Demand $ 4,612 0.8% -% $ 4,389 0.8% -% $ 4,250 0.7% -%
Interest-bearing Demand 351,960 58.3% 1.2% 298,189 53.0% 0.8% 288,753 49.9% 0.4%
Savings 20,337 3.4% 0.8% 16,632 3.0% 0.3% 11,951 2.1% -%
Time 227,010 37.5% 1.1% 242,791 43.2% 0.8% 273,890 47.3% 0.7%
Total Public Fund Deposits $ 603,919 100.0% 1.2% $ 562,001 100.0% 0.8% $ 578,844 100.0% 0.5%
EXPECT MORE 83

At December 31, 2017, the aggregate amount of outstanding certificates of deposit in amounts greater than or equal to $100,000 was approximately $409.4 million. At December 31, 2017, approximately $141.3 million of our certificates of deposit greater than or equal to $100,000 had a remaining term greater than one year.
The following table sets forth the maturity of the total certificates of deposit greater than or equal to $100,000 at December 31, 2017.
Borrowings.
First Guaranty maintains borrowing relationships with other financial institutions as well as the Federal Home Loan Bank on a short and long-term basis to meet liquidity needs. Short-term borrowings totaled $15.5 million at December 31, 2017 and $6.5 million at December 31, 2016. The short-term borrowings at December 31, 2017 were comprised of a line of credit of $6.5 million, with no outstanding balance and collateralized short-term borrowings from the Federal Home Loan Bank totaling $15.5 million.
At December 31, 2017, we had $294.2 million in FHLB letters of credit outstanding obtained primarily for collateralizing public deposits. The increase in Federal Home Loan Bank letters of credit reflects First Guaranty's ability to transition public funds deposits into loans.
The following table sets forth information concerning balances and interest rates on our short-term borrowings at the dates and for the years indicated.
First Guaranty Bancshares had senior long-term debt totaling $22.8 million at December 31, 2017 and $22.1 million at December 31, 2016. First Guaranty modified its existing senior long-term debt in the second quarter of 2017. The modification increased the principal balance to $25.0 million with new net proceeds of $3.8 million. The existing amortization terms and rates remained the same. The $3.8 million in additional proceeds were contributed to First Guaranty Bank for future growth.
First Guaranty also had junior subordinated debentures totaling $14.7 million at December 31, 2017 and $14.6 million at December 31, 2016.
Shareholders’ Equity
Total shareholders’ equity increased to $144.0 million at December 31, 2017 from $124.3 million at December 31, 2016. The increase in shareholders' equity was principally the result of an $11.3 million increase in surplus, a $5.5 million increase in retained earnings and a decrease of $2.4 million in accumulated other comprehensive loss. The decrease in accumulated other comprehensive loss was primarily attributed to the decrease in unrealized losses on available for sale securities during the year. The $11.3 million increase in surplus was due to the issuance of common stock resulting from the Premier acquisition and the 10% common stock dividend paid in December 2017. The $5.5 million increase in retained earnings was due to net income of $11.8 million during the year ended December 31, 2017, partially offset by $5.2 million in cash dividends paid on our common stock and the reclassification to surplus for the 10% common stock dividend.
The following table sets forth our public funds as a percent of total deposits.
December 31, 2017
(in thousands)
Due in one year or less $ 268,078
Due after one year through three years 107,414
Due after three years 33,920
Total certificates of deposit greater than or equal to $100,000 $409,412
At or For the Years Ended December 31,
2017 2016 2015
(in thousands except for %)
Balance at end of year $15,500 $ 6,500 $ 1,800
Maximum month-end outstanding $28,000 $ 25,000 $13,800
Average daily outstanding $ 5,833 $ 8,775 $ 4,217
Total weighted average rate during the year 1.06% 0.85% 2.12%
Weighted average rate during year 1.51% 0.65% 4.50%
At December 31,
2017 2016 2015
(in thousands except for %)
Public Funds:
Noninterest-bearing Demand $ 4,828 $ 4,114 $ 4,906
Interest-bearing Demand 389,788 324,356 296,416
Savings 20,539 20,116 14,667
Time 225,591 208,330 252,688
Total Public Funds $ 640,746 $ 556,916 $ 568,677
Total Deposits $1,549,286 $1,326,181 $1,295,870
Total Public Funds as a percent of Total Deposits 41.4% 42.0% 43.9%
84 2017 ANNUAL REPORT FIRST GUARANTY BANCSHARES, INC.

Results of Operations
Performance Summary
Year ended December 31, 2017 compared with year ended December 31, 2016. Net income for the year ended December 31, 2017 was $11.8 million, a decrease of $2.3 million, or 16.6%, from $14.1 million for the year ended December 31, 2016. The decrease in net income of $2.3 million for the year ended December 31, 2017 was the result of several factors. Non-interest income declined as net gains on securities were $2.4 million less in 2017 than in 2016. Net gains on securities sales for the years ended December 31, 2017 and 2016 were $1.4 million and $3.8 million, respectively. Non-interest expense increased primarily due to expenses associated with the Premier acquisition that included $1.4 million in one-time merger related expenses, as well as expenses associated with additional compensation, occupancy, and other operating expenses for the new Texas markets. First Guaranty recorded a one-time income tax expense of $0.9 million in 2017 related to the estimated net impact from the remeasurement of deferred tax assets and liabilities due to the change in Federal tax rates that occurred with the passage of the Tax Cuts and Jobs Act. Interest expense increased in 2017 due changes in rates paid on demand deposits and time deposits and due to the acquired deposits from the Premier acquisition. Factors that partially offset these expenses included increased loan interest income and gains on the sale of SBA loans. Loan interest income increased due to the continued growth in First Guaranty’s loan portfolio and due to the acquired loans from the Premier acquisition. First Guaranty generated $0.3 million in gains from SBA loans sales following the Premier acquisition. Earnings per common share for the year ended December 31, 2017 was $1.37 per common share, a decrease of 18.5% or $0.31 per common share from $1.68 per common share for the year ended December 31, 2016 (as adjusted for the 10% stock dividend in December 2017).
Earnings per share was affected by the change in earnings and by the change in shares outstanding due to the Premier acquisition. Average shares outstanding was 8,608,088 for 2017 compared to 8,369,424 for 2016.
Year ended December 31, 2016 compared with year ended December 31, 2015. Net income for the year ended December 31, 2016 was $14.1 million, a decrease of $0.4 million, or 2.8%, from $14.5 million for the year ended December 31, 2015. Net income available to common shareholders for the year ended December 31, 2016 was $14.1 million which was a decrease of $28,000. The decrease in net income of $0.4 million for the year ended December 31, 2016 was primarily the result of increased interest expense and increased noninterest expense, partially offset by an increase in interest income and noninterest income. Net gains on securities sales for the years ended December 31, 2016 and 2015 were $3.8 million and $3.3 million, respectively. Earnings per common share for the year ended December 31, 2016 was $1.68 per common share, a decrease of 8.2% or $0.15 per common share from $1.83 per common share for the year ended December 31, 2015 (as adjusted for the 10% stock dividend in December 2017).
Net Interest Income
Our operating results depend primarily on our net interest income, which is the difference between interest income earned on interest-earning assets, including loans and securities, and interest expense incurred on interest-bearing liabilities, including deposits and other borrowed funds. Interest rate fluctuations, as well as changes in the amount and type of interest-earning assets and interest-bearing liabilities, combine to affect net interest income. Our net interest income is affected by changes in the amount and mix of interest-earning assets and interest-bearing liabilities. It is also affected by changes in yields earned on interest-earning assets and rates paid on interest-bearing deposits and other borrowed funds.
TOTAL NET INCOME In Millions
0
3
6
9
12
15
20172016201520142013 0
30
60
90
120
150
20172016201520142013
TOTAL COMMON SHAREHOLDERS' EQUITY In Millions
EXPECT MORE 85

A financial institution’s asset and liability structure is substantially different from that of a non-financial company, in that virtually all assets and liabilities are monetary in nature. Accordingly, changes in interest rates may have a significant impact on a financial institution’s performance. The impact of interest rate changes depends on the sensitivity to the change of our interest-earning assets and interest-bearing liabilities. The effects of the low interest rate environment in recent years and our interest sensitivity position is discussed below.
Year ended December 31, 2017 compared with year ended December 31, 2016. Net interest income for the year ended December 31, 2017 and 2016 was $53.2 million and $48.4 million, respectively. The increase in net interest income for the year ended December 31, 2017 was primarily due to an increase in the average balance of our total interest-earning assets and an increase in the average yield of our total interest-earning assets, partially offset by the increase in the average balance of our total interest-bearing liabilities and an increase in the average rate of our total interest-bearing liabilities. The average balance of total interest-earning assets increased by $168.4 million to $1.6 billion for the year ended December 31, 2017 as compared to the year ended December 31, 2016. The average yield on our total interest-earning assets increased 13 basis points to 4.23% for the year ended December 31, 2017 compared to 4.10% for the year ended December 31, 2016. The average balance of total interest-bearing liabilities increased by $151.9 million to $1.3 billion for the year ended December 31, 2017 as compared to the year ended December 31, 2016. The average rate of our total interest-bearing liabilities increased by 22 basis points to 1.14% for the year ended December 31, 2017 compared to 0.92% for the year ended December 31, 2016. As a result, our net interest rate spread decreased nine basis points to 3.09% for the year ended December 31, 2017 from 3.18% for the year ended December 31, 2016, and our net interest margin decreased six basis points to 3.33% for the year ended December 31, 2017 from 3.39% for the year ended December 31, 2016.
Year ended December 31, 2016 compared with year ended December 31, 2015. Net interest income for the year ended December 31, 2016 and 2015 was $48.4 million and $47.5 million, respectively. The increase in net interest income for the year ended December 31, 2016 was primarily due to a decrease in the average balance of our total interest-bearing liabilities and an increase in the average yield of our total interest-earnings assets partially offset by the increase in the average rate of our total interest-bearing liabilities and a decrease in the average balance of our total interest-earning assets. The average balance of total interest-bearing liabilities decreased by $18.7 million to $1.1 billion for the year ended December 31, 2016 as compared to the year ended December 31, 2015. The average yield on our total interest-earning assets increased 25 basis points to 4.10% for the year ended December 31, 2016 compared to 3.85% for the year ended December 31, 2015. The average rate of our total interest-bearing liabilities increased by 16 basis points to 0.92% for the year ended December 31, 2016 compared to 0.76% for the year ended December 31, 2015. The average balance of total interest-earning assets decreased by $30.2 million to $1.4 billion for the year ended December 31, 2016 as compared to the year ended December 31, 2015. As a result, our net interest rate spread increased nine basis points to 3.18% for the year ended December 31, 2016 from 3.09% for the year ended December 31, 2015, and our net interest margin increased 13 basis points to 3.39% for the year ended December 31, 2016 from 3.26% for the year ended December 31, 2015.
Interest Income
Year ended December 31, 2017 compared with year ended December 31, 2016. First Guaranty continues to transition assets from lower yielding securities to higher yielding loans in order to increase interest income. Interest income increased $9.0 million, or 15.4%, to $67.5 million for the year ended December 31, 2017 from $58.5 million for the year ended December 31, 2016 primarily as a result of a $8.5 million increase in interest income on loans. The increase in interest income resulted primarily from an increase in the average balance of our total interest-earning assets along with an increase in the average yield of interest-earning assets. The average balance of interest-earning assets increased $168.4 million to $1.6 billion for the year ended December 31, 2017 as compared to the prior year period. The average yield of interest-earning assets increased by 13 basis points to 4.23% for the year ended December 31, 2017 compared to 4.10% for the year ended December 31, 2016.
Interest income on securities increased $0.4 million, or 2.8%, to $13.3 million for the year ended December 31, 2017 primarily as a result of an increase in the average yield on securities, partially offset by a decrease in the average balance of securities. The average yield on securities increased by 12 basis points to 2.60% for the year ended December 31, 2017 compared to 2.48% for the year ended December 31, 2016 as a result of First Guaranty's plan to transition assets from securities to loans. The average balance of securities decreased $11.7 million to $511.7 million for the year ended December 31, 2017 from $523.4 million for the year ended December 31, 2016.
Interest income on loans increased $8.5 million, or 18.8%, to $54.0 million for the year ended December 31, 2017 as a result of an increase in the average balance of loans, partially offset by a decrease in the average yield on loans. The average balance of loans (excluding loans held for sale) increased by $175.1 million to $1.1 billion for the year ended December 31, 2017 from $881.4 million for the year ended December 31, 2016 as a result of new loan originations, acquired loans and loans assumed from the Premier acquisition, the majority of which were one-to-four family residential loans, commercial leases, commercial real estate loans and commercial and industrial loans. The average yield on loans (excluding loans held for sale) decreased by five basis points to 5.11% for the year ended December 31, 2017 compared to 5.16% for the year ended December 31, 2016.
Year ended December 31, 2016 compared with year ended December 31, 2015. Interest income increased $2.5 million, or 4.4%, to $58.5 million for the year ended December 31, 2016 from $56.1 million for the year ended December 31, 2015 primarily as a result of a $3.0 million increase in interest income on loans. The increase in interest income resulted primarily from an increase in the average yield of interest-earning assets by 25 basis points to 4.10% for the year ended December 31, 2016 compared to 3.85% for the year ended December 31, 2015. This increase was partially offset by a $30.2 million decrease in the average balance of our interest-earnings assets to $1.4 billion for the year ended December 31, 2016 as compared to the prior year.
Interest income on securities decreased $0.5 million, or 3.7%, to $13.0 million for the year ended December 31, 2016 as a result of the decrease in the average balance of securities, which was partially offset by an increase in the average yield on securities. The average balance of securities decreased $85.9 million to $523.4 million for the year ended December 31, 2016 from $609.3 million for the year ended December 31, 2015 as a result of First Guaranty's plan to transition assets from securities into loans. The average yield on securities increased by 27 basis points to 2.48% for the year ended December 31, 2016 compared to 2.21% for the year ended December 31, 2015.
86 2017 ANNUAL REPORT FIRST GUARANTY BANCSHARES, INC.
Interest income on loans increased $3.0 million, or 7.0%, to $45.5 million for the year ended December 31, 2016 as a result of an increase in the average balance of loans, partially offset by a decrease in the average yield on loans. The average balance of loans increased by $65.4 million to $881.4 million for the year ended December 31, 2016 from $816.0 million for the year ended December 31, 2015 as a result of new loan originations, the majority of which were one-to-four family residential loans, the origination of commercial leases, commercial real estate loans and commercial and industrial loans. Partially offsetting the increase in interest income on loans was a decrease in the average yield on loans, which decreased by five basis points to 5.16% for the year ended December 31, 2016 compared to 5.21% for the year ended December 31, 2015 as a result of the low interest rate environment in 2016.
Interest Expense
Year ended December 31, 2017 compared with year ended December 31, 2016. Interest expense increased $4.3 million, or 41.9%, to $14.4 million for the year ended December 31, 2017 from $10.1 million for the year ended December 31, 2016 due primarily to an increase in the average balance of interest-bearing deposits along with an increase in the average rate paid on interest-bearing deposits. The average balance of interest-bearing deposits increased by $154.2 million during the year ended December 31, 2017 to $1.2 billion due to increases in the average balance of demand and time deposits as a result of the Premier acquisition. The average rate of interest-bearing demand deposits increased by 39 basis points during the year ended December 31, 2017 to 1.02%. The increase in the average rate on interest-bearing deposits was due to the increase in demand deposits, primarily public funds NOW accounts and brokered money market deposits, whose rates are contractually tied to national index rates such as the U.S. Federal Funds rate or short term U.S. Treasury rates.
Year ended December 31, 2016 compared with year ended December 31, 2015. Interest expense increased $1.5 million, or 17.8%, to $10.1 million for the year ended December 31, 2016 from $8.6 million for the year ended December 31, 2015 due to an increase in the average rate on deposits partially offset by the decrease in the average balance of deposits. Interest expense also increased due to the origination of a senior secured loan and the issuance of junior subordinated debt used to redeem the SBLF preferred stock at the end of 2015. The approximate increase in interest expense due to these borrowings was $1.4 million for the year ended December 31, 2016. The average rate of time deposits decreased by two basis points during the year ended December 31, 2016 to 1.07%, reflecting downward repricing of our time deposits in the continued low interest rate environment. The decrease was offset by an increase in the average rate of interest-bearing demand deposits of 28 basis points during the year ended December 31, 2016 to 0.63%. The average balance of interest-bearing deposits decreased by $55.8 million during the year ended December 31, 2016 to $1.1 billion as a result of a $81.2 million decrease in the average balance of time deposits that was partially offset by a $25.3 million increase in the average balance of interest-bearing demand deposits and savings deposits.
Average Balances and Yields.
The following table sets forth average balance sheet balances, average yields and costs, and certain other information for the years indicated. No tax-equivalent yield adjustments were made, as the effect thereof was not material. All average balances are daily average balances. Nonaccrual loans were included in the computation of average balances, but have been reflected in the table as loans carrying a zero yield. Loans, net of unearned income, include loans held for sale. The yields set forth below include the effect of deferred fees, discounts and premiums that are amortized or accreted to interest income or expense.
The net interest income yield presented below is calculated by dividing net interest income by average interest-earning assets and is a measure of the efficiency of the earnings from the balance sheet activities. It is affected by changes in the difference between interest on interest-earning assets and interest-bearing liabilities and the percentage of interest-earning assets funded by interest-bearing liabilities.
EXPECT MORE 87

(1) Includes Federal Reserve balances reported in cash and due from banks on the consolidated balance sheets.(2) Net interest rate spread represents the difference between the yield on average interest-earning assets and the cost of average interest-bearing liabilities.(3) Net interest-earning assets represent total interest-earning assets less total interest-bearing liabilities.(4) Net interest margin represents net interest income divided by average total interest-earning assets.(5) The tax adjusted net interest margin was 3.36%, 3.42% and 3.29% for the years ended December 31, 2017, 2016 and 2015. A 35% tax rate was used to calculate the effect on securities income from tax exempt securities.
December 31, 2017 December 31, 2016 December 31, 2015Average Balance Interest
Yield/Rate
Average Balance Interest
Yield/Rate
Average Balance Interest
Yield/Rate
(in thousands except for %)
AssetsInterest-earning assets:Interest-earning deposits with banks(1) $ 23,913 $ 178 0.74% $ 20,857 $ 69 0.33% $ 30,485 $ 72 0.24%Securities (including FHLB stock) 511,728 13,325 2.60% 523,438 12,968 2.48% 609,348 13,471 2.21%Federal funds sold 977 9 0.89% 256 - -% 312 - -%Loans held for sale 1,233 69 5.60% - - -% - - -%Loans, net of unearned income 1,056,519 53,965 5.11% 881,387 45,495 5.16% 816,027 42,536 5.21% Total interest-earning assets 1,594,370 67,546 4.23% 1,425,938 58,532 4.10% 1,456,172 56,079 3.85%
Noninterest-earning assets:Cash and due from banks 10,147 7,915 7,191Premises and equipment, net 31,885 22,306 20,300Other assets 9,536 3,800 5,870Total assets $1,645,938 $1,459,959 $1,489,533
Liabilities and Shareholders' EquityInterest-bearing liabilities:Demand deposits $ 539,399 5,526 1.02% $ 415,410 2,633 0.63% $401,617 1,419 0.35%Savings deposits 102,779 201 0.20% 89,279 80 0.09% 77,726 38 0.05%Time deposits 575,666 7,112 1.24% 558,982 5,954 1.07% 640,134 6,985 1.09%Borrowings 41,190 1,554 3.77% 43,474 1,473 3.39% 6,320 166 2.62% Total interest-bearing liabilities 1,259,034 14,393 1.14% 1,107,145 10,140 0.92% 1,125,797 8,608 0.76%
Noninterest-bearing liabilities:Demand deposits 244,949 221,634 211,584Other 5,138 5,144 5,010 Total Liabilities 1,509,121 1,333,923 1,342,391
Shareholders' equity 136,817 126,036 147,142Total liabilities and shareholders' equity $1,645,938 $1,459,959 $1,489,533Net interest income $53,153 $48,392 $47,471
Net interest rate spread(2) 3.09% 3.18% 3.09%
Net interest-earning assets(3) $ 335,336 $ 318,793 $ 330,375Net interest margin(4)(5) 3.33% 3.39% 3.26%
Average interest-earning assets to interest-bearing liabilities 126.64% 128.79% 129.35%
88 2017 ANNUAL REPORT FIRST GUARANTY BANCSHARES, INC.

For the Years Ended December 31, 2017 vs. 2016
For the Years Ended December 31, 2016 vs. 2015
Increase (Decrease) Due To Increase (Decrease) Due To
Volume RateIncrease/Decrease Volume Rate
Increase/Decrease
(in thousands except for %)
Interest earned on:
Interest-earning deposits with banks $ 12 $ 97 $ 109 $ (27) $ 24 $ (3)
Securities (including FHLB stock) (294) 651 357 (2,023) 1,520 (503
Federal funds sold - 9 9 - - -
Loans held for sale 69 - 69 - - - Loans, net of unearned income 8,950 (480) 8,470 3,377 (418) 2,959
Total interest income 8,737 277 9,014 1,327 1,126 2,453
Interest paid on:
Demand deposits 944 1,949 2,893 50 1,164 1,214
Savings deposits 14 107 121 7 35 42
Time deposits 182 976 1,158 (868) (163) (1,031)
Borrowings (80) 161 81 1,245 62 1,307
Total interest expense 1,060 3,193 4,253 434 1,098 1,532
Change in net interest income $ 7,677 $ (2,916) $ 4,761 $ 893 $ 28 $ 921
Provision for Loan Losses
A provision for loan losses is a charge to income in an amount that management believes is necessary to maintain an adequate allowance for loan losses. The provision is based on management’s regular evaluation of current economic conditions in our specific markets as well as regionally and nationally, changes in the character and size of the loan portfolio, underlying collateral values securing loans, and other factors which deserve recognition in estimating loan losses. This evaluation is inherently subjective as it requires estimates that are susceptible to significant revision as more information becomes available or as future events change.
We recorded a $3.8 million provision for loan losses for the year ended December 31, 2017 compared to $3.7 million for 2016. The allowance for loan losses at December 31, 2017 was $9.2 million or 0.80% of total loans, compared to $11.1 million or 1.17% of total loans at December 31, 2016. The increase in the provision was attributed to the additional provisions on loans evaluated individually for impairment. Substandard loans increased $7.5 million to $49.5 million at December 31, 2017 from $42.0 million at December 31, 2016, partially offset by a decrease in doubtful loans of $3.2 million. The decrease in the allowance at December 31, 2017 compared to December 31, 2016 was due to charge-offs to estimated fair value on impaired loans which had specific reserves allocated to them in prior years and in 2017, which reduced the carrying value of the loans. The allowance for loan losses as a percentage of total loans was 0.90% prior to the inclusion of the
Volume/Rate Analysis.
The following table presents the dollar amount of changes in interest income and interest expense for major components of interest-earning assets and interest-bearing liabilities for the years indicated. The table distinguishes between: (1) changes attributable to volume (changes in volume multiplied by the prior year’s rate); (2) changes attributable to rate (change in rate multiplied by the prior year’s volume) and (3) total increase (decrease) (the sum of the previous columns). Changes attributable to both volume and rate are allocated ratably between the volume and rate categories.
acquired loans from Premier. The impaired loan portfolio did not suffer additional declines in estimated fair value requiring further provisions. We believe that the allowance is adequate to cover potential losses in the loan portfolio given the current economic conditions, and current expected net charge-offs and non-performing asset levels.
For the year ended December 31, 2016, the provision for loan losses was $3.7 million, a decrease of $0.2 million from $3.9 million for 2015. The allowance for loan losses was $11.1 million and $9.4 million at December 31, 2016 and 2015, respectively. The primary change to the credit quality of the loan portfolio was associated with the upgrades of loans. The impaired loan portfolio did not suffer additional declines in estimated fair value requiring further provisions.
Noninterest Income
Our primary sources of recurring noninterest income are customer service fees, loan fees, gains on the sale of loans and available for sale securities and other service fees. Noninterest income does not include loan origination fees which are recognized over the life of the related loan as an adjustment to yield using the interest method.
EXPECT MORE 89
Noninterest income totaled $8.3 million for the year ended December 31, 2017, a decrease of $1.1 million when compared to $9.5 million for 2016. The decrease was primarily due to lower gains on securities sales. Net securities gains were $1.4 million for the year ended December 31, 2017 and $3.8 million for 2016. The gains on securities sales occurred as First Guaranty sold investment securities in order to fund loan growth. We also continued to have gains from bonds that were called and paid off before their contractual maturity. Service charges, commissions and fees totaled $2.6 million for the year ended December 31, 2017 and $2.4 million for 2016. ATM and debit card fees totaled $2.0 million for the year ended December 31, 2017 and $1.9 million for 2016. Net loan gains were $0.3 million for the year ended December 31, 2017 as compared to $14,000 for 2016. The increase in net loan gains during the year ended December 31, 2017 were related to $0.3 million in net gains on the sale of the guaranteed portion of SBA loans. Other noninterest income increased by $0.7 million to $2.1 million for the year ended December 31, 2017 compared to $1.4 million for 2016.
Noninterest income totaled $9.5 million for the year ended December 31, 2016, an increase of $0.5 million when compared to $9.0 million for 2015. The increase was primarily due to higher gains on securities sales. Net securities gains were $3.8 million for the year ended December 31, 2016 and $3.3 million for 2015. The gains on securities sales occurred as First Guaranty sold investment securities in order to fund loan growth. We also continued to have gains from bonds that were called and paid off before their contractual maturity. Service charges, commissions and fees totaled $2.4 million for the year ended December 31, 2016 and $2.7 million for 2015. ATM and debit card fees totaled $1.9 million for the year ended December 31, 2016 and $1.8 million for 2015. Other noninterest income increased by $0.3 million to $1.4 million for the year ended December 31,
2016 compared to $1.1 million for 2015. Other noninterest income included a $0.1 million other-than-temporary impairment charge on an investment security.
Noninterest Expense
Noninterest expense includes salaries and employee benefits, occupancy and equipment expense and other types of expenses. Noninterest expense increased $5.6 million to $38.5 million for the year ended December 31, 2017 compared to $32.9 million in 2016. Salaries and employee benefits expense totaled $20.1 million for 2017 as compared to $16.6 million for 2016, primarily due to the increase in personnel expense from the Premier acquisition and new hires. Occupancy and equipment expense totaled $4.5 million for 2017 and $4.2 million for 2016. Other noninterest expense increased by $1.8 million to $13.9 million for the year ended December 31, 2017 as compared to 2016. The largest increase in other noninterest expense occurred due to increased legal and professional fees associated with the Premier acquisition. Included in other non-interest expense were non-recurring expenses related to the acquisition of Premier of approximately $1.4 million.
Noninterest expense includes salaries and employee benefits, occupancy and equipment expense and other types of expenses. Noninterest expense increased $1.8 million to $32.9 million for the year ended December 31, 2016 compared to $31.1 million in 2015. Salaries and employee benefits expense totaled $16.6 million for 2016 and $15.5 million for 2015. Occupancy and equipment expense totaled $4.2 million for 2016 and $3.8 million for 2015. Other noninterest expense increased by $0.3 million to $12.1 million for the year ended December 31, 2016 as compared to 2015. Included in noninterest expense were flood related expenses of approximately $0.3 million that occurred during the year ended December 31, 2016.
December 31, 2017 December 31, 2016 December 31, 2015
(in thousands)
Other noninterest expense:
Legal and professional fees $ 3,037 $ 2,185 $ 2,019
Data processing 1,608 1,259 1,184
ATM fees 1,161 1,044 1,022
Marketing and public relations 1,205 878 848
Taxes - sales, capital and franchise 970 787 717
Operating supplies 496 471 414
Software expense and amortization 923 835 612
Travel and lodging 910 710 818
Telephone 167 177 172
Amortization of core deposits 432 320 320
Donations 322 298 332
Net costs from other real estate and repossessions 306 498 493
Regulatory assessment 726 1,005 1,111
Other 1,640 1,599 1,692
Total other expense $13,903 $12,066 $11,754
The following table presents, for the years indicated, the major categories of other noninterest expense:
90 2017 ANNUAL REPORT FIRST GUARANTY BANCSHARES, INC.

Income Taxes.
The amount of income tax expense is influenced by the amount of pre-tax income, the amount of tax-exempt income and the amount of other non-deductible expenses. The provision for income taxes for the years ended December 31, 2017, 2016 and 2015 was $7.4 million, $7.2 million and $7.0 million, respectively. The provision for income taxes increased in 2017 as compared to 2016. First Guaranty recorded a one-time income tax expense of $0.9 million as a result of a remeasurement of its net deferred tax asset due to the enactment of the Tax Cuts and Jobs Act ("the "Tax Act") in December 2017 which reduced the corporate federal income tax rate from 35% to 21% beginning January 1, 2018 GAAP requires that the impact of the Tax Act must be accounted for in the period of enactment of the new law. Our statutory tax rate was 35.0% for 2017, 2016 and 2015. First Guaranty's statutory rate for 2018 will be 21.0%.
Impact of Inflation
Our consolidated financial statements and related notes included elsewhere in this Annual Report on Form 10-K have been prepared in accordance with GAAP. These require the measurement of financial position and operating results in terms of historical dollars, without considering changes in the relative value of money over time due to inflation or recession.
Unlike many industrial companies, substantially all of our assets and liabilities are monetary in nature. As a result, interest rates have a more significant impact on our performance than the effects of general levels of inflation. Interest rates may not necessarily move in the same direction or in the same magnitude as the prices of goods and services. However, other operating expenses do reflect general levels of inflation.
Liquidity and Capital Resources
Liquidity
Liquidity refers to the ability or flexibility to manage future cash flows to meet the needs of depositors and borrowers and fund operations. Maintaining appropriate levels of liquidity allows us to have sufficient funds available to meet customer demand for loans, withdrawal of deposit balances and maturities of deposits and other liabilities. Liquid assets include cash and due from banks, interest-earning demand deposits with banks, federal funds sold and available for sale investment securities.
Loans maturing within one year or less at December 31, 2017 totaled $164.7 million. At December 31, 2017, time deposits maturing within one year or less totaled $357.7 million. First Guaranty's held to maturity ("HTM") investment securities portfolio at December 31, 2017 was $120.1 million or 23.9% of the investment portfolio compared to $101.9 million or 20.4% at December 31, 2016. The securities in the HTM portfolio are used to collateralize public funds deposits and may also be used to secure borrowings with the Federal Home Loan Bank or Federal Reserve Bank. The agency securities in the HTM portfolio have maturities of 10 years or less. The mortgage backed securities have stated final maturities of 15 to 20 years at December 31, 2017. The municipal securities in the HTM portfolio have maturities of 20 years or less. The HTM portfolio had a forecasted weighted average life of approximately 5.9 years based on current interest rates at December 31, 2017. Management regularly monitors the size and composition of the HTM portfolio to evaluate its effect on our liquidity. First Guaranty's available for sale ("AFS") portfolio was $381.5 million, or 76.1% of the investment portfolio at December 31, 2017 compared to $397.5 million, or 79.6% at December 31, 2016. The majority of the AFS portfolio was comprised of U.S. Treasuries, U.S. Government Agencies, mortgage backed securities, municipal bonds and investment grade corporate bonds. We believe these securities are readily marketable and enhance our liquidity.
We maintained a net borrowing capacity at the FHLB totaling $40.1 million and $45.8 million at December 31, 2017 and December 31, 2016, respectively with $15.5 million and $6.5 million in FHLB advances outstanding at December 31, 2017 and December 31, 2016, respectively. At December 31, 2017, we had outstanding letters of credit from the FHLB in the amount of $294.2 million that were primarily used to collateralize public funds deposits. We also have a discount window line with the Federal Reserve Bank of $8.7 million, with no outstanding balance at December 31, 2017. We also maintain federal funds lines of credit at various correspondent banks with borrowing capacity of $95.5 million at December 31, 2017. We have a revolving line of credit for $6.5 million, with no outstanding balance at December 31, 2017 secured by a pledge of the Bank's common stock. Management believes there is sufficient liquidity to satisfy current operating needs.
Capital Resources
Our capital position is reflected in total shareholders’ equity, subject to certain adjustments for regulatory purposes. Further, our capital base allows us to take advantage of business opportunities while maintaining the level of resources we deem appropriate to address business risks inherent in daily operations.
Total shareholders’ equity increased to $144.0 million at December 31, 2017 from $124.3 million at December 31, 2016. The increase in shareholders' equity was principally the result of an $11.3 million increase in surplus, a $5.5 million increase in retained earnings and a decrease of $2.4 million in accumulated other comprehensive loss at December 31, 2017. The decrease in accumulated other comprehensive loss was primarily attributed to the decrease in unrealized losses on available for sale securities during the year ended December 31, 2017. The $11.3 million increase in surplus was due to the issuance of common stock resulting from the Premier acquisition and the 10% common stock dividend paid in December 2017. The $5.5 million increase in retained earnings was due to net income of $11.8 million during the year ended December 31, 2017, partially offset by $5.2 million in cash dividends paid on our common stock and the reclassification to surplus for the 10% common stock dividend.
Capital Management
We manage our capital to comply with our internal planning targets and regulatory capital standards administered by the Federal Reserve and the FDIC. We review capital levels on a monthly basis. We evaluate a number of capital ratios, including Tier 1 capital to total adjusted assets (the leverage ratio) and Tier 1 capital to risk-weighted assets. At December 31, 2017, First Guaranty Bancshares and First Guaranty Bank were classified as well-capitalized. First Guaranty Bancshares, Inc. capital conservation buffer was 4.14% at December 31, 2017. First Guaranty Bank’s capital conservation buffer was 5.07% at December 31, 2017.
EXPECT MORE 91
The following table presents our capital ratios as of the indicated dates.
Off-balance sheet commitmentsWe are a party to financial instruments with off-balance sheet risk in the normal course of business to meet the financing needs of its customers and to reduce its own exposure to fluctuations in interest rates. These financial instruments include commitments to extend credit and standby and commercial letters of credit. Those instruments involve, to varying degrees, elements of credit and interest rate risk in excess of the amount recognized in our consolidated balance sheets. The contract or notional amounts of those instruments reflect the extent of the involvement in particular classes of financial instruments.
"Well Capitalized Minimums" At December 31, 2017
"Well Capitalized Minimums" At December 31, 2016
Tier 1 Leverage Ratio:
Consolidated N/A 8.27% N/A 8.68%
Bank 5.00% 9.88% 5.00% 9.88%
Tier 1 Risk-based Capital Ratio:
Consolidated N/A 10.35% N/A 10.59%
Bank 8.00% 12.39% 8.00% 12.05%
Total Risk-based Capital Ratio:
Consolidated N/A 12.14% N/A 12.79%
Bank 10.00% 13.07% 10.00% 12.99%
Common Equity Tier One Capital:
Consolidated N/A 10.35% N/A 10.59%
Bank 6.50% 12.39% 6.50% 12.05%
Contract Amount
December 31, 2017 December 31, 2016 December 31, 2015
(in thousands)
Commitments to Extend Credit $ 78,125 $ 56,910 $ 88,081
Unfunded Commitments under lines of credit $101,344 $128,428 $107,581
Commercial and Standby letters of credit $ 7,886 $ 6,602 $ 7,486
The exposure to credit loss in the event of nonperformance by the other party to the financial instrument for commitments to extend credit and standby and commercial letters of credit is represented by the contractual notional amount of those instruments. The same credit policies are used in making commitments and conditional obligations as it does for on-balance sheet instruments. Unless otherwise noted, collateral or other security is not required to support financial instruments with credit risk.
The notional amounts of the financial instruments with off-balance sheet risk at December 31, 2017, 2016 and 2015 are as follows:
Commitments to extend credit are agreements to lend to a customer as long as there is no violation of any condition established in the contract. Commitments generally have fixed expiration dates or other termination clauses and may require payment of a fee. Since commitments may expire without being drawn upon, the total commitment amounts do not necessarily represent future cash requirements. Each customer’s creditworthiness is evaluated on a case-by-case basis. The amount of collateral obtained, if deemed necessary upon extension of credit, is based on our credit evaluation of the counterpart. Collateral requirements vary but may include accounts receivable, inventory, property, plant and equipment, residential real estate and commercial properties.
Unfunded commitments under lines of credit are contractually obligated by us as long as the borrower is in compliance with the terms of the loan relationship. Unfunded lines of credit are typically operating lines of credit that adjust on a regular basis as a customer requires funding. There may be seasonal variations to the usage of these lines. At December 31, 2017, the largest concentration of unfunded commitments were lines of credit associated with commercial and industrial loans.
Commercial and standby letters of credit are conditional commitments to guarantee the performance of a customer to a third party. These guarantees are primarily issued to support public and private borrowing arrangements, including commercial paper, bond financing and similar transactions. The majority of these guarantees are short-term
92 2017 ANNUAL REPORT FIRST GUARANTY BANCSHARES, INC.

rate risk position. The board ALCO investment committee is comprised of certain members of the board of directors of the Bank and meets monthly. The management asset liability committee provides a monthly report to the board ALCO investment committee.
The need for interest sensitivity gap management is most critical in times of rapid changes in overall interest rates. We generally seek to limit our exposure to interest rate fluctuations by maintaining a relatively balanced mix of rate sensitive assets and liabilities on a one-year time horizon and greater than one-year time horizon. Because of the significant impact on net interest margin from mismatches in repricing opportunities, we monitor the asset-liability mix periodically depending upon the management asset liability committee’s assessment of current business conditions and the interest rate outlook. We maintain exposure to interest rate fluctuations within prudent levels using varying investment strategies. These strategies include, but are not limited to, frequent internal modeling of asset and liability values and behavior due to changes in interest rates. We monitor cash flow forecasts closely and evaluate the impact of both prepayments and extension risk.
The following interest sensitivity analysis is one measurement of interest rate risk. This analysis, which we prepare quarterly, reflects the contractual maturity characteristics of assets and liabilities over various time periods. This analysis does not factor in prepayments or interest rate floors on loans which may significantly change the report. This table includes nonaccrual loans in their respective maturity periods. The gap indicates whether more assets or liabilities are subject to repricing over a given time period. The interest sensitivity analysis at December 31, 2017 illustrated below reflects a liability-sensitive position with a negative cumulative gap on a one-year basis.
(one year or less); however, some guarantees extend for up to three years. The credit risk involved in issuing letters of credit is essentially the same as that involved in extending loan facilities to customers. Collateral requirements are the same as on-balance sheet instruments and commitments to extend credit.
There were no losses incurred on any commitments during the years ended December 31, 2017, 2016 and 2015.
Contractual Obligations
The following table summarizes our fixed and determinable contractual obligations and other funding needs by payment date at December 31, 2017. The payment amounts represent those amounts due to the recipient and do not include any unamortized premiums or discounts or other similar carrying amount adjustments.
Item 7A – Quantitative and Qualitative Disclosures about Market Risk
Asset/Liability Management and Market Risk
Asset/Liability Management
Our asset/liability management process consists of quantifying, analyzing and controlling interest rate risk to maintain reasonably stable net interest income levels under various interest rate environments. The principal objective of asset/liability management is to maximize net interest income while operating within acceptable limits established for interest rate risk and to maintain adequate levels of liquidity.
The majority of our assets and liabilities are monetary in nature. Consequently, one of our most significant forms of market risk is interest rate risk, which is inherent in our lending and deposit-taking activities. Our assets, consisting primarily of loans secured by real estate and fixed rate securities in our investment portfolio, have longer maturities than our liabilities, consisting primarily of deposits. As a result, a principal part of our business strategy is to manage interest rate risk and reduce the exposure of our net interest income to changes in market interest rates. The board of directors of First Guaranty Bank has established two committees, the management asset liability committee and the board investment committee, to oversee the interest rate risk inherent in our assets and liabilities, for determining the level of risk that is appropriate given our business strategy, operating environment, capital, liquidity and performance objectives, and for managing this risk consistent with the guidelines approved by the board of directors. The management asset liability committee is comprised of senior officers of the Bank and meets as needed to review our asset liability policies and interest
Payments Due by Period: December 31, 2017
Less Than One Year One to Three Years Over Three Years Total
(in thousands)
Operating leases $ 39 $ 47 $ 15 $ 101
Software contracts 1,271 1,016 207 2,494
Time deposits 357,687 167,745 55,899 581,331
Short-term borrowings 15,500 - - 15,500
Senior long-term debt 2,941 5,882 13,971 22,794
Junior subordinated debentures - - 15,000 15,000
Total contractual obligations $377,438 $174,690 $85,092 $637,220
EXPECT MORE 93

December 31, 2017
Interest Sensitivity Within
3 Months Or Less
Over 3 Months thru 12 Months
Total One Year
Over One Year Total
(in thousands)
Earning Assets:
Loans (including loans held for sale) $ 515,254 $ 48,631 $ 563,885 $ 586,437 $ 1,150,322
Securities (including FHLB stock) 24,338 7,246 31,584 472,423 504,007
Federal Funds Sold 823 - 823 - 823
Other earning assets 25,589 - 25,589 - 25,589
Total earning assets $ 566,004 $ 55,877 $ 621,881 $ 1,058,860 $ 1,680,741
Source of Funds:
Interest-bearing accounts:
Demand deposits $ 611,677 $ - $ 611,677 $ - $ 611,677
Savings deposits 104,661 - 104,661 - 104,661Time deposits 150,844 206,843 357,687 223,644 581,331Short-term borrowings 15,500 - 15,500 - 15,500Senior long-term debt 22,774 - 22,774 - 22,774
Junior subordinated debt - - - 14,664 14,664Noninterest-bearing, net - - - 330,134 330,134Total source of funds $ 905,456 $ 206,843 $ 1,112,299 $ 568,442 $1,680,741
Period gap $ (339,452) $ (150,966) $ (490,418) $ 490,418
Cumulative gap $ (339,452) $ (490,418) $ (490,418) $ -
Cumulative gap as a percent of earning assets -20.2% -29.2% -29.2%
94 2017 ANNUAL REPORT FIRST GUARANTY BANCSHARES, INC.

December 31, 2017
Instantaneous Changes in Interest Rates (basis points)
Percent Change in Net Interest Income
+400 (11.05%)
+300 (8.19%)
+200 (5.22%)
+100 (2.34%)
Base -%
-100 2.15%
Gradual Changes in Interest Rates (basis points)
Percent Change in Net Interest Income
+400 (6.47%)
+300 (4.77%)
+200 (3.15%)
+100 (1.45%)
Base -%
-100 2.09%
Net Interest Income at Risk. Net interest income at risk measures the risk of a decline in earnings due to changes in interest rates. The first table below presents an analysis of our interest rate risk as measured by the estimated changes in net interest income resulting from an instantaneous and sustained parallel shift in the yield curve over a 12-month horizon at December 31, 2017. The second table below presents an analysis of our interest rate risk as measured by the estimated changes in net interest income resulting from a gradual shift in the yield curve over a 12-month period. Shifts are measured in 100 basis point increments (+400 through -100 basis points) from base case. We do not present shifts less than 100 basis points because of the current low interest rate environment. The base case scenario encompasses key assumptions for asset/liability mix, loan and deposit growth, pricing, prepayment speeds, deposit decay rates, securities portfolio cash flows and reinvestment strategy and the market value of certain assets under the various interest rate scenarios. The base case scenario assumes that the current interest rate environment is held constant throughout the forecast period for a static balance sheet and the instantaneous and gradual shocks are performed against that yield curve.
These scenarios above are both instantaneous and gradual shocks that assume balance sheet management will mirror the base case. Even if interest rates change in the designated amounts, there can be no assurance that our assets and liabilities would perform as anticipated. Additionally, a change in the U.S. Treasury rates in the designated amounts accompanied by a change in the shape of the U.S. Treasury yield curve would cause significantly different changes to net interest income than indicated above. Strategic management of our balance sheet would be adjusted to accommodate these movements. As with any method of measuring interest rate risk, certain shortcomings are inherent in the methods of analysis presented above. For example, although certain assets and liabilities may have similar maturities or periods to repricing, they may react in different degrees to changes in market interest rates. Also, the interest rates on certain types of assets and liabilities may fluctuate in advance of changes in market interest rates, while interest rates on other types may lag behind changes in market rates. Also, the ability of many borrowers to service their debt
may decrease in the event of an interest rate increase. We consider all of these factors in monitoring exposure to interest rate risk.
We are pursuing a strategy that began in 2012 to reduce long-term interest rate risk. The contractual maturity of the investment portfolio was shortened and mortgage backed securities were purchased to enhance cash flow. We were able to grow our loan portfolio while reducing the size of the investment portfolio. New loans originated generally were either floating rate or were fixed rate with maturities that did not exceed five years. Securities as a percentage of average interest-earning assets decreased from 36.7% in 2016 to 32.1% in 2017. Deposit maturities were extended and generally priced lower. We believe that the addition of short-term securities and deploying our capital to grow our loan portfolio will help to lower interest rate risk.
EXPECT MORE 95

Charles E. Castaing, CPA, Retired
Roger E. Hussey, CPA, Retired
Samuel R. Lolan, CPALori D. Percle, CPA
Debbie B. Taylor, CPAKatherine H. Armentor, CPA
Robin G. Freyou, CPA
Shalee M. Landry, CPATrenton R. Hardy, CPABrittany S. Guidry, CPA
Report of Castaing, Hussey & Lolan, LLCIndependent Registered Accounting Firm
To the Shareholders and Board of DirectorsFirst Guaranty Bancshares, Inc.
Opinion on the Financial Statements
We have audited the accompanying consolidated balance sheets of First Guaranty Bancshares, Inc. and Subsidiaries as of December 31, 2017 and 2016, and the related consolidated statements of income, comprehensive income, shareholders’ equity, and cash flows for each of the years in the three-year period ended December 31, 2017, and the related notes (collectively referred to as the consolidated financial statements). In our opinion, the consolidated financial statements present fairly, in all material respects, the consolidated financial position of First Guaranty Bancshares, Inc. and Subsidiaries as of December 31, 2017 and 2016, and the consolidated results of its operations and its cash flows for each of the years in the three-year period ended December 31, 2017, in conformity with accounting principles generally accepted in the United States of America.
We also have audited, in accordance with the standards of the American Institute of Certified Public Accountants, First Guaranty Bancshares, Inc.’s internal control over financial reporting as of December 31, 2017, based on criteria established in Internal Control—Integrated Framework (2013) issued by the Committee of Sponsoring Organizations of the Treadway Commission (COSO), and our report dated March 16, 2018, expressed an unqualified opinion.
Basis for Opinion
These financial statements are the responsibility of First Guaranty Bancshares Inc.’s management. Our responsibility is to express an opinion on First Guaranty Bancshares Inc. and Subsidiaries’ financial statements based on our audits. We are a public accounting firm registered with the PCAOB and are required to be independent with respect to First Guaranty Bancshares, Inc. and Subsidiaries in accordance with the U.S. federal securities laws and the applicable rules and regulations of the Securities and Exchange Commission and the PCAOB.
We conducted our audits in accordance with the standards of the PCAOB. Those standards require that we plan and perform the audit to obtain reasonable assurance about whether the financial statements are free of material misstatement, whether due to error or fraud. Our audits included performing procedures to assess the risks of material misstatement of the financial statements, whether due to error or fraud, and performing procedures that respond to those risks. Such procedures included examining, on a test basis, evidence regarding the amounts and disclosures in the financial statements. Our audits also included evaluating the accounting principles used and significant estimates made by management, as well as evaluating the overall presentation of the financial statements. We believe that our audits provide a reasonable basis for our opinion.
We have served as First Guaranty Bancshares Inc. and Subsidiaries’ auditor since 2001.
Castaing, Hussey & Lolan, LLCNew Iberia, Louisiana
March 16, 2018
96 2017 ANNUAL REPORT FIRST GUARANTY BANCSHARES, INC.
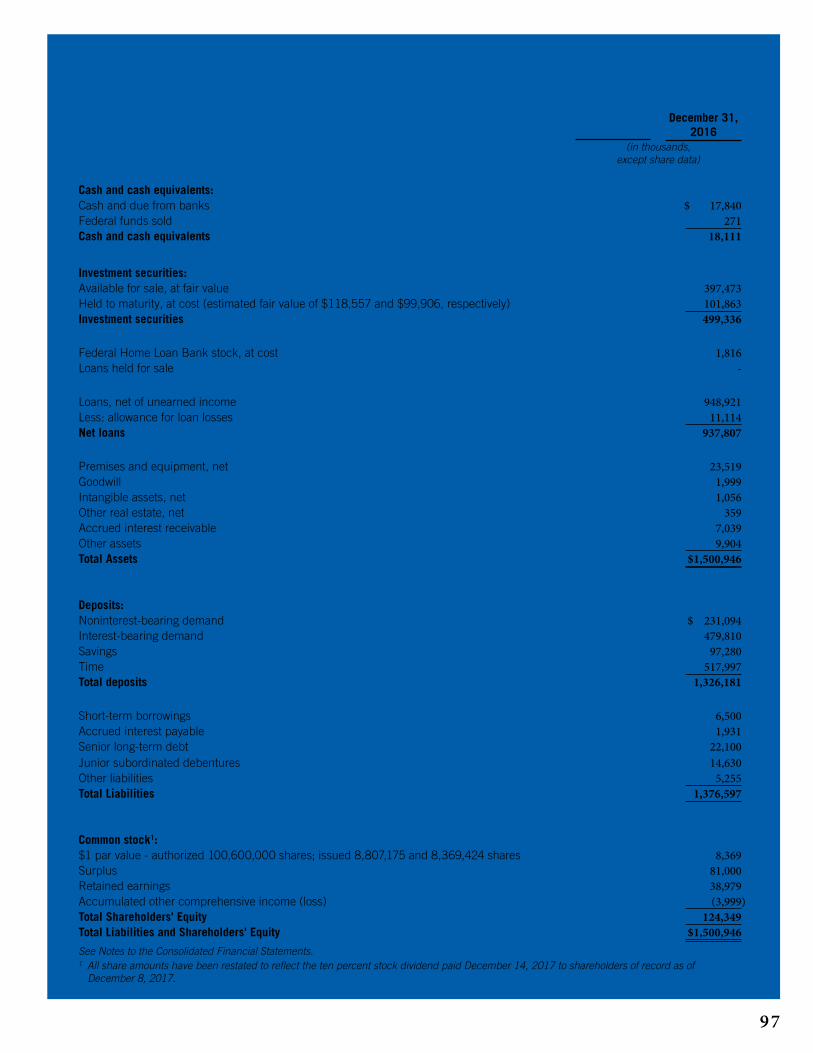
FIRST GUARANTY BANCSHARES, INC. AND SUBSIDIARYCONSOLIDATED BALANCE SHEETS
December 31, 2017
December 31, 2016
(in thousands, except share data)
AssetsCash and cash equivalents:Cash and due from banks $ 37,205 $ 17,840Federal funds sold 823 271 Cash and cash equivalents 38,028 18,111
Investment securities:Available for sale, at fair value 381,535 397,473 Held to maturity, at cost (estimated fair value of $118,557 and $99,906, respectively) 120,121 101,863 Investment securities 501,656 499,336
Federal Home Loan Bank stock, at cost 2,351 1,816 Loans held for sale 1,308 -
Loans, net of unearned income 1,149,014 948,921 Less: allowance for loan losses 9,225 11,114 Net loans 1,139,789 937,807
Premises and equipment, net 38,020 23,519 Goodwill 3,472 1,999 Intangible assets, net 4,424 1,056 Other real estate, net 1,281 359 Accrued interest receivable 7,982 7,039 Other assets 12,119 9,904 Total Assets $1,750,430 $1,500,946
Liabilities and Shareholders' EquityDeposits:Noninterest-bearing demand $ 251,617 $ 231,094Interest-bearing demand 611,677 479,810 Savings 104,661 97,280 Time 581,331 517,997 Total deposits 1,549,286 1,326,181
Short-term borrowings 15,500 6,500 Accrued interest payable 2,488 1,931 Senior long-term debt 22,774 22,100 Junior subordinated debentures 14,664 14,630Other liabilities 1,735 5,255 Total Liabilities 1,606,447 1,376,597
Shareholders' EquityCommon stock1:$1 par value - authorized 100,600,000 shares; issued 8,807,175 and 8,369,424 shares 8,807 8,369Surplus 92,268 81,000Retained earnings 44,464 38,979Accumulated other comprehensive income (loss) (1,556) (3,999)Total Shareholders' Equity 143,983 124,349 Total Liabilities and Shareholders' Equity $1,750,430 $1,500,946See Notes to the Consolidated Financial Statements.1 All share amounts have been restated to reflect the ten percent stock dividend paid December 14, 2017 to shareholders of record as of December 8, 2017.
97

FIRST GUARANTY BANCSHARES, INC. AND SUBSIDIARYCONSOLIDATED STATEMENTS OF INCOME
Years Ended December 31,2017 2016 2015
(in thousands, except share data)
Interest Income:Loans (including fees) $ 54,034 $ 45,495 $42,536Deposits with other banks 178 69 72Securities (including FHLB stock) 13,325 12,968 13,471Federal funds sold 9 - -Total Interest Income 67,546 58,532 56,079
Interest Expense:Demand deposits 5,526 2,633 1,419Savings deposits 201 80 38Time deposits 7,112 5,954 6,985Borrowings 1,554 1,473 166Total Interest Expense 14,393 10,140 8,608
Net Interest Income 53,153 48,392 47,471Less: Provision for loan losses 3,822 3,705 3,864Net Interest Income after Provision for Loan Losses 49,331 44,687 43,607
Noninterest Income:Service charges, commissions and fees 2,589 2,388 2,736ATM and debit card fees 1,986 1,859 1,779Net gains on securities 1,397 3,799 3,300Net gains on sale of loans 311 14 4 Other 2,057 1,395 1,137Total Noninterest Income 8,340 9,455 8,956
Noninterest Expense:Salaries and employee benefits 20,113 16,577 15,496Occupancy and equipment expense 4,505 4,242 3,845Other 13,903 12,066 11,754Total Noninterest Expense 38,521 32,885 31,095
Income Before Income Taxes 19,150 21,257 21,468Less: Provision for income taxes 7,399 7,164 6,963Net Income $ 11,751 $ 14,093 $ 14,505Preferred stock dividends - - (384)Income Available to Common Shareholders $ 11,751 $ 14,093 $ 14,121
Per Common Share1:Earnings $ 1.37 $ 1.68 $ 1.83Cash dividends paid $ 0.60 $ 0.58 $ 0.54
Weighted Average Common Shares Outstanding 8,608,088 8,369,424 7,714,620See Notes to Consolidated Financial Statements1 All share and per share amounts have been restated to reflect the ten percent stock dividend paid December 14, 2017 to shareholders of record as of December 8, 2017.
98 2017 ANNUAL REPORT FIRST GUARANTY BANCSHARES, INC.

FIRST GUARANTY BANCSHARES, INC. AND SUBSIDIARYCONSOLIDATED STATEMENTS OF COMPREHENSIVE INCOME (LOSS)
Years Ended December 31,2017 2016 2015
(in thousands)
Net Income $11,751 $14,093 $14,505Other comprehensive income (loss): Unrealized gains (losses) on securities: Unrealized holding gains (losses) arising during the period 5,098 (955) 1,394Reclassification adjustments for net gains included in net income (1,397) (3,799) (3,300) Reclassification of OTTI losses included in net income - 60 175Change in unrealized gains (losses) on securities 3,701 (4,694) (1,731)Tax impact (1,258) 1,596 589Other comprehensive income (loss) 2,443 (3,098) (1,142)Comprehensive Income $14,194 $10,995 $13,363See Notes to Consolidated Financial Statements
FIRST GUARANTY BANCSHARES, INC. AND SUBSIDIARYCONSOLIDATED STATEMENTS OF CHANGES IN SHAREHOLDERS' EQUITY
Series CPreferred
Stock$1,000 Par
CommonStock
$1 Par SurplusTreasury
StockRetainedEarnings
AccumulatedOther
ComprehensiveIncome/ (Loss) Total
(in thousands, except share data)
Balance December 31, 2014 (2) $39,435 $7,615 $69,311 $ (54) $23,035 $ 241 $139,583Net income - - - - 14,505 - 14,505Reclassification of treasury stock under the
LCBA (1)(2) - (4) (7) 54 (43) - -Other comprehensive income - - - - - (1,142) (1,142) Preferred stock redeemed, Series C (39,435) - - - - - (39,435)Common stock issued in initial public offering,
758,027 shares(2) - 758 11,696 - (3,110) - 9,344Cash dividends on common stock ($0.54 per
share)(2) - - - - (4,247) - (4,247) Preferred stock dividends - - - - (384) - (384)Balance December 31, 2015 $ - $ 8,369 $ 81,000 $ - $29,756 $ (901) $118,224Net income - - - - 14,093 - 14,093Other comprehensive income - - - - - (3,098) (3,098)Cash dividends on common stock ($0.58 per share)(2) - - - - (4,870) - (4,870)Balance December 31, 2016 $ - $ 8,369 $ 81,000 $ - $38,979 $ (3,999) $124,349Net income - - - - 11,751 - 11,751Common stock issued in acquisition, 437,751
shares(2) - 438 11,268 - (1,056) - 10,650Other comprehensive income - - - - - 2,443 2,443Cash dividends on common stock ($0.60 per
share)(2) - - - - (5,210) - (5,210) Balance December 31, 2017 $ - $ 8,807 $ 92,268 $ - $44,464 $(1,556) $143,983See Notes to Consolidated Financial Statements
(1) Effective January 1, 2015, companies incorporated under Louisiana law became subject to the Louisiana Business Corporation Act (which replaces the Louisiana Business Corporation Law). Provisions of the Louisiana Business Corporation Act eliminate the concept of treasury stock and provide that shares reacquired by a company are to be treated as authorized but unissued shares. As a result of this change in law, shares previously classified as treasury stock were reclassified as a reduction to issued shares of common stock in the consolidated financial statements as of June 30, 2015, reducing the stated value of common stock and retained earnings.(2) All share and per share amounts reflect the ten percent stock dividend paid December 14, 2017 to shareholders of record as of December 8, 2017.
99

FIRST GUARANTY BANCSHARES, INC. AND SUBSIDIARYCONSOLIDATED STATEMENTS OF CASH FLOWS
Years Ended December 31,2017 2016 2015
(in thousands)
Cash Flows From Operating Activities:Net income $ 11,751 $ 14,093 $ 14,505Adjustments to reconcile net income to net cash provided by operating activities:Provision for loan losses 3,822 3,705 3,864Depreciation and amortization 2,444 2,190 1,995Amortization/Accretion of investments 1,788 2,239 2,036Gain on sale/call of securities (1,397) (3,799) (3,300)Other than temporary impairment charge on securities - 60 175Gain on sale of assets (361) (76) (6)Repossessed asset writedowns and loss on disposition 103 243 411FHLB stock dividends (23) (6) (4)Net decrease in loans held for sale 347 - -Change in other assets and liabilities, net (6,199) 3,563 (2,461)Net Cash Provided by Operating Activities 12,275 22,212 17,215
Cash Flows From Investing Activities:Proceeds from maturities and calls of certificates of deposit - 1,001 9,250Proceeds from maturities and calls of HTM securities 11,703 85,875 72,036Proceeds from maturities, calls and sales of AFS securities 542,894 1,000,905 723,249Funds invested in HTM securities (30,530) (18,563) (48,318)Funds Invested in AFS securities (517,185) (1,024,632) (650,698)Proceeds from sale/redemption of Federal Home Loan Bank stock - - 3,554Funds invested in Federal Home Loan Bank stock - (875) (2,864)Net increase in loans (80,816) (109,467) (56,000)Purchases of premises and equipment (6,814) (4,109) (4,400)Proceeds from sales of premises and equipment 51 983 4Proceeds from sales of other real estate owned 608 1,098 1,394Cash paid in excess of cash received in acquisition (2,907) - -Net Cash (Used In) Provided By Investing Activities (82,996) (67,784) 47,207
Cash Flows From Financing Activities:Net increase (decrease) in deposits 95,879 30,311 (75,969)Net (decrease) increase in federal funds purchased and short-term borrowings (700) 4,700 -Proceeds from long-term borrowings, net of costs 3,750 - 24,969Repayment of long-term borrowings (3,081) (3,730) (600)Proceeds from junior subordinated debentures, net of costs - - 14,597Issuance of common stock, net of costs - - 9,344Redemption of preferred stock - - (39,435)Dividends paid (5,210) (4,870) (4,631)Net Cash Provided By (Used in) Financing Activities 90,638 26,411 (71,725)
Net Increase (Decrease In) Cash and Cash Equivalents 19,917 (19,161) (7,303) Cash and Cash Equivalents at the Beginning of the Period 18,111 37,272 44,575Cash and Cash Equivalents at the End of the Period $ 38,028 $ 18,111 $ 37,272
Noncash activities:Loans transferred to foreclosed assets $ 1,374 $ 123 $ 1,184Common stock issued in acquisition $ 10,650 $ - $ -
Cash paid during the period:Interest on deposits and borrowed funds $ 13,836 $ 9,916 $ 8,898Income taxes $ 10,700 $ 3,000 $ 8,400
See Notes to the Consolidated Financial Statements.
100 2017 ANNUAL REPORT FIRST GUARANTY BANCSHARES, INC.

NOTES TO CONSOLIDATED FINANCIAL STATEMENTSNote 1. Business and Summary of Significant Accounting Policies
Business
First Guaranty Bancshares, Inc. ("First Guaranty") is a Louisiana corporation headquartered in Hammond, LA. First Guaranty owns all of the outstanding shares of common stock of First Guaranty Bank. First Guaranty Bank (the “Bank”) is a Louisiana state-chartered commercial bank that provides a diversified range of financial services to consumers and businesses in the communities in which it operates. These services include consumer and commercial lending, mortgage loan origination, the issuance of credit cards and retail banking services. The Bank also maintains an investment portfolio comprised of government, government agency, corporate, and municipal securities. The Bank has twenty-seven banking offices, including one drive-up banking facility, and thirty-eight automated teller machines (ATMs) in Southeast Louisiana, Southwest Louisiana, North Louisiana and North Central Texas.
Summary of significant accounting policies
The accounting and reporting policies of First Guaranty conform to generally accepted accounting principles and to predominant accounting practices within the banking industry. The more significant accounting and reporting policies are as follows:
Consolidation
The consolidated financial statements include the accounts of First Guaranty Bancshares, Inc., and its wholly owned subsidiary, First Guaranty Bank. All significant intercompany balances and transactions have been eliminated in consolidation.
Acquisition Accounting
Acquisitions are accounted for under the purchase method of accounting. Purchased assets, including identifiable intangibles, and assumed liabilities are recorded at their respective acquisition date fair values. If the fair value of net assets purchased exceeds the consideration given, a gain on acquisition is recognized. If the consideration given exceeds the fair value of the net assets received, goodwill is recognized. Fair values are subject to refinement for up to one year after the closing date of an acquisition as information relative to closing date fair values becomes available. Purchased loans acquired in a business combination are recorded at estimated fair value on their purchase date with no carryover of the related allowance for loan losses. See Acquired Loans section below for accounting policy regarding loans acquired in a business combination.
Use of estimates
The preparation of financial statements in conformity with generally accepted accounting principles requires Management to make estimates and assumptions that affect the reported amounts of assets and liabilities and disclosure of contingent assets and liabilities at the dates of the financial statements and the reported amounts of revenue and expense during the reporting periods. Actual results could differ from those estimates. Material estimates that are particularly susceptible to significant change in the near-term relate to the determination of the allowance for loan losses, the valuation of real estate acquired in connection with foreclosures or in satisfaction of loans, and the valuation of investment securities. In connection with the determination of the allowance for loan losses and real estate owned, First Guaranty obtains independent appraisals for significant properties.
Cash and cash equivalentsFor purposes of reporting cash flows, cash and cash equivalents are defined as cash, due from banks, interest-bearing demand deposits with banks and federal funds sold with maturities of three months or less.
Securities
First Guaranty reviews its financial position, liquidity and future plans in evaluating the criteria for classifying investment securities. Debt securities that Management has the ability and intent to hold to maturity are classified as held to maturity and carried at cost, adjusted for amortization of premiums and accretion of discounts using methods approximating the interest method. Securities available for sale are stated at fair value. The unrealized difference, if any, between amortized cost and fair value of these AFS securities is excluded from income and is reported, net of deferred taxes, in accumulated other comprehensive income as a part of shareholders’ equity. Details of other comprehensive income are reported in the consolidated statements of comprehensive income. Realized gains and losses on securities are computed based on the specific identification method and are reported as a separate component of other income. Amortization of premiums and discounts is included in interest income. Discounts and premiums related to debt securities are amortized using the effective interest rate method.
Management evaluates securities for other-than-temporary impairment ("OTTI") at least on a quarterly basis, and more frequently when economic or market conditions warrant such an evaluation. In estimating other-than-temporary losses, management considers the length of time and extent that fair value has been less than cost and the financial condition and near term prospects of the issuer. Management also assesses whether it intends to sell, or it is more likely than not that it will be required to sell, a security in an unrealized loss position before recovery of its amortized cost basis. If either of the criteria regarding intent or requirement to sell is met, the entire difference between amortized cost and fair value is recognized as impairment through earnings. For debt securities that do not meet the aforementioned criteria, the amount of impairment is split into two components as follows: 1) OTTI related to credit loss, which must be recognized in the income statement and 2) OTTI related to other factors, which is recognized in other comprehensive income. The credit loss is defined as the difference between the present value of the cash flows expected to be collected and the amortized cost basis. For equity securities, the entire amount of impairment is recognized through earnings.
Loans held for sale
Mortgage loans originated and intended for sale in the secondary market are carried at the lower of cost or estimated fair value in the aggregate. Net unrealized losses, if any, are recognized through a valuation allowance by charges to income. Loans held for sale have primarily been fixed rate single-family residential mortgage loans under contract to be sold in the secondary market. In most cases, loans in this category are sold within thirty days. Buyers generally have recourse to return a purchased loan under limited circumstances. Recourse conditions may include early payment default, breach of representations or warranties and documentation deficiencies. Mortgage loans held for sale are generally sold with the mortgage servicing rights released. Gains or losses on sales of mortgage loans are recognized based on the differences between the selling price and the carrying value of the related mortgage loans sold.
Loans
Loans are stated at the principal amounts outstanding, net of unearned income and deferred loan fees. In addition to loans issued in the normal course of business, overdrafts on customer deposit accounts are considered to be loans and reclassified as such. Interest income on all classifications of loans is calculated using the simple interest method on daily balances of the principal amount outstanding.
101

Accrual of interest is discontinued on a loan when Management believes, after considering economic and business conditions and collection efforts, the borrower’s financial condition is such that reasonable doubt exists as to the full and timely collection of principal and interest. This evaluation is made for all loans that are 90 days or more contractually past due. When a loan is placed in nonaccrual status, all interest previously accrued but not collected is reversed against current period interest income. Income on such loans is then recognized only to the extent that cash is received and where the future collection of interest and principal is probable. Loans are returned to accrual status when, in the judgment of Management, all principal and interest amounts contractually due are reasonably assured to be collected within a reasonable time frame and when the borrower has demonstrated payment performance of cash or cash equivalents; generally for a period of six months. All loans, except mortgage loans, are considered past due if they are past due 30 days. Mortgage loans are considered past due when two consecutive payments have been missed. Loans that are past due 90-120 days and deemed uncollectible are charged-off. The loan charge off is a reduction of the allowance for loan losses.
Troubled Debt Restructurings (TDRs)
TDRs are loans in which the borrower is experiencing financial difficulty at the time of restructuring, and the Bank has granted a concession to the borrower. TDRs are undertaken in order to improve the likelihood of recovery on the loan and may take the form of modifications made with the stated interest rate lower than the current market rate for new debt with similar risk, other modifications to the structure of the loan that fall outside of normal underwriting policies and procedures, or in limited circumstances forgiveness of principal and / or interest. TDRs can involve loans remaining on non-accrual, moving to non-accrual, or continuing on accrual status, depending on the individual facts and circumstances of the borrower. TDRs are subject to policies governing accrual and non-accrual evaluation consistent with all other loans as discussed in the “Loans” section above. All loans with the TDR designation are considered to be impaired, even if they are accruing.
First Guaranty's policy is to evaluate TDRs that have subsequently been restructured and returned to market terms after 12 months of performance. The evaluation includes a review of the loan file and analysis of the credit to assess the loan terms, including interest rate to insure such terms are consistent with market terms. The loan terms are compared to a sampling of loans with similar terms and risk characteristics, including loans originated by First Guaranty and loans lost to a competitor. The sample provides a guide to determine market terms pursuant to ASC 310-40-50-2. The loan is also evaluated at that time for impairment. A loan determined to be restructured to market terms and not considered impaired will no longer be disclosed as a TDR in the years following the restructuring. These loans will continue to be individually evaluated for impairment. A loan determined to either be restructured to below market terms or to be impaired will remain a TDR.
Credit Quality
First Guaranty's credit quality indicators are pass, special mention, substandard, and doubtful.
Loans included in the pass category are performing loans with satisfactory debt coverage ratios, collateral, payment history, and documentation requirements.
Special mention loans have potential weaknesses that deserve close attention. If left uncorrected, these potential weaknesses may result in deterioration of the repayment prospects. Borrowers may be experiencing adverse operating trends (declining revenues or margins) or an ill proportioned balance sheet (e.g., increasing inventory without
an increase in sales, high leverage, tight liquidity). Adverse economic or market conditions, such as interest rate increases or the entry of a new competitor, may also support a special mention rating. Nonfinancial reasons include management problems, pending litigation, an ineffective loan agreement or other material structural weakness, and any other significant deviation from prudent lending practices.
A substandard loan is inadequately protected by the paying capacity of the obligor or of the collateral pledged, if any. Loans classified as substandard have a well-defined weakness. They are characterized by the distinct possibility that First Guaranty will sustain some loss if the deficiencies are not corrected. These loans require more intensive supervision. Substandard loans are generally characterized by current or expected unprofitable operations, inadequate debt service coverage, inadequate liquidity, or marginal capitalization. Repayment may depend on collateral or other credit risk mitigates. For some substandard loans, the likelihood of full collection of interest and principal may be in doubt and interest is no longer accrued. Consumer loans that are 90 days or more past due or that are nonaccrual are considered substandard.
Doubtful loans have the weaknesses of substandard loans with the additional characteristic that the weaknesses make collection or liquidation in full questionable and there is a high probability of loss based on currently existing facts, conditions and values.
A loan is considered impaired when, based on current information and events, it is probable that First Guaranty will be unable to collect the scheduled payments of principal or interest when due according to the contractual terms of the loan agreement. Factors considered by Management in determining impairment include payment status, collateral value and the probability of collecting scheduled principal and interest payments when due. Loans that experience insignificant payment delays and payment shortfalls generally are not classified as impaired. Management determines the significance of payment delays and payment shortfalls on a case-by-case basis, taking into consideration all of the circumstances surrounding the loan and the borrower, including the length of the delay, the reasons for the delay, the borrower’s prior payment record and the amount of the shortfall in relation to the principal and interest owed. Impairment is measured on a loan-by-loan basis for commercial and construction loans by either the present value of expected future cash flows discounted at the loan’s effective interest rate, the loan’s obtainable market price or the fair value of the collateral if the loan is collateral dependent. This process is only applied to impaired loans or relationships in excess of $500,000. Large groups of smaller balance homogeneous loans are collectively evaluated for impairment. Accordingly, individual consumer and residential loans are not separately identified for impairment disclosures, unless such loans are the subject of a restructuring agreement. Loans that have been restructured in a troubled debt restructuring will continue to be evaluated individually for impairment, including those no longer requiring disclosure.
Acquired Loans
Loans are recorded at estimated fair value on their purchase date with no carryover of the related allowance for loan losses. Acquired loans are segregated between those with deteriorated credit quality at acquisition and those deemed as performing. To make this determination, Management considers such factors as past due status, nonaccrual status, credit risk ratings, interest rates and collateral position. The fair value of acquired loans deemed performing is determined by discounting cash flows, both principal and interest, for each pool at prevailing market interest rates as well as consideration of inherent potential losses. The difference between the fair value and principal balances due at acquisition date, the fair value discount, is accreted into income over the estimated life of each loan pool.
102 2017 ANNUAL REPORT FIRST GUARANTY BANCSHARES, INC.

Loans acquired in a business combination are recorded at their estimated fair value on their purchase date with no carryover of the related allowance for loan losses. Performing acquired loans are subsequently evaluated for any required allowance at each reporting date. An allowance for loan losses is calculated using a similar methodology for originated loans.
Loan fees and costs
Nonrefundable loan origination and commitment fees and direct costs associated with originating loans are deferred and recognized over the lives of the related loans as an adjustment to the loans' yield using the level yield method.
Allowance for Loan Losses
The allowance for loan losses is established through a provision for loan losses charged to expense. Loans are charged against the allowance for loan losses when Management believes that the collectability of the principal is unlikely. The allowance, which is based on evaluation of the collectability of loans and prior loan loss experience, is an amount that, in the opinion of Management, reflects the risks inherent in the existing loan portfolio and exists at the reporting date. The evaluations take into consideration a number of subjective factors including changes in the nature and volume of the loan portfolio, historical losses, overall portfolio quality, review of specific problem loans, current economic conditions that may affect a borrower’s ability to pay, adequacy of loan collateral and other relevant factors. In addition, regulatory agencies, as an integral part of their examination process, periodically review the estimated losses on loans. Such agencies may require additional recognition of losses based on their judgments about information available to them at the time of their examination.
The following are general credit risk factors that affect First Guaranty's loan portfolio segments. These factors do not encompass all risks associated with each loan category. Construction and land development loans have risks associated with interim construction prior to permanent financing and repayment risks due to the future sale of developed property. Farmland and agricultural loans have risks such as weather, government agricultural policies, fuel and fertilizer costs, and market price volatility. 1-4 family, multi-family, and consumer credits are strongly influenced by employment levels, consumer debt loads and the general economy. Non-farm non-residential loans include both owner occupied real estate and non-owner occupied real estate. Common risks associated with these properties is the ability to maintain tenant leases and keep lease income at a level able to service required debt and operating expenses. Commercial and industrial loans generally have non-real estate secured collateral which requires closer monitoring than real estate collateral.
Although Management uses available information to recognize losses on loans, because of uncertainties associated with local economic conditions, collateral values and future cash flows on impaired loans, it is reasonably possible that a material change could occur in the allowance for loan losses in the near term. However, the amount of the change that is reasonably possible cannot be estimated. The evaluation of the adequacy of loan collateral is often based upon estimates and appraisals. Because of changing economic conditions, the valuations determined from such estimates and appraisals may also change. Accordingly, First Guaranty may ultimately incur losses that vary from Management's current estimates. Adjustments to the allowance for loan losses will be reported in the period such adjustments become known or can be reasonably estimated. All loan losses are charged to the allowance for loan losses when the loss actually occurs or when the collectability of the principal is unlikely. Recoveries are credited to the allowance at the time of recovery.
The allowance consists of specific, general, and unallocated components. The specific component relates to loans that are classified as doubtful, substandard, and impaired. For such loans that are also classified as impaired, an allowance is established when the discounted cash flows (or collateral value or observable market price) of the impaired loan is lower than the carrying value of that loan. Also, a specific reserve is allocated for syndicated loans. The general component covers non-classified loans and special mention loans and is based on historical loss experience adjusted for qualitative factors. An unallocated component is maintained to cover uncertainties that could affect the estimate of probable losses.
The allowance for loan losses is reviewed on a monthly basis. The monitoring of credit risk also extends to unfunded credit commitments, such as unused commercial credit lines and letters of credit. A reserve is established as needed for estimates of probable losses on such commitments.
Goodwill and Intangible Assets
Goodwill and intangible assets deemed to have indefinite lives are subject to annual impairment tests. First Guaranty's goodwill is tested for impairment on an annual basis, or more often if events or circumstances indicate that there may be impairment. Adverse changes in the economic environment, declining operations, or other factors could result in a decline in the implied fair value of goodwill. If the implied fair value is less than the carrying amount, a loss would be recognized in other non-interest expense to reduce the carrying amount to implied fair value of goodwill. The goodwill impairment test includes two steps that are preceded by a, “step zero”, qualitative test. The qualitative test allows Management to assess whether qualitative factors indicate that it is more likely than not that impairment exists. If it is not more likely than not that impairment exists, then no impairment exists and the two step quantitative test would not be necessary. These qualitative indicators include factors such as earnings, share price, market conditions, etc. If the qualitative factors indicate that it is more likely than not that impairment exists, then the two step quantitative test would be necessary. Step one is used to identify potential impairment and compares the estimated fair value of a reporting unit with its carrying amount, including goodwill. If the estimated fair value of a reporting unit exceeds its carrying amount, goodwill of the reporting unit is not considered impaired. If the carrying amount of a reporting unit exceeds its estimated fair value, the second step of the goodwill impairment test is performed to measure the amount of impairment loss, if any. Step two of the goodwill impairment test compares the implied estimated fair value of reporting unit goodwill with the carrying amount of that goodwill. If the carrying amount of goodwill for that reporting unit exceeds the implied fair value of that unit’s goodwill, an impairment loss is recognized in an amount equal to that excess.
Identifiable intangible assets are acquired assets that lack physical substance but can be distinguished from goodwill because of contractual or legal rights or because the assets are capable of being sold or exchanged either on their own or in combination with the related contract, asset or liability. First Guaranty's intangible assets primarily relate to core deposits. These core deposit intangibles are amortized on a straight-line basis over terms ranging from seven to fifteen years. Management periodically evaluates whether events or circumstances have occurred that impair this deposit intangible.
103
Premises and equipment
Premises and equipment are stated at cost, less accumulated depreciation. Depreciation is computed for financial reporting purposes using the straight-line method over the estimated useful lives of the respective assets as follows:
Buildings and improvements 10-40 years
Equipment, fixtures and automobiles 3-10 years
Expenditures for renewals and betterments are capitalized and depreciated over their estimated useful lives. Repairs, maintenance and minor improvements are charged to operating expense as incurred. Gains or losses on disposition, if any, are recorded as a separate line item in noninterest income on the Statements of Income.
Other real estate
Other real estate includes properties acquired through foreclosure or acceptance of deeds in lieu of foreclosure. These properties are recorded at the lower of the recorded investment in the property or its fair value less the estimated cost of disposition. Any valuation adjustments required prior to foreclosure are charged to the allowance for loan losses. Subsequent to foreclosure, losses on the periodic revaluation of the property are charged to current period earnings as other real estate expense. Costs of operating and maintaining the properties are charged to other real estate expense as incurred. Any subsequent gains or losses on dispositions are credited or charged to income in the period of disposition.
Off-balance sheet financial instruments
In the ordinary course of business, First Guaranty has entered into commitments to extend credit, including commitments under credit card arrangements, commitments to fund commercial real estate, construction and land development loans secured by real estate, and performance standby letters of credit. Such financial instruments are recorded when they are funded.
Income taxes
First Guaranty and its subsidiary file a consolidated federal income tax return on a calendar year basis. In lieu of Louisiana state income tax, the Bank is subject to the Louisiana bank shares tax, which is included in noninterest expense in First Guaranty's consolidated financial statements. With few exceptions, First Guaranty is no longer subject to U.S. federal, state or local income tax examinations for years before 2014. Deferred tax assets and liabilities are recognized for the future tax consequences attributable to differences between the financial statement carrying amounts of existing assets and liabilities and their respective tax basis. Deferred tax assets and liabilities are measured using enacted tax rates expected to apply to taxable income in the years in which the deferred tax assets or liabilities are expected to be settled or realized. Valuation allowances are established when necessary to reduce deferred tax assets to the amount expected to be utilized.
Comprehensive income
Accounting principles generally require that recognized revenue, expenses, gains and losses be included in net income. Although certain changes in assets and liabilities, such as unrealized gains and losses on available for sale securities, are reported as a separate component of the equity section of the balance sheet, such items along with net income, are components of comprehensive income. The components of other comprehensive income and related tax effects are presented in the Statements of Comprehensive Income.
Fair Value Measurements
The fair value of a financial instrument is the current amount that would be received to sell an asset or paid to transfer a liability in an orderly transaction between market participants. A fair value measurement assumes that the transaction to sell the asset or transfer the liability occurs in the principal market for the asset or liability or, in the absence of a principal market, the most advantageous market for the asset or liability. Valuation techniques use certain inputs to arrive at fair value. Inputs to valuation techniques are the assumptions that market participants would use in pricing the asset or liability. They may be observable or unobservable. First Guaranty uses a fair value hierarchy for valuation inputs that gives the highest priority to quoted prices in active markets for identical assets or liabilities and the lowest priority to unobservable inputs. See Note 20 for a detailed description of fair value measurements.
Transfers of Financial Assets
Transfers of financial assets are accounted for as sales, when control over the assets has been surrendered. Control over transferred assets is deemed to be surrendered when (i) the assets have been isolated from First Guaranty, (ii) the transferee obtains the right (free of conditions that constrain it from taking advantage of that right) to pledge or exchange the transferred assets, and (iii) First Guaranty does not maintain effective control over the transferred assets through an agreement to repurchase them before their maturity.
Earnings per common share
Earnings per share represents income available to common shareholders divided by the weighted average number of common shares outstanding during the period. In December of 2017, First Guaranty issued a pro rata, 10% common stock dividend. The shares issued for the stock dividend have been retrospectively factored into the calculation of earnings per share as well as cash dividends paid on common stock and represented on the face of the financial statements. No convertible shares of First Guaranty's stock are outstanding.
Operating Segments
All of First Guaranty's operations are considered by management to be aggregated into one reportable operating segment. While the chief decision-makers monitor the revenue streams of the various products and services, the identifiable segments are not material. Operations are managed and financial performance is evaluated on a Company-wide basis.
Reclassifications
Certain reclassifications have been made to prior year end financial statements in order to conform to the classification adopted for reporting in 2017.
Note 2. Recent Accounting PronouncementsIn February 2016, the FASB issued ASU 2016-02, "Leases: Conforming Amendments Related to Leases". This ASU amends the codification regarding leases in order to increase transparency and comparability. The ASU requires companies to recognize lease assets and liabilities on the balance sheet and disclose key information about leasing arrangements. A lessee would recognize a liability to make lease payments and a right-of-use asset representing its right to use the leased asset for the lease term. The ASU is effective for annual and interim periods beginning after December 15, 2018. The adoption of this ASU is not expected to have a material effect on First Guaranty's Consolidated Financial Statements.
In June 2016, the FASB issued ASU 2016-13, "Financial Instruments- Credit Losses: Measurement of Credit Losses on Financial Instruments". This ASU amends guidance on reporting credit losses for assets held at amortized cost basis and available for sale debt securities. The ASU amendments require the measurement of all expected credit losses
104 2017 ANNUAL REPORT FIRST GUARANTY BANCSHARES, INC.
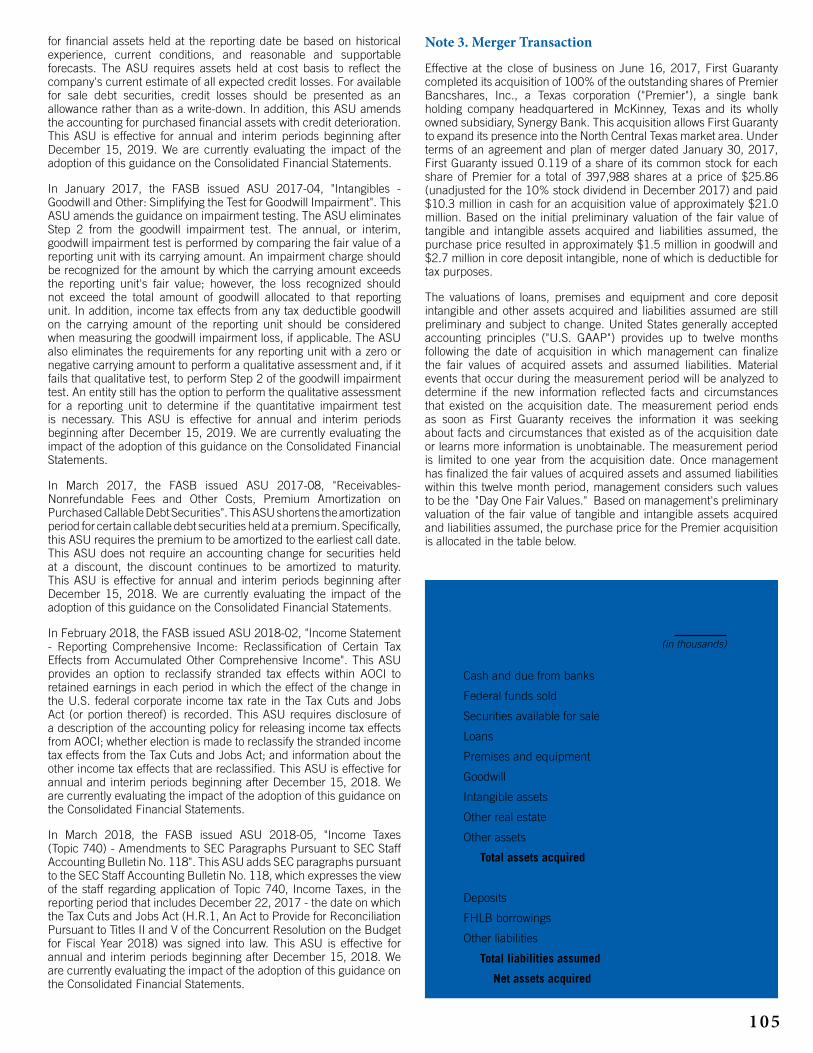
for financial assets held at the reporting date be based on historical experience, current conditions, and reasonable and supportable forecasts. The ASU requires assets held at cost basis to reflect the company's current estimate of all expected credit losses. For available for sale debt securities, credit losses should be presented as an allowance rather than as a write-down. In addition, this ASU amends the accounting for purchased financial assets with credit deterioration. This ASU is effective for annual and interim periods beginning after December 15, 2019. We are currently evaluating the impact of the adoption of this guidance on the Consolidated Financial Statements.
In January 2017, the FASB issued ASU 2017-04, "Intangibles - Goodwill and Other: Simplifying the Test for Goodwill Impairment". This ASU amends the guidance on impairment testing. The ASU eliminates Step 2 from the goodwill impairment test. The annual, or interim, goodwill impairment test is performed by comparing the fair value of a reporting unit with its carrying amount. An impairment charge should be recognized for the amount by which the carrying amount exceeds the reporting unit's fair value; however, the loss recognized should not exceed the total amount of goodwill allocated to that reporting unit. In addition, income tax effects from any tax deductible goodwill on the carrying amount of the reporting unit should be considered when measuring the goodwill impairment loss, if applicable. The ASU also eliminates the requirements for any reporting unit with a zero or negative carrying amount to perform a qualitative assessment and, if it fails that qualitative test, to perform Step 2 of the goodwill impairment test. An entity still has the option to perform the qualitative assessment for a reporting unit to determine if the quantitative impairment test is necessary. This ASU is effective for annual and interim periods beginning after December 15, 2019. We are currently evaluating the impact of the adoption of this guidance on the Consolidated Financial Statements.
In March 2017, the FASB issued ASU 2017-08, "Receivables- Nonrefundable Fees and Other Costs, Premium Amortization on Purchased Callable Debt Securities". This ASU shortens the amortization period for certain callable debt securities held at a premium. Specifically, this ASU requires the premium to be amortized to the earliest call date. This ASU does not require an accounting change for securities held at a discount, the discount continues to be amortized to maturity. This ASU is effective for annual and interim periods beginning after December 15, 2018. We are currently evaluating the impact of the adoption of this guidance on the Consolidated Financial Statements.
In February 2018, the FASB issued ASU 2018-02, "Income Statement - Reporting Comprehensive Income: Reclassification of Certain Tax Effects from Accumulated Other Comprehensive Income". This ASU provides an option to reclassify stranded tax effects within AOCI to retained earnings in each period in which the effect of the change in the U.S. federal corporate income tax rate in the Tax Cuts and Jobs Act (or portion thereof) is recorded. This ASU requires disclosure of a description of the accounting policy for releasing income tax effects from AOCI; whether election is made to reclassify the stranded income tax effects from the Tax Cuts and Jobs Act; and information about the other income tax effects that are reclassified. This ASU is effective for annual and interim periods beginning after December 15, 2018. We are currently evaluating the impact of the adoption of this guidance on the Consolidated Financial Statements.
In March 2018, the FASB issued ASU 2018-05, "Income Taxes (Topic 740) - Amendments to SEC Paragraphs Pursuant to SEC Staff Accounting Bulletin No. 118". This ASU adds SEC paragraphs pursuant to the SEC Staff Accounting Bulletin No. 118, which expresses the view of the staff regarding application of Topic 740, Income Taxes, in the reporting period that includes December 22, 2017 - the date on which the Tax Cuts and Jobs Act (H.R.1, An Act to Provide for Reconciliation Pursuant to Titles II and V of the Concurrent Resolution on the Budget for Fiscal Year 2018) was signed into law. This ASU is effective for annual and interim periods beginning after December 15, 2018. We are currently evaluating the impact of the adoption of this guidance on the Consolidated Financial Statements.
Note 3. Merger Transaction
Effective at the close of business on June 16, 2017, First Guaranty completed its acquisition of 100% of the outstanding shares of Premier Bancshares, Inc., a Texas corporation ("Premier"), a single bank holding company headquartered in McKinney, Texas and its wholly owned subsidiary, Synergy Bank. This acquisition allows First Guaranty to expand its presence into the North Central Texas market area. Under terms of an agreement and plan of merger dated January 30, 2017, First Guaranty issued 0.119 of a share of its common stock for each share of Premier for a total of 397,988 shares at a price of $25.86 (unadjusted for the 10% stock dividend in December 2017) and paid $10.3 million in cash for an acquisition value of approximately $21.0 million. Based on the initial preliminary valuation of the fair value of tangible and intangible assets acquired and liabilities assumed, the purchase price resulted in approximately $1.5 million in goodwill and $2.7 million in core deposit intangible, none of which is deductible for tax purposes.
The valuations of loans, premises and equipment and core deposit intangible and other assets acquired and liabilities assumed are still preliminary and subject to change. United States generally accepted accounting principles ("U.S. GAAP") provides up to twelve months following the date of acquisition in which management can finalize the fair values of acquired assets and assumed liabilities. Material events that occur during the measurement period will be analyzed to determine if the new information reflected facts and circumstances that existed on the acquisition date. The measurement period ends as soon as First Guaranty receives the information it was seeking about facts and circumstances that existed as of the acquisition date or learns more information is unobtainable. The measurement period is limited to one year from the acquisition date. Once management has finalized the fair values of acquired assets and assumed liabilities within this twelve month period, management considers such values to be the "Day One Fair Values." Based on management's preliminary valuation of the fair value of tangible and intangible assets acquired and liabilities assumed, the purchase price for the Premier acquisition is allocated in the table below.
Premier Bancshares,
Inc.
(in thousands)
Cash and due from banks $ 4,542
Federal funds sold 2,855
Securities available for sale 5,892
Loans 128,018
Premises and equipment 9,493
Goodwill 1,474
Intangible assets 3,809
Other real estate 221
Other assets 2,009
Total assets acquired $ 158,313
Deposits 127,228
FHLB borrowings 9,700
Other liabilities 431
Total liabilities assumed $ 137,359
Net assets acquired $ 20,954
105

December 31, 2017 December 31, 2016
Amortized Cost
Gross Unrealized
Gains
Gross Unrealized
Losses Fair ValueAmortized
Cost
Gross Unrealized
Gains
Gross Unrealized
Losses Fair Value
(in thousands)
Available for sale:
U.S Treasuries $ 19,490 $ - $ (4) $ 19,486 $ 29,994 $ - $ - $ 29,994
U.S. Government Agencies 200,052 - (4,069) 195,983 183,152 - (4,820) 178,332
Corporate debt securities 91,770 661 (946) 91,485 132,448 1,624 (2,100) 131,972
Mutual funds or other equity securities 500 - (7) 493 580 - (7) 573
Municipal bonds 37,210 2,434 (75) 39,569 28,177 100 (320) 27,957
Collateralized mortgage obligations 1,191 - (6) 1,185 - - - -
Mortgage-backed securities 33,680 - (346) 33,334 29,181 - (536) 28,645
Total available for sale securities $ 383,893 $ 3,095 $ (5,453) $381,535 $ 403,532 $1,724 $(7,783) $397,473
Held to maturity:
U.S. Government Agencies $ 28,169 $ - $ (670) $ 27,499 $ 18,167 $ - $ (655) $ 17,512
Municipal bonds 5,322 15 (12) 5,325 - - - -
Mortgage-backed securities 86,630 6 (903) 85,733 83,696 - (1,302) 82,394
Total held to maturity securities $120,121 $ 21 $(1,585) $118,557 $101,863 $ - $(1,957) $99,906
The fair value of net assets acquired includes fair value adjustments to certain receivables that were not considered impaired as of the acquisition date. The non-impaired loans excluded from the purchase credit impairment requirements under ASC 310-30 were recorded at an estimated fair value of $123.7 million and had gross contractual amounts receivable of $122.9 million on the date of acquisition. Contractual cash flows not expected to be collected are estimated at $0.5 million.
The following pro forma information for the twelve months ended December 31, 2017 and December 31, 2016 reflects First Guaranty's estimated consolidated results of operations as if the acquisition of Premier occurred at January 1, 2016, unadjusted for potential cost savings.
Note 4. Cash and Due from BanksCertain reserves are required to be maintained at the Federal Reserve Bank. There was no reserve requirement as of December 31, 2017 and 2016. At December 31, 2017 First Guaranty had only one account at correspondent banks, excluding the Federal Reserve Bank, that
exceeded the FDIC insurable limit of $250,000. This account was over the insurable limit by $0.6 million. At December 31, 2016 First Guaranty had only one account at correspondent banks, excluding the Federal Reserve Bank, that exceeded the FDIC insurable limit of $250,000. This account was over the insurable limit by $4,000.
2017 2016
(in thousands, except share data)
Net Interest Income $ 55,663 $53,190
Noninterest Income 8,540 11,541
Noninterest Expense 42,434 39,395
Net Income 10,885 13,709
Earnings per common share $ 1.24 $ 1.56
Note 5. SecuritiesA summary comparison of securities by type at December 31, 2017 and 2016 is shown below.
106 2017 ANNUAL REPORT FIRST GUARANTY BANCSHARES, INC.
The scheduled maturities of securities at December 31, 2017, by contractual maturity, are shown below. Actual maturities may differ from contractual maturities due to call or prepayments. Mortgage-backed securities are not due at a single maturity because of amortization and potential prepayment of the underlying mortgages. For this reason they are presented separately in the maturity table below.
The following is a summary of the fair value of securities with gross unrealized losses and an aging of those gross unrealized losses as of the dates indicated:
December 31, 2017
Amortized Cost Fair Value
(in thousands )
Available for sale:
Due in one year or less $ 29,215 $ 29,233
Due after one year through five years 76,969 76,922
Due after five years through 10 years 217,238 214,769
Over 10 years 25,600 26,092
Subtotal 349,022 347,016
Collateralized mortgage obligations 1,191 1,185
Mortgage-backed Securities 33,680 33,334
Total available for sale securities $383,893 $381,535
Held to maturity:
Due in one year or less $ - $ -
Due after one year through five years 5,124 5,057
Due after five years through 10 years 18,485 17,907
Over 10 years 9,882 9,860
Subtotal 33,491 32,824
Mortgage-backed Securities 86,630 85,733
Total held to maturity securities $120,121 $ 118,557
At December 31, 2017
Less Than 12 Months 12 Months or More Total
Number of Securities Fair Value
Gross Unrealized
LossesNumber of Securities Fair Value
Gross Unrealized
LossesNumber of Securities Fair Value
Gross Unrealized
Losses
(in thousands)
Available for sale:
U.S. Treasuries 6 $ 19,486 (4) - $ - $ - 6 $ 19,486 $ (4)
U.S. Government agencies 30 62,991 (519) 36 132,992 (3,550) 66 195,983 (4,069)
Corporate debt securities 56 19,050 (240) 70 22,818 (706) 126 41,868 (946)
Mutual funds or other equity securities 1 493 (7) - - - 1 493 (7)
Municipal bonds 9 4,431 (36) 1 1,079 (39) 10 5,510 (75)
Collateralized mortgage obligations 4 936 (6) - - - 4 936 (6)
Mortgage-backed securities 26 14,737 (73) 11 18,313 (273) 37 33,050 (346)
Total available for sale securities 132 $ 122,124 $ (885) 118 $175,202 $ (4,568) 250 $ 297,326 $ (5,453)
Held to maturity:
U.S. Government agencies 4 $ 9,925 $ (75) 10 $ 17,574 $ (595) 14 $ 27,499 (670)
Municipal bonds 6 3,191 (12) - - - 6 3,191 (12)
Mortgage-backed securities 35 54,186 (515) 17 26,852 (388) 52 81,038 (903)
Total held to maturity securities 45 $ 67,302 $ (602) 27 $ 44,426 $ (983) 72 $ 111,728 $ (1,585)
107

During the years ended December 31, 2017, 2016, and 2015, First Guaranty recorded OTTI losses on available for sale securities as follows:
There were $0, $0.1 million, and $0.2 million other-than-temporary impairment losses recognized on securities in 2017, 2016 and 2015, respectively.
As of December 31, 2017, 322 of First Guaranty's debt securities had unrealized losses totaling 1.7% of the individual securities’ amortized cost basis and 1.4% of First Guaranty's total amortized cost basis of the investment securities portfolio. 145 of the 322 securities had been in a continuous loss position for over 12 months at such date. The 145 securities had an aggregate amortized cost basis of $225.2 million and an unrealized loss of $5.6 million at December 31, 2017. Management has the intent and ability to hold these debt securities until maturity or until anticipated recovery.
Securities are evaluated for other-than-temporary impairment at least quarterly and more frequently when economic or market conditions warrant such evaluation. Consideration is given to (i) the length of time and the extent to which the fair value has been less than cost, (ii) the financial condition and near-term prospects of the issuer, (iii) the recovery of contractual principal and interest and (iv) the intent and ability of First Guaranty to retain its investment in the issuer for a period of time sufficient to allow for any anticipated recovery in fair value.
Investment securities issued by the U.S. Government and Government sponsored enterprises with unrealized losses and the amount of unrealized losses on those investment securities that are the result of changes in market interest rates will not be other-than-temporarily impaired. First Guaranty has the ability and intent to hold these securities until recovery, which may not be until maturity.
Corporate debt securities in a loss position consist primarily of corporate bonds issued by businesses in the financial, insurance, utility, manufacturing, industrial, consumer products and oil and gas industries. Two issuers have other-than-temporary impairment losses at December 31, 2017. First Guaranty believes that the remaining issuers will be able to fulfill the obligations of these securities based on evaluations described above. First Guaranty has the ability and intent to hold these securities until they recover, which could be at their maturity dates.
At December 31, 2016
Less Than 12 Months 12 Months or More Total
Number of Securities Fair Value
Gross Unrealized
LossesNumber of Securities Fair Value
Gross Unrealized
LossesNumber of Securities Fair Value
Gross Unrealized
Losses
(in thousands)
Available for sale:
U.S. Treasuries 3 $ 10,997 $ - - $ - $ - 3 $ 10,997 $ -
U.S. Government agencies 54 178,331 (4,820) - - - 54 178,331 (4,820)
Corporate debt securities 185 61,669 (1,613) 26 6,440 (487) 211 68,109 (2,100)
Mutual funds or other equity securities 1 493 (7) - - - 1 493 (7)
Municipal bonds 14 10,210 (320) - - - 14 10,210 (320)
Mortgage-backed securities 16 28,645 (536) - - - 16 28,645 (536)
Total available for sale securities 273 $ 290,345 $ (7,296) 26 $ 6,440 $ (487) 299 $ 296,785 $ (7,783)
Held to maturity:
U.S. Government agencies 10 $ 17,512 $ (655) - $ - $ - 10 $ 17,512 $ (655)
Mortgage-backed securities 48 82,394 (1,302) - - - 48 82,394 (1,302)
Total held to maturity securities 58 $ 99,906 $ (1,957) - $ - $ - 58 $ 99,906 $ (1,957)
Year Ended December 31,
2017
Year Ended December 31,
2016
Year Ended December 31,
2015
(in thousands)
Total OTTI charge realized and unrealized $ - $66 $571
OTTI recognized in other comprehensive income (non-credit component) - 6 396
Net impairment losses recognized in earnings (credit component) $ - $60 $175
108 2017 ANNUAL REPORT FIRST GUARANTY BANCSHARES, INC.

Year Ended December 31,
2017
Year Ended December 31,
2016
Year Ended December 31,
2015
(in thousands)
Beginning balance of credit losses at beginning of year $ 60 $175 $ -
Other-than-temporary impairment credit losses on securities not previously OTTI - 60 175
Increases for additional credit losses on securities previously determined to be OTTI - - -
Reduction for increases in cash flows - - -
Reduction due to credit impaired securities sold or fully settled - (175) -
Ending balance of cumulative credit losses recognized in earnings at end of year $ 60 $ 60 $175
In 2017 there were no other-than-temporary impairment credit losses on securities for which First Guaranty had previously recognized OTTI. For securities that have indications of credit related impairment, management analyzes future expected cash flows to determine if any credit related impairment is evident. Estimated cash flows are determined using management's best estimate of future cash flows based on specific assumptions. The assumptions used to determine the cash flows were based on estimates of loss severity and credit default probabilities. Management reviews reports from credit rating agencies and public filings of issuers.
In 2016 there were no other-than-temporary impairment credit losses on securities for which First Guaranty had previously recognized OTTI. The amount related to losses on securities with no previous losses amounted to $0.1 million at December 31, 2016. For securities that have indications of credit related impairment, management analyzes future expected cash flows to determine if any credit related impairment is evident. Estimated cash flows are determined using management's best estimate of future cash flows based on specific assumptions. The assumptions used to determine the cash flows were based on estimates of loss severity and credit default probabilities. Management reviews reports from credit rating agencies and public filings of issuers. The credit related impairment was related to one corporate debt security with a book balance of $0.1 million that experienced declines in its financial performance associated with the utilities industry. This corporate debt security had a non-credit related impairment of approximately $6,000.
In 2015 there were no other-than-temporary impairment credit losses on securities for which First Guaranty had previously recognized
OTTI. The amount related to losses on securities with no previous losses amounted to $0.2 million at December 31, 2015. The credit related impairment was related to one corporate debt security with a book balance of $0.5 million that experienced declines in its financial performance associated with the mining industry. This corporate debt security had a non-credit related impairment of $0.3 million. This security was sold in 2016. A second corporate debt security had a non-credit related impairment of $0.1 million due to the fact that the issuer went private and liquidity in its debt securities was reduced. Management anticipates receipt of all scheduled cash flows for this security.
Non-credit related other-than-temporary impairment losses recognized in other comprehensive income totaled zero in 2017, $6,000 in 2016, and $0.4 million in 2015. The impairment losses in 2016 were related to one available for sale corporate bond security, described above, which had original amortized cost of $0.1 million. The impairment losses in 2015 were related to two available for sale corporate bond securities, described above, which had original amortized cost of $0.8 million.
At December 31, 2017 and 2016 the carrying value of pledged securities totaled $412.2 million and $368.2 million, respectively.
First Guaranty completed its liquidation of the common stock from a converted preferred security in the third quarter of 2015. The total gains realized on the security were $2.7 million. Gross realized gains on sales of securities were $1.4 million, $3.6 million and $3.3 million (including the sale of the converted preferred security) for the years ended December 31, 2017, 2016 and 2015, respectively. Gross realized losses were $0.1 million, $53,000 and $0.4 million for the years ended December 31, 2017, 2016 and 2015. The tax applicable to these transactions amounted to $0.5 million, $1.3 million, and $1.2 million for 2017, 2016 and 2015, respectively. Proceeds from sales of securities classified as available for sale amounted to $148.0 million, $191.0 million and $290.0 million for the years ended December 31, 2017, 2016 and 2015, respectively.
Net unrealized losses on available for sale securities included in accumulated other comprehensive income (loss) ("AOCI"), net of applicable income taxes, totaled $1.6 million at December 31, 2017. At December 31, 2016 net unrealized losses included in AOCI, net of applicable income taxes, totaled $4.0 million. During 2017 and 2016 net gains, net of tax, reclassified out of AOCI into earnings totaled $0.9 million and $2.5 million, respectively.
The following table presents a roll-forward of the amount of credit losses on debt securities held by First Guaranty for which a portion of OTTI was recognized in other comprehensive income for the year ended December 31, 2017, 2016, and 2015:
At December 31, 2017, First Guaranty's exposure to investment securities issuers that exceeded 10% of shareholders’ equity as follows:
At December 31, 2017
Amortized Cost Fair Value
(in thousands)
U.S. Treasuries $ 19,490 $ 19,486
Federal Home Loan Bank (FHLB) 50,395 49,403
Federal Home Loan Mortgage Corporation (Freddie Mac-FHLMC) 57,569 57,008
Federal National Mortgage Association (Fannie Mae-FNMA) 103,644 101,757
Federal Farm Credit Bank (FFCB) 136,923 134,381
Total $368,021 $362,035
109
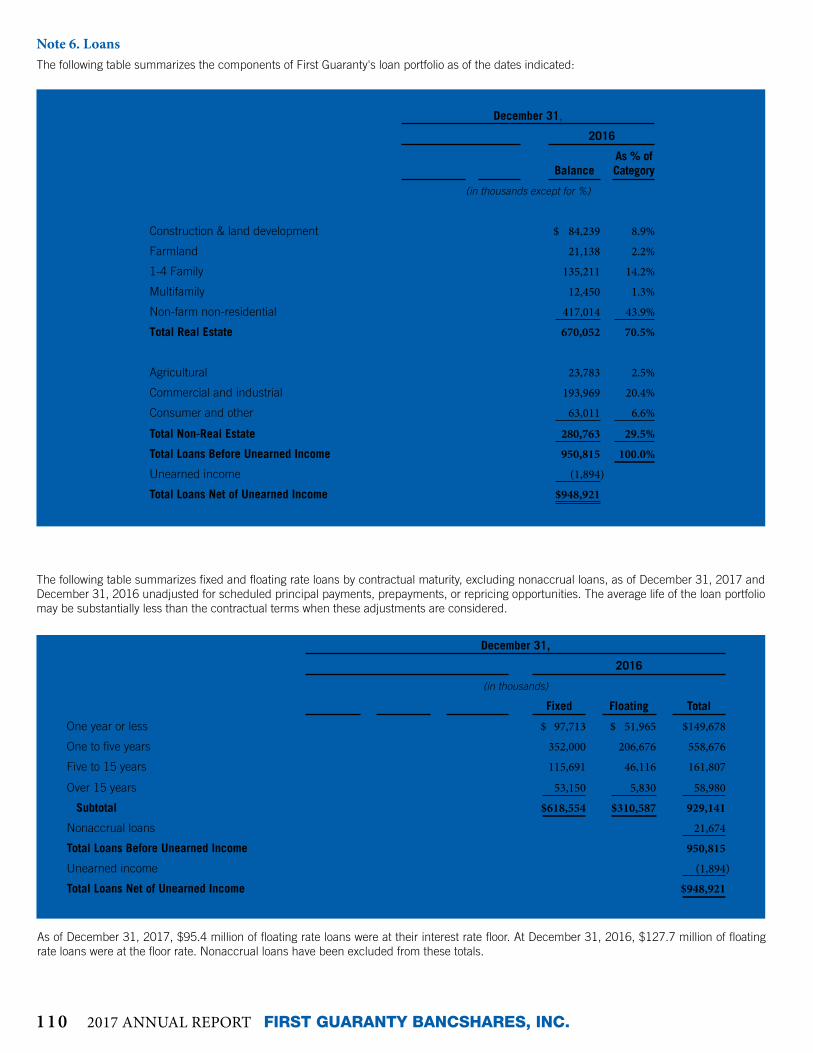
Note 6. LoansThe following table summarizes the components of First Guaranty's loan portfolio as of the dates indicated:
December 31,
2017 2016
BalanceAs % of Category Balance
As % of Category
(in thousands except for %)
Real Estate:
Construction & land development $ 112,603 9.8% $ 84,239 8.9%
Farmland 25,691 2.2% 21,138 2.2%
1-4 Family 158,733 13.8% 135,211 14.2%
Multifamily 16,840 1.4% 12,450 1.3%
Non-farm non-residential 540,231 46.9% 417,014 43.9%
Total Real Estate 854,098 74.1% 670,052 70.5%
Non-Real Estate:
Agricultural 21,514 1.9% 23,783 2.5%
Commercial and industrial 220,700 19.2% 193,969 20.4%
Consumer and other 55,185 4.8% 63,011 6.6%
Total Non-Real Estate 297,399 25.9% 280,763 29.5%
Total Loans Before Unearned Income 1,151,497 100.0% 950,815 100.0%
Unearned income (2,483) (1,894)
Total Loans Net of Unearned Income $ 1,149,014 $948,921
December 31,
2017 2016
(in thousands)
Fixed Floating Total Fixed Floating Total
One year or less $ 89,383 $ 75,361 $ 164,744 $ 97,713 $ 51,965 $149,678
One to five years 390,333 251,135 641,468 352,000 206,676 558,676
Five to 15 years 124,215 70,273 194,488 115,691 46,116 161,807
Over 15 years 70,366 67,881 138,247 53,150 5,830 58,980
Subtotal $674,297 $464,650 1,138,947 $618,554 $310,587 929,141
Nonaccrual loans 12,550 21,674
Total Loans Before Unearned Income 1,151,497 950,815
Unearned income (2,483) (1,894)
Total Loans Net of Unearned Income $ 1,149,014 $948,921
The following table summarizes fixed and floating rate loans by contractual maturity, excluding nonaccrual loans, as of December 31, 2017 and December 31, 2016 unadjusted for scheduled principal payments, prepayments, or repricing opportunities. The average life of the loan portfolio may be substantially less than the contractual terms when these adjustments are considered.
As of December 31, 2017, $95.4 million of floating rate loans were at their interest rate floor. At December 31, 2016, $127.7 million of floating rate loans were at the floor rate. Nonaccrual loans have been excluded from these totals.
110 2017 ANNUAL REPORT FIRST GUARANTY BANCSHARES, INC.

The tables above include $12.6 million and $21.7 million of nonaccrual loans for December 31, 2017 and 2016, respectively. See the tables below for more detail on nonaccrual loans.
As of December 31, 2017
30-89 Days Past Due
90 Days or Greater Past Due
Total Past Due Current Total Loans
Recorded Investment 90 Days Accruing
(in thousands)
Real Estate:
Construction & land development $ 95 $ 371 $ 466 $ 112,137 $ 112,603 $ -
Farmland 175 65 240 25,451 25,691 -
1 - 4 family 1,481 1,953 3,434 155,299 158,733 -
Multi-family - - - 16,840 16,840 -
Non-farm non-residential 1,006 3,758 4,764 535,467 540,231 -
Total Real Estate 2,757 6,147 8,904 845,194 854,098 -
Non-Real Estate:
Agricultural 239 1,537 1,776 19,738 21,514 41
Commercial and industrial 630 5,624 6,254 214,446 220,700 798
Consumer and other 463 81 544 54,641 55,185 -
Total Non-Real Estate 1,332 7,242 8,574 288,825 297,399 839
Total Loans Before Unearned Income $ 4,089 $13,389 $17,478 $ 1,134,019 1,151,497 $839
Unearned income (2,483)
Total Loans Net of Unearned Income $ 1,149,014
As of December 31, 2016
30-89 Days Past Due
90 Days or Greater Past Due
Total Past Due Current Total Loans
Recorded Investment 90 Days Accruing
(in thousands)
Real Estate:
Construction & land development $ 173 $ 585 $ 758 $ 83,481 $ 84,239 $ 34
Farmland 234 105 339 20,799 21,138 -
1 - 4 family 1,108 2,387 3,495 131,716 135,211 145
Multi-family - 5,014 5,014 7,436 12,450 -
Non-farm non-residential 1,618 2,753 4,371 412,643 417,014 -
Total Real Estate 3,133 10,844 13,977 656,075 670,052 179
Non-Real Estate:
Agricultural 64 1,958 2,022 21,761 23,783 -
Commercial and industrial 552 8,070 8,622 185,347 193,969 -
Consumer and other 182 981 1,163 61,848 63,011 -
Total Non-Real Estate 798 11,009 11,807 268,956 280,763 -
Total Loans Before Unearned Income $3,931 $21,853 $25,784 $925,031 950,815 $179
Unearned income (1,894)
Total Loans Net of Unearned Income $948,921
The following tables present the age analysis of past due loans for the periods indicated:
111

The following is a summary of nonaccrual loans by class for the periods indicated:
The following table identifies the credit exposure of the loan portfolio by specific credit ratings for the periods indicated:
As of December 31,
2017 2016
(in thousands)
Real Estate:
Construction & land development $ 371 $ 551
Farmland 65 105
1-4 family 1,953 2,242
Multi-family - 5,014
Non-farm non-residential 3,758 2,753
Total Real Estate 6,147 10,665
Non-Real Estate:
Agricultural 1,496 1,958
Commercial and industrial 4,826 8,070
Consumer and other 81 981
Total Non-Real Estate 6,403 11,009
Total Nonaccrual Loans $12,550 $21,674
As of December 31, 2017 As of December 31, 2016
PassSpecial Mention
Sub- standard Doubtful Total Pass
Special Mention
Sub- standard Doubtful Total
(in thousands)
Real Estate:
Construction & land development $ 108,200 $ 125 $ 4,278 $ - $112,603 $ 79,069 $ 1,162 $ 4,008 $ - $ 84,239
Farmland 25,030 569 92 - 25,691 20,652 381 105 - 21,138
1-4 family 149,426 1,856 7,451 - 158,733 123,191 5,460 6,560 - 135,211
Multi-family 9,366 639 6,835 - 16,840 4,268 1,132 7,050 - 12,450
Non-farm non-residential 520,432 2,490 17,309 - 540,231 392,355 6,406 18,253 - 417,014
Total Real Estate 812,454 5,679 35,965 - 854,098 619,535 14,541 35,976 - 670,052
Non-Real Estate:
Agricultural 19,050 995 1,469 - 21,514 20,890 920 1,973 - 23,783
Commercial and industrial 191,784 19,187 5,169 4,560 220,700 182,381 850 3,008 7,730 193,969
Consumer and other 48,225 68 6,892 - 55,185 60,582 1,394 1,035 - 63,011
Total Non-Real Estate 259,059 20,250 13,530 4,560 297,399 263,853 3,164 6,016 7,730 280,763
Total Loans Before Unearned Income $ 1,071,513 $ 25,929 $49,495 $4,560 1,151,497 $ 883,388 $ 17,705 $41,992 $7,730 950,815
Unearned income (2,483) (1,894)
Total Loans Net of Unearned Income $1,149,014 $948,921
112 2017 ANNUAL REPORT FIRST GUARANTY BANCSHARES, INC.

Purchased Impaired Loans
As part of the acquisition of Premier Bancshares, Inc. on June 16, 2017, First Guaranty purchased credit impaired loans for which there was, at acquisition, evidence of deterioration of credit quality since their origination and it was probable, at acquisition, that all contractually required payments would not be collected. The carrying amount of those loans is as follows at December 31, 2017.
As of December 31, 2017
(in thousands)
Real Estate:
Construction & land development $ 1,135
Farmland 8
1-4 family 50
Multi-family -
Non-farm non-residential 2,148
Total Real Estate 3,341
Non-Real Estate:
Agricultural -
Commercial and industrial 1,017
Consumer and other -
Total Non-Real Estate 1,017
Total Carrying Amount $ 4,358
Contractual principal balance $ 5,436
Carrying amount, net of allowance $ 4,358
The accretable yield, or income expected to be collected, on the purchased loans above is as follows at December 31, 2017.
Year Ended December 31, 2017
(in thousands)
Balance, beginning of period $ -
Acquisition accretable yield 1,195
Accretion (164)
Net transfers from nonaccretable difference to accretable yield -
Balance, end of period $ 1,031
For those purchased loans disclosed above, First Guaranty did not increase the allowance for loan losses for the year ended December 31, 2017.
Where First Guaranty can reasonably estimate the cash flows expected to be collected on the loans, a portion of the purchase discount is allocated to an accretable yield adjustment based upon the present value of the future estimated cash flows versus the current carrying value of the loan and the accretable yield portion is being recognized as interest income over the remaining life of the loan.
Where First Guaranty cannot reasonably estimate the cash flows expected to be collected on the loans, it has decided to account for those loans using the cost recovery method of income recognition. As such, no portion of a purchase discount adjustment has been
determined to meet the definition of an accretable yield adjustment on those loans accounted for using the cost recovery method. If, in the future, cash flows from the borrower(s) can be reasonably estimated, a portion of the purchase discount would be allocated to an accretable yield adjustment based upon the present value of the future estimated cash flows versus the current carrying value of the loan and the accretable yield portion would be recognized as interest income over the remaining life of the loan. Until such accretable yield can be calculated, under the cost recovery method of income recognition, all payments will be used to reduce the carrying value of the loan and no income will be recognized on the loan until the carrying value is reduced to zero. Any loan accounted for under the cost recovery method is also still included as a non-accrual loan in the amounts presented in the table below.
The contractually required payments of purchased impaired loans totaled $7.5 million, while the cash flow expected to be collected at acquisition totaled $5.0 million, and the fair value of the acquired loans totaled $3.8 million.
113
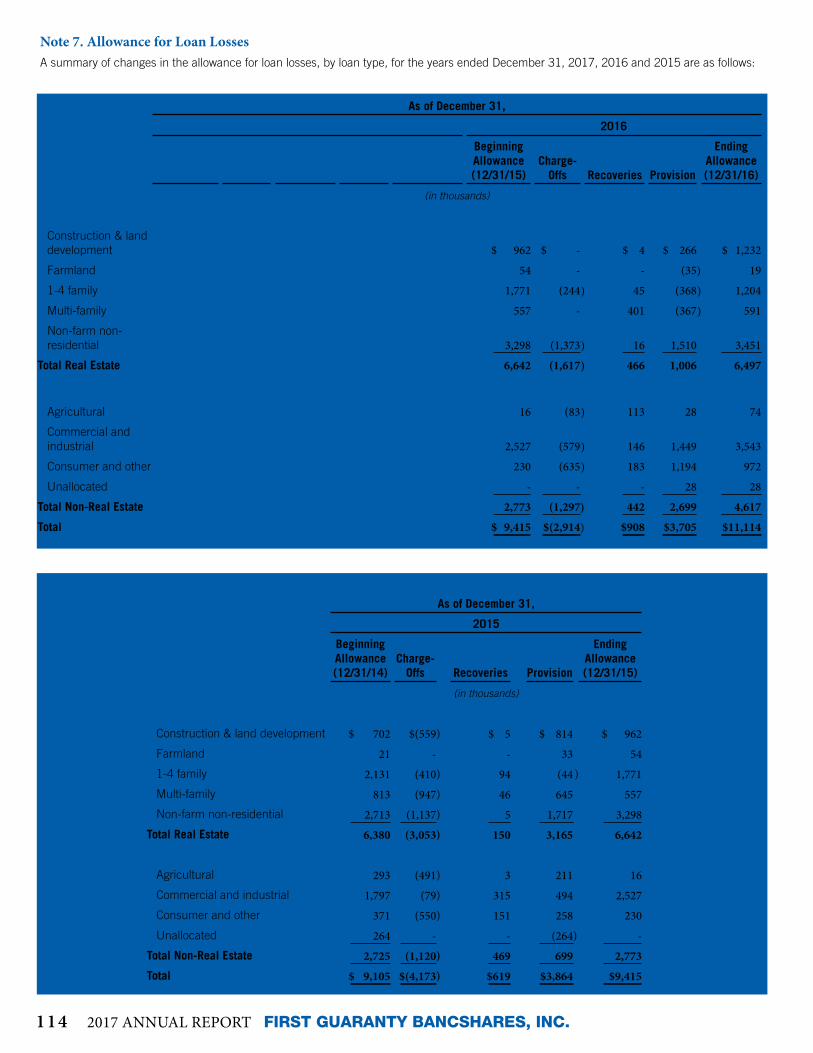
Note 7. Allowance for Loan LossesA summary of changes in the allowance for loan losses, by loan type, for the years ended December 31, 2017, 2016 and 2015 are as follows:
As of December 31,
2017 2016
Beginning Allowance (12/31/16)
Charge-Offs Recoveries Provision
Ending Allowance (12/31/17)
Beginning Allowance (12/31/15)
Charge-Offs Recoveries Provision
Ending Allowance (12/31/16)
(in thousands)
Real Estate:
Construction & land development $ 1,232 $ - $ 43 $ (647) $ 628 $ 962 $ - $ 4 $ 266 $ 1,232
Farmland 19 - - (14) 5 54 - - (35) 19
1-4 family 1,204 (33) 92 (185) 1,078 1,771 (244) 45 (368) 1,204
Multi-family 591 - 40 363 994 557 - 401 (367) 591
Non-farm non-residential 3,451 (1,291) 85 566 2,811 3,298 (1,373) 16 1,510 3,451
Total Real Estate 6,497 (1,324) 260 83 5,516 6,642 (1,617) 466 1,006 6,497
Non-Real Estate: Agricultural 74 (162) 138 137 187 16 (83) 113 28 74
Commercial and industrial 3,543 (3,629) 30 2,433 2,377 2,527 (579) 146 1,449 3,543
Consumer and other 972 (1,247) 223 1,177 1,125 230 (635) 183 1,194 972
Unallocated 28 - - (8) 20 - - - 28 28
Total Non-Real Estate 4,617 (5,038) 391 3,739 3,709 2,773 (1,297) 442 2,699 4,617
Total $ 11,114 $(6,362) $651 $3,822 $9,225 $ 9,415 $(2,914) $908 $3,705 $11,114
As of December 31,
2015
Beginning Allowance (12/31/14)
Charge-Offs Recoveries Provision
Ending Allowance (12/31/15)
(in thousands)
Real Estate:
Construction & land development $ 702 $(559) $ 5 $ 814 $ 962
Farmland 21 - - 33 54
1-4 family 2,131 (410) 94 (44 ) 1,771
Multi-family 813 (947) 46 645 557
Non-farm non-residential 2,713 (1,137) 5 1,717 3,298
Total Real Estate 6,380 (3,053) 150 3,165 6,642
Non-Real Estate:
Agricultural 293 (491) 3 211 16
Commercial and industrial 1,797 (79) 315 494 2,527
Consumer and other 371 (550) 151 258 230
Unallocated 264 - - (264) -
Total Non-Real Estate 2,725 (1,120) 469 699 2,773
Total $ 9,105 $(4,173) $619 $3,864 $9,415
114 2017 ANNUAL REPORT FIRST GUARANTY BANCSHARES, INC.

Negative provisions are caused by changes in the composition and credit quality of the loan portfolio. The result is an allocation of the loan loss reserve from one category to another.
A summary of the allowance and loans individually and collectively evaluated for impairment are as follows:
As of December 31, 2017
Allowance Individually
Evaluated for Impairment
Allowance Collectively
Evaluated for Impairment
Total Allowance for Credit Losses
Loans Individually
Evaluated for Impairment
Loans Collectively
Evaluated for Impairment
Total Loans before
Unearned Income
(in thousands)
Real Estate:
Construction & land development $ - $ 628 $ 628 $ - $ 112,603 $ 112,603
Farmland - 5 5 - 25,691 25,691
1-4 family - 1,078 1,078 - 158,733 158,733
Multi-family - 994 994 - 16,840 16,840
Non-farm non-residential 236 2,575 2,811 8,990 531,241 540,231
Total Real Estate 236 5,280 5,516 8,990 845,108 854,098
Non-Real Estate:
Agricultural 66 121 187 861 20,653 21,514
Commercial and industrial 565 1,812 2,377 5,731 214,969 220,700
Consumer and other - 1,125 1,125 - 55,185 55,185
Unallocated - 20 20 - - -
Total Non-Real Estate 631 3,078 3,709 6,592 290,807 297,399
Total $867 $8,358 $9,225 $15,582 $1,135,915 1,151,497
Unearned Income (2,483)
Total Loans Net of Unearned Income $1,149,014
As of December 31, 2016
Allowance Individually
Evaluated for Impairment
Allowance Collectively
Evaluated for Impairment
Total Allowance for Credit Losses
Loans Individually
Evaluated for Impairment
Loans Collectively
Evaluated for Impairment
Total Loans before
Unearned Income
(in thousands)
Real Estate:
Construction & land development $ - $1,232 $1,232 $ 361 $ 83,878 $ 84,239
Farmland - 19 19 - 21,138 21,138
1-4 family 8 1,196 1,204 1,130 134,081 135,211
Multi-family 164 427 591 5,014 7,436 12,450
Non-farm non-residential 247 3,204 3,451 10,803 406,211 417,014
Total Real Estate 419 6,078 6,497 17,308 652,744 670,052
Non-Real Estate:
Agricultural 11 63 74 1,614 22,169 23,783
Commercial and industrial 2,375 1,168 3,543 8,965 185,004 193,969
Consumer and other 193 779 972 924 62,087 63,011
Unallocated - 28 28 - - -
Total Non-Real Estate 2,579 2,038 4,617 11,503 269,260 280,763
Total $2,998 $8,116 $11,114 $28,811 $922,004 950,815
Unearned Income (1,894)
Total Loans Net Of Unearned Income $948,921
115

As of December 31, 2017, 2016 and 2015, First Guaranty had loans totaling $12.6 million, $21.7 million and $20.0 million, respectively, not accruing interest. As of December 31, 2017, 2016 and 2015, First Guaranty had loans past due 90 days or more and still accruing interest totaling $0.8 million, $0.2 million and $0.4 million, respectively. The average outstanding balance of nonaccrual loans in 2017 was $17.3 million compared to $22.5 million in 2016 and $14.9 million in 2015.
As of December 31, 2017
Recorded Investment
Unpaid Principal Balance
Related Allowance
Average Recorded
Investment
Interest Income
Recognized
Interest Income
Cash Basis
(in thousands)
Impaired Loans with no related allowance:
Real Estate:
Construction & land development $ - $ - $ - $ - $ - $ -
Farmland - - - - - -
1-4 family - - - - - -
Multi-family - - - - - -
Non-farm non-residential 5,771 5,771 - 5,933 248 279
Total Real Estate 5,771 5,771 - 5,933 248 279
Non-Real Estate:
Agricultural - - - - - -
Commercial and industrial - - - - - -
Consumer and other - - - - - -
Total Non-Real Estate - - - - - -
Total Impaired Loans with no related allowance 5,771 5,771 - 5,933 248 279
Impaired Loans with an allowance recorded:
Real estate:
Construction & land development - - - - - -
Farmland - - - - - -
1-4 family - - - - - -
Multi-family - - - - - -
Non-farm non-residential 3,219 3,570 236 3,555 183 127
Total Real Estate 3,219 3,570 236 3,555 183 127
Non-Real Estate:
Agricultural 861 920 66 1,117 70 17
Commercial and industrial 5,731 9,062 565 8,121 65 84
Consumer and other - - - - - -
Total Non-Real Estate 6,592 9,982 631 9,238 135 101
Total Impaired Loans with an allowance recorded 9,811 13,552 867 12,793 318 228
Total Impaired Loans $15,582 $19,323 $ 867 $ 18,726 $ 566 $ 507
As of December 31, 2017, First Guaranty has no outstanding commitments to advance additional funds in connection with impaired loans.
The following is a summary of impaired loans by class at December 31, 2017:
116 2017 ANNUAL REPORT FIRST GUARANTY BANCSHARES, INC.

The following is a summary of impaired loans by class at December 31, 2016:
As of December 31, 2016
Recorded Investment
Unpaid Principal Balance
Related Allowance
Average Recorded
Investment
Interest Income
Recognized
Interest Income
Cash Basis
(in thousands)
Impaired Loans with no related allowance:
Real Estate:
Construction & land development $ 361 $ 823 $ - $ 363 $ - $ -
Farmland - - - - - -
1-4 family 863 1,196 - 1,044 49 48
Multifamily - - - - - -
Non-farm non-residential 8,501 9,430 - 8,949 196 175
Total Real Estate 9,725 11,449 - 10,356 245 223
Non-Real Estate: Agricultural 1,603 1,742 - 1,377 30 -
Commercial and industrial - - - - - -
Consumer and other 686 685 - 724 18 12
Total Non-Real Estate 2,289 2,427 - 2,101 48 12
Total Impaired Loans with no related allowance 12,014 13,876 - 12,457 293 235
Impaired Loans with an allowance recorded: Real estate:
Construction & land development - - - - - -
Farmland - - - - - -
1-4 family 267 303 8 279 - -
Multi-family 5,014 5,305 164 5,169 - -
Non-farm non-residential 2,302 2,296 247 2,334 119 113
Total Real Estate 7,583 7,904 419 7,782 119 113
Non-Real Estate: Agricultural 11 11 11 11 - -
Commercial and industrial 8,965 9,117 2,375 9,379 72 72
Consumer and other 238 244 193 289 8 7
Total Non-Real Estate 9,214 9,372 2,579 9,679 80 79
Total Impaired Loans with an allowance recorded 16,797 17,276 2,998 17,461 199 192
Total Impaired Loans $28,811 $31,152 $2,998 $29,918 $ 492 $ 427
117

Troubled Debt Restructurings
A Troubled Debt Restructuring ("TDR") is a debt restructuring in which the creditor for economic or legal reasons related to the debtor's financial difficulties grants a concession to the debtor that it would not otherwise consider. The modifications to First Guaranty's TDRs were
concessions on the interest rate charged. The effect of the modifications to First Guaranty was a reduction in interest income. These loans were evaluated in First Guaranty's reserve for loan losses. In 2017 and 2016, there were no credit relationships that were restructured in a troubled debt restructuring.
The following table is an age analysis of TDRs as of December 31, 2017 and December 31, 2016:
Troubled Debt Restructurings December 31, 2017 December 31, 2016
Accruing Loans Accruing Loans
Current
30-89 Days Past
Due NonaccrualTotal TDRs Current
30-89 Days
Past Due NonaccrualTotal TDRs
(in thousands)
Real Estate:
Construction & land development $ - $ - $ 334 $ 334 $ - $ - $361 $ 361Farmland - - - - - - - -
1-4 Family - - - - - - - -Multi-family - - - - - - - -Non-farm non residential 2,138 - - 2,138 2,987 - 100 3,087
Total Real Estate 2,138 - 334 2,472 2,987 - 461 3,448Non-Real Estate:
Agricultural - - - - - - - -
Commercial and industrial - - - - - - - -Consumer and other - - - - - - - -
Total Non-Real Estate - - - - - - - -Total $ 2,138 $ - $ 334 $ 2,472 $2,987 $ - $461 $3,448
Trouble Debt Restructured Loans Activity
Twelve Months Ended December 31, 2017
Beginning balance
(December 31, 2016)
New TDRs
Charge-Offs post-
modificationTransferred
to ORE Paydowns
Construction to permanent
financing
Restructured to market
termsOther
adjustments
Ending balance
(December 31, 2017)
(in thousands)
Real Estate:Construction & land development $ 361 $ - $ - $ - $(27) $ - $ - $ - $ 334
Farmland - - - - - - - - -
1-4 family - - - - - - - - -
Multi-family - - - - - - - - -
Non-farm non-residential 3,087 - (102) - (849) - - 2 2,138
Total Real Estate 3,448 - (102) - (876) - - 2 2,472
Non-Real Estate:
Agricultural - - - - - - - - -
Commercial and industrial - - - - - - - - -
Consumer and other - - - - - - - - -
Total Non-Real Estate - - - - - - - - -Total Impaired Loans with no related allowance $3,448 $ - $(102) $ - $(876) $ - $ - $ 2 $2,472
The following table discloses TDR activity for the twelve months ended December 31, 2017.
118 2017 ANNUAL REPORT FIRST GUARANTY BANCSHARES, INC.

There were no commitments to lend additional funds to debtors whose terms have been modified in a troubled debt restructuring at December 31, 2017.
Note 8. Premises and EquipmentThe components of premises and equipment at December 31, 2017 and 2016 are as follows:
Depreciation expense amounted to $1.8 million, $1.7 million and $1.6 million for 2017, 2016 and 2015, respectively.
Note 9. Goodwill and Other Intangible AssetsGoodwill and intangible assets deemed to have indefinite lives are no longer amortized, but are subject to impairment testing. Other intangible assets continue to be amortized over their useful lives. Goodwill represents the purchase price over the fair value of net assets acquired from the Homestead Bancorp in 2007 and Premier Bancshares, Inc. in 2017. No impairment charges have been recognized since acquisition. Goodwill totaled $3.5 million and $2.0 million at December 31, 2017 and 2016, respectively.
The following table summarizes intangible assets subject to amortization.
December 31,
2017 2016
(in thousands)
Land $ 12,875 $ 7,185
Bank premises 31,469 21,229
Furniture and equipment 24,305 21,689
Construction in progress 382 2,106
Acquired value 69,031 52,209
Less: accumulated depreciation 31,011 28,690
Net book value $38,020 $23,519
December 31,
2017 2016
Gross Carrying Amount
Accumulated Amortization
Net Carrying Amount
Gross Carrying Amount
Accumulated Amortization
Net Carrying Amount
(in thousands)
Core deposit intangibles $12,053 $ 8,804 $ 3,249 $9,350 $ 8,372 $978
Mortgage servicing rights 1,373 198 1,175 267 189 78
Total $13,426 $9,002 $4,424 $9,617 $ 8,561 $1,056
The core deposits intangible reflect the value of deposit relationships, including the beneficial rates, which arose from acquisitions. The weighted-average amortization period remaining for the core deposit intangibles is 9.7 years.
Amortization expense relating to purchase accounting intangibles totaled $0.4 million, $0.3 million, and $0.3 million for the years ended December 31, 2017, 2016, and 2015, respectively.
Amortization expense of the core deposit intangible assets for the next five years is as follows:
For the Years Ended Estimated Amortization Expense
(in thousands)
December 31, 2018 $545
December 31, 2019 $361
December 31, 2020 $361
December 31, 2021 $293
December 31, 2022 $225
119

Note 10. Other Real Estate Other real estate owned consists of the following:
Note 11. DepositsA schedule of maturities of all time deposits are as follows:
The table above includes, for December 31, 2017, brokered deposits totaling $9.8 million. The aggregate amount of jumbo time deposits, each with a minimum denomination of $250,000 totaled $266.2 million and $241.4 million at December 31, 2017 and 2016, respectively.
Note 12. BorrowingsShort-term borrowings are summarized as follows:
First Guaranty maintains borrowing relationships with other financial institutions as well as the Federal Home Loan Bank on a short and long-term basis to meet liquidity needs. Short-term borrowings totaled $15.5 million at December 31, 2017 and $6.5 million at December 31, 2016. Short-term borrowing consisted of a line of credit of $6.5 million, with no outstanding balance at December 31, 2017 and collateralized short-term borrowings from the Federal Home Loan Bank totaling $15.5 million at December 31, 2017.
Available lines of credit totaled $150.8 million at December 31, 2017 and $133.7 million at December 31, 2016.
The following schedule provides certain information about First Guaranty's short-term borrowings for the periods indicated:
Long-term debt is summarized as follows:
Senior long-term debt with a commercial bank, priced at floating 3-month LIBOR plus 250 basis points (3.87%), totaled $22.8 million at December 31, 2017 and $21.8 at December 31, 2016. First Guaranty pays $735,294 principal plus interest quarterly. This loan was originated in December 2015 and has a contractual maturity date of December 22, 2020. This long-term debt is secured by a pledge of 85% (4,823,899 shares) of First Guaranty's interest in First Guaranty Bank (a wholly owned subsidiary). First Guaranty modified its existing senior long-term debt in the second quarter of 2017. The modification increased the principal balance to $25.0 million with new net proceeds of $3.8 million. The existing amortization terms and rates remained the same. The $3.8 million in additional proceeds were contributed to First Guaranty Bank for future growth.
Senior long-term debt with a commercial bank, priced at Wall Street Journal Prime plus 75 basis points (4.75%), had no outstanding balance at December 31, 2017 and totaled $0.3 million at December 31, 2016. First Guaranty paid $50,000 principal plus interest monthly. This long-term debt was secured by a pledge of 13.2% (735,745 shares) of First Guaranty's interest in First Guaranty Bank (a wholly owned subsidiary). This loan matured on May 12, 2017.
Junior subordinated debt, priced at Wall Street Journal Prime plus 75 basis points (4.00%), totaled $14.7 million at December 31, 2017 and $14.6 million at December 31, 2016. First Guaranty pays interest semi-annually for the Fixed Interest Rate Period and quarterly for the Floating Interest Rate Period. The Note is unsecured and ranks junior in right of payment to any senior indebtedness and obligations to general and secured creditors. The Note was originated in December 2015 and is scheduled to mature on December 21, 2025. Subject to limited exceptions, First Guaranty cannot repay the Note until after December 21, 2020. The Note qualifies for treatment as Tier 2 capital for regulatory capital purposes.
First Guaranty maintains a revolving line of credit for $6.5 million with an availability of $6.5 million at December 31, 2017. This line of credit is secured by the same collateral as the senior term loan and is priced at 4.50%.
At December 31, 2017, letters of credit issued by the FHLB totaling $294.2 million were outstanding and carried as off-balance sheet items, all of which expire in 2018. At December 31, 2016, letters of credit issued by the FHLB totaling $226.1 million were outstanding and carried as off-balance sheet items, all of which expired in 2017. The letters of credit are solely used for pledging towards public fund deposits. The FHLB has a blanket lien on substantially all of the loans in First Guaranty's portfolio which is used to secure borrowing availability from the FHLB. First Guaranty has obtained a subordination agreement from the FHLB on First Guaranty's farmland, agricultural, and commercial and industrial loans. These loans are available to be pledged for additional reserve liquidity.
December 31,
2017 2016
(in thousands)
Real Estate Owned Acquired by Foreclosure:
Residential $ 23 $ 71
Construction & land development 304 -
Non-farm non-residential 954 288
Total Other Real Estate Owned and Foreclosed Property $1,281 $359
December 31, 2017
(in thousands)
2018 $357,687
2019 118,902
2020 48,843
2021 16,622
2022 and thereafter 39,277
Total $581,331
December 31, 2017
December 31, 2016
(in thousands)
Federal Home Loan Bank advances $15,500 $6,500
Line of credit - -
Total short-term borrowings $15,500 $6,500
December 31,
2017 2016 2015
(in thousands except for %)
Outstanding at year end $ 15,500 $ 6,500 $ 1,800
Maximum month-end outstanding $28,000 $25,000 $13,800
Average daily outstanding $ 5,833 $ 8,775 $ 4,217
Weighted average rate during the year 1.06% 0.85% 2.12%
Weighted average rate at year end 1.51% 0.65% 4.50%
120 2017 ANNUAL REPORT FIRST GUARANTY BANCSHARES, INC.

As of December 31, 2017 obligations on senior long-term debt and junior subordinated debentures totaled $37.4 million. The scheduled maturities are as follows:
Note 13. Capital RequirementsFirst Guaranty and the Bank are subject to various regulatory capital requirements administered by federal and state banking agencies. Failure to meet minimum capital requirements can initiate certain mandatory and possibly additional discretionary actions that, if undertaken, could have a direct material effect on First Guaranty's financial statements. Under capital adequacy guidelines and the regulatory framework for prompt corrective action, First Guaranty and the Bank must meet specific capital guidelines that involve quantitative measures of their assets, liabilities and certain off-balance sheet items as calculated under regulatory accounting practices. The capital amounts and classification are also subject to qualitative judgments by the regulators about components, risk weightings and other factors.
Prompt corrective action provisions are not applicable to bank holding companies.
Quantitative measures established by regulation to ensure capital adequacy require First Guaranty and the Bank to maintain minimum amounts and ratios of total and Tier 1 capital to risk-weighted assets and of Tier 1 capital to average assets. Management believes, as of December 31, 2017 and 2016, that First Guaranty and the Bank met all capital adequacy requirements.
In addition to establishing the minimum regulatory capital requirements, the regulations limit capital distributions and certain discretionary bonus payments to management if the institution does not hold a "capital conservation buffer" consisting of 2.5% of common equity Tier 1 capital to risk-weighted asset above the amount necessary to meet its minimum risk-based capital requirements. The capital conservation buffer requirement is being phased in beginning January 1, 2016 at 0.625% of risk-weighted assets and increasing each year until fully implemented at 2.5% on January 1, 2019. For 2018, the capital conservation buffer will be 1.875% of risk-weighted assets. First Guaranty Bancshares, Inc. capital conservation buffer was 4.14% at December 31, 2017. First Guaranty Bank’s capital conservation buffer was 5.07% at December 31, 2017.
As of December 31, 2017, the most recent notification from the Federal Deposit Insurance Corporation categorized the Bank as well capitalized under the regulatory framework for prompt corrective action. To be categorized as well capitalized, an institution must maintain minimum total risk-based, Tier 1 risk-based and Tier 1 leverage ratios as set forth in the following table. There are no conditions or events since the notification that Management believes have changed the Bank’s category.
Senior Long-term
Debt
Junior Subordinated Debentures
(in thousands)
2018 $ 2,941 $ -
2019 2,941 -
2020 2,941 -
2021 2,941 -
2022 2,941 -
2023 and thereafter 8,089 15,000
Subtotal $22,794 $15,000
Debt issuance costs (20) (336)
Total $22,774 $14,664
121

First Guaranty's and the Bank’s actual capital amounts and ratios as of December 31, 2017 and 2016 are presented in the following table.
Actual
Minimum Capital
Requirements
Minimum to be Well Capitalized
Under Action Provisions
Amount Ratio Amount Ratio Amount Ratio
(in thousands except for %)
December 31, 2017
Total Risk-Based Capital:
Consolidated $164,545 12.14% $ 108,427 8.00% N/A N/A
Bank $176,398 13.07% $ 107,961 8.00% $134,951 10.00%
Tier 1 Capital:
Consolidated $140,320 10.35% $ 81,320 6.00% N/A N/A
Bank $167,173 12.39% $ 80,971 6.00% $107,961 8.00%
Tier 1 Leverage Capital:
Consolidated $140,320 8.27% $ 67,899 4.00% N/A N/A
Bank $167,173 9.88% $ 67,709 4.00% $ 84,636 5.00%
Common Equity Tier One Capital:
Consolidated $140,320 10.35% $ 60,990 4.50% N/A N/A
Bank $167,173 12.39% $ 60,728 4.50% $ 87,718 6.50%
December 31, 2016
Total Risk-Based Capital:
Consolidated $151,877 12.79% $ 94,982 8.00% N/A N/A
Bank $153,768 12.99% $ 94,717 8.00% $118,396 10.00%
Tier 1 Capital:
Consolidated $125,763 10.59% $ 71,236 6.00% N/A N/A
Bank $142,654 12.05% $ 71,038 6.00% $ 94,717 8.00%
Tier 1 Leverage Capital:
Consolidated $125,763 8.68% $ 57,930 4.00% N/A N/A
Bank $142,654 9.88% $ 57,771 4.00% $ 72,214 5.00%
Common Equity Tier One Capital:
Consolidated 125,763 10.59% $ 53,427 4.50% N/A N/A
Bank 142,654 12.05% $ 53,278 4.50% $ 76,958 6.50%
Note 14. Dividend Restrictions The Federal Reserve Bank ("FRB") has stated that, generally, a bank holding company should not maintain a rate of distributions to shareholders unless its available net income has been sufficient to fully fund the distributions, and the prospective rate of earnings retention appears consistent with the bank holding company’s capital needs, asset quality and overall financial condition. As a Louisiana corporation, First Guaranty is restricted under the Louisiana corporate law from paying dividends under certain conditions.
First Guaranty Bank may not pay dividends or distribute capital assets if it is in default on any assessment due to the FDIC. First Guaranty Bank is also subject to regulations that impose minimum regulatory capital
and minimum state law earnings requirements that affect the amount of cash available for distribution. In addition, under the Louisiana Banking Law, dividends may not be paid if it would reduce the unimpaired surplus below 50% of outstanding capital stock in any year.
The Bank is restricted under applicable laws in the payment of dividends to an amount equal to current year earnings plus undistributed earnings for the immediately preceding year, unless prior permission is received from the Commissioner of Financial Institutions for the State of Louisiana. Dividends payable by the Bank in 2018 without permission will be limited to 2018 earnings plus the undistributed earnings of $3.2 million from 2017.
122 2017 ANNUAL REPORT FIRST GUARANTY BANCSHARES, INC.

Accordingly, at January 1, 2018, $167.6 million of First Guaranty's equity in the net assets of the Bank was restricted. In addition, dividends paid by the Bank to First Guaranty would be prohibited if the effect thereof would cause the Bank’s capital to be reduced below applicable minimum capital requirements.
Note 15. Related Party TransactionsIn the normal course of business, First Guaranty and its subsidiary, First Guaranty Bank, have loans, deposits and other transactions with its executive officers, directors and certain business organizations and individuals with which such persons are associated. These transactions are completed with terms no less favorable than current market rates. An analysis of the activity of loans made to such borrowers during the year ended December 31, 2017 and 2016 follows:
Unfunded commitments to First Guaranty and Bank directors and executive officers totaled $17.5 million and $24.9 million at December 31, 2017 and 2016, respectively. At December 31, 2017 First Guaranty and the Bank had deposits from directors and executives totaling $24.6 million. There were no participations in loans purchased from affiliated financial institutions included in First Guaranty's loan portfolio in 2017 or 2016.
During the years ended 2017, 2016 and 2015, First Guaranty paid approximately $0.4 million, $0.3 million and $0.2 million, respectively, for printing services and supplies and office furniture and equipment to Champion Industries, Inc., of which Mr. Marshall T. Reynolds, the Chairman of First Guaranty's Board of Directors, is President, Chief Executive Officer, Chairman of the Board of Directors and a major shareholder of Champion.
On December 21, 2015, First Guaranty issued a $15.0 million subordinated note (the "Note") to Edgar Ray Smith III, a director of First Guaranty. The Note is for a ten-year term (non-callable for first five years) and will bear interest at a fixed annual rate of 4.0% for the first five years of the term and then adjust to a floating rate based on the Prime Rate as reported by the Wall Street Journal plus 75 basis points for the period of time after the fifth year until redemption or maturity. First Guaranty paid interest of $0.6 million in 2017 and 2016 for this note.
During the years ended 2017, 2016 and 2015, First Guaranty paid approximately $0.2 million, $0.3 million and $0.2 million, respectively, for architectural services in relation to bank branches to Gasaway Gasaway Bankston Architects, of which bank subsidiary board member Andrew B. Gasaway is part owner.
Note 16. Employee Benefit Plans
First Guaranty has an employee savings plan to which employees, who meet certain service requirements, may defer 1% to 20% of their base salaries, 6% of which may be matched up to 100%, at its sole discretion. Contributions to the savings plan were $240,000, $191,000 and $86,000 in 2017, 2016 and 2015, respectively. First Guaranty has an Employee Stock Ownership Plan (“ESOP”) which was frozen in 2010. No contributions were made to the ESOP for the years 2017, 2016 or 2015. As of December 31, 2017, the ESOP held 15,530 shares. First Guaranty is in the process of terminating the plan.
Note 17. Other Expenses
The following is a summary of the significant components of other noninterest expense:
First Guaranty does not capitalize advertising costs. They are expensed as incurred and are included in other noninterest expense on the Consolidated Statements of Income. Advertising expense was $0.7 million, $0.6 million and $0.6 million for 2017, 2016 and 2015, respectively.
Note 18. Income TaxesOn December 22, 2017, the Tax Cuts and Jobs Act (“TCJA”) was signed into law. The TCJA makes broad and complex changes to the U.S. tax code that affected income tax rate in 2017. The TCJA reduces the U.S. federal corporate income tax expense from 35% to 21% beginning January 1, 2018 and also establishes new tax laws that will affect 2018.
ASC 740 requires a company to record the effects of a tax law change in the period of enactment, however, shortly after the enactment of the TCJA, the SEC staff issued SAB 118, which allows a company to record a provisional amount when it does not have the necessary information available, prepared, or analyzed in reasonable detail to complete its accounting for the change in the tax law. The measurement period ends when the company has obtained, prepared and analyzed the information necessary to finalize its accounting, but cannot extend beyond one year.
The following is a summary of the provision for income taxes included in the Consolidated Statements of Income:
December 31,
2017 2016
(in thousands)
Balance, beginning of year $58,279 $57,816
Net Increase 24,639 463
Balance, end of year $82,918 $58,279
December 31,
2017 2016 2015
(in thousands)
Other noninterest expense:
Legal and professional fees $ 3,037 $ 2,185 $ 2,019
Data processing 1,608 1,259 1,184
ATM Fees 1,161 1,044 1,022
Marketing and public relations 1,205 878 848
Taxes - sales, capital and franchise 970 787 717
Operating supplies 496 471 414
Software expense and amortization 923 835 612
Travel and lodging 910 710 818
Telephone 167 177 172
Amortization of core deposits 432 320 320
Donations 322 298 332
Net costs from other real estate and repossessions 306 498 493
Regulatory assessment 726 1,005 1,111
Other 1,640 1,599 1,692
Total other noninterest expense $13,903 $12,066 $11,754
December 31,
2017 2016 2015
(in thousands)
Current $4,638 $8,168 $7,347
Deferred 2,761 (1,004) (384)
Total $7,399 $7,164 $6,963
123

measurement of a tax position taken or expected to be taken in a tax return. First Guaranty does not believe it has any unrecognized tax benefits included in its consolidated financial statements. First Guaranty has not had any settlements in the current period with taxing authorities, nor has it recognized tax benefits as a result of a lapse of the applicable statute of limitations. First Guaranty recognizes interest and penalties accrued related to unrecognized tax benefits, if applicable, in noninterest expense. During the years ended December 31, 2017, 2016 and 2015, First Guaranty did not recognize any interest or penalties in its consolidated financial statements, nor has it recorded an accrued liability for interest or penalty payments.
Note 19. Commitments and Contingencies
Off-balance sheet commitments
First Guaranty is a party to financial instruments with off-balance sheet risk in the normal course of business to meet the financing needs of its customers and to reduce its own exposure to fluctuations in interest rates. These financial instruments include commitments to extend credit and standby and commercial letters of credit. Those instruments involve, to varying degrees, elements of credit and interest rate risk in excess of the amount recognized in the Consolidated Balance Sheets. The contract or notional amounts of those instruments reflect the extent of the involvement in particular classes of financial instruments.
The exposure to credit loss in the event of nonperformance by the other party to the financial instrument for commitments to extend credit and standby and commercial letters of credit is represented by the contractual notional amount of those instruments. Unless otherwise noted, collateral or other security is not required to support financial instruments with credit risk.
Set forth below is a summary of the notional amounts of the financial instruments with off-balance sheet risk at December 31, 2017 and December 31, 2016.
Commitments to extend credit are agreements to lend to a customer as long as there is no violation of any condition established in the contract. Commitments generally have fixed expiration dates or other termination clauses and may require payment of a fee. Since commitments may expire without being drawn upon, the total commitment amounts do not necessarily represent future cash requirements. Each customer's creditworthiness is evaluated on a case-by-case basis. The amount of collateral obtained, if deemed necessary upon extension of credit, is based on Management's credit evaluation of the counterpart. Collateral requirements vary but may include accounts receivable, inventory, property, plant and equipment, residential real estate and commercial properties.
Standby and commercial letters of credit are conditional commitments to guarantee the performance of a customer to a third party. These guarantees are primarily issued to support public and private borrowing arrangements, including commercial paper, bond financing and similar transactions. The majority of these guarantees are short-term, one year or less; however, some guarantees extend for up to three years. The credit risk involved in issuing letters of credit is essentially the same as that involved in extending loan facilities. Collateral requirements are the same as on-balance sheet instruments and commitments to extend credit.
The difference between income taxes computed by applying the statutory federal income tax rate and the provision for income taxes in the financial statements is reconciled as follows:
(1) Included in other for the year ended December 31, 2017 is $0.9 million related to the estimated net impact from the remeasurement of deferred tax assets and liabilities as a result of the passage of the Tax Cuts and Jobs Act in December 2017.
Deferred taxes are recorded based upon differences between the financial statement and tax basis of assets and liabilities, and available tax credit carry forwards. Temporary differences between the financial statement and tax values of assets and liabilities give rise to deferred taxes. The significant components of deferred taxes classified in First Guaranty's Consolidated Balance Sheets at December 31, 2017 and 2016 are as follows:
Net operating loss carryforwards for income tax purposes were $7.0 million as of December 31, 2017 as compared to zero in 2016. The carryforwards were acquired in 2017 in the Premier acquisition and expire from 2027 to 2034, and will be utilized subject to annual Internal Revenue Code Section 382 limitations.
ASC 740-10, Income Taxes, clarifies the accounting for uncertainty in income taxes and prescribes a recognition threshold and measurement attribute for the consolidated financial statements recognition and
December 31,
2017 2016
(in thousands)
Deferred tax assets:
Allowance for loan losses $ 1,804 $3,890
Other real estate owned 25 60
Unrealized losses on available for sale securities 495 2,060
Net operating loss 1,463 -
Other 546 449
Gross deferred tax assets 4,333 6,459
Deferred tax liabilities:
Depreciation and amortization (1,688) (1,480)
Core deposit intangibles (662) (342)
Unrealized gains on available for sale securities - -
Other (566) (376)
Gross deferred tax liabilities (2,916) (2,198)
Net deferred tax assets $ 1,417 $ 4,261
December 31,
2017 2016
(in thousands)
Contract Amount
Commitments to Extend Credit $ 78,125 $ 56,910
Unfunded Commitments under lines of credit $ 101,344 $ 128,428
Commercial and Standby letters of credit $ 7,886 $ 6,602
December 31,
2017 2016 2015
(in thousands except for %)
Statutory tax rate 35.0% 35.0% 35.0%
Federal income taxes at statutory rate $6,703 $7,440 $7,514
Tax exempt municipal income (254) (283) (436)
Other (1) 950 7 (115)
Total $7,399 $7,164 $6,963
124 2017 ANNUAL REPORT FIRST GUARANTY BANCSHARES, INC.

There were no losses incurred on off-balance sheet commitments in 2017, 2016 or 2015.
Note 20. Fair Value MeasurementsThe fair value of a financial instrument is the current amount that would be received to sell an asset or paid to transfer a liability in an orderly transaction between market participants. A fair value measurement assumes that the transaction to sell the asset or transfer the liability occurs in the principal market for the asset or liability or, in the absence of a principal market, the most advantageous market for the asset or liability. Valuation techniques use certain inputs to arrive at fair value. Inputs to valuation techniques are the assumptions that market participants would use in pricing the asset or liability. They may be observable or unobservable. First Guaranty uses a fair value hierarchy for valuation inputs that gives the highest priority to quoted prices in active markets for identical assets or liabilities and the lowest priority to unobservable inputs. The fair value hierarchy is as follows:
Level 1 Inputs – Unadjusted quoted market prices in active markets for identical assets or liabilities that the reporting entity has the ability to access at the measurement date.
Level 2 Inputs – Inputs other than quoted prices included in Level 1 that are observable for the asset or liability, either directly or indirectly. These might include quoted prices for similar assets or liabilities in active markets, quoted prices for identical or similar assets or liabilities in markets that are not active, inputs other than quoted prices that are observable for the asset or liability (such as interest rates, volatilities, prepayment speeds or credit risks) or inputs that are derived principally from or corroborated by market data by correlation or other means.
Level 3 Inputs – Unobservable inputs for determining the fair values of assets or liabilities that reflect an entity’s own assumptions about the assumptions that market participants would use in pricing the assets or liabilities.
A description of the valuation methodologies used for instruments measured at fair value follows, as well as the classification of such instruments within the valuation hierarchy.
Securities available for sale.Securities are classified within Level 1 where quoted market prices are available in an active market. Inputs include securities that have quoted prices in active markets for identical assets. If quoted market prices are unavailable, fair value is estimated using quoted prices of securities with similar characteristics, at which point the securities would be classified within Level 2 of the hierarchy. Securities classified Level 3 as of December 31, 2017 include certain municipal bonds and an equity security.
Impaired loans.Loans are measured for impairment using the methods permitted by ASC Topic 310. Fair value of impaired loans is measured by either the fair value of the collateral if the loan is collateral dependent (Level 2 or Level 3), or the present value of expected future cash flows, discounted at the loan's effective interest rate (Level 3). Fair value of the collateral is determined by appraisals or by independent valuation.
Other real estate owned. Properties are recorded at the balance of the loan or at estimated fair value less estimated selling costs, whichever is less, at the date acquired. Fair values of other real estate owned ("OREO") at December 31, 2017 and 2016 are determined by sales agreement or appraisal, and costs to sell are based on estimation per the terms and conditions of the sales agreement or amounts commonly used in real estate transactions. Inputs include appraisal values or recent sales activity for similar assets in the property’s market; thus OREO measured at fair value would be classified within either Level 2 or Level 3 of the hierarchy.
Certain non-financial assets and non-financial liabilities are measured at fair value on a non-recurring basis including assets and liabilities related to reporting units measured at fair value in the testing of goodwill impairment, as well as intangible assets and other non-financial long-lived assets measured at fair value for impairment assessment.
The following table summarizes financial assets measured at fair value on a recurring basis as of December 31, 2017 and 2016, segregated by the level of the valuation inputs within the fair value hierarchy utilized to measure fair value:
First Guaranty's valuation methodologies may produce a fair value calculation that may not be indicative of net realizable value or reflective of future fair values. While Management believes the methodologies used are appropriate and consistent with other market participants, the use of different methodologies or assumptions to determine the fair value of certain financial instruments could result in a different estimate of fair value.
The change in Level 1 securities available for sale from December 31, 2016 was due principally to a net decrease in Treasury bills of $10.5 million. The change in Level 2 and Level 3 securities available for sale from December 31, 2016 was due principally due to the transfer of municipal securities from Level 3 to Level 2.
The following table reconciles assets measured at fair value on a recurring basis using unobservable inputs (Level 3):
There were no gains or losses for the period included in earnings attributable to the change in unrealized gains or losses relating to assets still held as of December 31, 2017.
December 31,
2017 2016
(in thousands)
Available for Sale Securities Fair Value Measurements Using:
Level 1:Quoted Prices in Active Markets For Identical Assets $19,980 $ 30,487
Level 2: Significant Other Observable Inputs 355,022 347,586
Level 3: Significant Unobservable Inputs 6,533 19,400
Securities available for sale measured at fair value $381,535 $397,473
Level 3 Changes
December 31,
2017 2016
(in thousands)
Balance, beginning of year $19,400 $ 7,701
Total gains or losses (realized/unrealized):
Included in earnings 54 -
Included in other comprehensive income - -
Purchases, sales, issuances and settlements, net 10,574 11,699
Transfers in and/or out of Level 3 (23,495) -
Balance as of end of year $ 6,533 $19,400
125

The following table measures financial assets and financial liabilities measured at fair value on a non-recurring basis as of December 31, 2017, segregated by the level of valuation inputs within the fair value hierarchy utilized to measure fair value:
ASC 825-10 provides First Guaranty with an option to report selected financial assets and liabilities at fair value. The fair value option established by this statement permits First Guaranty to choose to measure eligible items at fair value at specified election dates and report unrealized gains and losses on items for which the fair value option has been elected in earnings at each reporting date subsequent to implementation.
First Guaranty has chosen not to elect the fair value option for any items that are not already required to be measured at fair value in accordance with accounting principles generally accepted in the United States.
Note 21. Financial Instruments
Fair value estimates are generally subjective in nature and are dependent upon a number of significant assumptions associated with each instrument or group of similar instruments, including estimates of discount rates, risks associated with specific financial instruments, estimates of future cash flows and relevant available market information. Fair value information is intended to represent an estimate of an amount at which a financial instrument could be exchanged in a current transaction between a willing buyer and seller engaging in an exchange transaction. However, since there are no established trading markets for a significant portion of First Guaranty's financial instruments, First Guaranty may not be able to immediately settle financial instruments; as such, the fair values are not necessarily indicative of the amounts that could be realized through immediate settlement. In addition, the majority of the financial instruments, such as loans and deposits, are held to maturity and are realized or paid according to the contractual agreement with the customer.
Quoted market prices are used to estimate fair values when available. However, due to the nature of the financial instruments, in many instances quoted market prices are not available. Accordingly,
estimated fair values have been estimated based on other valuation techniques, such as discounting estimated future cash flows using a rate commensurate with the risks involved or other acceptable methods. Fair values are estimated without regard to any premium or discount that may result from concentrations of ownership of financial instruments, possible income tax ramifications or estimated transaction costs. The fair value estimates are subjective in nature and involve matters of significant judgment and, therefore, cannot be determined with precision. Fair values are also estimated at a specific point in time and are based on interest rates and other assumptions at that date. As events change the assumptions underlying these estimates, the fair values of financial instruments will change.
Disclosure of fair values is not required for certain items such as lease financing, investments accounted for under the equity method of accounting, obligations of pension and other postretirement benefits, premises and equipment, other real estate, prepaid expenses, the value of long-term relationships with depositors (core deposit intangibles) and other customer relationships, other intangible assets and income tax assets and liabilities. Fair value estimates are presented for existing on- and off-balance sheet financial instruments without attempting to estimate the value of anticipated future business and the value of assets and liabilities that are not considered financial instruments. In addition, the tax ramifications related to the realization of the unrealized gains and losses have not been considered in the estimates. Accordingly, the aggregate fair value amounts presented do not purport to represent and should not be considered representative of the underlying market or franchise value of First Guaranty.
Because the standard permits many alternative calculation techniques and because numerous assumptions have been used to estimate the fair values, reasonable comparison of the fair value information with other financial institutions' fair value information cannot necessarily be made. The methods and assumptions used to estimate the fair values of financial instruments are as follows:
Cash and due from banks, interest-bearing deposits with banks, federal funds sold and federal funds purchased.
These items are generally short-term and the carrying amounts reported in the consolidated balance sheets are a reasonable estimation of the fair values.
Investment Securities.
Fair values are principally based on quoted market prices. If quoted market prices are not available, fair values are based on quoted market prices of comparable instruments or the use of discounted cash flow analyses.
Loans Held for Sale.
Fair values of mortgage loans held for sale are based on commitments on hand from investors or prevailing market prices. These loans are classified within level 3 of the fair value hierarchy.
Loans, net.
Market values are computed present values using net present value formulas. The present value is the sum of the present value of all projected cash flows on an item at a specified discount rate. The discount rate is set as an appropriate rate index, plus or minus an appropriate spread. These loans are classified within level 3 of the fair value hierarchy.
December 31,
2017 2016
(in thousands)
Fair Value Measurements Using: Impaired Loans
Level 1: Quoted Prices in Active Markets For Identical Assets $ - $ -
Level 2: Significant Other Observable Inputs - 259
Level 3: Significant Unobservable Inputs 12,003 18,559
Impaired loans measured at fair value $12,003 $18,818
Fair Value Measurements Using: Other Real Estate Owned
Level 1: Quoted Prices in Active Markets For Identical Assets $ - $ -
Level 2: Significant Other Observable Inputs 1,249 226
Level 3: Significant Unobservable Inputs 32 133
Other real estate owned measured at fair value $ 1,281 $ 359
126 2017 ANNUAL REPORT FIRST GUARANTY BANCSHARES, INC.

Impaired loans
Fair value of impaired loans is measured by either the fair value of the collateral if the loan is collateral dependent (Level 2 or Level 3), or the present value of expected future cash flows, discounted at the loan's effective interest rate (Level 3). Fair value of the collateral is determined by appraisals or by independent valuation.
Accrued interest receivable.
The carrying amount of accrued interest receivable approximates its fair value.
Deposits.
Market values are actually computed present values using net present value formulas. The present value is the sum of the present value of all projected cash flows on an item at a specified discount rate. The discount rate is set as an appropriate rate index, plus or minus an appropriate spread. Deposits are classified within level 3 of the fair value hierarchy.
Accrued interest payable.
The carrying amount of accrued interest payable approximates its fair value.
Borrowings.
The carrying amount of federal funds purchased and other short-term borrowings approximate their fair values. The fair value of First Guaranty's long-term borrowings is computed using net present value formulas. The present value is the sum of the present value of all projected cash flows on an item at a specified discount rate. The discount rate is set as an appropriate rate index, plus or minus an appropriate spread. Borrowings are classified within level 3 of the fair value hierarchy.
Other Unrecognized Financial Instruments.
The fair value of commitments to extend credit is estimated using the fees charged to enter into similar legally binding agreements, taking into account the remaining terms of the agreements and customers' credit ratings. For fixed-rate loan commitments, fair value also considers the difference between current levels of interest rates and the committed rates. Noninterest-bearing deposits are held at cost. The fair values of letters of credit are based on fees charged for similar agreements or on estimated cost to terminate them or otherwise settle the obligations with the counterparties at the reporting date. At December 31, 2017 and 2016 the fair value of guarantees under commercial and standby letters of credit was not material.
The estimated fair values and carrying values of the financial instruments at December 31, 2017 and 2016 are presented in the following table:
December 31,
2017 2016
Carrying Value
Estimated Fair Value
Carrying Value
Estimated Fair Value
(in thousands)
Assets
Cash and cash equivalents $ 38,028 $ 38,028 $ 18,111 $ 18,111
Securities, available for sale $ 381,535 $ 381,535 $ 397,473 $ 397,473
Securities, held to maturity $ 120,121 $ 118,557 $ 101,863 $ 99,906
Federal Home Loan Bank stock $ 2,351 $ 2,351 $ 1,816 $ 1,816
Loans held for sale $ 1,308 $ 1,439 $ - $ -
Loans, net $ 1,139,789 $1,133,868 $ 937,807 $ 937,495
Accrued interest receivable $ 7,982 $ 7,982 $ 7,039 $ 7,039
Liabilities
Deposits $ 1,549,286 $1,549,449 $1,326,181 $1,325,972
Borrowings $ 38,274 $ 38,294 $ 28,600 $ 28,625
Junior subordinated debentures $ 14,664 $ 14,324 $ 14,630 $ 13,909
Accrued interest payable $ 2,488 $ 2,488 $ 1,931 $ 1,931
There is no material difference between the contract amount and the estimated fair value of off-balance sheet items that are primarily comprised of short-term unfunded loan commitments that are generally at market prices.
127

Note 22. Concentrations of Credit and Other Risks
First Guaranty monitors loan portfolio concentrations by region, collateral type, loan type, and industry on a monthly basis and has established maximum thresholds as a percentage of its capital to ensure that the desired mix and diversification of its loan portfolio is achieved. First Guaranty is compliant with the established thresholds as of December 31, 2017. Personal, commercial and residential loans are granted to customers, most of who reside in northern and southern areas of Louisiana. Although First Guaranty has a diversified loan portfolio, significant portions of the loans are collateralized by real estate located in Tangipahoa Parish and surrounding parishes in Southeast Louisiana. Declines in the Louisiana economy could result in lower real estate values which could, under certain circumstances, result in losses to First Guaranty.
The distribution of commitments to extend credit approximates the distribution of loans outstanding. Commercial and standby letters of credit were granted primarily to commercial borrowers. Generally, credit is not extended in excess of $10.0 million to any single borrower or group of related borrowers.
Approximately 41.4% of First Guaranty's deposits are derived from local governmental agencies at December 31, 2017. These governmental depositing authorities are generally long-term customers. A number of the depositing authorities are under contractual obligation to maintain their operating funds exclusively with First Guaranty. In most cases, First Guaranty is required to pledge securities or letters of credit issued by the Federal Home Loan Bank to the depositing authorities to collateralize their deposits. Under certain circumstances, the withdrawal of all of, or a significant portion of, the deposits of one or more of the depositing authorities may result in a temporary reduction in liquidity, depending primarily on the maturities and/or classifications of the securities pledged against such deposits and the ability to replace such deposits with either new deposits or other borrowings.
Public fund deposits totaled $640.7 million at December 31, 2017.
Note 23. Litigation
First Guaranty is subject to various legal proceedings in the normal course of its business. It is Management’s belief that the ultimate resolution of such claims will not have a material adverse effect on First Guaranty's financial position or results of operations.
Note 24. Condensed Parent Company InformationThe following condensed financial information reflects the accounts and transactions of First Guaranty Bancshares, Inc. for the dates indicated:
First Guaranty Bancshares, Inc.Condensed Balance Sheets
December 31,
2017 2016
(in thousands)
Assets
Cash $ 5,214 $ 16,088
Investment in bank subsidiary 170,836 141,241
Investment Securities (available for sale, at fair value) - 80
Other assets 6,086 4,197
Total Assets $182,136 $161,606
Liabilities and Shareholders' Equity
Short-term debt $ - $ -
Senior long-term debt 22,774 22,100
Junior subordinated debentures 14,664 14,630
Other liabilities 715 527
Total Liabilities 38,153 37,257
Shareholders' Equity 143,983 124,349
Total Liabilities and Shareholders' Equity $182,136 $161,606
128 2017 ANNUAL REPORT FIRST GUARANTY BANCSHARES, INC.

First Guaranty Bancshares, Inc.Condensed Statements of Income
December 31,
2017 2016 2015
(in thousands)
Operating Income
Dividends received from bank subsidiary $10,622 $11,858 $ 9,843
Net gains on securities 54 - 2,652
Other income 171 160 261
Total operating income 10,847 12,018 12,756
Operating Expenses
Interest expense 1,518 1,444 192
Salaries & Benefits 495 200 172
Other expenses 1,147 948 766
Total operating expenses 3,160 2,592 1,130
Income before income tax benefit and increase in equity in undistributed earnings of subsidiary 7,687 9,426 11,626
Income tax benefit (expense) 834 846 (605)
Income before increase in equity in undistributed earnings of subsidiary 8,521 10,272 11,021
Increase in equity in undistributed earnings of subsidiary 3,230 3,821 3,484
Net Income 11,751 14,093 14,505
Less preferred stock dividends - - (384)
Net income available to common shareholders $11,751 $14,093 $14,121
129

First Guaranty Bancshares, Inc.Condensed Statements of Cash Flows
December 31,
2017 2016 2015
(in thousands)
Cash flows from operating activities:
Net income $11,751 $14,093 $14,505
Adjustments to reconcile net income to net cash provided by operating activities:
Increase in equity in undistributed earnings of subsidiary $ (3,230) $(3,821) $(3,484)
Depreciation and amortization 43 7 -
Gain on sale of securities (54) - (2,652)
Net change in other liabilities 187 318 (28)
Net change in other assets (1,306) (971) 396
Net cash provided by operating activities 7,391 9,626 8,737
Cash flows from investing activities:
Proceeds from maturities, calls and sales of AFS securities 134 - 4,152
Funds invested in AFS securities - - (10)
Funds invested in bank subsidiary (3,750) - -
Cash paid in acquisition (10,108) - -
Net cash provided by (used in) investing activities (13,724) - 4,142
Cash flows from financing activities:
Net decrease in short-term borrowings - (1,800) -
Proceeds from long-term debt, net of costs 3,750 - 24,969
Repayment of long-term debt (3,081) (3,730) (1,584)
Proceeds from junior subordinated debentures, net of costs - - 14,597
Issuance of common stock, net of costs - - 9,344
Redemption of preferred stock - - (39,435)
Dividends paid (5,210) (4,870) (4,631)
Net cash (used in) provided by financing activities (4,541) (10,400) 3,260
Net (decrease) increase in cash and cash equivalents (10,874) (774) 16,139
Cash and cash equivalents at the beginning of the period 16,088 16,862 723
Cash and cash equivalents at the end of the period $5,214 $16,088 $16,862
130 2017 ANNUAL REPORT FIRST GUARANTY BANCSHARES, INC.

Item 5 - Market for Registrant’s Common Equity, Related Shareholder Matters and Issuer Purchases of Equity SecuritiesShares of our common stock are traded on the NASDAQ Global Marketplace under the symbol "FGBI". As of December 31, 2017, there were approximately 1,500 holders of record of our common stock.
The following table sets forth the quarterly high and low reported sales prices for our common stock for the years ended December 31, 2017 and 2016. These reported sales prices represent trades that were quoted on the NASDAQ.
Our shareholders are entitled to receive dividends when, and if, declared by the Board of Directors, out of funds legally available for dividends. We have paid consecutive quarterly cash dividends on our common stock for each of the last 98 quarters dating back to the third quarter of 1993. The Board of Directors intends to continue to pay regular quarterly cash dividends. The ability to pay dividends in the future will depend on earnings and financial condition, liquidity and capital requirements, regulatory restrictions, the general economic and regulatory climate and ability to service any equity or debt obligations senior to common stock. There are legal restrictions on the ability of First Guaranty Bank to pay cash dividends to First Guaranty Bancshares, Inc. Under federal and state law, we are required to maintain certain surplus and capital levels and may not distribute dividends in cash or in kind, if after such distribution we would fall below such levels. Specifically, an insured depository institution is prohibited from making any capital distribution to its shareholders, including by way of dividend, if after making such distribution, the depository institution fails to meet the required minimum level for any relevant capital measure including the risk-based capital adequacy and leverage standards.
Additionally, under the Louisiana Business Corporation Act, First Guaranty Bancshares, Inc. is prohibited from paying any cash dividends to shareholders if, after the payment of such dividend First Guaranty Bancshares would not be able to pay its debts as they became due in the usual course of business or its total assets would be less than its total liabilities or where net assets are less than the liquidation value of shares that have a preferential right to participate in First Guaranty Bancshares, Inc.’s assets in the event First Guaranty Bancshares, Inc. were to be liquidated.
2017 2016
Quarter Ended*: High Low Dividend High Low Dividend
March 31, $ 22.00 $21.37 $ 0.16 $16.83 $15.50 $ 0.16
June 30, $ 24.82 $24.69 $ 0.16 $ 16.15 $15.95 $ 0.16
September 30, $ 24.55 $24.24 $ 0.16 $ 16.41 $16.17 $ 0.16
December 31, $ 25.02 $24.63 $ 0.16 $ 23.93 $23.32 $ 0.16
* Data above has not been adjusted to reflect the ten percent stock dividend paid December 14, 2017 to shareholders of record as of December 8, 2017.
www.fgb.net
131
Corporate Information
Annual Meeting
The Annual Meeting of Shareholders will convene at
2:00 PM Central Daylight Saving Time (CDT) on
Thursday, May 17, 2018 in the Auditorium,
First Guaranty Square, 400 East Thomas Street
Hammond, Louisiana
Corporate Headquarters
First Guaranty Square
400 East Thomas Street
Hammond, Louisiana 70401-3320
Telephone: (985) 345-7685
Shareholder Services
First Guaranty Bank
Post Office Box 2009
Hammond, Louisiana 70404-2009
Contact: Vanessa R. Drew
Telephone: (985) 375-0343
Email: [email protected]
Certified Public Accountants
Castaing, Hussey & Lolan, LLC
New Iberia, Louisiana
Financial and General Information
Persons seeking financial or other information about the
Company are invited to contact:
Eric J. Dosch
Chief Financial Officer, Treasurer and Secretary
First Guaranty Bancshares, Inc.
Post Office Box 2009
Hammond, Louisiana 70404-2009
Telephone (985) 375-0308
Notice to Shareholders
A copy of the First Guaranty Bancshares, Inc. Annual Report
filed on Form 10-K with the U.S. Securities and Exchange
Commission can be accessed through the Company’s website at
www.fgb.net or is available without charge by writing.
132 2017 ANNUAL REPORT FIRST GUARANTY BANCSHARES, INC.

EXPECTMORE
RELIABLE DEPENDABLE
P
REDICTABLE

20
17
FIR
ST
GU
AR
AN
TY
BA
NC
SH
AR
ES
, INC
. AN
NU
AL
RE
PO
RT
www.fgb.net
EXPECT MORE
0
200
400
600
800
1000
1200
201720162015201420132008200319981993
ANNUAL REPORT 2017
Loans, Net of Unearned Income(in millions)