What Should Shipping Expect From China, Japan, & Korea
15
1 What Should Shipping Expect From China, Japan, & Korea June 2014 Julian Proctor, Managing Director & Head of Investment Team, Tiger Group Investments
-
Upload
khangminh22 -
Category
Documents
-
view
1 -
download
0
Transcript of What Should Shipping Expect From China, Japan, & Korea

1
What Should Shipping Expect From China, Japan, & Korea June 2014
Julian Proctor, Managing Director & Head of Investment Team, Tiger Group Investments

2
Country Profile – China

3
China – Shipbuilding
Yards Need Higher Prices
Source: Tiger Internal Estimates
• Building at or below breakeven levels for orders placed in 2012-13
• Banks unwilling to fund refund guarantees on loss making projects
• Subsidy for SOE shipyards for orders placed by SOEs (i.e. COSCO, CSCL,CSG etc.), essentially keeping it all in the family
• Chaotic mix of federal, provincial and municipal state owned, SOE shipyards, Chinese private (1st, 2nd, 3rd , and 4th tier yards), foreign owned yards – almost 3,000 yards
• Simply put, there are too many yards and too many owners willing to take risks
4%4%
4%
4%
3%
3%
3%
3%
2%
2%
68%
Jiangsu New YZJ
Zhejiang Yangfan
Chengxi Shipyd.
Sinopacific Dayang
COSCO Group
Shanghai Waigaoqiao
CIC (Jiangsu)
Weihai Samjin
Fujian Southeast
Jinling Shipyard
Others
Chaotic Mix – Share of Current Orderbook
Note: Based on number of vessels, total: 2,408 vessels
$0
$10
$20
$30
$40
$50
$60
$70
$80
$90
$100
2008 2009 2010 2011 2012 2013 Q1 2014 Q2 2014
Capesize Newbuild Price Average Capesize Newbuild Breakeven Price
Note: Calculated breakeven of $55m and then adjusted where by the inflation rate to arrive at approximation
Source: Clarksons

4
-15%
-10%
-5%
0%
5%
10%
15%
20%
25%
2008 2009 2010 2011 2012 2013
YZJ COSCORongsheng China Shipbuilding Industra-AGuangzhou Shipyard China CSSC
China – Shipbuilding
Margins Under Pressure Inflationary Pressure TBC
• Inflation starting to bite, productivity not keeping pace
• Many banks not prepared to issue refund guarantees on loss making projects, adding further pressure on yards
• Subsidy program for SOE shipyards for orders placed by SOEs (COSCO, CSG, etc.), keeping it all in the family
-10
-5
0
5
10
15
30
35
40
45
50
55
60
65
2005 2006 2007 2008 2009 2010 2011 2012 2013 2014
CPMI (LHS) CPPI (RHS)
Y-o-Y Change Index Value
Source: Bloomberg Source: Bloomberg

5
--
$20bn
$40bn
$60bn
$80bn
$100bn
$120bn
$140bn
2011 2012 2013
RMB Lending In USD Equivalents
--
$2bn
$4bn
$6bn
$8bn
$10bn
2011 2012 2013
USD Lending
China – Ship Finance
Chinese Banks: USD Lending Compared To RMB
• Higher funding costs faced by Chinese banks being passed through to owners (L+350 bps unless very strategic project)
• Banks will negotiate harshly if possible
• Recent hype around leasing companies is a very short-term phenomenon, with banks merely fulfilling their mandate
• Basel 3 will also have a substantial impact
Source: PBOC Note: Converted RMB lending to USD using a fixed exchange rate of 6.3
Hidden Bad Debts: The Nanjing Tanker Saga
• Nanjing Tanker is recent a notable example of the “hidden bad debts” in China’s banking system
• Despite a drastic fall in Operating Profit, lenders were willing to extend new loans to Nanjing Tanker
• Currently unclear how many Chinese shipping companies are likely to encounter a similar fate
Source:Lloyd’s List, Nanjing Tanker filings, Google Finance
23% CAGR
15% CAGR
886
1,468 1,528
1,568 0.2% 0.3%
(8.9%)
(12.8%)
(14.0%)
(12.0%)
(10.0%)
(8.0%)
(6.0%)
(4.0%)
(2.0%)
2.0%
--
200
400
600
800
1,000
1,200
1,400
1,600
1,800
2009 2010 2011 2012
Net Debt (US$m) Operating Profit / Net Debt

6
China – Cargo
Iron-ore Imports
• Increasing end-user demand from Chinese steel Industry
• Demand highly fragmented with the top 10 Chinese steel mills accounting for 35% of crude steel output in 2013
• Consolidation to drive economies of scale
• The leading driver in world trade, but the Chinese have a hard time to gauge
• Conflicts between the objectives of SOEs
Source: Clarksons, Xinhua Financial Network News
Capesize TC & Spot Rates $/day
• 2014 Chinese Iron ore imports are forecasted to be ~2x the level seen in 2008, but yet rates remain 4x lower
• China continues to play the arbitrage game between domestic supplies, Brazil and Australia
• Strategic government objective to transport 60% of seaborne oil imports through local shipping companies
$/ton
$0
$20,000
$40,000
$60,000
$80,000
$100,000
$120,000
2008 2009 2010 2011 2012 2013 2014
$0$5
$10$15$20$25$30$35$40$45
Tubarao Beilun, Bao Hay Point Qingdao
2009 2010 2011 2012 2013 H2 2014
436
615 603665
724795
897
0MT
100MT
200MT
300MT
400MT
500MT
600MT
700MT
800MT
900MT
1,000MT
2008 2009 2010 2011 2012 2013 2014 (f)
Source: Clarksons
Source: Clarksons
7
Country Profile – Korea

8
Korea – Shipbuilding
• Korean yards still some of the best in the world
• Outsourcing substantial amounts of steel work to China
• Yards slots are taken right up till H1 2016
Korean Yards Forward Deliveries Rising Korean Won (Won to USD)
• Rising Won a big concern for Korean yards
• Potential exposure to offshore industry
Source: Clarksons, Bloomberg
$0.0006
$0.0007
$0.0007
$0.0008
$0.0008
$0.0009
$0.0009
$0.0010
$0.0010
$0.0011
$0.0011
06/04 06/05 06/06 06/07 06/08 06/09 06/10 06/11 06/12 06/13 06/14
0
20
40
60
80
100
120
140
160
180
200
Hyundai Group
Daewoo STX SPP Sungdong Daehan Samsung H.I.
Dae Sun
2014 2015 2016 2017
Note: total orderbook stands at 1,043 vessels Source: Clarksons Source: Bloomberg

9
$9bn
$10bn
$14bn
$17bn
--
2
4
6
8
10
12
14
16
18
2010 2011 2012 2013
25% CAGR
Korea – Ship Finance
• Korea Exim Bank appears to be the largest Korean lender to the shipping industry
• Relatively small players, except for government agencies
• Export credit agencies remain open, as evidenced by the 25% CAGR in Korea Exim Bank’s shipping loan portfolio since 2010
• Decline in CDS prices for Korea Exim Bank debt suggests improved credit environment for Korean government agencies
• Significantly lower government bond yields likely to encourage Korean insurers and pension funds to seek higher yielding assets
Korea Exim Bank – Shipping Loan Portfolio ($bn) Improving Credit Environment
Note: Based on available reporting
Korea Exim Bank – CDS Prices (2009 – 2014 YTD)
Korean Government – 10-Year Bond Yields (June 2009 – 2014 YTD)
2.5%3.0%3.5%4.0%4.5%5.0%5.5%6.0%
06/09 06/10 06/11 06/12 06/13 06/14
Source: Petrofin Research
Source: Bloomberg

10
Country Profile – Japan

11
Japan – Shipbuilding
Resurgent Japan- Share of Global Orderbook Japanese Orderbook By Type
24%
21%20%
18% 18%
22%
0%
5%
10%
15%
20%
25%
2008 2009 2010 2011 2012 2013
63%
3%
9%
1%
2%
4%
18%
Bulk
Container
Chem & Oil
Tankers
LNG
LPG
Other
• A reorganized and consolidated industry
• Focused on the production of certain types of vessels depending on yard
• Weakening Yen making prices more attractive
• Older work force still an issue- several yards have visa programs to import Chinese workers
• Ability to do new designs, but scope to accommodate change is limited
• Potential big change is willingness to take USD contracts, even though Japan was already a large part of the world economy
Weakening Yen Helping (Yen to USD)
¥70
¥75
¥80
¥85
¥90
¥95
¥100
¥105
2009 2010 2011 2012 2013 2014
Note: Based on number of vessels, total: 907 vessels Note: Based on annual Japanese orderbook DWT and Global orderbook DWT Source: Clarksons Source: Clarksons
Source: Bloomberg

12
$0
$10
$20
$30
$40
$50
$60
2010 2011 2012 2013
BTMU SMBC JBIC
Japan – Ship Finance
Japanese Banks - Shipping Loan Portfolios ($bn)
Source: JBIC Annual Report, Petrofin Research
• Japanese banks mostly focused on domestic owners, who are financed in Japanese Yen
• Hit hard by the Japanese Yen and global shipping crisis. Major banks only just looking at shipping again
• Particular focus on LNG and offshore sector
3-Year CAGR: 58.8%
3-Year CAGR: 0.0%
3-Year CAGR: (4.1%)
13
Japan – Cargo
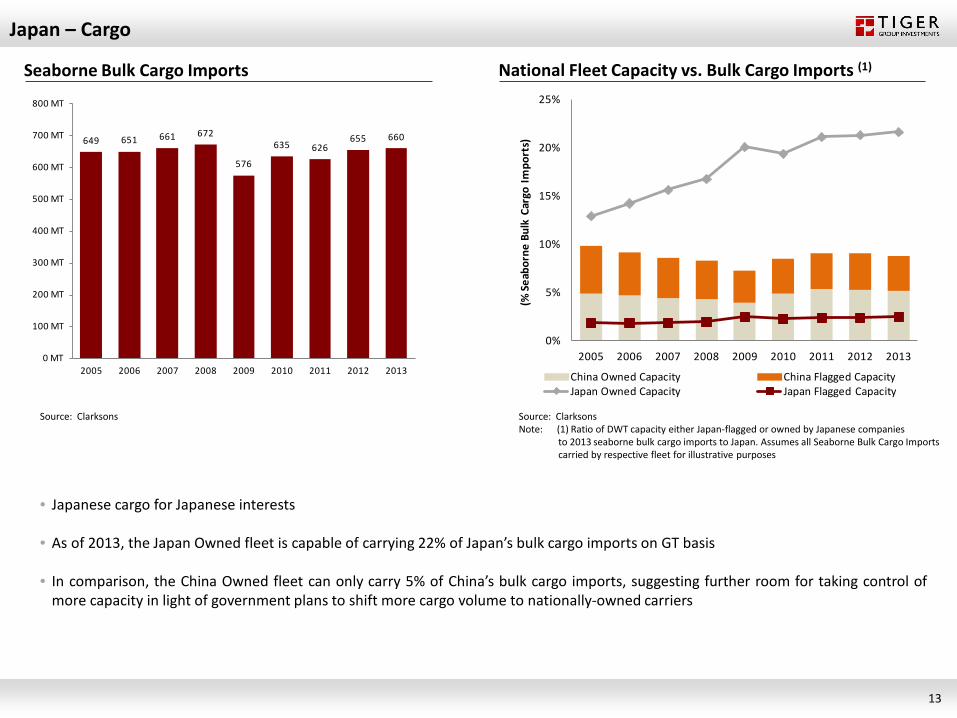
Seaborne Bulk Cargo Imports
Source: Clarksons
649 651 661 672
576
635 626655 660
0 MT
100 MT
200 MT
300 MT
400 MT
500 MT
600 MT
700 MT
800 MT
2005 2006 2007 2008 2009 2010 2011 2012 2013
0%
5%
10%
15%
20%
25%
2005 2006 2007 2008 2009 2010 2011 2012 2013
(% Se
abor
ne B
ulk
Carg
o Im
port
s)
China Owned Capacity China Flagged CapacityJapan Owned Capacity Japan Flagged Capacity
• Japanese cargo for Japanese interests
• As of 2013, the Japan Owned fleet is capable of carrying 22% of Japan’s bulk cargo imports on GT basis
• In comparison, the China Owned fleet can only carry 5% of China’s bulk cargo imports, suggesting further room for taking control of more capacity in light of government plans to shift more cargo volume to nationally-owned carriers
Source: Clarksons Note: (1) Ratio of DWT capacity either Japan-flagged or owned by Japanese companies to 2013 seaborne bulk cargo imports to Japan. Assumes all Seaborne Bulk Cargo Imports carried by respective fleet for illustrative purposes
National Fleet Capacity vs. Bulk Cargo Imports (1)

14
Concluding Remarks
15
Concluding remarks
• National economic agendas and foreign policy will drive larger fleets and stronger capabilities in ship yard production particularly in Japan and China
• Currency movements from the Big 3 will have the largest consequences on their shipwoning and yard footprints, especially given their addiction to local currency debt; Korea and Japan exposed if China decides to unexepected depreciate RMB to support growth in next years
• Foreign shipowners will find it harder to compete for Asian cargo given implicit national cargo policy, whilst select Asian shipowners will continues to benefit from superior access to low cost capital, subsidies and often policy driven goals – resulting in substantial competition to international owners