High-resolution continuum-source atomic absorption spectrometry: what can we expect?
Upload
khangminh22Category
view
3download
0
See the last page for disclaimer Page 1 of 9
中
外
运
输
Eq
uit
y R
ese
arc
h
Eq
uit
y R
ese
arc
h R
ep
ort
证
券
研
究
报
告
Co
mp
an
y R
ep
ort
股
票
研
究
公
司
报
告
证
券
研
究
报
告
[Tabl
e_Inf
o1] 消
费
行
业-
酒
店
Co
ns
um
er
Sec
tor-
Ho
tels
[Tab
le_I
nfo2
]
携
程
旅
行
网
Ctr
ip.c
om
In
tern
ati
on
al
(CT
RP
US
)
[Table_Title] Company Report: Ctrip.com International (CTRP US) Noah Hudson
Hudson (86755) 2397 6684
公司报告: 携程旅行网 (CTRP US) [email protected]
2 November 2018
[Table_Summary] Expect Operating Margin to Continue to Climb
预计运营利润率持续攀升
For 3Q18, Ctrip's management guides for revenue YoY growth from
13% to 18% and non-GAAP operating profit in the range of RMB1.8-1.9
bn. In 2Q18, Ctrip's non-GAAP operating profit (excluding share-based
compensation charges) was RMB1.2 bn, flat YoY and 7.1% below Bloomberg
consensus forecast; net revenue was RMB7.3 bn, up 13.3% YoY and on the
lower end of the management's previous growth guidance range; gross
margin fell to 79.9% vs. 82.6% in 2Q17 as Ctrip upgraded service of its
standards; non-GAAP operating margin was 16.5%, down by 2.4 ppt YoY;
net income was RMB2.4 bn, vs. RMB359 mn in 2Q17, largely due to gains
from equity securities fair value change; and excluding share-based
compensation charges and fair value changes of equity securities,
non-GAAP diluted earnings per ADR was RMB1.90, up 27.5% YoY.
We forecast 2018-2020 non-GAAP operating income of RMB4.8 bn,
RMB6.5 bn and RMB8.7 bn, respectively, reflecting 22.0% CAGR. We
forecast 2018-2020 fully diluted earnings per ADR of RMB2.09, RMB4.83
and RMB9.05, respectively.
We lower our target price from US$52.00 to US$38.00 and downgrade to
"Accumulate" investment rating. We expect Ctrip's top-line growth and
market share to continue to grow rapidly as it becomes more profitable over
the medium to long term. In addition, with a large cash balance, we expect
Ctrip to continue to make strategic investments, both in China and
internationally, thereby further expanding its business scale. Our US$38.00
target price is a 19.6% discount to our DCF derived NAV of US$47.43.
携程管理层对 2018 年 3 季度收入同比增长的指引为 13%-18%,对该季度非通用会计准
则下运营利润的指引则为人民币 18-19 亿元。2018 年第 2 季度,携程非通用会计准则下
运营利润(剔除基于股份的薪酬开支)为人民币 12 亿元,与去年同期持平,低于彭博一
致预期 7.1%;净收入为人民币 73 亿元,同比增长 13.3%,达到管理层之前增长预测的低
位水平;毛利率随携程升级其服务标准下降至 79.9%(去年同期为 82.6%);非通用会计
准则下运营利润率为 16.5%,同比下降 2.4 个百分点;得益于权益性证券公允价值变动带
来的收益,公司净利润达到人民币 24 亿元(去年同期为人民币 3.59 亿元);剔除基于股
份的薪酬开支及权益性证券公允价值变动收益,非通用会计准则下稀释后每份 ADR 净利
为人民币 1.90 元,同比上升 27.5%。
我们预计 2018-2020 年非通用会计准则下运营利润将分别为人民币 48、65 和 87 亿元,
年复合增长率为 22.0%。我们预计 2018-2020 年完全稀释后每份 ADR 净利分别为人民币
2.09、4.83 和 9.05 元。
我们将目标价由 52.00 美元下调至 38.00 美元,下调投资评级至“收集”。我们预计随着
携程中长期盈利能力增强,其收入增长及市场份额将持续快速提升。此外,预计持充裕现
金的携程将持续在国内外进行战略投资,进一步扩大其商业规模。我们 38.00 美元的目标
价对于我们用折现现金流方法得出的 47.43 美元的每份 ADR 估值有 19.6%的折让。
[Table_Rank] Rating: Accumulate
Downgraded
评级: 收集 (下调)
[Table_Price] 6-18m TP目标价: US$38.00
Revised from 原目标价: US$52.00
ADR price ADR价格: US$34.880
Stock performance
股价表现
[Table_QuotePic]
(40)
(30)
(20)
(10)
0
10
20
30
Nov-17 Dec-17 Feb-18 Apr-18 May-18 Jul-18 Sep-18 Oct-18
% change
NASDAQ COMP Index CTRIP
Change in ADR Price
ADR 价变动
1 M
1 个月
3 M
3 个月
1 Y
1 年
Abs. % 绝对变动 %
(6.9) (15.1) (24.9)
Rel. % to NASDAQ index 相对纳指变动 %
0.2 (10.3) (35.6)
Avg. ADR price (USD) 平均 ADR 价(美元)
36.8 38.6 44.3
Source: Bloomberg, Guotai Junan International.
[Table_Profit] Year End Turnover Net Profit Earnings/ADR Earnings/ADR PER BV/ADR PBR DP ADR Yield ROE
年结 收入 股东净利 每份 ADR 净利 每份ADR净利变
动
市盈率 每份ADR净资产 市净率 每份 ADR 股息 股息率 净资产收益率
12/31 (RMB m) (RMB m) (RMB) (△ %) (x) (RMB) (x) (RMB) (%) (%)
2016A 19,228 (1,431) (3.023) n.a. n.a. 151.134 1.6 0.0 0.0 (2.4)
2017F 26,780 2,142 4.067 n.a. 55.8 159.677 1.4 0.0 0.0 2.7
2018F 30,326 1,417 2.689 (33.9) 85.4 156.460 1.5 0.0 0.0 1.6
2019F 35,125 3,099 5.051 87.9 45.5 150.967 1.5 0.0 0.0 3.4
2020F 40,784 5,802 9.137 80.9 25.1 159.697 1.4 0.0 0.0 6.0
[Table_BaseData] ADR in issue (m) 总 ADR 数 (m) 545.2 Major shareholder 大股东 Baidu (BIDU US) 21.0%
Market cap. (US$ m) 市值 (US$ m) 19,017.2 Free float (%) 自由流通比率 (%) 71.0
3 month average vol. 3 个月平均成交股数 (‘000) 5,416.1 FY18 Net gearing (%) FY18 净负债/股东资金 (%) 36.1
52 Weeks high/low (US$) 52 周高/低 (US$) 51.910 / 29.660 FY18 Est. NAV (US$) FY18 每 ADR 估值(美元) 47.4
Source: the Company, Guotai Junan International.

Co
mp
an
y R
ep
ort
See the last page for disclaimer Page 2 of 9
[Table_RightMar1]
2 N
ove
mb
er
20
18
[Table_RightMar2]
Ctr
ip.c
om
In
tern
atio
na
l 携
程旅
行网
(C
TR
P U
S)
Ctrip.com International (CTRP US)
2Q18 REVIEW
Ctrip's 2Q18 net revenue was RMB7.3 billion, reflecting an increase of 13.3% YoY, which is on the lower end of Ctrip's
management's previous guidance range of 12% to 17% growth. Accommodation reservation revenue was RMB2.8 million,
up 20.8% YoY, primarily driven by an increase in accommodation reservation volume. Ctrip further expanded its total hotel
coverage to close to 1.4 million properties, an increase of 26% YoY. Ctrip's international hotel room night bookings increased by
40% YoY, more than doubling the outbound industry growth pace. Transportation ticketing revenue was RMB3 billion, up just
1% YoY. Ground transportation including train ticketing, bus ticketing and car services continued to grow rapidly. The air
ticketing segment also maintained very strong volume growth momentum across all platforms, but air ticketing revenue growth
was partially offset by the decrease of per air ticket segment revenue. Ctrip has continued to extend its multi-model
transportation offering such as free airport shuttle buses and airport parking vouchers. Package tour revenue was RMB839
million, up 31% YoY primarily driven by increase in volume growth of both organized tours and self-guided tours.
Non-GAAP 2Q18 operating profit (which excludes share-based compensation expense) was RMB1.2 billion, flat YoY
and 7.1% below Bloomberg consensus forecast, while non-GAAP operating profit hit the upper bound of Ctrip’s
management's previous guidance range of RMB1.1 billion to RMB 1.2 billion in 2Q18; this wasn't really a positive surprise since
it has met or exceeded the upper bound of Ctrip’s management's previous guidance range in every quarter at least since 3Q16.
Non-GAAP operating margin was 16.5%, up from 14.4% in the previous quarter but down by 2.4 ppt compared to the same
quarter last year. Gross margin fell to 79.9% compared to 82.6% during 2Q17 as Ctrip upgraded its service standards across its
business.
Excluding share-based compensation charges and fair value changes of equity security investments, 2Q18 non-GAAP
diluted earnings per ADR was RMB1.90, up 27.5% YoY. Net income was RMB2.4 billion compared to RMB359 million for the
same period in 2017 and RMB1.1 billion in the previous quarter, largely due to gains from equity securities measured at fair
value and investing activities. Excluding share-based compensation charges and fair value changes of equity securities
investments, non-GAAP net income was RMB1.1 billion, up 25.4% YoY.
Table-1: Ctrip Results
(% or ppt.)
RMB million 2Q17A 3Q17A 4Q17A 1Q18A 2Q18A
YoY QoQ
Net Revenues 6,459 7,900 6,379 6,731 7,319
13.3% 8.7%
Gross Income 5,334 6,596 5,318 5,487 5,850
9.7% 6.6%
Gross Profit Margin 82.6% 83.5% 83.4% 81.5% 79.9%
(2.7) ppt (1.6) ppt
Operating Income 687 1,359 508 590 724
5.4% 22.7%
Operating Margin 10.6% 17.2% 8.0% 8.8% 9.9%
(0.7) ppt 1.1 ppt
Share Based Compensation Expense (528) (384) (400) (376) (480)
9.1% (27.7%)
Non-GAAP Operating Income 1,215 1,743 908 966 1,204
(0.9%) 24.6%
Non-GAAP Operating Income Margin 18.8% 22.1% 14.2% 14.4% 16.5%
(2.4) ppt 2.1 ppt
Interest Expense (net) (133) (47) 13 158 (47)
64.7% n.a.
Other 397 233 337 397 2,256
468.1% 468.3%
Income Tax Expense (540) (313) (289) (179) (322)
(40.4%) 79.9%
Effective Tax Rate 58.4% 19.9% 38.1% 14.6% 11.8%
(46.5) ppt (2.8) ppt
Income from Affiliates (26) 32 (98) 78 (213)
(719.2%) n.a.
Non-controlling Interest (26) (35) 34 16 (17)
33.5% n.a.
Net Income 359 1,229 504 1,060 2,381
563.2% 124.6%
Net Income Margin 5.6% 15.6% 7.9% 15.7% 32.5%
27.0 ppt 16.8 ppt
Less:
Gain on F.V. Change of Equity Investments 0 0 0 (688) 1,750
n.a. n.a.
Share Based Compensation Expense (528) (384) (400) (376) (480)
9.1% (27.7%)
Non-GAAP Net Income 887 1,613 904 2,124 1,111
25.3% (47.7%)
Non-GAAP Net Income Margin 13.7% 20.4% 14.2% 31.6% 15.2%
1.4 ppt (16.4) ppt
Fully Diluted Earnings per ADR (RMB) 0.65 2.10 0.88 1.81 3.89
501.3% 114.9%
Non-GAAP Fully Diluted Earnings per ADR (RMB) 1.49 2.70 1.56 3.48 1.90
27.5% (45.4%)
Source: the Company, Guotai Junan International.

Co
mp
an
y R
ep
ort
See the last page for disclaimer Page 3 of 9
[Table_RightMar1]
2 N
ove
mb
er
20
18
[Table_RightMar2]
Ctr
ip.c
om
In
tern
atio
na
l 携
程旅
行网
(C
TR
P U
S)
Ctrip.com International (CTRP US)
Ctrip's international air ticketing outperformed during 2Q18. Excluding Skyscanner, with strong growth for both outbound
travel and Trip.com, Ctrip's international air tickets achieved 40% YoY volume growth, around two times faster than the overall
Chinese outbound ticket growth rate. Skyscanner's total revenue growth maintained a healthy rate of approximately 30% YoY,
driven largely by strong traffic growth. Trip.com continued to perform very well, achieving triple-digit growth in air ticket volume
for the seventh consecutive quarter. Ctrip recently launched both local activity and airport transfer services in certain target
markets and plans to expand these product lines into other markets in the months ahead.
Figure-1: Ctrip Revenue Growth Breakdown Figure-2: Ctrip Operating Income Margin
45.6%
46.4%
41.8%
25.9%
10.6%13.3%
0%
10%
20%
30%
40%
50%
60%
1Q17A 2Q17A 3Q17A 4Q17A 1Q18A 2Q18A
Accommodation Transportation TicketingPackaged Tour Corporate TravelTotal
6.8%
10.6%17.2%
8.0%8.8%
9.9%
15.4%
18.8%
22.1%
14.2%14.4%
16.5%
0%
5%
10%
15%
20%
25%
1Q17A 2Q17A 3Q17A 4Q17A 1Q18A 2Q18A
Operating Income Margin
Non-GAAP Operating Income Margin
Source: the Company, Guotai Junan International. Source: the Company, Guotai Junan International.
OUTLOOK & FORECAST REVISIONS
We revise down our forecasts for Ctrip's 2018-2020 net revenue by 2.9%, 9.7% and 16.4%, respectively. For 3Q18,
Ctrip's management guides net revenue growth of 13% YoY to 18% YoY, which is less than our previous forecast. Despite
strong execution from Ctrip, we now revise down our revenue forecasts as we expect revenue growth to slow as a number of
macro indicators point to a slowing economy. We think the recent depreciation of the RMB could negatively impact Ctrip's
outbound air ticketing, which has been one of Ctrip's strongest segments. According to the China National Tourism
Administration, China's domestic tourism revenue was RMB2.45 trillion in 1H18, up 12.5% YoY, reflecting a slowdown in growth
compared to the 15.2% and 15.9% growth rate achieved in 2016 and 2017, respectively. The China Tourism Academy
forecasts domestic tourism revenue to reach RMB5.07 trillion in 2018, an increase of 11%, which if achieved, would be the
slowest growth rate since 2015 when China's domestic tourism revenue increased by 10.5%.
Figure-3: Ctrip Total Net Revenue Figure-4: Ctrip Revenue Breakdown
19.2 26.8 30.8 36.3 42.7
76.5%
39.5%
14.8% 17.9% 17.7%
0%
20%
40%
60%
80%
100%
0
5
10
15
20
25
30
35
40
45
2016A 2017A 2018F 2019F 2020F
Total Net Revenue Growth
RMB mn
35.5%
45.6%
11.2%
2.8%
5.7%
Hotels38.0%
Ticketing40.7%
Packaged-tour
12.3%
Corporate Travel
3.1%
Others6.0%
2018F
2017A
Source: the Company, Guotai Junan International. Source: the Company, Guotai Junan International.
Co
mp
an
y R
ep
ort
See the last page for disclaimer Page 4 of 9
[Table_RightMar1]
2 N
ove
mb
er
20
18
[Table_RightMar2]
Ctr
ip.c
om
In
tern
atio
na
l 携
程旅
行网
(C
TR
P U
S)
Ctrip.com International (CTRP US)
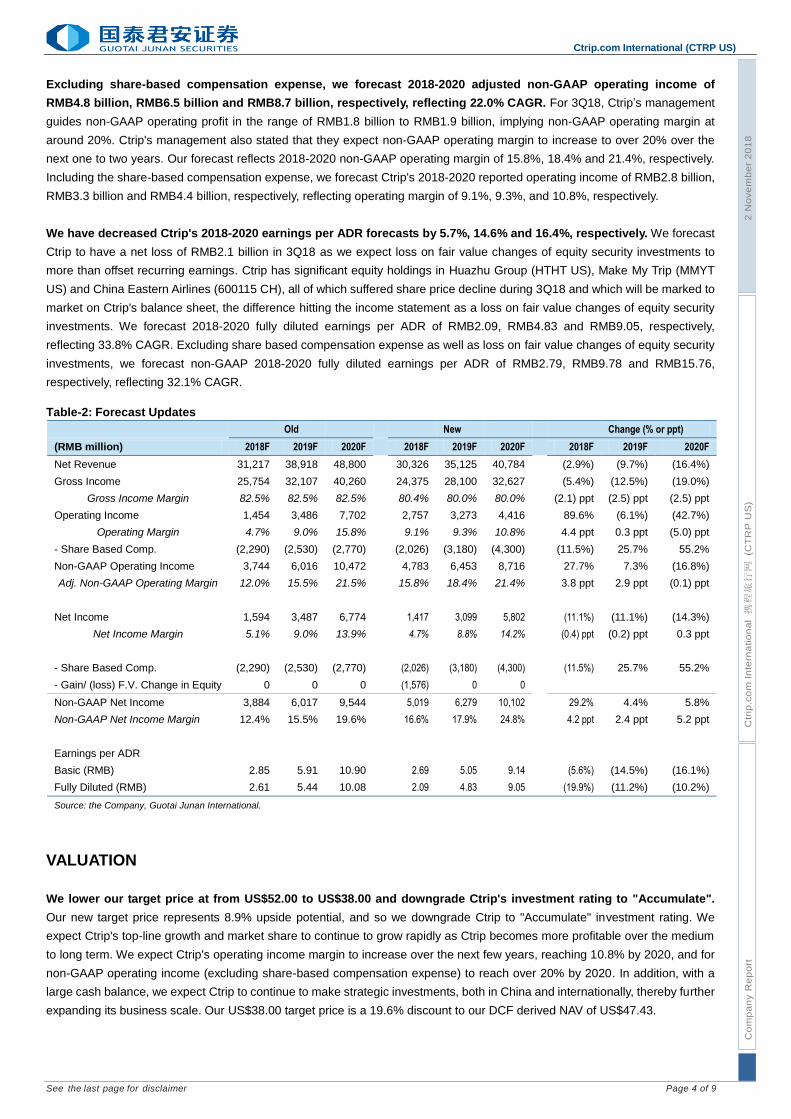
Excluding share-based compensation expense, we forecast 2018-2020 adjusted non-GAAP operating income of
RMB4.8 billion, RMB6.5 billion and RMB8.7 billion, respectively, reflecting 22.0% CAGR. For 3Q18, Ctrip’s management
guides non-GAAP operating profit in the range of RMB1.8 billion to RMB1.9 billion, implying non-GAAP operating margin at
around 20%. Ctrip's management also stated that they expect non-GAAP operating margin to increase to over 20% over the
next one to two years. Our forecast reflects 2018-2020 non-GAAP operating margin of 15.8%, 18.4% and 21.4%, respectively.
Including the share-based compensation expense, we forecast Ctrip's 2018-2020 reported operating income of RMB2.8 billion,
RMB3.3 billion and RMB4.4 billion, respectively, reflecting operating margin of 9.1%, 9.3%, and 10.8%, respectively.
We have decreased Ctrip's 2018-2020 earnings per ADR forecasts by 5.7%, 14.6% and 16.4%, respectively. We forecast
Ctrip to have a net loss of RMB2.1 billion in 3Q18 as we expect loss on fair value changes of equity security investments to
more than offset recurring earnings. Ctrip has significant equity holdings in Huazhu Group (HTHT US), Make My Trip (MMYT
US) and China Eastern Airlines (600115 CH), all of which suffered share price decline during 3Q18 and which will be marked to
market on Ctrip's balance sheet, the difference hitting the income statement as a loss on fair value changes of equity security
investments. We forecast 2018-2020 fully diluted earnings per ADR of RMB2.09, RMB4.83 and RMB9.05, respectively,
reflecting 33.8% CAGR. Excluding share based compensation expense as well as loss on fair value changes of equity security
investments, we forecast non-GAAP 2018-2020 fully diluted earnings per ADR of RMB2.79, RMB9.78 and RMB15.76,
respectively, reflecting 32.1% CAGR.
Table-2: Forecast Updates
Old
New
Change (% or ppt)
(RMB million) 2018F 2019F 2020F
2018F 2019F 2020F
2018F 2019F 2020F
Net Revenue 31,217 38,918 48,800
30,326 35,125 40,784
(2.9%) (9.7%) (16.4%)
Gross Income 25,754 32,107 40,260
24,375 28,100 32,627
(5.4%) (12.5%) (19.0%)
Gross Income Margin 82.5% 82.5% 82.5%
80.4% 80.0% 80.0%
(2.1) ppt (2.5) ppt (2.5) ppt
Operating Income 1,454 3,486 7,702
2,757 3,273 4,416
89.6% (6.1%) (42.7%)
Operating Margin 4.7% 9.0% 15.8%
9.1% 9.3% 10.8%
4.4 ppt 0.3 ppt (5.0) ppt
- Share Based Comp. (2,290) (2,530) (2,770)
(2,026) (3,180) (4,300)
(11.5%) 25.7% 55.2%
Non-GAAP Operating Income 3,744 6,016 10,472
4,783 6,453 8,716
27.7% 7.3% (16.8%)
Adj. Non-GAAP Operating Margin 12.0% 15.5% 21.5%
15.8% 18.4% 21.4%
3.8 ppt 2.9 ppt (0.1) ppt
Net Income 1,594 3,487 6,774
1,417 3,099 5,802
(11.1%) (11.1%) (14.3%)
Net Income Margin 5.1% 9.0% 13.9%
4.7% 8.8% 14.2%
(0.4) ppt (0.2) ppt 0.3 ppt
- Share Based Comp. (2,290) (2,530) (2,770)
(2,026) (3,180) (4,300)
(11.5%) 25.7% 55.2%
- Gain/ (loss) F.V. Change in Equity 0 0 0
(1,576) 0 0
Non-GAAP Net Income 3,884 6,017 9,544
5,019 6,279 10,102
29.2% 4.4% 5.8%
Non-GAAP Net Income Margin 12.4% 15.5% 19.6%
16.6% 17.9% 24.8%
4.2 ppt 2.4 ppt 5.2 ppt
Earnings per ADR
Basic (RMB) 2.85 5.91 10.90
2.69 5.05 9.14
(5.6%) (14.5%) (16.1%)
Fully Diluted (RMB) 2.61 5.44 10.08
2.09 4.83 9.05
(19.9%) (11.2%) (10.2%)
Source: the Company, Guotai Junan International.
VALUATION
We lower our target price at from US$52.00 to US$38.00 and downgrade Ctrip's investment rating to "Accumulate".
Our new target price represents 8.9% upside potential, and so we downgrade Ctrip to "Accumulate" investment rating. We
expect Ctrip's top-line growth and market share to continue to grow rapidly as Ctrip becomes more profitable over the medium
to long term. We expect Ctrip's operating income margin to increase over the next few years, reaching 10.8% by 2020, and for
non-GAAP operating income (excluding share-based compensation expense) to reach over 20% by 2020. In addition, with a
large cash balance, we expect Ctrip to continue to make strategic investments, both in China and internationally, thereby further
expanding its business scale. Our US$38.00 target price is a 19.6% discount to our DCF derived NAV of US$47.43.

Co
mp
an
y R
ep
ort
See the last page for disclaimer Page 5 of 9
[Table_RightMar1]
2 N
ove
mb
er
20
18
[Table_RightMar2]
Ctr
ip.c
om
In
tern
atio
na
l 携
程旅
行网
(C
TR
P U
S)
Ctrip.com International (CTRP US)
Figure-5: Ctrip 2-Year Historical Forward P/E
(non-GAAP)
Figure-6: Ctrip 1-Year Historical Forward P/E
(non-GAAP)
10
20
30
40
50
60
Nov/16 Oct/17 Oct/18
BEst P/E Ratio (Next 4 Quarters)
Mean
+1 ST. DEV.
-1 ST. DEV.
20
25
30
35
40
45
50
BEst P/E Ratio (Next 4 Quarters)Mean +1 ST. DEV. -1 ST. DEV.
Source: Bloomberg. Note*: "Forward" valuations are based on the next four quarters earnings forecasts.
Source: Bloomberg. Note*: "Forward" valuations are based on the next four quarters earnings forecasts.
Table-3: Peers Comparison
Company Stock
Cncy Last Mkt. Cap PE (Adjusted)
PE (GAAP) ROE(%) PB
Code price US$ mil 18F 19F 20F
18F 19F 20F 18F 18F
USA - Listed
Ctrip.Com-Adr CTRP US USD 34.880 19,017 27.4 21.6 17.6 363.7 35.2 114.2 5.0 1.5
Booking Holdings BKNG US USD 1,896.090 90,011 21.1 18.7 16.6 41.8 38.6 68.3 38.5 7.6
Tripadvisor Inc TRIP US USD 53.290 7,330 37.3 33.4 27.6 34.1 35.0 39.6 10.8 5.1
Makemytrip Ltd MMYT US USD 26.580 2,711 n.a. n.a. n.a. n.a. n.a. 237.3 (14.7) 1.0
Expedia Inc EXPE US USD 127.620 19,012 22.8 19.4 16.7 38.5 19.9 49.4 16.7 4.4
Travelzoo Inc TZOO US USD 8.490 103 26.5 23.6 n.a. n.a. 10.4 6.5 n.a. n.a.
Tuniu Corp-Adr TOUR US USD 6.520 846 n.a. 73.3 42.3 n.a. n.a. n.a. (7.5) 2.5
Simple Average 27.0 31.7 24.2 119.5 27.8 85.9 8.1 3.7
Weighted Average 23.1 20.4 17.5 86.1 35.3 73.8 28.1 6.0
Source: Bloomberg, Guotai Junan International
Table-4: DCF Analysis
DCF Assumptions Calculation Perpetual growth rate 3.0%
PV Free Cash Flows to the Firm (RMB mn) 165,237
PV Terminal Value (RMB mn) 75,120
Risk free rate 2.31%
Enterprise Value (RMB mn) 240,357
Adjusted Beta 1.20
- Debt (RMB mn) 49,398
Market risk premium 10.9%
- Minority Interest -7.0%
Cost of Equity 15.4%
+ Cash & Equivalents (RMB mn) 18,344
Total NAV (RMB mn) 207,424
Borrowing interest rate 4.0%
Effective tax rate 26.0%
ADR Outstanding (fully diluted, as at end of 2018, mn) 634
Cost of Debt 3.0%
NAV per ADR (RMB) 327.2
US$:RMB 6.90
E/ (D+E) 66%
NAV per ADR (US$) 47.43
D/ (D+E) 30%
WACC 11.0%
Source: Bloomberg, Guotai Junan International.
Table-5: Target Price Valuation
FY17A
FY18F FY19F FY20F
Earnings per ADR (RMB GAAP) 4.07 2.69 5.046 9.115
Earnings per ADR (US$ GAAP) 0.63 0.39 0.73 1.32
PER (GAAP) based on Target Price 60.8 97.5 52.0 28.8
Source: the Company, Guotai Junan International.

Co
mp
an
y R
ep
ort
See the last page for disclaimer Page 6 of 9
[Table_RightMar1]
2 N
ove
mb
er
20
18
[Table_RightMar2]
Ctr
ip.c
om
In
tern
atio
na
l 携
程旅
行网
(C
TR
P U
S)
Ctrip.com International (CTRP US)
Financial Statements and Ratios
[Table_IncomeStatement] Income Statement
Year end 31 Dec (RMB m) 2016A 2017A 2018F 2019F 2020F
Total revenue 19,228 26,780 30,326 35,125 40,784
Cost of revenues (4,730) (4,678) (5,950) (7,025) (8,157)
Gross profit 14,499 22,101 24,375 28,100 32,627
Product development (7,687) (8,259) (9,519) (11,143) (12,869)
SG&A (8,380) (10,917) (12,099) (13,685) (15,343)
Operating profit (1,568) 2,926 2,757 3,273 4,416
Interest income (expense) (165) (299) 43 (994) (66)
Other income (27) 879 (35) 0 0
Income from affiliates 602 (65) (235) 200 200
Profit before tax (1,158) 3,441 2,530 2,479 4,549
Income tax (478) (1,281) (1,014) 619 1,136
Profit after tax (1,636) 2,161 1,516 3,098 5,686
Non-controlling interest 206 (19) (99) 1 117
Shareholders' profit / loss (1,431) 2,142 1,417 3,099 5,802
Non-GAAP net profit 2,129 3,976 5,019 6,279 10,102
Basic EPADR (3.023) 4.067 2.689 5.051 9.137
Diluted EPADR (3.023) 3.777 2.091 4.828 9.050
[Table_CashFlowStatement] Cash Flow Statement
Year end 31 Dec (RMB m) 2016A 2017F 2018F 2019F 2020F
Net profit (1,636) 2,161 1,516 3,098 5,686
Share based compensation 3,560 1,834 2,026 3,180 4,300
Equity in gain of affiliates (602) 65 235 (200) (200)
D&A 719 883 168 168 168
Deferred income tax & other (177) (72) (69) 42 77
Change in working capital 3,410 2,197 3,771 3,840 4,642
Cash from operating activities
5,273 7,069 7,647 10,128 14,673
Purchases of PP&E (683) (471) (741) (995) (1,249)
Cash paid for investments (5,408) (1,541) (3,759) (3,759) (3,759)
Change in short-term invest. (5,935) (13,936) (5,048) (1,894) (1,894)
Others (7,799) 716 (1,966) (1,845) (1,845)
Cash from investing activities
(19,825) (15,232) (11,515) (8,493) (8,747)
Short term loan proceeds 1,980 2,137 3,170 (6,240) 8,407
Issuance of convertibles 6,545 0 692 (888) (888)
Others 3,765 5,882 162 251 188
Cash from financing activities
12,290 8,019 4,024 (6,877) 7,707
Cash at beg of year 19,216 18,435 18,243 18,352 13,062
Net changes in cash (2,263) (144) 156 (5,242) 13,633
Effect of for-ex 1,482 (47) (47) (47) (47)
Cash at end of year 18,435 18,243 18,352 13,062 26,648
Source: the Company, Guotai Junan International.
[Table_BalanceSheet] Balance Sheet
Year end 31 Dec (RMB m) 2016A 2017A 2018F 2019F 2020F PP&E 5,592 5,616 6,191 7,021 8,105 Investments 20,533 25,574 27,008 28,442 29,876 Goodwill 56,015 56,246 58,571 60,896 63,221 Intangible assets 13,925 13,750 13,900 14,050 14,199 Others 2,438 1,636 1,726 1,638 1,514 Total non-current assets 98,502 102,822 107,397 112,047 116,916 Cash & cash equivalents 18,435 18,243 18,352 13,062 26,648 Restricted cash 1,744 1,749 2,500 3,251 4,002 Short-term investments 14,113 28,130 33,178 35,072 36,966 Accounts receivable, net 4,625 4,559 7,278 8,430 9,788 Prepayments & other 6,995 6,546 7,413 8,586 9,969 Total current assets 45,911 59,227 68,721 68,402 87,374 Total assets 144,414 162,048 176,117 180,448 204,290 Short term borrowings 6,887 16,316 19,486 13,246 21,653 Accounts payable 7,279 7,459 11,221 12,996 15,090 Salary and welfare payable 2,508 3,465 3,923 4,544 5,277 Advances from customers 8,191 7,868 9,915 12,393 15,492 Others 5,430 7,052 7,914 8,981 10,218 Total current liabilities 30,295 42,160 52,459 52,161 67,730 Convertible note 34,651 29,220 29,912 29,024 28,136 Other long-term liabilities 3,947 4,195 4,443 4,691 4,939 Total non-current liabilities 38,598 33,416 34,355 33,715 33,075 Total liabilities 68,893 75,575 86,814 85,876 100,804 Total shareholders' equity 71,537 84,694 87,425 92,593 101,407 Minority interest 3,984 1,779 1,879 1,979 2,079 Total equity 75,521 86,473 89,304 94,572 103,486
[Table_FinancialRatio] Financial Ratios
2016A 2017A 2018F 2019F 2020F Gross margin 75.4% 82.5% 80.4% 80.0% 80.0% Operating margin -8.2% 10.9% 9.1% 9.3% 10.8% Net income margin -4.0% 12.2% 3.6% 6.6% 8.5% Non-GAAP net profit margin 11.1% 14.8% 16.6% 17.9% 24.8% Asset turnover (x) 0.1 0.2 0.2 0.2 0.2 ROA -1.1% 1.4% 0.8% 1.7% 3.0% Assets/equity (x) 2.3 2.0 2.0 2.0 2.0 ROE -2.4% 2.7% 1.6% 3.4% 6.0% Net gearing 39.5% 34.9% 36.1% 32.5% 23.9% Current ratio (x) 1.5 1.4 1.3 1.3 1.3 Debt/equity 55.0% 52.7% 55.3% 44.7% 48.1%

Co
mp
an
y R
ep
ort
See the last page for disclaimer Page 7 of 9
[Table_RightMar1]
2 N
ove
mb
er
20
18
[Table_RightMar2]
Ctr
ip.c
om
In
tern
atio
na
l 携
程旅
行网
(C
TR
P U
S)
Ctrip.com International (CTRP US)
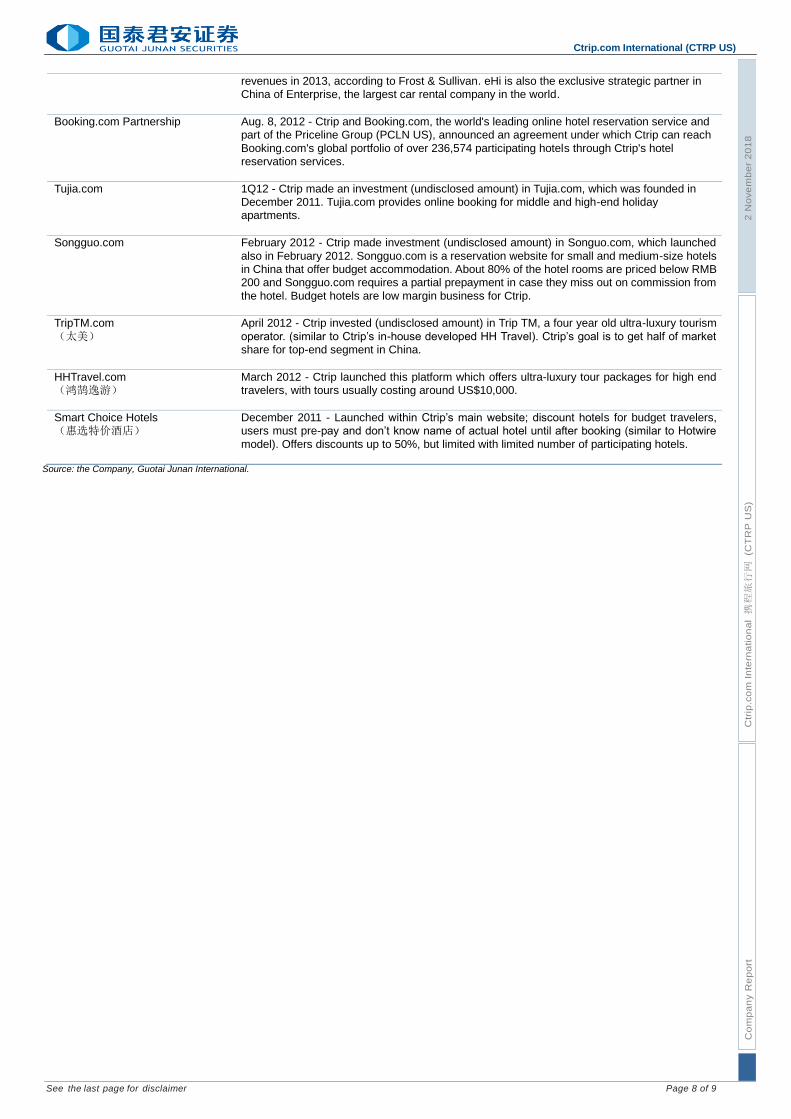
APPENDIX: Ctrip - Projects & Partnerships
Project / Investment Description
Skyscanner Holdings Ltd. Dec. 2016 - Ctrip acquired Skyscanner Holdings Limited ("Skyscanner"), a leading global travel
search site headquartered in Edinburgh, the United Kingdom. The acquisition valued Skyscanner at £1.4 billion. Skyscanner's management team will continue to manage Skyscanner's operations independently as part of the Ctrip group. With the investment in
Skyscanner, Ctrip aims to improve its global travel services, especially the international air ticketing business. Skyscanner ranks as one of the top online travel brands serving 60 mn monthly active users and is available in over 30 languages.
Qunar (QUNR US) Jan. 12, 2016 - Ctrip announced investment of US$1.3 billion in cash and issued 5.4 mn shares
as investment in several non-U.S. investment entities, which acquired a significant minority stake of Qunar (QUNR US). Combined with Ctrip's Oct. 2015 investment in Qunar, this gives Ctrip effective control of Qunar and nearly all of Qunar's economic interest, although Qunar will
remain listed on the NASDAQ. Ctrip began consolidating Qunar's results starting from Jan. 2016.
MakeMyTrip Ltd. (MMYT US) Jan. 7, 2016 - Ctrip invested US$180 mn in MakeMyTrip Ltd. (MMYT US), India's largest online travel company, via convertible bonds. MakeMyTrip has also granted Ctrip permission to acquire MakeMyTrip shares in the open market, so that combined with shares convertible under
the convertible bonds, Ctrip may own up to 26.6% of MakeMyTrip's outstanding shares. One MakeMyTrip director is appointed by Ctrip.
Qunar (QUNR US) - Baidu (BIDU US) share swap
Oct. 26, 2015 - share swap deal whereby Ctrip held approximately 45% interest in Qunar (QUNR US) and Baidu (BIDU US) held approximately 25% interest in Ctrip Four Ctrip
representatives, namely, Ctrip's Chairman, CEO, Co-president and COO were appointed to Qunar's board of directors. Two representatives of Baidu (Chairman/CEO and a vice president) were appointed to Ctrip's board of directors.
eLong (LONG US) May 22, 2015 - Ctrip announced that it acquired 37.6% equity stake of eLong (LONG US) with a total purchase price of approximately US$ 400 mn. Ctrip will obtained one seat on eLong’s
board of directors. The two companies continue to run as two separate operations, each maintaining their own brands and platforms.
Travel Fusion Jan. 2015 - Ctrip invested in Travel Fusion, a leading online travel company for low-cost carriers. Company expected this strategic relationship to not only help international travel
business, but also enhance the efficiency and effectiveness of Company’s IT systems by leveraging Travel Fusion's advanced technology.
Beijing Joint Wisdom Information Technology Co., Ltd. (Joint Wisdom)
1Q15 - Ctrip established Joint Wisdom by merging several key subsidiaries, including Brandwisdom.cn with Ctrip Beijing China Software Hotel Information System Co., Ltd. Joint Wisdom has integrated big data and cloud-based technology in three segments: software,
information stream and data intelligence products. With the combined strength, Joint Wisdom provides the full set of property management system solutions to cover about 60,000 hotels in China, ranging from hostels to high star ones.
eHi Auto Services (EHIC US)
(一嗨租车)
Jan. 21, 2015, Ctrip and eHi expand their business relationship. Ctrip has integrated eHi's
chauffeured car services, including airport pick-up and drop-off and other business transportation services, into its corporate and individual service offerings. Ctrip also features and promotes eHi's services on its various channels.
“Young” Mobile Application 2Q14 - Ctrip launched a new mobile app called Young that offers special features tailor-made to college students.
LY.com (Tongcheng) Ctrip invested US$200 mn to become the second largest shareholder (about a 30% stake) of
Tongcheng Network Technology Share Co., Ltd., a leading local attraction ticket service provider that operates LY.com. The investment is classified as an affiliate under the equity method.
Tuniu.com (TOUR US) Ctrip bought US$15 mn worth of Tuniu.com shares as an anchor investor in Tuniu.com’s IPO. Tuniu.com specializes in China’s leisure package tour business and launched its IPO on the
NASDAQ on May 9, 2014.
cn.toursforfun.com (途风)
Dec. 2013 - Ctrip acquired cn.toursforfun.com, an online travel supplier focused on overseas tours and vacation packages and daytrips for Chinese travelers in the United States.
Yongche.com (易到用车)
Dec. 2013 - Ctrip made investment in Beijing-based Dongfang Cheyun, operator of online car rental platform Yongche.com, which offers car rental, high-end chauffeur mobile booking, and mobile taxi booking services.
eHi Auto Services (EHIC US)
(一嗨租车)
Dec. 2013 - Ctrip bought slightly less than 20% interest in eHi, classified as an available for sale
financial investment. Ctrip became eHi’s designated and preferred business partner and integrated access to eHi's online reservation system in its Ctrip Travel mobile application. eHi is China's No. 1 car services provider and No. 2 car rentals provider in terms of market share by
Co
mp
an
y R
ep
ort
See the last page for disclaimer Page 8 of 9
[Table_RightMar1]
2 N
ove
mb
er
20
18
[Table_RightMar2]
Ctr
ip.c
om
In
tern
atio
na
l 携
程旅
行网
(C
TR
P U
S)
Ctrip.com International (CTRP US)
revenues in 2013, according to Frost & Sullivan. eHi is also the exclusive strategic partner in China of Enterprise, the largest car rental company in the world.
Booking.com Partnership Aug. 8, 2012 - Ctrip and Booking.com, the world's leading online hotel reservation service and part of the Priceline Group (PCLN US), announced an agreement under which Ctrip can reach
Booking.com's global portfolio of over 236,574 participating hotels through Ctrip's hotel reservation services.
Tujia.com 1Q12 - Ctrip made an investment (undisclosed amount) in Tujia.com, which was founded in December 2011. Tujia.com provides online booking for middle and high-end holiday apartments.
Songguo.com February 2012 - Ctrip made investment (undisclosed amount) in Songuo.com, which launched
also in February 2012. Songguo.com is a reservation website for small and medium-size hotels in China that offer budget accommodation. About 80% of the hotel rooms are priced below RMB 200 and Songguo.com requires a partial prepayment in case they miss out on commission from
the hotel. Budget hotels are low margin business for Ctrip.
TripTM.com
(太美)
April 2012 - Ctrip invested (undisclosed amount) in Trip TM, a four year old ultra-luxury tourism
operator. (similar to Ctrip’s in-house developed HH Travel). Ctrip’s goal is to get half of market share for top-end segment in China.
HHTravel.com (鸿鹄逸游)
March 2012 - Ctrip launched this platform which offers ultra-luxury tour packages for high end travelers, with tours usually costing around US$10,000.
Smart Choice Hotels (惠选特价酒店)
December 2011 - Launched within Ctrip’s main website; discount hotels for budget travelers, users must pre-pay and don’t know name of actual hotel until after booking (similar to Hotwire
model). Offers discounts up to 50%, but limited with limited number of participating hotels.
Source: the Company, Guotai Junan International.

Co
mp
an
y R
ep
ort
See the last page for disclaimer Page 9 of 9
[Table_RightMar1]
2 N
ove
mb
er
20
18
[Table_RightMar2]
Ctr
ip.c
om
In
tern
atio
na
l 携
程旅
行网
(C
TR
P U
S)
Ctrip.com International (CTRP US)
[Table_CompanyRatingDefinition] Company Rating Definition
The Benchmark: NASDAQ Composite Index
Time Horizon: 6 to 18 months
Rating Definition
Buy Relative Performance>15%; or the fundamental outlook of the company or sector is favorable.
Accumulate Relative Performance is 5% to 15%; or the fundamental outlook of the company or sector is favorable.
Neutral Relative Performance is -5% to 5%; or the fundamental outlook of the company or sector is neutral.
Reduce Relative Performance is -5% to -15%; or the fundamental outlook of the company or sector is unfavorable.
Sell Relative Performance <-15%; or the fundamental outlook of the company or sector is unfavorable.
[Table_IndustryRatingDefinition] Sector Rating Definition
The Benchmark: NASDAQ Composite Index
Time Horizon: 6 to 18 months
Rating Definition
Outperform Relative Performance>5%; or the fundamental outlook of the sector is favorable.
Neutral Relative Performance is -5% to 5%; or the fundamental outlook of the sector is neutral.
Underperform Relative Performance<-5%; Or the fundamental outlook of the sector is unfavorable.
[Table_DISCLOSUREOFINTERESTS] DISCLOSURE OF INTERESTS
(1) The Analysts and their associates do not serve as an officer of the issuer mentioned in this Research Report. (2) The Analysts and their associates do not have any financial interests in relation to the issuer mentioned in this Research Report. (3) Except for KAISA GROUP (01638 HK), GUOTAI JUNAN I (01788 HK),BINHAI INVESTMENT (02886 HK),VALUE A SHARE (03095
HK), CAM SCSMALLCAP (03157 HK), MR CSI300 ETF-R (CNY) (83127 HK), Guotai Junan and its group companies do not hold equal to or more than 1% of the market capitalization of the issuer mentioned in this Research Report.
(4) Guotai Junan and its group companies have not had investment banking relationships with the issuer mentioned in this Research Report within the preceding 12 months.
(5) Guotai Junan and its group companies are not making a market in the securities in respect of the issuer mentioned in this Research Report.
(6) Guotai Junan and its group companies have not employed an individual serving as an officer of the issuer mentioned in this Research Report. There is no officer of the issuer mentioned in this Research Report associated with Guotai Junan and its group companies.
DISCLAIMER This Research Report does not constitute an invitation or offer to acquire, purchase or subscribe for securities by Guotai Junan Securities (Hong Kong) Limited ("Guotai Junan"). Guotai Junan and its group companies may do business that relates to companies covered in research reports, including investment banking, investment services, etc. (for example, the placing agent, lead manager, sponsor, underwriter or invest proprietarily). Any opinions expressed in this report may differ or be contrary to opinions or investment strategies expressed orally or in written form by sales persons, dealers and other professional executives of Guotai Junan group of companies. Any opinions expressed in this report may differ or be contrary to opinions or investment decisions made by the asset management and investment banking groups of Guotai Junan. Though best effort has been made to ensure the accuracy of the information and data contained in this Research Report, Guotai Junan does not guarantee the accuracy and completeness of the information and data herein. This Research Report may contain some forward-looking estimates and forecasts derived from the assumptions of the future political and economic conditions with inherently unpredictable and mutable situation, so uncertainty may contain. Investors should understand and comprehend the investment objectives and its related risks, and where necessary consult their own financial advisers prior to any investment decision. This Research Report is not directed at, or intended for distribution to or use by, any person or entity who is a citizen or resident of or located in any jurisdiction where such distribution, publication, availability or use would be contrary to applicable law or regulation or which would subject Guotai Junan and its group companies to any registration or licensing requirement within such jurisdiction. © 2018 Guotai Junan Securities (Hong Kong) Limited. All Rights Reserved. 27/F., Low Block, Grand Millennium Plaza, 181 Queen’s Road Central, Hong Kong. Tel.: (852) 2509-9118 Fax: (852) 2509-7793 Website: www.gtja.com.hk
Copyright © 2022 FDOKUMEN