Excessive fluctuations in knee joint moments during early stance in sprinting are caused by digital...
18
1 Original article: Excessive fluctuations in knee joint moments during early stance in sprinting are caused by digital filtering procedures Authors: Neil E. Bezodis a,b , Aki I.T. Salo b , Grant Trewartha b Affiliations: a School of Sport, Health and Applied Science, St Mary’s University College, Twickenham, UK, TW1 4SX. b Sport, Health and Exercise Science, University of Bath, UK, BA2 7AY. Corresponding author: Neil E. Bezodis, PhD email: [email protected] Tel: +44 208 240 2325 Fax: +44 208 240 4212
Transcript of Excessive fluctuations in knee joint moments during early stance in sprinting are caused by digital...

1
Original article:
Excessive fluctuations in knee joint moments during early stance in sprinting are caused
by digital filtering procedures
Authors:
Neil E. Bezodisa,b, Aki I.T. Salob, Grant Trewarthab
Affiliations:
aSchool of Sport, Health and Applied Science, St Mary’s University College, Twickenham,
UK, TW1 4SX.
bSport, Health and Exercise Science, University of Bath, UK, BA2 7AY.
Corresponding author:
Neil E. Bezodis, PhD
email: [email protected]
Tel: +44 208 240 2325
Fax: +44 208 240 4212

2
Abstract:
Inverse dynamics analyses are commonly used to understand movement patterns in all
forms of gait. The aim of this study was to determine the effect of digital filtering
procedures on the knee joint moments calculated during sprinting as an example of the
possible influence of data analysis processes on interpretation of movement patterns. Data
were obtained from three highly trained sprinters who completed a series of 30 m sprints.
Ten different combinations of cut-off frequency were applied to the two-dimensional
kinematic and kinetic input data with the kinetic cut-off frequency set equal to or higher
than the kinematic cut-off frequency. When using the commonly adopted practice of
filtering the kinetic data with a higher cut-off frequency than the kinematic data,
exaggerated fluctuations in the knee joint moment existed soon after contact. In extreme
cases, the knee moved between flexor, extensor and flexor dominance in less than 33 ms
and through ranges exceeding 500 Nm. During an inverse dynamics analysis of
locomotion, mismatched cut-off frequencies will likely affect the calculated joint moments if
the cut-off frequency applied to the kinematic data is less than the true frequency content,
particularly during impact phases. In the example of sprinting, exaggerated fluctuations in
the knee joint moment appear to be data processing artefact rather than genuine
characteristics of the joint kinetics. When the cut-off frequencies, and thus the frequency
content of all input data, are matched, the fluctuations after contact are minimal, and such
a procedure is suggested for inverse dynamics analyses of gait.
Keywords:
Biomechanics; Data analysis; Impact; Running; Smoothing.

3
1. Introduction
Resultant joint moments (RJMs) are commonly determined during analyses of human
locomotion using an inverse dynamics analysis (IDA) to understand the underlying causes
of movement. Such IDA approaches have been widely used in an attempt to understand
the lower limb RJMs during discrete stance phases in the fastest form of gait, sprinting1-7.
The role of the knee joint in sprinting has been of particular interest and debate, and the
above studies have commonly reported excessive fluctuations of both high frequency and
magnitude in the knee RJM during the early part of stance in steps ranging from the very
first on the track up to maximum velocity. However, despite their existence, no clear
explanation for the occurrence of these fluctuations has previously been offered.
In determining RJMs during gait, an IDA requires input from kinematic (typically video-
based), kinetic (typically ground reaction force; GRF) and segmental inertia data. The
accuracy of these input data is therefore clearly of importance in ensuring integrity of the
output data. The kinematic input data have previously been shown to have the largest
influence on the determined RJM outputs8,9. This is due to the unavoidable presence of
noise in the displacement data as a result of digitising error or marker movement relative
to the underlying joint centres, which is further amplified in the determination of the linear
and angular acceleration data required for an IDA. The kinematic input data are therefore
smoothed prior to inclusion in the IDA, with low-pass digital filters commonly used to
attenuate data above a specific frequency10. The kinematic input data used in the
aforementioned sprinting research studies were filtered using cut-off frequencies ranging
from 8 to 24 Hz where stated. Kinetic input data also contain noise and are thus often also
filtered for an IDA. In an attempt to preserve the commonly observed impact GRFs in
sprinting, these kinetic input data are often filtered at a higher cut-off frequency than the

4
kinematic data. The above sprinting studies that stated their GRF cut-off frequency used
either values of 75 Hz or the authors chose not to filter their kinetic input data at all.
It has been suggested that during activities with high impact forces, filtering the kinetic and
kinematic input data using different cut-off frequencies could lead to the computation of
artificial peaks in the determined RJMs11-13. It is thus possible that previously observed
excessive fluctuations in the knee RJM during early stance in sprinting are influenced by
the digital filtering procedures. The aim of this study was therefore to determine the effect
of different cut-off frequency combinations applied to the kinematic and kinetic IDA input
data on the determined knee joint RJMs, with a view to explaining the commonly observed
fluctuations soon after impact in sprinting.
2. Methods
2.1. Research design and participants
Due to the methodological focus of this study, a within-participant analysis was adopted.
This allowed the direct effects of the different filter combinations to be observed without
potentially averaging out any fluctuations or effects due to between-participant differences.
A multiple-single-participant approach (n = 3) was used to make the results more
applicable to a wider population, including both sexes (participant A = male, 21 years,
82.6 kg, 1.81 m; participant B = male, 20 years, 86.9 kg, 1.78 m; participant C = female, 26
years, 60.5 kg, 1.76 m). All participants were highly trained sprinters (100 m personal best
times: A = 10.14 s, B = 10.28 s, C (100 m hurdles) = 12.72 s) and provided written
informed consent to participate in this study which had been approved by the Local
Research Ethics Committee.

5
2.2. Equipment set-up
A start line was marked across one lane of an indoor running track so that the participants
would land with their first ground contact on a 0.900 × 0.600 m force platform (9287BA,
Kistler, Switzerland) sampling at 1000 Hz. The first stance phase was analysed because
the magnitude and frequency of the ground reaction forces is lowest here7, before
increasing as a sprint progresses towards mid-acceleration5 and then maximum velocity6.
Any filtering artefact observed in the first stance phase would therefore likely still be
evident, and potentially greater, during any of the subsequent steps of a maximal effort
sprint. The force platform was covered with a fitted piece of synthetic track surface and
was thus flush with the track. A high-speed digital video camera (Motion-Pro HS-1,
Redlake, USA) sampling at 200 Hz was located 25 m away from the force platform, with its
optical axis perpendicular to the direction of the running lane. Images were collected inside
a 2.5 m field of view at a resolution of 1280 × 1024 pixels, and using a 1/1000 s shutter
speed. The capture area was calibrated using four corner points of a rectangular frame
(2.00 m horizontally × 1.60 m vertically). A series of LEDs were activated by the pressing
of a custom trigger button and used to synchronise the video and force data to the nearest
millisecond. This trigger also sent a signal to a sounder device to which the participants
responded, representative of the auditory stimulus received in competition.
2.3. Data collection
Following a coach-directed warm up, each participant completed a series of five (A and B)
or four (C) maximal effort sprints to 30 m. Each sprint commenced from starting blocks
which were adjusted to the preference of each participant, who also wore their own spiked
shoes. Each trial was initiated by an experienced starter who followed standard ‘on your
marks’ and ‘set’ commands by pressing the custom trigger button to commence data

6
collection. Participants were allowed their normal recovery (approximately 8-10 minutes)
after each trial to ensure subsequent performance was not affected by fatigue.
2.4. Data processing and analysis
The raw video files were imported into digitising software (Peak Motus® v. 8.5, Vicon, UK)
and digitised with a resolution of measurement of just less than 1 mm. For each trial, five
points (stance hip, knee, ankle and second metatarsal-phalangeal (MTP) joint centres, and
distal hallux) were manually digitised from ten frames prior to touchdown until ten frames
after toe-off. Projective scaling was then used to reconstruct raw displacement time-
histories, and the raw force data were downsampled to 200 Hz to correspond to the
kinematic data. These raw kinematic and kinetic data were then each passed through a 4th
order zero-delay Butterworth digital filter10 using four different cut-off frequencies (10, 25,
50 and 100 Hz). This yielded 10 combinations where the kinetic data cut-off frequency
equalled or exceeded that of the kinematic input data, each of which is subsequently
referred to in the format of VxFy where x and y represent the cut-off frequencies applied to
the kinematic (video) and kinetic (force) data respectively (e.g. V25F100 represents video
data filtered at 25 Hz and force data filtered at 100 Hz). Participant-specific segmental
inertia data were calculated from 95 direct anthropometric measurements14. Each
combination of kinematic and kinetic input data were then used with the inertia data in a
standard two-dimensional IDA10,15 to calculate the RJMs at the knee joint. A four-segment
stance leg model which incorporated the MTP, ankle, knee and hip joints was used due to
the importance of the MTP joint in sprinting16. The knee RJMs were time-normalised to
101 samples from touchdown to toe-off using an interpolating cubic spline, before mean ±
standard deviation time-histories were calculated for each participant for each of the ten
combinations of cut-off frequencies. Mean ± standard deviation peak impact (0-5% of

7
stance) and active (20-100% of stance) RJMs from all individual trials for each participant
were also determined for each of these combinations.
3. Results
The data from all combinations of cut-off frequencies clearly revealed an underlying trend
for a knee extensor RJM which reached peak values just prior to mid stance (Figure 1).
The ten different cut-off frequency combinations altered this mean peak active RJM by up
to 49, 45 and 29 Nm for participants A, B and C, (up to 48%, 22% and 29% of the peak
active RJMs), respectively. When the kinematic and kinetic input data cut-off frequencies
were matched (from top left to bottom right of Figure 1; bold values in Table 1) there were
only minor fluctuations away from the underlying rising extensor dominance in the RJM
during early stance, and the frequency and magnitude of these fluctuations did not appear
to exceed any of the fluctuations seen throughout the remainder of the stance phase.
However, when the kinetic input data cut-off frequency was higher than that of the
kinematic data, the magnitude of the peak impact moment during the first 5% of stance
increased, and the increased magnitude of these impact moments was more marked as
the kinetic cut-off frequency increased for any given kinematic cut-off frequency. Using
participant A as an example, when the cut-off frequencies were matched, there were
minimal or no extensor peaks in the RJM evident during the first 5% of stance (Figure 1
and Table 1), yet when the kinetic cut-off frequency increased above that of the kinematic
input data, impact extensor moments were clearly apparent and reached a mean value of
446 Nm in the V10F100 condition. Although participant A showed the largest increases in
impact moments as the kinetic cut-off frequency increased, the above impact moment
trends were apparent for all three participants. When filtering the kinematic data at 10 Hz,
as the kinetic input data cut-off frequency was altered from 10 Hz to 100 Hz the mean

8
peak impact RJM increased from 38 Nm to 139 Nm (266% increase) for participant B and
from 23 Nm to 207 Nm (800% increase) for participant C). Furthermore, participants A and
C both demonstrated fluctuations between extensor, flexor and returning to extensor
dominance during the first 15% of stance when the cut-off frequencies were not matched.
The most extreme example of this was in the V10F100 condition, where the knee RJM of
participant A fluctuated from +376 Nm (extensor peak) to -206 Nm (flexor peak) and back
to +90 Nm (extensor peak) in less than 33 ms. Participant B showed the same fluctuating
pattern although the RJM never became flexor dominant.
4. Discussion
This study assessed the effects of different kinematic and kinetic cut-off frequencies on the
determined knee RJM time-histories during gait, placed in the context of the first stance
phase of a maximal effort sprint. It was found that the different filter combinations had a
small effect on the peak active moment during mid-stance. The increases in the peak
active RJM as the cut-off frequency magnitudes increased were due to the increasingly
noisy nature of the entire RJM time-history since less of the noise in the kinematic input
data was removed. However, the choice of cut-off frequency combinations had a
considerable effect on the magnitude of the peak knee extensor RJM during the first 5% of
stance. When the kinetic cut-off frequency matched that of the kinematic input data, these
impact moments were either virtually non-existent (participant A) or small (participants B
and C). However, as the kinetic cut-off frequency increased above that of the kinematic
input data – as has typically been the case in sprinting IDA studies – the impact RJM
increased up to magnitudes of 446, 139 and 207 Nm for participants A, B and C,
respectively (in the V10F100 condition). For participants A and C, these values were more
than double the peak active moment observed during mid-stance in the same condition.

9
These impact RJMs were markedly greater than those observed when cut-off frequencies
were matched (participant A seldom exhibited an extensor moment during the first 5% of
stance, whilst participants B and C exhibited mean impact RJMs smaller than 53 Nm
during the four matched cut-off frequency conditions).
These results can be explained by considering the calculations used in an IDA. As the
frequency of the impact peak during running is related to the acceleration of the lower
limb17,18, filtering the kinematic input data at a lower cut-off frequency than the kinetic input
data creates inconsistencies in the frequency content of these two data sets. The genuine
high frequency segmental accelerations which corresponded to the high frequency GRFs
in the kinetic data are removed from the kinematic input data. This means that when
determining the internal joint forces in the most distal joint (using Newton’s 2nd Law; ΣF =
ma), a large peak in the calculated internal joint force is required to counter the inputted
high frequency peak in the GRF data and thus make the sum of the forces proportional to
the inputted (smoothed) acceleration of this distal segment. This spurious peak is then
propagated up the leg as the calculations proceed to the more proximal joints and clearly
affects the calculated knee RJM. Based on these results, the excessive fluctuations in
knee RJM that have been previously reported during early stance in various phases of a
sprint1-7 are likely to be an exaggerated artefact introduced by filtering the kinematic input
data at a considerably lower cut-off frequency than the kinetic input data.
Data for the current study were collected from the first stance phase of a sprint where,
based on previous evidence7, the magnitude of any peak GRFs soon after impact appear
to be typically lower than steps during mid-acceleration5 or maximum velocity6. Given that
these peak impact GRFs appear to increase as a sprint progresses, and that the

10
participant who experienced the largest impact GRFs in the current study (i.e. participant
A; Figure 2) also experienced the largest increases in knee RJM as the IDA input data
were filtered at increasingly mismatched cut-off frequencies, it can be expected that the
effects of this filtering mismatch will be even more pronounced during later phases of a
sprint. However, based on the aforementioned explanations for these exaggerated RJMs,
it is also possible that these effects would exist to some extent during impacts in any form
of gait. If the kinetic data are filtered at a higher cut-off frequency than the kinematic data,
and the cut-off frequency applied to the kinematic data is lower than the highest
frequencies found in the true kinematic signal, then excessive fluctuations in the RJM will
be produced around impact.
Interestingly, for both participant A and participant C (who also exhibited relatively high
impact GRF magnitudes; Figure 2), the knee RJMs calculated with mismatched cut-off
frequencies often fluctuated rapidly between extensor, flexor and then extensor dominance
within less than 33 ms after touchdown (Figure 1). However, although such rapid and
excessive fluctuations in knee RJM have been readily reported, no clear physiological
explanations have previously been offered for these fluctuations and we believe that they
are more likely due to the data analysis procedures employed. Although the novel
inclusion of the MTP joint in this study was different from previous IDAs in sprinting, the
choice to include or exclude the MTP joint has no independent effect on any fluctuations
soon after impact16.
Whilst previous studies have identified similar phenomena in landings and cutting
manoeuvres12,13, these have only been investigated using one or two widely mismatched
cut-off frequencies. The data presented in the current study extend these findings to the

11
analysis of gait, whilst further highlighting that even relatively small mismatches between
the cut-off frequencies applied to the kinetic and kinematic data affect the calculated RJM
at the knee joint, and that these effects are not necessarily dependent on the absolute
values of the cut-off frequencies that are chosen. A clear example of this is evident when
the kinetic input data were filtered with a cut-off frequency of 25 Hz; a relatively severe
degree of filtering which largely attenuated the GRF impact peak. When the kinematic data
were also filtered at 25 Hz (i.e. V25F25; Figure 1c), fluctuations in the RJM after impact
were minimal. However, when the kinematic cut-off frequency was reduced to 10 Hz (i.e.
V10F25, Figure 1b), despite the kinetic input data being identical to those used in the
V25F25 example and thus lacking much of the true impact GRF peak, fluctuations in the
knee RJM after impact again became apparent.
In summary, this study revealed that excessive fluctuations in the knee RJM during a
ground contact phase are evident when the kinematic and kinetic input data to an IDA are
filtered with mismatched cut-off frequencies. These occur due to the removal of genuine
high frequency accelerations in the kinematic data which relate to the high frequency
impact GRFs, thus meaning that spurious joint forces are introduced to the IDA to balance
the equations of motion. The frequency of the GRFs is clearly the most important factor,
and even when the ground reaction force impact peaks are relatively small in magnitude,
as was the case for one of the participants in the current study, a mismatch in the cut-off
frequencies used leads to exaggerated fluctuations in the knee RJM soon after impact.
Applying identical cut-off frequencies to the kinematic and kinetic input data prevents the
generation of these fluctuations. The ideal cut-off frequency is dependent on the quality of
the kinematic input data and should be determined from these data, ideally being as high
as possible without making the RJMs uninterpretable due to excessive noise. It is essential

12
that cut-off frequencies applied to kinematic and kinetic data are clearly stated, and care
must be taken to ensure that processing undertaken in commercial software programmes
at any stage of an IDA is fully understood and transparent. If variables are required from
the GRF data in addition to those used as kinetic inputs for the IDA, it is recommended
that these GRF data are filtered separately with a higher cut-off frequency to prevent
unwanted attenuation.
Highlights
Different inverse dynamics cut-off frequency combinations were investigated
Mismatched cut-off frequencies create inconsistencies within the input data
In sprinting, excessive knee moment fluctuations are due to mismatched filtering
Matching kinematic and kinetic cut-off frequencies prevents calculation artefacts
Filtering procedures must be clearly detailed in inverse dynamics analyses of gait
Conflict of interest statement
There are no conflicts of interest for any of the authors with regard to this work.
Acknowledgements:
The authors are grateful to the participants for agreeing to have one of their training
sessions analysed, and to Dr Ian Bezodis and the Cardiff School of Sport for their
assistance with data collection and facilities. The University of Bath and UK Athletics are
thanked for partly funding the study.

13
References
1. Mann R, Sprague P. A kinetic analysis of the ground leg during sprint running. Res Q
Exerc Sport 1980; 51: 334-348
2. Mann R. A kinetic analysis of sprinting. Med Sci Sports Exerc 1981; 13: 325-328
3. Jacobs R, van Ingen Schenau GJ. Intermuscular coordination in a sprint push-off. J
Biomech 1992; 25: 953-965
4. Johnson MD, Buckley JG. Muscle power patterns in the mid-acceleration phase of
sprinting. J Sports Sci 2001; 19: 263-272
5. Hunter JP, Marshall RN, McNair PJ. Segment-interaction analysis of the stance limb in
sprint running. J Biomech 2004; 37: 1439-1446
6. Bezodis IN, Kerwin DG, Salo AIT. Lower-limb mechanics during the support phase of
maximum-velocity sprint running. Med Sci Sports Exerc 2008; 40: 707-715
7. Charalambous L, Irwin G, Bezodis IN, Kerwin D. Lower limb joint kinetic and ankle joint
stiffness in the sprint start push-off. J Sports Sci 2012; 30: 1-9
8. Challis JH, Kerwin DG. Quantification of the uncertainties in resultant joint moments
computed in a dynamic activity. J Sports Sci 1996; 14: 219-231

14
9. Riemer R, Hsiao-Wecksler ET, Zhang X. Uncertainties in inverse dynamics solutions: a
comprehensive analysis and an application to gait. Gait Posture 2008; 27: 578-88
10. Winter DA. Biomechanics and motor control of human movement. New York: Wiley;
1990
11. van den Bogert AJ, de Koning JJ. On optimal filtering for inverse dynamics analysis. In
JA Hoffer, A Chapman, JJ Eng, A Hodgson, TE Milner, D Sanderson (Eds.), Proceedings
of the IXth Biennial Conference of the Canadian Society for Biomechanics (pp. 214-215).
Vancouver: University Press; 1996
12. Bisseling RW, Hof AL. Handling of impact forces in inverse dynamics. J Biomech 2006;
39: 2438-2444
13. Kristianslund E, Krosshaug T, van den Bogert AJ. Effect of low pass filtering on joint
moments from inverse dynamics: Implications for injury prevention. J Biomech 2012; 45:
666-671
14. Yeadon MR. The simulation of aerial movement 2: a mathematical inertia model of the
human-body. J Biomech 1990; 23: 67-74
15. Elftman H. Forces and energy changes in the leg during walking. American J Physiol
1939; 125: 339-356

15
16. Bezodis NE, Salo AIT, Trewartha G. Modelling the stance leg in 2D analyses of
sprinting: inclusion of the MTP joint affects joint kinetics. J Appl Biomech 2012; 28: 222-
227
17. Bobbert MF, Schamhardt HC, Nigg BM. Calculation of vertical ground reaction force
estimates during running from positional data. J Biomech 1991; 24: 1095-1105
18. Nigg BM. Biomechanics of sports shoes. Calgary: Topline Printing Inc; 2010
16
Tables
Table 1. Peak impact and active extensor resultant joint moments (Nm) at the knee joint
during the first stance phase of a sprint for all three participants (intra-participant mean ±
standard deviation).
V10 V25 V50 V100
Impact Active Impact Active Impact Active Impact Active
Part
icip
ant A
F10 13 ± 35 54 ± 23
F25 148 ± 36 66 ± 21 n/a 67 ± 21
F50 306 ± 60 76 ± 19 109 ± 43 78 ± 17 n/a 90 ± 19
F100 446 ± 114 89 ± 15 246 ± 98 89± 14 102 ± 88 99 ± 17 13 ± 105 103 ± 22
Part
icip
ant
B
F10 38 ± 20 163 ± 20
F25 73 ± 24 169 ± 19 31 ± 9 173 ± 19
F50 118 ± 42 172 ± 20 76 ± 29 176 ± 21 43 ± 29 188 ± 14
F100 139 ± 54 176 ± 21 97 ± 41 181 ± 20 65 ± 39 190 ± 12 53 ± 64 208 ± 22
Part
icip
ant
C
F10 23 ± 3 72 ± 13
F25 86 ± 8 73 ± 13 4 ± 10 75 ± 14
F50 164 ± 17 77 ± 13 84 ± 11 79 ± 15 26 ± 22 86 ± 15
F100 207 ± 20 81 ± 12 123 ± 15 83 ± 14 61 ± 23 89 ± 14 52 ± 33 101 ± 14
Note: V and F represent the kinematic (video) and kinetic (force) data, respectively, with
the subsequent numbers representing the cut-off frequencies applied to the data (e.g. V25
represents kinematic (video) data filtered at 25 Hz).

17
Figures 1a-j. Mean resultant knee joint moment time-histories for each of the three
participants for all ten cut-off frequency combinations (participant A = dotted line,
participant B = dashed line, participant C = solid line). Standard deviations are omitted for
clarity purposes but are presented for selected discrete values in Table 1.
18
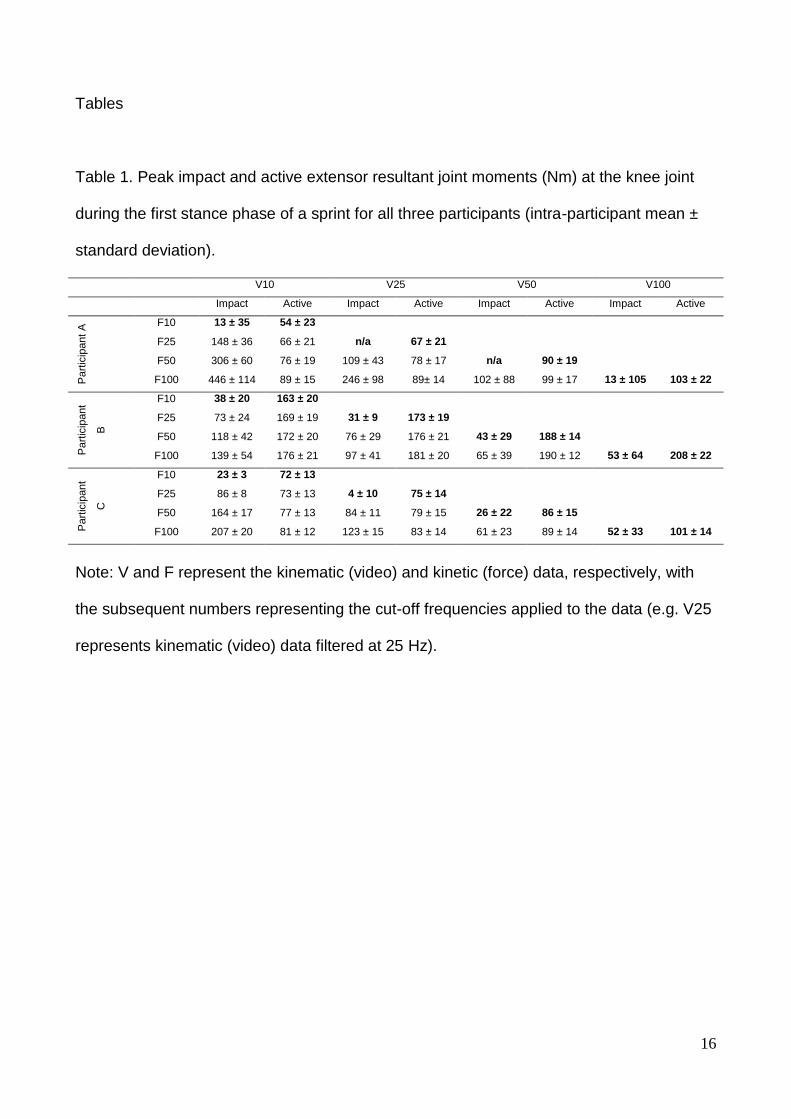
Figure 2. Mean raw a) horizontal and b) vertical ground reaction force time-histories for
each of the three participants (participant A = dotted line, participant B = dashed line,
participant C = solid line).