Derivation of Supports Moments Coefficients for Prismatic ...
10
Copyright © 2015 IJEIR, All right reserved 613 International Journal of Engineering Innovation & Research Volume 4, Issue 4, ISSN: 2277 – 5668 Derivation of Supports Moments Coefficients for Prismatic Continuous Beams by Elastic Analysis Fathelrahman M. Adam Email: [email protected] A. E. Hassaballa Email: [email protected] H. E. M. Sallam Email: [email protected] Abstract – In this paper an elastic analysis was adopted in order to calculate the negative moment coefficients for the continuous beams of different number of spans form 2-spans to 10-spans and with different span lengths. The difference of spans adopted on the bases of spans ratio between the longest span to the shortest span on the continuous beam. The lengths of spans were taken in sequences starting with shortest span and the subsequent spans increase by constant rate. Eleven ratios were taken starting from 1.0 (equal spans) to 2.0 by constant rate of 0.1. The method of analysis used here is the moment distribution methods used to analyze ninety nine models of continuous beams gained by a combination between the different number of spans and the different spans ratios and all calculations were done using spreadsheets. A uniformly distributed load full spans was applied throughout all the models. The coefficients of negative moments have been calculated according to the negative moments at supports obtained for the various models and a comprehensive data were gained according to that. These data were analyzed and summarized by taking the average of the convergent values controlled and measured using standard deviation. The final filtered values of coefficients were listed in Tables and also explained graphically. A modification for the values of moment coefficients has been done for beams of 3-spans, 4-spans and 5-spans in order to consider the case of difference in spans lengths take place randomly differ than the adopted for the models taking into consideration the modification limited to the span ratio for the adjacent spans not more than 1.5.A verification has been done for the values of coefficients calculated by comparing the moment calculated using these coefficients with the moments gained by using PROKON software program, these all done for different examples taking on different spans numbers with different spans ratios. percentages differences between the two values for each moment were calculated as errors and most of the errors values fall less than 3%. Few of the errors increases than 3% to 9% in limited cases and these values as generally considered acceptable as these moments considered as approximate moments and as the larger errors always coincide with the larger span ratio between adjacent spans and this case is a rare practically. Keywords – Continuous Beams, Elastic Analysis, Moment Coefficients, Moment Distribution Method. I. INTRODUCTION A continuous beam is a structural component which is classified as a statically indeterminate multi span beam on hinged supports along its length. These are usually in the same horizontal plane, and the spans between the supports are in one straight line. The end spans may be cantilever, may be freely supported or fixed supported. The continuous beam provides resistance to bending when a load is applied. At least one of the supports of a continuous beam must be able to develop a reaction along the beam axis. Continuous beams are used in structural designs when three or more spans exist. Continuous beams occur frequently in cast in situ construction when a single span of construction is linked to an adjoining span also commonly used in bridges. Bending moment of continuous beams does not confine to a single span only but it will affect the whole system. The continuous beam is much stiffer and stronger than the simply supported beam because the Continuity tends to reduce the maximum moment on a beam and makes it stiffer. To design any structure which a continuous beam is a part of it, it is necessary to know the bending moments and shearing forces in each member. Various methods have been developed for determining the bending moments and shearing force on continuous beams, these methods are interrelated to each other to a greater or lesser extent. Most of the well-known individual methods of structural analysis such as the theorem of three moments which it proposed by Clapeyron (is French engineer and physicist), slope deflection, fixed and characteristic points, and moment distribution methods. These approaches generally lends their self better to hand computation than numerical methods such as flexibly methods, stiffness method or finite element method. To avoid the need to solve large sets of simultaneous equations, such as are required with the three-moment theorem or slope deflection, methods involving successive approximations have been devised, such as hardy cross moment distribution. A coefficient method is used for the analysis of continuous as approximate method by most of codes of practice such as ACI code, BS8110, EC and SBC. The approximate method allows for various load patterns also allows for the real rotation restraint at external supports, where the real moment is not equal to zero. Elastic analysis gives systematic zero moment values at all external pin supports. The coefficient method is thus more realistic but is only valid for standard cases. It is advised to use this method whenever its conditions of application are satisfied. Elastic analysis should be used only if the conditions of the code method are not satisfied. As an example the ACI code provisions require two or more continuous spans, spans of equal length or having the larger of two adjacent spans not being greater than the shorter by more than 20 percent, loads being uniformly distributed, unfactored live load not exceeding three times unfactored dead load, and the members being prismatic. All provisions must be met when using the moment coefficients.
-
Upload
khangminh22 -
Category
Documents
-
view
0 -
download
0
Transcript of Derivation of Supports Moments Coefficients for Prismatic ...

Copyright © 2015 IJEIR, All right reserved
613
International Journal of Engineering Innovation & Research
Volume 4, Issue 4, ISSN: 2277 – 5668
Derivation of Supports Moments Coefficients for
Prismatic Continuous Beams by Elastic Analysis
Fathelrahman M. Adam Email: [email protected]
A. E. Hassaballa Email: [email protected]
H. E. M. Sallam Email: [email protected]
Abstract – In this paper an elastic analysis was adopted in
order to calculate the negative moment coefficients for the
continuous beams of different number of spans form 2-spans
to 10-spans and with different span lengths. The difference of
spans adopted on the bases of spans ratio between the longest
span to the shortest span on the continuous beam. The
lengths of spans were taken in sequences starting with
shortest span and the subsequent spans increase by constant
rate. Eleven ratios were taken starting from 1.0 (equal spans)
to 2.0 by constant rate of 0.1. The method of analysis used
here is the moment distribution methods used to analyze
ninety nine models of continuous beams gained by a
combination between the different number of spans and the
different spans ratios and all calculations were done using
spreadsheets. A uniformly distributed load full spans was
applied throughout all the models. The coefficients of
negative moments have been calculated according to the
negative moments at supports obtained for the various
models and a comprehensive data were gained according to
that. These data were analyzed and summarized by taking
the average of the convergent values controlled and
measured using standard deviation. The final filtered values
of coefficients were listed in Tables and also explained
graphically. A modification for the values of moment
coefficients has been done for beams of 3-spans, 4-spans and
5-spans in order to consider the case of difference in spans
lengths take place randomly differ than the adopted for the
models taking into consideration the modification limited to
the span ratio for the adjacent spans not more than 1.5.A
verification has been done for the values of coefficients
calculated by comparing the moment calculated using these
coefficients with the moments gained by using PROKON
software program, these all done for different examples
taking on different spans numbers with different spans
ratios. percentages differences between the two values for
each moment were calculated as errors and most of the
errors values fall less than 3%. Few of the errors increases
than 3% to 9% in limited cases and these values as generally
considered acceptable as these moments considered as
approximate moments and as the larger errors always
coincide with the larger span ratio between adjacent spans
and this case is a rare practically.
Keywords – Continuous Beams, Elastic Analysis, Moment
Coefficients, Moment Distribution Method.
I. INTRODUCTION
A continuous beam is a structural component which is
classified as a statically indeterminate multi span beam on
hinged supports along its length. These are usually in the
same horizontal plane, and the spans between the supports
are in one straight line. The end spans may be cantilever,
may be freely supported or fixed supported. The
continuous beam provides resistance to bending when a
load is applied. At least one of the supports of a
continuous beam must be able to develop a reaction along
the beam axis. Continuous beams are used in structural
designs when three or more spans exist. Continuous beams
occur frequently in cast in situ construction when a single
span of construction is linked to an adjoining span also
commonly used in bridges. Bending moment of
continuous beams does not confine to a single span only
but it will affect the whole system. The continuous beam is
much stiffer and stronger than the simply supported beam
because the Continuity tends to reduce the maximum
moment on a beam and makes it stiffer. To design any
structure which a continuous beam is a part of it, it is
necessary to know the bending moments and shearing
forces in each member.
Various methods have been developed for determining
the bending moments and shearing force on continuous
beams, these methods are interrelated to each other to a
greater or lesser extent. Most of the well-known individual
methods of structural analysis such as the theorem of three
moments which it proposed by Clapeyron (is French
engineer and physicist), slope deflection, fixed and
characteristic points, and moment distribution methods.
These approaches generally lends their self better to hand
computation than numerical methods such as flexibly
methods, stiffness method or finite element method. To
avoid the need to solve large sets of simultaneous
equations, such as are required with the three-moment
theorem or slope deflection, methods involving successive
approximations have been devised, such as hardy cross
moment distribution.
A coefficient method is used for the analysis of
continuous as approximate method by most of codes of
practice such as ACI code, BS8110, EC and SBC. The
approximate method allows for various load patterns also
allows for the real rotation restraint at external supports,
where the real moment is not equal to zero. Elastic
analysis gives systematic zero moment values at all
external pin supports. The coefficient method is thus more
realistic but is only valid for standard cases. It is advised
to use this method whenever its conditions of application
are satisfied. Elastic analysis should be used only if the
conditions of the code method are not satisfied. As an
example the ACI code provisions require two or more
continuous spans, spans of equal length or having the
larger of two adjacent spans not being greater than the
shorter by more than 20 percent, loads being uniformly
distributed, unfactored live load not exceeding three times
unfactored dead load, and the members being prismatic.
All provisions must be met when using the moment
coefficients.

Copyright © 2015 IJEIR, All right reserved
614
International Journal of Engineering Innovation & Research
Volume 4, Issue 4, ISSN: 2277 – 5668
Even with the availability of computers, most engineers
find it desirable to make a rough check of results, using
approximate means, to detect gross errors. Further, for
structures of minor importance, it is often satisfactory to
design on the basis of results obtained by rough
calculation. For these reasons, many engineers at some
stage in the design process estimate the values of
moments, shears, and thrusts at critical locations, using
approximate sketches of the structure deflected by its
loads.
Much of engineer handbook contains coefficients for
calculating forces, one of these helpful manuals is the
reinforced concrete designer’s handbook by Renolds and
Steedman [1] in which there is a comprehensive data about
continuous beam coefficients. A shear and moment
formulas with diagrams for simply supported beams and
continuous beams of two spans were done by American
Wood Council [2]. Khuda and Anwar [3] were studying
the behavior of beams and developed moment coefficients
for beams of different spans and varying span ratio.
This paper adopt elastic analysis using moment
distribution method to deduce negative moment
coefficients as approximate method to calculate supports
moments.
II. MOMENT DISTRIBUTION METHOD
The method was invented by Professor Hardy Cross of
University of Illinois of U.S.A. in 1930. The method can
be used to analyze all types of statically indeterminate
beams or rigid frames. Essentially it consists in solving the
linear simultaneous equations that were obtained in the
slope-deflection method by successive approximations or
moment distribution. Increased number of cycles would
result in more accuracy.
The moment distribution method starts with assuming
that each joint in the structure is fixed, then joints are
“unlocked” and “locked” in succession until each joint has
rotated to its final position. During this process, internal
moments at the joints are “distributed” and balanced. The
resulting series can be terminated whenever one reaches
the degree of accuracy required. After member end
moments are obtained, all member stress resultants can be
obtained from the laws of statics.
For the next three decades, moment distribution
provided the standard means in engineering offices for the
analysis of indeterminate beams and frames. Even now, it
serves as the basic analytical tool for analysis if computer
facilities are not available [4].
2.1 General steps of Moment Distribution: The moment distribution method involves the following
steps:
A. Determination of fixed end moments due to externally
applied loads for all the members.
B. Determination of distribution factors for members
meeting at each joint.
C. The sum of the fixed end moments at each joint is
calculated (unbalanced moment). Next calculate the
balancing moments which is equal in magnitude but
opposite in sign to this sum.
D. At each joint distribution of balancing moments to each
member in the ratios of distribution factors.
E. Carry over half the distributed moments to the other
end of each member.
F. Repeat the cycle (d) and (e) once it is completed for all
the joints of the structure.
This process continues till sufficient accuracy of results
is achieved with attention to that the process should stop
only after a distribution and never after a carry over.
2.2 The Fixed End Moments: The fixed end moments are reaction moments developed
in abeam member under certain load conditions with both
ends fixed against rotation. A beam with both ends fixed is
statically indeterminate to the 3rd degree, and any
structural analysis method applicable on statically
indeterminate beams can be used to calculate the fixed end
moments.
In this paper we introduce only distributed load full
spans for each member, the fixed end moments can be
calculated from the formulas shown in Fig. (1). As sign
convention, the clockwise moment consider as positive
and counterclockwise moment consider as negative.
Fig.1. Fixed End Moments at ends of beam carry
uniformly distributed load and according to support
condition
2.3 Distribution Factors: Is the factor calculated for each element that connected
at a given joint and multiplied by the moment at this joint
to give the distributed moment to each element. As an
example if there are two elements AB and BC connected
at joint B which have outbalance moment (M) and this
moment must be distributed to each element. The
distribution mainly depends on the material property (E,
Elastic Modulus) and geometric data (L, span length and I,
second moment of inertia) for each element as illustrated
in Fig. (2).
M
A
C
B
Deflected Shape 𝜃𝐴 = 0
𝜃𝐶 = 0
𝜃𝐵 = ?
EA, IA,
LA
EB, IB,
LB
w 𝑤𝑙2
8
l
w
l
𝑤𝑙2
12 𝑤𝑙2
12

Copyright © 2015 IJEIR, All right reserved
615
International Journal of Engineering Innovation & Research
Volume 4, Issue 4, ISSN: 2277 – 5668
Fig.2. Two Elements Connected at Joint B
Mathematically the distribution factors need to
distribute the moment (M) to the two elements can be
calculated by using the following formula:
𝐷𝐵𝐴 =𝑘𝐴𝐵
𝑘𝑇
, 𝐷𝐵𝐶 =𝑘𝐵𝐶
𝑘𝑇
(1)
Where k is the stiffness which defined by the moment at
one end of a member necessary to produce unit rotation of
that end when the other end is held fixed. It is calculated
by using the elements properties as:
𝑘𝐴𝐵 =4𝐸𝐴𝐼𝐴𝐿𝐴
, 𝑘𝐵𝐶 =4𝐸𝐵𝐼𝐵𝐿𝐵
, 𝑘𝑇 = 𝑘𝐴𝐵 + 𝑘𝐵𝐶 (2)
The distribution factor is calculated for each joint so
each element has two distributions factors at its two ends.
2.4 Carry Over: Is the ratio of the moment at the end to the moment
producing rotation at the rotating end. It can be derived
using slope-deflection equations and numerically is equal
to ½.
III. MODELS OF CONTINUOUS BEAM
The continuous beam analyzed in this paper was taken
under the following properties:
The section is prismatic.
All the supports are hinges.
The loads applied is uniformly distributed load full span
and have a unit value (w=1.0kN/m).
Use different number of spans starts from two spans and
followed by three spans and so on to ten number of
spans as shown in Fig. (3).
The study adopts beams of equal spans and beams with
different spans lengths with the difference of spans goes
ascending by regular amount depending on the ratio
calculated between the last span (longest) to first span
(shortest). For beams of spans differ irregularly a
modification has been done.
The spans ratios start from 1 means equal spans and
sequences by a rate of 0.1 (10% increasing) until end by
2.0 means that the spans differ by 100% (this gives 11
ratios).These ratios repeated for each number of spans
(from 2 to 10) which gives 99 models of continuous
beams.
The various span lengths of beams can be calculated
according to the following algorithm:
1. Set the values of spans ratios (R) from 1.1 to 2.0 by
step 0.1 (R1 = 1.0, R2 = 1.1, ……, R10 = 1.9 and R11 =
2.0)
2. Iterate for the number of spans (NS) from 2 to 10 by
using the counter i from 2 to 10.
3. Iterate for the ratio of difference of spans by using the
counter j from 1 to 11.
4. Set the first span length for each number of span and
span ratio = 1.0, using equation. (3)
L(i,j,1) = 1.0 (3)
5. Set the value of Rj according to the counter j
6. Iterate using counter k from 2 to i to calculate the spans
lengths using equation. (4)
𝐿(𝑖 ,𝑗 ,𝑘) = 𝐿(𝑖 ,𝑗 ,𝑘−1) +𝑅𝑗 − 1
𝑖 − 1 (4)
Fig.3. Continuous Beam with Different Number of Spans
(NS) start from 2 to 10 spans.
3.1 Calculation of Elastic Negative Moments: For the 99 models and by following steps of moment
distribution method, spreadsheets have been used to help
in calculation. As an example Table (1) shows spreadsheet
for moment calculations of beams of 5-spans with R = 1.6.
Table 1: Spreadsheet for member ends moments calculations according to the moment distribution method
Joints 1 2 2 3 3 4 4 5 5 6
Length(m) 1 1.15 1.3 1.45 1.6
Loads(kN/m) 1 1 1 1 1
k 4 3.478 3.077 2.759 2.5
∑k 4 7.478 7.478 6.555 6.555 5.836 5.836 5.259 5.259 2.5
D.F 1 0.535 0.465 0.531 0.469 0.527 0.473 0.525 0.475 1
F.E.M(kN.m) 0 0.125 -0.11 0.1102 -0.141 0.1408 -0.175 0.1752 -0.32 0
Release 0.00000 -0.00791 -0.00688 0.01625 0.01438 0.01813 0.01625 0.07596 0.06884 0.00000
C.O -0.00396 0.00000 0.00812 -0.00344 0.00906 0.00719 0.03798 0.00813 0.00000 0.03442
∑Moments 0.000 0.113 -0.113 0.126 -0.126 0.140 -0.140 0.259 -0.259 0.000
Note that the actual number of cycles is more than it appears in the Table (1).
3.2 Calculation of Negative Moment Coefficients: Once the member ends moments have been calculated
which are the negative moments at supports, the
coefficients can be calculated by dividing these moments
by the span length. Since the support moment is common
between left and right spans to the support, so an average
of these span lengths is used to find the moment
coefficient at this support.
𝐶𝑖 =𝑀𝑠𝑖
½ 𝐿𝐿 + 𝐿𝑅 (4)
where:
i is refer to the support.
C is the negative moment coefficient at the intended
support.
Ms is the negative moment at that support.
LL is span length left to support
L1=1.0 L2
LNS-1 LN
S

Copyright © 2015 IJEIR, All right reserved
616
International Journal of Engineering Innovation & Research
Volume 4, Issue 4, ISSN: 2277 – 5668
LR is the span length right to the support.
The coefficient C is used in turn to calculate the moment
according to the given span length (L) and the value of
uniformly distributed load (w) for the number of spans and
spans ratio considered by using equation. (5).
𝑀𝑖 = 𝐶𝑖 𝑤𝐿𝑖2 (5)
IV. RESULTS AND COMMENTS
By using the spreadsheet and with following steps of
moment distribution method to calculate supports
moments, comprehensive results were gained for the 99
models of continuous beams. The coefficients of negative
moments (C) were calculated and the results were
arranged and tabulated in many tables according to the
different number of spans and different spans ratios. To
control a lot of data of C, we use a key for C with the
location of support for the different numbers of supports as
described below:
The outer supports have no coefficients this means C =
0, so it is not necessary to name it.
Each beam has been divided into two parts, left part and
right part and naming C as mirror naming.
Where the number of spans start from 2 to 10, then there
are even and odd. The even have middle support and
equal numbers of supports from left and right and the
odd number of spans have equal number of supports
from left and right only.
The naming of C starts from first outer supports to take
C1 for 2-spans and C1-L and C1-R for other number of
spans and followed by C2 for 5-spans and C2-L and C2-
R for other number of spans and so on.(note that L refer
to left and R refer to right). The naming of C
coefficients is seeing in Fig. (4).
Fig.4. Naming of Negative Moment Coefficient
4.1 The values of C1 Coefficient: The values of C1 obtained by adopting the elastic
analysis as described before were explained graphically
for the different number of spans with different spans
lengths ratio as shown in Fig. (5).
Fig.5. C1 Coefficient for different Number of Spans with
different span lengths ratios
The line named S2 is the line represented the values of
C1 for the continuous beam of two spans and so on for S3
to S10. The suffix R refer to C at right and L refer to C at
left as explained in Fig. (4).
Comments on Figure of C1: 1) The values of C1 for the beams of 2-spans (S2) and 3-
spans (S3) are quietly differ than the values of the other
number of spans. Also beams of 4-spans (S4) and 5-
spans (S5) differ but by small amount.
2) The values of C1 for ratio 1 and 2 are falls closely
between 0.104 and 0.107 for all number of spans of
beam without regard for S2 and S3.
3) As general and with the ratio increase, the values of
coefficient of C1 at left of beam decrease and the
values at right increase.
4) From comment above we have to say that the values of
C1 for beams of number of 4, 5, 6, 7, 8, 9 and 10 spans
(S4-S10) can be taken together as goes as a bundle for
C1 at left and at right and in way to average their
values after checking the deviation of the average by
calculating the standard deviation (STD). Fig. (6)
shows the values of STD for the bundle of lines of 4-
C1-L C2-L C3-L C4-L C5 C4-R C3-R C2-R C1-R
C1-L C2-L C3-L C4-L C4-R C3-R C2-R C1-R
C1-L C2-L C3-L C3-R C2-R C1-R C4
C1-L C2-L C3-L C3-R C2-R C1-R
C1-L C2-L C2-R C3 C1-R
C1-L C1-R C2-R C2-L
C1-L C1-R C2
C1-L C1-R
C1

Copyright © 2015 IJEIR, All right reserved
617
International Journal of Engineering Innovation & Research
Volume 4, Issue 4, ISSN: 2277 – 5668
spans to 10-spans for the various span ratios.
Fig.6. Standard Deviation for the beams of number of
spans from 4 to 10
With referring to Fig. (6), we observe that the STD for
the values of C1 at left and right for the number of spans
from 4 to 10 have very less value about to 0.003, this
allows to use an average value for C1 instead of using
individual value for each number of spans at left and right.
For more filtration the STD have been calculated for the
values of C1 for ratios 1 and 1.1 together and for the ratios
from 1.2 to 2.0 together. These done for different numbers
of spans S2, S3 (L and R), S(4-10) (L and R) the values
are shown in Table (2).
Table 2: Standard Deviation for the different radios and
different Number of Spans No. of Spans S2 S3-L S(4-10)-L S3-R S (4-10)-R
STD
(1.0 & 1.1) 0.0007 0.0028 0.0006 0.0028 0.0007
STD
(1.2 – 2.0) 0.0136 0.0089 0.0018 0.0062 0.0015
From the Table (2) the STD for the values of C1 for the
ratios 1.0 and 1.1 and for 2, 3 spans and from 4 to 10 spans
are found to be less than 0.003, this value allows to use an
average value for the two ratios.
For the ratios from 1.2 to 2 the STD for the 2 spans and
3 spans somewhat is high, but for the number of spans
from 4 to 10 is less than 0.002, so the using of an average
value is possible.
The final values of C1 are summarized and tabulated as
shown in Table (3).
Table 3: C1-CoefficientValues after Filtration
Ratio S2 S3-L S3-R S(4-10)-L S(4-10)-R
1 & 1.1 0.126 0.100 0.106
1.2 0.128 0.092 0.107
0.101 0.110
1.3 0.131 0.088 0.110
1.4 0.135 0.085 0.113
1.5 0.140 0.082 0.116
1.6 0.145 0.078 0.118
1.7 0.150 0.075 0.120
1.8 0.156 0.072 0.122
1.9 0.161 0.069 0.124
2 0.167 0.066 0.125
The values of C1 for the 2-spans and 3-spans can be
illustrated graphically as shown in Fig. (7).
Fig.7. C1-Coefficient for beams of 2 and 3 number of
spans for the spans ratios from 1.2 to 2.0
Instead of using Table (3) or Fig. (7) for 2 and 3-spans
we can use the equations deduced by using the Curvexpert
Program by applying curve fitting process. The quadratic
equation was found to be very suitable form used to fit the
values of C1 with standard error = 0 and correlation
coefficient = 1. The quadratic equation takes the form:
𝐶1 = 𝑎 + 𝑏 𝑅 + 𝑐(𝑅)2 (6)
where :
a,b,c , are the parameters generated by programs and given
in Table(4) for each curve.
R, is the ratio between the longest span to the shortest span
on the continuous beam
The values of a, b and c are summarized at the Table(4)
Table 4) Constants Parameters a,b and c for the Quadratic
Equations for the 2 and 3-spans
Number of
Spans
Parameters
a b c
2-Spans 1.07E-01 -1.92E-03 1.61E-02
3-Spans-L 1.43E-01 -4.89E-02 5.18E-03
3-Spans-R 5.35E-02 5.81E-02 -1.11E-02
The values of C2, C3, C4 and C5 Coefficients: With following the same procedure for C1, the values of
the other coefficients (C2 - C5) were analyzed and filtered
and their values were summarized and tabulated as shown
in Table (5).
Table 5: Summarized values of C2, C3, C4 and C5
C2 C3 C4 C5
Ratio S4 S (5-10)
L
S (5-10)
R
S (6-10)
L&R
S (8-10)
L&R S10
1 & 1.1 0.071 0.078 0.078 0.085 0.083 0.083
1.2 - 2.0 0.069 0.080 0.076 0.085 0.083 0.083
Modification of Moment Coefficients: This paper adopts a continuous beams with different
spans number and the span lengths either been equally or
different. The different here is limited to spans lengths
Copyright © 2015 IJEIR, All right reserved
618
International Journal of Engineering Innovation & Research
Volume 4, Issue 4, ISSN: 2277 – 5668
start with small length and subsequent span lengths
increased gradually by constant rate. This case may face
by different practices, so if using the same values of
coefficient may lead to big error. By trial and error and
with taking different sequences of spans with a ratio of
any two adjacent spans not exceed 1.5, a modification has
been done for the values of C for beams of 3-spans, 4-
spans and 5-spans. The modification values are taken as
described below.
Modification for 3-spans: Calculate the average spans ratio of all spans lengths
calculated based on shortest span.
Use the ratio calculated above to extract the value of
from the coefficients of the 2-spans (equation. 6) and
multiplied it by constant value (0.775).
Modification for 4-spans: calculate the average spans ratio of all spans lengths
calculated based on shortest span.
for spans ratios 1 and 1.1, C1 and C2 take the values
for normal spans sequences.
for ratio greater than or equal 1.2: take C1 equal to
0.108 coincide with the big length of span and equal to
0.095 coincide with small span, for C2 take a constant
value of 0.090.
Modification for 5-spans: calculate the average spans ratio of all spans lengths
calculated based on shortest span.
for spans ratios 1 and 1.1, C1 and C2 take the values
for normal spans sequences.
for ratio greater than or equal 1.2: take C1 equal to
0.105 and 0.095 coincide with the big and small span
length respectively, for C2 take a constant value of
0.085 throughout.
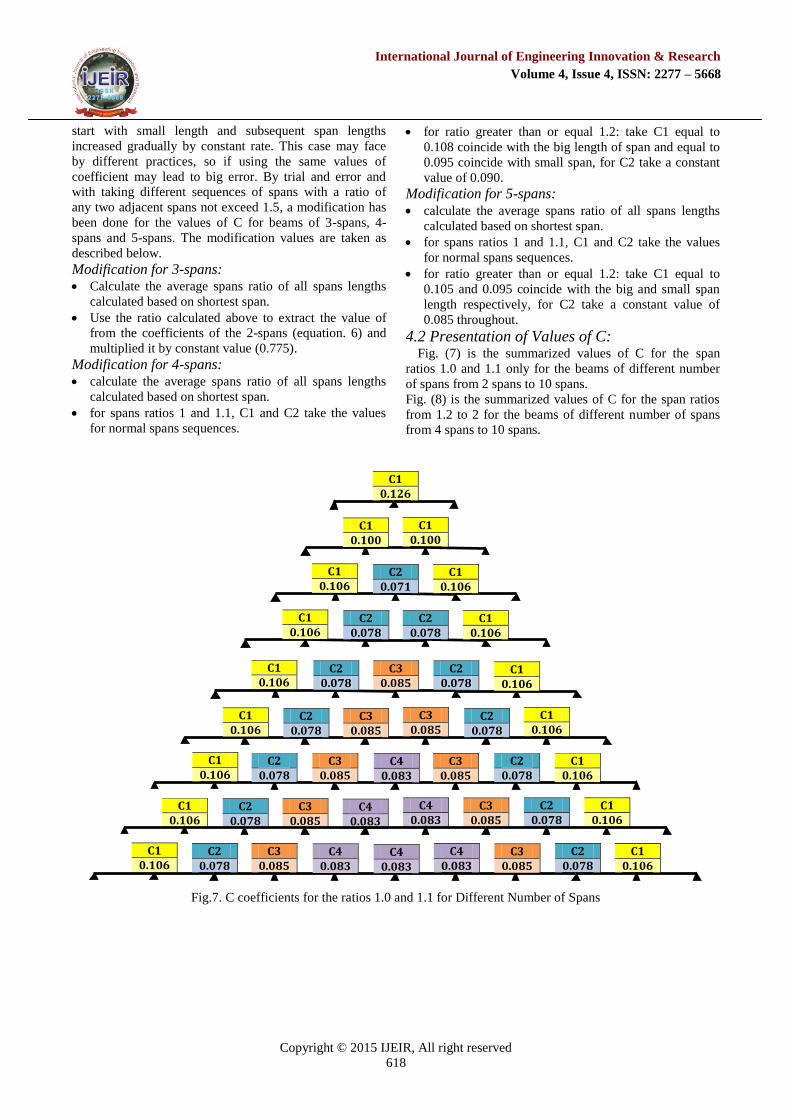
4.2 Presentation of Values of C: Fig. (7) is the summarized values of C for the span
ratios 1.0 and 1.1 only for the beams of different number
of spans from 2 spans to 10 spans.
Fig. (8) is the summarized values of C for the span ratios
from 1.2 to 2 for the beams of different number of spans
from 4 spans to 10 spans.
Fig.7. C coefficients for the ratios 1.0 and 1.1 for Different Number of Spans
C1 0.106
C2 0.078
C3 0.085
C1 0.106
C2 0.078
C3 0.085
C4 0.083
C4 0.083
C4 0.083
C2 0.078
C3 0.085
C1 0.106
C2 0.078
C3 0.085
C4 0.083
C4 0.083
C1 0.106
C1 0.106
C2 0.078
C3 0.085
C1 0.106
C2 0.078
C3 0.085
C4 0.083
C1 0.106
C2 0.078
C3 0.085
C1 0.106
C2 0.078
C3 0.085
C1 0.106
C2 0.078
C3 0.085
C1 0.106
C2 0.078
C1 0.106
C2 0.078
C2 0.078
C1 0.106
C1 0.106
C2 0.071
C1 0.106
C1 0.100
C1 0.100
C1 0.126

Copyright © 2015 IJEIR, All right reserved
619
International Journal of Engineering Innovation & Research
Volume 4, Issue 4, ISSN: 2277 – 5668
Fig.8. Values of C coefficients for the ratios 1.2to 2 for Different Number of Spans
Note: For 2 and 3 spans the Table (4) can be used or using Equations 6.
V. VERIFICATION OF THE C VALUES
Here some examples were taken in order to verify the
calculated coefficients for the different number of spans
and different spans ratios. The negative moment
coefficients at supports (C) can be taken from Table (3)
for ratios 1 and 1.1 and for ratios from 1.2 to 2 can be
taken from Table (4) and also from equation. (6). The
moments calculated from C were checked and verified by
one that calculated by PROKON software program which
is used the finite element method in the analysis of
structures. The percentage difference between moments
due to coefficient M (C) and moment gained by using
software M (PROKON) were calculated to test the
accuracy.
M(C) is calculated using equation. (5) and for L the
average of two spans to left and to right to the support
considered is used.
Example 1: Continuous Beam of 2-spans.
Fig.9. Continuous Beam of 2-Spans
Different span lengths were used and the ratios are
calculated accordingly. The moment required to be
calculated is the moment at joint B and its coefficient is
C1. The input data and calculations were shown in
Table(6).
Table (6)-1: Input Data and Coefficients of Moment (C) for Example 1
Ex. No. L1 (m) L2 (m) R C1 C1
1-1 4 4 1 0.126 -
1-2 4 4.4 1.1 0.126 -
1-3 4 5.2 1.3 0.131 0.132
1-4 4 8 2.0 0.167 -
Table (6)-2: Calculations of Negative Moments at Joint B for Example 1:
Ex. No. R M (PROKON) M (C1) Diff% M (C1) Diff%
1-1 1 24.0 24.2 0.83% - -
1-2 1.1 26.64 26.67 0.11% - -
1-3 1.3 33.36 33.26 0.29% 33.52 0.47%
1-4 2.0 72 72.14 0.2% - -
According to the different percentages shown in Table
(6)-2 we concluded that the moments calculated according
to the values of C were acceptable.
w = 12kN/m
L1 m
B C
EI=const
L2 m
A
C1-L 0.101
C2-L 0.080
C3-L 0.085
C1-R 0.110
C2-R 0.076
C3-R 0.085
C4-L 0.083
C4-R 0.083
C4 0.083
C2-L 0.080
C3-L 0.085
C1-R 0.110
C2-R 0.076
C3-R 0.085
C4-L 0.083
C4-R 0.083
C1-L 0.101
C1-L 0.101
C2-L 0.080
C3-L 0.085
C1-R 0.110
C2-R 0.076
C3-R 0.085
C4 0.083
C1-L 0.101
C2-L 0.080
C3-L 0.085
C1-R 0.110
C2-R 0.076
C3-R 0.085
C1-L 0.101
C2-L 0.080
C3 0.085
C1-R 0.110
C2-R 0.076
C1-L 0.101
C2-L 0.080
C2-R 0.076
C1-R 0.110
C1-L 0.101
C2 0.069
C1-R 0.110

Copyright © 2015 IJEIR, All right reserved
620
International Journal of Engineering Innovation & Research
Volume 4, Issue 4, ISSN: 2277 – 5668
Example 2: Continuous Beam of 3-spans.
Fig.9. Continuous Beam of 3-Spans
Different span lengths were used and the ratios are
calculated accordingly. The moment required to be
calculated is the moment at joints B and C and their
coefficients areC1-L (for B) and C1-R (for C). The input
data and calculations were shown in Table (7).
Table (7)-1: Input Data and Coefficient of Moment (C) for Example 2
Ex. No. L1 (m) L2 (m) L3 (m) R C1-L C1-R
2-1 4 4 4 1 0.1 0.1
2-2 4 4.2 4.4 1.1 0.1 0.1
2-3 4 4.4 4.2 1.075* 0.098** 0.098**
2-4 4 4.8 5.6 1.4 0.085 0.113
2-5 4 5.6 4.8 1.3* 0.102** 0.102**
2-6 4 6 8 2 0.066 0.125
2-7 4 8 6 1.75* 0.1185** 0.1185**
*is the average ratio.
**is the modified coefficient.
Table (7)-2: Calculations of Negative Moment of Joints B and C for Example 2:
Ex. No. R M-L (PROKON) M (C-L) Diff% M-R (PROKON) M (C-R) Diff%
2-1 1 28.8 28.8 0.00% 28.8 28.8 0.00%
2-2 1.1 29.03 30.26 4.23% 34.58 33.28 3.75%
2-3 1.075* 31.13 31.12 0.04% 33.71 32.62 3.24%
2-4 1.4 29.62 29.62 0.00% 55.09 55.00 0.16%
2-5 1.3* 41.35 42.3 2.30% 50.79 49.65 2.25%
2-6 2 29.82 29.7 0.40% 110.6 110.25 0.32%
2-7 1.75* 76.26 76.79 0.69% 95.21 104.52 9.78%
According to the different percentages shown in Table
(7)-2 we concluded that the moments calculated according
to the values of C were acceptable.
If the spans lengths are arranged by a procedure
different from the sequence followed in this study, then a
modification must be done which the extraction of
coefficients based on coefficients of 2-spans by either
using Table (3) directly or calculating it using equation.
(6) with depending on the average spans ratio for all spans
calculated based on the first span (Smallest span length on
the beam). As general the modification is acceptable as the
error is less which shown clearly on Examples 2-3, 2-5
and 2-7. We see an error of 9.78% in Example 2-7 which
is to some extent is large but as general it can be
considered acceptable.
Example 3: Continuous Beam of 4-spans.
Fig.10. Continuous Beam of 4-Spans
Different span lengths were used and the ratios are
calculated accordingly. The moment required to be
calculated is the moment at joints B, C and D and their
coefficients are C1-L (for B), C1-R (for D) and C2-L (for
c). The input data and calculations were shown in Table
(8).
Table (8)-1: Input Data and Coefficient of Moment (C) for Example 3
Ex. No. L1 (m) L2 (m) L3 (m) L4 (m) R C1-L C1-R C2
3-1 4 4 4 4 1 0.106 0.106 0.071
3-2 4 4.4 5 6 1.5 0.101 0.110 0.069
3-3 4 6 5 4.6 1.3* 0.108** 0.095** 0.090**
3-4 4 6 7 8 2.0 0.101 0.110 0.069
3-5 4 8 7 6 1.8* 0.108** 0.095** 0.090**
3-6 4 4.4 4.1 4.3 1.1* 0.106 0.106 0.071
*is the average ratio.
**is the modified coefficient.
w = 10kN/m
L1 m B C EI=cons
t L2 m
A
L3 m D
E
L4 m
w = 18kN/m
L1 m B C EI=const
L2 m
A
L3 m
D

Copyright © 2015 IJEIR, All right reserved
621
International Journal of Engineering Innovation & Research
Volume 4, Issue 4, ISSN: 2277 – 5668
Table (8)-2: Calculations of Negative Moment of Joints B and C for Example 2:
Ex.
No.
M-L-C1
(PROKON)
M
(C1-L) Diff%
M-R–C1
(PROKON)
M
(C1-R) Diff%
M-C2
(PROKON)
M
(C2) Diff%
3-1 17.14 16.96 1.05% 17.14 16.96 1.05% 11.43 11.36 0.61%
3-2 18.49 17.82 3.64% 35.53 33.28 6.35% 14.17 15.24 7.57%
3-3 27.10 27.00 0.37% 22.09 21.89 0.91% 26.34 27.23 3.36%
3-4 25.84 25.25 2.28% 64.13 61.89 3.52% 30.52 29.15 4.48%
3-5 43.22 38.88 10.04% 40.2 40.1 0.16% 50.35 50.63 0.55%
3-6 18.72 18.70 0.12% 18.85 18.70 0.80% 13.27 12.82 3.36%
According to the different percentages shown in Table
(8)-2 we concluded that the moments calculated according
to the values of C were acceptable.
Example 4: Continuous Beam of 5-spans.
Fig.11. Continuous Beam of 4-Spans
Different span lengths were used and the ratios are
calculated accordingly. The moment required to be
calculated is the moment at joints B, C, D and E. The
coefficients of these are C1-L for (B), C1-R for (E), C2-L
for (C) and C2-R for (D). The input data and calculations
were shown in Table (9).
Table (9)-1: Input Data and Coefficient of Moment (C) for Example 4
Ex. No. L1 (m) L2 (m) L3 (m) L4 (m) L5 (m) R C1-L C1-R C2-L C2-R
4-1 4 4 4 4 4 1 0.106 0.106 0.078 0.078
4-2 4 4.3 4.6 4.9 5.2 1.3 0.101 0.110 0.080 0.076
4-3 4 4.3 4.9 5.2 4.6 1.2* 0.095** 0.105** 0.085** 0.085**
4-4 4 4.8 5.6 6.4 7.2 1.8 0.101 0.110 0.080 0.076
4-5 4 4.8 6.4 7.2 5.6 1.5* 0.095** 0.105** 0.085** 0.085**
*is the average ratio.
**is the modified coefficient.
Table (9)-2: Calculations of Negative Moment of Joints B and C for Example 4:
Ex.
No.
M-L-C1
(PROKON)
M
(C1-
L)
Diff% M-R–C1
(PROKON)
M
(C1-R) Diff%
M-L-C2
(PROKON)
M
(C2-L) Diff%
M-R–C2
(PROKON)
M
(C2-R) Diff%
4-1 33.68 33.92 0.71% 25.26 24.96 1.19% 33.68 33.92 0.71% 25.26 24.96 1.19%
4-2 34.84 34.79 0.14% 55.58 56.11 0.95% 32.37 31.68 2.12% 34.41 34.30 0.33%
4-3 34.39 33.52 2.53% 49.3 48.38 1.87% 34.1 35.97 5.48% 42.96 43.35 0.91%
4-4 37.03 39.11 5.61% 104.4 101.73 2.56% 46.09 43.26 6.13% 52.6 54.72 4.03%
4-5 35.39 36.78 3.94% 84.06 86.02 2.33% 52.11 53.31 2.31% 82.29 78.61 4.47%
According to the different percentages shown in Table
(9)-2 we concluded that the moments calculated according
to the values of C were acceptable.
Example 5: Continuous Beam of 8-spans.
Fig.12. Continuous Beam of 4-Spans
Different span lengths were used and the ratios are
calculated accordingly. The moment required to be
calculated is the moment at joints from B to I. The
coefficient of these are C1-L for (B), C1-R for (H), C2-L
for (C), C2-R for (G), C3-L for (D), C3-R for (F) and C4-
L for (E) The input data and calculations were shown in
Table (10).
Table (10)-1: Input Data and Coefficient of Moment (C) for Example 5
Ex. No. L1
(m)
L2
(m)
L3
(m)
L4
(m)
L5
(m)
L6
(m)
L7
(m)
L8
(m) R C1-L C1-R C2-L C2-R C3-L C3-R C4
5-1 4 4 4 4 4 4 4 4 1 0.106 0.106 0.078 0.078 0.085 0.085 0.083
5-2 4 4.3 4.6 4.9 5.2 5.5 5.8 6.0 1.5 0.101 0.110 0.080 0.076 0.085 0.085 0.083
w = 15kN/m
L1 m B C EI=const
L2 m
A
L3 m H I
L8 m

Copyright © 2015 IJEIR, All right reserved
622
International Journal of Engineering Innovation & Research
Volume 4, Issue 4, ISSN: 2277 – 5668
Table (10)-2: Calculations of Negative Moment of Joints B and C for Example 5:
Ex. No. M-L-C1
(P)
M
(C1-L) Diff%
M-R–C1
(P)
M
(C1-R) Diff%
M-L-C2
(P)
M
(C2-L) Diff%
M-R–C2
(P)
M
(C2-R) Diff%
5-1 25.36 25.44 0.32% 25.36 25.44 0.32% 18.56 18.72 0.86% 18.56 18.72 0.86%
5-2 26.33 26.09 0.90% 56.33 57.44 1.96% 23.5 23.76 1.12% 36.59 36.39 0.54%
Ex. No. M-L-C3
(P)
M
(C3-L) Diff%
M-R–C3
(P)
M
(C3-R) Diff%
M-C4
(P)
M-C4
(C4) Diff%
5-1 20.41 20.40 0.05% 20.41 20.40 0.05% 19.79 19.92 0.66%
5-2 28.60 28.77 0.58% 36.72 36.49 0.62% 31.55,, 31.75 0.64%
According to the different percentages shown in Table
(10)-2 we concluded that the moments calculated
according to the values of C were acceptable.
VI. CONCLUSION
An elastic analysis was carried out to calculate the
negative moment coefficients for the continuous beams of
different number of spans form 2-spans to 10-spans and
with different span lengths support uniformly distributed
load throughout span lengths combined together to give a
99 models of continuous beams. The moment distribution
methods have been used with aid of spreadsheets for
calculations to analyze ninety nine models of continuous
beams. The analysis of the models gives a comprehensive
data of negative moment coefficients. These data were
analyzed and filtered by taking the average for the
convergent values controlled and measured using standard
deviation. From the values obtained the following points
can be concluded:
For the beams of 2-spans and 3-psan the values of
moments coefficients gained with the span ratio increased
are shown varied and different from the other number of
spans.
For the beams from 4-spans to 10-spans the values of
negative moment coefficients appeared convergent to each
other for the most of the spans ratios.
As roughly results the negative moment coefficient for
the 2-spans the values range between 0.126 to 0.167 for
the span ratios from 1.0 to 2.0. For the beams of 4-spans to
10-spans and for span ratio from 1.0 to 2.0, the coefficient
of the first interior support range between 0.10 to 0.11, for
the second interior support range between 0.07 to 0.08 and
for any other interior supports the value range between
0.083 to 0.085.
When comparing the negative moments based on the
coefficients obtained with those obtained by using
PROKON Program, the comparing reveal acceptable
convergence, so the values of negative moment
coefficients deducted here can be used with high
confidence with observance to the limitation that: the
loads are uniformly distributed full spans and the ratio
between any adjacent spans is not greater than 1.5 except
beams of 2-spans.
REFERENCES
[1] Charles E. Renolds and James C. Steedman, “Reinforced
Concrete Designer’s Handbook”, 10thedn, E & FN SPON, 1999. [2] American Wood Council, “Beams Formulas with Shear and
Moment Diagrams”, American Forest and & Paper Association,
Inc, Design Aids No. 6, 2007. [3] S.N. Khuda, and A.M.M.T. Anwar, “DESIGN AID FOR
CONTINUOUS BEAMS”
[4] Arthur H. Nilson, David Darwin, Charles W. Dolan, “Design of Concrete Structures”, 14 Edition, McGraw-Hill, 2004.
[5] Owen Brooker, “Concrete Buildings Scheme Design Manual”,
Cement and Concrete Industry Publication (CCIP), 2009. [6] Chidolue C.A., Aginam C.H., “Effect of Shear on Stress
Distribution in Redundant Frames”, IJSCE, issues-3, pp 199-
206, 2012
AUTHOR'S PROFILE
Fathelrahman M. Adam He work as Assistant Professor at Jazan University
(KSA) in Civil Engineering Department On leave
from Civil Engineering Department, Nile Valley
University (Sudan). He received his PhD in
Structural Engineering in 2008 from Sudan
University of Science and Technology (Sudan). He has published more than 10 papers in international journals and
conferences in addition to two researches published as books in Lap
Lambert Academic Publishing . His research interests are in Linear & Nonlinear Analysis Finite Element, Shell Structures, Design
Optimization, Formwork Analysis & Design
A. E. Hassaballa He work as Assistant Professor at Jazan University
(KSA) in civil engineering department On leave from Civil Engineering Department, Sudan University of
Science and Technology. He received his PhD in
Structural Engineering in 2010 from Sudan University of Science and Technology (Sudan). He
has published more than 15 papers in international journals and
conferences. His research interests are Dynamics of Structures and
Earthquake Engineering, Concrete Technology, Concrete Testing and
Quality Control.
H. E. M. Sallam He work as Professor at Jazan University (KSA) in
civil engineering department On sabbatical leave from Materials Engineering Department, Zagazig
University. He also joined work at Northeastern
university (USA). He received his PhD in Materials Engineering in 1993 from Zagazig University
(Egypt). He has published more than 100 papers in international journals
and conferences. His research interests are in Crack Arresters in Steel Structure Components, Fracture Mechanics, Fatigue of Materials.