excel data jonah - AgEcon Search
86
AN EVALUATION OF FARMERS WILLINGNESS TO PAY FOR IRRIGATION WATER IN KERIO VALLEY BASIN KENYA JONAH KIPSAAT KIPROP A Thesis Submitted to the Graduate School in Partial Fulfilment for the Requirements for the award of Master of Science Degree in Agricultural and Applied Economics of Egerton University EGERTON UNIVERSITY MAY 2015
-
Upload
khangminh22 -
Category
Documents
-
view
3 -
download
0
Transcript of excel data jonah - AgEcon Search

AN EVALUATION OF FARMERS WILLINGNESS TO PAY FOR IRRIGATION
WATER IN KERIO VALLEY BASIN KENYA
JONAH KIPSAAT KIPROP
A Thesis Submitted to the Graduate School in Partial Fulfilment for the
Requirements for the award of Master of Science Degree in Agricultural and
Applied Economics of Egerton University
EGERTON UNIVERSITY
MAY 2015
ii
DECLARATION AND APPROVAL
DECLARATION
I declare that, except where there is explicit reference to the contribution of others, this
thesis is the result of my original work and has never, been submitted for any other
degree at Egerton University or any other institution of higher learning.
Signature…………………………………….. Date ………………………………………
Jonah Kipsaat Kiprop
Reg No. KM17/3010/11
APPROVAL
This thesis has be submitted to the Graduate School with our approval as University
Supervisors
Signature…………………………………….. Date…………………………………….
Prof. Job K. Lagat (PhD)
Associate Professor,
Department of Agricultural Economics and Agribusiness Management,
Egerton University
Signature…………………………………... Date ……………………………………….
Prof. Patience Mshenga (PhD)
Associate Professor,
Department of Agricultural Economics and Agribusiness Management
Egerton University

iii
COPYRIGHT
©2015, Jonah Kipsaat Kiprop
No part of this thesis may be reproduced, stored in any retrieval system, or transmitted in
any form, electronic, mechanical, photocopying, recording or otherwise, without prior
written permission of the Author or Egerton University on behalf of the Author
All rights reserved

iv
DEDICATION
I dedicate this work to my parents Mr David Tunduria and Mrs Pauline Tunduria, My
Fiancée Celestine, brothers Elias, Eric, Josphat and Nelson and to my cousin Sally for
their sincere support.
v
ACKNOWLEDGEMENT
I am indebted to a number of people who improved this thesis in many different ways.
My sincere thanks and gratitude goes to my supervisors Prof. Job Lagat and Prof.
Patience Mshenga for their valuable and constructive comments, guidance,
encouragement and motivation throughout the period of this work. On many occasions,
you ensured that the study remained focused and all the necessary components for
success were available. I wish to acknowledge the entire staff of the Department of
Agricultural Economics and Agribusiness Management Egerton University under the
leadership of Prof. Benjamin Mutai for their support since I enrolled for my studies.
Special thanks to the African Economic Research Consortium (AERC) through the
CMAAE program (Collaborative Masters in Agricultural and Applied Economics for
sponsoring my specialization studies at the University of Pretoria, South Africa and
funding my research work.
I wish to thank the Tunyo division agricultural staff led by Mr. Isaac Macharia and Mrs.
Edna Cheboi for their guidance and introduction to farmers in the Irrigation schemes. I
appreciate the work of the enumerators Nelson, Noah, and Mathew who assisted me
during data collection. Also deserving great recognition are the smallholder irrigation
farmers in the Kerio Valley basin for their unconditional support in enabling me to
collect data with ease. I appreciate the support of my colleagues in the CMAAE 2011
class, especially Kelvin Mulungu for sharing with me useful and insightful ideas during
the entire period of the study and research.

vi
ABSTRACT
Water is a critical resource whose availability and proper use is a key factor to Kenya’s
sustainable agricultural development. However, changing climatic conditions and
growing population in arid and semi-arid lands have exerted pressure on the scarce water
resources. Consequently, there have been renewed efforts to enhance capacity of
smallholder irrigation farmers to own and manage irrigation schemes. The objective of
this study was to evaluate the farmers’ willingness to pay and to determine the average
economic value of irrigation water used by major crops grown in the Kerio valley basin.
A multistage sampling method was used to select a representative sample of 216
smallholder irrigation farmers. Data was obtained using a structured questionnaire
administered to the farmers additional data on irrigation water requirements was obtained
from the Food and Agriculture Organization Aquacrop model. The findings revealed
significant differences in farmers occupation status, education level, total livestock
ownership, membership in water users’ association, access to training, distance to the
market and distance to the water source between farmers willing to pay and those not
willing to pay. The results of the probit regression model indicated that the education
level of household head, membership in irrigation water users’ association, farmers’
participation in the construction and maintenance of the scheme and total income from
irrigation positively influenced the farmers’ decision on willingness to pay for irrigation
water. However, distance to water source and access to extension services negatively
influenced farmers’ decision to pay for irrigation water. The Contingent valuation model
results indicate that 91.4% of the smallholder farmers were willing to pay for irrigation
water with a mean willingness to pay of KES 938 (USD 10.4) per Ha in a production
season. This represents about 9.6% of the average total farm income. Factors that
positively influenced the mean willingness to pay are; age of farmers, household size,
distance to the water source and income obtained from irrigation farming. The residual
imputation model results on the economic values of irrigation water for nine crops
indicate that the overall mean value is KES 11.5 per cubic meter of water. The economic
value of irrigation water for the crops; sorghum, green grams, maize, millet, cassava,
cowpeas, mangoes, bananas and lemons were KES 25.2, 20.9, 14.9, 3.6, 4.3, 2.7, 16.9,
7.4 and 6.5 respectively. The study recommends the implementation of an all-inclusive
bottom up approach, water management system that ensures equitable and affordable
water distribution to the smallholder farmers.

vii
TABLE OF CONTENTS
DECLARATION AND APPROVAL .............................................................................. ii
COPYRIGHT .................................................................................................................. iii
DEDICATION .................................................................................................................. iv
ACKNOWLEDGEMENT ................................................................................................ v
ABSTRACT ...................................................................................................................... vi
TABLE OF CONTENTS ................................................................................................ vii
LIST OF TABLES ............................................................................................................ x
LIST OF FIGURES ......................................................................................................... xi
LIST OF ABBREVIATIONS ......................................................................................... xii
CHAPTER ONE ................................................................................................................ 1
INTRODUCTION ............................................................................................................. 1
1.1 Background of the study ............................................................................................ 1
1.2 Statement of the problem ........................................................................................... 4
1.3 Objectives of study .................................................................................................... 4
1.3.1 General objective ................................................................................................ 4
1.3.2 Specific objectives .............................................................................................. 4
1.4 Research questions .................................................................................................... 5
1.5 Hypothesis ............................................................................................................ 5
1.6 Justification of the study ............................................................................................ 5
1.7 Scope and limitation of the study .............................................................................. 6
1.8 Operational definition of terms.................................................................................. 6
CHAPTER TWO .............................................................................................................. 8
LITERATURE REVIEW ................................................................................................. 8
2.1. Water as a resource ................................................................................................... 8
2.2 Economic value of water ........................................................................................... 8
2.3 Pricing of irrigation water .......................................................................................... 9

viii
2.4 Willingness to pay for irrigation water .................................................................... 10
2.5 Determinants of farmers’ willingness to pay for irrigation water ........................... 11
2.6 Water productivity ................................................................................................... 13
2.7 Residual imputation model ...................................................................................... 13
2.8 Theoretical framework ............................................................................................ 14
2.8.1 Consumers utility theory ................................................................................... 14
2.8.2 Euler’s theorem ................................................................................................. 17
2.9 Conceptual framework ............................................................................................ 18
CHAPTER THREE ........................................................................................................ 20
RESEARCH METHODOLOGY .................................................................................. 20
3.1 Study area ................................................................................................................ 20
3.2. 1 Population of study and sampling unit ............................................................ 22
3.2.2 Sampling procedure .......................................................................................... 22
3.2.3 Sample size ....................................................................................................... 22
3.3 Data collection ......................................................................................................... 23
3.4 Data analysis ............................................................................................................ 23
3.5 Analytical framework .............................................................................................. 23
3.5.1 Probit model ...................................................................................................... 23
3.5.2 Double bounded contingent valuation model ................................................... 24
3.5.3 Residual imputation model ............................................................................... 27
CHAPTER FOUR ........................................................................................................... 29
RESULTS AND DISCUSSION ..................................................................................... 29
4.1 Socio-economic characteristics of the smallholder irrigation farmers based on
willingness to pay for irrigation water ........................................................................... 29
4.1.1 Age and household size .................................................................................... 29
4.1.3 Household heads’ educational status ................................................................ 31
4.1.4 Land tenure and size ......................................................................................... 33

ix
4.1.5 Farmers' total income and income from irrigation farming .............................. 34
4.1.6 Livestock ownership ......................................................................................... 35
4.1.7 Farmers access to agricultural training, extension, credit and membership in
irrigation water users association .................................................................................. 35
4.1.8 Mode of transport and distance to nearby market centre...................................... 38
4.1.9 Irrigation development, operation and maintenance ............................................ 38
4.1.10 Water shortage, conflicts and preferred water allocation system. .................. 39
4.2 Factors influencing farmers’ willingness to pay for irrigation water ...................... 41
4.2.2 Factors influencing the farmers’ decision on willingness to pay for irrigation
water .......................................................................................................................... 41
4.3 Estimation of farmers Mean willingness to pay for irrigation water ....................... 45
4.3.1 Farmers’ response to different bid amounts. ........................................................ 45
4.4 Average economic value of irrigation water used in production across major crops
grown ............................................................................................................................. 48
CHAPTER FIVE ............................................................................................................. 51
CONCLUSIONS AND RECOMMENDATIONS ........................................................ 51
5.1 Conclusion ............................................................................................................... 51
5.2 Recommendations ................................................................................................... 52
5.3 Areas of further research ......................................................................................... 53
REFERENCES ............................................................................................................ 54
Appendix: 1 .................................................................................................................. 65
Appendix 2.................................................................................................................... 72
Appendix 3.................................................................................................................... 73
Appendix 4.................................................................................................................... 74

x
LIST OF TABLES
Table 1: Description of variables and the expected signs used in the probit and contingent
valuation model ................................................................................................... 26
Table 2: Age and household size of the farmers given their willingness to pay ............... 29
Table 3: Gender and occupation status of farmers given their willingness to pay............ 31
Table 4: Education level of farmers given their willingness to pay .................................. 32
Table 5: Average land holding (acres) .............................................................................. 33
Table 6: Mean livestock ownership in the scheme ........................................................... 35
Table 7: Farmers access to agricultural training, extension, credit and membership in
irrigation water users association ........................................................................ 36
Table 8: Farmers perceptions on the new system of irrigation ......................................... 39
Table 9: Preferred system of water allocation, water shortage and conflicts .................... 40
Table 10: Probit estimates for the factors influencing farmers’ decision on willingness to
pay decision for irrigation water ......................................................................... 42
Table 11: Farmers’ response to different bid levels .......................................................... 45
Table 12: Factors influencing farmers’ mean willingness to pay for irrigation water ...... 46
Table 13: Summary of crop budgets ................................................................................. 48
Table 14: Water productivity ratios and residual value of irrigation water ...................... 49

xi
LIST OF FIGURES
Figure 1: Irrigation potential in the Kenyan basins. ............................................................ 2
Figure 2: Relationship between the socio-economic factors and willingness to pay for
irrigation water ................................................................................................. 19
Figure 3: Map of Elgeyo Marakwet County ..................................................................... 21
Figure 4: Household size distribution. .............................................................................. 30
Figure 5: Education level of the farmers. .......................................................................... 32
Figure 6: land tenure in the scheme .................................................................................. 33
Figure 7: Farmers income given their willingness to pay ................................................. 34
Figure 8: Farmers frequency of contact of extension service staff ................................... 37
Figure 9: Major modes of transport used by farmers in the scheme ................................. 38
Figure 10: Farmers response to willingness to pay for irrigation water ........................... 41

xii
LIST OF ABBREVIATIONS
ADB African Development Bank
AERC African Economic Research Consortium
ASALs Arid and Semi-Arid Lands
ASDS Agricultural Sector Development Strategy
CVM Contingent Valuation Method
FAO Food and Agriculture Organization of the United Nations
FAO-COAG Food and Agriculture Organization of the United Nations
Committee on Agriculture
ICWE International Conference on Water and Environment
IWRM Integrated Water Resource Management
IWUA Irrigation Water Users’ Association
KNBS Kenya National Bureau of Statistics
KVDA Kerio Valley Development Authority
NIB National Irrigation Board
OECD Organization for Economic Co-operation and Development
GoK Government of Kenya
SHDP Smallholder Horticultural Development Project
WTP Willingness to Pay
UNESCO-WWAP United Nations Educational, Scientific and Cultural Organization
World Water Assessment Programme
IFPRI International Food Policy Research Institute
RIM Residual Imputation Model

1
CHAPTER ONE
INTRODUCTION
1.1 Background of the study
Water is one of the most important natural resources and is a key component to
prosperity and wealth Arbues et al., (2003). However, globally water is becoming
increasingly scarce, especially in developing countries (Amer, 2004). The growing
population, rising incomes and urbanization are increasing the demand for fresh water.
This upward trend in demand calls for efficient water allocation among competing uses.
Irrigated agriculture is currently the biggest user of global water supply accounting for
approximately 70 percent of fresh water abstraction in the world (FAO-COAG, 2007). In
addition, it is projected that irrigated land in developing countries will increase by 27
percent in the next 20 years (World Bank, 2008).
Irrigated agriculture is the only option that can enhance food production in rain deficit
regions. With climatic changes experienced in most regions of the World, irrigated
agriculture is increasingly facing uncertainty about the quantity and regularity of water
supply UNESCO-WWAP (2009). According to FAO (2007), climate change will
account for 20 percent of global increases in water scarcity. In order to bridge the water
deficit and adapt to climate change there is a need to implement decisions on
conservation and allocation of water. The chosen approach must be compatible with the
social objectives of economic efficiency, equity and sustainability.
Agriculture in Kenya is the basic and crucial sector to enhance food security. However,
the sector has been facing numerous challenges in recent years including food insecurity,
erratic weather conditions and rising population. Kenya is among the countries classified
as water deficit in the world, with water resources unevenly distributed in space and time
(ASDS, 2010-2030). Only 17 percent of the land area in Kenya is high potential area,
receiving more than 700 mm of rainfall per year. Currently, irrigated land in Kenya is 1.8
percent of the total land cultivated compared to four percent of Sub-Saharan Africa
(SSA) (World Bank, 2008). The remaining land is arid and semi-arid land and cannot
support food crop production under normal rain fed agriculture. Food shortage is a
recurrent problem, which rain fed crop production cannot solve alone, without emphasis
on irrigation development. Over the years, empirical evidence has shown that irrigation
increases the yield of most crops by 100 to 400 percent (FAO, 2009). As such, in order to

2
develop a vibrant agricultural sector, irrigation development must be emphasised. The
Government has acknowledged the relevance of irrigated agriculture and made its
development a major aspect of Agricultural Sector Development Strategy (ASDS, 2030).
Irrigation in Kenya has a long history spanning over 400 years, and smallholder irrigation
activities constitute a significant part of the total irrigation activities in Kenya (NIB,
2010). Irrigation farming occurs mainly in irrigation schemes, though individual farmers
also practice it in isolation. Of the total irrigable land in Kenya, smallholder managed
schemes account for 42 percent, while the government managed schemes account for 18
percent (RoK, 2010). Most of these irrigation schemes developed between the years 1960
and 1980 (Ngigi, 2002). Despite the strong gains made in the 1970’s, the rate of
irrigation development has declined over the years. With the country being largely
dependent on seasonal rainfall, the same has not been sufficient to sustain crop
production. This has necessitated scaling up of irrigation development activities to
contribute to the attainment of vision 2030’s objective of enhanced food security.
Irrigation expansion and development will also boost food production in marginal lands
and improve livelihoods in rural areas.
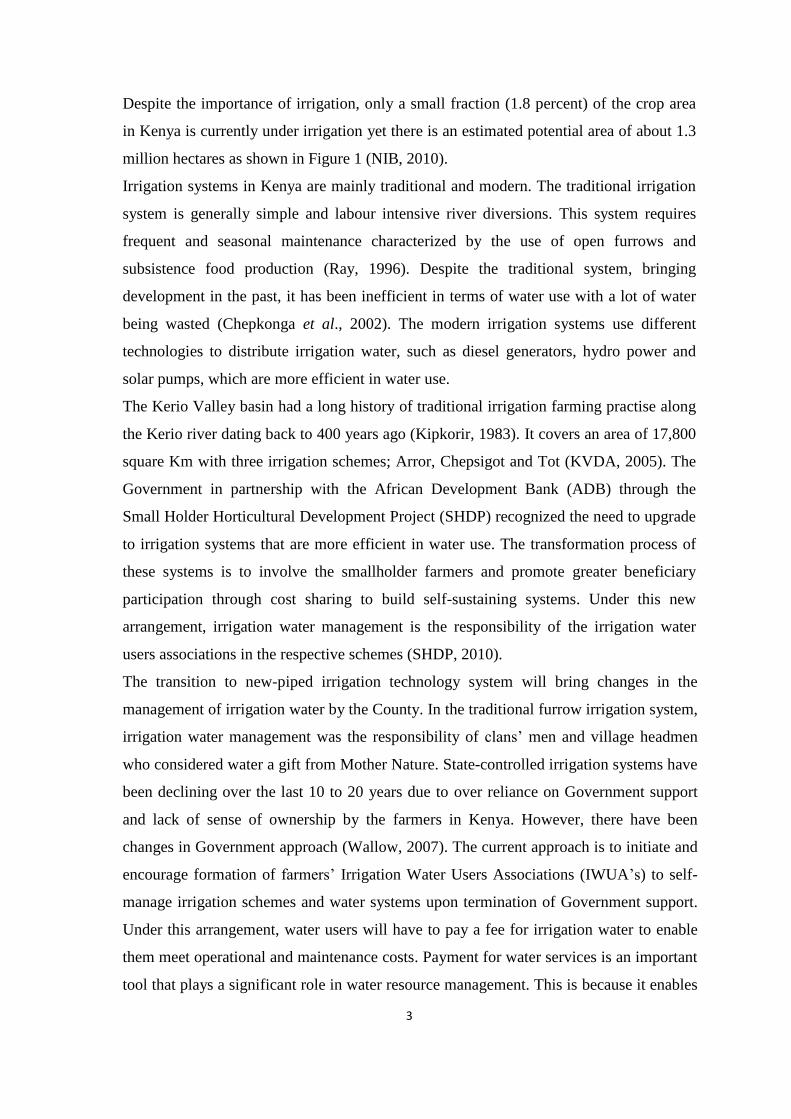
Figure 1: Irrigation potential in the Kenyan basins.
Source: National Irrigation Board (NIB), 2012.
0
50000
100000
150000
200000
250000
Tana Athi Lake Victoria Kerio Valley Ewaso Ngiro
Lan
d a
rea
in H
a
Kenyan basins
3
Despite the importance of irrigation, only a small fraction (1.8 percent) of the crop area
in Kenya is currently under irrigation yet there is an estimated potential area of about 1.3
million hectares as shown in Figure 1 (NIB, 2010).
Irrigation systems in Kenya are mainly traditional and modern. The traditional irrigation
system is generally simple and labour intensive river diversions. This system requires
frequent and seasonal maintenance characterized by the use of open furrows and
subsistence food production (Ray, 1996). Despite the traditional system, bringing
development in the past, it has been inefficient in terms of water use with a lot of water
being wasted (Chepkonga et al., 2002). The modern irrigation systems use different
technologies to distribute irrigation water, such as diesel generators, hydro power and
solar pumps, which are more efficient in water use.
The Kerio Valley basin had a long history of traditional irrigation farming practise along
the Kerio river dating back to 400 years ago (Kipkorir, 1983). It covers an area of 17,800
square Km with three irrigation schemes; Arror, Chepsigot and Tot (KVDA, 2005). The
Government in partnership with the African Development Bank (ADB) through the
Small Holder Horticultural Development Project (SHDP) recognized the need to upgrade
to irrigation systems that are more efficient in water use. The transformation process of
these systems is to involve the smallholder farmers and promote greater beneficiary
participation through cost sharing to build self-sustaining systems. Under this new
arrangement, irrigation water management is the responsibility of the irrigation water
users associations in the respective schemes (SHDP, 2010).
The transition to new-piped irrigation technology system will bring changes in the
management of irrigation water by the County. In the traditional furrow irrigation system,
irrigation water management was the responsibility of clans’ men and village headmen
who considered water a gift from Mother Nature. State-controlled irrigation systems have
been declining over the last 10 to 20 years due to over reliance on Government support
and lack of sense of ownership by the farmers in Kenya. However, there have been
changes in Government approach (Wallow, 2007). The current approach is to initiate and
encourage formation of farmers’ Irrigation Water Users Associations (IWUA’s) to self-
manage irrigation schemes and water systems upon termination of Government support.
Under this arrangement, water users will have to pay a fee for irrigation water to enable
them meet operational and maintenance costs. Payment for water services is an important
tool that plays a significant role in water resource management. This is because it enables

4
water users to use the water resource efficiently. In addition, it enhances sustainability of
irrigation water since the water charges collected provide the financial requirements for
operation and maintenance costs in these schemes (Bazza et al., 2002).
1.2 Statement of the problem
Smallholder irrigation farmers in the Kerio valley basin, over the years, have relied on
the traditional furrow irrigation system. Under this system, water is allowed to flow along
the ground among the crops freely through furrows. The problem with this system is that,
about half of the water ends up not getting to the crops. Moreover, water is freely
abstracted which is not sustainable since there is no structure to support operation and
maintenance functions. However, the current upgrading (changing to pressurized
networks) will necessitate water users to pay a fee under the management of irrigation
water users’ association. Being a new system, there is little documentation on the
reaction of smallholder users to the introduction of water pricing. Information on the
average economic value of irrigation water used for production across major crops is also
scarce. Hence, assessing the farmers’ willingness to pay for irrigation water and
estimation of the average economic value of irrigation water used in production across
major crops would bridge this knowledge gap.
1.3 Objectives of study
1.3.1 General objective
The general objective of the study was to contribute to the sustainable management of
irrigation water in community managed smallholder irrigation schemes, by establishing
an effective water pricing mechanism.
1.3.2 Specific objectives
i. To describe the socio-economic and institutional attributes of smallholder
irrigation farmers’ in the Kerio valley basin
ii. To determine the socio-economic factors which influence the farmers’
willingness to pay for irrigation water in the Kerio valley basin
iii. To assess how much farmers’ are willing to pay for irrigation water in the
Kerio valley basin
iv. To determine the average economic value of irrigation water used in
production across major crops grown in the Kerio valley basin

5
1.4 Research questions
i. What are the socio-economic characteristics of smallholder irrigation farmers
in the Kerio valley basin?
ii. What are the socio-economic factors that influence farmers’ willingness to
pay for irrigation water in the Kerio valley basin?
iii. How much are smallholder farmers’ willing to pay for irrigation water in the
Kerio valley basin?
iv. What is the average economic value of irrigation water used in production of
the major crops in Kerio Valley basin?
1.5 Hypothesis
ii. Socio-economic and institutional factors do not significantly influence farmers’
willingness to pay for irrigation water in Kerio Valley basin Kenya
iii Smallholder irrigation farmers are not willing to pay for irrigation water in
Kerio Valley basin Kenya
1.6 Justification of the study
Changing climatic conditions and increasing water scarcity in semi-arid lands of Kenya
is a major challenge to smallholder irrigation farmers. Various strategies have been
implemented to expand smallholder irrigation in Kenya, with emphasis on development
of smallholder irrigation projects in semi-arid lands (ASAL’s). Improving access to
irrigation water and modernization of irrigation systems is one of the approaches, aimed
at enhancing food production and security. The bottom up management approach that
emphasises community participation in planning, implementation, operation and
maintenance of the irrigation schemes is also being emphasised. The approach is to have
less government intervention and pursue a balanced policy that incorporates both public
and beneficiary participation in building self-sustaining systems. This study aims to
generate information on how to enhance sustainability in the management of irrigation
schemes through payment of irrigation water as a mechanism to cover for the operation
and maintenance costs.
Understanding how farmers perceive payment for irrigation water will help stakeholders
to establish effective and efficient policies in the irrigation sub-sector. The contributions

6
of this study will provide detailed information on pricing of irrigation water as a key
instrument of improving water use efficiency.
1.7 Scope and limitation of the study
This study was done in the Kerio Valley basin, Elgeyo Marakwet County. It focused on
the smallholder irrigation farmers, specifically Arror irrigation scheme due to time
limitation to cover the whole river basin area. The study aimed at determining the
economic value of irrigation water in small holder managed farms in the Kerio valley
basin by eliciting farmers’ willingness to pay (WTP) using the contingent valuation
method and also determining the average economic value of irrigation water for the
major crops grown in the basin. Since most smallholder farmers do not keep records, the
study relied heavily on recall to capture the needed data.
1.8 Operational definition of terms
Crop water requirements - It is the quantity of water needed for normal growth and
yield production, which is supplied through rain fed agriculture or irrigation
Food security - It is a state when all people at all times have both physical and economic
access to sufficient food to meet their dietary needs for a productive and
healthy life.
Integrated water resource management - Is a process, which promotes the co-
ordinated development and management of water, land and related resources,
in order to maximize the resultant economic and social welfare in an
equitable manner without compromising the sustainability of vital
ecosystems.
Irrigation water users’ association - An association of irrigation water users organized
for facilitating the management and utilization of irrigation water
Surface irrigation - Are irrigation systems that supply irrigation water to the ground
surface for crop use. The main methods include basin and furrow.
Water pricing - A charge levied on irrigation water users for water supplied based on
operation and maintenance or other criteria.
7
Water productivity - Refers to the ratio between output (for example Yield) and total
water used (m3) or gross income (KES) and total water used (m
3).
Water scarcity - This is a situation whereby the quantity of water required by farmer for
producing output exceeds available quantity.
Willingness to pay - is a monetary measure of the value an individual farmer would pay
to have a specific change in quantity of water and service
8
CHAPTER TWO
LITERATURE REVIEW
2.1. Water as a resource
Water resources provide important benefits to mankind, both commodity benefits and
environmental values. For physical, social and economic reasons, water is a classic non–
marketed resource. In the past decades, increasing population, urbanization and industrial
development have increased demand for water, resulting in considerable decrease in the
renewable water resources. Market prices for water are seldom available or when
observable are subject to biases Yokwe (2009). However, because of increasing scarcity
of water, economic valuation plays an important role in public decision making on water
policies Young (1996). Therefore, designing appropriate water pricing structures is a
crucial issue for water utilities and local communities towards achieving an efficient
allocation of the scarce water resources.
2.2 Economic value of water
Water is a natural asset, the value of which resides in its ability to create flows of goods
and services over time Agudelo (2002). The concept of treating water as an economic
good arises from the definition of economics, which is the study of how people and
society choose to employ scarce resources and to distribute them for consumption now or
in the future, among the various groups in society (Samuelson et al., 1985). Water is an
economic resource since it meets the basic needs of human beings and has many
alternative uses in the society.
The concept of treating water as an economic good developed in the literature in the 20th
century. It culminated in the 1990’s after the International Conference on Water and
Environment in Dublin, Ireland (ICWE, 1992). In the conference report known as ‘the
Dublin Statement,’ the fourth guiding principle states that, “water has economic value in
all its uses and should be recognized as an economic good”. Later, on at the second
World Water Forum held in The Hague in 2000, an agreement was reached that full
resource value (economic, social, cultural and environmental) should be regarded in
water management decisions. Therefore, the concept of treating water as an economic
good is already accepted and enshrined in official international commitments throughout
the world.

9
Water has different values to different users. The total economic value of water is the
sum of use values and non-use values. Use value is the utility gained by an individual
from direct or indirect use of water. Non-use value is the notion that people appreciate
water even when they are actually not using it. The basis of the option value is how much
individuals are willing to pay today for the option of preserving the water in the future.
Bequest value is the value that others derive from water in the future (Munasinghe,
1993). While existence value means that, an individual places value on water and the
functions, it supports (Marcouiller et al., 1999).
2.3 Pricing of irrigation water
Irrigation is a vital component of crop production in many developing countries. Over the
years, many researchers have examined economic valuation of water as an instrument for
improving water allocation, reducing water consumption and management of irrigation
systems (Dinar and Subramanian, 1998; Maestu, 2001, Boswotrh et al., 2002; Dudu and
Chumi, 2008; Ruto et al., 2012). Water pricing is an economic instrument used to
improve water allocation and mitigate water scarcity situations (Bazza et al., 2002). It is
regarded a good tool to achieve efficiency in water use (Singh, 2007). Water prices
denote any charge or levy that farmers have to pay in order to access water in their fields
(OECD, 1999).
Water pricing plays two major roles, the financial role which is a mechanism for
recovering operation and maintenance cost and the economic role signalling scarcity
values and the opportunity cost of water, to guide in allocation decisions (Maher, 2009).
ADB, in its water policy report of 2000, reaffirmed the need to promote efficiencies in
water use by supporting demand management including water pricing. Jones (2003)
stated that anything scarce and in demand commands a price. To achieve successful
implementation of water pricing as an instrument is not an easy task. This is because
water pricing has many constraints. One of these constraints is the cultural perception of
water as a gift of nature, which is an impediment to the increasing need for the
introduction of irrigation charge services (Abu Zeid, 1998; Perry, 2001).
Despite the success of the irrigation sector in contributing to falling food prices, food
security and raising farm incomes the sector faces numerous challenges. Among these
problems is the management of communal irrigation schemes, which has elicited
growing frustration among the community, government and development agencies

10
(Rogers et al., 2002). The major reason is probably the low financial sustainability of the
sector. These problems of low efficiency, poor management and financial un-
sustainability are being addressed through a wide range of actions including
rehabilitation, modernization and participatory management. The limited benefits
obtained have shifted focus to economic-based intervention, particularly in the aftermath
of The Hague and Dublin meetings. The pricing of water and establishment of water
markets are among the measures that have received the greatest attention from
academicians and development agencies.
According to studies conducted by Molle (2004) and Johansson et al., (2002) water
pricing could address the question of pricing as a signal to water users on the economic
value of water hence regulate its use and avoid wastage. It also serves as a link between
irrigation sustainability and cost-recovery from farmers. Two basic economic
perspectives can describe irrigation sustainability; the first is that if the marginal cost of
water is almost zero, it induces the farmer to use water beyond the levels defined as
efficient by economic theory. The other concern is that economists view factor prices as
being reflective of the scarcity of the resource. This guides in estimating prices to
resources where no market exists, this serves as a way to avoid market distortions and
outright subsidization (Dagne, 2008). In most countries that implement water-pricing
policy, water users pay operation and maintenance costs (Dinar, 1997). In designing
water pricing affordability, measured by the amount of water charges paid relative to
households’ income, should be an essential concern to ensure that the poor households
can meet the costs (Hua-Wang et al., 2009).
2.4 Willingness to pay for irrigation water
Willingness to pay (WTP) is an economic concept, which is used to determine the
maximum amount a person would pay, or sacrifice in order to receive a good or to avoid
something undesired (Young, 1996). This study elicits smallholder irrigation farmers’
willingness to pay for improvements in the systems of irrigation. According to Freeman
(1993), it is a measure of the maximum amount an individual is willing to forego in other
goods and services in order to obtain some commodity or service. Willingness to pay is
becoming increasingly popular and is one of the standard approaches used by researchers
to place value on goods and services for which no market-based pricing mechanism
exists (Koss et al., 2001; Gil et al., 2003). Past research has shown very high levels of

11
WTP for water in most developing countries (Griffin et al., 1995; Raje et al., 2002; Altaf
et al., 2003; Rodriguez, 2003; Zekri and Dinar, 2003).
There are two main approaches used to analyse consumers’ willingness to pay. The direct
approach or stated preference technique, which allows respondents to express the value
they place on non-marketed good or services. The other approach is the Contingent
Valuation Method (CVM). This method is the most commonly used as it elicits
information about respondents' preferences for a good or service (Carson et al., 2001).
Two underlying assumptions describe this approach. The first assumption is that people
have hidden preferences for environmental goods. The second assumption is that people
are capable of transforming these preferences into monetary values (Hoevenagel, 1994).
The indirect approach or revealed preference involves observing consumer behaviour and
modelling behaviour based on the approximate expenditure in terms of time and money
to obtain the good or service (Cookson, 2000).
Some studies done to determine the economic value of irrigation water in developing
countries include that of Speelman (2010) who carried out a study in Limpopo province,
South Africa on the impacts of water rights system on smallholder irrigators’ willingness
to pay for water using contingent ranking. The results indicated that smallholders were
prepared to pay considerably higher water prices if connected to improvements in their
water rights system.
2.5 Determinants of farmers’ willingness to pay for irrigation water
Contingent valuation method (CVM) has become a major tool for estimating the value of
natural resources like water in developing countries (Whittington, 1998; Merret, 2002).
Ruto et al. (2012) studied the economic value of guaranteed water supply under scarcity
conditions using the contingent valuation method in the Guadalbullon river basin in
Spain. The results indicate that the farmers were willing to pay 10 % to 20 % more on
their current irrigators’ annual payment.
Using the contingent valuation model Yokwe (2004) estimated the price for a unit of
irrigation water which smallholder farmers were willing to pay in two irrigation schemes
in South Africa. The results indicate that farmers were willing to pay an average of R0.19
per M3 of water used. The study also employed a cross section regression model to
investigate explanatory factors influencing willingness to pay. In this study, only credit
affected farmers’ willingness to pay positively and significantly.

12
A study done in Chalkidiki, Greece, using Contingent valuation model on farmers’
willingness to pay for irrigation water and attitudes towards setting up an active water
user’s association showed that 65 percent of the respondents expressed a positive attitude
regarding participation in the association. The family size of respondents and education
level was significant in influencing farmers’ willingness to pay for irrigation water. The
effects of method of irrigation and farmers perceptions on the causes of water shortage
were insignificant (Mallios et al., 2001). The factors that influence farmers’ ability to pay
for irrigation facilities in Oshiri irrigation scheme in Nigeria under a public-private
partnership was done using logistic regression (Bamidele et al., 2010). The results
showed that the major determinants of farmers’ ability to pay include age of farmer,
education level and household income as well as the size of the household.
Contingent valuation results from a study on farmers’ willingness to pay for water
services from community forests in western Nepal indicated that the mean WTP of users
was USD 36.6 per year. Distance from household water source, daily water consumption
and household income were significant in influencing their willingness to pay (Khanal et
al., 2010). The determination of farmers’ willingness to pay for irrigation water under
government managed small-scale irrigation projects in Bangladesh revealed that the
estimated WTP for irrigation water was USD 23.85. The study argued that ground was
water is highly under-priced while bid level, respondent’s age, education level,
respondent’s age, family size and ownership of land have a significant influence on
farmers’ WTP for water (Sonia, 2006).
Aleeyar (2006) used a multiple regression model to identify the factors affecting farmers’
willingness to pay for irrigation water in Sri Lanka. The results indicated that total farm
income and land size affected their willingness to pay. Another contingent valuation
survey carried out by Giorgis (2004) in Ethiopia in the form of open-ended WTP
question revealed that access to credit creates an opportunity for respondents to invest in
agricultural inputs, of which irrigation is one. Thus, those who tend to borrow were
willing to pay more for irrigation water. Other variables that significantly influenced
farmers’ willingness to pay were respondents’ education, quantity of fertilizer used in the
preceding season, size of land, total household income, respondents’ age and experience
with irrigation.
Mbata (2006) used Contingent valuation survey to assess the factors affecting
households’ willingness to pay for private water connections in Kanye, Botswana using
13
multiple linear regressions. Results showed that household income, household size,
education of respondents and distance from the existing water source were significant
determinants of household WTP for tap water.
2.6 Water productivity
Water productivity measured as the relationship between agricultural production and
water consumption through evapotranspiration is an important component in crop
production. Growing conditions, such as climate, agronomic practices, soil type and
fertility affects it. Water productivity; is vital in assessing the performance of
smallholder-irrigated agriculture (FAO, 2003). Different spatial scales such as plant,
field, farm, scheme, sub-basin, and basin or regional scales define water productivity.
Bos et al., (2005) define water productivity at farm level in terms of economic benefit in
relation to irrigation water supply. According to Cook et al. (2006), estimates of water
productivity have two basic uses, firstly as a diagnostic tool to identify the level of water
use efficiency of a system under study and secondly to provide insight into the
opportunities for better management towards increased water productivity at the scale
under consideration.
Researchers have developed several models to describe the relationship between crop
production and water use. Hank (1974) linearly relates yields (Yact) to transpiration (Tact)
with maximum attainable yields (Ymax) under maximum transpiration (Tmax). Doorenbos
et al (1979) provides a simple method to assess the impact of crop water on yield
reduction for more than 25 crops. Water stress is determined as the difference between
actual evapotranspiration (ETact) and the evapotranspiration when crop requirements are
met (ETmax). This relates linearly to crop yield (Yact) under certain conditions, and
maximum yields (Ymax) under optimal conditions (Stewart et al., 1977). FAO introduced
the Aqua crop toolbox in 2009, which simulates the yield response to water and is
particularly suited to function under water scarcity condition (Steduto et al., 2009).
2.7 Residual imputation model
The residual imputation model, also known as a residual value method (RVM) is a
technique used to value water productivity where water is used as an intermediate input
into production. Crop production is a dynamic process in which decisions about inputs
are made sequentially. Farmers require field level information on the soil-water plant
relationship before making rational decisions on the best crops to grow given conditions

14
of water scarcity. In valuing water, very few studies have employed the residual
imputation technique. Some studies which have employed this technique include Yokwe
(2005) and Ashfaq and Saima (2005).
Emad et al., (2012) estimated the average economic value of irrigation water for twelve
crops in Jordan. The results showed that the weighted average of water value used in
field crops were JD 0.44 and JD 1.23 for vegetable crops and JD 0.23 for fruit trees. The
overall weighted average water value in irrigation was estimated at JD 0.51. With regard
to individual crops, cucumbers had the highest water values with about JD 6.05, followed
by string beans with JD 2.64, and sweet pepper with JD 2.54. Average economic values
of irrigation water for wheat, rice, sugarcane and cotton were determined by Muhammad
et al., (2005) in Pakistan. The economic value of irrigation water for wheat, rice,
sugarcane and cotton was Rs. 1.13, 0.63, 0.30 and 1.52, respectively. For the minor crops
that is potato, onion, and sunflower, the economic value of irrigation water was Rs. 6.60,
13.10, and 0.53, respectively.
Yokwe (2005) investigated the productivity of water and value in two smallholder
irrigation schemes (Zanyokwe and Thabina) in South Africa using the residual valuation
method. In both schemes, water values estimated for vegetables (cabbage, tomatoes and
butternut) were found to be greater than the water value for dry maize. Water
productivity was also estimated at both the farm and scheme level by comparing the
gross margins per m3 of water, WTP per m
3 and accounting cost per m
3. From the results
the active farmers in Zanyokwe scheme had lower WTP per m3
(R0.084) of water which
is less than the gross margin.
2.8 Theoretical framework
2.8.1 Consumers utility theory
At smallholder farm level, the decisions taken by irrigation water users’ on willingness to
pay for a resource depends on the expected level of satisfaction they would attain from
utilizing the resource. However, their willingness to pay or not to pay at any time is a
result of various factors such as the socio-economic characteristics of the farmers and the
constraints they face. This study, expects that smallholder farmers would reasonably
show their decisions to pay or not to pay for irrigation water in line with the objective of
improving their yield or income and other benefits they derive from water supplied. The
farmers would be willing to pay for the water they use if the utility they derive from

15
irrigation water under the new system is higher than using irrigation in the old traditional
system.
The farmers’ decision behaviour is in the form of a utility function and the decision
problem is, therefore a utility maximization problem. Assuming that, smallholders derive
utility from using irrigation water in crop production and their resource endowment. The
farmers’ water use benefits under the new system is represented by b, where 1b if the
farmer decides to use and pay for irrigation water under the new system and 0b if the
farmer prefers the old system and not willing to pay for water. X represents the resource
endowment of the farm household and the vector Y represents the other observable
attributes of the farm household that may potentially affect the willingness to pay
decision. The farmers’ willingness to pay for irrigation water under the new system
utility’ is given as, ),,1(1
YXUU and if the farmer is not willing to pay for irrigation
water use, the farmers’ utility is represented as; ),,0(0
YXUU . Therefore, farmers’
would prefer the best option from the stated alternatives based on the assumption of
rationality subject to socio-economic, demographic, institutional and other constraints.
Based on the specification of the utility function and in line with a study by Wagayehu
(2000) assuming additively separable utility function in the deterministic and stochastic
components, the deterministic component is assumed to be linear in the explanatory
variables. That is,
iYXSYXUU ),,1(),,1(
11 ……………………………………………….. (1)
And
010);,0();,0( YXSYXUU ……………………………...………………….. (2)
Where (.)t
U is the utility for the use of irrigation water and (.)t
S is the deterministic part
of the utility, and t
is the stochastic component representing the utility known to the
farmers but unobservable to the investigator. It is assumed that the farmers know their
resource endowment, X, and the implicit cost involved in irrigation farming in terms of
the use of their resources and can make a decision on whether to use or not. Farmers
implicit cost of deciding and using irrigation water is represented by I. Therefore, a
farmer would decide to pay for irrigation water under the new system if,

16
(.)(.)01
UU ..........………………………………………………………………….. (3)
01);,0();1,1( YXSYXS
The presence of random components permits making of probabilistic statements about
the farmers’ decision behaviour. If the farmer decides to pay for irrigation water under
the new system, the probability distribution is:
});,0();1,1(Pr{01
YXSYXSP ……………………………...… (4)
And if the farmer was not willing to pay for irrigation water under the new system,
});,0();1,0(Pr{10
YXSYXSP ……………………..……………... (5)
With the assumption that the deterministic component of the utility function is linear in
the explanatory variables, the utility functions in one and two is,
And 00
0
i
U
Where0
, 0
and1
, 0
are the vectors of response coefficients and random disturbances
The probabilities in 4 and 5 are stated as:
}(.)(.)({)(01
UUPWTPPr
)()()(0001
iiir
UPWTPP
))()(10101
ir
PWTPP
))(()(1001
r
PWTPP
iir
VPWTPP
()(
)()(i
PWTPP
111 U

17
Where P is the probability function, 1
oi
V is a random disturbance term
A = the number of vector parameters to be estimated
i
= is the number of explanatory variables
)(i
P =is the cumulative distribution function for i
V evaluated at i
Y
The probability that a farmer would be willing to pay for irrigation water under the new
system is then a function of a vector of the explanatory variables, of unknown parameters
and the disturbance term
2.8.2 Euler’s theorem
Euler’s theorem is a standard mathematical result that shows that if a production function
involves constant returns to scale, the sum of the marginal products will actually add to
the total product. Considering a production function f (x1... xn) suppose it is homogeneous
of degree 1 (that is has "constant returns to scale"). Euler's theorem shows that if the
price (in terms of units of output) of each input i is its "marginal product” f 'I (x1... xn),
then the total cost, namely ∑i=1nxi f i'(x1... xn) is equal to the total output, namely f (x1...
xn).
i nnnii
nxxallforxxkfxxfx .......,,).....,,()......,(1
111
' ………………………...(6)
In this study the residual imputation model was applied to find out the average economic
value of irrigation water used in production across major crops grown in Kerio valley
basin. Considering a production function Y=f (x’s) in which four factors of production
namely; capital (k), labour (l), natural resources, such as land (r), and irrigation water (w)
are employed in agricultural production.
),,, wrlf(ky …………………………………….…………………………...….(7)
Assuming known prices and constant technology where Py is the price of output; Px is the
price of input under perfect information. In addition, we assume the farmers’ objective is
to maximize production, the production function becomes:
wwi
n
i x
n
j iQPXPYP .
11**
…………………………….…………………… (8)
To find the conditions for optimal profits, take the first derivative of π with respect to x
and set that equal to zero

18
0/)(. PxdxXdfPydxd ……………………………………..……………….(9)
Therefore Py.dy/dx=Px or Py.MPx which means VMPx = Px
If there is exchange of all the inputs, including water in a competitive market and
subsequent employment in the production process, the value of water will be:
n
i iiywwXPxYPQP
1... ………………………………………………………...(10)
The residual imputation model determines the incremental contribution of each input in
production process through the assignment of appropriate prices to all inputs except
water. The residual obtained by subtracting the non-water input costs equals the gross
margin and is the maximum amount the farmer would pay for water and still cover the
cost of production. The residual calculation is expressed as:
w
m
j
n
j iijj
Q
PXPY
Pw1 1*
..
………………………………………………….(11)
2.9 Conceptual framework
The framework depicts the assumption that farmers’ perception about the performance
and the attributes of the new system of irrigation significantly affects their probability of
paying for irrigation water. Figure 2 shows factors that influence farmers’ decision on
whether to pay for irrigation water or not. The study conceptualized that, farmers form
perceptions of payment for irrigation water under the influence of several variables,
grouped into institutional factors, socio-economic factors and the attributes of the new
irrigation system. The institutional factors include access to credit, access to extension
service, membership in irrigation water users association, land tenure system, farmers’
participation in construction and maintenance, distance from the market and distance
from the water source. Socio-economic characteristics include: age of the farmer,
education level, farm size, household size, income and the number of livestock owned
while the attributes of the new system are water use efficiency, low maintenance cost and
wider land coverage and water distribution. Therefore, if farmers are willing to pay for
irrigation water they will derive benefits of improved management of water resources,
reduction in water conflicts, reduced water wastage and increased land acreage under
irrigation since the new system utilizes water more efficiently.

19
Figure 2: Relationship between the socio-economic factors and willingness to pay for
irrigation water
Source: Authors’ Conceptualization
Institutional factors
Access to credit
Membership in IWUA
Land tenure system
Access to extension
Access to agricultural training
Participation in construction and
maintenance
Distance from market
Distance from water source
service
Farm and farmers
characteristics
Age of the farmer
Education level
Farm size
Farmers
occupation
Income
Household size
Livestock
ownership
Attributes of the new system
of irrigation
Minimal repair cost
Irrigation land coverage
Farmers’ willingness
to pay for irrigation
water
How much farmers are
willing to pay for irrigation
water
Outcome
Improved management
of irrigation water

20
CHAPTER THREE
RESEARCH METHODOLOGY
3.1 Study area
The study was undertaken, in Elgeyo Marakwet County consisting of Marakwet East,
Marakwet West, Keiyo North and Keiyo South constituencies. The County is located
between longitude 35° 20′ and 35° 45′ East Longitude and 0° 10′ and 0° 20′ North
Latitude. It Borders, West Pokot County to the North, Baringo County to the East, Uasin-
Gishu County to the West and Trans Nzoia County to the North West as illustrated in
Figure 3. It covers a total land area of 3,030 Km2
and a population of 369,998 (KNBS,
2009) with an altitude ranging from 1,000 meters in the Kerio valley to 3,350 meters
above sea level in the highlands. The County receives a bimodal type of rainfall with
long rains received in March through April and short rains starting from July to
September. Mean annual rainfall ranges from 1000 mm for the highlands and between
200 mm to 800 mm in the dry low land. Temperatures in the Kerio valley basin vary
from as low as 10 ° C in the highland areas of the Cherangany and Tugen Hills, with
higher temperatures in the lower altitude areas of the valley floor that reach a maximum
of 40 ° C. Evapotranspiration is high in these zones due to low humidity.
The County falls into three distinct topographical zones: The highland plateau (2500m-
3500m) ideal for (forest, pyrethrum, tea, wool sheep, potatoes and dairy cattle); the Kerio
Escarpment (1,200m-2,000m) and the Valley floor (300m-900m). Irrigation occurs along
the 40 kilometres stretch of the escarpment containing three major irrigation schemes:
Arror, Chepsigot and Tot. Irrigation under these schemes mostly occurs on small plots
with the major crops grown being maize, millet, mangoes, sorghum, green grams,
cassava and cowpeas. Untapped and underutilized crops, which have high potential for
production potential, include sisal, cotton and pyrethrum. The main challenge in crop
production is climate variation with occasional severe droughts and heavy floods. Natural
resources like indigenous forests and minerals such as fluorspar endow the County while
oil prospecting is currently underway.

21
Figure 3: Map of Elgeyo Marakwet County
Source: (World Resource Institute, 2013)

22
3.2. 1 Population of study and sampling unit
The population in this study were the smallholder irrigation farmers in the whole of
Kerio valley basin, while the sample unit for this study consisted of all smallholder
irrigation farmers in the Kerio Valley basin in Elgeyo Marakwet County.
3.2.2 Sampling procedure
This study used multistage sampling procedure to select the sample for the study. In the
first stage, the study purposively selected Elgeyo Marakwet County because of the large
number of smallholder irrigation farmers and the irrigation schemes are currently
undergoing a transition from traditional irrigation to modern systems. In the second
stage, Arror irrigation scheme was selected purposively since it is the scheme that is
currently undergoing upgrading and based on the availability of modern facilities. In the
third stage, the study applied systematic sampling in choosing respondents from the
source list obtained from irrigation water users’ association and the Small Holder
Horticultural Development Project in the County.
3.2.3 Sample size
The required sample size was determined using the proportionate to size sampling as
specified by Groebner et l., (2005):
2
2)(
d
PQzn …………………………………………………………...………… (12)
Where n= is the sample size;
P=0.9 and is the proportion of the population of which in this case were
smallholder irrigation farmers in the county. Since, approximately 90
percent of the farmers in the Kerio basin practice smallholder irrigation
(SHDP, 2010).
d =0.04 is the significance level as this was enough to remove 90% bias in
sampling.
Z = 1.96.
Q =1-P the weighting variable.

23
Based on the calculations the sample size calculated for the study was;
n= [1.962 x 0.9 x 0.1] / [0.04
2] = 216.09 ≈ 216 respondents
3.3 Data collection
The study used primary data collected using a structured questionnaire and administered
to the smallholder irrigation farmers in the Kerio basin. Secondary data on irrigation,
crop-water use and requirements’ were obtained from the FAO CLIMWAT and
CROPWAT software 2013.
3.4 Data analysis
In analysing data, descriptive statistics including frequencies, percentages and means
were used to describe the socioeconomic characteristics of the farmers willing to pay and
those not willing to pay for irrigation water. A probit model was used to determine
factors influencing farmers’ willingness to pay while the contingent valuation model was
used to analyse farmers mean willingness to pay. The study also used the residual
imputation model to determine the average economic value of irrigation water used in
production across major crops grown. A pre-test survey involving 30 farmers was
undertaken to establish the starting bids for the contingent valuation model.
3.5 Analytical framework
3.5.1 Probit model
The decision taken by smallholder irrigation farmers’ on whether to pay or not to pay for
irrigation water depends on the unobservable utility index 𝑃𝑖 influenced by the
socioeconomic, institutional and attributes of the new system of irrigation. The larger the
expected utilities index 𝑃𝑖, the higher the probability of paying for irrigation water. The
index is expressed as;
𝑃𝑖(0, 1) = β1+ β2Xi……………. βnXn.....+ε …………………………….………………….……. (13)
𝑃𝑖(0,1)= β0+β1Edulevelhh+ β2Agehh +β3Partc+ β4Hhsize+ β5Genderhh+ β6Distmkt +
β7Tlu-own+β8Crd-acc+ β9Ext-ctc+ β10Income-irr+ β11Traing+ β12Memb-iwua+ β13Dist-
ws+ ε
To show the relationship between the utility index and the decision denoted by Y to pay
or not to pay an assumption is made such that Y= 1 if the household is willing to pay and
Y=0 if not willing to pay. Another assumption is the critical utility ρ* such that if the

24
expected utility exceeds ρ ٭ the then Y=1 otherwise Y=0 if the expected utility is less than
the critical threshold, meaning that the farmer will not be willing to pay. Mathematically,
this is expressed as:
Y=1 If ρ*>0 and Y=0 if ≤0……………………………………………..………..………...... (15)
The outcome equation of the profit model is estimated and presented as:
Y (0, 1) = β0+ β1Xi……………. βn Xn...+ε………………………..…………………………....... (16)
Where β0 = constant, Y (0, 1) = decision to pay or not, β = coefficient of determination,
Xi= respective factors influencing the decision and ε = Error term
Hence the outcome equation is:
Willingness to pay (Yi) = β0+β1Edulevelhh+ β2Agehh +β3Partc+ β4Hhsize+
β5Genderhh+ β6Distmkt + β7Tlu-own+β8Crd-acc+ β9Ext-ctc+ β10Income-irr+
β11Traing+ β12Memb-iwua+ β13Dist-ws+ ε …………………………………………………17)
3.5.2 Double bounded contingent valuation model
The dependent variable for the Probit model analysis has a dichotomous nature,
measuring the willingness to pay cash for irrigation water or not, where 1 is if the farmer
is willing and 0 if not. However, the decision on willingness to pay is not sufficient. The
total amount of cash that the farmer is willing to pay is very important. Since there is no
market for irrigation water in the area, the study employed the double bounded
contingent valuation method to collect information on the value of irrigation water. An
opening question was posed to the respondent on whether he/she was willing to pay or
not. If the respondent replied “no’’ for the first bid, then further discussions on the
payment were terminated. On the other hand, if the respondent’s choice was ‘’yes’’ then
a second question was posed with a starting bid value. If the payment choice for KESs,
was ‘’yes’’ then the respondent faced another level of bid choice, which would be higher
or lower amount, respectively. This second amount (bid) was based on the response of
the first bid (if the response for the first is yes, then the following bid would be double
the first one and half if otherwise).
The probabilities of the outcomes were represented by p (yy); p (nn); P (yn); and p (ny)
for “yes”, “yes’’, “no”, “no’’, “yes”, “no’’ and “no”, “yes’ ’outcomes respectively.
Following Hanemann et al. (1991), these likelihoods represented mathematically are:
25
The probability of “ no, no” outcome is represented as:
),G(B WTP)Max. and .(),(L
i
L
i
I
i
L
i
I
innBWTPMaxBPBBP
……...……… (18)
The probability of “yes, yes” will be:
),G(B1 WTP)Max. and .(),(U
i
U
i
I
i
U
i
I
iyyBWTPMaxBPBBP
…...…….. (19)
When a “yes” is followed by “no” we have:
),G(B),G(B) .(),(I
i
U
i
U
i
I
i
U
i
I
iynBWTPMaxBPBBP
…….....………… (20)
When a no is followed by a yes response the probability is :
),G(B),G(B) .(),(L
i
I
i
L
i
I
i
L
i
I
inyBWTPMaxBPBBP …………….………… (21)
With a sample of N observations where B is:
),(.),(.),(.),(.)(L
i
I
iny
ny
i
U
i
I
iyn
yn
i
L
i
I
inn
nn
i
U
i
I
iyy
yy
i
N
i
BBPdBBPdBBPdBBPdL
…. (22)
Where ny
i
yn
i
nn
i
yy
idddd and ,, are binary valued indicator variables, where 1
yy
id for yes-
yes response 0 otherwise, for no-no response, otherwise 0; 1ny
id for no –yes response,
otherwise 0; and 1yn
id for yes no response 0 otherwise

26
Table 1: Description of variables and the expected signs used in the probit and
contingent valuation model
Variable Variable
code
Type of
variable
Unit of measurement Expected
sign
Dependent variables
Willingness to pay for
irrigation water
WTP Dummy 1 for those willing to
participate and 0
otherwise
Independent variables
Education level of
household head
EDULHH Continuous Years -
Age of household
head
AGEHH Continuous Years -
Participation in
construction and
maintenance
PARTC-
MAI
Dummy 1 if participated, 0
otherwise
+
Distance from the
market
DIST-MKT Continuous Kilometres + / -
Household family size FAMSIZE Continuous Number of people in
household
-
Livestock ownership TLU Continuous Number of livestock
owned
+ / -
Access to credit
service
CRD-ACC Dummy 1 if accessible,0
otherwise
+ / -
Access or contact with
extension service
EXT-CTC Dummy 1 if accessible,0
otherwise
+ / -
Income from irrigated
farm
INCOME-
IRR
Continuous Kenya shillings +
Access to training TRAING Dummy 1 if trained,0 otherwise +
Membership in
irrigation water users
association
MEMB-
IWUA
Dummy 1 if member,0
otherwise
+
Distance to the water
source
DIST-WS Continuous Kilometres +

27
3.5.3 Residual imputation model
This is the most common method applied to determine the shadow pricing of irrigation
water and other producers’ goods. The technique determines the contribution of each
input to output in the production process. It assumes that if appropriate prices are
assigned by market forces for all production inputs except one the remaining total value
of product or residual which is water in this specific case, then its value can be imputed
(Young 2005). The residual value of water is estimated even if water is a scarce resource
and crops are irrigated with deficit or supplementary irrigation because water value is
assigned the residual value once the remaining inputs get the opportunity or market cost.
The model expressed mathematically and by considering an agricultural production
process in which four factors of production: capital (K), labour (L), natural resources,
such as land (R), and irrigation water (W) produces a single product denoted Y.
),,,( WRLKfY …………………………………………………...…….…. (23)
If we consider technology as constant, but all other factors variable except water, the
total production value is:
)()()()(WWRRLLkkY
QVMPQVMPQVMPQVMPTVP ……………...………...... (24)
Where TVP represents the total value of product Y, VMP represents value of marginal
product of resource I, and Q is the quantity of resource i. Assuming competitive factor
and product markets and treating, prices as known constants. The first postulate which
asserts that (VMPi =Pi) permits substituting into (2) and by rearranging
WWRRLLkkYQPQPQPQPTVP …………………………….…………..……… (25)
Assuming that all variables in (1) are known except Pw, the expression can be solved for
that unknown to impute shadow price of water PW⃰ as follows:
WRRLLKKYWQQPQPQPTVPP /)(
* ……………………...…………………. (26)
The study undertook valuation of the residual value of water for nine major crops grown
in the Kerio Valley basin. These crops together make up 90% of the total irrigated land
area of the basin (KVDA, 2010). The crops included are maize, millet, cowpeas, green
28
grams, cassava, bananas, mangoes, lemons and sorghum. Data available from FAO
irrigation water use and crop water requirements for crops cultivated in different agro-
ecological zones in Kenya guided the selection of these crops. FAO uses the Penman-
Montheith methodology in calculating the crop water requirements. These data are
available in the CROPWAT computer software, which uses data from CLIMWAT 2.0,
which is a database of climatic data from weather stations globally. Farm budgets for
each of these crops were developed. Gross margins calculations for each crop aided in
imputing the value of water for these crops. All costs were on per acre basis, and
converted to per hectare. These crop budgets were used to determine the price of water
(KES/m3). The costs of production were deducted from gross returns of each individual
crop. These returns were further divided by the amount of water applied (m3) in this case
the irrigation crop water requirement.

29
CHAPTER FOUR
RESULTS AND DISCUSSION
This chapter discusses the empirical findings of the study. It starts by presenting the
descriptive statistics for the socio-economic characteristics of the smallholder irrigation
farmers based on their willingness to pay for irrigation water. It also presents the results
of the probit model on the factors influencing the farmers’ decision on willingness to pay
for irrigation water. Lastly, it presents the results of the economic value of water based
on farmers’ mean willingness to pay and water productivity at the crop level.
4.1 Socio-economic characteristics of the smallholder irrigation farmers based on
willingness to pay for irrigation water
4.1.1 Age and household size
The results presented in Table 2 provide a summary of the ages and household sizes of
the farmers willing to pay and those not willing to pay for irrigation water. For farmers
willing to pay, the youngest farmer was 20 years old while the oldest farmer was 75 years
old. The mean age of all farmers was 40 years. In terms of the household size,
composition, the mean household size was 6 members with the smallest household size
being one member while the highest was composed of 15 members. However, farmers
who were not willing to pay had a mean age of 42 years with the youngest farmer being
19 years old and the oldest being 68 years.
Table 2: Age and household size of the farmers given their willingness to pay
Characteristics Willing to pay Not willing to pay
Mean t-ratio
Age (years) 40 42 40 -0.789
Household size (members) 6 5 6 1.084
The results in Table 2 indicate that the average age was higher for farmers not willing to
pay for irrigation water (42 years) compared to farmers willing to pay (40 years).

30
However, the differences in the mean ages and household sizes between the two groups
of farmers were not significant at the 5 % level of significance.
The household size distribution shown in Figure 4 illustrates the number of respondents
sampled against the household size. The least number of household members being 1 and
the highest being 15 members. Majority (36) of the respondents had six members in their
household.
Figure 4: Household size distribution.
Results presented in Table 3 indicate that among farmers willing to pay for irrigation
water, 65.4% were male and 34.5% female. On the other hand, farmers not willing to pay
for irrigation water comprised of 73.7% male and 26.3% female. These results indicate
that the majority of male-headed households were much more willing to pay for water
compared to the female-headed households. There is however no statistically significant
association between gender of the household and willingness to pay for irrigation water.
10 12
21
33
30
36
28
19
9 9
1
5
2 0
1
0
5
10
15
20
25
30
35
40
1 2 3 4 5 6 7 8 9 10 11 12 13 14 15
Num
ber
of
resp
onden
ts
Household size
Number of
respondents

31
Table 3: Gender and occupation status of farmers given their willingness to pay
Characteristic
of the farmer
Category Willing to
pay
N=197
Not willing
to pay
N=19
Overall
N=216
2 P
value
Gender Freq. % Freq. % Freq. % 0.001
Male 129 65.5 14 73.7 143 66.2 0.470
Female 68 34.5 5 26.3 73 33.8
Occupation
status
Full-time
farmers
117 59.4 7 36.8 124 57.4 17.615***
Salaried
/employed
54 27.4 3 15.7 57 26.4
Retired 3 1.5 0 0 3 1.4
Casual
labourers
23 11.7 9 47.3 32 14.8
*, **, *** significant at 10, 5 and 1 percent level, respectively
Analysis of farmers’ occupation status and participation in farm activities is presented in
Table 3. The results indicate that 57.4% were full time farmers while 26.4%, 1.4% and
14.8% were employed, retired and casual labour respectively. In respect to the
willingness to pay 59.4% of full time farmers were willing to pay for irrigation water. For
employed farmers working off farm 27.4% were willing to pay. A closer look at the
farmers working as casual labour in the scheme indicates that only 11.7% were willing to
pay. There is however, a statistically strong positive association between farmers’
occupation status and farm labour participation and farmers willingness’ to pay for
irrigation water.
4.1.3 Household heads’ educational status
In terms of educational level, the majority (87%) of the farmers had accessed education
as shown in Figure 5. The results show that 13% had not accessed formal education, 56%
had accessed primary education, 18% secondary education and only 13% tertiary
education.

32
Figure 5: Education level of the farmers.
Concerning willingness to pay and education level the results in Table 4 indicate that
10.7% of farmers willing to pay for irrigation water had no formal education, while
57.8% went to primary school, 17.2% secondary school and 14.3% university. Among
those not willing to pay 42.1% had no formal education, while 31.6% went to primary
school, 26.3% secondary school, and no farmer who had attained tertiary education in the
category. Results of chi square test indicate a significant positive association between
farmers’ access to education and farmers’ willing to pay for irrigation water.
Table 4: Education level of farmers given their willingness to pay
Education level Willing to
pay
N=197
Not willing to pay
N=19
Overall
N=216
2 sig
Freq. % Freq. % Freq. % 18.405*** 0.001
No education 21 10.7 8 42.1 29 13.4
primary 114 57.8 6 31.6
120 55.6
secondary 34 17.2 5 26.3 39 18
Tertiary/college 28 14.3 0 0 28 13
Total 197 100 19 100 216 100
*, **, *** Significant at 1 percent level.
none, 13.40%
primary,
55.60%
secondary, 1
8%
university/coll
ege
13%

33
4.1.4 Land tenure and size
Land tenure plays an important role in agricultural production. Results presented in
Figure 6 show that even though land ownership in the scheme is communally owned,
due to insufficiency of own cultivatable land in the scheme, about 35 % of the farmers
rented land from other farmers while 65 % farmed on their own portion of the communal
land.
Figure 6: land tenure in the scheme
Analysis of landholding in the scheme presented in Table 5 show that the average size of
total cultivated land owned by the farmers was 3.6 acres with farmers having the smallest
size of land owning 0.5 acres and the largest owning 20 acres. Farmers willing to pay for
irrigation water had a mean land size of 3.7 acres while non-willing farmers had a mean
of 3.5 acres. There was no significant difference in land ownership between the two
groups.
Table 5: Average land holding (acres)
Characteristics Willing to pay Not willing to pay Overall mean t-ratio Sig.
Total land 3.7 3.5 3.6 1.06 0.214
Irrigated land 2.4 2.1 2.25 0.715 0.475
communal, 65.00%
Rented Land, 35.00%

34
The total land utilized under irrigation had a mean of 2.25 acres with farmers willing to
pay for water having a mean of 2.4 acres, while those not willing to pay have a mean of
2.1acres. The hypothesis is that farmers with larger total land area have higher demand
for irrigation water. Hence, they were willing to pay for a secure and sufficient water
supply. Total land area under irrigation had an overall mean of 2.5 acres. The differences
between the means of the total land owned and land under irrigation in the scheme was
not significant at 5 percent confidence level.
4.1.5 Farmers' total income and income from irrigation farming
The results in Figure 7 present an analysis of total household income and income
obtained from irrigation farming. The overall mean household total income was KES
97,210. Farmers willing to pay for irrigation water had a total mean income of KES
92,127 while those not willing to pay had a mean of KES 98,068. The difference in
means between these groups was not significant.
Figure 7: Farmers income given their willingness to pay
In terms of total mean income from irrigation farming, willing farmers had higher
income with a mean of KES 54,061 compared to a mean of KES 41,826 for non-willing
farmers. The difference between the means of the two groups was significant. Income
0
10,000
20,000
30,000
40,000
50,000
60,000
70,000
80,000
90,000
100,000
willing topay
not willingto pay
overallmean
97,127 98,068 97,210
54,061
41,826
52,984
Inco
me
in (
Ksh
)
Farmers willingness to pay for irrigation water
total income
income from irrigation farming

35
plays a major role in influencing farmers’ willingness to pay as it is hypothesized that the
higher the amount of income per production season the more the farmer will be
concerned about sustainability and is more likely to pay for irrigation water.
4.1.6 Livestock ownership
Livestock are important assets in most rural households in Kenya. They provide food,
draft power and income. Moreover, livestock act as proxies of wealth and prestige. About
83% of the farmers in the scheme reared livestock, which constitute cattle, poultry, goats
and sheep. The mean number of total livestock owned was 29. The willing farmers had a
mean total livestock ownership of 28 and non-willing farmers had a mean of 31
livestock. As shown in Table 6, willing farmers had relatively lower total number of
animals compared to the non-willing farmers. The mean difference of total livestock
owned was significant at 5 percent confidence level.
Table 6: Mean livestock ownership in the scheme
Livestock Willing to pay Not willing to pay Overall
mean
t-value
Cattle 6 6 6 -0.076
Poultry 27 17 23 0.628
Goats 23 9 22 0.737
Sheep 7 5 7 0.887
Total livestock 28 31 29 3.04***
*, **, *** significant at 1 percent level
4.1.7 Farmers access to agricultural training, extension, credit and membership in
irrigation water users association
Agricultural support services provided by various institutions are important sources of
information on improved agricultural technologies and acquisition of farm inputs. These
services include agricultural training, extension and provision of credit. The results
presented in Table 7 indicate that 66 % of farmers had access to agricultural training.
Majority of farmers who had access to training (70%) were willing to pay for irrigation
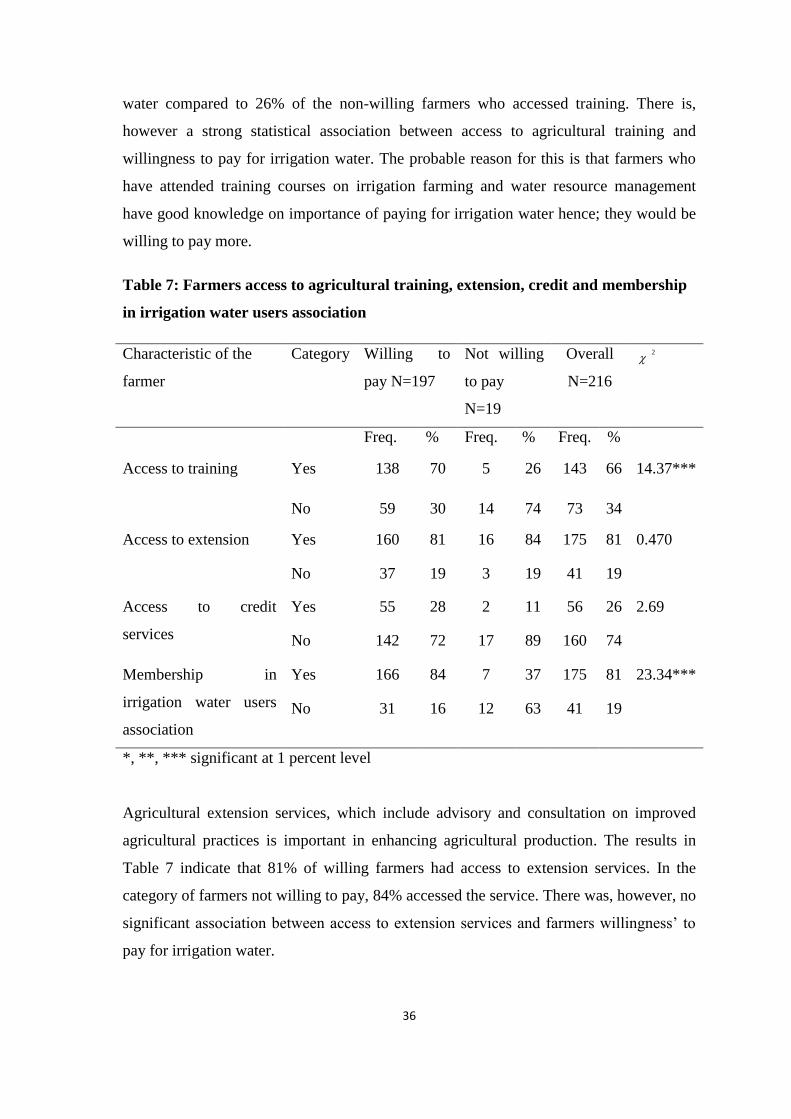
36
water compared to 26% of the non-willing farmers who accessed training. There is,
however a strong statistical association between access to agricultural training and
willingness to pay for irrigation water. The probable reason for this is that farmers who
have attended training courses on irrigation farming and water resource management
have good knowledge on importance of paying for irrigation water hence; they would be
willing to pay more.
Table 7: Farmers access to agricultural training, extension, credit and membership
in irrigation water users association
Characteristic of the
farmer
Category Willing to
pay N=197
Not willing
to pay
N=19
Overall
N=216
2
Freq. % Freq. % Freq. %
Access to training Yes 138 70 5 26 143 66 14.37***
No 59 30 14 74 73 34
Access to extension Yes 160 81 16 84 175 81 0.470
No 37 19 3 19 41 19
Access to credit
services
Yes 55 28 2 11 56 26 2.69
No 142 72 17 89 160 74
Membership in
irrigation water users
association
Yes 166 84 7 37 175 81 23.34***
No 31 16 12 63 41 19
*, **, *** significant at 1 percent level
Agricultural extension services, which include advisory and consultation on improved
agricultural practices is important in enhancing agricultural production. The results in
Table 7 indicate that 81% of willing farmers had access to extension services. In the
category of farmers not willing to pay, 84% accessed the service. There was, however, no
significant association between access to extension services and farmers willingness’ to
pay for irrigation water.

37
Frequency of contact with extension staff can gauge effectiveness of extension services
delivered to the farmers. The results presented in Figure 8 indicate that out of the total
number of farmers who had contact with the extension officers, 23% attested to having
received the visit only once a year, 51% had received at least 4 times a year and 25%
received at least once every month.
Figure 8: Farmers frequency of contact of extension service staff
The availability of sufficient credit to the smallholder farmers contributes positively in
enhancing production and income. Access to credit enables farmers to overcome working
capital constraints. The results in Table 7 indicate that 26% of farmers had access to
credit. On the category of farmers, willing to pay for irrigation water 28% had accessed
credit. These results indicate that most farmers in the scheme had no access to credit
service. There is, however, no significant statistical association between access to credit
services and farmers willingness to pay for irrigation water.
Water users’ manage the majority of smallholder irrigation schemes in Kenya, since
irrigation farming requires collective and coordinated action in case of any problems with
the systems. The proportions of farmers who are members of the irrigation water users
association and willing to pay for irrigation water were 84% as compared to 16% who
were not willing to pay yet there are members of the association (Table 7). For farmers
who were not willing to pay, 37.5% were members of the water users association while
63.5% were not members. From the results, it is apparent that the majority of the farmers
in the scheme who are members of the water users association are willing to pay for
Monthly 25%
Quartely 52%
Yearly 23%

38
irrigation water. There is a significant association between membership in the association
and willingness to pay for irrigation water.
4.1.8 Mode of transport and distance to nearby market centre
The mode of transport has influence on marketing of agricultural products. It determines
the marketing outlet chosen and the time the products reach the market. In Figure 9,
results indicate that 59% of the farmers used human labour, 20% used motor vehicles,
15% used donkeys and oxen and 6 % used motorcycles to transport their produce to the
market.
Figure 9: Major modes of transport used by farmers in the scheme
Farmers ease of access to the market centre contributes in increased agricultural income
as it enables farmers reduce the transportation costs but also exploit market information.
The results indicate that the average distance to the market for willing farmers was
relatively shorter (4.51Km) than the non-willing farmers (9.5 km).
4.1.9 Irrigation development, operation and maintenance
There is an expected change in the manner of agricultural production in the basin with
the introduction of the pressurised systems of irrigation. An analysis of the irrigation
systems currently used by farmers in the scheme found out that few farmers had adopted
the new system of irrigation though the process was still on going. From the results, 35%
of farmers had adopted sprinkler irrigation, 0.9% used drip irrigation and the majority of
motorcycle 6%
Donkeys & oxen 15%
motorvehicle 20%
human labour 59%
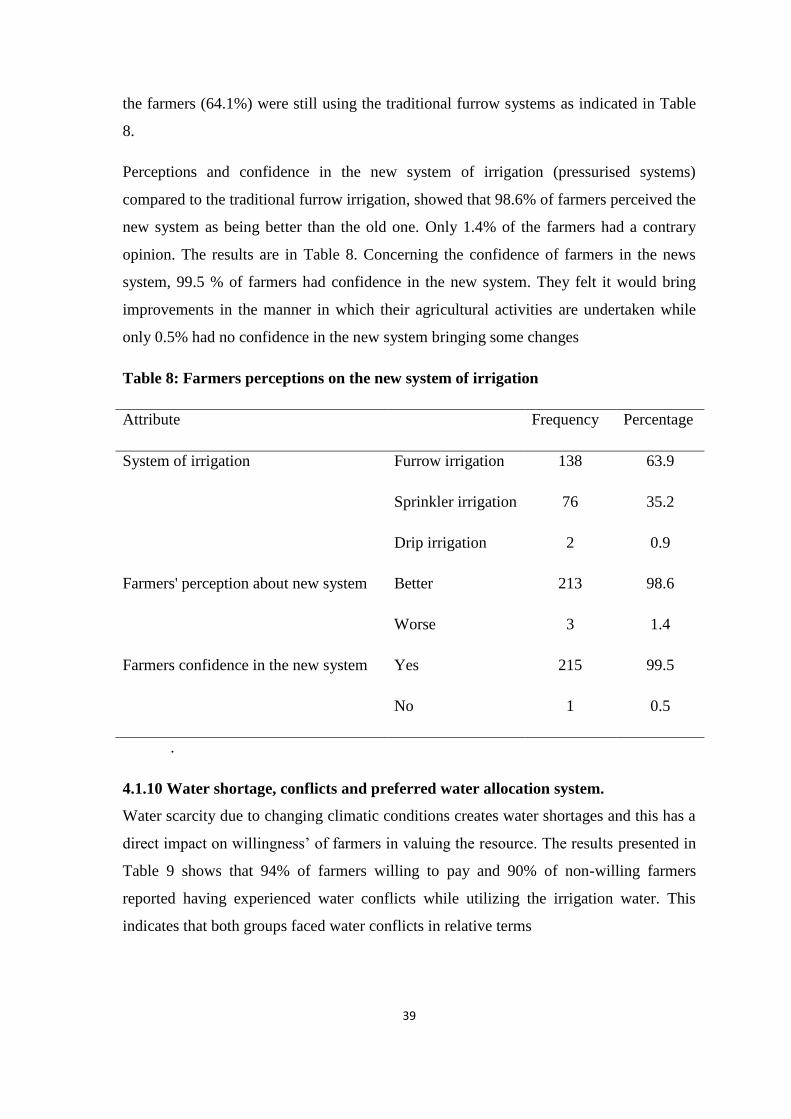
39
the farmers (64.1%) were still using the traditional furrow systems as indicated in Table
8.
Perceptions and confidence in the new system of irrigation (pressurised systems)
compared to the traditional furrow irrigation, showed that 98.6% of farmers perceived the
new system as being better than the old one. Only 1.4% of the farmers had a contrary
opinion. The results are in Table 8. Concerning the confidence of farmers in the news
system, 99.5 % of farmers had confidence in the new system. They felt it would bring
improvements in the manner in which their agricultural activities are undertaken while
only 0.5% had no confidence in the new system bringing some changes
Table 8: Farmers perceptions on the new system of irrigation
Attribute Frequency Percentage
System of irrigation Furrow irrigation 138 63.9
Sprinkler irrigation 76 35.2
Drip irrigation 2 0.9
Farmers' perception about new system Better 213 98.6
Worse 3 1.4
Farmers confidence in the new system Yes 215 99.5
No 1 0.5
.
4.1.10 Water shortage, conflicts and preferred water allocation system.
Water scarcity due to changing climatic conditions creates water shortages and this has a
direct impact on willingness’ of farmers in valuing the resource. The results presented in
Table 9 shows that 94% of farmers willing to pay and 90% of non-willing farmers
reported having experienced water conflicts while utilizing the irrigation water. This
indicates that both groups faced water conflicts in relative terms

40
Table 9: Preferred system of water allocation, water shortage and conflicts
Attribute Willing to
pay
Not willing
to pay
Total
percent percent percent
Conflict in water sharing Yes 94 90 94
No 6 10 6
Causes of water conflicts Upstream diversion 76 78 72
Water theft 6 10 8
Increase in number
of irrigation users
11 12 11
Mis-utilization and
wastage
7 6 6
Preferred system of water
allocation
Based on the size of
irrigated land
18 10 17
Equally among the
farmers
82 90 83
A further inquiry into the causes of water scarcity revealed that most of the farmers
willing to pay believed that water scarcity was created by; upstream diversion by head
users (76%), water theft (6%), increase in number of irrigation water users (11%) and
mis-utilization and wastage (7%) respectively as shown in Table 9. The corresponding
figures for non-willing farmers are 68%, 10%, 12% and 6% respectively. The results
indicate that upstream diversion by head users was a major problem for both groups of
farmers in the scheme.
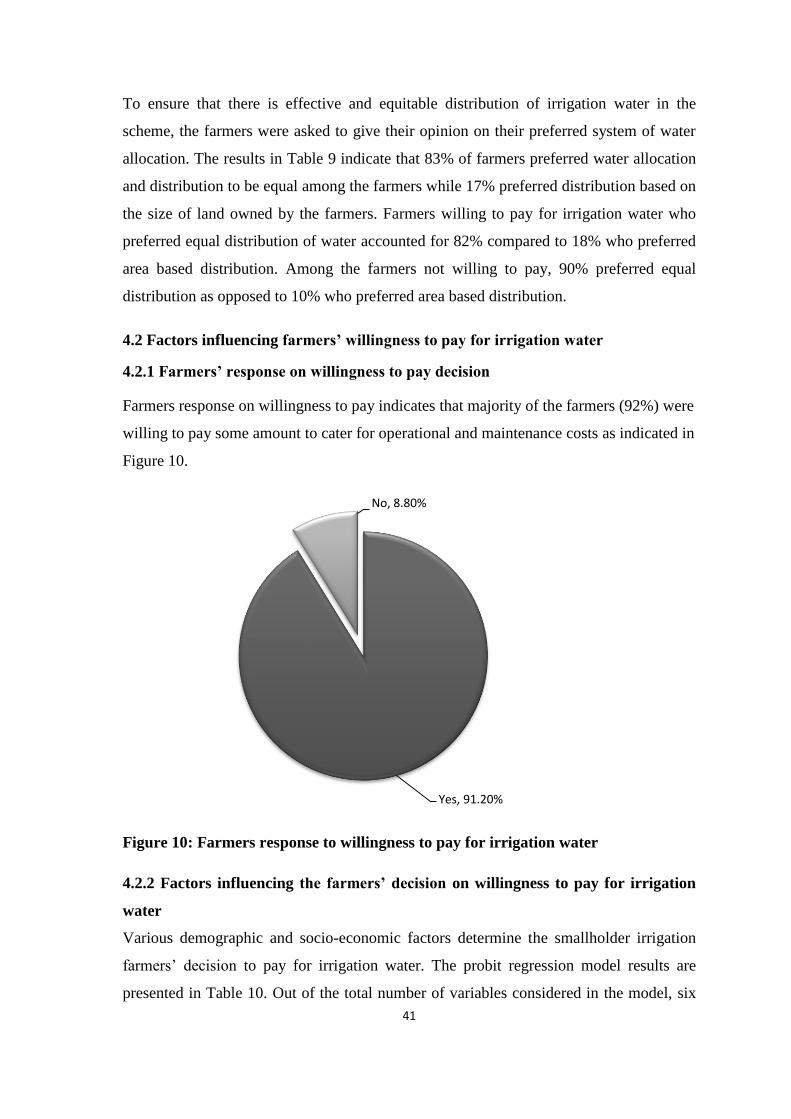
41
To ensure that there is effective and equitable distribution of irrigation water in the
scheme, the farmers were asked to give their opinion on their preferred system of water
allocation. The results in Table 9 indicate that 83% of farmers preferred water allocation
and distribution to be equal among the farmers while 17% preferred distribution based on
the size of land owned by the farmers. Farmers willing to pay for irrigation water who
preferred equal distribution of water accounted for 82% compared to 18% who preferred
area based distribution. Among the farmers not willing to pay, 90% preferred equal
distribution as opposed to 10% who preferred area based distribution.
4.2 Factors influencing farmers’ willingness to pay for irrigation water
4.2.1 Farmers’ response on willingness to pay decision
Farmers response on willingness to pay indicates that majority of the farmers (92%) were
willing to pay some amount to cater for operational and maintenance costs as indicated in
Figure 10.
Figure 10: Farmers response to willingness to pay for irrigation water
4.2.2 Factors influencing the farmers’ decision on willingness to pay for irrigation
water
Various demographic and socio-economic factors determine the smallholder irrigation
farmers’ decision to pay for irrigation water. The probit regression model results are
presented in Table 10. Out of the total number of variables considered in the model, six
Yes, 91.20%
No, 8.80%

42
variables significantly influenced the farmers’ decision to pay for irrigation water. The
variables are; the education level of the farmer, farmers’ participation in the construction
and maintenance of the irrigation scheme, access to extension, total income irrigation
farming, membership in irrigation water users association and distance to the water
source.
Table 10: Probit estimates for the factors influencing farmers’ decision on
willingness to pay decision for irrigation water
Variables Dy/Dx Coefficient Std. Err. Z
Education level 0.0297 2.88 1.34 2.14**
Age of farmer -1.46e-09 -0.017 0.023 -0.74
Participation in construction 0.02 1.50 0.75 2.01**
Household size .0000272 0.25 0.18 1.42
Gender of household head -0.005 -0.74 0.71 -1.03
Distance to the market -3.06e-08 -0.35 0.12 -2.76
Total livestock ownership 1.47e-09 0.008 0.015 0.54
Access to credit service -0.004 -0.064 0.90 -0.07
Access to extension service -0.001 -1.64 0.83 -1.97**
Total income from irrigated farm 0.182 5.80 1.53 3.79**
Access to agricultural training 0.0067 1.88 0.71 2.62
Membership in (IWUA) 0.16 1.72 0.81 2.10**
Distance to water source 0.04 -0.352 0.12 -2.88*
Constant 4.18 1.62 2.58
N 216
LR χ2 95.10
Prob> χ2 0.000
Pseudo R2 0.7707
Log likelihood -14.143
*, **, *** significant at 10, 5 and 1 percent level, respectively

43
Education level of the household head had a positive and significant influence on
farmers’ decision on willingness to pay for irrigation water. An additional year of
schooling increased the probability of farmers willing to pay for irrigation water by about
2.97%. The probable reason is educated farmers understand better issues of water
scarcity. They could also perceive better the future risk of reduced water flows on crop
production and hence may understand the importance of paying for irrigation water. This
is consistent with the findings by Ndetewio et al, (2013) who found education as a
significant positive factor in influencing farmers’ willingness to pay decision for
watershed and conservation in Lower Moshi irrigation scheme in Tanzania. However, the
findings are contrary with those done of Baidoo et al. (2013) in the Upper East region of
Ghana who found that surprisingly farmers with higher level of education were not
willing to pay for improved access to irrigation water.
The farmers’ participation in the construction and maintenance of the irrigation scheme
had a positive and significant effect in influencing the farmers’ willingness to pay
decision. Farmers’ participation in the construction and maintenance of the irrigation
structures increased the probability of willing to pay for irrigation water by 2 %.
Farmers’ participation in formulation and project implementation process builds a sense
of ownership. The reason is, as farmers perceive the existence of a furrow maintenance
problem, then there is as a potential threat of production loss. This pushes them to seek
for a sustainable solution of which financing the capacity of the irrigation scheme
through water charging is appears a better option. Hence, the farmers will be willing
actively participate in contributing water fees and maintenance of the irrigation systems.
This finding is in line with IFPRI (2005) study on improved water supply in Ghanaian
Volta Basin, in which farmers who were aware of problems in their irrigation water
supply participated regularly in construction and maintenance and were more willing to
pay for water supply improvements. Another study by Tsehayou (2013) on the challenges
facing smallholder irrigation schemes in Amhara region, Ethiopia found that participation
of water users in the management of the schemes had a positive impact on a sense of
ownership and active involvement in matters regarding the scheme.
Unexpectedly the results show that access to extension service had a negative and
significant influence on the farmers’ willingness to pay for irrigation water. Access to
extension service reduced the probability of farmers willing to pay by 1%. This is
contrary to the expected theory. The probable reason might be that even farmers who

44
have access to extension are better placed to have other sources of water and may have
adopted more efficient technologies compared to those who have not accessed to the
service. Nirere et al., (2013) found contact with extension service providers significantly
influenced farmers’ willingness to pay for protection of the Nyaborongo river system in
Rwanda. However, these results are contrary to a study done by Falola et al., (2013) who
found that access to extension services positively influenced farmers’ willingness to take
up agricultural insurance.
Total income from irrigation farming had a positive and significant influence on farmers’
willingness to pay for irrigation water. A unit increase in farm income from irrigation
increases the probability of farmers’ willingness to pay for irrigation water by 18.2%.
The interpretation of this is that if farmers earn more income from irrigation farming,
they are most likely to pay for irrigation water. This is because they have more
disposable income and more ability to deal with risk. Farmers with higher income may
also command more financial capital to make better economic use of water allotted. On
the contrary, farmers who earn low farm income from irrigation farming may face
difficulty in paying for the irrigation water. Similar findings by Bamidele et al. 2012
indicate that total farm income had a significant effect on farmers’ ability to pay for
irrigation facilities in Nigeria. Another study by Tang et al. (2013) on the willingness to
pay for irrigation water in North West China found that farmers’ with higher incomes
were much willing to pay for irrigation water.
Membership in irrigation water users’ association increased the probability of farmers
paying for irrigation water by 16%. Farmers who are members in the irrigation water
users association are easily influenced by their acquaintances than those in isolation.
They get to exchange ideas and learn about the benefits of new systems of irrigation and
new farming methods in view of sustainable agricultural production. A study by
Wegerich et al., (2000) on water users associations’ sustainability in the management of
irrigation water resources in Uzbekistan and Kyrgyzstan indicates that farmers were
willing to pay full price for operational and maintenance costs and were willing to invest
their labour and maintain the systems collectively. The results are consistent with those
of Frija et al. (2008) in Tunisia, who showed that changes in institutional structures of
irrigation water users association from individual to groups affect their willingness to pay
for water and indicated that farmers were willing to pay more under the group. Amondo

45
et al. (2013) found that membership in water users association had a significant influence
on their willingness to pay.
Finally, distance to the water source significantly and negatively influenced the farmers’
decision on willingness to pay for irrigation water. The results indicate that holding other
factors constant a farmer’s decision to pay for irrigation water decreases by 4% as the
distance of the water source increases by 1 kilometre. These findings corroborate Wen et
al, (2009) who found that the distance to the water source significantly reduces
willingness to pay for securing water quality in the South to North water transfer project
in China.
4.3 Estimation of farmers Mean willingness to pay for irrigation water
4.3.1 Farmers’ response to different bid amounts.
The results in Table 11 show the distribution frequency of respondents willingness to pay
at each bid amount. There were 197 farmers out of 216 who were willing to pay for the
given bids, 19 respondents’ were not willing to pay. Among the farmers who were
offered the lowest bid of KES 375, the proportion of 34.5% accepted to pay the amount
while those offered the highest bid of KES 1,500; about 50.2% were willing to pay. Only
15.3% of farmers’ were willing to pay the average bid of KES 750 per production season.
Table 11: Farmers’ response to different bid levels
Bid Frequency Percentage Cumulative %
KES 375 68 34.5 34.5
KES 750 30 15.3 49.8
KES 1500 99 50.2 100
Total 197 100
The double bounded dichotomous contingent valuation model was used to determine the
farmers mean willingness to pay for irrigation water. Farmers’ socio-economic
characteristics were included in the model to determine the factors, which influence the
mean willingness to pay for irrigation water. The results in Table 12 show that four
factors, age of the farmer, household size, and distance to water source and income from
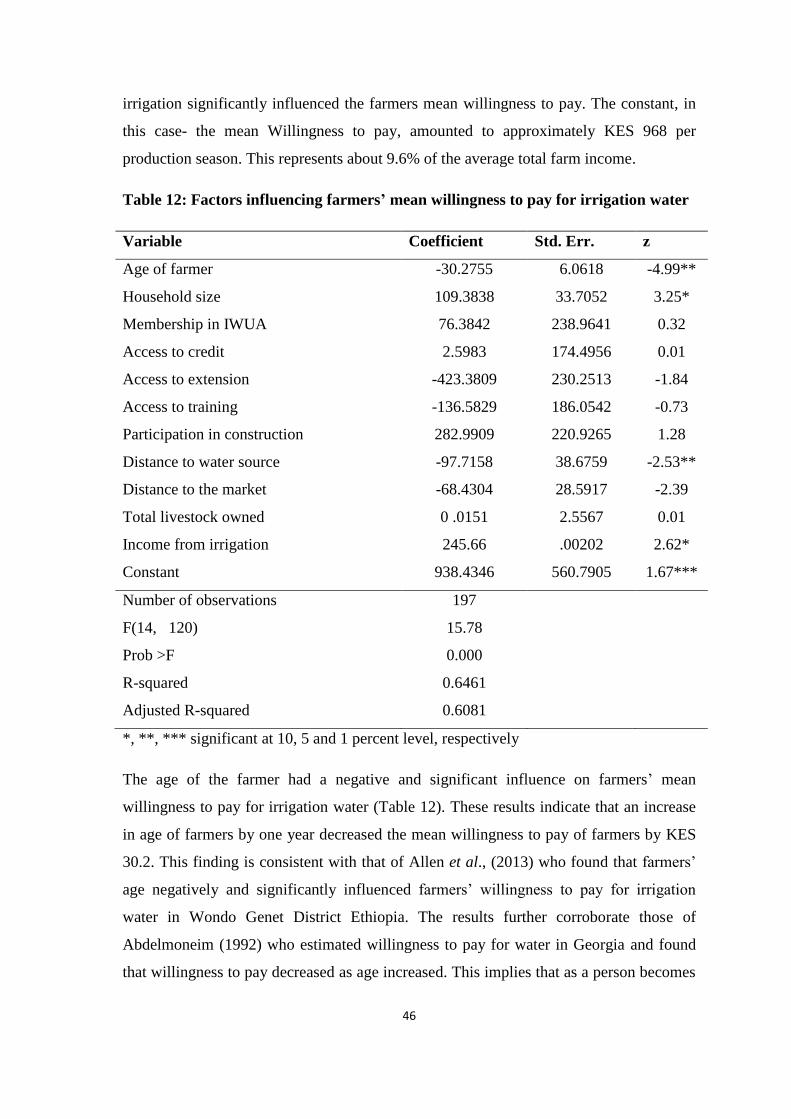
46
irrigation significantly influenced the farmers mean willingness to pay. The constant, in
this case- the mean Willingness to pay, amounted to approximately KES 968 per
production season. This represents about 9.6% of the average total farm income.
Table 12: Factors influencing farmers’ mean willingness to pay for irrigation water
Variable Coefficient Std. Err. z
Age of farmer -30.2755 6.0618 -4.99**
Household size 109.3838 33.7052 3.25*
Membership in IWUA 76.3842 238.9641 0.32
Access to credit 2.5983 174.4956 0.01
Access to extension -423.3809 230.2513 -1.84
Access to training -136.5829 186.0542 -0.73
Participation in construction 282.9909 220.9265 1.28
Distance to water source -97.7158 38.6759 -2.53**
Distance to the market -68.4304 28.5917 -2.39
Total livestock owned 0 .0151 2.5567 0.01
Income from irrigation 245.66 .00202 2.62*
Constant 938.4346 560.7905 1.67***
Number of observations 197
F(14, 120) 15.78
Prob >F 0.000
R-squared 0.6461
Adjusted R-squared 0.6081
*, **, *** significant at 10, 5 and 1 percent level, respectively
The age of the farmer had a negative and significant influence on farmers’ mean
willingness to pay for irrigation water (Table 12). These results indicate that an increase
in age of farmers by one year decreased the mean willingness to pay of farmers by KES
30.2. This finding is consistent with that of Allen et al., (2013) who found that farmers’
age negatively and significantly influenced farmers’ willingness to pay for irrigation
water in Wondo Genet District Ethiopia. The results further corroborate those of
Abdelmoneim (1992) who estimated willingness to pay for water in Georgia and found
that willingness to pay decreased as age increased. This implies that as a person becomes

47
aged the interest to pay for irrigation water declines. The impact of farmers’ age is a
combination effect of farming experience and planning. Although long experience has a
positive effect, younger farmers tend to have longer planning horizons and hence are
likely to pay for the introduction of water charging and new technologies (Holden and
Shiferaw, 2002). The plausible reason in this case is that older people are risk averse and
tend not to change their way of doing things Ashenafi (2007).
Other studies conducted by Mallious et al. (2001), Paulos (2002) and Tiwari (2005),
indicated that age has a negative effect on farmers’ willingness to pay decision and older
persons tend to pay less. The household size is significant and positively related to the
mean willingness to pay for irrigation water. From the results (Table 12), the amount of
money the farmers are willing to pay increases by KES 109.38 as households size
increases by 1 member holding other factors constant. The probable reason for this is
that, the larger the household size, the more the farm labour available in practising
irrigation farming in the scheme. Larger households also face pressure in terms of food
demand and income demand within the household, so they will be willing to pay for
irrigation water since the intervention in water pricing will lead to improved water
management, which in return enhance their income from irrigation and access to food.
These results are consistent with a study done by Ratna (1999) who found that household
size significantly influenced the pricing of rural drinking water in western India.
Distance to the water source is significant and negatively influences the amount of cash
payment for irrigation water (Table 12). Keeping other factors constant, as the distance of
the water source from the household increases by a kilometre, the mean willingness to
pay reduces by KES 97.71. This might be because residents who are located around the
head and main canals could easily access and use the water for irrigation while those at
the other end have location disadvantage to do so. The results further showed that when
the farmer is close to the head and main canal the amount of cash the household could
pay for irrigation water may be higher per production season than the tail end farmers.
These results are consistent with those of Rohith (2011) who found that distance of the
farm from the main canal significantly influenced farmers’ willingness to pay assured
summer irrigation. A study by Pate et al. (1995) on the effects of distance on willingness
to pay values for conservation wetlands programs in California indicates that distance
affected the willingness to pay for three programs in the San Joaquin valley.

48
Farmers’ income from irrigation had a positive and significant effect in influencing
farmers’ mean willingness to pay (Table 12). The higher the farm income from irrigation
farming, the more likely the farmers were willing to pay. This is in line with prior
expectation that the higher the income from farming, the higher the chance that the
farmer will pay for irrigation water. On the other hand, poverty reduces a household’s
willingness to pay and ability to invest in agricultural technologies. This is consistent
with studies done by Mwaura et al. (2010) and Agyekum et al., (2014).
4.4 Average economic value of irrigation water used in production across major
crops grown
Table 13: Summary of crop budgets
Crop Total sales TVP
(KES/Ha)
Total variable
cost
KES/ha
Gross margin
(KES/Ha)
Maize 110,484 21,040 89,444
Millet 74,649 10,388 64,261
Cowpeas 16,945 2,461 14,484
Green grams 108,779 12,991 95,788
Cassava 52,350 18,700 33,650
Bananas 120,000 35,747 84,253
Mangoes 185,000 26,318 158,682
Lemons 141,368 93,277 48,091
Sorghum 74,981 15,035 59,946
Farm enterprise budgets for each of the crop enterprises from the 216 sampled farmers
were undertaken. This involved quantifying all the costs involved in production. Farm
costs, which include land rent, labour, seed, fertilizer, pesticides, were all added up to
arrive at the total cost for each crop. Table 13 presents findings of the crop budgets in the
scheme. The results indicate that mango production enterprise had the highest gross
margin of KES 158,632 followed by green grams KES 95,788, maize KES 89,944,

49
bananas KES 84,253, millet KES 64,261, sorghum KES 59,946, lemons KES 48,091,
cassava KES 33,650 and cowpeas KES 14,434 respectively in decreasing order. Prices
were determined by the farm gate price or first point of sale transactions where farmers
participate in their capacity as sellers of their own products.
Table 14: Water productivity ratios and residual value of irrigation water
Crop Average
total sales
(KES/Ha)
Gross
margin
(KES/Ha)
Average
water
consumption
m3
Sales
/water
KES/m3
Gross
margin/water
m3
Residual
value
KES/m3
Maize 110,484 89,944 5,650 19.6 15.9 14.9
Millet 74,649 64,261 2,440 30.6 26.3 3.6
Cowpeas 16,945 14,484 4,582 3.7 3.1 2.7
Green
grams
108,779 95,788 1,115 97.6 88.6 20.9
Cassava 52,350 33,650 3,730 14.0 9.0 4.3
Banana 120,000 84,253 6,215 19.3 13.6 7.4
Mangoes 185,000 158,652 3,415 54.1 46.5 16.9
Lemons 141,368 48,091 4,600 30.7 10.4 6.5
sorghum 74,981 59,946 982 76.3 61.0 25.2
Residual
value
11.5
An analysis of water productivity in terms of gross margins per quantity of water used
expressed per M3 indicated that green grams had the highest water productivity at KES
88.6 per M3, followed by sorghum KES 61.0, mangoes KES 46.5, millet KES 26.3,
maize KES 15.9, lemons KES 10.4, cassava KES 9.0 and cowpeas KES 3.1 respectively
(Table 14). These results take into account the water use by the crops contrary to the

50
previous results on gross margins that indicated that mango enterprise was the most
profitable, in terms of water use sorghum is the most productive.
An analysis of the residual value of water indicates that the overall mean value is
KES11.5 per meter cubic of water. The economic value of irrigation water for field food
crops; sorghum, green grams, maize, millet, cassava and cowpeas are KES, 25.2, 20.9,
14.9, 3.6, 4.3, 2.7 respectively per M3 (Table 14). As for the fruit trees; mangoes,
bananas and lemons, the economic value of irrigation water is KES, 16.9, 7.4, 6.5 per M3
respectively. In general, sorghum and green grams have the highest values for the ratios
of apparent productivity, residual value while cowpeas and lemons have the lowest. The
results showed that at crop level, water values estimated for field crops are higher
generally compared to fruit trees. This means that there is greater potential in field crops
than fruit trees.

51
CHAPTER FIVE
CONCLUSIONS AND RECOMMENDATIONS
5.1 Conclusion
This study aimed at determining the economic value of irrigation water in small holder
managed farms in the Kerio valley basin. This was done by eliciting farmers’ willingness
to pay (WTP) using the contingent valuation method and also determining the average
economic value of irrigation water for the major crops grown in the basin using the
residual imputation approach. Different socio-economic characteristics of farmers
residing in the scheme were analysed. The findings revealed significant differences in
farmers occupation status, education level, total livestock ownership, membership in
water users’ association, access to training and distance to the market between willing to
pay for irrigation water and those not willing to pay. In conclusion, farmers willing to
pay had a comparative advantage over those not willing to pay for irrigation water. As
hypothesised education level of household head, membership in irrigation water users’
association, farmers’ participation in the construction and maintenance of the scheme and
total income from irrigation positively influenced the farmers’ decision on willingness to
pay for irrigation water. However, distance to water source and access to extension
services negatively influenced farmers’ decision to pay for irrigation water.
An assessment of how much smallholder farmers were willing to pay for irrigation water
and the factors influencing the mean willingness to pay for irrigation water indicates that
91.4% of the smallholder farmers were willing to pay for irrigation water with a mean
WTP of KES 938 per production season. This represents about 9.6% of the average total
farm income. The factors that influenced the mean willingness to pay were; age of the
farmer, household size, distance to the water source and income from irrigation farming.
Lastly, results on the average economic value of irrigation water used in production
across major nine crops grown in the Kerio valley basin indicate that the overall mean
value is KES 11.5 per meter cubic of water. The economic value of irrigation water for
field food crops; sorghum, green grams, maize, millet, cassava and cowpeas are KES,
25.2, 20.9, 14.9, 3.6, 4.3, 2.7 respectively. Similarly, for the fruit trees; mangoes, bananas
and lemons, the economic value of irrigation water is KES, 16.9, 7.4, 6.5 respectively.
Sorghum and green grams had the highest values for the ratios of apparent productivity/
52
residual value while, cowpeas, and lemons had the lowest for the ratios of apparent
productivity/residual value.
5.2 Recommendations
Based on the results of the study, improving accessibility and provision of adequate
irrigation water to smallholder farmers is needed. Modern and efficient water saving
delivery systems in semi-arid lands is necessary given the changing climatic conditions
and incidences of water scarcity. This study makes the following recommendations
concerning the management of smallholder irrigation schemes in the Kerio valley basin.
Education level was one of the factors, which significantly influenced farmers’
willingness to pay. More capacity building initiatives such as training and field days will
enhance the farmers’ willingness to pay. The results also showed that farmers who
regularly participated in the construction and maintenance of the scheme were more
willing to pay for irrigation water than those who did not. Therefore, these findings imply
that improvement of irrigation systems in terms of developing physical infrastructure and
efficient distribution of water can enhance farmers’ participation in the scheme.
Moreover, farmers training and guidance provided through the irrigation water users
association can contribute to enhance farmers participation.
The level of income obtained from irrigation farming significantly influenced the farmers
mean willingness to pay. Hence pricing of irrigation water in the scheme should follow a
policy of differential pricing based on income levels of farmers, rather than the
administering of flat rates that has the potential of misusing or overexploiting water (for
those who can afford it) as well as discouraging especially the poor farmers from its since
they cannot afford. Though it must be acknowledged that identifying households
according to income levels may be a major challenge, differential pricing has the
potential of ensuring that most households, if not all, have the ability to pay to for
irrigation water. Hence establishing a feasible water charging system in the schemes such
as the volumetric basis of water charging this will be helpful.
Membership in irrigation water users association significantly influenced the farmers’
decision on willingness to pay water charges. The water users associations should be
strengthened through training of technical staff such as plumbers who will ensure water
systems are properly maintained. On the other hand, adequate extension support should
be delivered more specifically on irrigation farming so that farmers would be able to
53
make efficient use of their irrigated land. Implementing an irrigation water management
system that would ensure equitable water distribution and effective enforcement of
existing rules and regulations would further enhance not only the farmers’ willingness to
pay but also the intensity of payment they would commit
The results of factors influencing the cash payment intensity showed that the level of
payment committed by farmers near the water source was higher compared to those who
are far. The less value attached to irrigation water by farmers who are far away may be
due to its insufficiency and poor management users have benefited less and lost sense of
ownership to commit resources. Crop water productivity indicates that sorghum and
green grams give high returns while utilizing less water. Therefore, farmers should be
encouraged to grow more of sorghum and green grams in the river basin.
5.3 Areas of further research
This study highlights the need to improve water productivity in the smallholder irrigation
context. The study recommends the following studies to enrich the results of future
research on smallholder irrigation farming and water demand studies. There is need for
research to establish the daily minimum water requirements farmers need for basic
household activities. This would be helpful in water pricing where certain basic
minimum considered essential could be supplied freely, after which consumption is
priced. Further investigations are needed to establish whether interventions in upgrading
the traditional systems of water supply have improved or worsed the welfare of the
farmers. There is neede to give policy-makers the required feedback to improve on policy
formulation and implementation strategies where necessary.

54
REFERENCES
Abdelmoneim, H. and Jordan, J. (1992). Estimating the Farmers’ Willingness to Pay for
Water in Georgia. Journal of Agribusiness, 15(1): 103-120.
National Irrigation Board, (2012). National Irrigation Board Website. www.nib.org/,
Accessed on 3rd
November 2012.
Agudelo, J. (2002). The Economic Valuation of Water, Principles and Methods. Water
Research Report Series No. 5, UNESCO-IHE Delft, Netherlands.
Agyekum, E. O., Yankyera, K.O., Keraita, B., Fialor, S.C. and Abidoo, R. (2014).
Willingness to Pay for Faecal Compost by Farmers in Southern Ghana. Journal of
Economics and Sustainable Development, 5 (2): 18-25.
Aheeyar, M. (2006). Willingness to Pay for Improved Irrigation Services in Mahaweli
System H; Paper presented at the 32nd
Water, Engineering and Development
Centre International Conference 13th
-17th
September 2006”, Colombo, Sri Lanka.
Alem, M., Worku, T. and Zebene, A. (2013). Economic Value of Irrigation Water in
Wondo Genet District Ethiopia; An Application of Contingent Valuation Method.
Journal of Economics and Sustainable Development, 4 (2): 23-35.
Amer, Z. and Emad, K. (2004). Measuring the Willingness to Pay for Groundwater in the
Highland Areas of Jordan. Journal of Agricultural Water Management, 68: 61-76.
Amondo, E., Kironchi, G. and Wangia, S. (2013). Willingness to Pay for Improved
Water Supply due to Spring Protection in Emuhaya District, Kenya. International
Journal of Education and Research, 1: 220-238.
Anemut, B. (2006). Determinants of Farmers’ Willingness to Pay for the Conservation of
National Parks: The Case of Simen Mountains National Park. Unpublished Msc.
Thesis, Haramaya University, Ethiopia.
Arbues, F., Barberan, R. and Villanua, I. (2003). Water Price Impact on Residential
Water Demand in the City of Zaragoza. A Dynamic Panel Data Approach, Paper
Presented at the 40th
European Congress of the European Regional Studies
Association (ERSA) in Barcelona, Spain 30th
-31st August 2002.

55
Ashenafi, G. (2007). Factors Influencing The Adoption of Triticale in Amhara Region
Ethiopia. University of Kassel, Department of Development Economics and
Agricultural Policy, Germany Tropentag, October 9-11 2007, Witzenhausen.
Baidoo, I., Ramatu, M., Asuming., S. and Akoto, I. (2013). Willingness to Pay for
improved Water Farming in The Upper East Region of Ghana. Greener Journal
of Agricultural Sciences, 3:271-279.
Bamidele, F., Ogunlade., I. and Olabode, P. (2010). Factors Affecting Farmers’ Ability to
Pay for Irrigation Facilities in Nigeria: The Case of Oshin Irrigation Scheme in
Kwara State, Nigeria. Journal of Sustainable Development in Africa, 12: 334-349.
Bazza, M. and Ahmad, M. (2002). A Comparative Assessment of Links Between
Irrigation Water Pricing and Irrigation Performance in the Near East. A Paper
Presented at the International Conference of Irrigation water Policies: Micro and
Macro Considerations, Agadir Morocco, June 2002.
Bos, M., Burton, M. and Molden, D.J. (2005). Irrigation and Drainage Performance
Assessment: Practical Guidelines. CABI Publishing Wallingford, United
Kingdom.
Bosworth, B., Cornish, G., Perry, C. and Van Steebergen, F. (2002). Water Charging in
Irrigated Agriculture, Lessons from Literature. Report OD145. H.R. Wallingford,
Wallingford, pp 90.
Carson, R., Floers, N. and Meade, N. (2001). Contingent Valuation: Controversies and
Evidence. Journal of Environmental and Resource Economics, 19: 173-210.
Chepkonga, W. and Mulindo, J. (2002). Institutions for Irrigation Water Management
and Use: A Comparative Analysis of the Perkerra and Kerio River Basins. Kenya
Agricultural Research Institute, Nairobi Kenya.
Cook S., Gichuki F. and Turral, H. (2006). Agricultural Water Productivity: Issues
Concepts and Approaches, Basin Focal Project Working Paper No. 1
http://waterandfood.org accessed on 24/9/2013.

56
Cookson, R. (2000). Incorporating Psychosocial Considerations into Health Valuation;
an Experimental Study. Journal of Health Economics, 3: 369-401.
Dagne, M. (2008). Determinants of Farmers’ Willingness to Pay for Irrigation Water in
Jabitehinan Wereda of Amhara Region. Unpublished Msc Thesis, Department of
Agricultural Economics, Haramaya University Ethiopia.
Dinar, A. and Subramanian, A. (1998). Water Pricing Experience: an International
Perspective. World Bank Technical Paper No. 386, World Bank, Washington
D.C.
Dinar, A., Rosegrant, M. and Meinzen-Dick., R. (1997). Water allocation Mechanism:
Principles and Examples. Policy Research Working Paper No.1779, World Bank
and International Food Policy Research Institute Washington D.C.
Dooremnbos, J. and Kassam., A.H. (1979). Yield Response to Water. FAO Irrigation and
Drainage Paper No. 33, FAO, Rome, Italy, P. 193.
Dudu, H. and Chumi., S. (2008). Economics of Irrigation Water Management: A
Literature Survey with Focus on Partial and General Equilibrium Models Policy.
Research Working Paper 4556 World Bank, Development Research Group
Sustainable Rural And Urban Development Team.
Emad, K. K., Amer, Z.S., Abbas, S. O. and Heniz., P.W. (2012). Estimation of the
Economic Value of Irrigation Water in Jordan. Journal of Agricultural Science
and Technology, 1: 487-497.
Falola, A., Ayinde., O.E. and Agboola., B.O. (2013). Willingness to Take Agricultural
Insurance by Cocoa Farmers’ in Nigeria. International Journal Of Food And
Agricultural Sciences, 1(1): 97-107.
Food and Agriculture Organization, Committee on Agriculture. (2007). Agriculture and
Water Scarcity: A Programmatic Approach to Water. Committee on Agriculture
20th
Session, 25-28th
April 2007 Rome Italy.

57
Food and Agriculture Organization. (1998). Irrigation and Drainage. A Paper No. 56
Crop Evapotranspiration (Guidelines for Computing Crop Water Requirements).
Rome Italy
Food and Agriculture Organization. (2003). Unlocking the Water Potential of
Agriculture. Rome: Food And Agriculture Organization the United Nation, Htpp:
//Ftp.Fao.Org/Agl/Docs/Unlocking_E.Pdf. Accessed, 11th
September 2012.
Food and Agriculture Organization. (2007). Coping With Water Scarcity Challenge of
21st Century. World Water Day 22
nd March 2007. Htpp//Www.Fao.Org. Accessed
On 20th
November 2012.
Food and Agriculture Organization. (2009). Coping With a Changing Climate:
Consideration for Adaptation and Mitigation in Agriculture. Rome, Italy.
Http://Www.Fao.Org. Accessed On 10th
March 2012.
Freeman, A. (1993). The Measurement of Environmental and Resource Values: Theory
and Methods. Journal of Resource for the Future, 26:271-292.
Frija, A., Chebil, A., Speelman, S. and VanHuylenbroek, G. (2008). Effects of the
Changes in Institutional Structure of Irrigation Water Property Rights on The
Willingness to Pay to Pay Of Farmers for Water: Case Of Tunisia. A Paper
Presented At The 12th
EAAE Congress 26th
-29th
August 2008 In Gent Belgium.
Gil, J., Gracia, A. and Sanchez, M. (2000). Market Segmentation and Willingness to Pay
for Organic Products in Spain. Journal of International Food and Agribusiness
Management, 3:207-226.
Giorgis, T. (2004). Estimating Willingness to Pay for Irrigation Water: A Contingent
Valuation Case Study on Small-Scale Irrigation Schemes. A Paper Presented At
The Second International Conference On The Ethiopian Economy Organized By
Ethiopian Economic Association. Addis-Ababa, Ethiopia.
Government of Kenya. (2010). Agricultural Sector Development Strategy 2010-2020.
Ministry of Agriculture.
58
Government of Kenya. (2010). Environment, Water and Irrigation Sector Report.
Ministry Of Water and Environment.
Government of Kenya. (2010). Small Scale Horticulture Development Project Appraisal
Report.
Griffin, C., Briscoe. J., Sigh, B., Ramasubban, R and Bhatia, R. (1995). Contingent
Valuation and Actual Behaviour: Predicting Connection to New Water Systems
in the State Of Kerala, India. Journal of World Bank Economic Review, 9:373-
395.
Groebner, D. and Shannon, P.W. (2005). Business Statistics, a Decision Making
Approach. Prentice Hall, New Jersey.
Hanemann, M., Loomis, J. and Kanninen, B. (1991). Statistical Efficiency of Double
Dichotomous Choice Contingent Valuation. American Journal of Agricultural
Economics, 73:1255-1263.
Hanks, R. (1974). Model for Predicting Plant Yields as Influenced By Water Use.
Agronomy Journal , 66: 660-665.
Hoevenagel, R. (1994). An Assessment of the Contingent Valuation Method
Methodological and Measurement Issues, Chapter 8, Pp 195-227 Kluwer
Academic Press, Netherlands.
Holden, S. and Shiferaw, B. (2002). Poverty And Land Degradation: Peasants
Willingness To Pay To Sustain Land Productivity In The Adoption Of Natural
Resource Management Practices: Improving Sustainable Agricultural
Production In Sub-Saharan Africa: 91-102 New York: CABI Publishing.
Hua, W., Jian, X. and Honglin, L. (2009). Water Pricing With Household Surveys: A
Study of Acceptability and Willingness to Pay in Chongqing China. China
Economic Review, 21:136-149.
IFPRI, (2010). What is the irrigation potential in Africa? A Combined Biophysical and
Socioeconomic Approach. IFPRI discussion paper 00993. Accessed on 20th
October 2012, htpp://www.ifpri.org/publications.

59
International Conference on Water and the Environment. (1992). The Dublin Statement
And Report of The Conference: Development Issues for The 21st Century.
Geneva, Switzerland: WMO (World Metrological Organization). Conference
Held On 26th
-31stjanuary 1992, Dublin, Ireland.
Johansson, R., Tsur, Y., Roe, T., Doukkali, R. and Dinar, A. (2002). Pricing Irrigation
Water: a Review of Theory and Practice. Journal of Water Policy, 4 (2): 173-199.
Jones, T. (2003). Recent developments in pricing of water services in OECD, countries.
OECD, Paris, France.
Karanja, F. (1999). CROPWAT model analysis of crop water use in six districts in Kenya.
Print.
Kenya National Bureau of Statistics. (2009). Kenyan facts and figures. Ministry of
planning and National Development Nairobi, Kenya.
Kerio Valley Development Authority. (2005). Strategic Plan 2005-2010. Print.
Khanal, Y., Upadhaya, R. and Sharma, P. (2008). Economic valuation of domestic water
supply services of two community forests of Palpa District in Nepal. Journal of
Banko Janakari, 20: 24-29.
Kipkorir, B. (1983). Historical perspectives on development of the Kerio Valley. Institute
of African studies, University of Nairobi pp.1-11.
Koss, P. and Khawaja, S. (2001). The value of water supply reliability in California: a
Contingent Valuation Method. Journal of Water Policy, 3: 165-174.
Maestu, J. (2001). The political economy of the implementation of water charges in
pricing practices in Spain. What can we learn: European commission, pricing
water, economics, Environment and society? Conference proceedings, Sintra
European commission, Brussels, pp 247-267.
Maher, O. and Abu, M. (2009). Farm-level perspectives regarding irrigation water prices
in the Tulkarm district, Palestine. Journal of Agricultural Water Management, 96:
1344-1350.

60
Mallios, Z. and Latinopoulos, P. (2001). Willingness to pay for irrigation water: case
study in Chalkidiki, Greece. Paper presented at the 7th
international conference
on environmental science and Technology Emoupolis, Syros Island, Greece
September 2001.
Mammo, G. (2002). Factors influencing farmers’ willingness to pay for soil conservation
technologies. The case of Chiro district, western Hararghe Highlands.
Unpublished Msc. Thesis presented to the school of graduate studies Alemaya
University.
Marcouiller, D. and Coggins, S. (1999). Water as a public good: property rights. Water
issues in Wisconsin. Madison: Cooperative Extension Publications.
Mbata, J. (2006). Estimating household willingness to pay for water services in a rural
economy: the case of Kanye in Southern Botswana. Development Southern
Africa, 23 (1): 29-44.
Merret, S. (2002). The urban market for farmers’ rights. Journal of Irrigation and
Drainage, 52:319-326.
Molle, F. (2004). Technical and institutional responses to basin closure in the Chao
Phraya river basin, Thailand. Water International, 29: 70-80.
Muhammad A, Saima J. and Irfan, A.B. (2005). Estimation of economic value of
irrigation water. Journal of Agricultural and Social Science, 1; 270-272.
Munasinghe, M. (1993). Environmental economics and natural resource management in
developing countries. Washington D.C: The World Bank.
Mwaura, F., Muwanika, F. and Okoboi, G. (2010). Willingness to pay for extension
services in Uganda among farmers involved in crop and animal husbandry.
Contributed paper presented at the third Joint African association of agricultural
economists (AAAE) conference, Cape Town, South Africa, September 19-23,
2010.
National Irrigation Board. (2012). National irrigation board website. www.nib.org/,
Accessed on 3rd
November 2012.

61
Ndetewio, P. and Mwakaje, A. (2013). Factors influencing willingness to pay for
watershed services in lower Moshi, Pangani basin, Tanzania. International
Journal of Agriculture and Environment 2:57-75
Ngigi., S. (2002). Review of irrigation development in Kenya. The changing face of
irrigation in Kenya: Opportunities for anticipating change in eastern and
southern Africa.
Nirere, S. (2013). An assessment of farmers’ willingness to pay for the protection of
Nyamborongo River System, Rwanda. Unpublished Master’s Thesis. University
of Nairobi.
Organization for Economic Co-operation and Development. (1999). Agricultural Water
pricing in OECD Countries. OECD, Paris.
Pate, J. and Loomis, J. (1995). The effect of distance on willingness to pay values: A case
study of wetlands and Salmon in California. Ecological economics, 20 (1) 199-
207.
Paulos, A. (2002). Determinants of farmers willingness to participate in soil
conservation practices in the highlands of bale. The case of Dinsho farming area.
Unpublished Msc thesis presented to the school of graduate studies of Alemaya
University Ethiopia.
Perry, C.J. (2001). Water at any price? Issues and options in charging for irrigation water.
Journal of Irrigation and Drainage, 50:1-7.
Pete, J. and Loomis, J. (1995). The effect of distance on willingness to pay values: A case
study of wetlands and salmon in California. Ecological economics, 20: 199-207
Raje, D., Dhobe, A. and Deshpande, A.W. (2002).Consumers’ willingness to pay more
for municipal supplied water: A case study. Journal of Ecological Economics,
42:391-400.
Ratna, V. (1999). Pricing of rural water: A study of willingness and ability to pay in
western India. Journal of Social and Economic Development, 11 (1): 101-122.

62
Ray, W. (1996). Indigenous community-managed irrigation in Sahelian West Africa.
Journal of Agriculture Ecosystems and Environment, 61:83-95.
Rodriguez, F. (2003). Local resolution for watershed Management. The Case of Water
and Land Allocation in Cotacachi, Ecuador. PhD dissertation. School of Natural
resource ,Ohio State University, Columbus-U.S.A.
Rogers, P., De-Silva, R. and Bhatia, R. (2002). Water is Economic good: How to use
prices to promote equity and sustainability. Water policy, 4:1-17.
Rohith, B. and Chandrakanth, M. (2011). Institutional and economic dynamics of water
users cooperative societies in Cauvery basin of Karnataka. Agricultural Economic
Research Review. 24: 235-242.
Ruto, E., Julia, O. and Azahara, M. (2012). The Economic Value of Guaranteed water
supply for irrigation under scarcity conditions. Agricultural Water Management,
113: 10-18.
Samuelson, P.A. and Nordhaus, W.D. (1985). Economics, international edition, (12th
Ed.). New York: Mc GRAW-HILL Book Company.
Singh, K. (2007). Rational pricing of water as an instrument of improving water use
efficiency in the Agricultural sector: A case study in Gujarat, India. International
Journal of Water Resource Development, 23: 679-690.
Sonia, A. (2006). Farmers’ willingness to pay for irrigation water under government
managed small-scale irrigation projects in Bangladesh. Journal of Bangladesh
Studies 1; 1-36.
Speelman, S., Joroen, B. and Stefano, F. (2009). Estimating the impacts of water pricing
on smallholder irrigators’ in North West Province, South Africa. Agricultural
Water Management, 96:1560-1566.
Steduto, P., Hsiao, T.C., Raes, D. and Fereres, E. (2009). Aqua crop-the FAO model to
simulate yield response to water: concepts and underlying principles. Journal of
Agricultural Economics, 101: 426-437.

63
Stewart, J.I., Danielson, R.E., Hanks, E.B. and Jackson, R.M. (1977). Optimizing crop
production through control of water and salinity levels in the soil. Utah Water
Research Lab.PR. 151-1, Logan, Utah, pp 191.
Tang, Z. N. and Liu, J. (2013). The Willingness to Pay for Irrigation Water: A case study
in Northwest China. Global Nest Journal, 15: 76-84.
Tiwari, D.N. (2005). Determining economic value of irrigation water: Comparison of
willingness to pay and indirect valuation approaches as a measure of sustainable
resource use. CSERGE working paper GEC 98-05
Tsehayou, G. and Krish, H. (2013). Challenges in farmer managed small-scale irrigation
schemes: Case study on south Achefer Woreda of Amhara region, Ethiopia.
Journal of Scientific Research and Review, 22:19-29.
UNESCO-WWAP (2009) Climate change and water an overview from the world water
development Report 3: Water in a changing world. Published by the United
Nations World Water Assessment Programme. Programme Office for Global
Water Assessment. Division of Water Sciences, Perugia, Italy.
United Nations Development Programme, (UNDP). (2006). Report on why gender
matters in water management. A delft Netherlands
Wagayehu, B. (2000). Analysis of farmers’ preferences for development intervention
programs: A case study of subsistence farmers from Eastern Ethiopian
Highlands. Unpublished Msc Thesis Department of Agricultural Economics
Haramaya University, Ethiopia.
Wallow, B., Onyango, L. and Dick, R. (2007). Irrigation management and poverty
dynamics: Case study of the Nyando Basin in western Kenya. CAB international.
Wang, H., Jian, X. and Honglin, Li. (2010). Water pricing with household surveys: A
study of acceptability and willingness to pay in Chongqing China. China
Economic Review Journal, 21:136-149.
64
Wen, C., Siu, L.Y. and Klaus H. (2009). Willingness to pay for securing water quality of
China’s south to north water transfer project (Middle Route). School of earth and
environment, Leeds, U.K.
Whittington. D., Davis. J. and McClelland, E. (1998). Implementing a demand-driven
approach to community water supply planning: A case study of Lugazi, Uganda.
Water international, 23: 134-145.
World Bank, (2008). The State of Kenya’s economy. Received from
www.sitesources.worldbank.org/ on 10th
March 2013.
World Resource Institute. (2013). Retrieved 30th
February 2013 from www.wri.com.
Yokwe, S.C.B. (2005). Investigation of the economics of water as used by smallholder
irrigation farmers in South Africa. Unpublished MSc thesis for M.Inst.Agrar,
Rural Development planning and Management. University of Pretoria South
Africa pp 228-23.
Yokwe, W. (2009). Water productivity in smallholder irrigation schemes in South Africa.
Agricultural water management, 96:1223-1228.
Young, R. (1996). Measuring Economic benefits for water investments and policies.
World Bank Technical Paper No. 338, Washington D.C.
Zekri, S. and Dinar, A. (2003). Welfare Consequences of Water Supplies Alternatives in
Rural Tunisia. Journal of Agricultural Economics, 28: 1-12.
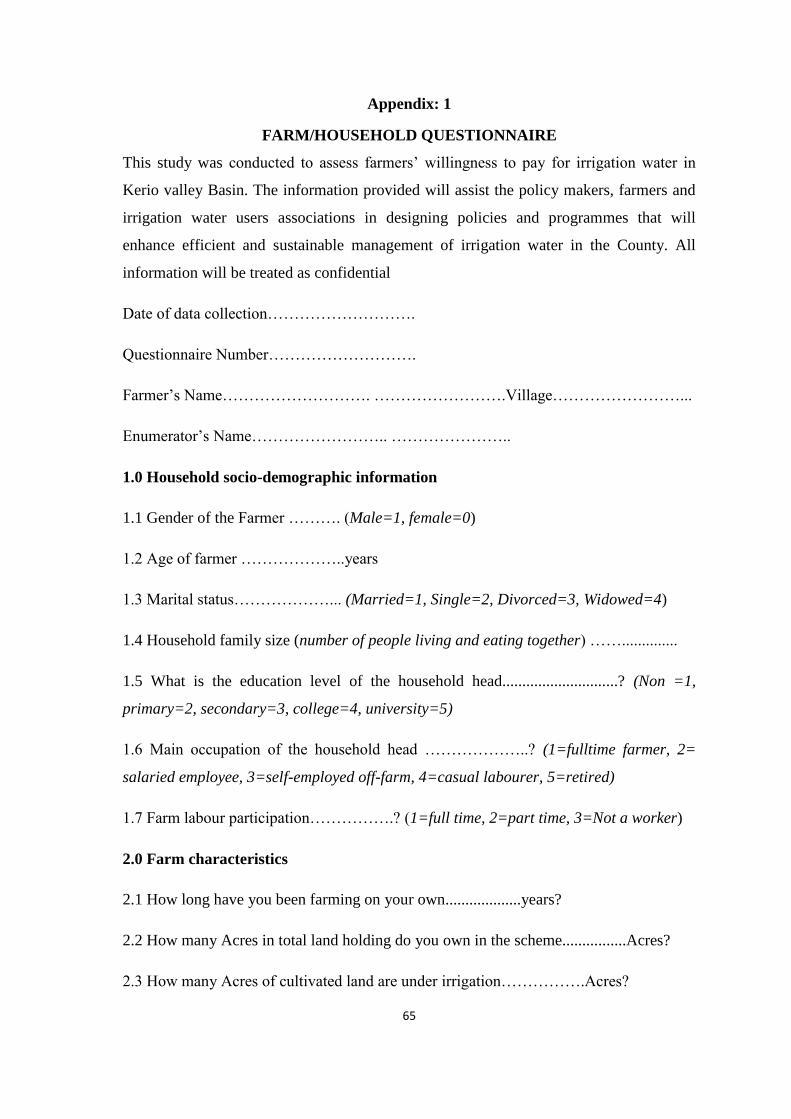
65
Appendix: 1
FARM/HOUSEHOLD QUESTIONNAIRE
This study was conducted to assess farmers’ willingness to pay for irrigation water in
Kerio valley Basin. The information provided will assist the policy makers, farmers and
irrigation water users associations in designing policies and programmes that will
enhance efficient and sustainable management of irrigation water in the County. All
information will be treated as confidential
Date of data collection……………………….
Questionnaire Number……………………….
Farmer’s Name………………………. …………………….Village……………………...
Enumerator’s Name…………………….. …………………..
1.0 Household socio-demographic information
1.1 Gender of the Farmer ………. (Male=1, female=0)
1.2 Age of farmer ………………..years
1.3 Marital status………………... (Married=1, Single=2, Divorced=3, Widowed=4)
1.4 Household family size (number of people living and eating together) ……..............
1.5 What is the education level of the household head.............................? (Non =1,
primary=2, secondary=3, college=4, university=5)
1.6 Main occupation of the household head ………………..? (1=fulltime farmer, 2=
salaried employee, 3=self-employed off-farm, 4=casual labourer, 5=retired)
1.7 Farm labour participation…………….? (1=full time, 2=part time, 3=Not a worker)
2.0 Farm characteristics
2.1 How long have you been farming on your own...................years?
2.2 How many Acres in total land holding do you own in the scheme................Acres?
2.3 How many Acres of cultivated land are under irrigation…………….Acres?
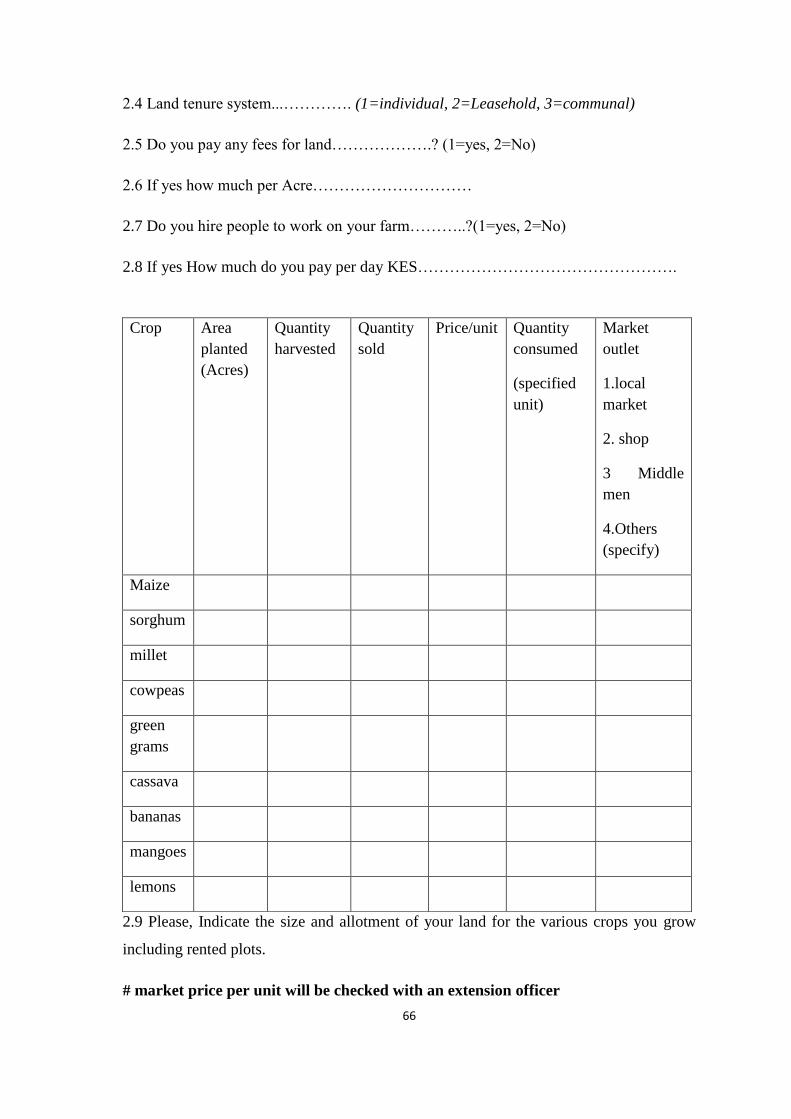
66
2.4 Land tenure system...…………. (1=individual, 2=Leasehold, 3=communal)
2.5 Do you pay any fees for land……………….? (1=yes, 2=No)
2.6 If yes how much per Acre…………………………
2.7 Do you hire people to work on your farm………..?(1=yes, 2=No)
2.8 If yes How much do you pay per day KES………………………………………….
2.9 Please, Indicate the size and allotment of your land for the various crops you grow
including rented plots.
# market price per unit will be checked with an extension officer
Crop Area
planted
(Acres)
Quantity
harvested
Quantity
sold
Price/unit Quantity
consumed
(specified
unit)
Market
outlet
1.local
market
2. shop
3 Middle
men
4.Others
(specify)
Maize
sorghum
millet
cowpeas
green
grams
cassava
bananas
mangoes
lemons

67
2.10 Have you ever faced food shortages in the past 5 years……………...? (Yes=1,
No=0)
2.11 If yes, how did you overcome……………? (1=Buying 2 borrowing 3 Aid 4 others,
specify……………..)
2.12 What are the major agricultural problems you face in your farm in increasing order
(1 for major and 9 for
least)………………………………………………………………………?
(1=Small farm, 2=crop pests and diseases, 3=animal disease, 5=shortage of input,
6=lack of technical support, 7=shortage of input, 8=Lack of technical support, 9=others
specify………………………….)
Expenditure/production costs
Crop Inputs
1.fertilizers
2.seeds
3.herbicides
4.pesticides
5.labour
6.tillage
Suppliers
1.local shop
2.store in town
3.coop
4.individual
(friends,
neighbours)
Quantity
purchased and
used
Cost
per
unit
Marketing
cost
Transport
packaging
And other
costs
maize
sorghum
millet
cowpeas
green
grams
cassava
bananas
mangoes
lemons
#input price per unit will be checked with extension officer
2.13 What major problem do you experience in input
supply………………………………………………………………………………………
…………………………….
68
3.0 Access to road and major institutional infrastructures
3.1 Do you own any large equipment (e.g tractor, pickup, implements)…… (1 yes, 2=
no)
3.2 Which mode do you use to transport agricultural produce to the market place..........?
(1=Pack animals, 2=motorcycle, =3=motor vehicle, 4=others (specify)……………………
3.2 What is the approximate distance from your farm to the nearest
market……………km
4.0 Access to credit services
4.1 Do you access credit/loan…………………..? (1= Yes, 0 =No)
4.2 If yes which is the major source from which you borrow money…………….? (1=
Cooperatives, 2=Microfinance institutions 3=bank, 4=merchants, 5=friends 6= money
lenders, 7=Agricultural Finance Corporation 8=others specify……….
4.3 For what purposes do you use the credit.............? (1=to buy farm inputs, 2=for trade,
3=livestock rearing, 4=consumption, 5 others, specify……………)
4.4 Do you repay back your loan on time………….? (Yes=1, No =0)
4.5 If No, what is the major challenge……….? (1=Due to insufficient return, 2=due to
crop failure and unfavourable weather,3=Due to price failure 4=Others,
specify…………………………..)
4.6 Is the credit facility adequate in meeting your needs……………? (1=Yes, 0=No)
4.7 Have you faced a problem of getting a loan………………? (1=Yes, 2= No)
4.8 If yes, which is the major problem………….? (1=Administrative problem
2=collateral 3=others, specify………………………….)
5.0 Access to Extension Services
5.0 Do you have access to Irrigation extension service in your area…….? (Yes=1, No =0)
5.1 Are there any Government or Non-Governmental Organizations supporting irrigation
development in your area…………….? (Yes=1, No=0)

69
5.2 Have you ever been supported by any of these organizations to improve your
irrigation activities……………….? (Yes=1, No=0)
5.4 If yes, mention the type of support you received so far…………? (1=Extension
2=training 3=maintenance, 4=experience sharing)
5.5 How frequently do you usually discuss agricultural matters with the extension
staff………………..? (1=monthly 2=quarterly 3=yearly)
5.6 From whom do you get most frequent advice…………..? (1=Development agents,
2=agricultural officers, 3=irrigation water users association)
5.7 Have you ever had vocational training in Agriculture so far…………? (Yes=1,No=0)
6.0 Irrigation development, operation and maintenance
6.1 Have you participated in the construction and maintenance at Arror irrigation
scheme....................? (Yes=1, No=0)
6.2 If yes, what and how much was your contribution…………….? (1 labour
for………days,2=cash KES………….3= Material…………...units)
6.3 Do you experience problems or conflicts about water sharing …………?(1=yes,2=no)
6.4 If yes, what are the causes for scarcity……..? (1 =Upstream diversion 2=
unfavourable weather, 3=water theft)
6.5 How do you perceive the level of income (Profitability) you have generated from
irrigated farming…………………..? (1=High 2=medium 3=low)
6.7 Are you a member of an irrigation water user association…………? (Yes=1, No=0)
6.8 Do you have any responsibility in the association…………………? (Yes=1, No=0)
6.9 Do you think the existence of this users’ institution is useful………? (Yes=1, No=0)
6.10 What is the system of water allocation among users……………..? (1=proportion to
the size of irrigated land, 2=equal distribution among members of association 3=equal
distribution among all users 4 based of crop type)

70
6.11 Which system of irrigation do you use in your farm…………..? (1=Traditional
furrow irrigation, 2= sprinkler irrigation 3=drip irrigation 4= others specify…………
6.12 How do you perceive maintenance of the new system of irrigation compared to the
old system is it better or worst……………...? (Better=1, worse=No)
6.13 What is the approximate distance of your farm from the water source
intake…………km
7.0 Willingness to pay for irrigation water
7.1 In the frame of an improved water supply, would you be willing to pay some amount
to cover the cost of operation and maintenance in the irrigation scheme………? (Yes=1,
No=0)
7.2 If Yes to 8.1 would you be willing to pay X……….. KES/ha/yr for supply and
service
7.3 If Yes to the First bid ask the respondent if He/she would you be willing to pay
BX………… KES /ha/yr? Where BX>X.
7.4 If no to the first bid, ask the respondent if he/she will be willing to pay BC……….
KES/ha/yr where BC<X
7.5 If No to the second lower bid, ask the respondent the maximum amount he/she would
be willing to pay KES……………………………………….
8.0 Income Sources
sources of income in kind (cash
equivalent) in cash total
farm income
Income from crop irrigation farming
Rented out land
Farm labour
Income from livestock sales and sale of the
products
71
9.0 Livestock Ownership
9.1 Do you own any livestock ……………..(1=Yes, 0=No)
If yes, tell me the type and number of livestock owned
Livestock type Number owned Number sold Gross income
Oxen
Cows
donkeys
poultry
goats
sheep
Total
10.0 General opinion
10.1 Do you have trust or confidence on the new system of irrigation compared to the
traditional furrow system..........................................? (Yes=1, No=0)
As farmer in the scheme, has your situation improved over the last 2 years..................?
(1=yes.2=no)
If yes why……………………………………………………………………………………………
10.2 How do you value water as a resource? Do you think it is a free and everlasting
good? …………………………………… (Yes =1, No=0)
Thank the interviewee for sparing his time.
nonfarm income
Wage from employment of family members
Income from remittances
Casual village labour
Business income from trade (shops, butchery.
etc.)
Craft works
Total income

72
Appendix 2
FAO data on CROPWAT model analysis of water use in Kerio valley basin agro-
ecological zone IV
Crop
name
Etm
(mm)
Ectro
p
(mm)
ky Ya Ym Area
croppin
g
intensit
y
Ectrop
actual
(mm)
Crop
water
use
(m3)
irrig
ation
wate
r
requi
reme
nt
maize 476.2 319 1.25 2881 9,000 20,900 128.5 5,650 39.9
sorghum 526 326.5 0.9 1853 5,000 3,653 98.2 2,440 8.4
millet 460.4 244 1 1433 3,000 30,000 116.6 4,582 4.9
cowpeas 509.8 321.2 1.15 550 800 1,533 85.8 1,115 21.9
green
grams
396.9 250.1 1.15 971 2,500 12,400 117 3,730 17.5
cassava 458 366.4 1.1 1085 2,000 500 214.1 6,215 0.2
bananas 942 820.3 1.35 7931 60,000 1,637 193 3,415 9.0
mangoes 1,618 1,570 0.8 1175
0
35,000 380 266.4 4,600 69.6
lemons 1,650 1,200 0.9 1245 40,000 350 325 982 50.4
Notes: ETm (Maximum crop evapotranspiration), ETcrop (Crop evapotranspiration), Ky
(Yield reduction factor), Ya (Actual crop yield in Kg/ha), Ym (Maximum crop yield in
Kg/ha), IWR (Irrigation water requirement), FWS (Field water supply in l/s/ha), ETcrop
actual (Actual crop evapotranspiration)
Source; FAO 2009
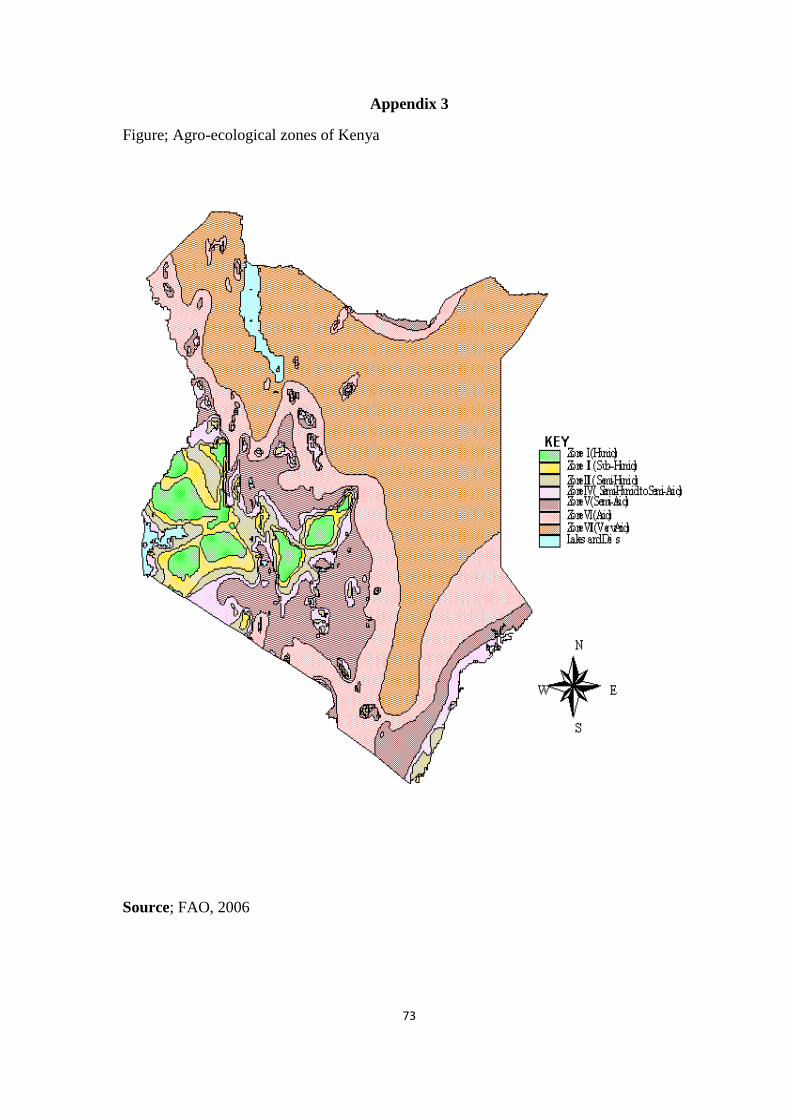
73
Appendix 3
Figure; Agro-ecological zones of Kenya
Source; FAO, 2006
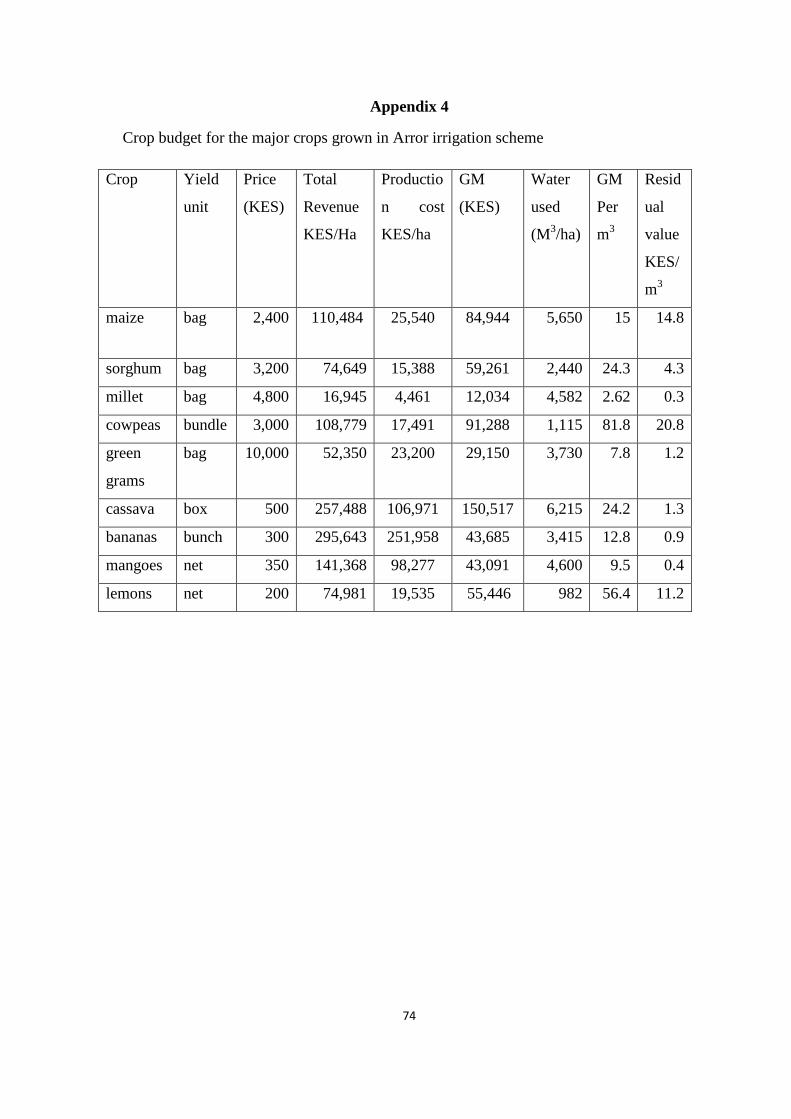
74
Appendix 4
Crop budget for the major crops grown in Arror irrigation scheme
Crop Yield
unit
Price
(KES)
Total
Revenue
KES/Ha
Productio
n cost
KES/ha
GM
(KES)
Water
used
(M3/ha)
GM
Per
m3
Resid
ual
value
KES/
m3
maize bag 2,400 110,484 25,540 84,944 5,650 15 14.8
sorghum bag 3,200 74,649 15,388 59,261 2,440 24.3 4.3
millet bag 4,800 16,945 4,461 12,034 4,582 2.62 0.3
cowpeas bundle 3,000 108,779 17,491 91,288 1,115 81.8 20.8
green
grams
bag 10,000 52,350 23,200 29,150 3,730 7.8 1.2
cassava box 500 257,488 106,971 150,517 6,215 24.2 1.3
bananas bunch 300 295,643 251,958 43,685 3,415 12.8 0.9
mangoes net 350 141,368 98,277 43,091 4,600 9.5 0.4
lemons net 200 74,981 19,535 55,446 982 56.4 11.2