Examining the 10-year rebuilding dilemma for U.S. fish stocks
10
Examining the 10-Year Rebuilding Dilemma for U.S. Fish Stocks Wesley S. Patrick 1 *, Jason Cope 2 1 Office of Sustainable Fisheries, National Marine Fisheries Service, Silver Spring, Maryland, United States of America, 2 Northwest Fisheries Science Center, National Marine Fisheries Service, Seattle, Washington, United States of America Abstract Worldwide, fishery managers strive to maintain fish stocks at or above levels that produce maximum sustainable yields, and to rebuild overexploited stocks that can no longer support such yields. In the United States, rebuilding overexploited stocks is a contentious issue, where most stocks are mandated to rebuild in as short a time as possible, and in a time period not to exceed 10 years. Opponents of such mandates and related guidance argue that rebuilding requirements are arbitrary, and create discontinuities in the time and fishing effort allowed for stocks to rebuild due to differences in productivity. Proponents, however, highlight how these mandates and guidance were needed to curtail the continued overexploitation of these stocks by setting firm deadlines on rebuilding. Here we evaluate the statements made by opponents and proponents of the 10-year rebuilding mandate and related guidance to determine whether such points are technically accurate using a simple population dynamics model and a database of U.S. fish stocks to parameterize the model. We also offer solutions to many of the issues surrounding this mandate and its implementation by recommending some fishing mortality based frameworks, which meet the intent of the 10-year rebuilding requirement while also providing more flexibility. Citation: Patrick WS, Cope J (2014) Examining the 10-Year Rebuilding Dilemma for U.S. Fish Stocks. PLoS ONE 9(11): e112232. doi:10.1371/journal.pone.0112232 Editor: Brian R. MacKenzie, Technical University of Denmark, Denmark Received March 22, 2014; Accepted October 10, 2014; Published November 6, 2014 This is an open-access article, free of all copyright, and may be freely reproduced, distributed, transmitted, modified, built upon, or otherwise used by anyone for any lawful purpose. The work is made available under the Creative Commons CC0 public domain dedication. Data Availability: The authors confirm that all data underlying the findings are fully available without restriction. The authors confirm that all data underlying the findings are fully available without restriction. All relevant data are within the Supporting Information files. Funding: These authors have no support or funding to report. Competing Interests: The authors have declared that no competing interests exist. * Email: [email protected] Introduction Managing marine fisheries for sustainable yield has been a goal of fishery managers for centuries [1,2,3], yet today many of the world’s fisheries still suffer from overexploitation [4,5,6]. The various consequences of depleting a fishery resource include economic (e.g., sub-optimal yields), social (e.g., reduced work- force), and ecological (e.g., reductions in the resiliency of the marine ecosystem) impacts [7,8]. Rebuilding overexploited fisher- ies to sustainable levels of catch can take several years to decades, depending on the productivity of the stocks (which may change due to environmental and biological conditions), the history and degree of depletion, and fishing mortality rate within those fisheries [9,10]. Thus, fishery managers must consider the ecological, social, and economic trade-offs of rebuilding immedi- ately versus rebuilding more slowly over time. In the United States, federally managed marine fisheries are mandated to rebuild the biomass (B) of overfished stocks (i.e., often defined as B ,K B msy ) to levels that support maximum sustainable yield (B msy ) in as short a time as possible, accounting for the status and biology of the stock, the needs of the fishing communities, recommendations by international organizations in which the U.S. participates, and the interactions within the marine ecosystem (Section 304(e)(4) of the Magnuson-Stevens Fishery Conservation and Management Act (MSA), as amended by the Sustainable Fisheries Act (SFA) (11). Furthermore, overfished stocks must be rebuilt within 10 years, except in cases where the life history characteristics of the stock, environmental conditions or manage- ment measures under an international agreement dictate other- wise [11]. The legislative history behind the 10-year requirement was not documented by Congress; however, Safina et al. [9] asserts that the 10-year requirement to rebuild was the result of several population dynamics experts stating, during the drafting of the SFA in 1996, that many overfished stocks were capable of rebuilding to maximum sustainable yield within 5 years if there was a moratorium on fishing. The drafters of the SFA then looked at balancing the short- and long-term trade-offs, and decided that 10 years (twice the time needed for most stocks to rebuild) was a reasonable timeframe to ensure stocks rebuild in a timely manner while accounting for socio-economic impacts [9]. In 1998, NOAA’s National Marine Fisheries Service (NMFS; the federal agency responsible for managing marine fisheries) developed national guidance on rebuilding overfished stocks to operationalize the 1996 SFA mandate to rebuild in as short a time as possible [12]. The guidance provided managers with a framework to determine the targeted time to rebuild (T target ) by specifying a minimum (or quickest) time for rebuilding a stock (T min ) and a maximum time allowable for rebuilding a stock (T max ). T target is then set somewhere between T min and T max based on an analysis of the factors listed previously (MSA Section 304(e)(4)). T min is defined as the expected amount of time a stock needs to rebuild to B msy in the absence of fishing mortality. In this context, the term ‘‘expected’’ means a 50 percent probability of attaining PLOS ONE | www.plosone.org 1 November 2014 | Volume 9 | Issue 11 | e112232
-
Upload
independent -
Category
Documents
-
view
1 -
download
0
Transcript of Examining the 10-year rebuilding dilemma for U.S. fish stocks

Examining the 10-Year Rebuilding Dilemma for U.S. FishStocksWesley S. Patrick1*, Jason Cope2
1 Office of Sustainable Fisheries, National Marine Fisheries Service, Silver Spring, Maryland, United States of America, 2 Northwest Fisheries Science Center, National Marine
Fisheries Service, Seattle, Washington, United States of America
Abstract
Worldwide, fishery managers strive to maintain fish stocks at or above levels that produce maximum sustainable yields, andto rebuild overexploited stocks that can no longer support such yields. In the United States, rebuilding overexploited stocksis a contentious issue, where most stocks are mandated to rebuild in as short a time as possible, and in a time period not toexceed 10 years. Opponents of such mandates and related guidance argue that rebuilding requirements are arbitrary, andcreate discontinuities in the time and fishing effort allowed for stocks to rebuild due to differences in productivity.Proponents, however, highlight how these mandates and guidance were needed to curtail the continued overexploitationof these stocks by setting firm deadlines on rebuilding. Here we evaluate the statements made by opponents andproponents of the 10-year rebuilding mandate and related guidance to determine whether such points are technicallyaccurate using a simple population dynamics model and a database of U.S. fish stocks to parameterize the model. We alsooffer solutions to many of the issues surrounding this mandate and its implementation by recommending some fishingmortality based frameworks, which meet the intent of the 10-year rebuilding requirement while also providing moreflexibility.
Citation: Patrick WS, Cope J (2014) Examining the 10-Year Rebuilding Dilemma for U.S. Fish Stocks. PLoS ONE 9(11): e112232. doi:10.1371/journal.pone.0112232
Editor: Brian R. MacKenzie, Technical University of Denmark, Denmark
Received March 22, 2014; Accepted October 10, 2014; Published November 6, 2014
This is an open-access article, free of all copyright, and may be freely reproduced, distributed, transmitted, modified, built upon, or otherwise used by anyone forany lawful purpose. The work is made available under the Creative Commons CC0 public domain dedication.
Data Availability: The authors confirm that all data underlying the findings are fully available without restriction. The authors confirm that all data underlyingthe findings are fully available without restriction. All relevant data are within the Supporting Information files.
Funding: These authors have no support or funding to report.
Competing Interests: The authors have declared that no competing interests exist.
* Email: [email protected]
Introduction
Managing marine fisheries for sustainable yield has been a goal
of fishery managers for centuries [1,2,3], yet today many of the
world’s fisheries still suffer from overexploitation [4,5,6]. The
various consequences of depleting a fishery resource include
economic (e.g., sub-optimal yields), social (e.g., reduced work-
force), and ecological (e.g., reductions in the resiliency of the
marine ecosystem) impacts [7,8]. Rebuilding overexploited fisher-
ies to sustainable levels of catch can take several years to decades,
depending on the productivity of the stocks (which may change
due to environmental and biological conditions), the history and
degree of depletion, and fishing mortality rate within those
fisheries [9,10]. Thus, fishery managers must consider the
ecological, social, and economic trade-offs of rebuilding immedi-
ately versus rebuilding more slowly over time.
In the United States, federally managed marine fisheries are
mandated to rebuild the biomass (B) of overfished stocks (i.e., often
defined as B ,K Bmsy) to levels that support maximum sustainable
yield (Bmsy) in as short a time as possible, accounting for the status
and biology of the stock, the needs of the fishing communities,
recommendations by international organizations in which the U.S.
participates, and the interactions within the marine ecosystem
(Section 304(e)(4) of the Magnuson-Stevens Fishery Conservation
and Management Act (MSA), as amended by the Sustainable
Fisheries Act (SFA) (11). Furthermore, overfished stocks must be
rebuilt within 10 years, except in cases where the life history
characteristics of the stock, environmental conditions or manage-
ment measures under an international agreement dictate other-
wise [11].
The legislative history behind the 10-year requirement was not
documented by Congress; however, Safina et al. [9] asserts that
the 10-year requirement to rebuild was the result of several
population dynamics experts stating, during the drafting of the
SFA in 1996, that many overfished stocks were capable of
rebuilding to maximum sustainable yield within 5 years if there
was a moratorium on fishing. The drafters of the SFA then looked
at balancing the short- and long-term trade-offs, and decided that
10 years (twice the time needed for most stocks to rebuild) was a
reasonable timeframe to ensure stocks rebuild in a timely manner
while accounting for socio-economic impacts [9].
In 1998, NOAA’s National Marine Fisheries Service (NMFS;
the federal agency responsible for managing marine fisheries)
developed national guidance on rebuilding overfished stocks to
operationalize the 1996 SFA mandate to rebuild in as short a time
as possible [12]. The guidance provided managers with a
framework to determine the targeted time to rebuild (Ttarget) by
specifying a minimum (or quickest) time for rebuilding a stock
(Tmin) and a maximum time allowable for rebuilding a stock (Tmax).
Ttarget is then set somewhere between Tmin and Tmax based on an
analysis of the factors listed previously (MSA Section 304(e)(4)).
Tmin is defined as the expected amount of time a stock needs to
rebuild to Bmsy in the absence of fishing mortality. In this context,
the term ‘‘expected’’ means a 50 percent probability of attaining
PLOS ONE | www.plosone.org 1 November 2014 | Volume 9 | Issue 11 | e112232
the Bmsy given inherent uncertainty in projecting biomass. For
stocks that have a Tmin of 10 years or less, the Tmax cannot exceed
10 years. If Tmin exceeds 10 years, then Tmax is calculated as Tmin
plus one generation time for that stock, where ‘‘generation time’’ is
defined as the average age of spawning individuals within a
population [13]. Once Ttarget has been chosen by fishery managers
based on their 304(e)(4) analysis, a rebuilding plan is developed
which often specifies a constant rebuilding fishing mortality rate
(Frebuild) that is some percentage of the rate associated with
achieving maximum sustainable yield (Fmsy) [14].
Since the implementation of the SFA in 1996 and NMFS’s 1998
guidance, these rebuilding requirements have been both praised
and criticized publicly [12,15]. More recently, issues with
rebuilding led Congress to require that NMFS fund a study by
the National Academy of Science’s National Research Council
(NRC) to evaluate the effectiveness of the current rebuilding
requirements [8]. In general, proponents believe the requirements
were needed to curtail practices of inaction by managers to
prevent overfishing (i.e., F. Fmsy) on rebuilding stocks and laissez-
faire attempts to meet rebuilding targets [9,16,17]. For example,
both Rosenberg et al. [18] and Milazzo [14] found overfishing
occurring in 40 to 45% of the stocks under rebuilding plans, and in
some cases overfishing had persisted for more than 5 years.
Furthermore, at least 22% of plans had reset rebuilding deadlines
back to year 1 when the plans were revised, instead of using the
existing time frame. This practice allowed managers to extend the
rebuilding time frames well beyond the plain language of the SFA
[18].
However, opponents note that the 10-year requirement has
limited the way in which managers can consider the socio-
economic impacts of rebuilding plans. For example, stocks unlucky
enough to have a Tmin of 10 years would be subject to a 10-year
moratorium [8,12,15]. Such a moratorium could wreak havoc on
the infrastructure and markets of the fishing industry if the stock
makes up a key component of the fishery [19,20], or could severely
limit fishing opportunities for other stocks in the fishery due to
bycatch issues [21]. Such a scenario is unlikely when Tmin.10
years. The discontinuity in the treatment of Tmax is also viewed as
unfair [8]. For example, if a stock could be rebuilt in 11 years in
the absence of fishing pressure (instead of 10), the stock would not
be subject to a moratorium and could have a longer Tmax (i.e., 11
years plus one generation time of the stock). Opponents also point
to discontinuities in the guidance that allows stocks that can
rebuild in less than 10 years (using the Tmin plus one generation
calculation) to still have a 10-year Tmax, because of the SFA
mandate that specifies that stocks should rebuild in as short a time
as possible [12,15].
We evaluate these statements made by proponents and
opponents of the 10-year rebuilding mandate and guidance to
determine whether such points are technically accurate, and offer
a resolution to some of the issues surrounding this mandate and its
implementation. Lastly, it is worth noting, that many of the
statements evaluated below are based on the findings of Safina
et al. [9]. Thus, for comparison sake, our modelling exercises
replicate that of Safina et al. [9], rather than using more
sophisticated modelling techniques that are more commonly used
in fisheries management.
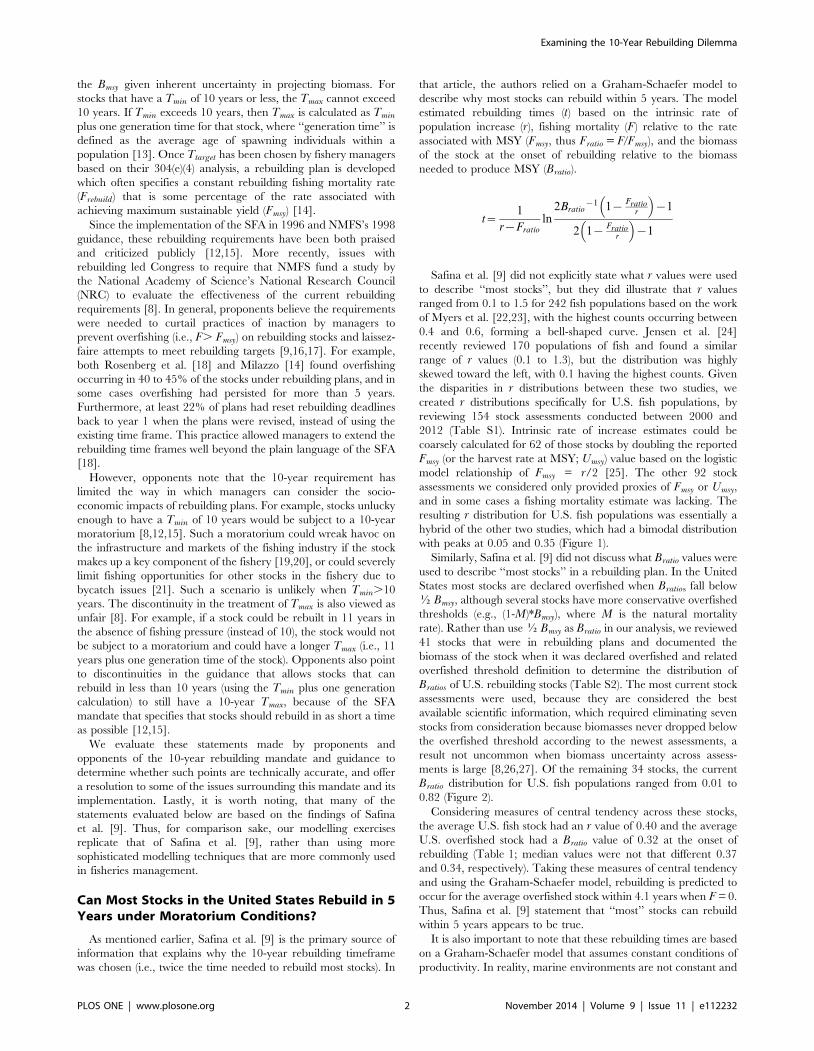
Can Most Stocks in the United States Rebuild in 5Years under Moratorium Conditions?
As mentioned earlier, Safina et al. [9] is the primary source of
information that explains why the 10-year rebuilding timeframe
was chosen (i.e., twice the time needed to rebuild most stocks). In
that article, the authors relied on a Graham-Schaefer model to
describe why most stocks can rebuild within 5 years. The model
estimated rebuilding times (t) based on the intrinsic rate of
population increase (r), fishing mortality (F) relative to the rate
associated with MSY (Fmsy, thus Fratio = F/Fmsy), and the biomass
of the stock at the onset of rebuilding relative to the biomass
needed to produce MSY (Bratio).
t~1
r{Fratio
ln2Bratio
{1 1{Fratio
r
� �{1
2 1{Fratio
r
� �{1
Safina et al. [9] did not explicitly state what r values were used
to describe ‘‘most stocks’’, but they did illustrate that r values
ranged from 0.1 to 1.5 for 242 fish populations based on the work
of Myers et al. [22,23], with the highest counts occurring between
0.4 and 0.6, forming a bell-shaped curve. Jensen et al. [24]
recently reviewed 170 populations of fish and found a similar
range of r values (0.1 to 1.3), but the distribution was highly
skewed toward the left, with 0.1 having the highest counts. Given
the disparities in r distributions between these two studies, we
created r distributions specifically for U.S. fish populations, by
reviewing 154 stock assessments conducted between 2000 and
2012 (Table S1). Intrinsic rate of increase estimates could be
coarsely calculated for 62 of those stocks by doubling the reported
Fmsy (or the harvest rate at MSY; Umsy) value based on the logistic
model relationship of Fmsy = r/2 [25]. The other 92 stock
assessments we considered only provided proxies of Fmsy or Umsy,
and in some cases a fishing mortality estimate was lacking. The
resulting r distribution for U.S. fish populations was essentially a
hybrid of the other two studies, which had a bimodal distribution
with peaks at 0.05 and 0.35 (Figure 1).
Similarly, Safina et al. [9] did not discuss what Bratio values were
used to describe ‘‘most stocks’’ in a rebuilding plan. In the United
States most stocks are declared overfished when Bratios fall below
K Bmsy, although several stocks have more conservative overfished
thresholds (e.g., (1-M)*Bmsy), where M is the natural mortality
rate). Rather than use K Bmsy as Bratio in our analysis, we reviewed
41 stocks that were in rebuilding plans and documented the
biomass of the stock when it was declared overfished and related
overfished threshold definition to determine the distribution of
Bratios of U.S. rebuilding stocks (Table S2). The most current stock
assessments were used, because they are considered the best
available scientific information, which required eliminating seven
stocks from consideration because biomasses never dropped below
the overfished threshold according to the newest assessments, a
result not uncommon when biomass uncertainty across assess-
ments is large [8,26,27]. Of the remaining 34 stocks, the current
Bratio distribution for U.S. fish populations ranged from 0.01 to
0.82 (Figure 2).
Considering measures of central tendency across these stocks,
the average U.S. fish stock had an r value of 0.40 and the average
U.S. overfished stock had a Bratio value of 0.32 at the onset of
rebuilding (Table 1; median values were not that different 0.37
and 0.34, respectively). Taking these measures of central tendency
and using the Graham-Schaefer model, rebuilding is predicted to
occur for the average overfished stock within 4.1 years when F = 0.
Thus, Safina et al. [9] statement that ‘‘most’’ stocks can rebuild
within 5 years appears to be true.
It is also important to note that these rebuilding times are based
on a Graham-Schaefer model that assumes constant conditions of
productivity. In reality, marine environments are not constant and
Examining the 10-Year Rebuilding Dilemma
PLOS ONE | www.plosone.org 2 November 2014 | Volume 9 | Issue 11 | e112232

Figure 1. The distribution of intrinsic growth rate coefficients (r) for U.S. fish stocks, based on 62 stocks for which Fmsy or Umsy
values were available. Note that r values labeled 0 on the x-axis actually represent 0.01 to 0.09 values.doi:10.1371/journal.pone.0112232.g001
Figure 2. The ratio distribution of biomass at the onset of rebuilding relative to the biomass associated with maximum sustainableyield (Bratio) for U.S. fish stocks, based on 34 stocks that were determined to be overfished based on the most current stockassessment. Note that Bratio values labeled 0 on the x-axis actually represent 0.01 to 0.09 values.doi:10.1371/journal.pone.0112232.g002
Examining the 10-Year Rebuilding Dilemma
PLOS ONE | www.plosone.org 3 November 2014 | Volume 9 | Issue 11 | e112232
the productivity of stocks can be sporadic. Thus, in many cases
rebuilding timelines are based on more complex models that use
age structured stochastic rebuilding dynamics that better reflect
the highly variable nature of recruitment events and uncertainty in
the marine environment [28,29,30]. Stochastic models generally
provide more precautious estimates of population growth com-
pared to the deterministic biomass models used here [31,32].
Therefore, the deterministic rebuilding timelines presented here
are likely to be more optimistic, resulting in shorter rebuilding
times.
How Many Stocks Are Susceptible to a 10-YearMoratorium?
Although no stocks have been subject to a 10-year moratorium,
the threat of such a scenario is a major talking point for opponents
of the 10-year rebuilding requirement. Sewell et al. [17] recently
summarized the rebuilding timelines of 44 U.S. fish stocks, and
showed that 23 (52%) of the stocks had 10-year rebuilding
timelines. However, none of these stocks were subject to a 10-year
moratorium. Instead, the high percentage of 10-year rebuilding
plans is the result of managers choosing to set their Ttarget to the
maximum allowed under the SFA, because the calculation of Tmin
was something less than 10 years. However, this is not to say that
some of these stocks may have dramatically reduced fishing
mortality rates in order to achieve the 10-year rebuilding timeline
(Table 1). For example, the Southern New England/Mid-Atlantic
winter flounder stock is in a 10-year rebuilding plan and has a
Fratio (i.e., maximum Frebuild/Fmsy) that is ,25% of Fmsy [8],
whereas the normal harvest policy for this groundfish stock is 75%
of Fmsy [33].
To determine how many U.S. stocks could qualify for a 10-year
moratorium, we used the Graham-Schaefer model to identify
combinations of r and Bratio values that trigger 10-year morato-
riums, where F was equal to zero. Our analysis revealed stocks
with r values ranging from 0.11 to 0.53 and Bratio values ranging
from 0.01 to 0.49 would trigger the 10-year moratorium. Of the 62
stocks for which we have r value estimates, half fell in this range,
though none of those stocks to date have been subjected to a 10-
year moratorium. The lack of 10-year fishing moratoriums
suggests that the likelihood of the right conditions occurring (i.e.,
r and Bratio values that result in a 10-year moratorium) is either not
high or that managers are capable of avoiding the moratorium via
rebuilding scenarios where Tmin is slightly higher than 10 years
and thus set Tmax higher.
Does the Use of Generation Time Result inEquitable Fratios among Rebuilding Stocks?
Historically, the use of the generation time in calculating Tmax
has not typically been a point of contention in terms of its
applicability to rebuilding guidance, although how it is defined can
vary. For example, Safina et al. [9] note that the mean generation
time for an unfished stock may be much longer than for an
overfished stock that has a highly truncated age distribution.
However, we found it interesting that in the past, stakeholders
have not questioned why this particular life history characteristic
was used in the 1998 guidance. NMFS guidance only notes that it
places a reasonable, species-specific cap on the maximum time to
rebuild [12,15,34]. Although the logarithmic inverse relationship
between r and generation time is well documented in the scientific
literature [35], its utility for scaling Tmax with the productivity of
the stock has not been empirically investigated to our knowledge.
To evaluate the relationship between r values and generation
time, we used the database of 154 U.S. stocks that have stock
assessments (described earlier), of which 62 stocks had r values
calculated. Generation times for these 62 corresponding stocks
were produced using the ‘‘life history tool’’ found within FishBase
[13]. In FishBase, generation time is derived from relationships in
optimum age (topt), age at length zero (t0), optimum length, infinity
length (Linf), and the von Bertlanffy growth function (K) [13].
Although the accuracy of generation time outputs in FishBase has
not been investigated, Thorson et al. [36] recently estimated biases
of age at maturity (tmat) outputs in FishBase, which was found to be
relatively accurate and relies on some of the same input
parameters as generation time (i.e., Linf, K, and t0). Additionally,
the generation times reported in 21 U.S. rebuilding plans and their
related r values were available for comparison (Table S1); how
these generation times were calculated were not provided but we
understand that proxies are often used.
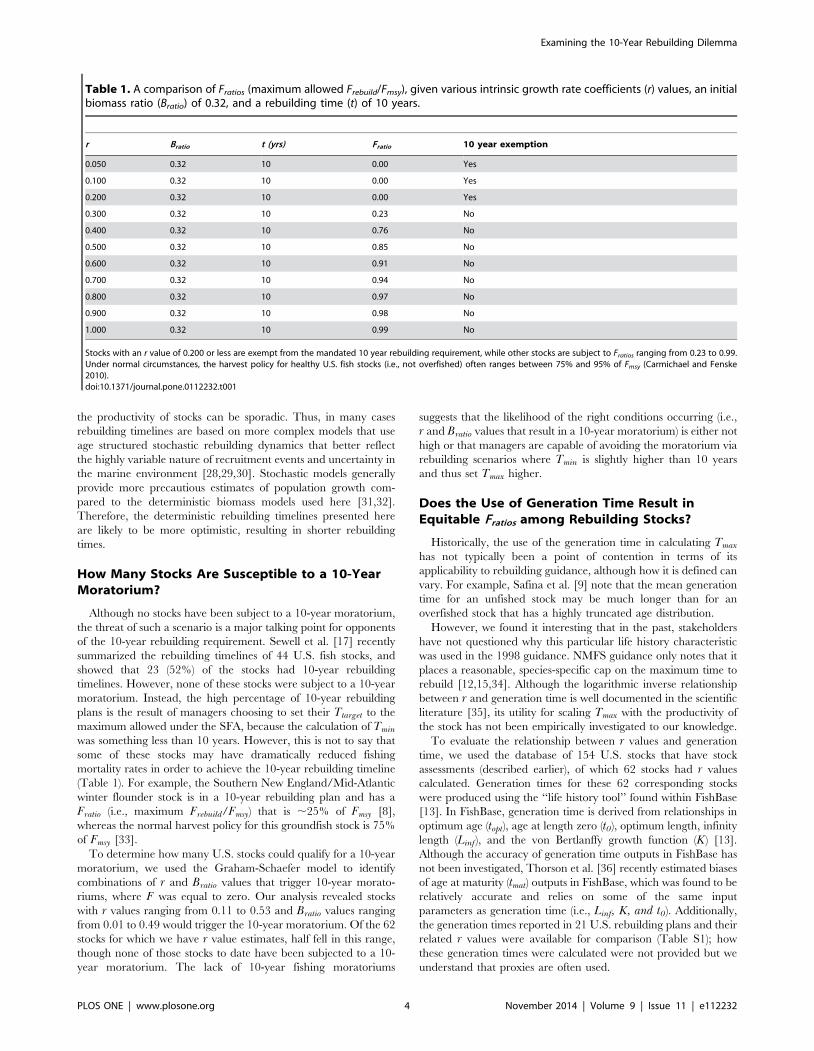
Table 1. A comparison of Fratios (maximum allowed Frebuild/Fmsy), given various intrinsic growth rate coefficients (r) values, an initialbiomass ratio (Bratio) of 0.32, and a rebuilding time (t) of 10 years.
r Bratio t (yrs) Fratio 10 year exemption
0.050 0.32 10 0.00 Yes
0.100 0.32 10 0.00 Yes
0.200 0.32 10 0.00 Yes
0.300 0.32 10 0.23 No
0.400 0.32 10 0.76 No
0.500 0.32 10 0.85 No
0.600 0.32 10 0.91 No
0.700 0.32 10 0.94 No
0.800 0.32 10 0.97 No
0.900 0.32 10 0.98 No
1.000 0.32 10 0.99 No
Stocks with an r value of 0.200 or less are exempt from the mandated 10 year rebuilding requirement, while other stocks are subject to Fratios ranging from 0.23 to 0.99.Under normal circumstances, the harvest policy for healthy U.S. fish stocks (i.e., not overfished) often ranges between 75% and 95% of Fmsy (Carmichael and Fenske2010).doi:10.1371/journal.pone.0112232.t001
Examining the 10-Year Rebuilding Dilemma
PLOS ONE | www.plosone.org 4 November 2014 | Volume 9 | Issue 11 | e112232

The logarithmic inverse relationship between r values and
generation times of stocks is shown in Figure 3. In general, the fit
of data is relatively poor (FishBase R2 = 0.31 – dashed line;
Reported values R2 = 0.52 – dotted line), but more importantly the
contrast between r and generation time is lost when r values are
greater than 0.20. This lack of contrast between r and generation
time means that stocks with an r value of 0.20 or greater will have
very similar generation times (i.e., ,5 years), which dispropor-
tionally affects the calculation of Tmax and related Fratio of the
stock. For example, using the Graham-Schaefer model and NMFS
rebuilding guidance, the average overfished stock (r = 0.40 and
Bratio = 0.32) that has a generation time of 5.0 years, a Tmin of 4.1
years, a Tmax of 9.1 years, and an allowable Fratio that is 71% of
FMSY. Whereas the Fratio for a stock with the same generation time
(5.0 years) and Bratio (0.32), but a lower r value (0.10) is only 31%
of FMSY (Tmin = 16.6 years and Tmax = 21.6 years), a 56%
reduction compared to the example above.
Although our observations are consistent with the expected
inverse relationships between r and generation time, these results
are based on non-validated data from FishBase and reported
generation times for which the methodology used to calculate the
values is unknown. Therefore the poor relationships observed here
could be the result of various proxies being used to calculated
generation time, as opposed to more reliable methods [34].
Regardless, it appears that the generation time lacks the contrasts
to be useful scalar of productivity for the majority of U.S. fish
stocks and its use likely results in disproportional estimates of Tmax
and Fratio.
Does Overfishing Still Threaten the Success ofRebuilding Plans?
In the past, several researchers have shown that overfishing
during the initial phases of a rebuilding plan or chronic overfishing
of a stock throughout the rebuilding plan were the primary causes
for a stock not to rebuild [8,14,16,17,18]. For stocks that could
rebuild in 10 years, the 10-year rebuilding mandate was effective
in that it placed a backstop on the time allowed to rebuild, and
made preventing overfishing a priority because otherwise drastic
cuts to fishing effort near the end of the rebuilding timeline may be
needed to meet the 10-year maximum [9]. However, much has
changed since 1996 in the way U.S. fisheries are managed. In
2006, the MSA was reauthorized (MSRA) and required, among
other things, the use of annual catch limits and accountability
measures to prevent overfishing of all stocks within a fishery
management plan [14,15]. These new requirements were imple-
mented through national guidance in 2009 [5], and created an
annual catch limit framework that accounts for the scientific and
management uncertainty in fisheries management by setting
precautionary catch limits (i.e., annual catch limits) below the
amount corresponding to maximum sustainable yield (i.e.,
overfishing limit) (Figure 4). When annual catch limits are
exceeded, accountability measures are triggered to correct for
the overage and to help prevent chronic overfishing [37]. Annual
catch limits and accountability measures are also applied to
rebuilding plans, to ensure rebuilding catch limits are not
exceeded.
Given the reauthorized MSA, we evaluated the performance of
fisheries management in preventing overfishing by reviewing the
Figure 3. The empirical relationship between intrinsic rate of growth coefficient (r) and generation time, for which r values (basedon Fmsy and Umsy) and generation time (based on FishBase and reported values from rebuilding plans) are available. The theoreticalrelationship between r and generation time (G) is provided by the equation G = lnR0/r, where R0 (the net reproductive rate per generation) isassumed to be 5, which is roughly the median value of R0 for the r and either FishBase or reported generation times.doi:10.1371/journal.pone.0112232.g003
Examining the 10-Year Rebuilding Dilemma
PLOS ONE | www.plosone.org 5 November 2014 | Volume 9 | Issue 11 | e112232

Status of U.S. Fisheries Report to Congress [38]. These reports
summarize the number of stocks determined to be undergoing
overfishing or in an overfished state between 2000 and 2013 (at
time of writing 2013 data are based on second quarter reports)
[38]. During this period, the number of stocks undergoing
overfishing declined from 48 to 28 (a 41% decrease) while stocks
in an overfished state declined from 52 to 40 (a 23% decrease)
(Figure 5). Of the stocks with a known status in 2013, only 13%
(26 of 194) were undergoing overfishing and 21% (37 of 175) were
overfished. The percentage of stocks undergoing overfishing and
stocks in an overfished condition are likely to continue to decrease
given that annual catch limits and accountability measures were
not fully implemented until 2012 by the U.S. regional fishery
management councils. Preliminary data on annual catch limit
performance in 2011 and 2012 suggest that approximately 10% of
the stocks exceeded their annual catch limit and 7% exceeded the
overfishing limit [39]. Therefore it appears that the reauthorized
Magnuson-Stevens Act and annual catch limit framework have
been successful at limiting (with the intention of ending)
overfishing and have added effective provisions that were not in
place when the 10-year rebuilding requirement was initially
implemented.
The rebuilding framework developed to implement the 10-year
requirement, however, has been a very useful concept. Prior to the
SFA and related 1998 rebuilding guidance, the only guidance
provided for rebuilding plans was that a program must be
established for rebuilding the stock over a period of time specified
by the Regional Fishery Management Council and acceptable to
the Secretary of Commerce [40]. As a result, the rationales for
how timelines for rebuilding were chosen were not as transparent
as they have been under the original 1998 or revised 2009
guidelines. With the 1998 rebuilding guidance, the Tmin, Ttarget,
and Tmax framework was created and essentially established lower
and upper limits on the allowable time to rebuild, which set the
stage for discussing the socio-economic trade-offs in setting the
Ttarget somewhere between Tmin and Tmax.
The rebuilding framework is also good for developing a
roadmap to recovery, because it necessitates the development of
long-term projection models to predict how the stock will respond
to the fishing mortality rate associated with Ttarget (Frebuild).
Managers can then use updated data and assessments and
subsequent projection models to determine whether they are
making adequate progress (i.e., more or less on schedule). If
adequate progress is not being made, managers can then evaluate
whether the lack of progress is due to inadequate management
control (i.e., F. Frebuild), unfounded assumptions or other needed
updates to the projection model, or identifiable environmental
conditions that changed the expectation of recruitment to the
fishery [40,41,42,43,44]. Depending on the factors identified,
managers have an array of management tools they can consider to
resolve the underlying issue.
Alternative Approaches to Calculating Tmax UsingFishing Mortality
Given the pros and cons of current rebuilding mandates and
related guidance, we recommend two alternative approaches to
developing rebuilding timelines. Both approaches rely on constant
fishing mortality rates to calculate Tmax and avoid discrepancies in
how Tmax is calculated between short- and long-lived species in
terms of Fratios and the 10-year time limit. Both approaches also fit
within the existing rebuilding guidance framework, where Tmin
and Tmax are calculated to define the minimum and maximum
times to rebuild, while Ttarget is still set somewhere in between the
two reference points to rebuild in as short a time as possible while
taking into account the needs of fishing communities and
interactions within the marine ecosystem. However, given the
uncertainty in stock assessment projections, the rebuilding
framework would only be used for planning purposes, and less
for delineating or defining hard deadlines to rebuild. Instead,
strong accountability measures (e.g., in-season closure authority,
payback provisions, annual catch targets, etc.) could be used to
reduce the effects of implementation error and ensure that
Figure 4. The annual catch limit (ACL) framework, describing how the acceptable biological catch level (ABC) is reduced from theoverfishing limit (OFL) based on scientific uncertainty in the estimate of OFL, how the ACL can be set at or below ABC, and how anannual catch target (ACT) can be set below the ACL to account for management uncertainty. The Scientific and Statistical Committee of aRegional Fishery Management Council sets an OFL and ABC, while the Regional Fishery Management Council sets the ACL and ACT; each decision isbased on a science-management feedback loop.doi:10.1371/journal.pone.0112232.g004
Examining the 10-Year Rebuilding Dilemma
PLOS ONE | www.plosone.org 6 November 2014 | Volume 9 | Issue 11 | e112232

rebuilding occurs in a timely manner. Such an approach is also
recommended in the recent NRC report on U.S. rebuilding plans
[8], noting that rebuilding plans that focus more on meeting
selected fishing mortality targets than on exact schedules for
attaining biomass targets may be more robust to assessment
uncertainties, natural variability, and ecosystem consideration, and
may have lower social and economic impacts.
The key to these alternative approaches is identifying an
acceptable F that both meets the existing 10-year rebuilding
mandate for the average overfished stock, and is acceptably high to
support the fishery during rebuilding. As noted earlier, the average
overfished stock (r = 0.40 and Bratio = 0.36) can rebuild in 4.1 years
(roughly 5 years) when the fishing mortality is set to zero and
productivity is constant, and this was presumably the rationale
used for creating the 10-year rebuilding timeframe (i.e., twice the
time to rebuild for ‘‘most’’ stocks). Thus, one alternative to
calculating Tmax is to simply multiply Tmin by two (Tmax = 2 * Tmin)
to allow the stock twice the time to rebuild. Using this alternative
approach means the average overfished stock would be expected
to rebuild in 8.2 years, and the maximum allowable Fratio for the
stock would be 66% of Fmsy. Furthermore, the Fratio of 0.66 is
constant among different r types of stocks, because Fmsy is a
function of r (Fmsy = r/2; 25). Lastly, it is worth noting that New
Zealand’s Ministry of Primary Industry uses this approach for
calculating Tmax and it was highlighted by the NRC report on U.S.
rebuilding plans as a model to consider [8,45].
The second alternative tries to rectify the difference between a
Tmax that is 8.2 years (based on Tmin * 2) and the 10 years allowed
for the average overfished stock. We ran the Graham-Schaefer
model with different Fratios (assuming Ttarget equals Tmax) until the
time to rebuild (t) equaled 10 years. Our analysis revealed that the
average overfished stock could rebuild in 10 years (Tmax) using a
Fratio that was 76% of Fmsy (Figure 6). Though the use of surplus
production models admittedly may produce more optimistic
results than stochastic age structured models, the Fratio of 76%
of Fmsy coincidentally aligns with the 75% Fmsy harvest control rule
that is commonly used in U.S. fisheries [33,46]. The 75% Fmsy
harvest control rule gained popularity in the 1990s as a
precautionary approach to fisheries management, when studies
revealed that such a rule reduces the chances of overfishing, results
in equilibrium yields of 94% of MSY or higher, and equilibrium
biomass levels between 125% and 131% Bmsy—a relatively small
sacrifice in yield for a relatively large gain in biomass [34,47,48].
Additionally, NMFS national guidance on rebuilding overfished
stocks notes that if a stock has not rebuilt by Tmax, then the fishing
mortality rate should be maintained at Frebuild or 75% Fmsy,
whichever is less [15]. Given the similarities to the 75% harvest
control rule and current rebuilding guidance, we re-ran the
analysis using 75% as the Fratio and found that the average
overfished stock could rebuild in 9.8 years. Since there is
essentially no difference in the rebuilding time (i.e., 9.8 vs. 10.0),
we will refer to this alternative approach as the 75% Fmsy
rebuilding approach.
The intent of our analyses was to demonstrate that a Tmax
approach based on a constant F could meet the 10-year rebuilding
requirement, and result in a more consistent and simplified
rebuilding strategy. Assuming the history behind the 10 year
requirement reported in Safina et al. [9] was accurate, our two
approaches to defining Tmax (i.e., Tmin * 2 and 75%Fmsy), along
with ACL and AM management and using Tmax as a planning tool
Figure 5. Between 2000 and 2013, overfishing determinations declined from 48 to 28 (a 41% reduction) while overfisheddeterminations declined from 52 to 40 (a 23% reduction).doi:10.1371/journal.pone.0112232.g005
Examining the 10-Year Rebuilding Dilemma
PLOS ONE | www.plosone.org 7 November 2014 | Volume 9 | Issue 11 | e112232

rather than a hard deadline, address the majority of stakeholders
concerns with the current rebuilding framework including: (1)
most stocks (i.e., over 50%) can still rebuild within 10 years, (2)
rebuilding stocks would no longer be susceptible to a10-year
moratorium; (3) there would be no discontinuities in allowable
Fratios among short- and long-lived species due to the use of 1+generation time calculations; and (4) managers could focus on
controlling Frebuild, as opposed to trying to control the biomass of
the stock which is harder to estimate and can be driven by
environmental conditions. Regarding this later point, evaluating
the biomass of the stock is still needed to determine whether the
rebuilding target (i.e., Bmsy) has been reached or not.
Our suggested approaches, however, are limited by the current
Tmin, Ttarget, Tmax framework recommended in NMFS national
guidance on rebuilding overfished stocks that operationalizes the
rebuilding mandates of the MSA. Alternatives to this framework
could be considered, if these mandates were revised. For example,
the NRC report on U.S. rebuilding encouraged the use of harvest
control rules that reduce fishing mortality as the biomass of the
stock declines [8]. Harvest control rules constructed in such a
manner would likely prevent stocks from ever being declared
overfished in the first place, as more conservative fishing mortality
rates are applied as the stock declines [8,49,50]. These types of
harvest control rules can also be constructed in such a way that
there are tiered categories of management action, where severely
depleted stocks may be subject moratorium until the biomass of
the stock reaches a minimum threshold (e.g., J Bmsy), whereby a
more structured F-based approach is applied until the stock
rebuilds to its target level of biomass [45].
Lastly, while we have only focused on trying to resolve the 10-
year rebuilding dilemma of the current rebuilding mandates and
guidelines, there is much more analysis that goes into minimizing
the economic, social, and ecological impacts of rebuilding a
fishery. There is also a myriad of other management tools that
managers can use to rebuild fish stocks, such as the use of marine
protected areas [8,51,52], buy-back programs to reduce fishing
capacity [53,54], stock enhancement [55], and habitat restoration
[56,57]. The most effective rebuilding plans will likely take a
portfolio approach to rebuilding stocks, by deploying a wide array
of management tools, rather than solely relying on controlling the
fishing mortality or the biomass of the stock.
Supporting Information
Table S1 A list of 154 assessed stocks used in theanalysis related to estimates of intrinsic rate of growth(r), generation time, and age at first maturity.
(XLSX)
Table S2 A list of the 34 U.S. fish stocks in rebuildingplans for which the biomass at the onset of rebuilding(Bratio) was reported.
(XLSX)
Figure 6. Rebuilding times (t) with various Fratios (0%, 25%, 50%, and 75%), using the Graham-Schaefer model. Rebuilding timedepends only on the intrinsic rate of increase (r), fishing mortality relative to Fmsy (Fratio), and the biomass at the onset of rebuilding relative to Bmsy
(Bratio). The average overfished stock (r = 0.40 and Bratio = 0.32) can rebuild in 4.1 years with Fratio = 0.0, or 10.0 years when Fratio = 0.76.doi:10.1371/journal.pone.0112232.g006
Examining the 10-Year Rebuilding Dilemma
PLOS ONE | www.plosone.org 8 November 2014 | Volume 9 | Issue 11 | e112232

Acknowledgments
Disclaimer: The views expressed in this article are the authors’ own and do
not necessarily represent the view of NMFS.
We would like to thank T. Quinn II for supplying us with the Graham-
Schaefer model used in this analysis. We are also grateful for the editorial
contributions provided by S. Balwani, J. Field, O. Hamel, J. Hare, M.
McClure, F. Pflieger, J. Stein, A. Risenhoover, G. Tromble, and our
anonymous reviewers.
Author Contributions
Conceived and designed the experiments: WSP JMC. Performed the
experiments: WSP JMC. Analyzed the data: WSP JMC. Contributed
reagents/materials/analysis tools: JMC. Wrote the paper: WSP JMC.
References
1. Smith TD (1994) Scaling Fisheries: The Science of Measuring the Effects of
Fishing, 1855–1955. Cambridge: Cambridge University Press. 392 p.
2. Caddy JF, Cochrane KL (2001) A review of fisheries management past and
present and some future perspectives for the third millennium. Ocean Coast
Manage 44: 653–682.
3. Longhurst A (2010) Mismanagement of Marine Fisheries. Cambridge: Cam-
bridge University Press. 315p.
4. Pauly D (2007) The Sea Around Us project: documenting and communicating
global fisheries impacts on marine ecosystems. AMBIO 36(4): 290–245.
5. Worm B, Hilborn R, Baum JK, Branch TA, Collie JS, et al. (2009) Rebuilding
global fisheries. Science 325(5940): 578–585.
6. Costello C, Ovando D, Hilborn R, Gaines SD, Deschenes O, et al. (2012) Status
and solutions for the world’s unassessed fisheries. Science 338(6106): 517–520.
7. Hilborn R, Stewart IJ, Branch TA, Jensen OP (2012) Defining trade-offs among
conservation, profitability, and food security in the California Current Bottom-
Trawl fishery. Conserv Biol 26(2): 257–266.
8. National Research Council (NRC) (2013) Evaluating the effectiveness of Fish
Stock Rebuilding Plans in the United States. Washington: The National
Academies Press. 292 p.
9. Safina C, Rosenberg AA, Myers RA, II Quinn TJ, Collie JS (2005) U.S. ocean
fish recovery: staying the course. Science 309: 707–708.
10. Neubauer P, Jensen OP, Hutchings JA, Baum JK (2013) Resilience and recovery
of overexploited marine populations. Science 340: 347–349.
11. Sustainable Fisheries Act of the Magnuson-Stevens Fishery Conservation and
Management Act (SFA) (1996) Silver Spring: U.S. Department of Commerce,
National Oceanic and Atmospheric Administration, National Marine Fisheries
Service. 170 p.
12. Federal Register (1998) Magnuson-Stevens Act Provision; National Standard
Guidelines – Final Rule. Federal Register 63(84): 24212–24237.
13. FishBase (2013) Estimation of life-history key facts. Available: http://www.
fishbase.org/MANUAL/key%20facts.htm. Accessed 2013 Aug 28.
14. Milazzo MJ (2011) Progress and problems in U.S. marine fisheries rebuilding
plans. Rev Fish Biol Fisheries 22 (1): 273–296.
15. Federal Register (2009) Magnuson-Stevens Act Provisions; Annual Catch Limits;
National Standard Guidelines – Final Rule. Federal Register 74(11): 3178–3213.
16. Murawski SA (2010) Rebuilding depleted fish stocks: the good, the bad, and,
mostly, the ugly. ICES J Mar Sci 67(9): 1830–1840.
17. Sewell B, Atkinson S, Newman D, Suatoni L (2013) Bringing back the fish: an
evaluation of U.S. fisheries rebuilding under the Magnuson-Stevens Fishery
Conservation and Management Act. Washington: Natural Resource Defense
Council Report R: 13-01-A. 26 p.
18. Rosenberg AA, Swasey JH, Bowman M (2006) US fisheries: progress and
problems. Front Ecol Environ 4(6): 303–308.
19. Jacob S, Jepson M (2009) Creating a community context for the fishery stock
sustainability index. Fisheries 34: 228–231.
20. Kasperski S, Holland DS (2013) Income diversification and risk for fishermen.
Proc Natl Acad Sci USA 110(6): 2076–2081.
21. Patrick WS, Benaka LR (2013) Estimating the economic impacts of bycatch in
U.S. commercial fisheries. Mar Policy 38: 470–475.
22. Myers RA, Mertz G, Fowlow PS (1997) Maximum population growth rates and
recovery times for Atlantic cod, Gadus morhua. Fish Bull 95(4): 762–772.
23. Myers RA, Bowen KG, Barrowman NJ (1999) Maximum reproductive rate of
fish at low population sizes. Can J Fish Aquat Sci 56(12): 2404–2419.
24. Jensen OP, Branch TA, Hilborn R (2012) Marine fisheries as ecological
experiments. Theoretical Ecology 5: 3–22.
25. Jacobson LD, Cadrin SX (2002) Stock-rebuilding time isopleths and constant-Fstock-rebuilding plans for overfished stocks. Fish Bull 100: 519–536.
26. Cadrin SX, Vaughan DS (1997) Retrospective analysis of virtual population
estimates for Atlantic menhaden stock assessment. Fish Bull 95(3): 445–455.
27. Ralston S, Punt AE, Hamel OS, DeVore JD, Conser RJ (2011) A meta-analytic
approach to quantifying scientific uncertainty in stock assessments. Fish Bull 109:
217–231.
28. Brodziak J, Legault CM (2005) Modeling averaging to estimate rebuilding
targets for overfished stocks. Can J Fish Aquat Sci 62: 544–562.
29. Stewart IJ (2009) Rebuilding analysis for canary rockfish based on the 2009
updated stock assessment. Portland: Pacific Fishery Management Council.
254 p.
30. Pacific Fishery Management Council (2012) Terms of Reference for the
Groundfish and Coastal Pelagic Species Stock Assessment and Review Process
for 2013–2014. Portland: Pacific Fishery Management Council. 29 p.
31. Lande R, Saether B, Engen S (2001) Sustainable exploitation of fluctuating
populations. In: Reynolds JD, Mace GM, Redford KH, Robinson JG, editors.
Conservation of Exploited Species. Cambridge: Cambridge University Press. Pp.
67–86.
32. Punt AE, Szuwalski C (2012) How well can FMSY and BMSY be estimated using
empirical measures of surplus production? Fish Res 134–136: 113–124.
33. Carmichael J, Fenske K (2011) Report of a National SSC Workshop on ABC
Control Rules Implementation and Peer Review Procedures. Charleston: South
Atlantic Fishery Management Council. 95 p.
34. Restrepo VR, Thompson GG, Mace PM, Gabriel WL, Low LL, et al. (1998)
Technical guidance on the use of precautionary approaches to implementing
National Standard 1 of the Magnuson-Stevens Fishery Conservation and
Management Act. Silver Spring: National Marine Fisheries Service, NOAA
Tech. Memo. NMFS-F/SPO-31. 54 p.
35. Caswell H (2001) Matrix population models: construction, analysis and
interpretation, 2nd edition. Sinauer, Sunderland, MA. 722 p.
36. Thorson JT, Cope JM, Patrick WS (2014) Assessing the quality of life history
information in publicly available databases. Ecol Appl 24(1): 217–226.
37. Methot RD, Tromble GR, Lambert DM, Greene KE (2013) Implementing a
science-based system for preventing overfishing and guiding sustainable fisheries
in the U.S. ICES J Mar Sci 71(2): 183–194.
38. NMFS (National Marine Fisheries Service) (2013) Status of U.S. fisheries. Silver
Spring: National Marine Fisheries Service. Available: http://www.nmfs.noaa.
gov/sfa/fisheries_eco/status_of_fisheries/archive/stock_status_archive.html.
Accessed 2014 Jul 10.
39. Rauch S (2013) Written testimony by Samuel D. Rauch III Acting Assistant
Administrator for the National Marine Fisheries Service National Oceanic and
Atmospheric Administration US Department of Commerce – Hearing on
Magnuson-Stevens Fisheries Conservation and Management Act – Before the
Committee on Natural Resources United States House of Representatives,
September 11, 2013. Available: http://www.legislative.noaa.gov/Testimony/
Rauch091113.pdf. Accessed 2013 Aug 28.
40. Federal Register (1989) Guidelines for fishery management plans – Final Rule.
Federal Register 54(140): 30826–30844.
41. Patrick WS, Morrison W, Nelson M, Gonzalez Marrero RL (2013) Factors
affecting management uncertainty in U.S. fisheries and methodological
solutions. Ocean & Coastal Management 71: 64–72.
42. Hsieh CH, Glaser SM, Lucas AJ, Sugihara G (2005) Distinguishing random
environmental fluctuations from ecological catastrophes for the North Pacific
Ocean. Nature 435: 336.
43. Hollowed AB, Barange M, Ito S, Kim S, Loeng H, et al. (2011) Effects of climate
change on fish and fisheries: forecasting impacts, assessing ecosystem responses,
and evaluating management strategies. ICES J Mar Sci 68: 984–985.
44. Punt AE (2011) The impact of climate change on the performance of rebuilding
strategies for overfished groundfish species of the U.S. West Coast. Fish Res 109:
320–329.
45. New Zealand Ministry of Fisheries (2014) Operational guidelines for New
Zealand’s Harvest Strategy Standard. Wellington: Ministry of Fisheries. 67 p.
46. Berkson J, Barbieri L, Cadrin S, Cass-Calay S, Crone P, et al. (2011) Calculating
acceptable biological catch for stocks that have reliable catch data only (Only
Reliable Catch Stocks – ORCS). Miami: National Marine Fisheries Service,
NOAA Tech. Memo. NMFS-SEFSC-616. 56 p.
47. Thompson GG (1993) A proposal for a threshold stock size and maximum
fishing mortality rate. In: Smith J, Hunt JJ, Rivard D, editors. Risk evaluation
and biological reference points for fisheries management. Ottawa: National
Research Council of Canada, Can Spec Publ Fish Aquat Sci. pp 303–320.
48. Mace PM (1994) Relationships between common biological reference points
used as thresholds and targets of fisheries management strategies. Can J Fish
Aquat Sci 51: 110–122.
49. Restrepo VR, Powers JE (1999) Precautionary control rules in US fisheries
management: specification and performance. ICES J Mar Sci 56: 846–852.
50. Punt AE (2003) Evaluating the efficacy of managing West Coast groundfish
resources through simulations. Fish Bull 101: 860–873.
51. Guenette S, Pitcher TJ, Walters CJ (2000) The potential of marine reserves for
the management of northern cod in Newfoundland. Bull Mar Sci 66(3): 831–
852.
52. Collie J, Rochet MJ, Bell R (2013) Rebuilding fish communities: the ghost of
fisheries past and the virtue of patience. Ecol App23(2): 374–391.
53. Clark CW, Munro GR, Sumaila UR (2005) Subsidies, buybacks, and sustainable
fisheries. J Env Econ Management 50(1): 47–58.
Examining the 10-Year Rebuilding Dilemma
PLOS ONE | www.plosone.org 9 November 2014 | Volume 9 | Issue 11 | e112232

54. Curtis R, Squires D (2007) Fisheries Buybacks. Hoboken: Blackwell Publishing.
288 p.55. Bell JD, Bartley DM, Lorenzen K, Loneragan NR (2006) Restocking and stock
enhancement of coastal fisheries: potential, problems and progress. Fish Res
80(1): 1–8.
56. Williams RN, Bisson PA, Bottom DL, Calvin LD, Coutant CC, et al. (1999)
Scientific issues in the restoration of salmonid fishes in the Columbia River.Fisheries 24(3): 10–19.
57. Hasselman DJ, Limburg KE (2012) Alosine restoration in the 21st century:
challenging the status quo. Mar Coast Fish 4(1): 174–187.
Examining the 10-Year Rebuilding Dilemma
PLOS ONE | www.plosone.org 10 November 2014 | Volume 9 | Issue 11 | e112232