
Modeling Moral Dilemma Judgment
37
The Neuroeconomics of Emotional Conflicts in Moral Dilemma Judgment Armando F. Rocha 1,2 , Fábio T. Rocha 1 and Eduardo Massad 2,3 1. Laboratory for Research on Decision Making, School of Economy of São Paulo, FGV. 2. Lim 01 – HC FMUSP, School of Medicine, University of São Paulo. Av. Dr. Arnaldo 455, São Paulo, 01246-903, Brazil. 3. Department of Infectious and Tropical Diseases (Hon. Prof.), London School of Hygiene & Tropical Medicine, London, UK. correspondent author: Armando F. Rocha phone: +55-11-3066 7435 fax: +55-11-3066 7382 e-mail: [email protected]
-
Upload
independent -
Category
Documents
-
view
1 -
download
0
Transcript of Modeling Moral Dilemma Judgment

The Neuroeconomics of Emotional Conflicts in Moral Dilemma Judgment
Armando F. Rocha 1,2, Fábio T. Rocha 1 and Eduardo Massad 2,3 1. Laboratory for Research on Decision Making, Scho ol of Economy of São
Paulo, FGV.
2. Lim 01 – HC FMUSP , School of Medicine, University of São Paulo. Av. Dr .
Arnaldo 455, São Paulo, 01246-903, Brazil.
3. Department of Infectious and Tropical Diseases ( Hon. Prof.), London
School of Hygiene & Tropical Medicine, London, UK.
correspondent author:
Armando F. Rocha
phone: +55-11-3066 7435
fax: +55-11-3066 7382
e-mail: [email protected]
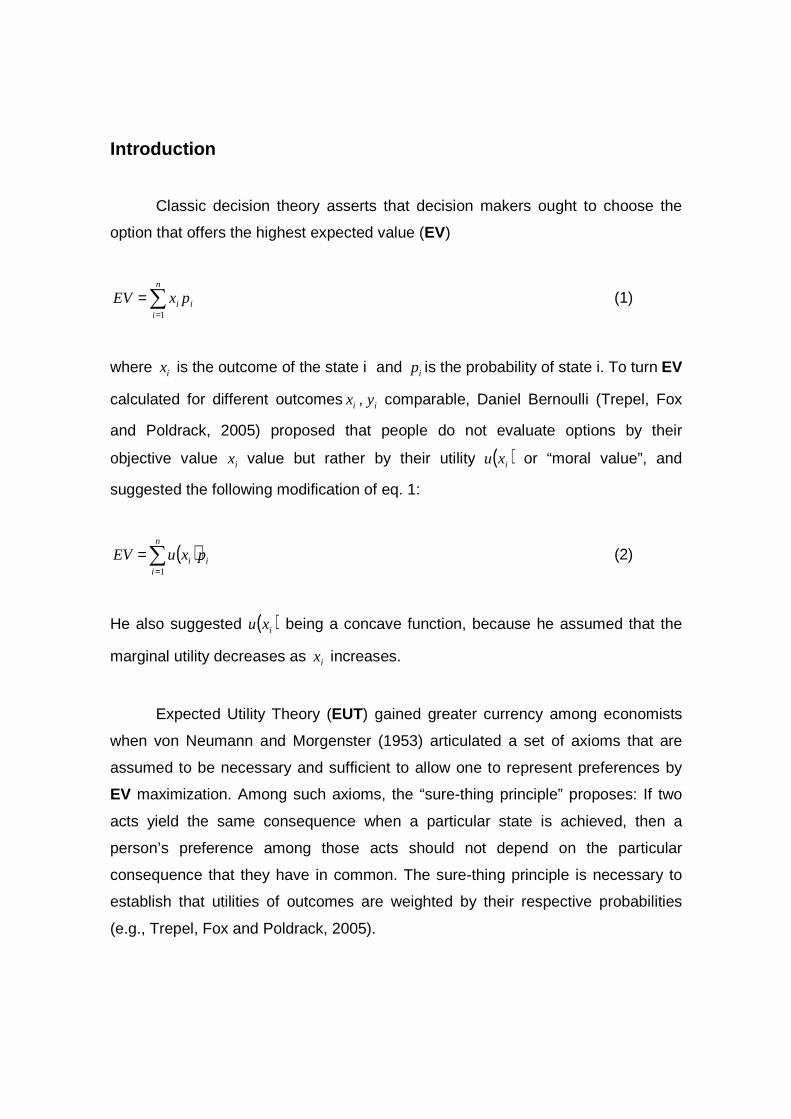
Introduction
Classic decision theory asserts that decision makers ought to choose the
option that offers the highest expected value (EV)
i
n
ii pxEV ∑
=
=1
(1)
where ix is the outcome of the state i and ip is the probability of state i. To turn EV
calculated for different outcomes ix , iy comparable, Daniel Bernoulli (Trepel, Fox
and Poldrack, 2005) proposed that people do not evaluate options by their
objective value ix value but rather by their utility ( )ixu or “moral value”, and
suggested the following modification of eq. 1:
( ) i
n
ii pxuEV ∑
=
=1
(2)
He also suggested ( )ixu being a concave function, because he assumed that the
marginal utility decreases as ix increases.
Expected Utility Theory (EUT) gained greater currency among economists
when von Neumann and Morgenster (1953) articulated a set of axioms that are
assumed to be necessary and sufficient to allow one to represent preferences by
EV maximization. Among such axioms, the “sure-thing principle” proposes: If two
acts yield the same consequence when a particular state is achieved, then a
person’s preference among those acts should not depend on the particular
consequence that they have in common. The sure-thing principle is necessary to
establish that utilities of outcomes are weighted by their respective probabilities
(e.g., Trepel, Fox and Poldrack, 2005).
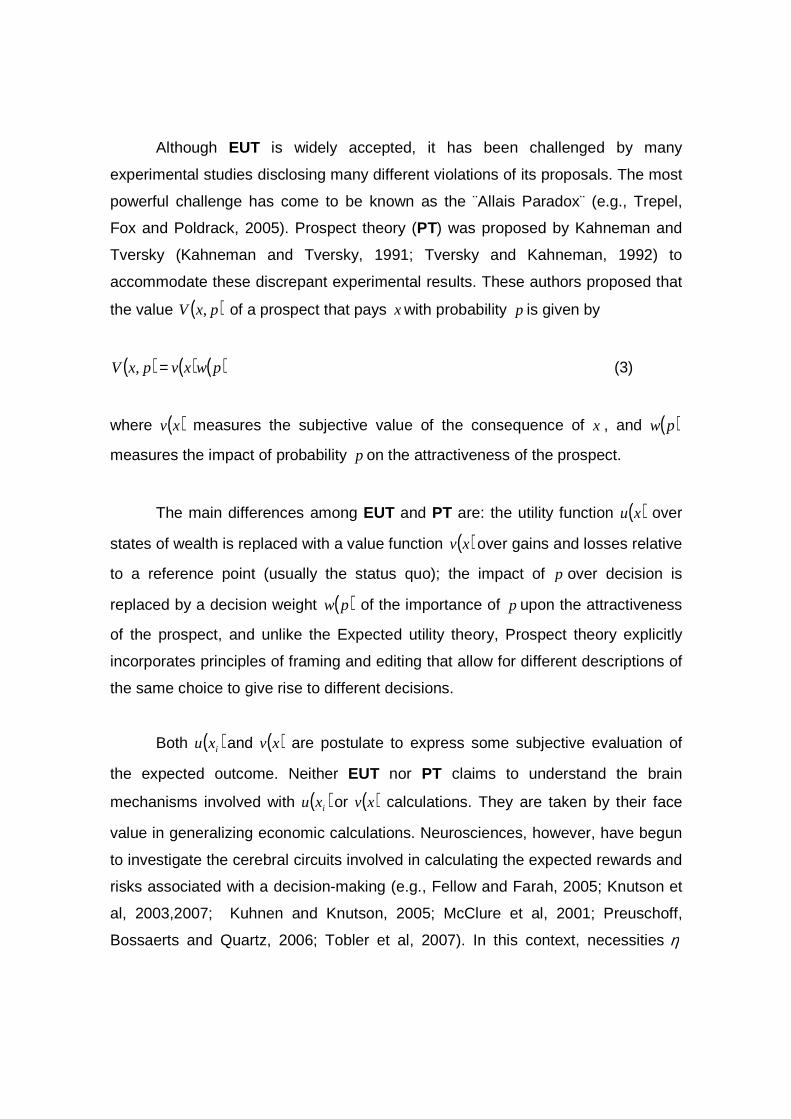
Although EUT is widely accepted, it has been challenged by many
experimental studies disclosing many different violations of its proposals. The most
powerful challenge has come to be known as the ¨Allais Paradox¨ (e.g., Trepel,
Fox and Poldrack, 2005). Prospect theory (PT) was proposed by Kahneman and
Tversky (Kahneman and Tversky, 1991; Tversky and Kahneman, 1992) to
accommodate these discrepant experimental results. These authors proposed that
the value ( )pxV , of a prospect that pays xwith probability p is given by
( ) ( ) ( )pwxvpxV =, (3)
where ( )xv measures the subjective value of the consequence of x , and ( )pw
measures the impact of probability p on the attractiveness of the prospect.
The main differences among EUT and PT are: the utility function ( )xu over
states of wealth is replaced with a value function ( )xv over gains and losses relative
to a reference point (usually the status quo); the impact of p over decision is
replaced by a decision weight ( )pw of the importance of p upon the attractiveness
of the prospect, and unlike the Expected utility theory, Prospect theory explicitly
incorporates principles of framing and editing that allow for different descriptions of
the same choice to give rise to different decisions.
Both ( )ixu and ( )xv are postulate to express some subjective evaluation of
the expected outcome. Neither EUT nor PT claims to understand the brain
mechanisms involved with ( )ixu or ( )xv calculations. They are taken by their face
value in generalizing economic calculations. Neurosciences, however, have begun
to investigate the cerebral circuits involved in calculating the expected rewards and
risks associated with a decision-making (e.g., Fellow and Farah, 2005; Knutson et
al, 2003,2007; Kuhnen and Knutson, 2005; McClure et al, 2001; Preuschoff,
Bossaerts and Quartz, 2006; Tobler et al, 2007). In this context, necessities η
trigger motivations ϑ to implement actions ai that are expected to fulfill η with
some expected reward ( )tiaλ and calculated risk or cost ( )t
iaχ , and decision-
making about ai becomes dependent on the actual values of ( )tiaλ and ( )t
iaχ .
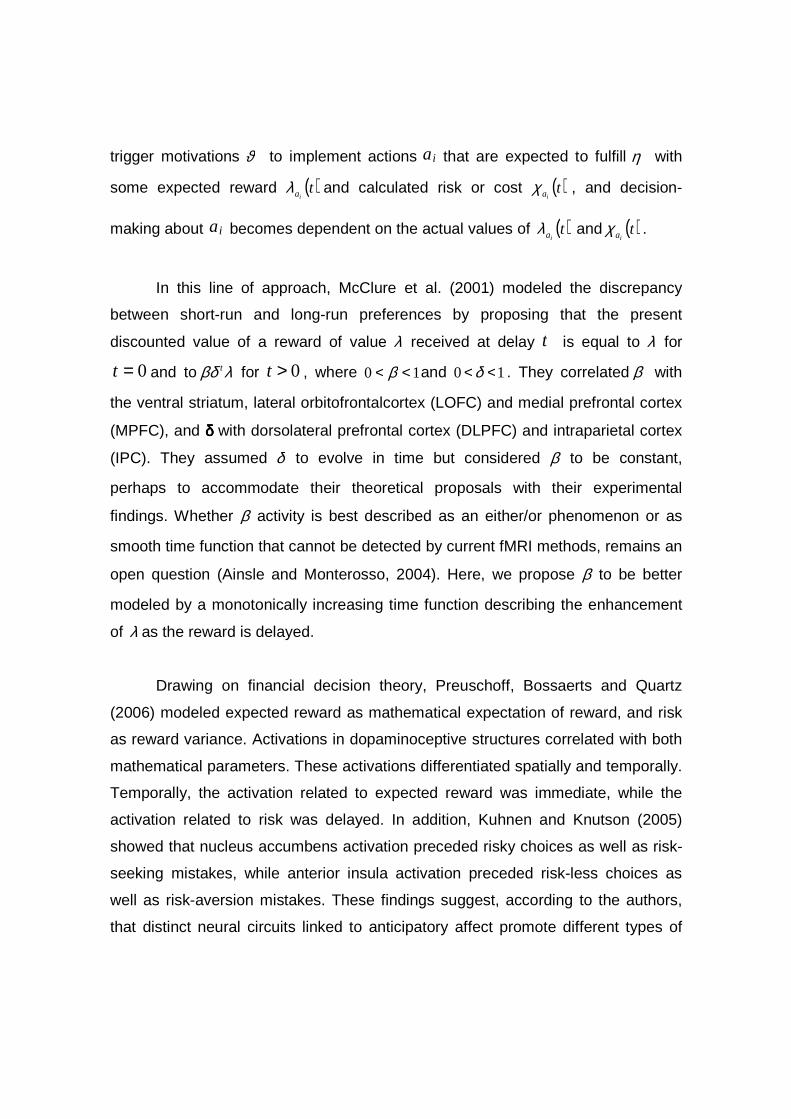
In this line of approach, McClure et al. (2001) modeled the discrepancy
between short-run and long-run preferences by proposing that the present
discounted value of a reward of value λ received at delay t is equal to λ for
0=t and to λβδ t for 0>t , where 10 << β and 10 << δ . They correlated β with
the ventral striatum, lateral orbitofrontalcortex (LOFC) and medial prefrontal cortex
(MPFC), and δδδδ with dorsolateral prefrontal cortex (DLPFC) and intraparietal cortex
(IPC). They assumed δ to evolve in time but considered β to be constant,
perhaps to accommodate their theoretical proposals with their experimental
findings. Whether β activity is best described as an either/or phenomenon or as
smooth time function that cannot be detected by current fMRI methods, remains an
open question (Ainsle and Monterosso, 2004). Here, we propose β to be better
modeled by a monotonically increasing time function describing the enhancement
of λ as the reward is delayed.
Drawing on financial decision theory, Preuschoff, Bossaerts and Quartz
(2006) modeled expected reward as mathematical expectation of reward, and risk
as reward variance. Activations in dopaminoceptive structures correlated with both
mathematical parameters. These activations differentiated spatially and temporally.
Temporally, the activation related to expected reward was immediate, while the
activation related to risk was delayed. In addition, Kuhnen and Knutson (2005)
showed that nucleus accumbens activation preceded risky choices as well as risk-
seeking mistakes, while anterior insula activation preceded risk-less choices as
well as risk-aversion mistakes. These findings suggest, according to the authors,
that distinct neural circuits linked to anticipatory affect promote different types of

financial choices and indicate that excessive activation of these circuits may lead to
investing mistakes.
Social behavior is the hallmark of human kind. Theory of Mind (ToM) as the
ability to attribute mental states to others has an important role in social cognition.
Brain imaging studies in healthy subjects have described a brain system involving
medial prefrontal cortex, superior temporal sulcus and temporal pole in ToM
processing (e.g., Gallagher et al 2002; Hamilton, et al 2006; den Ouden et al2005).
In addition, Fiddick, Spampinato and Grafman (2005) showed that, although the
tested social and non-social rules were matched in terms of their logical structure,
reasoning about social contracts and precautions (non-social rules) activated a
different constellation of neurological structures.
The actual knowledge provided by neurosciences allows the following definition
of the dimensions of PES and IES:
1) Rewarding system: it corresponds to the Liking System proposed by Berridge,
2003 and it is in charge to evaluate the expected benefit ( )iPESi aλ , ( )i
IESi aλ of
actions;
2) Risk taking system: it corresponds to the Fear-Panic system as described e.g.
by Graef, 2003 and Ledoux, 1996, and it is in charge of assessing the
estimated cost ( )iPESi aχ , ( )i
IESi aχ to implement actions and
3) Approaching-withdrawing system: it corresponds to the Seeking-avoiding
system proposed by Panksepp, 1998 and it is responsible for the decision
about actions. Here, we propose that the actual values of ( )iPESi aλ , ( )i
IESi aλ and
( )iPESi aχ , ( )i
IESi aχ are used by the “seeking” system to decide about
implementing or not ai .

Because of this, expected rewards ( )ii aλ and costs ( )ii aχ of any human action
ai are proposed, here, to be evaluated in two different decision spaces, named the
Personal Emotional (PES) and Interpersonal Emotional (IES) decision Spaces,
respectively. On the one hand, PES is devoted to recognize personal necessities
PESη and motivations PESϑ , as well as to evaluate the expected personal rewards
( )iPESi aλ and costs ( )i
PESi aχ in implementing ai . On the other hand, IES is devoted
to recognize interpersonal IESη and motivations IESϑ , as well as to evaluate the
expected social rewards ( )iIESi aλ and costs ( )i
IESi aχ in implementing ai .
Conflict may arise from such different evaluations and it may turn decision
making difficult. Moral judgment in case of social dillemma (Greene et al
2001,2004), is an example of this type of hard decision-making. Let be their
examples:
The trolley dilemma : ( 1P ) A runaway trolley is headed for five people who will be
killed if it proceeds in its present course. ( 2P ) The only way to save them is to hit a
switch that will turn the trolley onto an alternate set of tracks where it will kill one
person instead of five. (Q) Is it appropriate to switch tracks?
The foot bridge dilemma : ( 1P ) As before, the trolley will kill five people ( 2P )
unless you push a stranger to be killed and stop the trolley in order to save the five
other people. (Q ) Is it appropriate to push the stranger?
Such dilemmas have the following structure:
- a proposition 1P introduces a social necessity IESη triggering a motivation
IESϑ for a social utilitarian action ai with defined rewards ( )iIESi aλ and costs

( )iIESi aχ . Another proposition 2P describes how ai may be implemented in
PES, and it defines the personal reward ( )iPESi aλ and cost ( )i
PESi aχ of
implementing ai . Finally, the question Q asks for a decision about the
adequateness of ai to satisfy IESη introduced by 1P .
The trolley dilemma is proposed to be an impersonal dilemma (ID) because
2P proposes an action that is “edited” by the decision maker, whereas the foot
bridge dilemma is classified as a personal dilemma (PD) because 2P action must
be “authored” by the decision maker. PD is proposed to involve personal moral
violations that make decision a hard task (Greene et al 2001,2004). As a matter of
fact, ID and PD dilemmas differ on the amount of the risk ( )iPESi aχ calculated in
PES: ( ) ( )PDiPESiIDi
PESi aa χχ < , where ( )IDi
PESi aχ is the calculated risk for the
proposed action ai in the case of ID and ( )PDiPESi aχ is the calculated risk for the
proposed action ai in the case of PD. The personal risk for switching tracks is
certainly smaller than that of pushing a stranger from the footbridge.
We have used (Foz et al, 2001; Rocha et al, 2004, Rocha, Massad and
Pereira Jr. 2004) the correlation entropy (h(c i)) as a measure of the EEG activity
associated to a given cognitive task. Briefly, the EEG is recorded while the subject
is solving the task, e.g. the dilemma judgment. The correlation r i,j between the EEG
activity recorded by the electrodes ei,ej is calculated for all the 20 electrodes of the
10/20 system and for the relevant task epochs, e.g. the EGG epochs R1, R2 and R3
associated to 1P , 2P and Q reading, respectively. In the sequence, h(c i) is
calculated for each ei taking into account the 19 calculated values of r i,j.
Regression analysis is used to correlate h(c i) either decision making or decision
time and h(c i). This technique is very portable and provides useful information
about the dynamics of the neural circuits involved in task solving. Contrary to fMRI,
EEG mapping has the temporal resolution

In the present paper, we assumed that:
1) decision making in moral judgment of those dilemma used by Greene et al,
(2001,2004) may be formalized by means of the model described in the next
section;
2) the comparison of experimental and simulated results may be used to check
the validity of our model and
3) the entropy h(c i) measures how much the EEG activity is related with the
decision making in moral judgment and that its analysis may also contribute
to test the hypothesis introduced here.
The Model
Let the expected reward ( )ii aλ and calculated cost ( )ii aχ at time t to be
dependent on both an assessment function and a discounting function. The
assessment function augments ( )ii aλ or ( )ii aχ as decision is delayed and the
discounting function ( )ii aλ or ( )ii aχ decreases as the expected outcome is delayed.
For instance, if food is need and eating is delayed then hunger and starve augment.
Also, because reward and risk involve different evaluations (e.g., Kahneman and
Tversky, 1991; Kuhnen and Knutson, 2005; Preuschoff, Bossaerts and Quartz,
2006; Tversky and Kanheman, 1992) it is proposed here that ( )ii aλ and ( )ii aχ are
modeled by different assessment and discounting functions. Finally, because
Preuschoff, Bossaerts and Quartz (2006) found activation related to risk to be
delayed in relation to activation related to expected reward, here, ( )ii aλ and ( )ii aχ
assessments are modeled by different types of functions: ( )ii aχ assessment
function is similar to that proposed by PT (e.g., Trepel, Fox and Poldrack, 2005))
and includes a scaling factor accounting for the above temporal differences in
activations. Thus:

tkaaa i
t
iit 2
1
1
)( δβλκ
= (4)
( ) 44
43
)( κκ
κ
θγ
χtt
tt
i
i
i
a
tka
a −+= (5)
where:
a) t
ia
1
1
κβ is a function that models the benefit assessment;
b) tkai
2δ formalizes benefit discounting;
c) ( )ττ
τ
ϕ tt
t
ia − models the cost assessment;
d) tkai
3γ formalizes cost discounting;
e) )4,3,2,1( =iiκ are constants and
f) iaθ is a scaling parameter.
The values of the parameter iaβ ,
iaδ , iaγ and
iaθ are dependent on each specific
ia , or in other words, each action ia is specified by its set of parametersiaβ ,
iaδ ,
iaγ and iaθ . These parameters are called here the beliefs about ia . Also, the
constants iκ will be said to quantify the motivation ϑ , such that ϑ augments
asη increases, and the values of iκ increase as ϑ augments.
LeDoux (1996) proposed the existence of two different circuits for risk
assessment. The first and more primitive one involves the amigdala and it is in
charge of a very quick evaluation of any possible threat. The second and
evolutionary recent one involves the insular cortex and it modulates the action of
the first system.. Because of this, the reward and risk assessment functions are
different. The reward assessment function is concave, while the risk assessment
function has an inflection point marking the transition from a predominantly limbic
to a predominantly cortical risk evaluation.
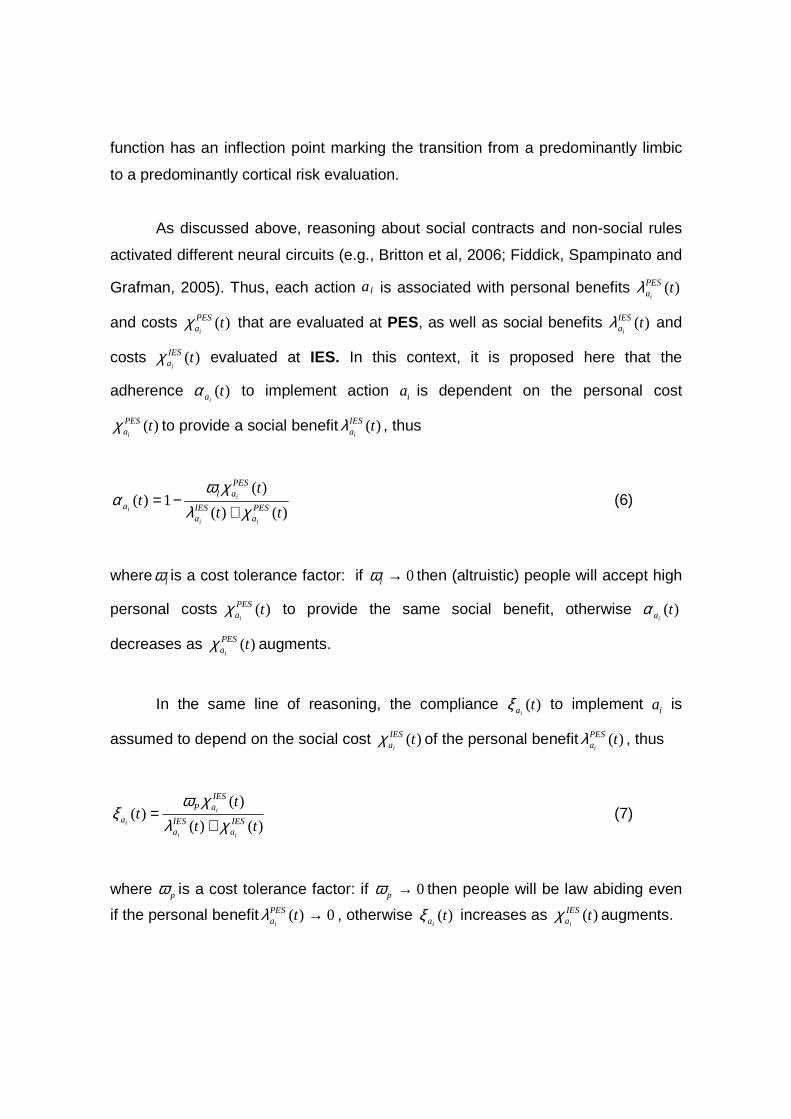
As discussed above, reasoning about social contracts and non-social rules
activated different neural circuits (e.g., Britton et al, 2006; Fiddick, Spampinato and
Grafman, 2005). Thus, each action ai is associated with personal benefits )(tPESai
λ
and costs )(tPESai
χ that are evaluated at PES, as well as social benefits )(tIESai
λ and
costs )(tIESai
χ evaluated at IES. In this context, it is proposed here that the
adherence )(tiaα to implement action ia is dependent on the personal cost
)(tPESai
χ to provide a social benefit )(tIESai
λ , thus
)()(
)(1)(
tt
tt
PESa
IESa
PESal
a
ii
i
i χλχω
α+
−= (6)
where lω is a cost tolerance factor: if 0→lω then (altruistic) people will accept high
personal costs )(tPESai
χ to provide the same social benefit, otherwise )(tiaα
decreases as )(tPESai
χ augments.
In the same line of reasoning, the compliance )(tiaξ to implement ia is
assumed to depend on the social cost )(tIESai
χ of the personal benefit )(tPESai
λ , thus
)()(
)()(
tt
tt
IESa
IESa
IESaP
a
ii
i
i χλχω
ξ+
= (7)
where pω is a cost tolerance factor: if 0→pω then people will be law abiding even
if the personal benefit 0)( →tPESai
λ , otherwise )(tiaξ increases as )(tIES
aiχ augments.
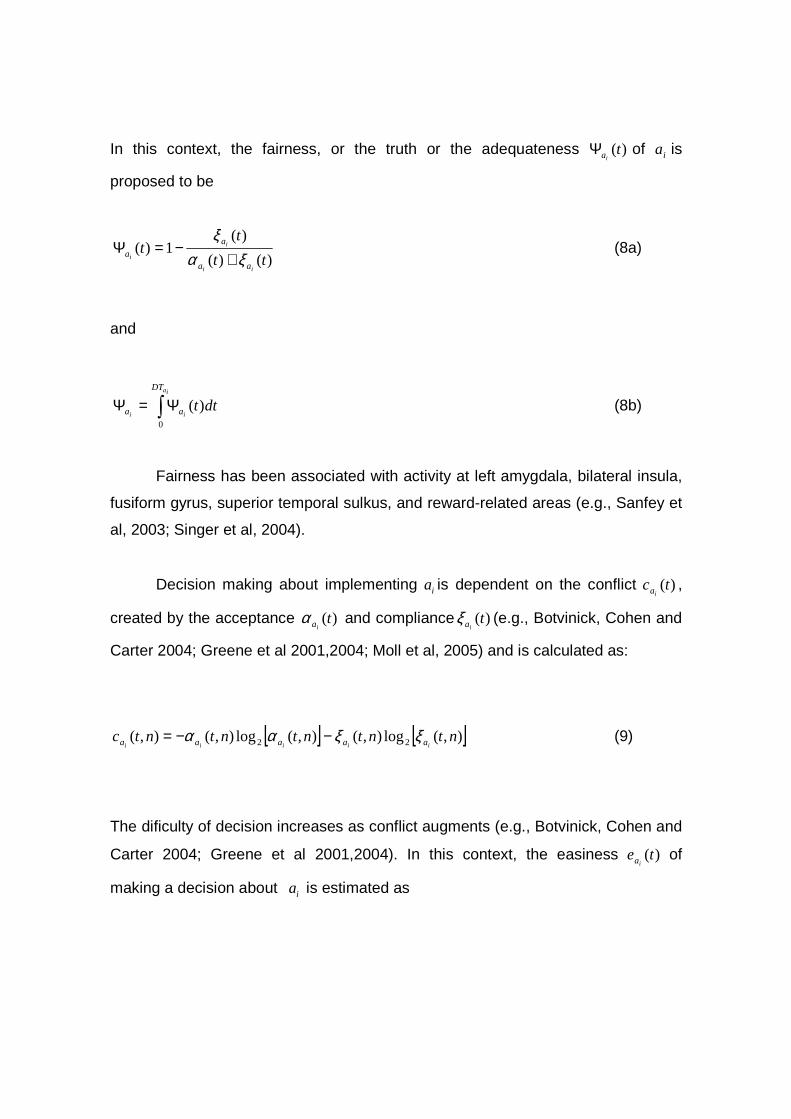
In this context, the fairness, or the truth or the adequateness )(tiaΨ of ia is
proposed to be
)()(
)(1)(
tt
tt
ii
i
i
aa
a
a ξαξ
+−=Ψ (8a)
and
∫Ψ=Ψia
ii
DT
aa dtt0
)( (8b)
Fairness has been associated with activity at left amygdala, bilateral insula,
fusiform gyrus, superior temporal sulkus, and reward-related areas (e.g., Sanfey et
al, 2003; Singer et al, 2004).
Decision making about implementing ia is dependent on the conflict )(tcia ,
created by the acceptance )(tiaα and compliance )(t
iaξ (e.g., Botvinick, Cohen and
Carter 2004; Greene et al 2001,2004; Moll et al, 2005) and is calculated as:
[ ] [ ]),(log),(),(log),(),( 22 ntntntntntciiiii aaaaa ξξαα −−= (9)
The dificulty of decision increases as conflict augments (e.g., Botvinick, Cohen and
Carter 2004; Greene et al 2001,2004). In this context, the easiness )(teia of
making a decision about ia is estimated as
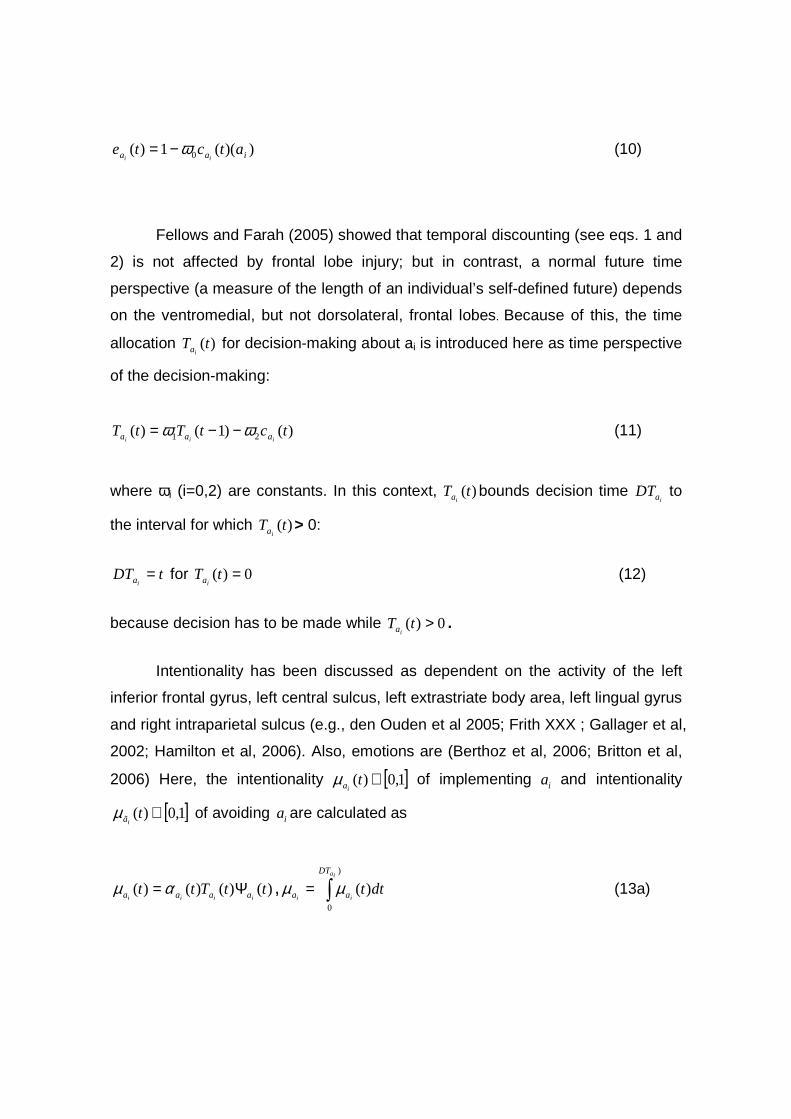
))((1)( 0 iaa atcteii
ω−= (10)
Fellows and Farah (2005) showed that temporal discounting (see eqs. 1 and
2) is not affected by frontal lobe injury; but in contrast, a normal future time
perspective (a measure of the length of an individual’s self-defined future) depends
on the ventromedial, but not dorsolateral, frontal lobes. Because of this, the time
allocation )(tTia for decision-making about ai is introduced here as time perspective
of the decision-making:
)()1()( 21 tctTtTiii aaa ωω −−= (11)
where ωi (i=0,2) are constants. In this context, )(tTia bounds decision time
iaDT to
the interval for which )(tTia > 0:
tDTia = for 0)( =tT
ia (12)
because decision has to be made while 0)( >tTia .
Intentionality has been discussed as dependent on the activity of the left
inferior frontal gyrus, left central sulcus, left extrastriate body area, left lingual gyrus
and right intraparietal sulcus (e.g., den Ouden et al 2005; Frith XXX ; Gallager et al,
2002; Hamilton et al, 2006). Also, emotions are (Berthoz et al, 2006; Britton et al,
2006) Here, the intentionality [ ]1,0)( ∈tiaµ of implementing ia and intentionality
[ ]1,0)( ∈tiãµ of avoiding ia are calculated as
)()()()( ttTttiiii aaaa Ψ= αµ , ∫=
)
0
)(ia
ii
DT
aa dttµµ (13a)

)(
)()()(
t
tTtt
i
ii
i
a
aa
ã Ψ=
ξµ , ∫=
ia
ii
DT
ãã dtt0
)(µµ (13b)
The activity in the inferior frontal cortex and parietal areas have being
correlated with desirability or stimulus salience and the decision about probabilistic
choices (e.g., Dorris and Glimcher, 2004, Glimcher, 2003 and Huettel, Song and
McCarthy, 2005). In this context, the probabilities )(tpia of implementing ia , and
)(tpiã of avoiding ia are proposed to be calculated as
)()(
)()(
tt
ttp
ii
i
i
ãa
a
a µµµ
+= , ∫=
ia
ii
DT
aa dttpp0
)( (14a)
and
)()(
)()(
tt
ttp
ii
i
i
ãa
ã
ã µµµ
+= , ∫=
ia
ii
DT
ãã dttpp0
)( (14b)
2. Methods
2.1. EEG measurements
10 female and 10 male adults (mean age 27y 3 mo) volunteered for solving
30 dilemmas previously used by Greene et al (2204) while his/her EEG was
registered with 20 electrodes placed according to the 10/20 system; impedance
smaller than 10 Kohm ; notch filter 50Hz; sampling rate of 256 Hz and 10 bits
resolution. The dilemmas were translated to Portuguese by one of the authors,
having a degree on Linguistics.
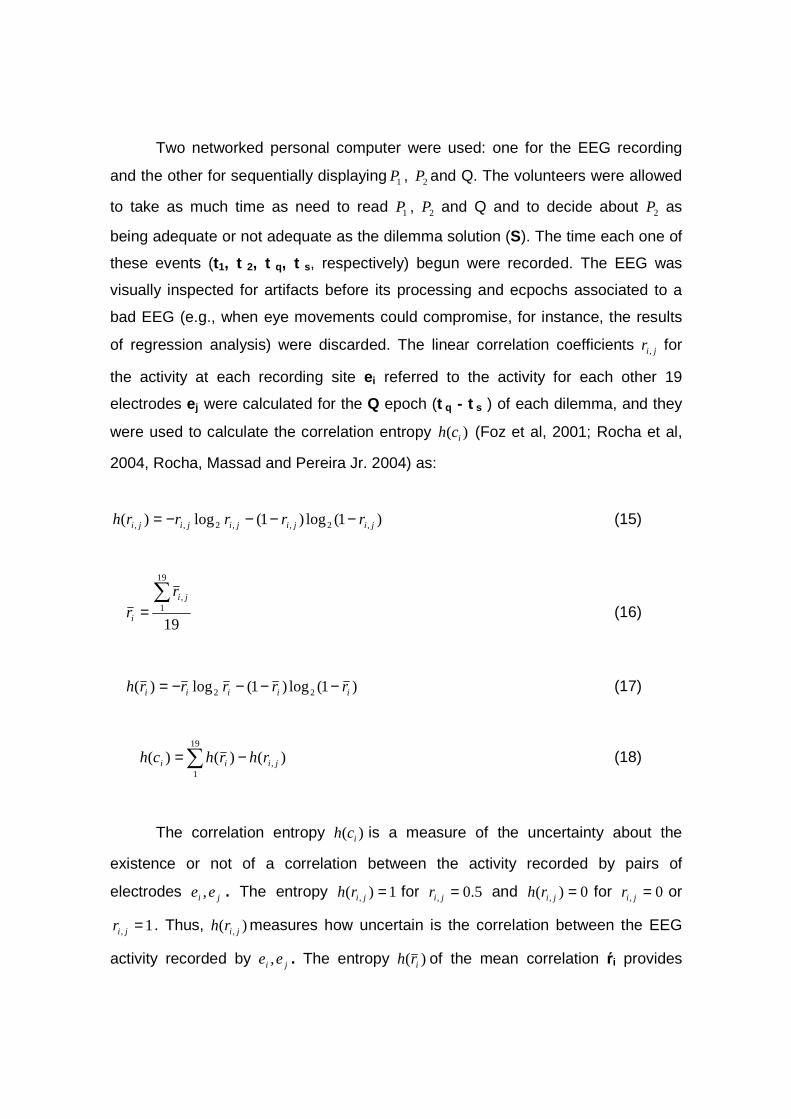
Two networked personal computer were used: one for the EEG recording
and the other for sequentially displaying 1P , 2P and Q. The volunteers were allowed
to take as much time as need to read 1P , 2P and Q and to decide about 2P as
being adequate or not adequate as the dilemma solution (S). The time each one of
these events (t1, t 2, t q, t s, respectively) begun were recorded. The EEG was
visually inspected for artifacts before its processing and ecpochs associated to a
bad EEG (e.g., when eye movements could compromise, for instance, the results
of regression analysis) were discarded. The linear correlation coefficients jir , for
the activity at each recording site ei referred to the activity for each other 19
electrodes ej were calculated for the Q epoch (t q - t s ) of each dilemma, and they
were used to calculate the correlation entropy )( ich (Foz et al, 2001; Rocha et al,
2004, Rocha, Massad and Pereira Jr. 2004) as:
)1(log)1(log)( ,2,,2,, jijijijiji rrrrrh −−−−= ��� (15)
�19
19
1,∑
=ji
i
rr ���� (16)
�
� )1(log)1(log)( 22 iiiii rrrrrh −−−−= ��� (17)
�� ∑ −=19
1, )()()( jiii rhrhch ���� (18)
������
The correlation entropy )( ich is a measure of the uncertainty about the
existence or not of a correlation between the activity recorded by pairs of
electrodes ji ee , . The entropy 1)( , =jirh for 5.0, =jir and 0)( , =jirh for 0, =jir or
1, =jir . Thus, )( , jirh measures how uncertain is the correlation between the EEG
activity recorded by ji ee , . The entropy )( irh of the mean correlation ŕi provides
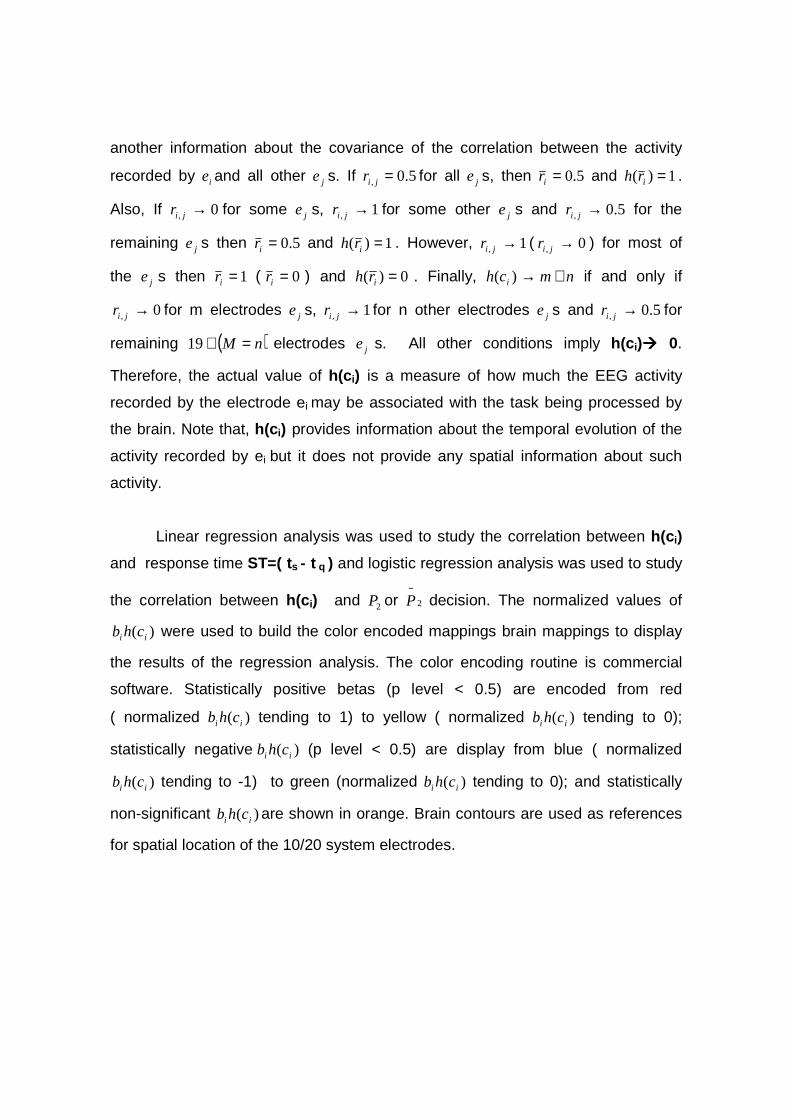
another information about the covariance of the correlation between the activity
recorded by ie and all other je s. If 5.0, =jir for all je s, then 5.0=ir and 1)( =irh .
Also, If 0, →jir for some je s, 1, →jir for some other je s and 5.0, →jir for the
remaining je s then 5.0=ir and 1)( =irh . However, 1, →jir ( 0, →jir ) for most of
the je s then 1=ir ( 0=ir ) and 0)( =irh . Finally, nmch i +→)( if and only if
0, →jir for m electrodes je s, 1, →jir for n other electrodes je s and 5.0, →jir for
remaining ( )nM =+19 electrodes je s. All other conditions imply h(c i)���� 0.
Therefore, the actual value of h(c i) is a measure of how much the EEG activity
recorded by the electrode ei may be associated with the task being processed by
the brain. Note that, h(c i) provides information about the temporal evolution of the
activity recorded by ei but it does not provide any spatial information about such
activity.
Linear regression analysis was used to study the correlation between h(c i)
and response time ST=( ts - t q ) and logistic regression analysis was used to study
the correlation between h(c i) and 2P or 2
−P decision. The normalized values of
)( ii chb were used to build the color encoded mappings brain mappings to display
the results of the regression analysis. The color encoding routine is commercial
software. Statistically positive betas (p level < 0.5) are encoded from red
( normalized )( ii chb tending to 1) to yellow ( normalized )( ii chb tending to 0);
statistically negative )( ii chb (p level < 0.5) are display from blue ( normalized
)( ii chb tending to -1) to green (normalized )( ii chb tending to 0); and statistically
non-significant )( ii chb are shown in orange. Brain contours are used as references
for spatial location of the 10/20 system electrodes.

2.2. Simulations
Simulations were performed by calculating equations 1 to 11 with time step
of 1 second, during 20 seconds, using the parameters as in table 1 to obtain the
theoretical )(tpia distribution for ID and PD dilemma, as well as to theoretically
estimate the probabilities iap and
iãp of accepting or not 2P as an adequate
solution for 1P . Parameters in equation 5 were adjusted to result into:
1. )()( tt IESa
PESa ii
χχ > for both ID and PD and
2. )(tPESai
χ for both ID smaller than f )(tPESai
χ for PD
Parameters in equation 4 (see Table I) were adjusted to result into:
3. )()( tt PESa
IESa ii
λλ > for both ID and PD and
4. )(tPESai
λ for both PD smaller than f )(tPESai
λ for PD.
Table I – Parameters used to simulate data of Figur e 1
ID PD PES IES PES IES k1 0,06 k1 0,08 k1 0,02 k1 0,08 k2 0,2 k2 0,1 k2 0,4 k2 0,1 β 0,2 β 0,7 β 0,5 β 0,7 δ 0,7 δ 0,45 δ 0,9 δ 0,45 k3 0,3 k3 0,4 k3 0,3 k3 0,4 γ 0,7 γ 0,6 γ 0,9 γ 0,6 τ 2 τ 2 τ 2 τ 2 ϕ 9 ϕ 14 ϕ 10 ϕ 14

A wide range of values of the parameters in equations 4 and 5 are able to
adjust the experimental and theoretical ST distributions (as in fig. 1). However, the
values of iap and
iãp varied for each of these simulations. The parameters in table I
are those that adjusted the theoretical and the experimental iap s, for both ID and
PD.
3. Results
3.1 Experimental and Theoretical Data
Despite the fact that the mean ST was statistically the same for both ID and
PD, the maximum STs were greater for PD than for ID (Fig. 1C). The mean ST
was 8.19s for 2P selections and it was statically different from the mean ST value
of 5.16 s for 2
−P responses. Although ST varied considerably considering dilemma
and volunteer, 90% of all decisions were made in the first 12 seconds. The ID
values of p( 2P ) and p( 2
−P ) were 0.36 and 0.64, respectively. The p( 2
−P ) values
were p( 2P ) = 0.30 and p( 2
−P )= 0.70. There was no statistical difference between
the ID and PD values.

Fig. 1 – Experimental and theoretical data. In A, s imulations of equation 3 for
PES and IES. In B, first and third graphs, simulati ons of equations 8-10;
second and fourth graphs, simulations of equations 4, 5 and 7. In C, ps
simulation of equation 11 and pe experimental data.
The experimental ST dynamics was used to set parameters k1,k2 ,k3 and ϕϕϕϕ
(table 1) for the simulations illustrated in Figure 1. A good agreement between
theoretical (ps) and experimental (pe) decision time distribution was obtained for
both ID and PD (Fig. 1C). The only difference between these two simulations was
that the risk calculated in PES for ID (rPES(ai)ID) was smaller than the risk
(rPES(ai)PD) calculated of PD (Fig. 1A). Thus, as hypothesized rPES(ai)ID < rPES(ai)PD.
These conditions imposed different time courses for )( 2Ptα and )( 2Ptξ associated
with ID and PD that resulted into different ST distributions. The adherence
)( 2Ptα to 2P was smaller than the compliance )( 2Ptξ for both ID and PD. The
adherence )( 2Ptα to 2P in the case of ID was greater than that for PD, whereas the
compliance )( 2Ptξ of 2P in the case of ID was smaller than that for PD (Fig.1B).
The consequences were that theoretically p( 2P ) < p( 2
−P ) for both ID and PD, and
that p( 2
−P ) obtained for PD was greater than that calculated for ID. As a matter of
fact the theoretical and experimental values of p( 2P ) and p( 2
−P ) were similar for
both types of dilemma.
3.2 Brain Mappings
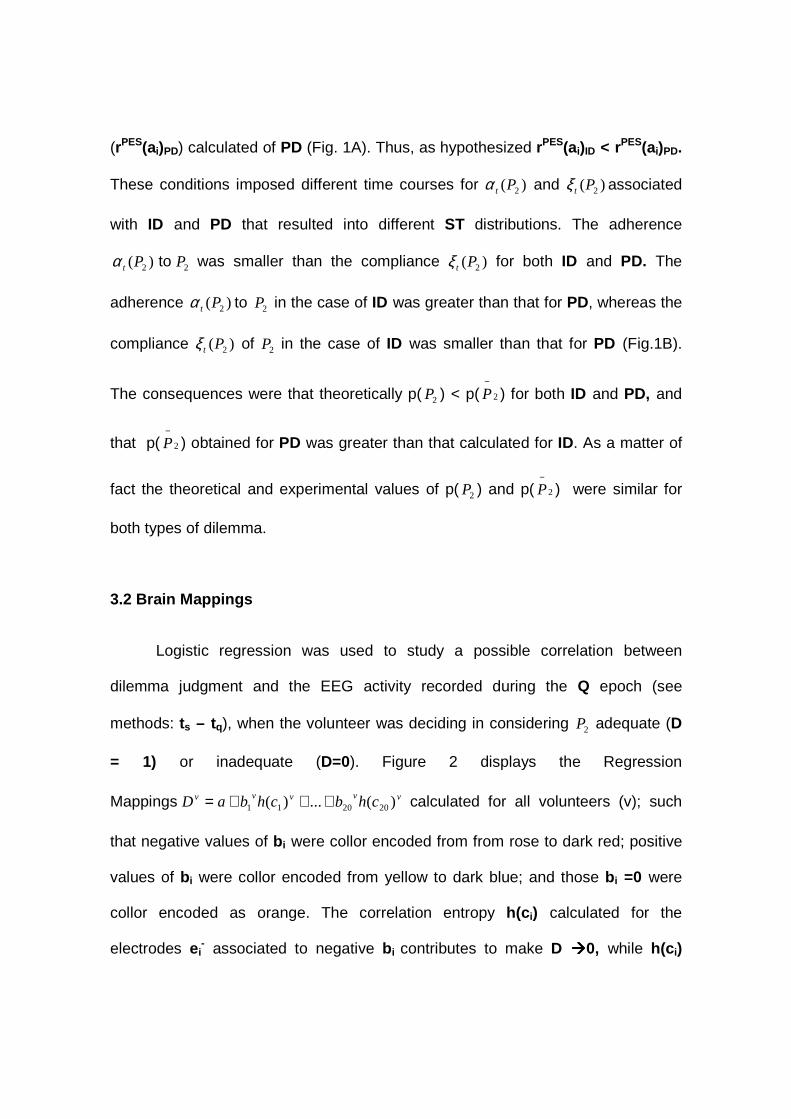
Logistic regression was used to study a possible correlation between
dilemma judgment and the EEG activity recorded during the Q epoch (see
methods: ts – tq), when the volunteer was deciding in considering 2P adequate (D
= 1) or inadequate (D=0). Figure 2 displays the Regression
Mappings vvvvv chbchbaD )(...)( 202011 +++= calculated for all volunteers (v); such
that negative values of b i were collor encoded from from rose to dark red; positive
values of b i were collor encoded from yellow to dark blue; and those b i =0 were
collor encoded as orange. The correlation entropy h(c i) calculated for the
electrodes ei- associated to negative b i contributes to make D ����0, while h(c i)
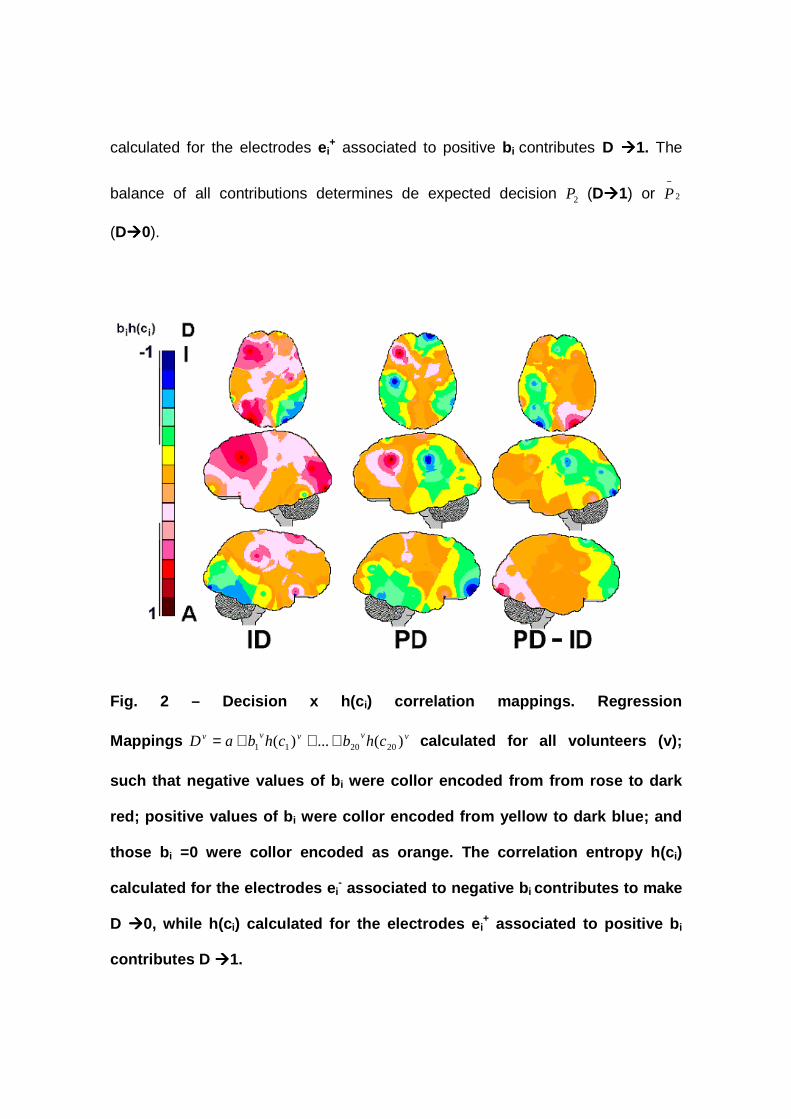
calculated for the electrodes ei+ associated to positive b i contributes D ����1. The
balance of all contributions determines de expected decision 2P (D����1) or 2
−P
(D����0).
Fig. 2 – Decision x h(c i) correlation mappings. Regression
Mappings vvvvv chbchbaD )(...)( 202011 +++= calculated for all volunteers (v);
such that negative values of b i were collor encoded from from rose to dark
red; positive values of b i were collor encoded from yellow to dark blue; and
those b i =0 were collor encoded as orange. The correlation entropy h(c i)
calculated for the electrodes e i- associated to negative b i contributes to make
D ����0, while h(c i) calculated for the electrodes e i+ associated to positive b i
contributes D ����1.
It is noteworthy to observe that the EEG activity recorded at the left
hemisphere mostly contributed for considering 2P adequate (D=1) in the case of ID
whereas the right posterior brain was more involved in considering 2P inadequate
(D=0) (Figure 2ID). As a matter of fact, h(c i) calculated for FZ, F3; F7; C4; F8, P3
and O1 (called here 2P electrodes) contributed for D=1 whereas h(c i) calculated for
T6, P4 and O2 (called here 2
−P electrodes) contributed for D=0. D=1 in the PD case
is also dependent on the same anterior areas influencing ID decision in both
hemisphere, besides depending on CZ and PZ but not on P3 and O1. 2P
innadequacy (D=0) for PD is associated with FP2, FZ, C3, P4 and T6. In Figure 2,
the mappings labelled PD-ID were calculated for b iPDh(c i)
PD- b iIDh(c i)
ID, where
b iPDh(c i)
PD are values obtained for the electrode ei in the case of PD and b i
IDh(c i) ID
those values calculated for ID. This difference mapping shows that h(c i) calculated
for FP2, FZ, C3, P3 and O1 contributed for 2P being considered more inadequate
in the PD case than in the ID case. In the same line of reasoning, P4 and O2
influenced D=0 more in in the ID case than in the PD case.
Linear regression was used to study a possible correlation between the time
required to understand and to solve the dilemma (see methods: ts – t1) judgment
and the EEG activity recorded during the Q epoch. Figure 3 displays the
Regression Mappings vvvvv chbchbaST )(...)( 202011 +++= calculated for all
volunteers (v), ); such that negative values of b i were collor encoded from rose to
dark red; positive values of b i were collor encoded from yellow to dark blue; and
those b i =0 were collor encoded as orange. The correlation entropy h(c i) calculated

for the electrodes ei- associated to negative b i contributes to decrease ST, while
h(c i) calculated for the electrodes ei+ associated to positive b i contributes to
increase ST. The balance of all contributions determines the actual ST.
Fig. 3 – Decision time x h(c i) correlation mappings. Regression Mappings
vvvvv chbchbaST )(...)( 202011 +++= calculated for all volunteers (v), ); such that
negative values of b i were collor encoded from rose to dark red; positi ve
values of b i were collor encoded from yellow to dark blue; and those b i =0
were collor encoded as orange. The correlation entr opy h(c i) calculated for
the electrodes e i- associated to negative b i contributes to decrease ST, while
h(c i) calculated for the electrodes e i+ associated to positive b i contributes to
increase ST. The balance of all contributions deter mines the actual ST.

It is noteworthy to observe that practically the same areas contributed to
decrease (rose/red electrodes in Figure 3) or to increase (green/blue electrodes in
Figure 3) in the case of both ID and PD. Also, the comparison of Figures 2 and 3,
shows that the electrodes influencing the actual value of ST are also involved in
deciding about 2P being adequate or not. The PD-ID mapping, however, shows
that most of the electrodes contributed to increase ST if PD is compared to ID.
3. Discussion
3.1. The experimental and theoretical data
The experimental and simulated results presented here seem to validate our
theoretical model described by eqs. 1 to 11 and they support the model as an
adequate tool to formalized decision-making in the case of dilemma judgment.
Also, probabilities p( 2P ) or p( 2
−P ) of 2P being selected as adequate or inadequate
by our volunteers and their ST distributions were very similar to those reported by
Greene et al [14] as we were able to statistically compare the two set of results,
(those authors kindly provided us a copy of their data for such a purpose). Also,
our model fits their data very well, using the same assumption used to simulate our
data that PD and ID differ from each other by the amount of the calculated risk in
IES, that is r IES( 2
−P )ID < r IES( 2
−P )PD.
According to our model, this results in compliance )( 2Ptξ higher for PD than
for ID and adherence )( 2Ptα smaller for PD than for ID. Since the compliance )( 2Ptξ
measures the aversion in implementing 2P , then it may be concluded, in
accordance with Greene et al [14], that the amount of PD personal moral violation
is greater than that of ID. Our definition of conflict resulted in PDID PcPc )()( 22 >
because PD
PD
ID
ID
P
P
P
P
)(
)(
)(
)(
2
2
2
2
ξα
ξα
> . In our formulation, high conflict reduces decision time.
This is in accordance with the fact that Stmax is greater in PD than in ID, for both
theoretical (figure 1B) and experimental (figure 1C) data, but it disagrees with
Greene’s et al [14] proposal that conflict is associated with the difficulty imposed by
personal moral violation in the case of PD and so it increases ST. The increased
ACC activity disclosed by those authors associated with difficult PD decisions is
explained here by the increase of PDt P )( 2ξ instead of their proposal of the
augmentation of PDPc )( 2 .
3.2. EEG recording
Despite the claims about the EEG spatial discrimination limitations, the
patterns of brain activity we recorded may be imputed to the enrollment of a large
number of neurons widely distributed in the brain in the task of dilemma solving.
This is because both the logistic ( vvvvv chbchbaD )(...)( 202011 +++= ) and the linear
regression ( vvvvv chbchbaST )(...)( 202011 +++= ) mappings were statistically
significant (p<0.001) explaining around 30% and 20% of data variance,
respectively. The type of dilemma considered influenced these correlations.
Dilemma solution required, therefore, a complex enrollment of neurons in different
parts of the brain, as proposed by other authors [14], [19-21] and in agreement with
our model, which implies that the probabilities of considering 2P adequate (p( 2P )) or
inadequate (p( 2
−P )) are dependent (eq.11) on )( 2PTt , )( 2Put , )( 2Ptα and )( 2Ptξ .
Let be assumed here that the activity recorded by the anterior 2P electrodes
FZ, F3; F7; C4; CZ and F8 is associated with the calculations of )( 2PTt and
)( 2Put that are the same for computing both p( 2P ) and p( 2
−P ). In addition, let be
proposed that the activity recorded by the other posterior 2P electrodes is
associated with the calculations of )( 2Ptα . Finally, let be considered that the 2
−P
electrodes recorded the activity associated with the calculations of )( 2Ptξ . These
assumptions would explain the ID and PD mapping differences on Fig. 2-ID and
PD. These propositions may also be in agreement with Greene et al, [13-14], who
found that areas BA 9/10 (medial frontal girus), BA 31 (posterior cingulated gyrus)
and BA 39 (angular gyrus) are more active in PD judgment than in ID decision. In
addition, these authors showed that BA 46 (middle frontal gyrus, bilateral) and BA
7/40 (parietal lobe, bilateral) are less active in PD than in ID judgment.
The left hemisphere seems to contribute for p( 2
−P ) more in the case of PD
than in the case of ID, whereas the left hemisphere seems to influence both p( 2P )
in the same way (Fig. 2, PD-ID). Here we proposed that PD is distinguished from
ID because r IES( 2
−P )PD > r IES( 2
−P )ID. We may interpret these findings by proposing
that the left hemisphere is much more involved in calculating r IES( 2
−P ) than the right
hemisphere. In addition, we may also assume that the right hemisphere is much
more involved in calculating rPES( 2
−P ) than the left brain. Such propositions are
supported by the literature showing that the left brain is much more involved in the
cognition about the self and the right hemisphere is much more related with the
social cognition [2], [4], [15], [16], [29].
ST distribution was very similar PD and ID, the main differences being
quantitative rather than qualitative. In addition, the PD-ID mapping in figure 3
shows that PD decision is most delayed by the right hemisphere and FP7
electrodes. This points to a very complex neural processing of dilemma judgment,
similar to that disclosed by Greene et al [13-14]. Because of the similar behavior on
dilemma judgment of the US and the Brazilian volunteers, we may propose that our
regression mappings are associated with the activity of the same set of neurons
identified in the fMRI study [13-14], although we cannot claim for any specific
correlation between any recording electrode ei and any specific set of fMRI
identified neurons.

3.3. Conclusion
Glimcher [9] questions the classical Cartesian-Sherringtonian approach of
neurosciences:
1) identify a simple behavior;
2) determine a priori the minimal set of neurobiological components that could
account for that behavior;
3) look for evidence that those components exist, and
4) localize them.
The fundamental inadequacy of such an approach is the failure to get the real
understanding of any complex system in handling complex tasks, like the brain in
complex decision-making. Neuroeconomics modeling is an important step in this
direction, because it deals with the dynamics of the complex interactions between
a large number of widely distributed neurons that enroll to solve a complex task,
instead of just the identifying and localizing of some of these neurons. The present
results disclose a complex association of the EEG activity recorded by widely
distributed electrodes that support a probabilistic model of decision-making.
Glimcher’s thesis requires probability theory to be incorporate into the approaches
used to understand the brain.
Although neuroeconomics is in its early stages [8-10], [23], and much have
to be done to make its models about decision-making broadly predictive as well as
explanatory [9], we believe that the present paper represents an important
contribution in that direction.
References:
Ainslie and J. Moterosso (2004) A maketplace in the brain?, Science, 306:421-423
Allison, , A. Puce and G. McCarthy (2000) Social perception from visual cues: role
of the STS region, Trends in Cognitive Sciences, 4: 267-278
Berridge, K. C. (2003) Pleasures of the brain. Brain and Cognition, 52:106-128
Berthoz, S., J. Grèzes, J.L. Armony, R.E. Passingham and R.J. Dolan (2006)
Affective response to one's own moral violations NeuroImage, 31:945-950
Botvinick, M. M., J. D. Cohen and C. S. Carter (2004) Conflict monitoring and
anterior cingulate cortex: and update. Trends in Cog. Scie., 2044:529-546;
Brady, N. M. Campbell and M. Flaherty (2004) My left brain and me: a dissociation
in the perception of self and others. Neuropsychologia, 42:1156-1161
Britton, J. C, K. Luan Phan, S. F. Taylor, R. C. Welsh, K.C. Berridge and I.
Liberzon (2006) Neural correlates of social and nonsocial emotions: An fMRI study.
NeuroImage, 31:397-409
Dorris, M. C. and P. W. Glimcher *2004) Activity in posterior parietal cortex is
correlated with the relative subjective desirability of action. (Neuron, 44:3650378
Fehr, E. and B. Rockenbach (2004) Human altruism: economic, neural and
evolutionary perspectives. Current Opinion Neurobil, 14:784-790
Fellow, L. K. and M. J. Farah (2005) Dissociable elements of human foresight: a
role for the ventromedial frontal lobes in framing the future, but not in discouting
future rewards. Neuropshychologia, 43:1214-1221
Fiddick, L. M. Vittoria Spampinato and J. Grafman (2005) Social contracts and
precautions activate different neurological systems: An fMRI investigation of
deontic reasoning NeuroImage, 28: 778-786
Foz, F. B., Luchini; Palmeri, S., Rocha, A. F., Rodela. E. C.; Rondó, A. G.,
Cardoso, M. B. Ramazzini, P. B.; Leite, C. C. (2001) Language Plasticity Revealed
by EEG Mapping. Pediatric Neurology, 26:106-115
Gallagher, H. L., A. I. Jack, A. Roepstorff and C. D. Frith (2002) Imaging the
intentional stance in a competitive game. NeuroImage 16:814-821;
Glimcher, P.W. (2003) Decision, Uncertainty and the Brain (A Bradford Book, The
MIT Pres, Cambridge, Massachusetts).
Graeff, F. (2003) Serotonin, the periaqueductal gray and panic. Neuroscie. and
Biobehav. Rev. 28: 239-259 (2003).
Gray. J. A. and N. McNaughton. The neuropsychology of anxiety: an enquiry into
the functions of the septo-hippocampal system (2nd ed.). Oxford University Press.
Oxford (2000).
Greene, J. D., R. B. Sommerville, L. E. Nystrom, J. M. Darley and J. D. Cohen
(2001) An fMRI investigation of emotional engagement in moral judgment. Science,
293:2105-2108;

Greene, J. D., L. E. Nystrom, A D. Nystrom, A D. Engel, J. M. Darley and J. D.
Cohen (2004) The neural bases of cognitive conflict and control in moral
judgement. Neuron, 44:389-400
Frith, U. and C.D. Frith (2003) Development and neurophysiology of mentalizing. In
The Neuroscience of Social Cognition, Frith and Wolpert (Eds), Oxford University
Press, Oxford, pp. 45-76
Hamilton, A.F.C, D.l M. Wolpert, U. Frith and S. T. Grafton (2006) Where does your
own action influence your perception of another person's action in the brain?
NeuroImage, 29: 524-535
Huettel, S. A., A. W. Song and G. McCarthy (2005) Decisions under uncertainty:
Probabilistic context influences activation of prefrontal and parietal cortices. J.
Neuroscie. 25:3304-3311
Ishai, A., C. F. Schmidt and P. Boesiger (2005) Face perception is mediated by a
distributed cortical network. Brain REs. Bulletin, 67:87-93
Kahneman, D. and A. Tversky (1991) Loss aversion in kiskless choice: a
reference-dependet model. Q. J. Econ. 106:1039-1061
Kircher, T. T. J, C. Senior, M. L. Phillips, S. Rabe-Hesketh, P. J. Benson, E. T.
Bullmores, M. Brammer, A. Simmons, M. Bartels and A. S. David (2001)
Recognizin one´s won face. Cognition, 78:b1-b15
Knutson, B, G. w. Fong, S. M. Bennett, C. M. Adams and D. Hommer (2003) A
region of mesial prefrontal cortex tracks monetarily rewarding outcomes:
characterization with rapid event-related fMRI. NeuroImage, 18:263-272

Knutson, B, S. rick, G. E. wimmer, D. Prelec and G. Loewesnstein (2007) Neural
Predictors of Purchases. Neuron, 53:147-156
Kuhnen, C. M. and B. Knutoson (2005) The Neural Basis of Financial Risk Taking.
Neuron, 47:763-770
Ledoux, J. E. (1996) The emotional brain: The mysterious underpinning of emotial
life (Simon & Schuster, New York, 1996)
McClure, S. M., D. I. Laibson, G. Loweestein and J. D. Cohen (2004) Separate
neural systems value immediate and delayed monetary rewards. Science,
306:503-507
Moll, J.; P.J Eslinger, Paul and R. Oliveira-Souza Frontopolar and anterior
temporal cortex activation in a moral judgment task: preliminary functional MRI
results in normal subjects. Arq. Neuro-Psiquiatr., 59:657-664 (2001)
Moll, J. R. Oliveira-Souz, I. E. Bramati and J. Grafman Functional networks in
emotional moral and nonmoral social judgments. NeuroImage 16:696-703 (2002)
Moll, J. R. Zahn, r. Oliveira-Souza, F. rueger and J. Grafman The neural basis of
human moral cognition Nature Neuroscie. Rev. 6:799-809 (2005)
den Ouden, H.E.M., U. Frith, C. Frith and S.-J. Blakemore (2005) Thinking about
intentions NeuroImage, 28: 787-796
Panksepp, J. (1998) Affective Neuroscience: The foundations of human and animal
emotions. (Oxford University Press, Oxford)
Paulus, M. (2005) Neurobiology of decision-making: Qudo Vadis? Cog. Brain Res.
23:2-10 (2005).

Preuschoff, K, P. Bossaerts and Quartz, S. R. (2006) Neural differentiation of
expected reward and risk in human subcortical structures. Neuron, 51:381-390
Quervain, D. J-F, U. Fischbacher, V. Treyer, M. Schellhammer, U. Schnyder, A.
Buck and E. Fehr (2004) The neural basis of altruistic punishment. Science,
305;1254-1258
Rocha. F. T., A. F. Rocha, E. Massad and R. Menezes (2004) Brain mappings of
the arithmetic processing in children and adults. . Cognitive Brain Res. 22: 359-372
Rocha, A. F., Massad, E. and Pereira Jr., A. ( 2004 ) The Brain: From Fuzzy
Arithmetic to Quantum Computing. Springer Verlag, Heildelberg.
Rolls, E. T. (1999) The brain and emotion (Oxford University Press, Oxford)
Sanfey, A G., J. K. Rilling, J. A Aronson, L. E. Nystrom and J. D. Cohen (2003) The
neural basis of economic decision-making in the ultimatum game. Science,
200:1755-1758
Singer, T., S. J. Kiebel, J. S. Winston, R. J. Dolan and C. D. Frith (2004) Brain
Responses to the Acquired Moral Status of Faces. Neuron, 41;653-662
Stone, A. and T. Valentine (2005) Strength of visual percept generated by famous
faces perceived without awareness: Effects of affective valence, response latency
and visual diled. Cosnciousness and Cognition, 14: 548-564
Takahashi, L. K. (2001) Role of CRF1 and CRF2 receptors in fear and anxiety.
Neuroscie. and BioBehav. Reev. 25:627-636

Tobler, P. N., P. C. Flectcher, R. T. Bullmore and W. Schultz (2007) Learning-
related human brain activations reflecting individual finances. Neuron, 54:167-175
Trepel, C., C. R. Fox and R. A. Poldrack (2005) Prospect theory on the brain?
Toward a cognitive neuroscience of decision under risk. Cog. Brain Researc.,
23:34-50
Tversky, A. and D. Kahneman (1992) Advances in prospect theory cumulative
representation of uncertainty. J. Risk Uncertain. 5:297-323
Uvnas-Mober,K. (1998) Oxcitocin may mediate the benefits of positive social
interaction and emotions. Psychoneuroendocrinology 8:819-835
von Neumann, J. and O, Morgenstern, Theory of Games and Economic Behavior
(Princeton University Press, Princeton,1953);
Young, L. J. and Z. Wang (2004) The neurobiology of pair bonding. Nature
Neurosci. 10:1048-1054