Measurement of Circulating Desialylated Glycoproteins - NCBI

Examining Associations of Circulating Endotoxin withNutritional Status, Inflammation and Mortality in HemodialysisPatients
Usama Feroze, MD1,2, Kamyar Kalantar-Zadeh, MD, MPH, PhD1,2,3, Kevin A Sterling, MD4,Miklos Z. Molnar, MD; PhD1, Nazanin Noori, MD, PhD1, Debbie Benner, RD6, Vhalab Shah,PhD5, Rama Dwivedi, PhD4, Kenneth Becker, MD6, Csaba P Kovesdy, MD3, and Dominic SRaj, MD4
1Harold Simmons Center for Chronic Disease Research and Epidemiology2Division of Nephrology and Hypertension, Los Angeles Biomedical Research Institute at Harbor-UCLA Medical Center, Torrance, CA 905023David Geffen School of Medicine at UCLA and the UCLA School of Public Health, Los Angeles,CA4Division of Renal Diseases and Hypertension, George Washington University, Washington DC5Department of Biochemistry, University of New Mexico Health Sciences Center, Albuquerque,NM6Division of Endocrinology and Metabolism, George Washington University, Washington DC5George Washington University School of Medicine, North Washington, DC.
AbstractObjective—Lipopolysaccharide or endotoxin constitutes most part of the outer portion of the cellwall in the gram negative bacteria. Sub-clinical endotoxemia could contribute to increasedinflammation and mortality in hemodialysis patients. Endotoxin level and clinical effect aredetermined by its soluble receptor sCD14 and high density lipoprotein. We examine thehypothesis that endotoxin level correlates with mortality.
© 2011 The National Kidney Foundation, Inc. Published by Elsevier Inc. All rights reserved.
Correspondance/Reprint Request: Kamyar Kalantar-Zadeh, MD, MPH, PhD, Harold Simmons Center for Chronic DiseaseResearch and Epidemiology, Los Angeles Biomedical Research Institute at Harbor-UCLA Medical Center, 1124 West Carson Street,C1-Annex, Torrance, CA 90502, USA, Phone: 310-222-3891, Fax: 310-782-1837, [email protected], Dominic Raj, MD, GeorgeWashington University, 2121 I Street Northwest, Washington, DC, [email protected].
Publisher's Disclaimer: This is a PDF file of an unedited manuscript that has been accepted for publication. As a service to ourcustomers we are providing this early version of the manuscript. The manuscript will undergo copyediting, typesetting, and review ofthe resulting proof before it is published in its final citable form. Please note that during the production process errors may bediscovered which could affect the content, and all legal disclaimers that apply to the journal pertain.
This study was presented in part as an abstract during the annual meeting of the American Society of Nephrology, Oct 27–30, 2009,San Diego, CA.
Relevant Potential Conflict of InterestKKZ, CPK and/or JDK have received recent grants and/or honoraria from Genzyme, Inc, the manufacturer of Sevelamer (Renagel™and Renvela™) and doxercalciferol (Hectoral™), Abbott laboratories, the manufacturer of Paricalcitol (Zemplar™) and calcitriol(Calcijex™), Fresenius Medical Care, the distributor of calcilum acetate (PhosLo™), Shire Pharmaceuticals, the manufacturer oflanthanum carbonoate (Fosrenol™), and/or Amgen, Inc, the manufacturer of Cinacalcet hydrochloride (Sensipar™ or Mimpara™).
NIH Public AccessAuthor ManuscriptJ Ren Nutr. Author manuscript; available in PMC 2013 May 01.
Published in final edited form as:J Ren Nutr. 2012 May ; 22(3): 317–326. doi:10.1053/j.jrn.2011.05.004.
NIH
-PA Author Manuscript
NIH
-PA Author Manuscript
NIH
-PA Author Manuscript
Methods—In this cohort study, endotoxin levels were measured in 306 long-term hemodialysispatients who were then followed for up to 42 months. Soluble CD14 and cytokines levels werealso measured.
Results—The mean (±SD) endotoxin level was 2.31±3.10 EU/ml (min: 0.26 EU/ml, max: 22.94EU/ml, inter-quartile range: 1.33EU/ml, median: 1.27EU/ml). Endotoxin correlated with C-reactive protein (r = 0.11, p<0.04). On multivariate logistic regression analysis, high body massindex (BMI) and low HDL cholesterol levels were associated with higher endotoxinemia(endotoxin below or above of median). In multivariable Cox regression analysis adjusted for case-mix and nutritional/inflammatory confounders, endotoxin levels in the 3rd quartile vs. 1st quartilewas associated with a trend towards increased hazard ratio (HR) for death (HR 1.83, 95%confidence interval: 0.93–3.6, p=0.08).
Conclusions—In this hemodialysis cohort, we found associations between endotoxinemia andCRP, body composition and HDL. A moderately high endotoxin levels tended to correlate withincreased mortality than the highest circulating endotoxin level. Additional studies are required toasses the effect of endotoxemia on mortality in dialysis population.
KeywordsChronic Kidney Disease (CKD); hemodialysis; nutritional status; inflammation; endotoxin;cytokines
IntroductionEnd Stage Renal Disease (ESRD) patients have increased morbidity and mortality comparedto the general population. Infection is the second most important cause of the increasedmortality seen in these ESRD patients (1). More than 75% of deaths in these patients is as aresult of septicemia (2). The incidence rate of bacterial infections in ESRD patients is oneepisode per 100 patient months (3, 4). These bacterial infections are often life threateninggiven the increased susceptibility of uremic patients to infection due to their immunedysfunction(5). While Staphylococcus aureus is the major pathogenic organism (4)responsible for infections in dialysis patients, it has been found that endotoxemia due togram-negative organisms is also a potential source of inflammation in these ESRD patients.(6)
The Endotoxins (lipopolysaccharide in the outer wall of gram negative bacteria) cangenerate a complex host response through signaling pathways initiated after attachment oflipopolysaccharide (LPS) to the CD14 antigen on effector cells (7). Initiation of thiscomplex response occurs after binding of the lipopolysaccharide to the lipolysaccharidebinding protein (LBP) through a lipid A moiety.(8).CD14 is then activated by the LPS-LBPcomplex which leads to the activation of the cellular immune complex (9). ESRD patientsare exposed to higher levels of endotoxin due to: 1) bacteriolysis in patients suffering fromgram-negative sepsis caused by bactericidal systemic antibiotics which release a highvolume of endotoxin (10, 11), 2) entry of endotoxin through the intestinal mucosal epithelialby bacterial translocation (12),and 3) potential use of non-ultra pure dialysate for the dialysis(13). Nevertheless, a recent study found that endotoxemia is associated with better survivalin peritoneal dialysis patients.(14)
Given that ESRD patients have higher baseline levels of inflammatory markers, (15) wehypothesized that there is a relationship between endotoxin levels and inflammation in thesemaintenance dialysis patients. In addition, we wanted to examine the impact of the proposedrelationship on the nutritional status and mortality in these ESRD patients.
Feroze et al. Page 2
J Ren Nutr. Author manuscript; available in PMC 2013 May 01.
NIH
-PA Author Manuscript
NIH
-PA Author Manuscript
NIH
-PA Author Manuscript

MethodsPatient Population
We studied a population of hemodialysis (HD) patients who were part of the Nutritional andInflammatory Evaluation in Dialysis (NIED) study (16).The original NIED cohort consistedof more than 3000 MHD outpatients followed for 6 years in eight (8) DaVita maintenancedialysis clinics in Southern CA.(see the NIED study Website at www.Niedstudy.org formore details as well as previous publications (17–21)). To be included in the study, patientshad to be at least 18 years old and on outpatient hemodialysis for at least 8 weeks. Patientswere excluded if they had an acute infection or had a life expectancy of less than 6 months.The study was approved by the IRB and all subjects gave informed consent prior to beingenrolled in the study. A total of 893 long term HD patients were randomly invited andagreed to participate in the NIED study. Out of these subjects, 310 also agreed to undergo anadditional substudy including measurement of endotoxin, which led to 306 subjects withendotoxin data, since samples on 4 subjects had top be discarded for contamination. Themedical record was thoroughly reviewed for each subject by a collaborating physician in thestudy. Information such as underlying kidney disease, cardiovascular disease history andother co-morbid illnesses was abstracted. A modified version of the Charlton Co-morbidityIndex (i.e. excluding the age and kidney disease components) was used to assess severity ofco-morbidities (22, 23). The 306 HD patients were followed for a total of 42 months (March2004 - September 30, 2007).
Anthropometric and Body Composition MeasuresBody weight and anthropometric measurements were performed while patients were on HDor within 5–20 minutes after termination of their hemodialysis treatment. Biceps and tricepsskin fold thickness was measured by standard technique using the conventional skin foldcaliper (24, 25).
Near Infrared InteractanceTo estimate percentage body fat and fat free body mass, near infrared (NIR) interactancewas measured at the same time as the anthropometric measurements (26). A commercialNIR interactance sensor with a coefficient of variation of 0.5% for total body fatmeasurement (portable Furtex 6100; Furtex, Inc, Rockville, VA; www.furtex.com) wasused. NIR measurements were performed by placing a Furtex sensor on the upper arm (freeof vascular access) for several seconds and entering the required data (data of birth, sex,weight, and height) for each patient. NIR measurements of body fat appear to correlatesignificantly with other nutritional measures in HD patients (27).
Endotoxin MeasurementWe used quantitative Chromogenic Limulus Amebocyte Lysate (LAL) test for endotoxins inplasma (both free and protein-bound forms) using a commercially available kit (QCL-1000,Cambrex bioscience Inc, Walkersville, MD). The minimum detectable level of endotoxin is0.1 EU/ml.
Other Laboratory TestsPre-dialysis and post-dialysis blood samples were obtained on a mid-week day thatcoincided with the day that the required quarterly blood tests were done at the DaVitadialysis facilities. Single pooled Kt/V was used to represent the weekly dialysis dose. Alllaboratory studies were performed by DaVita Laboratories (Deland, FL) using automatedmethods. Serum high sensitivity C-reactive protein (CRP) was measured using aturbidometric immunoassay (WPCI, Osaka, Japan; normal range<3.0mg/L) (28, 29).
Feroze et al. Page 3
J Ren Nutr. Author manuscript; available in PMC 2013 May 01.
NIH
-PA Author Manuscript
NIH
-PA Author Manuscript
NIH
-PA Author Manuscript
Interleukin 6 (IL-6) and tumor necrosis factor alpha (TNF-α) levels were measured withusing immunoassay kits (R&D Systems, Minneapolis, Minn., USA; units: pg/ml; normalrange: IL-6: < 9.9 pg/ml, TNF- α : < 4.7 pg/ml) (30, 31). The C-reactive protein (CRP),TNF-α and IL-6 levels were measured in the General Clinical Research Center Laboratoriesat Harbor UCLA. Serum Transthyretin (pre-albumin) was measured by immunoprecipitationand the plasma homocysteine concentration was measured by high performance liquidchromatography (HPLC) in the Harbor-UCLA Clinical Laboratories.
Statistical MethodsPearson’s correlation coefficient(r) was used for analyses of linear associations. Multivariatelogistic regression analysis was performed to obtain adjusted p-values controlled for case-mix and other covariates. Death hazard ratios (HRs) were obtained using Cox proportionalhazard models controlling for the relevant covariates.
We performed incremental levels of multivariate adjustment where: (A) Case-mix variablesincluding age, gender, race (African-American), diabetes mellitus, and dialysis vintage wereincluded. (B) Malnutrition-inflammation complex syndrome (MICS) variables included suchas albumin, creatinine, hemoglobin, total iron binding capacity, normalized protein catabolicrate, white blood count and; normalized protein catabolic rate (nPCR) [also known asnormalized protein nitrogen appearance (nPNA)]; and body mass index. (C) Additionaladjustment was done for three inflammatory markers (CRP, IL-6, and TNFα) in a fullyadjusted Cox regression model.
We expected significant confounding in the unadjusted models where relevant confounderssuch as age and gender were not taken into account. In fact, while the results from theadjusted models may have been over-adjusted (possibly due to inclusion of biologicalintermediates that are along the causal pathway from predictor to outcome variable), wemake our inferences based on models adjusted for case-mix. Because of uncertaintyregarding which final model is in fact the most parsimonious, we include 3 levels ofadjustment in the presented data so that the full spectrum of results can be appreciated. Thedata analysis was done using STATA version 11.1 (STATA Corporation, College Station,TX).
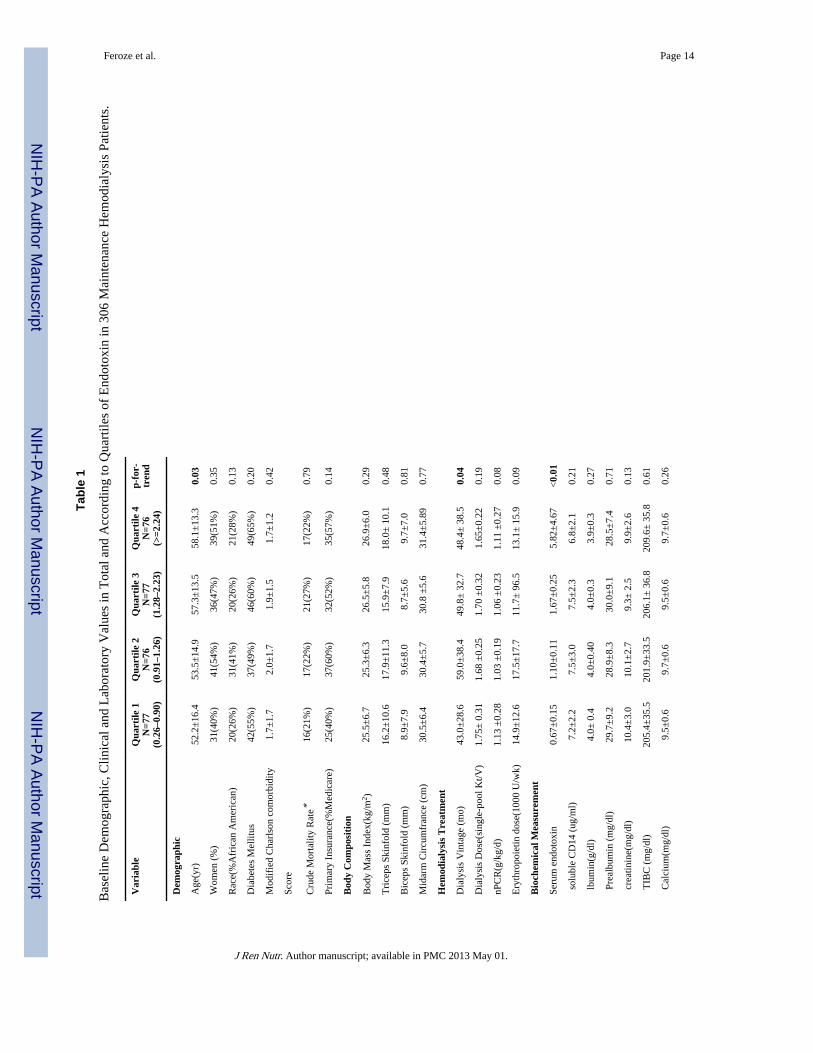
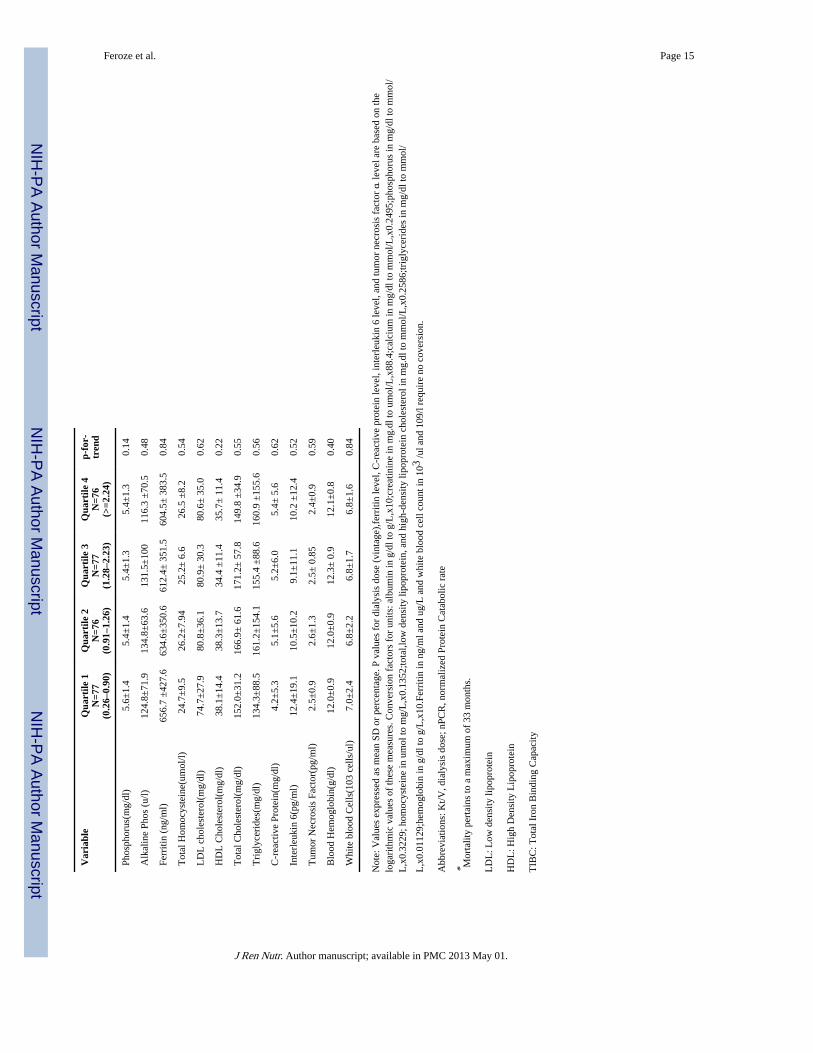
ResultsThe mean (±SD) endotoxin level was 2.31±3.10 EU/ml (min: 0.26 EU/ml, max: 22.94 EU/ml, inter-quartile range: 1.33 EU/ml, median: 1.27 EU/ml). Baseline demographic, clinical,and laboratory values in the 306 MHD patients studied are shown in Table 1. The patientsmean age (±SD) was 55±15 years; 48% of patients were women (n=149), 30% (n=92) wereAfrican-American and 57% were diabetic. The dialysis vintage was 50±35 months (median+ inter-quartile range: 45+ 44 months). Mean endotoxin level was 2.3±3.1 EU/ml (median:1.27 EU/ml). Figure 1 shows the distribution of endotoxin levels. After ranking subjectsaccording to their serum endotoxin level, we categorized them into quartiles with 75–77patients in each group. Table 1 lists relevant demographic, clinical and laboratory measuresacross quartiles of endotoxin levels. Older patients were more likely to be in the higherquartiles of endotoxin levels. No other significant trend was seen in the demographic,physical or biochemical variables as it relates to increasing quartile of endotoxin levels.
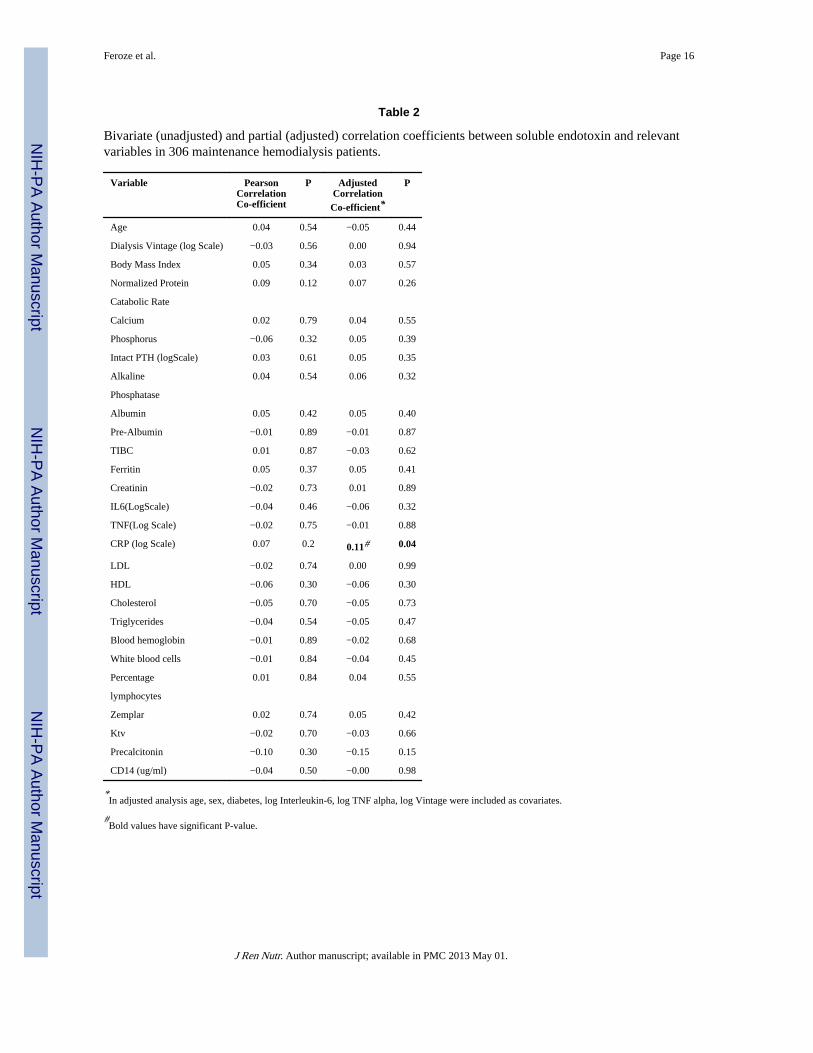
Factors Correlated with Endotoxin LevelTable 2 shows the unadjusted and adjusted correlations between Endotoxin levels andrelevant nutritional, inflammatory and biochemical variables. There was a statisticallysignificant correlation between endotoxin level and CRP level (p-value <0.05) after
Feroze et al. Page 4
J Ren Nutr. Author manuscript; available in PMC 2013 May 01.
NIH
-PA Author Manuscript
NIH
-PA Author Manuscript
NIH
-PA Author Manuscript

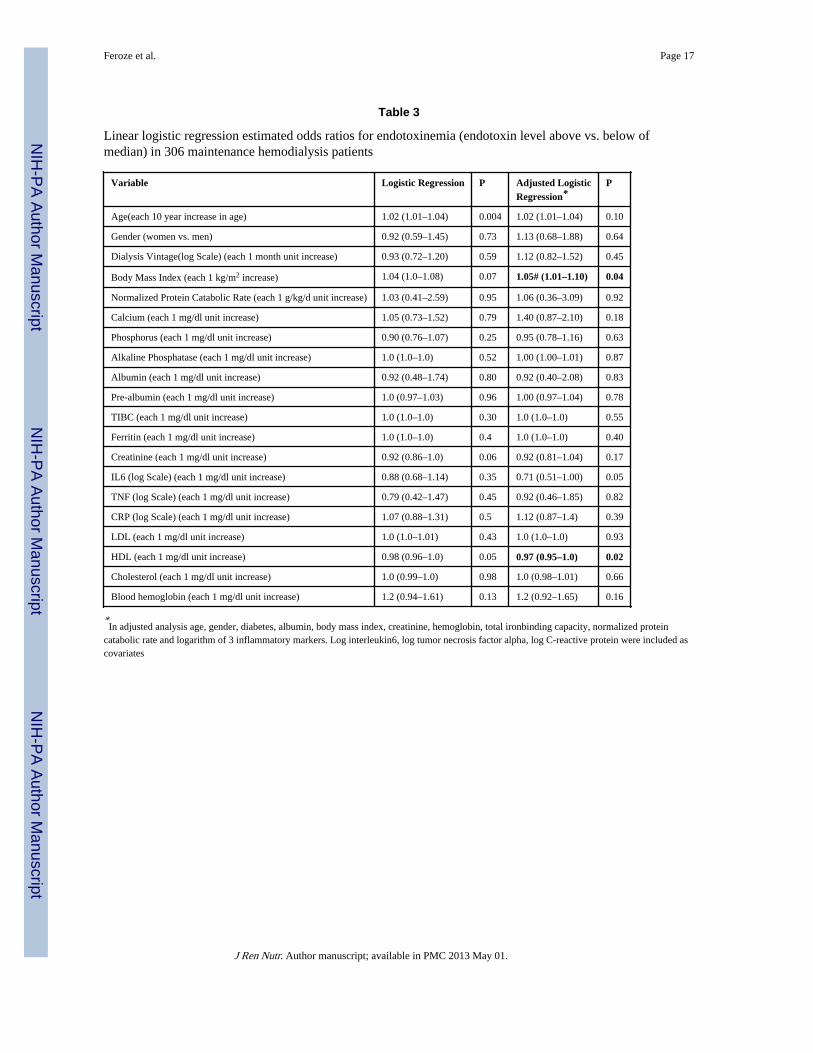
adjustment for relevant covariates. This positive correlation was further supported by thescatter plot shown in figure 2 (r=0.11, P<0.05) No correlation was seen between the othermarkers of inflammation and Endotoxin level. We defined the endotoxin level is equal 5 µg/ml when it was more than 5 µg/ml in our further analyses. Table 3 shows the results ofunivariate (unadjusted) and multivariate logistic regression analysis of the association of thevariables of interest and Endotoxin level. Body mass Index and HDL cholesterol level wereassociated with endotoxin levels after multivariate logistic regression analysis. There was a5% increased odds of higher endotoxin levels for each 1kg/m2 increase in body mass index.There was a 3% decrease in endotoxin levels for each 1mg/dl decrease in HDL cholesterollevel.
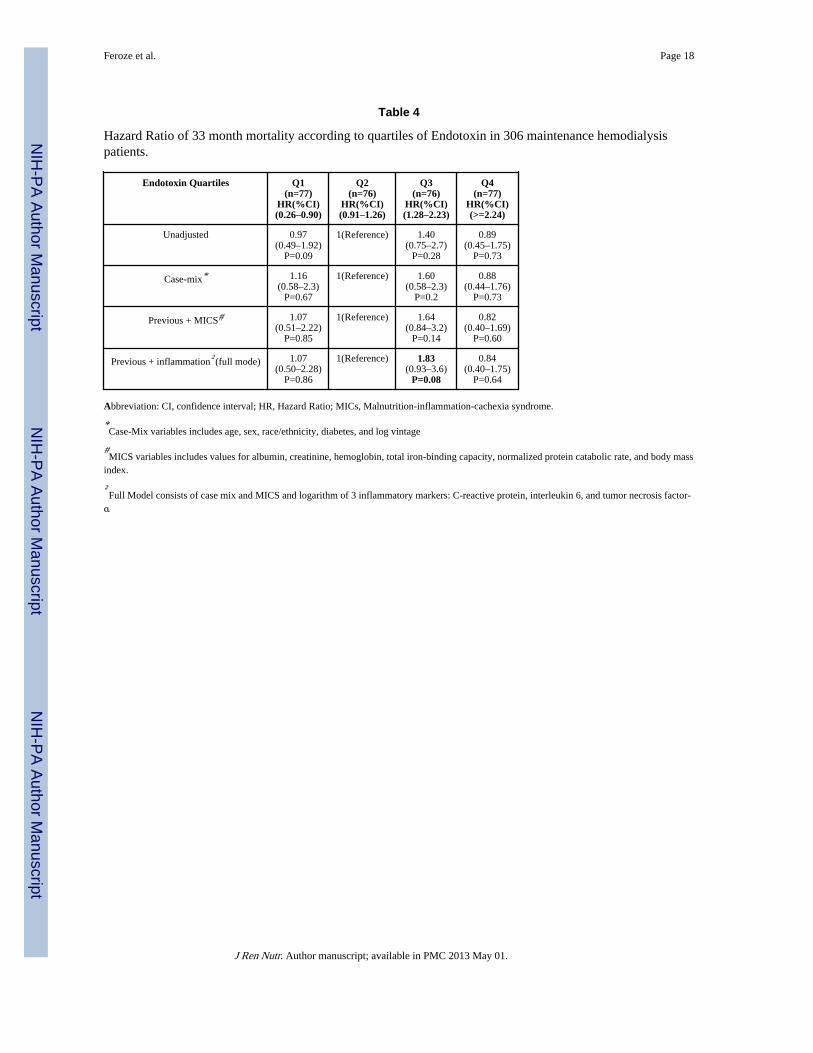
Serum Endotoxin and SurvivalDuring the 42 months follow-up, 58(20%) subjects died, 33(11%) received a renal transplantand 26(8%) were lost to follow up. The hazard ratio for mortality is shown in Table 4.Hazard ratio for mortality was not significant across the quartiles of increasing endotoxinlevels. However, there was a trend towards the 3rd quartile of endotoxin levels (1.28–2.23EU/ml) being associated with an 83% increase in mortality [i.e. HR 1.83 (0.93, 3.60), p-value 0.08]. Cubic spline plots shown in Figure 3 further illustrate the nature of therelationships shown in Table 4.
DiscussionIn 306 maintenance hemodialysis patients, we found that circulating endotoxin level wasassociated with higher CRP levels and BMI but lower HDL level. Whereas we did not findan incremental association between elevated circulating endotoxin levels and mortality inmaintenance hemodialysis patients, we did find that moderately high (3rd quartile) but notthe highest (4th quartile) circulating endotoxin levels (endotoxin greater than 1.265 EU/mland less than 2.237 EU/ml) tended to be associated with increasing mortality (83% higher)compared to mortality in the lowest quartile of endotoxin levels. Though this trend was notstatistically significant, it appeared robust when adjustment was made for case-mix andother nutritional and inflammatory measures, including serum IL-6 and TNF-a. A recentstudy by McIntyre et al has shown significant association between higher circulating level ofendotoxin with higher mortality rate in hemodialysis patients (32).
CKD patients have higher prevalence of inflammation (33) which is an independent riskfactor for cardiovascular events through promotion of atherosclerosis (34). Infection beingthe 2nd most common cause of death in hemodialysis patients (1), bacterial infectionsespecially by gram negative bacteria serves as a major contributor (35). Endotoxin (LipidA), a glucosamine based phospholipid, is the hydrophobic anchor of lipopolysaccharide andmakes up the outer monolayer of the outer membranes of most gram-negative bacteria (36).As it is biologically active portion of lipopolysaccharide molecule (37), it contributes in theactivation of the host immune cells like macrophages etc, and results in the release ofinflammatory mediators(38). This activation of cascade occurs through the combination oflipopolysaccharide (LPS) with lipopolysaccharide binding protein (LBP) and theninteraction of this complex with CD14 (cell surface antigen). CD14 has two forms namelysoluble and myeloid, and these two forms interact with LPS-LBP complex through twodifferent pathways as highlighted in Figure 4.
A possible explanation for the paradoxical effect of higher concentration of endotoxin onmortality can be explained through endotoxin action at receptor level shown in (Figure 4).Raj et al found that increased soluble CD14 level was associated with higher death risk inCKD patients (21). Endotoxin mediates its effect after binding with CD14 to specificreceptors resulting in activation of a cascade of inflammatory cytokines(7). In lower
Feroze et al. Page 5
J Ren Nutr. Author manuscript; available in PMC 2013 May 01.
NIH
-PA Author Manuscript
NIH
-PA Author Manuscript
NIH
-PA Author Manuscript

concentrations it activates the immune system to combat infection without causing overtdamage while very high concentration suggests that they are not bound 50 pg/ml or greaterwere at increased risk for development of atherosclerosis (39). Lack of association withinflammatory cytokines apart from CRP, in our study, further supports this explanation.Indeed a recent study found that endotoxemia is associated with better survival in peritonealdialysis patients.(14)
Another plausible explanation for this association is that in our study population, the meanlevel of endotoxin was 2.31±3.10 EU/ml and sCD14 was 7.24±2.45 ug/ml. sCD14 valuesacross the quartiles of endotoxin level showed that group with higher mortality risk hadhigher sCD 14 as compared to the other two groups. Further analysis showed no significantcorrelation was found between the endotoxin and CD14. So this finding further suggeststhat, to manifest its effect, endotoxin requires a certain amount of sCD14 in the blood toshow maximum activation of the inflammatory cascasde Table 1.
Data also suggested that older patients had higher level of endotoxin and this increment hadsignificant association (Table 1) but no significant correlation was found between endotoxinand age (Table 2). The only significant positive correlation that was found in this study isbetween CRP levels and endotoxin levels when adjusted for case-mix variables (Table 2).Szeto et al found a similar association between CRP and Serum endotoxin levels inperitoneal dialysis patients. Their study also found a negative correlation between serumalbumin and serum endotoxin which we did not find in our study (6). Our findings aresimilar to those of Goncalves et al who reported that there were no association betweenendotoxin levels and circulating cytokines (40).
An inverse association was also found between HDL and endotoxin levels in after bothunadjusted and adjusted linear regression analyses. This finding correlated with the fact thatHDL levels decline more than any other lipoproteins in septic patients (41). LPS isdetoxified in the circulation by incorporation into lipoproteins (LDL, VLDL, TGL andHDL)(42, 43).
Selection bias during study enrollment resulting in a younger maintenance HD cohort is oneof the major limitations of this study. However, because mortality rate in the original NIEDstudy cohort was lower than in the baseline dialysis population (16), it might be argued thatthe strength of the association seen is much lower than would be seen in a more randomlyselected sample of dialysis patients. The strength of our study relates to the fact thatparticipants were selected randomly without prior knowledge of their inflammation status.Further, we had a fairly large sample size with comprehensive clinical and laboratoryevaluation. We were able to do body composition measurement, obtain detailed informationon co-morbid illnesses and measure levels of pro-inflammatory cytokines.
ConclusionIn our study of 306 MHD patients who were followed for up to 3.5 years, increasingendotoxin levels was not associated with increased mortality. This possibly is due tocomplex interaction of endotoxin with its receptors and signaling cascade. Additionalstudies are necessary to assess the relationship between endotoxin concentration and otherlong-term outcomes in these maintenance hemodialysis patients.
AcknowledgmentsThe authors are thankful to dietitians and other teammates in DaVita Wild West and Gold Coast Divisions forsupporting the study and the staff at Harbor-UCLA GCRC Core Laboratories for the management of blood samplesand measuring inflammatory markers.
Feroze et al. Page 6
J Ren Nutr. Author manuscript; available in PMC 2013 May 01.
NIH
-PA Author Manuscript
NIH
-PA Author Manuscript
NIH
-PA Author Manuscript
Funding Source
The study was supported by Dr. Kalantar-Zadeh’s research grants from the National Institute of Diabetes, Digestiveand Kidney Disease of the National Institute of Health (R01 DK078106, R21 DK078012, and K23 DK61162), aresearch grant from DaVita Clinical Research and a philanthropic grant from Mr. Harold Simmons. Dr. Raj issupported by the National Institute of Health Grants AG21560 and R01DK073665-01A1. Dr. Miklos Zsolt Molnarreceived grants from the National Research Fund (NKTH-OTKA-EU 7KP-HUMAN-MB08-A-81231), was alsosupported by the János Bolyai Research Scholarship of the Hungarian Academy of Sciences (2008–2011), and isrecipient of the Hungarian Eötvös Scholarship (MÖB/66-2/2010).
References1. Mailloux LU, Bellucci AG, Wilkes BM, Napolitano B, Mossey RT, Lesser M, Bluestone PA.
Mortality in dialysis patients: analysis of the causes of death. Am J Kidney Dis. 1991; 18(3):326–335. [PubMed: 1882824]
2. Sarnak MJ, Jaber BL. Mortality caused by sepsis in patients with end-stage renal disease comparedwith the general population. Kidney international. 2000; 58(4):1758–1764. [PubMed: 11012910]
3. Kessler M, Hoen B, Mayeux D, Hestin D, Fontenaille C. Bacteremia in patients on chronichemodialysis. A multicenter prospective survey. Nephron. 1993; 64(1):95–100. [PubMed: 8502343]
4. Hoen B, Paul-Dauphin A, Hestin D, Kessler M. EPIBACDIAL: a multicenter prospective study ofrisk factors for bacteremia in chronic hemodialysis patients. J Am Soc Nephrol. 1998; 9(5):869–876. [PubMed: 9596085]
5. Cohen G, Haag-Weber M, Horl WH. Immune dysfunction in uremia. Kidney Int Suppl. 1997;62:S79–S82. [PubMed: 9350688]
6. Szeto CC, Kwan BC, Chow KM, Lai KB, Chung KY, Leung CB, Li PK. Endotoxemia is related tosystemic inflammation and atherosclerosis in peritoneal dialysis patients. Clin J Am Soc Nephrol.2008; 3(2):431–436. [PubMed: 18256376]
7. Wright, SD.; Ramos, RA.; Tobias, PS.; Ulevitch, RJ.; Mathison, JC. Science. Vol. 249. New York,NY: 1990. CD14, a receptor for complexes of lipopolysaccharide (LPS) and LPS binding protein; p.1431-1433.
8. Tobias PS, Soldau K, Ulevitch RJ. Identification of a lipid A binding site in the acute phase reactantlipopolysaccharide binding protein. The Journal of biological chemistry. 1989; 264(18):10867–10871. [PubMed: 2471708]
9. Tobias PS, Ulevitch RJ. Lipopolysaccharide-binding protein and CD14 in the lipopolysaccharide-dependent activation of cells. Chest. 1994; 105(Suppl)(3):48S–50S. [PubMed: 7510603]
10. Holzheimer RG. The significance of endotoxin release in experimental and clinical sepsis insurgical patients--evidence for antibiotic-induced endotoxin release? Infection. 1998; 26(2):77–84.[PubMed: 9561376]
11. Mock CN, Jurkovich GJ, Dries DJ, Maier RV. Clinical significance of antibiotic endotoxin-releasing properties in trauma patients. Arch Surg. 1995; 130(11):1234–1240. discussion1240-1231. [PubMed: 7487468]
12. Van Leeuwen PA, Boermeester MA, Houdijk AP, Ferwerda CC, Cuesta MA, Meyer S, WesdorpRI. Clinical significance of translocation. Gut. 1994; 35(Suppl)(1):S28–S34. [PubMed: 8125386]
13. Arizono K, Nomura K, Motoyama T, Matsushita Y, Matsuoka K, Miyazu R, Takeshita H, FukuiH. Use of ultrapure dialysate in reduction of chronic inflammation during hemodialysis. Bloodpurification. 2004; 22(Suppl 2):26–29. [PubMed: 15655319]
14. Szeto CC, Kwan BC, Chow KM, Lai KB, Pang WF, Chung KY, Leung CB, Li PK. Endotoxemiais associated with better clinical outcome in incident chinese peritoneal dialysis patients: aprospective cohort study. Perit Dial Int. 2010; 30(2):178–186. [PubMed: 20081047]
15. Stenvinkel P, Alvestrand A. Inflammation in end-stage renal disease: sources, consequences, andtherapy. Seminars in dialysis. 2002; 15(5):329–337. [PubMed: 12358637]
16. Colman S, Bross R, Benner D, Chow J, Braglia A, Arzaghi J, Dennis J, Martinez L, Baldo DB,Agarwal V, Trundnowski T, Zitterkoph J, Martinez B, Khawar OS, Kalantar-Zadeh K. TheNutritional and Inflammatory Evaluation in Dialysis patients (NIED) study: overview of the NIEDstudy and the role of dietitians. J Ren Nutr. 2005; 15(2):231–243. [PubMed: 15827897]
Feroze et al. Page 7
J Ren Nutr. Author manuscript; available in PMC 2013 May 01.
NIH
-PA Author Manuscript
NIH
-PA Author Manuscript
NIH
-PA Author Manuscript
17. Shantouf RS, Budoff MJ, Ahmadi N, Ghaffari A, Flores F, Gopal A, Noori N, Jing J, Kovesdy CP,Kalantar-Zadeh K. Total and individual coronary artery calcium scores as independent predictorsof mortality in hemodialysis patients. Am J Nephrol. 2010; 31(5):419–425. [PubMed: 20389057]
18. Noori N, Kopple JD, Kovesdy CP, Feroze U, Sim JJ, Murali SB, Luna A, Gomez M, Luna C,Bross R, Nissenson AR, Kalantar-Zadeh K. Mid-arm muscle circumference and quality of life andsurvival in maintenance hemodialysis patients. Clin J Am Soc Nephrol. 2010; 5(12):2258–2268.[PubMed: 20947789]
19. Noori N, Kalantar-Zadeh K, Kovesdy CP, Bross R, Benner D, Kopple JD. Association of dietaryphosphorus intake and phosphorus to protein ratio with mortality in hemodialysis patients. Clin JAm Soc Nephrol. 2010; 5(4):683–692. [PubMed: 20185606]
20. Noori N, Kalantar-Zadeh K, Kovesdy CP, Murali SB, Bross R, Nissenson AR, Kopple JD. Dietarypotassium intake and mortality in long-term hemodialysis patients. Am J Kidney Dis. 2010; 56(2):338–347. [PubMed: 20580474]
21. Raj DS, Shah VO, Rambod M, Kovesdy CP, Kalantar-Zadeh K. Association of soluble endotoxinreceptor CD14 and mortality among patients undergoing hemodialysis. Am J Kidney Dis. 2009;54(6):1062–1071. [PubMed: 19699018]
22. Mehrotra R, Kermah D, Fried L, Kalantar-Zadeh K, Khawar O, Norris K, Nissenson A. Chronicperitoneal dialysis in the United States: declining utilization despite improving outcomes. J AmSoc Nephrol. 2007; 18(10):2781–2788. [PubMed: 17804675]
23. Beddhu S, Bruns FJ, Saul M, Seddon P, Zeidel ML. A simple comorbidity scale predicts clinicaloutcomes and costs in dialysis patients. The American journal of medicine. 2000; 108(8):609–613.[PubMed: 10856407]
24. Nelson EE, Hong CD, Pesce AL, Peterson DW, Singh S, Pollak VE. Anthropometric norms for thedialysis population. Am J Kidney Dis. 1990; 16(1):32–37. [PubMed: 2195877]
25. Williams AJ, McArley A. Body composition, treatment time, and outcome in hemodialysispatients. J Ren Nutr. 1999; 9(3):157–162. [PubMed: 10431037]
26. Kalantar-Zadeh K, Dunne E, Nixon K, Kahn K, Lee GH, Kleiner M, Luft FC. Near infra-redinteractance for nutritional assessment of dialysis patients. Nephrol Dial Transplant. 1999; 14(1):169–175. [PubMed: 10052499]
27. Kalantar-Zadeh K, Kuwae N, Wu DY, Shantouf RS, Fouque D, Anker SD, Block G, Kopple JD.Associations of body fat and its changes over time with quality of life and prospective mortality inhemodialysis patients. The American journal of clinical nutrition. 2006; 83(2):202–210. [PubMed:16469976]
28. Ridker PM, Rifai N, Rose L, Buring JE, Cook NR. Comparison of C-reactive protein and low-density lipoprotein cholesterol levels in the prediction of first cardiovascular events. The NewEngland journal of medicine. 2002; 347(20):1557–1565. [PubMed: 12432042]
29. Erbagci AB, Tarakcioglu M, Aksoy M, Kocabas R, Nacak M, Aynacioglu AS, Sivrikoz C.Diagnostic value of CRP and Lp(a) in coronary heart disease. Acta cardiologica. 2002; 57(3):197–204. [PubMed: 12088177]
30. Pecoits-Filho R, Barany P, Lindholm B, Heimburger O, Stenvinkel P. Interleukin-6 is anindependent predictor of mortality in patients starting dialysis treatment. Nephrol Dial Transplant.2002; 17(9):1684–1688. [PubMed: 12198224]
31. Beutler B, Cerami A. The biology of cachectin/TNF--a primary mediator of the host response.Annual review of immunology. 1989; 7:625–655.
32. McIntyre CW, Harrison LE, Eldehni MT, Jefferies HJ, Szeto CC, John SG, Sigrist MK, Burton JO,Hothi D, Korsheed S, Owen PJ, Lai KB, Li PK. Circulating Endotoxemia: A Novel Factor inSystemic Inflammation and Cardiovascular Disease in Chronic Kidney Disease. Clin J Am SocNephrol.
33. Panichi V, Migliori M, De Pietro S, Taccola D, Bianchi AM, Norpoth M, Metelli MR, GiovanniniL, Tetta C, Palla R. C reactive protein in patients with chronic renal diseases. Renal failure. 2001;23(3–4):551–562. [PubMed: 11499569]
34. Zimmermann J, Herrlinger S, Pruy A, Metzger T, Wanner C. Inflammation enhancescardiovascular risk and mortality in hemodialysis patients. Kidney international. 1999; 55(2):648–658. [PubMed: 9987089]
Feroze et al. Page 8
J Ren Nutr. Author manuscript; available in PMC 2013 May 01.
NIH
-PA Author Manuscript
NIH
-PA Author Manuscript
NIH
-PA Author Manuscript
35. Chen CH, Hsu WH, Chen HJ, Chen W, Shih CM, Hsia TC, Tu CY. Different bacteriology andprognosis of thoracic empyemas between patients with chronic and end-stage renal disease. Chest.2007; 132(2):532–539. [PubMed: 17699132]
36. Raetz CR, Whitfield C. Lipopolysaccharide endotoxins. Annual review of biochemistry. 2002;71:635–700.
37. Rietschel ET, Kirikae T, Schade FU, Ulmer AJ, Holst O, Brade H, Schmidt G, Mamat U,Grimmecke HD, Kusumoto S, et al. The chemical structure of bacterial endotoxin in relation tobioactivity. Immunobiology. 1993; 187(3–5):169–190. [PubMed: 8330896]
38. Bosshart H, Heinzelmann M. Targeting bacterial endotoxin: two sides of a coin. Annals of the NewYork Academy of Sciences. 2007; 1096:1–17. [PubMed: 17405910]
39. Wiedermann CJ, Kiechl S, Dunzendorfer S, Schratzberger P, Egger G, Oberhollenzer F, Willeit J.Association of endotoxemia with carotid atherosclerosis and cardiovascular disease: prospectiveresults from the Bruneck Study. Journal of the American College of Cardiology. 1999; 34(7):1975–1981. [PubMed: 10588212]
40. Goncalves S, Pecoits-Filho R, Perreto S, Barberato SH, Stinghen AE, Lima EG, Fuerbringer R,Sauthier SM, Riella MC. Associations between renal function, volume status and endotoxaemia inchronic kidney disease patients. Nephrol Dial Transplant. 2006; 21(10):2788–2794. [PubMed:16861246]
41. Gordon BR, Parker TS, Levine DM, Saal SD, Wang JC, Sloan BJ, Barie PS, Rubin AL. Low lipidconcentrations in critical illness: implications for preventing and treating endotoxemia. Criticalcare medicine. 1996; 24(4):584–589. [PubMed: 8612407]
42. Levine DM, Parker TS, Donnelly TM, Walsh A, Rubin AL. In vivo protection against endotoxinby plasma high density lipoprotein. Proceedings of the National Academy of Sciences of theUnited States of America. 1993; 90(24):12040–12044. [PubMed: 8265667]
43. Feingold KR, Funk JL, Moser AH, Shigenaga JK, Rapp JH, Grunfeld C. Role for circulatinglipoproteins in protection from endotoxin toxicity. Infection and immunity. 1995; 63(5):2041–2046. [PubMed: 7729918]
Feroze et al. Page 9
J Ren Nutr. Author manuscript; available in PMC 2013 May 01.
NIH
-PA Author Manuscript
NIH
-PA Author Manuscript
NIH
-PA Author Manuscript

Figure 1.a: Histogram of Serum Endotoxin Levelb: Histogram of variable Endotoxin (Endotoxin with every value above 5 is =5)
Feroze et al. Page 10
J Ren Nutr. Author manuscript; available in PMC 2013 May 01.
NIH
-PA Author Manuscript
NIH
-PA Author Manuscript
NIH
-PA Author Manuscript
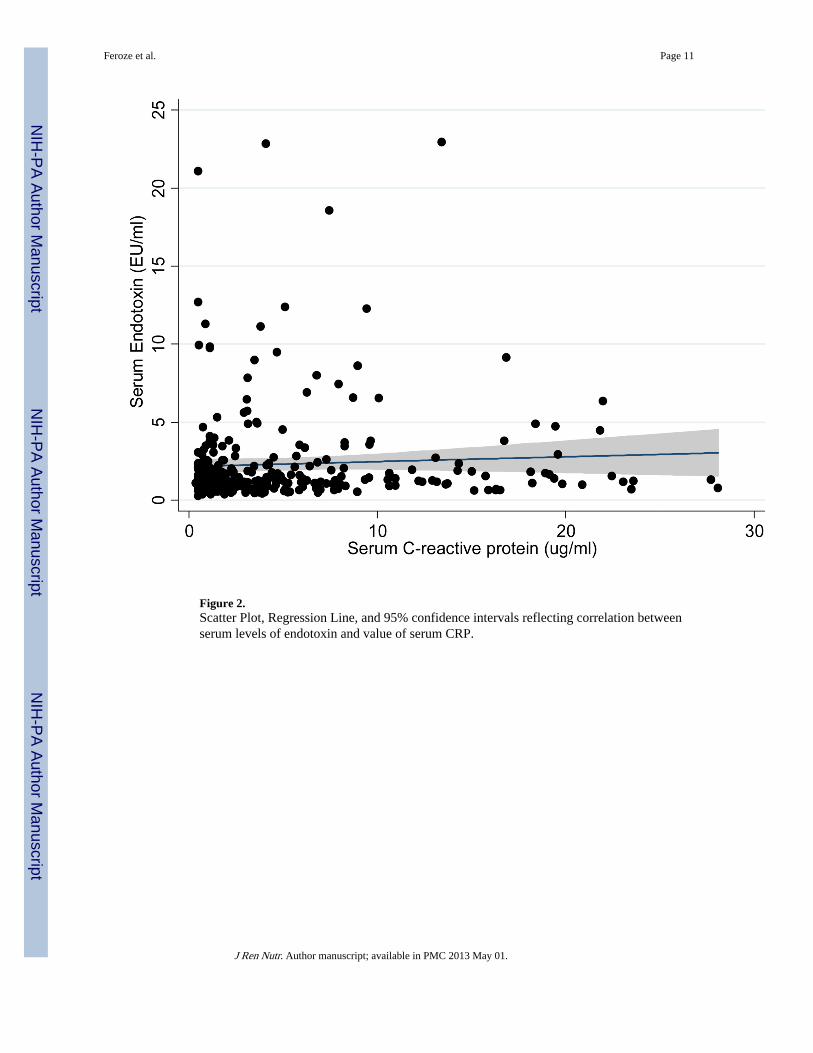
Figure 2.Scatter Plot, Regression Line, and 95% confidence intervals reflecting correlation betweenserum levels of endotoxin and value of serum CRP.
Feroze et al. Page 11
J Ren Nutr. Author manuscript; available in PMC 2013 May 01.
NIH
-PA Author Manuscript
NIH
-PA Author Manuscript
NIH
-PA Author Manuscript
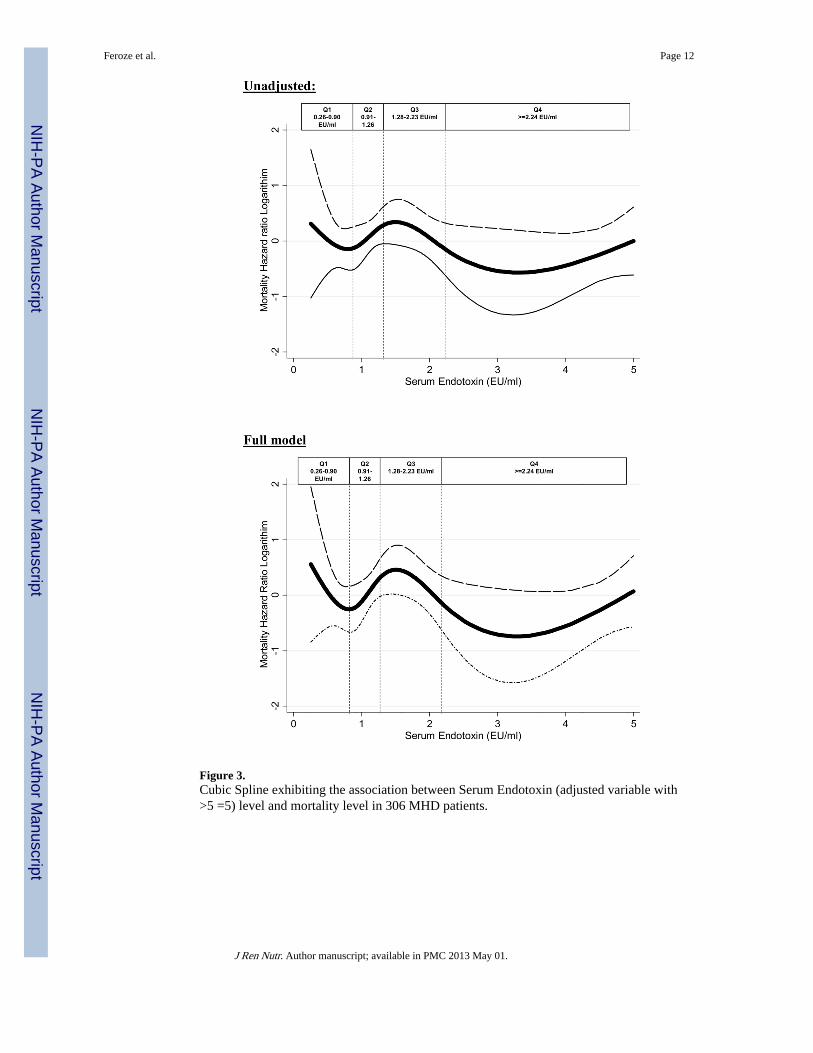
Figure 3.Cubic Spline exhibiting the association between Serum Endotoxin (adjusted variable with>5 =5) level and mortality level in 306 MHD patients.
Feroze et al. Page 12
J Ren Nutr. Author manuscript; available in PMC 2013 May 01.
NIH
-PA Author Manuscript
NIH
-PA Author Manuscript
NIH
-PA Author Manuscript
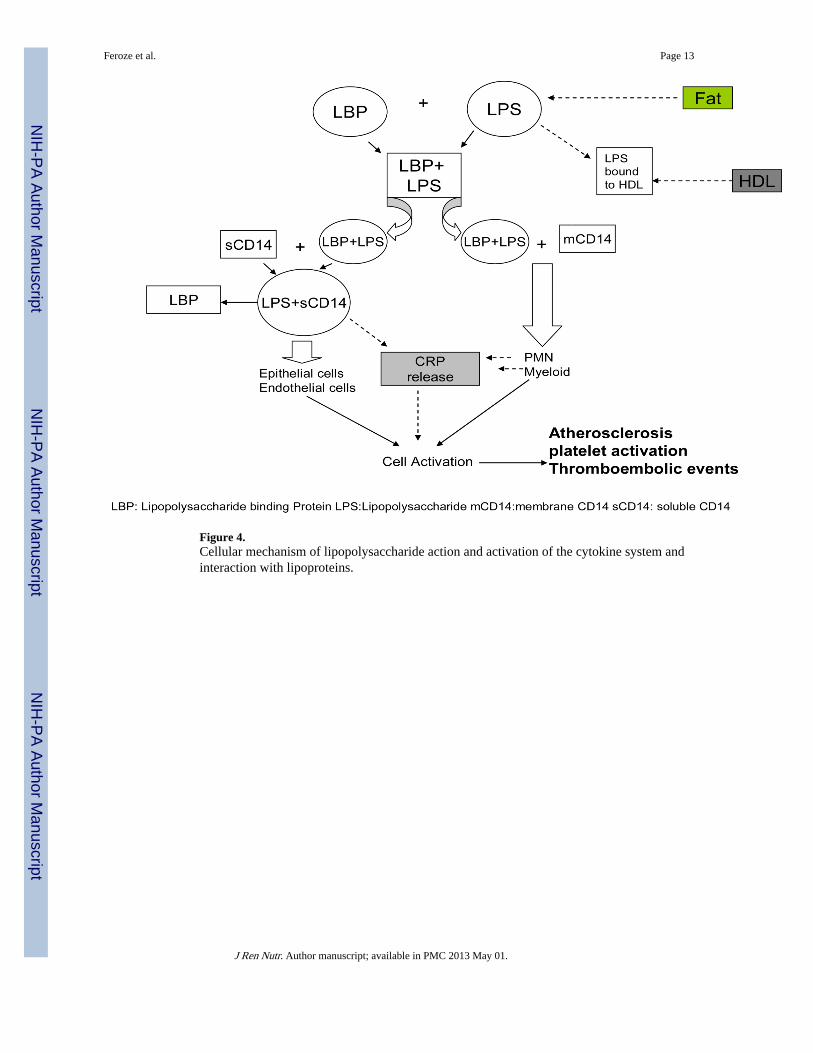
Figure 4.Cellular mechanism of lipopolysaccharide action and activation of the cytokine system andinteraction with lipoproteins.
Feroze et al. Page 13
J Ren Nutr. Author manuscript; available in PMC 2013 May 01.
NIH
-PA Author Manuscript
NIH
-PA Author Manuscript
NIH
-PA Author Manuscript
NIH
-PA Author Manuscript
NIH
-PA Author Manuscript
NIH
-PA Author Manuscript
Feroze et al. Page 14
Tabl
e 1
Bas
elin
e D
emog
raph
ic, C
linic
al a
nd L
abor
ator
y V
alue
s in
Tot
al a
nd A
ccor
ding
to Q
uart
iles
of E
ndot
oxin
in 3
06 M
aint
enan
ce H
emod
ialy
sis
Patie
nts.
Var
iabl
eQ
uart
ile 1
N=7
7(0
.26–
0.90
)
Qua
rtile
2N
=76
(0.9
1–1.
26)
Qua
rtile
3N
=77
(1.2
8–2.
23)
Qua
rtile
4N
=76
(>=2
.24)
p-fo
r-tr
end
Dem
ogra
phic
Age
(yr)
52.2
±16
.453
.5±
14.9
57.3
±13
.558
.1±
13.3
0.03
Wom
en (
%)
31(4
0%)
41(5
4%)
36(4
7%)
39(5
1%)
0.35
Rac
e(%
Afr
ican
Am
eric
an)
20(2
6%)
31(4
1%)
20(2
6%)
21(2
8%)
0.13
Dia
bete
s M
ellit
us42
(55%
)37
(49%
)46
(60%
)49
(65%
)0.
20
Mod
ifie
d C
harl
son
com
orbi
dity
1.7±
1.7
2.0±
1.7
1.9±
1.5
1.7±
1.2
0.42
Scor
e
Cru
de M
orta
lity
Rat
e*16
(21%
)17
(22%
)21
(27%
)17
(22%
)0.
79
Prim
ary
Insu
ranc
e(%
Med
icar
e)25
(40%
)37
(60%
)32
(52%
)35
(57%
)0.
14
Bod
y C
ompo
siti
on
Bod
y M
ass
Inde
x(kg
/m2 )
25.5
±6.
725
.3±
6.3
26.5
±5.
826
.9±
6.0
0.29
Tri
ceps
Ski
nfol
d (m
m)
16.2
±10
.617
.9±
11.3
15.9
±7.
918
.0±
10.
10.
48
Bic
eps
Skin
fold
(m
m)
8.9±
7.9
9.6±
8.0
8.7±
5.6
9.7±
7.0
0.81
Mid
arm
Cir
cum
fran
ce (
cm)
30.5
±6.
430
.4±
5.7
30.8
±5.
631
.4±
5.89
0.77
Hem
odia
lysi
s T
reat
men
t
Dia
lysi
s V
inta
ge (
mo)
43.0
±28
.659
.0±
38.4
49.8
± 3
2.7
48.4
± 3
8.5
0.04
Dia
lysi
s D
ose(
sing
le-p
ool K
t/V)
1.75
± 0
.31
1.68
±0.
251.
70 ±
0.32
1.65
±0.
220.
19
nPC
R(g
/kg/
d)1.
13 ±
0.28
1.03
±0.
191.
06 ±
0.23
1.11
±0.
270.
08
Ery
thro
poie
tin d
ose(
1000
U/w
k)14
.9±
12.6
17.5
±17
.711
.7±
96.
513
.1±
15.
90.
09
Bio
chem
ical
Mea
sure
men
t
Seru
m e
ndot
oxin
0.67
±0.
151.
10±
0.11
1.67
±0.
255.
82±
4.67
<0.
01
sol
uble
CD
14 (
ug/m
l)7.
2±2.
27.
5±3.
07.
5±2.
36.
8±2.
10.
21
lbu
min
(g/d
l)4.
0± 0
.44.
0±0.
404.
0±0.
33.
9±0.
30.
27
Pre
albu
min
(m
g/dl
)29
.7±
9.2
28.9
±8.
330
.0±
9.1
28.5
±7.
40.
71
cre
atin
ine(
mg/
dl)
10.4
±3.
010
.1±
2.7
9.3±
2.5
9.9±
2.6
0.13
TIB
C (
mg/
dl)
205.
4±35
.520
1.9±
33.5
206.
1± 3
6.8
209.
6± 3
5.8
0.61
Cal
cium
(mg/
dl)
9.5±
0.6
9.7±
0.6
9.5±
0.6
9.7±
0.6
0.26
J Ren Nutr. Author manuscript; available in PMC 2013 May 01.
NIH
-PA Author Manuscript
NIH
-PA Author Manuscript
NIH
-PA Author Manuscript
Feroze et al. Page 15
Var
iabl
eQ
uart
ile 1
N=7
7(0
.26–
0.90
)
Qua
rtile
2N
=76
(0.9
1–1.
26)
Qua
rtile
3N
=77
(1.2
8–2.
23)
Qua
rtile
4N
=76
(>=2
.24)
p-fo
r-tr
end
Phos
phor
us(m
g/dl
)5.
6±1.
45.
4±1.
45.
4±1.
35.
4±1.
30.
14
Alk
alin
e Ph
os (
u/l)
124.
8±71
.913
4.8±
63.6
131.
5±10
011
6.3
±70
.50.
48
Ferr
itin
(ng/
ml)
656.
7 ±
427.
663
4.6±
350.
661
2.4±
351
.560
4.5±
383
.50.
84
Tot
al H
omoc
yste
ine(
umol
/l)24
.7±
9.5
26.2
±7.
9425
.2±
6.6
26.5
±8.
20.
54
LD
L c
hole
ster
ol(m
g/dl
)74
.7±
27.9
80.8
±36
.180
.9±
30.
380
.6±
35.
00.
62
HD
L C
hole
ster
ol(m
g/dl
)38
.1±
14.4
38.3
±13
.734
.4 ±
11.4
35.7
± 1
1.4
0.22
Tot
al C
hole
ster
ol(m
g/dl
)15
2.0±
31.2
166.
9± 6
1.6
171.
2± 5
7.8
149.
8 ±
34.9
0.55
Tri
glyc
erid
es(m
g/dl
)13
4.3±
88.5
161.
2±15
4.1
155.
4 ±
88.6
160.
9 ±
155.
60.
56
C-r
eact
ive
Prot
ein(
mg/
dl)
4.2±
5.3
5.1±
5.6
5.2±
6.0
5.4±
5.6
0.62
Inte
rleu
kin
6(pg
/ml)
12.4
±19
.110
.5±
10.2
9.1±
11.1
10.2
±12
.40.
52
Tum
or N
ecro
sis
Fact
or(p
g/m
l)2.
5±0.
92.
6±1.
32.
5± 0
.85
2.4±
0.9
0.59
Blo
od H
emog
lobi
n(g/
dl)
12.0
±0.
912
.0±
0.9
12.3
± 0
.912
.1±
0.8
0.40
Whi
te b
lood
Cel
ls(1
03 c
ells
/ul)
7.0±
2.4
6.8±
2.2
6.8±
1.7
6.8±
1.6
0.84
Not
e: V
alue
s ex
pres
sed
as m
ean
SD o
r pe
rcen
tage
. P v
alue
s fo
r di
alys
is d
ose
(vin
tage
),fe
rriti
n le
vel,
C-r
eact
ive
prot
ein
leve
l, in
terl
euki
n 6
leve
l, an
d tu
mor
nec
rosi
s fa
ctor
α le
vel a
re b
ased
on
the
loga
rith
mic
val
ues
of th
ese
mea
sure
s. C
onve
rsio
n fa
ctor
s fo
r un
its: a
lbum
in in
g/d
l to
g/L
,x10
;cre
atin
ine
in m
g.dl
to u
mol
/L,x
88.4
;cal
cium
in m
g/dl
to m
mol
/L,x
0.24
95;p
hosp
horu
s in
mg/
dl to
mm
ol/
L,x
0.32
29; h
omoc
yste
ine
in u
mol
to m
g/L
,x0.
1352
;tota
l,low
den
sity
lipo
prot
ein,
and
hig
h-de
nsity
lipo
prot
ein
chol
este
rol i
n m
g.dl
to m
mol
/L,x
0.25
86;tr
igly
ceri
des
in m
g/dl
to m
mol
/
L,x
0.01
129;
hem
oglo
bin
in g
/dl t
o g/
L,x
10.F
erri
tin in
ng/
ml a
nd u
g/L
and
whi
te b
lood
cel
l cou
nt in
103
/ul a
nd 1
09/l
requ
ire
no c
over
sion
.
Abb
revi
atio
ns: K
t/V, d
ialy
sis
dose
; nPC
R, n
orm
aliz
ed P
rote
in C
atab
olic
rat
e
* Mor
talit
y pe
rtai
ns to
a m
axim
um o
f 33
mon
ths.
LD
L: L
ow d
ensi
ty li
popr
otei
n
HD
L: H
igh
Den
sity
Lip
opro
tein
TIB
C: T
otal
Iro
n B
indi
ng C
apac
ity
J Ren Nutr. Author manuscript; available in PMC 2013 May 01.
NIH
-PA Author Manuscript
NIH
-PA Author Manuscript
NIH
-PA Author Manuscript
Feroze et al. Page 16
Table 2
Bivariate (unadjusted) and partial (adjusted) correlation coefficients between soluble endotoxin and relevantvariables in 306 maintenance hemodialysis patients.
Variable PearsonCorrelationCo-efficient
P AdjustedCorrelationCo-efficient*
P
Age 0.04 0.54 −0.05 0.44
Dialysis Vintage (log Scale) −0.03 0.56 0.00 0.94
Body Mass Index 0.05 0.34 0.03 0.57
Normalized Protein 0.09 0.12 0.07 0.26
Catabolic Rate
Calcium 0.02 0.79 0.04 0.55
Phosphorus −0.06 0.32 0.05 0.39
Intact PTH (logScale) 0.03 0.61 0.05 0.35
Alkaline 0.04 0.54 0.06 0.32
Phosphatase
Albumin 0.05 0.42 0.05 0.40
Pre-Albumin −0.01 0.89 −0.01 0.87
TIBC 0.01 0.87 −0.03 0.62
Ferritin 0.05 0.37 0.05 0.41
Creatinin −0.02 0.73 0.01 0.89
IL6(LogScale) −0.04 0.46 −0.06 0.32
TNF(Log Scale) −0.02 0.75 −0.01 0.88
CRP (log Scale) 0.07 0.2 0.11# 0.04
LDL −0.02 0.74 0.00 0.99
HDL −0.06 0.30 −0.06 0.30
Cholesterol −0.05 0.70 −0.05 0.73
Triglycerides −0.04 0.54 −0.05 0.47
Blood hemoglobin −0.01 0.89 −0.02 0.68
White blood cells −0.01 0.84 −0.04 0.45
Percentage 0.01 0.84 0.04 0.55
lymphocytes
Zemplar 0.02 0.74 0.05 0.42
Ktv −0.02 0.70 −0.03 0.66
Precalcitonin −0.10 0.30 −0.15 0.15
CD14 (ug/ml) −0.04 0.50 −0.00 0.98
*In adjusted analysis age, sex, diabetes, log Interleukin-6, log TNF alpha, log Vintage were included as covariates.
#Bold values have significant P-value.
J Ren Nutr. Author manuscript; available in PMC 2013 May 01.
NIH
-PA Author Manuscript
NIH
-PA Author Manuscript
NIH
-PA Author Manuscript
Feroze et al. Page 17
Table 3
Linear logistic regression estimated odds ratios for endotoxinemia (endotoxin level above vs. below ofmedian) in 306 maintenance hemodialysis patients
Variable Logistic Regression P Adjusted LogisticRegression*
P
Age(each 10 year increase in age) 1.02 (1.01–1.04) 0.004 1.02 (1.01–1.04) 0.10
Gender (women vs. men) 0.92 (0.59–1.45) 0.73 1.13 (0.68–1.88) 0.64
Dialysis Vintage(log Scale) (each 1 month unit increase) 0.93 (0.72–1.20) 0.59 1.12 (0.82–1.52) 0.45
Body Mass Index (each 1 kg/m2 increase) 1.04 (1.0–1.08) 0.07 1.05# (1.01–1.10) 0.04
Normalized Protein Catabolic Rate (each 1 g/kg/d unit increase) 1.03 (0.41–2.59) 0.95 1.06 (0.36–3.09) 0.92
Calcium (each 1 mg/dl unit increase) 1.05 (0.73–1.52) 0.79 1.40 (0.87–2.10) 0.18
Phosphorus (each 1 mg/dl unit increase) 0.90 (0.76–1.07) 0.25 0.95 (0.78–1.16) 0.63
Alkaline Phosphatase (each 1 mg/dl unit increase) 1.0 (1.0–1.0) 0.52 1.00 (1.00–1.01) 0.87
Albumin (each 1 mg/dl unit increase) 0.92 (0.48–1.74) 0.80 0.92 (0.40–2.08) 0.83
Pre-albumin (each 1 mg/dl unit increase) 1.0 (0.97–1.03) 0.96 1.00 (0.97–1.04) 0.78
TIBC (each 1 mg/dl unit increase) 1.0 (1.0–1.0) 0.30 1.0 (1.0–1.0) 0.55
Ferritin (each 1 mg/dl unit increase) 1.0 (1.0–1.0) 0.4 1.0 (1.0–1.0) 0.40
Creatinine (each 1 mg/dl unit increase) 0.92 (0.86–1.0) 0.06 0.92 (0.81–1.04) 0.17
IL6 (log Scale) (each 1 mg/dl unit increase) 0.88 (0.68–1.14) 0.35 0.71 (0.51–1.00) 0.05
TNF (log Scale) (each 1 mg/dl unit increase) 0.79 (0.42–1.47) 0.45 0.92 (0.46–1.85) 0.82
CRP (log Scale) (each 1 mg/dl unit increase) 1.07 (0.88–1.31) 0.5 1.12 (0.87–1.4) 0.39
LDL (each 1 mg/dl unit increase) 1.0 (1.0–1.01) 0.43 1.0 (1.0–1.0) 0.93
HDL (each 1 mg/dl unit increase) 0.98 (0.96–1.0) 0.05 0.97 (0.95–1.0) 0.02
Cholesterol (each 1 mg/dl unit increase) 1.0 (0.99–1.0) 0.98 1.0 (0.98–1.01) 0.66
Blood hemoglobin (each 1 mg/dl unit increase) 1.2 (0.94–1.61) 0.13 1.2 (0.92–1.65) 0.16
*In adjusted analysis age, gender, diabetes, albumin, body mass index, creatinine, hemoglobin, total ironbinding capacity, normalized protein
catabolic rate and logarithm of 3 inflammatory markers. Log interleukin6, log tumor necrosis factor alpha, log C-reactive protein were included ascovariates
J Ren Nutr. Author manuscript; available in PMC 2013 May 01.
NIH
-PA Author Manuscript
NIH
-PA Author Manuscript
NIH
-PA Author Manuscript
Feroze et al. Page 18
Table 4
Hazard Ratio of 33 month mortality according to quartiles of Endotoxin in 306 maintenance hemodialysispatients.
Endotoxin Quartiles Q1(n=77)
HR(%CI)(0.26–0.90)
Q2(n=76)
HR(%CI)(0.91–1.26)
Q3(n=76)
HR(%CI)(1.28–2.23)
Q4(n=77)
HR(%CI)(>=2.24)
Unadjusted 0.97(0.49–1.92)
P=0.09
1(Reference) 1.40(0.75–2.7)
P=0.28
0.89(0.45–1.75)
P=0.73
Case-mix* 1.16(0.58–2.3)
P=0.67
1(Reference) 1.60(0.58–2.3)
P=0.2
0.88(0.44–1.76)
P=0.73
Previous + MICS# 1.07(0.51–2.22)
P=0.85
1(Reference) 1.64(0.84–3.2)
P=0.14
0.82(0.40–1.69)
P=0.60
Previous + inflammation†(full mode) 1.07(0.50–2.28)
P=0.86
1(Reference) 1.83(0.93–3.6)
P=0.08
0.84(0.40–1.75)
P=0.64
Abbreviation: CI, confidence interval; HR, Hazard Ratio; MICs, Malnutrition-inflammation-cachexia syndrome.
*Case-Mix variables includes age, sex, race/ethnicity, diabetes, and log vintage
#MICS variables includes values for albumin, creatinine, hemoglobin, total iron-binding capacity, normalized protein catabolic rate, and body mass
index.
†Full Model consists of case mix and MICS and logarithm of 3 inflammatory markers: C-reactive protein, interleukin 6, and tumor necrosis factor-α
J Ren Nutr. Author manuscript; available in PMC 2013 May 01.
Copyright © 2022 FDOKUMEN