Evolutionary game theory in an agent-based brain tumor model: Exploring the...
11
Journal of Theoretical Biology 238 (2006) 146–156 Evolutionary game theory in an agent-based brain tumor model: Exploring the ‘Genotype–Phenotype’ link Yuri Mansury a,b , Mark Diggory c , Thomas S. Deisboeck a,b, a Complex Biosystems Modeling Laboratory, HST-Biomedical Engineering Center, Massachusetts Institute of Technology, Cambridge, MA 02139, USA b Harvard-MIT (HST), Athinoula A. Martinos Center for Biomedical Imaging, Massachusetts General Hospital, Charlestown, MA 02129, USA c Harvard-MIT Data Centre, Harvard University, Cambridge, MA 02138, USA Received 9 February 2005; accepted 4 May 2005 Available online 2 August 2005 Abstract To investigate the genotype–phenotype link in a polyclonal cancer cell population, here we introduce evolutionary game theory into our previously developed agent-based brain tumor model. We model the heterogeneous cell population as a mixture of two distinct genotypes: the more proliferative Type A and the more migratory Type B. Our agent-based simulations reveal a phase transition in the tumor’s velocity of spatial expansion linking the tumor fitness to genotypic composition. Specifically, velocity initially falls as rising payoffs reward the interactions among the more stationary Type A cells, but unexpectedly accelerates again when these A–A payoffs increase even further. At this latter accelerating stage, fewer migratory Type B cells appear to confer a competitive advantage in terms of the tumor’s spatial aggression over the overall numerically dominating Type A cells, which in turn leads to an acceleration of the overall tumor dynamics while its surface roughness declines. We discuss potential implications of our findings for cancer research. r 2005 Elsevier Ltd. All rights reserved. Keywords: Gliomas; Game theory; Agent based; Tumor modeling 1. Introduction This manuscript proposes a game-theory framework to extend our previously developed spatio-temporal agent-based model of brain tumor cells (Mansury and Deisboeck 2003, 2004). In addition to rapid tissue invasion (Giese et al., 1996), these neoplasms are characterized by extensive heterogeneity (Shapiro, 1986), which contributes to the failure of current treatment modalities. Since integrating a game-theory module allows the modeling of cell–cell interactions in a polyclonal population of tumor cells, this step is, from a tumor biology perspective, a logical extension from our previously ‘monoclonal’ model that focused on pheno- typic alterations. In particular, here we have a hetero- genous population of tumor cells with two subpopulations that can be distinguished based on their distinct genotypes. The interactions among tumor cells and between cells and environment create the diame- trically opposing forces of cooperation and competition, which can lead to nonlinear dynamics and complex spatial pattern. Cooperation emerges when a group of tumor cells together generate a synergistic effect in the form of higher fitness levels than those of individually isolated cells. At the same time, however, these cells also spatially compete with each other to occupy more permissive locations characterized by nutrient abun- dance. The discreteness of our agent-based model, where the smallest unit of observation is an individual tumor cell, naturally complements a game-theory module. Such a module focuses on pairwise cell–cell interactions, which require a spatially explicit model because they ARTICLE IN PRESS www.elsevier.com/locate/yjtbi 0022-5193/$ - see front matter r 2005 Elsevier Ltd. All rights reserved. doi:10.1016/j.jtbi.2005.05.027 Corresponding author. Complex Biosystems Modeling Labora- tory, Harvard-MIT (HST) Athinoula A. Martinos Center for Biomedical Imaging, Massachusetts General Hospital-East, Rm. 2301, Bldg. 149, 13th Street, Charlestown, MA 02129, USA. Tel.: +1 617 724 1845; fax: +1 617 726 5079 E-mail address: [email protected] (T.S. Deisboeck).
-
Upload
independent -
Category
Documents
-
view
5 -
download
0
Transcript of Evolutionary game theory in an agent-based brain tumor model: Exploring the...
ARTICLE IN PRESS
0022-5193/$ - se
doi:10.1016/j.jtb
�Correspondtory, Harvard
Biomedical Im
2301, Bldg. 14
+1617 724 184
E-mail addre
Journal of Theoretical Biology 238 (2006) 146–156
www.elsevier.com/locate/yjtbi
Evolutionary game theory in an agent-based brain tumor model:Exploring the ‘Genotype–Phenotype’ link
Yuri Mansurya,b, Mark Diggoryc, Thomas S. Deisboecka,b,�
aComplex Biosystems Modeling Laboratory, HST-Biomedical Engineering Center, Massachusetts Institute of Technology, Cambridge, MA 02139, USAbHarvard-MIT (HST), Athinoula A. Martinos Center for Biomedical Imaging, Massachusetts General Hospital, Charlestown, MA 02129, USA
cHarvard-MIT Data Centre, Harvard University, Cambridge, MA 02138, USA
Received 9 February 2005; accepted 4 May 2005
Available online 2 August 2005
Abstract
To investigate the genotype–phenotype link in a polyclonal cancer cell population, here we introduce evolutionary game theory
into our previously developed agent-based brain tumor model. We model the heterogeneous cell population as a mixture of two
distinct genotypes: the more proliferative Type A and the more migratory Type B. Our agent-based simulations reveal a phase
transition in the tumor’s velocity of spatial expansion linking the tumor fitness to genotypic composition. Specifically, velocity
initially falls as rising payoffs reward the interactions among the more stationary Type A cells, but unexpectedly accelerates again
when these A–A payoffs increase even further. At this latter accelerating stage, fewer migratory Type B cells appear to confer a
competitive advantage in terms of the tumor’s spatial aggression over the overall numerically dominating Type A cells, which in turn
leads to an acceleration of the overall tumor dynamics while its surface roughness declines. We discuss potential implications of our
findings for cancer research.
r 2005 Elsevier Ltd. All rights reserved.
Keywords: Gliomas; Game theory; Agent based; Tumor modeling
1. Introduction
This manuscript proposes a game-theory frameworkto extend our previously developed spatio-temporalagent-based model of brain tumor cells (Mansury andDeisboeck 2003, 2004). In addition to rapid tissueinvasion (Giese et al., 1996), these neoplasms arecharacterized by extensive heterogeneity (Shapiro,1986), which contributes to the failure of currenttreatment modalities. Since integrating a game-theorymodule allows the modeling of cell–cell interactions in apolyclonal population of tumor cells, this step is, from atumor biology perspective, a logical extension from our
e front matter r 2005 Elsevier Ltd. All rights reserved.
i.2005.05.027
ing author. Complex Biosystems Modeling Labora-
-MIT (HST) Athinoula A. Martinos Center for
aging, Massachusetts General Hospital-East, Rm.
9, 13th Street, Charlestown, MA 02129, USA. Tel.:
5; fax: +1617 726 5079
ss: [email protected] (T.S. Deisboeck).
previously ‘monoclonal’ model that focused on pheno-typic alterations. In particular, here we have a hetero-genous population of tumor cells with twosubpopulations that can be distinguished based on theirdistinct genotypes. The interactions among tumor cellsand between cells and environment create the diame-trically opposing forces of cooperation and competition,which can lead to nonlinear dynamics and complexspatial pattern. Cooperation emerges when a group oftumor cells together generate a synergistic effect in theform of higher fitness levels than those of individuallyisolated cells. At the same time, however, these cells alsospatially compete with each other to occupy morepermissive locations characterized by nutrient abun-dance. The discreteness of our agent-based model, wherethe smallest unit of observation is an individual tumorcell, naturally complements a game-theory module.Such a module focuses on pairwise cell–cell interactions,which require a spatially explicit model because they
ARTICLE IN PRESSY. Mansury et al. / Journal of Theoretical Biology 238 (2006) 146–156 147
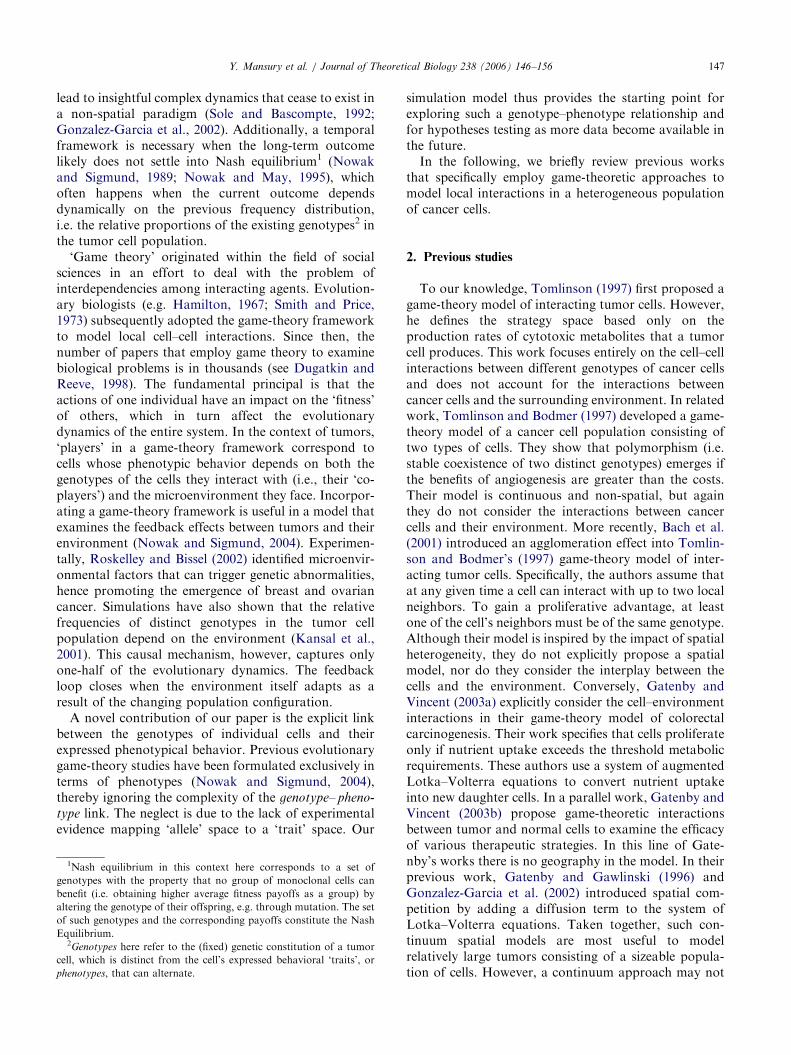
lead to insightful complex dynamics that cease to exist ina non-spatial paradigm (Sole and Bascompte, 1992;Gonzalez-Garcia et al., 2002). Additionally, a temporalframework is necessary when the long-term outcomelikely does not settle into Nash equilibrium1 (Nowakand Sigmund, 1989; Nowak and May, 1995), whichoften happens when the current outcome dependsdynamically on the previous frequency distribution,i.e. the relative proportions of the existing genotypes2 inthe tumor cell population.
‘Game theory’ originated within the field of socialsciences in an effort to deal with the problem ofinterdependencies among interacting agents. Evolution-ary biologists (e.g. Hamilton, 1967; Smith and Price,1973) subsequently adopted the game-theory frameworkto model local cell–cell interactions. Since then, thenumber of papers that employ game theory to examinebiological problems is in thousands (see Dugatkin andReeve, 1998). The fundamental principal is that theactions of one individual have an impact on the ‘fitness’of others, which in turn affect the evolutionarydynamics of the entire system. In the context of tumors,‘players’ in a game-theory framework correspond tocells whose phenotypic behavior depends on both thegenotypes of the cells they interact with (i.e., their ‘co-players’) and the microenvironment they face. Incorpor-ating a game-theory framework is useful in a model thatexamines the feedback effects between tumors and theirenvironment (Nowak and Sigmund, 2004). Experimen-tally, Roskelley and Bissel (2002) identified microenvir-onmental factors that can trigger genetic abnormalities,hence promoting the emergence of breast and ovariancancer. Simulations have also shown that the relativefrequencies of distinct genotypes in the tumor cellpopulation depend on the environment (Kansal et al.,2001). This causal mechanism, however, captures onlyone-half of the evolutionary dynamics. The feedbackloop closes when the environment itself adapts as aresult of the changing population configuration.
A novel contribution of our paper is the explicit linkbetween the genotypes of individual cells and theirexpressed phenotypical behavior. Previous evolutionarygame-theory studies have been formulated exclusively interms of phenotypes (Nowak and Sigmund, 2004),thereby ignoring the complexity of the genotype– pheno-
type link. The neglect is due to the lack of experimentalevidence mapping ‘allele’ space to a ‘trait’ space. Our
1Nash equilibrium in this context here corresponds to a set of
genotypes with the property that no group of monoclonal cells can
benefit (i.e. obtaining higher average fitness payoffs as a group) by
altering the genotype of their offspring, e.g. through mutation. The set
of such genotypes and the corresponding payoffs constitute the Nash
Equilibrium.2Genotypes here refer to the (fixed) genetic constitution of a tumor
cell, which is distinct from the cell’s expressed behavioral ‘traits’, or
phenotypes, that can alternate.
simulation model thus provides the starting point forexploring such a genotype–phenotype relationship andfor hypotheses testing as more data become available inthe future.
In the following, we briefly review previous worksthat specifically employ game-theoretic approaches tomodel local interactions in a heterogeneous populationof cancer cells.
2. Previous studies
To our knowledge, Tomlinson (1997) first proposed agame-theory model of interacting tumor cells. However,he defines the strategy space based only on theproduction rates of cytotoxic metabolites that a tumorcell produces. This work focuses entirely on the cell–cellinteractions between different genotypes of cancer cellsand does not account for the interactions betweencancer cells and the surrounding environment. In relatedwork, Tomlinson and Bodmer (1997) developed a game-theory model of a cancer cell population consisting oftwo types of cells. They show that polymorphism (i.e.stable coexistence of two distinct genotypes) emerges ifthe benefits of angiogenesis are greater than the costs.Their model is continuous and non-spatial, but againthey do not consider the interactions between cancercells and their environment. More recently, Bach et al.(2001) introduced an agglomeration effect into Tomlin-son and Bodmer’s (1997) game-theory model of inter-acting tumor cells. Specifically, the authors assume thatat any given time a cell can interact with up to two localneighbors. To gain a proliferative advantage, at leastone of the cell’s neighbors must be of the same genotype.Although their model is inspired by the impact of spatialheterogeneity, they do not explicitly propose a spatialmodel, nor do they consider the interplay between thecells and the environment. Conversely, Gatenby andVincent (2003a) explicitly consider the cell–environmentinteractions in their game-theory model of colorectalcarcinogenesis. Their work specifies that cells proliferateonly if nutrient uptake exceeds the threshold metabolicrequirements. These authors use a system of augmentedLotka–Volterra equations to convert nutrient uptakeinto new daughter cells. In a parallel work, Gatenby andVincent (2003b) propose game-theoretic interactionsbetween tumor and normal cells to examine the efficacyof various therapeutic strategies. In this line of Gate-nby’s works there is no geography in the model. In theirprevious work, Gatenby and Gawlinski (1996) andGonzalez-Garcia et al. (2002) introduced spatial com-petition by adding a diffusion term to the system ofLotka–Volterra equations. Taken together, such con-tinuum spatial models are most useful to modelrelatively large tumors consisting of a sizeable popula-tion of cells. However, a continuum approach may not

ARTICLE IN PRESS
Table 1
The distinctions between genotypes A and B in terms of their
genetically encoded capability to proliferate, migrate, and commu-
nicate with other cells via gap junctions
Genetic composition
Type A Highly proliferative genotype
High number of gap junctions
Type B Highly migratory genotype
Low number of gap junctions
Y. Mansury et al. / Journal of Theoretical Biology 238 (2006) 146–156148
be suitable during the crucial early stages of tumorigen-esis characterized by a small, discrete number of tumorcells. Yet, from a systems perspective, it is arguably thespatio-temporal behavior of this initially relatively smallnumber of tumor cells that subsequently establishes theevolutionary trajectory of the tumor (see, e.g. Mansuryand Deisboeck, 2003, 2004). Specifically, the tumor’saverage spatial velocity determines how quickly cancercells invade their surrounding brain parenchyma, whichin turn often determines the patient’s prognosis.
The following section details the game-theory moduleextending our previously developed agent-based modelof malignant brain cancer (Mansury and Deisboeck,2003, 2004). As in our previous works, we alsohypothesize here that migrating tumor cells3 are biasedrandom walkers guided by the presence of environ-mental stimuli when they invade the (virtual) brainparenchyma. However, here we choose to include onlynutrient gradients as the pertinent environmental factorswhile excluding toxic metabolites and mechanicalconfinements. Such a simplified setup allows us toestablish the cause–effect link between the tumor and itsmicroenvironment more transparently.
3. Model
3.1. Game-theory module
‘Strategic’ interactions among virtual cancer cells canbe represented by a simple model of evolutionary gametheory. Such a framework means that an interactionbetween two cells confers certain ‘payoffs’ whose specificvalue depends on the genotypes of the interacting cancercells. In turn, these payoffs determine the cells’phenotypic behavior, thus completing the genotype–phenotype mapping. Here we will consider local inter-actions only: a cancer cell can interact only with itsneighbor cells located in an adjacent location one latticesite away sharing a common border.
The game-theory features of our model are as follows:Initially at time t ¼ 0 there are two equal-size sub-populations of cancer cells that can be distinguishedbased on their genotypes: A and B. We assume that thegenetic makeups, resulting from mutational events, aresuch that genotype A is highly proliferative and exhibitshigher inclination to communicate with other cells viagap junctions, while genotype B is highly migratoryand performs lesser gap junction communications (seeTable 1). We emphasize here that genotype A can alsomigrate (and genotype B can also proliferate); however,under the same environmental conditions genotype A
3Although we are aware of the 2D/3D distinction between cell
migration and invasion, in here, we have used these two terms
interchangeably to merely describe cell motility.
has higher probability to proliferate than genotype B(while genotype B has higher probability to migrate).For now, neglecting further mutational events, thesegenotypes are fixed properties that never change duringthe lifetime of these virtual tumor cells.
Given the two genotypes, there are thus three possiblepairs of interacting cells, namely A–A, A–B, and B–B.Let N ¼ f1; 2; . . . ; ng be the set of all viable cells in thepopulation, which can be broken down into nA,t cells ofType A and nB,t cells of Type B, nA+nB ¼ n. Therelative proportions (i.e. frequencies) of these distinctgenotypes in the total population are therefore f A ¼
nA=n and f B ¼ 1� f A for Type A and B, respectively.When a pair of cells interacts, each cell is rewarded withcertain ‘payoffs’, which affect their phenotypic behaviorin terms of growth or migratory activities. In contrast togenotypic composition, phenotypic behavior can alterdepending on the cell’s partner of interaction and on theenvironmental factors. A payoff matrix summarizes therewards for cell interactions affecting their phenotypes,but whose magnitude depends on the genotypes of theinteracting cells, thus establishing the genotype–pheno-type link.
The left-most column in Table 2 indicates thegenotypes receiving the rewards (i.e. the ‘player’)whereas the top row represents the genotypes ofthe cells they are interacting with (i.e. the ‘co-player’).Table 2 thus indicates that when two cells of Type Ameet, each cell is rewarded with payoffs a. Similarlywhen two cells of Type B interact, each receivespayoffs g. An interesting event occurs when cells ofdifferent genotypes interact because the outcome can beasymmetric. In this case when a Type A and a Type Bmeet, the former is rewarded with b and the latter withd. The expected payoff for an individual Type A cell isthen
EA ¼ f Aaþ ð1� f AÞb, (1)
and for a Type B
EB ¼ f Bgþ ð1� f BÞd. (2)
If greater phenotypic payoffs in terms of proliferation aswell as migratory activities correspond to higher fitnesslevels, then the average fitness of the entire tumor system
ARTICLE IN PRESS
Table 2
Generic phenotypic payoff matrix of interactions between tumor cell
genotypes A and B
Encounter with
Type A genotype Type B genotype
Payoffs to Type A a bType B d g
Y. Mansury et al. / Journal of Theoretical Biology 238 (2006) 146–156 149
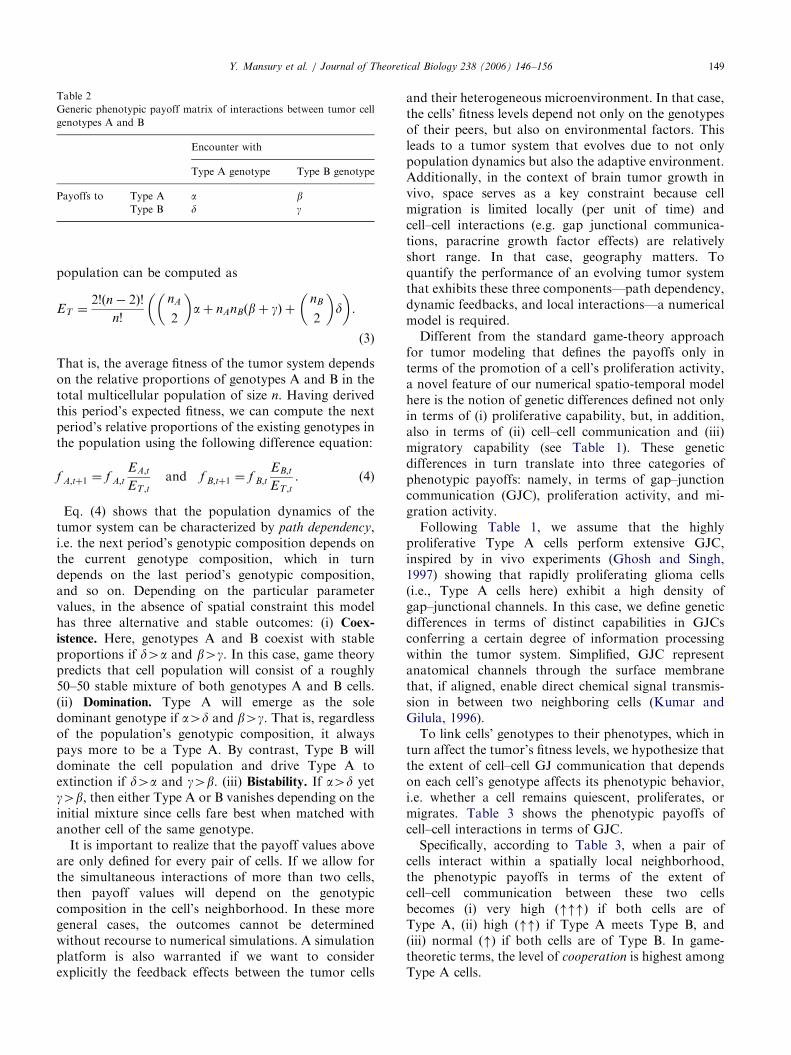
population can be computed as
ET ¼2!ðn� 2Þ!
n!
nA
2
� �aþ nAnBðbþ gÞ þ
nB
2
� �d
� �.
(3)
That is, the average fitness of the tumor system dependson the relative proportions of genotypes A and B in thetotal multicellular population of size n. Having derivedthis period’s expected fitness, we can compute the nextperiod’s relative proportions of the existing genotypes inthe population using the following difference equation:
f A;tþ1 ¼ f A;t
EA;t
ET ;tand f B;tþ1 ¼ f B;t
EB;t
ET ;t. (4)
Eq. (4) shows that the population dynamics of thetumor system can be characterized by path dependency,i.e. the next period’s genotypic composition depends onthe current genotype composition, which in turndepends on the last period’s genotypic composition,and so on. Depending on the particular parametervalues, in the absence of spatial constraint this modelhas three alternative and stable outcomes: (i) Coex-
istence. Here, genotypes A and B coexist with stableproportions if d4a and b4g. In this case, game theorypredicts that cell population will consist of a roughly50–50 stable mixture of both genotypes A and B cells.(ii) Domination. Type A will emerge as the soledominant genotype if a4d and b4g. That is, regardlessof the population’s genotypic composition, it alwayspays more to be a Type A. By contrast, Type B willdominate the cell population and drive Type A toextinction if d4a and g4b. (iii) Bistability. If a4d yetg4b, then either Type A or B vanishes depending on theinitial mixture since cells fare best when matched withanother cell of the same genotype.
It is important to realize that the payoff values aboveare only defined for every pair of cells. If we allow forthe simultaneous interactions of more than two cells,then payoff values will depend on the genotypiccomposition in the cell’s neighborhood. In these moregeneral cases, the outcomes cannot be determinedwithout recourse to numerical simulations. A simulationplatform is also warranted if we want to considerexplicitly the feedback effects between the tumor cells
and their heterogeneous microenvironment. In that case,the cells’ fitness levels depend not only on the genotypesof their peers, but also on environmental factors. Thisleads to a tumor system that evolves due to not onlypopulation dynamics but also the adaptive environment.Additionally, in the context of brain tumor growth invivo, space serves as a key constraint because cellmigration is limited locally (per unit of time) andcell–cell interactions (e.g. gap junctional communica-tions, paracrine growth factor effects) are relativelyshort range. In that case, geography matters. Toquantify the performance of an evolving tumor systemthat exhibits these three components—path dependency,dynamic feedbacks, and local interactions—a numericalmodel is required.
Different from the standard game-theory approachfor tumor modeling that defines the payoffs only interms of the promotion of a cell’s proliferation activity,a novel feature of our numerical spatio-temporal modelhere is the notion of genetic differences defined not onlyin terms of (i) proliferative capability, but, in addition,also in terms of (ii) cell–cell communication and (iii)migratory capability (see Table 1). These geneticdifferences in turn translate into three categories ofphenotypic payoffs: namely, in terms of gap–junctioncommunication (GJC), proliferation activity, and mi-gration activity.
Following Table 1, we assume that the highlyproliferative Type A cells perform extensive GJC,inspired by in vivo experiments (Ghosh and Singh,1997) showing that rapidly proliferating glioma cells(i.e., Type A cells here) exhibit a high density ofgap–junctional channels. In this case, we define geneticdifferences in terms of distinct capabilities in GJCsconferring a certain degree of information processingwithin the tumor system. Simplified, GJC representanatomical channels through the surface membranethat, if aligned, enable direct chemical signal transmis-sion in between two neighboring cells (Kumar andGilula, 1996).
To link cells’ genotypes to their phenotypes, which inturn affect the tumor’s fitness levels, we hypothesize thatthe extent of cell–cell GJ communication that dependson each cell’s genotype affects its phenotypic behavior,i.e. whether a cell remains quiescent, proliferates, ormigrates. Table 3 shows the phenotypic payoffs ofcell–cell interactions in terms of GJC.
Specifically, according to Table 3, when a pair ofcells interact within a spatially local neighborhood,the phenotypic payoffs in terms of the extent ofcell–cell communication between these two cellsbecomes (i) very high """ð Þ if both cells are ofType A, (ii) high ""ð Þ if Type A meets Type B, and(iii) normal "ð Þ if both cells are of Type B. In game-theoretic terms, the level of cooperation is highest amongType A cells.
ARTICLE IN PRESS
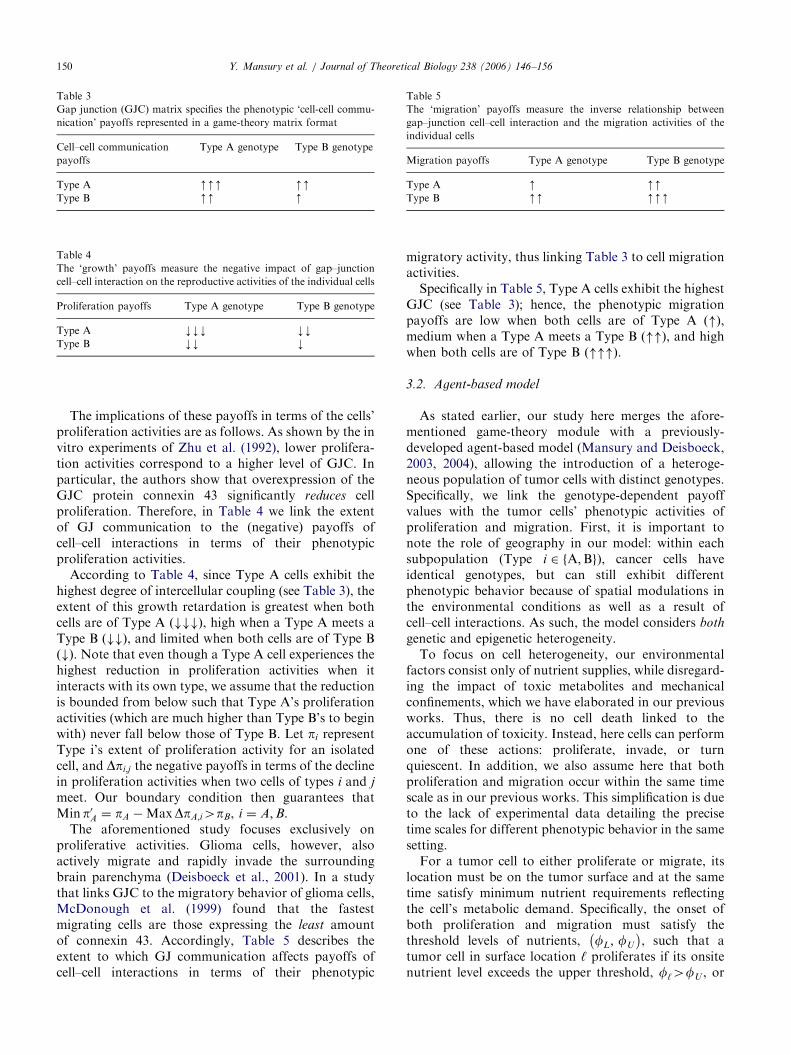
Table 3
Gap junction (GJC) matrix specifies the phenotypic ‘cell-cell commu-
nication’ payoffs represented in a game-theory matrix format
Cell–cell communication
payoffs
Type A genotype Type B genotype
Type A mmm mmType B mm m
Table 4
The ‘growth’ payoffs measure the negative impact of gap–junction
cell–cell interaction on the reproductive activities of the individual cells
Proliferation payoffs Type A genotype Type B genotype
Type A kkk kkType B kk k
Table 5
The ‘migration’ payoffs measure the inverse relationship between
gap–junction cell–cell interaction and the migration activities of the
individual cells
Migration payoffs Type A genotype Type B genotype
Type A m mmType B mm mmm
Y. Mansury et al. / Journal of Theoretical Biology 238 (2006) 146–156150
The implications of these payoffs in terms of the cells’proliferation activities are as follows. As shown by the invitro experiments of Zhu et al. (1992), lower prolifera-tion activities correspond to a higher level of GJC. Inparticular, the authors show that overexpression of theGJC protein connexin 43 significantly reduces cellproliferation. Therefore, in Table 4 we link the extentof GJ communication to the (negative) payoffs ofcell–cell interactions in terms of their phenotypicproliferation activities.
According to Table 4, since Type A cells exhibit thehighest degree of intercellular coupling (see Table 3), theextent of this growth retardation is greatest when bothcells are of Type A ###ð Þ, high when a Type A meets aType B ##ð Þ, and limited when both cells are of Type B#ð Þ. Note that even though a Type A cell experiences thehighest reduction in proliferation activities when itinteracts with its own type, we assume that the reductionis bounded from below such that Type A’s proliferationactivities (which are much higher than Type B’s to beginwith) never fall below those of Type B. Let pi representType i’s extent of proliferation activity for an isolatedcell, and Dpi;j the negative payoffs in terms of the declinein proliferation activities when two cells of types i and j
meet. Our boundary condition then guarantees thatMinp0A ¼ pA �MaxDpA;i4pB, i ¼ A;B.
The aforementioned study focuses exclusively onproliferative activities. Glioma cells, however, alsoactively migrate and rapidly invade the surroundingbrain parenchyma (Deisboeck et al., 2001). In a studythat links GJC to the migratory behavior of glioma cells,McDonough et al. (1999) found that the fastestmigrating cells are those expressing the least amountof connexin 43. Accordingly, Table 5 describes theextent to which GJ communication affects payoffs ofcell–cell interactions in terms of their phenotypic
migratory activity, thus linking Table 3 to cell migrationactivities.
Specifically in Table 5, Type A cells exhibit the highestGJC (see Table 3); hence, the phenotypic migrationpayoffs are low when both cells are of Type A "ð Þ,medium when a Type A meets a Type B ""ð Þ, and highwhen both cells are of Type B """ð Þ.
3.2. Agent-based model
As stated earlier, our study here merges the afore-mentioned game-theory module with a previously-developed agent-based model (Mansury and Deisboeck,2003, 2004), allowing the introduction of a heteroge-neous population of tumor cells with distinct genotypes.Specifically, we link the genotype-dependent payoffvalues with the tumor cells’ phenotypic activities ofproliferation and migration. First, it is important tonote the role of geography in our model: within eachsubpopulation (Type i 2 fA;Bg), cancer cells haveidentical genotypes, but can still exhibit differentphenotypic behavior because of spatial modulations inthe environmental conditions as well as a result ofcell–cell interactions. As such, the model considers both
genetic and epigenetic heterogeneity.To focus on cell heterogeneity, our environmental
factors consist only of nutrient supplies, while disregard-ing the impact of toxic metabolites and mechanicalconfinements, which we have elaborated in our previousworks. Thus, there is no cell death linked to theaccumulation of toxicity. Instead, here cells can performone of these actions: proliferate, invade, or turnquiescent. In addition, we also assume here that bothproliferation and migration occur within the same timescale as in our previous works. This simplification is dueto the lack of experimental data detailing the precisetime scales for different phenotypic behavior in the samesetting.
For a tumor cell to either proliferate or migrate, itslocation must be on the tumor surface and at the sametime satisfy minimum nutrient requirements reflectingthe cell’s metabolic demand. Specifically, the onset ofboth proliferation and migration must satisfy thethreshold levels of nutrients, fL; fU
� �, such that a
tumor cell in surface location ‘ proliferates if its onsitenutrient level exceeds the upper threshold, f‘4fU , or

ARTICLE IN PRESSY. Mansury et al. / Journal of Theoretical Biology 238 (2006) 146–156 151
migrates to the surrounding parenchyma wheneverfLof‘ofU . Alive tumor cells that are trapped insidethe tumor (hence are incapable of either proliferating ormoving) or reside in locations with inadequate nutrientsless than the lower threshold, f‘ofL, enter a reversible,quiescent state.
3.2.1. Cell proliferation
The link between the game-theory module and thecells’ proliferative activity is established the followingway. We propose that the probability to proliferate for aType i cell, i 2 fA;Bg, in location ‘ is determined in thefollowing way:
Prproliferate;j ¼ f‘= f‘ þ kprolif ;i
� �; i 2 fA;Bg, (5)
where the parameter kprolif ;i controls the extent ofproliferation activity such that the higher its magnitude,the less likely proliferation can occur. Eq. (5) can beinterpreted as the fitness generating functions of a Type i
cell (Brown and Vincent, 1992), which specifies how anindividual cell’s proliferative activity relates to both thegenotype of its neighbor (via kprolif ;i; i 2 fA;Bg) and thelocation-specific environmental factor (i.e. the onsitelevels of nutrients f‘). As we have assumed in Table 1,Type A cells are highly proliferative genetically rightfrom their origin (i.e., kprolif ;Aokprolif ;B). Because of theexperimentally proven phenotypic dichotomy betweengrowth and migration (Giese et al., 1996; Mariani et al.,2001) that is built into our agent-based algorithm,during their lifetime genetically more proliferative (andthus epigenetically, more proliferative active) Type Acells will also have lower probability (phenotypically) tomigrate to the surrounding parenchyma. It is importantto note here that in our model a cell with a specificgenotype (either A or B) over its lifetime is capable ofboth proliferating and migrating, yet at any given
moment if the cell is non-quiescent, then it can onlyeither proliferate or migrate, but not both at the sametime. For example, at time tþ 1 a cell that migrated inprevious time t can certainly proliferate if certainenvironmental and spatial conditions are satisfied (seethe Algorithm Implementation section below for specificdetails of these conditions), and vice versa.
In the absence of more specific experimental data, weassume for now a negative, linear link between theextent of GJ communication (Table 3) and phenotypicproliferation activities: k0prolif ;i ¼ pi;jkprolif ;i, i; j 2 fA;Bg.That is, the payoffs pi;j adjust downward the prolif-erative activity of a tumor cell whenever cell–cellinteraction occurs. In particular, following Table 4,pA;A4pA;B4pB;B with pA;B ¼ pB;A. For example, a TypeA cell experiences the largest reduction in proliferativeactivities when it meets another Type A, whereas a TypeB cell meeting a same-type cell experiences the leastreduction. At any given time, however, a cell caninteract with all its neighbors sharing a common border
in the West, Northwest, North, Northeast, East, South-east, South, and Southwest (i.e. the so-called ‘Mooreneighborhood’). When multiple interactions occursimultaneously, we assume a multiplicative rule:
k0prolif ;i ¼ kprolif ;i
Yj
pi;j, (6)
where i; j 2 fA;Bg and cell j 2 i’s neighborhood.
3.2.2. Cell migration
Migrating cells compare the strength of chemical,diffusive signals that their local neighbors transmit. Thismodeling concept follows earlier works by Sander andDeisboeck (2002) arguing that ‘homotype’ attractorsignals aid the emergence of branch-like migrationpatterns seen in experimental setups (Deisboeck et al.,2001). Such signals represent, e.g., the protein ligandTGF-a, which, after being secreted by the tumor cellsthemselves, acts paracrine in that it binds to the tumorcells’ epidermal growth factor receptor. Specifically, themagnitude of the signal Sk that a cell k transmits fromlocation ‘ at time t is a function of the current onsitelevel of nutrients, augmented by the signals transmittedby the cell’s neighbors at time t� 1:
SkðtÞ ¼ f ½f‘ðtÞ� þXn
m¼0
wmSmðt� 1Þ, (7)
where m 2 k’s set of nearest neighbors and wm
denotes the distance-dependent weight. We definef ½f‘ðtÞ� ¼ 1� 1=f‘ðtÞ, implying @f =@f40, i.e. highernutrient levels amplify the magnitude of these paracrinesignals, and hence guide the migration trajectory oftumor cells along the chemotactic path of ‘highestattraction’ (for this concept, see Deisboeck et al.,2001). We detail the numerical method calculating thesignal weights in Eq. (11). Furthermore, we argue herethat lower levels of GJ communication are associatedwith higher activities of migration phenotypically asmediated by the stronger signal Sk: S0k ¼ mi;jSk,i; j 2 fA;Bg, and mi;j41. This inverse relationshipfollows McDonough et al. (1999), who argue thatsuppressing connexin-43 expression (i.e. lower GJcommunication) allows glioma cells to detachfrom their neighbors, which in turn should acceleratemigration. Following Table 5, we assume thatmB;B4mA;B4mA;A, i.e. a B–B interaction triggers cellmotility through significant amplification, mB;B,of the signal strength that guides migration. Note,however, that since we have the same time scale forboth proliferation and migration in the currentsetting, this signal amplification mechanism has alesser impact on B–B interactions than would beexpected otherwise. Again a multiplicative ruleprevails when a cell interacts with several local
ARTICLE IN PRESSY. Mansury et al. / Journal of Theoretical Biology 238 (2006) 146–156152
neighbors simultaneously:
S0k ¼ S0k
Yj
mi;j , (8)
where i; j 2 fA;Bg. An eligible cell m invades a neighbor-ing location that transmits the strongest signal, art maxS0k, k 2 m’s set of nearest neighbors.
3.2.3. Microenvironment
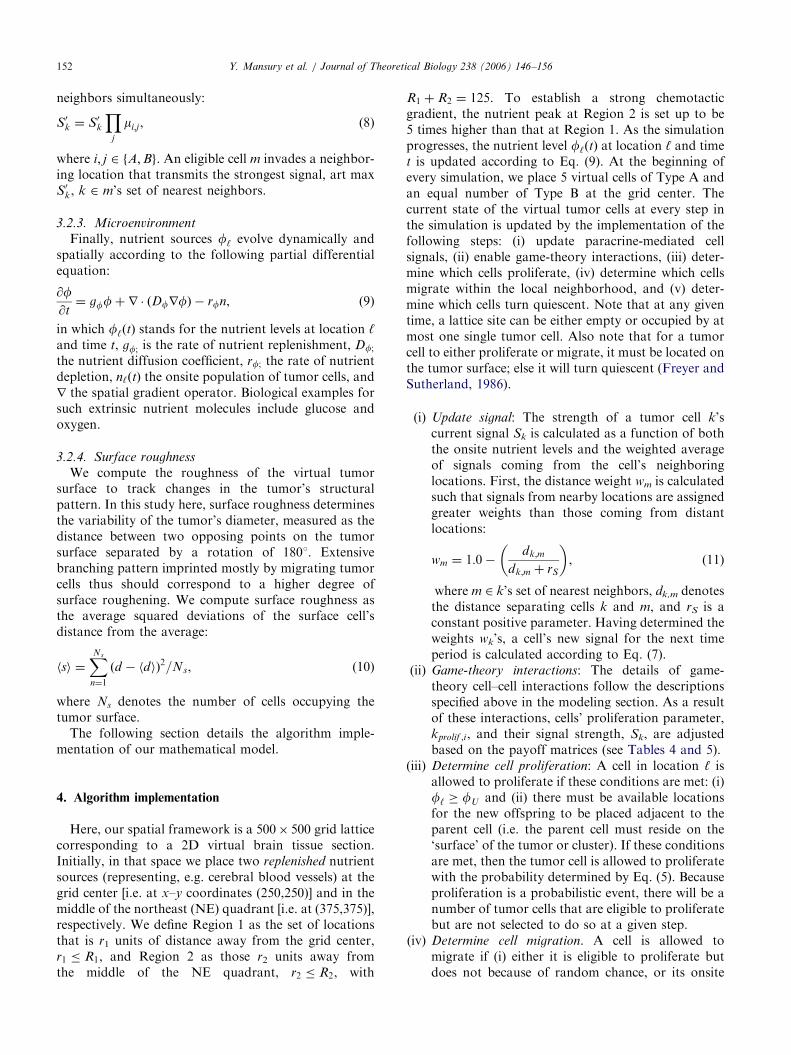
Finally, nutrient sources f‘ evolve dynamically andspatially according to the following partial differentialequation:
@f@t¼ gffþ r � ðDfrfÞ � rfn, (9)
in which f‘ðtÞ stands for the nutrient levels at location ‘and time t, gf; is the rate of nutrient replenishment, Df;
the nutrient diffusion coefficient, rf; the rate of nutrientdepletion, n‘ðtÞ the onsite population of tumor cells, andr the spatial gradient operator. Biological examples forsuch extrinsic nutrient molecules include glucose andoxygen.
3.2.4. Surface roughness
We compute the roughness of the virtual tumorsurface to track changes in the tumor’s structuralpattern. In this study here, surface roughness determinesthe variability of the tumor’s diameter, measured as thedistance between two opposing points on the tumorsurface separated by a rotation of 1801. Extensivebranching pattern imprinted mostly by migrating tumorcells thus should correspond to a higher degree ofsurface roughening. We compute surface roughness asthe average squared deviations of the surface cell’sdistance from the average:
sh i ¼XNs
n¼1
d � dh ið Þ2=Ns, (10)
where Ns denotes the number of cells occupying thetumor surface.
The following section details the algorithm imple-mentation of our mathematical model.
4. Algorithm implementation
Here, our spatial framework is a 500� 500 grid latticecorresponding to a 2D virtual brain tissue section.Initially, in that space we place two replenished nutrientsources (representing, e.g. cerebral blood vessels) at thegrid center [i.e. at x–y coordinates (250,250)] and in themiddle of the northeast (NE) quadrant [i.e. at (375,375)],respectively. We define Region 1 as the set of locationsthat is r1 units of distance away from the grid center,r1 � R1, and Region 2 as those r2 units away fromthe middle of the NE quadrant, r2 � R2, with
R1 þ R2 ¼ 125. To establish a strong chemotacticgradient, the nutrient peak at Region 2 is set up to be5 times higher than that at Region 1. As the simulationprogresses, the nutrient level f‘ðtÞ at location ‘ and timet is updated according to Eq. (9). At the beginning ofevery simulation, we place 5 virtual cells of Type A andan equal number of Type B at the grid center. Thecurrent state of the virtual tumor cells at every step inthe simulation is updated by the implementation of thefollowing steps: (i) update paracrine-mediated cellsignals, (ii) enable game-theory interactions, (iii) deter-mine which cells proliferate, (iv) determine which cellsmigrate within the local neighborhood, and (v) deter-mine which cells turn quiescent. Note that at any giventime, a lattice site can be either empty or occupied by atmost one single tumor cell. Also note that for a tumorcell to either proliferate or migrate, it must be located onthe tumor surface; else it will turn quiescent (Freyer andSutherland, 1986).
(i)
Update signal: The strength of a tumor cell k’scurrent signal Sk is calculated as a function of boththe onsite nutrient levels and the weighted averageof signals coming from the cell’s neighboringlocations. First, the distance weight wm is calculatedsuch that signals from nearby locations are assignedgreater weights than those coming from distantlocations:wm ¼ 1:0�dk;m
dk;m þ rS
� �, (11)
where m 2 k’s set of nearest neighbors, dk,m denotesthe distance separating cells k and m, and rS is aconstant positive parameter. Having determined theweights wk’s, a cell’s new signal for the next timeperiod is calculated according to Eq. (7).
(ii)
Game-theory interactions: The details of game-theory cell–cell interactions follow the descriptionsspecified above in the modeling section. As a resultof these interactions, cells’ proliferation parameter,kprolif ;i, and their signal strength, Sk, are adjustedbased on the payoff matrices (see Tables 4 and 5).(iii)
Determine cell proliferation: A cell in location ‘ isallowed to proliferate if these conditions are met: (i)f‘ � fU and (ii) there must be available locationsfor the new offspring to be placed adjacent to theparent cell (i.e. the parent cell must reside on the‘surface’ of the tumor or cluster). If these conditionsare met, then the tumor cell is allowed to proliferatewith the probability determined by Eq. (5). Becauseproliferation is a probabilistic event, there will be anumber of tumor cells that are eligible to proliferatebut are not selected to do so at a given step.(iv)
Determine cell migration. A cell is allowed tomigrate if (i) either it is eligible to proliferate butdoes not because of random chance, or its onsite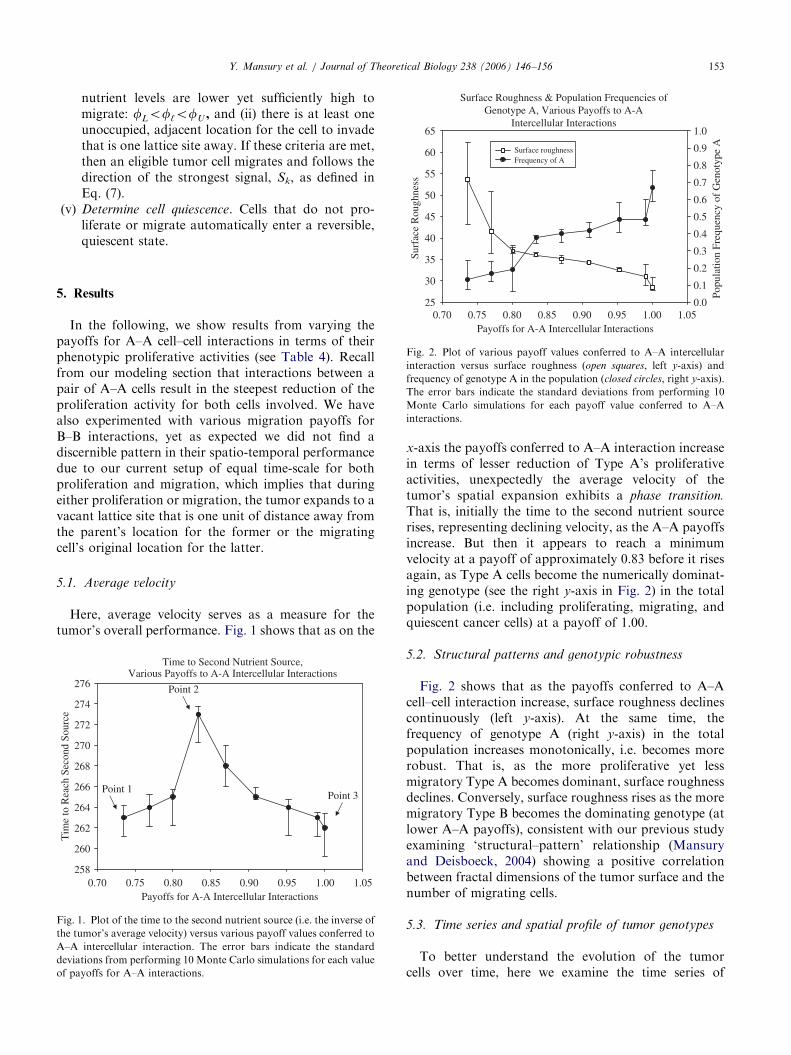
ARTICLE IN PRESST
ime
to R
each
Sec
ond
Sour
ce
2
2
2
2
2
2
2
2
2
2
Fig.
the tu
A–A
devia
of pa
Surface Roughness & Population Frequencies of Genotype A, Various Payoffs to A-A Intercellular Interactions
hnes
s
50
55
60
65
of G
enot
ype
A
0.6
0.7
0.8
0.9
1.0
Surface roughnessFrequency of A
Y. Mansury et al. / Journal of Theoretical Biology 238 (2006) 146–156 153
nutrient levels are lower yet sufficiently high tomigrate: fLof‘ofU , and (ii) there is at least oneunoccupied, adjacent location for the cell to invadethat is one lattice site away. If these criteria are met,then an eligible tumor cell migrates and follows thedirection of the strongest signal, Sk, as defined inEq. (7).
oug
cy
(v)
rfac
e R
40
45
Freq
uen
0.4
0.5
Determine cell quiescence. Cells that do not pro-liferate or migrate automatically enter a reversible,quiescent state.Payoffs for A-A Intercellular Interactions0.70 0.75 0.80 0.85 0.90 0.95 1.00 1.05
Su
25
30
35
Popu
latio
n
0.0
0.1
0.2
0.3
Fig. 2. Plot of various payoff values conferred to A–A intercellular
interaction versus surface roughness (open squares, left y-axis) and
frequency of genotype A in the population (closed circles, right y-axis).
The error bars indicate the standard deviations from performing 10
Monte Carlo simulations for each payoff value conferred to A–A
interactions.
5. Results
In the following, we show results from varying thepayoffs for A–A cell–cell interactions in terms of theirphenotypic proliferative activities (see Table 4). Recallfrom our modeling section that interactions between apair of A–A cells result in the steepest reduction of theproliferation activity for both cells involved. We havealso experimented with various migration payoffs forB–B interactions, yet as expected we did not find adiscernible pattern in their spatio-temporal performancedue to our current setup of equal time-scale for bothproliferation and migration, which implies that duringeither proliferation or migration, the tumor expands to avacant lattice site that is one unit of distance away fromthe parent’s location for the former or the migratingcell’s original location for the latter.
5.1. Average velocity
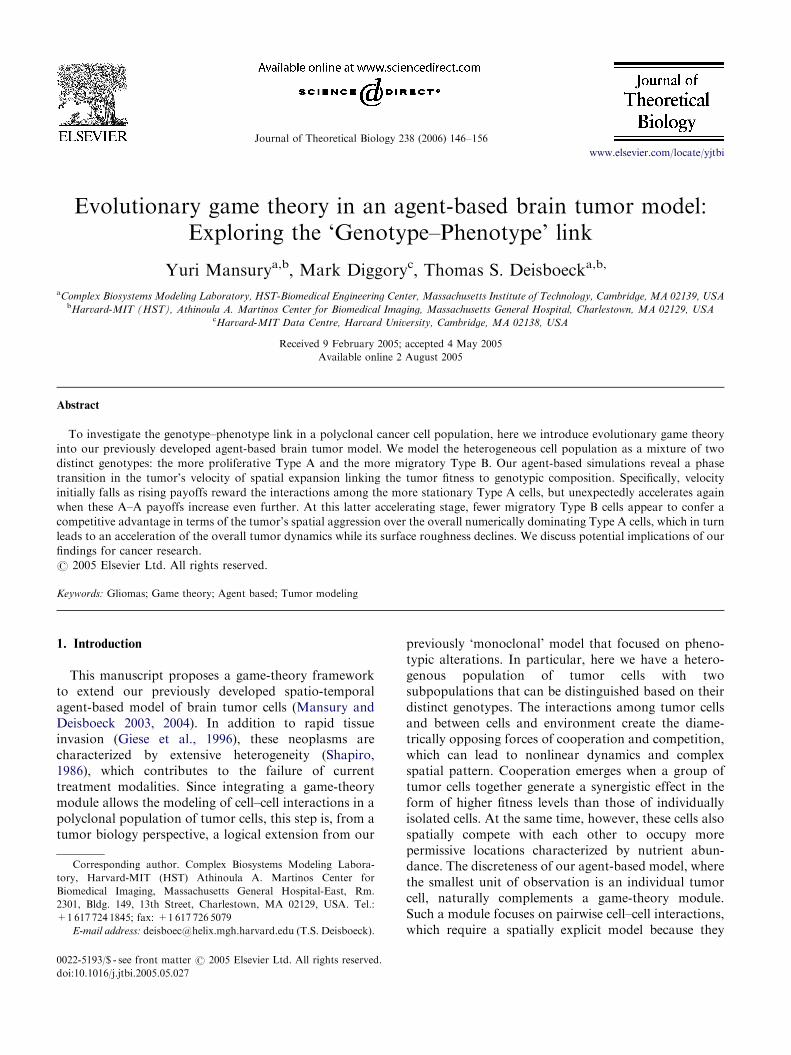
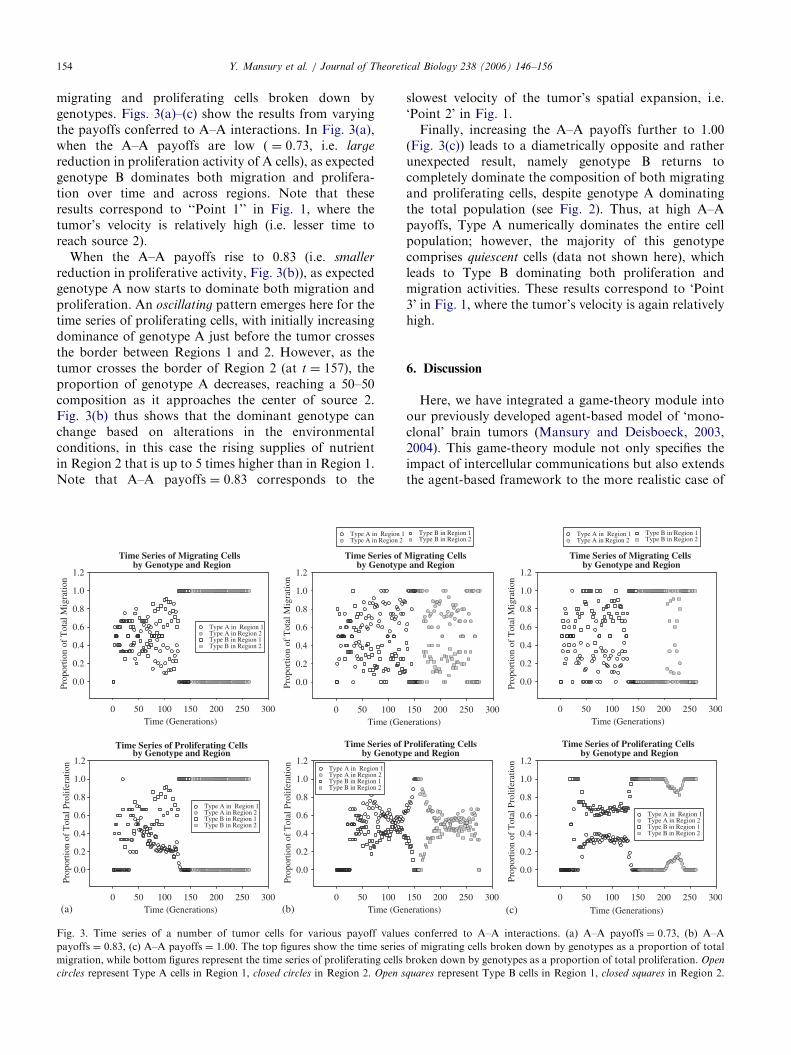
Here, average velocity serves as a measure for thetumor’s overall performance. Fig. 1 shows that as on the
Time to Second Nutrient Source,Various Payoffs to A-A Intercellular Interactions
Payoffs for A-A Intercellular Interactions0.70 0.75 0.80 0.85 0.90 0.95 1.00 1.05
58
60
62
64
66
68
70
72
74
76
Point 1
Point 2
Point 3
1. Plot of the time to the second nutrient source (i.e. the inverse of
mor’s average velocity) versus various payoff values conferred to
intercellular interaction. The error bars indicate the standard
tions from performing 10 Monte Carlo simulations for each value
yoffs for A–A interactions.
x-axis the payoffs conferred to A–A interaction increasein terms of lesser reduction of Type A’s proliferativeactivities, unexpectedly the average velocity of thetumor’s spatial expansion exhibits a phase transition.
That is, initially the time to the second nutrient sourcerises, representing declining velocity, as the A–A payoffsincrease. But then it appears to reach a minimumvelocity at a payoff of approximately 0.83 before it risesagain, as Type A cells become the numerically dominat-ing genotype (see the right y-axis in Fig. 2) in the totalpopulation (i.e. including proliferating, migrating, andquiescent cancer cells) at a payoff of 1.00.
5.2. Structural patterns and genotypic robustness
Fig. 2 shows that as the payoffs conferred to A–Acell–cell interaction increase, surface roughness declinescontinuously (left y-axis). At the same time, thefrequency of genotype A (right y-axis) in the totalpopulation increases monotonically, i.e. becomes morerobust. That is, as the more proliferative yet lessmigratory Type A becomes dominant, surface roughnessdeclines. Conversely, surface roughness rises as the moremigratory Type B becomes the dominating genotype (atlower A–A payoffs), consistent with our previous studyexamining ‘structural–pattern’ relationship (Mansuryand Deisboeck, 2004) showing a positive correlationbetween fractal dimensions of the tumor surface and thenumber of migrating cells.
5.3. Time series and spatial profile of tumor genotypes
To better understand the evolution of the tumorcells over time, here we examine the time series of
ARTICLE IN PRESSY. Mansury et al. / Journal of Theoretical Biology 238 (2006) 146–156154
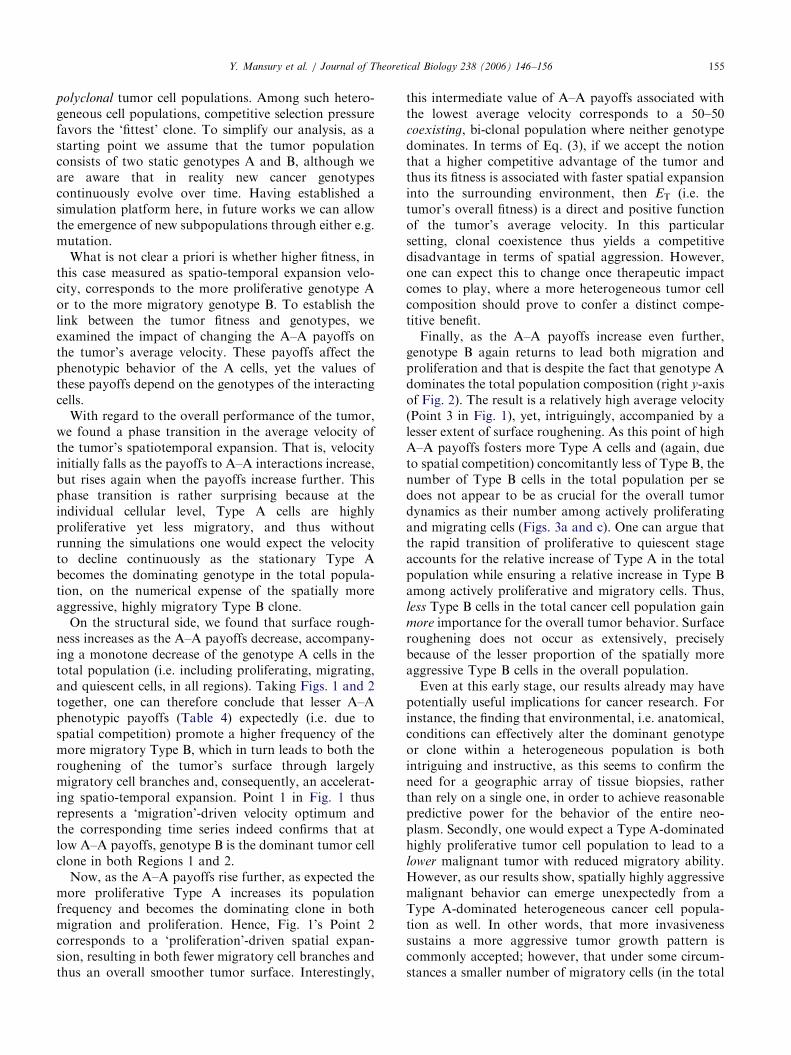
migrating and proliferating cells broken down bygenotypes. Figs. 3(a)–(c) show the results from varyingthe payoffs conferred to A–A interactions. In Fig. 3(a),when the A–A payoffs are low ( ¼ 0.73, i.e. large
reduction in proliferation activity of A cells), as expectedgenotype B dominates both migration and prolifera-tion over time and across regions. Note that theseresults correspond to ‘‘Point 1’’ in Fig. 1, where thetumor’s velocity is relatively high (i.e. lesser time toreach source 2).
When the A–A payoffs rise to 0.83 (i.e. smaller
reduction in proliferative activity, Fig. 3(b)), as expectedgenotype A now starts to dominate both migration andproliferation. An oscillating pattern emerges here for thetime series of proliferating cells, with initially increasingdominance of genotype A just before the tumor crossesthe border between Regions 1 and 2. However, as thetumor crosses the border of Region 2 (at t ¼ 157), theproportion of genotype A decreases, reaching a 50–50composition as it approaches the center of source 2.Fig. 3(b) thus shows that the dominant genotype canchange based on alterations in the environmentalconditions, in this case the rising supplies of nutrientin Region 2 that is up to 5 times higher than in Region 1.Note that A–A payoffs ¼ 0.83 corresponds to the
Time Series of Migrating Cells by Genotype and Region
Time (Generations)0 50 100 150 200 250 300
Prop
ortio
n of
Tot
al M
igra
tion
0.0
0.2
0.4
0.6
0.8
1.0
1.2
Type A in Region 1 Type A in Region 2Type B in Region 1 Type B in Region 2
Time Series of by Genotype
Time (Ge0 50 100
Prop
ortio
n of
Tot
al M
igra
tion
0.0
0.2
0.4
0.6
0.8
1.0
1.2
Time Series of Proliferating Cells by Genotype and Region
Time (Generations)0 50 100 150 200 250 300
Prop
ortio
n of
Tot
al P
rolif
erat
ion
0.0
0.2
0.4
0.6
0.8
1.0
1.2
Time Series of by Genotyp
Time (Ge0 50 100
Prop
ortio
n of
Tot
al P
rolif
erat
ion
0.0
0.2
0.4
0.6
0.8
1.0
1.2Type A in Region 1 Type A in Region 2Type B in Region 1 Type B in Region 2
Type A in Region 1 Type A in Region 2Type B in Region 1 Type B in Region 2
Type A in Region 1Type A in Region 2
(a) (b)
Fig. 3. Time series of a number of tumor cells for various payoff value
payoffs ¼ 0.83, (c) A–A payoffs ¼ 1.00. The top figures show the time series
migration, while bottom figures represent the time series of proliferating cells
circles represent Type A cells in Region 1, closed circles in Region 2. Open s
slowest velocity of the tumor’s spatial expansion, i.e.‘Point 2’ in Fig. 1.
Finally, increasing the A–A payoffs further to 1.00(Fig. 3(c)) leads to a diametrically opposite and ratherunexpected result, namely genotype B returns tocompletely dominate the composition of both migratingand proliferating cells, despite genotype A dominatingthe total population (see Fig. 2). Thus, at high A–Apayoffs, Type A numerically dominates the entire cellpopulation; however, the majority of this genotypecomprises quiescent cells (data not shown here), whichleads to Type B dominating both proliferation andmigration activities. These results correspond to ‘Point3’ in Fig. 1, where the tumor’s velocity is again relativelyhigh.
6. Discussion
Here, we have integrated a game-theory module intoour previously developed agent-based model of ‘mono-clonal’ brain tumors (Mansury and Deisboeck, 2003,2004). This game-theory module not only specifies theimpact of intercellular communications but also extendsthe agent-based framework to the more realistic case of
Migrating Cells and Region
nerations)150 200 250 300
Time Series of Migrating Cells by Genotype and Region
Time (Generations)0 50 100 150 200 250 300
Prop
ortio
n of
Tot
al M
igra
tion
0.0
0.2
0.4
0.6
0.8
1.0
1.2
Proliferating Cells e and Region
nerations)150 200 250 300
Time Series of Proliferating Cells by Genotype and Region
Time (Generations)
0 50 100 150 200 250 300
Prop
ortio
n of
Tot
al P
rolif
erat
ion
0.0
0.2
0.4
0.6
0.8
1.0
1.2
Type A in Region 1 Type A in Region 2Type B in Region 1 Type B in Region 2
Type B in Region 1 Type B in Region 2
Type A in Region 1 Type A in Region 2
Type B in Region 1 Type B in Region 2
(c)
s conferred to A–A interactions. (a) A–A payoffs ¼ 0.73, (b) A–A
of migrating cells broken down by genotypes as a proportion of total
broken down by genotypes as a proportion of total proliferation. Open
quares represent Type B cells in Region 1, closed squares in Region 2.
ARTICLE IN PRESSY. Mansury et al. / Journal of Theoretical Biology 238 (2006) 146–156 155
polyclonal tumor cell populations. Among such hetero-geneous cell populations, competitive selection pressurefavors the ‘fittest’ clone. To simplify our analysis, as astarting point we assume that the tumor populationconsists of two static genotypes A and B, although weare aware that in reality new cancer genotypescontinuously evolve over time. Having established asimulation platform here, in future works we can allowthe emergence of new subpopulations through either e.g.mutation.
What is not clear a priori is whether higher fitness, inthis case measured as spatio-temporal expansion velo-city, corresponds to the more proliferative genotype Aor to the more migratory genotype B. To establish thelink between the tumor fitness and genotypes, weexamined the impact of changing the A–A payoffs onthe tumor’s average velocity. These payoffs affect thephenotypic behavior of the A cells, yet the values ofthese payoffs depend on the genotypes of the interactingcells.
With regard to the overall performance of the tumor,we found a phase transition in the average velocity ofthe tumor’s spatiotemporal expansion. That is, velocityinitially falls as the payoffs to A–A interactions increase,but rises again when the payoffs increase further. Thisphase transition is rather surprising because at theindividual cellular level, Type A cells are highlyproliferative yet less migratory, and thus withoutrunning the simulations one would expect the velocityto decline continuously as the stationary Type Abecomes the dominating genotype in the total popula-tion, on the numerical expense of the spatially moreaggressive, highly migratory Type B clone.
On the structural side, we found that surface rough-ness increases as the A–A payoffs decrease, accompany-ing a monotone decrease of the genotype A cells in thetotal population (i.e. including proliferating, migrating,and quiescent cells, in all regions). Taking Figs. 1 and 2together, one can therefore conclude that lesser A–Aphenotypic payoffs (Table 4) expectedly (i.e. due tospatial competition) promote a higher frequency of themore migratory Type B, which in turn leads to both theroughening of the tumor’s surface through largelymigratory cell branches and, consequently, an accelerat-ing spatio-temporal expansion. Point 1 in Fig. 1 thusrepresents a ‘migration’-driven velocity optimum andthe corresponding time series indeed confirms that atlow A–A payoffs, genotype B is the dominant tumor cellclone in both Regions 1 and 2.
Now, as the A–A payoffs rise further, as expected themore proliferative Type A increases its populationfrequency and becomes the dominating clone in bothmigration and proliferation. Hence, Fig. 1’s Point 2corresponds to a ‘proliferation’-driven spatial expan-sion, resulting in both fewer migratory cell branches andthus an overall smoother tumor surface. Interestingly,
this intermediate value of A–A payoffs associated withthe lowest average velocity corresponds to a 50–50coexisting, bi-clonal population where neither genotypedominates. In terms of Eq. (3), if we accept the notionthat a higher competitive advantage of the tumor andthus its fitness is associated with faster spatial expansioninto the surrounding environment, then ET (i.e. thetumor’s overall fitness) is a direct and positive functionof the tumor’s average velocity. In this particularsetting, clonal coexistence thus yields a competitivedisadvantage in terms of spatial aggression. However,one can expect this to change once therapeutic impactcomes to play, where a more heterogeneous tumor cellcomposition should prove to confer a distinct compe-titive benefit.
Finally, as the A–A payoffs increase even further,genotype B again returns to lead both migration andproliferation and that is despite the fact that genotype Adominates the total population composition (right y-axisof Fig. 2). The result is a relatively high average velocity(Point 3 in Fig. 1), yet, intriguingly, accompanied by alesser extent of surface roughening. As this point of highA–A payoffs fosters more Type A cells and (again, dueto spatial competition) concomitantly less of Type B, thenumber of Type B cells in the total population per sedoes not appear to be as crucial for the overall tumordynamics as their number among actively proliferatingand migrating cells (Figs. 3a and c). One can argue thatthe rapid transition of proliferative to quiescent stageaccounts for the relative increase of Type A in the totalpopulation while ensuring a relative increase in Type Bamong actively proliferative and migratory cells. Thus,less Type B cells in the total cancer cell population gainmore importance for the overall tumor behavior. Surfaceroughening does not occur as extensively, preciselybecause of the lesser proportion of the spatially moreaggressive Type B cells in the overall population.
Even at this early stage, our results already may havepotentially useful implications for cancer research. Forinstance, the finding that environmental, i.e. anatomical,conditions can effectively alter the dominant genotypeor clone within a heterogeneous population is bothintriguing and instructive, as this seems to confirm theneed for a geographic array of tissue biopsies, ratherthan rely on a single one, in order to achieve reasonablepredictive power for the behavior of the entire neo-plasm. Secondly, one would expect a Type A-dominatedhighly proliferative tumor cell population to lead to alower malignant tumor with reduced migratory ability.However, as our results show, spatially highly aggressivemalignant behavior can emerge unexpectedly from aType A-dominated heterogeneous cancer cell popula-tion as well. In other words, that more invasivenesssustains a more aggressive tumor growth pattern iscommonly accepted; however, that under some circum-stances a smaller number of migratory cells (in the total
ARTICLE IN PRESSY. Mansury et al. / Journal of Theoretical Biology 238 (2006) 146–156156
population) can come to dominate the tumor’s emergentdynamics, potentially without even causing noticeablestructural changes, is rather alarming given thatcancerous structures need to reach a certain size tobecome detectable on image, a prerequisite for image-guided biopsies in clinics.
In a future work, we plan among other extensions tospecify different time scales along with allowing morethan one cell per lattice site for proliferation andmigration, thus allowing B–B migration payoffs togenerate distinct spatiotemporal patterns. Adding muta-tional events in order to trigger progressive changes ofthe currently static genotypes will render the frameworkbiologically more realistic and should provide a startingpoint to explore the coupling between proliferationcapabilities and mutation rates for glioma cells, asSasaki and Nowak (2003) have done for the generaltheoretical case. Another potential extension would beto include other environmental variables, such as toxicmetabolites and mechanical confinements, and toexamine the impact of the former on cell death andthe latter on varying cell densities.
In summary, this model and its future iterationsshould prove useful in our effort to better understandthe underlying mechanisms of tumorigenesis based onthe genotypic–phenotypic link, and thus support theclaim that game theory approaches will soon gain anessential role in interdisciplinary cancer research.
Acknowledgments
This work has been supported by Grants CA 085139and CA 113004 from the National Institutes of Healthand by the Harvard-MIT (HST) Athinoula A. MartinosCenter for Biomedical Imaging and the Department ofRadiology at Massachusetts General Hospital. Y.M. isthe recipient of an NCI-Training Grant Fellowship fromthe National Institutes of Health (CA 09502).
References
Bach, L.A., Bentzen, S.M., Alsner, J., Christiansen, F.B., 2001. An
evolutionary-game model of tumour–cell interactions: possible
relevance to gene therapy. Eur. J. Cancer 37, 2116–2120.
Brown, J.S., Vincent, T.L., 1992. Organization of predator–prey
communities as an evolutionary game. Evolution 46, 1269–1283.
Deisboeck, T.S., Berens, M.E., Kansal, A.R., Torquato, S., Stemmer-
Rachamimov, A.O., Chiocca, E.A., 2001. Pattern of self-organiza-
tion in tumor systems: complex growth dynamics in a novel brain
tumor spheroid model. Cell Prolif 34, 115–134.
Dugatkin, L.A., Reeve, H.K., 1998. Game Theory and Animal
Behavior, Eds. Oxford University Press, Oxford.
Freyer, J.P., Sutherland, R.M., 1986. Regulation of growth saturation
and development of necrosis in EMT6/Ro multicellular spheroids
by the glucose and oxygen supply. Cancer Res 46, 3504–3512.
Gatenby, R.A., Gawlinski, E.T., 1996. A reaction–diffusion model of
cancer invasion. Cancer Res 56, 5745–5753.
Gatenby, R.A., Vincent, T.L., 2003a. An evolutionary model of
carcinogenesis. Cancer Res 63, 6212–6220.
Gatenby, R.A., Vincent, T.L., 2003b. Application of quantitative
models from population biology and evolutionary game theory
to tumor therapeutic strategies. Mol. Cancer Ther. 2 (9),
919–927.
Ghosh, P., Singh, U.N., 1997. Intercellular communication in rapidly
proliferating and differentiated C6 glioma cells in culture. Cell Biol.
Int. 21 (9), 551–557.
Giese, A., Loo, M.A., Tran, N., Haskett, D., Coons, S., Berens, M.E.,
1996. Dichotomy of astrocytoma migration and proliferation. Int.
J. Cancer 67, 275–282.
Gonzalez-Garcia, I., Sole, R.V., Costa, J., 2002. Metapopulation
dynamics and spatial heterogeneity in cancer. Proc. Natl Acad. Sci.
USA 20, 13085–13089.
Hamilton, W.D., 1967. Extraordinary sex ratios. Science 156, 477–488.
Kansal, A.R., Torquato, S., Chiocca, E.A., Deisboeck, T.S., 2001.
Emergence of a subpopulation in a computational model of tumor
growth. J. Theor. Biol. 207 (3), 431–441.
Kumar, N.M., Gilula, N.B., 1996. The gap junction communication
channel. Cell 84, 381–388.
Mansury, Y., Deisboeck, T.S., 2003. The impact of ‘search-precision’
in an agent-based tumor model. J. Theor. Biol. 224, 325–337.
Mansury, Y., Deisboeck, T.S., 2004. Simulating ‘structure–function’
patterns of malignant brain tumors. Physica A 331, 219–232.
Mariani, L., Beaudry, C., McDonough, W.S., Hoelzinger, D.B.,
Demuth, T., Ross, K.R., Berens, T., Coons, S.W., Watts, G.,
Trent, J.M., Wei, J.S., Giese, A., Berens, M.E., 2001. Glioma cell
motility is associated with reduced transcription of proapoptotic
and proliferation genes: a cDNA microarray analysis. Neuroon-
cology 53, 161–176.
McDonough, W.S., Johansson, A., Joffee, H., Giese, A., Berens, M.E.,
1999. Gap junction intercellular communication in gliomas is
inversely related to cell motility. Int. J. Dev. Neurosci. 17 (5-6),
601–611.
Nowak, M.A., May, R.M., 1995. Evolutionary games and chaos.
Nature 359, 826–829.
Nowak, M.A., Sigmund, K., 1989. Oscillation in the evolution of
reciprocity. J. Theor. Biol. 137, 21–26.
Nowak, M.A., Sigmund, K., 2004. Evolutionary dynamics of
biological games. Science 303, 793–799.
Roskelley, C.D., Bissel, M.J., 2002. The dominance of the micro-
environment in breast and ovarian cancer. Semin. Cancer Biol. 12,
97–104.
Sander, L.M., Deisboeck, T.S., 2002. Growth patterns of microscopic
brain tumors. Phys. Rev. E 66, 051901.
Sasaki, A., Nowak, M.A., 2003. Mutation landscapes. J. Theor. Biol.
224, 241–247.
Shapiro, J.R., 1986. Biology of gliomas: heterogeneity, oncogenes,
growth factors. Semin. Oncol. 13, 4–15.
Smith, J.M., Price, G.R., 1973. The logic of animal conflict. Nature
246, 15–18.
Sole, R.V., Bascompte, J., 1992. Stability and complexity in spatially-
extended two-species competition. J. Theor. Biol. 159, 469–480.
Tomlinson, I.P.M., 1997. Game–theory interactions between tumour
cells. Eur. J. Cancer 33, 1495–1500.
Tomlinson, I.P.M., Bodmer, W.F., 1997. Modelling the conse-
quences of interactions between tumour cells. Brit. J. Cancer 75,
157–160.
Zhu, D., Kidder, G.M., Caveney, S., Naus, C.C., 1992. Growth
retardation in glioma cells cocultured with cells overexpressing a
gap junction protein. Proc. Natl Acad. Sci. USA. 89 (21),
10218–10221.