Evolutionary factors affecting the cross-species utility of newly developed microsatellite markers...
13
Evolutionary factors affecting the cross-species utility of newly developed microsatellite markers in seabirds YOSHAN MOODLEY,*, † JUAN F. MASELLO, ‡ THERESA L. COLE, ‡ , § LUCIANO CALDERON, ‡ GOPI K. MUNIMANDA, † MARCO R. THALI, ¶ RACHAEL ALDERMAN,** RICHARD J. CUTHBERT, †† MANUEL MARIN, ‡‡ , §§ MELANIE MASSARO, ¶¶ JOAN NAVARRO,*** RICHARD A. PHILLIPS, ††† PETER G. RYAN, ‡‡‡ CRISTI AN G. SUAZO, ‡ YVES CHEREL, §§§ HENRI WEIMERSKIRCH§§§ andPETRA QUILLFELDT ‡ *Department of Zoology, University of Venda, Private Bag X5050, Thohoyandou 0950, South Africa, †Department of Integrative Biology and Evolution, Konrad Lorenz Institute for Ethology, University of Veterinary Medicine Vienna, Savoyenstr. 1a, A-1160 Vienna, Austria, ‡Justus Liebig University Giessen, Department of Animal Ecology & Systematics, Heinrich-Buff-Ring 38, D- 35392 Giessen, Germany, §Trace and Environmental DNA Laboratory, Department of Environment and Agriculture, Curtin University, Perth, WA 6102, Australia, ¶Ecogenics GmbH, Grabenstrasse 11a, 8952 Zurich-Schlieren, Switzerland, **Department of Primary Industries, Parks, Water and Environment, GPO Box 44, Hobart, Tas. 7001, Australia, ††Royal Society for the Protection of Birds (RSPB), The Lodge, Sandy, Bedfordshire SG19 2DL, UK, ‡‡Section of Ornithology, Natural History Museum of Los Angeles County, 900 Exposition Boulevard, Los Angeles, CA 90007, USA, §§Feather Link Inc., 1013 Westchester Way, Cincinnati, OH 45244, USA, ¶¶School of Environmental Sciences, Charles Sturt University, PO Box 789, Albury, NSW 2640, Australia, ***Department of Conservation Biology, Estaci on Biol ogica de Do~ nana (EBD-CSIC), Avda. Am erico Vespucio s/n, Seville 41092, Spain, †††British Antarctic Survey, Natural Environment Research Council, High Cross, Madingley Road, Cambridge CB3 0ET, UK, ‡‡‡Percy FitzPatrick Institute, DST/NRF Centre of Excellence, University of Cape Town, Rondebosch 7701, South Africa, §§§Centre d’Etudes Biologiques de Chiz e, UMR 7372 CNRS-Universit e de La Rochelle, 79360 Villiers-en-Bois, France Abstract Microsatellite loci are ideal for testing hypotheses relating to genetic segregation at fine spatio-temporal scales. They are also conserved among closely related species, making them potentially useful for clarifying interspe- cific relationships between recently diverged taxa. However, mutations at primer binding sites may lead to increased nonamplification, or disruptions that may result in decreased polymorphism in nontarget species. Fur- thermore, high mutation rates and constraints on allele size may also with evolutionary time, promote an increase in convergently evolved allele size classes, biasing measures of interspecific genetic differentiation. Here, we used next-generation sequencing to develop microsatellite markers from a shotgun genome sequence of the sub-Antarctic seabird, the thin-billed prion (Pachyptila belcheri), that we tested for cross-species amplifi- cation in other Pachyptila and related sub-Antarctic species. We found that heterozygosity decreased and the proportion of nonamplifying loci increased with phylogenetic distance from the target species. Surprisingly, we found that species trees estimated from interspecific F ST provided better approximations of mtDNA relation- ships among the studied species than those estimated using D C , even though F ST was more affected by null alleles. We observed a significantly nonlinear second order polynomial relationship between microsatellite and mtDNA distances. We propose that the loss of linearity with increasing mtDNA distance stems from an increas- ing proportion of homoplastic allele size classes that are identical in state, but not identical by descent. There- fore, despite high cross-species amplification success and high polymorphism among the closely related Pachyptila species, we caution against the use of microsatellites in phylogenetic inference among distantly related taxa. Keywords: cross-species transferability, genetic diversity, microsatellite, null alleles, Pachyptila, Procellariiformes Received 23 July 2014; revision received 12 January 2015; accepted 13 January 2015 Correspondence: Yoshan Moodley, Fax: +43-1-489-09-15-801; E- mail: [email protected] © 2015 John Wiley & Sons Ltd Molecular Ecology Resources (2015) doi: 10.1111/1755-0998.12372
-
Upload
independent -
Category
Documents
-
view
7 -
download
0
Transcript of Evolutionary factors affecting the cross-species utility of newly developed microsatellite markers...
Evolutionary factors affecting the cross-species utility ofnewly developed microsatellite markers in seabirds
YOSHAN MOODLEY,*, † JUAN F. MASELLO,‡ THERESA L. COLE,‡ ,§ LUCIANO CALDERON,‡GOPI K. MUNIMANDA,† MARCO R. THALI,¶ RACHAEL ALDERMAN,** RICHARD J. CUTHBERT,††MANUEL MARIN,‡‡ ,§§ MELANIE MASSARO,¶¶ JOAN NAVARRO,*** RICHARD A. PHILLIPS,†††PETER G. RYAN,‡‡‡ CRISTI �AN G. SUAZO,‡ YVES CHEREL,§§§ HENRI WEIMERSKIRCH§§§and PETRA QUILLFELDT‡
*Department of Zoology, University of Venda, Private Bag X5050, Thohoyandou 0950, South Africa, †Department of Integrative
Biology and Evolution, Konrad Lorenz Institute for Ethology, University of Veterinary Medicine Vienna, Savoyenstr. 1a, A-1160
Vienna, Austria, ‡Justus Liebig University Giessen, Department of Animal Ecology & Systematics, Heinrich-Buff-Ring 38, D-
35392 Giessen, Germany, §Trace and Environmental DNA Laboratory, Department of Environment and Agriculture, Curtin
University, Perth, WA 6102, Australia, ¶Ecogenics GmbH, Grabenstrasse 11a, 8952 Zurich-Schlieren, Switzerland, **Department
of Primary Industries, Parks, Water and Environment, GPO Box 44, Hobart, Tas. 7001, Australia, ††Royal Society for the
Protection of Birds (RSPB), The Lodge, Sandy, Bedfordshire SG19 2DL, UK, ‡‡Section of Ornithology, Natural History Museum
of Los Angeles County, 900 Exposition Boulevard, Los Angeles, CA 90007, USA, §§Feather Link Inc., 1013 Westchester Way,
Cincinnati, OH 45244, USA, ¶¶School of Environmental Sciences, Charles Sturt University, PO Box 789, Albury, NSW 2640,
Australia, ***Department of Conservation Biology, Estaci�on Biol�ogica de Do~nana (EBD-CSIC), Avda. Am�erico Vespucio s/n,
Seville 41092, Spain, †††British Antarctic Survey, Natural Environment Research Council, High Cross, Madingley Road,
Cambridge CB3 0ET, UK, ‡‡‡Percy FitzPatrick Institute, DST/NRF Centre of Excellence, University of Cape Town, Rondebosch
7701, South Africa, §§§Centre d’Etudes Biologiques de Chiz�e, UMR 7372 CNRS-Universit�e de La Rochelle, 79360 Villiers-en-Bois,
France
Abstract
Microsatellite loci are ideal for testing hypotheses relating to genetic segregation at fine spatio-temporal scales.
They are also conserved among closely related species, making them potentially useful for clarifying interspe-
cific relationships between recently diverged taxa. However, mutations at primer binding sites may lead to
increased nonamplification, or disruptions that may result in decreased polymorphism in nontarget species. Fur-
thermore, high mutation rates and constraints on allele size may also with evolutionary time, promote an
increase in convergently evolved allele size classes, biasing measures of interspecific genetic differentiation.
Here, we used next-generation sequencing to develop microsatellite markers from a shotgun genome sequence
of the sub-Antarctic seabird, the thin-billed prion (Pachyptila belcheri), that we tested for cross-species amplifi-
cation in other Pachyptila and related sub-Antarctic species. We found that heterozygosity decreased and the
proportion of nonamplifying loci increased with phylogenetic distance from the target species. Surprisingly, we
found that species trees estimated from interspecific FST provided better approximations of mtDNA relation-
ships among the studied species than those estimated using DC, even though FST was more affected by null
alleles. We observed a significantly nonlinear second order polynomial relationship between microsatellite and
mtDNA distances. We propose that the loss of linearity with increasing mtDNA distance stems from an increas-
ing proportion of homoplastic allele size classes that are identical in state, but not identical by descent. There-
fore, despite high cross-species amplification success and high polymorphism among the closely related
Pachyptila species, we caution against the use of microsatellites in phylogenetic inference among distantly
related taxa.
Keywords: cross-species transferability, genetic diversity, microsatellite, null alleles, Pachyptila, Procellariiformes
Received 23 July 2014; revision received 12 January 2015; accepted 13 January 2015
Correspondence: Yoshan Moodley, Fax: +43-1-489-09-15-801; E-
mail: [email protected]
© 2015 John Wiley & Sons Ltd
Molecular Ecology Resources (2015) doi: 10.1111/1755-0998.12372
Introduction
Two-thirds of our planet is covered by sea, and alba-
trosses, petrels and storm-petrels (Aves, Procellariiformes)
are, par excellence, the seabirds of the open ocean, only
coming ashore to breed, usually on remote islands (Brooke
2004). This highly mobile group of seabirds could theoreti-
cally maintain high levels of gene flow, but strong philop-
atry to breeding islands observed in some species
(Ovenden et al. 1991; Steeves et al. 2005; Bicknell et al.
2012) may lead to pronounced genetic differentiation
between populations. Our understanding of gene flow
and genetic structure in petrels has improved consider-
ably in recent years (Smith et al. 2007; Lawrence et al.
2008; Gangloff et al. 2012; Wiley et al. 2012; Kerr & Dove
2013), but remains poor for the diverse and often wide-
spread species that breed on sub-Antarctic islands.
Petrels (Procellariidae) of the genus Pachyptila, the pri-
ons, are ideal monitors of ocean productivity as they feed
mainly on zooplankton, which responds rapidly to
changing environmental conditions (Hunt et al. 1992;
Bocher et al. 2001; Cherel et al. 2002; Quillfeldt et al. 2007,
2008). Prions are highly mobile and have a wide distribu-
tion in sub-Antarctic waters (Onley & Scofield 2007).
Detailed studies on diet, breeding biology and behavio-
ural ecology have been published for several prion spe-
cies (Strange 1980; Bretagnolle et al. 1990; Liddle 1994;
Ridoux 1994; Reid et al. 1999; Cherel et al. 2002; Quill-
feldt et al. 2003, 2007, 2008; Navarro et al. 2013). Much
less was known about distributions at sea, particularly
during the nonbreeding season. However, recent stable
isotope and tracking studies indicate considerable eco-
logical segregation among populations breeding in the
Atlantic and Indian sectors of the Southern Ocean (Cher-
el et al. 2002, 2006; Quillfeldt et al. 2010, 2013). This spa-
tial and temporal segregation could potentially lead to
population differentiation, with consequences for taxon-
omy and conservation status.
Prions are generally clustered into 2 groups, the spe-
cies with, or without, palatal lamellae, and hence filtering
apparatus (Prince & Morgan 1987). The former (the so-
called ‘whale birds’) includes the Antarctic prion Pachyp-
tila desolata, Salvin’s prion P. salvini and broad-billed
prion P. vittata, and the latter, the thin-billed prion P.
belcheri, fairy prion P. turtur and fulmar prion P. crassiros-
tris. As yet, there are no phylogeographic studies of any
prion species, and only scattered genetic information
exists (e.g. Ovenden et al. 1991). Nor is there agreement
regarding the number of prion species or their genetic
relationships (see Brooke 2004; Penhallurick & Wink
2004; Rheindt & Austin 2005; Onley & Scofield 2007).
Using enzyme electrophoresis, Barrowclough et al.
(1981) concluded that Antarctic prions were closely
related to blue petrels Halobaena caerulea, and Viot et al.
(1993) that Antarctic prions, thin-billed prions and Sal-
vin’s prions were very closely related. The low variation
at the mitochondrial cytochrome b gene also suggests
that Antarctic prions, thin-billed prions and blue petrels
are closely related species (Nunn & Stanley 1998). Based
on the same locus, Penhallurick & Wink (2004) invoked
the multidimensional biological species concept to sug-
gest that all prions represent just two species. However,
this last study was heavily criticized (Rheindt & Austin
2005). Consequently, taxonomic authorities and field
guides still follow the scheme outlined by Bretagnolle
et al. (1990) which concluded from the combination of
morphometrics, breeding biology, genetics and calls that
Antarctic, Salvin’s, thin-billed and fairy prions were dis-
tinct but closely related species. The recent description of
distinct thin- and broad-billed morphs, within broad-
billed prions that also show strong differences in breed-
ing phenology at Gough Island, raises further questions
regarding intra- and interspecific relationships of this
group (Ryan et al. 2014). More genetic data from the
many populations of prions that breed in the sub-Antarc-
tic could potentially shed important light on these open
questions.
Microsatellite loci are powerful tools in population
and evolutionary genetics that could provide the reso-
lution for detailed analyses of several aspects of prion
biology. Given their high mutation rate, they are ideal
for testing hypotheses relating to fine-scale spatiotem-
poral segregation and for the estimation of demo-
graphic parameters such as gene flow, effective
population size and genetic variability (Bruford &
Wayne 1993; Sunnucks 2000). They are also conserved
among closely related species (Moore et al. 1991) mak-
ing them potentially useful for clarifying interspecific
genetic relationships between recently diverged taxa
(e.g. Dawson et al. 2010), although their high mutation
rate means that loci developed for one species may not
always be useful for others. This is because mutations
at primer binding sites may lead to increased nonam-
plification (Moodley et al. 2006), or disruptions within
tandemly repeated elements may lead to a reduced
level of observed polymorphism in the nontarget spe-
cies (Garza et al. 1995; Primmer et al. 2005). The taxa of
interest must therefore be closely related to maximize
utility and offset the costs of microsatellite develop-
ment. Hence, the testing of newly developed microsat-
ellite loci for cross-species utility has become fairly
standard practice (Li et al. 2003; Bried et al. 2008; Daw-
son et al. 2010; Jan et al. 2012; Huang et al. 2014); how-
ever, few surveys have reported statistical trends in
their multispecies data sets.
Here, we used next-generation sequencing technol-
ogy to develop a set of 26 polymorphic microsatellite
markers from a shotgun genome sequence of the
© 2015 John Wiley & Sons Ltd
2 Y. MOODLEY ET AL .
thin-billed prion in order to test for genetic structure
among the different populations of this species and to
provide an accurate estimation of demographic parame-
ters. We also tested these microsatellite loci for cross-
species amplification in other prions, the closely related
blue petrel (all Procellariiformes, Procellariidae) and the
more distantly related Wilson’s storm-petrel Oceanites
oceanicus (Procellariiformes, Hydrobatidae). While prion
species appear to be very closely related, we predict,
nevertheless, that average observed microsatellite
genetic diversity will decrease, whereas the number of
nonamplifying alleles will increase, with increasing phy-
logenetic distance from the species of origin (thin-billed
prion). As any increase in null allele frequency could
bias the estimation of essential population parameters in
phylogeographic studies (e.g. Astanei et al. 2005; Wulff
et al. 2012; McCormack et al. 2013) and perhaps even
alter phylogenetic relationships, we corrected our raw
data for null alleles using methods developed by Cha-
puis & Estoup (2007). This allowed for a comparison of
the effect of null alleles on levels of interspecific differ-
entiation.
Lastly, high microsatellite mutation rates coupled
with mutational limits on allele sizes (Ostrander et al.
1993; Bowcock et al. 1994) increase the probability of con-
vergent evolution of allele size classes. Given this highly
homoplastic scenario, population parameters and evolu-
tionary hypotheses inferred under the assumption that
alleles of the same size share a most recent common
ancestor (i.e. are identical by descent) could be biased,
even in comparisons between sister taxa (Paetkau et al.
1997). We expect, therefore, that microsatellite
genetic distance between species will be biased to lower
values as the evolutionary time separating species
increases.
Materials and methods
Molecular methods
Between 2010 and 2012, samples (all from adults) from
77 thin-billed prions, 79 Antarctic prions, 118 broad-
billed prions, 18 Salvin’s prions, 35 fairy prions, 99 blue
petrels and 6 Wilson’s storm-petrels were obtained in
breeding colonies located on sub-Antarctic island groups
(Noir, Diego Ramirez, Falkland/Malvinas, South Geor-
gia, Tristan da Cunha, Gough, Marion, Kerguelen, Mac-
quarie, and Chatham). Genomic DNA was obtained
from different sample types: blood in ethanol (Gough
and Diego Ramirez), blood in Queens’s lysis buffer (Ker-
guelen and Falkland/Malvinas), blood on FTA classic
cards (Whatman International Ltd., Maidstone, UK;
South Georgia and Chatham), muscle in ethanol (Mac-
quarie, Gough, Tristan da Cunha and Noir) and feather
quills (Marion, Tristan da Cunha and Falkland/Malvin-
as). DNA was extracted from blood (n = 313), feather
quills (n = 101) or muscle tissue (n = 51) using the
Qiagen DNeasy� Tissue kit (Qiagen, Germany). DNA
quantity and quality was determined by UV spectropho-
tometry using a NanoDrop 1000 Spectrophotometer, and
all samples were standardized to a final concentration of
10 ng/lL.Microsatellite-containing genomic sequences were
isolated by ecogenics GmbH (Switzerland) from a 1:1
pool of two thin-billed prion individuals from Mayes
Island in the Kerguelen Archipelago using a modified
high-throughput genomic sequencing approach (Abdelk-
rim et al. 2009). Genomic DNA was nebulized to 300–800 bp and ligated into an ssDNA library. These size-
selected fragments were then enriched for tandemly
repeated element content using magnetic streptavidin
beads and biotin-labelled CT and GT repeat oligonucleo-
tides. This enriched shotgun library was then sequenced
on a Roche 454 next-generation platform using the GS-
FLX titanium reagents. Resulting sequence reads were
passed through quality filters and scanned for microsat-
ellite repeats, from the conserved flanking regions of
which primer pairs were designed using Primer 3 (Un-
tergasser et al. 2012).
After initial testing for amplification and polymor-
phism, microsatellite loci were visualised in the seven
species of petrel through florescent labelling of universal
M13 primers, as described in Schuelke (2000). PCR was
then performed in a final volume of 10 lL including
1 9 Qiagen PCR buffer, 2 mM dNTPs, 2 lM M13-tailed
forward primer, 2 lM reverse primer, 2 lM of universal
M13 primer 50-end-labelled, 0.5 U Hotstar Taq (Qiagen)
and 10 ng template. The PCR program comprised an ini-
tial denaturation step of 95°C for 15 min, the cycling
parameters were 30 cycles at 95°C for 30 s, an annealing
temperature of 56°C for 45 s, 72°C for 45 s, 8 cycles of
95°C for 30 s, 53°C for 45 s, 72°C for 45 s and a final
extension step of 72°C for 30 min. PCR products were
visualized on a 1.5% agarose gel to confirm successful
amplification and to examine negative controls. Products
were run on a AB 3130xl genetic analyser along with a
ROX size-standard. We repeated all PCRs for individuals
that failed to amplify at >4 loci and for those loci with
>10% missing data.
We used an 880-bp fragment of the mitochondrial
cytochrome b gene to estimate the phylogenetic relation-
ships among the seven taxa in our data set, as two of our
hypotheses required an independent estimate of inter-
specific phylogenetic distance. While we do not believe
that mtDNA distances are unbiased, we do feel that its
slower mutation rate, relative to that of microsatellites,
would ensure its linearity among the seven species on
our comparison. Furthermore, cytochrome b has been
© 2015 John Wiley & Sons Ltd
CROSS -SPECIES UTIL ITY OF MICROSATELLITES FOR SEABIRDS 3
used previously to successfully infer relatedness among
a much broader sample of Procellariiformes (Nunn &
Stanley 1998), and previous morphological and behavio-
ural analyses (Bretagnolle et al. 1990) did not specifically
quantify interspecific distances among the species in our
study. Generic avian cytochrome b primers (e.g. Patter-
son et al. 2011) were problematic for some samples.
Therefore, we designed specific primers (CytB_Pri_F:
50-CTAGCTATACACTACACCGC-30 and CytB_Pri_R:
50-CTAGTTGGCCGATGATGATG-30) for our study
group from an alignment of those samples that we suc-
cessfully sequenced. PCRs were conducted in 20 lL reac-
tion volumes containing 100 ng DNA template, 10 mM of
each primer, 10 mM dNTPs (Roth, Karlsruhe), 2 mM
MgCl, 5 U Thermus aquaticus polymerase (BioLabs Taq
DNA polymerase) in a 1x PCR reaction buffer. Thermo-
cycling included initial denaturation at 94°C for 2 min,
30 cycles of denaturation at 94°C for 30 s, annealing at
60°C for 45 s and extension at 72°C for 1 min, followed
by a final extension step of 5 min at 72°C. Products were
purified of excess primers and dNTPs using exonucle-
ase-shrimp alkaline phosphatase (Fermentas Life Sci-
ences following the manufacturer’s specifications). PCR
products were then sequenced in both directions using
Big Dye chemistry (Applied Biosystems) and run on an
AB 3130xl genetic analyser (Applied Biosystems). Result-
ing sequences were assembled and aligned in CLC Main
Workbench� 6.9.2.
Data analyses
Genotypes were assigned with GENEMARKER 1.85 (SoftGe-
netics LLC, State College, PA, USA). 20% of the samples
were rescored by a separate individual, with a resulting
error rate of <5%. The probability of deviation from
Hardy–Weinberg equilibrium (HWE) and nonrandom
association of loci was calculated for each locus/species
combination using GENEPOP (Raymond & Rousset 1995;
Tables 1 and 2). Measures of genetic diversity [number
of alleles per locus (A), observed heterozygosity (HO)
and expected heterozygosity (HE)] were estimated in CER-
VUS 3.0.3 (Kalinowski et al. 2007) and MSA 4.05 (Dieringer
& Schl€otterer 2003). The inbreeding coefficient (FIS) and
its significance were estimated with GENEPOP (Raymond
& Rousset 1995). Null allele frequencies (F null) per locus
and species were obtained using FREENA (Chapuis & Es-
toup 2007).
Phylogenetic distances between species at the cyto-
chrome b gene were calculated using the maximum
likelihood in MEGA (Tamura et al. 2013). We recon-
structed the mitochondrial species phylogeny by firstly
determining the most suitable substitution model for
the cytochrome b sequence data using the Akaike infor-
mation criteria (AIC) in JMODELTEST 2 (Darriba et al.
2012), then set the model parameters to the general
time reversible (GTR) model with gamma substitution
rate heterogeneity estimated from the data using four
rate categories.
We examined the cross-species utility of our isolated
microsatellite loci by plotting genetic diversity (HO) and
the proportion of missing data (nonamplifying loci after
3x repeat PCRs, with standardized DNA quantity and
quality) in each species against phylogenetic (mtDNA,
cytochrome b) p-distances, calculated in MEGA (Table S1,
Supporting Information). We also performed this regres-
sion separately for three different phylogenetic group-
ings: Group 1: all seven species; Group 2: Halobaena and
Pachyptila only; Group 3: Pachyptila species only. For a
more detailed analysis of these relationships, we used a
generalized linear model (GLM, implemented in R, R
Development Core Team 2014) to test the effect of phylo-
genetic distance (as a covariate) and locus (as a factor) on
both observed heterozygosity and the proportion of
missing data in each of the three species groupings
above. A GLM could not be used to test for the effect of
phylogenetic distance and locus on null allele frequen-
cies due to a large amount of missing data in Wilson’s
storm-petrels.
The frequency of null alleles was calculated in our data
set using FREENA (Chapuis & Estoup 2007). This method
estimates the frequency of null alleles from data sets simu-
lated to contain and not contain null alleles. Then, it uses
the expectation–maximization (EM) algorithm of Demp-
ster et al. (1977) to adjust homozygote allele frequencies
based on true and false homozygote counts, resulting in
the estimation of the null allele frequency. Population dif-
ferentiation indices can then be calculated including null
alleles (INA) and also only on the visible allele sizes, thus,
excluding null alleles (ENA). To determine the effect of
null alleles on cross-species comparisons, we calculated
pairwise FST (Wright 1943) and DC (genetic distance of
Cavalli-Sforza & Edwards 1967) between species using
INA and ENA data sets. We reconstructed UPGMA spe-
cies trees from these triangular FST and DC matrices, using
MEGA 6.06 (Tamura et al. 2013).
We investigated the effect of high mutation rates and
constraints on allele size on microsatellite genetic dis-
tance by observing the change in the slope of pairwise
Mantel regressions performed on the same three phylo-
genetic data groupings used in Fig. 1. As interspecific
microsatellite distance, we used INA and ENA triangular
matrices of both FST and DC and checked their linearity
against the matrix of pairwise maximum-likelihood cyto-
chrome b distances calculated previously (Table S1, Sup-
porting Information). All Mantel regressions were
calculated in GenAlEx 6.5 (Peakall & Smouse 2012). To
formally test the hypothesis that FST and DC microsatel-
lite distances were nonlinearly related to mtDNA
© 2015 John Wiley & Sons Ltd
4 Y. MOODLEY ET AL .
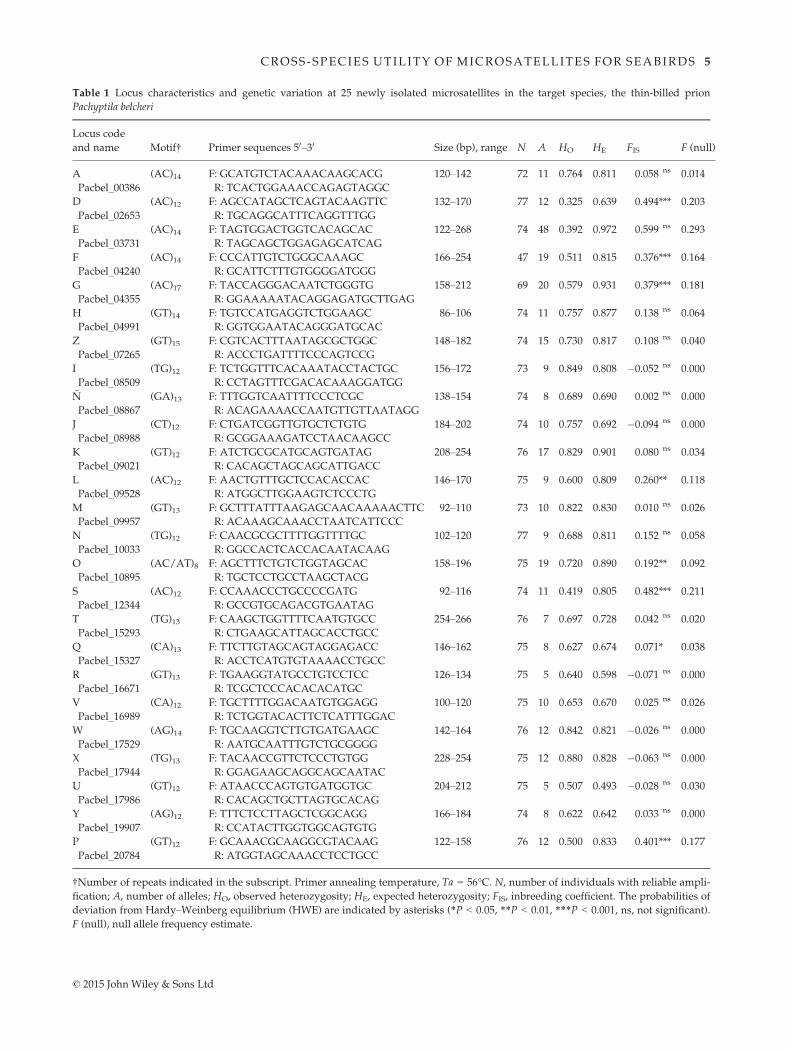
Table 1 Locus characteristics and genetic variation at 25 newly isolated microsatellites in the target species, the thin-billed prion
Pachyptila belcheri
Locus code
and name Motif† Primer sequences 50–30 Size (bp), range N A HO HE FIS F (null)
A
Pacbel_00386
(AC)14 F: GCATGTCTACAAACAAGCACG
R: TCACTGGAAACCAGAGTAGGC
120–142 72 11 0.764 0.811 0.058 ns 0.014
D
Pacbel_02653
(AC)12 F: AGCCATAGCTCAGTACAAGTTC
R: TGCAGGCATTTCAGGTTTGG
132–170 77 12 0.325 0.639 0.494*** 0.203
E
Pacbel_03731
(AC)14 F: TAGTGGACTGGTCACAGCAC
R: TAGCAGCTGGAGAGCATCAG
122–268 74 48 0.392 0.972 0.599 ns 0.293
F
Pacbel_04240
(AC)14 F: CCCATTGTCTGGGCAAAGC
R: GCATTCTTTGTGGGGATGGG
166–254 47 19 0.511 0.815 0.376*** 0.164
G
Pacbel_04355
(AC)17 F: TACCAGGGACAATCTGGGTG
R: GGAAAAATACAGGAGATGCTTGAG
158–212 69 20 0.579 0.931 0.379*** 0.181
H
Pacbel_04991
(GT)14 F: TGTCCATGAGGTCTGGAAGC
R: GGTGGAATACAGGGATGCAC
86–106 74 11 0.757 0.877 0.138 ns 0.064
Z
Pacbel_07265
(GT)15 F: CGTCACTTTAATAGCGCTGGC
R: ACCCTGATTTTCCCAGTCCG
148–182 74 15 0.730 0.817 0.108 ns 0.040
I
Pacbel_08509
(TG)12 F: TCTGGTTTCACAAATACCTACTGC
R: CCTAGTTTCGACACAAAGGATGG
156–172 73 9 0.849 0.808 �0.052 ns 0.000
~N
Pacbel_08867
(GA)13 F: TTTGGTCAATTTTCCCTCGC
R: ACAGAAAACCAATGTTGTTAATAGG
138–154 74 8 0.689 0.690 0.002 ns 0.000
J
Pacbel_08988
(CT)12 F: CTGATCGGTTGTGCTCTGTG
R: GCGGAAAGATCCTAACAAGCC
184–202 74 10 0.757 0.692 �0.094 ns 0.000
K
Pacbel_09021
(GT)12 F: ATCTGCGCATGCAGTGATAG
R: CACAGCTAGCAGCATTGACC
208–254 76 17 0.829 0.901 0.080 ns 0.034
L
Pacbel_09528
(AC)12 F: AACTGTTTGCTCCACACCAC
R: ATGGCTTGGAAGTCTCCCTG
146–170 75 9 0.600 0.809 0.260** 0.118
M
Pacbel_09957
(GT)13 F: GCTTTATTTAAGAGCAACAAAAACTTC
R: ACAAAGCAAACCTAATCATTCCC
92–110 73 10 0.822 0.830 0.010 ns 0.026
N
Pacbel_10033
(TG)12 F: CAACGCGCTTTTGGTTTTGC
R: GGCCACTCACCACAATACAAG
102–120 77 9 0.688 0.811 0.152 ns 0.058
O
Pacbel_10895
(AC/AT)8 F: AGCTTTCTGTCTGGTAGCAC
R: TGCTCCTGCCTAAGCTACG
158–196 75 19 0.720 0.890 0.192** 0.092
S
Pacbel_12344
(AC)12 F: CCAAACCCTGCCCCGATG
R: GCCGTGCAGACGTGAATAG
92–116 74 11 0.419 0.805 0.482*** 0.211
T
Pacbel_15293
(TG)13 F: CAAGCTGGTTTTCAATGTGCC
R: CTGAAGCATTAGCACCTGCC
254–266 76 7 0.697 0.728 0.042 ns 0.020
Q
Pacbel_15327
(CA)13 F: TTCTTGTAGCAGTAGGAGACC
R: ACCTCATGTGTAAAACCTGCC
146–162 75 8 0.627 0.674 0.071* 0.038
R
Pacbel_16671
(GT)13 F: TGAAGGTATGCCTGTCCTCC
R: TCGCTCCCACACACATGC
126–134 75 5 0.640 0.598 �0.071 ns 0.000
V
Pacbel_16989
(CA)12 F: TGCTTTTGGACAATGTGGAGG
R: TCTGGTACACTTCTCATTTGGAC
100–120 75 10 0.653 0.670 0.025 ns 0.026
W
Pacbel_17529
(AG)14 F: TGCAAGGTCTTGTGATGAAGC
R: AATGCAATTTGTCTGCGGGG
142–164 76 12 0.842 0.821 �0.026 ns 0.000
X
Pacbel_17944
(TG)13 F: TACAACCGTTCTCCCTGTGG
R: GGAGAAGCAGGCAGCAATAC
228–254 75 12 0.880 0.828 �0.063 ns 0.000
U
Pacbel_17986
(GT)12 F: ATAACCCAGTGTGATGGTGC
R: CACAGCTGCTTAGTGCACAG
204–212 75 5 0.507 0.493 �0.028 ns 0.030
Y
Pacbel_19907
(AG)12 F: TTTCTCCTTAGCTCGGCAGG
R: CCATACTTGGTGGCAGTGTG
166–184 74 8 0.622 0.642 0.033 ns 0.000
P
Pacbel_20784
(GT)12 F: GCAAACGCAAGGCGTACAAG
R: ATGGTAGCAAACCTCCTGCC
122–158 76 12 0.500 0.833 0.401*** 0.177
†Number of repeats indicated in the subscript. Primer annealing temperature, Ta = 56°C. N, number of individuals with reliable ampli-
fication; A, number of alleles; HO, observed heterozygosity; HE, expected heterozygosity; FIS, inbreeding coefficient. The probabilities of
deviation from Hardy–Weinberg equilibrium (HWE) are indicated by asterisks (*P < 0.05, **P < 0.01, ***P < 0.001, ns, not significant).
F (null), null allele frequency estimate.
© 2015 John Wiley & Sons Ltd
CROSS -SPECIES UTIL ITY OF MICROSATELLITES FOR SEABIRDS 5

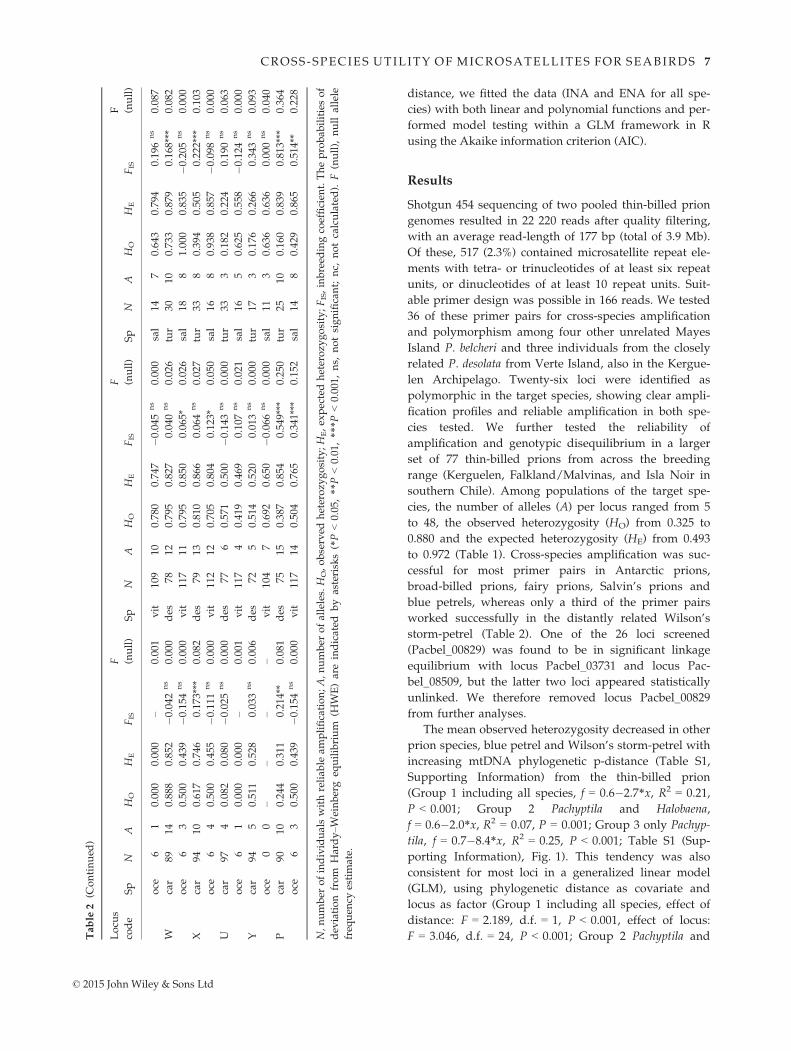
Table
2Cross-speciesgen
etic
variationofmicrosatellites
isolatedfrom
25thin-billedprionsPachyptilabelcheriin
AntarcticprionsP.desolata
(des),broad
-billedprionsP.vittata(vit),
fairyprionsP.turtur(tur),Salvin’sprionsP.salvini(sal),bluepetrelsHalobaenacaerulea(car)an
dWilson’sstorm
-petrelsOceanites
oceanicus(oce)
Locu
s
code
Sp
NA
HO
HE
FIS
F (null)
Sp
NA
HO
HE
FIS
F (null)
Sp
NA
HO
HE
FIS
F (null)
Acar
9713
0.835
0.897
0.070*
0.017
des
7913
0.810
0.862
0.061
ns
0.011
tur
332
0.424
0.403
�0.054
ns
0.000
oce
12
11
�1.000
nc
0.000
vit
117
110.675
0.828
0.185***
0.074
sal
1810
0.778
0.856
0.093
ns
0.033
Dcar
954
0.042
0.082
0.489***
0.088
des
7711
0.468
0.754
0.381***
0.167
tur
335
0.272
0.525
0.484***
0.167
oce
62
0.167
0.167
0.000n
c0.000
vit
115
90.313
0.642
0.513***
0.200
sal
178
0.471
0.663
0.297*
0.132
Ecar
9513
0.779
0.795
0.020
ns
0.022
des
7551
0.653
0.971
0.329**
0.157
tur
11
0.000
0.000
–0.001
oce
61
0.000
0.000
–0.001
vit
111
390.649
0.951
0.319***
0.157
sal
1722
0.588
0.973
0.403***
0.184
Fcar
8313
0.313
0.782
0.601***
0.265
des
4817
0.438
0.927
0.531***
0.252
tur
179
0.235
0.818
0.719***
0.311
oce
23
0.500
0.833
0.500
ns
0.001
vit
6520
0.477
0.872
0.455***
0.204
sal
139
0.615
0.840
0.276*
0.104
Gcar
9310
0.731
0.829
0.118*
0.056
des
7620
0.684
0.930
0.265***
0.127
tur
149
0.429
0.820
0.487***
0.200
oce
56
0.400
0.844
0.556**
0.189
vit
116
230.750
0.934
0.198***
0.093
sal
139
0.385
0.806
0.533***
0.203
Hcar
928
0.152
0.259
0.413***
0.116
des
7810
0.795
0.893
0.111*
0.050
tur
334
0.333
0.526
0.370*
0.122
oce
00
––
––
vit
113
110.655
0.826
0.208***
0.094
sal
159
0.800
0.880
0.094
ns
0.043
Zcar
8528
0.635
0.947
0.331***
0.160
des
7215
0.694
0.785
0.116
ns
0.057
tur
216
0.619
0.560
�0.109
ns
0.000
oce
55
0.400
0.844
0.556*
0.203
vit
103
140.709
0.777
0.088**
0.033
sal
167
0.625
0.756
0.178
ns
0.048
Icar
9513
0.832
0.846
0.017
ns
0.015
des
7511
0.720
0.785
0.083*
0.027
tur
165
0.438
0.688
0.371*
0.156
oce
62
0.167
0.167
0.000n
c0.000
vit
111
120.730
0.756
0.034**
0.032
sal
116
0.636
0.805
0.218
ns
0.073
~ Ncar
8210
0.841
0.795
�0.059
ns
0.000
des
789
0.590
0.664
0.113
ns
0.041
tur
266
0.577
0.728
0.211**
0.060
oce
62
0.500
0.409
�0.250
ns
0.000
vit
106
50.623
0.630
0.012
ns
0.014
sal
176
0.824
0.745
�0.109
ns
0.000
Jcar
8912
0.348
0.859
0.596***
0.272
des
779
0.792
0.697
�0.138
ns
0.000
tur
332
0.030
0.088
0.660*
0.105
oce
62
0.500
0.409
�0.250
ns
0.000
vit
113
60.575
0.635
0.094**
0.040
sal
114
0.364
0.688
0.484
ns
0.190
Kcar
9522
0.821
0.913
0.101*
0.049
des
7522
0.907
0.893
�0.015
ns
0.000
tur
106
0.600
0.832
0.290
ns
0.133
oce
62
0.167
0.167
0.000n
c0.000
vit
112
180.848
0.911
0.069**
0.019
sal
1712
0.882
0.895
0.014
ns
0.000
Lcar
959
0.589
0.675
0.127*
0.061
des
7214
0.653
0.814
0.199**
0.079
tur
327
0.375
0.609
0.388***
0.151
oce
11
0.000
0.000
�0.001
vit
114
130.500
0.640
0.219***
0.079
sal
115
0.636
0.775
0.186
ns
0.050
Mcar
852
0.059
0.057
�0.024
ns
0.000
des
789
0.679
0.826
0.179***
0.062
tur
295
0.655
0.662
0.011
ns
0.031
oce
44
0.250
0.821
0.727*
0.278
vit
116
70.431
0.674
0.362***
0.152
sal
157
0.533
0.766
0.311
ns
0.098
Ncar
959
0.568
0.842
0.326***
0.151
des
789
0.679
0.825
0.178*
0.075
tur
355
0.429
0.737
0.422***
0.170
oce
54
0.600
0.644
0.077
ns
0.000
vit
117
100.752
0.802
0.063
ns
0.012
sal
146
0.571
0.815
0.307
ns
0.119
Ocar
9236
0.793
0.946
0.162**
0.068
des
7817
0.487
0.866
0.439***
0.202
tur
104
0.100
0.363
0.735**
0.192
oce
45
0.250
0.893
0.750*
0.300
vit
112
210.295
0.868
0.662***
0.306
sal
1611
0.438
0.855
0.496***
0.209
Scar
907
0.367
0.729
0.499***
0.207
des
6511
0.662
0.838
0.212*
0.088
tur
195
0.421
0.616
0.322*
0.149
oce
51
0.000
0.000
–0.001
vit
104
120.587
0.839
0.302***
0.133
sal
148
0.714
0.796
0.107
ns
0.005
Tcar
967
0.708
0.730
0.030
ns
0.020
des
799
0.759
0.774
0.019
ns
0.005
tur
133
0.538
0.495
�0.091
ns
0.000
oce
61
0.000
0.000
–0.001
vit
114
60.640
0.676
0.053
ns
0.012
sal
166
0.750
0.776
0.035
ns
0.000
Qcar
8914
0.798
0.877
0.091
ns
0.040
des
7612
0.711
0.756
0.061
ns
0.000
tur
225
0.545
0.636
0.146
ns
0.053
oce
11
0.000
0.000
–0.001
vit
113
100.726
0.737
0.015
ns
0.005
sal
178
0.647
0.775
0.170
ns
0.042
Rcar
965
0.219
0.240
0.091
ns
0.018
des
789
0.372
0.394
0.056
ns
0.004
tur
212
0.095
0.093
�0.026
ns
0.000
oce
61
0.000
0.000
–0.001
vit
996
0.485
0.514
0.057**
0.046
sal
166
0.313
0.512
0.398**
0.126
Vcar
953
0.158
0.148
�0.070
ns
0.000
des
7512
0.720
0.720
0.000
ns
0.000
tur
3310
0.636
0.734
0.135
ns
0.053
© 2015 John Wiley & Sons Ltd
6 Y. MOODLEY ET AL .
distance, we fitted the data (INA and ENA for all spe-
cies) with both linear and polynomial functions and per-
formed model testing within a GLM framework in R
using the Akaike information criterion (AIC).
Results
Shotgun 454 sequencing of two pooled thin-billed prion
genomes resulted in 22 220 reads after quality filtering,
with an average read-length of 177 bp (total of 3.9 Mb).
Of these, 517 (2.3%) contained microsatellite repeat ele-
ments with tetra- or trinucleotides of at least six repeat
units, or dinucleotides of at least 10 repeat units. Suit-
able primer design was possible in 166 reads. We tested
36 of these primer pairs for cross-species amplification
and polymorphism among four other unrelated Mayes
Island P. belcheri and three individuals from the closely
related P. desolata from Verte Island, also in the Kergue-
len Archipelago. Twenty-six loci were identified as
polymorphic in the target species, showing clear ampli-
fication profiles and reliable amplification in both spe-
cies tested. We further tested the reliability of
amplification and genotypic disequilibrium in a larger
set of 77 thin-billed prions from across the breeding
range (Kerguelen, Falkland/Malvinas, and Isla Noir in
southern Chile). Among populations of the target spe-
cies, the number of alleles (A) per locus ranged from 5
to 48, the observed heterozygosity (HO) from 0.325 to
0.880 and the expected heterozygosity (HE) from 0.493
to 0.972 (Table 1). Cross-species amplification was suc-
cessful for most primer pairs in Antarctic prions,
broad-billed prions, fairy prions, Salvin’s prions and
blue petrels, whereas only a third of the primer pairs
worked successfully in the distantly related Wilson’s
storm-petrel (Table 2). One of the 26 loci screened
(Pacbel_00829) was found to be in significant linkage
equilibrium with locus Pacbel_03731 and locus Pac-
bel_08509, but the latter two loci appeared statistically
unlinked. We therefore removed locus Pacbel_00829
from further analyses.
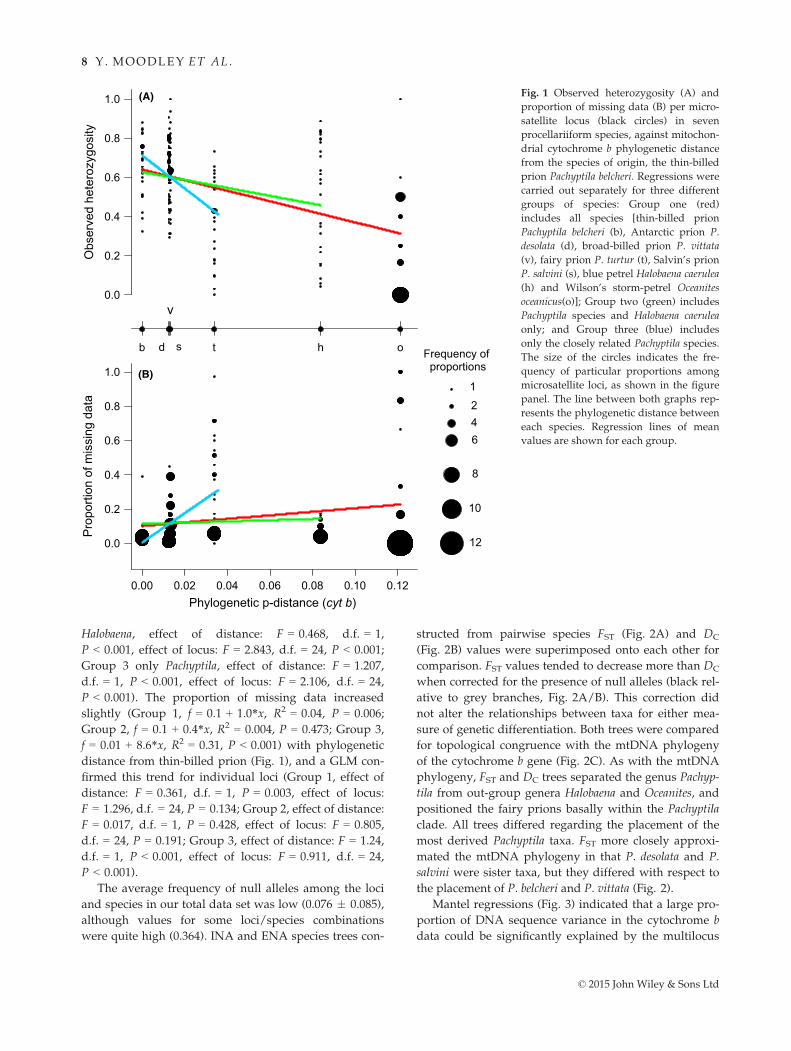
The mean observed heterozygosity decreased in other
prion species, blue petrel and Wilson’s storm-petrel with
increasing mtDNA phylogenetic p-distance (Table S1,
Supporting Information) from the thin-billed prion
(Group 1 including all species, f = 0.6�2.7*x, R2 = 0.21,
P < 0.001; Group 2 Pachyptila and Halobaena,
f = 0.6�2.0*x, R2 = 0.07, P = 0.001; Group 3 only Pachyp-
tila, f = 0.7�8.4*x, R2 = 0.25, P < 0.001; Table S1 (Sup-
porting Information), Fig. 1). This tendency was also
consistent for most loci in a generalized linear model
(GLM), using phylogenetic distance as covariate and
locus as factor (Group 1 including all species, effect of
distance: F = 2.189, d.f. = 1, P < 0.001, effect of locus:
F = 3.046, d.f. = 24, P < 0.001; Group 2 Pachyptila andTable
2(C
ontinued
)
Locu
s
code
Sp
NA
HO
HE
FIS
F (null)
Sp
NA
HO
HE
FIS
F (null)
Sp
NA
HO
HE
FIS
F (null)
oce
61
0.000
0.000
–0.001
vit
109
100.780
0.747
�0.045
ns
0.000
sal
147
0.643
0.794
0.196
ns
0.087
Wcar
8914
0.888
0.852
�0.042
ns
0.000
des
7812
0.795
0.827
0.040
ns
0.026
tur
3010
0.733
0.879
0.168***
0.082
oce
63
0.500
0.439
�0.154
ns
0.000
vit
117
110.795
0.850
0.065*
0.026
sal
188
1.000
0.835
�0.205
ns
0.000
Xcar
9410
0.617
0.746
0.173***
0.082
des
7913
0.810
0.866
0.064
ns
0.027
tur
338
0.394
0.505
0.222***
0.103
oce
64
0.500
0.455
�0.111
ns
0.000
vit
112
120.705
0.804
0.123*
0.050
sal
168
0.938
0.857
�0.098
ns
0.000
Ucar
974
0.082
0.080
�0.025
ns
0.000
des
776
0.571
0.500
�0.143
ns
0.000
tur
333
0.182
0.224
0.190
ns
0.063
oce
61
0.000
0.000
–0.001
vit
117
40.419
0.469
0.107
ns
0.021
sal
165
0.625
0.558
�0.124
ns
0.000
Ycar
945
0.511
0.528
0.033
ns
0.006
des
725
0.514
0.520
0.013
ns
0.000
tur
173
0.176
0.266
0.343
ns
0.093
oce
00
––
––
vit
104
70.692
0.650
�0.066
ns
0.000
sal
113
0.636
0.636
0.000
ns
0.040
Pcar
9010
0.244
0.311
0.214**
0.081
des
7515
0.387
0.854
0.549***
0.250
tur
2510
0.160
0.839
0.813***
0.364
oce
63
0.500
0.439
�0.154
ns
0.000
vit
117
140.504
0.765
0.341***
0.152
sal
148
0.429
0.865
0.514**
0.228
N,number
ofindividualswithreliab
leam
plification;A,number
ofalleles.H
O,observed
heterozy
gosity;H
E,expectedheterozy
gosity;FIS,inbreed
ingcoefficien
t.Theprobab
ilitiesof
dev
iation
from
Hardy–W
einbergeq
uilibrium
(HWE)areindicated
byasterisks(*P<0.05,**P<0.01,***P
<0.001,
ns,
notsignificant;
nc,
notcalculated).
F(null),
null
allele
freq
uen
cyestimate.
© 2015 John Wiley & Sons Ltd
CROSS -SPECIES UTIL ITY OF MICROSATELLITES FOR SEABIRDS 7
Halobaena, effect of distance: F = 0.468, d.f. = 1,
P < 0.001, effect of locus: F = 2.843, d.f. = 24, P < 0.001;
Group 3 only Pachyptila, effect of distance: F = 1.207,
d.f. = 1, P < 0.001, effect of locus: F = 2.106, d.f. = 24,
P < 0.001). The proportion of missing data increased
slightly (Group 1, f = 0.1 + 1.0*x, R2 = 0.04, P = 0.006;
Group 2, f = 0.1 + 0.4*x, R2 = 0.004, P = 0.473; Group 3,
f = 0.01 + 8.6*x, R2 = 0.31, P < 0.001) with phylogenetic
distance from thin-billed prion (Fig. 1), and a GLM con-
firmed this trend for individual loci (Group 1, effect of
distance: F = 0.361, d.f. = 1, P = 0.003, effect of locus:
F = 1.296, d.f. = 24, P = 0.134; Group 2, effect of distance:
F = 0.017, d.f. = 1, P = 0.428, effect of locus: F = 0.805,
d.f. = 24, P = 0.191; Group 3, effect of distance: F = 1.24,
d.f. = 1, P < 0.001, effect of locus: F = 0.911, d.f. = 24,
P < 0.001).
The average frequency of null alleles among the loci
and species in our total data set was low (0.076 � 0.085),
although values for some loci/species combinations
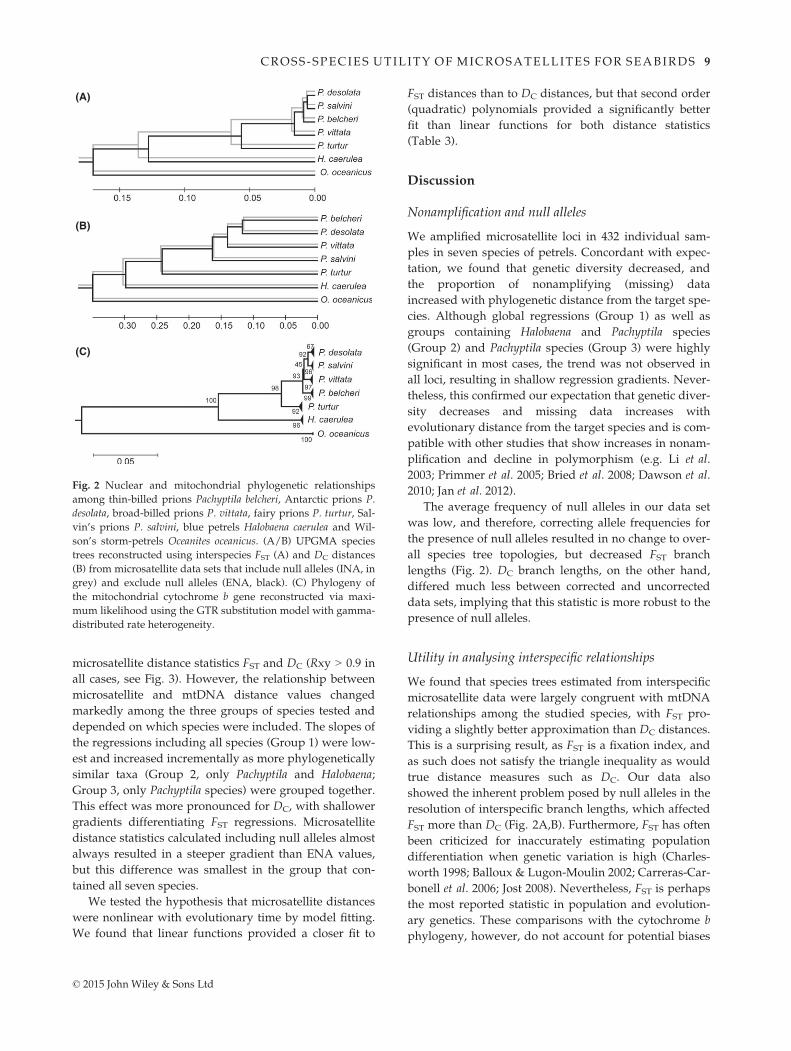
were quite high (0.364). INA and ENA species trees con-
structed from pairwise species FST (Fig. 2A) and DC
(Fig. 2B) values were superimposed onto each other for
comparison. FST values tended to decrease more than DC
when corrected for the presence of null alleles (black rel-
ative to grey branches, Fig. 2A/B). This correction did
not alter the relationships between taxa for either mea-
sure of genetic differentiation. Both trees were compared
for topological congruence with the mtDNA phylogeny
of the cytochrome b gene (Fig. 2C). As with the mtDNA
phylogeny, FST and DC trees separated the genus Pachyp-
tila from out-group genera Halobaena and Oceanites, and
positioned the fairy prions basally within the Pachyptila
clade. All trees differed regarding the placement of the
most derived Pachyptila taxa. FST more closely approxi-
mated the mtDNA phylogeny in that P. desolata and P.
salvini were sister taxa, but they differed with respect to
the placement of P. belcheri and P. vittata (Fig. 2).
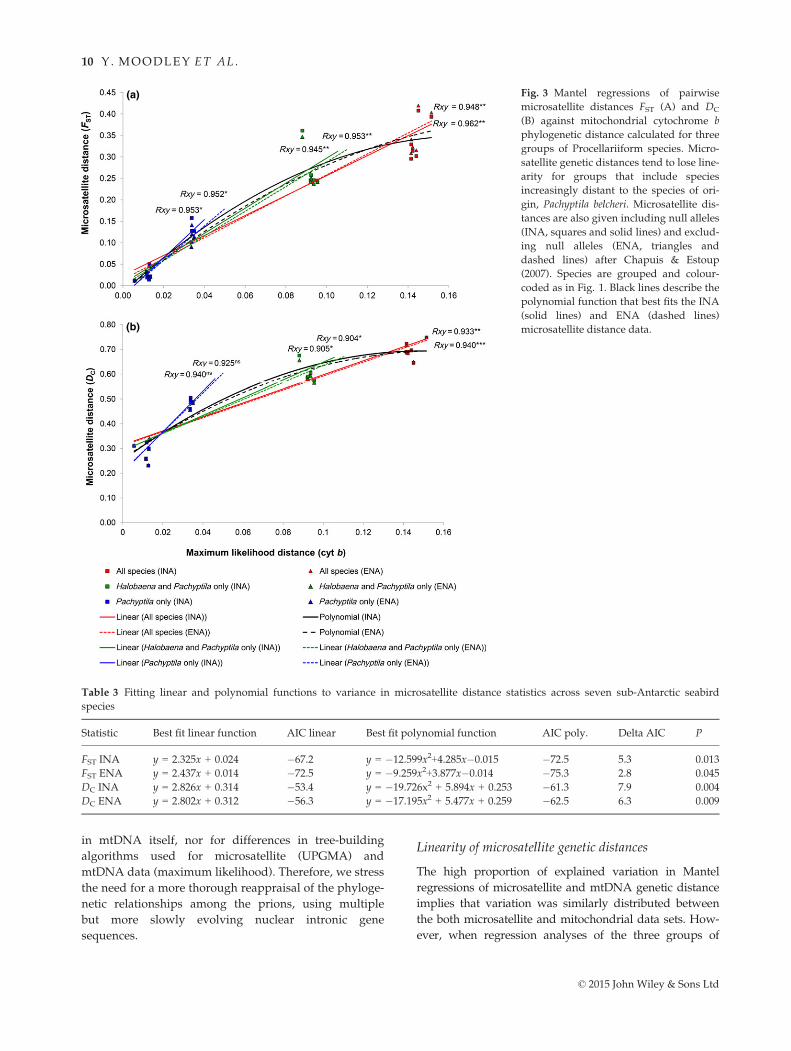
Mantel regressions (Fig. 3) indicated that a large pro-
portion of DNA sequence variance in the cytochrome b
data could be significantly explained by the multilocus
Phylogenetic p-distance (cyt b)0.00 0.02 0.04 0.06 0.08 0.10 0.12
Pro
porti
on o
f mis
sing
dat
a
0.0
0.2
0.4
0.6
0.8
1.0
b t h o
Obs
erve
d he
tero
zygo
sity
0.0
0.2
0.4
0.6
0.8
1.0
v
12
10
8
642
1
Frequency of proportions
d s
(A)
(B)
Fig. 1 Observed heterozygosity (A) and
proportion of missing data (B) per micro-
satellite locus (black circles) in seven
procellariiform species, against mitochon-
drial cytochrome b phylogenetic distance
from the species of origin, the thin-billed
prion Pachyptila belcheri. Regressions were
carried out separately for three different
groups of species: Group one (red)
includes all species [thin-billed prion
Pachyptila belcheri (b), Antarctic prion P.
desolata (d), broad-billed prion P. vittata
(v), fairy prion P. turtur (t), Salvin’s prion
P. salvini (s), blue petrel Halobaena caerulea
(h) and Wilson’s storm-petrel Oceanites
oceanicus(o)]; Group two (green) includes
Pachyptila species and Halobaena caerulea
only; and Group three (blue) includes
only the closely related Pachyptila species.
The size of the circles indicates the fre-
quency of particular proportions among
microsatellite loci, as shown in the figure
panel. The line between both graphs rep-
resents the phylogenetic distance between
each species. Regression lines of mean
values are shown for each group.
© 2015 John Wiley & Sons Ltd
8 Y. MOODLEY ET AL .
microsatellite distance statistics FST and DC (Rxy > 0.9 in
all cases, see Fig. 3). However, the relationship between
microsatellite and mtDNA distance values changed
markedly among the three groups of species tested and
depended on which species were included. The slopes of
the regressions including all species (Group 1) were low-
est and increased incrementally as more phylogenetically
similar taxa (Group 2, only Pachyptila and Halobaena;
Group 3, only Pachyptila species) were grouped together.
This effect was more pronounced for DC, with shallower
gradients differentiating FST regressions. Microsatellite
distance statistics calculated including null alleles almost
always resulted in a steeper gradient than ENA values,
but this difference was smallest in the group that con-
tained all seven species.
We tested the hypothesis that microsatellite distances
were nonlinear with evolutionary time by model fitting.
We found that linear functions provided a closer fit to
FST distances than to DC distances, but that second order
(quadratic) polynomials provided a significantly better
fit than linear functions for both distance statistics
(Table 3).
Discussion
Nonamplification and null alleles
We amplified microsatellite loci in 432 individual sam-
ples in seven species of petrels. Concordant with expec-
tation, we found that genetic diversity decreased, and
the proportion of nonamplifying (missing) data
increased with phylogenetic distance from the target spe-
cies. Although global regressions (Group 1) as well as
groups containing Halobaena and Pachyptila species
(Group 2) and Pachyptila species (Group 3) were highly
significant in most cases, the trend was not observed in
all loci, resulting in shallow regression gradients. Never-
theless, this confirmed our expectation that genetic diver-
sity decreases and missing data increases with
evolutionary distance from the target species and is com-
patible with other studies that show increases in nonam-
plification and decline in polymorphism (e.g. Li et al.
2003; Primmer et al. 2005; Bried et al. 2008; Dawson et al.
2010; Jan et al. 2012).
The average frequency of null alleles in our data set
was low, and therefore, correcting allele frequencies for
the presence of null alleles resulted in no change to over-
all species tree topologies, but decreased FST branch
lengths (Fig. 2). DC branch lengths, on the other hand,
differed much less between corrected and uncorrected
data sets, implying that this statistic is more robust to the
presence of null alleles.
Utility in analysing interspecific relationships
We found that species trees estimated from interspecific
microsatellite data were largely congruent with mtDNA
relationships among the studied species, with FST pro-
viding a slightly better approximation than DC distances.
This is a surprising result, as FST is a fixation index, and
as such does not satisfy the triangle inequality as would
true distance measures such as DC. Our data also
showed the inherent problem posed by null alleles in the
resolution of interspecific branch lengths, which affected
FST more than DC (Fig. 2A,B). Furthermore, FST has often
been criticized for inaccurately estimating population
differentiation when genetic variation is high (Charles-
worth 1998; Balloux & Lugon-Moulin 2002; Carreras-Car-
bonell et al. 2006; Jost 2008). Nevertheless, FST is perhaps
the most reported statistic in population and evolution-
ary genetics. These comparisons with the cytochrome b
phylogeny, however, do not account for potential biases
(A)
(C)
(B)
Fig. 2 Nuclear and mitochondrial phylogenetic relationships
among thin-billed prions Pachyptila belcheri, Antarctic prions P.
desolata, broad-billed prions P. vittata, fairy prions P. turtur, Sal-
vin’s prions P. salvini, blue petrels Halobaena caerulea and Wil-
son’s storm-petrels Oceanites oceanicus. (A/B) UPGMA species
trees reconstructed using interspecies FST (A) and DC distances
(B) from microsatellite data sets that include null alleles (INA, in
grey) and exclude null alleles (ENA, black). (C) Phylogeny of
the mitochondrial cytochrome b gene reconstructed via maxi-
mum likelihood using the GTR substitution model with gamma-
distributed rate heterogeneity.
© 2015 John Wiley & Sons Ltd
CROSS -SPECIES UTIL ITY OF MICROSATELLITES FOR SEABIRDS 9
in mtDNA itself, nor for differences in tree-building
algorithms used for microsatellite (UPGMA) and
mtDNA data (maximum likelihood). Therefore, we stress
the need for a more thorough reappraisal of the phyloge-
netic relationships among the prions, using multiple
but more slowly evolving nuclear intronic gene
sequences.
Linearity of microsatellite genetic distances
The high proportion of explained variation in Mantel
regressions of microsatellite and mtDNA genetic distance
implies that variation was similarly distributed between
the both microsatellite and mitochondrial data sets. How-
ever, when regression analyses of the three groups of
(a)
(b)
Fig. 3 Mantel regressions of pairwise
microsatellite distances FST (A) and DC
(B) against mitochondrial cytochrome b
phylogenetic distance calculated for three
groups of Procellariiform species. Micro-
satellite genetic distances tend to lose line-
arity for groups that include species
increasingly distant to the species of ori-
gin, Pachyptila belcheri. Microsatellite dis-
tances are also given including null alleles
(INA, squares and solid lines) and exclud-
ing null alleles (ENA, triangles and
dashed lines) after Chapuis & Estoup
(2007). Species are grouped and colour-
coded as in Fig. 1. Black lines describe the
polynomial function that best fits the INA
(solid lines) and ENA (dashed lines)
microsatellite distance data.
Table 3 Fitting linear and polynomial functions to variance in microsatellite distance statistics across seven sub-Antarctic seabird
species
Statistic Best fit linear function AIC linear Best fit polynomial function AIC poly. Delta AIC P
FST INA y = 2.325x + 0.024 �67.2 y = �12.599x2+4.285x�0.015 �72.5 5.3 0.013
FST ENA y = 2.437x + 0.014 �72.5 y = �9.259x2+3.877x�0.014 �75.3 2.8 0.045
DC INA y = 2.826x + 0.314 �53.4 y = �19.726x2 + 5.894x + 0.253 �61.3 7.9 0.004
DC ENA y = 2.802x + 0.312 �56.3 y = �17.195x2 + 5.477x + 0.259 �62.5 6.3 0.009
© 2015 John Wiley & Sons Ltd
10 Y. MOODLEY ET AL .
varying species diversity imposed a linear relationship
between microsatellite and mtDNA distance, the slope of
the regression changed considerably, suggesting that the
true relationship was nonlinear. Instead, at lower distance
values (e.g. among congeners; Group 3), the relationship
appears linear, but microsatellite distance gradually
reaches a plateau with increasing mtDNA distance
(Fig. 3A,B, Groups 1 and 2), implying that the latter statis-
tic is a better estimator of relationships among distantly
related taxa. We tested the hypothesis that microsatellite
distances are not linear with evolutionary distance by fit-
ting both linear and polynomial functions to the FST and
DC data and found that in both cases a quadratic function
best fitted the data (Table 3).
Interestingly, FST appeared to remain linear for longer
than DC, especially when corrected for the presence of
null alleles (see higher P values, Table 3). While this sug-
gests that FST might be more useful at higher phyloge-
netic levels, its usefulness is compromised by its higher
variance compared to DC. Because neither microsatellite
distance measure maintained linearity in pairwise inter-
generic comparisons, we recommend that analyses of
genetic differentiation restrict FST and DC to studies in
which the target species is closely related to the species
from which the markers were developed. In either case,
ENA correction for null alleles is essential.
Despite high mutation rates of microsatellites, simula-
tions indicate that measures of genetic differentiation will
remain linear much longer without constraints in allele
size (Nauta & Weissing 1996). Therefore, we propose that
the nonlinearity we observed at the intergeneric level is a
natural consequence of constrained microsatellite allele
size that leads to an increase in the number of conver-
gently evolved allele size classes that, while identical in
state, are no longer identical by descent in intergeneric
pairwise comparisons. Estoup et al. (2002) suggested that
at the intraspecific level, the high mutation rates of mi-
crosatellites will compensate for the inevitable convergent
evolution of some allele classes, while Paetkau et al.
(1997) detected a loss of linearity among closely related
sister taxa (brown bear Ursus arctos and polar bear U.
maritimus). Given that variation in our set of microsatel-
lites remains linear within the genus Pachyptila, perhaps
because of a slightly lower mutation rate or a slightly lar-
ger maximum repeat size, we are confident that popula-
tion genetic and demographic analyses at this level will
not be compromised by constraints in allele size.
Conclusions
We show here that a panel of 25 microsatellite loci devel-
oped using next-generation sequencing of a thin-billed
prion shotgun library may be applied in studies of
molecular ecology among congeners; however, this
approach may result in a greater proportion of null
alleles and lower amounts of genetic diversity in the non-
target species. Genetic diversities therefore may not be
directly comparable between species, despite the use of
the same conserved microsatellite markers. In addition,
the contrasting results from the two measures of differ-
entiation lead us to discourage the use of these microsat-
ellites in phylogenetic reconstruction beyond the genus
level, as even at that level this may be associated with
high variance.
Acknowledgements
The work was funded by a grant provided by the German Sci-
ence Foundation DFG (Qu 148/5). We would like to thank the
New Island Conservation Trust with assistance from Ian, Maria
and Georgina Strange, and Benno H. L€uthi, Klemens P€utz and
Gerhard Meyer from the Antarctic Research Trust, for crucial
support during the fieldwork. We extend special thanks to Ruth
Brown for her fieldwork support at Bird Island (South Georgia)
and to Jaime A. Cursach for his assistance during fieldwork at
Diego Ramirez (Chile). We thank Antje Schreiner for help with
the laboratory work.
References
Abdelkrim J, Robertson B, Stanton J, Gemmell N (2009) Fast, cost-effec-
tive development of species-specific microsatellite markers by genomic
sequencing. BioTechniques, 46, 185–192.
Astanei I, Gosling E, Wilson JIM, Powell E (2005) Genetic variability and
phylogeography of the invasive zebra mussel, Dreissena polymorpha
(Pallas). Molecular Ecology, 14, 1655–1666.
Balloux F, Lugon-Moulin N (2002) The estimation of population differen-
tiation with microsatellite markers. Molecular Ecology, 11, 155–165.
Barrowclough GF, Corbin KW, Zink RM (1981) Genetic differentiation in
the Procellariiformes. Comparative Biochemistry and Physiology Part B:
Comparative Biochemistry, 69, 629–632.
Bicknell A, Knight M, Bilton D et al. (2012) Population genetic structure
and long-distance dispersal among seabird populations: Implications
for colony persistence. Molecular Ecology, 21, 2863–2876.
Bocher P, Cherel Y, Labat JP et al. (2001) Amphipod-based food web:
Themisto gaudichaudii caught in nets and by seabirds in Kerguelen
waters, southern Indian Ocean. Marine Ecology Progress Series, 223,
261–276.
Bowcock A, Ruiz-Linares A, Tomfohrde J et al. (1994) High resolution of
human evolutionary trees with polymorphic microsatellites. Nature,
368, 455–457.
Bretagnolle V, Zotier R, Jouventin P (1990) Comparative population biol-
ogy of four prions (Genus Pachyptila) from the Indian Ocean and con-
sequences for their taxonomic status. Auk, 107, 305–316.
Bried J, Dubois MP, Jouventin P, Santos RS (2008) Eleven polymorphic
microsatellite markers in Cory’s shearwater, Calonectris diomedea, and
cross-species amplification on threatened Procellariiformes. Molecular
Ecology Resources, 8, 602–604.
Brooke M (2004) Albatrosses and Petrels Across the World. Oxford Univer-
sity Press, Oxford.
Bruford MW, Wayne RK (1993) Microsatellites and their application to
population genetic studies. Current Opinion in Genetics & Development,
3, 939–943.
Carreras-Carbonell J, Macpherson E, Pascual M (2006) Population struc-
ture within and between subspecies of the Mediterranean triplefin fish
© 2015 John Wiley & Sons Ltd
CROSS -SPECIES UTIL ITY OF MICROSATELLITES FOR SEABIRDS 11
Tripterygion delaisi revealed by highly polymorphic microsatellite loci.
Molecular Ecology, 15, 3527–3539.
Cavalli-Sforza LL, Edwards AW (1967) Phylogenetic analysis. Models
and estimation procedures. American Journal of Human Genetics, 19,
233–257.
Chapuis M-P, Estoup A (2007) Microsatellite null alleles and estimation
of population differentiation. Molecular Biology and Evolution, 24,
621–631.
Charlesworth B (1998) Measures of divergence between populations and
the effect of forces that reduce variability. Molecular Biology and Evolu-
tion, 15, 538–543.
Cherel Y, Bocher P, de Broyer C, Hobson KA (2002) Food and feeding
ecology of the sympatric thin-billed Pachyptila belcheri and Antarctic P.
desolata prions at Iles Kerguelen, Southern Indian Ocean. Marine Ecol-
ogy Progress Series, 228, 263–281.
Cherel Y, Phillips RA, Hobson KA, McGill R (2006) Stable isotope evi-
dence of diverse species-specific and individual wintering strategies in
seabirds. Biology Letters, 2, 301–303.
Darriba D, Taboada GL, Doallo R, Posada D (2012) jModelTest 2: more
models, new heuristics and parallel computing. Nature Methods, 9, 772.
Dawson DA, Horsburgh GJ, K€upper C et al. (2010) New methods to iden-
tify conserved microsatellite loci and develop primer sets of high
cross-species utility – as demonstrated for birds. Molecular Ecology
Resources, 10, 475–494.
Dempster AP, Laird NM, Rubin DB (1977) Maximum likelihood from
incomplete data via the EM algorithm. Journal of the Royal statistical
Society, 39, 1–38.
Development Core Team R (2014) R: A Language and Environment for Sta-
tistical Computing. R Foundation for Statistical Computing, Vienna.
Dieringer D, Schl€otterer C (2003) Microsatellite analyser (MSA): a plat-
form independent analysis tool for large microsatellite data sets. Molec-
ular Ecology Notes, 3, 167–169.
Estoup A, Jarne P, Cornuet J-M (2002) Homoplasy and mutation model
at microsatellite loci and their consequences for population genetics
analysis. Molecular Ecology, 11, 1591–1604.
Gangloff B, Shirihai H, Watling D et al. (2012) The complete phylogeny of
Pseudobulweria, the most endangered seabird genus: systematics,
species status and conservation implications. Conservation Genetics, 13,
39–52.
Garza JC, Slatkin M, Freimer NB (1995) Microsatellite allele frequencies
in humans and chimpanzees, with implications for constraints on
allele size. Molecular Biology and Evolution, 12, 594–603.
Huang D, Zhang Y, Jin M et al. (2014) Characterization and high cross-
species transferability of microsatellite markers from the floral tran-
scriptome of Aspidistra saxicola (Asparagaceae). Molecular Ecology
Resources, 14, 569–577.
Hunt GL, Priddle J, Whitehouse MJ, Veit RR, Heywood RB (1992) Changes
in seabird species abundance near South Georgia during a period of
rapid change in sea-surface temperature. Antarctic Science, 4, 15–22.
Jan C, Dawson DA, Altringham JD, Burke T, Butlin RK (2012) Develop-
ment of conserved microsatellite markers of high cross-species utility
in bat species (Vespertilionidae, Chiroptera, Mammalia). Molecular
Ecology Resources, 12, 532–548.
Jost LOU (2008) GST and its relatives do not measure differentiation.
Molecular Ecology, 17, 4015–4026.
Kalinowski ST, Taper ML, Marshall TC (2007) Revising how the com-
puter program cervus accommodates genotyping error increases suc-
cess in paternity assignment. Molecular Ecology, 16, 1099–1106.
Kerr KC, Dove CJ (2013) Delimiting shades of gray: phylogeography of
the Northern Fulmar, Fulmarus glacialis. Ecology and Evolution, 3,
1915–1930.
Lawrence HA, Taylor GA, Millar CD, Lambert DM (2008) High mito-
chondrial and nuclear genetic diversity in one of the world’s most
endangered seabirds, the Chatham Island Taiko (Pterodroma magentae).
Conservation Genetics, 9, 1293–1301.
Li G, Hubert S, Bucklin K, Ribes V, Hedgecock D (2003) Characterization
of 79 microsatellite DNA markers in the Pacific oyster Crassostrea gigas.
Molecular Ecology Notes, 3, 228–232.
Liddle GM (1994) Interannual variation in the breeding biology of the
Antarctic prion Pachyptila desolata at Bird Island, South Georgia. Journal
of Zoology, 234, 12–139.
McCormack JE, Hird SM, Zellmer AJ, Carstens BC, Brumfield RT
(2013) Applications of next-generation sequencing to phylogeogra-
phy and phylogenetics. Molecular Phylogenetics and Evolution, 66,
526–538.
Moodley Y, Baumgarten I, Harley E (2006) Horse microsatellites and their
amenability to comparative equid genetics. Animal Genetics, 37,
258–261.
Moore S, Sargeant L, King T et al. (1991) The conservation of dinucleotide
microsatellites among mammalian genomes allows the use of heterolo-
gous PCR primer pairs in closely related species. Genomics, 10,
654–660.
Nauta MJ, Weissing FJ (1996) Constraints on allele size at microsatel-
lite loci: implications for genetic differentiation. Genetics, 143, 1021–
1032.
Navarro J, Votier SC, Aguzzi J et al. (2013) Ecological segregation in
space, time and trophic niche of sympatric planktivorous petrels. PLoS
ONE, 8, e62897.
Nunn GB, Stanley SE (1998) Body size effects and rates of cytochrome b
evolution in tube-nosed seabirds. Molecular Biology and Evolution, 15,
1360–1371.
Onley D, Scofield P (2007) Albatrosses, Petrels and Shearwaters of the World.
Christopher Helm, London.
Ostrander EA, Sprague GF Jr, Rine J (1993) Identification and character-
ization of dinucleotide repeat (CA)n markers for genetic mapping in
dog. Genomics, 16, 207–213.
Ovenden J, Wust-Saucy A, Bywater R, Brothers N, White R (1991)
Genetic evidence for philopatry in a colonially nesting seabird, the
Fairy Prion (Pachyptila turtur). Auk, 108, 688–694.
Paetkau D, Waits LP, Clarkson PL, Craighead L, Strobeck C (1997) An
empirical evaluation of genetic distance statistics using microsatellite
data from bear (Ursidae) populations. Genetics, 147, 1943–1957.
Patterson SA, Morris-Pocock JA, Friesen VL (2011) A multilocus phylog-
eny of the Sulidae (Aves: Pelecaniformes). Molecular Phylogenetics and
Evolution, 58, 181–191.
Peakall R, Smouse PE (2012) GenAlEx 6.5: genetic analysis in Excel. Pop-
ulation genetic software for teaching and research—an update. Bioin-
formatics, 28, 2537–2539.
Penhallurick J, Wink M (2004) Analysis of the taxonomy and nomencla-
ture of the Procellariiformes based on complete nucleotide sequences
of the mitochondrial cytochrome b gene. Emu, 104, 125–147.
Primmer CR, Painter JN, Koskinen MT, Palo JU, Meril€a J (2005) Factors
affecting avian cross-species microsatellite amplification. Journal of
Avian Biology, 36, 348–360.
Prince PA, Morgan RA (1987) Diet and feeding ecology of Procellarii-
formes. In: Seabirds. Feeding Ecology and Role in Marine Ecosystems
(ed Croxall J. P.), pp. 135–171. Cambridge University Press, Cam-
bridge, UK.
Quillfeldt P, Masello JF, Strange I (2003) Breeding biology of the Thin-
billed prion Pachyptila belcheri at New Island, Falkland Islands, in the
poor season 2002/2003: egg desertion, breeding success and chick pro-
visioning. Polar Biology, 26, 746–752.
Quillfeldt P, Strange I, Masello JF (2007) Sea surface temperatures, vari-
able food supply and behavioural buffering capacity in Thin-billed pri-
ons Pachyptila belcheri: breeding success, provisioning and chick
begging. Journal of Avian Biology, 38, 298–308.
Quillfeldt P, McGill RAR, Strange IJ et al. (2008) Stable isotope analysis
reveals sexual and environmental variability and individual consis-
tency in foraging of Thin-billed prions. Marine Ecology Progress Series,
373, 137–148.
Quillfeldt P, Masello JF, McGill RAR, Adams M, Furness RW (2010) Mov-
ing polewards in winter: a recent change in migratory strategy. Fron-
tiers in Zoology, 7, 15.
Quillfeldt P, Masello JF, Navarro J, Phillips RA (2013) Year-round distri-
bution suggests spatial segregation of two small petrel species in the
South Atlantic. Journal of Biogeography, 40, 430–441.
© 2015 John Wiley & Sons Ltd
12 Y. MOODLEY ET AL .
Raymond M, Rousset F (1995) GENEPOP Version 3.1d: population
genetics software for exact tests and ecumenism. Journal of Heredity, 86,
248–249.
Reid K, Liddle GM, Prince PA, Croxall JP (1999) Measurement of chicks
provisioning in Antarctic prions Pachyptila desolata using an automated
weighing system. Journal of Avian Biology, 30, 127–134.
Rheindt FE, Austin JJ (2005) Major analytical and conceptual shortcom-
ings in a recent taxonomic revision of the Procellariiformes–a reply to
Penhallurick and Wink (2004). Emu, 105, 181–186.
Ridoux V (1994) The diets and dietary segregation of seabirds at the sub-
antarctic Crozet Islands. Marine Ornithology, 22, 1–192.
Ryan P, Bourgeois K, Dromz�ee S, Dilley B (2014) The occurrence of two
bill morphs of prions Pachyptila vittata on Gough Island. Polar Biology,
37, 727–735.
Schuelke M (2000) An economic method for the fluorescent labeling of
PCR fragments. Nature Biotechnology, 18, 233–234.
Smith AL, Monteiro L, Hasegawa O, Friesen VL (2007) Global phylogeog-
raphy of the band-rumped storm-petrel (Oceanodroma castro; Procellari-
iformes: Hydrobatidae). Molecular Phylogenetics and Evolution, 43,
755–773.
Steeves TE, Anderson DJ, Friesen VL (2005) A role for nonphysical
barriers to gene flow in the diversification of a highly vagile sea-
bird, the masked booby (Sula dactylatra). Molecular Ecology, 14,
3877–3887.
Strange I (1980) The thin-billed prion, Pachyptila belcheri, at New Island,
Falkland Islands. Gerfaut, 70, 411–445.
Sunnucks P (2000) Efficient genetic markers for population biology.
Trends in Ecology & Evolution, 15, 199–203.
Tamura K, Stecher G, Peterson D, Filipski A, Kumar S (2013) MEGA6:
Molecular evolutionary genetics analysis version 6.0. Molecular Biology
and Evolution, 30, 2725–2729.
Untergasser A, Cutcutache I, Koressaar T et al. (2012) Primer3–new capa-
bilities and interfaces. Nucleic Acids Research, 40, e115.
Viot C, Jouventin P, Bried J (1993) Population genetics of southern sea-
birds. Marine Ornithology, 21, 1–25.
Wiley AE, Welch AJ, Ostrom PH et al. (2012) Foraging segregation and
genetic divergence between geographically proximate colonies of a
highly mobile seabird. Oecologia, 168, 119–130.
Wright S (1943) Isolation by distance. Genetics, 28, 114–138.
Wulff A, Hollingsworth PM, Haugstetter J et al. (2012) Ten nuclear micro-
satellites markers cross-amplifying in Scaevola montana and S. coccinea
(Goodeniaceae), a locally common and a narrow endemic plant species
of ultramafic scrublands in New Caledonia. Conservation Genetics
Resources, 4, 725–728.
P.Q. and Y.M. conceived and designed the study. R.A.,
Y.C., R.J.C., M. Marin, J.F.M., M.M., J.N., R.A.P., P.Q.,
P.G.R., C.G.S., and H.W. carried out the extensive field-
work. M.R.T. isolated the microsatellite sequences.
T.L.C., J.F.M., and G.K.M. screened the samples. J.F.M.,
Y.M., T.L.C., and L.C. carried out the bioinformatic
analyses. Y.M., J.F.M., and P.Q. drafted the manuscript.
All authors reviewed the final draft of the manuscript.
Data accessibility
DNA sequences: GenBank accessions KP122163-
KP122196, KM050769 and KM050770. Shotgun DNA
sequence reads, 432 microsatellite genotypes at 25 loci,
cytochrome b alignment, distance matrices and tree files:
Provisional DRYAD entry doi:10.5061/dryad.rc917.
Supporting Information
Additional Supporting Information may be found in the online
version of this article:
Table S1 Phylogenetic p-distances and maximum likelihood
distances (cytochrome b) in Pachyptila species, blue petrels and
Wilson’s storm-petrels.
© 2015 John Wiley & Sons Ltd
CROSS -SPECIES UTIL ITY OF MICROSATELLITES FOR SEABIRDS 13