Anti VEGF versus PRP in Diabetic retinopathy treatment (prospective study)
Upload
khangminh22Category
view
0download
0
DOCUMENT RESUME
' ED 211 568 TM E10 8.88
AUTHOR Ross, John A.: Maynes,,Florence.J. ..
TITLE Experimental Problem-Solving Item Pcc1: Junior andIntermediate Division Science. Prgject°4130-4029;Final R&D Report to the Ontario Institute fcr Studies
.. in Education.INSTITUTION Ontario Inst. for Studies.in EducatiCn4Peterlorough.
. Trent Valley Centre,'i
.,.
PUE DATE 80\
N457E. 255p. \,I , %
'EMS PRICE 'MF01/PC11 131us.Postage. ,
\`
i. s:-*Curriculum Development; Elelentavy-Schcol .
.Zlemeitary Secondary Education; Foreign Ctuntr
DESCRIPTORS
*Item Banks; *Science Cur,Ficulum; *Science Testsl, . ,
4#.Scientific Literacy; Secondary School Science; *Vest,'Ltems ., \
. - % 4
IDENTIFIERS Canada
ABSTRACT ' .
v
The absence of suitable instruments-to neasurescientific inguiryqskills, and the inability" of teachers to constructtheir cwn tests `'to measure mastery of. science skills led thePeterborough County (Ontario) Board of Education to develgp .
skill-oriented curriculum guidelines in response to dbanges inMinistry of Educatio4 priorities in science. Skills tf-Iscientificinquiry were identified, levels of student growth for each skill weredes.cribed, and a pool of 'test itenic with Vteachers, manual Was.developed; The prpiry impe'6t of the project is to give teachers apractical tool that will provide the with feedback on student skilldevelopment and the effects of the science program. The project isalso to prOmote a gener,alizable approach,to curriculum sleVelopment.Successful completion of the prgvject will-incrqase curricular skillsof the participants, and dissemination of the proAucts, will heighten ,
support for' this approadt to curricular innovation.. ( '-uthor/GK). . .
t.
,..
****************A4***41***********,**********t******************.p******.
Ac.. Pepriductions--s1Fplied byetDRS are' the best that can be made *
# t., from the original document... .
. ,
*
le**** **************#*****0********************i****4********#******- ...
1 J *ft
'' r,**v V
..**
r

NCZ)LL.1
0
14,
,r
C-
4
Experimental Problem-Solving Iteffi Pool
Junior and Intermediate Division Science
Projeot #80-4029 Final R & D Report to the
Ontario Institute For Studies In Education
John A. Ross
Florence J. Maynes
Trent Valley CentreBox ,719, 150 O'Carroll Ave.
PeterborOugh, OntarioK9J,7A1
1980 05 27. -
2
r
U S DEPARTMENT OF EDUCATION,NATIONAL INSTITUTE OF EDUCATION,
E PICA70%A, Hr /4, tS ,,F)RMAT,)NEN Tt-+ EHo
PERAI",',, )T4 T ' E
MA ;T PJA,
Tr 7,4i p ,l+14
[NFURMA7'

tir
C.
Table of Contents
1. Abstract y2
2yDescriptionof the Project 3
3:-Domain Definition610
4. Junior Division Item Pool -.38
5. Intermediate Division Item Pool 137
rF
I
Av.
r
2
et,

1. Abstract-
Seven skills of scientific inquiry were identified from Ontario Ministry
guidelines. These skills were given multi-levelled behavioural definitions.
Separate test item pools were,constructed for the junior and intermediate
divisions using inquiry situations derived from the curriculum guidelines
ofvone school system. The, item pools were field tested and substantially
revised.
4
2
. 4
4

2. Projebt Description
In the,last*ten years there has been-a significant shift in priorities
within the science curriculum toward a greater emphasis
skills in fundamental science processes. his shift is
P1J1 and in the Senior Science Guidelines as well as in
curriculum materials.
on developing student
reflecteein circular
locally developed
Discussion with teachers of the current state of evaluation practices
with respect to the new emphasis on science' inquiry skills has revealed that
teachers feel competent t6 produce test items to measure science content but
feel that they lack the knowledge and skill required to produce tests to0-
measure science inquiry skills. In addition teachers are unaware of any
existing assessment tools which could be used to measure these higher order
4
cognitive objectives in science. The lack of such tools has aroused concern
that if these skills are not measured they are less likely to be taught. Further-.
more there is concern that if there is no valid and reliable means to assess
student growth in science skills it is inordinately difficult for the teacher
t9 key instruction to the appropriate level of student development.
Existing Science Assessment Tools
In a review of available commercial measures Wah(lstrom et al (1977) con6lUded
that Ministry of Education Science objectives are consistently assessed only
by the_Stanford Early Achievement Tests. Examination of these tests reveals
that the items focus on understanding basic science concepts --on knowing the
products of science not, on mastering the processes of science.' Mastery of the
requisite skills of scientific inquiry cannot be determined from°scores on the
Stanford.
3
5

4
There are other less commonly used instruments thaedo focus on science
, .
processes but each has significant'shortoomings, particularly with regard to
the range of science skills covered. Hungerford's_test_(Hungerford & Miles,
1969) measures only classification and observation skills. The instrument of
Nelson, Abraham and Reynolds (1969) is limited, to observation, inference and
classification. The test of Lodge (1969) focuses only on measuring students'
attitudes toward developing proficiency in science processes, not on measuring
mastery of those processes. Although Tannenbapm's (1968).Test of Science
Processes does measure a broader _range of science skill's it too has shortcomings:
it is heavily content, laden, it is limited to the secondary school panel, it
suffers from some serious problems of administration (see Elgood, 1976), and
it has validity problems ((Lierres and Demers, 1980). Other unpublished
instruments (reviewed by Mayer, 1974) suffer from similar deficiencies.
Finally, there is the unpublished grade 8 problem-solving test developed by
/the OISE Intermediate Evaluation Project. There are only alfew items specific
to science and these items'tend to focus on terminal objectives. Consequently,
its use as a diagnostic tool for teachers is limited.
Local Need-
The absence of,suitable instruments to measure sciencelinquiry skills,
and the inability of teacher's to construct their own tests to measure mastery
of Science skills, has been particularly problematic for the Peterborough
County Board of Education. This Board has developed an extensive set of
'skill oriented curriculum guidelines in response to changes in Ministry of
Education priorities in science. These documents are not beiriglused to the
extent or in the manner* intended bythe Board. Teachers are selecting from
- the guidelines the content portions and virtually ignoring the skill emphasis.
The reasons for the inappropriate use of the document are twofold: the ,
student behavioural dimensions of science inquiry skills are not delineated
s
-6

5
by the local guidelines nor do,they provide assessment procedures that would
enable teachers to determine if students are learning the designated
The Board approached the principal investigators in the fallof'1977
with a request for assistance, in meeting the assessment defici ies.of the
Board's sFience guicleline. With the pupport of $17b0 in small scale OISE.
funding the principal investigators worked with a team of vice-pEncipals in
the Board to meet the.needs of junior division' teachers. By adapting procedures
developed by Robinson and others (1976,. 1977), this group identified the
skills of scientific inquiry, described the levels of \ tudent growth for
each skill, developed a small pool of test items and produced a manual for
teachers (appended to this propbsal).
The Board responded very positively to the products of this effort and
requested that the work be extended in the following wayi: by disseminating
teacher manual and pool of junior items, by increasing the pool of junior
items, by developing a pool of intermediate items and by establishing grade
level expectations for each sel-of items. Senior administrators identified
these tasks as the top priority for Board-OISE cooperation and provided
funding for release time for all Board personnel invited to participate on
the project. The Board views these activities as an ffective mechanism to
increase the use of its science guideline and to meet Ministry expectations for
local science programs.
Project Activities
Three integrated sets of activities were planned. The first set involved,
the dissemination of project outputs from the first year. This set of activities
provided for ongoing inservice for teachers and school administrators, particularly
'for joint problem-solving sessions with teachers, directed by priacipals with0
the aid of members of the.development committee. The data collection was
designed to tie in with the inservice in that it requiredteachers to respond

6
to the manual, and test items. It also provided an opportunity for extensive4*
user participation in the revision of the products and in the setting of grade
level expectations for students.
The secorid set of activities were directed toward the production of test-/
items for the intermediate division and,the expansion of the existing junior
item pool. The first step in this process was,a revision of the skills organizer
based on the'responses from gcience educators external to the project.LThis
revision took the form of revising particular growth schemes, especially for
the skill of "judging the adequacy of data collected", and developamg'growth
Ay'
schemes for skills not yet addressed .("observing relationships in the:summary
data" andk"using a data summarizing calculation"). The growth schemes are
contained in chapter 3 of this report.
The activity of developing attest blueprint (Hopkins 'and Antes, 1978)
which'matches skills against content involved a search of the County. guidelines,
for examples of fruitful inquiries which afforded an opportunity for students
to demonstrate the requisite skills. ,This ,matching of skills against content , .
was done to increase teacher and student recognition of the substance of the
test items with familiar topics and to contribute to the ittegration of the
test items with the Board guideline. The test items themselves do not require_
,knowledge of content: all prerequisite content will be given in the item so
that the item measures skill performance alone.
New items were constructed for each skill. The procedures usedinvolved
developing a Stimulus from the selected context which 'requires the student to
denongtrate competenpe'on a given skill, constructing a series of response
options that describe (using the appropriate growth scheme) how students at
each level would behave, obtaining informafeedback from a few students using
the test item with and. without response options, and revising the item using
4

)
student language to increase clarity. This pet 01' events thus involves a
',replication of activities successfully completed by projedt participants in
the first year.
7
The third set of activities involved field trials of new items. Workshops
were held for science teachers in the junior and intermediate divisions.
Participants at these sessions Were introduced to the set of experimental
skills identified in the project, the skills were defined and examples of
items Were presented. The resulting feedback from teachers and student reactions
to the items were.used to undertake a preliminary revision of the item pools.
The item idols are contained in Chapters 4 and 5 of this report.
Impact of the Project
The primary impact of the project will be in the Peterborough County
, 9Board of Education in cladsroOms teaching science. v(The population is
estimated at'330 teachers and 7 509 students at.the elementary level and 40
teachers and 800 students in graates 9 & 10,) The products of the:project will
give teachers a practical tool that will provide them with feedback on
student skill development and on the effects of the science program. It will
also assist the Bdard with the implementation of its science guideline and
by extension with the implementation of Ministry of Educati6n science objectives.
The secondary impact of the project will be in science classrooms in
other boards, partidulariy in two bc4rds that have expressed a_desire for a
role in the project. The test items and teacher manual can be used with little
5
or no modification by other boards faced with the problems outlined in the
rationale,
The tertiary impact of the project lies in its promotion of a generalizable
approach to curriculum development. The 12-15 member of the working group
are pursuing an approach to skirl-acvelopment (known as.ICPOGMU) which is

a
8
being applied to a broad range of curricular problems inb the Board (and not
incidentally in other boards across the province). Successful completion of
,
the sciencesproject in year 16 will increase the.curricular skills of partici-.
pants, and dissemination of the products will heighten support within the
Board for this approach to curriculum innovation, thereby increasing the
contribution of the Institute to the resolution of practical problems of
practitioners,
4
-
10
YY
I
9
ti
Referencei-.
9
Elgood, J. C. An investigation into the development of specific science processesin grade 8 and first year high school students in Aimonte, Ontario.' M.Ed.
thesis, Queen's University,...1976.
1
\
r Hopkins, G. D., & Antes, R. L. ClassrooM measurement and observation. Itasca,
Ill.:, Peacock, 1978..
Hungerford, H. H. & Miles, D. T. A test to measure observation and comparison
skills in science. Science Education, 1969, 53, 61-66.
1
; Intermediate Problem Solving Test. Unpublished test used in the IntermediateTe"sting Projects OISE (M. Holmes, Principal Investigator).
.
1
Kerr, W. A. An investigation into the effects of,learning environmenton attitude,.understanding of science and the scientific enterprise, and process skilldevelopment in /senior elementary science students. M.Ed. thesis, Queen's
University, 1975.
[. - . .
t
Lierres, T., Demert, M. .L'Observation et l'interpretation dans l'enseignement. , des sciences on secondaire. Canadian Journal of Education, 1980, 5 (1), 52-61.
[
3 .
Lodge, F. Student 'rating of science skills. Science Education, 1969, 53, 412-422.. .
%
17)
Mayer, U. J. Unpublished evaluation instruments in science education: A handbook.
Columbus: Ohio State University, 1974.
Measuring the skills of science. An unpublished manual for teachers produced -
.by the.OISE Trent Valley Centre and the Peterborough County Board of Education,
1978.
Nelson M. A., & Abraham, E.t. Inquiry skills measures. Journal0i! Research in
ScienceTeaching, 1973, 10, 291-297.
Robinson, strategy for analyzing complex objectives:Developing skilllevels. Unpublished paper, 1976.
RobinSon,'F.' Defining organizing sets. Unpublished'paper, OISE Northeastern
\ Centre, 1978.
Robinson, F., Clipsham, J., Hedges, H., & Popp, L. ICPOGMU: A system ofa -
curriculum development. Paper presented.at Ontario Coordinators Association
'Conference, 1977.. _ - .
,.
.1 .
. J
Tannenbaum, R. S.. The deveolopment of the test` of science processes. Unpublished,
/,. ,', doctoral dissertation, Columbia University, 1968.
....._
4 WahlStrOMM. W:, Dailey, R. D., & Raphael, D. Measuring achievement at the '-,
1.
.- Primary and junior levels. -Toronto: Ontario Ministry'of Education, 1977.
o
L
f

, 3. Domain'Definitions4
4
,Science is a method for making sense-of the world in which we live.
Science prorams in most schools usually have three sets of'objectives: weo 1(,
want to-teach students some basic facts and.concept.sabout the natural world;
we want to develop appropriate student attitudes otoOrd the natural world and
.
its,inv tigation; we want to teach students how to inquire into their envNon-
ment. This manual is concerned with the last of4lese objectives. The focus
here on the skills of scientific inquiry, sometimes called the science
processes,or'the skills of experimehtal thinking.
If we think of what a scientist does when he is doing an 'experiment, we
wouldlikely come up with a list ake the following: °
.the scientist begins by selecting a question that,can be answered
by doing an experiment;
..he develops a plan for collecting and Organizing information about
',the question;
.he makesNiL record of'his observations in carrying out the plan,
f
making judgments about the adequacy of the information he is collecting;
.he 'Summarizes his data and drawS concIdusions that answer his
initial question;
world;
.
,'
N
.he extendirhis conclusions beyond the experiment to the real
44 A t`, ,
,I
.he.re\ ports the results of his experiment to an audience.
Each of the activities represents an important skill area to,be developed
;Tin a science program. If we want to measure wbether studeitd have Mastered
each of these skills, we must do two things. FirstfNe must define as clearly
as we can what.each skill means and Provide a description of how someone,who .
.had mastered the skill would behSve. Second, we must develop a valid and,
reliable-way of testing the skill performance of students.
AP
12 a,
0,

,"'"
4
11
..
. .
'When it comee to defining the skills we usually think interms of adult '0.
, . .
performance. WaGg, a an image in our minds of how wewould, act whendemon=,
strating these s kills. But adult performance'is not a realistic expectation for
'A student in grade-A.4r( 4rad46 or everl,gfade 10. What we have to do in defining
these skills is describe science behalPiore'that would be appropriate to success '
ful student's at each grade level. Furthermore, we should try to describe
-behavior that would be appropriate to students of different ability levels:.
we want to be able to describelNod experimentc thinking wheriit appears6
.the -work 'of the low and, high. ability students, 'as well 4A when it appears- in
the Work of the average stuent. Furthermore, we want tobe able to describe
our goals'for students in a Way that will help us to improve their performanCe.
Not only do we want to be able to say that a given student is or'is not perform-
.
ing at the desired level; we also wantto be able to say what the next'step for
.
-this student is.
'The ,definitions of science inquiry skills given in this manual are in the.4.
'form of growth sch e . These growth schemes provide a hierarchy of behaviors
.
for each skill;' the 'eirarchy.db,.cribes the performance of students at varying'
levels of sophistication with respect to each skill. Each level in the- growth
....
increase. --
..saeme,corroponds to an increase .n student competence that can be achieved
. ...,,,.
17147A :
..,-. .
,-
in reasonable 'chunks of classroom time, such as a period, 4 week or a unit... .
Expectations tor students have not been developed. Each skill section
has a pt showing hOw a sample of students ecored on the items relevant to
the skill. Teachers are invited to set their own'standards of perfo#ance,
basing their expectations on the science backgrounds of their students, the-
ability of,their students and the amount of instruction in the ski9a4.heir
students have received.
4)
I . °

nIe
.I )
12
I t
.
When it cdMes to measuring student, performance on these skills tere , ,-,'
are several.options. The growth. schemes for each skill can b,
used as an
...° i. 1
. ' .
pupilobservation scheme for rating pil performance. This method requires a great-..-
i.
_ .
. . 0deal of-interpretatiop on the part of the observer. A second method which is
.o V
much less-problematic is to adMinister multiple-choice test items: this manual. _ .
gives a bank of items for each'skill. A third methos to give students open-1
'..N.
.
.ended items; that,is to administer the-items in this manual without the response
,91,
I-options. 'The written answers of students cantle analyzed using the growth schemes
A,
and by the choices given in the multiple -choice items as examples of responses
'..-
at each level. Of the three methods thesecond is the most practical in the
I'
classrocp situation because the item have already been' ev, loped and there are,
.
.
'-.-
scores from a sample of students.Vhat can be used for comparitive purposes.
A few remarks about the items are in order. Eaqh item tests one and only
one skill. Each response option in the item corresponds to one and only oneAft
level of the growth scheme., Most Of the items offer students a range of.
8 . . eresponses that vary in-correctness. 9
There are a few items that have one correct
choice and.a series of distractors.Aincorrect arlwers).
The itemsa-use content related to topics in the Board's science guideline
(which in turn is based on the relevant Ministry guidelines). Therefore there. e .
,may be an inclination to use a given item during or following instruction in the
I .# topic to which its content refers This is not inappropriate and students may_
i indeed be.more comfortable when the information contained in the introduction
.
.0 tOithe item task is more or less familiar to them. However, it should be..
remembered that each ite tests a skill, it does not and cann4t,test the acquisi-
tion.°
tion of content knowledge .( oncepts, principles, facts)'.41
6..
1
1'4

13
Efforts have been made to ensure that all the content information necessary
for completion of an item is, provided in the stimulus portion (the question part).
Any item may be used when a teacher Wishes to know about the student's skill, .
level; there is no need to wait, until the conteht topic has_been coveted before
administering it. 4 1
The item bank whiCh follows contains an organizei that matches skills'
against cbre content of the cou nty progkam, a section.on each skill, and a final
.Section describing how the items are produced.' Each skill section contains a-,
. .
description (growth scheme) for the skill, a set of tea items, an answer sheet4
for the items and a summary of student performance on the items.
In the description of the skill an exampl=e Of a fairly typical experim'ent
swill be used. The diagram shows a drawing of a pendulum. A piece'of string
with a bob on the end of it is suspended from a table and held in place.by a
book; The swinging string functions as a pendulum.
ik1644601;
Angle of .ARelease
4- Arm.
ie
deL. e"
4-4 Bob'
"The Pendulum
The key components (variables) are the length of the pendulum arm (i.e.,
the length of the string), the mass of the bob (the weight on the end of the arm),
the'angle-of release (i.e., the angle between the table and thearmat the point.
0f-its release), the amount offorde given the arm when it is released (i.e.,
the arm can be dropped or pushed), and the peripd (i.e., the time required to
...Complete one complete swing in,the bob). ,.Typical experiments involve the student

trying to determine which of thee variables affct the period. These
experimntsconclude that the periodof$the pendulum is positively related
to the len§th of the arm and is not affected by other variables.
I.
gib
16
4
14
-
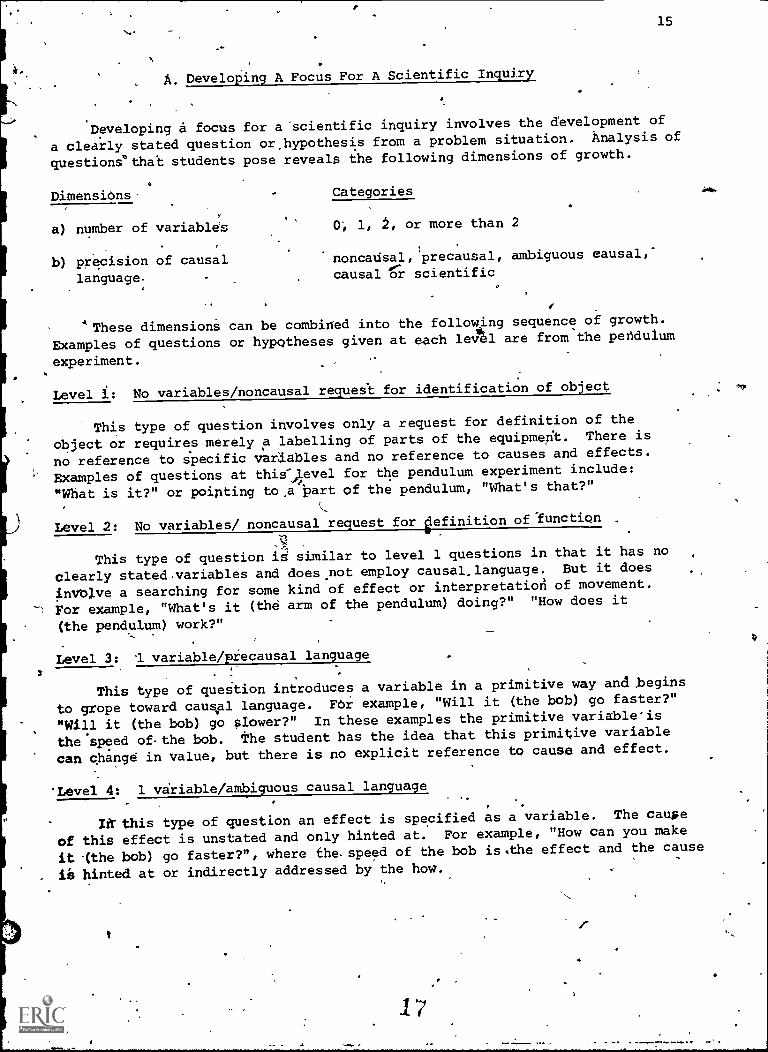
A. Developing A Focus For A Scientific Inquiry
15
Developing a focus for a Scientific inquiry involves the development of
a clearly stated question or,hypothesis from a problem situation. Analysis of
questions that students pose reveals the following dimensions of growth.
Dimensions Categories
a) number of variables 0; 1, 2, or more than 2
b) precision of causal noncausal, precausal, ambiguous causal,'
language: causal or scientific
These dimensionS can be combined into the following sequence of growth.
Examples of questions or hypotheses given at each leAl are from the pendulum
experiment.
Level i: No variables/noncausal request for identification of object 1
This type of question involves only a request for definition of the
object or requires merely a labelling of parts of the equipment. There is
no reference to specific variables and no reference to causes and effects.
Examples of questions at this".4.evel for the pendulum experiment include:
"What is it?" or pointing to,a tart of the pendulum, "What's that?"
Level 2: No variables/ noncausal request for gefinition of function
9,
This type of question is similar to level 1 questions in that it has no
clearly stated. variables and does not employ causal.language. But it does
invblve a searching for some kind of effect or interpretation of movement.
For example, "What's it (the arm of the pendulum) doing?" "How does it
(the pendulum) work?"
Level 3: variable/precausal language
This type of queition introduces a variable in a primitive way and .begins
to grope toward causal language. F6r example, "Will it (the bob) go faster?"
"Will it (the bob) go slower?" In these examples the primitive variable-is
the speed of-the bob. The student has the idea that this primitive variable
can change in Value, but there is no explicit reference to cause and effect.
Level 4: 1 variable /ambiguous causal language
In this type of question an effect is specified as a variable. The cause
of this effect is unstated and only hinted at. For example, "How can you make
it Ithe bob) go faster?", where the. speed of the bob is.the effect and the cause
is hinted at or indirectly addressed by the how.

16,
Level 5: 2 variables/explicit causal language
Questions at this level clearly specify 2 variables. Oneyhriableis a potential cause, the.other variable is the potential effect. However,
the student may focus on'a specific change in the causal variable, for example,
"If I make the string (the arm) longer will it make a difference to the amountof time required to make one complete swing?" "If I increase'the angle of
release will the time required to make a complete swing be affected?"
Level 6: 2 variables/precise scientific statement
Questions at this level differ from Level 5 questions in that thet ifull range of variation in both the cause and effec variables is being
considered and More precise "scientific" language is employed. Hence the
student. -at this level might ask, "Does the length of the arm affect the'period?"or "Does the amount of force applied to the bob affect the period."
Levels 6a:A slightly more advanced student may ask a series of 2 or more Level 6
questions about th effect of several potential causes of the same effect, thus,
-IA the period affe ed by the length of the arm, or the amount of force applied
to the bob, or the_ s'of the bob, or the angle of release?"
Level 7: More than 2 variables
Questions at this level specify more than 2 variables, but rather thanasking about each potential cause in an essenidally separate question the student
now links them to show that possible interacting effects are being considered.*
A three variable example is "Does the,effeCt of force on the period depend on the
length of the arm?" or, restated, "Is the effect of force,on the period different
for different arm lengths?"
Testing: Levels 1 through 6 (but not 6a) are tested in the Junior Division.
Levels 4 through 7 are tested in the Intermediate Division.
I
k
4
18

B. Developing A Plan For Collecting And Organizing Information
Developing a plan for collecting antNorganizing information refers to
the mental image of the problem and its solution. Such a mental image includes
-a set of variables.and a hypothesized relationship. This mental image is
very difficult to communicate-to another person; hence it is very difficult to
measure. The mental image or framework or plan can be represented as a data
table, a graph, a set of steps in.an experimental procedure or as a'descripaon
of how to find out if-an expected relationship does exist. In assessing the
adequacy of student fkameworks the important thing is not the form in which'it
is expressed but these dimensions:
Dimensions
a) number of variables
b) use of control variables
Categories
0, 1, 2, more than 2
no'controls, conditions kept the same,systematically varying a control
variable
These two dimensions can be combined into the following levels of
growth:
Levf=1: No variables.
At this level the student is essentially playing /ith the equipment.
He is not investigating a specific question but only anipulating the equip-
ment. In the pendulum experiment this might mean swinging the arm of the
, pendulum back and forth simply because'this is an obvious thing to do with
it. The student might unconsciously vary the angle of release or theamount
of push giVen to the arm as it is released but he is really not aware that
any of his actions could be related to the pendulum's period (the length of
time the arm takes to make a complete swing).
, Lev& 2: Manipulating a vatiable to see what happens
This too is a pre-experimental stage. The student is not investigating
a clearly defined question or hypothesis. What he does is chapge something
to see it anything else is changed. The changes he tries have a purpose but
they are not systematic.' Each involves.a single variable; there is'no plan
to measure a second, dependent, variable (the effect) or any particular idea
of how that effect might manifest itself. In the case of our pendulum example
the student may decide to try lengthening therstring (the.arm of the pendulum)
. to see:what will happen: he has no expectations of the result.:
19

1
1
,18
Level:3: Manipulating 2 variables with no attempt to keep conditions the same
At this level the student is engaged in a genuine experiment. In the
case of the pendulum he might lengthen the string ( the arm of the pendulum)
to see if this will change the amount of time it takes for the bob to'make )
one. complete swing (i.e., he is trying to determine if the length of the arm
'affects the period). At this level.theremtis no attempt to control other
variables which might affect the result. For example, the angle at which the
student releases the arm of the pendulum or the amount of push the studerit
exerts on the arm when releasing the arm may affect the period of the pendulum.
At this level the student is unaware of the need to control for the possible
distortion of his results by these uncontrolled factors.
Level 4: Manipulating 2 variables while keeping other/variables 'constant
At this level the student is, aware that theerelationship between two
variables might be influenced by other,factors. He attempts to deal with
this problem by keeping these other factors constant. For example, a student
at this level trying to find out if the period of the pendulum changes when
the length of the arm is increased from 10 cieto 20 cm might make sure that
he releases the arm from the same angle and with the same amount of push when
the arm is 20 cm long as when the arm is 10 Cm long.
*Level 4a: Manipulating more than 2 variables in_pairs
This level is only a slight advance from level 4: it will not be tested
in the items but it is included because it is a useful step in helping students
master level 5. Students at this level handle questions involving more than
2 variables by doihg a series of 2 variable experiments. In the pendulum
example a student who wanted to find out what would make the arm of the pendulum
go faster might identify the length of the arm and the weight of the bob as
factors which influence the period. At this lev%he student would test for
the effect of the length of the arm on the period d then separately test for
the effect of the weight of the bob on the period., He would'keep other factors
such as the angle of release 4nd the amount of push given on release) the same
in all cases.
Level 5:' Manipulating 2 variables while systematically varying a third
At this level]. students are testing for a relationship between twovariables while a3Ittrolling for a third. 'the difference between this leveland level 4 is that at level 4 students are, controlling variables by keepingthe'same value of the control variable in all situations. At level 5 students
are controlling variables by finding out if the relationship they are examining
js maintained'in several values of a control variable. Foi example, a level
5 student. who wanted to find out if the length of the arm affects the period
Olight,determine the period when'the arm is 10 cm, 20 cm and 30 cm gping a bob .
that has a mass of 1 g. He might then repeat the experiment to dnermine if
the relationship between length of the arm and the period remained the same
'when bobs having a mass of 3 g, 5 g and so forth were used.
Testing:. Levels 1, 2, 3 and 4 are tested in the Junior Division.Levels 2, 3, 4 and 5 are tested in the Intermediate Division.
S
2 e)

X third dimension, which has not been included in the growth scheme,
concerns the student's degree of independence in selecting a frameWork or
plan. At the lowest level, the student would be.able to. follow a pl\an (experi-
,
mental procedute), given by a teacher or textbook. Mote sophisticated students. -
would be able to participate in,the development of a framework collect vely
with the guidance of the teacher. ,Much more sophisticated students wou d be
able to develop their own framework for an experiment after being remind d by
a teacher that a plan developed for a previous experiment is relevant. TiecO/
most sophisticated students would 44 able to develop their own frameworks with-
out
'` :,-
prompting from the teacher. This dimension will not be tested in the i ems.,\
It ii.offered as a way of categorizing student behaviour for purposes of claes-.
room obserVation.
21 j.
.1

C. Judging the Adequacy of Data:t
After the data from the experiment has been collected there is a 'crucial
set of issues to be addressed. Is the information of sufficient volume,
accuracy and refevance to deal with the problem? The skillpf-judging the
adequacy of, the data involves answering these questions. There are several
distincedimensions to the skill,: ..
a) The data collected must be r4evant to the problem. That is the student
must have collected information on the relationship of the specific variables
20
a
in his experimental plan: This dimension is addressed in'the skill of recording
data.
b) Data about the relationship between one set ofvariables should not be
confounded by distortions -that arise by failing to control for the effects of
ether variables that might affect the relationship. This dimension is addressed
in the skill of developing a plan: in that growth scheme distinctions 4fe made
between plans that fail to control for intervening' variables (levels 1, 2 and
3), plans that try to keep other variables constant (level 41 and plans that
systematically control for other,variables.(level*5).
c) he thiid dimension concerns, measureRent'error. All information collected(
in an experiment has an err& component.' What distinguishes students with
respect to-the skill of judging the adequacy of data is the amount of error
that exists in their data (i.e., the adequay of the procedures used to collect
the information) and strategies used to deal with error.
A sample of experimental procedlares that students should be able to
perform has been identified. _These include such things as measurement procedures,
general control procedures and procedures to follow when unexpected or conflicting
results are encountered. A series of test items focusing on the correct
performance of each procedure has been developed.- No stages growth have
beeh described.
.22
tt
0
21
.
A variety o strategies could be used by students t deal with residual
measurement error. In order of sophistication, these strat,pgies are: ignOre
the error (accept the data' uncritically), repeat the experiment several times
(i.e. have multiple trials of the experimental treatment), and employ statistical
0 strtegiesito measure the error (e.g. compare the amount of variance between1ko.
'trials to the amount of variance between experimental conditions). No test
items lave been developed to measure these differences in strategy.
VIP
A.
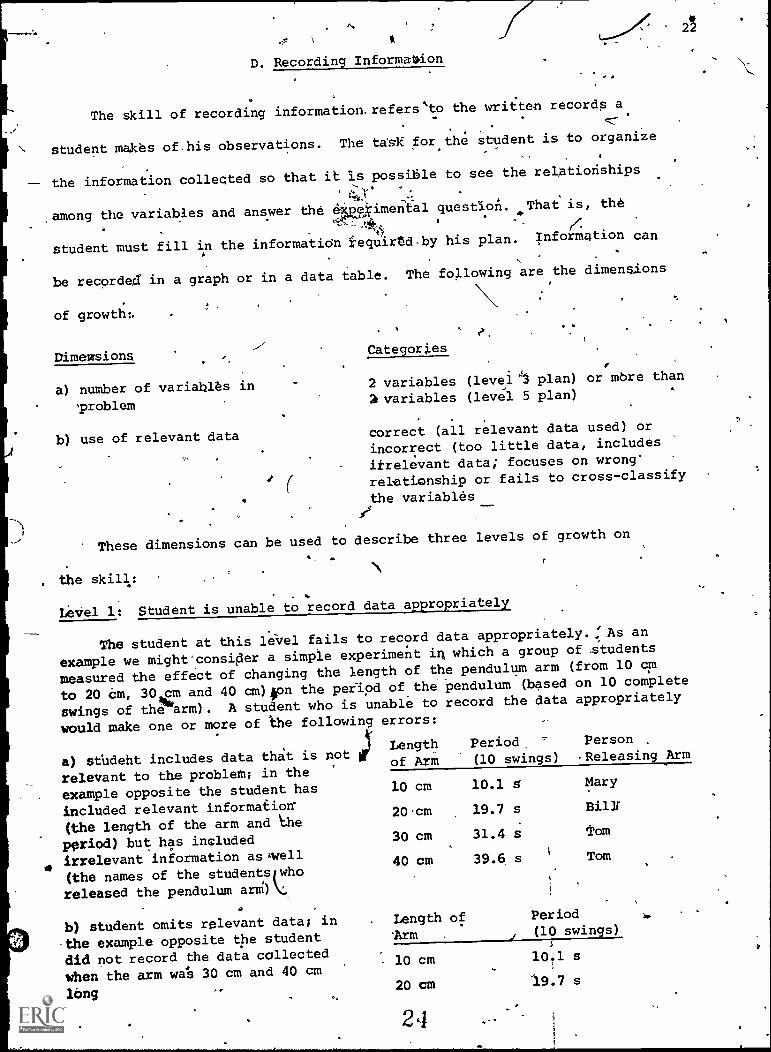
D. Recording Information
The skill of recording information.refers'to the written records a
\ student makes of.his observations. The task forthe student is to organize
the information collected so that it is possible to see the relationships
,among the variables and answerv;5,
the ewimental question. .That is, the
student must fill in the information fequirtdby his plan. Information canA
be recorded in a graph or in a
of growth:.
Dimewsions
a) number of variables in
'problem
b) use of relevant data
These dimensions can be
, the skill:
data table. The following are the dimensions
Categories
2!
2 variables (level plan) or more than
variables (level 5 plan)
correct (all relevant data used) or
incorrect (too little data, includes
itrelevant data; focuses on wrong'
relationship or fails to cross-classify
the variables
used to describe three levels of growth on
Level 1: Student is unable to record data appropriately
The student at this level fails to record data appropriately.: As an
example we mightconsipler asimple experiment in which a group of students
measured the effect of changing the length of the pendulum arm (from 10 cm
to 20 Cm, 30 cm and 40 cm)ion the period of the pendulum (based on 10 complete
swings of the arm). A student who is unable to record the data appropriately
would make one or more of the following errors:
a) studeht includes data that is not ;relevant to the problem; in the
example opposite the student has
included relevant information(the length of the arm and the
ppriod) but has included
Eti
irrelevant information asewell
(the names of the students who
released the pendulum ard)V
b) student omits relevant data; in
the example opposite the student
did not record the data collected
when the arm was 30 cm and 40 cm
lOng)
Length Period Person
of Arm (10 swings) Releasing Arm
10 cm 10.1 S Mary
Bu Y
Tom
20 cm 19.7 s
30 cm 31.4 s
40 cm 39.6 s Tom
Length of Period
'Arm (10 swings)
10 cm 10.1 s
20 cm 19.7 s
24

1
I_
I .
1
c), student focuses on the wrong
relationship; 'in the example
Opposite the Student recorded.data relevant to the length of
the arm and the distance travelled
by the arm rather than data On the
variables given in the question
d)'student fails to Cross-clatsiethe data by the variables ink t.be
example opposite-the student has
prodlced 2 separate tables.- onefor length of "the arm and One
for period of the pendulum;because the tables are separate
it is impossible to determine
if one variable causes changes
in the other
*e) student fails tos sequence the,
Oata on one of the variables; ,
(this is rare in an experimental
problem because the order is,
usually given to students); in the
example opposite it is difficult
to see the relationship because
neither Variable is sequenced
Length of
4-rm
10 cm20 cm,30 cm
40 cm
Distance Travelledby the Arm ,
Y1 cm14 cm21 cm28 cm
Length of Arm
10 cm,20 cm:30 dm
40 cm
Period of Pendulum(10 swings)
10:1 .s
19.7 s31.439.6 s
Length Period -
of Arm '(10 swings)
20 cm 19.7 s
40 cm 39.6 s
30 cm 31.4 s
10 cm 10.1 s
Level 2: Student records data appropriately in a 2 variable experiment
The student at this level avoids all of the errors listed above in
level one. Both ofthese examples for the pendulum experiment are correct.
Length Period _
of Arm (10, swinge)
10 cm 10.1 s
20 cm 19.7 s
'30'cm. 31.4 s
40 cm 39.6's
40
30(1 'swings)
C20
10 x
010 20 30 4'
Length of Arm (in,cm)_
x.
25
23
1'

tr.
24
Level 3: Student records 4ata appropriately in an experiment with more than
2 variables
The student at this level avoids all the errors listed aboVe in level- 1.
What distinguishes this student from level 2'is that he is able. to regord data
in a more complex problem. The following table and graph ajre alternativeway ''
of recording information in an experipnt to find out if the affect of the
length of the pendulum arm on the period is influenced by the massof the Bob.
Period (10 swings) in seconds'#.
1 g bob 2 g bob 3 g bob
10 cm20 cm30 cm
'40 cm
11.4 10.1 9.6
20.3 19.7 19.9
29.8 30.4
40.2 39.6 41:8,
Period(10 Swings)50.0
(in s)
40. - -. - 40, cm arm
39.0, _ --- 0 cm arm
20.
10.0
I
20 cm arm
10 cm arm
19 29 39
Mass of bob in g)
Testing: Levels 1 and 2 are tested in the Junior Division
Levels 1 and 3 are tested in the Intermediate Division
V
26

Growth Scheme for Observing Relationships in DataI I
OP'
25
Observing relationships in data in an experimiental problem involves the
examination of previously developed,data tables or graphs to find trends in1the data. The task is to(deteribine whether there are relationships between the
variables in the study, this skill is liery'closely'linked to the skill'bfconcluding: It describes the capacity of the student to process information.
It helps diagnose the difficulties of students who are unable to draw appropriate
conclusions: The dimensions of the skill of observing relitionships are:.
Dimension Categories of Growth
a) number of cases used a.limited selection or all the cases
b) amount of information about each 1, 2 or 3 variables
case usedeyeball scrutiny or computational
c) sophistication of strategypused strategy
These dimensions can be combined into a growth scheme which will be described
using an example of data collected in an experiment involving marbles rolling
down a ramp. 'The first 5 levels refer to a siinple experiment in which only 2
variables are involved'. The sixth level requires additional data fbr a more
complex,problem concerning 3 variables.
Mass of Marble
Distance Travelledby Marble
1 g 1st trial 12 cm .
2nd trial 14 cm
3rd trial 11 cm
2 g 1st trial, 17 cm2nd trial '16 cm.30 trial 19 am
g 1st trial 24 cm*21.4 trial 22 cm
3id'trial 23 cm
Leve1.1: Limited selection of-cases/1 piece of information
I
The student at thistlevel tries to observe relationships by considering
the inforeation'about 2 variables provide&for a single case. For example, the
student might look to see whathappened with one of the,marbles, for example,
m.ass."'the 1 g. Even though he ha information about 3 trials w this is marble he.
will not be able, to observe any relationship because he looks at only one
,
-
.
27
I

26
Level 2: Limited selection of 2 extreme cases/2 nieces of .information about each
44
.
..vThe student at this lev 1 selects the two cases which 1:-.c the highest
and lowest values on one of the ariables in the study. For examnle, a student
might pick out the longest distance (24 cm) and the shortest distance -(11 cm).
Since the longest distance is produced by the biggest marble (3 g) and tilde short-
est distance by the smallest marble (1 g) he might decide there is' a relationship
between4mass of the marble and distance travelled.
Level a: Limited selection of a few cases/2 pieces of information a.'hOut each
1
The student at this level tries to observe relationships by. con,sidering,
.the appropriate information about a few cases arbitrarily chosen. For example,' a
student might focus on the second trial in each set and'try to determine if the
distance travelled increases as the mass of the marble increases. This student
ignores the other cases in the data table.
Seve1.4: All cases/2 pieces of informg.tion about each/eyeball scrutiny
The student at this level uses all the cases. The cases are,grouped
on one variable: the student looks down the column for the other:variable to
see if the same order or pattern exists. If there is a consistent pattern he is
able to determine if there is a relationship between _the two variables. For
example, the student at this level might observe thati the distances travelled tend
to increase between each group. Since themass of the marble increases between
each group, he might observe th,t there is a relationship between the marble's mass
and distance travelled.
(--
Level 5: All cases/2 pieces of information about each/computational strategy
The trouble with the level 4 method for observing relationships is that
deviant cases in the patter:1r, or weak relationships, make it difficult to observe
the.appropriate relationships. The student at level 5 calculates dyerages for each
-set of cases and then observe if there is a relationship. For example, a student
might calculate that the average distance the marble rolls increases (12.3 cm,
17.3 cm and 23 cm) as the mass of the marble increases (1 g, 2 g and 3 g). More
sophisticated computational strategies are appropriate for the Senior Divsidon.
A student at this level might also select median cases.
Level 6: ''All cases/3 pieces of information about each/eyeball scrutiny
This level requires additional data` -for the third variable. In the
example provided, the data for each set of three trials has been averaged.
Height o f AVerage Distance Rolled
Rasp 1 g marble 2 g marble 3 g marble
10 cril
15 cm
°20 cm
20 cm
30 cm
40 cm-
40 cm
60 cm
80 cm.
80 cm> .
120 cm
360 cm.
2a

27
A student at this level might by trying tclfind out if variable affects
a 'sepond'variable while a third variable is- systematically altered. For example,
dOeS the mass of.the marble affect the distance rolled when the height of the
ramp is varied. A student at this level would examine the data for the first
row of the table. He would find that when the ramp is 10 cm ,high, the distance
rolled increases with the mass of the marble. Then -he would examine the second
row of the table and observe that the distance rolled increases with the' mass
of the marble when the ramp is 15 cm. Then he would examine the third row of
the table and observe the same relationship. He would' summarize his observations
by saying that the mass of the marble affects the distance rolled when the
height of the ramp is changed.
.Testing: Level's 1, 2, 3, 4 are. tested in the Junior Division. .
Levels 2, 3,.4, 5 are tested in the Interthediate Divi*ion.
Level °6 is tested in the Intermediate Division.
`r 4
4 29
28
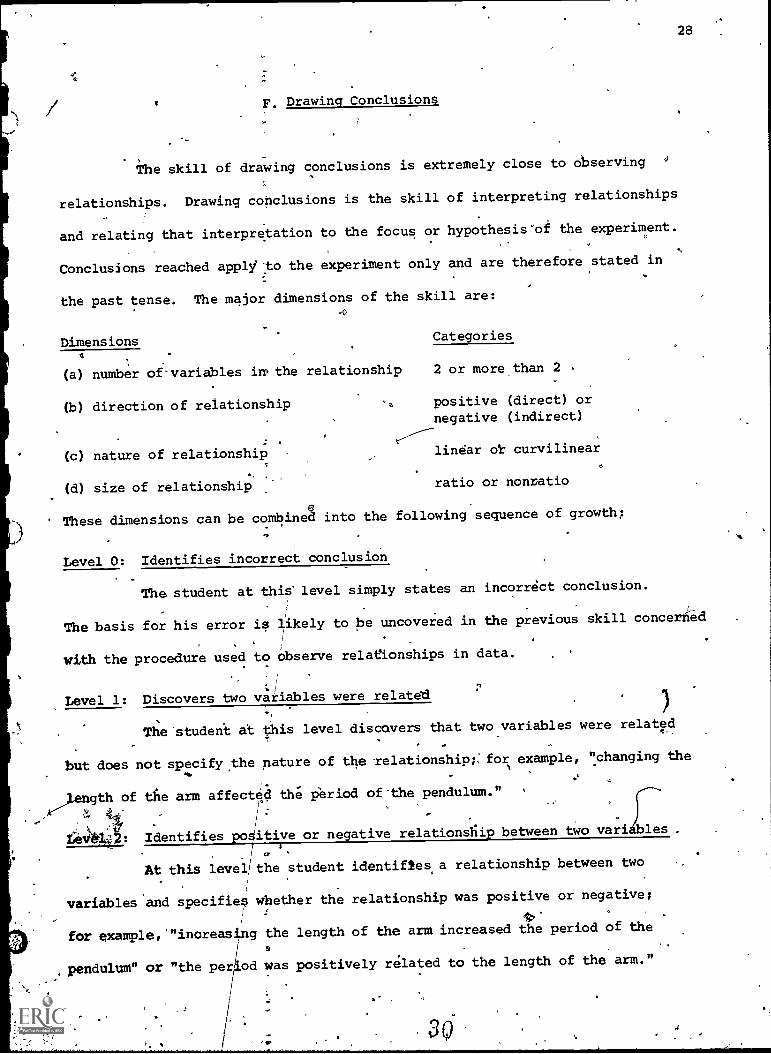
F. Drawing Conclusions
The skill of drawing conclusions is extremely close to observing
relationships. Drawing conclusions is the skill of interpreting relationships
and relating that interpretation to the focus or hypothesis'of the experiment.
Conclusions reached apply-to the experiment only and are therefore stated in
the past tense. The major dimensions of the skill are:
Dimensions Categories
(a) number of-variables in the relationship 2 or more than 2
(b) direction of relationship positive (direct) ornegative (indirect)
(c) nature of relationship linear oY curvilinear
, .
(d) size of relationship ratio or nonratio
'These dimensions can be combines into the following sequence of growth;
Level 0: Identifies incorrect conclusion
The, student at this' level simply states an incorrect conclusion.
The basis for his error is likely to be uncovered in the previous skill concerned
with the procedure used to observe relationships in data.
;./
Level 1: Discovers two variables were related
, )
The'studeni a't this level discovers that two variables were related4
't
. .
but does not specify the nature of the elationship;:for example, "changing the
gth of the arm affected the period of-the pendulum."
il)60- Identifies po itive or negative relationship between two variables .
At this levellthe student identiftes a relationship between two
variables and specifies whether the relationship was positive or negative;
/
for example,'"increasing the length of the arm increased the period of the.
,penduluM" or "the perri.od was positively related to the length of the arm."
a(i
I
29
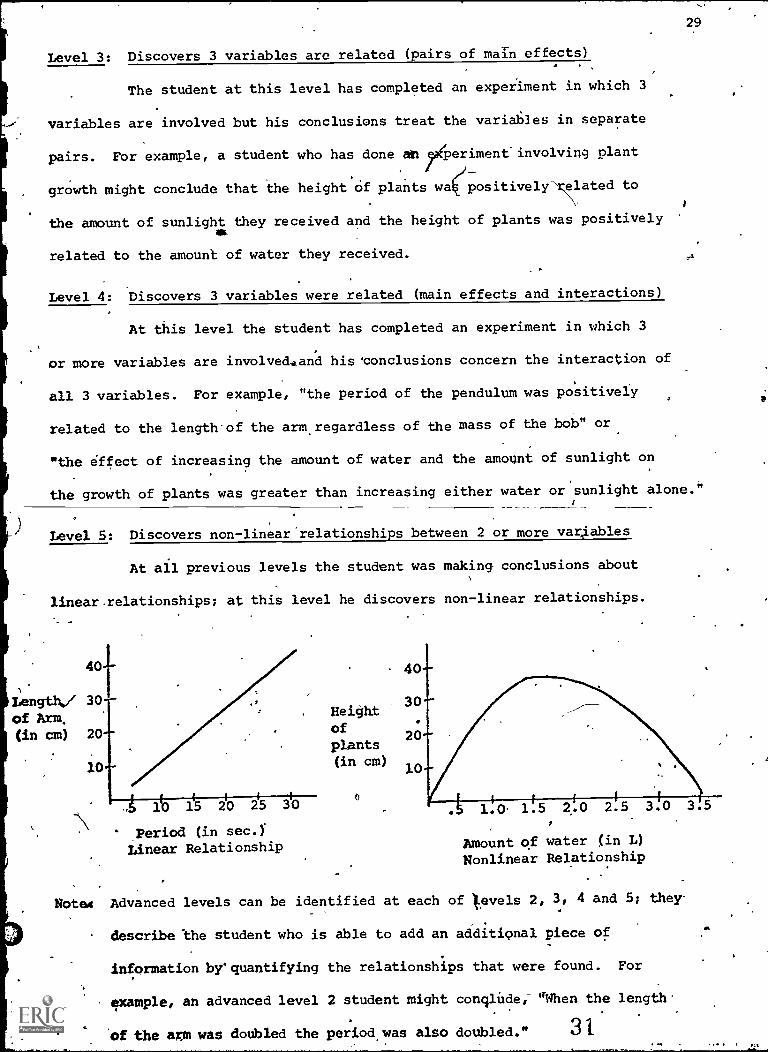
Level 3: Discovers 3 variables are related (pairs of main effects)
The student at this level has completed an experiment in which 3
variables are involved but his conclusions treat the variables in separate
pairs. For example, a student who has done Mnyeperimentinvolving plant
growth might conclude that the height Of plants wak positively elated to
the amount of sunlight they received and the height of plants was positively116
related to the amount of water they received.
Level 4: Discovers 3 variables were related (main effects and interactions)
At this level the student has completed an experiment in which 3
or more variables are involved4and his' conclusions concern the interaction of
all 3 variables. For example, "the period of the pendulum was positively
related to the length of the arm regardless of the mass of the bob" or
"the effect of increasing the amount of water and the amount of sunlight on
the growth of plants was greater than increasing either water or'sunlight alone."
Level 5: Discovers non - linear relationships between 2 or more variables
At all previous levels the student was making- conclusions about
linear relationships; at this level he discovers non-linear relationships.
40
Length/ 30of Arm.
I(in cm) 20
10
1 i 4 1 I
10 15 20 25 30
40
. Height30
of20
plants(in cm)
10
Period (in sec.)
Linear Relationship
1.0 1.5 2.0 2.5 3.0 3.5
Amount of water (in L)
Nonlinear Relationship
Note Advanced levels can be identified at each of Levels 2, 3, 4 and 5; they
describe the student who is able to add an additional piece of
information brguantifying the relationships that were found. For
example, an advanced level 2 student might conclude,- "When the length.
of the aim was doubled the period was also doubled." 31

. 'Testing: Levels 0, 1,*2 and 3 are tested in the Junior Division
Leyelb 0, 2, 3 and 4 are tested in the Intermediate Division
Level 5 is not tested.
4 The advanced levels of levels 2.to 5 are not tested.
J.
V
6
ats
ID
.30
-

1-N.
........)
l'
ments about what is expected in- events ,of a similar nature, now or in ther
future. Thus a student may use the results of his inquiry to draw conclusions
1
about not only repetitions with the same conditions as his experiment, but.
about conditions in the real world (grindfather clock pendulums, as well as
1weighted string pendulums) oeto predict, based on he relationships he has
Cdiscovered, the probable outcomes with other
.
values of the factor he has tested
(for example, pendulum lengths that fall between the lengths he used, or that
Iare longer or shorter than any he used). ,
The point of experimental trials of possible factors whiech make a differ-
' ,'ence to things of interest is, pf course, to be able to make such general or
i
I
inclusive statements or to predict what is likely to happen in future real-.
world happenings. Students are encouraged to actively seek contexts in which
their,results apply and to use correctly .the facts of the relationship they
G Generalizing/Extrapolating/Predicting About Probable Results in New Situations
This skill involves using the conclusions of an experiment to make'state-
have discovered in these new contexts. It is also.important, however, that
they learn to assess whether the same kind of results are probable, and if sp
how probable, as the conditions of the new context and the values of the factor
'which has been found to make a difference grow less similar to thoSe ofthe
experiment.
Two, dimensions are involved:
a) Correct Use of Discovered Relationships
The first 3 categories of this dimension are concerned with two-
.
variable (the factor making a difference and the factor affected). straight-
lint (as.the factor making a difference increases or decreases the factor
affected shows regular increases or decreases) relationships. (as in the
diagram_ in Fig. 1)o
33
-31

te-
Pendulum40
length in 20cm
10
0.5 0. 5 1.10
Period lehgth in seconds
Fig . 1
The child-who.has moved beyond an inability to generalize at all to the.
earliest level recognizes only that the effect should be operating in the
0
new context (the first factokis making a difference to the second one); later
he can specify the direction of the difference (that increases in one will
increase or decrease the other;); at the third level he can use the facts of the
experimental outcomes to calculate how much these increases or decreases.
/;)
shOUld be.
The final two categories have to do with more complex relationships.
.The ,first of these is concerned with relationships that are "curved" rather
than straight lines (that is, if values of the two factors were plotted on a
graph there would be
example, in Fig 2).
vary witiethe amount
PlantGrowthper wkin cm
changes in the direction of the linesrqduced. (As for
With these effects, then, the direction of the effect can
of the factor that makes a difference. At the final
Amount of Water per slay in ml
..,
Fig. 2
34
a
32

33
4level, students arelearning to deal with effectg produced by a complex of
two or more interacting factors when generalizing or predicting what happens
in situations beyond that of the experiment'itself.
b) Assessment of Probabilit
This dimension is 'eflected in the develOping ability of a student
1
to be critical of potenti ly appropriate new contexts in which to apply his
findings,-and to modifyhis generalizations orlaredictions accordingly. 'Thus
the younger stuiet is apt to feel he has disCovered a truth that applies
indiscriminately to all places and at all times.) With increasing maturity
and experience he enters 6 transitional phase where he may dOubt the applica-
tioWef his results when the contexts, orglrhe values of the. independent variable
(the factor that makes a difference) are very different from those of his
experiment: Finally, he reaches a mature level where he is'critical ofeach
new context and actively assesses each in terms of the probability that a
discovered relationship wild. hold., The difference.in this student is that 410W
he searches for 'factors in the new context that could alter tile'results, When-
doing this he will consider both the conditions (same as the experiment,
different but so similar they may be placed in the same class)and different
because of the presence of other factors which pace class membership in
question) and the values of the independent variable, (which may be the same
as those tested, different but within the range tested, pr either a small or
large amient greater or lesser than any of the valtes about which information
has been discovered).
These two considerations may be placed together to form the following
table:
35
s.

Values Of The Independent Variable.
6 1
Larger or Smaller Than0 Tested Values
Same as Within the By 'a small By a large
Conditions tested values tested range amount amount
Same asexperiment
Real-worldbut sameclais
1 2 2 2 or 3
2 2 2 3 or 4
Differentclass(other 3 or 4
factorsPresent)
3 or,40
3 or 4 3 or 4
Obviously the prObability that the relationship holds' will decline as
one proceeds from the upper left-hand cell, which describes an exact repetition
of the experiment, to the lower right-hand cell which describes a situation with
both siMilarities and differences, in the conditions' and values of the
independent variable which.differ:greatly frpm those for' which information exists.
The numbers in the cells are attempts to categorize (faikly roughly)Cele prob-
ability of predictions based On the discovered reiationshiP, given the situations
described by each cell, as follows;
1 = almost certainly true
2 = probably true
3 = may or may not be true
4 = unlikely to be true
Thus in the upper'left-hand dell the only differences' one would expect ,
would be-due to small er!ors in measurement. Continuing through the cells of
the table, repetition of the experiment (b.g. uses weighted strings for .
o
pendulums) or essentially of the same class (e.g. a grandfather clock), it is
probable the relationship wouldioe.unaltered. 'However, if the values of the
independent variable differ, especially by a large amount' (e.g. a pendulum
several metres in length when the longest one tested is.40 cm) the probability
. 36
4

would be assessed as somewhat reduced by someone who has no other-information
. about pendulums. When there are new factors in the conditions (e.g. the grand-
father clock.sits on a tilted table or floor) predictions would be "may or may
not be true" or are "unlikely to be true" depending on what is known about the
probable effect these other factors would have.
The two dimensions, "correct use of the relatidnship", and "assessment
of probability" may then be summarized as follows:
Dimensions Categories
a) Correct use of relationship _Effect with no direction or amount;.positive or negative effect with noamount; pobitive or negative effect
_ with amount; effects that vary indirection with amount; complex effects
b) Assessment of probability No differences among situations;extreme differences assessed; all new
4 situations assessed
These dimensions can be combined into the following levels:
Level 0: No new situations identified
Level 1: 'Equally probable, effect expected in all situations
The student at this level is aware, for example, that the length of
the arm affects the period but is unable to predict the specific effect, in
a new context such as la real grandfather clock, of lengthening or shortening4
the arm. Further, he would ascribe the effect to any swinging arm, whatever
the circumstances.
Level 2: Correct direction of effect expected with equal probability in all
but very obviously different situations
At this level the student is able to correctly predict the directiod of
the effect in other situations. When applying the-results of the pendulum
experiment to grandfather clocks, for example, the student would realize that,
lengthening the arm will lengthen (not shorten) the period. He can also
3)14
e
36
correctly apply the direction of a negative relationship) On his own, how-
Never, the student does not differentiate among most situat ons, expecting e*, 0
relationship to exist with equal probability in all but'very, different
circumstances (such as, perhaps, a grandfather clock on'a'tilted or uneven
floor).
Level 3: Correct direction and amount of effect expected with equal probability
in all but very different situations
At this level the student dan. Use the data of the experiment to correctly
determine the size Of the expected effect, as well as,its direction. He still,
however, fully expects the relationship to hold for all but very different
circumstances.
Level 4: Correct direction and amount of varying effects expected with differing
probabilities depending o circumstances .
The stud6nt at this level can correctly apply more complex relationships
where the amount and d rection of the effect can vary depending on the strength
of the factor which pr uces it (as, for example, in the relationships of water
or fertilizer to plant g wth).
The big difference in tudents at this level, however, is their awareness
of the variations in probabi ty that the same result will be found in new
contexts. Such students take nto account, ds was described, above, both the
conditions is the new context Member of'the class of conditions to which
the experiiental conditions belong or are there new variab es present which
affect its class membership) and the values of the variable about which the
prediction is made.to
`Level:51._ Correct direction and amount of complex, 2 or Itre variable effects
expected with differing probabilities depending on circumstances.
This level describes the individual who can deal with effects that are
determined by interactiqg factors when assessing.how his results apply beyond
the experiment in which they were discovered. This student also assesses the
1.

0
effeceof-differing circumsp.a. ces and modifies accordingly his estimate o
the probability that the rela ionship will hold.
Testing:'
Although the 2 dimension have been combined when descrilDing levels,
they are tested separately.
For dimension (a) - Separate items with sub-items each containing a correct
response and a set of distractors are provided for each
of leve s'2 (junior), and 3 (intermediate) (levels 4 and
5 are .t tested). Students who fail level 2 are assumed
to be at level I or loWer. Students who fail level 3
should be tested with the next lower level. ,Students who
pass-level 3-are assumed to be at least at this leVel.A ,
'For dimeniion (b) - Students who'pass the items provided for this dimension
are assumed to be at leardt at level 4 of the growth scheme
with respect to this dimension. Students who fail are
assumed to be below level 4 on-this dimension. This
dimension is_teted in the intermediate division,
'Mew
37
s

38
4. Junior Division Item Pool
The items have been grouped in terms of skill, using the same sequence
that was followed for the presentation of the domain definitions (growth
schemes).
In each case a marking sheet precedes the items.
40
O
44-
-\ 4;
r,
; -

Items
1..Ramp
2. Sound
3. Bicycle
,4. Shadows (a)
5. Shadows (b)16.
ear
A. QUESTIONING = Junior
0
$
Answer Sheet.
39
Level 1. Leve1,2 Level 3 Level 4 Level 5 level 6
c b , e
fda,rb
a
b a
6. Magnets (a) a
8. Solutions f b
9. Plant Require-ments - Fertilizer
7. Magnits;,(b) .e
10.1 Peidu lum _ b
e
a
f.
-
11. Water and He -
c
C
a
41
a £
a
f e a
e
f*
f c b
a
f
e
.1
.
a
0
e
f
.b

Questioning
1. Ramp
Mary built amarbles downsize.
eightof Ramp
* 40
Junior Item
ramp using a board and some books. Sfie wanted to use it to roll
the ramp onto the floor. Mary had several marbles of different'
Marble
Rarip
tC
.**
Floor
istance Travelled By Marble?4
'Directions: Suppose Mary wanted to experiment with her equipment.-
Which would be the best question she could ask?
Circle the letter of your choice.
(a) How-can I make the marble rail further?
(b) What will the marble'do?
(c) What 'is- the name of this equipment ?`
o
(d) Does the size bf.the marble affect the distance it will traNiel
across the floor?
(e)' Canerake the marble roll further?.
(f) Would the marble roll further if it was bigger?
Qu
42
...
a

e
Questioning__
2. Sound /
ere is a glass-jar with some water in it. If you strike the jar with a
glass rod makes a sound.'
41
Junior IteM
Alw
9
9
'Directions: suppose'you wanted to experiment with this equipment.Which wou1d be the best -question to ask?
Circle the letter of your choice.
(a) What should I do to get different sounds?
(b) Which musical note is the sound?.-
(c) Does the height of water in the jar, affect the pitch of the
sound it makes?
(d) What can I do with the bottle and rod?'
(e) If I put more water in the'jar can I get a different sound?
(f) Can I'get different-sounds with the bottle and rod? :*!"
1 1

I-
Questioning
42
Junior Item
I.
3. Bicycle/
John was visitinebis uncl. There was a unicycle wheel like the one in the
picture stored /in the garage., He got it out to look at it.
a
Directions: Suppose John wanted to experiment with the wheel.
Which would be the best question hecould ask?
Circle the letter`of your choice.
Does the number of spokes in the wheel affect the weight it will hold?
CIO/ What kind of thing.ca- n that be?,
.
(f) Can just little people ri e on the wheel?..
Aii,
/
/jd) What,can you do with this strange wheel?.
.. '
A
$e) If you" put in more spokes will it hold more weight?
(() ',,How can you make the wheel hold heavy people?,
44
7

Questioning
4. Shadows (a)
43
Junior Item
Carole takes ,her pup,.. Kelly, for'a walk at night. She carries a flashlight.
Sometimes, they walk towards a yard with a high wall around it. When the pup
sees his large shadow, ahead of him on the wall he gets frightened and turns
back. So fax Carole has not made him go any closer to the wall.
MM.011011
-flashlight
ntoy dog
.
'Directions: -Suppose.Carole had a flashlight, a screen and a toy dog.
If she wanted to do an experiment which would be the best
question for her to ask?
Circle the letter of your choice.5
(a) What is a shadow?
(b) Can I make a shadow smaller?
. (c) If I move the dog clo er to the screen will the shadow ;jet smaller?
?
kii) What does a shadoW do?
. (e) Does the distance of the dog from the screen affect the size of the
. shadow?
(f)' How can I make the shadow smaller?
45
Vs
screenandshadow
-44
QuestioningJunior Item
5. Shadows (b)
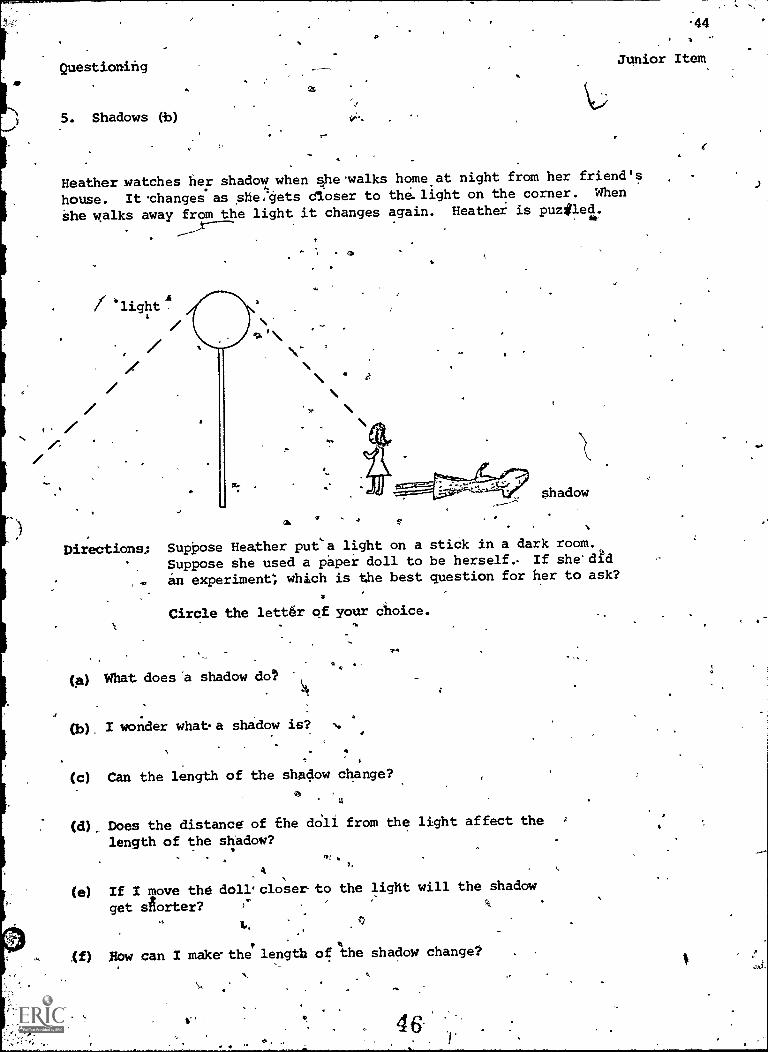
Heather watches her shadow when qhevalks home, at night from her friend's
house. It changes as she,gets dloser to the.light on the corner. When
She walks away from the light it changes again. Heather is purtled.
light
z
a
shadow
Directions: Suppose Heather puea light on a stick in a dark room.,
Suppose she used a paper doll to be herself. If shedidan experiment, which is the best question for her to ask?
Circle the lett6r of your choice.
(a) What does a shadow do?. 4
(b). I wonder what-a shadow is?
(c) Can the length of the shadow change?
ts
(d) Does the distance of the &ill from the light affect the
length of the shadow?
A
(e) If I move the doll closer to the light will the shadow
get shorter?
.(f) How can I make- the length of the shadow change?

Questioning
A
6. Magnets (a)
45
Junior Item
Gerry has some ba magnets of different sizes. also has .me pieces
of?steel of different masses. He is lifting the m ses with the magnet's.
His friend Steve wonders what he is trying to do.
(
Directions: Suppose Gerry said he would try and answer a question for
Steve by doing an experiment. Which question do you think
would be best for Steve to ask?
Circle the letter of your choice.
'(a) Will the little magnet attract the masses?
(b) Is the size,of the magnet related to therof theobject it will attract? .
0
0..y Do you need a larger magnet toattract the large;, masses?
(d) What do you call your equipment ?,
(e) What are you doing with your .equipment?
(f) tow do yoil attract the largest mass?
47.
4'4
Masses

F
Questioning
7. Magnets (b)
46
Junior .Item
Andy's teacher,made an electromagnet by wrapping a wire around'a nail.
To power the magnet, she attached both ends of the wire to a battei'y.
She fould add another battery to the circuit each time she wanted to
increase the power of the magnet. She also had a number of steel massed.
more batteries battery
'nail& )e
wire
electromagnet
masses.
_
Directions: Suppose the teacher said she would try to answer a question
for the class by doing an experiment. Which one do you think
is best?
4
Circle the letter of your choice.
(a) How do you make the magnet pick up more mass?
(b) Can the electromagnet pick up all the masses?
k
(c) Does-the amount of power in the circuit affect the mass the
magnet:can pick up?
(d) What can you do with an electromagnet?
4
,(e) What is an electroMagnet?
. *A"
, 17
(f) Will the magnet pick up moremass if you add a battery
to the circuit?
48
c.

Questioning'4
8. Solutions4
4
.
47
Junior Item
Tim's teacher had a jar with water in it. ''She kept adding salt to the water
and stirring it until it dissolved. After a while no more salt would dissolve.
It settled on the bottom of the ja..
She also 'had a stand that woad hold the water jar and a candle that would
fit under it.
Jar of Water Salt Stand and Candle
Directions: Suppose the teacher asked the class if they had questions
that could be answered by doing an experiment. Which is
the best question for Tim to ask?, .
Circle the letter of your choice.
(a) If you warm the water will more salt dissolve in it?
)
(b) What can you dowith the salty water? fr
(c) Can you make more salt dissolve in the water?4
Does the temperature of the water affect the amount of water
that will dissolve in it?
(e) How can you make more salt dissolve in the, water?
-
f) Do you call the liquid in the jar a salt'solution?
t,
4.140..
49
P

Questioning
9. Plant RequirementsFertilizer
48
Junior Item
Andy wanted to grow same tomatoes. He decided to st'at.tflem indoors in
a pot. He was told he should add fertilizer to the - pot. ,
irectionsl Andy wondered about fertilizer.. If Andy wanted to do an
experiment, which would be the;",best question for Andy to
ask?
Circle the letter of.your choice..
(a) What is fertilizer?
(b) Can the plants grow faster?'
, What 'is the ,fertilize supposed td do?.c
o Fa
, !y(d) Will the /ants grok,fapter ife?I give them fertilizer?.
: ',..'' ' .: ' V4, .70 III o,
"(e) How does the amount-of fertilizer affeCt' the growth df the plants?
IZ'P '
, -,... ''' ,.
(f) How can we make the pla4 nts 'grow faster?
o 4
r,
e

.14
Questioning
10. Pendulum
49-
Junior Item
Bill noticed the grandfather clock in the hall wasn't keeping good'time.
It was always sldw. H wound it'up but it still didn't keep good time.
His,dad told him the pendulum must be off.
DireCtions:. Bill
)t ught of a lot of questions. If he wanted to do an
exp509iment, which is the best question for him to ask?
Circle-the letter of your choice.
(a) Why does the Clock need a pendulugg
11° *
(b) What is a pendulum?
(c) Can the pendulum be made to go faster?
(d) Will the pendulum go faster if I move the weight up and make
the arm shorter?
(e) What can I. do to the, pendulum o4make it speed up?
(f) Will moving the weight up or down the affect how ,fast
or slow the clock runs?
*AM
Si
`.)

Questioning
11, Water and Heat
50
Junior Item
Gary was at the YMCA on Saturday. After a swim, he decided to go to the
sauna. He had never been in a sauna. A man poured some water on some
jocks at one end of the sauna room and the room got all steamy.
4
Directions: Gary wanted to.understand what had happened. If he wanted
to do an experiment, which is the best question fc him to
ask?
Circle the letter of your choice.
(a) Can I make more steam?'ti
(b) Does the temperature of the rocks affect how much steam I get?
(c) What is a sauna bath?
(d) If I make the rocks hotter will I getmoie steam?,
(e) What do I do to make more steam?
(f) What does the water on the rocks do?
rc
52
4
4
A.

e
Items, 4
B. DEVELOPING Ai PLAN - Junior Level
Answer Sheet
Level 1 Level 2 Level 3 Level 4
1. Plection (I_ a . c I) d.
2. Solutions c b d a- .
ci
.3. Conducting Sound b d c - a
... .
4. Shadows d b a c
.
5. Animal Coverings - feathers b c a d'
6. Pitch of Sound ec a b d
-7,
7. Plant Requirements a d c b
8. Mass and Wiight
/. Bicycle (a)1
_.
10. Bicycle (b)
3
I
c
b
(
a
c
cr b
a c
b a
I
51
o
0
..
I'

52
Developing A Plan
1. Reflection
Junior Item
Molly was sleeping outdoors on a camping trip with her friends. Just before
she went to sleep the moon tame up. She could see their knapsacks in a row
nearby.. One, or two seemed much clearer than the others. She even thought
she could see the grass in front of them more clearly.
Back at school she asked her teacher about this. He told her, to get four
sheets of-paper, one white, one orange, one green and one black. He told
her to get also aimall candle in a holder.
Directions: Here are some'ideas.about what Molly could do,with this
equipment. Which one do you u-think is best?
Circle thq letter of your choice.
(a) Cut the sheets of paper into small squares. Glue all the little squares
to a large sheet. Mix up the light and da; colours to make a pattern.
Hang the large sheet on the wall. Light the candle and turn out all the
other lights. See if the pattern looks nice n the dim light. Make
another one to see if you like it better. .
(b) .We one of the sheets of paper to a wall in a large room. Put a little
table beside the wall under the paper. Put some things on the table.
Light the candle. Put it ona table in the middle of the room. Then
turn out the lights. See how clearly'you can see the table and the .things
on it. Repeat with each of the other sheets of paper. See if there are
any differences in what you can see.g
(c) Hang t he 4 sheetsof paper in a row on a wall in a 4arge room. Light the
candle and turn out all the other lights. Hold the candle in your hand. )r--
,Look very carefully at each sheet of paper one at a time. Move the candle
up and down, and backanlforth. See if youcannotice anything about the.
different papers. See if you can notice' anything near the papers. Tell'
yourteacher everything you saw.
(d) Put the candle on a table in the middle of the room. Put a ball.on.a table,
against a wall. Pile a few hooks in front of 9e ball to shade it from
light from the candle itself. Tape each sheet of paper, one at a time, in
the same place On the wall above. Light the candle. With each sheet,
turn 6iit the-other lights. Stand to one sideNin the same place and see
if you can see the ball better with one paperor another.
k
,
V
54
.4
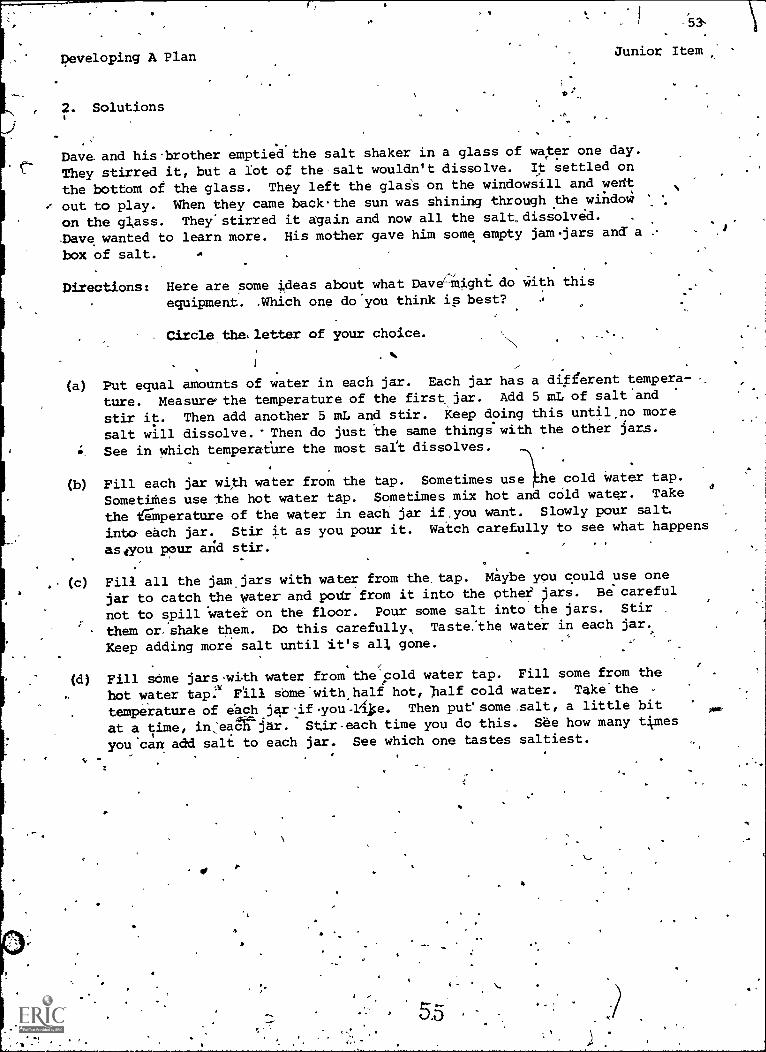
Developing A Plan
, 2. Solutions .3
53,
Junior Item
Dave. and his-brother emptied the salt shaker in a glass of water one day.
They stirred it, but a lot of the salt wouldn't dissolve. It settled on
the bottom of the glass. They left the glass on the windowsill and wefft
out to play. When they came baokthe sun was shining through the window
on the glass. They'stirred it again and now all the salt, dissolved.
-Dave wanted to learn more. His mother gave him some empty jam.jars and' a
box of salt. A
.
Directions: Here are some ideas about what Davelillight do With this
equipment. .Which one do'you think is best?
Circle the, letter of your choice.
(a) Put equal amounts of water in each jar. Each jar has a different tempera-
ture. Measure-the temperature of the first jar. Add 5 mL of salt'and
stir it. Then add another 5 mL and stir. Keep doing this until no more
salt will dissolve. 'Then do just the same things with the other jars.
See in which temperature the most salt dissolves.
(b) Fill each jar with water from the tap. Sometimes use .he cold Water tap.
Sometithes use the hot water tap. Sometimes mix hot and cold water. Take
the temperature of the water in each jar if.you want. Slowly pour salt.
into- each jar. Stir it as you pour it. Watch carefully to see what happens
astyou pour arid stir.
(c) Fill all the jam -jars with water from the tap. Maybe you could use one
jar to catch the water and potir from it into the ether' jars. Be'careful
not to spill 'water on the floor. Pour some salt into the jars. Stir
them on shake them. Do this carefully. Taste:the water in each jar.
Keep adding more salt until it's all gone. .
(d) Fill some jars with water from the cold water tap. Fill some from the
hot water tap. Fill some with half hot, 'half cold water. Take the -
temperature of eechjerlif.you-11.e. Then put' some salt, a little bit
Crat a time, in,eajar. Stir-each time you do this. See how many tines
you can add salt to each jar. See which one tastes saltiest.
5.5

Developing. A PlanJunior Iteni t 54
3. Conducting Sound.,44
When:Sandy was swimming underwater one day at the lake she heard a motor'
boat. It sounded different than from shore. She wondered about sound through
air, water or solids. One day she got into the'bathtub to find out more'.' She
had a tuning fork to make asound and she asked her sister to help her.
Ir
Directions: Here are some ideas about what Sandy could do.
,Which one is best?.
Circle the letter of your chbice.
:446.
. (a) Get in,the bathtub. Get her sister.to practice using'fhe same force each
time she ..strikes the fork. 'Get her to strike'the fork in the air, or
underthe water, or along the sideof the tub, or along the'wall.' Listeh
sitting up in the tub, or lyingunderwater,-or with her ear against the
side of the tub or the wall, wherever her sister strikes the fork. See -
if the sounds are different. Make-sure her sister uses a ruler.so the
fork is always, the same distance from Sandy's ear.
4-.
). Get in ale bathtub with her:sister. .Put the tuning, fork in their little
brother's toy rubber boat. Bang.the runing fork while,they push the boat
back and forth in flip water. Maybe the boat will sink; If it does the
'tuning fork will hit the bottom of the tub. Put her ear down in the water
'very 'quickly so she hears the sound coming through the water. I
(c) Cet in the bathtub. Get her sister to strike the tuning fork with a spoon:
. Get her to do this several times. Listen first sitting up in the tub.
Then listen with her head underwater. Then listen, with her ear against
the side df the metal tip. 'Then liten with herear agdinst the wall.
Do this many times to be sure she'S done it right. Listen carefully each
time and see if the sound is different.
(d) 'Get in the bathtub.. Get her sister tefstand different places in the bath-
room. Get her to strike the tuning fork with a spoon. Sometimes put her
head underwater and listen to see'what happens. Get her sister to take
a turn in the bathtub.. Strike'the tuning fork and let her sister listen.
Try to think of different things to do to see what happens.
Soy
" .
56
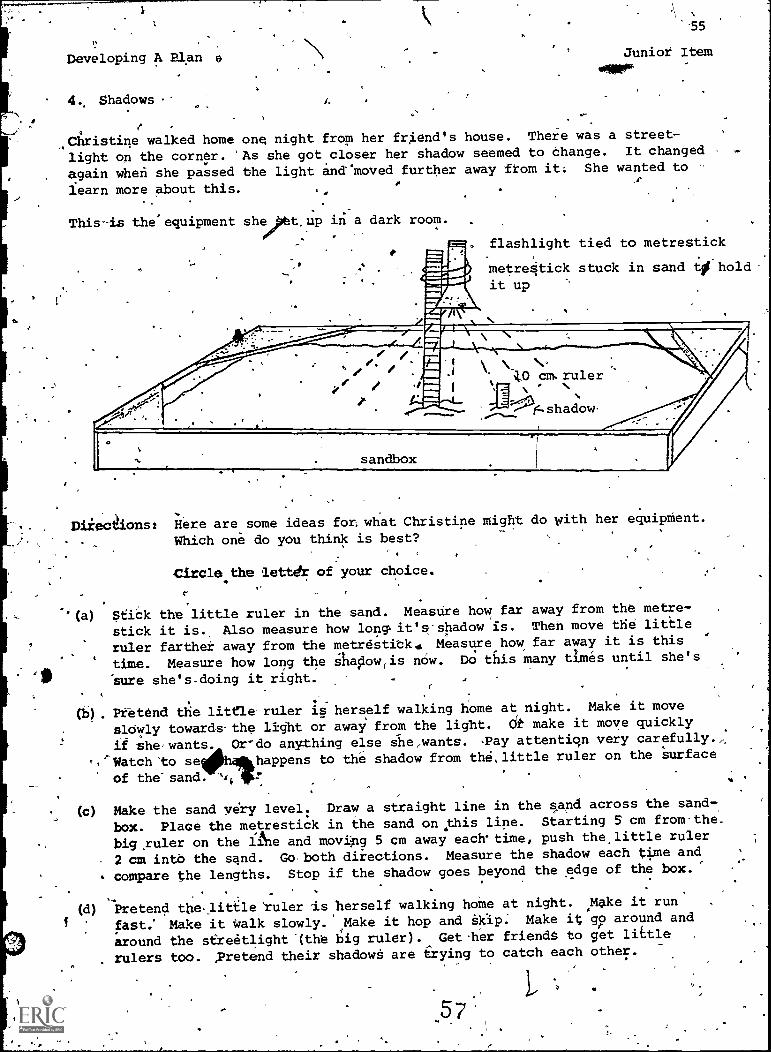
1
.11
Developing A Plan
4., Shadows
e
Christine walked home one night from her friend's house. There was a street-
light on the corner. 'As she got closer her shadow seemed to Change. It changed
again when she passed the light andmoved further away fkom it She wanted to
learn more about this.
e
i.oh
'55
Juniot Item
44100w
This is the equipment sheott_up in a dark room.
I (a)
7, to
,e
flashlight tied to metrestick
metrestick stuck in sand tO hold-it up
Here are some ideas for, what Christine might do with her equipMent.
Which one do you think is best?
Circle the lett& of your choice.
Sabk the little ruler in the sand. Measure how far away from the metre-
stick it is., Also measure how long% it's shadow is. Then move tHe little
ruler farther` from the metrestitk. Measure how far away it is this
time. Measure how long the shailowiis n614. Do this many times until she's
sure she'sdoing it right.
(b). Pretend the little ruler is herself walking home at night.
slowly towards-
it shewants.Watch 'to se
of the' sand.
Make it move
the light or away from the light. di. make it move quickly
Or-do anything else she,wants. -Pay attentiqn very carefully.;
happens to the shadow from the, little ruler on the surface
(c) Make the sand very level: Draw a straight line in the sand across the sand-
box. Place the metrestick in the sand ondthis line. Starting 5 cm from-the,
big ruler on the lAle and movipg 5 cm away eachtime, push the, little ruler
2 cm into the sand. Go both diiections. Measure the shadow each time and
compare the lengths. Stop if the shadow goes beyond the edge of the box.'
,Make it rungo around andget littleother.
(d) Pretend the little ruler ls herself walking home at night.
fast.' Make it walk slowly. Make it hop and kip. Make it
around the sreetlight.(the big ruler). Get -her friends to
rulers too. ,Pretend their shadowS are trying to catch each
57.

Developing a Plan
5. Animal Coverings - Feathers.
56
Junior Item
118,
'Bill went bird watching in the woods with his grandfather. Sometimes he could
see a bird easily. Other times he had trouble, seeing one even when his grand-
father pointed it out. He wondered about this.
The next time they went to the woods they took a box full of different kinds ofbird feathers with them.
bisections: Here are some ideas about what Bill might do.with the feath r .
Which one do you think is best?
Circle the letter of your choice.!
(a) Pick out two groups of feathers. Make the feathers in one group plaincolors and the feathers in, the other group have stripes of different colors.Find some places in tne woods where-the sun comes through the trees inlight and dark patches on the ground. Mix up the feathers. Toss them all
on the ground in one of those places. See which ones are easiest to pick
Out.
Picic out all the feathers he likesStick some of the feathers in it.'trees. Hide among the rocks. Seewants, change the feathers and trryhim he wins the game..
best. Tie a shoelace around his head.Hide from his grandfather among.the_if his.grindfather can spot him. If heagain.. IT his grandfather can't spot
(o) Take some feathers.and hold them up one at a time against a rock. Take '
some and hold them against a tree trunk. Hold some in front of some leafybranches, or between his eyes and a lake. Do it carefully several times.Try-and find other places to hold the feathers; Pay attention to whathappens and 'make notes.
.
(d) Choose some plain feathers,and some striped feathers. Find a place wherethe sun is patchy do the ground. Get his grandfather to put them down oneat a time, in, mixed up order, in different spots with the same amount oflight and shade.. 'Don't look until he !says "Ready". See.how many seconds
it takes to spot each one. Stop if the sun goes behind a cloud and waituntil the light gets brightagain.
5 3.
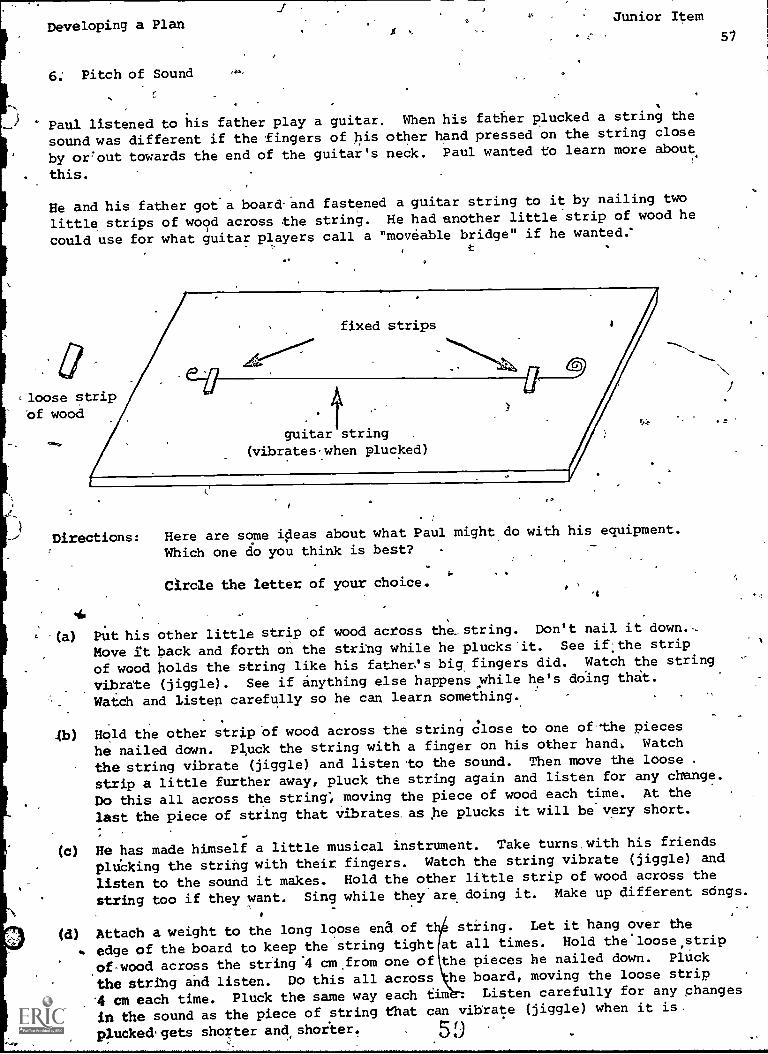
r.
Developing a Plan
6. Pitch of Sound
Paul listened to his father play a guitar
sound was different if the fingers of his
by orrout towards the end of the guitar's
this.
4.4 Junior Item
c
.When his father plucked a string the
other hand pressed on the string close
neck. Paul wanted to learn more about
He and his father got'a board and fastened a guitar string to it by nailing two
little strips of wood across the string. He had another little strip of wood he
could use for what guitar players call a "moveable bridge" if he wanted.'
0
51
,loose stripof wood
1
Directions: Here are some ideas about what Paul might do with his equipment.
Which one do you think is best? -
Circle the letter of your choice.is
Put his other little strip of wood across the_string. Don't nail it down..
Move it back and forth on the string while he plucks-it. See if'; the strip
of wood holds the string like his father's big fingers did. Watch the string
vibrate (jiggle). See if anything else happens while he's doing that.
Watch and listen carefully so he can learn something.
$
.(b) Hold the other strip of wood across the string close to one of the pieces
he nailed down. Pluck the string with a finger on his other hand, Watch
the string vibrate (jiggle) and listen ,to the sound. Then move the loose .
strip a little further away, pluck the string again and listen for any change.
Do this all across the string', moving the piece of wood each time. At the
last the piece of string that vibrates. as he plucks it will be very short.
(0) He has made himself a little musical instrument. Take turns, with his friends
pluCking the string with their fingers. Watch the string vibrate (jiggle) and
listen to the sound it makes. Hold the other little strip of wood across the
string too if they want. Sing while they are doing it. Make up different songs.
(d) Attach a weight to the long loose end of t string. Let it hang over the
edge of the board to keep the string tight at all times. Hold the'loose,strip
0f-wood across the string'4 cm,from one of the pieces he nailed down. Pluck
the string and listen. Do this all across he board, moving the loose strip
'4 cm each time. Pluck the same way each fim Listen carefully for any changes
in the sound as the piece of string that can vibrate (jiggle) when it
50plucked gets shorter and shorter.

Developing A
7. Plant Requirements
58'
Junior Item
John would like to be a gardener when $e finishes school. He wants to learn
hot' to care for plants., It's winter so he must Verk indoors, He has some
flower pots and some soil. He'a,lso has some bean seeds. He knows seeds need
water and he.can get that from the tap.
^
Directions: Here are some ideas about what John might do.Which one do you think is best?
Circle the letter Of-your choice.T.
(a) Put soil in the flower pots. 'Plant the seeds. Plant about 10 seeds because
some might not grow. .Put one seed in each pot. Put the pots out of the way
on some windowsills. Be pure they get some sunlight. Ask his mother to
tell him when theyneed more water so he won't forget. If the plants grow
beans pick them.
(b) Plant10 bean seedl, onetin each pot. Plant each at the same depth. Put
all the pots in a place` where.thefget the same amount of sunlight. Each
day give 2 plants cold water, two cool water, two medium water, two warm
water, and two hot water'. Give each the same amount. Count the days until
sprouts appear in each Poi and compare them.'
(c) Plant about 10 bean seeds,00ne in each pot. Place the pots around the room,
where4.hey can get some light. ;Be -sure to water the plants when they need_
it.. Give them differgnt temperaturesof water. Give some pots cold, some
cool, some medium, some warm'and Some hot water. Count the days until'
sprouts appear' in each pot ancompare 'them.
(d) Plant one, bean seed in each p?t. Plant about 10 altogether. Set them in
,places where theyiciadoget.some light'. , Water them when they need it, Watch
to see what happens if you give the plants/different temperatures of water.
Get different tempertures taking water from the cold tap, the hot tap
or both at once.
6 0
ar
.10
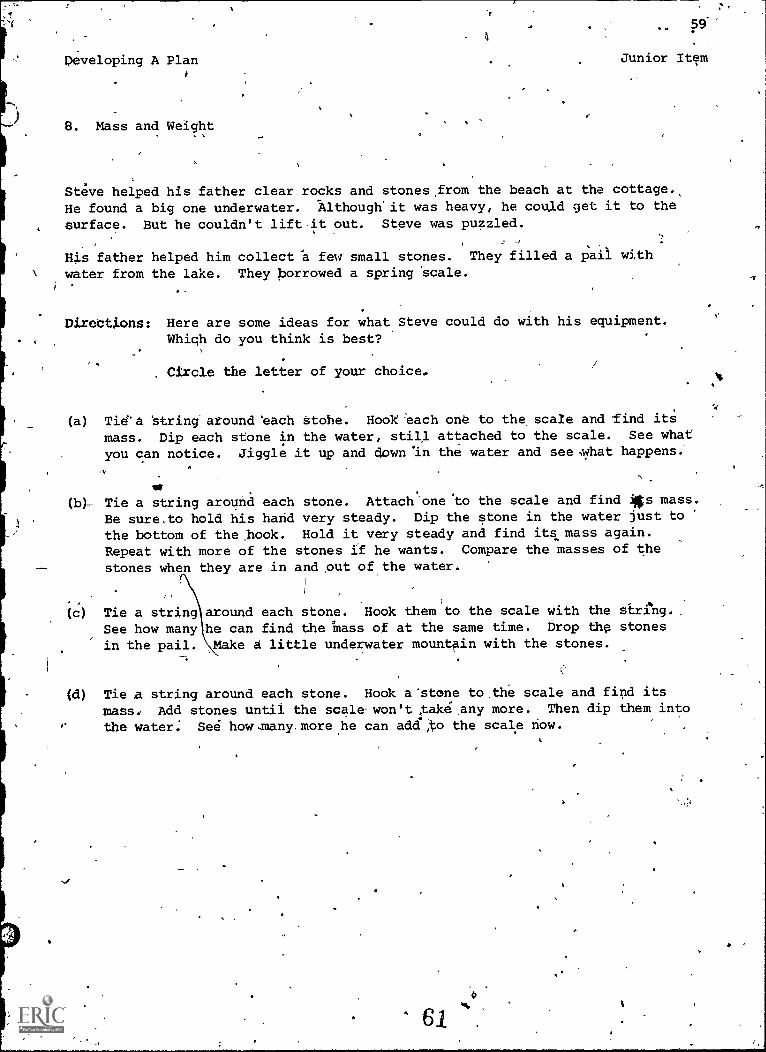
O
Developing A Plan
8. Mass and Weight
59
Junior Item
Steve helped his father clear rocks and stones ,from the beach at the cottage.,
He found a big one underwater. 'Although' it was heavy, he could get it to the
surface. But he couldn't lift .it out. Steve was puzzled.
His father helped him collect a few small stones. They filled a pail with
water from the lake. They borrowed a spring scale.
Direttions: Here are some ideas for what Steve could do with his equipment.Which do you think is best?
, Circle the letter of your choice.
(a) Tid'a 'string around 'each stone. Hook each one to the scale and find its
mass. Dip each stone in the water, still attached to the scale. See what
you can notice. Jiggle it up and down'in the water and see,what happens.
(b)- Tie a string around each stone. Attach one.to the scale and find iits mass.
Be sure,to hold his hand very steady. Dip the stone in the water just to
the bottom of the hook. Hold it, very steady and find itt, mass again.
Repeat with more of the stones if he wants. Compare the masses of the
stones when they are in and put of the water.
( c ) Tie a string around each stone. Hook them to the scale with the string.
See how many he can find the Mass of at the same time. Drop thp stones
in the pail. Make a little underwater mountain with the stones.
(d) Tie a string around each stone. Hook a'stone to,the scale and find its
mass, Add stones until the scale, won't take any more. Then dip them into
the water: See how,manTmorehe can addo the scale now.
6 1 .

Developing A Plan
r'
9. Bicycles (a)7
Junior Item
Peter was riding his bicycle downtown one day. He had to stop quickly when
a big truck cut in front of him. A storekeeper who saw him was frightened.
He scolded Peter. He said he was riding his bicycle too fast fog. safety in
traffic.
- Peter didn't like what he said.' He asked his friends to bring their bicycles
to the school yard on Saturday when no one was around. He set up a bourse with
sticks at the starting lineand finish line.
alrec4ons: Here are some ideas for what Peter might do. Which one do you
think is best?
Circle the letter ofyour choice.
(a) Take 3 people. Tell each person to start separately. Tell one person
to ,ride fast, one person t6 ride slowly, and one person6to go at an in
between speed. Stand at the firlish line. See how long it takes each
one to stop when they put on their brakes at the finish line and compare
the times.
(b)' Line up everybodyat the starting line. Say "go". Watph them pedal as
fast as they can. Yell qsrtop" when they get to the end of-the course.
Tell them not to put on their brakes too hard in case they skid and fall
_over. The winner is the first one to get to the finish, line.and get
-stopped safely. '
(9) Ask one person to ride the same bicycle three times at different speeds.
Be careful he starts at the same place each time and puts-on'his brakes
at the same place. Measure how many seconds it takes him to stop at
path speed and compare the times. Ask each of the others to do the same
thing. Compare the stopping time at different speed's for, them also.
(d) Line up everybody at the starting line.' Tell some of them to go fast.
Tell some to go 'slowly. Tell others to go at an in between'speed. Tell
everybody to put on their brakes when they get'to the finish line. Watch-
carefully .t.0 see what happens. Tell them all to be careful when'they put,
on their brakes.
'62
60

61
.
Developing A Plan Junior Item
10. Bicycles (b).
,-.
.
Terry and his bigger brother ride their bicycles to school each day. There is
a long hill on'the way. Terry's brother can always coast farther at the bottom
of the hill than Terry can.
i 2
..,
Terry'asked his friends to bring their bicycles. to the'hill one day after school.
_Jim's mass is 35 kg, Eric's mass is as kg and Terry is biggest. His mass is .
41 kg. 2
'Directions: Here are some ideas for what Terry andhis friends could do.
Which on do you think is best?
1
,
.Circle the letterOf,your choice.
(a) If the bikes aren't the same each boy uses the same one to ride down the
hill. Each boy makes a still start at the same spot. Each boy stops
pedaling at the same spot: Measure who coasts the farthest after he stops
pedaling.
I
(b) One person at a time pedals down the hill. -He stops pedaling at the
b6ttom. Oise of the others measures how far he coasts after he stops
pedaling. See who coasts the farthest.,e
a
(cf Start togethdr down the hilly Be sure there isn't any traffic coming
so it's sate. *Stop pedaling close to the bottom. Ask somebody to watch
each of them and tell them what he sees.
(d), Have a race down the hill. Do it Several times. Start,at the top of the
hill sometimes: Start halffuray down sometimes. ,Stop when it's time to
go home 'for dinner.
63

C. JUDGING THE ADEQVACY OF DATA - Junior Level
Answer Sheet
1.Ac gee 20. a
2. a 21. b
3. c 22.
4. a 23. a-
5. d 24. c
6. b 25. b
7. b 26. b
8. d x`27. a
9. c 28..c
10. b 29.1 c
11. d 30. a
12. d 31..
13. b 3.14. 33. a
15. a 34. b
16. a 35. c
17.k c '36. c
18. b 37. d
19. c ..
_t
64
*a
c
ra

r
Judging The Adequacy of DataJunior
1. When measuring mass which instrument would giv you more accurate results?
One marked in: A.
(a) kilograms
(b) grams
(c),milligr&ms
(d) 'none of these
2. WhenmeaSuring distance which instrument would give a more accurate result?
One marked in:I
(a) millimetreset
(b) centimetres
(c) kilometres
(d) none of these
0
4
3. The most accurate measurement of time would be'obtained by using:
(a) a Clock with a second hand
(b) a wristwatch With'a second hand
lc) a stop watch
(d) ,none of these;`ti
I
While placing a ruler on the line segment AB before measuring the, distance
from A top, it is more accurate to be looking stkaight down the ruler with
your eyes directly above:
(a) point A
(b) point B
(8) the centreof the line segment
(d) none of these
5
63'

4
5. You have planted three,bean sprouts in an experiment to find out how much
they will. grow in a month. At the end of a month your pest answer would
be obtained by:
(a) measuring the tallest plant
7
(b) measuring the shortest plant
(c) measuring the middle plant
(d) measuring all three and averaging their heights
O
6. When comparing the mass of two similar objects your best answer would be.
obtained by:
(a) holding one in each hand to feel the difference
(b) using'an equal arm balance
c) using bathroom scales
7. If you wanted to measure the volume of a marble by placing it in water,
fyou would get a more accurate answer by using:
(a) a wide, graduated cylinder
(bra narrow, graduated cylinder
(C), either one would give an equally accurate answer
r, .
8. When dying any experiment, your most accurate result will be obtained by
doing the experiment:
(a) once, wrking.very carekully
(b) twice aid averaging results,
(c) three times and averaging results
(d) many times and averaging results,
9 When measuring the circumference (i.e. ,'the distance around) of a wheel
the most accurate answer would be obtained by:
(a) stretchirig a tape measure around the wheel
(11) rolling the wheel one complete turnjalong the ground and m suring the
distance,it haS travelled in a stra ght line
(c) measuring the diameter of the wheel and using the mathemat.cal fordula.
(C ./rd), for finding the circumfere ce
64

,i,
10. The most accurate way to record information from reading research is to:
(a) put the facts down in point fOrm
(b) use a direct quotation from the text book
(c) record the facts in your own Ards
11. The best way to find out about the covering of an animal is tip:AO
-.. -
(a) read a description of it in your text book
(b) look at a picture of the animalc---
(c) study a labelled diagram of the animal
(d) examine a live specimen of the animal'
4
12. What would be the best unit of measurement to use when measuring the
distance from Peterborough to Toronto?
(a) millimetre
(b) centimetre
(c) r etre
(d) kilometre
13. What would be the best uniof measurement to use when,measuring the length
of al soccer field?
(a) Millimetre
(b) 'rtetre,
(c) (kilometre
(d) centimetre
Wh t would be the best unit of measurement to use /hen measuring the length
of your desk?
metre
) kilometre
) centimetre,
d) mil imetre6 7
65
1

-15.. What would be the best unit of measurement to use
your eraser?
(a.) millimetre
(b), centimetre
(c) kilometre
(d)'
metre
16. What would be the best unit of measurement to use
(a) kilograms
.(b) grams
4c) milligrams
-66 _
when meastring the width of
el
when measuring your mass?
tt
11.
17. What would be the best unit of measurement to use when measuring the mass
of din ,apple?
(a) milligrams'
(b) kilograms
(c) grams
18. Three bicycles are going to be tested for manoeuvrability around an
obstacle course. What would be the best way of conducting the test?
(a) have a'diffeient person ride each bicycle
(b) haVe one.person rid three bicycles
ts,(c) make-sure all the riders at re boys
(d) make sure all the riders are girls
419.. If you were to meagre the length of your schoolyard, which of the following
instrument would give the most accurate answer?0 a
X
e
(a) 30 cm
(b) planimeter
(c) 100 m tape
(d) 10 m tape
: 68
ke"
s
'a

,
20. When measuring the%ivvolume of a cube;' the most accurate answer will be
.
obtained2
(a) measuring the length of the(7 =LxWx H)
(b) placing the cubeamount the water
(c) placing the cubeamount the water
- (d) placing'thescube
sides and using*the mathelthatical formula
in a narrow; graduated cylinder and measuring thg
rises. ,in awide graduated cylinder and measuring the
rises ,
in a beaker fiiled.to the brim with water and
measuring the amount of water which overflows
21. When desdribing the temperaturemperature ofts
the" information most.accurately?
/
(a) hot
(b) 31°C
(c) Watm:
Id) boiling
a liquid', which of
22. When describing the4mass of an object,,which of
information mostacdarately?
4(a) light
(b) heavy_
(c) 50 kg
,
.
Pick out tbg,most accurateto another.
(a) 20 m
(b) sb4rt
(c) long
term for describing
24. When describing the speed at which an
give the most'acCurate description?
(a) fast
(b) slow 4
(C) 30 km per hour
(d) quAckly
object is
the following gives
the Mellowing givp,s the
the distante from one point
13 .
67
travelling, which tern would
I
I

25. If you were giving a scientific description of a bird's feather, which of
the following wordswould you not use?9
'1
(a) long '
.(b) pretty,
(c) smooth .
(d) blue
a.44
26.. Which one of the descriptions of desk has unnecessary information?
(a) brown coloured, 3 drawe;s, rectangular shape1
_ *.
(b) rectangular shape, 70 cm x 140 cm dimensions, located in middle of
:room
(c) biown colour, slantedtop, round legsvier
(d) square legs, rectangular shape, brown colour
27. Which one of the descriptions of a rug has'unnecessary information?
r
68
(a) rectangular shaped, plain colour, has fringe on side, is located by
the door
, (b) oval shaped, silk fr,Inge on the side, red coloured, has a spot of grease
on the Side:
(c) square, red, shag, fringed
(d) round shaped, blue and white Coloured, emblem in. centre
28. Which one of the descriptions of a plant has unnecessary information?
(a) long stems, very'leafy, golden cal ured flower, 1 m high
.
(b) short stem, oval shaped leaves, f. ers eke red and clustered
longltemS, very bushy in's' wooden pot, blue flowers .c`
4
(d) a14ernating leaf pattern, long . stems-,. no flowers-, 2 m high
4 1to
Sr.

69.
Oa
29. Which of the descriptions of a fieh"has unnecessary, information?
(a) 32 cm long, found ln tropical seas, yellow and 'Dille in colour
..(b) fresh water fish, light and dark green stripes, whitish belly, 20 cm
Icing
.(c) in a 2 Ctank, grey and green incOlour, very long thin body
(d) has many sharp teeth, very broad head, white belly, green back
30. Which one of the descriptions of a deer has unnecessary information?
(a) white tail, large antler120 kilograms in Weight,, found north of Omemee
(b) white tail, small furry antlers, white spots on baCk, white breast
(c) a female, no antlers., white tail, brown body colour
(d) five pronged antlers, large muscular cipest, white tail, 200 kilograms
31. Which one of the descriptions of an animal.has unnecessary information?
(a) bushy tail, 70 kilograms in weight, scruffy ears, large fangs
(b)large fangs, shaggy fur, grey in colour, bushy tail
(c).broWn eyes, shaggy, fur, large padded feet, broad flat hea d
(d). broad flat head, bushy tdil, looks hungry, scruffy ears
.4
Which method of timingwould be more accurate when measuring the time of a
runner in a 100 m sprint?
la) 'when the sta rter is also the timer
(b) 'when one person starts and another times
(p) when two people time the runner and,average the results,
Id) when there are 3 different timers and the best time is takeni s.
. . 4.
33. Which method d measuring ,would be best if you weze measuring the. distance
, that a bicyclecould coast dOwn a, gentle 4kope from a standing start?
. 1. . .
(a) measure from wfieie the back wheel'starts to where the back wheel stops
... :;..
(b) measure from where the back wheel Starts to where the front wheel stops
(c) teasure from the spot the rider starts to where the rider.stops
(d) -any of the methods above would be the same'\
71

.
I
34. If a sprinting race was being started by a judge at the finiihing line 300
metres away, which method would be the best for starting the race?
(aj by yelling the signal ready-set-go'
(b) using a hand signal to start
(c) using a starting pistol as a signal to go
35. Bill Wanted to know if all bean seeds have the same mass. He should use
a balance which can be read to the nearest;
(a) gram
(b) kilogram
(c) 0.1 gram
(d) milligraM = 0.001 gram.
dr'
36. ,Jim wanted to measure the daily growth of a newly germinated bean seed.
He should use a ruler which can be read to the nearest:
(a) metre
(b) centimetre
(c) millimetre
'(d) 0.5 centimetres
37. Bob and Anne were measuring the weight of apiece of metal using, spring
Scales.
Trial .
They recorded their Values in the table below.
Anne's Bob's
Measurements Measurements
7 5.0 N 4.8 N-
-2 4.9 N 4.7 tr '
. 5.0 N 4.8 N
4 - .5.1 N 4.9 N
5 5.0 N 4.8 N
Average 5.0 N. 4.8 N
\
70
I 4
Which of the folloWing"factors might account for the different answers.
.. .
. /
(a) one of the spring scales was not,"zerOed" (reading zero) at the beginning
114.
of the measurement
(b) either.Anne or Bob was. not reading the scale at eye level
.
(c) one,of the spring scales has lost some of the "tightness" of its coils
Orposiibly.any of the above ') 72

D. RECORDING INFORMATION - Junior Level
Answer Sheet - Version 1
1. Ramp (a)
. Vinegar and Soda (c)
3..Cgasting Distance (a)
4. Plant Requirementssoil type
5. Plant Requirementswater temperature
6. Mass and Volume (d)
( e )
(b)
6
Angwer Sheet - ,Version 2
Items
71
. Ramp
2. Vinegar and Soda
3. Coasting Dittance
4. PlantRequirements -soil type
5. Plant Requirementswater temperature
6. Mass and Volume
1 2 3 4
(iii)
(ii)
,(ii)
(i)
(i)
(iii)
(iv)
(iv) ,
..
(iv)
(iv)
(iv)
(ii)
(iii)
(iv)
(iv)
. (iv)
(iv)
(ii)
(iv)
(ii)
(ii)
(i)
Note: Students must choose the correct answer to all 4 questions to score
correct on each item.
1. Ramp
24 Vinegar andkSoda
3. Coadting Didtance
44. PlaAt Requirements -soil type
5. Plant Requirementswater temperature
6. Volume and Mass
ke.
Answer Sheet.- Version
See option (a), version 1
See option (c)! version 1
See option (a), version 1
See option (e), version 1
,\
tee.option (b), version 1
ISee option (cp., version 1
ft

Recording Information)
1. Effect of Height of Rampon Distance a Marble Rolls(Version 1)
Junior
4chard built a ramp and rolled a marble down it to see how far it would,
travel across the floor. He then decided to find out if the distance
gavelled by a marble is influenced by the height of the ramp. He rolled
3i marbles down the ramp when it was 10 cm high. Then he rolled the same
3 marbles from ramps 20 cm high.and 30 cm high. He was carefla to do
everything the same each time he started a marble down the ramp.
Here is the information Richard collected.
Length of
Height Colour of Distance Time the
of Ramp Marble Rolled Marble Rolled
10 cm 1st marble blue 60 pm 1.0 s
20 cm - 1st marble blue 120 cm 1.5 s
30 cm 1st marble blue 240 cm . 2.0 s
10 cm 2nd marble red -.120 cm 1.5 s
20 cm 2nd marble red . 240 cm 2.0 s
30 cm 2nd marble red .. 360 cm 2.5 s
; 10 cm 3rd marble yellow ' .240 cm 2.0 s,
20 cm 3rd marble yellow 360 cm 2.5 s
30 cm 3rd marble yellow 480 cm . 3.0 s
Directions: Which of the following charts should he use to answer thee
question Does,the height ofthe,ramp affect the distahce
. that the marble rolls?
Circle the letter of the correct answer..
(a)
Height ofRamp
Distance Rolled
1st marble 2nd marble -3rd marble
cm
2a cm
30 cm
(b) 4
Height ofRamp
' 60 cm 120 cm
120 cm 240 cm
240 cm 360. cm
Distance Rolled.
1st marble 3rd marble
10 cm ' 60 cm 240 cm
20 cm' 120 cm _360 cm
30 cm 240 cm 480 cm
240 ,cm
360 cm
480 cm

(c) Height of**.' DiStance
Ramp Rolled Taken
-1st marble 10 cm 60 cm 1.0 s
1st marble 20 cm 120 cm 1.5 s
lstmarble 30 cm 240' cm 2.0 s
2nd marble 10 cm 120 cm 1.5 s
2nd marble 20 cm 240. cm. 2.0 s
2nd marble 30 cm '360 cm 2.5 s
3rd marble 10 cm 240 cm 2.0 s
3rd marble 20 cm 360 cm 2.5 s
3rd marble 30 cm 480 cm 3.0 s
(d) Height ofRamp
Time Takento Roll
(e)
1st marble1st marble1st marble
2nd. marble2nd marble2nd marble
3rd marble3rd marble3rd marble
Ii
10 cm20 cm30 cm
10 cm.20 cm30 cm
10 cm20 cm30-cm
1.0 s1.5 s2.0 s
1.5 ss
2.5 s
2.0 q,
2.5 s3.0 s
Height d Disiance
Marble of 'Ramp Marble Rolled
1st 10 cm. 1st 60 cm
1st 20 cm 1st 120 cm
-- 1st 30 cm 1st 240 cm
2nd -. 10 cm 2nd f20 cm
2nd 20 cm 2nd 240 cm
2nd 30 cm 2nd 360 cm
3rd 10 cm
3rd420 cm
3rd 30 cm
'
3rd 240 cm
3rd 360 cm
3rd 480 cm
75
73
1
4, 4
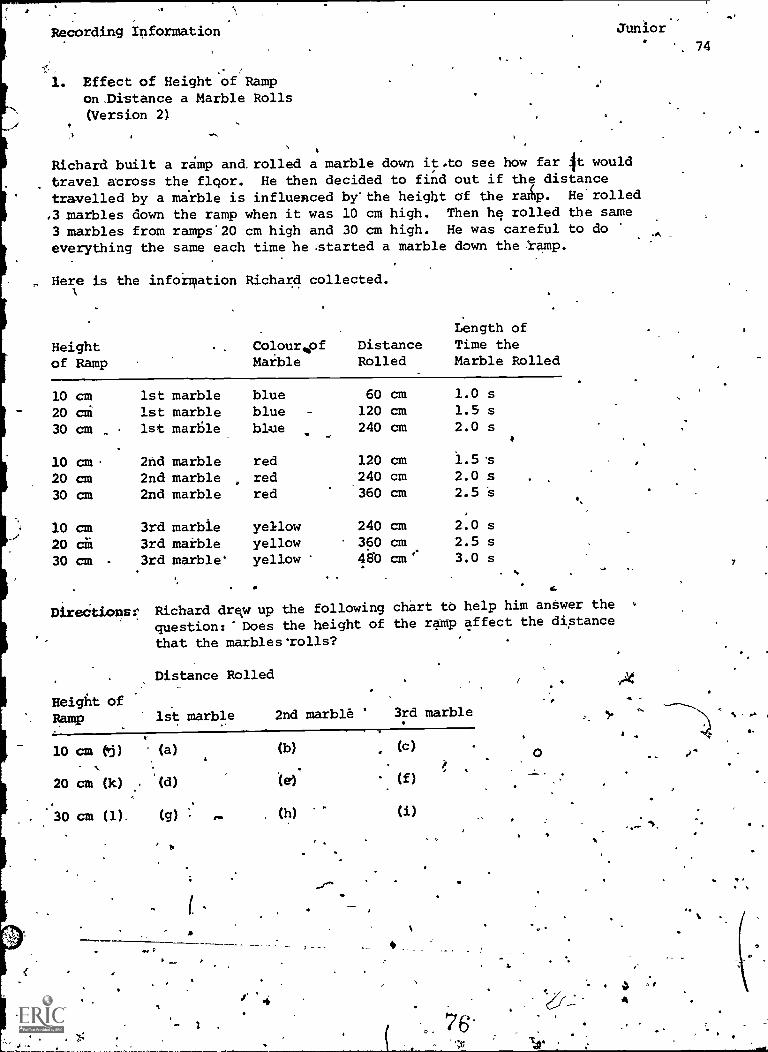
Recording Information
. Effect of Height of Rampon Distance a Marble Rolls(Version 2)
Junior.'
' 74
Richard built a ramp and, rolled a marble down it.to see how far 4t would
travel across the floor. He then decided to find out if the distance
travelled by a marble is influenced by'the height of the ramp. He'rolled
.3 marbles down the ramp when it was 10 cm high. Then he rolled the same
3 marbles from ramps'20 cm high and 30 cm high. He was careful to do
everything the same each time he .started a marble down the )camp.
Here is the information Richard collected.
Heightof Ramp
ColourtpfMarble
DistanceRolled
Length ofTime theMarble Rolled
10 cm 1st marble blue 60 cm 1.0 s
20 ci 1st marble blue 120 cm 1.5 s
30 cm . 1st marble blue . 240 cm 2.0 s
10 cm. 2nd marble red 120 cm 1.5 s
20 an 2nd marble red 240 cm 2.0 s
30 cm 2nd marble red 360 cm 2.5 s
10 cm 3rd marble yellow 240 cm 2.0 s
20 61 3rd marble yellow 360 cm 2.5 s
30 cm 3rd marble' yellow 480 am' 3.0 s
.
Directions: Richard drew up the following chart to help him answer the
question:" Does the height of the ramp affect the distance
that the marblesrolls?
Distance Rolled
Height ofRamp 1st marble 2nd marble ' 3rd marble
10 cm (!J) (a) (b) (c)
20 cm (lt) (d) (e) (f)
. .30 cm (1) (g) (h) (i)
4
f
ti
-N.
'
7
s.
.
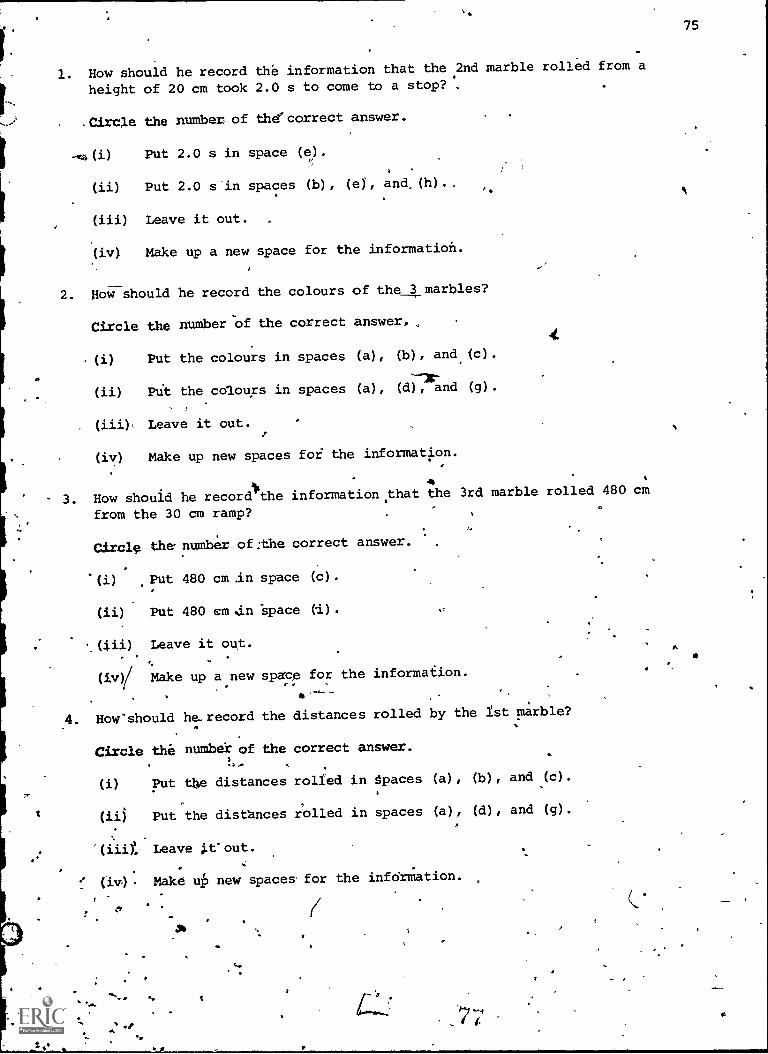
75
1. How should he record the information that the 2nd marble rolled from a
height of 20 cm took 2.0 s to come to a stop?
-Circle the number of thd'correct answer.
Put 2.0 s in space (e).
(ii) Put 2.0 s 'in spaces (b), (e) , and, (h) . ,
(iii) Leave it out.
(iv) Make up a new space for the information.
2. How should he record the colours of the _3 marbles?
Circle the number'Of the correct answer,
(i) Put the colours in spaces (a), (b), and (c).
(ii) Plit the colours in spaces (a), (d)) and (g).
(iii), Leave it out.
(iv) Make up new spaces for the information.
3. How should he record thefrom the 30 cm ramp?
information that the 3rd marble rolled 480 cm
Circlg the number_of:the correct answer.
.
(i) ,Put 480 cm in space (c).
(ii) Put 480 cm an space (i).
Leave it out..
A
(iv)/ Make up a new space for the information.
4. How'should he. record the distances rolled by the 1st marble?
Circle the number of the correct answer.
(i) Put t1e distances rolled in tpaces (a), (b), and (c).
(iij Put the distances rolled in spaces (a), (d), and (g).
'(iii) Leave j.t'out.
(iv). Make tab new spaces for the infdrnlation.
(

I
.
Recording InformationJunior
Effect of Height of Ramp
on Distance a Marble Rolls
(Version 3)
11.
Richard built a ramp and rolled a marble down it to see hONfar it,would
travel across the floor, He then decided to find out if the distance
travelled.by ajmarble is influenced,by the height of the ramp. He rollOd
3 marbles down the ramp when it was 10 cm high. Then he rolled the same
3 marbles from ramps 20 cm high and 30 cm high. He was careful to do
everything the same each time he started a marble down the ramp.
Here is the information Richard collected.
Heightof Ramp
Colour ofMarble
DistanceRolled
Length ofTime the.
Marble Rolled
10 cm20 cm30 cm
10 cm20 cm30 cm
10 cm20 cm30 cm
1st goarble,
1st marble1st marble
2nd marble2nd marble2nd marble
3rdmarble3rd marble3rd marble
blueblue
ue
redredred
yellowyellowyellow
.60
120
240
120,
240360
240360480
cm.011
C111
cmcmcm
cmcmcm
1.4 s1.5 s2.0 s
1.5 s2.0-s2.5 s
-2.0 s2.5 s3.0 s
Directions: Use the above information to fill in this chart so that Richard
can answer his guesXion: -Does t e height of the ramp affect,
the distance that the marble rol s?
'Add mor rows.Ind columns if you need them.
'Distance Rolled
Height ofItimp '1st marble 214 marble .
3rd marble'elly
10
76
40

Recordtng,Information'NJuniOr
2. Effect of Strength of Vinegar' MixedSoda on Speed of a Toy Boat.
(Version 15
4
77
Paul has'a\toy boat that uses a'mixture of vinegar and baking soda, for
its power f:>urce He wants to know if the strength of the vinegar he
adds to a glyen amount of sodas. will affect the speed of the boat. He
sets out a A metre course in a swimming pool. He uses 3 vinegar_ mixtures,
'weak, mediuftland strong, and measures the time it takes his boat to run
the 1 metre course with each. He is careful to keep everything the same
on each run e) ept the strength of, the vinegar mixture.
Here is all th infor7Ation Paul collected.
4
Strength of Amount Lehgth of
Vinegar Mixture of Sodk Course
Weak:
- 0.001 L water to'.001 L vinegar
- 0.001 L water to.001 L vinegar
° - 0.001 L water to.001 L vinegar
1 g .
1 g
1 g
1 m
1 m
1 m
Medium:
- 0.001 L water to 1 g
.004 L vinegar
.0.001L. water to 1 g
.004 L vinegar
1 m
- 0.001 L water to lg 1 m
.004 L vinegar
Strong:
- vinegano wat
- vinegarno water
- vinegar tono water
1 g 1 m
1 g 1 m
1 g . , 1 m
71m0 of Run.
in SecondsLevelness ofMoving Boat
Length of TimeBoat RunsBefore Stopping(in seconds)
1st run 14 level 240,
2nd run 15 leyel 26
3rd run 16 A;evel 25
1st run 11 almost level 19
2nd run 10 almost level 19
3rd run 9 almost level 20
1st run 4 bow up higher 15
2nd run 5 bow up higher 15
3rd run 6 b2w up higher 15

..11
Directions: Which of the following charts should he use to answe the question,
i"Does the strength of the vinegar in the vinegar-soda mixture affect
calf
(b)
78
the speed of the boat?"
Circle the letter of the correc
Time in SeConds
Weak mixture 15
Medium mixture 10
Strong"mixture 5
Time in Seconds
Trial 1 Trial 2
Weak mixture 14 15
Medium nixpre 11 10
Strong mixture 4 5
(c) Time in Seconds
(d)
(e)
answer.
D ratio* of
Trial (in seconds)
25/
9' 20
I6 15
,Trial 1 Trial 2 Trial 3
k -
Weak mixture
Medium mixture
Strong mixture
14
11
4
15,
105
16
9
6'
Time in Seconds
Trial 1 Trial 2 Trial 3
Weak Mixture , 14 15 16
Time in Secoals
Trial 1 Trial 2 Trial 3
MediUm Mixture 11 10 9
*Time in Seconds
Trial 1 Trial 2 Trial 36.
Strohg Mixture 4 5 6
Levelness ofMoving Boat
Duration ofRun (in seconds) ,'
Weak Mixture level 25
Medium Mixture almost, level 20.
Strong Mixture bow up higher ; 15
I
p
ti

1
Recorffng Information-
2. ,E.fect of /Strength of Vinegar Mixed
with ,Soda on Speed .of a Toy Boat
(Version 2)
Junior
Paul has a tOy boat that uses a mixture of vinegar and baking sdda for
its power,source.4; He wants to know iftthe strength of the vinegar he
adds to a giVen amount of soda will affect the sped of the boat. *He
sets put a 1 metre course in a swimming pool. He uses 3 vinegar mixtureS
weak, mediu*and'strong, and measures, the time it.takes his-boat to run
the 1 metre course with Rach. He is careful to keep everything the same
on each run except the strength of the vinegar mixture.
Here is all filfrinformation Paul collected. 4
Streng of Amount Length of Time of Run
Vinega Mixture Soda' Course in Seconds
Weak:
- 0.0 1,L water to 11 4 1 m 1st run .14:
1 L vinegar
- O. 01 L water to' 1 g 1 m 2nd run .15
001 L vinegar
- 0.001 L water to 1 g 1-m 3rd-run 16
.001 L vinegar
M dium:
0.001 L water to 1 g 1 m 1st run 11
-- .004 L vinegar
- 0.001 L water to g 1 n14 2nd run 10
.004 L vinegar,
= 0.001 L water to 1 g 3id run' 9
.004 L vinegar
StrOng:
- vinegar tono water
1 g 1 m 1st run 4
- vinegar tono water,
- vinegar tono water
1 g
1 g
Zia 2nd run
3rd. run
5
6
1;evelhess of
Moving Boat-
79
Length of Time'Boat RunsBefore Stoppoir.-,-
(in seconds)
level
-level
level
24
26
25
7
almost 'level. 19 4
almost level 19
almost level 20
bow up higher 15
bow up higher 15
bow up higher 15
S.
4
4.
'81
-r
Directions:
80
Paul prepared the following diagram to record the information
so he would be able to,answ r hiS question: "Does the strength
of the vinegar in the'vinega oda mixture affect the speed of
the boat?"
Strength oeMixture
Time of 1 metre rp in seconds
1st run 2nd run '3rd run
Weak mixture -a) (b) (c)
'medium mixture (k) (3) - (e) (f)
strong mixture (1) (g) (h) (i)
1. How should Paul,recOrd the information that on the 3rdruns the toy boat
.took 16 s with theyeak mixture, 9 s with the medium mixture and 6 s with
the strong mixture?
Circle the number of the correct answer.
(i) Put the numbers in spaces (a), (b) and (p).
(ii) Put the numbers in spaces (q), (f) land (i) .
Make up new spaces for the information.
(iv). Leave itout.301
'2% How should Paul record the information that the boat ran 26 s on the 2nd
rell using a weak mixture?
Circle the number of the correct answer.4.
(i) Include j.t in space ODT.
(ii) Include it in spaces (d),'(e) and (f).
(iii) Make up new spaces for the information,
(iv) Leave it out.
3: Flow shoul&Paul record the information that the2nd run of thetoy boat
,,using the strong Mixture took 5 s?
Circle the number of the' correct answer.
(i) Put 5 s 411 space (e).
(ii) Put 5 s in space.(h).
(iii) Make up a new pace for the information.
(iv), Leave it out.n
4
a
'4

o
e
'!'
,
- ....,
*
.4. How should Paul record the information that he .used 1 g of soda each- .
time he preparet a mixture?
C.iicle the munbei of the correct' answer.. .
81'
0
(i) Record it in spaces (j), (k) and (1) in the strength of mixture
column.
(ii) Record it in each of the spaces (a) (fp) (c) (d) (e) (f) (s) ,(h) and (i);
.k
. , .*(iii) Make up ,new spaces for the ');Information. ,
r .(iv),: Leave it out.
..J
I r
. .
., .
s
a
0 1 . ''. 4 ' l. 0
. l-' .
-4
.
I,
\
..
a
.,
. .%
/
i
1
1
t
lib
o
.. .'.. f '.
tit
. e%
.
,..
a
,
s
a
,i
,
. . N.,.. . .
at' ,...e
Y
/ '
01
i
I
4-

Re'cording Information
2. Hffect'ofStrength of Vinegar Mixedwith Soda'on.Speed of a Toy Boat
(Versiori 3)
Paul has a toy boat 'that.uses a mixture of vinegar and.
its power source. He wants to know if the strength of
adds to a giver: amount of soda will affect the speed4of
sets out a 1 metre aourse in a,wimming poolot. He uses
weak; medium Ad-strong, and measures the time it takes
the 1 metre course with each. He is careful to_keep eV
on each run except the strength of the vinegar mixture.
Here is all the information Paul collected.
Strength OfVinegar Mixture
Junior
82
baking, soda for
the vinegar hethebOat., He3 vinegar mixtures,his boat to runerything the same
Amounts' Length of Time of Run Levelness of
of'Soda Course in Seconds -Moving Boat
Ar
Length of TimeBoat RunsBefore Stoppin:,--
(in seconds) '
Weak:
- 0.001 V water to 1g.001 L vinegar '.
-.0.001 L'water to 1 g
.001 L vinegtx
- 0.001 L water to,:001 L vinegar,
1
4 l
1 m
IC m
Medium:. .
0.001.1, water to 1 g
.004 L vinegar
- Q.001 L water to loci
.004 L vinegar°
r 0.001 L ;Aber to 1 g
't004 L vinegar.
a
c.Strog:
vinegar. to
miawater .
- vinevr tono water. 4
4. \
- vinegar to g.t
no water
01 g
1 m
I m
,
Ise run 14
2nd run 15
3rd run 16
1st., nip' 11
2nd run 10
3rd run 9
level
level
level 25
ire
A.1m,c;st "19
almost level :0,19
almost level 20
I'm
1 m
1 m
1st run 0 4
2nd run
3rd run
bow.up higher
'5` k,44 Up higher 15
bow up higher .15
0
0 keii .6
84 :
,
Itr
Directions: Use the thformatipn to fill in this chart so,that.Paul'-c:An answer
his question: "Does the strength of the vinegar in the vinegar-.
soda mixture affect the .speed of the boat?" .
Add more rows and columns if yOu:need them.I
Strength ofFixture'
Time of 1 m Run, in Seconds
ist rum 2nd run 3td runN
W eak
Medium
Strong .
A
J
-
83
. s....
..
. 1. !,.
...
le .
.".
. .....
. . 0 11
(
t ....
a I.
. ..
(-\, . \,... ..
4 .
a
ar

Recording information
3. Effect of Cyclistts Mass on
Distance lie Can Coast.(Version 1)
Junior84
V
- Jim is trying-to find out why some children can coast further 4n their bicycles
than, others can. He, wants' to knowwhether a person's,mass influences the
distance he or shecan coast... lb find out, he gathered four ofhis classmates,Bill, Jane; Terry and Pflyllis, who all had the same kind of-bicycles, at the
top of a hill near the school:f
One. ate time each started dOwnhill by pushing,off:with his foot. Jim measured
how far each'travelled before'rieegling to pedal to keep the bike balanced. Each ,
friend did .this three times and then Jim used the school nurse's scale to find
their mass and height.
Here is the information Jim collected.
4
Student
,.
StfrtingPoint
Bill 1st tzy top of, hill
.2nd try top of hill
. 3rd try top of hill
Jane 1st try top of hill
2nd try top of hill
.3rd try top of tall
rry 1st try' top of-hill
.2ftd try 'top of hill
'A",
3rd try top of-hill
Phyllis ,Ipt try top of hill
2nd try top of hill
3rd try top of hill-
1-
".
Pedalledat
,
Start
.
,
'DistanceTravelledwhen Startedto Pedal
7
a
Type ofBicycle Mass
.
Height
Boyor J.
Girl
no m 10 speed Sekine 35 kg 1.3 M . Boy
no 290 m 10 speed Sekine
nq 290 m 10 kipeed Sekine
no - 320 m 10 speed Sekine 36 kg 1.2 m Girl
no, , .
320'm 10 speedSekinenp 320 m 10 speed Sekine
4,,. . ,,
no 330 m -.. 10 speed Sekine 41 kg 1.5 m. Bby,
no 331 m 10' speed Sekine o ..
no .3,31m '/04-speed Sekine
no 328 m
. (
1D speed Sekine
,
38 kg 2.1'm Girl
no 327 m 10 speed Sekine
no 328km 10 speed Sekine
'4er
'46
%
I ..a
.

Directions:
:85 2
Jim and his friends tried to organize the iniormatiOn into a chart.
Which one-would besthelp Jim to answer his question, "Does a
person's mass, make a different to the distance he or she can coast
on a bicycla?"
Circle,the-letter of the correct answe r.
(a) Distance Travelled.
Mass ;1st Try 2nd Try 3rd Try
35 kg 300 m 290 m 290 m
36 kg 320 ml,' 320 m 3'20 m
36 kg 38 m 327c
'328 m
' 41 kg 330 m 331 m 331 m.
.
(b) Distance Travelled:-
1st Try 2nd Try '3rd Try Mass
t
'Bill; '300'm 290 m 290 m,
Bill 35 kg-
4
$.7n6 X320 In 320 m 320 m ' Jane' .36 kg
Phyllis -328 m 327,m 328 m ' Phyllis 38 kg.
S'rry 330 m 331 m 331 m Terry - 41 kg
(c) .Mass Height
35T kgm
36kg 1.2m
38 kg 1.14m
41 kg 1.5 m
td)" Distance Travelled
MasS
35 Yg
36 kg
38 kg
41 kg:
1st Try 2nd Try 3rd Try Height
300.m 290 6 290 m 1.3 m ,J
320 m 320,16 320 m - 1.2 m
328 m ''.-327'm , 328 m 1.1 m
330 i . '3 1 m 331 M 1.S em%
(e) Distance Tr
Mass gnryeilei
d Try. 3rd Try
35 kg
41 kg
'300 m
330 m
4 N.
2906
331*m
290 m
331-m
/

tl
Recording Information"
.3. Effect of CycliWs Mass on
Distance HeCan Coast(Version 2)
'lJ is trying to find out why
an others can. He wants todistance he or she can coast."Bill, Jane, Terry and Phyllis,top of a hill near the school.
Junior86
some children can coast furtheron their bicycles
know whether a person'S mass influences the
To find out, he gathered four of his classMates,
who all had the same kind of bicycles, at the
a
One at a time each started do4wnhill by pushing off with his foot. Jim measured
how far-each travelled befor4 needing to pedal to keep the bike balanced. Each
friend did this three times-and then Jim used the school-nurse's scale to Lind
their mass and height.
'rive is the information Jim collected.
Student
Starting-
Point
DistanceTravelled
Pedalled when Started Type of
at Start to Pedal, Bicycle
WID
Boyor
Mass Height Girl
Bill 1st try2nd try3rd try
-lane
top of hilltop of hillto of hill
1st try top of hill
2nd try top,-,of hill
3rd try top Of hill
Terry 1st try top of hill
2nd try top of hill
3rd try top of hill
Phyllis 1st try2nd try3rd try
no 300 m 10 speed Sekine. 35 kg '1.3 m Boy
no 290 m 10 speed Sekine
no 290 m 10 speed Sekine
no 320 m 10 speed Sekine 36 kg 1.2 m Girl
no 320 m 10 speed Sekine
no 320 m 10'speed Sekine-
no 330 m 10 speed' Sekine 41 kg '1.5 m Boy
no 331 m 10 speed Sekine
no 331 m 10 speed Sekine-
0
top'of hill no
top of hill, no
top of hill /6
328 m 10 'speed Sekine 38 kg 1.1 m Girl
327 m 10 speed Sekine
328 m , 10 speed Sekine
Directions: Jim and his friends, made up the following chart to record the
information that would help them answer.their question: "Does
. ., a person's mass make a difference .to the distance he or
coast} on 'a bicycle?".
Person's Mass
istance Ttavelled Before Pedalling
First Time Second Time -Third Time
Bill (m)
Jane in)
Phyllis (o)
'Terry' (p)
(a)
(d)
(g)
(J)
(c)
(f)
(1)
83
10
-
she can
-12
1. How should they record the4informationthat Bill had tjone300 m on his
first try when he had to start edalling.
Circle the number of the correc answer.
(i) Put 300 m in space (c) .
(ii) Put 300 m in space (a).
(iii) Make up a new space for the infolmation.
(iv) Leave it out.
0
2. How should they record the!information that each of the 4 persons used a
10 speed Sekine bicycle?V
Circle the umber of the correct answer.
(1) Record it.in the spaces (m), (n), (o), (p)..
(ii) Record it in the spaces (a), (b), (c) , (d) , (e), (f), (g), (1)-1; (i),
(j), (k) and (1).
liii) Make up new spaces for the information. ;
(iv) Leave it dut. 0
3. How should they record the information that Terry was 1.5 m tall?
Circle the number of the correct answer.A
li) Record it in'space.(g)..
(ii) Record it4in spacg(p).
(iii) Make up a new space for the infoLation.
(iv) Leave it out.
*4
*AA
. 4. How should they record the information that Bill went 300 m, Jane 320 m,
Phyllis 328 m and Terry 330 m on their first tries?
CirCle the number`of the correct answer.
(i) Put the numbers in spaces (b), (e), (h)
(ii) Putthe numbers in the Spaces (a) , (d),
(iii) Make up new spaces for the information.
(iv) Leave it out.,
y
444
and (k).
(g) and (j).
87,
4,
4

, -,
Recording Iliforniation - . ..
I.- .,.
, ..: , -
.,,. ' A.. w
a.
. .
3. tffept of Cyclis t's M4s.on:
4,
Distance' He Can Coast, .S
.:
(WsiOn 3) ..- 44..%
4 '
... , '-' , 6lh is .
gliJunioe-
. .
.4 * A.
t
/
4.
s o 0 .s- 7 ,
Jim iv trying tg And gUt-Why 'some children can coast further` on their bicyclegie
than oth'ersdan. He wants 'to klieg whether a person's mass inflpences the / ,
distance h st4 can coast. To find out, he gathered four of his class vtes,
Bill, Jane, Terry,and Phyllis; wheall Wad' the same kind of bicycles, at he
top of a hill near the school.,
One at a time each started downhill by pushi g off ith his .: Jim-meiasured
'how far each'_trwelled-before needing to pedal to kee. 'the pike balanced. Each
friend did this three times and thenAJim used the scho 4 '0, rse'sscale to find
their mass and height. , ''.
_7 .
.*Tk. .
Here is the information Jim collected. e
-
.1
Student
DistanceTravelled
Starting Pedalled when Started
Point at Start. to Pedal.
Bill 1st try top of hill no 300 m
2nd try topsof hill no 290 m
3rd try too.of hill no 290 m
. .
Jane lstApry top of hill no 320 m4 2nd try top of hill no 320 m
3rd. try top of hill no 320 m0 --
Terry 1st try top of hill no -- 330 m
2nd try top Hof hill no . 331 m
3rd try' top of hill no ,331 m
Phyllis 1st try top of hill no 328 m
2nd try top of hill no, -327 m
3rd try top of hill no , 328 m-I- .
.
/\.<_
Type ofBicycle Mass Height
BoyorGirl
,10 speed Sekine 35 kg. 1.3 m Boy
10 speed Sekine10 speed Sekine
10 speed Sekine 36 kg 1.2 m Girl
10 speed Sekine10 'speed Sekine
10 speed Sekine 41 kg 1.5 M. Boy
10' speed Sekinearr.
10 speed Sekine )0p.
10 speed Sekine 38 kg 1.1 m Girl
10 speed Sekine10 speed Sekine
thisDirections:- Use thezabout. infofmation to fill in this chart so th Jim can
answer. he question: "Does a person's mass make a dif rence to
the distance he or she can coast on a bicycle?"
Add morerows or columns if you need them.
1
Dis ce Travelled BeforePedalling
Person's Mass °1°41 First'Time Second Time Third Tittle
ail].
Jane
Phyllis
.Terry.0
4

/,"
. -
RecOVing Inforthationv*4
a
4. Effect of Soil Type onGrowth of Plants(Version 1)
Junior
' .,A class lie studying how 'the type of soil affects theamount of growth in plants.
-r They put each kind off,soLL in a different pot and planted 'three seeds ach
pot. They were .careful to keep everything else the same, for each of the-se ings.
Then they measured- the -height that each plant grew.
89
HeA4 is the information they-kllected.
Amount of .Exposure of Number of dAys Height of 1Height, of
Type ,of water- every window pots until first seedling in seedling in Colour
Soil Seed day : kept in sprout appears' two weeks three weeks of stem
sand ist .05e
,, east green7-days 4,0 cm . 8.0 cm,,
2nd .05 L 3.0 cm, green, , east / 9 days 9.0 cur
3rd .05 J, 'mast ,5 days 3. 5 cm 7.0 cm;...
green. .
sand & 1st .05 L east 5 days 7.0 cm 11,0 cm / green
plant 2nd .05 L 'east f days- . cm , .,:e 6 da 6.5 12.5 cm green,:
food 3rd . .05'L ,.eaet 3.days. 6.0.cm 12.0 cm green
.."..i,J , ' 0 .S
peat 1st .05 L efist
.
. 8 days (, 5.0 cut 10.0 cm ' green
MOSS 2nd .05 L ''eSst 7 days 4. 0 cm - 9.0 cm green
3rd ..-05 L '''' .east 6 days 4.5 cm 9.0 bm 'green.
.
, ,...t...
., 0
garden 1st .05 L k , east 6 days 6.0 cm X12.0 cm green
soil -' 2nd .05 L eaq'tL. 5 days /6.5 cm 12.0 cm green
3rd .05 L east , 4 days 7.0 cm 12.5 cm green.
.. .4)
A44
4.* 4' e? ... . ' . .
: Directions: Their quetion is: N. "Which kind of poilheIps plants to grow the
tallest ?" Whip. Of' the Ifollowing charts is the best way to show
the inforniation they need' to anewer. their kquestion? .
f' :` ., ',7 i: ' ...
:Circle the letter of the doirect answer.f.::,,
(a) Number of daYs untilA t
s
sprout appeals,
Type 'of Soil 1st Seed 2nd Seed ..,3ed Seed.a.
4' .Sand
Sand andPlant FoOd
Peat ?foss
Garden Soil
7 days, 9
01..
ys - 5 days .
.,.
5 days 6 "days 3 daye't,. _
. .
!
4
8 days 7ys 6 days.
r
c6,days 5 days 4 days
)
4 91
sit

ObY
Soil,Type
\ ne 4
Total Amount SeedlingGrew in Three Weeks
1st Seed 2nd Seed 3rd Seed
Sand & Plant Food' 11.0 cm 12.5 cm 12.0 cm
', Garden Soil 12.0 cm 12.0 cm 12.5 cm
tok
(c) Total, Amount, Seedlings
Seed Grew 1.n: Thtee Weeks
c
Seed Type of Soli
. 90
1st p:o cm f 1st . sand
2nd 7.0 cm 2nd sand
3rd 7.0 cm 3rd sand-- .
1st 11.0 cm . lsf sand and pl5t.."Tood_____
. 2nd 12.5 cm .2nd -send-ana-plaq-food ..
3rd 12.0 'am .3rd sand and plant food
1st 10.0 cm2nd 9.0 cm3rd, 9.0 cm
,1st 12.0 cm,2nd 0,12.0 cm
3Kci 1215 cm
(d)0
Type of Soil 1st 41 2nd., 3rd
Total Amount SeedlingsGrew in Three Weeks
.
sand '8.0 cm 7.0 cin 7.0 c 7 days 9 days 5 days
sand and 11.0 cm 12.5 cm 12.0 cm ° days 6 days 3 days
plant good. r
peat moss °;:i10.0 an- 9.0 cm -9e0 cm 8 days. 7 days 6 days
garden soil -12.01FM ' '12:.0 cm 12.5 cm.- 46.days .5 days .4 dais
.
. .
'
.
1st peat moss2rid peat moss
3rd peat moss
1st garden soil
2nd garden soil
3rd garden soil
S
411,.
Number/Of days untilSprOut Appears
1st : 2nd 3rd
,s
4Total Amount Seedli ngs
Grew6xp.T1.tree Weeks :
Type of toil 1st 2nd 3rd. .°
,.sand .0- cm 7.0 cItt . 7.0 cm., ,
.. i A
.. .
sane' and - 11.0 em "12.5 cm 12.D 0
plant food .. ' .. ....
C. '1
, pedt:moss 10:0 cm 5.0 cm 9.0 dm. .
.- ..."7". '.
garden' soil .' 12,0: cm 12.0. cm 12.5 cm- r
. .-,
R. ., , .*.
.
.
.i.
0 ,4" g 0-
,
V o
O..°t . '
°2
%
-
°
.
ti
.
,.,

Recording Information'
4. Effect of Soil Type on
. . Growth. of Plants
(Version 2)) '
-
.11
Juniora 91
A
'A class is studying.hothe type of soil affects the amount of growth in plants. .
They.put each )and of soil in a different pot, and planted three seeds in each
.pot. They were caTefuL to keep. everything else the same for each of the seedlings:
Then they measured the.height%thateach plant grew...... VIP, .. . /
t" . ,'''' 2,-- - .
if
Here is the Information they collected. ",
4'i ,-
(40 ' '
Type
of Height.Exposure of Number of days Height of . .
Type of water every window pots until fjprst seedling'in seedling ix Colour
Soil Seed day kept in sprout apppars two weeks three weeks of stem
____
sand 1st .05 L_
east 7days 4. cm 8.0 cm ---green
2nd. .05 L east 9 days 3. cm 9.0 cm green
3rdY .05 L east 5 days 3.5 cm 7.0 cm green.
sand & 1st .05 L(
east 5 days 7.0 cm 11.0 cm. green
plant 2nd' .05L , east . ' 6 days' 6.5 cm 12.5 cm green
food 3rd .051, east ' 3 days. '6.0 cm 12.0 cm_ green
peat, 1st , .05 L east 8 days 5.0 cm 10.0 cm green
'moss- 2nd .05 L , east 7 days 4.0 cm . 9.0 cm green'
3rd .05 L east ,6 days....,, 4.5 cm' ,9.0 cm green
.. -
garden 1st .05. L east: 6 days 6.0 cm 12.0 cm breen
soil 2nd .05 L east 5 days 6.5 cm 12.0 cm green
4 3rd: .05 L .east -4 days .. 7.0 cm 12.5 cm.
green;,-
. . I % N 0..,
Diiections: 'The class made up this chait to record the information that would
help them answer their question: "Which kin..of soil helps plants
'..gr?w the tallest?"
Type.Of Soil
.Total Amount Seedlings Grew In 3 Weeks
2nd 3"rd
sand (m)
im
sand "and
plant food (
pedt moss *(0)
gardensoil (p)
b.
(a) (b) (c)
(d) (e) (f)
tg)(h), - (i)
(k) '(1)
°I°
-
°

*
1..-How should the clags record the information that the fopr 1st seeds grew
'8:0 cm, '11.0 cm, 10.0 cm and 12.0 cm each in three weeks?
Circle the number pf the correct answer.
,(i) Pat the numbers in spaces (a) ,, (d),, ,(g) and (ji.
(ii) Put'the numbers in spaces .(m) ,, (al , (b) ande(c)r
r4 4
(iii) Make up new spaces for the information.
(iv) Leave it out.a
2. Howshouldthe clast'record the information thaethe 1st seeds planted in
peat moss sprouted in 8 days?
'circle the number of the correct answer.
(i) Include it in space (g).
(ii) Include it in space (a). 01,
Make up a new space for the information.
(iv) Leave it out.
3. How should the class record the information that each plant was paced,
in a window with an eastern exp,sure?
Circle the number of the correctanswer. 10A,
(i) Record it in spaces (m), (n), (o) and (p) in the soil type
(ii) 412.ecord it in each ,f the spaces (a), (b), (d,) , (e), (f), .(g) ,
(h), (i), (j),. (k) and (1).0 ir
(iii) Make up new spaces for the information.
(iv) -Leave it outs '
40t-
4. How should,the class record the information at the 3rd seed planted in
sand and plant food was 12.0 cm high three weeks after planting?
circle the humberrthe correct answer.,
(i) In space (b).
(ii) 'In space (f).
(iii) Make up ,a new space for the'information.
(iv) L Leave it out. lo
'92

peCOrding Information
14.4. ffect,of Soil Type on
Growth of Planti(Version 3)
I
.
Junior
A class is studying how the type of soil affects the amount of gtowth'in
They put each kind of soil in a different pot and 'Wanted three seeds in
pot.' They were careful to ',seep everything else the, same for each of the
Then they measured the height that-each plant grew.
Here'is,the inforMation they collected.,
Type of
Soil Seed day kept in sprout appears
Amount of - _Exposure of Number of days
water every window pots, until first
Height ofseedling intwo weeks
93
plants.each'seedlings.
Height ofseedling in Colour.
three weeks of.stem
sand 1st2nd
- 3rd
sand & 1st
plant 2nd,
food .
peat 1st
noss 2nd
3rd
garden elstsoil 2hd
. 3rd
4
.05 L
.0'5 L
.05 L
.05 L
.05
L
.05 L
.05 L
,.05 L9
:05
L
Directiong:
easteast'east
'easteasteast
east-
easte4tt
easteasteast
4
7 days
9 days5.days
5 days.6 days3 days.'
8 day97 days
6 daysfp
6 days5 days4 days
Use the above information to fill
can answer.their question: "Which
grow the tallest?"
cm3.0 cm3.5 cm
7.0 cm6.5 cm6.0 cm
5.0 cp4.0 cm ,
4.5 cm
6.0 cm,'6.5 cm7.0 cm
in this chart so that.the classkind of soil'helps.plants to'
8.0 cm- green
9.0 cm, green
7.0 cm green
11.0 cm green
12.5 cm green ,
12.0 cm green
10.0 cm green
cm green
U cm green
12.0 cy: green
12,O, cm grpengreen
. Add more rows or columns if you need them.
Nptal,AmopntEeedlings Grew in 3 Weeks
'Type of Soil Ise 2nd . 3rd
sand
sand andplant food,
peat moss
garden soil
efi
4
1
Recording Informatim /
6
Effect of Water Temperature
on Germination Time mol
(Version 1)
0 I
Junior\
* *s
94
Paul waits to know whether t temperature of water will affect the time a
seed takes o sprout. class helped Paul plant seeds in soil in pots..
They set sthe Pots together in a sunny blasSroom window and watered them
everyday. They kept everything thd same for all the seed pots eiccept or
three different temperatures of water, co warm and hot. They watched
them' for two weeks.
Here is the inforration Padl coil
Used 'Cool Water
lst plant
-. 2nd plant- 3rd plant
Used Warm Water,
- 1st plant- 2nd plant- 3rd plant
Used Hot Water1st plant
- 2nd° plant..
3rd plant
, 1
1,
I
1'
,q,*
10
1
Number of Amont baysk until Height of0
Colour of
seeds in Type of of Water sprout sproutr in sprout ip
°pot teed each day , appears twol,weeks two weeks
bean .05 L'
'beanbean .(A:L.7
bean .05 L 6
bean .05 L 5 ..2.- f, 5 rol greep
bean, .05 L d 5 5,cm # green
bean .05 L 6 4 icm green
. . .,
. 40 * . \.. .''P'
:bean .05 L no sprout 0 ': , - -°
bean .05 L no sprout 0
, .bean :05 Lean no sprout 0 s .
. t.
,
,4 cm green3 cm5 cm" green-
1
6

0
Directions: Th9 class made charts of the information in their notebooks.
Which one do you think is best tohelp Paul answer'his question, 4
"Does the temperature of the water affect the time a seed takes -
(a)
(b)
1 4 (c)
.(d)
95
to sprout?"
Circle the letter of the correct answer.
Cool Water
Warm Water
HotWater
Height of Sprout .fi
1st plant. 2nd plant 3rd plant ."
4 Om 3 cm , 5 cm,
5 cm' 5 cm
. 5 cm,10
,0 0 0
Sprouting Time
1st plant 2nd plant Std plant
Cool Water- 6 days
Warm Water 5 days
Hot Water no sprout
7 days 6 days
5 days 6 days
no sprout no sprout
Sprouting Time
1st plant 2nd plant /3rd plant
Cool Wafer 6 days 7 days 6 days
Warm Water 5 days__/ 5 da 6 days
4,
Sprouting TimeHeight of Sprout f
lst'plant 2nd plant '3rd plant 1st-Plant 2nd plant =3rd plante
Cool Water .6 daYg q days 6 days 4 cm ,3 cm
WatM Water 5 days 5, .days . 6 days 5 cm 5 cm
Hot Water A? sproat. no sprout .no sprout 0 0
je) Temperature of
' Water Plant
coolcoolcool
warmwarmwarm
113-:
.hothothot
N.
1st2nd3rd
4
1st2nd3rd
lgt2nd
3rd
Sprouting Time:- Plant
6 dayt7 days6 days
5, days
5 dayl6 days
1st2nd
o, 3rd
1st-21nd.
3rd
no 'sProut 1st
to sprout 2nd.
zio "sprout. 3rd
V.
49.
5 cm
4 cm
0

.
Recording InformationJunior
5. Effect of Water Temperature.
on Germination Time
(Version 2)A a
11,-*
Paul wants to know whether the temperature of water willaffect the time 'a
seed takes to sprout. The cla'ss helped Paul plant seeds in soil in pots.
They set the pots together in a sunny classroom window, and watered them
everyday. They kept everything the same for all the seed pots except for
three different temperatures of water, cool, warm Nand hot. They watched
them for two weeks.
Here is the information Paul collected.
Number of. seeds in
pot
Type ofSeed
Amountof water'eaeh'day
Days untilsproutappears
Used Cool Water -e1st plan 1 bean .05 L . 6
- 2nd plant 1 bean .05 L 7
- 3rd plant 1 can .05 L 6
.
Used Warm Water1st plant 1 ' bean .05'L 5
- 2nd plant 1 bean .05 L 5
- 3rd plant 1 bean .05 L..
. 6.
Used Hot Water
- 1st plant 1 bean .05 L .no sprout
-- 2nd plant '1 bean ..05 L no, sprout
- 3rd plant 1 bean) .05 L no sprout
96
Height of Colour of
sprout in sprout in
two weeks two weeks
4'cm green
'3 Cm green
5 crti green
6
5 cm green
5 cm green..
4 cm .green
0
"06
Directions: The class designed the following chart to 'record the informtibn
that would helpPaul answer his question: "Does the temperature
of the water affect the time a seed takes to sprout?"
C'\
Temperatureof Water
Sprouting Time
1st Plant' 2nd Plant 3rd Plant
Cool Water ,(j) (a} (bc (c)
Warm Water (k) (d) (e) (f)
Hot Water (1) (g)'' (h) . (i)
7' °g,
6
4-

,
--*4:I .041.,'. .
.
1. How should Raul record the information that the sprout appeared in the
first pot watered.with cool water in six days?
.4Circle .the number of: the correct answer.
(i) Put 6 days in space (a).
(ii) Put 6r days in space (e).
(iii) Make up a new space for the information.
(iv) . Leave it out.
2. How should Paul record the information that each pot received .05 L of
water each day?
Circle thkrot the correct answer.
(i) Record ie in the spaces (j), (k) and (1).
(ii) Record it, in each of the spaces (a), (b),(c)/ (d), (e), (f.), (g),
(h) arid*(1).
(iii) Make .up*new spaces for the information.
(iv) Leave it out.
I- 3. How should Paul record the information that the third plant watered with
/ . :
iof water was 5 cm'high at the end of two weeks?,
4r41: CIrcle the number of the correct ,answer...,- ,:-,,. .
;` ' ' '' ^ IV' - « ,
4'`I (i) Include it in Space (6).itv '
t ;
'(ii) Include it in space (5)-
(iii) Make up a new space for the information.
Leave it out.
4. How shouldsprout had
-Circle the
Paul record the-information that at the end of two weeks no
appeared in any of the pots watered with hot water?
number"of the correct answer.
(i) Put "no Rprout" in spaces (a), (b) and (c).
(ii) Put "ho sprout" in spaces (g), (n) and (i).
(iii) Make up new spaces for the information.
(iv) Leave it out.
ti
qo
9,7
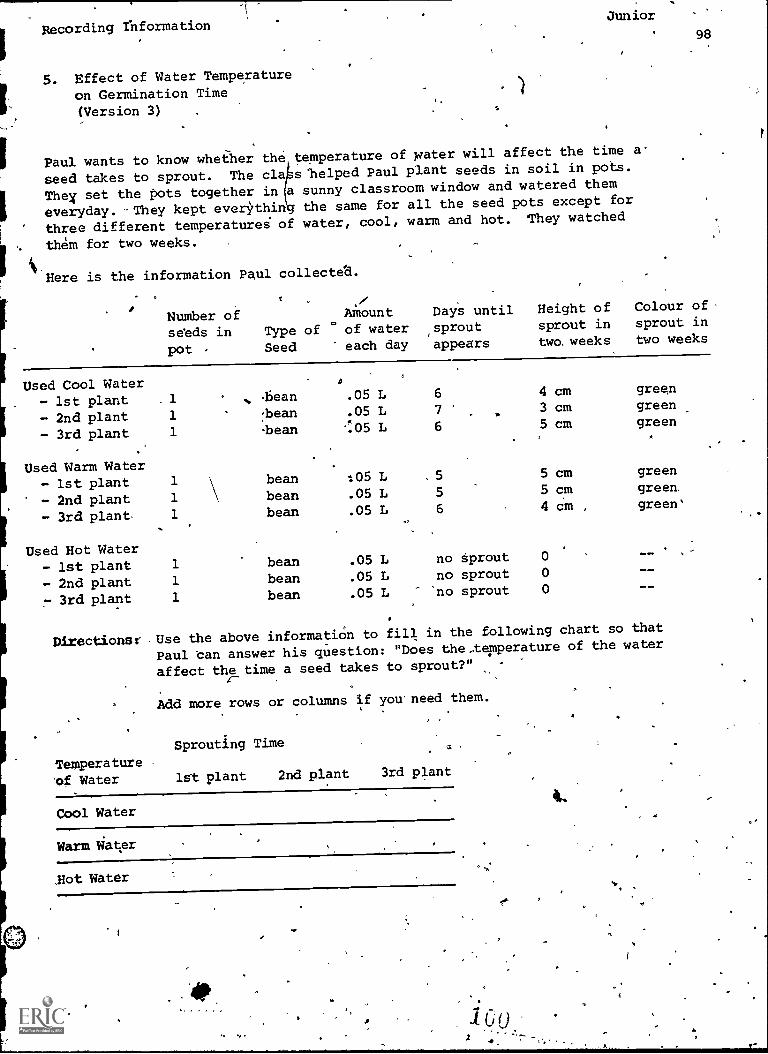
Recording InformationJunior
98
5. Effect of Water Temperature
on Germination Time(Version 3)
Paul wants to know whet-her the temperature of water will affect the time a
seed takes to sprout. The cla slhelped Paul plant seeds in soil in pots.
They set the pots together in a sunny classroom window and watered them
everyday. They kept ever thin the same for all the seed pots except for
three different temperaturei of water, cool, warm and hot. They watched
them for two weeks.
Here is the information Paul collected.
a
Number ofseeds inpot -
Type ofSeed
Amountof watereach day
DayS untilsproutappears
Height ofsprout intwo, weeks
Colour ofsprout intwo weeks
Used Cool Water- 1st plant 1 -bean .05 L 6 4 cm green
- 2nd plant 1 :bean .05 L 7 3 cm green
- 3rd plant 1 'bean .:05 L 6 5 am green
Used Warm Water- 1st plant 1 bean 105 L 5 5 am green
2nd plant 1 bean .05 L 5 5 cm green.
- 3rd plant. 1 bean .05 L 6 4 cm , green'
Used Hot Water- 1st plant 1 bean .05 L no sprout 0 OW WO
- 2nd plant 1 bean .05 L no sprout 0
- 3rd plant 1 bean .05 L no sprout 0
Directionsr . Use the above informatiOn to fill in the following chart so that
Patil can answer his question: "Does the,temperature of the water
affect the time a seed takes to sprout?" -
Add more rows or columns if you need them.
Sprouting Time
Temperature'of Water 1st plant
Cool Water
2nd plant 3rd plant
Warm Water
,Hot Water
WO'
4..

t.
Recording Information.76nio;
6. Size and Volume of Marbles(Version 1)
Ann wanted to find out if the mass of a marble is related to its volume.
She collected-some small, medium and large marbles of digfereht colours
and materials.- She made sure she had a marble of each material in each
size. She dropped them one by one into water in a-glass cylinder. The
cylinder hadmarkings on the side so she could tell how many mL the water
rose when she added'a marble,.:.....4., ,
I,44 Here. is the information Ann collected.
I
Level of water ,
in cylinderwhen no marbleis'in it
20 mL20 mL20 mL J
20 mL
20mL20 mL
20 mL20 4111.4
20 mL
A.
99
Colour ofMarble .Size of Marble
Materialmarblemade of
Level of waterin cylinderafter marbleis added
Volume ofMarble
blue 1st small one ,glassi 22.5 mL 2.5 mL
orange 1st medium one stone 23.0 mL 3.0 mil.
red , 2nd small one stone 22.0 mL 2.0 mL
yellow 1st large one plastic 25.0 mL 5.0 mL
green 2nd medium one `plastic 23.5 mL 3.5 mL
yellow 3rd medium one glass 23.0 mL 3.0 mL
green 3rd small one plastic 21.75 mL 1.7.5 mL
red 2nd large one glass 24.5 mL 4.5 mL
blue 3rd large one stone 25.0 mL 5.0 mL
101

100
.Directions: She(tried different ways to organize the information into a chart
that would help.her to answer her question, "Is the mass of a,
marble related to its volume?"
Circle the letter of the correct one.
(a) Material marble made of
Size of Marble 1st marble 2nd marble 3rd marble
(b)
(c)
(e)
small glass stone plastic
medium stone - plastic glass
large plastic # glass stone
Volume of Marble
Size of Marble 1st marble 3rd marble
small 2.5 mI;-- 1.75 mL
medium 3.0 mL 3.0 mL
large 5.0 mL 5.0 mL
Voluirte of Marble Material marble made of
Size ofMarble 1st marble 2nd marble '3rd marble .1st marble 2nd marble 3rd marble
:small 2:5 mL 2.0 mL,/
1;75 mL glass stone plastic
medium 3.0 mL 3.5 mL 3.0 mL stone plastic glass
large 5.0 mL 4.5 mL 5.0 mL plastic glass stone
4
. Volume of Marble
Size of Marble 1st marble. 2nd marble 3rd marble
small 2.5 mL 2.0 mL 1.75'mL
medium 3.0 mL 3.5 mL 3.0 mL
large 5.0 mL 4.5 mL 5.0 mL
Size of Marble Volume'of Marble
1st marbly small medium large 1st marble 2.5 mL 2.0 mL 1.75 mL
2nd marble small medium large' 2nd marble 3.0 mL 3.5 mL 3.0 mL
3rd marble small' medium large 3rd marble 5.0 mL 4.5 mL 5.0 mL
1 O 0

Recordirib InformationJuniors*
6. S4ze and Volume of Marbles
(Version 2)
Ann 'Wanted to find out if the mass of a marble'is related to its volume.
She collected some small, medium and large marbles of different colours
and materials. She made sure she had a marble of ea material in each
size. She dropped them one by one into water in a gla c Under. The
cylinder had markings on'the side so she could tell how man the water
rose when she added a marble.
Here is the information Ann collected.
Level of 'water
ihoOlinderwhen no marble Colour of
is in it Marble Size ofMarble
Materialmarblemade of
101
Level of waterin cylinderafter'marble Volume of
is added Marble
20 mL20.mL20 mL
20 mL20 mL20 mL
20 mL,
20 mL20 mL
; -
blueorangered
yellowgreenyellow,
greenredblue
.
1st small one1st Medium one
- 2nd small one
1st large one2nd medium one3rd medium'one
3rd
.i2nd3rd
small onelarge onelarge one
glassstonestone
plasticplasticglass
plasticglassstone
22.523.0
,1?22.0
25.'0
23.523.0
qmL
mLmL
mLmLmL
21.75 mL24.5 mL
25,0 mL
2.5 mL3.0 mL2.0 mL
5.0 mL3.5 mL3.0 mL
1/1.75 mL4.5 mL5.0 mL
-Directions:-Ann-designed,thls-chait_to_recordthe information that would help
her answer her question: "Is th9re a relationShiP between -the
volume of a marble and its maW"
Size of garble
Volume of Marble
1st marble 2nd marble 3rd marble
small (j).
;tedium (k)
large (1)
a
10 r)
4,

4
1. How should Ann record the information that the first large marble has a
volume of-5mL?
Circle the number of the correct answer.4
Xi) Put "5 mL" in-spabe (g).
(ii) Put "5 ML" in space (f).
(iii) Make up 'a new space for the iftforma'tion.
(iv) Leave it out.,
2. How should Ann record the informatiOn that the water in the cylinder stood
at.21.75 mL after she added the third small marble?
Circle the number of.the correct answer.
(i) Include it in space (c).
(ii) Include it in sate,(j).
(iii) Make 1113 a new space fOr the information.
(iv) Leave it out.
102
3. How should Ann record the information about the material from which each
marble is made?
Circle the number of the correct answer.
(i) Include it in the spaces (a), (b), (c), (d), (e),_(f), (g (h) and
.
(ii) Include it in the spaces (j), (k) and (1).
(iii) Make up new spaces for the information.
(iv) Leave it out,
4. How should Annkecord the information that the volumes of the medium-
sized marbles were 3.0 mL, 3.5 mL and 3.0'mL?
Circle the number of the-correct answer.
(i) Put qiese numbers in spaces (d), (e) and (f).
4
(ii) Put these numbers in spaces (g), (h) and (i).
(iii) Make up-new, spaces forlthe -information.
(iv) Leave it out..
4
10 4
4,
44-
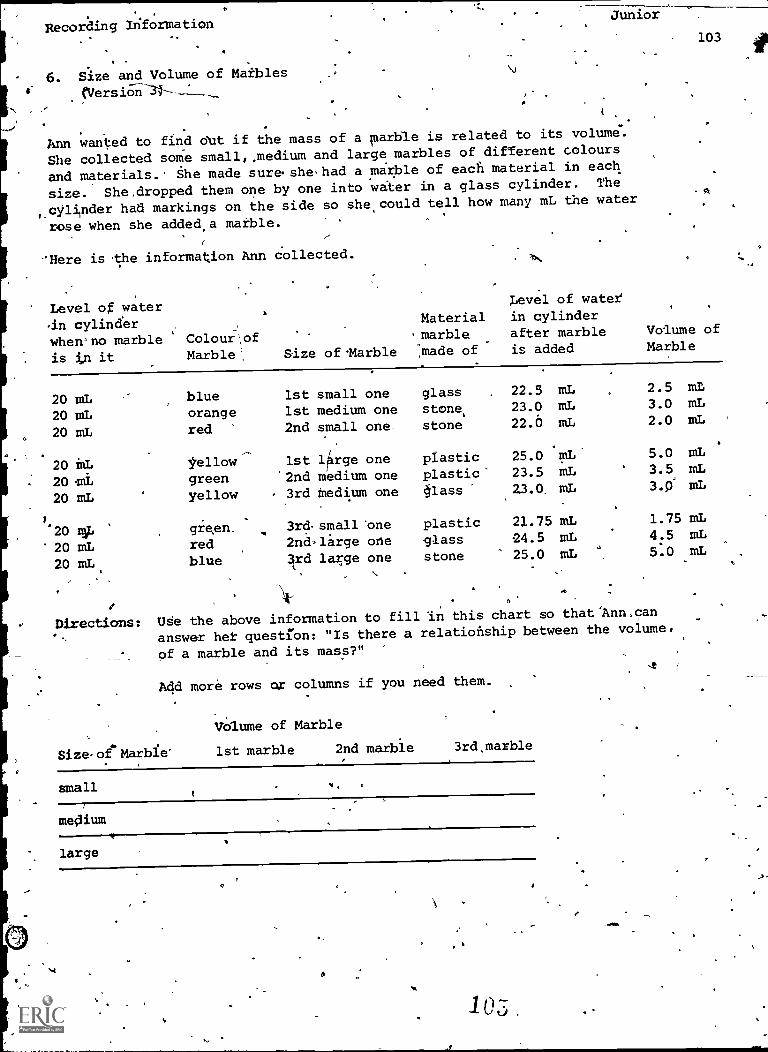
o
Recording Information
.
6. Size and Volume of Matbles41 Nersion34---
.
.t.Junior
Ann wanted to find Out if the mass of a marble is related to its volume.
She collected some small,,medium and large marbles of different colours
and materials. 1-Ie made sureshehad a marble of each material in each
size. She.dropped them one by one into water in a glass cylinder. The
,,cylinder had markings on the side so she, could tell how many mL the water
rose when she added a marble.
-liere is the information Ann collected. IN
103
Level of waterLevel of water
in cylinder.
2Material in cylinder
wherrno marble Colour ,of marble_
after marble Volume of
is j it Marble Size ofMarble ,made of is added Marble
20 mL blue 1st small one glass . 22.3 mL 2.5 mL
20 mL orange 1st medium one stone, 23.0 mL 3.0 mL
20 mL red 2nd small one stone 22.0 mL 2.0 mL
.
.
20 mL Yellow 1st urge one plastic 25.0 mL 5.0 mL
20 mi, green '2nd medium one plastic' 23.5 TI, 3.5 mL
20 mL yellow 3rd Medium one glass 23.0. mL 3.6' mL
/ . .
20 rq, green. 3rdsmallone plastic 21.75 mL 1.75 mL
20 mL red 2nd.l.irge one glass 24.5 mL 4:5 mL
20 ml,, blue 3rd large one stone 25.0 mL 5.0 mL
A
Directions: Ude the above information to fill In this chart so that'Ann.can
answer her question: "Is there a relationship between the volume,
of a marble and its mass?"
Add more rows or columns if you need them.
Size(of Marble'
Volume of Marble
1st marble 2nd marble 3rd,marble
small %,I
.
..
medium
large
O
6
.6
100

I.
104
;OBSERVING RELATIONSHIPS IN DATA - Junior. Level
.
Answer Sheet
( "
,
.
.-
Levels
/__
Items 1 2 3'. 4
1. Ramp a b : d c
I
_.
2. Moose & Wolves , e d' b a
I 3: Magnets i
.
11a c d
I. A
4. Plants & Sunlight' d c
ti a: b
15. Plants & Water d c b' a
6. PlAnts & Fertilizer c.
. I
b. a la
1
7. Pendulum
ib 'd c a
6'. Shadows a c -d Nb
1
9. Animal Coverings, - b'' a d -c
fur.
I 10. Solutions b d c a
1,0 tj11'r-7Z'

Observing Relationships
7(.1. Ramp
HeightofRamp
4
Distance Travelled By Marble
Junior, 105
Richard did an experiment in which marbles.of different mass rolled down
a ramp. He wApted to find out if the distance...travelled by'each marble is
influenced by, the mass of the marble. These were his results:
Trial
Distance Travelled by Marble
I g marble 2 g marble
a
3 g marble
1st 12 17 24
2nd 14 lEr 22
3rd .11 19 23
4th 15 14 . 18
5th 9. 15 25
DirectiOnst What would be the best way to find out if there is a relationship
between the raps of a marble and the distance it traven down the
ramp?
Circle the letter of the best answer.
(a) -Study.the information for the 1st, 2nd and 3rd trials of the 2 g marble.
See what happens to the distance the marble travels on'these rolls.
(b) Find the longest and shortest distance travelled. 'See if the marble's mass
is.bigger for the longest distance than it is for the shortest distance.
(c) .Look at all the information. See if the distance travelled is always
longer as the marble's mass gets bigger. .D
(d) Compare the distance the marble travelled on the middle trial for each
mass. See if the distance increases as the mass of the marble increases.4
40'7.
1

Observing Relationships
.2.( Moose and Wolves
Junior
Frank thinks, that' wolves may kill moose. He got some information about the
,changing numbers of moose and wolves in Algonquin Park. He wanted to find
. out if the number of wolves *living in the Park influenced the number-of moose-
living in'the Park.
Here is the infbrmation he received:
Year
Numberof Wolves.
Numberot,Moose° 0
967 78 53
1968 100 44
1989 124 33
1970 148 20
1971, 151 21
1932 124 30
. 1973' 98 43
1974 73 54
°
1975 105 42,
1976 135
'1977 161 28
4 -1978 204 ',18
Directions:.'
What would be the best way to, find out if there is a reletionsh41
between the number of wolves-and the number of moose in the Park?
Circle the letter 9f the best answer.
(a) Look at all the information., See if the number of moose always gets
_smaller if the number dfswoives gets larger.
(b) Lookat the numbers for the fiist am8 last years. If there are more
wolves in'1978 than there were in 1968, see if there are fewer moose
in 1978 than there were in 1968.
(c) LbOk at 1969 and 1,72 when the number of wolves was the same. See what
P happened to the number of moose ill these years.
I .
(d) Find the years whenthere was the most and the least
there are fewer moose when there are the molt wolves
when there are bwer wolves:,
I
p 1 6)
MIPP
wolves.and the
See ifmost moose
-106

Observing Relationships
3. Magnets t.
.
Bob has done an experiment in which magnets of different sizes were lowered
into a can of.pins. He wanted to see if the larger magnets attracted more
pins than the smaller ones.
Various Sized Magnets
4.
m:an-RalfPull ofPush Pins
These were his results:
Size of
: Magnet
1
Number ofPins Picked Up
'Smallest 1st trial 66 .
2nd trial 55
3rd 'trial 76
Medium 1st trial 750
2nd trial 75
3rd trial 79
Largest 1st trial 90
2nd trial 89
3rd trial 96.
-Directions: What would be the best way to find out if thereiis a relationship
.between the size of the magnet and the power of the magnet?
Circle the letter of,the best answer.
(a) Find the largest and smallest nuMber of pins picked up. See-if the magnet
,size isgreater for the largest number of pinsthan it is for the smallest
number. ,
14 Study the data for the'lst, 2nd and 3rd trials of the medium sized"magnet.
See howmany pins the magnet picked up on each of these trials.
(c) -Compare the number of pins picked upon the middle trial for each sized,
magnet. See if-the number of pins picked up increams as the,site of
the magnet increases. 2 .
Look .at all the. data. See if the number of pins the magnet picked ,up is ,
'always greater as the magnet size gets bigger.
109
4A .t
' I ..164 o',.
.IF

, .4-
.Observing Relationships
Junior
.,
.
.....- °
4. Plants and Sunlight le
-4,. .
kJohn.set up an experiment to see if there was-a-reiati een the growth
,,,_u
.of "flants and the amount of Auralcfilt-tha received. nine plants. All
were treated the same -except that three of them received 6hours of sunlight .
per-daythree received 9 hours and three received 12 hourd.' At the end, of the
..monthhe measu4ed the fleight of each plant and recorded his findings. .
,
: -1-4*
108'
Here are the resu
Amount ofSunlight/Day
'1 6 hours
9' hours
12-hoUrs
Directions:
Height of Plants After OcieMonth
Plant 2 Plant 3
15 cm 13 cm ° 18 cm
Plant 1
14 cm 23 cm 20 cm
20 cm 26 cm 21 cm.
What would be thg best.way for John to decide if there is a
relationship be6teen the growth of plantS and the amount of
sunlight they receive?
_Circle-the letter pf the best Answer:
(a) Examine the growth recorded fo,he last plant in each group. See if
the height of the plants iMrease as the hours of sunlight increases.V
(b Study all Of 'the replts to See whether a plant always showed more growth
when it received more sunlight.
(c,) Compare the plant that grew the most and the plant that grew the least.
Set if the tallest plant received the most sunlight possible and the
a dbortedt'r)eceived the least sunlight-possible.
0
,,(d) yegok at the three plants that received 6 hours of sunlight per day. See
hoW tall each of them became.
L
,
.
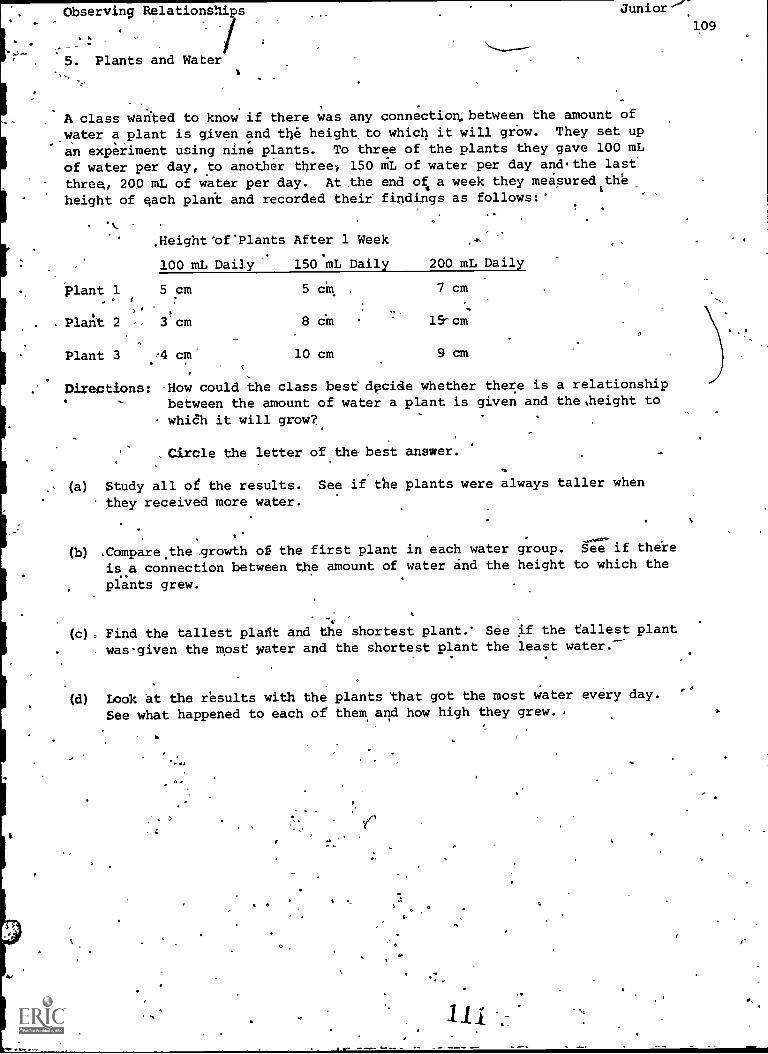
Observing RelationShips
if :
. Plants and Water
Junior '
109
A class wanted to know if there was any connection, between the amount of
water a plant is given and the height, to which it will grOw. They set up
an experiment using nine plants. To three of the plants they gave 100 mLof water per day, to another threel 150 mL of water per day and.the last
three, 200 mL of water per day. At the end of a week they meapuredithe
height of each plant and recorded their findings as follows:'
plant 1o (
,Height-of'Plants After 1 Week
100 mL Daily 150'mL Daily
5cm 5 ciu.
. Plant 2 3 cm
Plant 3 :4 cm'
Directions:
8 cm
200 mL Daily
7 cm
15- cm
10 cm 9 cm
How could the class best dpcide whether there is a relationshipbetween the amount of water a plant is given and the,height to
which it will grow?,.
Circle the letter of the best answer.
(a) Study all of the results. See if the plants were always taller when
they received more water.
.
(b) Xompare.the 9Towth of the first plant in each water group. See if thefe
is .a connection between the amount of water and the height to which the
piants grew.
(c),, Find the tallest plaAt and the shortest plant.' See if the tallest plant
was given the most water and the shortest plant the least water.--
(d) Look at the results with the plants 'that got the most water every day.
See what happened to each of them and how high they grew..
1J 1

DiDeerxing Relationships Junior
6. Plants and Fertilizer
A class did an experiment to see if there was any connection between the
growth of a plant and the amount of fertilizer it was given. In the experiment
they used 12 plants. To three ofithem they gave no fertilizer at all', to the
next three they gave 2 g of fertilizer, to another three they gave 4,g of
fertilizer and the last three they gave 6 g of fertilizer.
Following are the results they observed:
Height of Plants In Two Weeks
9 g2 g 4 g 6 g
° Fertilizer Fertilizer Fertilizer Fertilizer
Plant 1 2 cm 3 cm 5 cm.' 9 cm-
. AhPlant 2 1 cm 4 cm 4 cm 6 cm
14
Plant 3 , 2 cm' 2 cm 7 cm 5 cm
$ s
Directions: What should the claSs do to decide if there is a relationship
, . between plant growth and the amount of fertilizer used?
Circle the letter of the best answer.
(a) Compare the growth of one plant getting each amount of fertilizer. See
if there is a connection between that amount and how much thby grew.
a
110
(b) Compare the plant with the greatest amount of growth with that showing
the'least growth. See if the tallest plant was given the most fertilizer A
and the shortest plant the least fertilizer.
(c) Look atthe results forlthe three plants receiving the most fertilizer.
See how much they grew.
(d) Examine all of the information. See if the plants, always grew more when
they were given more fertilizer.
4

-
Observing Relationships
7. Pendulum
Junior
Bob, Jane and Mary did an experiment to see if the length of the arm of a
pendulum is related to how fast it swings. They made pendulums' of four
different lengths. Then they took turns swinging each pendulUm. They used
a:watch to find out how long each,pendulum took to complete 10 swings.They put all their results into one chart as follows:
Length of Pendulum Arm
10 cm
15 cm
Time To Complete 10 Swings
Bob 'Jane Mary
4 s 3 s 5.s
10 s 9 s 5 s
20 am 11 s 11 s . 11 s
25 cm 16 s 14 s
Directions: What should.they dothe pendulum length
Circle%the - letter of
18 s
to decide if there is a connection between\.k
and the time it takes to swing?
the best answer.
(a) Study all of the data. See if the time always increases as the length of
the pendulum arm increases.
kr
(b) Study the times noted by Bob, Jane and Mary for the shortest pendulum..
See how long it took to make 10 swings when each of them tried.
(c) Compare all the times recorded by Mary and, ee if the time increases as
the length of the pendulum arm increases.
(3) Look at the longest time taken and the shortest time taken. See if the
longest time was taken by the longest pendulum arm and the shortest time
by-the shortest pendulum.arm.
113
111

Observing Relationships
8. Shadows
. Junior112
Bob, Alice and Ted did an experiment to study the length of shadows. Each
attached a light fo a pole. The light could be attached in different positions
up and down the pole. In turn each placed:an object the same distance in
front of the pole. They measured the length of the shadow for each different
position of the light that they tried.
Light on PoleObject and Shadow
Here are thei\ results on one chart:
Position of Light
Length of Shadow
Bob's °Object Alice's Object Ted's Object
Directly behind object 6 cm 8 cm 10 cm
3 cm above object 5 cm 6 cm 8 cm
6 cm above object 4 cm 5 cm 7 cm
9 cm above object 2 cm 4 cm 5 cm
Directions* What would be the best way-for them to decide if there is a
connection between the height of the light and the length of
the shadow?
Circle the letter of the best answer.
(a) Study the length of the 3 shadows when the light was highest. See how,
long each of them is.
(b) Study all the results. See if the shadow always gets shorter when the.
light' is raised to a higher Osition.
(
(C) Find the longest and the shortest shadow. See if the light was At the
lowest position for the longest shadow and the highest position for the 44
-shortest shadow.
(d) Compare the shadow lengths of Bob's object. See if the shadoW gets
shorter each time,the light is raised.

Observing Relationships Junior
9. Animal Coverings - Fur
rJeff had noticed that on an animal some f r is long and some is short., He
wondered if the length of fur depended on he part of the animal's body it
was found on.
He collected the following information:
Length of Fur
Part of Body Wolf Buffalo Bear Badger Fox groundhog
Neck
Stomach
Back
. ,
long long long long long long
short long long short short short
4i. kshort short short short short short
,----
Directions: What would be the best way to find out if there is a relationshipbetween the length of fur and, the.part of the body on which it
is found? .
Circle the letter of the best answer.
(a) Pick the biggest and smaliest.animais- See if they have long and short
fur on the same parts of their bodies.- 1
(b) Look at the information about one of the animals. See where the fur is
long and short.
(c) Look at all the information. See if long fur and short fur are always
fi on the same part of the body o » all thb animals,
(d) Look at all the information about one part of the body. See if the
same length offur is on this part of all the animals.
0
a
113

Observing Relationships
10. Solutions
Junior
Dave put equal amounts of water in three different jars.\\The water in each
jar was a different temperature. He added salt, 5 mL at a\time, to one of
the jars. He stirred the solution and kept adding salt until no more would
dissolve. Then he did the same with each of the other jars. 'He counted the
number of 5 mL portions of salt that dissolved in each jar. He'repeated the
whole experiment 3 times.
Here are his results:6
11*
Temperatureof Water
Amount of Salt Dissolved in 5 mL Portions
Trial 1 Trial 2 Trial 3
Cool
Warm
Hot
8
12
21 5
0-
7
13
19
t6
12
20
114
,,Directions: What would be the best way for him to-decide if there is a
connection between the temperature of the water and the
amount of salt that could be dissolvedin it?
Circle the letter of the best answer.
(a) Look atoll the inforMation.' See if more salt always dissolved asthe
temperature of the water increased.
(b) Study the amount of salt that dissolved ip the hot test water. See
hoW much dissolved each time.
(c) LOok at the information about the last trial. See if more salt was
dissolVed as the temperature of the water increased.
(d) /Find the least and the most salt that dissolved. See if the water
temperature was different for the two amounts.
fl
116
O

"115
F. DRAWING CONCLUSIONS - Junior Level
Answer Sheet
Levels
0 1 .2 3
1. VOlume andSize c b or d e a,
2. Plant 'Growth .. b or e. c d a
Water and,
Fertilizer
3. Blectromagnet a or e d c.
4. Pendulum d or d.. _
a or e f
. 5. Growth of Fish a or g c or e b or d . .f
15. Growth of . e or g c or f i'cr b d
Plants - Soil -
and Sun
7. Growth of b or d g or f a or e c
b
Plants - Blue*Liquid & GreenPowder
8. Sound
9. ShadOws
10. AnimalCoverings --Fur
a or e
b or e
b or f
b or c f'
f or g c or a d )
a 0,
a or e ot g
. . 117' ,

onoludkng
1'. Volume and Size
A
Water LevelWithout Object
9
I
Water Level .
With Object
cp
Junior
JOhn partially filled with water a narrow cAadliated cylindet. Then he
took three objects made of different substances and placed each, in turn, in
the water. For each object he carefully measured cthe number of cm the water
level rose when it,was plated in the water.
Here are the results he obtained:
Size of Object. Mass of Object AmountWater Level Rose
Object 1 (smallest) 10g% %
-4 cM
Object 2_4medium) 157 f'" 8 cm
Object 3 (largest) 5 g 12 cm .
Here are some statem ents about the results of. the exper iment, 1
1. The volume of the object was ted 'b its mass. .
2. The volume of the object was'affected by its size.
3. As the size of the object increased;' its volume increased.
4. The volume of the object was unrelated'to its Mass.
Directions: Which statement or combination of statements best describes the,
results of the experiment?t
Circle the litter of the besi answer..
(a) Statement 3 and statement 4.
(b) Statement 2 only.
(c): Statementil only.
(d) Statement.4 only.
(e) Statement 3 only.

Drawing Conclusions
2. 13i14 Growth
Junior
A group of studets did an experiment with plants. They planted radish seeds
in 6 pots. .They added fertilizer to pots 1, 2 and 3, hut-gavO no fertilizer
to pots 4,.5 and 6. Pots land 4 got .01 L.of water dailyc pbts 2 and 5 got
.03 L of water daily and pots 3 and 6 got .05 L of water daily. At the end
of 3,weeks they measured the height of the seedling in eabh pot.
Here are the results:
unt ofHeight of Seedlings in Pheeks
Water,Daily Fertilizer No Fertilizer
.01 L Pot 1 - 16 cm pot 4 - 10 cm
.03 L Pot 2- 17 cm. Pot 5.- 11 cm
.05 L Pot 3 - 18 cm Pot 6 - 12 cm
-Here are some statements about the results:
1,. Adding fertilizer increased the growth of therplants
2. 'Adding fertilizer to the plants made a difference to how much they grew.
3. As the amount of water given to the unfertilized-plants increased the
growth of the plants decreased.
4. Increasing the amount of water given daily increased the growth of the
plants.
Directions: Which statement or combination of'statements best describes the
results of the experiment.
Circle the letter of the best answer.
(a) Statement 1 and statement 4 together.
(b) ptatement 3 only.
(c) StateMent 2 only.-
(d) Stateent 1 only.'
(e) Statement 2 and statement 3 together.
I.
tt
117.,

Drawing ConClusions
Ao
3. Electromagnets
Junior
.
.Margaret's teacher made an electromagnet by carefully wrapping a nail with
copper wire and attaching the end of the wire to a battery. She had more
batteries that she could also attach to increase the power of the magnet. .
Shehad a set of weights, some made of copper and some made of nickel. She
lifted these with the magnet.
more batteries
electromagnet4
Here are the results she got:
O."20g r 40g
COPPER WEIGHTS
O. 20g
Check mark indicates weight could be lifted.
Number,of I
BatteriesCopper Nickel.
in Magnet 20 g 40 g 60 g 20 g 40 -g- 60 g
1
,
24V/' tV. t/ t#
- %
Here are some statements about the results:
40 g
NICKEL WEIGHTSA
44
1. The electromagnet could lift a greater mass of copper than of nickel.
2. As the number of batteries in the magnet was increased, the mass it'could
lift also incratsed.
3. When the mass of the coppe weights was increased, there was an Increase
in the mass of the nickel eights.
4. The number-of batteries in the magnet made a difference to the mass that
could be lifted.
Directions: Which statement or combination of statements
results of her experiment?
Circle( the letter of the best answer.
(a) Statement 3 an statement 4 together.
(b)Statement 1 and statement 2 together.
(c) Statement 2 only.
(d) Statement 4 only.
(e) Statement '3 only.
1
best describes the
3.18
.17
6p g
.60 g

Drawing Conclusions
4. Pendulum
Junior
I, I.
..
A group of students did an ,experiment With pepdulums. They used a string
fastened to the edge Cis table, for the arm of the pendulum, p.nd tied a
1weight at the other end of it to be'the bob'. They measured the period.of.
their pendulum (the period is the time the arm takes to make a complete swing).
1
They repeated their measurements with different arm lengths and different
bob masses.,
.
'Here are their results:
Time in seconds of. 10 swings
Mdss . -10 cm 20 cm 30 cm
of bob "arm. arm arm ,
5 g
3.0g
-)
10 15
10 14
.
15' '15g 5 9
Here are some atments shoat the results:
11. As the mass of the, bob increased, the length of the arm also increased:
2. Changing the mass,of the bob did not affect tne period of the pendulum.
3. Increasing the length of the arm increased the period of the penduluth.
119
44 As the length of the arm was changed, the period of the peAdulum also changed.
Directionsf Which statement or combination of statements best describds the
.results of the experiment?
"Circle the lette4 of the best answer.
(a)` Statement-2 bnly.
)
(b) Statement 2 and' statement 3 together:
(c) Statement 1 only.
Statement 1 and statembnt 2 together
(e) Statement,4 only.'
(f) Statement 3 only.
121
1.*
a
.41

z
prawing ConclusiohpJunior
120
5. Growth of Fish
The grade 6 science\class did a study with goldfish. They put one of 4
identical fish in each tank. Fish A and B Were put` in cool water. Fish
C and D were put .in warm water. Fish A and C were fed twice a day for 20
days while the other 2 were only fed once a day. The gain in mast of the
fish between day land day 20 was recorded.
A 13 C D
I 1
Twice a day Once a day Twice a day. Once a day
Cool Water
Here are the results:
,Warm Water
increase inMibas
Temperature Fed Once Fed Twice
of Water a Day a Day
Cool 1 g 2 g.
(.7- .....),
Warm .5 g 1g
Here are some statements about the results.
1. When the temperature of the water was decreased, the increase in mass was
greater.k °
2. Changing theamount of food given daily trade a difference to the increase
in mass 'of the fish.
3. The quantity of food fed to the fish was decreased and over a period of
' time it was observed that the growth of the fishidoubldd.
4. When the amount of food the fish received was increased, the increase in
mass was greater..
5. The temperature of the water in which the fish were kept affected the growth
of the goldfish.
Directions: Which statement or combination of statements best describes the
results of the experiment?
°circle the letter of the best answer.
(a), Statement 3 and statement 5 together.
(b) ,Staftment 1 only.
(c), Statement 2 only.
Ad) Statement 4 only.
(e) Statement 5 only.
(f) Statement 1 and statement 4 together.
(g) Statement 3 only.

Drawing Conclusions Junior
12
6. Gidwth of Plants -'Soil and
Sunlight
A group of students planted somebean seesis,in pots and watched them grow.
Pots 1 and 2 were filed with sand, pots 3Lld 4 with garden loam. The
students put pots 1 and 3 in 4 sunny south window and pots 2 and 4 in a
north,window that got no direct spin .All plants got the same ainount_of
water daily.t..
'llere are their results: o
4
Kind ofSoil
Height of Plants in-3 Weeks
Sun' ,No Sun
Sand -Pot 1 - 5 cm Pot 2 - 4 cm
Loam Pot 3 - 9 cm Pot 4.- 8 din
Here are some statements about the results:
1. Thewindow in which they .were placed made a difference to the growth of
the plants.
2. The kind of soil'In which they were planted made 'a difference to. the
grdwth of theplants.
3. The plants grew better with'direct sunlight than without it.
4. _The experiment showed that, plants do just as well without direct sunlight.
V.
5 The plants'greW better in loam,tllon in sand.
. 1
Direttions: Which statement or combination of statements best describes the
1'resultS'of the experiment?
./.--
.
..,
. '''CJAle the letter of the best answer,
N.
4
(a) Statement 3 only. ,
00 ttatemeAtSonly.',
,
%, (c) Statement 2 only,. ,
(d) Statement 3 and statement 5:together..
.
(9 Statement 44 and Statement 5 together..
(f). . .
Statement 1 only .
(4.0 Statement 4 only.
,1 c"
4
1 9 0,&et,:
ti

DralOing Conclusions .Junior
7. Growth of Plants -blue liquid & green powder
A group of students were giv'en: .
- 9 bean seeds- a bottle of blue liquid'
- a box of green powder.
122
They planted the seeds in separate pots. Each pot/contained the same kind
of soil. Each pot received the same amount,of sunlight and water everyday..
Once a week each seed received some of the liquldand some of the powder.r
After 4 weeks the students measured the' eight of the plants:
Here are the results:
Amount of. blue liquid
- - 500 mL
I 1 000 mL
1 500 mL
Height of Plants,J9
50 mg. . ' 100 mg . 150 mg
green powder green powder"' green powder
4 cm . 8 cm, 16 cm
- 8 cm 16 cm 32 cm
16 cm 32 cm-.
64 cm
Here are some statements about the TesultS of the experiment.
1. As the amount of blue liquid the plants received was increased, the height
of the plants increased..
2. The blue liquid,had an effect on the growth of the plants..
7
A.
3, As the amountgof green powder the plants received was increased, the height
of the plants increased.-
The grOwth of the plants was affected by the green powder.
. 5. The experiment showed that increasing the height of the plants decreased
the, amount of blue liquid they needed.
. Ddrections4 Which statement of combination of statements best describes the4 results of the experiment?
Circle the letter of the best answer.
(a) Statement 3 1:41.y.
(b) Statement 5 only.
(c) 'Statement 1 and statement 3 together
(d) Statement 4 and statement 5 together.*40
' (e) ,Statement 1 only. -
(f) 'Statement 4 only
(g) ftatement 2 only.
4

Drawing Conclusions
8. Sound
1$s
\
Junidr
Barb found, three small jars the same size. She filled one of them 3/4.fuIl of
water, one 1/2 full and the other 1/4 full. She tapped each jar with a pencil
and listened to the sound. Then she did the experiment again with thre0 large
jai's.
I'
small jars
Here are her results:
Pitch of Sound
Amount of Small Large
Water Jars Jars
3/4 fiall low low
. f/2 full. mediurg medium,
1/4 full high ' high
H,re are .some statements about he results.
1. The size of the jar made no difference to the result.
Large jars
2. The amount of water inthe jar made a difference to the sound.
3. The amount of water in the jar did not make a difference to the sound.
4. Increasing the amount of water in the jar decreased the pitch of the sound.
,
Directions: Which statement or combination of statements best describes the
. result6 of the experiment?
Circle the letter of. the best answer..
(a) Statement 3 only.
(b) Statement 1 only.
(c) 'Stitement 4 only.
(d) Statement 2 only.
(e) Statement 1 and statement 3 together.
(f) Statement 1 and statement 4 together.
125
4
123

Drawingtonclusions Junior
9. Shadows
Bob, Alice and Ted wanted to study shadows. They attached a light to a Pole.
The light could be attached in different positions up and down the pole. Then
in turn each pladed an object the same distance in front of the pole. Bob used
a block 3 cm high.- Alice used a stick 4 cm long and Ted used a stick 5 cm long.
They each measured the length of the shadow for each different position of the
light that they tried.
Polewithlight
Here are their results.0
object
shadow
Length of Shadow
'Position Bob's Object Alice's Object
of Light (3 cm) (4 cm)
Directly behind 6 cm 8 cm
object
3 cm. above Objedt 5acm 6 cm
6 cm above-object: 4 cm 5 cm
9 cm above object 2 cm 4 cm.
Here are'some statements about the results.
Ted's Object
(5 cm)
10 cm
8 cm
7 cm
5 cm
/
1. The size of the object made a difference to the length of the shadow.
2. As the size of the object was increased the length of the shadow increased.
124
3. When.the height of the light was increased the length of-the shadow increased.
4. 'The height of the light had an effect on the length of the shadow.
,5. As the height of the light increased the length of the. shadow decreased.
Directions: Which statement or combination of statements best d ibes the
results of the experiment?
Circle the letter of the best answer.ti
(a) Statement 5 only.
(b) Statement 3 only.
(c) Statement 2 only.
(d) Statement 2. and statement 5 together.
(e) Statement 3 and statement 1 together.
(f) Statement 1 only.
(g) Statement-'4 only. 126
CP

Drawing ConclusionsJunior
10. Animal Coveririgs - fur
Jeff had noticed that softie animal fur is long and some is short.' He collected
the following information.:
Length' of Fur
Part ofBody 'Wolf Buffalo Bear
Neck -long long, long
Stomach short long long
Back short §fort short
C.Badger Fox Groundhog
long, long long
short short" short
short short Short I
Here are some statements about his findings.
c-g
03,
A
1. Different lengths of fur were located on different parts of an animal's'
body.
2. All animals had long fur on the same parts of their bOdies.
' 3. The wolf,' badger, fox and groundhog had long or 'short fur on the same
parts of their bodies but the buffalo and bear were different.
4. Some animals had different lengths of fur on a particular part of their
bodies than other animals did.
5. Long fur was most often found on the neck and short fur was most often
found on the stomachs and backs of the'animalstbodies.
Directions: Which statement or combination of statements best describes the
results of his study?
Circle the letter of'the best answer.
(a) Statement 4 only.
(b) Statement 2 only.
-(c) Stateient 3 and statement 5 together.
(d) Statement 1 only.
(e) Statement 5 only.
(f) Statement 2 and statement 4 together.
-
(g) Statement 3 only.
125
1

126
G. GENERALIZING/PREDICTING - Junior Lever A2
Answer Sheet
1 2 3 4
1. Pendulum' j- longer than longer than shorten arm, shorten.
. pendulum,
2. Pitch-&-Seccund become lower on my right lower 5A..3. Sha.ows . get shorter changes length longer longer than
4.'Bidyc less than more than b faster
180 cm 220 cm
I\5. Water Currents
(Ferti e )
7. Plants(Water)
8. Pla nts
(Sunlight)
9. Volume & Size
10. Unicycles
slower b a less help
a a less than bigger than
lest than10 cm
more than rains a lot
10 .cm
taller than
mbre than less than open sunny much taller
18 cm 6 hours area than
more than smaller than stone bigger 10 cm
6 cm than egg
Jack different same rate Jack
points
Note: Students must choose the corz optio4 on alb 4 questions to score
correct on an item.
ids \,
I-
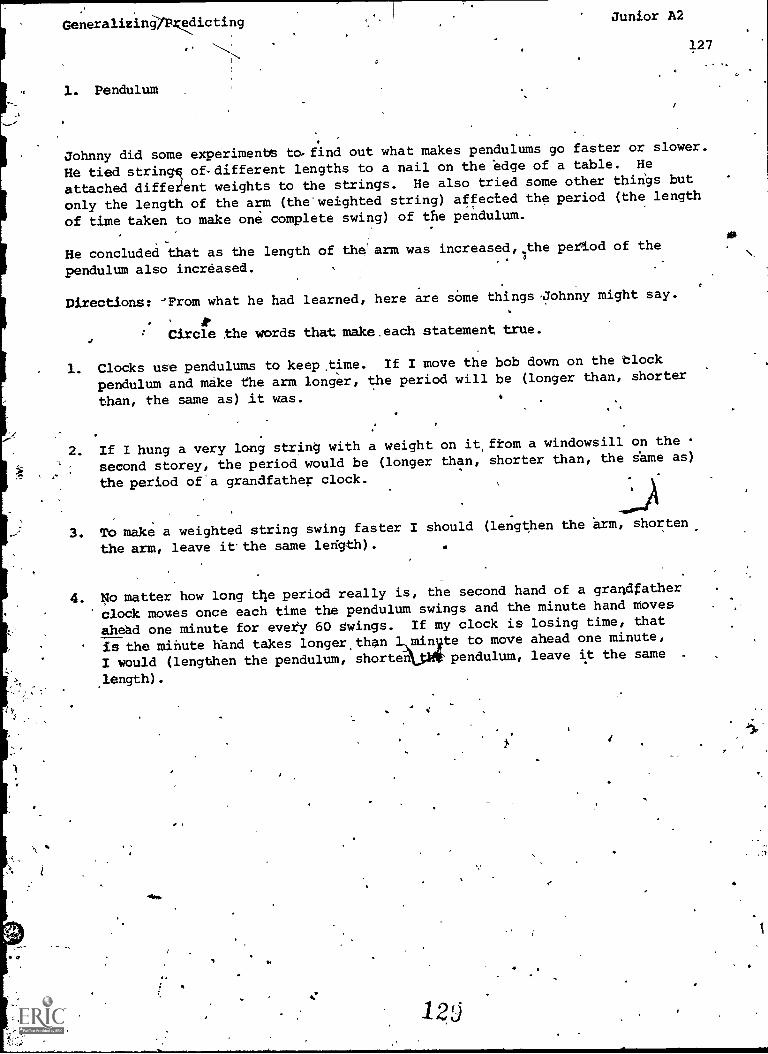
Generalizing edicting
1. Pendulum
Junior A2
127
Johnny did some experiments to. find out what makes pendulums go faster or slower.
He tied strin of-different lengths to a nail on the edge of a table. He
attached differentent weights to the strings. He also tried some other things but
only the length of the arm (the-weighted string) affected the period (the length
of time taken to make one complete swing) of the pendulum.
He concluded that as the length of the arm was increased,..the period of the
pendulum also increased.
Directions: From what he had learned, here are some thingsJohnny might say.
Circle the words that make.each statement true.
1. Clocks use pendulums to keep .time. If I move the bob down on the block
pendulum and make the arm longer, the period will be (longer than, shorter
than, the same as) it was.
2. If I hung a very long string with a weight on it, from a windowsill on the
second storey, the period would be (longer than, shorter than, the same as)
the period of a grandfather clock.
3. To make a weighted string swing faster I should (lengthen the arm, shorten
the arm, leave it. the same ledgth).
4. No matter how long the period really is, the second hand of a grandfather
clock moves once each time the pendulum swings and the minute hand Moves
ahead one minute for every 60 swings. If my clock is losing time, that
is the minute hand takes longerthan min to to move ahead one minute,
I would (lengthen the pendulum, shorten pendulum, leave it the same .
length).
I
12 j

Generalizing/PredictingJunior A2
128
2. Pitch & Sound
Paul wanted to know how a single guitar string could make different sounds.
He fastened a guitar string to a board by4nailing a strip of wood across each
end. He had another strip of wood which he could place under, the string. By
moving this strip of wood he could change the length of the, string which
vibrated when plucked.
Paul concluded that as the piece Of string which could vibrate got shorter the
sound produced got higher.
. _
Directions: From what he had learned, her; are some'thtngs Paul might say.
-
Circle'the word or words that make each statement ;rue.
1. If I change the length of a vibrating string'from 15 cm to 20 cm the sound
produced will ,(become higher, become lower, stay the same).
2. In a, piano a small hammer strikes a wire. As the wire vibrates it prOduces
the sound. If I am sitting at the piano the shorter wires must be (on my
left, in front pf me, on my right).
3. The ldng, thin piece of a guitar is called the neck. If I pluck a string
on a guitar the farther out on the neck I put the fingers of my other hand,
the'sound produced will be (higher, lower, no different).
A harp is a stringed instrument. I t makes sounds when the strings are
plucked. Below is a diagram showing 5 strings. To get the highest sound,
I would pihck,string number (1, 2, 3, 4, 5).
1 23 4 5
er,
13() 0 L

Generalizing/Predicting
3. Shadows
%Junior AZ. I
/ 129
Bot attached a light to a pole. The light could be attached in different-
positions up and down the pole.. He placed an object in front of the pole.
He meaured the length of the shadow cast by the object when thelight was
straight'behind the object and when it was at different heights above the
object.
t fir: NI)
PoleWithLight
;
Object
Shadow
He concluded that the more the light was abpve the object and shining down
on it, the shorter its shadow was.
`
Directions: From What he had leased, hare are some thingt,Bob might say.
C /
Circle the word or words that make each*statement true.. , .
-.
From sunrise to neon the shadows'of trees in the garden will,(get longer',
get shorter, stay the same). ,
.
2. From sunrise to sunset the shadow of the flagpole at school (changes length,
stays the same length).. /
4' 0 ,
-
3. If I:use the lamp on my desk instead of the one in the ceiling above my
desk my shadow will be (longer, shorter, the same, length).
4: There is a streetlight at the corner . Under it, 'e.light is coming
from above. Down the block it comes from the slide. If I stand in.
front of the second house down the street my shadow will be (longer.than,
shorter than, the same as).it is at the corner
et.
7'
1.11.... 'on...* ................./.......... '

Generalizing/Predicting
4. Bicycles.
1
Mary, Tom and. Richard decided to compare a number of bicycles. -They measured
theldiameter'of the wheels and how far eacAlbicycle travelled with one turn
Junior A2
-130
of the pedal arm.
Here are the notes they made:
Bicycle , Diame6i.
Number Make of Wheel
Distance Travelledwith One Pedal Tulh
1 Sekine. 60 cm 180 0-cm
2 Sekine 66 Cm 200 cm.
3 Sekine 72 cm 220 cm
4 Raleigh 60 cm 180 cm
5 Raleigh 66 cm 200 'cm
6 Raleigh 72 cm 220 cm
7 Centurion 60 cm 180 cm
8 Centurion 66 cm 200 cm
9 Centurion 72 cm '220 cm
They concluded that as the diameter of-the wheef got longer the bicycle travelled
further withvone turn of the pedal arm.
Directions: From what they have learned,here are some things they might say.
Circle the word or words that make each statement true.
1. If a bicycle has a wheel,diameter4f 54 cm then with one turn'of the pedal,
it will travel.(180 cm, more than 180 cm, less than 180 cm).
.
2. If a bicycle has a.wheel diameter df aq cm,,itwill travel with one turn
of the pedal arm (220 cm, more than 220 cm, lesi than 220'cm).
3. Bicycles made for children have smaller wheels than bicycles made for
adult's. For each turn.of its own pedal:
.(a) the child'd bicycle would gp farther
(b) the adult's bicycle would go farVer(c they would each travel the same distance.
4. To keep pace with an adult on an adult's bicycle, a child on a child's
bicycle must pedal: - P
- (a) faster(b) slower(c)..the same speed.
O

Generalizing /Predicting
5. Water Currents
Junior A2
131
Some students floated objects like leaves, twigs and dry' mud particles in
Jackson Park_Creek. They wanted to know whether the current was fastest
down near the bottom of the water, up on the surface--at the edge, or on
the surface--in the centre of the.creek.
Here are their results:
Rate of Travel - cm/second
Surface of water in the middle 20
Surface of water at edges 15
Near bottom of creek 13
They concluded the current of the creek was fastest on the surface in the
middle of the'creek, next on the surface at the edges and slowest near the
bottom.
,Directions: Their teacher asked them to complete the following. statements
. remembering what they had learned.
Circle the words that make each statement true.
1. A diver is drifting.,underwater down the river. A sunbather on an air
mattress is,drifting down the surface. The diver's speed will be
(faster, slower, no different) than the sunbather's.
2. A piece of dead wood is floating slowly along the edge of a river. Sudddnly,
it begins to move faster. It most likely'has:
(a) sunk to the bottom(b) beeri carried to the centre oof the stream
(c) stayed at the edge.
3. A ship on the ocean wishing to travel at the fastest possible speed would:
(a) get in the middle of a current(b) stay at the edge of a current(c) get away from ..the current altogether.
4. A submarine is travelling underwater in the ocen. A ship is travelling
above it in an ocean current. The submarine wil), get (more help, lbss
help, the same amount of help) from the current.

Generalizing/Predicting
6. Plants (Fertiliier) a
Junior A2
4. I
A group of students dial some experiments on the gro th of beans. They added
different amounts of fertilizer to different plants.
Here, are their results:
Amount of Fertilizer , Height of Plants
Added Orice a Week In 2 Months
none 10 cm
2g - 14 cm
4g 18 cm
They concluded tyt the more fertilizer they added the higher the plants grew.
Directions: From what they have learned, here are some things they might say.
Circle the words that make each, statement true.
1. If bean plants are given g of fertilizer every week, they would likely:
(a) grow to be more than 14 cm tall -
(b) grow to be less than 14 cm tall
(c) grow to be abOut 14 cm tall.
2. If bean plants grotto be 12 cm tall °after two months they most likely
have been given: 7
(a) less than 2 g of'fertilizer daily.
(b) 2.9 of fertilizer daily
(c) more than 2'4 of fertilizer. daily.
3. Roses given'2 g of fertilizer each week will likely grow (more than, less
`than, the same as) roses given 4 g of fertilizer every week.
4.Trees4probably'need'more'fertilizer than beans. ut if we knew how much
topive them, fertilized, trees, would grow (bigge than, smaller than, th
same as) unfertilized trees..
71
t
1 a4 ---
.132

.mw 4
Generalizing/Predicting
7 - 'Plants (Water),
Junior A2
Terry studied how well bean plants grewNwith different amounts of water.
Here are the results he got;
Amount of WaterPer Day
2 mL
3 mL
4 mL
I
5 mL
Height of PlantsIn 2 Months
.
ope concluded that the more water his plants were given the taller they grew.
Directions: From what he had learned, Terry might say the following things.
10am
12 cm
14 cm
16 cm6
Circle the words that make each statement true.
1. Plants that get 1 mL of water each day should reach in 2 monthp a height
.2. Plants that get 2.5 mL of water per day should reach a.height of (more
of (more than 10. cm, 10 cm', ,less than 10 cm) .
than 10 cm,'10 c less than 10 cm).
3. Unless it is cut, grass Should grow longer if it (rains a lot, rains a
little bit, doesn't rain at all).
I 4: I would expect, from the results of 9y experiment, that plants growing
at the edge of a creek would grow (faller than, shortek than, the same
height as) plants further away from the.water.
eh
133
4
O

Generalizing/PrediAingJunior A2
134
8. Plants (Sunlight)
do .
Ed grew some bean plants in pots. Some of his plants-were in a room where
they got sunlight 12 hours a day. Others were in a room where they-got sun-
light for wily 6 hours a day. The plants in the sunniest room were 24 cm
tall in two months. The other plants only grew tb be 18 cm tall in the same ,
length of time.
He concluded that the more sunlight his plarits received.the taller they grew.
Directions: From -what he had learned, here are some things he might say.
Circle the words that make each statement true.
4
1. If bean plants get.49 hours of sunlight a day in two months they should
grow to a height of (more than 18 cm, 18 crit, less than 18 cm).
2. If bean plants grow to a height of 12 cm in two months, they are probably
getting (less than 6 hours, 6 hours, more than 6 hours) of sunlight a day.
3." I should plant my garden (in an Open sunny area,- in a partly shaded area,
in the shade among ,fees).
4. Suppose I planted beans outdoors about the middle of June in\two places.
I could plant some Way up north where the sun shines aimOst all t4time.
I could plant the others near the equator. In two months the plants'in
the north should be (much taller than, about the same height as, much
shorter than) the plants near the equator.
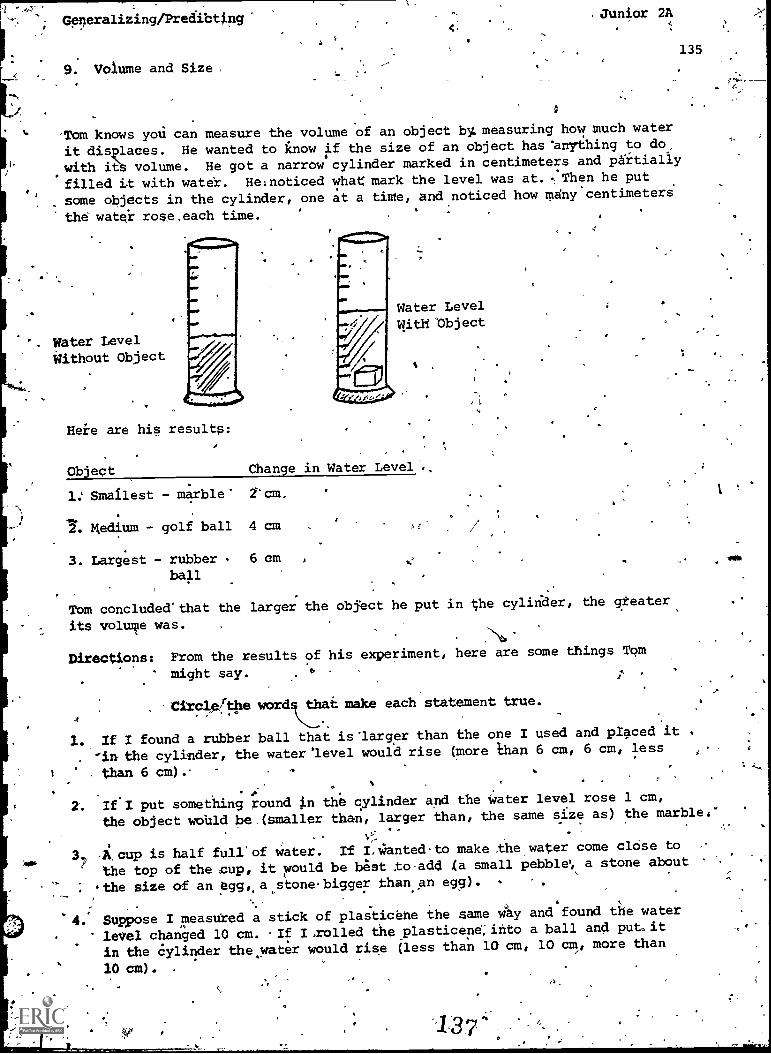
Ge9eralizing/Predibting
9. Volume and Size,
<
0
Junior 2A
-Tom knows yoti can measure the volume of an object by. measuring how much water
it displaces. He wanted to know if the size of an object has'anything to do,
with its volume. He got a narrow cylinder marked in centimeters and partially
filled it with water. He:noticed what mark the level was at. Then he put
some objects in the cylinder, one at a time, and noticed how many centimeters
the. water rose.each time.
Water LevelWithout Object
Heie are his results:
Water LevelWitH `Object
Object Change in Water Level
1: Smallest - marble' 7'am,
2. Medium - golf ball 4 cm
3. Largest - rubber 6 cm
ball
Tom concluded-that the larger the object he put in the cylinder, the gteater
its volume was.'s\o,'
Directions: From the results of his experiment, here are some things Tom
might say.
.Circle/the word that make each statement true.
,
1. If I found a rubber ball that is 'larger than the one I used and placed it .
.in the cylinder, the water 'level would rise (more than 6 cm, 6 cm, less
than 6 cm). . ..
....
.,
2. III put something round in tilt cylinder and the water level rose 1 cm,
the object would be .(smaller than, larger than, the same size as) the marble:"
37
41: cup is half full' of water. If I,Wanted-to make ,the water come close to
the top of the cup, it would be best to-add La small pebble," a stone about
: -the size of an egg,, astone.bigger than an egg). - .
. .
4 .'
,
..
4. Suppose I measured a stick of platicene the same why and found die water
level changed 10 cm. If I rolled theplasticend;into a ball and put. it
in the Cylinder thewater would rise (less than la cm, 10 cm, more than
.
.10 cm). .
135
I

Generalizing/Predicting
10. UnicyclesA
Junior A2
136
The onllyboyS in thesneighbourhood,whO owned unicycles were Bob, Frank, Bill
and Jack. Ty noticed that each unicycle whbill turned all the, way around
once for eacil'complete turn of the.pedhl. But the wheels were different
. Sizes. They decided to see how many complete turns of the Pedal each had to
.make to travel 3 000 m.
Here is what they found ()lit:
Rider,
Diameter of *heel Dance Travelled Number of Pedal Turns
Bob .60 cm 3 000 m 160
Frank 60 cm 3, 000 m 160
Bill 66 cm 3 000 m 141
N'
Jack 72 cm 3 boo m 123
They,concluded.that the larger the whee1 the fewer pedal turns were needed
to travel 3 000 m.'
Directions*: From what they had learned, here are some things they migh say.
Circle the words that.make each statement true.
1. If each of us travelled.only one pedal turn (Frank, Jadk, Bill) would go
furthest. .
.
'2. If Frank, Bill and Jack travelled for 10 pedal turns they would arrive
at (the same point, "different points).
3. If Bob and.Frank pedalled' side by side, keeping pace with each other, Bob
Would travel (at a slower rate; at the same rate, at a faster rate) than
Frank.t.
4. If-We all went for a long ride: (Bob, Frank, Bill, Jack) ,would probably
be least tired at the end of the trip. ,
1N
1
5. Intermediate Division Item Pool
137
The items have been grouped in terms-of skill, using the same sequence
that was followed for the presentation of the domain definitions (giowt4
/ .
schemes).
In each case a marking scheme precedes the items.-9
Q
. 13Y

6
F.
138 \
Items
a
A. QUEAIONING - Intermediate Level,
Answer Sheet
Level 4 Level 5 Level 6 Level 6a Level 7
1. Melting Ice . c b d e a
., ..
2. Pulling Force d a c b e
3. Heat CondUCtion a
4
4. Onion Sprouts e, d c b a
5. Irritability b d a c
6:- RespiO.tion . c ,. e. b a d
.
7. ',Animal ialoWth: a e d b -c
, ,
8. 'Property of Matter b . , a e d c
\.
9. Thermal Expansipn d b a c -* e .
10; Radiation and d e a
Heat Absorption
c

a
Questioning
1. Melf.ingIce
139
Intermediate
---A teacher placed ice in a liquid,and.asked the class to observe carefully
what happened. Over several minutes the class noticed the ice chunks
growingismaller as they mslted.
Directi8ns: The teacher told the class they could do an experiment using
ice and liquid. Which would be the best question for the
claSs to ask?
Circle the letter of your choice.
(ar Is the effect of quantity of liquid on the melting rate different
for different liquids?
(b) If there was moreliquid would the ice melt faster?
(c) How can we make the ice melt faster?
(d) Is the rate of ice melting affected by the quantity
of the liquid?
(e) Does the quantity of liquid affect the rate of: ice melting?'
Does the type of liquid affedt it?
4
s.

4'
Questioning
2. /*tilling Farce
140.
Intermediate
as 1
The class made a ramp by ,p1Scing one end of a board on a box. They could
make a steeper ramp if they placed the box further under the board. They
attached a spring scale to a little wheeled wagon. ey pulled the wagon
smoothly and gently up the ramp and observed the amo\t of pulling forceshown on the spring scale.
a
wagon
-spring
scale
..s
. Board (Hill). .
a
Box
Directionsi If youyerg in the class which of the following questions
do you think would be best for them to answer by doing
an'experimAt?a
Circle the letter of your choice.
(a) If the ramp is Steeper it"the pulling force increased?
(b) How.does the ahgle'of the ramp affect the pulling force needed?
How does the mass to be pulled affect the pulling three needed?
(c) Does the angle'of the ramp affect the pulling force needed?
(d) How,can we,increase the pulling force needed?
(e) Is the effect of the. angle of ,the ramp on the necessary pulling
force different for different masses?
r
Questio ing
3.- Heat Conduction
141
Intermediate
Four boys were cooking the bacon and eggs at a s er camp. Each had a
similar Coleman stove. Their frying pans were the same size and each had
the same amount of food in his pan, yet the food in e was cooking faster
than in others.
Directions: One boy said they.coulddo an experiment.t' Which is the best question for them to ask?
Circle the letter of your choice.
(a) What makes(the food cook faster in some pans than in others?
(b) Is the effect of metal type on heat conduction different for
different thicknesses?
._
.
lc) If I use a copper pan will the food cook faster?
(d) Is the conduction ofpan? Is it affected
(e) Is the conduction of
et,
heat affected by the,type'pfmetal in theby the thickness of the pan?
heat affected by the type of metal in the pan?
!'
143
A

AQuestionin g
4. Onion Sprouts'
42
Intermediate
. *In was helping his father clean out the basement. In a dim corner they
found's net bag.full of onions. Most of the onions had sprouted long green
shoots. All the shoots grew up through the top of the bag, even when the
onion was upside down. John was puzzled.4
- Directions: John-wanted to experiment to understand what had happened.
Which is the best question for him to ask?r .
Circle the-letter of your Choice:
(a) Does the effect of thp source of light on the direction of growth
of the sprouts depend on the degree of k midity?
(b) Is the direction of growth of the sprouts affected by the source
of light? Is, it affected by the degree of humidity of the room?
(c) Does the source of light affect the direction of growth of the
sprouts?j
(d) If the bag,was above'the window would the sprouts grow down to
the light?
.(e) What makes the onion sprouts growupwards?
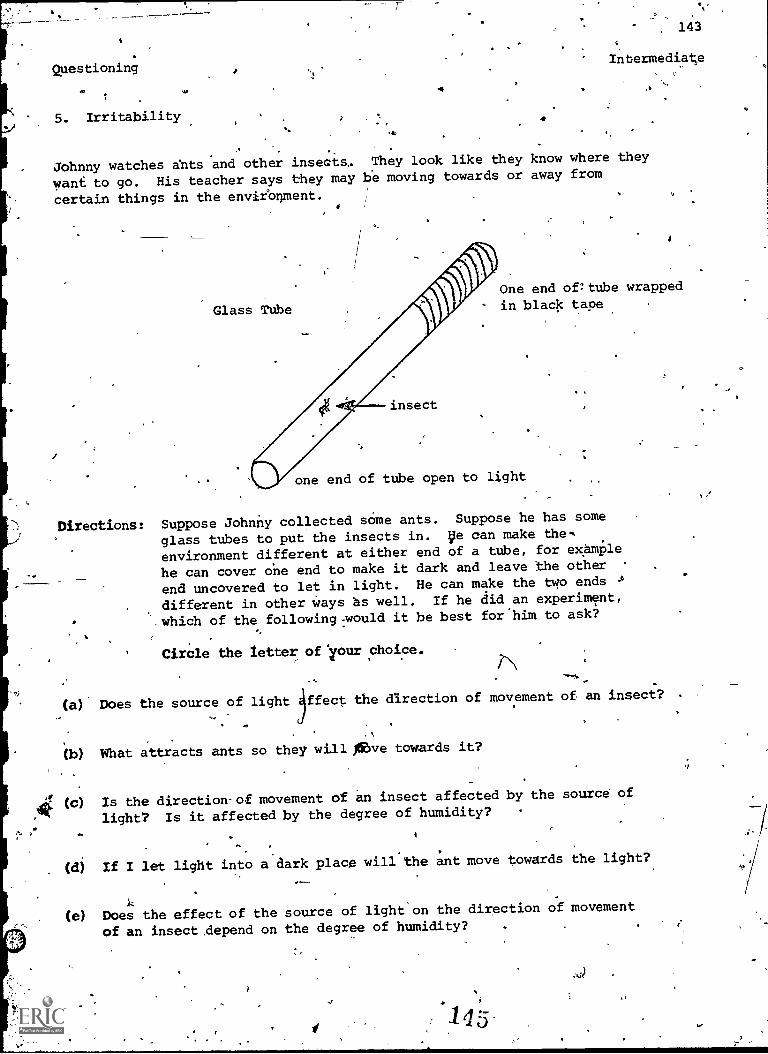
Questioning
5. Irritability
4
. 143
Intermediate
Johnny watches ants and other insects,. They look like they know where they
want to go. His teacher says they may be moving towards or away from
certain things in the environment.
Glass Tube
insect
A
One end ofltube wrappedin black tape
one end of tube open to light
Directions: Suppose Johnny collected some ants. Suppose he has some
glass tubes to put the insects in. Ve can make the-,
environment different at either end of a tube, for example
he can cover one end to make it dark and leave the other
end uncovered to let in light. He can make the two ends
different in other Ways hs well. If he did an experiment,
which of the following-would it be best for'him to ask?
Circle the letter of'your choice.
(a) Does the source of light 4ffect the direction of movement of an insect?
(b) What attracts ants so they will Ave towards it?
,g (c) Is the directionof movement of an insect affected by the source of
light? Is it affected by the degree of humidity?
(d) If I let light into a dark place will lthe ant move towards the light?
(e) Does the effect of the source of light on the direction of movement
of an insect,depend on the degree of humidity?

e
144
Questioningt!R Intermediate
. ,
6. Respiration
The class had'a fish tank a the back of the room. They turned on aubbler
from time to time to keep air in the water. SometimeS the fish were more
active than atasothdr times and the class wondered 4hy this should be. The
teacher asked thein to think of a question they could answer by doing an . .
experiment.7
'Directions: 'Which of the following questions would be best for them to agk?
.r
Circle,the lette77k your choice. g.
aill
(a) Is the activity of the fish affected by the amount of air in the water?
Is itaffected by the amount of vegetation in the tank?
(b) Is the activity of the fish affected by the-amount of air in the water?
liaccan'we make the fish more active?
, <, ,. .
the'-
0) S effect of,eir in the water on the activity of the fish depend
on the.amoun&ofvl g::ation in, the tank?e.,
,
*re
a
.. 6
(e) If we turn 'Onthe'bubblersand add more air to.
the water will the fish
get more active?.
:c ' .
"1 .
-
.
1 6.:
..
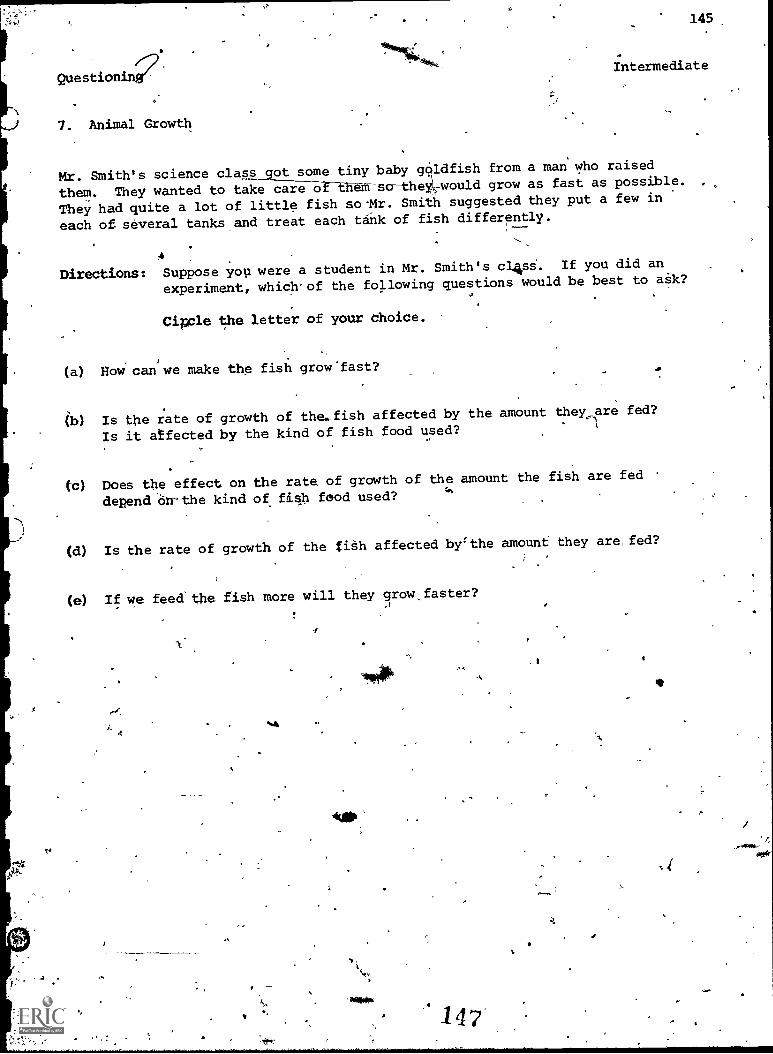
QuestiOnin
7. Animal Growth
145
Intermediate
Mr. Smith's science class _got some tiny baby gOldfish from a man who raised
them. They wanted to take care Toa-lhe-m-sonthewould grow as fast as possible.
They had quite a lot of little fish so'Mr. Smith suggested they put a few in
each of several tanks and treat each tank of fish differently.
4
Directions: Suppose yop were a student in Mr. Smith's cl4si. If you did an
experiment, whichof the following questions would be best to ask?
Cipcle the letter of your choice.
(a) How can we make the fish grow'fast?
(b) Is the rate of growth of the,. fish affected by the amount they.are fed?
Is it affected by the kind of fish food used?
to) Does the effect on the rate of growth of the amount the fish are fed
depend On-the kind of fish food used?
(d) Is the rate of growth of the fish affected byf'the amount they are, fed?
(e) If we feed the fish more will they grow, faster?.
/.4
*MP
1 4 7

Questioning
8. Property of Matter
146
Intermediat
Bill's uncle didn't feel very well. Bill watched his uncle plit two tablets of
AlkaT.-Seltzer in a glass of water. The water got full of bubbles before
his uncle drank it. Bill thought this was interesting and wanted to know
more about it.
DireationS:. Suppose Bill got a package of
them to school. At school he
equipment in the science room
the following questions would
Alka-Seltzer tablets andtookcould use the beakers and other
to do an experiment. Which of
it be best for Bill to ask?
Circle the letter of your choice.
(a) -if I warm the water will i get more bubbles?
(b) How can I make the tablets create more bubbles?
(c) Is the effect of the temperature of the wateron the amount of
bubbles Okoduced different for differlpt quantities of water? _
(4) Is the quantity of bubbles produced affe ed by the temperature
of the water? Is it affected by the quantity of water?
(e) Does the temperature of the water affect the quantity of bubbles
produced?
4
148
se.

. ,
Questioning
9: Therpal Expansion
147
Intermediate.
One day a stbaent left a corked test tube which was completely filled with
a liquid on a sunny windowsill. Suddenly the cork flew out and the liquid
spilled. The liquid must have expanded (taken up more space) and pushed
out the co4c.
Their teacher told the class they could do an experiment to find out more
about what had happened.
Ddrections: Which would be the best question for the class to ask?
CiiCle the letter of your choice.
(a) Is the amount of expansion affected by the temperature of the liquid?
(b) 1g we heat the liquid will it expand?
(c) Does the type of liquid affect the amount of expansion? Is the:amount
of expansion affected by the temperature.of the liquid?
(d) How can we make a liquid expand?
(e)-' Is the effect of temperature on the amount of expansiop different for
different liquids?
vi
gin
149
N
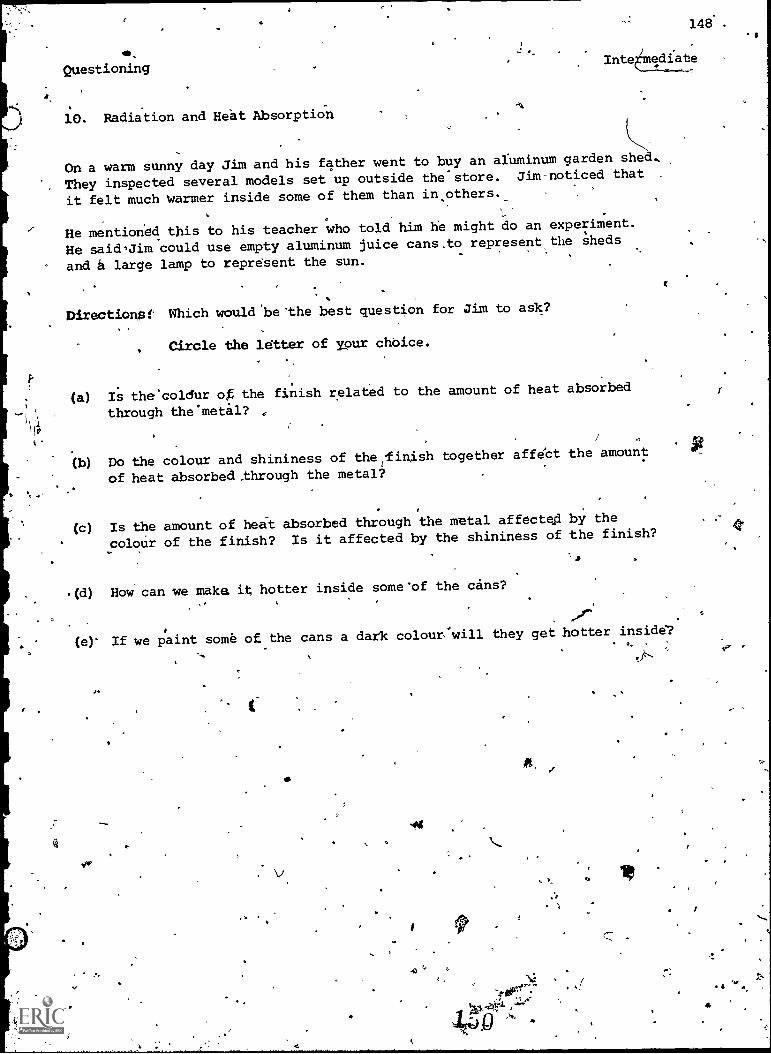
148..
op,
QuestioningInte6ediate
10. Radiation and Heat Absorption
On a warm sunny day Jim and his father went to buy an aluminum garden shed.
They inspected several models set up outside the-store. Jim-noticed that .
it felt much Warmer inside some of them than in others.
He mentioned this to his teacher who told him he might do an experiment.
He saidJim could use empty aluminum juice cans,to represent the sheds
°and a large lamp to represent the sun.
Directionst Which woulbethe best question for Jim to ask?
Circle the ldtter of your choice.
(a) Is the'coldur of the finish related to the amount of heat absorbed
through themetal?
(b) Do the colour and shininess of the,linish together affeCt the amount
of heat absorbed through the metal?
(c) Is the amount of hei't absorbed through the metal affecteg by the
colour of the finish? Is it affected by the shininess of the finish?
(d) How can we make it hotter inside some'of the cans?
(e)' If we paint some of the cans a dark colour will they get hotter inside?
yfy v
41
-
,J-`
4
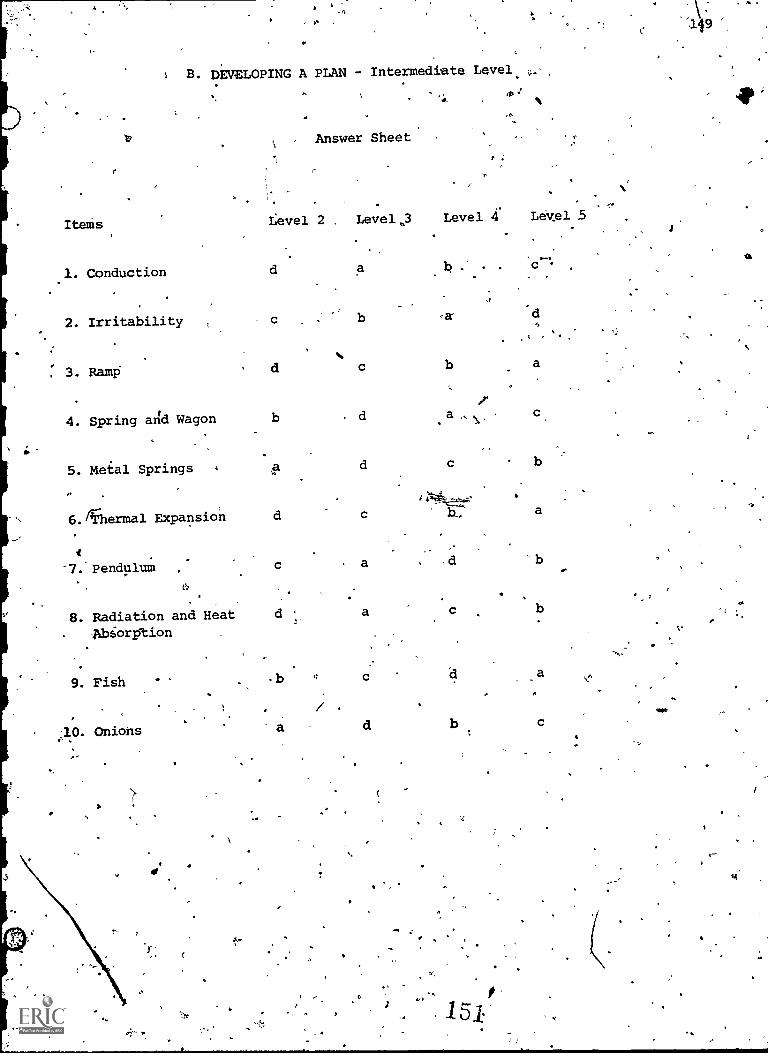
iterns
1. Conduction
2. Irritability
. 3. Ramp
B. DEVELOPING A PLAN - Intermediete Level.
4. Spring and Wagon
5. Metal Springs
6. iiherrnal Expansion
Answer Sheet
4,
.6
Level 2 , Level 3 Level 4' Level 5
a
4
-7.'Pendulum c a
8. Radiation and Heat d a
Abiorption
9. Fish . .b
/
1AL Onions
ti
,a-
a
C
d
C
b
1 51
C
6
a
b
a
b
b
a
C
s
d

'
10,
Developing A Pian,
j.
1. Conduction
Intermediate
.
You are asked to cook dinner at summer camp.- You.have a number of pots and
several single burner Coleman stoves. You put water in the pots and,put them
I
.
., on the stoves. Some come to a boil before the others. You wonder why.#
._, .
Directions: 'You decide to,find' out more. Here are some ideAs about what
-you covid do. Which tone is best?
ow .
I
Circle the-letter of your choice.
.
,
.r
'.' (a). Put some Waterdh tpo pots .that are different thicknesses. 'Put each on a
different 'stove and turn On the burners. Note the time it takes each to
come to a boil. See if it's different. You might tty doing it again to
see if the same pot boils first a second time.
4
Pick out two pots
thicknesses. Put
saie tempeAture.at the sameitime.boil.
150
gib
that are the same size and the same metal,'but different
the same amount of water -in each. Be sure it: is the
Put each on a stove. fiTutn each stove on the same amount
See in which pot the Water comes first to a full rolling
(c) Find two pots that are the same size and the same metal but different
thicknesses. Find two more, of a different metal but the same size and
thicknesses as the first two. Put the same amount of water of the same
temperature in each. Start heating each pot at the1same time with the
burner of each stove you use turned on the same amount. 'See in which
metal or thickness of pot the' water comes first, second, third and fourth
to a full rollihg boil.1
(d) Fill a powith water. Alt it on a stove. Turn on the burner. See if
it comes to4a boil. Change the amount of water and try that. po it
again on another stove. _Ity one of the other pots. See what you notice
. when you dd that. Keep trying 'different things. ,
152
;

Developing A elan
2.. Irritability
151
Intermediate
You have watched insects crawling or flying around. They seem to know what --,,
they are doing. Your teacher. says maybe something in the environment attracts
or repels there. ..-,
r.
-You Ilve some glass tubes. Each is open at both ends. Along the upper surface v
is a small hole. You have some ants and other.insects such as mealworms and
wood lice yOu can.put in the tubes.
You also have some dark paper-and transparent paper to cover the ends of the
tubes.,
'
Directions: Mere afe some ideas about what to do with this equipment.
kn'Which e is. best?
Circle the letter of your choice.
(a) Cover ,one end of a tube with dark paper. Cover the other end with
transparent paper. Be sure both papers are very dry and have the same
odour ancktempefature. Put in an ant and watch to see the direction it
goes. Repeat in exactly the same way with several more ants in case
the. fiiSt one was not healthy and see. if they do the same thing.
(b) Cover one elF:of at tube with dark paper. Cover the ether enO:with
transparent paper. Put an ant in the,tube. Watch to see which direction
'Ait goes. 'Shake the tube and then see what direction it goes. Put the
tube in other places and see if the ant still goes in the same direction
when you set it down.
r
(c) ,Use,4one of your materials to cover one,end of a tube. Use The other one
to cover the other end. Put an ant into the tube. Watch,to see what-'
happenst 'Add another ant. Watch again. Put in a mealworm or a wood
louse. --Watch AgAin. Change'the material covering one of the ends and
watch. KeepchAnging'or adding insects and watch.
41
t$
(d) Prepare three tubes with dark paper onone end and transparent paper on .
.the other: Be sure the papers are the same temperature, odbur and dryness.
Put.an ant in One tube, a mealworm in the second and a wood louse in the
third. Watch to see which direction each-goes. Repeat the experiMeht
several times with different ants, mealworms and woodlice. .See if-they
all go the same or different directions.,
'
I 53
0

vDeveloping A Plan
3. Ramp
1
152
Intermediate
Richard saw his friends rolling marbles down a ramp they had built using boards
and books. They were trying to get the marble to reach a certain mark on the
floor. The mark was quite a long distance from the ramp and none of their marbles
.reached it. ,r";
Richard .built a ramp of his own just the same as theirs. He got sglme marbles
of different masses.
Marble
Heightof Ramp
Floor
4-distance travelled by marble-
Directions: Here are some ideas for what Richard could do with his equipment.
Which one is best?
circle the letter of your choice.
(a) Roll a small 1 g marble several times down a ramp that is 10 cm high,
starting it the same way each time. Repeat this step with the same
marble and ramps 12 cm and 14 cm high. Take a 2 g marble and then a 3 g
marble and repeat the experiment with each of them. Use all 3..ramp
heights with each of the'marbles. measure. the distance rolled each time.
Compare all the distances.
(b) ',Roll one marble several times down a-ranp that is 10 cm high. Start it
from the same spot and thesame way each time. Raise the ramp to 12 cm
and then 14 cm and roll the same marble several times down each of them.
Do it the,same way. Measure how far it.rolls each time and compare the
distances from different heights.-
wr Roll some marbles down a ramp _that is 10 cm high. Raise the'ramp to 12 cm
and rollsomemore. 'Raiie it again to 14 cm and roll some more. Medsure
how far the marble goes each time and comparfp the distances.from the
different heights. Use coloured chalk to mark how far each -marble goes.
.(d) Roll a`lot of marbles down the ramp.. Use different masses. Try changing
the height of the ramp by using a bigger board to hold it up. Try some-
thing'a little different each time he rolls another marble to see what
happens. Keep doingthist
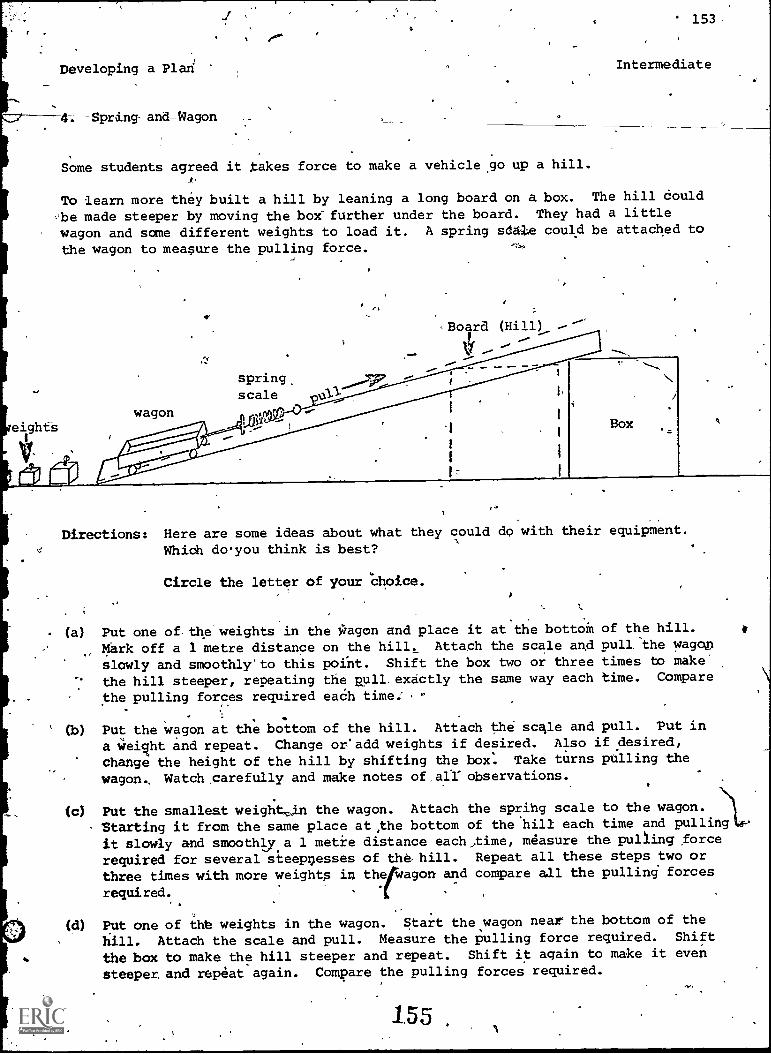
Developing a Plari
4-. Spring and-Wagon
153,
Intermediate
Some students agreed it takes force to make a vehiclego up a hill.
To learn more they built a hill by leaning a long board on a box. The hill could
4pe made steeper by moving the box-further under the board. They had a little
wagon and some different weights to load it. A spring sdaq.;,e- coni] be attached to
the wagon to measure the pulling force.
spring.scale
-Board (Hill)
Directions: Here are some ideas about what they could do with their equipment.
Which do-you think is best?
Circle the letter of your Choice.
%
(a) Put one of the weights in the wagon and place it at the bottoin of the hill.
Mark off a 1 metre distance on the hill. Attach the scale and Pull-the wagop
slowly and smoothly'to this point. Shift the box two or three times to make
the hill steeper, repeating the Rull exactly the same way each time. Compare
the pulling forces required each time.
(b) Put the wagon at the bottom of the hill. Attach the scale and pull. Put in
a Weight and repeat. Change or'add weights if desired. Also if desired,
change the height of the hill by shifting the box Take turns pulling the
wagon.. Watch,carefully and make notes of,afr observations.
(c) Put the smallest weight-in the wagon. Attach the sprihg scale to the wagon.
Starting it from the same place at ,the bottom of the 'hill each time and pulling
it slowly and smoothly.a 1 metre distance each,time, measure the pulling force
required for several steepxesses of the hill. Repeat all these steps two or
three times with more weights in the wagon and compare all the pulling forces
required.
(d) Put one of thb weights in the wagon. Start the wagon near the bottom of the
hill. Attach the scale and pull. Measure the pulling force required. Shift
the box to make the hill steeper and repeat. Shift it again to make it even
steeper, and repeat again. Compare the pulling forces required.
155 e

Developing A Plan
5. ,Metal Springs.
Johnny foind some old springs in hisac harder to stretch than othe'rs.
_He collected some,metal weights tl3at
springs
A
r
154,
Intermediate
father's workshop. Some seemed heavier
cquld be'hooked to the springs.
5
0
e
4.O
weights
Directions: Here are someyideas for 'what Johnny might do with this equipment.
Which one is best?0 ^ r. e
Circle the letter of your choice.
(a) Hang the springs from hooks ojk ttte,wall. Pull on them with his fingers
to see how they feet/ Piettach a weight to one of'them. Try a different
weight on another. Keep moving weights around on the springs. Watch
carefully and keep notes. .
0
(b) Hang the springs frogphooks op the wall, making,sure the hooks are big.
enough to let each spring hang free. -Measure the length of each spring.
Using different weights one time, attach the weight smoothly and
carefully to.one of the springs. Each time, measure its length now.
Repeat, using ali-the same weights, On the other springs. 'Compare the-
amollt each sp!ing stretches with each of the weights.
(c). Hang the springs from hooks on the w41. Be sure:ea-oh spring hangs free
of the wall. Measuring the length of the spring before and after, attach
one of the weights to each springin turn. Attich the weight carefully.
and do it the same way each time. Compare the amount each spring stretches,
(d) Hang the springs from hoOks'on the wail. Measure the length,qf the spring.
Take one weight and hang it to the spring. Measure the length of the spring
now. Measure the length of the next spring. Move the weight to it. Measure
it now. -Do this for all` the springs. Compare the amont 'each spring stretches.
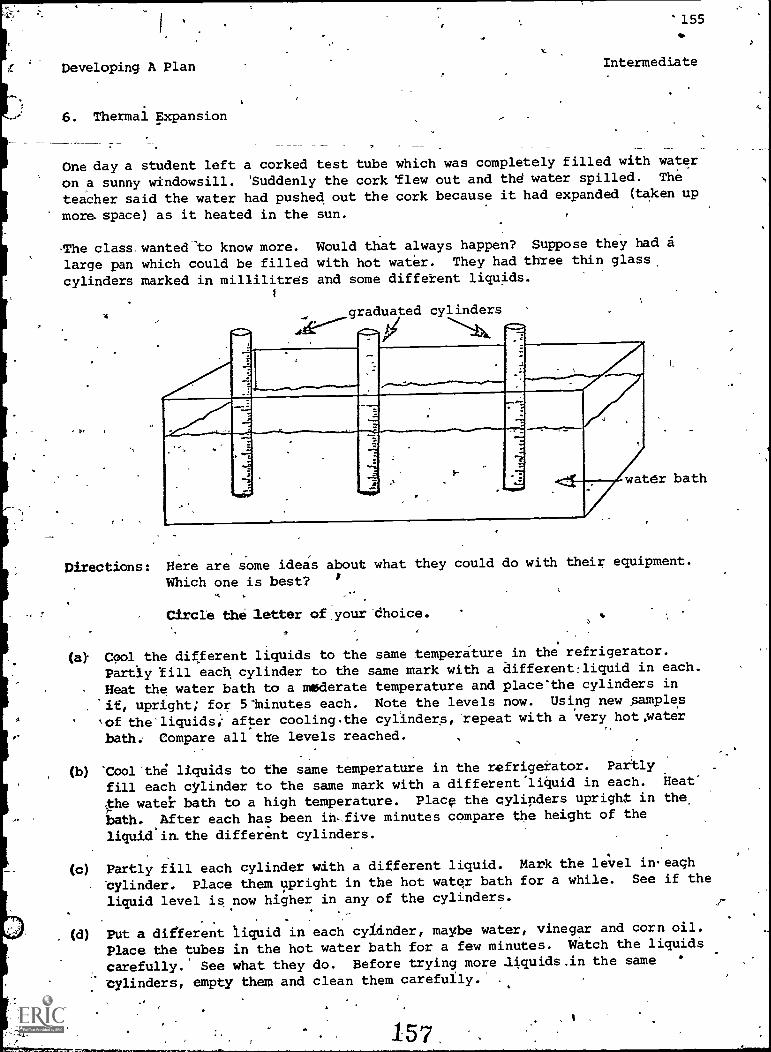
Developing A Plan
6. Thermal Expansion
155
Intermediate
One day a student left a corked test tube which was completely filled with water
on a sunny windowsill. 'Suddenly the cork 'flew out and thd water spilled. The
teacher said the water had pushed out the cork because it had expanded (taken up
more. space) as it heated in the sun.
The class wanted' o know more. Would that always happen? Suppose they had
large pan which could be filled with hot water. They had three thin glass,
cylinders marked in millilitres and some different liquids.1
graduated cylinders
water bath
Directions: Here are some ideas about what they could do with their equipment.
Which one is best? 1'
Circle the letter of,your'dhoice.
(a) Cool the different liquids to the same temperature in the refrigerator.
Partly 'fill each cylinder to the same mark with a different:liquid in each.
Heat the water bath to a moderate temperature and place'the cylinders in
'it, upright; for 5"Minutes each. Note the levels now. Using new samples
'of the-liquids; after cooling the cylinders,' repeat with a very hot,water
bath. Compare all the levels reached.
(b) 'Cool'the liquids to the same temperature in the refrigerator. Partly
fill each cylinder to the same mark with a different"liquid in each. Heat'
the water bath to a high temperature. Place the cylinders upright in the,
bath. After each has been ih-five minutes compare the height of the
liquid in. the different cylinders.
(c) Partly fill each cylinder with a different liquid. Mark the level ineaqh
Cylinder. Place them upright in the hot water bath for a while. See if the
liquid level is now higher in any of the cylinders.
(d) Put a different liquid in each cylinder, maybe water, vinegar and corn oil.
Place the tubes in the hot water bath for a few minutes. Watch the liquids
carefully. See what they do. Before trying more .14quids.in the same
cylinders, empty them and clean them carefully. .
1:57.

t:
,.
Developing Plan Intermediate
b C7. Pendulum J;
156
/ \
. There is a grandfather clock in the front hall of
/ s. the school. Some students wondered how it works..
I
/ A\ Arm'
A teacher said it works Ily,means of a peddulum that
/
.
moves back and forth. A pendulum can be made using
/ \ a mass (bob) and a string.
II/
\
\ .
/Directions; Here are some ideas about how to study
iN, the principles on which the pendulum- /
I-ie/ works. Which is,the best?
Bob
Pendulum
Circle the letter of your choice.
(a) Attach the bob to the string. Measure the time it takei- for the pendulum
to,go from side to side (the period). Lengthen the string. See if the
period is changed. 'Do this several times. -t e
(b) Attach a 1 g bob to the string and swing it back and forth. Use a string
"length of 10 cm, then 20 cm and then 30 cm, Measure the time it takes for
the pendulum to move back and forth (the period) with each'string length.
Repeat, starting. each swing from the same point, using bobs of 5 g and then
10 g and compake all the periods.
(c) Attach the bob to the string. Suspend the bob so that'it can swing back
and forth. Swing the bob several times. tee if you can be careful enough
tar make it'swing smoothly. Watch the pendulum swinging and see if you
can learn something about it.
(d) Attach a 1 g bob to.the string and swing it, back And forth. Start each
swing from the same point. Measure how long it takes for the pendulum
to go from one 'side to the other (the period). Use a string of 10 cm and
then repeat using a string of 20cm and compare the periods.
158

Developing A Plan
8. Radiation and Heat Absorption
7
eg"
ft157
Intermediate J
On a warm sunny day Jim and his father went to buy an aluminum tool shed. They
inspected-several models set Up outside the store. They found two-similar models
that they liked but Jim noticed that it felt muchwarmer inside one of them: He
wondered about this.
-Tam-collected empty juice cans with the labels removed to represent tool sheds'
and a 250 watt lamp to represent the sun. He had a thermometer to measure the
temperature.'
Directions: Here are some ideas for what Jim could.dO with his equipment.
Which is best?
Circle the letter of your choice.
(a) Paint one can black, one white and one green. Put some water in each-of
them. First shine the lamp on the black can and see if the water gets hot.
Take the temperature of the water., Shine the lamp on the white cans, And
then.the green one. See if the water gets hotter in one of theca.'
,
(b) Paint 2 cans black, two white and two,gren. Use shiny enamel paint for one
can of each colour and dull flat paint for the other one. Taking each can
in turn, put 1/2 litre of water in it and place it 20 cm fromthe lamp for 6
half an hour. Be sure the water temperature in each cary'is the same at the
beginning of its turn. Measure the temperature again at the end. 'Coritpare
the water temperature reached in the 6 cans:
(c) aint one can-black, one white and one green. Use shiny enamel paint for each.
Taking each can in turn fill it exactly.half full of water. Measure the water
temperature and be sure it's the same in each one before it is placed 20 cm,
from the lamp for half an hour. Measure the temperature again at the end of
that time. Compare.the water temperatutes reached in the '3 cans.
(d) Put some water...in 'an empty juice can. Hold the base of the lamp in his hand.
Shine it on the can, Try holding the lamp closer or farther away. See what
,, happens to the waterAn the Can.Try it with a different can. See what
happens with it. '

0 s. 158
0 ,
Intermediate4
Developing A Plan
9. Fish.3
Sue's class were studying the breathing mechanisms of several different kinds
of animals. Sue had noticed that the mouth and gill movements of a fish weresometimes faster than at other times. She wondered'how certain conditions affect
breathing Gate .
She got some fish bowls and some goldfish. She got a bottle of vinegar. Vinegar
is a mild acid.
Directions: Here are some ideas for what Sue might do with this equipment.Which one is test?
Circle the letter of,your choice.
(a) Let a pail of tl water settl . Warm 1 000 mL to ?0°C and put, it in one
bowl. Add 3 fish. Count the number of times each fish opens and closesits mouth (the number of breathing movements) in one minute. Do this in
the plain water and again after adding first 10 mL of vinegar and then nor
40 mL more vinegar to the bowl. Gradually adapt the fish to warmer water.,Place them in a second-bowl-containing 1 000 .mL from the same pail warmed
to 30°C. Repedt the counts without and. With vinegar. Compare all the
preAthing counts.
(b) Put water in two fish'boWls' Make sure it's not too hot or too cold for.
the fish. Put some fish in each bowl. Put a little bit of vinegar in
one of the bowls. Get a notepad and make notes of.how the fish behave in
the different bowls. Do it several times if you want. Change the,amount
of vinegar and see what happens. -
icj Put water from the tap in two of the bowls. Make sure it's not too cola
or the fish might die. Put a fish in each bowl. Add 10 mL of vinegar to
one bowl. Count the 'number of times the fish opens and closes its mouth(the number of breathing movements) in one minute. Do this. for both fish
and compare. Repeat if you think yoti could have made a mistake.
(d) -Let a pail of tap water settle. Warm 1 000 mL to 20°C and place in a bowl.Add 3 fish..*Count the number of times each fish opens and closes its mouth(the number, of breathing movements).in one minute. Add 10 mL of vinegar to
the water. Count each fish's breathing movements in one minute again. Add
40 mL more vinegar. Again count the breathing movements in one minute and
compare with the other counts.
160,

159/
Deve1oping A Plan - Intermediate ,
10. Onions
John helped his father clean out a storage room in the basement. In a dim
corner they found a net bag fullAbf'onions. Most of the onions had sprouted
long green shoots. All the shoots grew up through the top of the bag, even
-when the onion was upside down.. John was puzzled..;*
He went to the store and bought a large bag of onions. There was an empty closet
- in the houSe. It had an electric outlet on one wall.
Directions: Here are some ideas for what John could do with the onions.
Which one is best?
Circle the letter of your choice.
(a) Plug in a night light to give a dim light in the, closet. Put oniongall
around on the floor.* Put some on the shelf in the closet. Tie a string
around some and hang them from the 'ceiling if you -want. Look everyday to
see what the onions are doing.
(b) plug in a night light. Get 12 onions the,same size with no sprouts. 'Put
6 on the floor with, the top of each pointing in a different direction. Tie
strings aroundthe others. Hang them from the ceiling right above the first ,
ones. Make.sure they are the same distance from the,light as the onions on .
4the floor. Make sure the tops point in the same directions. Check once a
'week and compare'the direction the sprouts grow.
6
(c) Plug in a night'light. Get 12 onions the same size with no sprouts. Put
6 on the floor. Make the top. of each point in a different direction.. Hang v
the others from the ceiling right above them, the same distance from the .
light and pointing in the same directions. When those have sprouted enough
to see what direction the sprodts are groWing, repeat, with 12 more onions.
This time keep pails of water in the closet to make it damp. Compare these
=Lions with thefirSt ones,
. 6
(5) Plug in a night light. Put an onions on the shelf. It will be above the
light. Put another on the floor. It will 'Ice under the light. Check once
a week. When the anions sprout compare the direction the sprouts are
growing. Do it over again with more onions if you want.
161

C. JUDGING THE ADEQUACY OF DATA - intermediate
Answer.:Sheet
1. c 31. de
2. c 32. e
3. d 33. b
4. d 34. b
5. c 35. d
6. a
7. c,8. d
9. d
10. c
16. a
17. ,b1E1. c
19. b20. b
21. d
22. d
23. c
24. c
25. a
26.
27. b28.
29. c
30. d
O
A
36. b37. d38. a
39. 43
40. d
41. d
42. c
43. a
44. c
45. c
46. b47. e
48. b49. c
50. a
51. b52. d53. a
54. c
56. c
57. e
160

Judging The Adequacy of Data
161
Intermediate.
1. Bill wanted to know if all bean seeds have the same mass. He should use
a balance which can be read to the nearest:
(a) gram411
(b) kilogram
(c) 0.1 gram
(d) milligram = 0.001 gram
i
Z. Jim wanted to measure the daily growth of a newly germinated bean seed. He
should use a ruler which can`Ie read to the nearest:4
(h) metre
(b) centimetre
(c) millimetre
(d) 0.5 centimetres
3. Bob and Anne were measuring the Veight pf a piece of metal using spring
`scales. They recorded their values in the table below.
,Anne's BoWsTrial , Measurements Measurements
< 1 5.0 N 4.8 N
2 4.9 N 4.7 N
3 5.0 N 4.8 N
4 511 N 4.9 N
5-
`-'`
5.0 N 4.8 Nty.
Average 5.0 N 4.8N°
41.
f
Which of the following factors might account for. the different answers,.
(alone of the spring scales l'was not "zeroed" (reading. zero) at.the-beginning
of the measurement
(b) either Anne or Bob was not reading the scale at eye level-.
lc) one of the spring scales has lost some of the "tightness." of its coil
(d) possibly any of the above
163
a

eli A graduated cylinder was used by four students to determine the volume
of an irregularly shaped object,bx water displacement. Each student"
recorded a difIerent answer: Which factor may have accounted for this?'
(a) the level of the water was not read at eye level
(b) the cylinder was held at an angle as the water level was read
(c) the object was not lowered carefully into the cylinder and water
splashed out.,-,
(d) possibly any of the above
5. A graduated cylinder with a scale marked every 11.0 ML waS'usA to find
the volume of a thumb tack. This procedure would result in:
(a), an inaccurate answer
(b) an accurate answer
(c) no answer
(d) an answer that was close to the actual value
Gil In order to.discover the, volume of one thumb tack, which_procec*re would
be best to use?
(a) use a graduated cylinder marked every 1.0 mL but use 100 thumb tackg
at once, then divide the increa in volume by roo
(b) use a graduated cylinder marked every 1.0 mL and repeat e procedure
with one tack ten times, then calculate the average
(c) use a graduated cylinder which Has a scale marked every 0.5 mL and
take one measurement with one tack
(d7 use a mathematical-formula to suit the shape of a thumb tack and
calculate the volume,
7. A.class wanted to disco er the effect of exercise on the.rate of the heart
tt .:beat. Each student nee ed to measure his own "resting" heart rape by
taking his pulse. The best data would be obtained by:
, (a) taking one 60 second pulse rate using the first two fingers of.your
right hand on the bottom of your left wrist
O
) taking oie 60 s pulse rate using the first two fingers of your right.
hd on your throat,'half way between your voice box and corner of
jawbone - /
(c) t ing several 60 s readings using either method above and averaging
the' e Its0
(d) taking several 5-second readinp using either method above, multiplying
by 12 to give tO second readings, then averaging4(
164'.
is

8. Four studentsmeasuring the,Their results
Student
-N ,.. . .
4.
. . , . . .
calculated (independently) the volume of the same
length, width, and height'and using the formula V
are given in the'table below. '1
.
Volunie
1
2
3
4
160 cm3.'
'.150 cm3
160 cm
200 cm3
. Would you:
(a) find the
,
(b) find thethe last
163
box byLxWxH.
s.
average volume using the four values given, in the table
volume using the'first three values and throwing outaverageone
(c) have the students repeat their measurements and calculations, then
average the 8 results '0 .
(d) have the students check their measurements and'ealculation"s and if
student 4'gets4a value closer to.the values of the other three, then
average',the SOUS values
\ I
9. Wendy'is interested in learning about the structure of the willow tree
flower. ,Z shouldshouldr
'(a) find a willow 'tree and examine a flower
/V'
(b) find a i4illow tree and examine several flowers
°
(c) examine one flower on several different willow trees
(d) examine several flowers pn several different willow trees
in a potsitting on a stove,element is bubbling.of. .
10. .Paul notices that waterWOuld he:
.(a) conclude th.at thq water is definitely boiling
(b) cOnclude'thatthe water'is definitely not boiling
(c) make no conclusiOns until further observations were made
(d)
.
conclude that the water in the pot is probably boiling,
165

11. When determining the factors that may affect the degree of, friction.when
a block slides across a table, the least important consideiation in the
list belOw would be:
(a) the colour of the block
the mass of the }kook
-4-
(c) the type of surface on the block
(d) the type of surfaCe on the table
At
12. In order to di ;cover the thickness of one sheet of'paper in a book, you
should:.
(a) find a ruler with a scale smaLl enough to measure the thickness of
one sheet ,
(b) try to measure thethickness ofby 10
1(c) try to measure the thickness of
by 100
(d) trY to measure the thickness ofby'100 .
10 sheets in millimetres and divide
100 sheets in millimetres and divide
p.00'sheets in centimetres and divide
164°
13.' Peter het up an xperiment to fry toprove that male miceicould learn
faster than female mice, because he thought males were smarter than
females, His data seemed to indicate that male mice would find their
way through a, maze, faster than female mice. Would you:
(a) accept Peter's data and conclude that male mice could learn astek
thanfemal mice
(b) accept peer'sda tat and conclude that the male of most animal species .1
can learn faster than the female
(c) look for.flaws in'Peter's procedure'since you suspect sex has no s
bearing on how quickly ands learn
,(d) repeat Peter's experiment exactly and if you get the same results
e, conclude that male, mice learn more'quickly.than female mice
..
166

1 165
14. _Op viewing the great,number.of dandelions on her front lawn, Mary wondered
if,they grew any taller in one area than in another. She decided to divide
her lawn into eightequal,squares using-pegs and string. To see if the
taller dandelions were' Jpcated in a specific area of the, lawn she should:
(a) measure the tallest dandelions in each square
(b) measure one of the tallest-and one of the shortest dandelion-6 in each
square and find the average
(c) select 20 dandelions in each square, chosen at random with eyes closed,
measure the size and find the average size for'each square
(d) inspect by eye each square and decide which 2 squares, have most of the
thller,dandelions
15.' Franc tookthe "resting" pulse .(heart beat) of the 30 students in his class.'
His valups ranged from 55 bdats per minuteto 115 beats per minute. He
should:
(a) not worry about the variation and just find the average.
(b) conclude that his technique for taking the pulse is not good
(c) check with atdoctor to see if such a variation is normal
./(d) count only those which are within 10 beats per minute of the normal
resting pulse which he had heard was 72 beats per,minute
1 6 Linda wanted to use fi-ve identical marbles for an experiment. .She boUght 5
.which looked identical from the same box in a store but she decided to check
the mass of each using ip balance. She got the following measurements:
,Aarbld Mass,
1
2.
5.25 g5.00 9
3. 5.50 g
4 4.75 g
5 5.25 g
What should she first do?---
/ ,. ,
..
,(a)assume that theloalance may not be working,properly,And repeat her
-(lorteasuAmerits with another balance t
(b) not worry about the differencee and'jUst use the average mass value
when using each marble
conclude that the marbleg.are not identical in size'(c J#
(d) conAude that the marbles aremade from different tYpei of-glass
167r
166
17, Fred was attempting to discover if there was any relationship between the
mass of a substance and its volume. He measured-the mass and volume of
twelve different sized chunks'of aluminum and divided the mass value3by
-the volume value for each chunk. Eleven answers were within 50 kg/m of
2 100 kg/m3
. One answer was out by 500 kg/m3. Fred shoUld:
(a) omit the answer that was out by 500 kg/m3 and average the rest
(b) repeat the measurements and calculations for-all samples with particular
emphasis on the one that was out by 500 kg/m3
(c) average the twelve answers as they stand
(d) scrap the experiment because none of the calculated values was identical
18. Fred was attempting to discover if the're was any relationship between the
mass of a substance and its volume. He measured the mass and volume of
twelve different sized chunks of aluminum and divided the mass value by
the volume value for each chunk. Eleveanswers were within 50 kg/m3of
2100 kg/m3. One answer was out by 500 kg/m3. Fred checked his measurements
of the odd sample several times and got the same result. Fred should:
(a) scrap the experiment
(b) ignore the one that was out by 500 kg/m3
1
(c) look for other reasons why one sample was so far out
(d) average all twelve results
19. Bob wanted to compare the height of the maple trees and beech trees in a
wooded area. He should:.
(a) measure the heights of the tallest maples and tallest beech trees and
compare
(b) choose, at random; several maple trees and several be ech trees and
compare their heights
(c),find the average height of several' maple trees in.one area ,of the forest
and the average height of several beech trees in another area of they
forest and compare
l(d) walk to several different areas in the forest and estimate by eye which
trees seem to be taller, maples or beech
f68

20. Cheryl wantedthan others.experiment?
(a) the mass,
to find out what makes some solid .balls bounce higherWhich list of factors below should she consider in her
volume, and material of the ball
(b) the mass, volume, and material of the ball and the height from which
it is dropped.
(c) the mass and volume of the ball and the height from which it is dropped
(d) the volume and material of the ball and the height from which it.is
dropped.
1
(e) the mass, volume and material of the ball, the country where it was .
made and the height from which it is dropped
21. Bill wanted to write a report about mealworms.' The best report would be
based upon:
(a) reading reference books about mealworms
(b) reading reference books about mealworms and observing one in a glass
dish
(c) observing a mealworm in a glass dish
(d) reading reference book's about mealworms and observing'several in a
glass dish
22. Carole'had thought of an interesting theory to explain how birds migrate
in the right direction at the right time of the year.- As a good scientist
she should: -
(a) 'read only reference books which support her idea'
(b) set up an experiment so.that it supports her idea
(c) read.sev reference books to gdas many ideas on the subject as '
possible
(d) read several reference books on the subject, set up an experiment, then,
decide if her idea is correct, partly correct, or ineorrect
23. Andrew carried out an experiment which gave some data he did not expect.
He should:
(a) accept all the data of the experiment
(b) repeat the exact xperiment.then accept ,all the data
(c) check with a refe ence, perhaps his teacher, concerning the design of
his experiment,- then experiment again
(d) ignom the data which was unexpected'and,draw conclusions from the rest
of the data169
167
168
24. Sam ound the length and laidth'of a piece of paper to be 5.10 cm and 7.25 cm.
res ctively. He should, report.the area-of the paper as being:
(a) 36.975 cm2
(b) 37 cm2
(c) 37.0 cm2
(d) 36.96 cm2
25. When measuring the length of a line using a ruler marked every half cm you
could report the length in cm:
(a) to two decimal places of accuracy
(b) to one decimal place of accuracy
(c) to three decimal places of accuracy
(d) to no decimal places of accuracy just whole centimetres
26. A class decided to study the amount of rainfall in the city of Peterborough
for the month of May. The best report would include:
(a) the average rainfall for the month based on' measurements taken in the
school yard
(b) the average rainfall for the month based on measurements taken at several
locations in the city
4 (c) the daily rainfall for the month based on measurements taken at several'
locations in the city
(d) the daily rainfall for the month as reportqd on the local newscast
27. In Olympic swim competitions the timing is now done electronically. This
is because:
(aP stop watches aren't accurate
(b) human error.in use of the stop watches is,eliminated
(c) not enough people c#n be found to.do thetimini
(d) new ways of doing things are always better than old ways
170'

169
28. One half a class found the volume of a block of wood by measuring thelength, width and height and calculating, using the formula, V.=LxWx H.The other half of the class foundthe volume of the same block by usingthe water displacement method with a graduated cylinder. Examine the data
table below.
Volume of Block Volume of Block(measured and-calculated) (Water displacement,
60 cm3
55 cm3
65 cm3
59 cm3
61 cm3
63 cm3
57 cm3
60 cm3
50 cm3
47 cm3
67 cm3
70 cm3
68 cm3
58 cm3
60 cm3 Average 60 cm3
From this data you would conclude that:
(a) both methods of determining volume are equally accurate
(b) water displacement is a more accurate method than measurement andcalculation by formula
4(c) measurement and calculation by formula is a more accurate method than
water displacement
(d) one of the groups worked iiore carefully than the other group
29. A grade nine class at P.C.V.S..wanted to discover what fadtors might binvolved in determining the height of grade nine students. Which plan
would ydu follow?
(a) measure the height of all:the students-in the class and record the
sex with the height
(b) measure the height of all the students in the class and record the
sex and age with the height
(c)'mhasure the.height of all the students in all grade nine classes andrecord the sex and age with the "fibigljp.
(d) measure the height'of all the students in all gradenine,classes andrecord the sex, age and dolour of eyes with the height
171

170
.
30. A grade seven class at David Fife School wafted to study the amount of
traffic on Highway No. 7. The best report would include:
(a) a count of all vehicles travelling from east to west, from 9:00 a.m.
to 3:00 p.m. on one day 4
(b) a. count of all vehicles travelling both directiols from 9:00 a.m. to
3:00 p.m. on several days
(c) a count of all*vehicles travelling from east to west from 9:00 a.m. to
3:00 p.m. on several days
(d) a count of all vehicles in Classification groups (transports, motorcycles,
cars, etc.) travelling in both directions from 9:00 a.m. to 3:00 p.m.
on several days
31. Richard wanted to learn -as much as he could about chipmunks during his
summer holidays. He should:
(a) catch a chipmunk and watch him in a cage supplied.with food and water.
(b) read a book about chipmunks
(c) make notes one day while watching the chipmunks around his cottage
(d) make notes from observations throughout the summer of chipmunks and
read reference books about these animals
32. A certain industry was accused o; polluting the river water with a waste
chemical. To prove whether or not this was happening a scientist would:,
(a) take a river water sample near the industry art analyse it
(b) ask the owners of the industry if they were indeed allowing their
wastes to escape into the river4
(c) take a river water sample near the industry several,tWs throughout'
one day
(d) take river water samplgs,bdth above and below the industry one day4
(e) take river water samples'hoth above and belai the industry .at gdveral
differ tipes on several different days 0
00 0
ire

33. In order to determine theof bean seeds, the same ntrays containing the sameand sunlight was the samedata was recorded in four
effect of the amount of fertilizer on the growth
urr6er of needs were planted in three identicaltype and amovni; of soil.' The amount of water
for'each tray. After three weeks of growth the
ways. Which do you think is the best way?
171,
Tray Column A Column B Column C Column D,
1. -16 of 20 seeds -80% of the -most of the -16 of 20 seeds
grew seeds grew seeds grew grew
-all were tall -average height -tallest was ' -tallest was
15 cm 18 cm 18 cm-shortest was11 cm
2 -15 of 20 seedsgrew
-75% of theseeds grew
-most of theseeds grew
-15 of 20 seed,grew
-most were tall -average height -tallest was -tallest was
12 cm 17 cm 17 cm-shortest was .°
11 cm.
3 -10 9e20 seeds -50% of the -about half -10 of 20 seeds
greFf-not as tall as
seeds grew --average height
the seeds grew-tallest was
grelq /-tallest was
Tray 1 or 2 8 cm 11 cm 11 cm-shortest was
(a) column A
(b) column B
(c) column C.(d) column D
a '4 cm
34. Ingrid flipped a'Coin five times and got five "heads'''. From' this simple*
data she could:
(n) co nclude that "heads" will come up more often than "tails" for this
coin
.(b) decide that more trial's w ere needed before concluding anything
(c) concltide that the next five flips.will produce "tails" becadse there
is a 50-50 chance for "heads" or "tails"I
conclude that the coin is weighted so that only "heads" will appear
(
173 .-
.4

35. For a great many years men of science believed that the earth was the
centre of our solar system, and that the sun revolved around the earth.
They believed this'becausei
(a) they accepted, without question, what previCus men had said
(b) they lacked the precision instruments needed to see and measure the
moveiients of the planets
(c) they din not use the scientific method for investigating A problem
(d) of the above
36. Todd had read in a newspaper article that someone had claimed that praying
over plants improved their growth rate. He decided to grow two bean plants
from seed, praying over.ondand not over the other. The. one Todd prayed
over 'after one month was 5 cm taller than the other plant. Todd should ,
conclude that:
(a) praying over plants increases their rate of growth
(b) man ore trials are needed, which include controls for such thingg.as
the war h or moisture from his breath,,before he accepts the statement
made in the newspaper_
(c). the taller plant received more water-or sunlight
(d)'his (breath, while praying over the plant, somehow caused the plant.11.4
to grow taller
37. The school track coach wanted to pick girlg andYboys for the track team,
He should:4
(a) watch the girls and boys dun'
(b) pick.the older girls and boyl
.
.,
N
(c) use stop. watch for time trials in.
a 100 m sPftnt
(d).-meaIre the trials of all competitort for 411 ..1.1e 6/grits scheduled
recess activities then pick his teamfr,
38. ,At some soccer and hockey damps report cards are made out-for+ach boy
dr girl. If these reports are done by an instructor watching a final
scrimmage they -are:
(a) probably not reliable because the instructor can ch one player
for only a few minutes
(b) probably accurate because the instructor is very.
of the, game ;
.
(c) prcbably accurate because all the skins can be
(d) probablyskiir of
accurate because.a student-whe isoieak
the game is probabl4rweak ok strong ine
srgood at the skills
observed in a game
or strong in brie
all of the skills
172
110
.n

,
.
,...
14.9.. Joan is trying to decide which weed killer she should buy.. She dedides
to buy two brands and carry out an experiment to see which is more
.,effective." In a small section of her lawn she sprays brand "X" on fifty
dandelions and brand "Y" onfifty crab grass plants. After one weak
she records her data. .
r,
A Brand "X" Brand "Y"
1. 40/50 dand6lions 1. 35/50 crabgrass,were dying or plants were dying
dead or dead
2. 80% effective 2. 70% effective
From this data Joan should conclude that:
(a) brand "X" is the better weed killer
(b) brand "X" should be used on more dandelions and brand "Y" on more
crab grass because it's hard to,tell which is better0
jc) the.experiment should tie. repeated using brand "X" on the crab grass
. and brand "Y" on the dandelions
(d) the experiment would give more meaningful results if she tried both
./weed, killers on a greater variety of weeds
,... . . 1I. 40. Mary. had just learnedrthat the mass Value of 1 mLof a liquid varied from
liquid to liquid. ,By using a balance to measure mass and a.graduated
cylinder to measure volume, Mary obtained the following data.
Mass of Gasoline Volume of Gasoline Mass/Volume
6.4g . 10.0 mL 0.64 g/mL
When Mary checked in her text book the value given for Opaline was 0.68 g/mL.
Mary Should:.
(a) conclude that her balance wasn't working prbpeily
(b) conclude that the text bobk has printed an error
conclude that her volume measurement was not read correctly
make .no conclusions at this time

.
174
41. Mary had just learned that the mass value of 1 mL of a liquid varied from
liquid to liquid. By using a balance to measure mass and,a graduated
cylinder to measure volume, Mary obtained the following data.
Mass of Gasoline .Volume of Gasoline Mass/Volume
6.4 g 10.0 mL 0.64 g/mL
When Mary checked in her text book-the value given for gasoline was 0.68 g/mL.
Mary decided to'repeat her experiment five more times and asked Joe if he
would do the same experiment with his equipment.' Mary's and Joe's data is
given below.
Mary 1.
2.
3.
4.
5.
Joe 1.
2.
3.
4.
5.1
Average
Mary should:
Maser of Gasoline Volume of Gasoline Mass/Volume
.
6.3 g-
6.5 g6.5 g6.4 g6.4 g
.
6.5 g6.4 g6.4 g6.5 g6.4 g.
6.4 g
10.010.010.0 mL10.0-mi10.0 mL
10.0 mL10.0 mL10.0 mL10.0 mL10.0 mL
10.0 mL
t
-
A
,
0.63 g/mL0.65 g/mL0.65 g/mL0.64 g/mL0.64 g/mL
0.65 g/mL0.64 g/mL0:64 g/mL0.65 g/mL0.64 g/mL
0.64 g/mL
(a) conclude that the te4t-book definitely has pril4ed an error
(b) conclude"that both her and Joe's balance are not working properly
(c). make no conclusions at this time
) conclude that some other"' variable, such as type of gasoline, may be
at. work here 0
42. Allison was trying to decide whether or not a particular insect which
was abundant in her garden oluld'be classifiedwin the same group as.grass-
hoppers. Before making.a decision-she should:, .
.
(a) examine one of-these insects very carefully comparing its structure
r to -that of the grasshopper
(b) examine many of these insects verOcarefully cOmparthg their structure
to that of the grasshopper *
. .
4 ..
.
(c) set up an escape proof terrarium and observe the structure and changes
that occur withseveral'specimens over a period of4time
(d) look for pictures or the insect in a reference book, discover its name,
,then check in aclassification'book to seeif the name appears in the
.
grasshopper group
176 .1

175
43. A grade eight class wished to compare several bands of cained mixed 'nuts.
The best data table would contain:
(a) mass values for each of the different kinds of nuts, both whole and
pieces, for each brand
(b) a count of the total number of nuts found in each can
(O1 a count of the number of each kindlof nut in each Can
(d) mass values for the entire contents of each can
44. Hal wanted to findfind the volume ofwater displacementresults.
Number of Marbles
the volume of one small glass marble. He-decided to
20 similar marbles using a graduated cylinder ane,the
technique then dividing by 20.. Below are Hal's
4tarting Level of'v.-Water in Cylinder
Final Level ofWater in Cylinder
20 25 ML 65 mL
Hal concluded that the volume.of 1 marble was 0.2 g. Do 'you think:
(a) Halshas enough data to find the correct volume of 1 marble
(b) Hal does not have enough data to find the correct yolume of 1 marble
(c) Hal has no used his data correctly to And the volume of 1 marble
,.(d) Hal could have simplified his experiment by placing just 1 marble
in the graduated cylinder and reading the increaseidvolume
45. Examine the diagram of the graduated cylinder
I
.
-1 1. I' q,
,.
,... -.
The correct reading of the level of the water in the graduated cylinder is:.
,
(a) 43.5 mL
(b) 43.0 mL
(c) 42.5 mL-
(d) somewhere betWeen 40 and 45 mL
. /177.
4.
r-.

176
46. When reading a scale in order to obtain a measurement value you usually:'
...,
(a) read to the nearest mark o (n the scale '
(E) estimate 1/2 or 1/4 of the way between the marks on the scale upending
0 on how far apart the marks are
(o) read to the nearest 'printed number on the scale
(d) always round off to whole' numbers
Cs
47. Bob believes that adding fertilizer to a plant makes it grow taller: He
does an experiment to prove this but the results turn out to be somewhat
,'different from what he, expected. What should he do next?,
_la) change his opinion about fertilizer helping, plants to grow
(b) repeat the$experiment andlaccept the results if they show what he
expectsso
(o) decide that something had gone wrong with the experiment and continue
believing that fertilize'rhelps plants to grow
A
(d) repeat the experiment several times and base his opinion on the averages
'result*
(e) repeat the experiment several times and check-his results with some
research material regarding this topic before forming his opinion
48. Shirley had these three measurements of volume to enter on a data sheet:
73.482 m3, 4.7 m3,238.467 m3. Which column would be the best way of
entering this data?
Column A Column B Column C
73.487 m3
'73.5 m3
73.49 m3
4.7 m3
4.7 m3
4.70 m3
238.462 m3
238.5 m3
238.46 m3
(a) column A is the best way of expressing these numerals
(brcofumn B is the best way of expressing these numerals
(c) column C is the best way of expressing these numerals
(d) anyone of these columns is as good as-the other
4
O

177
These two parallel lines were'given by a math teacher for the students to
talk about. They were asked to statejhow they thought the lengths of theseparallel lines compared. Which would be the best way to make the comparison
of length?
(a) by inspection of the parallel lines
(b) measure and'comiare thi lengths of the lines,in cm.
(c) measure and compaie the lengths of the lines in mm
i
a
"fp
(d) by using your pencil to comparetheir lengths
I.? ..
50. When measuring the volume o'f a cube, the most accurate answer would be.
obtained by:\N___.-J,
(a) measuring the length of the sides and using the mathematical formula.V=:LxWxH,
.,
(b) placinglthe cube in a narrow graduated cylinder and measuring theamount that the water rises ,
.
.:. 1
(c).placing the cube in a wide graduated Cylinder and measuring*amount that'the water rises k
.
. 4(d) pacing the cube in a beaker thatii filled to
teasu4ng 'thq amount of water thit overflows...
M
#
s'
. .
I
t
the brim with water anor
$
t
..

rs '178
._ . . , . .
51. Listed below are 3 Setsof descriptions corresponding. to the necessary (----,,,
z'information listed at the Wit. These are htteMpfsliat accurately
describing a particular insect.Jr
Size
Shape
Colour
Tekture
'
Column A Column B
long 5 cm4
long and roundis h,
red and whitepolka-dots.,
rough'
Column C
egg shaped- ,
reddish- orange
with white spots
covered with short,prickly spines
,Mass 1 light . ..5 grams
i..
Attachments %wings and lees 2 setsof wings
c 3 sets of legs
4 . . . . . .
Special Features many hairs on front 2 sets of7antenna
of head .' on head
length of my--
rubber,
11,
balloon shaped
like a red'spotted leopard
slike a raggedsaw blade
,feather weight
similar_ to any
insecto 1
cat likewhiskers onhead
Which column gives the beat sd.ientific description of the insect?'
Circle the letter of,the correct answer:
(a) column A
(b) column B
Sc) column C.
(d) eithei column
Tt. .
6
I.
. 471
o
is adequate
'41
f
` . '''4,,
4'.. . ..p. A
. ' 40 .. . 1, : i. ..
R
1*
0
IIV
ISO
p.
a,

-
52.1. Taul wanted to see,if there was a 'relationship between the,volUMes of
'figures (cube, rectangular solid, cylinder) when the dimensions were
doubled. He.used the following data:
Dimensions-
Cube 2.0 x2.0 x 2.0. 8 cmj,
'Rectangular 1.0 x 2..0 x 3.0 6 Cmj
SolidRadius 2.0
bylinder `Height 3.0,38 cmj
Doubled Dimensions
4:0 X 4.0 x 4.0
.0 x x 6.0. ,
Radius (4.0
Height 6.0
179
New Volume
64 cm3 -
. .
48 cm3
.3300 cm s
4
..:
.Paul found that when the diffien ns were doubled the.
new volume.was 8 times,
the original volume.' What is.the st consideration before stating his ,- - .,,
conclusions:' -, %.
. . ,
Circle the letter of the best, answer.,'
(a) Consider( his data as. correct and write his concluding statement of
relationships. ,m 'a,
. ., .
(b) Check all his figures before writing hisconcluding statement.
:. .
k.A..
(c) Test his findings by using another.set of dimensionl. ,
:. ..
. .
(d) Use many more sets of dimensions before, wrAting'his concluding statement.
.
-53. Lisa wanted .to see If there was'a relationship betwen the areas olf figures
(square, rectangle-, triangle) when ti* dimensions were dipubled. She used
.', the following data: lk
.
2Doubled
. ,
Dimensions Area (cm ) Dimensions New Area (cm2
)
Square 2.0 cm x 2:0 cm , 4.p. .4.0.-vm x 4.0,cm 16 .
, ..
Rectangle 3.0 cm x 4.0 cm 12.0 6.0 cm x8.0 pm' 48,40
i, Triangle s 4.0 ,cm x '5.0 cm. 10.0 ' ; 8.0 cm x 10.0 gm 40,
Lisa found that when the dimensions were doubled the new area was 4 times
that of the origiAl. What would be her best consideration before writing .
her Conclusions? . 2
Circle the letter of the blst answer.
f dimensions before wrtng
a concluding statement. J .o i
. : i
- (a) TeSt her findings Kith man more sets
5
(b).: Accept her findings as correct and wri e her concluding statement.
(c) Check-all her figures .and crlculations for accuracy bdfore'writIng. . . ."
.. .
het conoldsion.. ,0
>...... . . .
(d) Test her finding's by,using_another set of dimensions before writing
her concluding statement.
6
1 S
.

54. Stan and Scott choseto study a colony of'Great Blue Herons that were
nesting on Rice Lake. After one day!'of observations they had accumulated
a number of pages of notes.. Before reporting their findings to the'class
they should do one of the following:
Circle the letter of the best statement.
.
(a) They should check their observation notes over carefully beforewriting their report.
(b) They should invite.some other students to witness their observations.
(c) They should observe the colony many more times before writing theirreport of their findings
(d) They should observe the colony one, more day before writing their final
report.
(e) They should accept their observations as adequate and write their
final report.
55. One day in the 1600's; Jean-Baptiste van,Helmont, a Belgian physician,
wrote a recipe for Producing mice. He said it could be done in '21 days
by putting a dirty shirt and some grains of Wheat in a pot or box, and
Setting this away iq a dark place where would not be disturbed.' He
belieVed that the aftive prindiple in producing the mice was the hunian
perspiration in the shirt. He tried out hi$ recipe many times, and got
mice every time.
There is obviously something wrong with this recipe for producing mice.
What has this physician not done with his,experiment to prove his recipe.
Circle the letter at the statement that You think is the best procedure
to foklow.
(a) Usa the recipe *,.-irith'a clean shiit:
.(b) Have other people try the recipe.
(c) Keep the shirt in a moue - proof' container.
(d) Check his results accurately.
(e) Try his recipe with other clothing. . 1
es
. .
v
x 182,4
181
;
56. Students /n Mr. Green's Science class were each given a piece of paper.
Each students was asked to make a list of the things he or she would want,
to make notes bout or CoMment about when describing some objects that
Mr. Green was 4oing to show them. Before the-students observe the objects
each student should make sure his or hez list is as adequate as possible.
Circle the letter of the best suggestion.
-(a) Each student should check his or her list with a neighbour's list
4 for completeness.
(b) Each student should re-examine and check his or her list for complete-
ness.
(c) Students should master list from all the students suggestions
in the class.
(d) Students should get together in groups to compile complete lists.
57. Four separate groups of students were trying to find the volume of an
,
irregplarly shaped solid by displacing water from a large beaker. The
overflow of water was collected in a graduated cylinder.4
Which one of the statements below describes the way to ensure the most
-accurate result?Circle the letter of the best suggestion.'
-(a) Bach group should repeat the experiment a number of times as carefully
as possible.
(b) Each group could accept their first result if it had been done carefully.
(c) Each group could repeat' the experiment a number of times And average
its "results.
(d) The groups could average the results of a single trial for the final
answer.
(c) Each group could do the gxveriment a number oftimesand average all
the results from all the groups together.
.e*4 .
i.. ,
J 183. , \r'

182
D: RECORDING INFORMATION Intermediate 44
.
Answer Sheet - Version 1
1. Radiation and Heat Absorption (c)
'2. Heat Conduction' (b)
3: Pendulum (d)
4: Thermal Expansion_ 's (a)
5. Goldfish (e)
Answer Sheet - Version 2
Items
1 2 3 4
..
..
.1. Radiation aid Heat Absorption' (iii) (i) (iii) (i)
2. Heat Conduction (iii) (iii) (ii) . (i)
3. P4ndulum (ii) (iii) (iii) (ii)
4. Thermal Expansion(iii) (i) (iii)
5. Goldfish (iii) (i) (iii) (iii)
Notei Students must select, the correct answer for all 4 questions to.
scorecorreap on the item.
Answer. Sheet - Version 3
1. Radiation and lat Absorption
2. Heat Conduction
3. Pendulum
4. Thermal. Expansion
5. Goldfish
4'
See option (c), version 1
.See option. (b), version 1
See optioni,(d), versiori'l
See option a), version 1
See option (e) version 1
P -184
-W-.
.
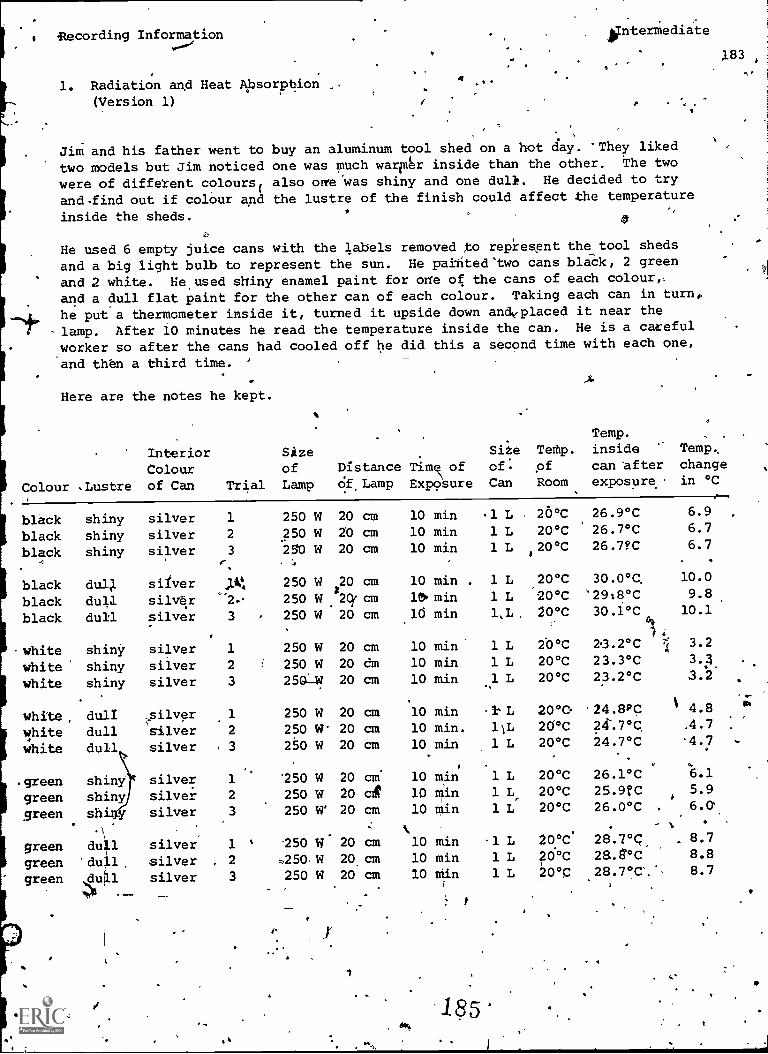
Recording Information intermediate
183
1. Radiation and Heat Absorption(Version 1)
,
Jim and his father went to buy an aluminum tool shed on a hot day. 'They liked
two models but Jim noticed one was mach warlAr inside than the other. The two
were of different colours ( also orre was shiny and one dull. He decided to try
and.find out if colour and the lustre of the finish could affect the temperature
inside the sheds.
He used 6 empty juice cans with the labels removed to rep'resent the tool sheds
and a big light bulb to represent the sun. He painted'two cans black, 2 green
and 2 white. He, used shiny enamel paint for one of the cans of each colour,.
and a dull flat paint for the other can of each colour. Taking each can in turn,
he put a thermometer inside it, turned it upside down andyplaced it near the
lamp. After 10 minutes he read the temperature inside the can. He is a careful
worker so after the cans had cooled off he did this a second time with each one,
and then a third time. '
Here are the notes he kept.
Colour Lustre
InteriorColourof Can Trial
SAzeof Distance Tim of
Lamp Of, Lamp Exposure
SiteofCan
Teti).
ofRoom
.
Temp.insidecanAfterexposure
.
Temp,
changein °C
blackblack
shinyshiny
silversilver
1
2
250 W 20 cm
250 W 20 cm10 min10 min
.1 L
1 L
26°C20°C
26.9°C26.7°C
6.9 ,
6.7
black shiny silver 3 250 W 20 cm 10 min 1 L 20°C 26.7?C 6.7A e
"'
0
blackblack
dull
dull
silver
silver
A2.
250 W 20 cm
250 W12(1, cm
10 min .
le. min
1 L
1 L
20 °C
20°C
30.0 °C,
'29:8°C
10.0
9.8
black dull silver 3 - 250 W 20 cm .10 min 1,L 20°C 30.1°C 10.1
whitewhite
shinyshiny
silver
silver
1
2 1
250 W 20 cm250 W 20 dm
10 min10 min
1 L
1 L
20°C20°C
2.3.2°C ,
23.3°C
3.2
3.3 .
white shiny silver 3 2501.-W 20 cm 10 min 1 L 20°C 23.2°C 3.2
whitewhitewhite
dulldulldull,
?silversilversilver
1
2
. 3
250 W 20 cm250 lig' 20 cm250 W 20 cm
10 min10 min.
10 min
- l' L
1\1,
1 L
20°C20°C20°C
24.8PC %
24.7°C,
24.7°C
4.8.4.7
'4.7 ..
.
.7"
.green shiny silver 1 '250 W 20 cm. 10 min 1 L 20°C 26.1°C 6.1
green shiny silver 2 250 W 20 ci 10 min 1 L,
20°C 25.9fC 5.9
green sh. silver 3 250 W' 20 cm 10 Min 1 L 20°C 26.0°C . 6.0
green silver 1 ' '250 W 20 cm 10 min 1 L 20°C 28.7 °C, . 8.7
green 'du 1. silver 2 W 20 cm 10 min 1 L 20°C 28. °C 8.8
green dull14'
silver 3 250 W 20 cm 10 min 1 L 20°C 28.7°C,', 8.7
y
185o
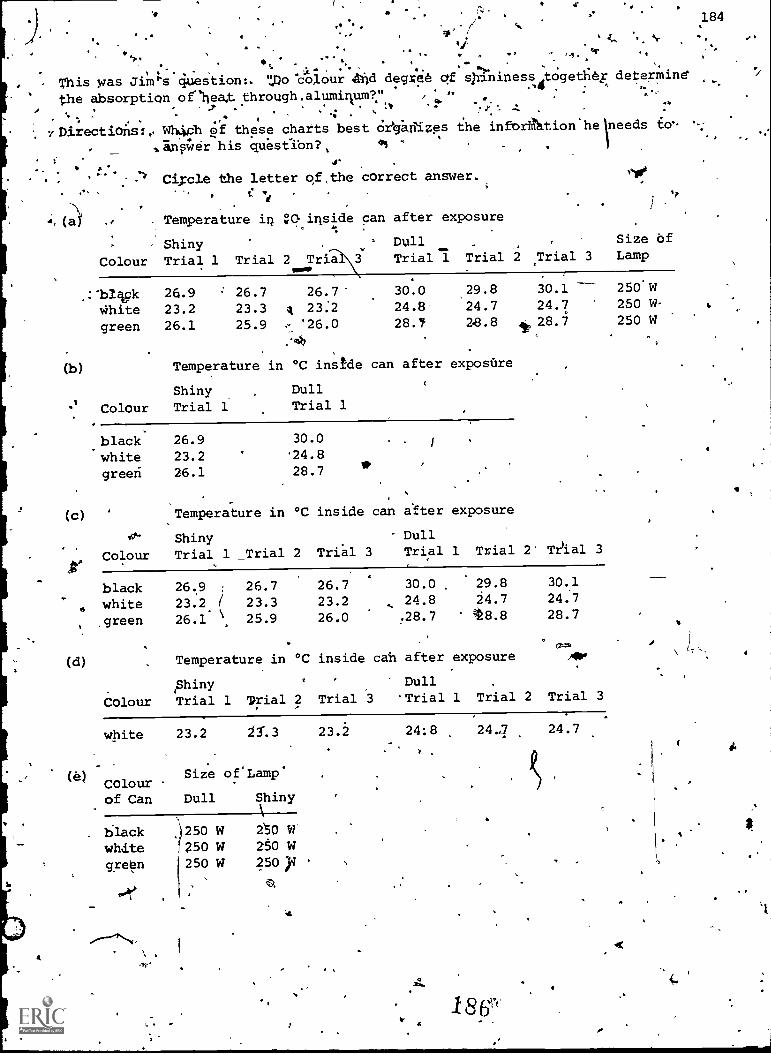
Y. ..
4 a -... ''.4
.1'
io
ow . - /. C..
.
', 5 ,
r n L .. .i.
9,,, . .. , . " ,4. tr.
r. 4
..
o
colour.4 ' 4 14.1. .
This was Jim"s question:. 'moo colour Awl degree cif shininess togetlie determine'. the absorption orheat through.alumiqum?" /.
. I ^ '0 . ' . V . r
.! .
, .
varectiofist, Whjsh ot these charts best OxVailizps the inforill.htion*he 1needs to--
1.5.4Wer his questlbn?, oi
4. . I.
''. Circle the letter of correct answer.:1'
pile
. ...
..
(a)
(b)
C ,a,
Temperature i4 iriside can after exposure
- , Shiny ° Dull Size of
Colour Trial 1 Trial 2 Tria Trial 1 Trial 2 Trial 3 Lamp
..:lbliFk 26.9 ' 26.7 26.7 30.0 29.8.
30.1 250*W
white 23.2 23.3 A 23:2 24.8 24.7 24.7 250 W-
green 26.1 25.9 ..- '26.0 28. 2.8.8 ir 28.7 250 W
.4,
Temperature in °C inside can after exposure
Shiny Dull
Colour Trial 1 Trial 1
black
green
26.9
23.2
26.1
30.0
'24.8
28.7
(c) Temperature in °C inside can after exposure
Colour
ShinyTrial 1 _Trial 2 Tri*al 3
DullTrial 1 Trial 2' Trlial 3
black 26.9 26.7 26.7 30.0 29.8 30.1
6 white 23.2 ( 23.3 23.2 24.8 24.7 24.7
green 26.1 \. 25.9 26.0 .28.7 t8.8 28.7
mm
(d) Temperature in °C inside cah after exposure Asp
Shiny Dull
Colour Trial 1 Trial 2 Trial 3 'Trial 1 Trial 2 Trial 3
white 23.2 23.3 23.2
(e)Colour
Size of'Lamp.
of Can Dull Shiny
black 250 W 250 W
white 250 W 250 W
green 250 W ;soy
-are
0.
24:8
.
24.,7 24.7
a.
1861,
4.
184

.
. 4
Recording Information
b... 41. .
Radiation and Absorption
(Version 2) :
Intermediate .
185
Jim and hisqather went totwoModels but.Jim,noticedw e of different' colours,
an find out cif colour and
inside the-sheds.
buy an aluminum tool shed on a hot day. They liked
one was much warmer inside than the other. The two
also one was shiny and one dull. He decided to try
the lustre of the finish could affeamperature
He used 6 empty juice-ans. with the labels removed to represent the tool sheds
and a big light bulb to represent the sun. He painted two cans black, 2 green
and 2. whtte:. He.uied shirly enamel paint for one, of the cans of each colour,
and a dull il'at paint for the other can of each colour.- Taking each can in turn,
he put a thermometer inside it, turned it upside down and placea it near the
lamp. After 10 minutes he read the temperature inside the can. He is a'careful
worker so aft.q the cans had cooled off he did this a second time with each one,
and then a third time.
Here are the .notes' he kept.°
- Temp.,
Interior , Size , Size Temp. inside Temp..
,.
$ Colaiir .. of ;Distance Time of of of can after chInge 1
.
Colour Lustre .9f;a.w1,. -Txial% Lamp of Lamp Exposure Can Room exposure in °C
a
lack shiny silv6r,- 1 250 W 20 cm 10 min
black .shiny :-silve'r 2 250 W 20 cm 10 min
black shiny silver 3 2.0 W 20 cm 10 min-g ,. . o,
black dull silver 250 W 20 cm' 10 min
'black dull silver 2 , 250 W 20 cm 10 min
black 4u11 silver ,e' 3 250 W- 20 'gym 10 min
-white shiny silver 1 "
white shiny silver
white shiny silver e °3
white dull silver .1
white dull silver 2
White dull silver.' 3.
green shiny silver 1
green shiny silver 2
.green shiny silver ,3
green dill silver
green dull silver
-green dull silver
IV
1.
2
3
1 L 20°C
1 L 20°C1 L 20°C
26.9°C26.7°C26.7°C
6.96.76.7'
1 L 20°C 30.0°C
1 L 20°C 29.8°C '
1 L 20 °C 30.1°C , 10.1
250 W 20 cm -10 min'' 1 L 20°C
'° 250 W '20'cm .10 min 1 L 20°C
. .256-W 20 611. min 1 L .20°Xt
23.2°C 3.2
23.3°S. 3.3
23.2°C 3.2
250,(W: 20 cm 10 min 1 L 20°C 24.8°C " 4.8-
. , 2.517.$ 20 cm min -1 L., 20°C 24.7°C 4.7,
2p0 W 20 at 1Gmin L 20°C 24.7°C
V
250 W 2Q.ci 7 io min 1 L.,. 20°C 26.1gC
250 W,."-'20.cm,41, 40,4 L. 2,0 °C 25.9°c 5.9
250j 20 cm 10 "min 1 L '20°C 26.0°C .6.0
250 W 20 ctr-,.' 101 min L 20°C 28.7°
250 W 20 CM .0 Min 1 L 20°C 28.8°
250 W 20 cm 10 min L. 20 °C 10.7°Cf ° .°'\ "t
187.
8.7 -

tr.
Id
This was Jim's question: "Do colour and degree.of shininess t9getherdetermine
the absorption of heat through aluminum?" 4 -
He made up this chart toorganize the information he needed-to answer it.
dolour
black (s)',
white (t)4
green (u)
Temperature in °C inside can
ShinyTrial 1
(a)
(g)
(m)
after exposure
Dull
Trial 2 Trial 3 Trial 1 Trial 2
(b) (c) (d) (e). .
(h) (i) (j$ (k)
(n) (0) 1p) (q)
1. How ,should he reaord the; information that the
Circle the number of the correct answer. -
(i) Put 250 Win spa es
(ii) Put 250 W in spac
(iii)' Leave it out:go.
(iv) Make up a new 'space
2.4 How should he record the,fadt that
(a) to (r).
S (S),. (t) apd (u).
lamp was 250 W?4
for the inkdrmation.--:
the temperature reached 26.9°C in the
shiny black can on the 1st trial?
Circle the
a.
t.0
186
4.
4
number ottbe corredtKanswIrt
space .(a):'.
.,
`(i) Put 26.9°C in
"4;(ii) Put26.9 ft in
(iii) 'Leave it out:
space (d)., .
s
Make up a new-space for the inforMation.
3. How shoulddull white
Circle the
(1), Put
r . e 0
he record the fact ttlapithe temperature changed 4.8°C
can on, the 1st irittyt .
.
4. ', 4 4' A .
.
number of the!correct answer.G
,.
. i..-
4.geC in space (j).,... . ,
(1)*.ail. Put 4.8°L'in.space
. (i4.) Leave it Ou't.
,a
. a (iv) Make up a 1141 tce fogS.
.. 4, ..1., oi 0 ''
4." HOw should he record theT1emperatures reafted in the shiny green can?,
,
,'0.
nformation.
Al
in the,
1;
',C1xcle.fthe ;lumber of tbe-cortd6t answer: 1,*°
f.
(1) ,Put 26-.1,c)q,( 26.9 °C and 26.0 °C in spices., Nos, (it') and (e) .
Put 28.1,7°C,i28:8C and' 28,.7°8 ;spaces 1*(Jd at'ids'.(o) .
-
. (iii) Leave tilem
(iv) Make up new spaces for_theinforMation. -.1:
188

, -Recording - Information
* l
Intermediate
1037
1. Radiation and Heat Absorption, !...-
..
*(Ver'sion 3J I .
- .'
.
, ..
.,..
. .*
.
Jim and his father went to buy an aluminum tool shed ono. hot nay'. They 14ced
two models but'Jit noticed one was much carmer inside than the other. The twor
.wereof different colours, also one was shiny and one dull: Hedecided to try
and fjind'out if colour and the lustre of the finish cquld affect the temperature
inside the sheds ., . .0 .
.. -.
t
He useeg'emp4 juice cal'IsOitVthe labels remevedtAo,represent-the tool sheds.. ef
and big light bulb to; represent the sun. He painted two -cans black, 2 green
end 2 white He used -shiny enamel pAnt for one of the cans of each colour,
and asidill flat paint for theother,can of each colour. Taking each can in turn,,,
he put a thermometer inside it, turned it upside down and placed -hear the--- .--
lamp. After 10 minutes he read the trperatureinside'the can.' He is a careful '.
worker so after the cans had cooked off he did this a second time with each one,
- and then a third time.
Here are the notes he kept.
Colubr Lustre
',lack shiny...lack shinyblack.. shiny
.
black dull-
black dull
black dull
white shiny
'white' shiny
white shiny
white dull
White dull
white dull
ghen"Shinygreen shiny
green -shiny1
)
green dull
green ddll i
green dull
`Temp.
Interior Size. Size Temp. 'inside Temp.
Colour of Distance Time of of . 'of can.after change
of can Trial Lamp of Lamp Exposure Can Room exposure in °C
silver 1 250 W 20 cm 10 min 1 L 20°C 26.9°C . 6.9
silvers 2 250 W. 20,cm 10 min . 1 L' 20°C 26.7°C 6.7
silver 3 250 W 204m 10 min 1 L 20°C 26.7°C 6;7
.
..
silver, 1 250 W 20 cm 10 min 1 L 20°C 30.0°C 10.0
silver 2 250 W 20 cm 1G min 1 L 20°C 29,8°C 9.8
silver 3 250 W '20 cm. 10 min 1 L 20°C 30.1°C 10.1
, 8
silver 1 /250 W, 20 cm 10 min l''L 20°C *23.2°C 3.2
silver 2 250 W 20 cm 10 min 1 L 20°C 23.3°C 3.3
silver 3 250 W 20 cm 10 min 1 L 20°C 23.2°C 3.2
,
silver 1 250 W 20 cm 10 min 1 L. 20°C 24.8C 4.8
silver 2 250 W 20.cM 10 min l'L 20°C 24.7dC.
4./
silver 3 250 W 20 cm 10 min 1 L 20°C 24.7 °C 4.7
silver .1 250 W 20 cm 10 min 1 L 20°C 26.1°C , 6.1
silver 2 25G W 20 cm 10 min 1 L 20°C 25.9°C 5.9
silver 3 250 W 20 cm 10 min 1 L 20°d 26.0°C 6.0
1 '
silver 1 250 W 20 cm 10 min 1 L 0.5'C 28.7°C 8.7
silver 2 250 W_ 20 cm * 10 min 1 L 20°C* 28.8°C *8.8
silver 3 250',14 20 cm 10 min 1 L 20°C' 28.7°C 8.7
. -
- .
. . ' .o
., x :
-.,, vit. "...., ,.. .
..
. ..:1 8. 9 0'
AO.

t
"4.'- eThis was Jip's question: "DO colour.and degree of shininess together determine
the absorption of heat thrOugh alumifium?",
Directions: Use the information .to fill 'in, this chArt so be can answer his
question.
Add more rows*or columns if.ybu need them.
Temperature in 0C inside can aftei exposure
Shiny Dull4
Colour Trial 1 Trial 2 'Trial 3 Trial 1 ,Trial 2 Trial 3I
dl
*"
a
4
0
fe
190
O
1
V
188
e
4

. ., 189
.. .
, .
Recording Information , , intermediate-.
2. Heat Conduction(Version 1)
t
Supp6se youwanted'to find out whether he as conducted better through
one kind of cooking pot than another. You found 4 flat-bottomed pots, two'
of alvminum and two of'copper. Two of the pots, pne of each metal," were2 mm thick.on the bottom and the other 2 were just 1 mm thick. You had
rfoufhotplates with*equal purners. You filled -each pot with the same amount
.and tiperature of water and placed each on one of the burners. YOu put a
floating thermometer in each pot. Then you turned on all the burners atthe same time and watched them carefully, measuring the time it took thewater to reach 100°C. You didall this three times, using fresh water inthe pots each time and waiting between trials fOr-the burners to cool down.
Here, is the information you collected.
-Metalof Pot
Thicknessofbottom
Diameterof pot
Temperatureof water atbeginning
AmountofWater Trial
aluminum 1 mm 12 cm 10°C 1 L 1
aluminum 1' mm . 12 cm 10°C .1 L 2
alumipuM 1 mm 12 cm 10°C 1 L 3
4aminuai 2 mm 12 cm 110fC 1 L 1
aluminum 2 mm 12 cm 10°C 1 L 2
aluminum 1 2 mm 12 cm 10°C 1 L %
copper 1 mm 12.cm . 10°C 1 L 1
copper 1 mm 12 cm 10°C 1 L 2
, copper 1 mm, 12 cm. -10°C 1 L
4
copper' 2 mm 12 cm 10°C 1 L .1
cdpper. 2 mm 12 cm 10°C 1 L' 2
copper 2 mm 12 cm 10°C 4' 1 L. 3
Time Time tobetween reachtrials 100°C
0 6 min 5 s
5 min 5 Min 59 s"
5 min 5 min 40 s
0 8 min 6 s
5 min 7 min 53 s
5 min 7 min 48 s
'-'0 5 min 2 s
5 min 4.min 56 s
I 5 min 4 min 30 s
0 7 min 6 s
5 min 6 min 50 s5 6 min 30 s
Your q uestion is: Do metal type or thickness together determine heat conduction?
'%Directions4 gWhich of th se charts best 9rganizes the information'you n edto
answer yourquestion?°
Circle the letter of the best answer.
I
(d) 1 *. Time\
to Re#ch 100°C,
- Thickness
.., Metal of, Pot '1 an 2 mm
aluminum 6 minI
5 s min" s
copper - ,5 min2 s 7 min 6 s
in

Mme TrItgacirT170%"' 'mem' MEM 111.MW
,>
WI!
Thickness
mm 0. 2 nun
Metal of Pot T5ial 1 irial.2 Trial 3- Trial 1. Trial 2 Trial 3'
(c)
aluminum
copper
6 min 5 s 5 min 59 s, 5 min-40 d' 8 min 6 s 7 min 53 s 7 min 48 s
5 min 2 s 4min 56 s 4,min 30 s. 7 min 6 s 6 min 50 s 6 min 30 s
Time to Reach 100°C
Thickness .`1
mm *
2 mm
Metal of Pot Trial 1 TLal 2 Trial 3 "- =Tria1.1 Trial 2 Triai'3
aluminum 6 min 5 s 5 min 59 s. 5'min 40's g/min 6 s 7 nip 54,s. 7 min 48 s
(d)
(e)
Metal"of yot
0'
A
Time Between Triali
Thickness
1 ram.2 mm
.
Metal of Pot Trial 1 . Trial 2 TrVkl Thal 1 Trial 2. Trial 3
aluminum 0 5 min 5 min 0 -5 min, ; 5,min
copper 0 4. 5 min 5 min 0 5, min 5 'min.._
.,../
Time:To Reach 100°C
Thickness'
1 mm,w
Trial 1 Trial 2 Tkial 1 Trial, 2 Trial 3
2 Dm
si"
Time Between Trials
Emir .111111115 mmmm1 I
190
flf
Thickness3
1 mm 2 rmn.19,
Trial Trial Trial '. Trial Trial Trii
°1 2 3 1' 2 3
, . , .
aluminum, 6 s 5 min 59 s '5 min 40 s 8'miri 6 s min 53 s 7 min 48 s 0min -I,
5 min 5 min. 5 min 5 mil*if
.,,, , .
%
.
.
. -
L copper 5 min 2 s 4inin, 56 s 4'min 30.il 7,min 6 s, 6 min 50 ti 6 min 30 s 0,
5 min 5 min , 0 5 min 5 mil
- ,.,
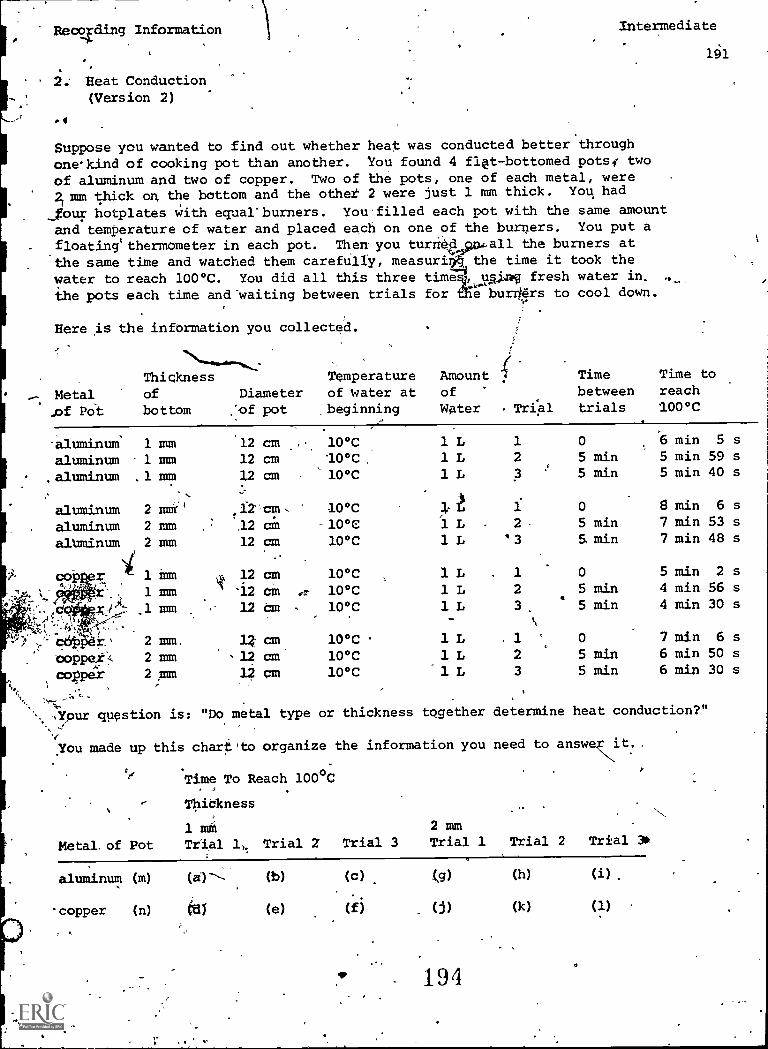
Recoding Information
.
2: Heat Conduction(Version 2)
Intermediate
Suppose you wanted to find out whether heat was conducted better throughonekind of cooking pot than another. You found 4 flat-bottomed pots*, two
of aluminum and two of copper. Two of the pots, one of each metal, were
2 mm thick or the bottom and the other 2 were just 1 mm thick. You had
_tour hotplates With equal-burners. You filled each pot with the same amountand temperature of water and placed each on one of the burners. You put a
floating` thermometer in each pot. Then you turrie6,590A all the burners at
the same time and watched them carefully, measuriOlathe time it took thewater to reach 100°C. You did all this three time Imiarg fresh water in.
F*".'the pots each time and-waiting between trials for e burriers to cool down.
Here is the information you collected.i
,
<,
N-.................
Thickness
-% Metal of Diameter
_of POt bottom :of pot
aluminum 1 mm 12 cm ,.
aluminum 1 mm 12 cm
aluminum .1 mm 12 cm.-,-
aluminum 2 rani' ' ff2ram,
aluminum 2 mm A2 cmalbminum 2 mm 12 cm
,
1 mm st, 12 cm1
'!..:',1 mm -12 Cm fr
A- 1 12mm .- cm.i-',;,:.,
,,,r., :-( ..
.. , 2 mm. 1/ cm,,
oopper 2 mm -12 cmA. s
copper 2 .mrn 12 cms - ,
191
.
Temperature Amount c Time Time to
of water at of,
between reach
beginning Water Trial trials 100°C
.
10°C 1 L 1 0 6 min 5 s
10°C 1 L 2 5 min 5 min 59 s
10°C 1 L 3 5 min 5 min 40 s
10°C 3 t 1 0 8 min 6 s
10 °C 1 L 2 5 min 7 min 53 s
10°C 1 L '3 5. min 7 min 48 s
10°C 1 L . 1 0 5 min 2 s
10°C 1 L 2*
5 min 4 min 56 s
10°C 1 L 3 5 min 4 min 30 s
10°C 1 L 1 0 7 min 6 s
10°C 1 L 2 5 min 6 min 50 s
10°C 1 L 3 5 min 6 min 30 s
.'Your question is: "Do metal type or thickness together determine heat conduction?"
You made up this chart)to organize the information you need to answeNit..
Time To Reach 100°C
ThiCkness
1 mitt 2 mm
Metal. of Pot Trial l,, Trial 2 Trial 3 Trial 1 Trial 2 Trial 3
aluminum (m) (a")---- (b) (c) (g) (h) (i)
-copper (n) 631 (e) (f) . (j) (k) (1)
194

192
1. How should you record the informatiori that the water was 10°C at the
beginning of the 1st trial in the 1 mm thick aluminum pol?
Circle the number of the correct answer.
(i) Put 10°C in spade (a).
(ii) Put 10°C in spaces ( ) to (1).
(iii) Leave it out.
(iv) Make up a new space for the informatiop.
N
2. How should you record the times between trials for the 2 mm thick copper
pot?0
Circle the number of the correct answer.
(i) Put 0, 5 min and 5 min in spaces (j), (k)and (1).
(ii) Put -0, 5 min aild 5 min in spaces (d), (e) and (f) and also in spaced
(j), (k) and (1):
(iii) Leave them out.
(iv) Make up new spaces for the information.
3. How should you record the information that on the 3rd trial the 2 mm thick
copper pot took 6 min 30 s to reach 100°C?
Circle*the number of the correct answer.
(i) Put 6 min 30 s in space (j).
(ii) Put 6 min 30 s in spice (1).
(iii) ,Leave it out.
(iv) - Make up a new space for the information.
4. How should you record the times taken to reach J00°C by the 1 mm thick.
aluminum pot?
the number of the correct answer.
Put the times taken in spaces
Put the times taken in spaces
Leave them out.
(a), (b) and (c).
(a) , (e) and (f).
(iv) Make up new spaces for the information.
. 0 195

Recording Information' Intermediate
193
2. Heat Conduction(Version 3).
e
Suppose you wanted to find out whether heat was conducted better through
one kindof cooking pot than another. You found 4 flat- bottomed pots, two
of aluminum land two of copper. Two of the pots, one of each metal, were2 mm thick on the bottom and the other 2 were just 1 mm thick.' You had
four hotplates with equal burners. You filled each pot with the,same amount
and temperature of water and placed eaciNns one of the burners. 'You put.a
floating thermometer'in each pot. Then you turned on all the burners. at
,the same time and watched them car4fully, measuring the time it took the
water to reach 100°C. You did all this three times, using fresh water inthe pots each time and waiting between trials for the burners to cool down.
Here is the information you collected..
Metalof Pot
Thicknessofbottom
Diameterof pot
Temperatureof water atbeginning
AmountofWater Trial
Timebetwe'en
trials
Time toreach100°C,
1aluminum 1 mm 12 cm 10°C 1 L 1 0 6 min 5 s
aluminum 1 mm 12 cm 10°C 1.1., 2 5 min 5 min 59 s
aluminum 1 mm 12 cm 10°C 01 L 3 5 min 5 min 40 s
aluminum 2 mm 12,cm - 10°C 1 L 1 0 8 min 6 s.
aluminum 2 min 12 cm 10°C 1 L 2 5 min. 7 min 53 s
-aluminum 2 mm 12 am. 10°C 1 L 3 5 min 7 Min 48 s
copper 1 mm 2 cm . 10°C 1 L 1 0 5 min 2 s
copper 1 Mm 12 cm 10°C 1 L 2 5 min 4 min 56 ss
copper..
1 mm 12 cm ' 10°C 1L 3 5 min 4 min 30-s
$
copper 2 mm : 12 cm 10°C 1,L 1 0 7 min 6 s
copper 2 mm 12 can 10°C 1 L 2 5 min 6 min 50 s
copper 2 mm 12 cm 10°C 1 L 3 5 min 6 min 30 s
Your question is: "Do metal type orthickness together determine heat conduttion?"
Directions: Use thee information to fill in this chart so you can answer your
question.
Add afore rows or'columns if you need them.
Time to Reach 100°C
Thickness
1 mm 2 mm
tal of Pot 'Trial 1 Trial 2 Trial 3 Tiiai 1 Trial'2 Trial 3
num
copper
196 .

Recording Information,
3. Pendulumfivers ion 1) C
elk
Intermediate
To study how a grandfather clock works the class made a,pendulum. They used
a string, attached to the edge of a table, for an arm and attached,a weight ,.
for a bob. They selected 2 different strings of 10 cm and 30 cm in length
and 3 different masses of bob (1 g, 5 g and 10 g). They measured the period
(the time it takes for the pendulum to move through its arc) for each arm
length and mass combination. They made 3 measurements for each. Everything
else, such as starting the swing from the same point, was kept the same for
each test.
Here is the information they collected.. -
Lengthof'arm
4
Hagsof bob Trial
Periodin seconds
Height (of bob
from floor atbeginning ofswing
Metalof bob
ShapeOf bob
10 cm 3, g 1 .6 1 m aluminum. round
10 cm 1 g 2 .7 1 m aluminum round
10 cm
10 cm
1 g
5 g.
3
1 (
.6
.6
1 m,1 m
aluminum,
_copper
round
round
10 cm 5 g, 2 .6 1 m copper round
10 cm' 5 g_ 3 .6 1 m copper round
10 cm 10 "g 1 .7 1 mi
iron round
10 cm' 10 g 2 .7 , / 1 m ifon round
10 cm 10 g 3 .6 1 m iron round
30 cm 1 g 1 1.6 1 m aluminum round
30 cm 1 4 2 1.5 1 m aluminum round
30 cm 1 g' 3 1.6 1 m aluminum round
30 cm 5 g 1 1.5 1 m copper round
30 cm 5 g 2 1.5 1 m copper round
30 cm 5 g 3, 1.6 1 m copper round
30 .cm lb g 1 1.6 1 m iron round
30 cm 10`g 2 1.6 1 m iron , round
30 cm 10 Tg 3 1.5 1 m iron round
197
194
ti

a-
Aj
Their question is: "Do arm length and_mas6 of the bpb together determine the
period of a pendulum?"
Directions: Which of these charts best organizes the information yob needto answer your question.
Circle the letter of the correct answer.
(a)
'(b)
Period in Seconds
Length of Arm
Mass of Bob 10 cal 30 cm
1 g .6 1.6
5 g: .6 1.5
10 g .7
Period in Seconds
Length of Arm
10 rm 30 cm 4
3
Mass of Bob,, Trial 1 Trial 2 Trial 3 Trial 1 1Trial 2 Trial 3
5 g .6 .6 .6 1.5 - , 1.5 1.6
(c) Mass of Bob Mdalt of Bob
(d)
1 g aluminum
5 g copper
10 g. iron
Period in Seconds-,
Length of Arm
Mass of Bob
10 cm
Trial 1 Trial 2 Trial 3
1 g .6 .7 .6A
5 g A .6 .6
10 g .7 ,7* .6 '
Period in Seconds
Length of Arm
10 cm
30 cm
Trial 1 Trial 2 Trial 3.
1.6 1.5 1.6
1'.5 1.5 1.6
1.6 1.6 1.5
30 cm
195
Masi of Bob Trial 1, Trial 2 Trial 3 Trial 1 Trial 2 Trial 3 Metal,of Bob
1.
1 g .6 .7 .6
5 g .6 :6 .610 g .7 . .7 .6
A.,
1.6 1.5,,
1.6
1.5 1.5 1.6
1.6 , 1.6 . 1.5
198
aluminum
,copper
"iron

Recording InforMation Intermediate
196
3. Pendulum(Version 2)
To study how .a grandfather clock works the class made a pendulunk:j They used
a string, attached to the edge of a table, for an arm and attached a weight
for a bob. They telected'2 different strings' of 10 cm and 30 cm in length
and 3 different masses of bob (1 g, 5 g and 10 g). They measured the period
(the time it takes for the pendulum to move through its arc) for each arm
"°1.ength and mass combination. They made 3 measurements for each. Everything
else, such as starting the swing from the same point, was kept the same for
each test.
Here is the information they collected.
Lengthof arm
Massof bob Trial
Periodin seconds
Height of bobfrom floor atbeginning of.swing
Metalof 3100
Shape -'. ',
of bob
)
10 cm 1 g 1 .6 1 m aluminum found
10 cm 1g 2 ..7 1 m aluminum round
10 cm 1g- 3 .6 1 m aluminum round
.
10 cm 5,g 1 .6 ' 1 m.copper round
4 10 cm 5 g° 2 : .6 1 m copper round
10 cm '5 g 3 .6 1 m copper round
..
10 cm 10 g 1 .7 l'm iron round
10 cm 10 g 2 .7 1 m iron' round
10 cm 10 g 3 .6 1 m iron round
1
30 cm 1 g 1 1.6 1 m aluminum round
30 cm .1 g 2 1.5 1 m , aluminum round
30 cm 1 gt 3 -1.6 1 m aluminum round
30 cm 5 g 1. 1.5 1 in,
copper round
30 cm 5 g 2 1.5 1 m copper round
30 cm 5 g 3.* 1.6 1 m copper round
30 cm 10 g '1 1.6 1 m iron round
30 cm 10 g 2 1.6 1 mt
iron round .
30 cm 10 g 3 1.5 1 m iron round
199

Their question is: arm:length and mass of the bob together determine theperiod, of the pendulum ?" -)
They made up this chart to organize the information they needed to answer it.k.
Period in Seconds
Length of Arm
10 cm 30 cmMass of bob Trial 1 Trial 2 Trial 3 Trial 1 Trial 2 Trial 3
,
1.g (s) ''' (a) (b) (c) . (d) (e) ( f )
0
'5 g (t) (g) (h) (i) (j) . (k) (1)
10 g (u) (m) . (n) .(o) '(p) (q) (r)
1. How should they record the periods of the 30 cm arm with a 10 g bob?
Circle the number of the correct answer.
(i) Put the periods in spaces (j), (k) and (1).
(ii) "Put the periods in spaces (p), (q) and (r).
(iii) Leave it out.'
(iv) Make up new spacesjfor the'information.
N2. How should they record the information about the metal of the bobs?
3.
Circle thenuMber of the correct answer..
. 4
(i).. Put this information in spaces (s), NI and (u)
(ii) Put this 'information spaces'4a) to (r).
(iii) Leave it out.
Aiv) Make tip new spaces for the information.
.197
How should they record the fact that the height of the bob at the beginningof the swing was always 1 m?
Circle the number of the correct answer.
(i) Put 1 m in each of the spaces (s), (t) and (u).
(ii) 'Put 1 h in each of the spaces (a) to (r).
(iii) Leave it out:
(iv) Make up new spaces for the information.
4. How should they record the fact that the 3rd trial Period of the 5 g bob ona 10 cm arm was .6 seconds?
Circle the number of the correct answer.,
(i) Put .6 seconds in space (c).
(ii) Put .6 seconds in space (i).
(iii) Leave it out.
(iv) Make up a new space for the information.
x'00
164

Recording Information Intermediate
3. PendulumVersion 3)
To study how a grandfather'clock works tile class made a pendulum: They used
- a, string, attached to the edge of a table, for anarm and attached a weight
'for a bob. They selected 2 different strings of 10 cm and.30 cm in length
and 3 different masses of bOb '(1 g, 5 g and 10 g). They measured the period
(the time it takes for the pendulum to move through its.arc) for each arm
length and mass combination. They made 3 measurements for each. Everything
els, such a6 starting the swing from the same point, was kept the same for
each test.
Here is the infoimation they collected..
Height of-bobfrom floor at
Length 'Mass ' Period beginning o1P- i Metal Shape
of arm of bob Trial in seconds swing of..
bob of bob
10 cm 1 g
10 an 1 g
10 cm 1 g
.10 cm, 5 g
10 cm 5 g
10 cm .5 g
10 cri 10 g
10 cm 10 g
10 cm 10 g
30 cm 1 g
30 cm 1 g
30 cm 1 gt
30 cm 5 g
30 cm 5 g
30 cm 5 g
30 an '10 g
30 an . 10 g
30 an 10 g
1 .6 1 m aluminum round
2 .7 1 m aluminum round
3 .6 1 m aluminum round
1 .6 1 a copper round
-2 .6 1 m.
copper , round
3 .6 1 Til 'copper round
(1 .7 1 m 'iron round
2 , .7 1 m iron round
3 .6 1 m iron- round
1 1.6 1 m aluminum round
2 1.5 1 m aluminum round
3 1.6 , 1 m aluminum round
.1
1 t ; 1.5 1 m copper round
2 1.5 1 in copper ' round
, 3. 1.6 '. , 1 in copper round
1.
t1.6 1 m iron round
2 1.6 1 m iron , round
3 ' 1.5 1 a iron round '
201
198

Their question is: "Do arm length Iand mass of the bob together determine the
periodsof the pendulum?"
Directions: Use the information to fill in this chart so they can answer
their question.
,Add more rows or columns if you need them.
Period in Seconds
Length of Arm
10 cm 30 cm
Mass of Bob Trial 1 Trial 2 Trial 3 Trial 1 Trial 2 Trial 3
1 g
5 g°
10.g
. - -
202
199

Recording Information
4. Thermal Expansion(Version 1)
Intermediate
.Some students had noticed that when water is heated it expands (fills more
space). They wondered if different liquids did the same thing. They ,put
-different liquids in a thin graduated cylinder. Then theYheated water in
a pan to a measured temperature and placed'the tube upright in the pan for
5 minutes..
They used water, an acid solution (vinegar) and tlpagar solution (coca-cola).for the liquids. They hdated the waterVin the OK first to 3O °C and tested
3 -samples of each liquid at that temperature. Then they heated the water
to and tested 3 more samples of each liquid.
Here is the infprmation they collected.
200
Amountofwaterin pan Liquid
Temperatureof waterin pan
Sample*
number
Inside' Volumediameter of boldof cylinder liquid
Volumeofheatedliquid'
Increase '
in = Atmospheri:
volume _pressure
1 la,. water .30°C 1 1Q mm 40 mL 44.2 mL 4.2 mL -102 kPa
1 L water 30°C 2 10 mm 40 mL 44.3 mL 4.3 mL 102,kpa
1 L water 30°C 3 10 mm 40 mL 44.1 mL 4.1 mL 102 kPa
,1 L ** water 90°C 1/ 10 mm 40 mL 45.7 mL 5.7 mL 102 kPa'
L o water: 90°C 2 10.mm 40 mL 45.6 mL 5.6'mL 102 kPa
1 L water ) 90°C 3 10 mm 40 mL 45.6 mL 5.6 mL 102 kPa. .
1`L vinegar 30°C 1,0 mm 40 mL 45.8 mL mL 1o12 kPa
1 L vinegar 30°C 2 10 mm 40 mL 45.6 mL 5.6 mL 102 kPa
1 L vinegar. -
30°C. 3 10 mm 40 mL 45.9 mL 5.9 mL 102 kpa
-1 L vinegar 90°C 1 10 mm 40 mL 47.1 mL' 7:1 mL 102 'kPa
1 L vinegar 90°C 2 10 mm - 40 mL.e
47.3 mL 7.3 mL 102 kPa
1 L vinegar 90 °C 3.
-10 mm 40 mL 47.2 mL 7.2 anL 102 kPa
1 L coca-cola 3Cosi 1 10 mm 40 mL 48.8 mL .8.8 mL 1Q kPa-
1 L coca -Cola 30°C 2 10 ram'' 40 mL 49.0 mL 9.0 mL*102 kPa
,11I;
1 L1 L '
coca-cola,
coca-folacoca-ola
30°C
'90°C
90°C
3.
2'
,10
10 NA'10 mm
A
40 mL
40 la,
40 mL
48.8 mL
50.1 mL50.1 mL
8.8mL 102 kPa
mL 102 kPa
r5..1 mL 102 kPa
1 Boca -Cola 40°C 3 10 mm 40 mL 50.2 mL 10.2 mL 102%xpa-
1".
203
Ir '

201
Their question. is: "Do liquid type and the_ temperature to 'whidh they are
heated together determine amount of,expansion of a liquid?".
Directions: Which of these charts, or4anize'best the inforMation they need'.to nswer their questions?
Nil'
Ci le the letter of the best answer.
(a) -Amount of Expansion in mL
Temperaeure: 30°C- Temperature: 90°C
Liquid 'Sample 1 Sample.,2 Sample '3 Sample 1 Sample 2 Sample, 3
water 4.3 4.1 5.7 5.6 5.6
vinegar 5.8 5.6 5.9 7.1 7.3 7.r
coca-cola 8.8 810' 8.8, 10.1 10.1 10.2
Amount of Expansion lin mL
TeMperature..
Liquid 30°C .90 °C
.water 4.2 5..7
vinegar 5.8 7.1'
coca-cola 8.$* 10.1
(d)
(e)
AmOunt of Expansion in mL - i4
Temperature: 30°C . Temperature: 90°C
,Liquid _Sampled Sample 2, Sample 3 Sample 1 Sample 2 Sample 3
coca -cola 4,8,8 9:0 '8.8 . 10.1 10:1 10.2
Aingunt of Expansion in mL Volume 'of Fluid When Heated
Temperature , , 'Temperature
30°C '. 90°,\ , 30°C 90 °C+
Sample No. Sample No. ;.
Liquid , . 1 2 '3 1 2 '3 '.1 2' 3 1 2 3'-,
water "' 4.2 4.3 '4.1 5.7 5.6 5.6 44.2 44.3 44.1 45.7 4g:46 45.6
vinegarfJ 5.8 5.6 5.9 7.1 7.3 7.2 45.8 45.6 45.9, 47.1 47.3 .4.2
coca-cola 8.8 9.0 8.8 .10.1 10.1 10.2 48.8 49.0 48.8 50.1 '50.1
Volume Of Fluid Whenffeated
Temperature:, 30°C Temperature: 90°C
Liquid Sample 1 Sample 2 Sample 3 Sample 1 Sample 2 'Sample 3
water 44.2 44.3 44.1 ' 45.7 45.6 45.6
vinegar. 45.8 45.6 45.9 47:1 47.3 47.2,0
coca -cola' 48.8 49.0 48.8 50.1 50.1 50.2
204

Recording InforiatiOn
4. Thermal Expansion(Version 2)
fl
intermediate
2q2,
10. .
Some students d noticed that when water is heated it exp. nds ifills more
space).4They W hdered if different liquids lid the same ing. They put
different liquids in a thin graduated cylinder. Then the, heated Water in
a pan to a measuredltemperaure and placed the tube upright in -the pan for
5 kinutes-e.. p'
They used water,a n acid solution (vinegar) and a sugar solutIbn (coca-cola)
for the liquids. They heated the water in the pan first to 30°C and tested
3 samples of each liquid at that temperature. tiThen,,they heated the water
to 90°iC and tested 3' more samples of each.liqui'db
Hete is the information they collected.
Amountofwaterin pan
. 1 L
1 L1 L
% L1 L1 L
1 L1 L1 L
1 L1.L1 L
Liquid
Temperatureof waterin pan
water 30°C
water 30°C
water 30°C
water 90°C
water °C
water 90:4
Vinegar 30°C ---
vinegar 30°C -
vinegar '30°C ''
vinegar' 90°C:
vinegar ,.,_ 0°C
vinegar , 90'3C4i,
.0
Inside Volume 'Volume Increase
Sample diameter of cold of heated in Atmospherj:
number -orcylinder liquid liquid volume 'pressure
1 10 mm
2 .10, mm
3, A, 10 MM
1 10 mai2 10 mm3 #10 mm
.
1,
1.0 pm
, 2 10mm'3 10 -nun
40 mL '44.2 mL mL 102 kPa
40 mL 44.3 mL 4.3 mL 102 kPa
40 mL- 44.1 mL- 4,1 mL 102 kPa
40' mL 45. 7 mL 5.7 mL 102 kPa
',40 mL 45.6 mL 5.6 mL 102 kPa
40 mL 45.6 mL 5.6 mL 102 kPaNs
40 mL 45.8 mL 5.8 mL 102 kPa
40 mL 45.6 mL 5.6 mL 102 kPa
40 mL 45.9 mL 5.9 mL 102, kPa
1 N 10 mm 40 mL 47.1 mL 7.1 mL 102 kPa
2 ; 10 mm 40 mL 47.3 mL 7.3 mL 102 kPa
3c 10 nun,
, 40 mL 47.2 mL' 7.2 mL 102 kPa
*
1 L coca? -cola -30 °C . . 1 10 nun 40 mL 48.8 tnL. 818 mL 102 kPa
1.L 7 coca-óol4"30°C 2 10 mm . 40 mL 49.0 mL '. 9.0 mL ro 2 ka
141., ' coca-cola 30°C 3 10 mm 40 mL 48.8 mL ' 8.8 mL 102 kPa
i .
1L. . 'coca-cola. 90°C 1 10 mm 40 mL 5Q.1 mL. 010.1 mL 102; kPa'
X L ,coda-cola 90°C . . 2 10 mm 40 mL 50.1 mL 10.1 roL 102 kPa
'1 L, coca -Cola 90°C 3.. 10 mm t 40 mL 50.2 mL 10.2 mL ,102 kPa,
-
9.
.1, 205 .
wy

.
Their question "pc typeiof liquid and temperature ta.which they are
heated together determine amoun of expansion of a liquid?"
Amount ofExpansion in ML
Temperature.
30°CLi uid -Sam le 1
aft
90°C
Sam le 2 Sam le 3 Sam le 1 Sam le Samle 3
water
vinegar
(s)
(t)coca-cola (u)
(e) (f)
(j) (k) (1)
(P) (a) (r)
1.. Hoyshoul4 they record the information that the.-2nd sample of coca-colaexpanded.9.0 mL when heated to-30°C?
Circle the number of the corrdqt answer.
(ir' _Put 9.0 in space (n).
(ii) Put .0 in space (q) .'
(iii) ,Leave it out.
(iv) Make up-a new space for thje information.
2. Howshould they record the fact that the volume of each sample when coldwas 40 mL?
Circle the number of the correct answer.
(i) 'lout this information in'each df the spaces (a) to (r).
(ii) Put this information in'the spaces (s), (t) and (u).
(iii) Leave it out.
(iv) Make up new spaces forthe information.
3. How should they record the informatiOn about the amount of expansion of the
3 samples of vinegar heated to 90°C?
Circle the .number of the correct answer.
11), Put 7.1, 7.3 and 7.2 in spaces (j), (k)
(ii) Put 7.1, 7.3 and 7.2 in spaces (g), (h)
(iii) Leave,it out.
(iv) Make up new spaces for the information.
and (1).
and '(i).
4. Ho* should they record the informatiori about the volume-of each sampleof vinegar when heated?
Circle the number of tlie correct answer.
14) Put each volume in` each of the spaces (g) to Cl).
(ii) Put each volume in each of the spaces (a) to (f).
(iii) Leave it out.tiv) Makeup new spaces fcK the inforniation. 206
bk.

Recording Information4
Intermediate
204
4. Thermal Expansion(Version 3)1.
Some students 'had noticed thA when water is heated it exiDands (fills more
ace). They wondered if different liquids did the same thing. Tficyput
different Liquids in a thin graduated cylinder. Then they heated water in
a pan .to a measured temperature and placed the tube upright in the pan for
5 minutes.
They used water, an acid solution (vinegar) and a sugar solutioh (coca-cola)
for the liquids. They:heated the water in the pan first to 30°C and tested
3 samples of each liquid-at that temperature. Then they heated the water
\ to 90°C and tested 3 more samples-of each liquid.
Here is/the information they collected.
Amountofwaterin pan
.
Liquid
Temperature Ingide.
of water 'Sample diaMeter
in pan - number of cylinder, .
Volumeof coldliquid
Volumeof heatedliquid
Increasein
volume
Atmospheri-pressure
1 L water 30°C=g
1 10 mm 40 mL 44.2 mL 4.2 mL 102 kPa
1 L1 L
waterwater
30°C30°C . 3
10 mm' .
.10 mm
40 mI,
40 mL44.3-mL44.1 mL %
4.3 mL4.1 mL
102 kPa102 kPa
:i
1 L water . 90°C 1 10 mm 40 mL 45.7 mL 5. mL 102 kPa
1 L water 90°C 2 10 mm 40 mL 45.6 mL 5.6 102 kPa
1 L water 90°C 13 10 mm 40 mL 45.6 ML 5.6 102 kPa
1 L vinegar 30°C ls 10 mm ,40 mL 45.8 mL 5.8 mL 102 kPa
1 L vinegar 30°C 2 10 mm 40 mL .45.6 mL 5.6 mL 102 kPa
1 L vinegar, . 30°C.
3 10 mm 40 mr 45.9 mL 5.9 mL 102 kPa
1 L vinegar 90°C 1 .10 mm 40 mL 47.1 mL 7.1 mL 102 kPa
1 L vinegar 90°C 10 hm 40 mL 0.3 mL 7.3 mL 102 kPa
1 L vinegai 90°C 3 10 mm 40 mL 47.2 mL 7.2 mL 102 kPa
1 L Coca-cola 30°C . 1 10 mm 40 mL 48.8 mL 8.8 mL 102 kPa
1 L coca-cola 30°C 2 10.mm J10 mL 49.0 mL 9.0 mL 102 kPa
1 L coca-cola 30°C 3 10 mm : 40 mL 48.8 mL 8.8 mL' 102 kPa
1 L , coca-cola 90°C- 1 10 mm 40 mL 50.1 mL 10.1 mL 102 kPa
1 L coca-cola 90°C :: 2 10 mm , 40 mL 50.1 mL '10.1 mL 102 kPa
1 L coca-cola 90°C 3 10 mm 40 mL 50.2 mL 10.2 mL 102 kPa
, 207

205
Their quetion is:" "Do type of liquid and temperature to which they areheated together determine amount of expansion of a liquid?"
Directions: Use the information to fill in this chart so they can answer their
questions..
Add more rows or columns if you need them.
Liquid
Aindunt of Expansion in mL
Temperature
30°C 90°C .
Sample 1 S e 2 Sample 3 Sample 1 Sample 2 Sample 3
water
vinegar
coca -cola
.0*
208
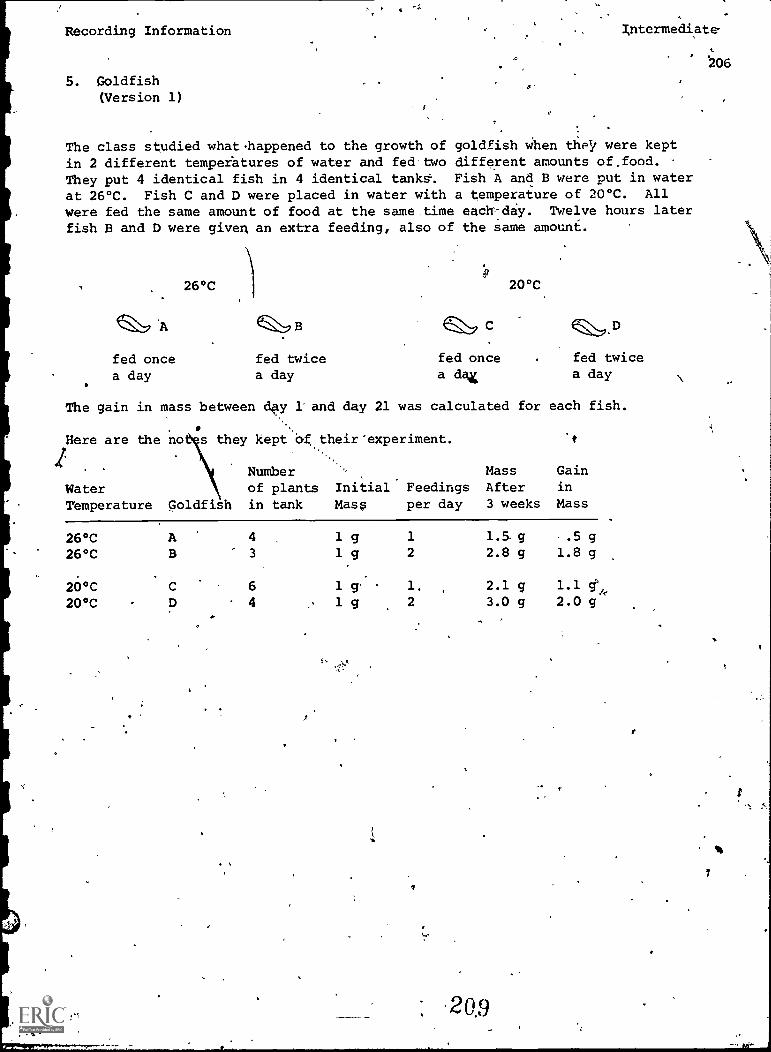
1,
Recording Information , Imtermediate
.. '206
5. Goldfish .
(Version 1)
The class studied whathappened to the growth of goldfish when they were kept
in 2 different tempeiatures of water and fed two different amounts of,food.They put 4 identical fish in 4 identical tanks. Fish A and B were put in water
at 26°C. Fish C and D were placed in water with a temperature of 20°C. All
were fed the same amount of food at the same time each-day. Twelve hours laterfish B and D were given an extra feeding, also of the same amount.
Qv 'A
fed oncea day
26°C
e"B
fed twicea day
'4!
20°C
C $3).D
fed once fed twicea dax a day
The gain in mass between ,41, 1 and day 21 was calculated for each fish.
Here are the no s they kept of their-experiment. 't
Number Mass Gain
Water of plants Initial Feedings After in
Temperature Goldfish in tank Mass per day 3 weeks Mass
26°C26°C
20°C20°C
A 4
B 3
C 6
D 4
1 g 1 1.5g .5 g1 g 2 2.8 g 1.8 g
1 g - 1. 2.1 g 1.1 get
1 g 2 3.0 g 2.0 g
20.9

a
This is theper day andincrease in
207
question the class would like to answer: "Do the number of feedings
the temperature of the water in the tank together determine the
mass of the fish?"
Directions; Which of these charts best organizes the information they needto answer their question?
Circle the letter of the best answer.
Gain in Mass
Water Temperature Fed Once a Day Fed Twice a Day
20°C 1.1 g
(b) Initial Mass
Water Fed Once Fed Twice
Temperature a Day. a Day
(c)
2.0 g
Mass After 3 Weeks Gain in Mass
Fed Once Fed Twicea Day a Day
Fed Once Fed TwiceDay a Day
26'C
20°C
1 g
1 g
Water Temperature
Gain in
Fed'Twice a Day
1.5g,
2.1 g
26°C
20°C
.(d) WaterTemperature
1.8 g
2.0 g
Initial Mass
6260c
20°C
Fish As 1 g
Fish Rs 1 g
kish.C; 1 gFish D: 1 g
2.8 g
3.0 g
If
(e) Gain in Mass
Water TQmparat4re Fed Once a Day Fed Twice a Day
26"C .5 g
20°C 1,1 g
1.8 g
2.0 g
210
.5 g
1.1 g
4
1.8 g
2.0 g

Recording Information Intermediate
208
5. aoldfiqh(Vers ion 2)
The class studied what happened to the growth of goldfish'when they were kept
in 2 different temperatures of water and fed two different amounts of food.) .
, They put 4 identical fish in 4 identical tanks. 'Fish A and B were put in water
-at 26°C. Fish C and D were placed in water with a temperature of 20°C. All,
were fed the same amount of food at the same time each day. Twelve hours later
fish B and'D Were given an extra feeding, also of the same amount.
26°C 20°C
A
fed once fed twice
a day a day
c
fed oncea day
D
fed twicea day
The gain in mass between day 1 and,day 21 was calculated for each fish.
Here are the notes they kept of their experiment.
.Number . Mass Gain
Water of plants Initial Feedings After in
Temperature Goldfish in tank Mass per day - 3 weeks Mass
26°C A 4 1 g 1 .1.5 g .5 g
26°C B 3 1 g 2 2.8 g 1.8 g
20°C C 6 1 g 1 2.1 g 1.1 g
20°C- D 4 .
,
. 2 '3.0 g . 2.0 g
Here is the question the class would like to answer: "Do the number of feedings.0per day and the temperature of the water in the tank together, determine the
increase in mass of the fish?"
The class made up this chart to organize the inforMation to answer their question.
aGain in Mass
Water Temperature Fed Once a Day Fed Twice a Day
26°C (e)
20°C (f)
(a) ) (b)
(c), (d)
g.) 211
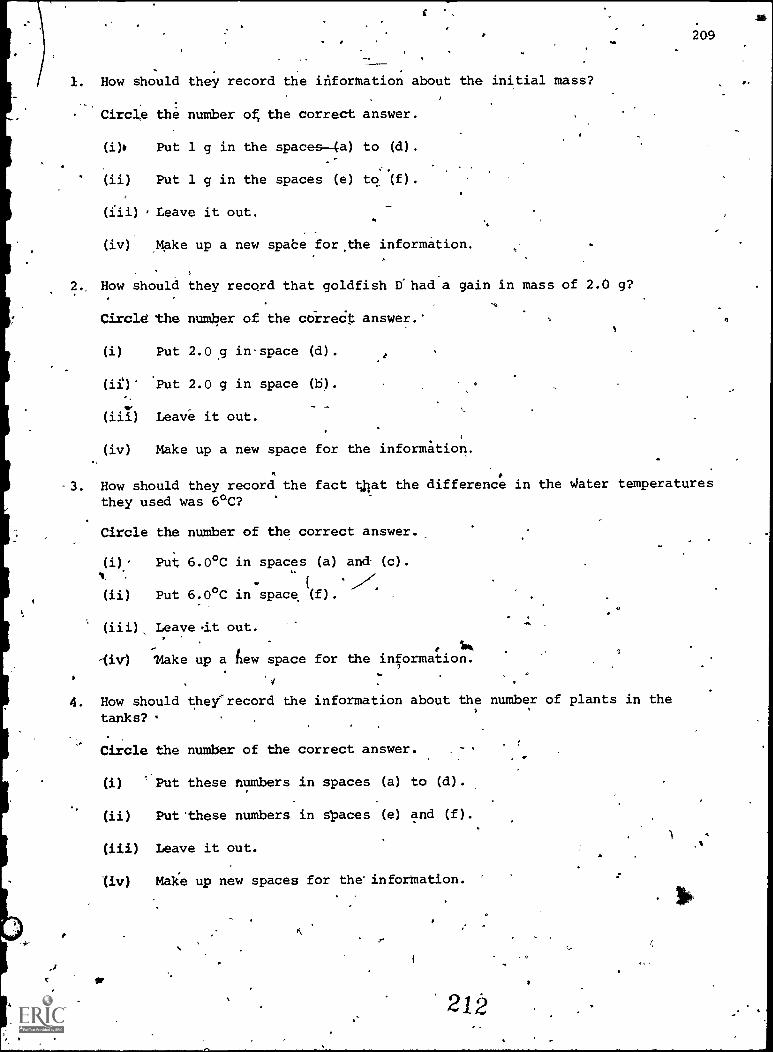
209
1. How should they record the information about the initial mass?
Circle the number of the correct answer.
(i). Put 1 g in the spaces-4a) to (d).
(ii) Put 1 g in the spaces (e) to (f).
(iii) Leave it out.
(iv) Make up a new spabe for.the information.
2., How should they record that goldfish D had a gain in mass of 2.0 g?
Circle the number of the correct answer.'
(i) Put 2.0g inspace (d).
(ii)' Put 2.0 g in space (b).
(iii) Leave it out.
(iv) Make up a new space for the informtion.
-3. How should they record the fact tliat the difference in the aster temperaturesthey used Was 6°C?
Circle the number of the correct answer.
(i) Put 6.0°C in spaces (a) and (c).(
(ii) Put 6.0°C in space (f) .
(iii) Leave dt out.
e lk-(iv) Flake up a hew space for the information.
7
4. How should they'record the information about the number of plants in the
tanks?
Circle the number of the correct answer.
(i) Put these numbers in spaces (a) to (d).
(ii) Put 'these numbers in spaces (e) and (f).
(iii) Leave it out.
(iv) Make up new spaces for the information.
212

Recording Information
5. Goldfish -
(Versiap 3)I
Intermediate
234
The class studied what happeried to q)e growth of goldfish whe6they were kept
in,2 different temperatures of water andled :two different amounts of food.
They put 4 identical fish in'4-identical tanks. Fish A-and B were put in water
at 26°C. `Fish C and'D were placed in water with temperature of 20°C. All
were fed the same amount of food at the same time each day. Twelve hours later
fish B and D were given an extra feeding, also of the same amount.
26°C..
-
fed once, fed twice
a day a day
20°C
0
C D
fed oncea day
fed twicea dai
The gain in mass between day 1 and day 21 was calculated-for each fish.
Here are the notes they kept of their experiment.
,
WaterTemperature
:.
Goldfish
f
Numberof plan'sin tank
.
Initial
majs ,
Feedingsper day .
Mass.
After3 weeks
4Gainin
Mass
26°C A 4 ° .1 g 1 1.5 1'5 g,1
26°C B 3 1 g 2 2.8 g 1.8 g.
20°C C 6 1 ,g,. 1 2.1 g 1..1 g
20°C D 4 1 g 2 3.0 g 2.0 g
H e is the question that the class wouldldike to anewer:."Do the numberof
feedings per day and the temperature of. the water in the tank together determine
the increase in mass of the fish?.
Directions: Use tile information from the table to fill in the following chart
so the class can answer their question.-1r
,Add more rows *or "columns if you need them:
Gain in Mass'
Water Temperature Fed Once a Day Fed Twice a Day,
.26 °C
20°C
°
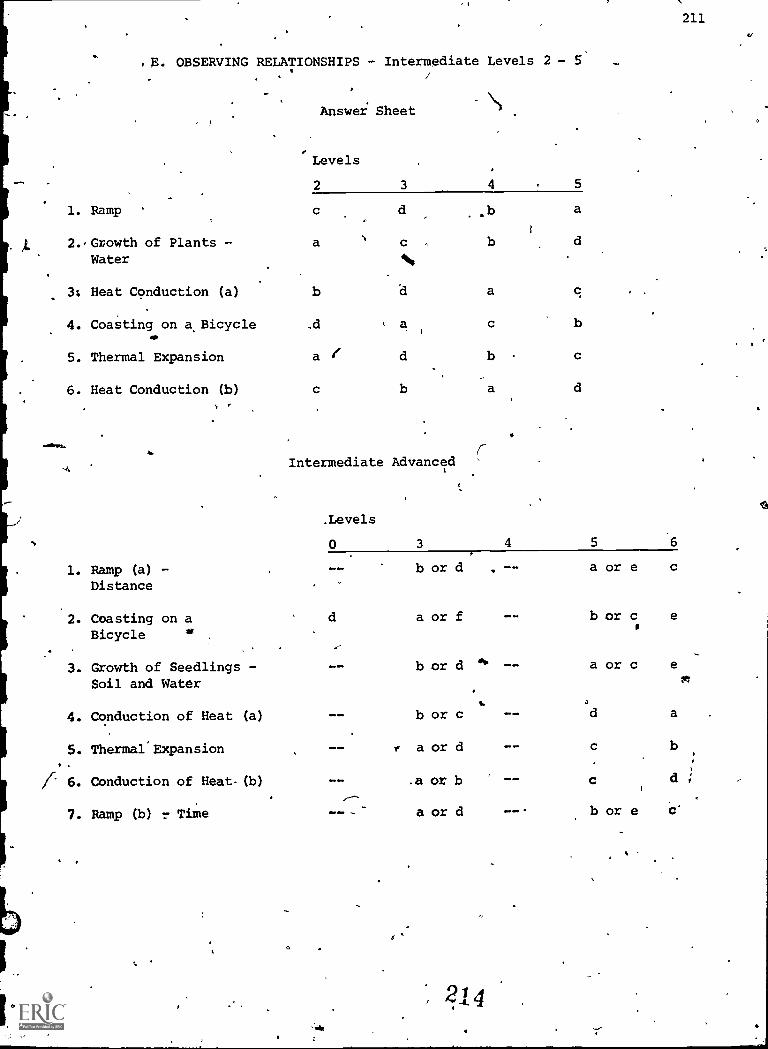
211
.E. OBSERVING RELATIONSHIPS - Intermediate Levels 2 - 5
1. Ramp
Answer Sheet
Levels
2 3 4 5
a
2.,Growth of Plants - a c
Water
3: Heat Conduction (a) b d a c
4. Coasting on a Bicyclete
5. Thermal Expansion
,d
a /
c b
6. Heat Conduction (b) c b a
Intermediate Advanced
,Levels
0 3 4 5
1. Ramp (a) - b or d a or e
Distance
2. Coasting on a d a or f -- b or c e
Bicycle 0.
1
3. Growth of Seedlings - -- b or d ''' -- a or c e
Soil and Water m
% i4. Conduction of Heat (a) -- b or c -- d a
5. Thermal'Expansion --le. a or d -- c b
.
i 6. Conduction of Heat- (b) .a or b c d ;
7. Ramp (b) 7 Time a or d b or e
21 4

,Observing Relationships
1. Ramp
Heightof Ramp'
Marblek
7.
..Intermediate Levels 2 -
.
5
/ 212
Ramp
f-_--
1 =
1
Floor
Distance Marble, Travelled
Richard did an experiment in which marbles of different mass rolled down
a ramp.. He wanted to find out if the distancetiavelled by each marble' is
minfluenced by the mass of the marble.
These were his results:I
"le
t
Distance Travelled by Mable
Trial 1 g marble 2-g marble , 3 g marble
1st 12 17 24
2nd 14 16 22
3rd 11 '19 23
4th 15 '14 18
5th S..:-.
15 25
Directions: What would be the best way to find out if there is a relationship
between the mass,of the marble and the Ttance it travels down
the ramp?
'Circle the lettet of the best answer--
(a) Calculate the average distance travelled for each marble down4each column.
See if the average distance travelled increases as the mass of the marble
increases.
(b) Look aLall the infowation. See ifthe distance travelled is always
longer as the marble's mass gets bigger.
i5(c) Find the-longest and shortest d' tance travelled. See if the marble's
mass is bigger for the longest istance.than it is for the'shortest
distance./
4...
(d) Compare the distance the marble travelled on the middle trial Al6reach
marble. See,xiif the distance increases as the mass of the marble increases.
xa

Observing Relationships Intermediate Levels 2 - 5
2. Growth of Plants - Water
A class is studying the effect of the amount of water on the growth of radish
seedlings. They decided to plant radish seeds in 12 pots filled with garden
soil. Four of the pets received .01 L of water daily; four pots received !03 L
4i
of water daily and the other four pots received .05 L of water daily.' They
were careful to keep everything else the same for each of the seedlings. After
3 weeks the heights of the seedlgs were measured.
Here are the results of:the experiment: r:.
Amount of WaterHeight of Seedlings A r 3 Weeks
Given eati.ly'' Plant 1 Plant 2 Plant 3 Plant 4.
011
.01 L
.05 L
6.2 cm 5.8 cm 6.0 cm 6.1 cm°
',. 10.1 cm 9.7 cm 9.9 cm 10.3 cm %.
12.0 cm 11.8 cm 12.2 cm 11.9 cm
DireCtionia What Wo d.be the best way for the class to find out if the
heights of the seedlings are affected by the amounts of water
'given, daily?.""
Circleithe letter of the best answer.
Aar Find the tallest and the shortest heights of the seedlings. See if the
amount of water is greater for the tallest seedling than it is for the
sttortest seedling.
(b) Look at all the data in the table., As the amount of water increases see
if the height of the seedlings changes.
-..,.
(c).,
Compare the heights' of each plant 3. Seeietlie'height of the seedlings
changes as the"-amount of water added Lily increases., -
) ,t
(6) Calculate the average heiglltofthe seedliAgs across each row. See :"
if the average height for each row changes as the artigunt ofwater added,
daily Odreases. , r
1G
Sq
213

O
Observing Relatiohships
4%0
3. Heat ConductionNa)
w4c Metal Rods
' Intermediate Levels 2.7 5
'Flame
COndUctometer'.
Mr. Simpson's class did an experiment to see if varkcus metals conduct heat
at different rates. A conductometer was used. A g'poll'Af wax was_placed at
the tip of each of the four metal rods. A flame was Positioned 4cm from the
centre of the conductoMeter. The time taken for each spot'of wax to melt off
was recorded. -
Here are the notes kept by the class:
Trials
Time to Melt Wax (in seconds)
Copper
ls, 58 -
2nd 60
3rd 61
4th 62/ .
Aluminum Brass Iron
80 . 103 1 179
79 . 102" 180
79 . 100 178
83 97 183
Directions: What would be the best way to find out, if there is a relationship'
between the type df metal and its ability to conduct heat?
°Cirdle the 1etter of the best answer.
(a) Look at all of the information. See if the time taken to melt the wax
is aPkAys different for different metals.
S
(b) Find the least and greatest times taken to melt the wax. See if thehe
two times are different for different metals.
'(') Calculate the'average time taken to melt the wax for each metal (the
average of each column). See if the average time is different for.
different metals.-°
(d) Compare the times taken to melt the wax on the third trial. See if the
tithe taken to melt the wax is affected by the type of metal.
217
214
4 O

0
Observing Relationships
4; Coasting on a Bicycle
t
. Intermediate'Levelv".2 - 5
215
Jim did an experiment in which boys of different masses coasted down a hill on
similar Sekine 10 speed bikes. The point from which the boys started coasting
was 20 m up the hill. Each boy made 3 trial runs from that height. Jim
measured the distances tie boys coasted before.they had to pedal the bike to
keep their balance. t., .
Here are his notes:
Distance Coasted
Trials ,Bill (30 kg) Mike (35 kg) Gord (40 kg)
1st 30 m 36 m 40in,
2nd 7 29 m 35 m 39 m
3rd 31.m , 34 m 41 m.
,
Directions: What would be the best way to find out if ..there is a relationshipbetween the mass of the boy and the distance he coasts down the
0' 0111?
Circle the letter of the best answer. $
(a) Compare the distance that each boy coasted on'their second trials. Seeif digtance coasted increases as the mass Of the lby increases.-
(b) Calculate the average distancptcoasted for each boy down each column
of, the table. See if the average distance coasted increases as themass of the boy 'increases.
1
(c) Look at all the information. As the mass of the bop increases see if
diStance coasted always increases. -/
.0
(d) Find the longest andshortest distance coasted.. See,i.f9
f the mass of-the
.boy is greater for. the longest distance coasted than itisTor the shortest
distance coasted%
I. i
4

Observing Relationships
5. Thermal Expansion
Intermediate Levels 2 - S
216
.
Susan did an experiment to dliscover the effect of heat on a liquid: The liquidshe chose was water. She p4t a given volume of water, 40 mL in each of 4graduated cylinders. She heated each cylinder to 30°C and measured the changein the volume of the water in each cylinder. Susan repeated this same procedureby heating the same volume of water in each of four cylinders to 60°C andfinally tof90°C. She recorded the change in volume in each graduated cylinder.,
0
NoHere are the notes 'she'kept:
Change in Volume
Temperature to WhichWater was Heated
Graduated Cylinders of Water 4
1st 2nd 3rd 4th
30°C .. '4.2 4.3 4.1. 4.3'
I.
60°C 4.8 4.9b :49.8 4.7..-
90°C 5.7 5.6 5.6 5.8
. e
Directions: What would be the best way for Susan to find out if there isa relationship between the amount of heat applied to a liquidand the effect on the volume of the liquid?
Circle the letterof the best answer.
(a) Find the greatest and least volume change. See if the temperature towhich the water was heated,is higher for the greatest change, in volumethan for the least change in volume.
(b) Look 'at all the data in the table. As the temperature'of the waterincreases see if the change in volume always increases.
(c) Calculate the average chazige in volume across each row of the table foreach temperature. See if the.average change in volume increases' as thetemperature increases..
(d) 'Compare the changes in ,volume in the cylinders of water for the thirdtrial. See if these changes in volume get larger as the temperature-ofthe water gets higher.
219

1
'Observing Hblationships
%.
6. Heat Conduction (b)
Mr. Murphy's class didaluminum pots'affectedwater to boiling point
o and the class measuredwas repeated for three
Here are their notes:
4
Sts
Intermediate Levels 2.- 6
an experiment to see if the thickness of the bottoms ofthe length of time required to heat tpp same volumes of(100°C). Three pots with 1 mm thick bottoms were heatedthe time required to boil the water. This same procedurepots with 2 mm thick bottoms and with 3 mm thick bottoms.
Time Required for Water to Reach Boiling Point
Thickness of,' Aluminum PotsPot Bottoms 1 2
1 irtm
2 min
3 mm
6 min
7.9 min
9.7 min
5.8 Tin
3
6.1 min
8 min 8.2. min
9.9 min 10.1 min
Directions: What would be the best way for the class to find out if thethickness of the pot bottoms affects the time reguiied to boil
the water?
Circle-the lletter-of-the-best-abswer.
217
(a) Look at all the data in the table.4' As the time required il water
4 increases, see if bhe thicknesses of the bottoms always increase..IJ
111) Compare the results for the 3rd pots. See if the time required to boil
water increases as the thickness of the bottoms increases.
-(c) Find the least and greatest times required to boil the water. See if
the pot bottom was thicker for the longest time than it.was for theshortest time.
./'
(d) . Calculate the average time required to boil.wateracross eachrow for
' each bottom thickness. `See if the average time increases as the thickness'
of the bottoms increases.
3
229
D

-
'Observing Relatibnships
1.. Ramp (a) - Distance
Marble
Heightof Ramp
Ramp
-=_
Intermediate Advanced
Floor
'218
.DiStance Marble-Travelled
Richard did an experiment in which marbles of different mass rolled down aramp.. A 1 g marble was rolled three times down a ramp 10 cm high. The
distance travelled on each trial was measured. The experiment was repeated
using 2 g and 3 g marbles on ramps that were 10 cm, 15 cm and 20 cm high..The.distanCes for each set of trials were averaged.
Here are Richard's results:
Average Distance RolledHeight ofRamp -fig- marble 2 g marble 3 g marble
10 cm15 cm20 cm
20 cm30 cm40 cm '
40 cm60 cm80 cm.
80 cm120 cm160 cm
Directions:* What would\be the best way for Richard to find out if the mass of
the marble affects how far the marble will roll when the height .
of'the ramp is changed?
Circle the letter of the best answer.
,.(a) Calculate the average distance travelled for the marbles in each row of
the table. See if the distance travelled increases as the height of the
ramp increases', when the mass of the marble is averaged.
Ab) Study that data for the 15 cm ramp. See if the average distance the
marble- rolls increases with the'mass.of_the marble.
(c) See if the mass of the marble affects how far it rolls when the ramp is
10 cm high.. See if the same effect of mass of the marble ondis1tance is
shown for the.otfier ramp heights;
(d) Study the data for the 2 g marble. See if the average distance rolled
increases as the height of the ramp increases.
(e) Calculate the average distance travelled for each marble in each column
of the table. See if the distance travelled increases as the mass of
the marble increases, when the height of the ramp averaged.
22.1

Observing Relationships Inteimediate Advanced
2. .Coasting on a Bicycle
219
Jim did ap experiment in which boys of different masses coasted down a hill on
similar bikes. The height of the starting point was changed for different
trials. Jim measured the distances that the boys travelled before they had40
to pedal to keep the bikes balanced.
Here are Jim's results: (I*
Height ofDistance Travelled
Start on Hill Bill (30 kg) Mike (35 kg) Gord (40 kg)
20m 30m 35m 40m
30m 45m
40m 60m
52 m 60 m
70m 80m
Directions: What would be the best way for Jim to find out if the boys' Mass
affects how far they will coast when they start at different,
4heights on the-hill?
Circle the letter of the best answer.
(a) Study the data for Gord. See if the distance he travelsfincreases as the
height of the starting point on.the hill increases.
(b) Calculate the average distance travelled by each boy down each column of
the table. See if the average distance travelled increases as the mass
of the boys increases.
(c) Calculate the average distance travelled for the boys at each height
across each row of the table. See if the average distance travelled
increases as the heigheof the starting point on the hill increases.
(d) Calculate the average starting height on the hill. See if the average
starting height affects the mass of the boys.
.(e) See if the boys' mass affects how far they coast when the starting point
is 20 m high. See if the saMe effect of the boys' mass on the distance
travelled is shown for the other starting points on the hill.
(f) Study the data for the 30 m high starting point. See if the distance'
-r that the boys coast increases with the mass of the boy riding the bike.
222

Observing Relationships Intermediate Advanced
220
3. Growth of Seedlings -Soil and Water
A class is studying the effect of the type of soil and the amount of water onthe growth of radish seedlings. They planted radish seeds in three potscontaining sand and in three similar pots containing garden soil. To one pot
of sand and one pot of garden soil'.01 L of water was added daily. To one
pot of sand and 1 pot of garden soil .03 L of water was added daily. Similarly,
to the remaining pot, of sand and pot of garden soil .05 L of water was addeddaily. They were careful to keep everything else the same for each of theseedlings. They measured the height of the s &dlings after 3 weeks. °
Here are the notes of their experiment:
Amount of Water'Given Daily
4'
Height of Seedling in Three Weeks
Sand Garden Soil
.01 L
.03 L
L
4.0 cm
6.0 cm
8.0 cm
.6.0 cm
' 8.0 am
10.0 cm
Directidns: What would be the best way for the class to find out if the heightof the seedlings is affected by the type of soil when differentamounts of water are given daily?
Circle the letter of the best answer.
(a) Calculatd the average height of the seedlings across each row of the
table. See if the average height of the seedlings is affected by theamount of water given daily.
(b) Study the data for .05 L of water. See if the height of the seedlings
is affected by the type of soil.
(c) Calculate the average height of the seedlings down eacIrcolumn of the
table. See if the average height of the seedlings is affected by thetype of soil in the pots.
(d) Study the data for sand. See'if the height of the seedlings is affected
by the amount'of water given daily.
(e) See if the amounts of water given daily affect the height of the seedlingsin.the sand. See if .the same effect is true for the seedlings in garden
soil.
. ;

Observing Relationships
4. Heat Conduction (a)
Intermediate Advanced
Conductometer
Mrs. Simpon's class did an experiment to find out if various metals conduct
heat at different rates. A conductometer was used. A spot Of wax was placed'
at the tip of each of the four metal rods. The flame was positioned 2 cm from
the centre of the conductometer and the time taken for each spot of wax to
drop was recorded. The experiMent was repeated with the flame 4 cm from the
centre of the conductometer.
Here are the results:
- ( Time to Melt Wax (iii seconds)
Di t4nceot,Plame Copper Aluminum Brass Iron
2\1qm 30 40 50 90
4 cm 60 80 100 180
'_`.Directions: What would be the best way for the students to find out if thetime needed to melt the wax is affected by the'type of metalwhen the flame is placed at different distances?
Circle the letter of the best-answer.-
I ,(a) See it the type of metal'affects the time reqpired to melt the wax when
the distance of the flame is 2 cm. See if this same effect is true for,
the,4 cm distance of flame.
-,(b) Study the data for the2 cm distance. See if the time required to melt
.the wax is affected by the type of metal used.
(c) Study the data for the aluminum metal rOd. See if the time required to
. melt the wax increases as the distance of the ,flame from the rod increases.
(1) Calculate the/average of the times required to melt the wax across each
row of. the tdble. See if the average time to melt the wax increasesas
the distance of the'flame increases.
. 224 ,
221

Observing Relationships
5. Thermal Expansion
Intermediate Advanced
Some students performed'aft experimentto study the effect of heat.on threetypes of liquid. They heated in a graduated cylinder the same volume ofwater, an acid solution (vinegar), and a sugar solution (coca-cola) to 30°Cand recorded the changes in the volume of each liquid. The experiment was
repeated, heating the same volumes of each liquid to 60°C, and again, heating
the same volumes of each liquid to 90°C.
Here are the results cf the experiment:
Temperature to WhichChange in Volume (in mL)
Liquids were Heated Water Acid Solution Sugar Solution
y30°C 4.0 5.0 10.0
e;
60°C ,r-8.0 10.0 20.0
90°C 12.0 15.0 30.0
Directions: What would be the best way for the students to find out ifthe change in the volume of each liquid is affected by thetemperature to which it is heated when different liquids are ,
7
used?
'Circle the letter of the best answer.
_(a) Study the information for the 60°C temperature. See if the change in
volume of the liquids is affected by the type of liquid,
U4 See if the change in the volume of the water increases as the temperatureto which it was heated increases. See if the same-relationship-is-truefor the acid solution and the sugar solution.
(c) C4lculate the average change in volume across each row of the table.`See if the average change in volume increases as the temperature towhich the liquids were heated increases.
1) Study the information for the acid; solution. See if the change in
volume has increased as the temperature increases:4P
V
225
.
222

Observing RelationshipsIntermediate Adi!enced
6. Heat Conductioh (b)
4Carol did an experiment to find which kinds of pots are best for fast cooking.
She used aAlminum and copper pb.ts with different thicknesses of bottoms. The
same amounts of Water at the same starting temperatures were set to-boil on
identical hot plates. She then recorded the time required for each pot of'water
to reach boiling point (100°C).
:Her notes from the exper nt are below:
me Required for' Water to Reach-Boilihg Point (100°C)
Thickness of Bottom, Aluminum Cropper
1 mm/
6 min
2 mm
3 mm
8 min7
10 min
5 min
9 min
-
Directions: What would be the best way for Carol to 'find out if the thickness
of the metal affects the time reqUired to Soil water when pots
of different metals are used?
Circle the letter of the at answer.
(a) Study the information for the 2 mm thickness of the bottom of each pot.
See if the time required to boil the water,is affected' by the type of 'pot:
(b) Study the information for the copper pot. See if the time required to
boil the water increases with the thickness of the bottom.
(c) Calculati. the average-of the times required to bOil water across each
row of the table. See if the average time requited to'boil water
increases as the thickness of the bottot of the pots increases.
. ,(d) See if the thickness of the bottom of the aluminum pots affects the time
required to boil water. See if the same effect of bottbm thickness is
shown for 'the copper pots.
V
226
7
223
1

\Observing Relationships Intermediate Advanced
'e
p247. Ramp (b) - Time
Mary did an experiment in which marbles of 1 g,,2 g-and 3 g were rolled down
a ramp. Three ramp heights of 10 cm,. 20 .cm an30 cm were used. Each marble
was released at each height and the length of time it took the marble to come
to rest was measured.
Here are Mary's results:
Height ofLength of Time The Marble Rolled
Ramp 1 g marble 2-g marble 3 g marble
10 cm . 1.0 s 1.5 s 2.0 s
20 cm 1.5 s 2.0 s 2:5 s
30 cm 2.0 s 2.5 s 3.0's
Directions: What would be the best way for Mary to find out if the size of
the marble affects:the length of time ittakes the marble to
come to rest when the height of,the 'ramp is changed?
Circle the letter of the best answer.
(a) Study the data for the 30 cm ramp. See if'the time thSt the marble rolls
increases with the mass of the marble.
(b) Calculate the average time.for the marbles across each row of the table.
See if the-average 'time increases as the height 'of the -ramp increases.
;'
(c) See if the mass of the marble affects the length of time that it rolls
when the ramp is 10 cm high. See if the same effect of the marble's mass
on time is shown for the other ramp height;.
4 (d) Study the data for the 2 g marble. See if the time the marble rolls
increases as the height of,the ramp increases.
(e) Calculate the average timefor each marble.mass.by averaging down each'
column of the table. See if the average /time increases as the mass of
the marble increases.
4
227
4

225
k
P. CONCLUDING - Intermediate
Levels
0 2 3 4
1. Ramp (a) a or c d or e
distance
2. Bicycle b or c a or f d e
e
3. Radiation c or d / b or f a,
4. Heat-Conduction d or f .a or e c b
5. Fish c or e b or d f a
6. Thermal Expansion a or b c or f e d ,.
7. Pendulum e or f a or b d c,.
8. Heat Conduction b or e t-or d a f
.
9. Ramp (b)- time a or e b or f c d
10. Growth of Plants c or e d or f b a
228
ti

Concluding
1. Ramp (a) - Distance
,, Intermediate
226
l
Richard built a ramp and rolled a marble down it to see h
kw far it would travel
across the floor. He decided to learn more. He rolled 3 arbles down the ramp
when it was resting on a support 10 cm high, then repeated the xpils4:nsing the
same 3 marbles, when the ramp was 20 cm high and 30 cm.high. He was careful to, '
do everything the same each time he started a marble down the ramp. He got these
results. y .
Distance Marble Rolled
Heightof RmA 1 g marble 2 g marble 3 g marble
20 6
36 cm
60 cm
120 cm
180 cm-
120 cm
240'cm
360 cm
240 cm
360 cm
480 cm
. ,
Here are some statements. about the results of the experiment.
tl. As the height of'the ramp was increased the distance.the marble travelled
increased.
2. As the distance the marble tralled increased the mass of the marble
. decreased.'
3. As the mass of the marble increased the distance the marble travelled also
increased.
4. The distance the marble travelled was determined by tiie'mAss of the marble
and ramp height together.
Directions: Which statement or combination of statements bestdescribes the
results of the experiment?
Circle the letter of 'the best answer.
(a) Statement 1 and stateTent 2 together.
(b) Statements 1, 3 and 4 together;
4c) Statement 2 only.
(d) Statement 3 only.
(e) Statement 1 only.
tfj''Statement 1.and statement 3 together.
V
229

Concluding intermediate
227
2. Bicycle
4
Jim tried to find out why some people coast further on their bicycles than others
do. He gathered three of his classmates, Bill, Terry and Sam, who all had.the
same kind of bicycles, at the top hear the school.
One at a time each coasted down the hill from a still- start.. Jim measured how
far each travelled before needing to pedal to keep the bike balanced.
They then repeated the experiment from a still start'position half way up the
hill. These.were'the'results.o 41/4
Boy's Mass
'Distance Travelled Without Pedalling,
Start Half Way Up Hill Start at Top of Hill0
35 kg36 kg41 kg
160 m175 in
195 m
320 m- 350 m
390 ,m
, here are some statements about the results of the experiment.
1. The distance the boys could coast was41.9termined.by their mass and the
height of the starting point together.
2.' As the mass Of the boys increased, the'distance the bike travelled also
. increased. .
3. As the height from which they started increased, the distance travelled
also increased.
4. Increasing the mass of the boy increased the height of the starting point
and the distance the bike travelled.
Directions: Which statement or ,combination, statements best describes the
results of the experiment?
Circle the letter of the best answer.
(a) Statement 3 only.
(b) Statement 4 ana statement 2 together.
(c) Statement 4 only.
(d) Statement 2 and statement 3 together.
(d) Statement 1, 2 apd 3 together.
(f) Statement 2 only.
r
WU*

Concluding
3'. Radiation and Heat Ahsorption
IF
Intermediate
a - 228
'-
Lyle didamexperiment. ,He had. six tin cans that were exactly the same. He
painted each can a different colour or finish..Then he filled each can with
.1 L of water at room temperature. A thermometer was placed in each can. -Each
can was placed 20 cm from a 250 watt lamp. After 30 minutes the temperature
change in each can was recorded. Here are the results.f
Temperature Change of Water After ,30 min in °C
Colour Dull Finish Shiny
-7-
Black 20 10
Dark Green le 8
White 12 6
Here are some statements about the results of the experiment.
1. When dull paint was used the temperatuie change of the water was greater
than when shiny paint was used.
2. The temperature change'of the water wasdetermined by the colour and the
dullness/shininess of the finish together.
3. The teMperature of the war and the colour of the paint were both less
when the surf to was dull rather th6 'shiny.
4. The temperature change was. greater when the colour was darker.-\
4P
Directions: Which statement or combination of statements best describes
the results of the experiment?\
Circle the letter of'the best answer.
(a). Statement 1 and statement 4 together.
(b) Statement 1 only.
(c) Statement 3 only.
(d) Statement 1 and statement 3 together.
(e) Statements 1, 2 and 4 together.
(f) -Statement 4 only.
23

:Concluding
4. Heat Conduction
I-
'Intermediate
Conductometer
Mr. Black's class did an experiment with,a conductometer. A spot of wax was
placed at the tip of 'each of four metal rods. The flame was' placed 2 cm from
.the centre of the conductometer and-the time taken for each spot of wax to
drop off was recorded. The experiment was repeated with the flame 4 cm from
the centre of the conductometer. Here are the results.
Metal
Tine Required to Melt Wax (in4secondIS),
Flame 2 cm Away Flame 4 cm Away
Copper 30 60
Aluminum 40 80
Brass SO 100
Iron 90 180
Here-are some statements about the results of the experiment.
1. The melting time was determined by ye type of metal and the distance of
the flame ,together.
6
2. 'The increase in melting time affected.the type of.metal and the distance
of the flame.
3. The time required to melt the wax was affected by the t e of metal in
the rod. .
0
4. When the distance of/the flame from the conductometer wasincreased, the
time taken for the.wex.to meltKalso increased.'
Directions: Which statement or comhination of statements best describes the
results of the experiment?
. . Circle the letter ,of the best answer.
(a) Statement, 4 only.
StatementS 1, 3 and 4 together,
(c) Statement 3 and statement .4 together..
(d) StateMent 2 and statement 4 together.
or.
(e) Statement 3 only.
(f). Statement 2 only 232
.229
4

-Cm)cludihgec
Intermediate
230
-, 44
The grade 7 science class,d4d a study with goldfish. They put an identical
'fish in each of four tanks. Fish .11k and B were kept in cool water. Fish C
and D were.kept in warm water. Fish A and C'were fed twice a day for 20 days
while the other 2 were-may fed once a day. The gain in mass of the fish
between day l and day 20 was recorded.,
? A B C. Li
I (9 l'. i 14' 1.,.
Tsvice a day, Once a day Twice a day Once a day
.
,Cool Water' Warm Water)
Results-Mass
Cool Water Twice a day 2 g
Once a day. 1 g
Water Twice a day 1 g
Once a day .5 g
Here are some statements about the results of the experiment.
1. The experiment with thd fish showed...pat if we gave the fish more to eat,
their amount of:gro-wth was greater. .
2. The'rexpei-iment with the fish showed that the fish grew more if they were
kept in cool water rather -than warm water.
3. When the quantity of food given the fish was decreased over a period oftime the growth of the fish doubled, even when the` temperature of the water
was changed.
4. The experiment with the fish showed that the'growth of the fish wasdetermined by the amount of food they received.and the temperature of the
water togetiler.
Directions: Which statement or combiAation of statements best describes-the
results of the experimept?
the.leiter of the best answer.
(a) tatements 1, 2 and 4 together.
(b) Statement2 only
.(c) Statement 1 and statement 3 together.
00 Statement 1 'only.
.
(e) Statement 3 only.
(f) Statement 1 and statement 2 together.
233
.

Concluding
6. Thermal Expansion
/
-GraduatedCylinder.
9
Pan of Water.
Intermediate
'4
231
Some students had noticed that when water is- heated it expands (fills more
space). They put different liquids one at a time into a thin graduated cylinder.Then they heated water in a pan to a measured temperature and placed the tubeupright in the pan for 5 minutes.--
They used an acid solution (vinegar) and a sugar solutiar (coda-cola) for theliquids: They heated the water in the pan-first to 30°C, testing each liquidat that temperature. Then they heated the water to 60°C and tested each liquid
again. Finally, they heated the water to 90°C and tested each liquid.
Here are the results.
)qu9Temperature ofWater in Pan
Volume of- Cold Liquid
Vinegar 30°C 40 mL
Coca-cola 30°C" 40 mL
Vinegar 60°C 40 mL
Coca-cola 60°C 40 mL
Vinegar 90°C 40 mL
.Coca-cola 90°C 40 mL
Volume ofHeated Liquid
45.0 mL50.0 mL
50.0 mL60.0 mL
X5.0 mL70.0,mL
Here are some statements about the results of the experiment.
Increasein Volume
5.010.0
10.020.0
445.030.0
1. Increasing the temperature of water in the pan increased the mount theIliquids. expanded.
2: The type of solution (sugar or acid) and the temperature to which it washeated togetherdeterminRd the amount of expansion.
3. The sugar solution (coca-cola) expanded more than the acid solution (vinegar
4. The temperature of the water in the pan was affected by the type of liquidbeing heated and increasing the volume of that liquid.
Directions; Which statement or combination of statements best describes the
results' of the experiment? r.,
t
Circle the letter of the best answer.
(a) Statement 1 and statement 4 together.
(b) Statement 4 only.
(c) Statement 3 only.
(d) Statements-1,,2 and 3 together.
. (e) Statement 1 and. statement 3 together., 23,4(f) .Statement 1 only.

0
Concluding Intermediate
232
7. -Pendulum
To study how a grandfather' clock works the class made a pendulum.using a
weight as a bob and a string, attached to the edge of a table, for an arm.
They selected 3 diff&ent strings of 10 cm, 20 cm and 30 cm in length and
3 differpt passes of bob (1 g, 5 g and 10 g). They measured the period
(the time it takes for the pendulum to move through its swing) for each arm
length and mass combination 3 times. They kept everything else, such as
starting the swing at the same angle, the'same for each test.
Here are their results:
Length:
Mass of Bob '
.
Period in Seconds
10 cm .1 g'
.
.6
10 cm 5.g , .6
10 cm 16 g . .6
20.6m20 cm
1 g
5 g
^ 1.11.1
nl
20 cm 10 g 1.1
30 cm 1 g 4 1.7
30 am s) 5 g 1.7
30 cm 10 g 1.7
Here are some statements about the results of the experiment.
1. Thd period of the pendulum was determined by the length'of the pendulum
regardless of the'mass of the bob.
2. The period of the pendulum was not affected by the mass of the bob.'
3. As the length of the arm was increased, there was an increase in the
periOd o6 the pendulum.
4. As the mass of the bob was increased there was an increase in the length
of the arm and the period, of the pendulum.
.
Directions: Which statement or combination of statments best describes the
results of the experiment?
Circle the letter of the best answer.
la) Statement 2 only.
(b) Statement 3 only,:
,(c) Statements 1, 2 and 3 together.
(d) Statement 2 and statement
(e) Statement 4 only.
(f)
3 togetboer.
Statement 3 and statement 4 together.
235

Concluding
8. Heat Conduction
Intermediate
>13
Bob boiled water in some pots. He used aluminum and copper pots with different
thicknesses of bqXtoms. The same amounts of water at the same starting
temperatures were set to boil on identical hot plates. He then recorded the
time required for each pot of water to reach boiling point.
Here are his results:
Time to Reach Boiling Point
Thickness, Copper Aluminum
of Bottom Pots Pots
1.mm 5 min.
6 milt
i2 mm . .'7 min /8 min
3 mm i 9 min 10 min
P
Here are soMe statements about the results of the experiment.
,12' If the pots have the same bottom thickness it is evident that water will
,boil faster in aluminum pots rather than copper pots.
. The type of metal pot used and, the thickness of the pot bottom together
.determine the time required.to boil the water.
3. As the thicknesses of the bottoms increased the time required to boil 'water
in them also increased. .
4. The time required to boil water is less for copper than for aluminum pots.
Directions: Which statement or combination of statements best describes the
results of this experiment?
Cirois:the letter of the best'answer;
(a) ,Statement 3 and statement 4 together.
(b) Statement 1 only.
(c) Statement 3 only.'
(d) Statement 4 only.
(e)" Statement 1 and tatement 4 together..
(f) Statements' 3 d 4 together.
ti
4

Concluding
O
9. Ramp (b) - time
Intermediate s"
234
George did,an experiMent to determline the effect of ramp height and marble
mass on e length of time a marble would roll. He used marbles with masses
of 1 g, 2 Tend 3 g. He rolled them down a ramp 10 cm high and recorded the.
length of ime the marble rolled. He then repeated this procedure from a ramp
20 cm hi and then 30 cm high. He was careful to do everything the same eaci
time he started a marble down the ramp.'
He got these results:
Length of Time Marbae Rolled (iriseconds)
Height of Pimp 1 g marble 2 g marble 3 g marble.
a10 cm 2.4 4.6 6.8
20 cm, 3.9 5.1 8.3
30 cm 5.4 9.8
Here are some statements about the results of this experiment.
1. As the time the marble rolled increased, the mass of the ma ble decreased.
2. The length of time the NArble rolled was determined by both the mass of
the marble and the height of the ramp.
3. As the. height of the.ramp was increased, the length of time the marble .
rolled also increased. m
4. Ai the mass of.the marble increased the length of time the marble rolled
increased.v
Directions: Which statement br_combihation of statements best describes the.
results of the experiment?
;Circle_ the letter of the best answer.
.
(a) Statement 1 and statement 3 togethet.
(b) StatgMent 3 only.
(c), Statement 3 and statement 4 together.
(d) Statements 2, 3 and 4 together% 4/* ;
(e) Statement 1 only.
(f) Statement 4 only.,

ConcludingIntermediate
10. browth of ylants - soil and water
A class is studying the. effect of the type of soil and the amount of water on
thb growth of radish seedlings. They planted radish seeds in three pots
containing sand and three similar pots containing garden soil. To one pot of
sand and one pot of garden.soil .01 L of water was added ails To one pot
of sand and one'pot of garden soil .01 L of water was a ded daily. The
remaining pot of sand and pot of garden soil received . L of water daily.
They were careful to keep everything else the same for each f the seedlings.
After 3 weeks they measured the 'height of the- seedlings.o
Here are the results.
Height of Seedlidgs After 3 Weeks
Amount ofWaterGiven Daily Sand
.01 L
.03 L
.05 L
A(.0 cm
6.0 cm
8.0 cm
Garden Soil
6.0 cm
10.0 cm
12.0t,cm
Here are some statements about the results of the experiment.
1. The amount of water giveh daily together with the type of soil determines
the growth of the seedlings.f 1-
2. The height of the seedlings increases as the amount of water increases.
3. The plants grow taller in Orden soil than,in.sand.
4. The typeof soil is determined by both the amount of water added daily and
the height of the seedlings after 3 weeks.
Directions:. WhiL statement or combination of statements best describes the
results of this experiment?
.'tarcle,the letter of the best answer.
(a). Statements 1, 2 and 3 together.
(b) Statement-2 and statement 3 together..
(c) Statement 4 only.
(d) Statement 3 only.
(e) Statement 2 and statement,4 together.
(f) Statement 2 only.
238
235
-4

G. GENERALIZING /PREDICTING - InteimediateLevel A3
0
1. Pendulum
2. Coasting Distance
3: Heat,Conduction
4. Thermal Expansion.
5., Ramp
AnsWer Sheet
2
d
d
b
3
b
, a
a
1.
4
4
b
e
e
a
b
Note: Students must sel 'ect the correct option on all 4 guestions)to score
correct on an item.(
'
239
Is.
2364
f

generalizing /Predicting Intermediate-A3.
1. Pendulum237
Johnny did some experiments bp- find out whatmakes pendulums go f4ster and
slower. He tied some string of different lengths to ,a nail on'the edge of a
table. He attached different weights to the strings. He also tried some
other things but only the length of the arm (the weighted-string) affected the
period (the length of time taken td make one complete swing) of the pendulum.
He got the following information about arm lengths and periods.
se
Length of the weighted arm(his strings with weights
° attached) Period of.the Pendulum
10 cm .5 seconds
15 cm .75 seconds
20 cm 1.00 seconds'
He concluded that as the length of the arm was increased the period of-the
pendulum also increased.
Directions: From, what he had learned, Johnny might say the following things.
Circle the letter of the words that make each statement true.
1. If I did the experiment over again using the same lengths of weighted
strings I would find the 15 cm arm has a period o6:
(a) approximately -.5 seconds
(b) approximately .75 seconds
(c) approximately 1.00 seconds
(d) approximately 2.00 seconds
(e) approximately 1.50 seconds
2. No matter how long the period r ally is, the second hand of a grandfather
clock' moves once each time the uendulum swings and the minute hand ,moves
ahead one minute for every 60 swings. my clock is taking 90 seconds to
move ahead ohe minute, I would: l,
i(a) make the pendulum twice as long as it is now,
'111C (b) make the pendulum 11/2 times its present length
.(c) leave the pendulum- the same length as it is now
(41) make the pendulum 2/3 as lorig as it is now
(e) make the pendulum 1/2 as long dS it is now,
i 240

fR
3. Grandfather clocks use a pendulum to keep time. If I had a grandfather
clock that had a-40 cm pendulum it would have a period_of:
(a) 4.0 seconds
(b) 2.0 seconds
(c) 3.0 seconds
(d) 4.0 seconds
(e) 5.0 seconds
4. If f tried an experiment with a 12.5 cm weighted string the period would
be:
(a) .5 seconds
(b) .625 seconds
c) .75 seconds
(d) .875 seconds
(e) 1:0 seconds.
eL
S
4
O
O
2 4
ri
:
238

;
Generalizing/Predicting'Intermediate A3
2. Coasting Daance
.
Jim wondered if a,person's mass has anything to do with how far he can coast
on a bicycle. He asked his friends Joe, Ed and Dave, who all had the same
.
kind of bicycles, to ride down a hill from a still start. Jim measured how
..14 far each travelled before needing to pedal to keep the bike balanced.4
Here are the results:
A. -
Rider's Name His Mass Distance Travelled
Joe 20 kg 200 m
Ed 30 kg 300 m
. Dave 40 kg 400 m. A
He concluded 'that the distance travelled increased with the mass of the rider.
Directions: From what he had learnedrhere are some things Jim might say.
circle the letter of. the words that make each statement true.
1. If I did the experiment over again using the same boys riding the same
bikes, I would find that Ed would travel:
(a) approximately 150 m
(b) approximately 250 m
(c) approximately 300 m
(4) approximately 325 m
(e) approximately 225 m
2. We can say that for each of the boys the distance the bike traveli is:
(a) twice as many meters ag4there are kilograms in his mash- 'ivt,
(b) half as many meters as there are kilograms in his mass
(c) three times as many meters as there are kilograms 'in his mass
(d) ten times as many meters as theta are kilograms in his masst
(e) one tenth as many meters as there are kilograms in his mass
242 7
r
239
Q

3. If my dad, who, has a mass of 75 kg, rode down
bikes, I would find the distance travelled to
. (a) 750 m
(b) 7 500 m
(o) 75 m
(d) 175 m
(e) 675 m
'
the hill on one of the same
4. If my friend Bob, who has a mass of 5 kg more than Ed, tries the same
experiment, the distance travelled would be:
(a) 325 m
(b) 375 m
(c) 275 m
(d) 340 m
(e) 350 m
243
10
7
240

Generglizing/Predicting Intermediate A3
A241
3. Conduction of Heat
Roger did an experiment to find out in which kind of pots water will boil
fastest. He found four flat bottom pots of the same size - two aluminum
and 2 copper. One aluminum pot and one copper pot had a bottom thickness
of 1 mm. The other aluminum pot and copper pot had a bottom thicknesS of
2 mm. Roger heated the same amounts of water, which were all the same
temperature to begin with, and found the time requireTto heat each amount of
water to 100 °C. ---
I. i
Here area the notes that Roger kept about his experiment. 0
/--.
MAtal Pot
Thickness of Time Needed
Bottom to Reach 100 °C
Aluminum 1 mm 6 min 5 s
Aluminum 2 mm Spin 6 s
Copper 1 mm 5 min 2 s
Copper 2 mm 7 min 6 s
He concluded that copper is a better conductor of heat than aluminum. He also
concluded thet the thicker the metal the more time it required to Yy ,t't the
liquid.
Directions: From what he had learned, here are some things Roger might say.
Circle the letter of the words that make each.. statement true.
I
1. If I repeated the experiment with a copper pot with a 3 mm thick bottom,
the time required to reach 100 °C would probably be:
1
(a) approximately 20 min 30 s,
(b) appr6kimately 7 min 30 s -,,
(c) approximately 7 min
1(d)approximately 10 min 15 s
. i_ (e) approximately 9 min 10 s. .
1 2. -If there was twice as much water in the 1 mm copper pot as in the others,.,
.
water will reach boiling point (100°C) in the least time in:A
I(a) an aluminum pot with a 2 mm bottom
(b) a copper pot with a'1 mm bottom
A. (c) an aluminum pot with a 1 mm b6ttom
(d) a copper pot with a 2 mmbotrm
(e) a copper pot with a 3 mm bottom.
244

2420
'3. I can assume that a copper pot with a bottom thickness of 1.5 mm wouldtake:
4
(a) approximately 6 minutes to boil the same amount of water.
(b) approximately 5 minutes to boil the same amount of water
(c) approximately 7 minutes to boil the Fame amount of water
(d) approximately 8 minutes to boil the same amount of water
(e) approximately 4 minutes to boil the same amount of water
4. If I had an aluminum pot with a bottom thickness of 3 mm, the time neededto boil twice as much water would probably be:
(a) approximgtely 10 min
(b) approximately' 19 min
(c) approximately 2 min
(d) approximately 26 mip
(e) approximately 20 min.
V
(.
41I
0
s4
245

Generalizing/Predicting
4. TherMal Expansion
.
Lt
41.
Intermediate A3
243
Some students noticed that water expands (fills more space) when heated. They
wondered if the amount of expansion is different foi differene'liquids and if
such differences are affected by the temperature to which the4iquids are
heated. The students put different liquids, using the same amount of each,
in .thin graduated cylindeks. Then the heated water in a pan to a measured
temperature.and placed the tubes upright in the pan of watei'for 5 minutes.
The different liquids used in the experiment were water, vinegar, and.a sugar
solution (pepsi-cola). They.heated the water in the pan first to 30°C, testing
the 3 different liquids at that temperature. The experiment'was repeatedputting' the 3 different liquids in the pan of water heated to. 90°C.
Here are the results:
LiquidTemperature of .IncreaseWater in Pan in Volume
Water 30°C 4.2 mL
Water 90°C 5.54111,
Viriegar 30°C 5.8 mL
Vinegar 90°C 7.5 mL
Pepsi-cola 30 °C 8.9 mL
Pepsi-cola 90°C 11.4 mL
=
The students concluded that the amount of expansion of a liquid depended on
the temperature to which it was heated as well as the type of liquid -it was.
Directios: From,whai they had learned, the students who had done the
experiment now said the following things.-
Circle the letter of the wordsVthat make each statement true.
1. If we repeated the experiment' using a-new sample of vinegar of the same
amount, placing it in.the same graduated cylinder in a pot of 90°C water
for 5 minutes,,the,increase in volume of the vinegar would probably be:
(a)- approximately 6.5 mL
(b) approximately 8.3,mL
(c) approximately 6.9 mL
4(1) approximately 7.4 mL
(e) approximately 7.8 mL'
2. If the amount of pepsi-cola we tested is about the same as there is in a
bottle orpepsi, the company should leave at least:
4a) 8 mL
(b) 10 mL
(c) 1,2 mL
(3) 14 mL
(e).16 mL
of space in the bottle to allow for expansion if the bottle is left outdoors
on a hot day. 24 101

Vegetable's cooked in water are sealed in the can at.boiling temperatures.If a.can of peas contains about the same amount of water as we used in ourexperiment, after cooling the volume would-be reduced
(a) approximately 5.7 mL
(b) approximately 5.5 mL,
(c) approximately 5.0 mL
(d) approximately 4.5 mL
.(e)apriroximately,4.2 mL
4. If the same amount of Eppsi -cola wasp placed in a graduated cylinder andheated in a pot of waeer at V°C for '5 minutes, the increase in volumewould be approximately: .. ,
(a) 10.2 mL
(b) 90 mL
(c) 11.0 rnI:
(d) 8.0 mL
(e) 12.0 mL
Mao
247
'244
. (

.Generalizing/Predicting
.
5. Ramp
Intermediate A3 '
245
Mary built a ramp 10 cm high and rolled a marble down,it to see how far itwould travel across the floor. She raisedthe ramp to 20 cm, and then to 30and rolled the marble again each time. She.was careful to do everything the
.same each time she started the marble down the ramp.
Here,are%the results:
Roll
2
Heightof Ramp
10
20 cm.
30 cm
Distance-Marble Travelled
60 cm'
n0 cm
180 cm
1"`
CIII
She concluded that the distance her marble travelled increased' with the,heightof the ramp.
Directions: From what she had learned, here are some things Mary said.
'Pircle tile letter of the words that make each statement 'true.
1. If I did the experiment over again using the same marble and a ramp height'of 20 cm, the marble would travel:
(a) approximately 10 cm
(b) exactly 120 am
(c) exactly 30 cm
(d) approximately 240 cm
(e) apprqximately 120_ cm0
2. No matter how far the marble did travel, it is safe to say that if theramp height is doubled or tripled then the distance the marble will travel
is:
(a) five times the ramp 'height
(b) half the ramp'height
AO increase y 0 am
(d) doubled of stir pled.(e) ten times the ramp height
3. If I raise'the rampAheight to50 cm, then the marble will travel:
(a) approximateli, 300 cm
(b) approximately 290 cm
1(c) approkimately 240 cm
(d) approximately 50 cm
..(e) approximately 500 cm 248

-
246
4. If-I did the experiment with a ramp height of 25 cm, I would find that the
marble would-travel:.
(a) approximately 120 cm
r.(b) approximately 150 cm
(c) approximately 250 cm
(d) approxiipately 105 cm
(0) approximately ,75 cm
IS
24 9

GENERALIZING/PREDICTING.- Intermediate Level B4 .
1.'Penduium'
2. Coasting Distance
. Answer Sheet
.4"
A B C D
2 2 or 3 2 3 or 4
4 2 1 or 2
C
3. Heat Conduction 1 or 2 4 1 3
4. Thermal Expansion 1 or 2 1 1 or 2,
-4
5. Ramp 1 or 2 2 or 3
247
4 (evaporastion.should alsooccur in thattime)
2 or 3 3
Note: Students must provide a easonable rating for all 4 questions to score
correct on the item.
250

Generalizing/Predicting k Intermediate B4
1. Pendulum
4,
Johnny knows grandfather clocks maketse of a pendulum to keep time. Some
clocks keep the right time and some run fast, others, slow. Johnny did some
experiments to find out what makes pendillums go faster and slower. He tied
some string-of different lengths to a nail onrthe edge of a table. He,
attached different, weights to the strings. He also tried some other things
but only the length of the arm.(the weighted string) affected the period (the
length of time taken to make one complete swing) of the pendulum. .
He got the folldwing information about arm lengths and periods.
Length of the Weighted arm(his string with weights
attached) Period of Pendulum
me
- 10 cm
15 cm
20 cm
.5 seconds
.75, seconds
1.00 seconds
He concluded that as the length of the arm was increased the period of the
pendulum also increased. .
Johnny now says some things about other pendulums. Use this scale to show
for each of the statements' below how true you think it is:
1 = almol.Ocertainly'true
2 = probably true
3 = may or may not be true
4= naPlikely to be true '
(a) If I used a weighted string 12.5 am lon9 the period would be .625
secdnds:
The period of
A grandfatherof 1 second.
sa string 5 in long,,,wouId be about 25 seconds.
9
clock with a penddlum 29 cm long would have a period
a
(d) A grandfather, clock,with-a 20-cm pendi4um sitting on a table that is
not lev.el would have, perioctof 1 second.
251
'248

V.
Generalizing/Predicting Intermediate B4
249
Coasting Distance
Jim wondered if a person's mass has anything to do with how far he can coast
on a bicycle. He'asked his friends Joe, Ed and Dave; who ali had the same
kind of bicycles, to ride down a hill from a'still start. Jim measured how
far each travelled be/ore needing to,pedal to keep the bike balanced.A
Here are the results:
Rider's Name His Mass Distance Travelled
Joe '20 kg 200 m
Ed 30 kg 300m
Dave 40 kg 400 m
He concluded that the distance travelled increased with the mass of the eider.
Jim now says some things about other situations involving coasting down hill.
Use this,,scale tb show for each of the statements below how true you think it is:
1 = almost certainly true
2 = probably true
3 = may dr may not be true
4 =not likely to be true
(a) In a soap-box derby race held on Saturday, Jim notices that his big
friend is in the same race as his smaller and younger brother. They ,
are both riding in identical soap-box cars. Jim states'th4t his brother
will win.
(b) X fully loaded dump truck which is twice the mass of an empty_dimp
wilkcoast twice as far.
(c) .Jines mother, who has a mass of 35 kg, coasted down the same hill of
Jim's experiment. She would travel less distance than Dave travelled.
(1) Jim's father, who has a mass of 75 kg, decided to coast down the hill.
The experiment was done with 3-speed bikes with big tires. He used a
.10-speed bike with narrow tires. ,From the top of the hill -to the inter-
section and stop sign is 600 m. He will have to apply the brakes in
order to stop at the intersection.
252

Generalizing/Predicting
3. Conduction of Heat
Intermediate B4
Roger did an experimentoto find out in which kind of pots water will boil
fastest. He found four flat bottom pots of the same size - two aluminum
and 2 copper. One aluminuM pot and one copper pot have a bottom thickness
of 1 mm. The other aluminum pot and copper pot have a bottom thickhess of
2 mm. Roger heated the same amounts of water, which were '11 the same
temperature to begin with, and found the time required to heat each amount of
water to 100°C.
Here are the notes that Roger kept about"his experiment.
Thickness Time Needed
Metal Pot ' of Bottom . to Reach 100°C
Aluminum 1 mm -6 min 5 s
Aluminum 2 mm 8 min 6 s
Copper 1 mm 5 min 2 s
Copper 2 mm 7 min 6 s
He concludedi.kat copper is a better conductor of heat than aluminum. He also
-concluded that the thicker the'metal.the more time is required to heat the
liquid.
Roger now says some things about other situations where heat is conducted through
metal. Use this scale to show for each of the statements below how true you
think it is:-
1 ='afmost certainly true
2 = probably true
3 = may or may not be true
4 = not likely to be true .
(a) Food would cook faster in a copper frying pan than an aluminum frying
pan of the same thickness.)
,
(b) If I, put a penny and a dime on the road on a hot sunny day, the ground
under the penny would get hot faster than it would under the dime.
(o) To conserve energy (electricity) I should cook with thin copper pots ,
or pans.
(d) Water will reach the boiling point faster in a copper pot with a'5 cm
thick bottom than in an aluminum pot with a 5 cm bottom.
.1
253

Generalizing/Predicting Intermediate B4
4. Thermal Expansion
Some, students noticed that water expands (fills more space) when heated. They
wondered if the amount of expansion is different for different liquids and if
such differences are affected by the.temperature to which the liquids are
heated. The students put different liquids, using the same amount of each,
in thin graduated cylinders. Then they heated water in a pan to a`measured
temperature and placed the tubes upright in the pan of water for 5 minutes.
The different liquids used in the experiment were water, vinegar and a sugar
solution (pepsi-cola). They heated the water in the pan first to 30°C, testing
the.3 different liquids at that temperature, The experiment was,repeatpd
putting the 3 different liquids in the pan of water heated to 90°C.
Here are the results:
Temperature of Indrease
Liquid, Water in Pan in Volume
Water 30°C 4.2 mL
Water . 90°C . 5.5 mL
Vinegar 30°C 5.8 mL
Vinegar 90 °C 4.4s mL
Pepsi-cola 30°C 8.9 mL,
Pepsi-cola 90°C- 11.4 MI,.
They concluded that as the
each liquid increased.
temperature)of the liquid increased, the volume of
They now saj some things about other situations where liquids are heated.,. Use
this scale to show for. each statement how true you think it is:
1 = almost certainly true
2 = probably true
3 = may or may not be true
- 4 = not,liiely to,be true .
.,.- N.. .(a) The increase in the volume of pepsi-cola will be approximately twice the
r,
increase in volume of a similar amount of water when they are both heated
to the same temperature.
(b) If the same volumes of vinegar and pepsi-cola are heated to the.same-
-temerature, the pepsi-cola will occupy more space.
(c) If two identical capped bottles, one completely filled with water andAiry
pne coskletely filled with pepsi-cola, are placed in the sun, the cap
should pop off the bottle of pepsi-cola first.
CO Suppose wefill a pail brimful with water and place it in the sun on a
hot daythat's about 30°C.--.The pail-has no lid. We know it holds exactly
10 times the amount of cool water that we placed in.th4 cylinder in our
experiment. We leave .it there for an hour or two to let the water heat,
then put it somewhere where tt-can grow cool again. We should find 42 mL
of water have overflowed because-of expansion and the quantity in ,the pail
is reduced by very close to that amount.
254
251

GenTrallzing/Predicting .
Intermediate B4
252
5. Ramp
Mary built a ramp 10 cm high and roged a marble down it to see how far it
would travel across the floor. She raised the ramp to 20 cm, and then to 30 cm
and rolled the marble again each time. She was careful to do everything tile
same each time she started the marble down the ramp.
Here are the results:
Roll
Heightof Ramp .
DistanceMarble Travelled
# 1 10 cm .60 cm
2' 20 cm . 120 am
3 30 cm 180 cm
She concluded that the distance her marble travelled ipereased with the height
of the ramp. 10
Mary now said some things about other ramps. Use this scale to show for each /
of the statements below how true you,think,it is.
1 = almost certainly,trile
2 = prbbably true
3 = may or may not be true
4 not likely to be true
(a) There are'2 roller ramps at thesDominion Store. One is flat and one
is raised. The cartons of groceries will travel farther on the raised
ramp than .the flat ramp.
(b) Suppofe I=had a ramp large enough for my ten-pin bowling ball and rolled
the blall down it. If I make the ramp twice as high, the ball will roll
twice ,as far. .
(c) If the emergency brake fails on a car parked at the top of a fairly steep
hill, ,it will travel, much further than if the same.thing-had happened at
thetop of a small hill.
.(d) I can travel much farther -after reaching the bottom of a steep ski hill
than one with a gentle slope even if the snow conditions are better on
the smaller hill. .
A
255
Copyright © 2022 FDOKUMEN