Evolution of the pozzolanic activity of a thermally treated zeolite
12
Evolution of the pozzolanic activity of a thermally treated zeolite Raquel Vigil de la Villa • Rau ´l Ferna ´ndez • Olga Rodrı ´guez • Rosario Garcı ´a • Ernesto Villar-Cocin ˜a • Moise ´s Frı ´as Received: 1 October 2012 / Accepted: 13 December 2012 / Published online: 27 December 2012 Ó Springer Science+Business Media New York 2012 Abstract Zeolites generally show pozzolanic activity due to their structural characteristics. The utilisation of po- zzolans as additions to cements results in added technical advantages of the construction materials. In this study, the pozzolanic activity of a thermally treated natural morde- nite-type zeolite from the Palmarito open-air deposit (Cuba) was evaluated with respect to a non-treated zeolite. Initially, a thermal treatment of the zeolite was performed at different temperatures within the range 300–1000 °C for 5 h in order to evaluate the better temperature of treatment. Afterwards, the pozzolanic activity was determined for each temperature after 7 days of reaction with a saturated Ca(OH) 2 solution that simulates the release of lime from ordinary Portland cement during the hydration reaction. The higher pozzolanic activity was achieved with the thermal treatment performed at 300 °C. Therefore, a fur- ther study studied the evolution of the mineralogical phases produced during pozzolanic reaction up to 90 days, carried out with the zeolite treated at that temperature. Consump- tion of Ca 2? in solution and formation of C–S–H-like phases with low Ca/Si ratio were experimentally observed as the main pozzolanic products. The thermodynamic study confirms high reactivity of the zeolite at short-term and chemical stability of the reaction products after 28 days. The zeolite thermally treated at 300 °C confirmed an increase in the pozzolanic activity with respect to the non- treated zeolite. Introduction Natural, zeolite-rich tuffs are presently used in the con- struction industry as pozzolanic materials [1–3]. A poz- zolanic material is generally defined as a natural or artificial material mainly consisting of SiO 2 and Al 2 O 3 , lacking in cementitious properties and hydraulic activity, but able to combine with portlandite [Ca(OH) 2 ] or lime- releasing materials (e.g. Portland cement) in the presence of water, at atmospheric temperature, to form reaction products with hydraulic binding character, calcium silicates hydrates and calcium aluminates hydrates-like phases (C–S–H and C–A–H) [4, 5]. Pozzolans are commonly used as additions to Portland cement and concrete manufactured to improve the durability characteristics [6–9], reduce the amount of clinker in the blended matrix and decrease the energy and environmental costs [10, 11]. In addition, the heat evolution during cement hydration is decreased [12–14]. Synthetic and natural zeolite materials, when properly prepared, achieve higher pozzolanic activity than other well- known pozzolans, such as silica fume, fly ash, metakaolin- based activated product or blast furnace slag [15–18]. Several authors have studied the pozzolanic activity of thermally treated zeolites. Upon heating, zeolites undergo a series of chemical and structural changes (loss of water, R. Vigil de la Villa Á R. Ferna ´ndez (&) Á R. Garcı ´a Department of Geology and Geochemistry (Associated Unit CSIC-UAM), Autonomous University of Madrid, Madrid, Spain e-mail: [email protected] R. Ferna ´ndez Á O. Rodrı ´guez Á M. Frı ´as Eduardo Torroja Institute for Construction Science (CSIC), Madrid, Spain O. Rodrı ´guez National Center for Metallurgical Research (CSIC), Madrid, Spain E. Villar-Cocin ˜a Department of Physics, Central University of Las Villas, Santa Clara, Villa Clara, Cuba 123 J Mater Sci (2013) 48:3213–3224 DOI 10.1007/s10853-012-7101-z
-
Upload
independent -
Category
Documents
-
view
2 -
download
0
Transcript of Evolution of the pozzolanic activity of a thermally treated zeolite

Evolution of the pozzolanic activity of a thermally treated zeolite
Raquel Vigil de la Villa • Raul Fernandez •
Olga Rodrıguez • Rosario Garcıa •
Ernesto Villar-Cocina • Moises Frıas
Received: 1 October 2012 / Accepted: 13 December 2012 / Published online: 27 December 2012
� Springer Science+Business Media New York 2012
Abstract Zeolites generally show pozzolanic activity due
to their structural characteristics. The utilisation of po-
zzolans as additions to cements results in added technical
advantages of the construction materials. In this study, the
pozzolanic activity of a thermally treated natural morde-
nite-type zeolite from the Palmarito open-air deposit
(Cuba) was evaluated with respect to a non-treated zeolite.
Initially, a thermal treatment of the zeolite was performed
at different temperatures within the range 300–1000 �C for
5 h in order to evaluate the better temperature of treatment.
Afterwards, the pozzolanic activity was determined for
each temperature after 7 days of reaction with a saturated
Ca(OH)2 solution that simulates the release of lime from
ordinary Portland cement during the hydration reaction.
The higher pozzolanic activity was achieved with the
thermal treatment performed at 300 �C. Therefore, a fur-
ther study studied the evolution of the mineralogical phases
produced during pozzolanic reaction up to 90 days, carried
out with the zeolite treated at that temperature. Consump-
tion of Ca2? in solution and formation of C–S–H-like
phases with low Ca/Si ratio were experimentally observed
as the main pozzolanic products. The thermodynamic study
confirms high reactivity of the zeolite at short-term and
chemical stability of the reaction products after 28 days.
The zeolite thermally treated at 300 �C confirmed an
increase in the pozzolanic activity with respect to the non-
treated zeolite.
Introduction
Natural, zeolite-rich tuffs are presently used in the con-
struction industry as pozzolanic materials [1–3]. A poz-
zolanic material is generally defined as a natural or
artificial material mainly consisting of SiO2 and Al2O3,
lacking in cementitious properties and hydraulic activity,
but able to combine with portlandite [Ca(OH)2] or lime-
releasing materials (e.g. Portland cement) in the presence
of water, at atmospheric temperature, to form reaction
products with hydraulic binding character, calcium silicates
hydrates and calcium aluminates hydrates-like phases
(C–S–H and C–A–H) [4, 5]. Pozzolans are commonly used
as additions to Portland cement and concrete manufactured
to improve the durability characteristics [6–9], reduce the
amount of clinker in the blended matrix and decrease the
energy and environmental costs [10, 11]. In addition, the
heat evolution during cement hydration is decreased
[12–14].
Synthetic and natural zeolite materials, when properly
prepared, achieve higher pozzolanic activity than other well-
known pozzolans, such as silica fume, fly ash, metakaolin-
based activated product or blast furnace slag [15–18].
Several authors have studied the pozzolanic activity of
thermally treated zeolites. Upon heating, zeolites undergo a
series of chemical and structural changes (loss of water,
R. Vigil de la Villa � R. Fernandez (&) � R. Garcıa
Department of Geology and Geochemistry (Associated Unit
CSIC-UAM), Autonomous University of Madrid, Madrid, Spain
e-mail: [email protected]
R. Fernandez � O. Rodrıguez � M. Frıas
Eduardo Torroja Institute for Construction Science (CSIC),
Madrid, Spain
O. Rodrıguez
National Center for Metallurgical Research (CSIC),
Madrid, Spain
E. Villar-Cocina
Department of Physics, Central University of Las Villas,
Santa Clara, Villa Clara, Cuba
123
J Mater Sci (2013) 48:3213–3224
DOI 10.1007/s10853-012-7101-z

modification of cage dimensions etc.) until they are largely
converted to an X-ray amorphous material [19]. It is widely
accepted that the thermal behaviour of the zeolite frame-
work is related to the Al concentration and that the thermal
stability increases as the Si/Al ratio increases. The expla-
nation is straightforward, as more energy is required to
break the Si–O bond compared to the Al–O bond [20]. The
heating of the zeolite samples normally decreases the early
strength but improves the resistance at long term [21, 22].
In general, the activation of zeolites destabilises the crys-
talline structure to form a less stable and more reactive
aluminosilicate framework; however, it has been evidenced
that the effect of heating on natural zeolites may produce
negligible improvement of the pozzolanic activity or even
reduce it [23].
Because of the several factors controlling the achieve-
ment of higher pozzolanic activity on zeolites and the wide
range of compositions and structures, there is no consensus
on the adequate temperature and dwell time in furnace.
Several natural zeolites have been heated to tempera-
tures in the range 350–1000 �C, for times in the range
2–15 h, in order to study the pozzolanic reaction and
compressive strength of cement–pozzolan mortars [19–23].
Perraki et al. [19] observed higher pozzolanic for an acti-
vated natural zeolite activity after treatment at 400 �C, the
lower temperature selected within the range proposed in
that study. The thermal treatment of the zeolite at 400 �C
improved its pozzolanic reactivity and accelerated the
reaction with Ca(OH)2, compared with a non-treated
sample, but thermal activation at temperatures over 400 �C
had a negative effect. Habert et al. [21] found that when the
zeolites are destabilised, the pozzolanic activity is
improved. They found that the higher pozzolanic activity
was achieved when the zeolites structure had partially
collapsed but had not already recrystallised. The mineral-
ogical composition was a key factor controlling the opti-
mum temperature to treat each sample (350 �C for a natural
phillipsite and 500 �C for a heulandite-rich zeolite). They
proposed the term metazeolite to describe the reactive
phase created by thermal activation of the zeolite before its
recrystallisation into a weakly reactive phase.
In a prior study [24], the pozzolanic reaction of a natural
zeolite-rich mordenite from the Palmarito deposit (Cuba)
was studied as a function of time. The most important
mineralogical and chemical changes observed were the
precipitation of calcium silicates hydrates (C–S–H phases)
with low Ca/Si ratio on the zeolite aggregates and the
consumption of aqueous Ca2? through the pozzolanic
reaction. However, the transformation of the original
mordenite to clinoptilolite was also detected.
In order to assess the potential benefit of heat treatment,
the pozzolanic reaction of the same starting material has
been determined in this study at 7 days after heating to
300, 400, 500, 600, 700, 800, 900 and 1000 �C. The
maximum consumption of Ca2? in the pozzolanic reaction
occurred in the material heat treated at 300 �C; therefore,
this temperature was chosen as the optimum to repeat the
experiment as in [24] and to study the pozzolanic reaction
as a function of time, up to 90 days, to assess the benefit of
using heat-treated rather than as mined zeolitic material in
concrete.
The present study complements the research performed
previously in [24] and compares the evolution of the poz-
zolanic activity of the as mined zeolite against the opti-
mised thermally treated sample at 300 �C. As a novelty
with respect to previously published studies, analysis of the
aqueous solutions have been performed and used for a
thermodynamic study that permits to evaluate the miner-
alogical stability of the new-formed minerals and their
evolution with time. This is important to predict the
chemical stability of the low crystalline phases typical of
cement systems.
Materials and methods
Thermally treated natural samples from the Palmarito
zeolite deposit were studied along the reaction with port-
landite [Ca(OH)2] in order to determine their pozzolanic
activity as a function of time. The zeolite deposit of
Palmarito is located within the province of Santiago de
Cuba, 50 km N of Santiago de Cuba city and 2 km SE of
Palmarito de Cauto town. The deposit stratigraphy is
constituted by several well-defined sedimentary sequences,
dominated by conglomeratic varieties in the base and
vitroclastic zeolitized tuffs on the top. The zeolite deposit
is related to back-arc sequences from Palaeocene–Eocene
volcanic island arcs. Due to the transformation of volcanic
shards of medium-acid composition, clinoptilolite origi-
nates substituting volcanic shards, and in a latter hydro-
thermal process mordenite substitutes for clinoptilolite.
The rocks, of green colour, are found in a well-stratified
discontinuous zone in layers of 10–15 cm thickness [25].
The crystalline components in the bulk sample were
quantified by X-ray diffraction (XRD) using the procedure
proposed by Schultz [26]. The integrated intensities (areas
under the XRD peaks) were adjusted to Gaussian functions
with subtraction of the base line, using the software
DRXWin� [27]. The comparison of the integrated inten-
sities of the diffraction peaks determines the weight frac-
tions of constituents. The XRD analysis is therefore
considered a semi-quantitative method that serves as a
proxy to identify the minerals evolution. The rock sample
from Palmarito is predominantly constituted by mordenite
(79 wt%), K-feldspar and plagioclases (21 wt%). The
observations by SEM showed aggregates of mordenite with
3214 J Mater Sci (2013) 48:3213–3224
123

poorly defined geometry in addition to other matrix min-
erals rich in iron and K-feldspars and plagioclases with
variable concentration in K, Na and Ca [24].
One gram of the thermally treated zeolites was sieved to
obtain a homogeneous sample and placed into a 75 ml
polyethylene flask with a saturated portlandite [Ca(OH)2]
solution that simulates the release of lime produced by an
OPC during the hydration reaction of a cement matrix. The
container was hermetically sealed, and the thermally trea-
ted zeolite–portlandite mixture was wet-cured at 40 �C for
7 days. It was proved that the higher pozzolanic activity
was achieved after treatment at 300 �C; therefore, the
pozzolanic activity was evaluated at this temperature by the
method described above for independent periods of 1, 7, 28
and 90 days.
The solid commercial Ca(OH)2 was calcined at 900 �C
for 2 h in order to decarbonate the chemical reagent, and
remove volatile impurities, mainly CO2. Carbonation of the
samples is a side effect that inhibits the pozzolanic reaction
because Ca(aq)2? is consumed to form CaCO3 instead of reac-
tion with the reactive aluminosilicate framework. Partial
carbonation is, however, expected during manipulation of
samples once the pozzolanic reaction has ceased due to
interaction with the atmospheric CO2(g). The Ca2? concen-
tration of a solution at portlandite saturation and 40 �C is
17.7 mmol/l. All experiments were performed in duplicate.
At the end of the reaction time, the hydrated solid
sample was filtered, washed with ethanol and desiccated
for 24 h in order to stop the hydration reaction. Then, the
mineralogy was studied by XRD and scanning electron
microscopy (SEM) to identify the products of the pozzo-
lanic reaction.
X-ray powder diffraction patterns were obtained using a
Siemens D-5000 diffractometer with a Cu anode, operating
at 30 mA and 40 kV, using divergence and reception slits
of 2 and 0.6 mm respectively, and measuring in 0.04 2hgoniometric steps for 3 s. The SEM equipment was a FEI
INSPECT microscope with an energy dispersive X-ray
analyser (EDX).
Immediately after solid–liquid separation, a fraction of
the aqueous solution was used to measure pH. Major cations
and anions in solution were measured by ICP-MS with an
Elan 6000 Perkin-Elmer Sciex analyser. The amount of
Ca(OH)2 consumed in the reaction was determined by
titration of aqueous Ca2? and OH- with ethylenediamine-
tetraacetic acid (EDTA) and diluted HCl, respectively. The
measurements obtained for Ca2? at 25 �C were normalised
with respect to a reference blank solution saturated in port-
landite at 40 �C using the geochemical code PHREEQC
[28].
In addition, analyses by Fourier transform infrared
spectroscopy (FTIR), and thermal analyses: thermogravi-
metry (TG) and differential thermal analysis (DTA) were
performed in order to confirm the mineralogical changes
observed by XRD and SEM-EDX. The derivative ther-
mogravimetry (DTG), which is the mathematical derivative
of the TG, was also used. The IR spectral analyses were
performed using a spectrometer ThermoScientific NICO-
LET 6700 and the TG/DTG-DTA analyses using a STA-
TON, STA 781 instrument, working at temperatures from
25 to 1050 �C, at a heating rate of 10 �C/min.
To study the state of equilibrium of the system, the
activities of aqueous species were calculated by entering,
in PHREEQC, the concentrations of Ca, Na, K, Mg, Al and
pH measured in solution. Aqueous Si, the dominant spe-
cies, at high pH, of which is HSiO3-, was not determined
by ICP-MS because the range of error for this species is too
large in the equipment used. Instead of the analytical
quantification, aqueous Si was equilibrated in PHREEQC
with quartz to fix a constant value (SiO2(aq) = 170 mmol/l).
This is coherent with calculations performed in previous
studies for zeolites dissolution reactions [24, 29]. The
electrochemical charge in solution was balanced with pH.
The saturation indices (SI) of minerals able to dissolve/
precipitate in the system were calculated with PHREEQC
to predict the stability of reaction products as a function of
time. The thermodynamic database used in PHREEQC was
the Lawrence Livermore National Laboratory (LLNL)
database which is a reformatted version of the EQ3/EQ6
database [30]. Crystalline C–S–H phases (with Ca/Si ratios
0.8, 1.2 and 1.6) and C–A–S phases (C3AH6 and C4AH13),
not included in LLNL database, were added from the
database THERMODDEM [31]. The dissolution reactions
of minerals, acquired from THERMODDEM, were prop-
erly adapted to fit the same aqueous species as in LLNL
(SiO2 instead of H4SiO4).
Results of the thermal treatment
XRD
From 300 to 800 �C, the crystalline phases were mainly
composed of mordenite and Na- and K-feldspar, as in the
raw sample [24]. At 900 �C, the structure of the zeolite was
destroyed and broad reflections were observed, indicating
the presence of an amorphous material. Characteristic
reflections of K-feldspars were still present at 900 and
1000 �C, although showing low intensity. At 1000 �C, the
reflections at 4.15 and 2.53 A indicated the formation of a
carnegieite-like phase (carnegieite is a crystalline phase of
aluminium silicate with ideal formula NaAlSiO4). The
same phenomenon observed in this study at 900 and
1000 �C (conversion to amorphous material followed by
formation of crystalline material with sharp diffraction
peaks) has been observed on the thermal treatment of NaX
J Mater Sci (2013) 48:3213–3224 3215
123
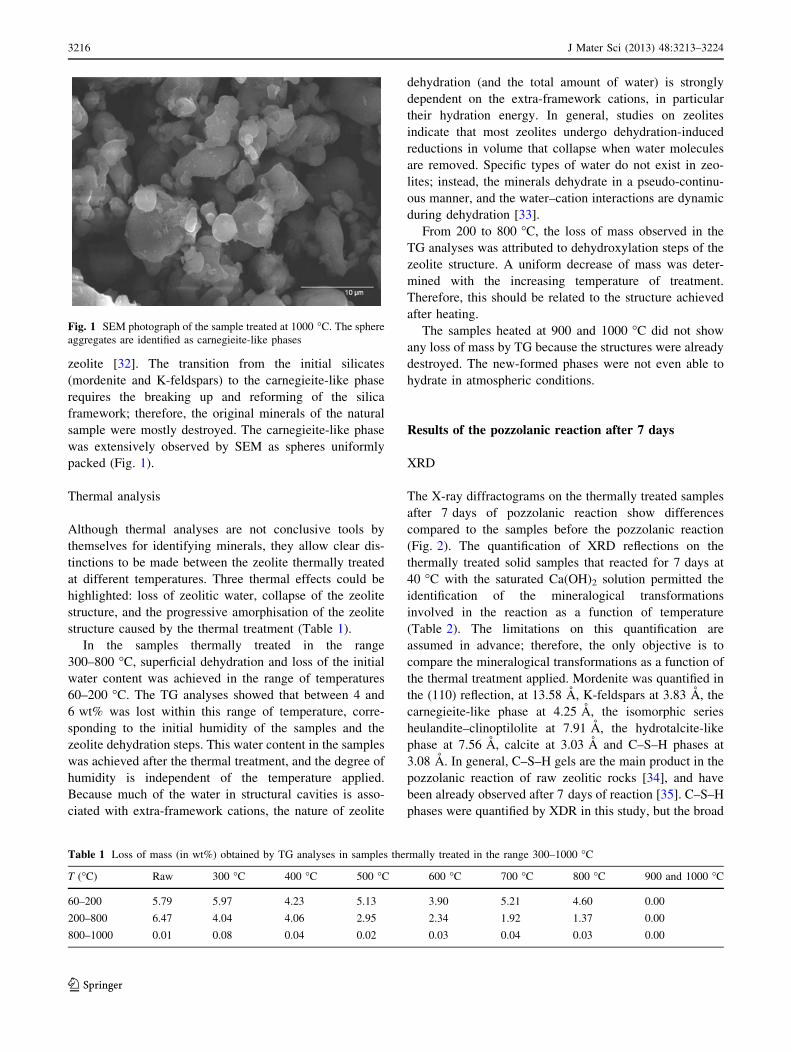
zeolite [32]. The transition from the initial silicates
(mordenite and K-feldspars) to the carnegieite-like phase
requires the breaking up and reforming of the silica
framework; therefore, the original minerals of the natural
sample were mostly destroyed. The carnegieite-like phase
was extensively observed by SEM as spheres uniformly
packed (Fig. 1).
Thermal analysis
Although thermal analyses are not conclusive tools by
themselves for identifying minerals, they allow clear dis-
tinctions to be made between the zeolite thermally treated
at different temperatures. Three thermal effects could be
highlighted: loss of zeolitic water, collapse of the zeolite
structure, and the progressive amorphisation of the zeolite
structure caused by the thermal treatment (Table 1).
In the samples thermally treated in the range
300–800 �C, superficial dehydration and loss of the initial
water content was achieved in the range of temperatures
60–200 �C. The TG analyses showed that between 4 and
6 wt% was lost within this range of temperature, corre-
sponding to the initial humidity of the samples and the
zeolite dehydration steps. This water content in the samples
was achieved after the thermal treatment, and the degree of
humidity is independent of the temperature applied.
Because much of the water in structural cavities is asso-
ciated with extra-framework cations, the nature of zeolite
dehydration (and the total amount of water) is strongly
dependent on the extra-framework cations, in particular
their hydration energy. In general, studies on zeolites
indicate that most zeolites undergo dehydration-induced
reductions in volume that collapse when water molecules
are removed. Specific types of water do not exist in zeo-
lites; instead, the minerals dehydrate in a pseudo-continu-
ous manner, and the water–cation interactions are dynamic
during dehydration [33].
From 200 to 800 �C, the loss of mass observed in the
TG analyses was attributed to dehydroxylation steps of the
zeolite structure. A uniform decrease of mass was deter-
mined with the increasing temperature of treatment.
Therefore, this should be related to the structure achieved
after heating.
The samples heated at 900 and 1000 �C did not show
any loss of mass by TG because the structures were already
destroyed. The new-formed phases were not even able to
hydrate in atmospheric conditions.
Results of the pozzolanic reaction after 7 days
XRD
The X-ray diffractograms on the thermally treated samples
after 7 days of pozzolanic reaction show differences
compared to the samples before the pozzolanic reaction
(Fig. 2). The quantification of XRD reflections on the
thermally treated solid samples that reacted for 7 days at
40 �C with the saturated Ca(OH)2 solution permitted the
identification of the mineralogical transformations
involved in the reaction as a function of temperature
(Table 2). The limitations on this quantification are
assumed in advance; therefore, the only objective is to
compare the mineralogical transformations as a function of
the thermal treatment applied. Mordenite was quantified in
the (110) reflection, at 13.58 A, K-feldspars at 3.83 A, the
carnegieite-like phase at 4.25 A, the isomorphic series
heulandite–clinoptilolite at 7.91 A, the hydrotalcite-like
phase at 7.56 A, calcite at 3.03 A and C–S–H phases at
3.08 A. In general, C–S–H gels are the main product in the
pozzolanic reaction of raw zeolitic rocks [34], and have
been already observed after 7 days of reaction [35]. C–S–H
phases were quantified by XDR in this study, but the broad
Fig. 1 SEM photograph of the sample treated at 1000 �C. The sphere
aggregates are identified as carnegieite-like phases
Table 1 Loss of mass (in wt%) obtained by TG analyses in samples thermally treated in the range 300–1000 �C
T (�C) Raw 300 �C 400 �C 500 �C 600 �C 700 �C 800 �C 900 and 1000 �C
60–200 5.79 5.97 4.23 5.13 3.90 5.21 4.60 0.00
200–800 6.47 4.04 4.06 2.95 2.34 1.92 1.37 0.00
800–1000 0.01 0.08 0.04 0.02 0.03 0.04 0.03 0.00
3216 J Mater Sci (2013) 48:3213–3224
123

reflections indicate their low crystallinity. At 300 �C, a
shift to lower d-spacing in the (200) reflection of mordenite
(9.06 A) and splitting into the range 8.95–9.03 A were
characteristic of the coexistence of the isomorphic series
heulandite–clinoptilolite (Fig. 3), as in the original raw
sample [24]. However, the coexistence of the isomorphic
series heulandite–clinoptilolite was lost at higher temper-
atures. The (200) reflection of mordenite became wider in
the range 9.07–9.05 A indicating an increasing effect of
amorphisation. Calcite is observed in all the diffractograms
from 300 to 1000 �C. This mineral does not form as a
consequence of the pozzolanic reaction since carbonates
were not present in the raw zeolite or in the thermally
treated samples, and were excluded in the pozzolanic
reaction. Then, it is assumed that calcite forms as a
consequence of the manipulation of samples after the
pozzolanic reaction. This reaction cannot be prevented but
influences in the calculation of Ca2? consumed in the
pozzolanic reaction must be corrected thereafter.
A hydrotalcite-like structure only formed at 1000 �C. This
phase was observed in a similar study as a reaction product
ofthe pozzolan/lime/water system, using paper sludge as
pozzolan thermally activated at 700 �C for 2 h [36].
SEM
The sample treated at 300 �C after pozzolanic reaction for
7 days showed web-like porous surfaces of C–S–H phases
covering mordenite and feldspar aggregates (Fig. 4a). The C–
S–H phases are the main product of the reaction. The external
morphology of aggregates was very similar to those obtained
for the raw sample without thermal treatment after pozzolanic
Fig. 2 XRD on disoriented powder of the natural zeolite from
Palmarito thermally treated from 300 to 1000 �C, after reaction with a
Ca(OH)2 saturated solution at 40 �C for 7 days. Ca calcite, Cgcarnegieite-like phase, CSH C–S–H, Fel K-feldspar, HT hydrotalcite-
like phase, Mor mordenite
Table 2 Mineralogical composition (wt%) quantified by XRD of the thermally treated zeolite in the range 300–1000 �C after 7 days of reaction
with the saturated Ca(OH)2 solution
T (�C) Mordenite Feldspars HEU–CLI C–S–H Calcite Carnegieite HT
Initial 56 20 9 15 – – –
300 58 17 6 11 8 – –
400 60 17 – 11 12 – –
500 55 20 – 10 15 – –
600 60 15 – 10 15 – –
700 56 15 – 9 20 – –
800 52 12 – 8 28 – –
900 – 8 – 6 – 86 –
1000 – 4 – 4 – 89 4
HEU heulandite, CLI clinoptilolite, HT hydrotalcite-like phase
Fig. 3 Details of random-powder XRD patterns showing the forma-
tion of a secondary clinoptilolite-type zeolite in the raw sample and
after thermal treatment at 300 �C (values given in d-spacing)
J Mater Sci (2013) 48:3213–3224 3217
123

reaction for 7 days in Fig. 4b [24]. The aspect of the C–S–H
phases presented a very disordered layer microstructure. The
pozzolanic reaction proceeds by rupture of Si–O and Al–O
bonds on the surface of the pozzolan (the thermally treated
natural zeolite) by attack of hydroxyl anions (OH-) and
reaction of the silicates and aluminates anions with Ca2? in
solution, to form C–S–H phases. The morphology of the C–S–
H phases covering mordenite and feldspar aggregates slightly
varied with the increasing temperature of treatment up to
800 �C, but the porous morphology decreased. At 800 �C,
incipient growth of C–S–H phases is observed only on very
irregular surfaces and cracked edges of mordenite and feld-
spar aggregates (Fig. 4b).
The formation of C–S–H occurs on the surface of the
aggregates that serve as substratum for the nucleation.
Therefore, the chemical analyses by EDX on the C–S–H
phases did not yield acceptable compositions since the
electron beam damaged the very thin C–S–H layers pene-
trating into the zeolite and giving a mixed composition. The
chemical compositions obtained by EDX revealed a
decreasing Ca content with the increasing temperature, while
the silica content increased shortly from 72 to 78 wt%
(Table 3). These results indicated that higher content of
Ca2? reacted in the pozzolanic reaction at lower
temperatures, as supported by the determination of the
pozzolanic activity (see below) and also the increasing Ca/Si
ratio with the decreasing temperature of treatment. The
mixed compositions obtained by the EDX analyses on
external surfaces did not permit to calculate the atomic Ca/Si
ratios of the C–S–H phases; however, an approximation was
performed assuming an ideal composition for the mordenite:
K0.9Na2.1Ca1.5Al6Si30O72:22H2O [29], occluded under the
C–S–H recovering. The selected composition corresponds to
a mordenite originated by diagenetic alteration in volcanic
tuffs (the same origin as in Palmarito). Assuming that Al did
not react to form C–A–H phases and remained constant in the
mordenite, and considering that the ideal composition
maintained the Si/Al and Ca/Al ratios at 5 and 0.83,
respectively, the excesses in Si and Ca were accounted as
part of the new-formed C–S–H phases. Then, the Ca/Si ratios
were calculated as 1.2 and 0.9 for the samples treated at 300
and 400 �C, respectively. At higher temperatures, the pres-
ent assumption lost validity because the thermal treatments
are able to vary the framework Si/Al ratio in mordenite. In
any case, taking into account this calculation and the aspect
of the C–S–H phases observed by SEM, a decreasing Ca/Si
ratio with the increasing temperature of treatment could be
inferred.
Fig. 4 Aspect of reaction products identified by SEM after 7 days of
pozzolanic reaction a nucleation of C–S–H phases recovering
aggregates of mordenite in the sample treated at 300 �C, and
b mordenite1 and feldspar2 aggregates in the sample treated at
800 �C with incipient C–S–H phases3 nucleating on irregular surfaces
Table 3 Chemical compositions in oxides (wt%) obtained by EDX analyses on samples thermally treated in the range 300–800 �C after 7 days
of pozzolanic reaction
Oxide 300 �C 400 �C 500 �C 600 �C 700 �C 800 �C
Na2O 0.8 ± 1.0 1.3 ± 0.8 1.5 ± 0.4 2.8 ± 0.8 1.4 ± 0.9 2.7 ± 0.7
Al2O3 11.6 ± 1.0 12.0 ± 0.7 11.3 ± 0.3 12.8 ± 0.8 13.2 ± 1.0 12.7 ± 1.3
SiO2 72.0 ± 1.3 72.5 ± 1.0 76.6 ± 1.1 76.0 ± 1.3 77.2 ± 1.1 78.3 ± 1.4
K2O 0.7 ± 0.5 1.5 ± 0.4 1.0 ± 0.4 0.9 ± 0.1 1.5 ± 0.9 1.6 ± 0.8
CaO 14.9 ± 0.4 12.7 ± 0.8 9.6 ± 0.8 7.5 ± 0.5 6.6 ± 0.4 4.8 ± 0.6
3218 J Mater Sci (2013) 48:3213–3224
123

Consumption of Ca2? in solution
The reaction between the thermally treated zeolites and the
Ca(OH)2 at 40 �C after 7 days of reaction showed that the
higher pozzolanic activity was achieved for the sample
treated at 300 �C (16.1 out of 17.7 mmol/l of portlandite
solution was consumed, ideally to form C–S–H and other
cement phases). The pozzolanic activity slightly decreased
with the increasing temperature of treatment up to 900 �C,
but at 1000 �C, the lack of mordenite and K-feldspars and
formation of a carnegieite-like phase which is chemically
inert and alkali resistant, reduced considerably the searched
reactivity of the solid (Fig. 5). A correction of the pozzo-
lanic activity was calculated assuming that the calcite
quantified by XRD corresponded to Ca2? adsorbed on the
surface of mordenite aggregates that did not react in the
pozzolanic reaction. Once the reaction was terminated, and
the solid and aqueous phases were separated, this Ca2?
carbonated easily during manipulation of the solid samples
by interaction with atmospheric CO2(g). The EDX analyses
confirmed high concentration of calcium carbonates on the
surface of aggregates, indicating that calcite did not pre-
cipitate as a secondary phase in the pozzolanic reaction but
as a residue of the non-reactive Ca2? that formed small
crystals with very poor morphology. The mass of calcite
quantified by XRD was transformed into concentration of
Ca2? required to form this mineral and then discounted
from the calculated Ca2? consumed in the pozzolanic
reaction. This assumption reduced moderately the pozzo-
lanic activity of samples treated up to 800 �C. At 900 �C,
calcite could not be quantified, and the correction at this
temperature was not performed, but the low pozzolanic
activity achieved compared to that obtained at lower tem-
peratures discarded any interest to study the reaction at
900 �C or higher temperatures in further detail.
Vigil de la Villa et al. [24] postulated that part of the
Ca2? consumed in solution, normally attributed to the
pozzolanic reaction, could be spent by an exchange reac-
tion between the original zeolite and a secondary zeolite or
by a dissolution/precipitation reaction, also to form a sec-
ondary zeolite, because for some zeolites (e.g. clinoptilo-
lite) the Ca-dominant type is the most thermodynamically
stable variety [37]. In agreement with this argument, the
calcite present in samples after the pozzolanic reaction,
detected in the range 300–800 �C, could have formed if
hydrated Ca2? was weakly adsorbed either on exchange
sites or at the external surface of the zeolite and would
react easily with the atmospheric CO2(g). This spontaneous
reaction would create a large number of nanocrystals of
calcite, not observable by SEM. The fact that calcite was
not detected at 900 �C after the pozzolanic reaction would
confirm that once the initial zeolite is destroyed, the weak
adsorption of Ca2? in (or on) the zeolite, and therefore the
carbonation, can no longer occur.
These results were compared to previous determinations
obtained for the non-treated raw zeolite using the same
methodology after 7 days of reaction [24]. The determi-
nation of the pozzolanic activity, even with the correction
of consumed Ca2? (not performed for the raw sample),
showed that heating at 300 �C for 5 h is the optimal con-
dition to improve the pozzolanic activity.
Results of the pozzolanic reaction for the sample
treated at 300 �C
XRD
Mordenite and K-feldspars were the sole mineral phases
identified by XRD after the thermal treatment at 300 �C.
Although the thermal effect produced structural changes on
the minerals, they were not evidenced by XRD, and the
quantification of the sample heated at 300 �C provided the
same mineral distribution as that in the raw sample [24].
The pozzolanic reaction evolved as a function of time
consuming mordenite and generating C–S–H phases as the
main product of the reaction (Table 4). A zeolite-type
phase within the isomorphic series heulandite–clinoptilo-
lite was detected and quantified after only one day of
reaction; however, this phase did not evolve significantly as
a function of time. Calcite was also quantified; however, as
previously reported, this mineral phase did not occur dur-
ing the pozzolanic reaction.
Fig. 5 Consumption of Ca2? in the pozzolanic reaction of the
zeolites thermally treated in the range 300–1000 �C after 7 days and
comparison of results with the non-treated raw zeolite. White areas
show the Ca2? concentration assumed in the precipitation of calcite,
not involved in the pozzolanic reaction
J Mater Sci (2013) 48:3213–3224 3219
123

SEM
After 1 day of reaction, the mordenite aggregates presented
microcrystalline porous lattices and C–S–H phases nucle-
ating on the cracked surfaces (Fig. 6a). The SEM images
show a porous network with cavities. These cavities are not
produced by the dissolution of mordenite; they are the
result of aggregation of the initial small and poorly crys-
talline mordenite particles interconnected by the incipient
growth of C–S–H phases. The reaction time favoured the
crystallisation of C–S–H phases on the surface of aggre-
gates, but after 28 days, the morphology and composition
persisted without any significant change up to 90 days
(Fig. 6b, c), indicating that the reaction ran to near com-
pletion and stopped due to surface layer of C–S–H block-
ing access to zeolite reactant.
Consumption of Ca2? in solution
In addition to the standard times selected (1, 7, 28 and
90 days), the pozzolanic activity was also determined
after 2 and 6 h and 3 days in order to establish a detailed
path of reaction at short-term. It was observed that the
reaction occurred rapidly and consumed most of the
aqueous Ca2? available within the first week (Fig. 7).
This is related with the structure of the zeolite after the
thermal treatment. Due to the low crystallinity of the raw
zeolite, the thermal treatment at 300 �C caused limited
processes of dissolution and re-crystallisation on the sur-
face of mordenite aggregates. The same correction per-
formed for the samples thermally treated in the range of
temperatures 300–1000 �C that reacted for 7 days with
the saturated Ca(OH)2 solution was accomplished at
300 �C after 1, 7, 28 and 90 days, deducting the Ca2?
consumed to form calcite to the Ca2? determined in
solution. After 2 and 6 h and 3 days, the solid samples
were not analysed, and therefore the correction could not
be performed. The correction decreased shortly the con-
centration of Ca2? consumed in the pozzolanic reaction.
The pozzolanic activity achieved with the zeolite treated
at 300 �C was considerably high after 7 days and
increased briefly after 28 days. Afterwards, it remained
almost constant, indicating the completion of the pozzo-
lanic reaction observed by XRD and SEM.
Table 4 Mineralogical composition (wt%) in the initial sample
thermally treated at 300 �C before the pozzolanic reaction and after 1,
7, 28 and 90 days
Time Mordenite Feldspars HEU–CLI Calcite C–S–H
Initial 79 21 – – –
1 day 66 13 6 8 7
7 days 58 17 6 8 11
28 days 51 19 5 6 19
90 days 49 21 5 6 19
Fig. 6 Aspect of reaction products identified by SEM in the sample treated at 300 �C a after 1 day; b after 28 days, and c after 90 days of
pozzolanic reaction
Fig. 7 Consumption of Ca2? in the pozzolanic reaction of the zeolite
treated at 300 �C as a function of time. The correction of results
(white squares) assumed the precipitation of calcite as a side effect
3220 J Mater Sci (2013) 48:3213–3224
123

Fourier-transform infrared spectroscopy
The analyses by FTIR showed wide and poorly defined
bands for the initial zeolite heated at 300 �C before the
pozzolanic reaction, indicating that the material is rather
amorphous. Not many differences were observed by FTIR
in the pozzolanic reaction as a function of time, but in
general, the IR bands became wider (Fig. 8).
The bands at 1429 and 875 cm-1 are normally assigned to
carbonates. The band at 875 cm-1 was not observed in the
initial sample, but it was present in all the IR spectra of
samples after the pozzolanic reaction attributed to the car-
bonation of samples during manipulation once the pozzola-
nic reaction finished.
The IR band at 1047 cm-1 in the initial sample progres-
sively shifted as a function of the reaction time to 1034 cm-1
after 90 days of reaction. This band was attributed to
asymmetrical stretching Si–O(Si) and Si–O(Al) vibrations in
external tetrahedral sites, and the shift indicates that alu-
minium species are inserted into the framework of zeolite,
which is consistent with the formation of the heulandite–
clinoptilolite isomorphic series from mordenite. This effect
was also observed in the pozzolanic reaction of the zeolite
without thermal treatment [24]. In addition to the shift, the
decrease in the intensity of this IR band indicated the con-
sumption of mordenite in pozzolanic reaction.
The band at 671 cm-1, and the shoulder at 970 cm-1
found in the spectrum after 90 days of pozzolanic reaction
is assigned to C–S–H phases and is characteristic of C–S–
H(I)-type phases [38].
Thermal analysis
The thermal analyses (DTG and DTA) were used to
identify structural changes in the initial zeolite compared
with the samples that reacted in the pozzolanic reaction.
Despite the low crystallinity of the thermally treated
samples before and after the pozzolanic reaction confirmed
by low intensity peaks in DTA and location in non-fixed
positions (i.e. the peaks were found at certain temperatures
within range shift from one sample to another), four dif-
ferent phenomena were identified by DTG (Fig. 9) and
DTA (not shown):
In the initial zeolite, a single broad endothermic peak is
observed with a maximum localised at 117 �C, which is
attributed to zeolitic water. During the pozzolanic reaction,
this peak was modified substantially. Two endothermic
peaks appear after only 1 day of reaction, localised at 60
and 117 �C, which are assigned respectively to hygro-
scopic water in low crystalline C–S–H phases and the
zeolitic water mentioned above.
An endothermic weak peak at 450 �C, observed in the
thermogram, was attributed to structural changes in the
poorly crystalline zeolite [19–21].
The endothermic peaks localised at 650 and 800 �C are
assigned to isomorphic changes of the secondary zeolite
formed within the isomorphic series heulandite–clinoptil-
olite that involve a change in the structure and decarbon-
ation of calcite, respectively. Both endothermic processes
were also observed during the pozzolanic reaction using a
non-thermally treated zeolite sample [24].
Specific surface area
The specific BET surface area of the solid samples treated
at 300 �C increased as the pozzolanic reaction evolved
(Table 5). The increase in BET surface area evolved as a
function of time in agreement with the consumption of
Ca2? in solution, and it is mainly attributed to the
Fig. 8 FTIR spectra of the initial sample (before the thermal treatment
at 300 �C) and after 1, 7, 28 and 90 days of pozzolanic reaction
Fig. 9 DTG curves of the initial sample (before the thermal treatment
at 300 �C) and after 1, 7, 28 and 90 days of pozzolanic reaction
J Mater Sci (2013) 48:3213–3224 3221
123

precipitation of C–S–H-like phases on the mordenite
aggregates, as observed by SEM.
Thermodynamic stability
Thermodynamic modelling is a valuable tool to predict the
stability of minerals involved in the pozzolanic reaction
and reaction products that could potentially form (i.e.
C–A–H phases).
The SI shows the tendency of equilibrium for the min-
erals of interest to precipitate or dissolve under the
experimental conditions [39]. The SI for mordenite, C–S–H
and C–A–H phases were calculated from the activities of
species in solution and the equilibrium constants of the
dissolution reactions for the minerals evaluated (Fig. 10).
A positive SI indicates that the aqueous solution is over-
saturated with respect to a mineral and, therefore, that the
mineral is favoured to precipitate. A negative value of the
SI indicates that the aqueous solution is undersaturated
with respect to a mineral and, therefore, that the mineral is
favoured to dissolve. The SI for mordenite increased
shortly for the first day of reaction, reached a maximum
after 3 days of reaction and decreased after that to values
near to zero after 28 and 90 days. This indicates that
mordenite was close to equilibrium conditions at any time
with some tendency to dissolve after 3 days. The C–S–H
phases with higher Ca/Si ratio were predicted to be more
stable at short term (before 3 days), which is consistent
with the nucleation of Ca2? on the surface of the mordenite
aggregates. After that time, C–S–H phases with lower Ca/
Si ratio were predicted to be more stable. The tobermorite-
type C–S–H mineral with Ca/Si = 0.8 is the only C–S–H
phase stable (SI [ 0) after approximately 12 days of
reaction up to 90 days. This phase was confirmed to form
by heterogeneous nucleation on the solid–liquid interface
in the pozzolanic reaction of a zeolitic tuff [40]; however,
other studies [5, 41] showed that a shift in the main C–S–H
position of the XRD reflection from 3.06 to 3.07 A
d-values (3.08 A in the present study) indicated a varying
Ca/Si range in the composition and changes in structural
parameters in comparison to an ideal synthesised toberm-
orite-type C–S–H phase.
None of the experimental evidence indicated that C–A–H
phases could form in the studied pozzolanic reaction.
Moreover, the thermodynamic model supported that these
phases were far too unsaturated to precipitate under the
experimental conditions. Low and stable concentrations of
Al(aq)3? ( the dominant species, at high pH, of which is
AlO2-) were determined in solution without any observed
tendency as a function of time (in the range 10-4–10-5 M).
This Al(aq)3? , originated by the dissolution of the activated
zeolite in the alkaline medium, could partially be incor-
porated into the C–S–H phases (to form C–A–S–H phases)
but not C–A–H.
Discussion
The thermal treatment of the natural zeolite from Palmarito
at 300 �C confirmed an increase in the pozzolanic activity
with respect to the non-treated zeolite because the zeolite
destabilised its structure and converted to a more reactive
phase (metazeolite), at a temperature below the structural
collapse. However, the thermal treatment at higher tem-
peratures than 300 �C had a negative effect, in agreement
with [19, 21], because the zeolite converted to a weaker
reactive phase. Liebig and Althaus [23] had already
showed that the initial mineral composition of a natural
zeolite controls the response to the thermal treatment, and
that the heating of the zeolite can even reduce the
Table 5 Specific BET surface area (m2/g) as a function of the
reaction time for the sample thermally treated at 300 �C
Time BET surface (m2/g)
Initial 15.5 ± 0.1
6 h 17.1 ± 0.1
1 day 22.6 ± 0.1
7 days 27.5 ± 0.2
28 days 35.4 ± 0.2
90 days 39.0 ± 0.3
Fig. 10 Saturation indices of evaluated minerals as a function of time
(in logarithmic scale)
3222 J Mater Sci (2013) 48:3213–3224
123

compressive strength of cement–pozzolan mortars. This
justifies the evaluation accomplished on the effect of the
thermal treatment at different temperatures in the range
300–1000 �C because the performance improvement in the
pozzolanic activity is specific of the starting material and
cannot be directly derived from other studies carried out on
different materials.
The thermal treatment necessary to destabilise a zeolite
is usually related to its framework topology and the Si/Al
ratio. Vigil et al. [24] predicted that the required temper-
ature to start decomposing the silicoaluminate network of
the mordenite sample used in the present study (Si/Al C 5)
should be higher than 400 �C, since [19] reported the better
pozzolanic activity for a heulandite-type zeolite (Si/
Al \ 4) after thermal treatment at that temperature. Sur-
prisingly, the pozzolanic activity of the natural zeolite
thermally treated at 300 �C required lower temperature of
treatment, which can be considered as an energy
improvement.
Partial carbonation of the zeolite samples was detected
after the pozzolanic reaction. The Ca2? consumed to form
CaCO3 was calculated and discounted from the pozzolanic
activity because the carbonation was a secondary effect
attributed to weakly adsorbed Ca on external or
exchangeable sites in the zeolite that reacted with atmo-
spheric CO2 during the manipulation of the samples.
C–S–H phases formed by means of the pozzolanic
reaction between the thermally treated zeolite and the
Ca(OH)2 solution simulating the release of lime. These
phases are considered responsible for the mechanical
strength of hydrated Portland cements. In addition, their
structure controls important physical properties of cement
pastes, such as shrinkage, creep, porosity, permeability and
elasticity. The formation of low-density C–S–H-like phases
at early stages evolved to denser porous structures at later
stages as a function of the pozzolanic reaction rate influ-
encing the increase in the specific surface area.
In agreement with the experimental observations, the
thermodynamic study predicted that a tobermorite-type
C–S–H phase (Ca/Si = 0.8) was the most stable phase at
long-term, while C–A–H phases were too unsaturated to
form in the system.
Materials such as fly ashes and silica fumes are also
frequently examined in the scientific literature in similar
fashion as raw or calcined natural pozzolans, e.g. [42], but
the use of any of these materials as admixtures for concrete
production must be evaluated according to the local
availability, costs and energy saving reasons. Natural
zeolites are abundant materials, already broadly consumed
in the construction industry in countries like Cuba [1] or
China [43]. Scientific studies as the present one should be
of use to promote better performance of the materials with
added technical improvements.
The chemical and mineralogical results obtained in the
present study are promising to consider the zeolite treated
at 300 �C a good pozzolan. However, in a further study, the
mechanical behaviour of both materials, the raw and the
thermally treated zeolite at 300 �C, should be studied in
their performance as addition to a cement mortar in order
to confirm or reject the advantages of the thermal
treatment.
Conclusions
The natural mordenite-type zeolite from Palmarito (Cuba)
demonstrated good pozzolanic properties once thermally
treated at 300 �C for 5 h. The thermal treatment at 300 �C
did not modify significantly the mineralogy of the zeolite but
activated the zeolite surface creating a more reactive mate-
rial, and increasing slightly its pozzolanic activity. Thermal
treatment at higher temperatures (400–1000 �C) is not rec-
ommended because the pozzolanic activity decreases. With
the increasing temperatures of treatment, the dissolution/re-
crystallisation reactions resulted in larger compaction of
aggregates and formation of lower size but well-defined
crystals that partially inhibited the pozzolanic reaction.
In the zeolite treated at 300 �C, C–S–H-like phases
formed on the aggregates of mordenite according to the
pozzolanic reaction. The reaction proceeded rapidly during
the first week of reaction indicating the completion of the
pozzolanic reaction due to C–S–H blocking access to
zeolite reactant after 28 days. The thermal treatment of the
zeolite at 300 �C shortly increased the pozzolanic activity
compared to the as mined non-activated sample.
The mechanical performance of the thermally treated
zeolite in a cement mortar with different ratios of zeolites
replacing cement (ASTM test) should be studied to con-
clusively evidence the pozzolanic activity of the thermally
treated zeolite. In addition, the proposed further study
should clarify the advantage of thermal treatment of the
zeolite in comparison with the non-treated material.
References
1. Colella C, de Gennaro M, Aiello R (2001) In: Bish DL, Ming DW
(eds) Reviews in mineralogy and geochemistry. Mineralogical
Society of America, Washington
2. Mertens G, Snellings R, Van Balen K, Bicer-Simsir B, Verlooy P,
Elsen J (2009) Cem Concr Res 39(3):233
3. Rosell-Lam M, Villar-Cocina E, Frıas M (2011) Constr Build
Mater 25(2):644
4. Cook DJ (1986) In: Swamy RN (ed) Cement replacement mate-
rials. Surrey University Press, London
5. Snellings R, Mertens G, Hertsens S, Elsen J (2009) Microporous
Mesoporous Mater 126(1–2):40
J Mater Sci (2013) 48:3213–3224 3223
123

6. Colak A (2003) Cem Concr Res 33(4):585
7. Colak A (2002) Cem Concr Res 32(1):109
8. Kaid N, Cyr M, Julien S, Khelafi H (2009) Constr Build Mater
23(12):3457
9. Rodrıguez-Camacho RE, Uribe-Afif R (2002) Cem Concr Res
32(12):1851
10. Fragoulis D, Chaniotakis E, Stamatakis MG (1997) Cem Concr
Res 27(6):889
11. Mehta PK (1981) Cem Concr Res 11(4):507
12. Frıas M, Sanchez de Rojas MI, Cabrera J (2000) Cem Concr Res
30(2):209
13. Sanchez de Rojas MI, Luxan MP, Frıas M, Garcıa N (1993) Cem
Concr Res 23(1):46
14. Sanchez de Rojas MI, Frıas M (1996) Cem Concr Res 26(2):203
15. Chan SYN, Ji X (1999) Cem Concr Compos 21(4):293
16. Poon CS, Lam L, Kou SC, Lin ZS (1999) Constr Build Mater
13(8):427
17. Sanchez de Rojas MI, Rivera J, Frıas M (1999) Cem Concr Res
29(6):945
18. Frıas M, Sanchez de Rojas MI, Rodrıguez O, Garcıa R, Vigil de
la Villa R (2008) Adv Cem Res 20(1):23
19. Perraki T, Kakali G, Kontori E (2005) J Therm Anal Calorim
82(1):109
20. Cruciani G (2006) J Phys Chem Solids 67(9–10):1973
21. Habert G, Choupay N, Montel JM, Guillaume D, Escadeillas G
(2008) Cem Concr Res 38(7):963
22. Shi C, Day RL (2001) Cem Concr Res 31(5):813
23. Liebig E, Althaus E (1998) Cem Concr Res 28(4):567
24. Vigil de la Villa R, Fernandez R, Garcıa R, Villar-Cocina E, Frıas
M (2009) Microporous Mesoporous Mater 126(1–2):125
25. Orozco G, Rizo R (1998) Acta Geologica Hipanica 33(1–4):335
26. Schultz LG (1964) Quantitative interpretation of the mineralog-
ical composition from X-ray and chemical data for the Pierre
Shale, US Geol Surv Prof Pap 391C
27. Primo V (1999) Powder Diffr 14(1):70
28. Parkhurst DL, Appelo CAJ (1999) User’s guide to PHREEQC
(version 2)—a computer program for speciation, batch-reaction,
one-dimensional transport, and inverse geochemical calculations.
US Geological Survey, Reston
29. Chipera SJ, Bish DL (1999) In: Mermut A, Kodama H, Torrance
JK (eds) Clays for Our Future. Proceedings of the 11th Annual
International Clay Conference, Ottawa
30. Wolery TJ (1992) EQ3/6, a software package for geochemical
modeling of aqueous systems: package overview and installation
guide (Version 7.0), Lawrence Berkeley Laboratory, California
31. Blanc P, Lassin A, Piantone P (2007) Thermoddem a database devoted
to waste minerals, BRGM, Orleans. http://thermoddem.brgm.fr
32. Lee HJ, Kim YM, Kweon OS, Kim IJ (2007) J Eur Ceram Soc
27(2–3):561
33. Bish DL, Carey JW (2001) Rev Mineral Geochem 45(1):403
34. Martınez-Ramırez S, Blanco-Varela MT, Erena I, Gener M
(2006) Appl Clay Sci 32(1–2):40
35. Perraki T, Kakali G, Kontoleon F (2003) Microporous Meso-
porous Mater 61(1–3):205
36. Garcıa R, Vigil de la Villa R, Rodrıguez O, Frıas M (2009) Appl
Clay Sci 43(3–4):331
37. Benning LG, Wilkin RT, Barnes HL (2000) Am Mineral
85(3–4):495
38. Conjeaud M, Boyer H (1980) Cem Concr Res 10(1):61
39. Appelo CAJ, Postma D (2005) Geochemistry. Groundwater and
pollution, Leiden
40. Drzaj B, Hocevar S, Slokan M, Zajc A (1978) Cem Concr Res
8(6):711
41. Garbev K, Beuchle G, Bornefeld M, Black L, Stemmermann P
(2008) J Am Ceram Soc 91(9):3005
42. Ahmadi B, Shekarchi M (2010) Cem Concr Compos 32(2):134
43. Feng N, Peng G (2005) Constr Build Mater 19(8):579
3224 J Mater Sci (2013) 48:3213–3224
123