Evidence of a relationship between age and otolith weight in the Chilean jack mackerel, Trachurus...
10
Evidence of a relationship between age and otolith weight in the Chilean jack mackerel, Trachurus symmetricus murphyi (Nichols) $ Miguel Araya a , Luis A. Cubillos b,* , Margarita Guzma ´n a , Jessica Pen ˜ailillo a , Aquiles Sepu ´lveda b a Departamento de Ciencias del Mar, Universidad Arturo Prat, Casilla 121, Iquique, Chile b Instituto de Investigacio ´n Pesquera, Casilla 350, Talcahuano, Chile Received 30 March 1999; received in revised form 27 September 1999; accepted 13 July 2000 Abstract The relationship between age and otolith weight was examined in the Chilean jack mackerel, Trachurus symmetricus murphyi (Nichols). The purpose was to present evidence for the relationship in order to obtain a rapid and inexpensive method of ageing individuals of T. s. murphyi. The evidence of the otolith age–weight relationship is presented according to: (a) the persistence and progression of modes in otolith weight frequency distributions of fishery-caught individuals during 1996, and (b) establishing a direct relationship between the otolith weight and age. The fish were aged using the density of daily growth increments, while the number of modes in the otolith weight frequency data (OWFD) were analyzed using MIX and MULTIFAN computer software. According to MIX, therewere between 8 and 10 modes in the OWFD and the average otolith mass growth rate (mg yr 1 ) was 8.256 mg yr 1 , under the assumption that modes in the data represent year classes. Using MULTIFAN, the best fit was a 10 age-class model and the otolith mass growth rate ranged between 7.22 mg yr 1 in the first two age classes and 7.07 mg yr 1 in the last age classes. The estimated ages of 52 fish ranged between 1.4 and 12.7 yr, and the relationship between otolith weight and age was linear and statistically significant (r 2 0:42, n 44, P < 0:05). The inverse relationship, using the otolith weight as the independent variable, was also linear, but the intercept was statistically equal to zero. The slope of a regression forced to pass through the origin was 0.119 yr mg 1 with a 95% confidence interval between 0.104 and 0.134 yr mg 1 . We concluded that the results support the idea that otolith weight is related with the age of jack mackerel and that it may be a useful tool of rapidly estimating the age of individuals and probably the age structure of jack mackerel. However, alternative methods of ageing should be applied because real ages of jack mackerel are far of clear. # 2001 Elsevier Science B.V. All rights reserved. Keywords: Otolith weight; Age; Central-southern Chile; Jack mackerel; Trachurus symmetricus murphyi 1. Introduction Determination of age in some species of the Genus Trachurus can be difficult using conventional methods of otolith reading (Farin ˜a Perez, 1983; Morales-Nin, 1987; Arruda, 1987; Kerstan, 1995). This seems to be Fisheries Research 51 (2001) 17–26 $ This work was presented in the Second International Symposium on Fish Otolith Research and Application, Bergen, Norway, 20–25 June 1998. * Corresponding author. Tel.: 56-41-584820; fax: 56-41-583939. E-mail addresses: [email protected] (M. Araya), [email protected] (L.A. Cubillos). 0165-7836/01/$ – see front matter # 2001 Elsevier Science B.V. All rights reserved. PII:S0165-7836(00)00233-2
Transcript of Evidence of a relationship between age and otolith weight in the Chilean jack mackerel, Trachurus...
Evidence of a relationship between age andotolith weight in the Chilean jack mackerel,Trachurus symmetricus murphyi (Nichols)$
Miguel Arayaa, Luis A. Cubillosb,*, Margarita GuzmaÂna,Jessica PenÄaililloa, Aquiles SepuÂlvedab
aDepartamento de Ciencias del Mar, Universidad Arturo Prat, Casilla 121, Iquique, ChilebInstituto de InvestigacioÂn Pesquera, Casilla 350, Talcahuano, Chile
Received 30 March 1999; received in revised form 27 September 1999; accepted 13 July 2000
Abstract
The relationship between age and otolith weight was examined in the Chilean jack mackerel, Trachurus symmetricus
murphyi (Nichols). The purpose was to present evidence for the relationship in order to obtain a rapid and inexpensive method
of ageing individuals of T. s. murphyi. The evidence of the otolith age±weight relationship is presented according to: (a) the
persistence and progression of modes in otolith weight frequency distributions of ®shery-caught individuals during 1996, and
(b) establishing a direct relationship between the otolith weight and age. The ®sh were aged using the density of daily growth
increments, while the number of modes in the otolith weight frequency data (OWFD) were analyzed using MIX and
MULTIFAN computer software. According to MIX, there were between 8 and 10 modes in the OWFD and the average otolith
mass growth rate (mg yrÿ1) was 8.256 mg yrÿ1, under the assumption that modes in the data represent year classes. Using
MULTIFAN, the best ®t was a 10 age-class model and the otolith mass growth rate ranged between 7.22 mg yrÿ1 in the ®rst
two age classes and 7.07 mg yrÿ1 in the last age classes. The estimated ages of 52 ®sh ranged between 1.4 and 12.7 yr, and the
relationship between otolith weight and age was linear and statistically signi®cant (r2 � 0:42, n � 44, P < 0:05). The inverse
relationship, using the otolith weight as the independent variable, was also linear, but the intercept was statistically equal to
zero. The slope of a regression forced to pass through the origin was 0.119 yr mgÿ1 with a 95% con®dence interval between
0.104 and 0.134 yr mgÿ1. We concluded that the results support the idea that otolith weight is related with the age of jack
mackerel and that it may be a useful tool of rapidly estimating the age of individuals and probably the age structure of jack
mackerel. However, alternative methods of ageing should be applied because real ages of jack mackerel are far of clear.
# 2001 Elsevier Science B.V. All rights reserved.
Keywords: Otolith weight; Age; Central-southern Chile; Jack mackerel; Trachurus symmetricus murphyi
1. Introduction
Determination of age in some species of the Genus
Trachurus can be dif®cult using conventional methods
of otolith reading (FarinÄa Perez, 1983; Morales-Nin,
1987; Arruda, 1987; Kerstan, 1995). This seems to be
Fisheries Research 51 (2001) 17±26
$ This work was presented in the Second International
Symposium on Fish Otolith Research and Application, Bergen,
Norway, 20±25 June 1998.* Corresponding author. Tel.: �56-41-584820;
fax: �56-41-583939.
E-mail addresses: [email protected] (M. Araya),
[email protected] (L.A. Cubillos).
0165-7836/01/$ ± see front matter # 2001 Elsevier Science B.V. All rights reserved.
PII: S 0 1 6 5 - 7 8 3 6 ( 0 0 ) 0 0 2 3 3 - 2

the case with the Chilean jack mackerel, Trachurus
symmetricus murphyi (Nichols), because there are
notable differences in age and growth studies (Kaiser,
1973; Pavez and Saa, 1978; Abramov and Kotlyar,
1980; Castillo and Arrizaga, 1987; Nekrasov, 1982,
1987; Kochkin, 1994; Cubillos and Grechina, 1998).
Systematic errors and differences in the interpretation
of age produce differences in estimates of growth rate,
von Bertalanffy growth parameters, and the index of
growth performance of the jack mackerel (Cubillos
and Arancibia, 1995).
Fish otoliths are employed as indicators of age,
but are useful only when age determination can be
precise and accurate. Conventional methods of age
determination are based on examination of growth
increments in ®sh otolith structure and correct
determination of age supposes that annuli in otoliths
can be identi®ed and counted. In otoliths of T. s.
murphyi however, the sequence of a single opaque
ring followed by a single hyaline ring is not alway-
sclear, but may contain double or multiple rings.
This problem has also been observed in Trachurus
trachurus trachurus of the North Atlantic (FarinÄa
Perez, 1983; Arruda, 1987) and Trachurus trachurus
capensis of Namibia and South Africa (Hatanaka
and Kawahara, 1985; Shcherbich, 1992; Kerstan,
1995).
The objective of the present study is to look for
alternative methods of determining the age of jack
mackerel. Recent research indicates that there is a
direct relationship between ®sh otolith weight and age
(Pawson, 1990; Radtke and Hourigan, 1990; Fletcher,
1991, 1995; Worthington et al., 1995a,b). This rela-
tionship has great potential for estimating age and age
structure in ®sh (Worthington et al., 1995a). It is a
faster and inexpensive method and would be prefer-
able when the ages of a great number of individuals are
required, e.g. the age composition of jack mackerel
catches.
In this paper we present evidence for the relation-
ship between age and otolith weight for T. s. murphyi,
in accordance with the following objectives: (1) to
investigate the persistence and modal progression
in the otolith weight frequency distributions of ®sh-
ery-caught individuals, and (2) to analyze the relation-
ship between otolith weight and age of some
individuals.
2. Materials and methods
2.1. Sampling
Between January and December 1996, specimens
of T. s. murphyi were collected from catches of the
purse-seine ¯eet operating in the central-southern area
off Chile (33±398S). Length±frequency data were
obtained as daily random samples from the catches
of vessels at the main places of landing and weekly
samples were analyzed to obtain biological data, i.e.
®sh weight, ovary weight, maturity and otoliths. A
total of 10 pairs of otoliths were collected for each
1 cm length class, cleaned, and stored dry in paper
envelopes. Body size was measured as fork length
(FL) to the nearest centimeter.
2.2. Otolith weight frequency
Sagittal otoliths of each ®sh were washed with
distilled water and dried over 12 h in an oven at
608C to constant weight. Undamaged otoliths were
then weighed individually to the nearest 0.0001 g. No
signi®cant difference was found (two-tailed tests)
between right and left otolith weight (t2;a�0:01;d:f:�32
� 2:724, tobserved � 1:490), nor between readers
(t2;a�0:01;d:f:�32 � 2:724, tobserved � ÿ0:457), nor
between wet and dry otolith weight
(t2;a�0:01;d:f:�32 � 2:724, tobserved � 1:325); therefore,
wet weights were used in subsequent analyzes. The
otolith weight data were compiled into quarterly
weight±frequency histograms (n � 1497), from which
the number of modes was analyzed using the MIX
(MacDonald and Pitcher, 1979; MacDonald and
Green, 1988) and MULTIFAN (Fournier et al.,
1990) computer programs, on the assumption that
the modes in the data represent year classes. These
programs, especially MULTIFAN, are designed to
help in discriminating between modes in length±fre-
quency data, but we used them to solve the number of
modes in the otolith weights. The data were summar-
ized within quarterly time series so that the ®rst
quarter is de®ned as the trimester from January to
March (designated as month 1), the second from April
to June (month 4), the third from July to August
(month 7), and the fourth from September to Decem-
ber (month 10).
18 M. Araya et al. / Fisheries Research 51 (2001) 17±26

2.3. Otolith weight versus age
In establishing the relationship between age and
otolith weight, a total of 60 otoliths from ®sh in the
range between 20 and 60 cm FL (otolith radius range:
2933±5500 mm) was selected at random to determine
age using the density of the daily growth increments
(Ralston and Miyamoto, 1983; Ralston and Williams,
1989). Otolith radius and weight were recorded before
the otolith was prepared for reading. Daily growth
increments were read and measured from thin sections
according to the recommendations by Brothers et al.
(1976) and Campana and Neilson (1985). It must be
mentioned that the deposition of daily growth incre-
ments in otolith sagittae of T. s. murphyi was validated
using oxytetracycline for marking the otoliths of ®sh
between 25 and 35 cm FL (unpublished results).
Because daily growth increments are daily, the appli-
cation of the method of density of daily growth
increments is justi®ed fully.
The thin sections were analyzed under a compound
microscope using transmitted light at 1000 times
magni®cation. To determine ages individually, an
adequate number of segments in which daily growth
increments were suf®ciently clear and interpretable
along the axis of growth were used. Readings of
segments were obtained trying to cover all the distance
between the nucleus and the postrostral border. Seg-
ment size and the number of daily growth increments
contained in each were used to determine the instan-
taneous otolith growth rate according to
Dx
Dincrements� Dx
Dt� dx
dt(1)
where Dx is the size of the segment (mm) at a certain
distance from the nucleus and Dt the number of
microincrements (days). There were n data pairs
(x, Dx/Dt) for each fish along the axis of growth
(x), i.e. from the nucleus to the postrostral border of
the otolith. In this way, it was possible to fit a
mathematical model describing the instantaneous oto-
lith growth rate (Dx/Dt) as a function of the growth
axis (x), i.e. distance from the nucleus. We used the
following mathematical model, which was fitted for
each fish using non-linear regression:
dx
dt� f �x� � ax�1ÿ bcx�1=c
(2)
where a, b, and c are constants to be estimated. This
model is very flexible since its shape depends on the
value of c. It was described by Deriso (1980) for
analysis of the stock±recruitment relationship in the
dynamics of a fish population. The model described by
Eq. (2) was selected because it is adequate for the
entire data sets (see Fig. 6). The age of each fish was
estimated by solving for dt in Eq. (2), and treating it as
a definite integral between the nucleus (x � 0) and the
otolith radius (x � R), i.e.
T �Z t�T
t�0
dt �Z x�R
x�0
f �x�ÿ1dx (3)
where T is the age in days. The definite integral was
evaluated using MTOOL of Maher (1988), which uses
Simpson's rule (Whittaker and Robinson, 1929) for
numeric integration.
Once age of individual were estimated by Eq. (3),
the relationship between otolith weight (OW) and age
(T) for T. s. murphyi was described using linear
regression with OW as the dependent variable and
age the independent variable. Results were tested for
signi®cance and log-transformed if required. To
obtain a predictive tool, analysis of regression was
also used to investigate the inverse relationship, with
age of individuals as the dependent variable and OW
the independent variable.
3. Results
3.1. Otolith dimensions
The relationships between otolith dimension and
®sh length are showed in Fig. 1. Otolith thickness
increased linearly with ®sh length, whereas for otolith
length and width, the line of best ®t was slightly
curved, and the increase in OW with ®sh length
was described by a power function (Fig. 1). It is clear
from these relationships that a notable change in
otolith width, thickness and weight occurred in ®sh
larger than 40 cm FL, particularly in otolith thickness
and weight. Although there is no notable change in
otolith length, results for the other measurements
suggest that there is a signi®cant change in the thick-
ness and weight of otoliths. It is probable that those
patterns can be due to differences in age of older
M. Araya et al. / Fisheries Research 51 (2001) 17±26 19

individuals with similar otolith size. If the weight of
otoliths is directly related with age of jack mackerel,
then the changes observed in otolith width, thickness
and weight for individuals larger than 40 cm FL would
be due to different ages from individuals with equal
length.
3.2. Otolith mass growth rate
3.2.1. Otolith weight frequency distribution
A series of modes can be separated in the quarterly
OW frequency distributions of the jack mackerel using
the MIX software (Fig. 2). It seems that the mean OW
of each mode represents a series of age classes. Also, it
can be seen that the mean OW of each age class
increases linearly with time, at least for the ®rst seven
classes, which are the most evident and easily sepa-
rated from the MIX (Fig. 3). Although the otolith mass
growth rate ¯uctuates between 0.435 and 0.929 mg
per month between age classes, the average annual
mass growth rate is estimated as 8.256 mg yrÿ1
(Table 1).
A more robust analysis for the analysis of OW
frequency can be carried out using MULTIFAN, on
the assumption that the modes represent age classes.
MULTIFAN was developed for analysis of ®sh
length±frequency data, where the original approach
assumes that the mean length of ®sh follow a von
Bertalanffy growth curve. In this case, the assumption
applies to the mean OW. However, in order to relax the
assumption of a von Bertalanffy function and to obtain
an approximately linear curve, we apply MULTIFAN
using very low initial values for the K parameter of the
von Bertalanffy growth function (0:01 � K � 0:1). In
Fig. 1. Otolith dimensions as a function of size of T. s. murphyi.
Fig. 2. Quarterly OW frequency distributions of T. s. murphyi
during 1996, showing the age classes identified by MIX.
Fig. 3. Progression of mean OW of T. s. murphyi identified in
Fig. 2. The slopes of these lines are an estimation of the otolith
mass growth rate (see Table 1).
20 M. Araya et al. / Fisheries Research 51 (2001) 17±26
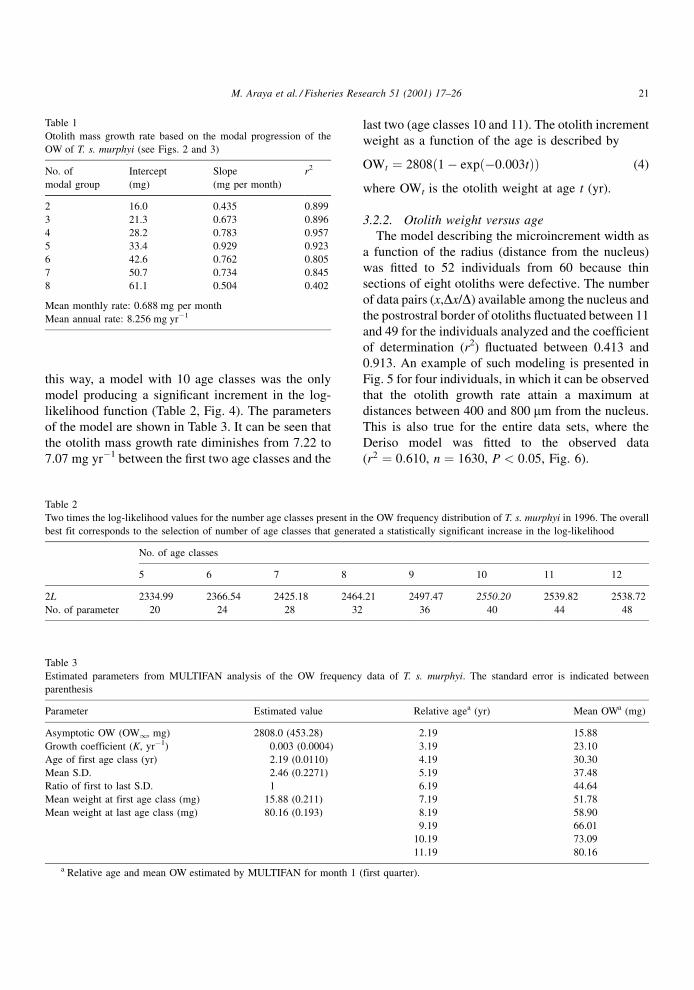
this way, a model with 10 age classes was the only
model producing a signi®cant increment in the log-
likelihood function (Table 2, Fig. 4). The parameters
of the model are shown in Table 3. It can be seen that
the otolith mass growth rate diminishes from 7.22 to
7.07 mg yrÿ1 between the ®rst two age classes and the
last two (age classes 10 and 11). The otolith increment
weight as a function of the age is described by
OWt � 2808�1ÿ exp�ÿ0:003t�� (4)
where OWt is the otolith weight at age t (yr).
3.2.2. Otolith weight versus age
The model describing the microincrement width as
a function of the radius (distance from the nucleus)
was ®tted to 52 individuals from 60 because thin
sections of eight otoliths were defective. The number
of data pairs (x,Dx/D) available among the nucleus and
the postrostral border of otoliths ¯uctuated between 11
and 49 for the individuals analyzed and the coef®cient
of determination (r2) ¯uctuated between 0.413 and
0.913. An example of such modeling is presented in
Fig. 5 for four individuals, in which it can be observed
that the otolith growth rate attain a maximum at
distances between 400 and 800 mm from the nucleus.
This is also true for the entire data sets, where the
Deriso model was ®tted to the observed data
(r2 � 0:610, n � 1630, P < 0:05, Fig. 6).
Table 1
Otolith mass growth rate based on the modal progression of the
OW of T. s. murphyi (see Figs. 2 and 3)
No. of
modal group
Intercept
(mg)
Slope
(mg per month)
r2
2 16.0 0.435 0.899
3 21.3 0.673 0.896
4 28.2 0.783 0.957
5 33.4 0.929 0.923
6 42.6 0.762 0.805
7 50.7 0.734 0.845
8 61.1 0.504 0.402
Mean monthly rate: 0.688 mg per month
Mean annual rate: 8.256 mg yrÿ1
Table 2
Two times the log-likelihood values for the number age classes present in the OW frequency distribution of T. s. murphyi in 1996. The overall
best fit corresponds to the selection of number of age classes that generated a statistically significant increase in the log-likelihood
No. of age classes
5 6 7 8 9 10 11 12
2L 2334.99 2366.54 2425.18 2464.21 2497.47 2550.20 2539.82 2538.72
No. of parameter 20 24 28 32 36 40 44 48
Table 3
Estimated parameters from MULTIFAN analysis of the OW frequency data of T. s. murphyi. The standard error is indicated between
parenthesis
Parameter Estimated value Relative agea (yr) Mean OWa (mg)
Asymptotic OW (OW1, mg) 2808.0 (453.28) 2.19 15.88
Growth coefficient (K, yrÿ1) 0.003 (0.0004) 3.19 23.10
Age of first age class (yr) 2.19 (0.0110) 4.19 30.30
Mean S.D. 2.46 (0.2271) 5.19 37.48
Ratio of first to last S.D. 1 6.19 44.64
Mean weight at first age class (mg) 15.88 (0.211) 7.19 51.78
Mean weight at last age class (mg) 80.16 (0.193) 8.19 58.90
9.19 66.01
10.19 73.09
11.19 80.16
a Relative age and mean OW estimated by MULTIFAN for month 1 (first quarter).
M. Araya et al. / Fisheries Research 51 (2001) 17±26 21
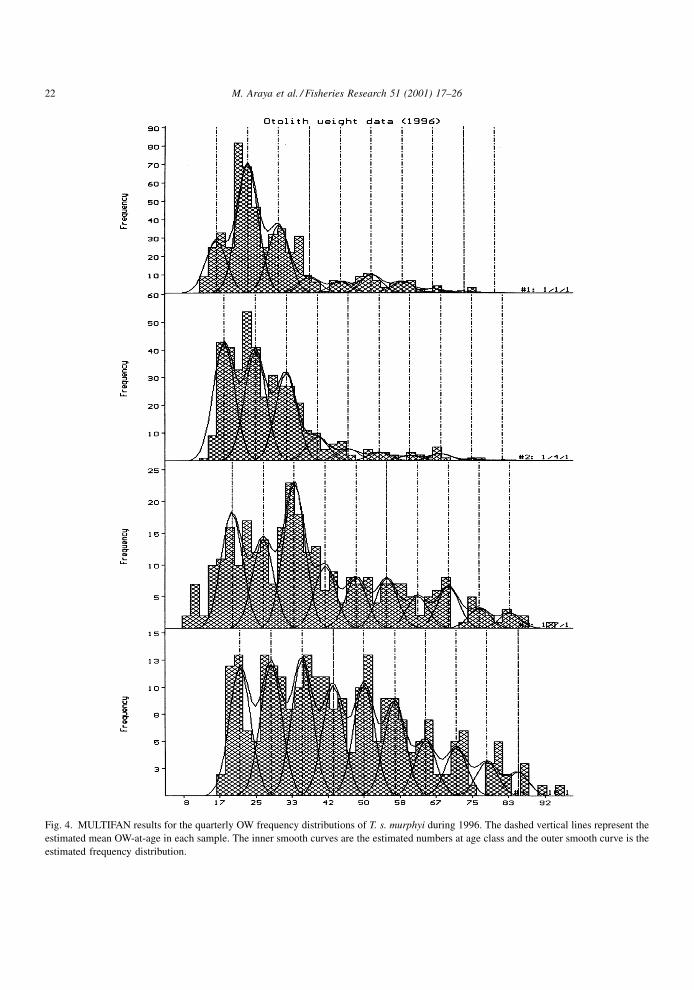
Fig. 4. MULTIFAN results for the quarterly OW frequency distributions of T. s. murphyi during 1996. The dashed vertical lines represent the
estimated mean OW-at-age in each sample. The inner smooth curves are the estimated numbers at age class and the outer smooth curve is the
estimated frequency distribution.
22 M. Araya et al. / Fisheries Research 51 (2001) 17±26

The individual age ¯uctuated between 1.4 and
12.7 yr and the OW was directly related to the esti-
mated age (Fig. 7). The relationship between OW and
age was established with 44 individuals, discarding
eight because otoliths were broken at the time of
weighing, a situation that was only evident after
preparing the otoliths for reading. The linear relation-
ship is signi®cant for n � 44 (P < 0:05) and the slope
and the constant of the regression were different
from zero at the 95% con®dence level. Regressions
based on log-transformed variables were also signi®-
cant, but the coef®cient of determination was lower
(Table 4).
It must be mentioned that when establishing the
inverse relationship, using the OW as the independent
variable, it was found that the constant of regression
was not different from zero at the 95% con®dence
level (Table 4). Furthermore, variance increases with
Fig. 5. Some examples of the fitted model to explain the otolith
growth rate of four individuals of T. s. murphyi as a function of the
distance from the nucleus.
Fig. 6. Otolith growth rate as a function of the distance from the
nucleus of all individuals of T. s. murphyi. Observed data are
showed in the upper panel and the fitted model to all data is showed
in the lower panel.
Fig. 7. Relationship between OW and the age of T. s. murphyi, (a)
original values of variables and (b) values of variables transformed
to logarithms.
Table 4
The regression formulas for the analysis of the relationship between OW and T in T. s. murphyi. Lower and upper limits at the 95% of
confidence are showed between parenthesis for the constant and the coefficient of regression
Regression formula Constant Slope r2 P-value
OW � a� bT 16.260 (9.346, 23.173) 4.117 (2.621, 5.613) 0.424 <0.05
T � A� B OW 0.642 (ÿ0.698, 1.982) 0.103 (0.066, 0.140) 0.424 <0.05
ln�OW� � a0 � b0 ln�OW� 2.627 (2.318, 2.935) 0.603 (0.375, 0.831) 0.404 <0.05
ln�T� � A0 � B0 ln�OW� ÿ1.010 (ÿ1.876, ÿ0.144) 0.670 (0.417, 0.924) 0.404 <0.05
T � b OW ± ± 0.119 (0.104, 0.134) 0.411 <0.05
M. Araya et al. / Fisheries Research 51 (2001) 17±26 23

the independent variable (Fig. 8), suggesting that a
regression without intercept should better in describe
the relationship of age on OW. The slope of this
last regression indicates that otoliths of the jack
mackerel present an increment of 0.119 mg yrÿ1,
IC � f0:104; 0:134�. In other words, the inverse of
this slope (1/b) suggests that the otolith mass growth
rate is approximately 8.385 mg yrÿ1. This result is
consistent with the analysis of OW frequency data.
4. Discussion
This study provides evidence of a relationship
between age and OW in T. s. murphyi. This relation-
ship could provide a rapid and economic method to
determine age in this species, a suggestion that has
been made in previous studies for other species (Boeh-
lert, 1985; Pawson, 1990; Fletcher, 1991, 1995;
Worthington et al., 1995a). These studies include both
tropical and temperate ®sh, and found that OW
explained between 70 and 90% of variability in ®sh
age.
In this study, the relationship between OW and age
estimated by the density of the daily growth incre-
ments indicates that OW explains 42% of the variation
in the age of T. s. murphyi. This is a good result
because the individual age estimated in this form can
contain many sources of error, such as: (a) high
individual variability in the otolith growth rate; (b)
error of measurements, which are associated with the
resolution of the optic microscope; (c) error in the
model used to describe the instantaneous otolith
growth rate and (d) error of estimation of the para-
meters of the model. In this context, the relationship of
age on OW is preferred because in the OW data only
error of measurements are present.
Nevertheless, this study demonstrated that the den-
sity of daily growth increments can be applied to
estimate the individual age of ®sh, over a wide range
of ages (1.4±12.7 yr). However, it is desirable to use
new application in analyzing the growth patterns in the
otolith of older jack mackerel, may be through a
scanning electronic microscope. Indeed, the curved
growth of the otolith of jack mackerel with age makes
it very dif®cult to obtain a section where the complete
sequence of the individual's growth can be observed.
Also, when the growth rate diminishes it is possible
that the width of daily growth increments could be
under the resolution of the optic microscope, affecting
the estimation of ages (Morales-Nin and Ralston,
1990).
The indirect evidence presented here through the
analysis of the modal progression in the OW fre-
quency, suggests two questions in connection with
the otolith mass growth rate of T. s. murphyi. The ®rst
is related to the variability of the otolith mass growth
rate of jack mackerel. Indeed, the analysis based on
MIX suggests that the otolith mass growth rate would
be variable among year classes and that this rate could
¯uctuate between 5.22 and 11.15 mg yrÿ1 (Table 1).
This point requires special attention, since it could
affect the estimates of age using the OW data. How-
ever, it should also be kept in mind the limitations of
the analysis based on MIX, since modes (normal
groups) in larger otoliths can be dif®cult to separate,
affecting the otolith mass growth rates in the older
year classes.
The second question arises from the indirect ana-
lysis which assumes that the mean OW follows the von
Bertalanffy growth model just as it come from the
results based on the MULTIFAN analysis (Eq. (4)).
However, using this approach the otolith mass growth
rate diminishes with age, the asymptotic weight of the
otolith is very large and the coef®cient K is very small,
suggesting that the relationship is linear.
These questions should be considered in future
studies. Indeed, if the OW is related directly to ®sh
age, through a constant otolith mass growth rate, then
the modes in the OW frequency should be distributed
approximately equidistant.
Despite these considerations, we conclude from
the presented evidence that OW could be useful in
providing quick and economical estimates of the
age and of age structure of T. s. murphyi. However,
Fig. 8. Relationship between age and OW of T. s. murphyi.
24 M. Araya et al. / Fisheries Research 51 (2001) 17±26

experimental studies using ®sh of known age (Reznick
et al., 1989; Secor and Dean, 1989) have shown that
the relationship between otolith size and ®sh size is
strongly in¯uenced by the growth rate of the ®sh, and
suggest that otolith growth is not synchronous with the
growth of the ®sh itself, but has an additional time-
dependent rate which results in slow-growing indivi-
duals having relatively heavy otoliths for their body
size. Pawson (1990) concluded that although appro-
priate models based on otolith±®sh size relationship
can predict age for groups of ®sh in which growth rates
are known or can be assumed to be consistent, such
techniques have a limited application in ageing ®sh
from wild populations with highly variable growth
rates. In this context due to potential variation in the
relationship between the OW and age, the relationship
should be calibrated for each new sample of ®sh. To
maximize the bene®ts of using OW, the calibration
would require precise and exact estimates of the age of
only a relatively small number of ®sh that cover the
whole range of OWs and ages present in the samples.
It must be mentioned, however that the real ages of
jack mackerel are far of clear because otoliths are
dif®cult to read, and the interpretation of annual rings
on otoliths by several authors is generating confusion
about growth rates. Thus, alternative methods of age-
ing should be applied to validate the indirect evidence
presented in this study for the relationship between
OW and age of jack mackerel.
Acknowledgements
We are grateful to Paul Taylor of NIWA, New
Zealand, Dr. Vidar Wespestad and Dr. Daniel Kimura,
AFSC, Seattle, for the comments, advice and review
of an early version of the paper. This research was
®nanced by FIP No. 95-10. Also, we wish to thank to
the Council of the Chilean Fisheries Research Fund by
facilitating the publication of the results.
References
Abramov, A.A., Kotlyar, A.N., 1980. Some biological features of
the Peruvian jack mackerel, Trachurus murphyi Nichols, 1920.
J. Ichthyol. 20 (1), 25±31.
Arruda, L.M., 1987. On the annual cycle of ring formation in horse
mackerel, Trachurus trachurus, otoliths off Portugal and its
implication on age determination. In: Proceedings of the Fifth
Congress of European Ichthyologists, Stockholm, 1985,
Swedish Museum of Natural History, pp. 229±232.
Boehlert, G., 1985. Using objective criteria and multiple regression
models for age determination in fishes. Fish. Bull. US 83,
103±117.
Brothers, E.B., Mathews, C.P., Lasker, R., 1976. Daily growth
increments in otoliths from larvae and adult fishes. Fish. Bull.
US 74, 1±8.
Campana, S.E., Neilson, J.D., 1985. Microstructure of fish otoliths.
Can. J. Fish. Aquat. Sci. 42, 1014±1032.
Castillo, G., Arrizaga, A., 1987. Edad y crecimiento del jurel
Trachurus symmetricus murphyi (Nichols, 1920) en aguas de
Chile Central. Biol. Pesq. (Chile) 16, 19±33.
Cubillos, L., Arancibia, H., 1995. Comparative growth perfor-
mance of the horse mackerel of the genus Trachurus, with
emphasis on T. symmetricus murphyi in Chile. Sci. Mar. 59
(3±4), 647±652.
Cubillos, L., Grechina, A.S., 1998. Crecimiento del jurel,
Trachurus symmetricus murphyi (Nichols) del PacõÂfico Suror-
iental mediante anaÂlisis de progresioÂn modal, pp. 151±161. In:
Arcos, D. (Ed.), BiologõÂa y EcologõÂa del Jurel en Aguas
Chilenas, Instituto de InvestigacioÂn Pesquera, Talcahuano,
Chile, 216 pp.
Deriso, R.B., 1980. Harvesting strategies and parameter estimation
for an age-structured model. Can. J. Fish. Aquat. Sci. 37, 268±
282.
FarinÄa Perez, A.C., 1983. Age and growth of the Galician shelf
horse mackerel (Trachurus trachurus L.). ICES C.M. 1983/
G:26, 11 pp.
Fletcher, W.J., 1991. A test of the relationship between otolith
weight and age for the pilchard Sardinops neopilchardus. Can.
J. Fish. Aquat. Sci. 48, 35±38.
Fletcher, W.J., 1995. Application of the otolith weight±age
relationship for the pilchard, Sardinops sagax neopilchardus.
Can. J. Fish. Aquat. Sci. 52, 657±664.
Fournier, D.A., Sibert, J.R., Majkowski, J., Hampton, J., 1990.
MULTIFAN a likelihood-based method for estimating growth
parameters and age composition from multiple length
frequency data sets illustrated using data for bluefin tuna
(Thunus maccoyii). Can. J. Fish. Aquat. Sci. 47, 301±317.
Hatanaka, H., Kawahara, S., 1985. Otolith ring formation in Cape
horse mackerel off Namibia. Colln Scient. Pap. Int. Commn.
SE. Atl. Fish 12, 87±94.
Kaiser, C.E., 1973. Age and growth of horse mackerel Trachurus
murphyi of Chile. Trans. Am. Fish. Soc. 102 (3), 591±595.
Kerstan, M., 1995. Ages and growth rates of agulhas bank horse
mackerel Trachurus trachurus capensis Ð comparison of
otolith ageing and length frequency analyses. S. Afr. J. Mar.
Sci. 15, 137±156.
Kochkin, P.N., 1994. Age determination and estimate of growth
rate for the Peruvian jack mackerels Trachurus symmetricus
murphyi. J. Ichthyol. 34 (3), 39±50.
MacDonald, P.D.M., Green, P.E.J., 1988. User's guide to program
MIX: an interactive program for fitting mixtures of distribu-
tions. Icthus Data Systems, Hamilton, Ont., 75 pp.
M. Araya et al. / Fisheries Research 51 (2001) 17±26 25
MacDonald, P.D.M., Pitcher, T.J., 1979. Age groups from size±
frequency data: a versatile and efficient method for analyzing
distribution mixtures. J. Fish. Res. Board Can. 36, 987±1001.
Maher, M.J., 1988. Mathtool: an interactive mathematical function
interpreter. User's Guide Version 1.1., 26 pp.
Morales-Nin, B., 1987. MeÂtodos de determinacioÂn de la edad en los
osteictios en base a estructuras de crecimiento. Inf. TeÂcn. Inv.
Pesq. 143, 30 pp.
Morales-Nin, B., Ralston, S., 1990. Age and growth of Lutjanus
kasmira (Forskal) in Hawaiian waters. J. Fish Biol. 36, 191±
203.
Nekrasov, V.V., 1982. Distribution, biology and fisheries potential
of horse mackerel (Trachurus symmetricus murphyi) in the
South-Eastern Pacific. VNIRO Internal Report. Moscow, 43
pp. (in Russian).
Nekrasov, V.V., 1987. Age and growth of horse mackerel, In:
Collected Papers on the Biology and Fisheries of Peruvian
Horse Mackerel. VNIRO. Moscow, pp. 44±46. (in Russian).
Pavez, P., Saa, E., 1978. DeterminacioÂn de edad y crecimiento del
jurel Trachurus murphyi Nichols, 1920. Invest. Mar. 6 (6), 89±
100.
Pawson, M.G., 1990. Using otolith weight to age fish. J. Fish. Biol.
36, 521±531.
Radtke, R.L., Hourigan, T.F., 1990. Age and growth of the Antartic
fish Nototheniops mudifrons. Fish. Bull. US 88, 557±571.
Ralston, S., Miyamoto, G.T., 1983. Analyzing the width of daily
otolith increments to age the Hawaiian snapper, Pristipomoides
filamentosus. Fish. Bull. US 81, 523±535.
Ralston, S., Williams, H.A., 1989. Numerical integration of daily
growth increments: an efficient means of ageing tropical fishes
for stock assessment. Fish. Bull. US 87, 1±16.
Reznick, D., Lindbeck, E., Bryga, H., 1989. Slower growth results
in larger otoliths: an experimental test with guppies (Poecilia
reticulata). Can. J. Fish. Aquat. Sci. 46, 108±112.
Secor, D.H., Dean, J.M., 1989. Somatic growth effects on the
otolith±fish size relationship in young pond-reared striped bass,
Morone saxatilis. Can. J. Fish. Aquat. Sci. 46, 113±121.
Shcherbich, L.V., 1992. Methods of age determination in the horse
mackerel, Trachurus capensis, by scales and otoliths. J.
Ichthyol. 32, 46±59.
Whittaker, E.T., Robinson, G., 1929. The Calculus of Observations,
a Treatise on Numerical Mathematics. Blackie, London.
Worthington, D.G., Fowler, A.J., Doherty, P.J., 1995a. Determining
the most efficient method of age determination for estimating
the age structure of a fish population. Can. J. Fish. Aquat. Sci.
52, 2320±2326.
Worthington, D.G., Doherty, P.J., Fowler, A.J., 1995b. Variation in
the relationship between otolith weight and age: implications
for the estimation of age of two tropical damselfish
(Pomacentrus moluccensis and P. wardi). Can. J. Fish. Aquat.
Sci. 52, 233±242.
26 M. Araya et al. / Fisheries Research 51 (2001) 17±26