Variation in standing stock of the mackerel icefish Champsocephalus gunnari at South Georgia
13
Variation in standing stock of the mackerel icefish Champsocephalus gunnari at South Georgia INIGO EVERSON, GRAEME PARKES*, KARL-HERMANN KOCK { and IAN L. BOYD British Antarctic Survey, Madingley Road, Cambridge CB3 0ET, UK; *Marine Resources Assessment Group Ltd, 47 Prince’s Gate, London SW7 2QA, UK; and {Bundesforschungsanstalt fu ¨r Fischerei, Institut fu ¨r Seefischerei, Hamburg, Germany Summary 1. Bottom trawl surveys on the South Georgia shelf indicate episodic declines in the abundance of the mackerel icefish Champsocephalus gunnari that, since 1990, are not directly attributable to commercial fishing. 2. The greatest eect has been observed in years when krill are known to have been scarce on the South Georgia shelf. 3. It is thought that C. gunnari survivorship is closely related to, but indirectly influenced by, krill availability. 4. Examination of food chain relationships indicates that predation by fur seals is likely to play a major role in the observed changes in C. gunnari abundance. 5. Periodic shifts in food chain relationships, involving krill, C. gunnari and fur seals, are postulated that could explain the episodic declines in the abundance of C. gunnari in the absence of fishing. 6. The study demonstrates how a key predator can have an over-riding impact on a commercial fish species, highlighting the importance of the ecosystem approach to fisheries management. Key-words: Antarctic, CCAMLR, ecosystem management, fur seal, krill. Journal of Applied Ecology (1999) 36, 591–603 Introduction The Antarctic mackerel icefish Champsocephalus gunnari Lo¨nnberg is a member of the Channichthyidae, a unique family lacking haemo- globin (Kock & Everson 1997) that has an interest- ing and unusual stock structure at South Georgia, a sub-Antarctic island centred on approximately 54 S, 37 W. Even before the onset of commercial fishing most of the stock consisted of 2–4-year-old fish, 20– 37 cm in total length, although the species can grow to more than 60 cm and live for 12–14 years (Permitin 1973). Champsocephalus gunnari is one of several species of finfish taken commercially in the region. Commercial fishing for finfish around South Georgia began in the late 1960s, and catches have been reported to the Commission for the Conservation of Antarctic Marine Living Resources (CCAMLR) since 1982, going back to the 1970 sea- son (seasons are designated by split year, thus the period 1 July 1969 to 30 June 1970 is referred to as 1970) (CCAMLR 1990a,b; CCAMLR 1996). Mackerel icefish was one of the most important spe- cies caught. Maximum catches yielded 80 000 tonnes in 1977, 128 000 tonnes in 1983 and 71 000 tonnes in 1987 (Fig. 1). The fishery ceased after 1990. During the 1970s and 1980s the large variation in catches from year to year was attributed primarily to the dierences in fishing between years and variation in year-class strength. Little attention was paid to other substantial sources of natural variation that might be present in the stock. Since the late 1980s the standing stock of C. gunnari has been monitored by fishery-independent groundfish surveys. Even though there has been no commercial fishing since 1990, the stock has continued to fluctuate sub- stantially, with dramatic episodic declines in abun- dance. In seeking an explanation for these declines, we have investigated the status of krill Euphausia superba Dana, a key prey item, and predators such as the fur seal Arctocephalus gazella Peters, follow- Correspondence: Inigo Everson (fax 01223 362616). e-mail: [email protected] Journal of Applied Ecology 1999, 36, 591–603 # 1999 British Ecological Society
Transcript of Variation in standing stock of the mackerel icefish Champsocephalus gunnari at South Georgia
Variation in standing stock of the mackerel ice®sh
Champsocephalus gunnari at South Georgia
INIGO EVERSON, GRAEME PARKES*, KARL-HERMANN KOCK{and IAN L. BOYD
British Antarctic Survey, Madingley Road, Cambridge CB3 0ET, UK; *Marine Resources Assessment Group
Ltd, 47 Prince's Gate, London SW7 2QA, UK; and {Bundesforschungsanstalt fuÈr Fischerei, Institut fuÈrSee®scherei, Hamburg, Germany
Summary
1. Bottom trawl surveys on the South Georgia shelf indicate episodic declines in
the abundance of the mackerel ice®sh Champsocephalus gunnari that, since 1990,
are not directly attributable to commercial ®shing.
2. The greatest e�ect has been observed in years when krill are known to have
been scarce on the South Georgia shelf.
3. It is thought that C. gunnari survivorship is closely related to, but indirectly
in¯uenced by, krill availability.
4. Examination of food chain relationships indicates that predation by fur seals is
likely to play a major role in the observed changes in C. gunnari abundance.
5. Periodic shifts in food chain relationships, involving krill, C. gunnari and fur
seals, are postulated that could explain the episodic declines in the abundance of
C. gunnari in the absence of ®shing.
6. The study demonstrates how a key predator can have an over-riding impact on
a commercial ®sh species, highlighting the importance of the ecosystem approach
to ®sheries management.
Key-words: Antarctic, CCAMLR, ecosystem management, fur seal, krill.
Journal of Applied Ecology (1999) 36, 591±603
Introduction
The Antarctic mackerel ice®sh Champsocephalus
gunnari LoÈ nnberg is a member of the
Channichthyidae, a unique family lacking haemo-
globin (Kock & Everson 1997) that has an interest-
ing and unusual stock structure at South Georgia, a
sub-Antarctic island centred on approximately 54�S,37�W. Even before the onset of commercial ®shing
most of the stock consisted of 2±4-year-old ®sh, 20±
37 cm in total length, although the species can grow
to more than 60 cm and live for 12±14 years
(Permitin 1973). Champsocephalus gunnari is one of
several species of ®n®sh taken commercially in the
region.
Commercial ®shing for ®n®sh around South
Georgia began in the late 1960s, and catches have
been reported to the Commission for the
Conservation of Antarctic Marine Living Resources
(CCAMLR) since 1982, going back to the 1970 sea-
son (seasons are designated by split year, thus the
period 1 July 1969 to 30 June 1970 is referred to as
1970) (CCAMLR 1990a,b; CCAMLR 1996).
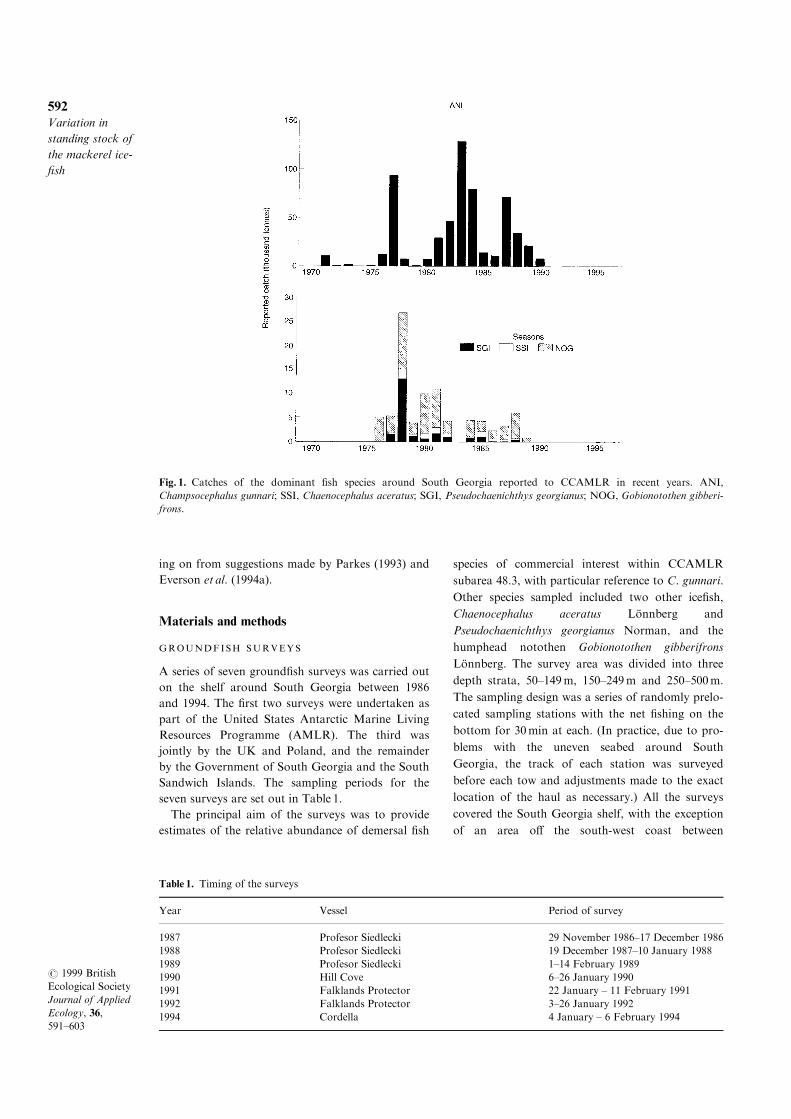
Mackerel ice®sh was one of the most important spe-
cies caught. Maximum catches yielded 80 000 tonnes
in 1977, 128 000 tonnes in 1983 and 71 000 tonnes in
1987 (Fig. 1). The ®shery ceased after 1990. During
the 1970s and 1980s the large variation in catches
from year to year was attributed primarily to the
di�erences in ®shing between years and variation in
year-class strength. Little attention was paid to
other substantial sources of natural variation that
might be present in the stock. Since the late 1980s
the standing stock of C. gunnari has been monitored
by ®shery-independent ground®sh surveys.
Even though there has been no commercial ®shing
since 1990, the stock has continued to ¯uctuate sub-
stantially, with dramatic episodic declines in abun-
dance. In seeking an explanation for these declines,
we have investigated the status of krill Euphausia
superba Dana, a key prey item, and predators such
as the fur seal Arctocephalus gazella Peters, follow-Correspondence: Inigo Everson (fax 01223 362616).
e-mail: [email protected]
Journal of
Applied Ecology
1999, 36,
591±603
# 1999 British
Ecological Society
ing on from suggestions made by Parkes (1993) and
Everson et al. (1994a).
Materials and methods
GROUNDFISH SURVEYS
A series of seven ground®sh surveys was carried out
on the shelf around South Georgia between 1986
and 1994. The ®rst two surveys were undertaken as
part of the United States Antarctic Marine Living
Resources Programme (AMLR). The third was
jointly by the UK and Poland, and the remainder
by the Government of South Georgia and the South
Sandwich Islands. The sampling periods for the
seven surveys are set out in Table 1.
The principal aim of the surveys was to provide
estimates of the relative abundance of demersal ®sh
species of commercial interest within CCAMLR
subarea 48.3, with particular reference to C. gunnari.
Other species sampled included two other ice®sh,
Chaenocephalus aceratus LoÈ nnberg and
Pseudochaenichthys georgianus Norman, and the
humphead notothen Gobionotothen gibberifrons
LoÈ nnberg. The survey area was divided into three
depth strata, 50±149m, 150±249m and 250±500m.
The sampling design was a series of randomly prelo-
cated sampling stations with the net ®shing on the
bottom for 30min at each. (In practice, due to pro-
blems with the uneven seabed around South
Georgia, the track of each station was surveyed
before each tow and adjustments made to the exact
location of the haul as necessary.) All the surveys
covered the South Georgia shelf, with the exception
of an area o� the south-west coast between
Fig. 1. Catches of the dominant ®sh species around South Georgia reported to CCAMLR in recent years. ANI,
Champsocephalus gunnari; SSI, Chaenocephalus aceratus; SGI, Pseudochaenichthys georgianus; NOG, Gobionotothen gibberi-
frons.
Table 1. Timing of the surveys
Year Vessel Period of survey
1987 Profesor Siedlecki 29 November 1986±17 December 1986
1988 Profesor Siedlecki 19 December 1987±10 January 1988
1989 Profesor Siedlecki 1±14 February 1989
1990 Hill Cove 6±26 January 1990
1991 Falklands Protector 22 January ± 11 February 1991
1992 Falklands Protector 3±26 January 1992
1994 Cordella 4 January ± 6 February 1994
592Variation in
standing stock of
the mackerel ice-
®sh
# 1999 British
Ecological Society
Journal of Applied
Ecology, 36,
591±603

Annenkov Island and Cape Disappointment, where
the ground is very rough and unsuited to bottom
trawling. All except one survey covered the much
smaller Shag Rocks shelf. Figure 2 provides an
example chart showing the haul locations from the
1991 survey. Sampling e�ort was allocated in rela-
tion to the area of seabed and the expected density
of C. gunnari in the three strata. Sampling locations
were distributed around the islands using a grid of
rectangles 0´5 degree of latitude by 1 degree of long-
itude. Details of the seven surveys are given in
Gabriel (1988), McKenna & Saila (1989), Parkes
et al. (1989, 1990) and Everson et al. (1991, 1992,
1994b).
The catch from each haul was sorted by species
and the number and total mass of each were mea-
sured. Samples were taken for length, individual
mass and age determination. Length-to-mass rela-
tionships and age±length keys were prepared and
reported to CCAMLR for use in stock assessments.
Age determination using otoliths was undertaken on
samples of C. gunnari by the Sea Fisheries Institute,
Gdynia, Poland. Diet composition and feeding
intensity of ice®sh were recorded in 1991, 1992 and
1994 using the frequency of occurrence method
(Kock et al. 1994).
ESTIMATION OF RELATIVE ABUNDANCE OF
GROUNDFISH
Studies on ground®sh surveys have shown that
catchability is potentially in¯uenced by a number of
factors, including three major components of the
survey equipment: the vessel, the trawl doors (otter
boards) and the trawl itself (Anonymous 1991;
J.R.S. Forrester, personal communication). Changes
in equipment during the course of a survey series
are therefore seen as undesirable, due to the poten-
tial for the introduction of bias in abundance
indices. Every attempt was made to standardize the
personnel, vessel and sampling gear during the sur-
vey series.
The team of scientists undertaking the surveys
remained more or less constant over the study per-
iod and the ®shing master changed only twice. The
same design of trawl doors was used throughout the
series. The trawl warp-to-water depth ratio was 3 : 1
for all surveys and the towing speed was 3´5 knots
with the net on the bottom. Unfortunately, however,
logistics and costs meant that changes in equipment
were unavoidable and four di�erent vessels, whose
details are shown in Table 2, were used. Three di�er-
ent variants of the same bottom trawl design were
used, all of which had a 40-mm liner in the cod end.
The di�erences between the trawls are set out in
Table 3. Similar headline length and the same design
of trawl doors provided for a similar wingspread,
and thus ®shing area, on all the nets. Even so, it was
only possible to measure the geometry of the trawl
in situ during one of the surveys (Pilling & Parkes
1995). In the absence of additional experimental evi-
dence, the surveys were treated as a time series from
which indices of stock abundance of ground®sh
could be generated. The unknown bias between sur-
veys resulting from vessel and gear changes was
treated as a random factor in the time series.
Fish density for each sample was estimated from
the mass of the catch, distance trawled and horizon-
Fig. 2. Map of South Georgia shelf showing the sampling locations on the 1991 survey. The same basic pattern was used
on all the surveys reported in this paper.
593I. Everson et al.
# 1999 British
Ecological Society
Journal of Applied
Ecology, 36,
591±603

tal opening (wingspread) of the net. Estimates of
relative abundance were ®rst made by the swept
area method (Gulland 1975; Saville 1977), assuming
normal distribution of densities. Areas of seabed
were taken from Everson & Campbell (1991). Due
to concerns over the application of this method to
species with patchy distributions, such as C. gunnari,
the density estimates were also analysed using a
computer program TRAWLCI (de la Mare 1994).
This uses Aitchison's delta distribution (Aitchison
1955; Pennington 1983) to model the underlying sta-
tistical distribution of trawl survey densities, and
generates unbiased estimates of abundance with
con®dence intervals that give the correct coverage
probability (de la Mare 1994). In both cases, esti-
mates of relative abundance and variance by stra-
tum were calculated and combined over strata to
give an overall relative abundance estimate.
THE POPULATION MODEL
Where the age composition of the catches is known,
the survey estimates of year class strength can be
used directly to predict relative abundance in subse-
quent years, assuming growth, natural mortality M
and catch C are known approximately. At meetings
of the CCAMLR Working Group on Fish Stock
Assessment, cohort analysis (Pope 1972) has been
used to project abundance in the terminal (most
recent) year of the Virtual Population Analysis
(VPA) and/or the relative abundance estimates from
surveys forward in time to examine the possible
e�ects of di�erent levels of future catch. For num-
bers N at age a and time t:
Nt�1;a�1 � NtaeÿM ÿ Ctae
ÿM=2: eqn 1
Throughout the analyses, M was assumed to be con-
stant both across ages and years.
Parkes (1993) and Anonymous (1993) used a time
series of abundance estimates for the South Georgia
shelf, derived from trawl surveys, as a relative index
of absolute abundance to tune VPA using both
Laurec±Shepherd tuning (Pope & Shepherd 1985)
and the ADAPT program (Gavaris 1993). The results
of these VPA demonstrated several important
points. The abundance of C. gunnari went through
major ¯uctuations during the active period of the
®shery in the 1970s and 1980s. Several surveys were
conducted during this period and they track the
changes in abundance reasonably well. However, in
the period after the cessation of commercial ®shing,
the VPA results did not correspond well to changes
in both abundance and age structure shown by sur-
veys between 1990 and 1991 (Anonymous 1993;
Parkes 1993).
To investigate population changes between adja-
cent surveys, we used cohort analysis to project
numbers at age estimated from one survey forwards
to the time of the following survey. When catches
are involved, this type of analysis su�ers from the
fact that surveys are regarded as a relative measure
of abundance, while the catches are taken to be
absolute. However, since the end of February 1990
the catch at South Georgia has been very small (the
reported catch between the times of the 1990 and
1991 surveys was 3828 tonnes, all taken in February
and March 1990). For simplicity, the catch compo-
nent of equation 1 was therefore omitted from the
cohort analyses.
Table 2. Details of vessels used in the surveys
Vessel name Profesor Siedlecki Hill Cove Falklands Protector Cordella
Port of registry Gdynia, Poland Stanley, Falkland Islands Hull, UK Hull, UK
Surveys 1987, 1988, 1989 1990 1991, 1992 1994
LOA 89´3 60 69´15
Horsepower 2800 2200 2500 2700
Tonnage 997´27 NRT 1591 GRT 1500 GRT
Trawl used P32/36 HC-120 FP-120 FP-120
LOA = length overall; GRT = gross registered tonnage; NRT = net registered tonnage.
Table 3. Characteristics of bottom trawl nets used in the surveys
P32/36 HC-120 FP-120
Headline length (m) 36 36´6 36´6
Measured headline height (m) (Pilling & Parkes 1995) 3´25±5
Measured wingspread (m) (Pilling & Parkes 1995) 14´5±22´3
Lower wings Absent Present Absent
Doors Polyvalent Polyvalent 1200 kg Polyvalent 1200 kg
594Variation in
standing stock of
the mackerel ice-
®sh
# 1999 British
Ecological Society
Journal of Applied
Ecology, 36,
591±603

Observed abundance at age was estimated from
the total biomass (this study); age distributions and
mean weight at age were derived separately from
each survey data set (Parkes 1993). These values
were projected stochastically to the time of the fol-
lowing survey. Ninety-®ve per cent con®dence inter-
vals (CI) for observed abundances at age were
simulated, using a bootstrap method, from the over-
all coe�cients of variation (CV) (assumed to be con-
stant across ages) provided by the TRAWLCI
program, assuming log-normally distributed resi-
duals. The 95% CI for the projected values was
derived from 2000 individual evaluations for each
age class. M was assumed to be constant (0´42)
across ages and years. Values for South Georgia
only were used in the projections due to the incom-
plete time series and small number of hauls from
Shag Rocks. The projection periods and age class
comparisons are shown in Table 4.
Results
SURVEYS
Throughout the survey series, the total catch of C.
gunnari in each haul was generally between 1 and
100 kg for a standard 30-min haul. All surveys
included a small proportion (about 5±10%) of larger
hauls, generally in the region of 0´2±1´0 tonnes. The
most extreme case was the 1990 survey, which con-
tained three hauls from South Georgia of between 2
and 8 tonnes each, two hauls at Shag Rocks of
between 3 and 5 tonnes, and a further haul at Shag
Rocks of about 55 tonnes, each for a standard half-
hour tow. Owing to the relatively small number of
hauls from Shag Rocks, this last catch had a great
e�ect on the estimates of both biomass and variance
for that year. Indices of relative abundance for C.
gunnari at Shag Rocks and South Georgia are set
out in Table 5.
Table 4. Projected means and con®dence intervals of relative abundance compared with the observed values from the sur-
veys
Projection
Period of
projection Comparison
2- and 3-year-old ®sh observed in 1989 to
3- and 4-year-old ®sh in 1990
1 year Predicted and observed 3- and 4-year-old ®sh in 1990
2- and 3-year-old ®sh observed in 1990 to
3- and 4-year-old ®sh in 1991
1 year Predicted and observed 3- and 4-year-old ®sh in 1991
2- and 3-year-old ®sh observed in 1991 to
3- and 4-year-old ®sh in 1992
1 year Predicted and observed 3- and 4-year-old ®sh in 1992
2- and 3-year-old ®sh observed in 1992 to
4- and 5-year-old ®sh in 1994
2 years Predicted and observed 4- and 5-year-old ®sh in 1994
Table 5. Estimated standing stock of Champsocephalus gunnari at South Georgia and Shag Rocks from trawl surveys. Note
that the 1990 survey around Shag Rocks included one exceptionally large haul of 40 tonnes in 22min
South Georgia Shag Rocks
Year Biomass (tonnes)
(lower CI±upper CI)
N
CV(%)
Biomass (tonnes)
(lower CI±upper CI)
N
CV(%)
1987 48 452 94 11 254 9
(31 839±85 567) 22´4 (2445±29 191) 63´2
1988 17 326 113 1386 3
(10 687±35 086) 36´8 (77±2´6� 1011) 76´7
1989 24 290
(12 201±76 002)
55
38´1
No sample
1990 67 620 59 305 889 8
(18 289±605 485) 64´2 (25 287±2´3� 1010) 78´7
1991 27 160 66 3855 10
(17 196±55 599) 25´9 (925±242 113) 68´6
1992 41 449 67 4659 11
(27 347±123 349) 21´6 (990±273 453) 72´7
1994 16 572 71 5275 13
(10 704±39 336) 23´5 (3134±15 049) 26´4
595I. Everson et al.
# 1999 British
Ecological Society
Journal of Applied
Ecology, 36,
591±603
The point estimates of biomass and associated
lower con®dence limits ¯uctuated substantially but
it is di�cult to interpret these because of the extre-
mely large upper con®dence limits. These latter we
believe to be overestimated by the TRAWLCI pro-
gram. The CV of the mean values of relative abun-
dance around South Georgia were, with one
exception, in the region of 21±38%. The lower num-
ber of sample stations and patchy distributions of
®sh at Shag Rocks resulted in high CV (60±80%)
for all except the 1994 survey.
COHORT ANALYSIS
The results of the cohort projections are shown in
Table 6. In both 1990 and 1992, observed abun-
dances were reasonably close to, and not signi®-
cantly di�erent from, those expected from previous
surveys. However, in 1991 and 1994 there were
anomalies indicating major departures from the
population model. In both these years, the observed
abundances were signi®cantly below those expected
on the basis of assumed levels of growth and M.
The incomplete time series and small number of
hauls from Shag Rocks means that estimates for
this area are subject to a much greater uncertainty
than those from South Georgia. In spite of this,
there is good evidence for a substantial decline in
standing stock at Shag Rocks between the 1990 and
1991 surveys (Table 5).
Discussion
The level of uncertainty around survey biomass esti-
mates and projections based on them is very often
high. Despite this, the anomalies shown by the ana-
lysis presented here show signi®cant departures
from the population model. However, the purpose
of this paper is not to examine the magnitude of
these anomalies in detail, beyond noting that they
are substantial, but rather to suggest mechanisms
that might be responsible for their existence.
The natural mortality coe�cient, M, prior to the
start of commercial ®shing was thought to be
around 0´42 (Everson 1998). This would mean that
under normal circumstances only around 5% of 1-
year-old ®sh would live to 7 years or more.
Although ®sh up to age 14 have been observed
(Permitin 1973), the older ®sh made up only a very
small proportion of the population prior to exploita-
tion (Kock & KoÈ ster 1989). Thus even prior to the
onset of commercial ®shing the population would
have been dominated by younger ®sh and the great-
est changes in biomass would have been associated
with 2, 3 and 4 year olds. Increase in the preponder-
ance of younger ®sh in the stock is a typical result
of the impact of commercial ®shing and has been
reported for ice®sh (Kock 1992). Following the ces-
sation of commercial ®shing in 1990 one would rea-
sonably expect to have seen a corresponding
increase in the proportion of older ®sh in the stock
and an associated reduction in the interannual varia-
bility in abundance. The survey estimates and
cohort projections indicate that this has not
occurred.
Evidence from surveys at South Georgia indicates
that the biomass of the dominant year classes was
signi®cantly less than expected in 1991 and 1994.
We conclude that these deviations from the popula-
tion model genuinely demonstrate two major
declines in adult abundance of C. gunnari in the
region in the absence of ®shing. These declines
occurred during seasons when the krill abundance
was low. In seasons when the krill abundance
appeared normal, 1990 and 1992, the cohort projec-
tions fell within the con®dence intervals of the sur-
vey results.
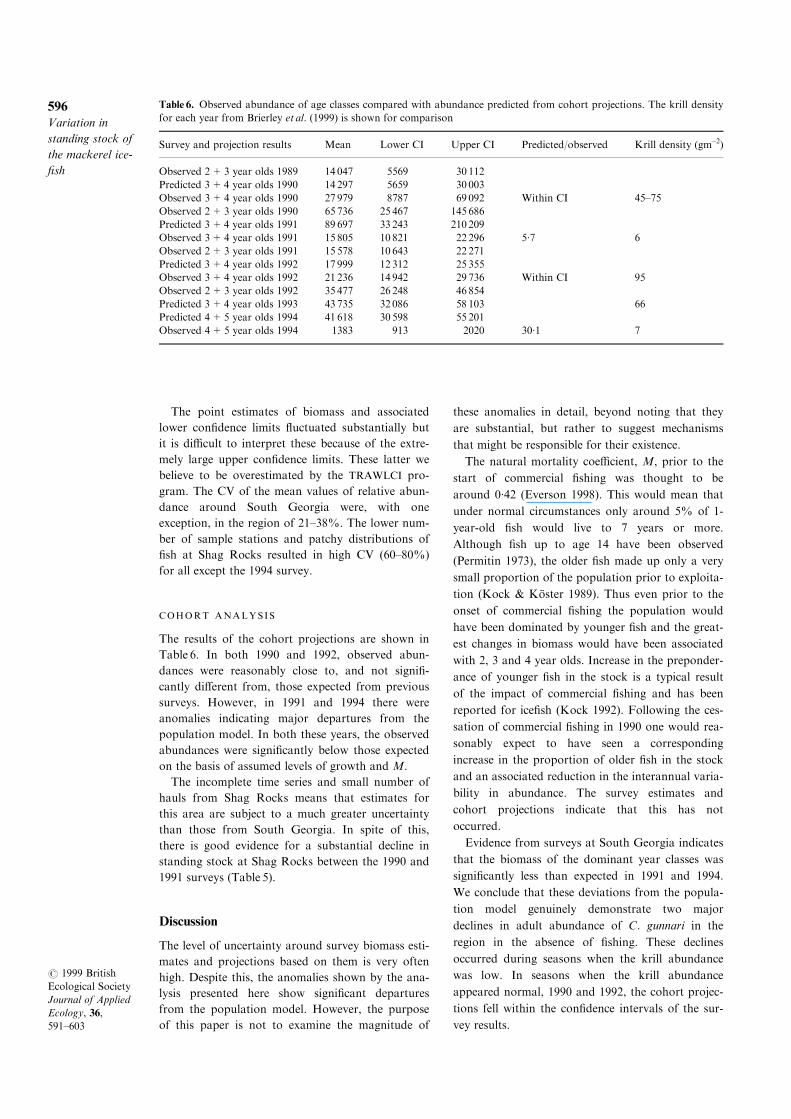
Table 6. Observed abundance of age classes compared with abundance predicted from cohort projections. The krill density
for each year from Brierley et al. (1999) is shown for comparison
Survey and projection results Mean Lower CI Upper CI Predicted/observed Krill density (gm±2)
Observed 2+3 year olds 1989 14 047 5569 30 112
Predicted 3+4 year olds 1990 14 297 5659 30 003
Observed 3+4 year olds 1990 27 979 8787 69 092 Within CI 45±75
Observed 2+3 year olds 1990 65 736 25 467 145 686
Predicted 3+4 year olds 1991 89 697 33 243 210 209
Observed 3+4 year olds 1991 15 805 10 821 22 296 5´7 6
Observed 2+3 year olds 1991 15 578 10 643 22 271
Predicted 3+4 year olds 1992 17 999 12 312 25 355
Observed 3+4 year olds 1992 21 236 14 942 29 736 Within CI 95
Observed 2+3 year olds 1992 35 477 26 248 46 854
Predicted 3+4 year olds 1993 43 735 32 086 58 103 66
Predicted 4+5 year olds 1994 41 618 30 598 55 201
Observed 4+5 year olds 1994 1383 913 2020 30´1 7
596Variation in
standing stock of
the mackerel ice-
®sh
# 1999 British
Ecological Society
Journal of Applied
Ecology, 36,
591±603

The remainder of this paper is devoted to consid-
ering possible explanations for these observations,
posed as a series of questions.
ARE THE ANOMALIES SIMPLY AN
EXPERIMENTAL ARTEFACT?
There are two main issues to be considered when
assessing whether the observed anomalies in 1991
and 1994 are genuine. These are, ®rst, that some
aspect of the survey design was inappropriate for
the distribution of the target species, and secondly,
that the e�ciency of the sampling gear varied
between surveys due to changes in equipment speci-
®cation or some aspect of the behaviour of the ®sh
associated with the timing of the surveys.
The random strati®ed design of the ground®sh
survey is a well-established methodology, used
around the world (Sissenwine, Azarovitz & Suomala
1983; Anonymous 1992a, b) that has been examined
and approved for surveying of C. gunnari by the
CCAMLR Working Group on Fish Stock
Assessment on a number of occasions (Anonymous
1992c). Therefore there is not thought to be any
inherent problem with the basic experimental meth-
odology used for the surveys.
As stated earlier, inter-vessel calibration studies
were not possible for a variety of reasons. The e�ect
of changing the survey vessel during the course of
the series is therefore unknown. Other studies have
shown that both vessel and trawl door e�ects are
potentially signi®cant. For example, using data from
the 35-year trawl survey series conducted by the US
NMFS North-east Fisheries Science Centre and its
predecessors, calculated vessel coe�cients (catch
ratio of two vessels ®shing simultaneously) in the
region of 0´8 for cod and haddock (95% CI 0´69±
0´94) and door coe�cients (catch ratio of polyvalent
to BMV doors) in the region of 1´49±1´56 (95% CI
1´18±1´88) were obtained (Anonymous 1991). The
reason that larger vessel di�erences were not
observed may be due, at least in part, to the fact
that both of the NMFS research vessels are much
oversized with regard to weight and horsepower for
the size of the trawl employed (C. Byrne, personal
communication). The same can be said of the vessels
used in the South Georgia survey series, all of which
were large stern trawlers more than capable of hand-
ling the small bottom trawl used throughout. In the
absence of any other information, the possible
e�ects resulting from changes in vessels were treated
as negligible. In contrast, it was concluded from the
NMFS study that changes in the trawl doors were
the most signi®cant intervention in the survey series.
There were no changes in the design of polyvalent
trawl doors used during the South Georgia series.
With respect to the three trawls, a comparison of
the characteristics of the nets is given in Parkes
(1993). The most notable di�erence between them is
the presence of lower wings in the HC-120 (1989/90
survey), which were not included in the other two
nets (the P32/36, 1986/87±1988/89, and the FP-120,
1990/91±1993/94). While it is possible that the pre-
sence of the lower wings increased the catching e�-
ciency of the HC-120 trawl compared to the others,
there is no way of knowing the extent to which this
is true. The ®shing master who worked with both
the HC-120 and the FP-120 trawls thought that the
e�ect was probably small on the rough trawling
ground around South Georgia. It should also be
noted that the two surveys that indicated the decline
in abundance between 1992 and 1994 used the same
trawl (the FP-120).
Champsocephalus gunnari are known to spend
daylight hours very close to the seabed and migrate
up into the water column at night (Frolkina &
Shlibanov 1991). Since the 1991 season, sampling on
the South Georgia ground®sh survey has been
restricted to daylight hours to prevent under-repre-
sentation of ®sh in the catch at night. Abundance
estimates prior to this time may therefore be nega-
tively biased compared with later estimates. If true,
this would make the discrepancy between expected
and observed abundance in 1991 even greater.
All of the surveys were undertaken at approxi-
mately the same time of year, during the summer
period, several months prior to the main spawning
season. The ®sh are known to aggregate prior to
spawning (Kock & Everson 1997); however, we do
not feel that this e�ect could have in¯uenced the
abundance estimates to the extent that we have
found.
COULD THE ANOMALIES BE THE RESULT
OF UNREPORTED FISHING?
The ®shing that took place up to the 1989/90 season
(Fig. 1) will have had an e�ect on the variability in
abundance and age structure of the population. This
e�ect would have continued as the population
recovered. Even allowing for this e�ect, the dra-
matic and abrupt declines in abundance in 1991 and
1994 cannot be explained by the reported catches.
The cohort analysis assumes that the reported
catches are a true re¯ection of the biological
removals from the C. gunnari stocks around South
Georgia, i.e. that there was negligible ®shing mortal-
ity after January 1990. In 1991 the reported com-
mercial catch was only 41 tonnes (SC-CAMLR
1991), against a total allowable catch of 26 000
tonnes (CCAMLR 1990c). Fishing vessels were
known to have been operating in the area, but left
due to the extremely poor catch rates (SC-CAMLR
1991), which tends to con®rm the gross reduction in
abundance at that time. It is unlikely that misreport-
ing has occurred given the low catch rates.
597I. Everson et al.
# 1999 British
Ecological Society
Journal of Applied
Ecology, 36,
591±603

Subsequent to 1990, we know of no commercial ®sh-
ing that could account for the discrepancies in the
standing stock estimates.
COULD THE FISH BE MIGRATING AWAY
FROM THE SURVEY AREA?
The distribution of C. gunnari is restricted to the
shelf area, and most ®sh were caught in water less
than 300m deep. South Georgia is an island, sepa-
rated from other major island groups by several
hundred miles and by waters over 2000m deep. A
survey at the South Orkney Islands, 300 miles away
from South Georgia, in January and February 1991
(Balguerias 1991) did not indicate a dramatic
increase in abundance over previous estimates, as
might be expected if a migration to that area, of the
scale necessary to account for the observed change,
had taken place.
Shag Rocks are close to South Georgia but are
separated from it by water deeper than 1000m for
approximately 10 nautical miles. If the decline on
the South Georgia shelf were a result of ®sh having
migrated across this gap, then a negative correlation
would be expected between the standing stock on
the South Georgia shelf and that around Shag
Rocks. This correlation is positive (R=0´764, d.f.
4, 0´1<P<0´05), indicating that the changes in
biomass at the two locations are moving in the same
direction and consequently discounting migration
between Shag Rocks and South Georgia as a viable
explanation.
Information from analysis of genetic variability
between di�erent localities has indicated that move-
ment of individuals between the South Orkneys and
South Georgia does occur (Carvalho & Lloyd-Evans
1990; Carvalho & Warren 1991). However, the
amount of mixing of ®sh required to produce these
results is almost certainly very much smaller than
would be required to explain the substantial reduc-
tions in standing stock around South Georgia.
Consequently we consider it unlikely that the
e�ect is due to local migration and also that, due to
the large expanse of deep water separating the
South Georgia and Shag Rocks region from other
suitable areas of shelf such as South Orkneys and
South Shetlands, the probability of such a large-
scale migration over such a distance is extremely
small.
COULD THE ANOMALIES BE THE RESULT
OF DEPARTURES FROM THE ASSUMPTIONS
IN THE POPULATION MODEL?
In 1990 and 1992, when the krill density was high,
the cohort projections in Table 6 fell within the con-
®dence intervals of the survey values, but when the
krill density was low, 1991 and 1994, the cohort pro-
jections were substantially above the survey values.
This is indicative of an ecological e�ect whereby
some of the assumptions in the population model
may no longer be valid.
Departures from the assumptions about growth
and M in the population model could give rise to
the observed anomalies. M was assumed to be con-
stant across years and ages. Growth was assumed to
be well represented by the mean weights at age cal-
culated from samples taken during the surveys. Of
these two possibilities, the single most plausible
explanation for these observations that has emerged
from discussions within the CCAMLR Working
Group on Fish Stock Assessment, is that periodi-
cally there is a dramatic increase in M considerably
in excess of the normally assumed level
(Anonymous 1994) of 0´42 (Everson 1998). We envi-
sage three situations under which natural mortality
could have dramatically increased to account for the
apparent changes in 1991 and 1994: zoonosis, star-
vation and increased predation.
In spite of examining over 10 000 ®sh during the
course of the surveys we have found no indication
that would point to disease as being the cause of
declines in numbers. The only evidence of disease
observed during the surveys was very small numbers
of ®sh, less than ®ve ®sh on any survey, that
appeared to have lesions, similar to the `X cell'
lesions reported by Bucke & Everson (1992) from
Lepidonotothen squamifrons.
Information on the diet of ice®sh, obtained during
most of the surveys, has been published (Kock et al.
1994). This indicates that the preferred food of C.
gunnari is Antarctic krill Euphausia superba, but that
periodically, when this is scarce, there is a greater
proportion of mysids and the hyperiid amphipod
Themisto gaudichaudii in their diet (Kock et al.
1994).
In years when krill are scarce, more of the sto-
machs of C. gunnari examined were empty com-
pared with years when krill were abundant. Even so,
when krill were scarce, the ®sh were apparently able
to feed successfully on alternative prey. Condition
indices have also been examined, which indicate
that, when krill were scarce, the ®sh were in poorer
condition. However, the reduction in condition is
thought to be insu�cient to cause death (Everson,
Kock & Parkes 1997). We therefore consider that
feeding conditions are unlikely to be the major
direct cause of the year-to-year di�erences in survi-
vorship.
The CCAMLR Ecosystem Monitoring
Programme (CEMP) uses data that provide indices
of krill availability on a variety of time and space
scales (Anonymous 1995). All four indicator species
monitored at South Georgia (fur seals Arctocephalus
gazella, gentoo penguin Pygoscelis papua Brandt,
macaroni penguin Eudyptes chrsolophus Forster and
598Variation in
standing stock of
the mackerel ice-
®sh
# 1999 British
Ecological Society
Journal of Applied
Ecology, 36,
591±603
black browed albatross Diomedea melanophris
Temminick) provided indices (e.g. reproductive per-
formance) indicating that from 1988 to 1997 there
have been two periods when the availability of krill
around South Georgia was low. These were immedi-
ately prior to 1991 and 1994 (Table 7). These years
coincide with the years of unexpectedly low abun-
dance of C. gunnari and also krill at South Georgia
(Table 6).
In considering possible e�ects due to predation on
C. gunnari it is necessary to note the size spectrum
of ®sh in the diet and the amount that each predator
is likely to consume. Table 8 lists the dominant ®sh-
eating predators known to forage on the South
Georgia shelf.
Gentoo penguins at South Georgia are estimated
to consume about 28 000 tonnes of ®sh each year
(Croxall, Prince & Ricketts 1984), around 27% of
which is estimated to be C. gunnari. In an average
year, therefore, gentoo penguins are likely to con-
sume around 7500 tonnes. There would need to be a
substantial increase in this amount to account for
the observed discrepancies in C. gunnari abundance,
which seems unlikely.
At South Georgia the fur seal population has
been increasing over the past several decades to its
present level of more than 4 million (Boyd 1993).
Models based on the energetic requirements of seals
using estimated pup production, age-speci®c annual
survival (Boyd et al. 1995), growth (Payne 1979) and
an average ®eld metabolic rate, which is four times
the basal metabolic rate (Costa, Croxall & Duck
1988), indicate that the current population would
consume about 5 or 6 million tonnes of krill each
year.
During the breeding season, the period of greatest
food consumption, lactating female fur seals are
land-based predators, with a median foraging range
in the region of 80 km from shore. Consequently
they rely on a high local abundance of food, prefer-
ably krill, to meet their energetic requirements at
this critical time of year (Reid & Arnould 1996;
Iverson, Arnould & Boyd 1997). They also feed on
®sh, particularly C. gunnari (Reid 1995), although
their ability to take large amounts of that species
may be constrained by their restricted diving depth
relative to the main depth range of the ®sh, 150±
250m. Dives tend to be no deeper than the mixed
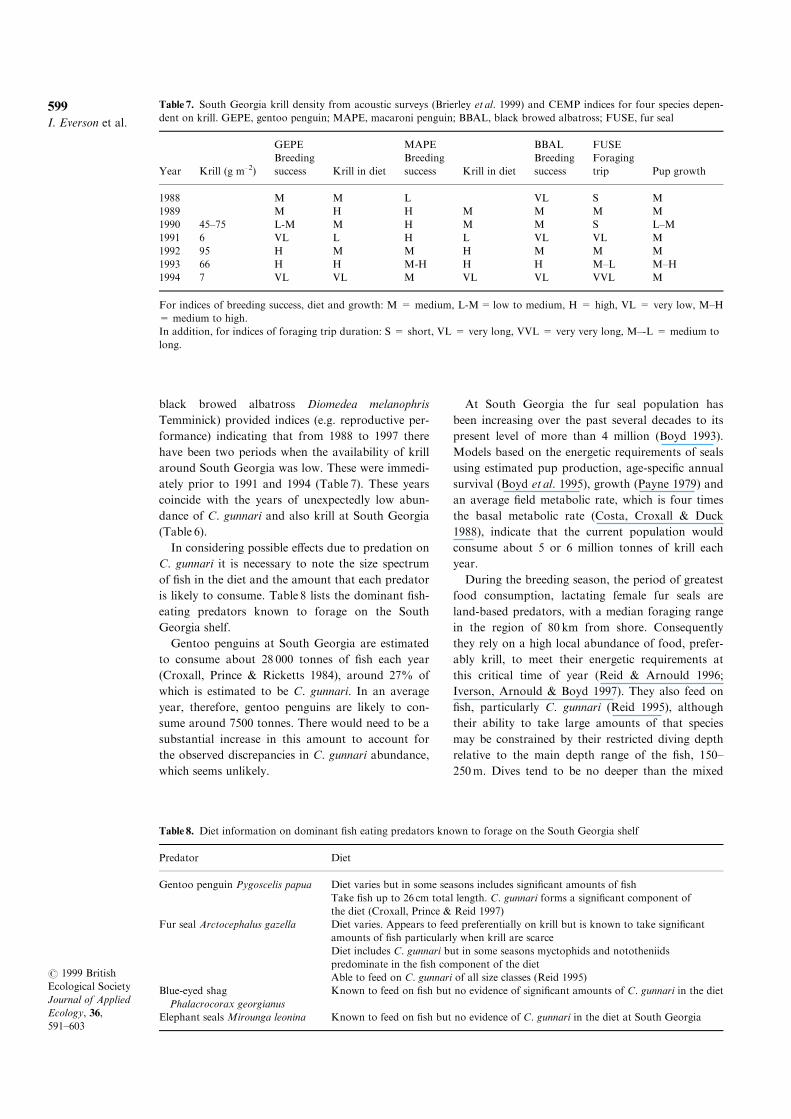
Table 7. South Georgia krill density from acoustic surveys (Brierley et al. 1999) and CEMP indices for four species depen-
dent on krill. GEPE, gentoo penguin; MAPE, macaroni penguin; BBAL, black browed albatross; FUSE, fur seal
Year Krill (g m±2)
GEPE
Breeding
success Krill in diet
MAPE
Breeding
success Krill in diet
BBAL
Breeding
success
FUSE
Foraging
trip Pup growth
1988 M M L VL S M
1989 M H H M M M M
1990 45±75 L-M M H M M S L±M
1991 6 VL L H L VL VL M
1992 95 H M M H M M M
1993 66 H H M-H H H M±L M±H
1994 7 VL VL M VL VL VVL M
For indices of breeding success, diet and growth: M = medium, L-M=low to medium, H = high, VL = very low, M±H
= medium to high.
In addition, for indices of foraging trip duration: S = short, VL = very long, VVL = very very long, M±-L = medium to
long.
Table 8. Diet information on dominant ®sh eating predators known to forage on the South Georgia shelf
Predator Diet
Gentoo penguin Pygoscelis papua Diet varies but in some seasons includes signi®cant amounts of ®sh
Take ®sh up to 26 cm total length. C. gunnari forms a signi®cant component of
the diet (Croxall, Prince & Reid 1997)
Fur seal Arctocephalus gazella Diet varies. Appears to feed preferentially on krill but is known to take signi®cant
amounts of ®sh particularly when krill are scarce
Diet includes C. gunnari but in some seasons myctophids and nototheniids
predominate in the ®sh component of the diet
Able to feed on C. gunnari of all size classes (Reid 1995)
Blue-eyed shag
Phalacrocorax georgianus
Known to feed on ®sh but no evidence of signi®cant amounts of C. gunnari in the diet
Elephant seals Mirounga leonina Known to feed on ®sh but no evidence of C. gunnari in the diet at South Georgia
599I. Everson et al.
# 1999 British
Ecological Society
Journal of Applied
Ecology, 36,
591±603
layer, with 95% of dives being less than 50m,
although they are known to dive deeper than 100m
(Boyd & Croxall 1992; Boyd, McCa�erty & Walker
1997).
We suggest that if krill were scarce at this time of
year then fur seals are likely to feed to a greater
extent on ®sh, including C. gunnari, within their
foraging range. The magnitude of this prey shift
could be su�cient to result in a signi®cant increase
in M on C. gunnari. A brief study of the relative
energy densities of krill and ®sh provides a ®rst
approximation of the possible quantities involved:
assuming energy densities for krill and ®sh of 3´5
and 4´0 MJ kg±1, respectively (Clarke 1980; Cherel
& Ridoux 1992), the total dietary requirement, if the
diet was totally of ®sh, would be over 4´5 million
tonnes. If the increased consumption of C. gunnari
by fur seals in times of krill scarcity amounted to
only 5% of this total requirement, this would be in
the same order of magnitude as the observed unex-
plained declines in the abundance of C. gunnari.
Is there evidence for such shifts occurring? Reid &
Arnould (1996) studied the diet of breeding fur seals
during the period from January to March from 1991
to 1994. They found that during this time, although
krill was the most frequently occurring prey item,
present in 88% of all scats examined, ®sh were pre-
sent in 47% of scats. Protomyctophum choriodon,
Lepidonotothen larseni and C. gunnari were the
dominant ®sh species present. They also found that
in the two seasons when krill were known to be
scarce, 1991 and 1994, the occurrence of ®sh was
highest; ®sh occurring in 62% and 67% of scats,
respectively. However, the proportion of C. gunneri
in fur seal diet was very much lower in 1991 than in
1994, and they appeared to be eating older ®sh (3+
years) than in 1994, when they ate 2-year-old ®sh
(Reid & Arnould 1996). Thus, while there is sub-
stantial evidence for increased consumption of ice-
®sh by fur seals in years of low krill abundance, the
interaction between the two species is obviously also
dependent upon other factors, such as the timing of
krill scarcity and year-class strength of the ice®sh
population itself.
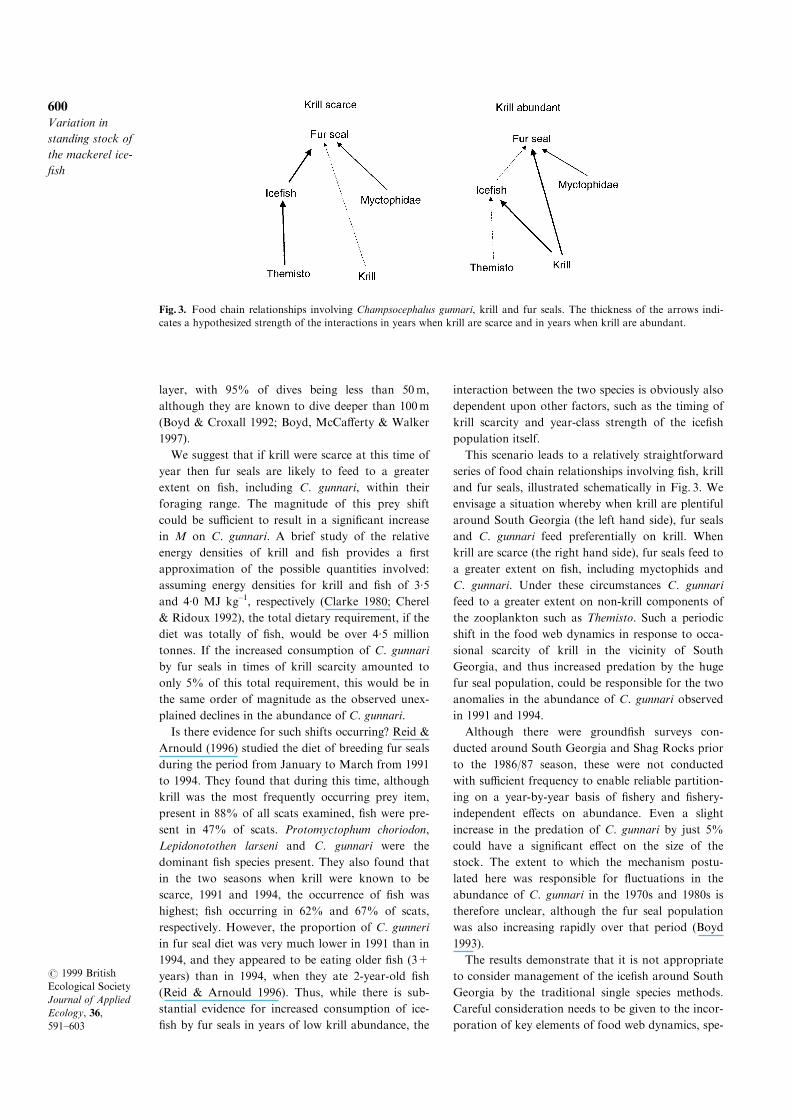
This scenario leads to a relatively straightforward
series of food chain relationships involving ®sh, krill
and fur seals, illustrated schematically in Fig. 3. We
envisage a situation whereby when krill are plentiful
around South Georgia (the left hand side), fur seals
and C. gunnari feed preferentially on krill. When
krill are scarce (the right hand side), fur seals feed to
a greater extent on ®sh, including myctophids and
C. gunnari. Under these circumstances C. gunnari
feed to a greater extent on non-krill components of
the zooplankton such as Themisto. Such a periodic
shift in the food web dynamics in response to occa-
sional scarcity of krill in the vicinity of South
Georgia, and thus increased predation by the huge
fur seal population, could be responsible for the two
anomalies in the abundance of C. gunnari observed
in 1991 and 1994.
Although there were ground®sh surveys con-
ducted around South Georgia and Shag Rocks prior
to the 1986/87 season, these were not conducted
with su�cient frequency to enable reliable partition-
ing on a year-by-year basis of ®shery and ®shery-
independent e�ects on abundance. Even a slight
increase in the predation of C. gunnari by just 5%
could have a signi®cant e�ect on the size of the
stock. The extent to which the mechanism postu-
lated here was responsible for ¯uctuations in the
abundance of C. gunnari in the 1970s and 1980s is
therefore unclear, although the fur seal population
was also increasing rapidly over that period (Boyd
1993).
The results demonstrate that it is not appropriate
to consider management of the ice®sh around South
Georgia by the traditional single species methods.
Careful consideration needs to be given to the incor-
poration of key elements of food web dynamics, spe-
Fig. 3. Food chain relationships involving Champsocephalus gunnari, krill and fur seals. The thickness of the arrows indi-
cates a hypothesized strength of the interactions in years when krill are scarce and in years when krill are abundant.
600Variation in
standing stock of
the mackerel ice-
®sh
# 1999 British
Ecological Society
Journal of Applied
Ecology, 36,
591±603
ci®cally those interactions involving krill, Themisto,
myctophids and fur seals into a management regime.
This is central to the mechanism for precautionary
management that is currently being developed and is
based on the assumption that M may increase dra-
matically in some years due to changes in predation
pressures (Agnew et al. 1998).
Viewed in a wider context, this study demon-
strates how a key predator can have an over-riding
impact on a commercial ®sh species. Furthermore,
through the interaction between environmental
variability and a large population of predators, it
highlights the importance of the ecosystem approach
to management of the Convention for the
Conservation of Antarctic Marine Living Resources,
the only international ®sheries convention to have
such an approach as its central pillar (Anonymous
1981).
Acknowledgements
We gratefully acknowledge all the o�cers, crew and
scienti®c teams on the various research cruises. We
also thank David Agnew, Geo� Kirkwood, John
Croxall and Keith Reid for their contributions to
various discussions leading up to completion of this
paper. Two anonymous referees made several useful
comments on an earlier draft of the manuscript that
served to strengthen the paper and this is gratefully
acknowledged.
References
Agnew, D., Everson, I., Kirkwood, G. & Parkes, G. (1998)
Towards the development of a management plan for
the mackerel ice®sh (Champsocephalus gunnari) in
Subarea 48.3. CCAMLR Science, 5, 63±78.
Aitchison, J. (1955) On the distribution of a positive ran-
dom variable having a discrete probability mass at the
origin. Journal of the American Statistical Association,
50, 901±908.
Anonymous (1981) Convention on the conservation of
Antarctic marine living resources. Polar Record, 20,
383±395.
Anonymous (1991) Survey vessels and gear modi®cations
and their possible e�ects on assessment analyses.
Report of the Twelfth Northeast Regional Stock
Assessment Workshop (12th SAW), Spring 1991, pp.
20±27. Reference Document 91±03. Northeast
Fisheries Science Centre, Woods Hole, MA.
Anonymous (1992a) Report of the Workshop on the
Analysis of Trawl Survey Data, Woods Hole, 4±9 June
1992. CM 1992/D:6. International Council for the
Exploration of the Seas, Copenhagen.
Anonymous (1992b) Manual for the International Bottom
Trawl Surveys, Rev. IV, Copenhagen, January 1992.
Addendum to CM 1992/H:3. International Council for
the Exploration of the Seas, Copenhagen.
Anonymous (1992c) CCAMLR workshop on design of
bottom trawl surveys, Hamburg, September, 1992.
Report of the Eleventh Meeting Annex 5. Report of the
Working Group on Fish Stock Assessment, SC-
CAMLR-XI Appendix H. Scienti®c Committee for the
Conservation of Antarctic Marine Living Resources,
CCAMLR, Hobart, Australia.
Anonymous (1993) Report of the Twelfth Meeting Annex 5.
Report of the Working Group on Fish Stock
Assessment, SC-CAMLR-XII, pp. 290±329. Scienti®c
Committee for the Conservation of Antarctic Marine
Living Resources, CCAMLR, Hobart, Australia.
Anonymous (1994) Report of the Twelfth Meeting Annex 4.
Report of the Working Group on Fish Stock
Assessment, SC-CAMLR-XIII. Scienti®c Committee
for the Conservation of Antarctic Marine Living
Resources, CCAMLR, Hobart, Australia.
Anonymous (1995) Report of the Fourteenth Meeting
Annex 4. Report of the Working Group on Ecosystem
Monitoring and Management, SC-CAMLR-XIV.
Scienti®c Committee for the Conservation of Antarctic
Marine Living Resources, CCAMLR, Hobart,
Australia.
Balguerias, E. (1991) Informe de la campana Espanola de
evaluacion de los stock de peces de Orcadas del Sur
(Antartida 9101). Report of the Tenth Meeting Annex
6. Report of the Working Group on Fish Stock
Assessment, SC-CAMLR-X. Document WG-FSA-91/
33. Scienti®c Committee for the Conservation of
Antarctic Marine Living Resources, CCAMLR,
Hobart, Australia.
Boyd, I.L. (1993) Pup production and distribution of
breeding Antarctic fur seals (Arctocephalus gazella) at
South Georgia. Antarctic Science, 5, 17±24.
Boyd, I.L. & Croxall, J.P. (1992) Diving behaviour of lac-
tating Antarctic fur seals. Canadian Journal of
Zoology, 70, 919±928.
Boyd, I.L., Croxall, J.P., Lunn, N.J. & Reid, K. (1995)
Population demography of Antarctic fur seals: the
costs of reproduction and implications for life-his-
tories. Journal of Animal Ecology, 64, 505±518.
Boyd, I.L., McCa�erty, D.J. & Walker, T.R. (1997)
Variation in foraging e�ort by lactating Antarctic fur
seals: response to simulated increased foraging costs.
Behavioural Ecology Sociobiology, 40, 135±144.
Brierley, A.S., Watkins, J.L., Goss, C., Wilkinson, M.T. &
Everson, I. (1999) Acoustic estimates of krill abun-
dance at South Georgia 1981±1998. CCAMLR
Science, 6, in press.
Bucke, D. & Everson, I. (1992) `X-cell' lesions in
Notothenia (Lepidonotothen) squamifrons GuÈ nther.
Bulletin of the European Association of Fish
Pathologists, 12, 83±86.
Carvalho, G.R. & Lloyd-Evans, D.P. (1990) Pilot study on
electrophoretic variation and stock structure in the
mackerel ice®sh Champsocephalus gunnari, South
Georgia waters. Report of the Ninth Meeting Annex 5.
Report of the Working Group on Fish Stock
Assessment, SC-CAMLR-IX. Document WG-FSA-90/
11. Scienti®c Committee for the Conservation of
Antarctic Marine Living Resources, CCAMLR,
Hobart, Australia.
Carvalho, G.R. & Warren, M. (1991) Genetic population
structure of mackerel ice®sh, Champsocephalus gunnari
in Antarctic waters. Report of the Tenth Meeting
Annex 5. Report of the Working Group on Fish Stock
Assessment, SC-CAMLR-XI. Document WG-FSA-91/
22. Scienti®c Committee for the Conservation of
Antarctic Marine Living Resources, CCAMLR,
Hobart, Australia.
CCAMLR (1990a) Statistical Bulletin of the Commission
for the Conservation of Antarctic Marine Living
Resources, CCAMLR-SB/90/1 (1970±1979).
CCAMLR, Hobart, Australia.
601I. Everson et al.
# 1999 British
Ecological Society
Journal of Applied
Ecology, 36,
591±603

CCAMLR (1990b) Statistical Bulletin of the Commission
for the Conservation of Antarctic Marine Living
Resources, CCAMLR-SB/90/2 (1980±1989).
CCAMLR, Hobart, Australia.
CCAMLR (1990c) Report of the Commission for the
Conservation of Antarctic Marine Living Resources,
CCAMLR IX, Hobart Australia. CCAMLR, Hobart,
Australia.
CCAMLR (1996) Statistical Bulletin of the Commission for
the Conservation of Antarctic Marine Living Resources,
CCAMLR-SB/90/1 (1986±1995). CCAMLR, Hobart,
Australia.
Cherel, Y. & Ridoux, V. (1992) Prey species and nutritive
value of food fed during summer to king penguin,
Aptenodytes patagonica, chicks at Possession Island,
Crozet Archipelago. Ibis, 134, 118±127.
Clarke, A.C. (1980) The biochemical composition of krill
Euphausia superba Dana, from South Georgia. Journal
of Experimental Marine Biology and Ecology, 43, 221±
236.
Costa, D.P., Croxall, J.P. & Duck, C. (1988) Foraging
energetics of Antarctic fur seals in relation to changes
in prey availability. Ecology, 70, 596±606.
Croxall, J.P., Prince, P.A. & Reid, K. (1997) Dietary segre-
gation of krill-eating South Georgia seabirds. Journal
of Zoology, London, 242, 531±556.
Croxall, J.P., Prince, P.A. & Ricketts, C.R. (1984) Impact
of seabirds on marine resources, especially krill, of
South Georgia waters. Seabird Energetics (eds
G. Causey Whittow & H. Rahn), pp. 285±317.
Plenum, New York.
Everson, I. (1998) Natural mortality rate in the mackerel
ice®sh (Champsocephalus gunnari) around South
Georgia. CCAMLR Science, 5, 245±258.
Everson, I. & Campbell, S. (1991) Areas of seabed within
selected depth ranges in CCAMLR subarea 48.3,
South Georgia. Selected Scienti®c Papers 1990,pp.
459±466. CCAMLR, Hobart, Australia.
Everson, I., Kock, K.-H. & Parkes, G. (1997) Interannual
variation in condition of the mackerel ice®sh. Journal
of Fish Biology, 51, 146±154.
Everson, I., Parkes, G.P., Boyd, I.L. & Kock, K.-H.
(1994a) Large variations in mackerel ice®sh
(Champsocephalus gunnari) standing stock at South
Georgia; are Antarctic fur seals (Arctocephalus gazella)
the cause? Report of the Twelfth Meeting Annex 5.
Report of the Working Group on Fish Stock
Assessment, SC-CAMLR-XII. Document WG-FSA-94/
17. Scienti®c Committee for the Conservation of
Antarctic Marine Living Resources, CCAMLR,
Hobart, Australia.
Everson, I., Parkes, G., Campbell, S., Kock, K.-H.,
Szlakowski, J., Cielniaszek, D., Goss, C. & Wilhelms,
S. (1992) Fish stock assessment survey in subarea 48.3.
Report of the Twelfth Meeting Annex 5. Report of the
Working Group on Fish Stock Assessment, SC-
CAMLR-XII. Document WG-FSA-92/17. Scienti®c
Committee for the Conservation of Antarctic Marine
Living Resources, CCAMLR, Hobart, Australia.
Everson, I., Parkes, G., Kock, K.-H., Campbell, S.,
Cielniaszek, D. & Szlakowski, Z. (1991) Fish stock
assessment survey in subarea 48.3. Report of the
Eleventh Meeting Annex 5. Report of the Working
Group on Fish Stock Assessment, SC-CAMLR-XI.
Document WG-FSA-91/14. Scienti®c Committee for
the Conservation of Antarctic Marine Living
Resources, CCAMLR, Hobart, Australia.
Everson, I., Parkes, G., Kock, K.-H., Goss, C.,
Cielniaszek, D., Szlakowski, J., Daly, H., Allcock, L.
& Pilling, G. (1994b) Fish stock assessment survey in
subarea 48.3. Report of the Thirteenth Meeting Annex
5. Report of the Working Group on Fish Stock
Assessment, SC-CAMLR-XIII. Document WG-FSA-
94/18. Scienti®c Committee for the Conservation of
Antarctic Marine Living Resources, CCAMLR,
Hobart, Australia.
Frolkina, J.A. & Shlibanov, V.I. (1991) On the problem of
ice®sh (Champsocephalus gunnari) vertical migration
on the South Georgia shelf. Report of the Tenth
Meeting Annex 5. Report of the Working Group on Fish
Stock Assessment, SC-CAMLR-X. Document WG-
FSA-91/6. Scienti®c Committee for the Conservation
of Antarctic Marine Living Resources, CCAMLR,
Hobart, Australia.
Gabriel (1988) Results of ®sh stock assessment survey,
South Georgia region, November±December 1986.
Selected Scienti®c Papers 1987, pp. 143±184. Scienti®c
Committee for the Conservation of Antarctic Marine
Living Resources, CCAMLR, Hobart, Australia.
Gavaris, S. (1993) Analytical estimates of reliability for the
projected yield from commercial ®sheries. Risk
Evaluation and Biological Reference Points for Fisheries
Management (eds S.J. Smith, J.J. Hunt & D. Rivard),
pp. 185±191. Canadian Special Publications in
Fisheries and Aquatic Science 120. Canadian Special
Publications in Fisheries and Aquatic Science,
University of Toronto, Toronto, Canada.
Gulland, J.A. (1975) Manual of Methods for Fisheries
Resource Survey and Appraisal. V. Objectives and Basic
Methods. Fisheries Technical Paper no. 145. FIRS/
T145. Food and Agriculture Organisation of the
United Nations (FAO), Rome, Italy.
Iverson, S.J., Arnould, J.P.Y. & Boyd, I.L. (1997) Milk
fatty acid signatures indicate both major and minor
shifts in the diet of lactating Antarctic fur seals.
Canadian Journal of Zoology, 75, 188±197.
Kock, K.-H. (1992) Antarctic Fish and Fisheries.
Cambridge University Press, Cambridge, UK.
Kock, K.-H. & Everson, I. (1997) Biology and ecology of
mackerel ice®sh, Champsocephalus gunnari: an
Antarctic ®sh lacking haemoglobin. Comparative
Biochemistry and Physiology, 118A, 1067±1077.
Kock, K.-H. & KoÈ ster, F.-W. (1989) The status of
exploited ®sh stocks in the Atlantic sector of the
Southern Ocean. Mitteilungen aus dem Institut fuÈr
See®scherei der Bundesforschunsanstalt fuÈr Fischerei.
Institut fuÈ r See®scherei, Hamburg, 46, 1±73.
Kock, K.-H., Wilhelms, S., Everson, I. & GroÈ ger, J. (1994)
Variations in the diet composition and feeding inten-
sity of mackerel ice®sh Champsocephalus gunnari at
South Georgia (Antarctic). Marine Ecology Progress in
Series, 108, 43±57.
McKenna, J.E. Jr & Saila, S.B. (1989) Results of ®sh stock
assessment survey, South Georgia, December 1987±
January 1988. Selected Scienti®c Papers 1988, part II,
pp. 19±52. Scienti®c Committee for the Conservation
of Antarctic Marine Living Resources, CCAMLR,
Hobart, Australia.
de la Mare, W.K. (1994) Estimating con®dence intervals
for ®sh stock abundance estimates from trawl surveys.
CCAMLR Science, 1, 203±207.
Parkes, G.B. (1993) The ®shery for Antarctic ice®sh
Champsocephalus gunnari around South Georgia. PhD
Thesis, University of London, London, UK.
Parkes, G.B.I., Everson, I., Anderson, J., Cielniaszek, Z.,
Szlakowski, J. & Traczyk, R. (1990) Report of the
UK/Polish ®sh stock assessment survey around South
Georgia in January 1990. Report of the Ninth Meeting
Annex 5. Report of the Working Group on Fish Stock
Assessment, SC-CAMLR-IX. Document WG-FSA-90/
602Variation in
standing stock of
the mackerel ice-
®sh
# 1999 British
Ecological Society
Journal of Applied
Ecology, 36,
591±603
11. Scienti®c Committee for the Conservation of
Antarctic Marine Living Resources, CCAMLR,
Hobart, Australia.
Parkes, G.B., Everson, I., Sosinski, J., Cielniaszek, Z. &
Szlakowski, J. (1989) Report of the joint UK/Polish
®sh stock assessment survey around South Georgia,
February 1989. Report of the Eighth Meeting Annex 5.
Report of the Working Group on Fish Stock
Assessment, SC-CAMLR-VIII. Document WG-FSA-
89/6. Scienti®c Committee for the Conservation of
Antarctic Marine Living Resources, CCAMLR,
Hobart, Australia.
Payne, M.R. (1979) Growth in the Antarctic fur seal
Arctocephalus gazella. Journal of Zoology, London,
187, 1±20.
Pennington, M. (1983) E�cient estimators of abundance
for ®sh and plankton surveys. Biometrics, 39, 281±286.
Permitin, Y.E. (1973) Fecundity and reproductive biology
of ice®sh (Chaenichthyidae), ®sh of the family
Muraenolepidae and dragon®sh (Bathydraconidae) of
the Scotia Sea (Antarctica). Journal of Ichthyology, 13,
204±215.
Pilling, G. & Parkes, G. (1995) Performance and geometry
of the FP-120 trawl used during UK ®sh stock assess-
ment surveys around South Georgia, Subarea 48.3.
CCAMLR Science, 2, 51±70.
Pope, J.G. (1972) An investigation of the accuracy of vir-
tual population analysis using cohort analysis.
International Council for Northwest Atlantic Fisheries
Research Bulletin, 9, 65±74.
Pope, J.G. & Shepherd, J.G. (1985) A comparison of the
performance of various methods of tuning VPA's
using e�ort data. Journal Du Conseil International
Pour Exploration de la Mer, 42, 129±151.
Reid, K. (1995) The diet of Antarctic fur seals
(Arctocephalus gazella Peters 1875) during winter at
South Georgia. Antarctic Science, 7, 241±250.
Reid, K. & Arnould, J.P.Y. (1996) The diet of Antarctic
fur seals Arctocephalus gazella during the breeding sea-
son at South Georgia. Polar Biology, 16, 105±114.
Saville, A. (1977) Survey Methods of Appraising Fishery
Resources. Fisheries Technical Paper 171. Food and
Agriculture Organisation of the United Nations
(FAO), Rome, Italy.
SC-CAMLR, (1991) Report of the Tenth Meeting of the
Scienti®c Committee for the Conservation of Antarctic
Marine Living Resources, SC-CAMLR-X. CCAMLR,
Hobart, Australia.
Sissenwine, M.P., Azarovitz, T.R. & Suomala, J.B. (1983)
Determining the abundance of ®sh. Experimental
Biology at Sea (eds A.G. MacDonald & I.G. Priede),
pp. 51±101. Academic Press Inc., London, UK.
Received 14 May 1998; revision received 23 April 1999
603I. Everson et al.
# 1999 British
Ecological Society
Journal of Applied
Ecology, 36,
591±603