Ron Rooks Collection Finding Aid (PDF) - Miller Nichols Library
Upload
khangminh22Category
view
6download
0
Sports Marketing 2020-2021
Richard K. Miller & Associates ————— since 1972 —————

SPORTS MARKETING
2020-2021
19th EDITION
RKMA MARKET RESEARCH HANDBOOK SERIES
By: Richard K. Miller and Kelli Washington
Published by:
Richard K. Miller & Associates2413 Main Street, Suite 331Miramar, FL 33025(888) 928-RKMA (7562)
www.rkma.com
Richard K. Miller & Associates————— since 1972 —————

SPORTS MARKETING
2020-2021
19th EDITION
RKMA MARKET RESEARCH HANDBOOK SERIES
Copyright © 2020 by Richard K. Miller & Associates
All rights reserved. Printed in the United States of America.
Use of the electronic edition of this publication is limited to internal use within the purchasing organization.
The electronic edition may be stored on computers, Intranets, servers, and networks by organizationswhich have purchased this publication, and those for which an employee has made such purchase. Copies, including multiple copies, may be printed from the electronic edition for use within the purchasingorganization.
Libraries may store the electronic edition on an archival database or proxy server for access by libraryusers.
Governmental agencies purchasing this publication may share the content within the agency ordepartment. Universities and colleges may share the information within their campus, but not with otheruniversities. Membership associations may use the information within their internal organization, but maynot distribute to their membership.
This publication may not be stored on Internet websites, nor may it be file-shared through the Internet.
This publication may not be resold or distributed without prior written agreement with the publisher.
While every attempt is made to provide accurate information, the author and publisher cannot be heldaccountable for any errors or omissions.
ISBN (electronic edition): 9781577832881ISSN 2472-5706 (online)
Richard K. Miller & Associates2413 Main Street, Suite 331Miramar, FL 33025(888) 928-RKMA (7562)
www.rkma.com

CONTENTS
PART I: THE U.S. SPORTS MARKET. . . . . . . . . . . . . . . . . . . . . . . . . . . . . . . . . . . . 29
1 MARKET SUMMARY. . . . . . . . . . . . . . . . . . . . . . . . . . . . . . . . . . . . . . . . . . . . . . 301.1 Annual Revenue. . . . . . . . . . . . . . . . . . . . . . . . . . . . . . . . . . . . . . . . . . . . . . 301.2 Professional and Collegiate Sports. . . . . . . . . . . . . . . . . . . . . . . . . . . . . . . . 301.3 Economic Impact. . . . . . . . . . . . . . . . . . . . . . . . . . . . . . . . . . . . . . . . . . . . . . 31
2 SPORTS FANS. . . . . . . . . . . . . . . . . . . . . . . . . . . . . . . . . . . . . . . . . . . . . . . . . . 322.1 Profile of Sports Fans. . . . . . . . . . . . . . . . . . . . . . . . . . . . . . . . . . . . . . . . . . 322.2 Demographic Profile Of U.S. Sports Fans. . . . . . . . . . . . . . . . . . . . . . . . . . . 332.3 Fan Spending. . . . . . . . . . . . . . . . . . . . . . . . . . . . . . . . . . . . . . . . . . . . . . . . 332.4 Favorite Sports. . . . . . . . . . . . . . . . . . . . . . . . . . . . . . . . . . . . . . . . . . . . . . . 342.5 Avid Fans.. . . . . . . . . . . . . . . . . . . . . . . . . . . . . . . . . . . . . . . . . . . . . . . . . . . 342.6 Fan Base By Gender. . . . . . . . . . . . . . . . . . . . . . . . . . . . . . . . . . . . . . . . . . . 352.7 Female Fans. . . . . . . . . . . . . . . . . . . . . . . . . . . . . . . . . . . . . . . . . . . . . . . . . 362.8 Fan Base By Age.. . . . . . . . . . . . . . . . . . . . . . . . . . . . . . . . . . . . . . . . . . . . . 362.9 Median Age By Sport.. . . . . . . . . . . . . . . . . . . . . . . . . . . . . . . . . . . . . . . . . . 372.10 Median Household Income By Sport. . . . . . . . . . . . . . . . . . . . . . . . . . . . . . 382.11 Youth Fans. . . . . . . . . . . . . . . . . . . . . . . . . . . . . . . . . . . . . . . . . . . . . . . . . 382.12 Fan Base By Ethnicity. . . . . . . . . . . . . . . . . . . . . . . . . . . . . . . . . . . . . . . . . 382.13 African-American Fans. . . . . . . . . . . . . . . . . . . . . . . . . . . . . . . . . . . . . . . . 402.14 Hispanic-American Fans. . . . . . . . . . . . . . . . . . . . . . . . . . . . . . . . . . . . . . . 40
3 PROFESSIONAL SPORTS. . . . . . . . . . . . . . . . . . . . . . . . . . . . . . . . . . . . . . . . . 413.1 Professional League Revenue. . . . . . . . . . . . . . . . . . . . . . . . . . . . . . . . . . . 413.2 Sports Teams. . . . . . . . . . . . . . . . . . . . . . . . . . . . . . . . . . . . . . . . . . . . . . . . 413.3 Franchise Sales. . . . . . . . . . . . . . . . . . . . . . . . . . . . . . . . . . . . . . . . . . . . . . . 423.4 Expansion. . . . . . . . . . . . . . . . . . . . . . . . . . . . . . . . . . . . . . . . . . . . . . . . . . . 433.5 Relocation. . . . . . . . . . . . . . . . . . . . . . . . . . . . . . . . . . . . . . . . . . . . . . . . . . . 43
4 ATHLETES.. . . . . . . . . . . . . . . . . . . . . . . . . . . . . . . . . . . . . . . . . . . . . . . . . . . . . 454.1 Most Popular Athletes. . . . . . . . . . . . . . . . . . . . . . . . . . . . . . . . . . . . . . . . . . 454.2 Highest-Paid Athletes. . . . . . . . . . . . . . . . . . . . . . . . . . . . . . . . . . . . . . . . . . 474.3 Athlete Endorsements. . . . . . . . . . . . . . . . . . . . . . . . . . . . . . . . . . . . . . . . . . 484.4 Market Resources. . . . . . . . . . . . . . . . . . . . . . . . . . . . . . . . . . . . . . . . . . . . . 49
5 PARTICIPATION & RECREATION. . . . . . . . . . . . . . . . . . . . . . . . . . . . . . . . . . . 505.1 Conditioning and Fitness. . . . . . . . . . . . . . . . . . . . . . . . . . . . . . . . . . . . . . . . 505.2 Individual Sports. . . . . . . . . . . . . . . . . . . . . . . . . . . . . . . . . . . . . . . . . . . . . . 51
SPORTS MARKETING 2020-2021
• 4 •

5.3 Racquet Sports. . . . . . . . . . . . . . . . . . . . . . . . . . . . . . . . . . . . . . . . . . . . . . . 515.4 Team Sports. . . . . . . . . . . . . . . . . . . . . . . . . . . . . . . . . . . . . . . . . . . . . . . . . 515.5 Outdoor Sports. . . . . . . . . . . . . . . . . . . . . . . . . . . . . . . . . . . . . . . . . . . . . . . 525.6 Water Sports. . . . . . . . . . . . . . . . . . . . . . . . . . . . . . . . . . . . . . . . . . . . . . . . . 535.7 Winter Sports.. . . . . . . . . . . . . . . . . . . . . . . . . . . . . . . . . . . . . . . . . . . . . . . . 535.8 Market Resources. . . . . . . . . . . . . . . . . . . . . . . . . . . . . . . . . . . . . . . . . . . . . 53
6 TOP SPORTS CITIES. . . . . . . . . . . . . . . . . . . . . . . . . . . . . . . . . . . . . . . . . . . . . 546.1 Best Sports Cities. . . . . . . . . . . . . . . . . . . . . . . . . . . . . . . . . . . . . . . . . . . . . 546.2 Avid Sports Fans City-by-City. . . . . . . . . . . . . . . . . . . . . . . . . . . . . . . . . . . . 546.3 Spectator Sports Attendance.. . . . . . . . . . . . . . . . . . . . . . . . . . . . . . . . . . . . 566.4 Fan Ranking By Sport. . . . . . . . . . . . . . . . . . . . . . . . . . . . . . . . . . . . . . . . . . 576.5 Top Minor League Markets. . . . . . . . . . . . . . . . . . . . . . . . . . . . . . . . . . . . . . 60
PART II: SPORTS MARKET SEGMENTS. . . . . . . . . . . . . . . . . . . . . . . . . . . . . . . . . 61
7 ADVERTISING & SPONSORSHIPS. . . . . . . . . . . . . . . . . . . . . . . . . . . . . . . . . . 627.1 Market Assessment. . . . . . . . . . . . . . . . . . . . . . . . . . . . . . . . . . . . . . . . . . . . 627.2 TV Ad Spending. . . . . . . . . . . . . . . . . . . . . . . . . . . . . . . . . . . . . . . . . . . . . . 627.3 Top Sports Advertisers. . . . . . . . . . . . . . . . . . . . . . . . . . . . . . . . . . . . . . . . . 627.4 Advertising Agencies in Sports Marketing. . . . . . . . . . . . . . . . . . . . . . . . . . . 637.5 Sports Sponsorships. . . . . . . . . . . . . . . . . . . . . . . . . . . . . . . . . . . . . . . . . . . 647.6 Naming Rights. . . . . . . . . . . . . . . . . . . . . . . . . . . . . . . . . . . . . . . . . . . . . . . . 657.7 Jersey Rights. . . . . . . . . . . . . . . . . . . . . . . . . . . . . . . . . . . . . . . . . . . . . . . . . 657.8 Backdrop Sponsors. . . . . . . . . . . . . . . . . . . . . . . . . . . . . . . . . . . . . . . . . . . . 667.9 Market Resources. . . . . . . . . . . . . . . . . . . . . . . . . . . . . . . . . . . . . . . . . . . . . 66
8 AGENTS & AGENCIES. . . . . . . . . . . . . . . . . . . . . . . . . . . . . . . . . . . . . . . . . . . . 678.1 Overview. . . . . . . . . . . . . . . . . . . . . . . . . . . . . . . . . . . . . . . . . . . . . . . . . . . . 678.2 Top Agents. . . . . . . . . . . . . . . . . . . . . . . . . . . . . . . . . . . . . . . . . . . . . . . . . . 678.3 Top Agencies.. . . . . . . . . . . . . . . . . . . . . . . . . . . . . . . . . . . . . . . . . . . . . . . . 688.3 Top Agents By League. . . . . . . . . . . . . . . . . . . . . . . . . . . . . . . . . . . . . . . . . 698.4 Agent Associations. . . . . . . . . . . . . . . . . . . . . . . . . . . . . . . . . . . . . . . . . . . . 708.5 Market Resources. . . . . . . . . . . . . . . . . . . . . . . . . . . . . . . . . . . . . . . . . . . . . 70
9 CONCESSIONS. . . . . . . . . . . . . . . . . . . . . . . . . . . . . . . . . . . . . . . . . . . . . . . . . . 719.1 Market Assessment. . . . . . . . . . . . . . . . . . . . . . . . . . . . . . . . . . . . . . . . . . . . 719.2 Concessionaires. . . . . . . . . . . . . . . . . . . . . . . . . . . . . . . . . . . . . . . . . . . . . . 719.3 Favorite Concession Foods And Beverages. . . . . . . . . . . . . . . . . . . . . . . . . 729.4 Best Food At Stadiums And Arenas. . . . . . . . . . . . . . . . . . . . . . . . . . . . . . . 729.5 In-Seat Ordering. . . . . . . . . . . . . . . . . . . . . . . . . . . . . . . . . . . . . . . . . . . . . . 749.6 Market Resources. . . . . . . . . . . . . . . . . . . . . . . . . . . . . . . . . . . . . . . . . . . . . 75
SPORTS MARKETING 2020-2021
• 5 •

10 FANTASY SPORTS. . . . . . . . . . . . . . . . . . . . . . . . . . . . . . . . . . . . . . . . . . . . . . . 7610.1 Overview. . . . . . . . . . . . . . . . . . . . . . . . . . . . . . . . . . . . . . . . . . . . . . . . . . . 7610.2 Market Assessment. . . . . . . . . . . . . . . . . . . . . . . . . . . . . . . . . . . . . . . . . . . 7610.3 Demographics. . . . . . . . . . . . . . . . . . . . . . . . . . . . . . . . . . . . . . . . . . . . . . . 7710.4 Season-Long Fantasy Sports. . . . . . . . . . . . . . . . . . . . . . . . . . . . . . . . . . . 7710.5 Daily Fantasy Sports. . . . . . . . . . . . . . . . . . . . . . . . . . . . . . . . . . . . . . . . . . 7910.6 Fantasy Sports and Professional Sports Leagues.. . . . . . . . . . . . . . . . . . . 8010.7 Market Resources. . . . . . . . . . . . . . . . . . . . . . . . . . . . . . . . . . . . . . . . . . . . 80
11 FITNESS & HEALTH CLUBS. . . . . . . . . . . . . . . . . . . . . . . . . . . . . . . . . . . . . . . 8111.1 Fitness Activities. . . . . . . . . . . . . . . . . . . . . . . . . . . . . . . . . . . . . . . . . . . . . 8111.2 Fitness and Health Clubs. . . . . . . . . . . . . . . . . . . . . . . . . . . . . . . . . . . . . . 8111.3 Market Leaders. . . . . . . . . . . . . . . . . . . . . . . . . . . . . . . . . . . . . . . . . . . . . . 8211.4 Market Resources. . . . . . . . . . . . . . . . . . . . . . . . . . . . . . . . . . . . . . . . . . . . 82
12 GAME PROMOTIONS. . . . . . . . . . . . . . . . . . . . . . . . . . . . . . . . . . . . . . . . . . . . . 8412.1 Overview. . . . . . . . . . . . . . . . . . . . . . . . . . . . . . . . . . . . . . . . . . . . . . . . . . . 8412.2 Giveaways. . . . . . . . . . . . . . . . . . . . . . . . . . . . . . . . . . . . . . . . . . . . . . . . . . 8412.3 Promotions and Events. . . . . . . . . . . . . . . . . . . . . . . . . . . . . . . . . . . . . . . . 8512.4 All-You-Can-Eat Promotions. . . . . . . . . . . . . . . . . . . . . . . . . . . . . . . . . . . . 85
13 LICENSED MERCHANDISE. . . . . . . . . . . . . . . . . . . . . . . . . . . . . . . . . . . . . . . . 8613.1 Professional Sports Properties. . . . . . . . . . . . . . . . . . . . . . . . . . . . . . . . . . 8613.2 Professional Sports Licensed Merchandise.. . . . . . . . . . . . . . . . . . . . . . . . 8613.3 Top-Selling Professional Sports Jerseys. . . . . . . . . . . . . . . . . . . . . . . . . . . 8713.4 Top-Selling Professional Sports Team Merchandise.. . . . . . . . . . . . . . . . . 8813.5 Collegiate Merchandise. . . . . . . . . . . . . . . . . . . . . . . . . . . . . . . . . . . . . . . . 8913.6 Market Resources. . . . . . . . . . . . . . . . . . . . . . . . . . . . . . . . . . . . . . . . . . . . 90
14 MEMORABILIA. . . . . . . . . . . . . . . . . . . . . . . . . . . . . . . . . . . . . . . . . . . . . . . . . . 9114.1 Market Assessment. . . . . . . . . . . . . . . . . . . . . . . . . . . . . . . . . . . . . . . . . . . 9114.2 Sports Memorabilia Auctions. . . . . . . . . . . . . . . . . . . . . . . . . . . . . . . . . . . . 9214.3 Sports Cards. . . . . . . . . . . . . . . . . . . . . . . . . . . . . . . . . . . . . . . . . . . . . . . . 9214.4 Market Resources. . . . . . . . . . . . . . . . . . . . . . . . . . . . . . . . . . . . . . . . . . . . 93
15 SPORTS BETTING. . . . . . . . . . . . . . . . . . . . . . . . . . . . . . . . . . . . . . . . . . . . . . . 9415.1 A New Era In Legal Sports Wagering. . . . . . . . . . . . . . . . . . . . . . . . . . . . . 9415.2 Market Assessment. . . . . . . . . . . . . . . . . . . . . . . . . . . . . . . . . . . . . . . . . . . 9415.3 Nevada Sports Books. . . . . . . . . . . . . . . . . . . . . . . . . . . . . . . . . . . . . . . . . 9515.4 States Allowing Legal Sports Betting.. . . . . . . . . . . . . . . . . . . . . . . . . . . . . 95
16 SPORTING GOODS. . . . . . . . . . . . . . . . . . . . . . . . . . . . . . . . . . . . . . . . . . . . . . 9716.1 Spending At Sporting Goods Stores. . . . . . . . . . . . . . . . . . . . . . . . . . . . . . 9716.2 Sporting Goods Category Spending. . . . . . . . . . . . . . . . . . . . . . . . . . . . . . 97
SPORTS MARKETING 2020-2021
• 6 •

16.3 Spending Distribution. . . . . . . . . . . . . . . . . . . . . . . . . . . . . . . . . . . . . . . . . 9716.4 Trends. . . . . . . . . . . . . . . . . . . . . . . . . . . . . . . . . . . . . . . . . . . . . . . . . . . . . 9916.5 Marketshare Leaders.. . . . . . . . . . . . . . . . . . . . . . . . . . . . . . . . . . . . . . . . . 9916.6 Market Resources. . . . . . . . . . . . . . . . . . . . . . . . . . . . . . . . . . . . . . . . . . . . 99
17 SPORTS HALLS OF FAME & MUSEUMS. . . . . . . . . . . . . . . . . . . . . . . . . . . . 10017.1 Overview. . . . . . . . . . . . . . . . . . . . . . . . . . . . . . . . . . . . . . . . . . . . . . . . . . 10017.2 Largest Halls of Fame. . . . . . . . . . . . . . . . . . . . . . . . . . . . . . . . . . . . . . . . 10017.3 List Of Sports Museums. . . . . . . . . . . . . . . . . . . . . . . . . . . . . . . . . . . . . . 10017.4 Team Museums.. . . . . . . . . . . . . . . . . . . . . . . . . . . . . . . . . . . . . . . . . . . . 103
18 SPORTS TRAVEL. . . . . . . . . . . . . . . . . . . . . . . . . . . . . . . . . . . . . . . . . . . . . . . 10418.1 Market Assessment. . . . . . . . . . . . . . . . . . . . . . . . . . . . . . . . . . . . . . . . . . 10418.2 Favorite Cities For Sports Travel. . . . . . . . . . . . . . . . . . . . . . . . . . . . . . . . 10518.3 Sports Commissions. . . . . . . . . . . . . . . . . . . . . . . . . . . . . . . . . . . . . . . . . 10518.4 Youth Sports Travel. . . . . . . . . . . . . . . . . . . . . . . . . . . . . . . . . . . . . . . . . . 10618.5 Baseball Spring Training. . . . . . . . . . . . . . . . . . . . . . . . . . . . . . . . . . . . . . 10618.6 Sports-Specialist Travel Agencies. . . . . . . . . . . . . . . . . . . . . . . . . . . . . . . 10618.7 Market Resources. . . . . . . . . . . . . . . . . . . . . . . . . . . . . . . . . . . . . . . . . . . 106
19 TICKETING. . . . . . . . . . . . . . . . . . . . . . . . . . . . . . . . . . . . . . . . . . . . . . . . . . . . 10819.1 Market Assessment. . . . . . . . . . . . . . . . . . . . . . . . . . . . . . . . . . . . . . . . . . 10819.2 Secondary Ticketing. . . . . . . . . . . . . . . . . . . . . . . . . . . . . . . . . . . . . . . . . 10819.3 Dynamic Pricing.. . . . . . . . . . . . . . . . . . . . . . . . . . . . . . . . . . . . . . . . . . . . 10919.4 Professional League Sports Tickets. . . . . . . . . . . . . . . . . . . . . . . . . . . . . 11019.5 Subscription Ticketing. . . . . . . . . . . . . . . . . . . . . . . . . . . . . . . . . . . . . . . . 11119.6 Moving Unsold Ticket Inventory.. . . . . . . . . . . . . . . . . . . . . . . . . . . . . . . . 11119.7 Ticketing Through Social Networks. . . . . . . . . . . . . . . . . . . . . . . . . . . . . . 11219.8 Market Resources. . . . . . . . . . . . . . . . . . . . . . . . . . . . . . . . . . . . . . . . . . . 112
PART III: VENUES. . . . . . . . . . . . . . . . . . . . . . . . . . . . . . . . . . . . . . . . . . . . . . . . . . 113
20 PROFESSIONAL SPORTS STADIUMS & ARENAS.. . . . . . . . . . . . . . . . . . . . 11420.1 Overview. . . . . . . . . . . . . . . . . . . . . . . . . . . . . . . . . . . . . . . . . . . . . . . . . . 11420.2 List Of Stadiums and Arenas.. . . . . . . . . . . . . . . . . . . . . . . . . . . . . . . . . . 114
21 COLLEGIATE STADIUMS AND ARENAS.. . . . . . . . . . . . . . . . . . . . . . . . . . . . 12121.1 Football Stadiums. . . . . . . . . . . . . . . . . . . . . . . . . . . . . . . . . . . . . . . . . . . 12121.2 Basketball Arenas. . . . . . . . . . . . . . . . . . . . . . . . . . . . . . . . . . . . . . . . . . . 124
22 SPORTS FACILITY CONSTRUCTION. . . . . . . . . . . . . . . . . . . . . . . . . . . . . . . 13322.1 Sports Facility Construction Spending.. . . . . . . . . . . . . . . . . . . . . . . . . . . 13322.2 Spending By Type Of Venue. . . . . . . . . . . . . . . . . . . . . . . . . . . . . . . . . . . 13322.3 Most Expensive Sports Facilities. . . . . . . . . . . . . . . . . . . . . . . . . . . . . . . . 13422.4 Current Projects.. . . . . . . . . . . . . . . . . . . . . . . . . . . . . . . . . . . . . . . . . . . . 135
SPORTS MARKETING 2020-2021
• 7 •

23 NAMING RIGHTS.. . . . . . . . . . . . . . . . . . . . . . . . . . . . . . . . . . . . . . . . . . . . . . . 13623.1 Overview. . . . . . . . . . . . . . . . . . . . . . . . . . . . . . . . . . . . . . . . . . . . . . . . . . 13623.2 Top Naming-Rights Deals. . . . . . . . . . . . . . . . . . . . . . . . . . . . . . . . . . . . . 13623.3 College Stadium Naming Rights. . . . . . . . . . . . . . . . . . . . . . . . . . . . . . . . 137
24 PREMIUM SEATING. . . . . . . . . . . . . . . . . . . . . . . . . . . . . . . . . . . . . . . . . . . . . 13824.1 Overview. . . . . . . . . . . . . . . . . . . . . . . . . . . . . . . . . . . . . . . . . . . . . . . . . . 13824.2 Market Assessment. . . . . . . . . . . . . . . . . . . . . . . . . . . . . . . . . . . . . . . . . . 13924.3 Personal Seat Licenses. . . . . . . . . . . . . . . . . . . . . . . . . . . . . . . . . . . . . . . 139
25 SPEEDWAYS.. . . . . . . . . . . . . . . . . . . . . . . . . . . . . . . . . . . . . . . . . . . . . . . . . . 14125.1 Overview. . . . . . . . . . . . . . . . . . . . . . . . . . . . . . . . . . . . . . . . . . . . . . . . . . 14125.2 Major Speedways. . . . . . . . . . . . . . . . . . . . . . . . . . . . . . . . . . . . . . . . . . . 141
PART IV: SPORTS MEDIA. . . . . . . . . . . . . . . . . . . . . . . . . . . . . . . . . . . . . . . . . . . . 143
26 SPORTS TELEVISION BROADCASTING.. . . . . . . . . . . . . . . . . . . . . . . . . . . . 14426.1 Sports Network Overview. . . . . . . . . . . . . . . . . . . . . . . . . . . . . . . . . . . . . 14426.2 Sports Television Viewership Demographics. . . . . . . . . . . . . . . . . . . . . . 14526.3 Most Watched Sports TV Broadcasts. . . . . . . . . . . . . . . . . . . . . . . . . . . . 14526.4 Broadcast Rights Agreements. . . . . . . . . . . . . . . . . . . . . . . . . . . . . . . . . . 14726.5 Major Sports Networks. . . . . . . . . . . . . . . . . . . . . . . . . . . . . . . . . . . . . . . 14926.6 Sport-Specific Networks. . . . . . . . . . . . . . . . . . . . . . . . . . . . . . . . . . . . . . 15026.7 League Networks.. . . . . . . . . . . . . . . . . . . . . . . . . . . . . . . . . . . . . . . . . . . 15126.8 Regional Sports Networks. . . . . . . . . . . . . . . . . . . . . . . . . . . . . . . . . . . . . 15226.9 RSN Ratings. . . . . . . . . . . . . . . . . . . . . . . . . . . . . . . . . . . . . . . . . . . . . . . 15826.10 Sports Programming On Cable Networks. . . . . . . . . . . . . . . . . . . . . . . . 15826.11 College Sports Broadcasts. . . . . . . . . . . . . . . . . . . . . . . . . . . . . . . . . . . 15926.12 European Sports Networks. . . . . . . . . . . . . . . . . . . . . . . . . . . . . . . . . . . 160
27 SPORTS RADIO. . . . . . . . . . . . . . . . . . . . . . . . . . . . . . . . . . . . . . . . . . . . . . . . 16127.1 Sports Radio Stations. . . . . . . . . . . . . . . . . . . . . . . . . . . . . . . . . . . . . . . . 16127.2 Sports Radio Networks. . . . . . . . . . . . . . . . . . . . . . . . . . . . . . . . . . . . . . . 16727.3 The Sports Radio Audience.. . . . . . . . . . . . . . . . . . . . . . . . . . . . . . . . . . . 16827.4 Advertising.. . . . . . . . . . . . . . . . . . . . . . . . . . . . . . . . . . . . . . . . . . . . . . . . 16927.5 Sports on Satellite Radio. . . . . . . . . . . . . . . . . . . . . . . . . . . . . . . . . . . . . . 17027.6 Live Broadcast Baseball. . . . . . . . . . . . . . . . . . . . . . . . . . . . . . . . . . . . . . 170
28 SPORTS PERIODICALS. . . . . . . . . . . . . . . . . . . . . . . . . . . . . . . . . . . . . . . . . . 17228.1 Market Assessment. . . . . . . . . . . . . . . . . . . . . . . . . . . . . . . . . . . . . . . . . . 17228.2 Circulation. . . . . . . . . . . . . . . . . . . . . . . . . . . . . . . . . . . . . . . . . . . . . . . . . 17228.3 List of Sports Periodicals. . . . . . . . . . . . . . . . . . . . . . . . . . . . . . . . . . . . . . 172
SPORTS MARKETING 2020-2021
• 8 •

29 NEWSPAPER SPORTS SECTIONS. . . . . . . . . . . . . . . . . . . . . . . . . . . . . . . . . 17729.1 How Fans Obtain Sports News. . . . . . . . . . . . . . . . . . . . . . . . . . . . . . . . . 17729.2 Sports Section Readership. . . . . . . . . . . . . . . . . . . . . . . . . . . . . . . . . . . . 17729.3 Sports Editors. . . . . . . . . . . . . . . . . . . . . . . . . . . . . . . . . . . . . . . . . . . . . . 178
30 SPORTS ONLINE. . . . . . . . . . . . . . . . . . . . . . . . . . . . . . . . . . . . . . . . . . . . . . . 18130.1 Digital Sports Media Traffic. . . . . . . . . . . . . . . . . . . . . . . . . . . . . . . . . . . . 18130.2 Major League Sports Streaming Packages. . . . . . . . . . . . . . . . . . . . . . . . 18230.3 Live Sports Online. . . . . . . . . . . . . . . . . . . . . . . . . . . . . . . . . . . . . . . . . . . 18330.4 Independent Sports Sites. . . . . . . . . . . . . . . . . . . . . . . . . . . . . . . . . . . . . 184
31 PODCASTS. . . . . . . . . . . . . . . . . . . . . . . . . . . . . . . . . . . . . . . . . . . . . . . . . . . . 18531.1 Overview. . . . . . . . . . . . . . . . . . . . . . . . . . . . . . . . . . . . . . . . . . . . . . . . . . 18531.2 Top Sports Podcasts. . . . . . . . . . . . . . . . . . . . . . . . . . . . . . . . . . . . . . . . . 185
32 SOCIAL MEDIA. . . . . . . . . . . . . . . . . . . . . . . . . . . . . . . . . . . . . . . . . . . . . . . . . 18732.1 Sports Social Media.. . . . . . . . . . . . . . . . . . . . . . . . . . . . . . . . . . . . . . . . . 18732.2 Sports League/Organization Followers. . . . . . . . . . . . . . . . . . . . . . . . . . . 18832.3 Team Followers. . . . . . . . . . . . . . . . . . . . . . . . . . . . . . . . . . . . . . . . . . . . . 18832.4 Athlete Followers. . . . . . . . . . . . . . . . . . . . . . . . . . . . . . . . . . . . . . . . . . . . 19032.5 Market Resources. . . . . . . . . . . . . . . . . . . . . . . . . . . . . . . . . . . . . . . . . . . 192
PART V: MAJOR EVENTS. . . . . . . . . . . . . . . . . . . . . . . . . . . . . . . . . . . . . . . . . . . . 193
33 ALL-STAR GAMES. . . . . . . . . . . . . . . . . . . . . . . . . . . . . . . . . . . . . . . . . . . . . . 19433.1 MLB All-Star Game. . . . . . . . . . . . . . . . . . . . . . . . . . . . . . . . . . . . . . . . . . 19433.2 NBA All-Star Game. . . . . . . . . . . . . . . . . . . . . . . . . . . . . . . . . . . . . . . . . . 19533.3 NFL Pro Bowl. . . . . . . . . . . . . . . . . . . . . . . . . . . . . . . . . . . . . . . . . . . . . . 19533.4 NHL All-Star Game. . . . . . . . . . . . . . . . . . . . . . . . . . . . . . . . . . . . . . . . . . 196
34 CHAMPIONSHIP PARADES. . . . . . . . . . . . . . . . . . . . . . . . . . . . . . . . . . . . . . . 19734.1 Overview. . . . . . . . . . . . . . . . . . . . . . . . . . . . . . . . . . . . . . . . . . . . . . . . . . 19734.2 Most Attended Parades. . . . . . . . . . . . . . . . . . . . . . . . . . . . . . . . . . . . . . . 197
35 COLLEGE FOOTBALL PLAYOFF & BOWL GAMES. . . . . . . . . . . . . . . . . . . . 19835.1 College Football Playoff.. . . . . . . . . . . . . . . . . . . . . . . . . . . . . . . . . . . . . . 19835.2 Bowl Games. . . . . . . . . . . . . . . . . . . . . . . . . . . . . . . . . . . . . . . . . . . . . . . 19935.3 Per-Team Payouts.. . . . . . . . . . . . . . . . . . . . . . . . . . . . . . . . . . . . . . . . . . 20035.4 Broadcast Rights And Viewership. . . . . . . . . . . . . . . . . . . . . . . . . . . . . . . 20135.5 Sponsors. . . . . . . . . . . . . . . . . . . . . . . . . . . . . . . . . . . . . . . . . . . . . . . . . . 202
36 FIFA MEN’S WORLD CUP. . . . . . . . . . . . . . . . . . . . . . . . . . . . . . . . . . . . . . . . 20336.1 Overview. . . . . . . . . . . . . . . . . . . . . . . . . . . . . . . . . . . . . . . . . . . . . . . . . . 20336.2 World Cup 2014. . . . . . . . . . . . . . . . . . . . . . . . . . . . . . . . . . . . . . . . . . . . 203
SPORTS MARKETING 2020-2021
• 9 •

36.3 World Cup 2018. . . . . . . . . . . . . . . . . . . . . . . . . . . . . . . . . . . . . . . . . . . . 20436.4 Broadcast Rights. . . . . . . . . . . . . . . . . . . . . . . . . . . . . . . . . . . . . . . . . . . . 20436.5 Sponsors. . . . . . . . . . . . . . . . . . . . . . . . . . . . . . . . . . . . . . . . . . . . . . . . . . 204
37 FIFA WOMEN’S WORLD CUP. . . . . . . . . . . . . . . . . . . . . . . . . . . . . . . . . . . . . 20537.1 Overview. . . . . . . . . . . . . . . . . . . . . . . . . . . . . . . . . . . . . . . . . . . . . . . . . . 20537.2 Women’s World Cup 2015. . . . . . . . . . . . . . . . . . . . . . . . . . . . . . . . . . . . 20537.3 Women’s World Cup 2019. . . . . . . . . . . . . . . . . . . . . . . . . . . . . . . . . . . . 205
38 INDIANAPOLIS 500. . . . . . . . . . . . . . . . . . . . . . . . . . . . . . . . . . . . . . . . . . . . . . 20738.1 Overview. . . . . . . . . . . . . . . . . . . . . . . . . . . . . . . . . . . . . . . . . . . . . . . . . . 20738.2 Spectators And Economic Impact. . . . . . . . . . . . . . . . . . . . . . . . . . . . . . . 20738.3 Television Viewership. . . . . . . . . . . . . . . . . . . . . . . . . . . . . . . . . . . . . . . . 207
39 KENTUCKY DERBY. . . . . . . . . . . . . . . . . . . . . . . . . . . . . . . . . . . . . . . . . . . . . 20939.1 Overview. . . . . . . . . . . . . . . . . . . . . . . . . . . . . . . . . . . . . . . . . . . . . . . . . . 20939.2 Attendance. . . . . . . . . . . . . . . . . . . . . . . . . . . . . . . . . . . . . . . . . . . . . . . . 20939.3 Broadcast TV.. . . . . . . . . . . . . . . . . . . . . . . . . . . . . . . . . . . . . . . . . . . . . . 20939.4 Top Advertisers. . . . . . . . . . . . . . . . . . . . . . . . . . . . . . . . . . . . . . . . . . . . . 21039.5 Sponsors. . . . . . . . . . . . . . . . . . . . . . . . . . . . . . . . . . . . . . . . . . . . . . . . . . 210
40 NBA FINALS. . . . . . . . . . . . . . . . . . . . . . . . . . . . . . . . . . . . . . . . . . . . . . . . . . . 21140.1 Overview. . . . . . . . . . . . . . . . . . . . . . . . . . . . . . . . . . . . . . . . . . . . . . . . . . 21140.2 TV Viewership. . . . . . . . . . . . . . . . . . . . . . . . . . . . . . . . . . . . . . . . . . . . . . 21140.3 Economic Impact. . . . . . . . . . . . . . . . . . . . . . . . . . . . . . . . . . . . . . . . . . . . 212
41 NCAA MEN’S FINAL FOUR.. . . . . . . . . . . . . . . . . . . . . . . . . . . . . . . . . . . . . . . 21341.1 Overview. . . . . . . . . . . . . . . . . . . . . . . . . . . . . . . . . . . . . . . . . . . . . . . . . . 21341.2 Spectators. . . . . . . . . . . . . . . . . . . . . . . . . . . . . . . . . . . . . . . . . . . . . . . . . 21341.3 TV Viewership. . . . . . . . . . . . . . . . . . . . . . . . . . . . . . . . . . . . . . . . . . . . . . 21441.4 March Madness Advertising. . . . . . . . . . . . . . . . . . . . . . . . . . . . . . . . . . . 21441.5 Economic Impact. . . . . . . . . . . . . . . . . . . . . . . . . . . . . . . . . . . . . . . . . . . . 215
42 NCAA WOMEN’S FINAL FOUR. . . . . . . . . . . . . . . . . . . . . . . . . . . . . . . . . . . . 21642.1 Overview. . . . . . . . . . . . . . . . . . . . . . . . . . . . . . . . . . . . . . . . . . . . . . . . . . 21642.2 Spectators. . . . . . . . . . . . . . . . . . . . . . . . . . . . . . . . . . . . . . . . . . . . . . . . . 21642.3 TV Viewership. . . . . . . . . . . . . . . . . . . . . . . . . . . . . . . . . . . . . . . . . . . . . . 21642.4 Economic Impact. . . . . . . . . . . . . . . . . . . . . . . . . . . . . . . . . . . . . . . . . . . . 217
43 OLYMPIC GAMES. . . . . . . . . . . . . . . . . . . . . . . . . . . . . . . . . . . . . . . . . . . . . . . 21843.1 Television Broadcast Rights. . . . . . . . . . . . . . . . . . . . . . . . . . . . . . . . . . . 21843.2 Prime-Time TV Audiences.. . . . . . . . . . . . . . . . . . . . . . . . . . . . . . . . . . . . 21843.3 Online Activities. . . . . . . . . . . . . . . . . . . . . . . . . . . . . . . . . . . . . . . . . . . . . 21943.4 Opening and Closing Ceremonies.. . . . . . . . . . . . . . . . . . . . . . . . . . . . . . 219
SPORTS MARKETING 2020-2021
• 10 •

43.5 Venue and Infrastructure Spending.. . . . . . . . . . . . . . . . . . . . . . . . . . . . . 22043.6 United States Olympic Committee.. . . . . . . . . . . . . . . . . . . . . . . . . . . . . . 22043.7 National Governing Bodies. . . . . . . . . . . . . . . . . . . . . . . . . . . . . . . . . . . . 22143.8 Market Resources. . . . . . . . . . . . . . . . . . . . . . . . . . . . . . . . . . . . . . . . . . . 222
44 RUGBY WORLD CUP. . . . . . . . . . . . . . . . . . . . . . . . . . . . . . . . . . . . . . . . . . . . 22344.1 Overview. . . . . . . . . . . . . . . . . . . . . . . . . . . . . . . . . . . . . . . . . . . . . . . . . . 22344.2 Rugby World Cup 2015. . . . . . . . . . . . . . . . . . . . . . . . . . . . . . . . . . . . . . . 22344.3 Rugby World Cup 2019. . . . . . . . . . . . . . . . . . . . . . . . . . . . . . . . . . . . . . . 22344.4 Sponsors. . . . . . . . . . . . . . . . . . . . . . . . . . . . . . . . . . . . . . . . . . . . . . . . . . 223
45 STANLEY CUP. . . . . . . . . . . . . . . . . . . . . . . . . . . . . . . . . . . . . . . . . . . . . . . . . 22445.1 Overview. . . . . . . . . . . . . . . . . . . . . . . . . . . . . . . . . . . . . . . . . . . . . . . . . . 22445.2 TV Viewership. . . . . . . . . . . . . . . . . . . . . . . . . . . . . . . . . . . . . . . . . . . . . . 22445.3 Economic Impact. . . . . . . . . . . . . . . . . . . . . . . . . . . . . . . . . . . . . . . . . . . . 224
46 SUPER BOWL. . . . . . . . . . . . . . . . . . . . . . . . . . . . . . . . . . . . . . . . . . . . . . . . . . 22546.1 Overview. . . . . . . . . . . . . . . . . . . . . . . . . . . . . . . . . . . . . . . . . . . . . . . . . . 22546.2 Host Cities And Game Attendance. . . . . . . . . . . . . . . . . . . . . . . . . . . . . . 22546.3 TV Viewership. . . . . . . . . . . . . . . . . . . . . . . . . . . . . . . . . . . . . . . . . . . . . . 22646.4 Super Bowl Ads. . . . . . . . . . . . . . . . . . . . . . . . . . . . . . . . . . . . . . . . . . . . . 22746.5 Economic Impact. . . . . . . . . . . . . . . . . . . . . . . . . . . . . . . . . . . . . . . . . . . . 228
47 WORLD SERIES. . . . . . . . . . . . . . . . . . . . . . . . . . . . . . . . . . . . . . . . . . . . . . . . 22947.1 Overview. . . . . . . . . . . . . . . . . . . . . . . . . . . . . . . . . . . . . . . . . . . . . . . . . . 22947.2 TV Viewership. . . . . . . . . . . . . . . . . . . . . . . . . . . . . . . . . . . . . . . . . . . . . . 22947.3 Economic Impact. . . . . . . . . . . . . . . . . . . . . . . . . . . . . . . . . . . . . . . . . . . . 230
PART VI: PROFESSIONAL LEAGUE SPORTS.. . . . . . . . . . . . . . . . . . . . . . . . . . . 231
48 MAJOR LEAGUE BASEBALL.. . . . . . . . . . . . . . . . . . . . . . . . . . . . . . . . . . . . . 23248.1 League Revenue. . . . . . . . . . . . . . . . . . . . . . . . . . . . . . . . . . . . . . . . . . . . 23248.2 Stadiums. . . . . . . . . . . . . . . . . . . . . . . . . . . . . . . . . . . . . . . . . . . . . . . . . . 23248.3 Team Valuations. . . . . . . . . . . . . . . . . . . . . . . . . . . . . . . . . . . . . . . . . . . . 23348.4 Player Salaries. . . . . . . . . . . . . . . . . . . . . . . . . . . . . . . . . . . . . . . . . . . . . 23448.5 Attendance. . . . . . . . . . . . . . . . . . . . . . . . . . . . . . . . . . . . . . . . . . . . . . . . 23548.6 Sponsors. . . . . . . . . . . . . . . . . . . . . . . . . . . . . . . . . . . . . . . . . . . . . . . . . . 23648.7 Television Broadcast Rights. . . . . . . . . . . . . . . . . . . . . . . . . . . . . . . . . . . 23648.8 Franchise Sales. . . . . . . . . . . . . . . . . . . . . . . . . . . . . . . . . . . . . . . . . . . . . 23748.9 World Series. . . . . . . . . . . . . . . . . . . . . . . . . . . . . . . . . . . . . . . . . . . . . . . 23748.10 All-Star Game. . . . . . . . . . . . . . . . . . . . . . . . . . . . . . . . . . . . . . . . . . . . . 23748.11 Fan Demographics. . . . . . . . . . . . . . . . . . . . . . . . . . . . . . . . . . . . . . . . . 23748.12 Fan Loyalty. . . . . . . . . . . . . . . . . . . . . . . . . . . . . . . . . . . . . . . . . . . . . . . 23848.13 Market Resources. . . . . . . . . . . . . . . . . . . . . . . . . . . . . . . . . . . . . . . . . . 238
SPORTS MARKETING 2020-2021
• 11 •

49 NATIONAL BASKETBALL ASSOCIATION.. . . . . . . . . . . . . . . . . . . . . . . . . . . 23949.1 League Revenue. . . . . . . . . . . . . . . . . . . . . . . . . . . . . . . . . . . . . . . . . . . . 23949.2 Arenas. . . . . . . . . . . . . . . . . . . . . . . . . . . . . . . . . . . . . . . . . . . . . . . . . . . . 23949.3 Team Valuations. . . . . . . . . . . . . . . . . . . . . . . . . . . . . . . . . . . . . . . . . . . . 24049.4 Player Salaries. . . . . . . . . . . . . . . . . . . . . . . . . . . . . . . . . . . . . . . . . . . . . 24149.5 Attendance. . . . . . . . . . . . . . . . . . . . . . . . . . . . . . . . . . . . . . . . . . . . . . . . 24249.6 Sponsors. . . . . . . . . . . . . . . . . . . . . . . . . . . . . . . . . . . . . . . . . . . . . . . . . . 24349.7 Television Broadcast Rights. . . . . . . . . . . . . . . . . . . . . . . . . . . . . . . . . . . 24349.8 Franchise Sale.. . . . . . . . . . . . . . . . . . . . . . . . . . . . . . . . . . . . . . . . . . . . . 24449.9 NBA Finals.. . . . . . . . . . . . . . . . . . . . . . . . . . . . . . . . . . . . . . . . . . . . . . . . 24449.10 All-Star Game. . . . . . . . . . . . . . . . . . . . . . . . . . . . . . . . . . . . . . . . . . . . . 24449.11 Fan Demographics. . . . . . . . . . . . . . . . . . . . . . . . . . . . . . . . . . . . . . . . . 24449.12 Fan Loyalty. . . . . . . . . . . . . . . . . . . . . . . . . . . . . . . . . . . . . . . . . . . . . . . 24549.13 Market Resources. . . . . . . . . . . . . . . . . . . . . . . . . . . . . . . . . . . . . . . . . . 245
50 NATIONAL FOOTBALL LEAGUE. . . . . . . . . . . . . . . . . . . . . . . . . . . . . . . . . . . 24650.1 League Revenue. . . . . . . . . . . . . . . . . . . . . . . . . . . . . . . . . . . . . . . . . . . . 24650.2 Stadiums. . . . . . . . . . . . . . . . . . . . . . . . . . . . . . . . . . . . . . . . . . . . . . . . . . 24650.3 Team Valuations. . . . . . . . . . . . . . . . . . . . . . . . . . . . . . . . . . . . . . . . . . . . 24750.4 Player Salaries. . . . . . . . . . . . . . . . . . . . . . . . . . . . . . . . . . . . . . . . . . . . . 24850.5 Attendance. . . . . . . . . . . . . . . . . . . . . . . . . . . . . . . . . . . . . . . . . . . . . . . . 24950.6 Sponsors. . . . . . . . . . . . . . . . . . . . . . . . . . . . . . . . . . . . . . . . . . . . . . . . . . 25050.7 Television Broadcast Rights. . . . . . . . . . . . . . . . . . . . . . . . . . . . . . . . . . . 25050.8 Franchise Sales. . . . . . . . . . . . . . . . . . . . . . . . . . . . . . . . . . . . . . . . . . . . . 25150.9 Super Bowl. . . . . . . . . . . . . . . . . . . . . . . . . . . . . . . . . . . . . . . . . . . . . . . . 25150.10 Pro Bowl Game. . . . . . . . . . . . . . . . . . . . . . . . . . . . . . . . . . . . . . . . . . . . 25150.11 Fan Demographics. . . . . . . . . . . . . . . . . . . . . . . . . . . . . . . . . . . . . . . . . 25150.12 Fan Loyalty. . . . . . . . . . . . . . . . . . . . . . . . . . . . . . . . . . . . . . . . . . . . . . . 25250.13 Market Resources. . . . . . . . . . . . . . . . . . . . . . . . . . . . . . . . . . . . . . . . . . 252
51 NATIONAL HOCKEY LEAGUE. . . . . . . . . . . . . . . . . . . . . . . . . . . . . . . . . . . . . 25351.1 League Revenue. . . . . . . . . . . . . . . . . . . . . . . . . . . . . . . . . . . . . . . . . . . . 25351.2 Arenas. . . . . . . . . . . . . . . . . . . . . . . . . . . . . . . . . . . . . . . . . . . . . . . . . . . . 25351.3 Team Valuations. . . . . . . . . . . . . . . . . . . . . . . . . . . . . . . . . . . . . . . . . . . . 25451.4 Player Salaries. . . . . . . . . . . . . . . . . . . . . . . . . . . . . . . . . . . . . . . . . . . . . 25551.5 Attendance. . . . . . . . . . . . . . . . . . . . . . . . . . . . . . . . . . . . . . . . . . . . . . . . 25651.6 Sponsors. . . . . . . . . . . . . . . . . . . . . . . . . . . . . . . . . . . . . . . . . . . . . . . . . . 25751.7 Television Broadcast Rights. . . . . . . . . . . . . . . . . . . . . . . . . . . . . . . . . . . 25751.8 Franchise Sales. . . . . . . . . . . . . . . . . . . . . . . . . . . . . . . . . . . . . . . . . . . . . 25851.9 Stanley Cup. . . . . . . . . . . . . . . . . . . . . . . . . . . . . . . . . . . . . . . . . . . . . . . . 25851.10 All-Star Game. . . . . . . . . . . . . . . . . . . . . . . . . . . . . . . . . . . . . . . . . . . . . 25851.11 Fan Demographics. . . . . . . . . . . . . . . . . . . . . . . . . . . . . . . . . . . . . . . . . 25851.12 Fan Loyalty. . . . . . . . . . . . . . . . . . . . . . . . . . . . . . . . . . . . . . . . . . . . . . . 25951.13 Market Resources. . . . . . . . . . . . . . . . . . . . . . . . . . . . . . . . . . . . . . . . . . 259
SPORTS MARKETING 2020-2021
• 12 •

52 MAJOR LEAGUE SOCCER.. . . . . . . . . . . . . . . . . . . . . . . . . . . . . . . . . . . . . . . 26052.1 Overview. . . . . . . . . . . . . . . . . . . . . . . . . . . . . . . . . . . . . . . . . . . . . . . . . . 26052.2 Stadiums. . . . . . . . . . . . . . . . . . . . . . . . . . . . . . . . . . . . . . . . . . . . . . . . . . 26052.3 Team Valuations. . . . . . . . . . . . . . . . . . . . . . . . . . . . . . . . . . . . . . . . . . . . 26152.4 Highest-Paid Players. . . . . . . . . . . . . . . . . . . . . . . . . . . . . . . . . . . . . . . . . 26152.5 Attendance. . . . . . . . . . . . . . . . . . . . . . . . . . . . . . . . . . . . . . . . . . . . . . . . 26152.6 Sponsors. . . . . . . . . . . . . . . . . . . . . . . . . . . . . . . . . . . . . . . . . . . . . . . . . . 26252.7 Television Broadcast Rights. . . . . . . . . . . . . . . . . . . . . . . . . . . . . . . . . . . 26352.8 Fan Demographics. . . . . . . . . . . . . . . . . . . . . . . . . . . . . . . . . . . . . . . . . . 26352.9 Market Resources. . . . . . . . . . . . . . . . . . . . . . . . . . . . . . . . . . . . . . . . . . . 263
53 PREMIER LEAGUE. . . . . . . . . . . . . . . . . . . . . . . . . . . . . . . . . . . . . . . . . . . . . . 26453.1 Overview. . . . . . . . . . . . . . . . . . . . . . . . . . . . . . . . . . . . . . . . . . . . . . . . . . 26453.2 Clubs. . . . . . . . . . . . . . . . . . . . . . . . . . . . . . . . . . . . . . . . . . . . . . . . . . . . . 26453.3 Team Valuations. . . . . . . . . . . . . . . . . . . . . . . . . . . . . . . . . . . . . . . . . . . . 26553.4 U.S. Broadcast Rights. . . . . . . . . . . . . . . . . . . . . . . . . . . . . . . . . . . . . . . . 265
54 UEFA CHAMPIONS LEAGUE. . . . . . . . . . . . . . . . . . . . . . . . . . . . . . . . . . . . . . 26654.1 Overview. . . . . . . . . . . . . . . . . . . . . . . . . . . . . . . . . . . . . . . . . . . . . . . . . . 26654.2 UEFA Champions League Final. . . . . . . . . . . . . . . . . . . . . . . . . . . . . . . . 26654.3 2018/19 UEFA Champions League Participants. . . . . . . . . . . . . . . . . . . . 26654.4 Top Teams. . . . . . . . . . . . . . . . . . . . . . . . . . . . . . . . . . . . . . . . . . . . . . . . 26754.5 Top Players. . . . . . . . . . . . . . . . . . . . . . . . . . . . . . . . . . . . . . . . . . . . . . . . 268
55 MAJOR LEAGUE LACROSSE. . . . . . . . . . . . . . . . . . . . . . . . . . . . . . . . . . . . . 26955.1 Overview. . . . . . . . . . . . . . . . . . . . . . . . . . . . . . . . . . . . . . . . . . . . . . . . . . 26955.2 Teams And Stadiums. . . . . . . . . . . . . . . . . . . . . . . . . . . . . . . . . . . . . . . . 26955.3 Attendance. . . . . . . . . . . . . . . . . . . . . . . . . . . . . . . . . . . . . . . . . . . . . . . . 26955.4 Broadcast Rights. . . . . . . . . . . . . . . . . . . . . . . . . . . . . . . . . . . . . . . . . . . . 26955.5 Sponsors. . . . . . . . . . . . . . . . . . . . . . . . . . . . . . . . . . . . . . . . . . . . . . . . . . 27055.6 Market Resources. . . . . . . . . . . . . . . . . . . . . . . . . . . . . . . . . . . . . . . . . . . 270
56 NATIONAL LACROSSE LEAGUE.. . . . . . . . . . . . . . . . . . . . . . . . . . . . . . . . . . 27156.1 Overview. . . . . . . . . . . . . . . . . . . . . . . . . . . . . . . . . . . . . . . . . . . . . . . . . . 27156.2 Arenas. . . . . . . . . . . . . . . . . . . . . . . . . . . . . . . . . . . . . . . . . . . . . . . . . . . . 27156.3 Attendance. . . . . . . . . . . . . . . . . . . . . . . . . . . . . . . . . . . . . . . . . . . . . . . . 27156.4 Broadcast Rights. . . . . . . . . . . . . . . . . . . . . . . . . . . . . . . . . . . . . . . . . . . . 27256.5 Sponsors. . . . . . . . . . . . . . . . . . . . . . . . . . . . . . . . . . . . . . . . . . . . . . . . . . 27256.6 Market Resources. . . . . . . . . . . . . . . . . . . . . . . . . . . . . . . . . . . . . . . . . . . 272
57 PREMIER LACROSSE LEAGUE.. . . . . . . . . . . . . . . . . . . . . . . . . . . . . . . . . . . 27357.1 Overview. . . . . . . . . . . . . . . . . . . . . . . . . . . . . . . . . . . . . . . . . . . . . . . . . . 27357.2 Inaugural Season. . . . . . . . . . . . . . . . . . . . . . . . . . . . . . . . . . . . . . . . . . . 27357.3 Teams. . . . . . . . . . . . . . . . . . . . . . . . . . . . . . . . . . . . . . . . . . . . . . . . . . . . 273
SPORTS MARKETING 2020-2021
• 13 •

57.4 Media.. . . . . . . . . . . . . . . . . . . . . . . . . . . . . . . . . . . . . . . . . . . . . . . . . . . . 27457.5 Sponsors. . . . . . . . . . . . . . . . . . . . . . . . . . . . . . . . . . . . . . . . . . . . . . . . . . 274
58 MAJOR LEAGUE RUGBY. . . . . . . . . . . . . . . . . . . . . . . . . . . . . . . . . . . . . . . . . 27558.1 Overview. . . . . . . . . . . . . . . . . . . . . . . . . . . . . . . . . . . . . . . . . . . . . . . . . . 27558.2 Teams and Stadiums.. . . . . . . . . . . . . . . . . . . . . . . . . . . . . . . . . . . . . . . . 27558.3 Expansion Teams. . . . . . . . . . . . . . . . . . . . . . . . . . . . . . . . . . . . . . . . . . . 27558.4 Broadcast Rights. . . . . . . . . . . . . . . . . . . . . . . . . . . . . . . . . . . . . . . . . . . . 27658.5 Market Resources. . . . . . . . . . . . . . . . . . . . . . . . . . . . . . . . . . . . . . . . . . . 276
59 CANADIAN FOOTBALL LEAGUE.. . . . . . . . . . . . . . . . . . . . . . . . . . . . . . . . . . 27759.1 Overview. . . . . . . . . . . . . . . . . . . . . . . . . . . . . . . . . . . . . . . . . . . . . . . . . . 27759.2 Stadiums. . . . . . . . . . . . . . . . . . . . . . . . . . . . . . . . . . . . . . . . . . . . . . . . . . 27759.3 Attendance. . . . . . . . . . . . . . . . . . . . . . . . . . . . . . . . . . . . . . . . . . . . . . . . 27759.4 Broadcast Rights. . . . . . . . . . . . . . . . . . . . . . . . . . . . . . . . . . . . . . . . . . . . 27859.5 Market Resources. . . . . . . . . . . . . . . . . . . . . . . . . . . . . . . . . . . . . . . . . . . 278
60 ARENA FOOTBALL LEAGUE. . . . . . . . . . . . . . . . . . . . . . . . . . . . . . . . . . . . . . 27960.1 Overview. . . . . . . . . . . . . . . . . . . . . . . . . . . . . . . . . . . . . . . . . . . . . . . . . . 27960.2 Teams And Stadiums. . . . . . . . . . . . . . . . . . . . . . . . . . . . . . . . . . . . . . . . 27960.3 Attendance. . . . . . . . . . . . . . . . . . . . . . . . . . . . . . . . . . . . . . . . . . . . . . . . 27960.4 Broadcast Rights. . . . . . . . . . . . . . . . . . . . . . . . . . . . . . . . . . . . . . . . . . . . 27960.5 Market Resources. . . . . . . . . . . . . . . . . . . . . . . . . . . . . . . . . . . . . . . . . . . 280
61 MINOR LEAGUE BASEBALL. . . . . . . . . . . . . . . . . . . . . . . . . . . . . . . . . . . . . . 28161.1 Overview. . . . . . . . . . . . . . . . . . . . . . . . . . . . . . . . . . . . . . . . . . . . . . . . . . 28161.2 Team Valuations. . . . . . . . . . . . . . . . . . . . . . . . . . . . . . . . . . . . . . . . . . . . 28161.3 Attendance By League. . . . . . . . . . . . . . . . . . . . . . . . . . . . . . . . . . . . . . . 28361.4 Top Team Attendance. . . . . . . . . . . . . . . . . . . . . . . . . . . . . . . . . . . . . . . . 28361.5 Sponsors. . . . . . . . . . . . . . . . . . . . . . . . . . . . . . . . . . . . . . . . . . . . . . . . . . 28561.6 Market Resources. . . . . . . . . . . . . . . . . . . . . . . . . . . . . . . . . . . . . . . . . . . 285
62 MINOR LEAGUE HOCKEY. . . . . . . . . . . . . . . . . . . . . . . . . . . . . . . . . . . . . . . . 28662.1 Overview. . . . . . . . . . . . . . . . . . . . . . . . . . . . . . . . . . . . . . . . . . . . . . . . . . 28662.2 American Hockey League. . . . . . . . . . . . . . . . . . . . . . . . . . . . . . . . . . . . . 28662.3 East Coast Hockey League. . . . . . . . . . . . . . . . . . . . . . . . . . . . . . . . . . . . 28762.4 Market Resources. . . . . . . . . . . . . . . . . . . . . . . . . . . . . . . . . . . . . . . . . . . 288
63 NBA G LEAGUE. . . . . . . . . . . . . . . . . . . . . . . . . . . . . . . . . . . . . . . . . . . . . . . . 28963.1 Overview. . . . . . . . . . . . . . . . . . . . . . . . . . . . . . . . . . . . . . . . . . . . . . . . . . 28963.2 Teams and NBA Affiliates. . . . . . . . . . . . . . . . . . . . . . . . . . . . . . . . . . . . . 28963.3 Arenas. . . . . . . . . . . . . . . . . . . . . . . . . . . . . . . . . . . . . . . . . . . . . . . . . . . . 29063.4 Attendance. . . . . . . . . . . . . . . . . . . . . . . . . . . . . . . . . . . . . . . . . . . . . . . . 29163.5 Media Rights. . . . . . . . . . . . . . . . . . . . . . . . . . . . . . . . . . . . . . . . . . . . . . . 291
SPORTS MARKETING 2020-2021
• 14 •

64 UNITED SOCCER LEAGUE. . . . . . . . . . . . . . . . . . . . . . . . . . . . . . . . . . . . . . . 29264.1 Overview. . . . . . . . . . . . . . . . . . . . . . . . . . . . . . . . . . . . . . . . . . . . . . . . . . 29264.2 Attendance. . . . . . . . . . . . . . . . . . . . . . . . . . . . . . . . . . . . . . . . . . . . . . . . 29264.3 Media Rights. . . . . . . . . . . . . . . . . . . . . . . . . . . . . . . . . . . . . . . . . . . . . . . 29364.4 Market Resources. . . . . . . . . . . . . . . . . . . . . . . . . . . . . . . . . . . . . . . . . . . 294
PART VII: WOMEN’S LEAGUE SPORTS. . . . . . . . . . . . . . . . . . . . . . . . . . . . . . . . 295
65 WOMEN’S NATIONAL BASKETBALL ASSOCIATION. . . . . . . . . . . . . . . . . . 29665.1 Overview. . . . . . . . . . . . . . . . . . . . . . . . . . . . . . . . . . . . . . . . . . . . . . . . . . 29665.2 Teams And Arenas. . . . . . . . . . . . . . . . . . . . . . . . . . . . . . . . . . . . . . . . . . 29665.3 Attendance. . . . . . . . . . . . . . . . . . . . . . . . . . . . . . . . . . . . . . . . . . . . . . . . 29665.4 Sponsors. . . . . . . . . . . . . . . . . . . . . . . . . . . . . . . . . . . . . . . . . . . . . . . . . . 29765.5 Television Broadcast Rights. . . . . . . . . . . . . . . . . . . . . . . . . . . . . . . . . . . 29865.6 Fan Demographics. . . . . . . . . . . . . . . . . . . . . . . . . . . . . . . . . . . . . . . . . . 29865.7 Market Resources. . . . . . . . . . . . . . . . . . . . . . . . . . . . . . . . . . . . . . . . . . . 299
66 LEGENDS FOOTBALL LEAGUE. . . . . . . . . . . . . . . . . . . . . . . . . . . . . . . . . . . 30066.1 Overview. . . . . . . . . . . . . . . . . . . . . . . . . . . . . . . . . . . . . . . . . . . . . . . . . . 30066.2 2019 Season. . . . . . . . . . . . . . . . . . . . . . . . . . . . . . . . . . . . . . . . . . . . . . . 30066.3 Media.. . . . . . . . . . . . . . . . . . . . . . . . . . . . . . . . . . . . . . . . . . . . . . . . . . . . 300
67 NATIONAL PRO FASTPITCH. . . . . . . . . . . . . . . . . . . . . . . . . . . . . . . . . . . . . . 30167.1 Overview. . . . . . . . . . . . . . . . . . . . . . . . . . . . . . . . . . . . . . . . . . . . . . . . . . 30167.2 Teams. . . . . . . . . . . . . . . . . . . . . . . . . . . . . . . . . . . . . . . . . . . . . . . . . . . . 30167.3 Media.. . . . . . . . . . . . . . . . . . . . . . . . . . . . . . . . . . . . . . . . . . . . . . . . . . . . 30167.4 Sponsors. . . . . . . . . . . . . . . . . . . . . . . . . . . . . . . . . . . . . . . . . . . . . . . . . . 30167.5 Market Resources. . . . . . . . . . . . . . . . . . . . . . . . . . . . . . . . . . . . . . . . . . . 302
68 NATIONAL WOMEN’S HOCKEY LEAGUE.. . . . . . . . . . . . . . . . . . . . . . . . . . . 30368.1 Overview. . . . . . . . . . . . . . . . . . . . . . . . . . . . . . . . . . . . . . . . . . . . . . . . . . 30368.2 2018-2019 Season. . . . . . . . . . . . . . . . . . . . . . . . . . . . . . . . . . . . . . . . . . 30368.3 Media.. . . . . . . . . . . . . . . . . . . . . . . . . . . . . . . . . . . . . . . . . . . . . . . . . . . . 30368.4 All-Star Game. . . . . . . . . . . . . . . . . . . . . . . . . . . . . . . . . . . . . . . . . . . . . . 30468.5 Sponsors. . . . . . . . . . . . . . . . . . . . . . . . . . . . . . . . . . . . . . . . . . . . . . . . . . 304
69 NATIONAL WOMEN’S SOCCER LEAGUE.. . . . . . . . . . . . . . . . . . . . . . . . . . . 30569.1 Overview. . . . . . . . . . . . . . . . . . . . . . . . . . . . . . . . . . . . . . . . . . . . . . . . . . 30569.2 Teams. . . . . . . . . . . . . . . . . . . . . . . . . . . . . . . . . . . . . . . . . . . . . . . . . . . . 30569.3 Attendance. . . . . . . . . . . . . . . . . . . . . . . . . . . . . . . . . . . . . . . . . . . . . . . . 30569.4 Media Rights. . . . . . . . . . . . . . . . . . . . . . . . . . . . . . . . . . . . . . . . . . . . . . . 30669.5 Sponsors. . . . . . . . . . . . . . . . . . . . . . . . . . . . . . . . . . . . . . . . . . . . . . . . . . 30669.6 Market Resources. . . . . . . . . . . . . . . . . . . . . . . . . . . . . . . . . . . . . . . . . . . 306
SPORTS MARKETING 2020-2021
• 15 •

PART VIII: COLLEGIATE & HIGH SCHOOL SPORTS. . . . . . . . . . . . . . . . . . . . . . 307
70 COLLEGE ATHLETIC PROGRAMS. . . . . . . . . . . . . . . . . . . . . . . . . . . . . . . . . 30870.1 Profiles of Major Programs. . . . . . . . . . . . . . . . . . . . . . . . . . . . . . . . . . . . 308
71 DIVISION I CONFERENCES. . . . . . . . . . . . . . . . . . . . . . . . . . . . . . . . . . . . . . . 34771.1 Division I Conferences.. . . . . . . . . . . . . . . . . . . . . . . . . . . . . . . . . . . . . . . 34771.2 Conference Revenue.. . . . . . . . . . . . . . . . . . . . . . . . . . . . . . . . . . . . . . . . 34871.3 Athletic Department Revenue. . . . . . . . . . . . . . . . . . . . . . . . . . . . . . . . . . 348
72 NCAA SPORTS. . . . . . . . . . . . . . . . . . . . . . . . . . . . . . . . . . . . . . . . . . . . . . . . . 35472.1 Overview. . . . . . . . . . . . . . . . . . . . . . . . . . . . . . . . . . . . . . . . . . . . . . . . . . 35472.2 Men’s and Women’s Sports. . . . . . . . . . . . . . . . . . . . . . . . . . . . . . . . . . . 35472.3 NCAA Revenue. . . . . . . . . . . . . . . . . . . . . . . . . . . . . . . . . . . . . . . . . . . . . 35672.4 Broadcast Rights. . . . . . . . . . . . . . . . . . . . . . . . . . . . . . . . . . . . . . . . . . . . 35672.5 Sponsors. . . . . . . . . . . . . . . . . . . . . . . . . . . . . . . . . . . . . . . . . . . . . . . . . . 35672.6 Market Resources. . . . . . . . . . . . . . . . . . . . . . . . . . . . . . . . . . . . . . . . . . . 356
73 NCAA FOOTBALL. . . . . . . . . . . . . . . . . . . . . . . . . . . . . . . . . . . . . . . . . . . . . . . 35773.1 Football Program Revenue. . . . . . . . . . . . . . . . . . . . . . . . . . . . . . . . . . . . 35773.2 Fans and Spectators. . . . . . . . . . . . . . . . . . . . . . . . . . . . . . . . . . . . . . . . . 35773.3 College Football Playoff and Bowl Games. . . . . . . . . . . . . . . . . . . . . . . . 35873.4 Fan Demographics. . . . . . . . . . . . . . . . . . . . . . . . . . . . . . . . . . . . . . . . . . 35873.5 Regular-Season Broadcasts. . . . . . . . . . . . . . . . . . . . . . . . . . . . . . . . . . . 359
74 NCAA MEN’S BASKETBALL. . . . . . . . . . . . . . . . . . . . . . . . . . . . . . . . . . . . . . 36074.1 Basketball Program Revenue. . . . . . . . . . . . . . . . . . . . . . . . . . . . . . . . . . 36074.2 Fans and Spectators. . . . . . . . . . . . . . . . . . . . . . . . . . . . . . . . . . . . . . . . . 36074.3 Fan Demographics. . . . . . . . . . . . . . . . . . . . . . . . . . . . . . . . . . . . . . . . . . 36174.4 NCAA Divison I Finals. . . . . . . . . . . . . . . . . . . . . . . . . . . . . . . . . . . . . . . . 36274.5 Favorite Teams. . . . . . . . . . . . . . . . . . . . . . . . . . . . . . . . . . . . . . . . . . . . . 36274.6 Regular-Season Broadcasts. . . . . . . . . . . . . . . . . . . . . . . . . . . . . . . . . . . 362
75 NCAA WOMEN’S BASKETBALL. . . . . . . . . . . . . . . . . . . . . . . . . . . . . . . . . . . 36375.1 Fans and Spectators. . . . . . . . . . . . . . . . . . . . . . . . . . . . . . . . . . . . . . . . . 36375.2 Favorite Teams. . . . . . . . . . . . . . . . . . . . . . . . . . . . . . . . . . . . . . . . . . . . . 363
76 HIGH SCHOOL SPORTS.. . . . . . . . . . . . . . . . . . . . . . . . . . . . . . . . . . . . . . . . . 36476.1 Overview. . . . . . . . . . . . . . . . . . . . . . . . . . . . . . . . . . . . . . . . . . . . . . . . . . 36476.2 Most Popular Sports. . . . . . . . . . . . . . . . . . . . . . . . . . . . . . . . . . . . . . . . . 36476.3 Participation by Sport. . . . . . . . . . . . . . . . . . . . . . . . . . . . . . . . . . . . . . . . 36576.4 Participation by State.. . . . . . . . . . . . . . . . . . . . . . . . . . . . . . . . . . . . . . . . 36676.5 Local Television Broadcasting. . . . . . . . . . . . . . . . . . . . . . . . . . . . . . . . . . 36876.6 High School Sports Online. . . . . . . . . . . . . . . . . . . . . . . . . . . . . . . . . . . . 368
SPORTS MARKETING 2020-2021
• 16 •

76.7 Sponsors and Promotions. . . . . . . . . . . . . . . . . . . . . . . . . . . . . . . . . . . . . 36876.8 Market Resources. . . . . . . . . . . . . . . . . . . . . . . . . . . . . . . . . . . . . . . . . . . 369
77 YOUTH TEAM SPORTS. . . . . . . . . . . . . . . . . . . . . . . . . . . . . . . . . . . . . . . . . . 37077.1 Participation. . . . . . . . . . . . . . . . . . . . . . . . . . . . . . . . . . . . . . . . . . . . . . . . 37077.2 AAU Sports. . . . . . . . . . . . . . . . . . . . . . . . . . . . . . . . . . . . . . . . . . . . . . . . 37177.3 Youth Baseball. . . . . . . . . . . . . . . . . . . . . . . . . . . . . . . . . . . . . . . . . . . . . 37177.4 Youth Basketball. . . . . . . . . . . . . . . . . . . . . . . . . . . . . . . . . . . . . . . . . . . . 37177.5 Youth Football. . . . . . . . . . . . . . . . . . . . . . . . . . . . . . . . . . . . . . . . . . . . . . 37277.6 Youth Hockey. . . . . . . . . . . . . . . . . . . . . . . . . . . . . . . . . . . . . . . . . . . . . . 37277.7 Youth Soccer. . . . . . . . . . . . . . . . . . . . . . . . . . . . . . . . . . . . . . . . . . . . . . . 372
PART IX: FIGHTING SPORTS. . . . . . . . . . . . . . . . . . . . . . . . . . . . . . . . . . . . . . . . . 374
78 BOXING. . . . . . . . . . . . . . . . . . . . . . . . . . . . . . . . . . . . . . . . . . . . . . . . . . . . . . . 37578.1 Overview. . . . . . . . . . . . . . . . . . . . . . . . . . . . . . . . . . . . . . . . . . . . . . . . . . 37578.2 Pay-Per-View Events.. . . . . . . . . . . . . . . . . . . . . . . . . . . . . . . . . . . . . . . . 37578.3 Televised Boxing. . . . . . . . . . . . . . . . . . . . . . . . . . . . . . . . . . . . . . . . . . . . 37678.4 Boxing Fans.. . . . . . . . . . . . . . . . . . . . . . . . . . . . . . . . . . . . . . . . . . . . . . . 377
79 ULTIMATE FIGHTING CHAMPIONSHIP.. . . . . . . . . . . . . . . . . . . . . . . . . . . . . 37979.1 Overview. . . . . . . . . . . . . . . . . . . . . . . . . . . . . . . . . . . . . . . . . . . . . . . . . . 37979.2 Live Events. . . . . . . . . . . . . . . . . . . . . . . . . . . . . . . . . . . . . . . . . . . . . . . . 37979.3 Pay-Per-View Events.. . . . . . . . . . . . . . . . . . . . . . . . . . . . . . . . . . . . . . . . 37979.4 UFC On TV. . . . . . . . . . . . . . . . . . . . . . . . . . . . . . . . . . . . . . . . . . . . . . . . 38179.5 MMA Fans. . . . . . . . . . . . . . . . . . . . . . . . . . . . . . . . . . . . . . . . . . . . . . . . . 38179.6 Sponsors. . . . . . . . . . . . . . . . . . . . . . . . . . . . . . . . . . . . . . . . . . . . . . . . . . 38179.7 Market Resources. . . . . . . . . . . . . . . . . . . . . . . . . . . . . . . . . . . . . . . . . . . 382
80 WORLD WRESTLING ENTERTAINMENT. . . . . . . . . . . . . . . . . . . . . . . . . . . . 38380.1 Overview. . . . . . . . . . . . . . . . . . . . . . . . . . . . . . . . . . . . . . . . . . . . . . . . . . 38380.2 Live Events and Television. . . . . . . . . . . . . . . . . . . . . . . . . . . . . . . . . . . . 38480.3 The WWE Network. . . . . . . . . . . . . . . . . . . . . . . . . . . . . . . . . . . . . . . . . . 38480.4 Pay-Per-View Events.. . . . . . . . . . . . . . . . . . . . . . . . . . . . . . . . . . . . . . . . 38480.5 Professional Wrestling Fans. . . . . . . . . . . . . . . . . . . . . . . . . . . . . . . . . . . 38580.6 Market Resources. . . . . . . . . . . . . . . . . . . . . . . . . . . . . . . . . . . . . . . . . . . 386
PART X: GOLF. . . . . . . . . . . . . . . . . . . . . . . . . . . . . . . . . . . . . . . . . . . . . . . . . . . . . 387
81 GOLF PARTICIPATION. . . . . . . . . . . . . . . . . . . . . . . . . . . . . . . . . . . . . . . . . . . 38881.1 Participation. . . . . . . . . . . . . . . . . . . . . . . . . . . . . . . . . . . . . . . . . . . . . . . . 38881.2 Spending. . . . . . . . . . . . . . . . . . . . . . . . . . . . . . . . . . . . . . . . . . . . . . . . . . 38881.4 Demographics. . . . . . . . . . . . . . . . . . . . . . . . . . . . . . . . . . . . . . . . . . . . . . 38981.5 Market Resources. . . . . . . . . . . . . . . . . . . . . . . . . . . . . . . . . . . . . . . . . . . 389
SPORTS MARKETING 2020-2021
• 17 •

82 GOLF COURSES. . . . . . . . . . . . . . . . . . . . . . . . . . . . . . . . . . . . . . . . . . . . . . . . 39082.1 Number Of Golf Courses. . . . . . . . . . . . . . . . . . . . . . . . . . . . . . . . . . . . . . 39082.2 Top Golf Courses. . . . . . . . . . . . . . . . . . . . . . . . . . . . . . . . . . . . . . . . . . . 390
83 MEN’S TOUR. . . . . . . . . . . . . . . . . . . . . . . . . . . . . . . . . . . . . . . . . . . . . . . . . . . 39283.1 Overview. . . . . . . . . . . . . . . . . . . . . . . . . . . . . . . . . . . . . . . . . . . . . . . . . . 39283.2 Highest-Earning Golfers. . . . . . . . . . . . . . . . . . . . . . . . . . . . . . . . . . . . . . 39283.3 The PGA Tour. . . . . . . . . . . . . . . . . . . . . . . . . . . . . . . . . . . . . . . . . . . . . . 39383.4 The Major Championships.. . . . . . . . . . . . . . . . . . . . . . . . . . . . . . . . . . . . 39483.5 Broadcast Rights. . . . . . . . . . . . . . . . . . . . . . . . . . . . . . . . . . . . . . . . . . . . 39483.6 Sponsors. . . . . . . . . . . . . . . . . . . . . . . . . . . . . . . . . . . . . . . . . . . . . . . . . . 39583.7 Market Resources. . . . . . . . . . . . . . . . . . . . . . . . . . . . . . . . . . . . . . . . . . . 395
84 WOMEN’S TOUR. . . . . . . . . . . . . . . . . . . . . . . . . . . . . . . . . . . . . . . . . . . . . . . . 39684.1 Overview. . . . . . . . . . . . . . . . . . . . . . . . . . . . . . . . . . . . . . . . . . . . . . . . . . 39684.2 Highest-Earning Golfers. . . . . . . . . . . . . . . . . . . . . . . . . . . . . . . . . . . . . . 39684.3 The LPGA Tour. . . . . . . . . . . . . . . . . . . . . . . . . . . . . . . . . . . . . . . . . . . . . 39784.4 Grand Slam. . . . . . . . . . . . . . . . . . . . . . . . . . . . . . . . . . . . . . . . . . . . . . . . 39784.5 Broadcast Rights. . . . . . . . . . . . . . . . . . . . . . . . . . . . . . . . . . . . . . . . . . . . 39784.6 Sponsors. . . . . . . . . . . . . . . . . . . . . . . . . . . . . . . . . . . . . . . . . . . . . . . . . . 39884.7 Market Resources. . . . . . . . . . . . . . . . . . . . . . . . . . . . . . . . . . . . . . . . . . . 398
85 MAJOR TOURNAMENTS. . . . . . . . . . . . . . . . . . . . . . . . . . . . . . . . . . . . . . . . . 39985.1 Overview. . . . . . . . . . . . . . . . . . . . . . . . . . . . . . . . . . . . . . . . . . . . . . . . . . 39985.2 The Masters.. . . . . . . . . . . . . . . . . . . . . . . . . . . . . . . . . . . . . . . . . . . . . . . 39985.3 U.S. Open Championships. . . . . . . . . . . . . . . . . . . . . . . . . . . . . . . . . . . . 40085.4 The British Open Championship. . . . . . . . . . . . . . . . . . . . . . . . . . . . . . . . 40085.5 PGA Championship. . . . . . . . . . . . . . . . . . . . . . . . . . . . . . . . . . . . . . . . . . 40185.6 Ryder Cup. . . . . . . . . . . . . . . . . . . . . . . . . . . . . . . . . . . . . . . . . . . . . . . . . 40185.7 Presidents Cup. . . . . . . . . . . . . . . . . . . . . . . . . . . . . . . . . . . . . . . . . . . . . 401
PART XI: MOTOR SPORTS. . . . . . . . . . . . . . . . . . . . . . . . . . . . . . . . . . . . . . . . . . . 403
86 INDYCAR. . . . . . . . . . . . . . . . . . . . . . . . . . . . . . . . . . . . . . . . . . . . . . . . . . . . . . 40486.1 Overview. . . . . . . . . . . . . . . . . . . . . . . . . . . . . . . . . . . . . . . . . . . . . . . . . . 40486.2 Sponsors. . . . . . . . . . . . . . . . . . . . . . . . . . . . . . . . . . . . . . . . . . . . . . . . . . 40486.3 Television and Radio Broadcast Rights.. . . . . . . . . . . . . . . . . . . . . . . . . . 40486.4 Racing Teams. . . . . . . . . . . . . . . . . . . . . . . . . . . . . . . . . . . . . . . . . . . . . . 40586.5 IndyCar Series. . . . . . . . . . . . . . . . . . . . . . . . . . . . . . . . . . . . . . . . . . . . . . 40586.6 Market Resources. . . . . . . . . . . . . . . . . . . . . . . . . . . . . . . . . . . . . . . . . . . 406
87 NASCAR. . . . . . . . . . . . . . . . . . . . . . . . . . . . . . . . . . . . . . . . . . . . . . . . . . . . . . 40787.1 Overview. . . . . . . . . . . . . . . . . . . . . . . . . . . . . . . . . . . . . . . . . . . . . . . . . . 40787.2 Advertising and Sponsorships. . . . . . . . . . . . . . . . . . . . . . . . . . . . . . . . . . 407
SPORTS MARKETING 2020-2021
• 18 •

87.3 Television Broadcast Rights and Ratings. . . . . . . . . . . . . . . . . . . . . . . . . 40887.4 Drivers and Racing Teams. . . . . . . . . . . . . . . . . . . . . . . . . . . . . . . . . . . . 40987.5 Tracks. . . . . . . . . . . . . . . . . . . . . . . . . . . . . . . . . . . . . . . . . . . . . . . . . . . . 40987.6 Monster Energy Cup Series.. . . . . . . . . . . . . . . . . . . . . . . . . . . . . . . . . . . 41087.7 Fan Demographics. . . . . . . . . . . . . . . . . . . . . . . . . . . . . . . . . . . . . . . . . . 41187.8 Market Resources. . . . . . . . . . . . . . . . . . . . . . . . . . . . . . . . . . . . . . . . . . . 412
88 FORMULA ONE. . . . . . . . . . . . . . . . . . . . . . . . . . . . . . . . . . . . . . . . . . . . . . . . . 41388.1 Overview. . . . . . . . . . . . . . . . . . . . . . . . . . . . . . . . . . . . . . . . . . . . . . . . . . 41388.2 Formula One 2019.. . . . . . . . . . . . . . . . . . . . . . . . . . . . . . . . . . . . . . . . . . 41388.3 United States Grand Prix. . . . . . . . . . . . . . . . . . . . . . . . . . . . . . . . . . . . . . 41488.4 Grand Prix of America. . . . . . . . . . . . . . . . . . . . . . . . . . . . . . . . . . . . . . . . 41488.5 Media Coverage. . . . . . . . . . . . . . . . . . . . . . . . . . . . . . . . . . . . . . . . . . . . 414
89 FORMULA E. . . . . . . . . . . . . . . . . . . . . . . . . . . . . . . . . . . . . . . . . . . . . . . . . . . 41689.1 Overview. . . . . . . . . . . . . . . . . . . . . . . . . . . . . . . . . . . . . . . . . . . . . . . . . . 41689.2 Racing Teams. . . . . . . . . . . . . . . . . . . . . . . . . . . . . . . . . . . . . . . . . . . . . . 41689.3 U.S. Races. . . . . . . . . . . . . . . . . . . . . . . . . . . . . . . . . . . . . . . . . . . . . . . . 41789.4 Formula E Championship Season Five. . . . . . . . . . . . . . . . . . . . . . . . . . . 41789.5 Media.. . . . . . . . . . . . . . . . . . . . . . . . . . . . . . . . . . . . . . . . . . . . . . . . . . . . 41789.6 Sponsors. . . . . . . . . . . . . . . . . . . . . . . . . . . . . . . . . . . . . . . . . . . . . . . . . . 418
90 NHRA DRAG RACING. . . . . . . . . . . . . . . . . . . . . . . . . . . . . . . . . . . . . . . . . . . . 41990.1 Overview. . . . . . . . . . . . . . . . . . . . . . . . . . . . . . . . . . . . . . . . . . . . . . . . . . 41990.2 Tracks. . . . . . . . . . . . . . . . . . . . . . . . . . . . . . . . . . . . . . . . . . . . . . . . . . . . 41990.3 NHRA Mello Yello Drag Racing Series. . . . . . . . . . . . . . . . . . . . . . . . . . . 42090.4 Broadcast Rights. . . . . . . . . . . . . . . . . . . . . . . . . . . . . . . . . . . . . . . . . . . . 42190.5 Sponsors. . . . . . . . . . . . . . . . . . . . . . . . . . . . . . . . . . . . . . . . . . . . . . . . . . 42190.6 Market Resources. . . . . . . . . . . . . . . . . . . . . . . . . . . . . . . . . . . . . . . . . . . 421
91 SPORTSCAR CHAMPIONSHIP. . . . . . . . . . . . . . . . . . . . . . . . . . . . . . . . . . . . 42291.1 Overview. . . . . . . . . . . . . . . . . . . . . . . . . . . . . . . . . . . . . . . . . . . . . . . . . . 42291.2 WeatherTech SportsCar Championship. . . . . . . . . . . . . . . . . . . . . . . . . . 42291.3 Broadcast Rights. . . . . . . . . . . . . . . . . . . . . . . . . . . . . . . . . . . . . . . . . . . . 42391.4 Sponsors. . . . . . . . . . . . . . . . . . . . . . . . . . . . . . . . . . . . . . . . . . . . . . . . . . 42391.5 Market Resources. . . . . . . . . . . . . . . . . . . . . . . . . . . . . . . . . . . . . . . . . . . 423
92 WORLD OF OUTLAWS. . . . . . . . . . . . . . . . . . . . . . . . . . . . . . . . . . . . . . . . . . . 42492.1 Overview. . . . . . . . . . . . . . . . . . . . . . . . . . . . . . . . . . . . . . . . . . . . . . . . . . 42492.2 Sponsors. . . . . . . . . . . . . . . . . . . . . . . . . . . . . . . . . . . . . . . . . . . . . . . . . . 42492.1 Market Resources. . . . . . . . . . . . . . . . . . . . . . . . . . . . . . . . . . . . . . . . . . . 424
SPORTS MARKETING 2020-2021
• 19 •

93 MOTORCYCLE RACING. . . . . . . . . . . . . . . . . . . . . . . . . . . . . . . . . . . . . . . . . . 42593.1 Overview. . . . . . . . . . . . . . . . . . . . . . . . . . . . . . . . . . . . . . . . . . . . . . . . . . 42593.2 AMA Pro Motocross.. . . . . . . . . . . . . . . . . . . . . . . . . . . . . . . . . . . . . . . . . 42593.3 MotoGP. . . . . . . . . . . . . . . . . . . . . . . . . . . . . . . . . . . . . . . . . . . . . . . . . . . 42693.4 Supercross. . . . . . . . . . . . . . . . . . . . . . . . . . . . . . . . . . . . . . . . . . . . . . . . 42793.5 Supercross Futures. . . . . . . . . . . . . . . . . . . . . . . . . . . . . . . . . . . . . . . . . . 42893.6 Market Resources. . . . . . . . . . . . . . . . . . . . . . . . . . . . . . . . . . . . . . . . . . . 428
PART XII: TENNIS. . . . . . . . . . . . . . . . . . . . . . . . . . . . . . . . . . . . . . . . . . . . . . . . . . 429
94 TENNIS PARTICIPATION. . . . . . . . . . . . . . . . . . . . . . . . . . . . . . . . . . . . . . . . . 43094.1 Participation. . . . . . . . . . . . . . . . . . . . . . . . . . . . . . . . . . . . . . . . . . . . . . . . 43094.2 Spending. . . . . . . . . . . . . . . . . . . . . . . . . . . . . . . . . . . . . . . . . . . . . . . . . . 43094.3 Demographics. . . . . . . . . . . . . . . . . . . . . . . . . . . . . . . . . . . . . . . . . . . . . . 43094.4 Market Resources. . . . . . . . . . . . . . . . . . . . . . . . . . . . . . . . . . . . . . . . . . . 431
95 TENNIS VENUES.. . . . . . . . . . . . . . . . . . . . . . . . . . . . . . . . . . . . . . . . . . . . . . . 43295.1 Top Tournament Courts. . . . . . . . . . . . . . . . . . . . . . . . . . . . . . . . . . . . . . 43295.2 Venue Profiles. . . . . . . . . . . . . . . . . . . . . . . . . . . . . . . . . . . . . . . . . . . . . . 432
96 MEN’S TOURS.. . . . . . . . . . . . . . . . . . . . . . . . . . . . . . . . . . . . . . . . . . . . . . . . . 43496.1 Overview. . . . . . . . . . . . . . . . . . . . . . . . . . . . . . . . . . . . . . . . . . . . . . . . . . 43496.2 Highest-Earning Tennis Players. . . . . . . . . . . . . . . . . . . . . . . . . . . . . . . . 43496.3 APT World Tour.. . . . . . . . . . . . . . . . . . . . . . . . . . . . . . . . . . . . . . . . . . . . 43496.4 Grand Slam Tournaments. . . . . . . . . . . . . . . . . . . . . . . . . . . . . . . . . . . . . 43696.5 Market Resources. . . . . . . . . . . . . . . . . . . . . . . . . . . . . . . . . . . . . . . . . . . 436
97 WOMEN’S TOURS. . . . . . . . . . . . . . . . . . . . . . . . . . . . . . . . . . . . . . . . . . . . . . 43797.1 Overview. . . . . . . . . . . . . . . . . . . . . . . . . . . . . . . . . . . . . . . . . . . . . . . . . . 43797.2 Highest-Earning Tennis Players. . . . . . . . . . . . . . . . . . . . . . . . . . . . . . . . 43797.3 WTA Tour. . . . . . . . . . . . . . . . . . . . . . . . . . . . . . . . . . . . . . . . . . . . . . . . . 43797.4 Grand Slam Tournaments. . . . . . . . . . . . . . . . . . . . . . . . . . . . . . . . . . . . . 43897.5 Sponsors. . . . . . . . . . . . . . . . . . . . . . . . . . . . . . . . . . . . . . . . . . . . . . . . . . 43897.6 Market Resources. . . . . . . . . . . . . . . . . . . . . . . . . . . . . . . . . . . . . . . . . . . 438
98 MAJOR TOURNAMENTS. . . . . . . . . . . . . . . . . . . . . . . . . . . . . . . . . . . . . . . . . 43998.1 BNP Paribas Open. . . . . . . . . . . . . . . . . . . . . . . . . . . . . . . . . . . . . . . . . . 43998.2 Davis Cup. . . . . . . . . . . . . . . . . . . . . . . . . . . . . . . . . . . . . . . . . . . . . . . . . 43998.3 Fed Cup.. . . . . . . . . . . . . . . . . . . . . . . . . . . . . . . . . . . . . . . . . . . . . . . . . . 43998.4 Miami Open. . . . . . . . . . . . . . . . . . . . . . . . . . . . . . . . . . . . . . . . . . . . . . . . 44098.5 US Open. . . . . . . . . . . . . . . . . . . . . . . . . . . . . . . . . . . . . . . . . . . . . . . . . . 44098.6 Wimbledon. . . . . . . . . . . . . . . . . . . . . . . . . . . . . . . . . . . . . . . . . . . . . . . . 441
SPORTS MARKETING 2020-2021
• 20 •

PART XIII: ESPORTS. . . . . . . . . . . . . . . . . . . . . . . . . . . . . . . . . . . . . . . . . . . . . . . . 443
99 ESPORTS MARKET ASSESSMENT.. . . . . . . . . . . . . . . . . . . . . . . . . . . . . . . . 44499.1 Overview. . . . . . . . . . . . . . . . . . . . . . . . . . . . . . . . . . . . . . . . . . . . . . . . . . 44499.2 Esports Viewers.. . . . . . . . . . . . . . . . . . . . . . . . . . . . . . . . . . . . . . . . . . . . 44499.3 Market Assessment. . . . . . . . . . . . . . . . . . . . . . . . . . . . . . . . . . . . . . . . . . 44599.4 Top Esports Companies. . . . . . . . . . . . . . . . . . . . . . . . . . . . . . . . . . . . . . 44599.5 Investment. . . . . . . . . . . . . . . . . . . . . . . . . . . . . . . . . . . . . . . . . . . . . . . . . 446
100 LEAGUES & CHAMPIONSHIPS. . . . . . . . . . . . . . . . . . . . . . . . . . . . . . . . . . . . 448100.1 ELeague. . . . . . . . . . . . . . . . . . . . . . . . . . . . . . . . . . . . . . . . . . . . . . . . . 448100.2 ESL Gaming Network. . . . . . . . . . . . . . . . . . . . . . . . . . . . . . . . . . . . . . . 448100.3 Evolution Championship Series.. . . . . . . . . . . . . . . . . . . . . . . . . . . . . . . 449100.4 FIFA eWorld Cup and eMLS Cup. . . . . . . . . . . . . . . . . . . . . . . . . . . . . . 449100.5 Fortnite World Cup. . . . . . . . . . . . . . . . . . . . . . . . . . . . . . . . . . . . . . . . . 450100.6 League Of Legends World Championship Series. . . . . . . . . . . . . . . . . . 450100.7 Major League Gaming. . . . . . . . . . . . . . . . . . . . . . . . . . . . . . . . . . . . . . . 451100.8 NBA 2K League.. . . . . . . . . . . . . . . . . . . . . . . . . . . . . . . . . . . . . . . . . . . 451100.9 Overwatch League. . . . . . . . . . . . . . . . . . . . . . . . . . . . . . . . . . . . . . . . . 451100.10 Super League Gaming. . . . . . . . . . . . . . . . . . . . . . . . . . . . . . . . . . . . . 452
101 ESPORTS VENUES.. . . . . . . . . . . . . . . . . . . . . . . . . . . . . . . . . . . . . . . . . . . . . 453101.1 Overview. . . . . . . . . . . . . . . . . . . . . . . . . . . . . . . . . . . . . . . . . . . . . . . . . 453101.2 Venue Profiles. . . . . . . . . . . . . . . . . . . . . . . . . . . . . . . . . . . . . . . . . . . . . 453
102 MEDIA & ADVERTISING. . . . . . . . . . . . . . . . . . . . . . . . . . . . . . . . . . . . . . . . . . 456102.1 Esports Media. . . . . . . . . . . . . . . . . . . . . . . . . . . . . . . . . . . . . . . . . . . . . 456102.2 Twitch. . . . . . . . . . . . . . . . . . . . . . . . . . . . . . . . . . . . . . . . . . . . . . . . . . . 457
103 COLLEGIATE ESPORTS. . . . . . . . . . . . . . . . . . . . . . . . . . . . . . . . . . . . . . . . . 459103.1 Collegiate Clubs. . . . . . . . . . . . . . . . . . . . . . . . . . . . . . . . . . . . . . . . . . . 459103.2 Varsity Esports Programs. . . . . . . . . . . . . . . . . . . . . . . . . . . . . . . . . . . . 459103.3 High School Esports League. . . . . . . . . . . . . . . . . . . . . . . . . . . . . . . . . . 460103.4 Market Resources. . . . . . . . . . . . . . . . . . . . . . . . . . . . . . . . . . . . . . . . . . 461
PART XIV: RODEO.. . . . . . . . . . . . . . . . . . . . . . . . . . . . . . . . . . . . . . . . . . . . . . . . . 462
104 RODEO FANS. . . . . . . . . . . . . . . . . . . . . . . . . . . . . . . . . . . . . . . . . . . . . . . . . . 463104.1 Overview. . . . . . . . . . . . . . . . . . . . . . . . . . . . . . . . . . . . . . . . . . . . . . . . . 463104.2 Major Events. . . . . . . . . . . . . . . . . . . . . . . . . . . . . . . . . . . . . . . . . . . . . . 463104.3 Fan Demographics. . . . . . . . . . . . . . . . . . . . . . . . . . . . . . . . . . . . . . . . . 463
SPORTS MARKETING 2020-2021
• 21 •

105 PROFESSIONAL RODEO COWBOYS ASSOCIATION. . . . . . . . . . . . . . . . . . 465105.1 Overview. . . . . . . . . . . . . . . . . . . . . . . . . . . . . . . . . . . . . . . . . . . . . . . . . 465105.2 Wrangler National Finals Rodeo. . . . . . . . . . . . . . . . . . . . . . . . . . . . . . . 465105.3 ProRodeo Tour. . . . . . . . . . . . . . . . . . . . . . . . . . . . . . . . . . . . . . . . . . . . 465105.4 RAM National Circuit Finals. . . . . . . . . . . . . . . . . . . . . . . . . . . . . . . . . . . 466105.5 Xtreme Bulls Tour .. . . . . . . . . . . . . . . . . . . . . . . . . . . . . . . . . . . . . . . . . 467105.6 Xtreme Broncs Tour. . . . . . . . . . . . . . . . . . . . . . . . . . . . . . . . . . . . . . . . 467105.7 All-American ProRodeo Series. . . . . . . . . . . . . . . . . . . . . . . . . . . . . . . . 467105.8 Sponsors. . . . . . . . . . . . . . . . . . . . . . . . . . . . . . . . . . . . . . . . . . . . . . . . . 468105.9 Market Resources. . . . . . . . . . . . . . . . . . . . . . . . . . . . . . . . . . . . . . . . . . 468
106 PROFESSIONAL BULL RIDERS. . . . . . . . . . . . . . . . . . . . . . . . . . . . . . . . . . . 469106.1 Overview. . . . . . . . . . . . . . . . . . . . . . . . . . . . . . . . . . . . . . . . . . . . . . . . . 469106.2 Unleash The Beast Tour. . . . . . . . . . . . . . . . . . . . . . . . . . . . . . . . . . . . . 469106.3 PBR World Finals. . . . . . . . . . . . . . . . . . . . . . . . . . . . . . . . . . . . . . . . . . 470106.4 Media.. . . . . . . . . . . . . . . . . . . . . . . . . . . . . . . . . . . . . . . . . . . . . . . . . . . 470106.5 Sponsors. . . . . . . . . . . . . . . . . . . . . . . . . . . . . . . . . . . . . . . . . . . . . . . . . 470106.6 Market Resources. . . . . . . . . . . . . . . . . . . . . . . . . . . . . . . . . . . . . . . . . . 470
PART XV: ORGANIZED SPORTS/COMPETITIONS. . . . . . . . . . . . . . . . . . . . . . . . 471
107 AIR RACING. . . . . . . . . . . . . . . . . . . . . . . . . . . . . . . . . . . . . . . . . . . . . . . . . . . 472107.1 Overview. . . . . . . . . . . . . . . . . . . . . . . . . . . . . . . . . . . . . . . . . . . . . . . . . 472107.2 Red Bull Air Race. . . . . . . . . . . . . . . . . . . . . . . . . . . . . . . . . . . . . . . . . . 472107.3 Reno Air Races. . . . . . . . . . . . . . . . . . . . . . . . . . . . . . . . . . . . . . . . . . . . 472
108 AMERICA’S CUP. . . . . . . . . . . . . . . . . . . . . . . . . . . . . . . . . . . . . . . . . . . . . . . . 474108.1 Overview. . . . . . . . . . . . . . . . . . . . . . . . . . . . . . . . . . . . . . . . . . . . . . . . . 474108.2 The 35th America’s Cup. . . . . . . . . . . . . . . . . . . . . . . . . . . . . . . . . . . . . . 474108.3 The 36th America’s Cup. . . . . . . . . . . . . . . . . . . . . . . . . . . . . . . . . . . . . . 475108.4 Market Resources. . . . . . . . . . . . . . . . . . . . . . . . . . . . . . . . . . . . . . . . . . 475
109 BASS FISHING & SPORTFISHING.. . . . . . . . . . . . . . . . . . . . . . . . . . . . . . . . . 476109.1 Overview. . . . . . . . . . . . . . . . . . . . . . . . . . . . . . . . . . . . . . . . . . . . . . . . . 476109.2 Bass Anglers Sportsman’s Society. . . . . . . . . . . . . . . . . . . . . . . . . . . . . 476109.3 Fishing League Worldwide. . . . . . . . . . . . . . . . . . . . . . . . . . . . . . . . . . . 478109.4 Western Outdoor News Bass. . . . . . . . . . . . . . . . . . . . . . . . . . . . . . . . . 479109.5 Major League Fishing. . . . . . . . . . . . . . . . . . . . . . . . . . . . . . . . . . . . . . . 479109.6 Sportfishing. . . . . . . . . . . . . . . . . . . . . . . . . . . . . . . . . . . . . . . . . . . . . . . 479109.7 Collegiate.. . . . . . . . . . . . . . . . . . . . . . . . . . . . . . . . . . . . . . . . . . . . . . . . 481109.8 Market Resources. . . . . . . . . . . . . . . . . . . . . . . . . . . . . . . . . . . . . . . . . . 481
110 BOWLING. . . . . . . . . . . . . . . . . . . . . . . . . . . . . . . . . . . . . . . . . . . . . . . . . . . . . 482110.1 Participation. . . . . . . . . . . . . . . . . . . . . . . . . . . . . . . . . . . . . . . . . . . . . . . 482
SPORTS MARKETING 2020-2021
• 22 •

110.2 United States Bowling Congress. . . . . . . . . . . . . . . . . . . . . . . . . . . . . . . 482110.3 Professional Bowlers Association. . . . . . . . . . . . . . . . . . . . . . . . . . . . . . 482110.4 Professional Women’s Bowling Association. . . . . . . . . . . . . . . . . . . . . . 483110.5 Collegiate Teams.. . . . . . . . . . . . . . . . . . . . . . . . . . . . . . . . . . . . . . . . . . 483110.6 World Bowling Association. . . . . . . . . . . . . . . . . . . . . . . . . . . . . . . . . . . 484110.7 Media And Advertising.. . . . . . . . . . . . . . . . . . . . . . . . . . . . . . . . . . . . . . 485110.8 Market Resources. . . . . . . . . . . . . . . . . . . . . . . . . . . . . . . . . . . . . . . . . . 485
111 COMPETITIVE CHEERLEADING. . . . . . . . . . . . . . . . . . . . . . . . . . . . . . . . . . . 486111.1 Overview. . . . . . . . . . . . . . . . . . . . . . . . . . . . . . . . . . . . . . . . . . . . . . . . . 486111.2 Sanctioning Organizations.. . . . . . . . . . . . . . . . . . . . . . . . . . . . . . . . . . . 486111.3 Collegiate Competitive Cheer. . . . . . . . . . . . . . . . . . . . . . . . . . . . . . . . . 487111.4 Market Resources. . . . . . . . . . . . . . . . . . . . . . . . . . . . . . . . . . . . . . . . . . 487
112 CRICKET. . . . . . . . . . . . . . . . . . . . . . . . . . . . . . . . . . . . . . . . . . . . . . . . . . . . . . 488112.1 Overview. . . . . . . . . . . . . . . . . . . . . . . . . . . . . . . . . . . . . . . . . . . . . . . . . 488112.2 Organized Cricket in the United States. . . . . . . . . . . . . . . . . . . . . . . . . . 489112.3 Cricket World Cup. . . . . . . . . . . . . . . . . . . . . . . . . . . . . . . . . . . . . . . . . . 490112.4 ICC World Twenty20. . . . . . . . . . . . . . . . . . . . . . . . . . . . . . . . . . . . . . . . 491112.5 Television Broadcasts. . . . . . . . . . . . . . . . . . . . . . . . . . . . . . . . . . . . . . . 491112.6 Market Resources. . . . . . . . . . . . . . . . . . . . . . . . . . . . . . . . . . . . . . . . . . 491
113 CYCLING. . . . . . . . . . . . . . . . . . . . . . . . . . . . . . . . . . . . . . . . . . . . . . . . . . . . . . 492113.1 Overview. . . . . . . . . . . . . . . . . . . . . . . . . . . . . . . . . . . . . . . . . . . . . . . . . 492113.2 USA Cycling. . . . . . . . . . . . . . . . . . . . . . . . . . . . . . . . . . . . . . . . . . . . . . 492113.3 Major U.S. Races. . . . . . . . . . . . . . . . . . . . . . . . . . . . . . . . . . . . . . . . . . 492113.4 Velodrome Bicycle Racing.. . . . . . . . . . . . . . . . . . . . . . . . . . . . . . . . . . . 494113.5 Tour de France. . . . . . . . . . . . . . . . . . . . . . . . . . . . . . . . . . . . . . . . . . . . 495113.6 Market Resources. . . . . . . . . . . . . . . . . . . . . . . . . . . . . . . . . . . . . . . . . . 496
114 DARTS. . . . . . . . . . . . . . . . . . . . . . . . . . . . . . . . . . . . . . . . . . . . . . . . . . . . . . . . 497114.1 Participation. . . . . . . . . . . . . . . . . . . . . . . . . . . . . . . . . . . . . . . . . . . . . . . 497114.2 Darts Championships On TV.. . . . . . . . . . . . . . . . . . . . . . . . . . . . . . . . . 497114.3 Market Resources. . . . . . . . . . . . . . . . . . . . . . . . . . . . . . . . . . . . . . . . . . 498
115 DOG SHOWS.. . . . . . . . . . . . . . . . . . . . . . . . . . . . . . . . . . . . . . . . . . . . . . . . . . 499115.1 Overview. . . . . . . . . . . . . . . . . . . . . . . . . . . . . . . . . . . . . . . . . . . . . . . . . 499115.2 Westminster Kennel Club Dog Show. . . . . . . . . . . . . . . . . . . . . . . . . . . 499115.3 National Dog Show. . . . . . . . . . . . . . . . . . . . . . . . . . . . . . . . . . . . . . . . . 499115.4 AKC/Eukanuba National Championship. . . . . . . . . . . . . . . . . . . . . . . . . 500115.5 Market Resources. . . . . . . . . . . . . . . . . . . . . . . . . . . . . . . . . . . . . . . . . . 500
116 DRONE RACING. . . . . . . . . . . . . . . . . . . . . . . . . . . . . . . . . . . . . . . . . . . . . . . . 501116.1 Overview. . . . . . . . . . . . . . . . . . . . . . . . . . . . . . . . . . . . . . . . . . . . . . . . . 501
SPORTS MARKETING 2020-2021
• 23 •

116.2 Drone Racing League. . . . . . . . . . . . . . . . . . . . . . . . . . . . . . . . . . . . . . . 501116.3 MultiGP. . . . . . . . . . . . . . . . . . . . . . . . . . . . . . . . . . . . . . . . . . . . . . . . . . 501116.4 Market Resources. . . . . . . . . . . . . . . . . . . . . . . . . . . . . . . . . . . . . . . . . . 501
117 EQUESTRIAN. . . . . . . . . . . . . . . . . . . . . . . . . . . . . . . . . . . . . . . . . . . . . . . . . . 502117.1 Overview. . . . . . . . . . . . . . . . . . . . . . . . . . . . . . . . . . . . . . . . . . . . . . . . . 502117.2 Horse Shows. . . . . . . . . . . . . . . . . . . . . . . . . . . . . . . . . . . . . . . . . . . . . . 502117.3 Polo. . . . . . . . . . . . . . . . . . . . . . . . . . . . . . . . . . . . . . . . . . . . . . . . . . . . . 503117.4 Rodeos. . . . . . . . . . . . . . . . . . . . . . . . . . . . . . . . . . . . . . . . . . . . . . . . . . 503117.5 World Equestrian Games. . . . . . . . . . . . . . . . . . . . . . . . . . . . . . . . . . . . 504117.6 Market Resources. . . . . . . . . . . . . . . . . . . . . . . . . . . . . . . . . . . . . . . . . . 504
118 EVENTS FOR ATHLETES WITH DISABILITIES.. . . . . . . . . . . . . . . . . . . . . . . 505118.1 Overview. . . . . . . . . . . . . . . . . . . . . . . . . . . . . . . . . . . . . . . . . . . . . . . . . 505118.2 Summer and Winter Paralympic Games. . . . . . . . . . . . . . . . . . . . . . . . . 505118.3 Special Olympics. . . . . . . . . . . . . . . . . . . . . . . . . . . . . . . . . . . . . . . . . . . 507118.4 Disabled Sports USA. . . . . . . . . . . . . . . . . . . . . . . . . . . . . . . . . . . . . . . . 507118.5 Market Resources. . . . . . . . . . . . . . . . . . . . . . . . . . . . . . . . . . . . . . . . . . 508
119 FIGURE SKATING. . . . . . . . . . . . . . . . . . . . . . . . . . . . . . . . . . . . . . . . . . . . . . . 509119.1 Overview. . . . . . . . . . . . . . . . . . . . . . . . . . . . . . . . . . . . . . . . . . . . . . . . . 509119.2 Sanctioning Organizations.. . . . . . . . . . . . . . . . . . . . . . . . . . . . . . . . . . . 509119.3 ISU Grand Prix of Figure Skating. . . . . . . . . . . . . . . . . . . . . . . . . . . . . . 510119.4 Skate America. . . . . . . . . . . . . . . . . . . . . . . . . . . . . . . . . . . . . . . . . . . . . 510119.5 Market Resources. . . . . . . . . . . . . . . . . . . . . . . . . . . . . . . . . . . . . . . . . . 511
120 FITNESS & STRENGTH COMPETITIONS. . . . . . . . . . . . . . . . . . . . . . . . . . . . 512120.1 Profiles of Major Events.. . . . . . . . . . . . . . . . . . . . . . . . . . . . . . . . . . . . . 512
121 GYMNASTICS. . . . . . . . . . . . . . . . . . . . . . . . . . . . . . . . . . . . . . . . . . . . . . . . . . 514121.1 Overview. . . . . . . . . . . . . . . . . . . . . . . . . . . . . . . . . . . . . . . . . . . . . . . . . 514121.2 Sanctioning Organizations.. . . . . . . . . . . . . . . . . . . . . . . . . . . . . . . . . . . 514121.3 Major Events. . . . . . . . . . . . . . . . . . . . . . . . . . . . . . . . . . . . . . . . . . . . . . 514121.4 Market Resources. . . . . . . . . . . . . . . . . . . . . . . . . . . . . . . . . . . . . . . . . . 515
122 HORSE RACING. . . . . . . . . . . . . . . . . . . . . . . . . . . . . . . . . . . . . . . . . . . . . . . . 516122.1 Overview. . . . . . . . . . . . . . . . . . . . . . . . . . . . . . . . . . . . . . . . . . . . . . . . . 516122.2 Top Races. . . . . . . . . . . . . . . . . . . . . . . . . . . . . . . . . . . . . . . . . . . . . . . . 516122.3 Triple Crown. . . . . . . . . . . . . . . . . . . . . . . . . . . . . . . . . . . . . . . . . . . . . . 516122.4 Breeders’ Cup. . . . . . . . . . . . . . . . . . . . . . . . . . . . . . . . . . . . . . . . . . . . . 517122.5 Saratoga. . . . . . . . . . . . . . . . . . . . . . . . . . . . . . . . . . . . . . . . . . . . . . . . . 517122.6 Pegasus World Cup. . . . . . . . . . . . . . . . . . . . . . . . . . . . . . . . . . . . . . . . 517122.7 Market Outlook. . . . . . . . . . . . . . . . . . . . . . . . . . . . . . . . . . . . . . . . . . . . 517122.8 Market Resources. . . . . . . . . . . . . . . . . . . . . . . . . . . . . . . . . . . . . . . . . . 518
SPORTS MARKETING 2020-2021
• 24 •

123 INTERNATIONAL CHAMPIONS CUP. . . . . . . . . . . . . . . . . . . . . . . . . . . . . . . . 519123.1 Overview. . . . . . . . . . . . . . . . . . . . . . . . . . . . . . . . . . . . . . . . . . . . . . . . . 519123.2 North American Tours. . . . . . . . . . . . . . . . . . . . . . . . . . . . . . . . . . . . . . . 519
124 LACROSSE. . . . . . . . . . . . . . . . . . . . . . . . . . . . . . . . . . . . . . . . . . . . . . . . . . . . 521124.1 Overview. . . . . . . . . . . . . . . . . . . . . . . . . . . . . . . . . . . . . . . . . . . . . . . . . 521124.2 Sanctioning Organization.. . . . . . . . . . . . . . . . . . . . . . . . . . . . . . . . . . . . 521124.3 Growth of Lacrosse in the United States. . . . . . . . . . . . . . . . . . . . . . . . . 521124.4 Major Events. . . . . . . . . . . . . . . . . . . . . . . . . . . . . . . . . . . . . . . . . . . . . . 522124.5 Market Resources. . . . . . . . . . . . . . . . . . . . . . . . . . . . . . . . . . . . . . . . . . 522
125 MARATHONS & ENDURANCE EVENTS. . . . . . . . . . . . . . . . . . . . . . . . . . . . . 523125.1 Participation. . . . . . . . . . . . . . . . . . . . . . . . . . . . . . . . . . . . . . . . . . . . . . . 523125.2 Major Events. . . . . . . . . . . . . . . . . . . . . . . . . . . . . . . . . . . . . . . . . . . . . . 523125.3 Economic Impact. . . . . . . . . . . . . . . . . . . . . . . . . . . . . . . . . . . . . . . . . . . 524125.4 Business Assessment. . . . . . . . . . . . . . . . . . . . . . . . . . . . . . . . . . . . . . . 524125.5 Sponsors. . . . . . . . . . . . . . . . . . . . . . . . . . . . . . . . . . . . . . . . . . . . . . . . . 525125.6 Market Resources. . . . . . . . . . . . . . . . . . . . . . . . . . . . . . . . . . . . . . . . . . 526
126 MOUNTAIN BIKE RACES. . . . . . . . . . . . . . . . . . . . . . . . . . . . . . . . . . . . . . . . . 527126.1 Overview. . . . . . . . . . . . . . . . . . . . . . . . . . . . . . . . . . . . . . . . . . . . . . . . . 527126.2 UCI Events. . . . . . . . . . . . . . . . . . . . . . . . . . . . . . . . . . . . . . . . . . . . . . . 527126.3 USA Cycling Mountain Bike National Championships. . . . . . . . . . . . . . . 527126.4 Sea Otter Classic.. . . . . . . . . . . . . . . . . . . . . . . . . . . . . . . . . . . . . . . . . . 528126.5 Market Resources. . . . . . . . . . . . . . . . . . . . . . . . . . . . . . . . . . . . . . . . . . 528
127 ROLLER DERBY. . . . . . . . . . . . . . . . . . . . . . . . . . . . . . . . . . . . . . . . . . . . . . . . 530127.1 Overview. . . . . . . . . . . . . . . . . . . . . . . . . . . . . . . . . . . . . . . . . . . . . . . . . 530127.2 Women’s Flat Track Derby Association.. . . . . . . . . . . . . . . . . . . . . . . . . 530127.3 Other Leagues.. . . . . . . . . . . . . . . . . . . . . . . . . . . . . . . . . . . . . . . . . . . . 530127.4 Market Resources. . . . . . . . . . . . . . . . . . . . . . . . . . . . . . . . . . . . . . . . . . 531
128 ROWING. . . . . . . . . . . . . . . . . . . . . . . . . . . . . . . . . . . . . . . . . . . . . . . . . . . . . . 532128.1 Overview. . . . . . . . . . . . . . . . . . . . . . . . . . . . . . . . . . . . . . . . . . . . . . . . . 532128.2 Intercollegiate Rowing. . . . . . . . . . . . . . . . . . . . . . . . . . . . . . . . . . . . . . . 532128.3 Rowing At The Summer Olympic Games. . . . . . . . . . . . . . . . . . . . . . . . 536128.4 The World Rowing Championships. . . . . . . . . . . . . . . . . . . . . . . . . . . . . 536128.5 Market Resources. . . . . . . . . . . . . . . . . . . . . . . . . . . . . . . . . . . . . . . . . . 536
129 RUGBY.. . . . . . . . . . . . . . . . . . . . . . . . . . . . . . . . . . . . . . . . . . . . . . . . . . . . . . . 537129.1 Overview. . . . . . . . . . . . . . . . . . . . . . . . . . . . . . . . . . . . . . . . . . . . . . . . . 537129.2 Growth In Popularity. . . . . . . . . . . . . . . . . . . . . . . . . . . . . . . . . . . . . . . . 537129.3 Major League Rugby. . . . . . . . . . . . . . . . . . . . . . . . . . . . . . . . . . . . . . . . 538129.4 USA Rugby League. . . . . . . . . . . . . . . . . . . . . . . . . . . . . . . . . . . . . . . . . 538
SPORTS MARKETING 2020-2021
• 25 •

129.5 USA Rugby Series.. . . . . . . . . . . . . . . . . . . . . . . . . . . . . . . . . . . . . . . . . 539129.6 Rugby in the Summer Olympic Games. . . . . . . . . . . . . . . . . . . . . . . . . . 539129.7 Six Nations Championship. . . . . . . . . . . . . . . . . . . . . . . . . . . . . . . . . . . 539129.8 Rugby World Cup. . . . . . . . . . . . . . . . . . . . . . . . . . . . . . . . . . . . . . . . . . 540129.9 Market Resources. . . . . . . . . . . . . . . . . . . . . . . . . . . . . . . . . . . . . . . . . . 540
130 SENIOR GAMES. . . . . . . . . . . . . . . . . . . . . . . . . . . . . . . . . . . . . . . . . . . . . . . . 541130.1 Overview. . . . . . . . . . . . . . . . . . . . . . . . . . . . . . . . . . . . . . . . . . . . . . . . . 541130.2 State Games. . . . . . . . . . . . . . . . . . . . . . . . . . . . . . . . . . . . . . . . . . . . . . 541130.3 Biennial Summer Games.. . . . . . . . . . . . . . . . . . . . . . . . . . . . . . . . . . . . 545130.4 Winter Senior Games. . . . . . . . . . . . . . . . . . . . . . . . . . . . . . . . . . . . . . . 545130.5 Sponsors. . . . . . . . . . . . . . . . . . . . . . . . . . . . . . . . . . . . . . . . . . . . . . . . . 546130.6 Market Resources. . . . . . . . . . . . . . . . . . . . . . . . . . . . . . . . . . . . . . . . . . 546
131 SKIING & SNOWBOARDING. . . . . . . . . . . . . . . . . . . . . . . . . . . . . . . . . . . . . . 547131.1 Overview. . . . . . . . . . . . . . . . . . . . . . . . . . . . . . . . . . . . . . . . . . . . . . . . . 547131.2 Participation. . . . . . . . . . . . . . . . . . . . . . . . . . . . . . . . . . . . . . . . . . . . . . . 547131.3 Governing Organizations. . . . . . . . . . . . . . . . . . . . . . . . . . . . . . . . . . . . . 548131.4 Winter Olympic Events. . . . . . . . . . . . . . . . . . . . . . . . . . . . . . . . . . . . . . 548131.5 FIS World Championships.. . . . . . . . . . . . . . . . . . . . . . . . . . . . . . . . . . . 548131.6 USSA Grand Prix Series. . . . . . . . . . . . . . . . . . . . . . . . . . . . . . . . . . . . . 549131.7 Market Resources. . . . . . . . . . . . . . . . . . . . . . . . . . . . . . . . . . . . . . . . . . 549
132 SOCCER. . . . . . . . . . . . . . . . . . . . . . . . . . . . . . . . . . . . . . . . . . . . . . . . . . . . . . 550132.1 Overview. . . . . . . . . . . . . . . . . . . . . . . . . . . . . . . . . . . . . . . . . . . . . . . . . 550132.2 Growth of Soccer in the United States. . . . . . . . . . . . . . . . . . . . . . . . . . 550132.3 Sponsors. . . . . . . . . . . . . . . . . . . . . . . . . . . . . . . . . . . . . . . . . . . . . . . . . 551132.4 Market Resources. . . . . . . . . . . . . . . . . . . . . . . . . . . . . . . . . . . . . . . . . . 551
133 SOFTBALL.. . . . . . . . . . . . . . . . . . . . . . . . . . . . . . . . . . . . . . . . . . . . . . . . . . . . 552133.1 Overview. . . . . . . . . . . . . . . . . . . . . . . . . . . . . . . . . . . . . . . . . . . . . . . . . 552133.2 Amateur Softball Association.. . . . . . . . . . . . . . . . . . . . . . . . . . . . . . . . . 552133.3 Market Resources. . . . . . . . . . . . . . . . . . . . . . . . . . . . . . . . . . . . . . . . . . 552
134 SPORT CLIMBING.. . . . . . . . . . . . . . . . . . . . . . . . . . . . . . . . . . . . . . . . . . . . . . 554134.1 Overview. . . . . . . . . . . . . . . . . . . . . . . . . . . . . . . . . . . . . . . . . . . . . . . . . 554134.2 Participation. . . . . . . . . . . . . . . . . . . . . . . . . . . . . . . . . . . . . . . . . . . . . . . 554134.3 USA Climbing. . . . . . . . . . . . . . . . . . . . . . . . . . . . . . . . . . . . . . . . . . . . . 554134.4 International Federation of Sport Climbing. . . . . . . . . . . . . . . . . . . . . . . 555134.5 Market Resources. . . . . . . . . . . . . . . . . . . . . . . . . . . . . . . . . . . . . . . . . . 556
135 STATE GAMES. . . . . . . . . . . . . . . . . . . . . . . . . . . . . . . . . . . . . . . . . . . . . . . . . 557135.1 Overview. . . . . . . . . . . . . . . . . . . . . . . . . . . . . . . . . . . . . . . . . . . . . . . . . 557135.2 Profiles of State Games.. . . . . . . . . . . . . . . . . . . . . . . . . . . . . . . . . . . . . 557
SPORTS MARKETING 2020-2021
• 26 •

135.3 State Games Of America.. . . . . . . . . . . . . . . . . . . . . . . . . . . . . . . . . . . . 560135.4 Market Resources. . . . . . . . . . . . . . . . . . . . . . . . . . . . . . . . . . . . . . . . . . 560
136 SURFING. . . . . . . . . . . . . . . . . . . . . . . . . . . . . . . . . . . . . . . . . . . . . . . . . . . . . . 561136.1 Participation. . . . . . . . . . . . . . . . . . . . . . . . . . . . . . . . . . . . . . . . . . . . . . . 561136.2 World Surf League. . . . . . . . . . . . . . . . . . . . . . . . . . . . . . . . . . . . . . . . . 561136.3 Championship Tour. . . . . . . . . . . . . . . . . . . . . . . . . . . . . . . . . . . . . . . . . 561136.4 Market Resources. . . . . . . . . . . . . . . . . . . . . . . . . . . . . . . . . . . . . . . . . . 562
137 SWIMMING, DIVING & WATER POLO. . . . . . . . . . . . . . . . . . . . . . . . . . . . . . . 563137.1 Overview. . . . . . . . . . . . . . . . . . . . . . . . . . . . . . . . . . . . . . . . . . . . . . . . . 563137.2 Sanctioning Organizations.. . . . . . . . . . . . . . . . . . . . . . . . . . . . . . . . . . . 563137.3 Sponsors. . . . . . . . . . . . . . . . . . . . . . . . . . . . . . . . . . . . . . . . . . . . . . . . . 564137.4 International Swimming League. . . . . . . . . . . . . . . . . . . . . . . . . . . . . . . 565137.5 Market Resources. . . . . . . . . . . . . . . . . . . . . . . . . . . . . . . . . . . . . . . . . . 565
138 TRACK & FIELD. . . . . . . . . . . . . . . . . . . . . . . . . . . . . . . . . . . . . . . . . . . . . . . . 566138.1 Overview. . . . . . . . . . . . . . . . . . . . . . . . . . . . . . . . . . . . . . . . . . . . . . . . . 566138.2 Sanctioning Organization.. . . . . . . . . . . . . . . . . . . . . . . . . . . . . . . . . . . . 566138.3 Major Events. . . . . . . . . . . . . . . . . . . . . . . . . . . . . . . . . . . . . . . . . . . . . . 566138.4 IAAF Diamond League. . . . . . . . . . . . . . . . . . . . . . . . . . . . . . . . . . . . . . 568138.5 TrackTown USA. . . . . . . . . . . . . . . . . . . . . . . . . . . . . . . . . . . . . . . . . . . 568138.6 Market Resources. . . . . . . . . . . . . . . . . . . . . . . . . . . . . . . . . . . . . . . . . . 568
139 TRIATHLONS.. . . . . . . . . . . . . . . . . . . . . . . . . . . . . . . . . . . . . . . . . . . . . . . . . . 569139.1 Overview. . . . . . . . . . . . . . . . . . . . . . . . . . . . . . . . . . . . . . . . . . . . . . . . . 569139.2 Demographics. . . . . . . . . . . . . . . . . . . . . . . . . . . . . . . . . . . . . . . . . . . . . 569139.3 Major Events. . . . . . . . . . . . . . . . . . . . . . . . . . . . . . . . . . . . . . . . . . . . . . 570139.4 Market Resources. . . . . . . . . . . . . . . . . . . . . . . . . . . . . . . . . . . . . . . . . . 571
140 ULTIMATE. . . . . . . . . . . . . . . . . . . . . . . . . . . . . . . . . . . . . . . . . . . . . . . . . . . . . 572140.1 Participation. . . . . . . . . . . . . . . . . . . . . . . . . . . . . . . . . . . . . . . . . . . . . . . 572140.2 USA Ultimate. . . . . . . . . . . . . . . . . . . . . . . . . . . . . . . . . . . . . . . . . . . . . . 572140.3 Collegiate Teams.. . . . . . . . . . . . . . . . . . . . . . . . . . . . . . . . . . . . . . . . . . 573140.4 Market Resources. . . . . . . . . . . . . . . . . . . . . . . . . . . . . . . . . . . . . . . . . . 573
141 VOLLEYBALL. . . . . . . . . . . . . . . . . . . . . . . . . . . . . . . . . . . . . . . . . . . . . . . . . . 574141.1 Overview. . . . . . . . . . . . . . . . . . . . . . . . . . . . . . . . . . . . . . . . . . . . . . . . . 574141.2 Sanctioning Organization.. . . . . . . . . . . . . . . . . . . . . . . . . . . . . . . . . . . . 574141.3 AVP Pro Beach Volleyball. . . . . . . . . . . . . . . . . . . . . . . . . . . . . . . . . . . . 575141.4 P1440 Series. . . . . . . . . . . . . . . . . . . . . . . . . . . . . . . . . . . . . . . . . . . . . . 575141.5 Market Resources. . . . . . . . . . . . . . . . . . . . . . . . . . . . . . . . . . . . . . . . . . 575
SPORTS MARKETING 2020-2021
• 27 •

142 X GAMES. . . . . . . . . . . . . . . . . . . . . . . . . . . . . . . . . . . . . . . . . . . . . . . . . . . . . . 577142.1 Overview. . . . . . . . . . . . . . . . . . . . . . . . . . . . . . . . . . . . . . . . . . . . . . . . . 577142.2 Summer X Games. . . . . . . . . . . . . . . . . . . . . . . . . . . . . . . . . . . . . . . . . . 577142.3 Winter X Games. . . . . . . . . . . . . . . . . . . . . . . . . . . . . . . . . . . . . . . . . . . 578142.4 Television Viewership. . . . . . . . . . . . . . . . . . . . . . . . . . . . . . . . . . . . . . . 578142.5 Digital Media. . . . . . . . . . . . . . . . . . . . . . . . . . . . . . . . . . . . . . . . . . . . . . 578142.6 Sponsors. . . . . . . . . . . . . . . . . . . . . . . . . . . . . . . . . . . . . . . . . . . . . . . . . 579
APPENDIX A - ACADEMIC CENTERS. . . . . . . . . . . . . . . . . . . . . . . . . . . . . . . . . . . 580
APPENDIX B - ANALYSTS. . . . . . . . . . . . . . . . . . . . . . . . . . . . . . . . . . . . . . . . . . . . 582
APPENDIX C - ASSOCIATIONS. . . . . . . . . . . . . . . . . . . . . . . . . . . . . . . . . . . . . . . . 584
APPENDIX D - COLLEGE DEGREE PROGRAMS IN SPORTS BUSINESS. . . . . . 585
APPENDIX E - PERIODICALS. . . . . . . . . . . . . . . . . . . . . . . . . . . . . . . . . . . . . . . . . 594
APPENDIX F - SPORTS COMMISSIONS. . . . . . . . . . . . . . . . . . . . . . . . . . . . . . . . . 595
REFERENCES. . . . . . . . . . . . . . . . . . . . . . . . . . . . . . . . . . . . . . . . . . . . . . . . . . . . . . 601
SPORTS MARKETING 2020-2021
• 28 •

PART I: THE U.S. SPORTS MARKET
SPORTS MARKETING 2020-2021
• 29 •

1
MARKET SUMMARY
1.1 Annual RevenueRichard K. Miller & Associates (RKMA, www.rkma.com) estimates annual
revenue of the entire U.S. sports industry at $431.5 billion. Major components of thisspending are as follows:• Sports advertising and marketing (see Chapter 7): $60.0 billion• Sporting goods (see Chapter 16): $50.0 billion• Professional sports (see Chapter 3): $39.5 billion• Sports travel (see Chapter 18): $38.0 billion• Fitness and health clubs (see Chapter 11): $32.4 billion• Event admission tickets (see Chapter 19): $30.0 billion• Golf (see Chapter 81): $24.4 billion• Media rights (see 1.2): $19.9 billion• Gate revenue (see 1.2): $19.8 billion• Tennis (see Chapter 94): $16.0 billion• Concessions (see Chapter 9): $15.0 billion• Licensed merchandise (see Chapter 13): $14.4 billion• Athlete income (see Chapter 4): $13.3 billion• Horse racing (see Chapter 121): $11.3 billion• NCAA sports (see Chapter 72): $10.5 billion• Motorsports (see Part XI): $10.0 billion• Sports books - legal betting only (see Chapter 15): $ 5.1 billion• Stadium and arena construction (see Chapter 22): $ 4.9 billion• Agents and agencies (see Chapter 8): $ 4.0 billion• Memorabilia (see Chapter 14): $ 4.0 billion• Sports online (see Chapter 26): $ 3.0 billion• Sports periodicals (see Chapter 24): $ 2.2 billion• Fantasy sports (see Chapter 10): $ 1.7 billion• Marathons and endurance events (see Chapter 124): $ 1.4 billion• Esports (see Chapter 99): $ 0.4 billion
1.2 Professional and Collegiate SportsOutlook For The Sports Market In North America Through 2020, by
PricewaterhouseCoopers (PwC, www.pwc.com), assesses the market for professional and collegiate sports as follows:
SPORTS MARKETING 2020-2021
• 30 •

Licensed Gate Revenue Media Rights Sponsorship Merchandise Total
• 2010: $16.18 billion $ 9.42 billion $11.82 billion $12.57 billion $49.99 billion• 2011: $16.12 billion $10.86 billion $12.62 billion $12.48 billion $52.07 billion• 2012: $15.82 billion $11.74 billion $13.26 billion $12.77 billion $53.59 billion• 2013: $17.37 billion $12.26 billion $13.90 billion $13.14 billion $56.68 billion• 2014: $17.71 billion $14.59 billion $14.69 billion $13.49 billion $60.48 billion• 2015: $18.26 billion $16.30 billion $15.48 billion $13.81 billion $63.86 billion• 2016: $18.72 billion $18.22 billion $16.30 billion $13.97 billion $67.21 billion• 2017: $19.37 billion $18.88 billion $16.93 billion $14.20 billion $69.38 billion• 2018: $19.79 billion $19.87 billion $17.54 billion $14.42 billion $71.62 billion• 2019: $20.32 billion $20.53 billion $18.13 billion $14.62 billion $73.60 billion• 2020: $20.82 billion $21.29 billion $18.74 billion $14.82 billion $75.67 billion
1.3 Economic ImpactThe following are estimates of economic impacts of select professional sports
events:• The National Football League (www.nfl.com) claims an economic impact from the
Super Bowl of around $400 million; direct spending by attending fans is estimated at$150 million or more.
• Major League Baseball (www.mlb.com) attaches a $75 million benefit to the All-StarGame and up to $250 million for the World Series.
• The NBA All-Star Game brings an estimated $35 million to $50 million in directspending, depending on the host city.
• The US Open, with an annual attendance of about 700,000, has an economicimpact of $750 million, according to a study conducted by AKRF Inc.(www.akrf.com) for the United States Tennis Association (USTA, www.usta.com).
• The Indianapolis 500 race, 500 Festival, and associated weekend events have aneconomic impact on the city of Indianapolis of approximately $340 million.
• NASCAR’s Daytona 500 and Brickyard 400 have an estimated local economicimpact of $240 million and $220 million, respectively.
• The TCS New York City Marathon (www.nycmarathon.org) has an estimated $250million economic impact; the Honolulu Marathon (www.honolulumarathon.org) andBoston Marathon (www.bostonmarathon.org) each have an economic impactestimated at approximately $100 million.
SPORTS MARKETING 2020-2021
• 31 •

2
SPORTS FANS
2.1 Profile of Sports FansThe Center for the Digital Future (www.digitalcenter.org), University of Southern
California, Annenberg School for Communication, reported that 86% of Americansconsider themselves sports fans. The following are findings of the study:Profile• Ninety-two percent (92%) of men and 80% of women consider themselves sports
fans.• Eighty-eight percent (88%) of sports fans follow more than one sport; 89% follow
more than one team.• Twenty-four percent (24%) say they are “intense” sports fans.• The demographic profile of the most intense sports fans is as follows:
- Gender: Male- Age: 35-to-54- Marital status: Married- Ethnicity: African-American- Income: $75,000-$100,000 per year- Education: College degree
• Even among the 14% of people who are not sports fans, most follow sports to someextent; one-third say they follow more than one team.
Sports Media Consumption• In general, very few people feel they can get all the sports content they want from
free sources. More than 90% of sports fans are willing to pay for sportsprogramming.
• Fifty-nine percent (59%) of sports fans want sports as part of their basic pay-TVpackage or bundle; 28% want it as an option.
• Sports fans say they will pay more for sports streaming than for sports content viacable or satellite television.
• Those ages 25-to-34 are willing to pay the most for sports programming.• Women are more willing to pay for sports programming than men. For all major
sports except baseball, women say they will pay up to 50% more.• Twenty-nine percent (29%) of 25-to-34 year olds say they would watch a sporting
event streamed live from a mobile phone.
SPORTS MARKETING 2020-2021
• 32 •

2.2 Demographic Profile Of U.S. Sports FansFifty-five percent (55%) of U.S. adults say they are sports fans, according to a
survey by the Marist College Institute for Public Opinion (www.maristpoll.marist.edu). The following is a demographic profile (percentage of respondents who say they arefans):Gender• Male: 65%• Female: 46%
Age• 18-to-29: 49%• 30-to-44: 53%• 45-to-59: 62%• 60 and older: 54%
Income• Less than $50,000: 49%• More than $50,000: 62%
Region• Northeast: 56%• Midwest: 56%• South: 60%• West: 47%
Education• Not college graduate: 56%• College graduate: 54%
2.3 Fan SpendingThe Sports Fan and Engagement Study, by Simmons Research
(www.simmonsresearch.com), reported fan spending* as follows:• Pro soccer: $707• PGA Tour: $646• NASCAR: $644• NHL: $641• NBA: $594• College sports: $589• MLB: $558• NFL: $534* among consumers who spent money on each sport
SPORTS MARKETING 2020-2021
• 33 •

Spending components include game tickets, concession spending at events, TV packages, apparel, and memorabilia.
2.4 Favorite SportsAccording to a recent Harris Poll (www.theharrispoll.com), favorite sports among
adults (age 18 and older) are as follows:• Pro football: 32%• Baseball: 16%• Men’s college football: 10%• Auto racing: 7%• Men’s pro basketball: 6%• Men’s soccer: 6%• Ice hockey: 6%• Men’s college basketball: 3%• Boxing: 2%• Men’s golf: 2%• Track & field: 2%• Women’s tennis: 2%• Bowling: 1%• Horse racing: 1%• Men’s tennis: 1%• Swimming: 1%• Women’s soccer: 1%
2.5 Avid FansAccording to an ESPN Sports Poll, these percentages of adults say they are fans
or avid followers* of the following sports leagues:Fan Avid Fan
• National Football League (NFL): 66% 32%• NCAA Football: 58% 23%• Major League Baseball (MLB): 57% 19%• NCAA Basketball: 48% 16%• National Basketball Association (NBA): 48% 16%• Extreme/action sports: 46% 11%• Figure skating: 45% 10%• Boxing: 37% 10%• Mixed martial arts: 36% 14%• NASCAR: 36% 11%• National Hockey League (NHL): 35% 8%• PGA Tour (golf): 33% 8%• Horse racing: 30% 5%
SPORTS MARKETING 2020-2021
• 34 •
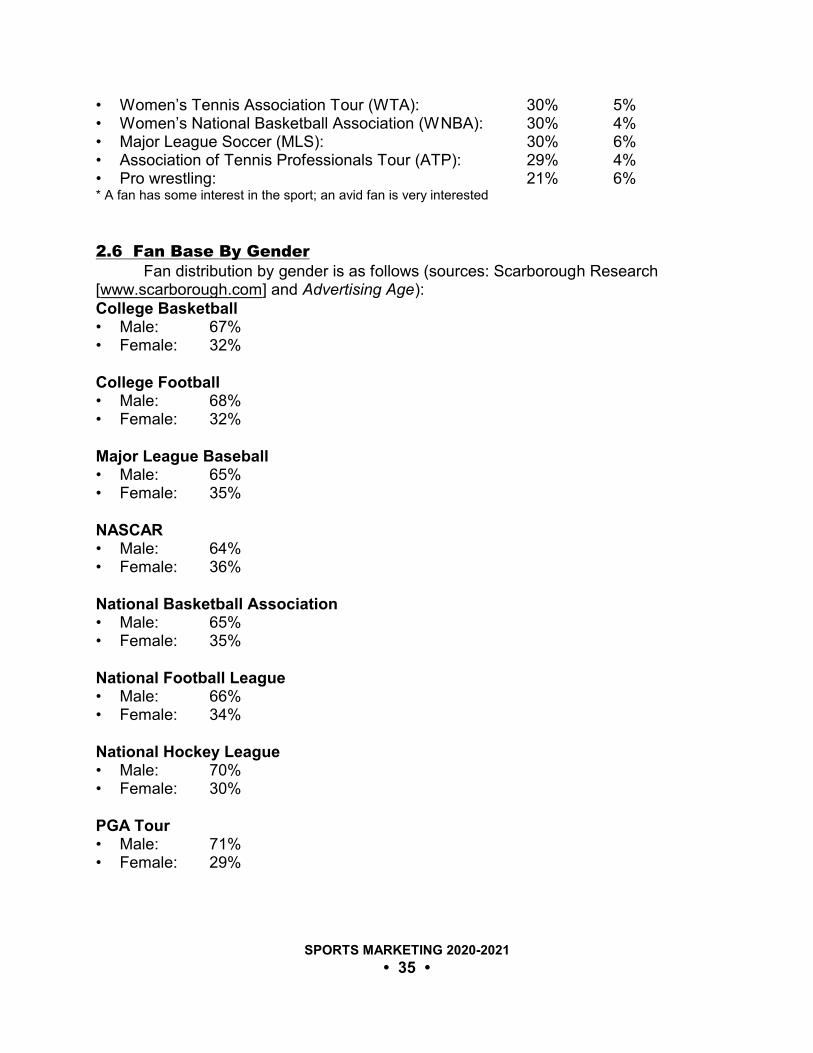
• Women’s Tennis Association Tour (WTA): 30% 5%• Women’s National Basketball Association (WNBA): 30% 4%• Major League Soccer (MLS): 30% 6%• Association of Tennis Professionals Tour (ATP): 29% 4%• Pro wrestling: 21% 6%* A fan has some interest in the sport; an avid fan is very interested
2.6 Fan Base By GenderFan distribution by gender is as follows (sources: Scarborough Research
[www.scarborough.com] and Advertising Age):College Basketball• Male: 67%• Female: 32%
College Football• Male: 68%• Female: 32%
Major League Baseball• Male: 65%• Female: 35%
NASCAR• Male: 64%• Female: 36%
National Basketball Association• Male: 65%• Female: 35%
National Football League• Male: 66%• Female: 34%
National Hockey League• Male: 70%• Female: 30%
PGA Tour• Male: 71%• Female: 29%
SPORTS MARKETING 2020-2021
• 35 •

2.7 Female FansSurveys have found that roughly 50 million women avidly follow sports.
According to Scarborough Sports Marketing and SportsBusiness Journal, thepercentages of women (ages 18 and older) who are fans or avid fans of various sportsare as follows:
Fan Avid Fan
• Olympic Games: 60% 24%• NFL: 49% 15%• MLB: 43% 10%• College football: 32% 9%• NBA: 31% 6%• College basketball: 26% 7%• NASCAR: 24% 8%• Horse racing: 22% 3%• PGA Tour: 21% 4%• Pro rodeo: 17% 3%• NHL: 16% 2%• Pro bull riding: 16% 3%• Minor league baseball: 16% 2%• WNBA: 15% 2%• IndyCar Series racing: 14% 2%• LPGA Tour: 13% 2%• Monster trucks: 11% 2%• MLS: 11% 2%• PBA bowling: 10% 1%
2.8 Fan Base By AgeFan distribution by age is as follows (sources: Scarborough Sports Marketing
and Advertising Age):College Basketball• 18-to-29: 19%• 30-to-49: 35%• 50-to-69: 34%• 70 and older: 13%
College Football• 18-to-29: 19%• 30-to-49: 36%• 50-to-69: 33%• 70 and older: 12%
SPORTS MARKETING 2020-2021
• 36 •
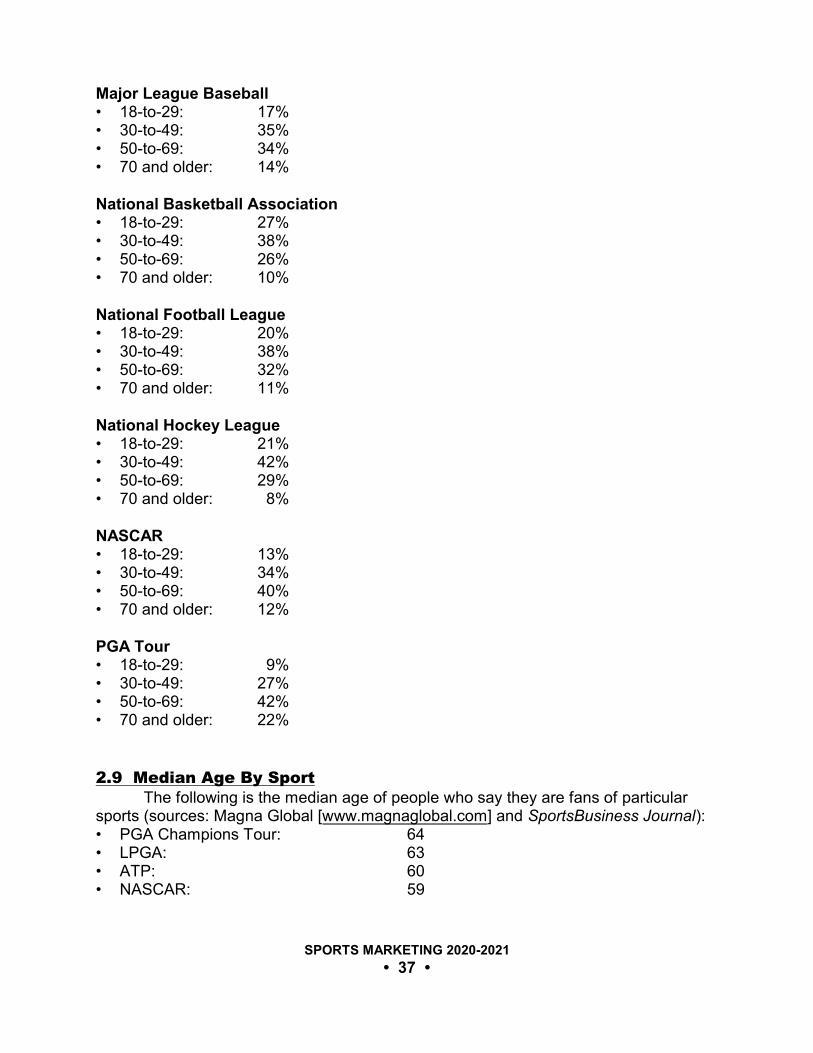
Major League Baseball• 18-to-29: 17%• 30-to-49: 35%• 50-to-69: 34%• 70 and older: 14%
National Basketball Association• 18-to-29: 27%• 30-to-49: 38%• 50-to-69: 26%• 70 and older: 10%
National Football League• 18-to-29: 20%• 30-to-49: 38%• 50-to-69: 32%• 70 and older: 11%
National Hockey League• 18-to-29: 21%• 30-to-49: 42%• 50-to-69: 29%• 70 and older: 8%
NASCAR• 18-to-29: 13%• 30-to-49: 34%• 50-to-69: 40%• 70 and older: 12%
PGA Tour• 18-to-29: 9%• 30-to-49: 27%• 50-to-69: 42%• 70 and older: 22%
2.9 Median Age By SportThe following is the median age of people who say they are fans of particular
sports (sources: Magna Global [www.magnaglobal.com] and SportsBusiness Journal):• PGA Champions Tour: 64• LPGA: 63• ATP: 60• NASCAR: 59
SPORTS MARKETING 2020-2021
• 37 •

• MLB: 56• College football: 52• NFL: 50• NHL: 48• English Premier League (EPL): 42• NBA: 41• MLS: 40
2.10 Median Household Income By SportThe following is the median household income of people who say they are fans
of particular sports (sources: Magna Global and SportsBusiness Journal):• English Premier League (EPL): $81,800• NHL: $78,800• LPGA: $72,500• PGA Champions Tour: $71,200• College football: $68,700• NFL: $68,400• MLB: $62,800• ATP: $62,300• MLS: $61,600• NBA: $57,600• NASCAR: $49,700
2.11 Youth FansThe following percentages of children ages 7-to-11 responded in an ESPN
Sports Poll saying they are fans of the following sports:• NBA: 77%• NFL: 69%• MLB: 69%• College basketball: 68%• Action sports: 68%• MLS: 62%• College sports: 60%• NASCAR: 57%• NHL: 50%
2.12 Fan Base By EthnicityFan distribution by ethnicity is as follows (source: ESPN Sports Poll):
SPORTS MARKETING 2020-2021
• 38 •

College Basketball• Caucasian: 73%• African-American: 13%• Hispanic-American: 9%• Other: 5%
College Football• Caucasian: 75%• African-American: 11%• Hispanic-American: 9%• Other: 5%
Major League Baseball• Caucasian: 74%• Hispanic-American: 12%• African-American: 5%• Other: 9%
Major League Soccer• Caucasian: 61%• Hispanic-American: 23%• African-American: 9%• Other: 7%
NASCAR• Caucasian: 77%• African-American: 9%• Hispanic-American: 9%• Other: 5%
National Basketball Association• Caucasian: 65%• African-American: 15%• Hispanic-American: 14%• Other: 6%
National Football League• Caucasian: 73%• African-American: 11%• Hispanic-American: 11%• Other: 5%
SPORTS MARKETING 2020-2021
• 39 •

2.13 African-American FansAccording to an ESPN Sports Poll, the following percentages of African-
American adults said they are fans or avid followers of these sports leagues: Fan Avid Fan
• National Football League: 75% 43%• National Basketball Association: 74% 39%• NCAA Basketball: 66% 25%• NCAA Football: 65% 27%• Boxing: 59% 25%• Women’s National Basketball Association: 55% 15%• Extreme/action sports: 54% 18%• Major League Baseball: 53% 15%• Women’s Tennis Association Tour: 53% 14%• Mixed martial arts: 52% 22%• Figure skating: 45% 12%• Association of Tennis Professionals Tour: 40% 8%• Pro wrestling: 39% 15%• PGA Tour (golf): 33% 7%• Major League Soccer: 32% 7%• NASCAR: 30% 6%• Horse racing: 28% 5%• National Hockey League: 27% 4%
2.14 Hispanic-American FansAccording to ESPN Deportes and SportsBusiness Journal, the percentages of
Hispanic-Americans that are fans of various sports compared with all U.S. adults are asfollows:
Hispanic- Americans All Adults
• Boxing: 62% 33%• World Cup Soccer: 61% n/a• MLB: 59% 58%• NBA: 56% 50%• Mexican Soccer League: 56% n/a• NFL: 50% 69%• Action sports: 48% 45%• NASCAR: 40% 43%• NHL: 24% 28%• PGA Tour: 22% 36%
SPORTS MARKETING 2020-2021
• 40 •

3
PROFESSIONAL SPORTS
3.1 Professional League RevenueRevenue for the four major professional sports leagues is $39.5 billion,
distributed as follows:• National Football League (2018-2019 season): $16.0 billion• Major League Baseball (2018 season): $10.3 billion• National Basketball Association (2017-2018 season): $ 8.0 billion• National Hockey League (2017-2018 season): $ 4.9 billion
According to SportsBusiness Journal, minor league sports collectively generate$1.6 billion annually. Operating expenses are $600 million, giving an operating incomeof approximately $1 billion.
3.2 Sports TeamsForbes annually assesses the world’s 50 most valuable sports teams. The
2019 list was as follows (change from previous year in parenthesis): • Dallas Cowboys (NFL): $5.00 billion (4%)• New York Yankees (MLB): $4.60 billion (15%)• Real Madrid (Spain; La Liga): $4.24 billion (4%)• FC Barcelona (Spain; La Liga): $4.02 billion (-1%)• New York Knicks (NBA): $4.00 billion (11%)• Manchester United (England; EPL): $3.81 billion (-8%)• New England Patriots (NFL): $3.80 billion (3%)• Los Angeles Lakers (NBA): $3.70 billion (12%)• Golden State Warriors (NBA): $3.50 billion (13%)• New York Giants (NFL): $3.30 billion (no change)• Los Angeles Dodgers (MLB): $3.30 billion (10%)• Boston Red Sox (MLB): $3.20 billion (14%)• Los Angeles Rams (NFL): $3.20 billion (7%)• Washington Redskins (NFL): $3.10 billion (no change)• Chicago Cubs (MLB): $3.10 billion (7%)• San Francisco 49ers (NFL): $3.05 billion (no change)• Bayern Munich (Germany; Bundesliga): $3.02 billion (-1%)• San Francisco Giants (MLB): $3.00 billion (5%)
SPORTS MARKETING 2020-2021
• 41 •

• Chicago Bears (NFL): $2.90 billion (2%)• Chicago Bulls (NBA): $2.90 billion (12%)• New York Jets (NFL): $2.85 billion (4%)• Houston Texans (NFL): $2.80 billion (no change)• Boston Celtics (NBA): $2.80 billion (12%)• Philadelphia Eagles (NFL): $2.75 billion (4%)• England Manchester City (EPL): $2.69 billion (9%)• Denver Broncos (NFL): $2.65 billion (2%)• Green Bay Packers (NFL): $2.63 billion (3%)• Atlanta Falcons (NFL): $2.60 billion (5%)• Baltimore Ravens (NFL): $2.59 billion (4%)• Pittsburgh Steelers (NFL): $2.58 billion (5%)• Seattle Seahawks (NFL): $2.58 billion (6%)• England Chelsea (EPL): $2.58 billion (25%)• Miami Dolphins (NFL): $2.58 billion (no change)• Oakland Raiders (NFL): $2.42 billion (2%)• Minnesota Vikings (NFL): $2.40 billion (no change)• Indianapolis Colts (NFL): $2.38 billion (no change)• Brooklyn Nets (NBA): $2.35 billion (2%)• Houston Rockets (NBA): $2.30 billion (5%)• Carolina Panthers (NFL): $2.30 billion (no change)• New York Mets (MLB): $2.30 billion (10%)• Los Angeles Chargers (NFL): $2.28 billion (no change)• Arsenal (England; EPL): $2.27 billion (1%)• Dallas Mavericks (NBA): $2.22 billion (18%)• Los Angeles Clippers (NBA): $2.20 billion (2%)• Liverpool (England; EPL): $2.18 billion (12%)• Arizona Cardinals (NFL): $2.15 billion (no change)• Kansas City Chiefs (NFL): $2.10 billion (no change)• St. Louis Cardinals (MLB): $2.10 billion (11%)• Jacksonville Jaguars (NFL): $2.08 billion (no change)• New Orleans Saints (NFL): $2.08 billion (4%)
3.3 Franchise SalesThe highest professional sports franchise sales have been as follows:
Team Price (Year)
• Carolina Panthers (NFL): $2.30 billion (2018)• Houston Rockets (NBA): $2.20 billion (2017)• Los Angeles Dodgers (MLB): $2.15 billion (2012)• Los Angeles Clippers (NBA): $2.00 billion (2014)• Buffalo Bills (NFL): $1.40 billion (2014)• Cleveland Browns (NFL): $1.40 billion* (2002)• Miami Marlins (NFL): $1.30 billion (2018)
SPORTS MARKETING 2020-2021
• 42 •

• Toronto Maple Leafs (NHL): $1.30 billion** (2012)• Miami Dolphins (NFL): $1.10 billion* (2008)• Jacksonville Jaguars (NFL): $ 760 million (2012)• Houston Astros (MLB): $ 675 million (2011)• Montreal Canadiens (NHL): $ 575 million** (2009)• Milwaukee Bucks (NBA): $ 550 million (2014)• Carolina Hurricanes (NHL): $ 500 million* (2018)* Valuation based on sale of partial ownership** Price includes other assets (i.e., media business or venue)
3.4 ExpansionThe addition of a NHL team in Las Vegas for the 2017-2018 is the first
expansion among the four major sports league since 2004. The expansion fee for thenew franchise is $500 million.
There have been six prior expansions among the four major leagues since 1998,as follows:
Team Expansion Fee
• 2004: Charlotte Bobcats (NBA) $300 million• 2002: Houston Texans (NFL) $700 million• 2000: Columbus Blue Jackets (NHL) $ 80 million• 2000: Minnesota Wild (NHL) $ 80 million• 1998: Arizona Diamond Backs (MLB) $130 million• 1998: Tampa Bay Devil Rays (MLB) $130 million
Major League Soccer has an ongoing expansion program. Recent andupcoming expansions are as follows:
Team Expansion Fee
• 2015: New York City FC $100 million• 2015: Orlando City FC $ 70 million• 2017: Atlanta $ 70 million• 2017: Minnesota $100 million• 2018: Los Angeles FC $110 million
3.5 RelocationSince 1966, there have been 33 franchise relocations across the four major
North American pro sports leagues, including two by teams that wound up back in thecity they came from. In all, five franchises have moved more than once in the past 50years.
Within the past decade, the NBA and NFL have implemented relocation fees forteam relocation.
SPORTS MARKETING 2020-2021
• 43 •

_________________________________________________________________
“The logic behind relocation fees is twofold: it’sused as a way of discouraging teams frommoving unnecessarily, and also so the league’sother owners can get compensated for theincreased value in the franchise post-move.”
USA Today _________________________________________________________________
In the NBA, the Board of Governors, comprised of one person (typically theowner) from each of the 30 NBA franchises, votes on relocation applications. Amajority vote of owners is needed to approve the relocation. If approved, the Board ofGovernors has the right to attach a relocation fee; there is no standard fee. The NFLhas a similar process.
When Seattle’s NBA franchise moved to Oklahoma City in 2008, there was a$30 million relocation fee.
In 2018, the NFL Chargers paid a $645 million relocation fee for the right tomove to Los Angeles from San Diego. The Rams also paid $645 to move to LosAngeles from St. Louis.
SPORTS MARKETING 2020-2021
• 44 •

4
ATHLETES
4.1 Most Popular AthletesESPN assesses the most popular athletes annually with its World Fame 100 list.
The ranking is based on three metrics to determine popularity: number of Internetsearches, value of endorsements, and number of social media followers.
The most popular athletes in 2018 were as follows:1. Cristiano Ronaldo (soccer; Portugal)2. LeBron James (basketball; United States)3. Lionel Messi (soccer; Argentina)4. Neymar (soccer; Brazil)5. Roger Federer (tennis; Switzerland)6. Tiger Woods (golf; United States)7. Kevin Durant (basketball; United States)8. Rafael Nadal (tennis; Spain)9. Stephen Curry (basketball; United States)10. Phil Mickelson (golf; United States)11. Virat Kohli (cricket; India)12. Serena Williams (tennis; United States)13. Novak Djokovic (tennis; Serbia)14. Floyd Mayweather (boxing; United States)15. Rory McIlroy (golf; Northern Ireland)16. Jordan Spieth (golf; United States)17. Sun Yang (swimming; China)18. Conor McGregor (mixed martial arts; Ireland)19. Gareth Bale (soccer; Wales)20. MS Dhoni (cricket; India)21. Maria Sharapova (tennis; Russia)22. Mesut Ozil (soccer; Germany)23. James Rodriguez (soccer; Colombia)24. James Harden (basketball; United States)25. Zlatan Ibrahimovic (soccer; Sweden)26. Wayne Rooney (soccer; England)27. Kyrie Irving (basketball; United States)28. Andres Iniesta (soccer; Spain)29. Paulo Dybala (soccer; Argentina)30. Rohit Sharma (cricket; India)
SPORTS MARKETING 2020-2021
• 45 •

31. Dwyane Wade (basketball; United States)32. Shaun White (snowboarding; United States)33. Paul Pogba (soccer; France)34. Russell Westbrook (basketball; United States)35. Luis Suarez (soccer; Uruguay)36. Derrick Rose (basketball; United States)37. Sergio Aguero (soccer; Argentina)38. Tom Brady (football; United States)39. Radamel Falcao (soccer; Colombia)40. Alexis Sanchez (soccer; Chile)41. Suresh Raina (cricket; India)42. Marcelo Vieira (soccer; Brazil)43. Carmelo Anthony (basketball; United States)44. Philippe Coutinho (soccer; Brazil)45. Karim Benzema (soccer; France)46. Anthony Joshua (boxing; England)47. Drew Brees (football; United States)48. Venus Williams (tennis; United States)49. Antoine Griezmann (soccer; France)50. Saina Nehwal (badminton; India)51. Damian Lillard (basketball; United States)52. Chris Paul (basketball; United States)53. Odell Beckham Jr. (football; United States)54. Cam Newton (football; United States)55. David Luiz (soccer; Brazil)56. Andy Murray (tennis; Scotland)57. Yuvraj Singh (cricket; India)58. Canelo Alvarez (boxing; Mexico)59. Aaron Rodgers (football; United States)60. Dani Alves (soccer; Brazil)61. Gennady Golovkin (boxing; Kazakhstan)62. Cesc Fàbregas (soccer; Spain)63. Manny Pacquiao (boxing; Philippines)64. Blake Griffin (basketball; United States)65. Javier Hernandez (soccer; Mexico)66. Caroline Wozniacki (tennis; Denmark)67. Pierre-Emerick Aubameyang (soccer; Gabon)68. Lewis Hamilton (auto racing; England)69. Justin Rose (golf; England)70. Yuzuru Hanyu (figure skating; Japan)71. Ravichandran Ashwin (cricket; India)72. J.J. Watt (football; United States)73. Sergio Garcia (golf; Spain)74. Wladimir Klitschko (boxing; Ukraine)
SPORTS MARKETING 2020-2021
• 46 •

75. Thomas Muller (soccer; Germany)76. Stan Wawrinka (tennis; Switzerland)77. Simona Halep (tennis; Romania)78. Zhang Jike (table Tennis; China)79. Kylian Mbappe (soccer; France)80. Harbhajan Singh (cricket; India)81. Russell Wilson (football; United States)82. Ma Long (table tennis; China)83. Gautam Gambhir (cricket; India)84. Robert Lewandowski (soccer; Poland)85. Eden Hazard (soccer; Belgium)86. Ning Zetao (swimming; China)87. Rickie Fowler (golf; United States)88. Alex Morgan (soccer; United States)89. Fu Yuanhui (swimming; China)90. Marco Reus (soccer; Germany)91. Toni Kroos (soccer; Germany)92. Isaiah Thomas (basketball; United States)93. Alvaro Morata (soccer; Spain)94. Shikhar Dhawan (cricket; India)95. Lindsey Vonn (skiing; United States)96. Thiago Silva (soccer; Brazil)97. Michelle Wie (golf; United States)98. Victoria Azarenka (tennis; Belarus)99. AB de Villiers (cricket; South Africa)100. Sania Mirza (tennis; India)
4.2 Highest-Paid AthletesForbes ranks the world’s male athletes by total income in 2018 as follows:
• Floyd Mayweather (boxing): $285.0 million• Lionel Messi (soccer): $111.0 million• Cristiano Ronaldo (soccer): $108.0 million• Conor McGregor (mixed martial arts): $ 99.0 million• Neymar (soccer): $ 90.0 million• LeBron James (basketball): $ 85.5 million• Roger Federer (tennis): $ 77.2 million• Stephen Curry (basketball): $ 76.9 million• Matt Ryan (football): $ 67.3 million• Matthew Stafford (football): $ 59.5 million• Kevin Durant (basketball): $ 57.3 million• Lewis Hamilton $ 51.0 million• Russell Westbrook (basketball): $ 47.6 million• James Harden (basketball): $ 46.4 million
SPORTS MARKETING 2020-2021
• 47 •

• Canelo Alvarez (boxing): $ 44.5 million• Tiger Woods (golf): $ 43.3 million• Drew Brees (football): $ 42.9 million• Sebastian Vettel $ 42.3 million• Derek Carr (football): $ 42.1 million• Rafael Nadal (tennis): $ 41.4 million• Alex Smith (football): $ 41.4 million• Phil Mickelson (golf): $ 41.3 million• Jordan Spieth (golf): $ 41.2 million• Damian Lillard (basketball): $ 39.2 million• Anthony Joshua (boxing): $ 39.0 million• Rory McIlroy (golf): $ 37.7 million• Trumaine Johnson (football): $ 37.0 million• Jimmy Garoppolo (football): $ 36.2 million• Kyrie Irving (basketball): $ 36.1 million• Giannis Antetokounmpo (basketball): $ 35.5 million• Blake Griffin (basketball): $ 35.5 million
The following women athletes had the highest total income in 2018 (source: Forbes):• Serena Williams (tennis): $18.1 million• Caroline Wozniacki (tennis): $13.0 million• Sloane Stephens (tennis): $11.2 million• Garbine Muguruza (tennis): $11.0 million• Maria Sharapova (tennis): $10.5 million• Venus Williams (tennis): $10.2 million• P.V. Sindhu (badminton): $ 8.5 million• Simona Halep (tennis): $ 7.7 million• Danica Patrick (auto racing): $ 7.5 million• Angelique Kerber (tennis): $ 7.0 million
4.3 Athlete EndorsementsForbes ranks athletes by endorsement income in 2018 as follows:
• Roger Federer (tennis): $65.0 million• LeBron James (basketball): $52.0 million• Cristiano Ronaldo (soccer): $47.0 million• Stephen Curry (basketball): $42.0 million• Tiger Woods (golf): $42.0 million• Phil Mickelson (golf): $37.0 million• Rory McIlroy (golf): $34.0 million• Kei Nishikori (tennis): $33.0 million• Kevin Durant (basketball): $32.0 million• Jordan Spieth (golf): $30.0 million
SPORTS MARKETING 2020-2021
• 48 •

• Lionel Messi (soccer): $27.0 million• Rafael Nadal (tennis): $27.0 million• Russell Westbrook (basketball): $19.0 million• James Harden (basketball): $18.0 million• Kyrie Irving (basketball): $17.0 million• Neymar (soccer): $17.0 million• Serena Williams (tennis): $16.0 million
4.4 Market ResourcesGlobal Sports Salaries Survey 2019, SportingIntelligence,(www.globalsportssalaries.com)
Sports Salaries Database, SportingIntelligence. (www.sportingintelligence.com/finance-biz/sports-salaries/)
Spotrac, 6576 E. Quaker Street, Suite 2, Orchard Park, NY 14127. (716) 508-7768.(www.spotrac.com)
SPORTS MARKETING 2020-2021
• 49 •

5
PARTICIPATION & RECREATION
5.1 Conditioning and FitnessThe 2018 Sports, Fitness And Leisure Activities Topline Participation Report,
published by the Sports & Fitness Industry Association (SFIA, www.sfia.org), reportstotal participation (at least once) and core participation (50 or more times) inconditioning and fitness activities among those ages six and older as follows (changefrom previous year in parenthesis):
Total Core
• Aquatic exercise: 10.5 million (-1.1%) 3.2 million (-5.9%)• Barre: 3.4 million (3.2%) 735,000 (6.0%)• Boot camp style cross-training: 6.6 million (1.0%) 2.0 million (-4.0%)• Calisthenics/bodyweight exercise: 24.4 million (-2.6%) 14.4 million (-6.4%)• Cardio kickboxing: 6.7 million (-3.0%) 2.0 million (-5.5%)• Cross-training style workouts: 13.6 million (5.5%) 6.7 million (3.8%)• Dance/other exercise to music: 22.6 million (3.6%) 7.7 million (0.9%)• Elliptical motion trainer: 32.3 million (0.2%) 16.4 million (-0.6%)• Free weights (barbells): 27.4 million (3.7%) 16.6 million (2.8%)• Free weights (hand weights/dumbbells): 52.2 million (1.4%) 33.3 million (-4.1%)• High impact/intensity training: 21.5 million (0.4%) 9.4 million (-2.3%)• Kettlebells: 12.2 million (13.4%) 5.0 million (5.2%)• Pilates training: 9.0 million (1.7%) 3.3 million (-0.6%)• Rowing machine: 11.7 million (8.1%) 4.4 million (1.3%)• Running/jogging: 50.8 million (7.1%) 26.8 million (4.5%)• Stair climbing machine: 14.9 million (-0.9%) 5.4 million (-5.2%)• Stationary cycling (group): 9.4 million (5.3%) 3.4 million (6.3%)• Stationary cycling (upright/recumb.): 36.0 million (-0.2%) 17.6 million (-1.6%)• Stretching/flexibility training: 33.2 million (-1.7%) 23.1 million (-3.7%)• Swimming for fitness: 27.1 million (2.0%) 8.8 million (-0.1%)• Tai Chi: 3.8 million (2.2%) 1.5 million (-0.2%)• Treadmill: 53.0 million (2.1%) 28.5 million (0.5%)• Walking for fitness: 110.8 million (2.7%) 75.5 million (2.9%)• Weight/resistance machine: 36.3 million (1.5%) 21.8 million (1.7%)• Yoga: 27.4 million (4,1%) 10.9 million (1.1%)
SPORTS MARKETING 2020-2021
• 50 •

5.2 Individual SportsTotal participation (at least once) and core participation (varies by sport) in
individual sports is as follows (change from previous year in parenthesis): Total Core # Core Participation
• Adventure racing: 2.5 million (-15.7%) 2+ 1.6 million (-15.0%)• Archery: 7.8 million (-1.7%) 26+ 1.2 million (-6.8%)• Bowling: 45.5 million (-0.9%) 13+ 9.6 million (-4.5%)• Boxing for competition: 1.4 million (13.0%) 13+ 199,000 (-3.1%)• Boxing for fitness: 5.2 million (-0.3%) 13+ 2.4 million (13.6%)• Golf: 23.8 million (n/a) - n/a• Ice skating: 10.0 million (-3.1%) 13+ 1.5 million (-5.9%)• Martial arts: 5.8 million (1.6%) 13+ 3.8 million (0.9%)• Mixed martial arts (comp.): 1.0 million (-7.6%) 13+ 280,000 (-9.6%)• Mixed martial arts (fitness): 2.4 million (-2.8%) 13+ 1.1 million (-2.3%)• Roller skating (2x2 wheels): 6.3 million (-2.9%) 13+ 1.2 million (-3.7%)• Roller skating (inline): 5.3 million (-2.1%) 13+ 1.4 million (-6.9%)• Skateboarding: 6.4 million (-0.9%) 26+ 2.4 million (-3.0%)• Trail running: 9.1 million (6.6%) - n/a• Triathlon (off-road): 1.9 million (10.2%) 2+ 1.1 million (6.7%)• Triathlon (traditional/road): 2.2 million (-8.9%) 2+ 1.4 million (11.4%)
5.3 Racquet SportsTotal participation (at least once) and core participation (varies by sport) in
racquet sports is as follows (change from previous year in parenthesis): Total Core # Core Participation
• Badminton: 6.4 million (-12.6%) 13+ 1.8 million (-9.8%)• Cardio tennis: 2.2 million (4.6%) - n/a• Pickleball: 3.1 million (11.3%) - n/a• Racquetball: 3.6 million (-1.5%) 13+ 1.1 million (-1.6%)• Squash: 1.5 million (-3.7%) 8+ 447,000 (2.2%)• Table tennis: 16.0 million (-3.2%) 13+ 4.2 million (-6.5%)• Tennis: 17.7 million (-2.2%) - n/a
5.4 Team SportsTotal participation (at least once) and core participation (varies by sport) in team
sports is as follows (change from previous year in parenthesis): Total Core # Core Participation
• Baseball: 15.6 million (6.0%) 13+ 9.2 million (1.7%)• Basketball: 23.4 million (4.7%) 13+ 14.9 million (0.1%)• Cheerleading: 3.8 million (-5.3%) 26+ 1.7 million (-0.7%)• Field hockey: 1.6 million (5.6%) 8+ 700,000 (-5.3%)
SPORTS MARKETING 2020-2021
• 51 •

• Football (flag): 6.6 million (6.1%) 13+ 3.0 million (11.7%)• Football (touch): 5.6 million (-1.0%) 13+ 2.3 million (-3.6%)• Football (tackle): 5.2 million (-4.7%) 26+ 3.1 million (-4.6%)• Gymnastics: 4.8 million (-10.7%) 50+ 1.7 million (-7.5%)• Ice hockey: 2.5 million (-5.7%) 13+ 1.3 million (-2.0%)• Lacrosse: 2.2 million (3.9%) 13+ 1.0 million (9.8%)• Paintball: 3.4 million (-8.1%) 8+ 1.1 million (2.4%)• Roller hockey: 1.8 million (-4.9%) 13+ 415,000 (-15.5%)• Rugby: 1.6 million (4.6%) 8+ 524,000 (14.0%)• Soccer (indoor): 5.4 million (5.5%) 13+ 2.7 million (-1.0%)• Soccer (outdoor): 11.9 million (-0.1%) 26+ 5.3 million (-5.9%)• Softball (fast pitch): 2.3 million (-6.4%) 26+ 1.2 million (-2.9%)• Softball (slow pitch): 7.3 million (-5.3%) 13+ 4.2 million (-2.1%)• Swimming (team): 3.0 million (-10.7%) 50+ 1.3 million (-9.8%)• Track and field: 4.2 million (1.1%) 26+ 2.1 million (-1.6%)• Ultimate frisbee: 3.1 million (-14.9%) 13+ 856,000 (-7.6%)• Volleyball (beach): 4.9 million (-9.9%) 13+ 1.4 million (-6.4%)• Volleyball (court): 6.3 million (1.6%) 13+ 3.4 million (0.4%)• Volleyball (grass): 3.5 million (-19.6%) 13+ 947,000 (-13.8%)• Wrestling: 1.9 million (-1.4%) 26+ 717,000 (-8.4%)
5.5 Outdoor SportsTotal participation (at least once) and core participation (8 or more times) in outdoor
sports is as follows (change from previous year in parenthesis): Total Core # Core Participation
• Backpacking (overnight): 11.0 million (8.1%) - n/a• Bicycling - BMX: 3.4 million (9.9%) 13+ 1.4 million (2.2%)• Bicycling - mountain: 8.6 million (-0.1%) 13+ 4.2 million (-2.8%)• Bicycling - road/paved: 38.9 million (1.3%) 26+ 18.7 million (-2.4%)• Birdwatching (>¼ mile): 12.3 million (6.1%) - n/a• Camping (<¼ mile): 26.3 million (-0.8%) - n/a• Camping (RV): 16.2 million (1.9%) 8+ 6.8 million (-4.3%)• Climbing (sport/boulder): 2.1 million (n/a) - n/a• Climbing (indoor): 5.0 million (n/a) - n/a• Climbing (ice/mountaineering): 2.5 million (-9.4%) - n/a• Fishing (fly): 6.8 million (5.2%) 8+ 2.3 million (3.1%)• Fishing (freshwater): 38.3 million (0.6%) 8+ 18.4 million (3.1%)• Fishing (saltwater): 13.1 million (6.5%) 8+ 5.4 million (7.3%)• Hiking (day): 44.9 million (6.6%) - n/a• Hunting (bow): 4.6 million (4.8%) 8+ 2.0 million (0.5%)• Hunting (handgun): 3.2 million (-7.7%) 8+ 1.0 million (-12.3%)• Hunting (rifle): 11.2 million (3.6%) 13+ 2.8 million (-1.2%)• Hunting (shotgun): 8.6 million (3.4%) 8+ 3.4 million (5.0%)
SPORTS MARKETING 2020-2021
• 52 •

• Shooting (sport clays): 5.1 million (-7.2%) 8+ 1.5 million (-0.9%)• Shooting (trap/skeet): 4.3 million (-6.5%) - n/a
5.6 Water SportsTotal participation (at least once) and core participation (8 or more times) in
water sports is as follows (change from previous year in parenthesis): Total Core
• Boardsailing/windsurfing: 1.6 million (-9.5%) 284,000 (-1.4%)• Canoeing: 9.2 million (-8.2%) n/a• Jet skiing: 5.4 million (-6.3%) 1.6 million (-9.1%)• Kayaking (recreational): 10.5 million (5.2%) n/a• Kayaking (sea touring): 3.0 million (-5.4%) n/a• Kayaking (white water): 2.5 million (-2.1%) n/a• Rafting: 3.5 million (1.5%) n/a• Sailing: 3.9 million (-3.0%) 1.3 million (-0.6%)• Scuba diving: 2.9 million (-7.6%) 761,000 (-7.1%)• Snorkeling: 8.4 million (-3.8%) 1.7 million (-6.2%)• Stand-up paddling: 3.3 million (3.3%) n/a• Surfing: 2.7 million (-4.0%) 975,000 (-4.8%)• Wakeboarding: 3.0 million (3.2%) 903,000 (1.0%)• Water skiing: 3.6 million (-3.5%) 1.0 million (-3.0%)
5.7 Winter SportsTotal participation (at least once) in winter sports is as follows (change from
previous year in parenthesis):• Skiing, alpine/downhill: 9.9 million (6.6%)• Skiing, cross-country: 5.1 million (9.0%)• Skiing, freestyle: 5.4 million (15.5%)• Sledding/saucer riding/tubing: 9.5 million (7.6%)• Snowboarding: 7.6 million (-0.6%)• Snowmobiling: 3.0 million (-9.5%)• Snowshoeing: 3.7 million (5.0%)• Telemarking, downhill: 2.5 million (-11.1%)
5.8 Market ResourcesSports & Fitness Industry Association (SFIA), 962 Wayne Avenue, Suite 300,Silver Spring, MD 20910. (301) 495-6321. (www.sfia.org)
SPORTS MARKETING 2020-2021
• 53 •

6
TOP SPORTS CITIES
6.1 Best Sports Cities2018 Best Sports Cities, a study by Wallethub (www.wallethub.com), compared
149 cities across 50 key metrics related to the five largest U.S. sports. Each sportcategory was given a weight corresponding with the total percentage of U.S. adults whosay they follow that sport; football was weighted 40%, basketball 31%, baseball 27%,hockey 15%, and soccer 9%. Each sport was graded on 50 metrics for favorableconditions for sports fans, with 100 being the most favorable. Metrics included thenumber of championship wins for each sport, fan engagement, ticket prices for games,stadium capacity, and game attendance.
The following were ranked the Best Sports Cities:1. Boston, MA2. Los Angeles, CA3. New York, NY4. Pittsburgh, PA5. Chicago, IL6. Philadelphia, PA7. Washington, DC8. Atlanta, GA9. Oakland, CA10. Dallas, TX11. Detroit, MI12. Minneapolis, MN13. Miami, FL14. Denver, CO15. Cincinnati, OH
16. Cleveland, OH17. Houston, TX18. Indianapolis, IN19. Seattle, WA20. New Orleans, LA21. Green Bay, WI22. Kansas City, MO23. Nashville, TN24. San Francisco, CA25. Charlotte, NC26. Buffalo, NY27. Baltimore, MD28. Salt Lake City, UT29. Tampa, FL30. San Antonio, TX
6.2 Avid Sports Fans City-by-CityScarborough Sports Marketing (www.scarborough.com) performs surveys in 81
metropolitan areas asking about 29 major spectator sports. The following arepercentages of adults in each city that said they are avid fans of at least one majorsport:• Columbus, OH: 66%• Boston, MA: 64%
SPORTS MARKETING 2020-2021
• 54 •
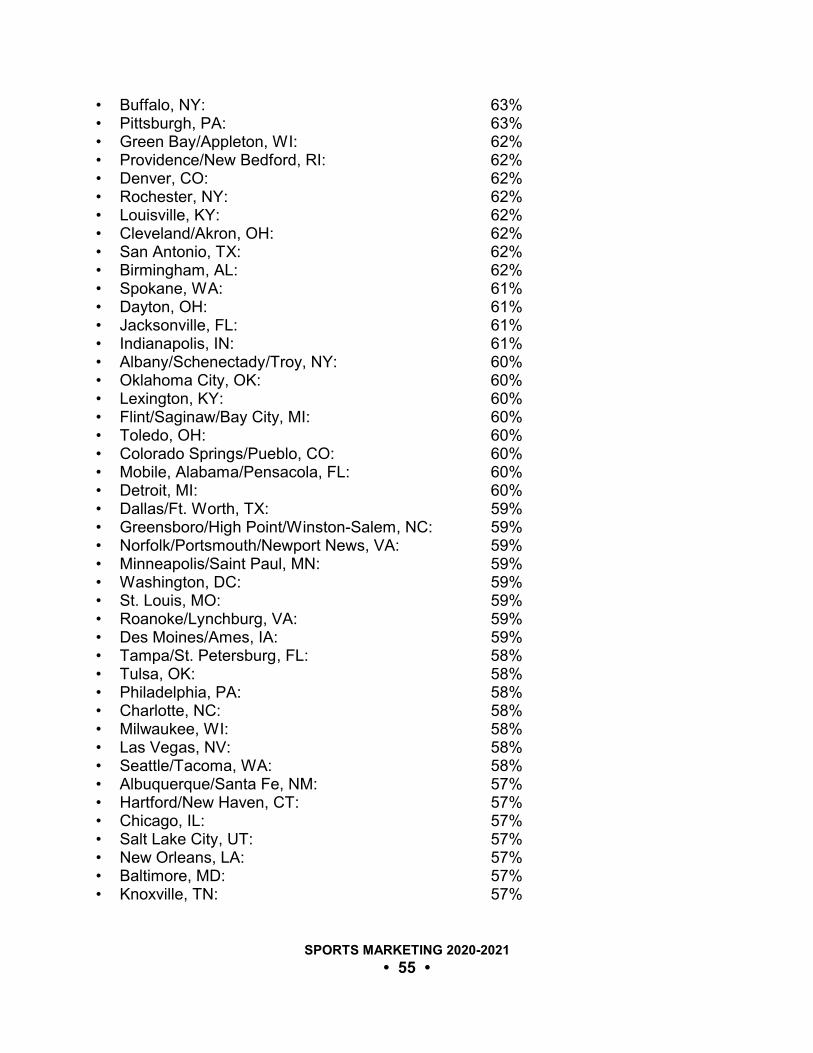
• Buffalo, NY: 63%• Pittsburgh, PA: 63%• Green Bay/Appleton, WI: 62%• Providence/New Bedford, RI: 62%• Denver, CO: 62%• Rochester, NY: 62%• Louisville, KY: 62%• Cleveland/Akron, OH: 62%• San Antonio, TX: 62%• Birmingham, AL: 62%• Spokane, WA: 61%• Dayton, OH: 61%• Jacksonville, FL: 61%• Indianapolis, IN: 61%• Albany/Schenectady/Troy, NY: 60%• Oklahoma City, OK: 60%• Lexington, KY: 60%• Flint/Saginaw/Bay City, MI: 60%• Toledo, OH: 60%• Colorado Springs/Pueblo, CO: 60%• Mobile, Alabama/Pensacola, FL: 60%• Detroit, MI: 60%• Dallas/Ft. Worth, TX: 59%• Greensboro/High Point/Winston-Salem, NC: 59%• Norfolk/Portsmouth/Newport News, VA: 59%• Minneapolis/Saint Paul, MN: 59%• Washington, DC: 59%• St. Louis, MO: 59%• Roanoke/Lynchburg, VA: 59%• Des Moines/Ames, IA: 59%• Tampa/St. Petersburg, FL: 58%• Tulsa, OK: 58%• Philadelphia, PA: 58%• Charlotte, NC: 58%• Milwaukee, WI: 58%• Las Vegas, NV: 58%• Seattle/Tacoma, WA: 58%• Albuquerque/Santa Fe, NM: 57%• Hartford/New Haven, CT: 57%• Chicago, IL: 57%• Salt Lake City, UT: 57%• New Orleans, LA: 57%• Baltimore, MD: 57%• Knoxville, TN: 57%
SPORTS MARKETING 2020-2021
• 55 •

• Cincinnati, OH: 57%• Nashville, TN: 57%• Kansas City, MO: 57%• Richmond/Petersburg, VA: 57%• Greenville/Spartanburg/Anderson, NC: 57%• Tucson, AZ: 56%• Atlanta, GA: 56%• Syracuse, NY: 56%• Honolulu, HI: 56%• West Palm Beach/Fort Pierce, FL: 56%• Charleston/Huntington, WV: 56%• Raleigh/Durham, NC: 56%• Memphis, TN: 56%• Phoenix, AZ: 55%• Orlando/Daytona Beach/Melbourne, FL: 55%• San Diego, CA: 55%• Sacramento/Stockton/Modesto, CA: 55%• Fort Myers/Naples, FL: 55%• Harrisburg/Lancaster/Lebanon/York, PA: 54%• Grand Rapids/Kalamazoo/Battle Creek, MI: 54%• Austin, TX: 54%• Chattanooga, TN: 53%• Wilkes-Barre/Scranton, PA: 52%• Houston, TX: 52%• Portland, OR: 52%• San Francisco/Oakland/San Jose, CA: 51%• Los Angeles, CA: 51%• Little Rock/Pine Bluff, AR: 51%• Miami/Ft. Lauderdale, FL: 51%• New York, NY: 50%• El Paso, TX: 49%• Fresno/Visalia, CA: 49%• Wichita/Hutchinson, KS: 48%• Bakersfield, CA: 48%• Harlingen/Weslaco/Brownsville/McAllen, TX: 43%
Of all 81 metropolitan areas surveyed by Scarborough, 56% of residents saidthey are avid sports fans.
6.3 Spectator Sports AttendanceAccording to The Media Audit (www.themediaaudit.com), the following
metropolitan areas have the highest percentages of adults that attend one or moreprofessional or college sports events annually:
SPORTS MARKETING 2020-2021
• 56 •

• Omaha, NE: 33.3%• Madison, WI: 30.6%• Birmingham, AL: 29.7%• Grand Rapids, MI: 29.5%• Lexington, KY: 29.2%
Among all adults living in metropolitan areas, 21.5% attend three or moreprofessional or college sports events annually.
6.4 Fan Ranking By SportThe top markets for sports, ranked by the percentage of adults regularly
following games on television or radio, are as follows (source: The Media Audit):High School Football• Tyler/Longview, TX: 52.0%• Greenville/Spartanburg, SC: 50.3%• Birmingham, AL: 48.8%• Oklahoma City, OK: 45.3%• Lubbock, TX: 45.2%• All metropolitan regions: 28.1%
Major League Baseball• St. Louis, MO: 77.0%• Columbia/Jefferson City, MO: 72.1%• Cincinnati, OH: 66.3%• Boston, MA: 65.8%• Milwaukee/Racine, WI: 65.5%• Detroit, MI: 63.3%• Philadelphia, PA: 62.7%• San Francisco, CA: 61.7%• Cleveland, OH: 61.1%• Dallas/Ft. Worth, TX: 60.6%• All metropolitan regions: 48.0%
Major League Soccer• San Diego, CA: 35.0%• Seattle-Tacoma, WA: 32.0%• New York, NY: 31.0%• Orange County, CA: 31.0%• Houston, TX: 30.0%• Los Angeles, CA: 30.0%• Riverside-San Bernardino, CA: 30.0%• Miami, FL: 29.0%
SPORTS MARKETING 2020-2021
• 57 •

• Raleigh-Durham, NC: 28.3%• Portland, OR: 28.0%• All metropolitan regions: 24.5%
NASCAR• Daytona Beach, FL: 48.5%• Charlotte, NC: 44.0%• Indianapolis, IN: 41.7%• Greensboro, NC: 39.6%• Melbourne, FL: 38.6%• Jacksonville, FL: 38.5%• Greenville/Spartanburg, SC: 37.1%• Columbia, SC: 35.8%• Ocala, FL: 35.6%• Dayton, OH: 35.0%• All metropolitan regions: 23.1%
National Basketball Association• Dallas/Fort Worth, TX: 63.2%• Akron, OH: 60.6%• Miami/Ft. Lauderdale, FL: 58.2%• Cleveland, OH: 55.9%• San Antonio, TX: 55.2%• All metropolitan regions: 40.9%
National Football League• Milwaukee-Racine, WI: 82.7%• Madison WI: 82.6%• New Orleans, LA: 80.5%• Pittsburgh, PA: 80.3%• Colorado Springs, CO: 79.5%• Denver, CO: 73.8%• Allentown-Bethlehem, PA: 72.9%• Sarasota-Bradenton, FL: 72.1%• Norfolk-Virginia Beach, VA: 71.8%• Akron, OH: 71.1%• All metropolitan regions: 61.5%
National Hockey League• Buffalo, NY: 69.8%• Pittsburgh, PA: 67.6%• Detroit, MI: 65.9%• Ann Arbor, MI: 46.0%• Boston, MA: 45.6%
SPORTS MARKETING 2020-2021
• 58 •

• Minneapolis/Saint Paul, MN: 45.6%• Denver, CO: 39.5%• Grand Rapids, MI: 39.4%• St. Louis, MO: 38.9%• Philadelphia, PA: 38.5%• All metropolitan regions: 23.5%
NCAA Basketball• Lexington, KY: 81.0%• Louisville, KY: 74.3%• Raleigh/Durham, NC: 63.9%• Syracuse, NY: 59.5%• Columbia-Jefferson City, MO: 58.9%• Indianapolis, IN: 55.0%• Madison, WI: 54.6%• Memphis, TN: 54.6%• Kansas City, MO: 53.2%• Columbus, OH: 53.2%• All metropolitan regions: 36.5%
Professional Sports (baseball, basketball, football, and hockey)• Boston, MA: 63.0%• Detroit, MI: 58.2%• Denver, CO: 56.9%• Southern NH: 56.0%• Pittsburgh, PA: 55.5%• Cleveland, OH: 54.8%• Buffalo, NY: 54.5% • Philadelphia, PA: 54.0%• Akron, OH: 52.7%• Minneapolis/Saint Paul, MN: 51.8%• Chicago, IL: 51.7%• Grand Rapids, MI: 50.2%• Madison, WI: 50.2%• Phoenix, AZ: 49.1%• Dallas/Ft. Worth, TX: 48.3%• Orange County, CA: 47.9%• Allentown/Bethlehem, PA: 47.5%• Milwaukee/Racine, WI: 47.4%• West Palm Beach, FL: 47.2%• Toledo, OH: 47.2%
SPORTS MARKETING 2020-2021
• 59 •

6.5 Top Minor League MarketsSince 2007, SportsBusiness Journal has conducted a biennial ranking of the
nation’s top minor league markets based on the regional economy, tenure of minorleague teams in five sports, and attendance at games. The most recent ranking,published in September 2017, is as follows:1. Des Moines, IA2. Quad Cities (Moline-Rock Island,
IL/Davenport-Bettendorf, IA)3. Fort Wayne, IN4. Charleston, SC5. Toledo, OH6. Grand Rapids-Comstock, MI7. Hershey-Harrisburg, PA8. Durham-Cary, NC9. Greenville, SC10. Binghamton, NY11. Syracuse, NY12. Allen, TX13. South Bend, IN14. Roanoke-Salem, VA15. Tacoma, WA16. Winston-Salem, NC17. Greensboro-Burlington, NC18. Appleton, WI19. Sioux Falls, SD20. North Little Rock, AR21. Asheville, NC22. Eugene, OR23. Cedar Rapids, IA24. Akron, OH25. Providence-Pawtucket, RI
26. Norfolk, VA27. Lehigh Valley, PA28. Loveland, CO29. Pulaski, VA30. West Valley City, UT31. Omaha, NE32. Burlington, IA33. Auburn, NY34. Peoria, IL35. Knoxville, TN36. Idaho Falls, ID37. Scranton/Wilkes-Barre, PA38. Fort Myers, FL39. Clearwater-Dunedin, FL40. Visalia, CA41. Wheeling, WV42. Port St. Lucie, FL43. Bluefield-Princeton, WV44. El Paso, TX45. Danville, VA46. Inland Empire, CA47. Pensacola, FL48. Modesto, CA49. Richmond, VA50. Jackson, MS
SPORTS MARKETING 2020-2021
• 60 •

PART II: SPORTS MARKET SEGMENTS
SPORTS MARKETING 2020-2021
• 61 •

7
ADVERTISING & SPONSORSHIPS
7.1 Market AssessmentAnnual spending for sports advertising and sponsorship is approximately
$60 billion. Television advertising is $22 billion, sponsorship is $17 billion, and thebalance includes print media advertising, radio advertising, and online advertising.
7.2 TV Ad SpendingKantar Media (www.kantarmedia.com) reported spending for sports ads on
television at $22 billion.TV ad spending by sport was as follows:
• Professional football: $7.0 billion• Olympics: $2.6 billion• College football: $1.7 billion• Professional basketball: $1.7 billion• College basketball: $1.6 billion• Golf: $ 980 million• Professional baseball: $ 960 million• Soccer: $ 660 million• Auto racing: $ 500 million• Hockey: $ 260 million• Other: $2.3 billion
7.3 Top Sports AdvertisersAccording to SportsBusiness Journal, based on iSpot.tv data, the following
companies had the highest sports TV ad spending in 2018:NFL• Verizon: $181.4 million• Geico: $154.3 million• Ford: $106.2 million• Progressive: $ 95.9 million• Chevrolet: $ 87.3 million
SPORTS MARKETING 2020-2021
• 62 •

NBA• State Farm: $ 35.2 million• Burger King: $ 31.2 million• Taco Bell: $ 30.2 million• American Express: $ 27.2 million• Geico: $ 25.5 million
NHL• Honda: $ 29.6 million• Lexus: $ 29.2 million• Volkswagen: $ 24.8 million• Geico: $ 23.1 million• Discover Card: $ 23.1 million
NASCAR• Geico: $ 9.4 million• Toyota: $ 8.9 million• Chevrolet: $ 8.6 million• Ford: $ 8.3 million• Ram Trucks: $ 6.9 million
MLB• Geico: $ 8.9 million• Taco Bell: $ 7.3 million• HankookTire: $ 6.8 million• T-Mobile: $ 5.8 million• Budweiser: $ 5.3 million
7.4 Advertising Agencies in Sports MarketingThe following are the advertising agencies most active in sports marketing
(source: SportsBusiness Journal):• 180 Communications (www.180amsterdam.com)• Anomaly (www.anomaly.com)• Arnold Worldwide (www.arnoldworldwide.com)• BBDO Worldwide (www.bbdo.com)• Bartle Bogle Hegarty (www.bartleboglehegarty.com)• Berlin Cameron United (www.bc-p.com)• Boathouse Group (www.boathouseinc.com)• Burrell Communications Group (www.burrell.com)• Campbell-Ewald (www.campbell-ewald.com)• Carat (www.carat.com)• Cramer-Krasselt Co. (www.c-k.com)
SPORTS MARKETING 2020-2021
• 63 •
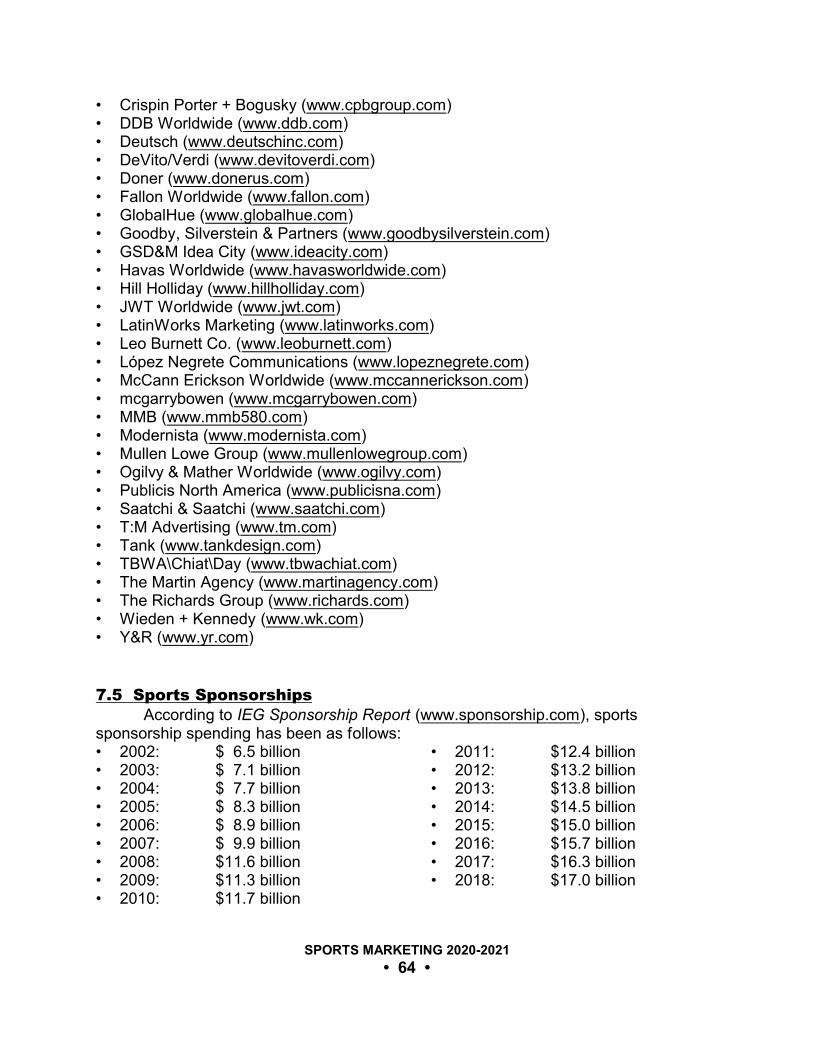
• Crispin Porter + Bogusky (www.cpbgroup.com)• DDB Worldwide (www.ddb.com)• Deutsch (www.deutschinc.com)• DeVito/Verdi (www.devitoverdi.com)• Doner (www.donerus.com)• Fallon Worldwide (www.fallon.com)• GlobalHue (www.globalhue.com)• Goodby, Silverstein & Partners (www.goodbysilverstein.com)• GSD&M Idea City (www.ideacity.com)• Havas Worldwide (www.havasworldwide.com)• Hill Holliday (www.hillholliday.com)• JWT Worldwide (www.jwt.com)• LatinWorks Marketing (www.latinworks.com)• Leo Burnett Co. (www.leoburnett.com)• López Negrete Communications (www.lopeznegrete.com)• McCann Erickson Worldwide (www.mccannerickson.com)• mcgarrybowen (www.mcgarrybowen.com)• MMB (www.mmb580.com)• Modernista (www.modernista.com)• Mullen Lowe Group (www.mullenlowegroup.com)• Ogilvy & Mather Worldwide (www.ogilvy.com)• Publicis North America (www.publicisna.com)• Saatchi & Saatchi (www.saatchi.com)• T:M Advertising (www.tm.com)• Tank (www.tankdesign.com)• TBWA\Chiat\Day (www.tbwachiat.com)• The Martin Agency (www.martinagency.com)• The Richards Group (www.richards.com)• Wieden + Kennedy (www.wk.com)• Y&R (www.yr.com)
7.5 Sports SponsorshipsAccording to IEG Sponsorship Report (www.sponsorship.com), sports
sponsorship spending has been as follows:• 2002: $ 6.5 billion• 2003: $ 7.1 billion• 2004: $ 7.7 billion• 2005: $ 8.3 billion• 2006: $ 8.9 billion• 2007: $ 9.9 billion• 2008: $11.6 billion• 2009: $11.3 billion• 2010: $11.7 billion
• 2011: $12.4 billion• 2012: $13.2 billion• 2013: $13.8 billion• 2014: $14.5 billion• 2015: $15.0 billion• 2016: $15.7 billion• 2017: $16.3 billion• 2018: $17.0 billion
SPORTS MARKETING 2020-2021
• 64 •

Sponsorship spending for sports events accounts for about 70% of the total U.S.sponsorship market.
Professional league sports sponsorship spending in 2018 was as follows:• National Football League: $1.35 billion• Major League Baseball: $ 901 million• National Basketball Association: $ 865 million• National Hockey League: $ 516 million• Major League Soccer: $ 361 million
7.6 Naming RightsStadium and arena naming rights are assessed in Chapter 23 of this handbook.
7.7 Jersey RightsAds emblazoned on jerseys are a common practice internationally. In the
English Premier League, for example, soccer teams Liverpool, Manchester City, andManchester United each receive $32.6 million annually for the corporate advertisingplaced on the front of jerseys.
Major League Soccer was the first professional sports league in the U.S. topermit advertising on uniforms when it approved the practice in 2006. The sponsor onthe front of an MLS jersey is typically one of a team's biggest corporate partners. Dealsgenerally range from $2 million to $5 million annually. The Houston Dynamo were theonly team in the league without a brand on the front of their shirts for the 2019 season.
MLS will expand its jersey rights in 2020, allowing teams a second advertisementon team jerseys, a sponsorship opportunity that the league estimates will bring eachteam more than $1 million a year. Starting in 2020, the league will remove its logo fromthe right sleeve of jerseys to allow placement of a 2.5-by-2.5-inch square ad. Theexpansion is a four-year pilot program.
The Nike logo was on NBA game jerseys beginning with the 2016-2017 seasonas part of an eight-year, $1 billion sponsorship deal with the league.
The NBA first allowed jersey ads beginning with the 2017-2018 season. All ofthe NBA’s 30 teams had corporate logo placement deals for the 2019-2020 season,with a wide range of prices. The Golden State Warriors have a three-year, $60 milliondeal with Rakuten Inc., while the Utah Jazz have a deal with Qualtrics's cancer charityfor a reported $4 million a year.
The Women’s National Basketball Association and National Women’s SoccerLeague also offer jersey rights to sponsors.
7.8 Backdrop SponsorsProfessional sports teams take advantage of every possible branding platform.
Teams have displayed sponsor’s logos on fabric backdrops at press conferences formany years. More recently, some teams have introduced digital backdrops.
SPORTS MARKETING 2020-2021
• 65 •

Stadium naming-rights sponsors generally have a prominent, if not exclusive,position on team backdrops.
An analysis by Nielsen Sports (www.nielsensports.com) assessed that backdroplogos comprised 1% to 16% of total media value of team-owned sponsorship assetsshown during television broadcasts. Among NBA and NFL teams, the value of thisasset can range up to $4.8 million for a season, including ESPN SportsCenter, FootballNight Countdown, Monday Night Countdown, and pregame and postgame coverage.
SportsBusiness Journal surveyed NFL, NBA, MLB, NHL, and MLS teamsregarding logo deals for backdrop sponsorships. Among the 142 teams, 135 displayedcorporate logos on backdrops, while only seven did not. In total, there were 245 logodeals, as follows:
No. Backdrop Sponsorship No. Teams Logo Deals
• NFL: 32 75• NBA: 30 49• MLS: 20 46• NHL: 30 42• MLB: 30 33
7.9 Market ResourcesAdvertising Age, 711 Third Avenue, New York, NY 10017. (212) 210-0100. (www.adage.com)
IEG Sponsorship Report and IEG Sponsorship Sourcebook, published by IEG, 350North Orleans Street, Suite 1200, Chicago, IL 60654. (312) 944-1727. (www.sponsorship.com)
SportsBusiness Journal, 120 West Morehead Street, Suite 310, Charlotte, NC 28202. (704) 973-1400. (www.sportsbusinessjournal.com)
SPORTS MARKETING 2020-2021
• 66 •

8
AGENTS & AGENCIES
8.1 OverviewSports agents typically receive 3% to 8% of the salary of client athletes and 10%
to 20% of endorsement contracts. The NBA and NFL limit agent compensation to 3%and 4%, respectively, of a player’s salary.
Many sports agencies also work in related fields such as entertainmentmarketing and talent representation.
8.2 Top AgentsForbes ranks the top agents in 2018 as follows:
Commissions Contracts
• Scott Boras: $105.16 million $1.9 billion• Jorge Mendes: $100.52 million $1.0 billion• Jonathan Barnett: $ 79.56 million $ 795.6 million• Jeff Schwartz: $ 66.78 million $1.7 billion• Mino Raiola: $ 62.89 million $ 628.9 million• Casey Close: $ 62.17 million $1.2 billion• Sam & Seth Levinson: $ 49.47 million $ 994.9 million• Volker Struth: $ 46.44 million $ 464.4 million• Pat Brisson: $ 45.35 million $1.1 billion• Todd France: $ 41.84 million $1.4 billion• Tom Condon: $ 39.46 million $1.3 billion• Joel Wolfe: $ 39.42 million $ 788.3 million• Leon Rose: $ 39.20 million $ 980.1 million• Joel Segal: $ 38.12 million $1.3 billion• Mark Bartelstein: $ 35.14 million $ 878.4 million• Drew Rosenhaus: $ 33.70 million $1.1 billion• Don Meehan: $ 33.38 million $ 802.7 million• Adam Katz: $ 31.89 million $ 637.8 million• J.P. Barry: $ 31.54 million $ 788.4 million• Jose Otin: $ 30.30 million $ 303.0 million• Dan Lozano: $ 26.96 million $ 539.1 million• Scott Pucino: $ 25.76 million $ 515.2 million• David Dunn: $ 25.46 million $ 848.6 million• Brodie Van Wagenen: $ 25.03 million $ 555.6 million• Rich Paul: $ 24.99 million $ 624.8 million
SPORTS MARKETING 2020-2021
• 67 •

• Greg Genske: $ 24.06 million $ 481.3 million• Jimmy Sexton: $ 23.63 million $ 787.8 million• Thad Foucher: $ 23.26 million $ 581.5 million• Bruce & Ryan Tollner: $ 22.78 million $ 759.4 million• Nez Balelo: $ 21.16 million $ 423.2 million• Mark Pieper: $ 20.43 million $ 408.6 million• Steven Heumann: $ 20.37 million $ 509.3 million• Gerry Johannson: $ 20.35 million $ 508.8 million• Meissa N'diaye: $ 20.10 million $ 201.0 million• Thomas Kroth: $ 19.74 million $ 197.4 million• Aaron Mintz: $ 18.82 million $ 470.4 million• Kurt Overhardt: $ 18.29 million $ 482.3 million• Fernando Felicevich: $ 17.29 million $ 172.9 million• Fernando Cuza: $ 17.27 million $ 345.3 million
8.3 Top AgenciesThe following ranked as the top agencies in 2018 (Forbes): Commissions Contracts
• Creative Artists Agency $348.8 million $9.4 billion• Wasserman: $174.9 million $3.7 billion• Excel Sports Management: $168.2 million $3.4 billion• Octagon: $142.4 million $2.9 billion• Boras Corp: $105.2 million $1.9 billion• Gestifute International: $100.5 million $1.0 billion• Independent Sports & Entertainment: $ 90.2 million $1.3 billion• Stellar Group: $ 79.6 million $ 796 million• Newport Sports Management: $ 79.4 million $ 2.0 billion• Mino Raiola S.P.: $ 62.9 million $ 629 million• Unique Sports Management: $ 57.3 million $ 573 million• Lian Sports: $ 55.9 million $ 559 million• Sports Entertainment Group: $ 52.2 million $ 522 million• Lagardere Sports: $ 50.6 million $1.4 billion• ACES: $ 49.5 million $ 995 million• WME-IMG: $ 47.7 million $ 176 million• SportsTotal: $ 46.4 million $ 464 million• Rogon SportManagement: $ 46.2 million $ 462 million• Priority Sports & Entertainment: $ 44.7 million $1.2 billion• YouFirst Sports: $ 41.8 million $ 642 million• Base Soccer Agency: $ 39.4 million $ 394 million• Rosenhaus Sports Representation $ 33.7 million $1.1 billion• Athletes First: $ 33.7 million $1.1 billion• Bahia Internacional: $ 30.3 million $ 303 million• Rep 1 Sports: $ 29.8 million $ 911 million
SPORTS MARKETING 2020-2021
• 68 •

• Roc Nation Sports: $ 28.9 million $ 935 million• The Legacy Agency: $ 27.1 million $ 500 million• MVP Sports Group: $ 27.0 million $ 539 million• BDA: $ 26.5 million $ 663 million• Klutch Sports: $ 25.0 million $ 625 million• Select Sports Group: $ 24.9 million $ 775 million• Orr Hockey Group: $ 22.9 million $ 573 million• SportsStars: $ 22.5 million $ 749 million• Key Sports Management: $ 21.7 million $ 217 million• The Sports Corporation $ 20.4 million $ 509 million• Beverly Hills Sports Council: $ 19.3 million $ 387 million• KO Sports: $ 18.3 million $ 482 million• Landmark Sports Agency: $ 13.8 million $ 216 million• TEAM8: $ 13.7 million $ 85 million• Sports Trust Advisors: $ 13.3 million $ 444 million• Tandem Sports + Entertainment: $ 11.6 million $ 291 million
8.3 Top Agents By LeagueAmong the four major leagues, the top agents (ranked by commissions) in 2018
were as follows (source: Forbes):Major League Baseball• Scott Boras (Boras Corp.): $105.16 million• Casey Close (Excel Sports Management): $ 62.17 million• Sam & Seth Levinson (ACES): $ 49.47 million• Joel Wolfe (Wasserman): $ 39.42 million• Adam Katz (Wasserman): $ 31.89 million• Dan Lozano (MVP Sports Group): $ 26.96 million• Scott Pucino (Octagon): $ 25.76 million• Brodie Van Wagenen (Creative Artists Agency): $ 25.03 million• Greg Genske (The Legacy Agency): $ 24.06 million• Nez Balelo (Creative Artists Agency): $ 21.16 million• Mark Pieper (Independent Sports & Entertainment): $ 20.43 million• Fernando Cuza (Independent Sports & Entertainment): $ 17.27 million
National Basketball Association • Jeff Schwartz (Excel Sports Management): $ 66.78 million• Leon Rose (Creative Artists Agency): $ 39.20 million• Mark Bartelstein (Priority Sports & Entertainment): $ 35.14 million• Rich Paul (Klutch Sports): $ 24.99 million• Thad Foucher (Wasserman): $ 23.26 million• Steven Heumann (Creative Artists Agency): $ 20.37 million• Aaron Mintz (Creative Artists Agency): $ 18.82 million
SPORTS MARKETING 2020-2021
• 69 •

National Football League• Todd France (Creative Artists Agency): $ 41.84 million• Tom Condon (Creative Artists Agency): $ 39.46 million• Joel Segal (Lagardere Sports): $ 38.12 million• Drew Rosenhaus (Rosenhaus Sports Representation): $ 33.70 million• David Dunn (Athletes First): $ 25.46 million• Jimmy Sexton (Creative Artists Agency): $ 23.63 million• Bruce & Ryan Tollner (Rep 1 Sports): $ 22.78 million
National Hockey League• Pat Brisson (Creative Artists Agency): $ 45.35 million• Don Meehan (Newport Sports): $ 33.38 million• J.P. Barry (Creative Artists Agency): $ 31.54 million• Gerry Johannson (The Sports Corporation): $ 20.35 million• Kurt Overhardt (KO SPorts): $ 18.29 million
8.4 Agent AssociationsApproximately 100 NFL agents met in February 2019 to discuss forming an
association. If the effort succeeds, it will be the first association of sports agents.
_________________________________________________________________
“Other attempts to form agent associationshave failed in the past for various reasons,including competitors not wanting to work witheach other.”
SportsBusiness Journal, 1/14/19 _________________________________________________________________
8.5 Market ResourcesSports Agent Blog. (http://sportsagentblog.com)
Top 40 Agencies, Forbes. (www.forbes.com/sports-agencies/list/)
Top 50 Sports Agents, Forbes. (www.forbes.com/sports-agents/list/)
SPORTS MARKETING 2020-2021
• 70 •

9
CONCESSIONS
9.1 Market AssessmentAnnual revenue from on-site game-day concessions at professional sports
stadiums and arenas is approximately $15 billion. Per capita spending on food andbeverage is between $15 and $25.
_________________________________________________________________
“Aramark, which makes food for 28 U.S. sportsarenas, says fans spend about 25% more on foodand beverages than they did five years ago.”
Bloomberg Businesweek _________________________________________________________________
Of 127 major league facilities, 112 have contracts with independent companiesto operate their general concessions; 15 have in-house operations. For premium-seatcatering, 114 facilities have contracts with outside suppliers; 13 handle this service in-house.
Premium concessions is probably the most lucrative aspect of sports arenafoodservice. The NFL’s suite/club seating market alone yields somewhere in theneighborhood of $2 billion annually, according to the Association of Luxury SuiteDirectors (www.alsd.com).
Concession sales at Super Bowl games are, by far, the highest among sportsevents. Over the past five years (2005-2019), food and beverage spending has rangedfrom $5.0 billion to $6.8 billion and $72 to $95 per capita. This spending includes somecatered functions on plazas and an adjacent park as well as general concessions andpremium dining at the stadium.
9.2 ConcessionairesAccording to SportsBusiness Journal (July 2019), the sports concessions
business is distributed by vendor marketshare as follows:Stadiums
• Aramark (www.aramark.com): 25%• Delaware North Sportservice (www.delawarenorth.com): 23%
SPORTS MARKETING 2020-2021
• 71 •

• Levy Restaurants (www.levyrestaurants.com): 23%• Legends Hospitality (www.legends.net): 10%• Centerplate/Sodexo (www.centerplate.com): 8%• In-house: 6%• Spectra (www.spectraconcessions.com): 4%• Others: 2%
Arenas • Levy Restaurants (www.levyrestaurants.com): 45%• Aramark (www.aramark.com): 18%• In-house: 13%• Delaware North Sportservice (www.delawarenorth.com): 10%• Centerplate/Sodexo (www.centerplate.com): 3%• Legends Hospitality (www.legends.net): 3%• Others: 7%
9.3 Favorite Concession Foods And BeveragesA 2018 survey by the National Association of Concessionaires (NAC;
www.naconline.org) found the favorite food and beverage items at stadiums and arenasas follows:• Hot dogs: 17%• Hamburgers: 17%• Soft drinks: 10%• Pizza: 9%
Items that patrons want to added to the menu are as follows:• French fires: 24%• Coffee: 17%• Fruit and veggies: 14%• Chips: 13%
9.4 Best Food At Stadiums And ArenasThe Daily Meal (www.thedailymeal.com) ranks the following professional sports
stadiums and arenas best for food:• Citi Field (Queens, New York, NY)• Mercedes-Benz Superdome (New Orleans, LA)• Cowboys Stadium (Dallas, TX)• Madison Square Garden (New York, NY)• Rose Garden (Portland, OR)• PNC Park (Pittsburgh, PA)• AT&T Park (San Francisco, CA)
SPORTS MARKETING 2020-2021
• 72 •

• Chesapeake Energy Arena (Oklahoma City, OK)• Staples Center (Los Angeles, CA)• Bridgestone Arena (Nashville, TN)• Great American Ball Park (Cincinnati, OH)• Air Canada Centre (Toronto, ON, Canada)• Lambeau Field (Green Bay, WI)• CenturyLink Field (Seattle, WA)• Fenway Park (Boston, MA)
The following stadiums and arenas serve the best luxury-box food:• Staples Center (Los Angeles, CA)• Cowboys Stadium (Dallas, TX)• Jeld-Wen Field (Portland, OR)• Wells Fargo Center (Philadelphia, PA)• Saratoga Race Track (Saratoga, NY)• Wrigley Field (Chicago, IL)• Nationals Field (Washington, DC)
10 Best (www.10best.com), a USA Today travel site, ranked the best stadiumfood in 2018 as follows:• Momocho Nachos (Progressive Field; Cleveland, OH)• Lobster Roll (Fenway Park; Boston, MA)• 4 Bells Shrimp Boil (Target Field; Minneapolis, MN)• Mama's Italian Special Hero (Citi Field; New York, NY)• Ben's Chili Bowl Half-Smoke (Nationals Park; Washington, DC)• Ole 29er (PPG Paints Arena; Pittsburgh, PA)• Bacon Blitz Bread (Lambeau Field; Green Bay, WI)• Tony Luke's Cheesesteak (Citizens Bank Park; Philadelphia, PA)• Hot Chicken Mac & Cheese (Bridgestone Arena; Nashville, TN)• Primanti Sandwich (PNC Park; Pittsburgh, PA)
Travel + Leisure rates the following as the best professional sports stadiums andarenas for food and beverage concessions:• Arrowhead Stadium (Kansas City, MO)• AT&T Park (San Francisco, CA)• Barclays Center (Brooklyn, NY)• CenturyLink Field (Seattle, WA)• Citi Field (New York, NY)• Cowboys Stadium (Arlington, TX)• FirstEnergy Stadium (Cleveland, OH)• Heinz Field (Pittsburgh, PA)• Madison Square Garden (New York, NY)• Miller Park (Milwaukee, WI)• Minute Maid Park (Houston, TX)
SPORTS MARKETING 2020-2021
• 73 •

• Oriole Park at Camden Yards (Baltimore, MD)• Robert F. Kennedy Memorial Stadium (Washington, DC)• Safeco Field (Seattle, WA)• Target Field (Minneapolis, MN)• Turner Field (Atlanta, GA)
The following college stadiums rank highest for foodservice:• University of Notre Dame• Stanford University• University of Oregon• Brigham Young University• University of Alabama• University of Wisconsin• University of Nebraska• University of Missouri
Hot dogs remain a favorite at ball parks. The Hot Dog & Sausage Council(www.hot-dog.org) estimated that 19.0 million hot dogs were consumed in major leaguestadiums during the 2018 season. The top hot dog-eating stadiums are as follows:• Rangers Ballpark (Texas Rangers): 1.6 million• Citizen’s Bank Park (Philadelphia Phillies): 1.5 million• Fenway Park (Boston Red Sox): 1.5 million
9.5 In-Seat OrderingThe National Association of Concessionaires found that 77% of stadium and
arena patrons are disappointed when ballparks, stadiums, and arenas don’t offer in-seat ordering.
_________________________________________________________________
“In-seat ordering, however, has been tough toimplement, including getting fans to downloadand use apps. There is a difference betweenpeople’s appetite for in-seat apps and theiractual usage.”
Paul Pettas, Director Centerplate SportsBusiness Journal, 10/15/18
_________________________________________________________________
SPORTS MARKETING 2020-2021
• 74 •

9.6 Market ResourcesNational Association of Concessionaires, 180 N. Michigan Avenue, Suite 2215,Chicago, IL 60601. (312) 236-3858. (www.naconline.org)
SPORTS MARKETING 2020-2021
• 75 •

10
FANTASY SPORTS
10.1 OverviewFantasy sports dates to the 1960s. Fantasy sports leagues, originally called
rotisserie leagues, where players draft teams from professional sports rosters andfollow season-long statistics to compile their scores, date to the 1980s.
Daily fantasy sports (DFS), which dates to 2007 and surged in popularity in2014, is similar to season-long competitions but last for just one day. In general, DFSdoes not compete for the same players as season-long games.
An assessment for the Fantasy Sports Trade Association (FSTA, www.fsta.org)by Ipsos (www.ipsos.com) estimates participation in fantasy sports in the U.S. andCanada at 60 million people. Eighty-two percent (82%) of all players play in aseason-long league, 19% exclusively play daily formats, and 17% play both formats.
While fantasy sports leagues for football, baseball, basketball, and hockey aremost popular, the range of sports attracting fantasy play includes virtually everycategory of sport and competition. There are even fantasy leagues for bass fishing.
The legalization of sports gambling in 2018 will impact fantasy sports. A June2018 survey by Ipsos for FSTA found that 79% of fantasy sports players who are notcurrent sports wagerers say they will likely participate in sports betting once legalized intheir state.
The following are other findings of the survey:• Ninety-two percent (92%) of current season-long fantasy sports players and 87% of
current daily fantasy sports players said they would play their respective fantasysports as often as they do now once legislation is passed in their state.
• Fantasy players who place sports wagers are willing to spend money onsports-related subscriptions, goods and services; 89% pay for extras like NFLSunday Ticket, MLB.tv, and NHL Center Ice.
• Crossover players (i.e., those who both play fantasy sports and wager) place wagersmore often than exclusive bettors. Seventy percent (70%) of crossover playersplaced weekly wagers while only 59% of exclusive bettors placed weekly wagers.
10.2 Market AssessmentEstimates of total spending for traditional fantasy sports are as high as $5 billion
annually – up to $468 per player – for publication subscriptions, league entrance fees,mail-order draft kits, fantasy software, and other products. League entrance fees arereturned to winning players, however, so net spending is considerably less than the $5
SPORTS MARKETING 2020-2021
• 76 •

billion figure. The FSTA places annual net spending at $1.7 billion.Each year, 1.5 million people pay more than $1 billion in DFS tournament fees.
FanDuel (www.fanduel.com), the largest DFS site, reported paying out over $400million in prizes (i.e., returning a percentage of entry fees to winners).
SportsBusiness Journal estimates annual net spending (i.e., total entry feesminus prizes) for daily fantasy sports at $660 million.
10.3 DemographicsAccording to an ESPN Sports Poll (http://espn.go.com/sportsnation/polls), the
percentages of people by age and gender who play online fantasy sports daily are asfollows:
Men Women
• 12-to-17: 6.8% 1.0%• 18-to-34: 8.0% 1.7%• 35-to-54: 8.4% 1.1%
The following percentages play online fantasy sports weekly: Men Women
• 12-to-17: 12.5% 5.1%• 18-to-34: 13.5% 3.0%• 35-to-54: 8.4% 1.5%
10.4 Season-Long Fantasy SportsFantasy players create teams using real statistics from actual players and
compete with other players in a league based on the performance of their fantasy team. Leagues typically consist of between eight and 14 teams. Fantasy players pay an entryfee to play; winning players receive cash prizes.
_________________________________________________________________
“In a typical league, a dozen or so participantschip in money – $20 on the low end and $1,300or more for high-stakes contests. The teamwith the best aggregate statistics wins at theend of the regular season and takes the lion’sshare of prize money.”
Forbes _________________________________________________________________
SPORTS MARKETING 2020-2021
• 77 •

League winners can earn a grand prize of $100,000 in national competitionssuch as NBC Sports’ national fantasy baseball competition, a season-long contest of 26leagues and 309 teams.
Most fantasy sport players play multiple sports, with football being the mostpopular. According to the FSTA, the following are percentages of participants and totalspending for the five most popular sports:
Participation Spending
• Football: 93% 48%• Baseball: 70% 33%• Basketball: 35% 12%• Hockey: 24% 3%• NASCAR: 23% 3%
Major media companies, including CBS, ESPN, Fox, and Yahoo!, have becomeactive in the fantasy sports business, operating leagues and providing services toplayers. While most fantasy operators previously charged players a fee to play, moreleagues are now free. A company like CBS makes money by selling to players a rangeof products such as draft guides and expert analysis, and through advertising.
Fantasy sports is supported by about a dozen magazines, about 200 websites(some fee-based), and countless amateur blogs.
At the pinnacle of traditional fantasy sports are football leagues where winningparticipants can make as much as $300,000 in a good year.
_________________________________________________________________
“The Diamond [National Fantasy FootballChampionship’s Diamond League] may well bethe world’s most serious fantasy football league. The entry fee is $10,000. The winner stands topocket $80,000. It is the most expensive amongmore than 300 pay-to-play leagues run by thesports information company Stats, which holds itsdrafts in Las Vegas, New York, and Chicago, aswell as online. More than 1,000 players, nearly allof them men, spend a combined $2 million for theright to manage some 4,000 teams in Statsfootball leagues.”
Bloomberg Businessweek _________________________________________________________________
SPORTS MARKETING 2020-2021
• 78 •
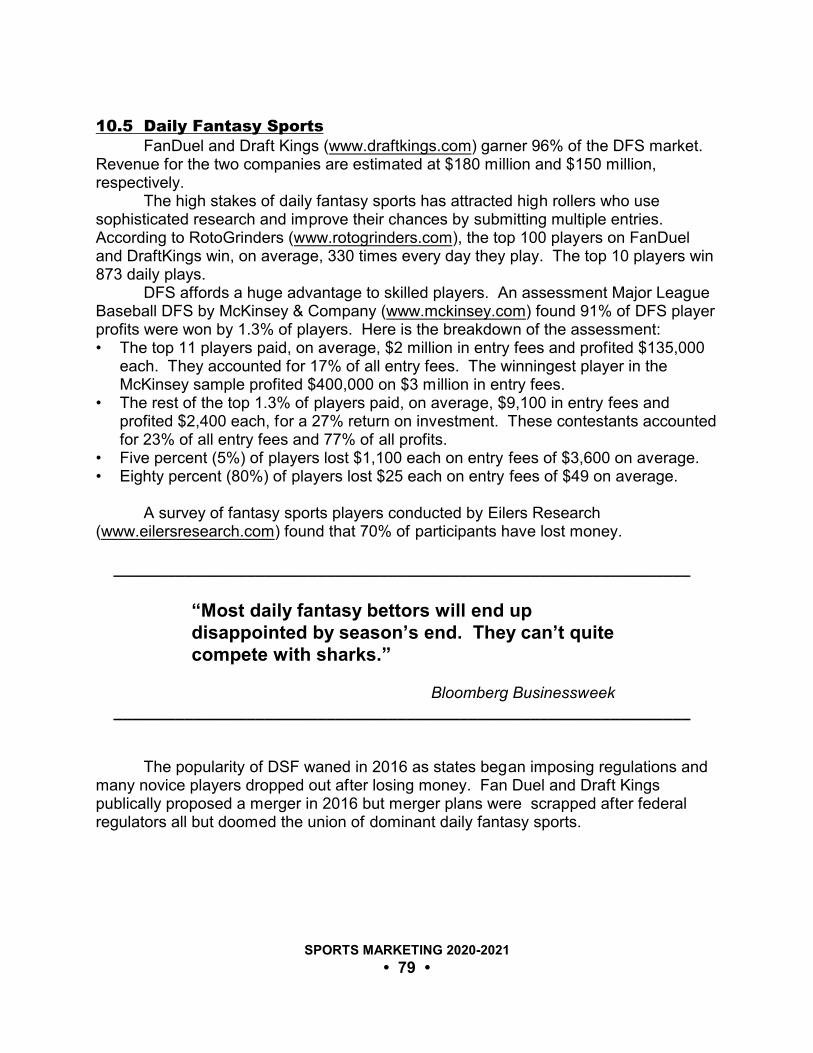
10.5 Daily Fantasy SportsFanDuel and Draft Kings (www.draftkings.com) garner 96% of the DFS market.
Revenue for the two companies are estimated at $180 million and $150 million,respectively.
The high stakes of daily fantasy sports has attracted high rollers who usesophisticated research and improve their chances by submitting multiple entries. According to RotoGrinders (www.rotogrinders.com), the top 100 players on FanDueland DraftKings win, on average, 330 times every day they play. The top 10 players win873 daily plays.
DFS affords a huge advantage to skilled players. An assessment Major LeagueBaseball DFS by McKinsey & Company (www.mckinsey.com) found 91% of DFS playerprofits were won by 1.3% of players. Here is the breakdown of the assessment:• The top 11 players paid, on average, $2 million in entry fees and profited $135,000
each. They accounted for 17% of all entry fees. The winningest player in theMcKinsey sample profited $400,000 on $3 million in entry fees.
• The rest of the top 1.3% of players paid, on average, $9,100 in entry fees andprofited $2,400 each, for a 27% return on investment. These contestants accountedfor 23% of all entry fees and 77% of all profits.
• Five percent (5%) of players lost $1,100 each on entry fees of $3,600 on average.• Eighty percent (80%) of players lost $25 each on entry fees of $49 on average.
A survey of fantasy sports players conducted by Eilers Research(www.eilersresearch.com) found that 70% of participants have lost money.
_________________________________________________________________
“Most daily fantasy bettors will end updisappointed by season’s end. They can’t quitecompete with sharks.”
Bloomberg Businessweek _________________________________________________________________
The popularity of DSF waned in 2016 as states began imposing regulations andmany novice players dropped out after losing money. Fan Duel and Draft Kingspublically proposed a merger in 2016 but merger plans were scrapped after federalregulators all but doomed the union of dominant daily fantasy sports.
SPORTS MARKETING 2020-2021
• 79 •

10.6 Fantasy Sports and Professional Sports LeaguesFantasy sports has been a boon for professional sports. Ipsos found that among
fantasy players, 61% report watching more live sports because of fantasy.In past years, professional sports leagues avoided involvement with fantasy
sports because of the possible link with wagering activities. This has changed, andMLB, the NBA, and the NFL all provide support for fantasy players.
Major League Baseball has a partnership with DraftKings, which offers a dailycontest on MLB.com in which prizes include tickets to games rather than cash.
The National Football League hosts season-long leagues on its website;provides fantasy analysis of players and winning strategies; and offers Fantasy UltimateExperience Leagues, pay-to-enter contests with authentic jerseys and memorabilia asprizes.
The National Basketball Association website (www.nba.com) has a FantasyCentral feature that provides player rankings, @NBAFantasy Draft Results, and otherinsight for fantasy players.
_________________________________________________________________
“The surprise has been that professionalleagues – traditionally ferocious opponents ofgambling on their sports, online or off – havequietly embraced gambling on fantasy sports,apparently aware that the passion for it iscrucial to their bottom lines.”
The New York Times _________________________________________________________________
DraftKings has sponsorship deals with 18 teams in MLB, NBA, NFL, and NHL;FanDuel has 11 sponsorships.
Major League Baseball has an investment stake in DraftKings.
10.7 Market ResourcesFantasy Sports Business (www.fantasysportsbusiness.com) - an online newsletter
Fantasy Sports Trade Association, 22 N. Carroll Street, Suite 300, Madison, W I 53703.(608) 310-7540. (www.fsta.org)
SPORTS MARKETING 2020-2021
• 80 •

11
FITNESS & HEALTH CLUBS
11.1 Fitness ActivitiesAccording to The American Time Use Survey, published by the Bureau of Labor
Statistics (www.bls.gov) of the U.S. Department of Labor, Americans on average spend18 minutes per day participating in sports, exercise, or recreation. Among those whoparticipate in these activities at all, the average is 1.7 hours daily, representing aboutone-third of leisure activity time.
On average, teens are active 40 minutes a day; people age 35 and above spend15 minutes or less being active. The survey suggests that Americans tend to do lessphysical activity as they get older.
11.2 Fitness and Health ClubsAccording to the International Health, Racquet & Sportsclub Association,
(IHRSA, www.ihrsa.org), the number of health and fitness clubs in the U.S. and totalmembership has been as follows (source: (IHRSA):
# Clubs Membership
• 2005: 26,830 41.3 million• 2006: 29,069 42.7 million• 2007: 29,357 41.5 million• 2008: 29,636 45.5 million• 2009: 29,750 45.3 million• 2010: 29,890 50.2 million• 2011: 29,960 51.4 million• 2012: 30,500 50.2 million• 2013: 32,150 52.9 million• 2014: 34,460 54.1 million• 2015: 34,523 54.7 million• 2016: 36,180 55.3 million• 2017: 38,477 60.9 million• 2018: 39,570 62.4 million
In total, 71.4 million adults used a health club in 2018; 14% were non-members. Total health club/gym/studio visits surpassed 5 billion. Member retention and netmembership growth were 71.4% and 2.4%, respectively.
SPORTS MARKETING 2020-2021
• 81 •

Members utilized the health club for an average of 102 days. Males membersvisited their health clubs for an average of 104 days; females used their clubs for anaverage of 100 days.
Not-for-profit organizations, such as the YMCA, operate more than 5,000 of the39,570 clubs.
Revenue for U.S. fitness centers was $32.4 billion in 2018, an increase from$30.0 billion the previous year.
Global health club industry revenue totaled $94 billion in 2018, with more than210,000 clubs serving 183 million members, according to the IHRSA.
A recent trend has been the rise in popularity of cross-training gyms. Accordingto the Sports and Fitness Industries Association (SFIA, www.sfia.org), 6.6 millionpeople practice boot-camp-style cross-training; 2.0 million are core participants,participating 50 or more times.
11.3 Market LeadersIHRSA Global 25 identified the following companies as fitness and health club
market leaders in the U.S.:• 24 Hour Fitness• 9 Round• Active Sports Clubs• Anytime Fitness• ClubCorp.• CrossFit• Crunch• Fitness Formula Clubs• Gold’s Gym International • Koko Fitness• LA Fitness International• Leisure Sports Inc.• Life Time Fitness• Orangetheory Fitness• Pure Barre• Snap Fitness• The Bay Club Company• Town Sports International Holdings Inc.• UFC
11.4 Market ResourcesFitness Centers Industry Profile, First Research, April 2019.(www.firstresearch.com/Industry-Research/Fitness-Centers.html)
SPORTS MARKETING 2020-2021
• 82 •

Gym, Health & Fitness Clubs in the U.S., IBISWorld, April 2019.(www.ibisworld.com/industry/default.aspx?indid=1655)
International Health, Racquet & Sportsclub Association (IHRSA), 70 Fargo Street,Boston, MA 02210. (800) 228-4772. (www.ihrsa.org)
Sports & Fitness Industry Association (SFIA), 962 Wayne Avenue, Suite 300,Silver Spring, MD 20910. (301) 495-6321. (www.sfia.org)
SPORTS MARKETING 2020-2021
• 83 •

12
GAME PROMOTIONS
12.1 OverviewMost professional sports teams offer promotional giveaways. Among them, MLB
teams are most active. An assessment by researchers at the Center for Sports Business & Research at
Penn State of promotions used by the Pittsburgh Pirates found that giveaways,entertainment, and events had a significant impact on attendance, more so than theteam performance, the popularity of the opponent, or weather. Among 21 categories ofpromotions, the study found skyblasts, concerts, and bobbleheads to be most popular.
12.2 GiveawaysThe following giveaways were offered by MLB clubs during the 2018 season
(source: SportsBusiness Journal): No. of Teams No. of Dates
• Bobblehead: 30 157• T-shirt: 28 114• Headwear/cap: 30 103• Backpack/bag: 29 59• Wall hanging: 18 51• Jersey: 19 48• Toy: 20 36• Figurine: 21 34• Magnetic schedule: 23 33• Baseball cards: 23 31
_________________________________________________________________
“As MLB clubs wrestle with the challenges ofattracting fans to ballparks, their reliance on non-baseball brands to do the trick – and, of course,bobbleheads – continues to grow.”
SportsBusiness Journal, 12/10/18 _________________________________________________________________
SPORTS MARKETING 2020-2021
• 84 •

12.3 Promotions and EventsThe following promotions were used by MLB clubs during the 2018 season
(source: SportsBusiness Journal): No. of Teams No. of Dates
• Concessions discount: 18 229• Fireworks: 24 209• Ticket discount: 13 174• Autographs: 7 152• Run the bases: 19 147• Festival: 18 121• Theme night: 26 117• Family day: 15 97• Cultural celebration: 19 96• Team history tribute: 26 88
12.4 All-You-Can-Eat PromotionsAll-you-can-eat promotions at games was introduced in 2007 by the Los Angeles
Dodgers. Fans buy tickets in special, non-premium seating areas for unlimited foodand non-alcoholic beverages. Typically selling for as low as $20 during the week, theseats are priced at up to $50 with upscale menu items at some stadiums.
Nineteen of the 30 MLB teams have all-you-can-eat sections.
_________________________________________________________________
“The all-you-can-eat seat is one of baseball’smore controversial (and successful) solutionsto sell hard-to-fill sections. You can find thepromotion in minor league parks as well. Nutritionists, of course, shudder at the notion.”
The Washington Post _________________________________________________________________
Promotions vary among teams, from Chicago White Sox’s patio parties at U.S.Cellular Field to the all-inclusive sections at every home game at Oriole Park atCamden Yards in Baltimore and PNC Park in Pittsburgh. The Dodgers’ 5,519-seat all-you-can-eat sections make up 10% of stadium capacity.
Several teams have enhanced promotional revenue by selling naming rights totheir all-you-can-eat sections. Convenience store chain Ampm (www.ampm.com) hasnaming-rights deals with five of the 19 MLB clubs that have such seating sections.
SPORTS MARKETING 2020-2021
• 85 •

13
LICENSED MERCHANDISE
13.1 Professional Sports PropertiesPricewaterhouseCoopers (www.pwc.com) assesses the market for professional
and collegiate sports licensed merchandise as follows:• 2010: $12.57 billion• 2011: $12.48 billion• 2012: $12.77 billion• 2013: $13.14 billion• 2014: $13.49 billion• 2015: $13.81 billion• 2016: $13.97 billion• 2017: $14.20 billion• 2018: $14.42 billion• 2019: $14.62 billion• 2020: $14.82 billion
According to The Licensing Letter, sports-licensed merchandise accounts for13.5% of the total U.S. licensing market.
13.2 Professional Sports Licensed MerchandiseMerchandise emblazoned with logos of professional sports licensors generated
$13.4 billion in retail sales in 2018, according to The Licensing Business. Distributionwas as follows:• MLB: $3.84 billion• NFL: $3.64 billion• NBA: $2.83 billion• NHL: $1.09 billion• NASCA: $ 863 million• Pro Soccer*: $ 780 million• PGA Tour: $ 349 million• * Includes European and Latin American teams
SPORTS MARKETING 2020-2021
• 86 •

13.3 Top-Selling Professional Sports JerseysThe following are the top-selling professional sports jerseys:
MLB (2018 season)• Aaron Judge (New York Yankees)• Jose Altuve (Houston Astros)• Javier Báez (Chicago Cubs)• Clayton Kershaw (Los Angeles Dodgers)• Mookie Betts (Boston Red Sox)• Anthony Rizzo (Chicago Cubs)• Kris Bryant (Chicago Cubs)• Shohei Ohtani (Los Angeles Angels)• Giancarlo Stanton (New York Yankees)• Yadier Molina (St. Louis Cardinals)
NBA (2018-2019 season)• LeBron James (Los Angeles Lakers)• Stephen Curry (Golden State Warriors)• Giannis Antetokounmpo (Milwaukee Bucks)• Kyrie Irving (Boston Celtics)• Joel Embiid (Philadelphia 76ers)• James Harden (Houston Rockets)• Russell Westbrook (Oklahoma City Thunder)• Kevin Durant (Golden State Warriors)• Ben Simmons (Philadelphia 76ers))• Jimmy Butler (Philadelphia 76ers)
NFL (2018-2019 season)• Baker Mayfield (Cleveland Browns)• Khalil Mack (Chicago Bears)• Tom Brady (New England Patriots)• Carson Wentz (Philadelphia Eagles)• Aaron Rodgers (Green Bay Packers)• Saquon Barkley (New York Giants)• Jimmy Garoppolo (San Francisco 49ers)• Patrick Mahomes (Kansas City Chiefs)• Ezekiel Elliott (Dallas Cowboys)• Odell Beckham (New York Giants)
NHL (2018-2019 season)• Auston Matthews (Toronto Maple Leafs)• Sidney Crosby (Pittsburgh Penguins)• Connor McDavid (Edmonton Oilers)• Marc-Andre Fleury (Vegas Golden Knights)
SPORTS MARKETING 2020-2021
• 87 •

• Henrik Lundqvist (New York Rangers)• Alex Ovechkin (Washington Capitals)• Mats Zuccarello (New York Rangers)• Patrick Kane (Chicago Blackhawks)• Jonathan Toews (Chicago Blackhawks)• Vladimir Tarasenko (St. Louis Blues)
WNBA (2018 season)• Elena Delle Donne (Washington Mystics)• Breanna Stewart (Seattle Storm)• Diana Taurasi (Phoenix Mercury)• Maya Moore (Minnesota Lynx)• Sue Bird (Seattle Storm)• Candace Parker (Los Angeles Sparks)• Skylar Diggins-Smith (Dallas Wings)• Brittney Griner (Phoenix Mercury)• Moriah Jefferson (San Antonio Stars)• Nneka Ogwumike (Los Angeles Sparks)
13.4 Top-Selling Professional Sports Team MerchandiseThe top-selling professional sports team merchandise is as follows:
MLB (2018 season)• New York Yankees• Los Angeles Dodgers• Chicago Cubs
NBA (2018-2019 season)• Los Angeles Lakers• Golden State Warriors• Boston Celtics
NFL (2018-2019 season)• Dallas Cowboys• New England Patriots• Seattle Seahawks
NHL (2018-2019 season)• Edmonton Oilers• Chicago Blackhawks• Toronto Maple Leafs
SPORTS MARKETING 2020-2021
• 88 •

WNBA (2018 season)• Seattle Storm• Dallas Wings• Minnesota Lynx
13.5 Collegiate MerchandiseAccording to The Licensing Letter, annual retail sales of licensed collegiate
merchandise are $4.6 billion in the U.S. and Canada. The market includes sports andgeneral merchandise; the bulk of spending is for sports-related items.
Collegiate Licensing Company (CLC, www.clc.com), part of IMG College(www.imgcollege.com), accounts for 75% to 80% of the collegiate licensing market. Licensing Resource Group (www.lrgusa.com) is the second largest agencyrepresenting schools.
Collegiate Licensing Company estimates the total collegiate licensing businesshigher than The Licensing Letter, at $5.5 billion, because CLC includes in itsassessment non-royalty-bearing merchandise sold through college stores.
According to CLC, apparel accounts for 65% of licensed collegiate merchandise. Distribution of licensed apparel merchandise is as follows:• T-shirts: 24%• Women’s fleece: 16%• Men’s/unisex fleece: 14%• Headwear: 13%• Other: 33%
Distribution of non-apparel product categories, which account for 35% of thecollegiate licensing market, is as follows:• Videogames: 24%• Domestics: 9%• Housewares: 8%• Gifts/novelties: 6%• Other: 53%
Sales of licensed merchandise are highest for the following university brands(source: Collegiate Licensing Company):• University of Alabama• University of Texas• University of Notre Dame• University of Michigan• University of Georgia• Texas A&M University• University of Florida• Louisiana State University
SPORTS MARKETING 2020-2021
• 89 •

• Florida State University• University of North Carolina
According to Collegiate Licensing Company, the following are the top collegiatemerchandise licensees:Apparel• Knights Apparel• Nike USA• Top of the World• adidas Team• Champion Custom Products• Outerstuff• Gear for Sports• Twins Enterprise• J. America• Colosseum Athletics Corp.
Non-Apparel• EA Sports• Fabrique Innovations• Wilson Sporting Goods• The Northwest• Commemorative Brands• Upper Deck• Herff Jones• Team Beans• Jenkins Enterprises• Tervis Tumbler
13.6 Market ResourcesThe Licensing Letter, Plain Language Media, P.O. Box 509, New London, CT 06320.(604) 210-4580. (www.thelicensingletter.com)
License! Global, 2 Penn Plaza, 15th Floor, New York City, NY 10121. (212) 600-3000.(www.licensemag.com)
Licensing Industry Merchandisers’ Association, 350 Fifth Avenue, Suite 4019, New York, NY 10118. (212) 244-1944. (www.licensing.org)
Sports Licensing & Tailgate Show (www.sportstailgateshow.com)
SPORTS MARKETING 2020-2021
• 90 •

14
MEMORABILIA
14.1 Market AssessmentThe annual U.S. market for sports memorabilia is approximately $4 billion. This
figure includes the autographed sports collectible market, which is estimated bySportsMemorabilia.com at $1 billion.
According to Sports Market Report, 92% of sports memorabilia collectors aremale, average age 37 years old. Their average income is $91,775 and 68% are collegeeducated.
_________________________________________________________________
“The sports memorabilia market ... has grownfrom a hobby started by amateurs into abillion-dollar industry complete withauthenticators, insurers and some memorabiliaselling for millions of dollars. For decades,players routinely gave away their autographsand their gear, including balls, bats and jerseys. Trading cards were mostly collected bychildren. It wasn’t until the go-go years of the1980s, when the first Baby Boomers werereaching middle age, that large amounts ofmoney poured into the sports memorabiliamarket, especially for baseball-related items,which make up about 70% of the vintage market. Serious collectors began paying five-, six- andeven seven-figure sums for scarce items, likejerseys worn by Ruth, Joe DiMaggio andothers.”
The New York Times, 10/27/18 _________________________________________________________________
SPORTS MARKETING 2020-2021
• 91 •

According to Beckett Media (www.beckett.com), 34% of collectors buy in shops,33% from online auctions, and 24% from online fixed-price dealers. The averagemonthly expenditure of online buyers is $149.
14.2 Sports Memorabilia AuctionsWith all collectibles, high-end pieces are in greatest demand and have the
highest increases in value. The bulk of high-end sports memorabilia is sold throughauction houses, which typically collect a 15% consignment fee from the seller and a20% premium from the buyer.
The following are the major auction houses specializing in sports memorabilia:• BidAmi Auctions, 6490 West Desert Inn Road, Las Vegas, NV 89146.
(702) 659-7976. (www.americanmemorabilia.com)• Bill Goodwin & Co., 9607 Mill Hill Lane, St. Louis, MO 63127. (314) 849-9798.
(www.goodwinandco.com)• Guernsey’s Auction, 65 East 93rd Street, New York, NY 10128. (212) 794-2280.
(www.guernseys.com)• Heritage Auction Galleries, 3500 Maple Avenue, 17th Floor, Dallas, TX 75219.
(214) 528-3500. (www.ha.com)• Huggins & Scott, 2301 Broadbirch Drive, Suite 150, Silver Spring, MD 20904.
(301) 608-0355. (www.hugginsandscott.com)• Leland’s, 130 Knickerbocker Avenue, Suite E, Bohemia, NY 11716. (631) 244-0077.
(www.lelands.com)• Memory Lane, 12831 Newport Avenue, Suite 180, Tustin, CA 92780.
(877) 606-5263. (www.memorylaneinc.com)• Robert Edward Auctions, P.O. Box 430, Chester, NJ 07930. (908) 888-2555.
(www.robertedwardauctions.com)• SCP Auctions, 32451 Golden Lantern, Suite 308, Laguna Niguel, CA 92677.
(800) 350-2273. (www.scpauctions.com)• Sotheby’s, Collectibles & Memorabilia Department, 1334 York Avenue, New York,
NY 10021. (212) 606-7000. (www.sothebys.com)
Also, eBay is a popular outlet for sports memorabilia trading.
14.3 Sports CardsThe sports trading card industry peaked with sales of $1.1 billion in 1991; sales
in 2018 were about $300 million. The number of card stores nationwide is down to lessthan 1,000, from about 4,500 at peak.
The popularity of baseball card collecting has faltered, in part, becausemanufacturers began focusing the market toward investors, some charging up to $150for packs that included extras such as autographs and small pieces of jerseys. Toppsis redirecting the market back to kids with basic cards that are inexpensive.
SPORTS MARKETING 2020-2021
• 92 •

Only Topps Company (www.topps.com) and Upper Deck (www.upperdeck.com) remain significant trading card producers; there once were about 80 producers.
14.4 Market ResourcesBeckett Media, 4635 McEwen Road, Dallas, TX 75244. (972) 991-6657. (www.beckett.com)
Sports Collector’s Digest and Sports Collector’s Monthly, P.O. Box 421751, Palm Coast, FL 32142. (800) 829-5561. (www.sportscollectorsdigest.com)
SPORTS MARKETING 2020-2021
• 93 •

15
SPORTS BETTING
15.1 A New Era In Legal Sports WageringThe Professional and Amateur Sports Protection Act (PASPA), enacted by
Congress in 1992, prohibited the expansion of sports betting beyond Delaware,Montana, Nevada, and Oregon – the four states that had already conducted or wereformally considering legislation on some form of sports betting. Among these states,only Nevada allowed casino sports betting.
In May 2018, the Supreme Court struck down PASPA, the federal law thatbarred gambling on football, basketball, baseball, and other sports in most states, givingstates the go-ahead to legalize betting on sports.
According to a report from Eilers & Krejcik Gaming (www.ekgamingllc.com), atleast 18 state legislatures were preparing bills prior to the Supreme Court ruling tolegalize and regulate sports gambling. The report projected that 32 states would likelyoffer sports betting within five years.
As of September 2019, eight states had legislation allowing sports betting.
15.2 Market AssessmentThe American Gaming Association (www.americangaming.org) estimates that
Americans illegally wager about $150 billion on sports each year.
_________________________________________________________________
“Americans are now betting more than $150billion annually on professional and collegecontests. (All but $250 million of it is illegal,which is why definitive figures are hard to comeby.) By comparison, the non-betting sportsindustry – ticket sales, media rights, advertisingrevenue – is expected to reach around $74billion next year.”
The New York Times, 3/30/18 _________________________________________________________________
SPORTS MARKETING 2020-2021
• 94 •

15.3 Nevada Sports BooksIn Nevada, there are 191 licensed sports books in operation. Sports wagering
represents approximately 1.5% of the total casino win amount in Nevada. According to the Nevada Gaming Commission and State Gaming Control Board
(www.gaming.nv.gov), $4.91 billion was wagered at Nevada sports books in 2018. Gross gaming revenue (GGR) for sporting events was $277.3 million. The win was5.7% of the amount wagered.
Wagers and GGR were distributed by event in 2018 as follows: Wagers Win Pct. GGR
• Football: $1.81 billion (37% of total) 5.6% $102.4 million• Basketball: $1.51 billion (31% of total) 6.6% $ 99.6 million• Baseball: $1.03 billion (21% of total) 4.6% $ 47.2 million• Other: $ 556 million (11% of total) 5.1% $ 28.9 million
Las Vegas’ sports book facilities have evolved into stylish environments withsophisticated technology designed to keep bettors engaged. Most casinos providecomfortable chairs, lighted tables for studying sports and race sheets, and free cocktailsfor those who make even a small wager.
The most attractive feature in recent years has been the introduction of mobilewagering. Players using wireless handsets can place bets instantly, even whilewatching an event, which eliminates the waits in lines at betting windows. The devicescan be used to place side wagers, called in-running bets, on virtually every play in agame.
15.4 States Allowing Legal Sports BettingIn 2018, seven states passes legislation allowing sports betting, as follows:
• Delaware• Mississippi• New Mexico• New Jersey• Pennsylvania• Rhode Island• West Virginia
Online and mobile wagering are allowed in all of these states except Delaware.The date of the first sports wager, number of sports books, and gross gaming
revenue for the first nine months (i.e., June 2018 through February 2019) are asfollows:
Date No. Books GGR
• Delaware: June 2018 5 $ 10.4 million• Mississippi: June 2018 29 $ 20.7 million• New Mexico:* October 2018 2 n/a
SPORTS MARKETING 2020-2021
• 95 •

• New Jersey: June 2018 11 $125.7 million• Pennsylvania: November 2018 6 $ 7.1 million• Rhode Island: November 2018 2 $ 300,000• West Virginia: September 2018 5 $ 7.7 million* Sports betting in New Mexico is allowed only on tribal grounds. Wagering data is not available.
SPORTS MARKETING 2020-2021
• 96 •

16
SPORTING GOODS
16.1 Spending At Sporting Goods StoresAccording to the Census Bureau (www.census.gov) of the U.S. Department of
Commerce, total sales at sporting goods stores (NAICS Code 45111) have been asfollows:• 2004: $28.64 billion• 2005: $30.71 billion• 2006: $33.87 billion• 2007: $35.80 billion• 2008: $36.75 billion• 2009: $36.52 billion• 2010: $37.32 billion• 2011: $39.00 billion
• 2012: $42.14 billion• 2013: $44.37 billion• 2014: $44.63 billion• 2015: $47.06 billion• 2016: $47.27 billion• 2017: $43.37 billion• 2018: $42.43 billion
These figures do not include sporting goods sales at general merchandisestores.
Sales in 2018 were distributed by month as follows:• January: $2.80 billion• February: $2.88 billion• March: $3.59 billion• April: $3.46 billion• May: $3.61 billion• June: $3.89 billion
• July: $3.70 billion• August: $3.99 billion• September: $3.36 billion• October: $3.18 billion• November: $3.73 billion• December: $5.13 billion
16.2 Sporting Goods Category SpendingThe National Sporting Goods Association (NSGA, www.nsga.org) assessed
annual spending for sporting goods at $64 billion. Distribution by category is follows:• Equipment: 50%• Athletic footwear: 33%• Sports apparel: 17%
16.3 Spending DistributionThe NSGA estimates consumer equipment purchases by sport as follows:
SPORTS MARKETING 2020-2021
• 97 •

• Exercise: $5.47 billion • Golf: $3.29 billion• Team goods sales: $2.62 billion• Fishing tackle: $2.09 billion • Camping: $1.75 billion • Optics: $1.30 billion • Snow skiing: $ 619 million• Baseball & softball: $ 452 million• Archery: $ 451 million • Tennis: $ 425 million• Billiards & indoor games: $ 350 million • Skin diving & scuba: $ 348 million• Wheel sports: $ 341 million• Snowboarding: $ 312 million• Basketball: $ 261 million• Helmets & sport protective: $ 211 million• Hockey & ice skates: $ 166 million• Bowling: $ 155 million • Football: $ 87 million• Soccer (balls): $ 77 million• Lacrosse: $ 43 million • Volleyball & badminton: $ 37 million• Racquetball: $ 27 million
Sports equipment sales are distributed by retail channel as follows (source:NSGA):• Sporting goods stores: 31%• Discount stores/warehouse clubs: 15%• Specialty sport shops: 12%• Department stores: 12%• Online: 11%• Pro shops: 5%• Specialty fitness shops: 2%• Other: 11%
Athletic footwear sales are distributed by retail channel as follows (source:NSGA):• Discount stores/warehouse clubs: 18%• Sporting goods stores: 16%• Specialty athletic footwear stores: 15%• Department stores: 11%• Family footwear stores: 11%• Online: 9%• Factory outlet stores: 8%
SPORTS MARKETING 2020-2021
• 98 •

• Specialty sport shops: 5%• Other: 7%
16.4 TrendsAccording to the Sports & Fitness Industry Association (SFIA, www.sfia.org), the
biggest challenge facing the sporting goods industry is, by far, the decline in sportsparticipation. With the exception of fitness activities, Americans are far less involved insports and outdoors activities than they were 15 years ago. Sports such as softball,volleyball, baseball, badminton, and tennis have lost millions of casual participants. Fitness has seen an increase in the number of frequent participants in recent years, butstill has fewer frequent participants as a percentage of the total population than it had in1990.
Organized team sports in schools and leagues have grown in recent years,largely because of a strong infusion of female players. But many organized teamsports tend to emphasize elite players and competition, freezing out millions who mightlike to play for fun.
16.5 Marketshare LeadersThe largest sporting goods chains, ranked by annual U.S. sales, are as follows:
• Dick’s Sporting Goods (www.dickssportinggoods.com): $8.6 billion• Bass Pro Shops (www.basspro.com): $7.3 billion• Foot Locker (www.footlocker.com): $5.9 billion• Academy Sports & Outdoors (www.academy.com): $4.6 billion• Cabela’s, Inc. (www.cabelas.com): $4.1 billion• Big 5 Sporting Goods (www.big5sportinggoods.com): $1.0 billion• Hibbett Sports (www.hibbett.com): $ 968 million
16.6 Market ResourcesNational Sporting Goods Association (NSGA), 1601 Feehanville Drive, Suite 300, Mt. Prospect, IL 60056. (847) 296-6742. (www.nsga.org)
Sports & Fitness Industry Association (SFIA), 962 Wayne Avenue, Suite 300,Silver Spring, MD 20910. (301) 495-6321. (www.sfia.org)
SPORTS MARKETING 2020-2021
• 99 •

17
SPORTS HALLS OF FAME & MUSEUMS
17.1 OverviewThere are approximately 80 national sports museums and halls of fame in North
America, in addition to dozens of team and local sports museums.
17.2 Largest Halls of FameThe following are recent attendance estimates for the largest sports halls of
fame:• National Baseball Hall of Fame (Cooperstown, NY): 350,000• Hockey Hall of Fame (Toronto, Ontario, Canada): 300,000• NASCAR Hall of Fame (Charlotte, NC): 260,000• College Football Hall of Fame (Atlanta, GA): 250,000• Naismith Memorial Basketball Hall of Fame (Springfield, MA): 200,000• World Golf Hall of Fame (St. Augustine, FL): 210,000• Pro Football Hall of Fame (Canton, OH): 200,000
Revenue at major sports halls of fame are as follows (source: SportsBusiness Journal):• Pro Football Hall of Fame (Canton, OH): $17.0 million• Hockey Hall of Fame (Toronto, Ontario, Canada): $13.1 million• National Baseball Hall of Fame (Cooperstown, NY): $ 8.3 million• International Tennis Hall of Fame (Newport, RI): $ 6.9 million• Naismith Memorial Basketball Hall of Fame (Springfield, MA): $ 6.2 million
17.3 List Of Sports MuseumsThe following is a list of U.S. and Canadian sports museums and halls of fame
(team and local museums are excluded):• Alabama Sports Hall of Fame (Birmingham, AL; www.ashof.org)• Archery Hall of Fame and Museum (Union City, PA; www.archeryhalloffame.org)• Babe Ruth Birthplace & Museum (Baltimore, MD; http://baberuthmuseum.org)• Bay Area Sports Hall of Fame (San Francisco, CA; www.bashof.org)• California Surf Museum (Oceanside, CA; www.surfmuseum.org)• College Baseball Hall of Fame (Lubbock, TX; www.collegebaseballhall.org)
SPORTS MARKETING 2020-2021
• 100 •

• College Football Hall of Fame (Atlanta, GA; www.cfbhall.com)• Colorado Sports Hall of Fame (Denver, CO; www.coloradosports.org)• Delaware Sports Museum and Hall of Fame (Wilmington, DE; www.desports.org)• Don Garlits Museum of Drag Racing (Ocala, FL; www.garlits.com)• Georgia Sports Hall of Fame (Macon, GA; http://georgiasportshalloffame.com)• Hispanic Heritage Baseball Museum Hall of Fame (San Francisco, CA;
www.hispanicbaseballmuseum.com)• Hockey Hall of Fame (Toronto, ON, Canada; www.hhof.com)• Indiana Basketball Hall of Fame (New Castle, IN; http://hoopshall.com)• Indiana Football Hall of Fame (Richmond, IN; www.indiana-football.org)• Indianapolis Motor Speedway Hall of Fame Museum (Indianapolis, IN;
www.indianapolismotorspeedway.com/at-the-track/museum)• International Bowling Museum & Hall of Fame (Arlington, TX;
www.bowlingmuseum.com)• International Boxing Hall of Fame (Canastota, NY; www.ibhof.com)• International Gymnastics Hall of Fame (Oklahoma City, OK; www.ighof.com)• International Motorsports Hall of Fame (Talladega, AL;
www.motorsportshalloffame.com)• International Surfing Museum (Huntington Beach, CA; www.surfingmuseum.org)• International Swimming Hall of Fame (Ft. Lauderdale, FL; www.ishof.org)• International Tennis Hall of Fame (Newport, RI; www.tennisfame.com)• Kansas Sports Hall of Fame (Wichita, KS; www.kshof.org)• Kentucky Derby Museum (Louisville, KY; www.derbymuseum.org)• Lacrosse Museum and National Hall of Fame (Baltimore, MD;
www.uslacrosse.org/about-us-lacrosse/hall-of-fame.aspx)• Louisville Slugger Museum (Louisville, KY; www.sluggermuseum.org)• Michigan Sports Hall of Fame (Detroit, MI; www.mshof.org)• Mississippi Sports Hall of Fame & Museum (Jackson, MS; www.msfame.com)• Missouri Sports Hall of Fame (Springfield, MO; http://mosportshalloffame.com)• Motorcycle Hall of Fame Museum (Pickerington, OH; www.motorcyclemuseum.org)• Motorsports Hall of Fame of America (Detroit, MI; www.mshf.com)• Mountain Bike Hall of Fame (Crested Butte, CO; www.mmbhof.org)• Naismith Memorial Basketball Hall of Fame (Springfield, MA; www.hoophall.com)• NASCAR Hall of Fame (Charlotte, NC; www.nascarhall.com)• National Art Museum of Sport (Indianapolis, IN; www.nationalartmuseumofsport.org)• National Baseball Hall of Fame and Museum (Cooperstown, NY;
www.baseballhall.org)• National Collegiate Basketball Hall of Fame (Kansas City, MO;
www.collegebasketballexperience.com)• National Distance Running Hall of Fame (Utica, NY; www.distancerunning.com)• National Italian American Sports Hall of Fame (Chicago, IL; www.niashf.org)• National Jewish Sports Hall of Fame and Museum (Commack, NY;
www.jewishsports.org/jewishsports/index.shtml)• National Sailing Center & Hall of Fame (Annapolis, MD; www.nshof.org)
SPORTS MARKETING 2020-2021
• 101 •

• National Soccer Hall of Fame (Oneonta, NY; www.ussoccer.com/about/hall-of-fame)• National Softball Hall of Fame (Oklahoma City, OK;
www.teamusa.org/usa-softball/about/national-softball-hall-of-fame)• National Sprint Car Hall of Fame (Knoxville, IA; www.sprintcarhof.com)• National Track and Field Hall of Fame (New York, NY;
http://ny.milesplit.com/pages/Hall-of-Fame)• National Wrestling Hall of Fame (Stillwater, OK; www.nwhof.org)• NCAA Hall of Champions (Indianapolis, IN; www.ncaahallofchampions.org)• Negro Leagues Baseball Museum (Kansas City, MO; www.nlbm.com)• New England Ski Museum (Cannon Mountain, NH; www.skimuseum.org)• North Carolina Sports Hall of Fame (Raleigh, NC; www.ncshof.org)• Off-Road Motorsports Hall of Fame (Reno, NV; www.ormhof.com)• Philadelphia Sports Hall of Fame (Philadelphia, PA; www.phillyhall.org)• Pro Football Hall of Fame (Canton, OH; www.profootballhof.com)• Professional Wrestling Hall of Fame (Schenectady, NY; www.pwhf.org)• ProRodeo Hall of Fame (Colorado Springs, CO; www.prorodeohalloffame.com)• SCCA Hall of Fame (Topeka, KS; www.scca.com/pages/scca-hall-of-fame)• Sports Hall of Fame of New Jersey (East Rutherford, NJ; http://njhalloffame.org)• St. Louis Wrestling Hall of Fame (St. Louis, MO; www.saintlouiswrestling.com/hof/)• Texas Rodeo Cowboy Hall of Fame (Fort Worth, TX; www.texasrodeocowboy.com)• Texas Sports Hall of Fame (Waco, TX; www.tshof.org)• The Sports Museum (Boston, MA; www.sportsmuseum.org)• U.S. Figure Skating Hall of Fame (Colorado Springs, CO; www.usfigureskating.org)• U.S. Olympic Museum (Colorado Springs, CO; www.usolympicmuseum.org) - opens
in 2018• U.S. Ski And Snowboard Hall of Fame and Museum (Ishpeming, MI;
http://skihall.com)• United States Bicycling Hall of Fame (Davis, CA; www.usbhof.org)• United States Hockey Hall of Fame (Eveleth, MN; www.ushockeyhall.com)• United States National Museum of Racing and Hall of Fame (Saratoga Springs, NY;
www.racingmuseum.org)• USA Field Hockey Hall of Fame (Collegeville, PA;
www.teamusa.org/usa-field-hockey/team-usa/hall-of-fame)• Virginia Sports Hall of Fame & Museum (Portsmouth, VA; www.vshfm.com)• Volleyball Hall of Fame (Holyoke, MA; www.volleyhall.org)• Wisconsin Hockey Hall of Fame (Eagle River, WI; www.wihockeyhalloffame.com)• Women’s Basketball Hall of Fame (Knoxville, TN; www.wbhof.com)• World Figure Skating Hall of Fame (Colorado Springs, CO;
www.worldskatingmuseum.org)• World Golf Hall of Fame (St. Augustine, FL; www.worldgolfhalloffame.org)• World Karate Union Hall of Fame (Stroudsburg, PA; www.theworldkarateunion.com)• WWE Hall of Fame (Stamford, CT; www.wwe.com/classics/wwe-hall-of-fame)
SPORTS MARKETING 2020-2021
• 102 •

17.4 Team MuseumsMany professional sports teams have small areas that show team history and
memorabilia. A few have constructed elaborate on-site museums, open to the publicyear around and charging up to $30 for visits.
The following are some team museums:Major League Baseball• Angels Hall of Fame• Baltimore Orioles Hall of Fame• Boston Red Sox Hall of Fame• Cincinnati Reds Hall of Fame and Museum• Cleveland Indians Hall of Fame• Ivan Allen Jr. Braves Museum and Hall of Fame• Milwaukee Brewers Wall of Honor• Minnesota Twins Hall of Fame• Montreal Expos Hall of Fame• Monument Park (New York Yankees)• New York Mets Hall of Fame• New York Yankees Museum• Philadelphia Baseball Wall of Fame• San Diego Padres Hall of Fame• San Francisco Giants Wall of Fame• Seattle Mariners Hall of Fame• St. Louis Cardinals Hall of Fame Museum• Texas Rangers Hall of Fame
National Football League• 49ers Museum Presented By Sony• Arizona Cardinals Ring of Honor• Baltimore Ravens Ring of Honor• Buffalo Bills Wall of Fame• Chiefs Hall of Honor Presented by Spectrum• Dallas Cowboys Ring of Honor• FedEx Great Hall (Pittsburgh Steelers)• Green Bay Packers Fan Hall of Fame• Green Bay Packers Hall of Fame• Los Angeles Chargers Hall of Fame• Minnesota Vikings Ring of Honor• New England Patriots Hall of Fame• San Diego Chargers Hall of Fame• Seattle Seahawks Ring of Honor• The Hall at Patriot Place Presented by Raytheon• Vikings Voyage• Washington Redskins Ring of Fame
SPORTS MARKETING 2020-2021
• 103 •

18
SPORTS TRAVEL
18.1 Market AssessmentBased on an annual survey of 500 cities and towns nationwide, the National
Association of Sports Commissions (www.sportscommissions.org) assessed directvisitor spending associated with sports events, excluding professional leagues’ regularseason games, at $12 billion.
Travel by sports teams is estimated as follows:• College teams: $2.0 billion• Professional teams: $1.0 billion
According to the U.S. Travel Association (USTA, www.ustravel.org), over 50million adults each year attend an organized sports event, competition, or tournamenteither as a spectator or participant while traveling 50 miles from home. The followingare the most popular organized sports events to watch or participate in while traveling:• Baseball or softball: 33.7 million• Football: 30.3 million• Basketball: 18.8 million• Auto racing: 15.0 million• Golf: 11.1 million
_________________________________________________________________
“Hosting amateur and collegiate tournamentsand championship events is one of the hottestareas in sports business right now.”
SportsBusiness Journal _________________________________________________________________
The National Golf Foundation (www.ngf.org) estimates about $16 billion is spenta year on golf travel, 75% of which goes to the hotel, transportation, and food andbeverage industries.
SPORTS MARKETING 2020-2021
• 104 •

18.2 Favorite Cities For Sports TravelIn the America’s Favorite Cities survey, readers of Travel + Leisure voted their
favorite cities for sports-related travel as follows*:• Chicago, IL• Denver, CO• Boston, MA• Philadelphia, PA• Dallas/Fort Worth, TX• New Orleans, LA• Kansas City, KS• San Francisco, CA• New York, NY• Houston, TX* Note: Travel + Leisure readers voted among 35 major cities; some sports-oriented destinationsincluding Detroit, Indianapolis, and St. Louis were not on the list.
The following cities ranked highest in the Travel + Leisure survey for passionatesports fans:• Pittsburgh, PA• Kansas City, MO• Cleveland, OH• Baltimore, MD• Philadelphia, PA
18.3 Sports CommissionsMost cities work to attract and coordinate sports events through their convention
and visitor bureaus (CVBs); some have organized sports commissions to focusexclusively on these activities. Most of these organizations are members of theNational Association of Sports Commissions, which has about 700 members.
_________________________________________________________________
“High-profile championships, and eventsshowcasing rivers, trails, and parks are highpriorities for sports commissions charged withattracting visitors and raising a city’s profile.”
SportsBusiness Journal, 7/9/18 _________________________________________________________________
SPORTS MARKETING 2020-2021
• 105 •
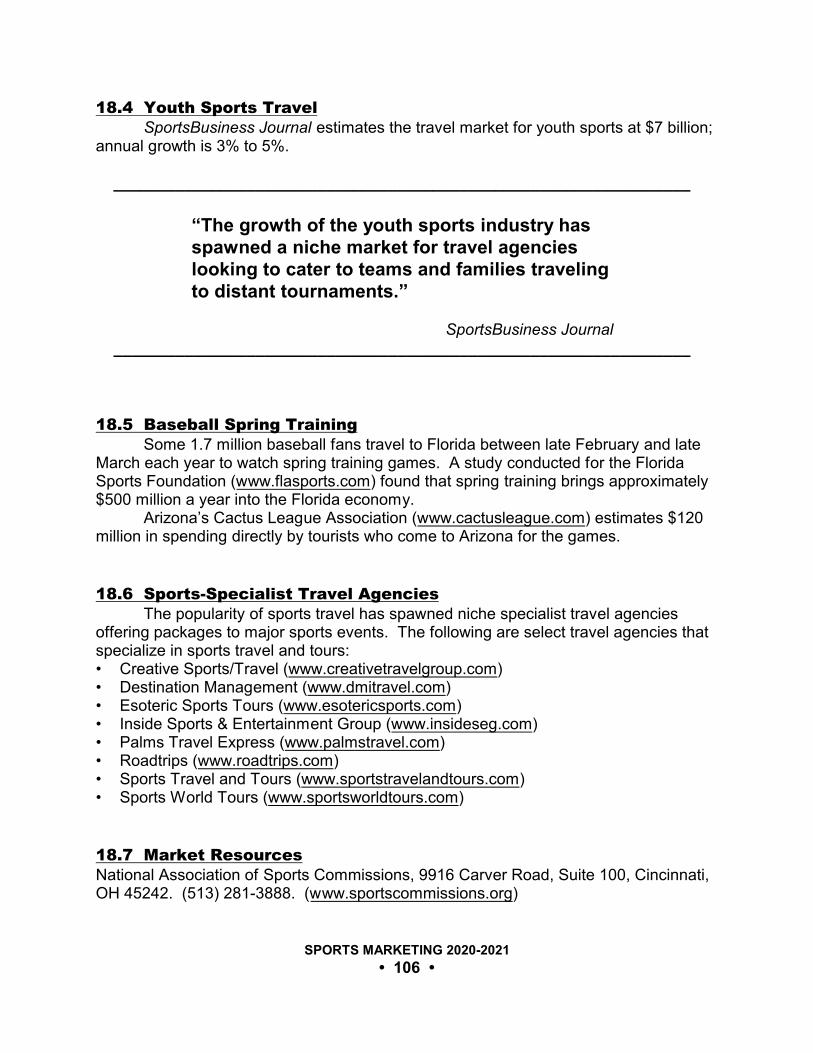
18.4 Youth Sports TravelSportsBusiness Journal estimates the travel market for youth sports at $7 billion;
annual growth is 3% to 5%.
_________________________________________________________________
“The growth of the youth sports industry hasspawned a niche market for travel agencieslooking to cater to teams and families travelingto distant tournaments.”
SportsBusiness Journal _________________________________________________________________
18.5 Baseball Spring TrainingSome 1.7 million baseball fans travel to Florida between late February and late
March each year to watch spring training games. A study conducted for the FloridaSports Foundation (www.flasports.com) found that spring training brings approximately$500 million a year into the Florida economy.
Arizona’s Cactus League Association (www.cactusleague.com) estimates $120million in spending directly by tourists who come to Arizona for the games.
18.6 Sports-Specialist Travel AgenciesThe popularity of sports travel has spawned niche specialist travel agencies
offering packages to major sports events. The following are select travel agencies thatspecialize in sports travel and tours:• Creative Sports/Travel (www.creativetravelgroup.com)• Destination Management (www.dmitravel.com)• Esoteric Sports Tours (www.esotericsports.com)• Inside Sports & Entertainment Group (www.insideseg.com)• Palms Travel Express (www.palmstravel.com)• Roadtrips (www.roadtrips.com)• Sports Travel and Tours (www.sportstravelandtours.com)• Sports World Tours (www.sportsworldtours.com)
18.7 Market ResourcesNational Association of Sports Commissions, 9916 Carver Road, Suite 100, Cincinnati,OH 45242. (513) 281-3888. (www.sportscommissions.org)
SPORTS MARKETING 2020-2021
• 106 •

Sport Tourism: A State of the Industry Report, National Association of SportsCommissions, July 2018. (www.sportscommissions.org/research/nasc-reports)
SPORTS MARKETING 2020-2021
• 107 •

19
TICKETING
19.1 Market AssessmentConsumers spend roughly $30 billion annually for tickets to sporting events. The
primary ticket market is approximately $22 million; the secondary ticket market isestimated at $8 billion.
_________________________________________________________________
“The ticketing industry continues to stand asone of the most actively changing segments ofthe entire sports business.”
SportsBusiness Journal, 1/15/19 _________________________________________________________________
Increasingly, tickets are sold online, with over 50% of individual game tickets nowsold online. Online sales allow teams to gain access to a wealth of data about theircustomers. The average NBA franchise, for example, has 500,000 names in itsdatabase, and some big-market teams have double that number.
Once worried that ticket resales would eat into overall sales, major sportsleagues have realized these concerns were unfounded, and many teams have beguncontracting with secondary ticket resellers, primarily as a service to their season-ticketholders. Surveys show that season-ticket holders – who contribute about 80% ofoverall ticket revenue – worry about unused tickets, thus the option to resell tickets isone of the best ways of retaining season-ticket holders.
19.2 Secondary TicketingThe online secondary ticketing market is estimated at $6 billion to $8 billion.
The amount could be much higher; no one knows for certain because so much of theselling can never be tracked.
While re-selling tickets online at face value is legal in all 50 states and the Districtof Columbia, about 15 states have some restriction on how much tickets can be markedup by sellers. The laws vary widely, depending on the state and type of event and venue,
SPORTS MARKETING 2020-2021
• 108 •

and they range in scope. Conversely, several states have relaxed their regulations by removing bans on online individual ticket auctions.
Online brokers largely have to rely on sellers to abide by their respective states’rules, yet there is no way of knowing if they actually do so. And the overall online ticketmarket is difficult to police given the borderless nature of the business.
There is a fine line between ticket brokers and scalpers. The former aregenerally those who are licensed by their state or are members of an association suchas the National Association of Ticket Brokers (www.natb.org). Legitimate brokers workto protect consumers against fraudulent transactions. Unlike some independentscalpers, these resellers guarantee the sale of tickets by checking both the buyer andseller for potential risk of fraud prior to transactions.
The following are the largest secondary ticket providers:• AXS (www.axs.com)• Coast to Coast Tickets (www.coasttocoasttickets.com)• eBay (www.ebay.com)• Go Tickets (www.gotickets.com)• RazorGator (www.razorgator.com)• ReplyBuy (www.replybuy.com)• SeatGeek (www.seatgeek.com)• StubHub (www.stubhub.com)• TickCo (www.tickco.com)• Ticket Liquidator (www.ticketliquidator.com)• Tickets.com (www.tickets.com)• Ticketmaster (www.ticketmaster.com)• TicketsNow (www.ticketsnow.com)
As competition in the segment has increased, the main players have createdsub-niches for themselves to establish market differentiation. RazorGator, for example,specializes in the corporate travel market; StubHub works primarily through fan-to-fanconnections and advertises heavily in mass media; TicketsNow takes sales listings onlythrough prescreened, licensed brokers; and Ticketmaster works in a more traditionalvendor capacity, only selling tickets on the secondary market for its ownTeamExchange clients.
Among companies in the secondary ticketing market, StubHub is the largest. eBay acquired StubHub in 2007 for $310 million.
19.3 Dynamic PricingDynamic pricing, also called market-based pricing and variable pricing, adjusts
single-game ticket prices based on demand. Using this model, teams can adjustregular ticket prices up or down as late as game day.
Software by Digonex Technologies (www.digonex.com), Qcue (www.qcue.com),and Veritix (www.veritix.com) is used by teams to guide variable pricing based on pastticket sales, team matchups, day and time of the game, player injuries, weather, and
SPORTS MARKETING 2020-2021
• 109 •

the going rate on ticket resale websites.Qcue reported that its MLB clients that implemented dynamic pricing for the
season increased revenue by an average of $900,000 by adjusting the price in eachsection of the ballpark for each game.
Variable pricing in professional sports dates to 2009, when the San FranciscoGiants began conducting trials with variable pricing. All 30 MLB teams had adopteddynamic pricing by 2015.
The NFL did not allow variable pricing until the 2014-2015 season.
19.4 Professional League Sports Tickets
Major League Baseball• According to Turnkey Sports (www.turnkeysports.com), non-season-ticket holders
purchased Major League Baseball tickets as follows:- Team website: 34%- StubHub: 19%- Team ticket office (walkup/telephone): 16%- Friend/relative: 15%- Ticketmaster: 6%- MLB.com: 3%- Other: 7%
• Tickets.com, a subsidiary of MLB Advanced Media (MLBAM), has primary ticketingagreements with 21 MLB teams.
• StubHub pays MLBAM more than half of the fees and commissions it collects on itsbaseball secondary ticket sales; MLBAM, in turn, sends a portion of these proceedsto the teams. SportsBusiness Journal estimates that StubHub pays MLBAM about$60 million annually.
• Some MLB teams are trying to encourage, even force, customers to use mobileticketing. The Atlanta Braves, for example, imposes a $250 fee for season ticketholders who elect to use paper tickets. The Cleveland Indians, Tampa Bay Rays,and Washington Nationals, among others, offer discounts or loyalty points for fanswho use mobile tickets.
National Basketball Association• NBAtickets.com, a subsidiary of NBA Media Ventures LLC, is the official ticket
marketplace for the NBA. It serves as a hub that links to the official team ticketingoptions for each team.
National Football League• Thirty-one (31) NFL teams have primary ticketing agreements with Ticketmaster; the
Detroit Lions uses AXS. • Ticketmaster’s NFL ticket resale volume is estimated by SportsBusiness Journal at
SPORTS MARKETING 2020-2021
• 110 •

roughly $500 million per season in gross sales; growth has been in double-digitpercentages in recent years.
National Hockey League• Ticketmaster operates the NHL Ticket Exchange, the official primary ticket
marketplace for the National Hockey League.
Major League Soccer• SeatGeek is the official ticketing partner of MLS.• In 2016, MLS and SeatGeek unveiled a ticketing system that allows fans to buy
tickets on dozens of e-commerce apps and ticketing sites, and also to securely sellor transfer tickets on any resale platform of their choice.
19.5 Subscription TicketingIn sports, fans pay a fixed monthly fee for access to discounted general
admission tickets or for a fixed number of games at a deep discount. Seats aregenerally assigned just prior to a game, allowing teams flexibility in selling inventory.
First introduced in 2015 by four MLB clubs – the Atlanta Braves, Chicago WhiteSox, Texas Rangers and Oakland A’s – 22 of MLB’s 30 clubs used the mobile-basedpasses in 2018. Dubbed the Ballpark Pass, more than a million subscription-basedtickets were sold in 2018; sales were up 36% year-over-year for the first half of the2019 season.
_________________________________________________________________
“Buoyed by the success of MLB’s Ballpark Pass,more teams across sports are experimentingwith subscription ticketing programs designedto appeal to the Netflix generation of fans.”
SportsBusiness Journal, 6/17/19 _________________________________________________________________
19.6 Moving Unsold Ticket InventoryAccording to SportsBusiness Journal, between 11% and 39% of primary ticket
inventory goes unsold.
ScoreBig (www.scorebig.com), dubbed a Priceline.com for sports tickets,launched an online service in 2010 that aids teams in moving unsold tickets. ScoreBig
SPORTS MARKETING 2020-2021
• 111 •

secures inventory from teams, leagues, venues, promoters, or anyone else holdinglarge blocks of unsold seats and sells it based on preference in price, location, andgame. The model is loosely based on travel sites that sell hotel rooms or airline ticketsat discounted rates.
19.7 Ticketing Through Social NetworksTicketmaster makes tickets to sports events available through Twitter and
Facebook. On Facebook, users can see where friends are sitting on an interactivemap.
According to LiveAnalytics (www.liveanalytics.com), the research arm ofTicketmaster, 14% of those who purchase sports tickets from Ticketmaster areinfluenced to attend a game by a Facebook post, 20% use social media to invite friendsto attend with them, and 47% are interested in seeing where their Facebook friends aresitting. LiveAnalytics also found that 16% of sports ticket buyers use their mobile phoneto check in at the game to a location-based platform such as Foursquare.
19.8 Market ResourcesNational Association of Ticket Brokers, 401 W. St. Charles Road, Lombard, IL 60148.(630) 510-4594. (www.natb.org)
SPORTS MARKETING 2020-2021
• 112 •

PART III: VENUES
SPORTS MARKETING 2020-2021
• 113 •

20
PROFESSIONAL SPORTS STADIUMS & ARENAS
20.1 OverviewIn the United States and Canada, 121 stadiums and arenas are home to teams
of Major League Baseball (MLB), Major League Soccer (MLS), the National BasketballAssociation (NBA), the National Football League (NFL), the National Hockey League(NHL), and the Women’s National Basketball Association (WNBA).
20.2 List Of Stadiums and Arenas Seating Year
Venue Team Capacity Opened
Anaheim, California• Angel Stadium of Anaheim: Angels (MLB) 45,477 1966• Honda Center: Ducks (NHL) 17,174 1993
Atlanta, Georgia• Mercedes-Benz Stadium: Falcons (NFL) 71,000 2017
United FC (MLS) 42,500• State Farm Arena: Hawks (NBA) 18,118 1999
Dream (WNBA) 18,118• SunTrust Park: Braves (MLB) 41,084 2017
Baltimore, Maryland• M&T Bank Stadium: Ravens (NFL) 71,008 1998• Oriole Park at Camden Yards: Orioles (MLB) 48,876 1992
Boston/Foxboro, Massachusetts• Fenway Park: Red Sox (MLB) 37,755 1912• Gillette Stadium: Patriots (NFL) 68,829 2002
Revolution (MLS) 20,000• TD Garden: Bruins (NHL) 17,565 1995
Celtics (NBA) 18,624
Buffalo, New York• KeyBank Center: Sabres (NHL) 19,070 1996• New Era Field: Bills (NFL) 71,608 1973
SPORTS MARKETING 2020-2021
• 114 •

Calgary, Alberta, Canada• Pengrowth Saddledome: Flames (NHL) 19,289 1983
Charlotte, North Carolina• Bank of America Stadium: Panthers (NFL) 73,523 1996• Spectrum Center: Hornets (NBA) 19,077 2005
Chicago, Illinois• Guaranteed Rate Field: White Sox (MLB) 40,615 1991• SeatGeek Stadium: Fire (MLS) 20,000 2006• Soldier Field: Bears (NFL) 61,500 1924• United Center: Bulls (NBA) 20,917 1994
Blackhawks (NHL) 19,717• Wrigley Field: Cubs (MLB) 41,649 1914
Cincinnati, Ohio• Great American Ball Park: Reds (MLB) 42,319 2003• Nippert Stadium FC Cincinnati (MLS) 33,800 1915• Paul Brown Stadium: Bengals (NFL) 65,515 2000
Cleveland, Ohio• First Energy Stadium: Browns (NFL) 68,200 2015• Progressive Field: Indians (MLB) 45,199 1994• Quicken Loans Arena: Cavaliers (NBA) 20,562 1994
Columbus, Ohio• Nationwide Arena: Blue Jackets (NHL) 18,144 2000• Mapfre Stadium: Crew (MLS) 19,968 1999
Dallas/Arlington, Texas• American Airlines Center: Mavericks (NBA) 19,200 2001
Stars (NHL) 18,532• AT&T Stadium: Cowboys (NFL) 80,000* 2009• Globe Life Park In Arlington: Rangers (MLB) 48,114 1994• Toyota Stadium: FC Dallas (MLS) 20,500 2005
Denver/Commerce City, Colorado• Broncos Stadium at Mile High: Broncos (NFL) 76,125 2001• Coors Field: Rockies (MLB) 46,897 1995• Dick’s Sporting Goods Park: Rapids (MLS) 18,061 2007• Pepsi Center: Avalanche (NHL) 17,809 1999
Nuggets (NBA) 19,520
SPORTS MARKETING 2020-2021
• 115 •

Detroit/Auburn Hills, Michigan• Comerica Park: Tigers (MLB) 41,299* 2000• Ford Field: Lions (NFL) 65,000 2002• Little Caesars Arena Red Wings (NHL) 19,600 2017
Pistons (NBA) 20,491
Edmondton, Alberta, Canada• Rogers Place: Oilers (NHL) 18,347 2016
Ft. Lauderdale/Sunrise, Florida• BB&T Center: Panthers (NHL) 19,250 1998
Green Bay, Wisconsin• Lambeau Field: Packers (NFL) 81,435 1957
Houston, Texas• BBVA Compass Stadium: Dynamo (MLS) 22,039 2012• Minute Maid Park: Astros (MLB) 41,168 2000• NRG Stadium: Texans (NFL) 72,220 2002• Toyota Center: Rockets (NBA) 18,055 2003
Indianapolis, Indiana• Bankers Life Fieldhouse: Pacers (NBA) 17,923 1999
Fever (WNBA) 18,345• Lucas Oil Stadium: Colts (NFL) 67,000* 2008
Jacksonville, Florida• TIAA Bank Field: Jaguars (NFL) 69,132* 1995
Kansas City, Missouri/Kansas• Arrowhead Stadium: Chiefs (NFL) 76,416 1972• Children’s Mercy Park: Sporting KC (MLS) 18,467 2011• Kauffman Stadium: Royals (MLB) 37,903 1973
Los Angeles, California• Banc of California Stadium: Los Angeles FC (MLS) 22,000 2018• Dignity Health Sports Park: Chargers (NFL) 27,000 2003
Galaxy (MLS) 27,000• Dodger Stadium: Dodgers (MLB) 56,000 1962• Los Angeles Memorial Coliseum: Rams (NFL) 78,500 1923• Staples Center: Clippers (NBA) 19,068 1999
Kings (NHL) 18,230Lakers (NBA) 18,997Sparks (WNBA) 18,997
SPORTS MARKETING 2020-2021
• 116 •

Las Vegas/Paradise, Nevada• T-Mobile Arena: Golden Knights (NHL) 17,368 2016
Memphis, Tennessee• FedEx Forum: Grizzlies (NBA) 17,368 2004
Miami/Miami Gardens, Florida• American Airlines Arena: Heat (NBA) 19,600 1999• Hard Rock Stadium: Dolphins (NFL) 65,326 1987• Marlins Park: Marlins (MLB) 36,742 2012
Milwaukee, Wisconsin• Fiserv Forum: Bucks (NBA) 17,500 2018• Miller Park: Brewers (MLB) 41,900 2001
Minneapolis/Saint Paul, Minnesota• Allianz Field: United (MLS) 17,954 2019• Target Center: Lynx (WNBA) 18,978 1990
Timberwolves (NBA) 18,978• Target Field: Twins (MLB) 38,649* 2010• U.S. Bank Stadium: Vikings (NFL) 66,655 2016• Xcel Energy Center: Wild (NHL) 17,954 2000
Montreal, Ontario, Canada• Bell Centre: Canadiens (NHL) 21,302 1996• Saputo Stadium: Impact (MLS) 20,801 2008
Nashville, Tennessee• Bridgestone Arena: Predators (NHL) 17,113 1996• Nissan Stadium: Titans (NFL) 69,143 1999
New Orleans, Louisiana• Mercedes-Benz Superdome: Saints (NFL) 71,000 1975• Smoothie King Center Pelicans (NBA) 16,867 1999
New York/Brooklyn/Long Island, New York; East Rutherford/Harrison, New Jersey• Barclays Center: Nets (NBA) 17,732 2012
Islanders (NHL) 15,789• Citi Field: Mets (MLB) 41,922 2009• Madison Square Garden: Knicks (NBA) 19,812 1968
Liberty (WNBA) 19,812Rangers (NHL) 18,006
• Nassau Veterans Memorial Coliseum: Islanders (NHL) 16,250 1972
SPORTS MARKETING 2020-2021
• 117 •

• MetLife Stadium: Giants (NFL) 82,500 2010Jets (NFL) 82,566
• Red Bull Arena: Red Bulls (MLS) 25,000 2010• Yankee Stadium: Yankees (MLB) 47,309 2009
New York City FC (MLS) 30,321
Newark, New Jersey• Prudential Center: Devils (NHL) 16,514 2007
Oklahoma City, Oklahoma• Chesapeake Energy Arena: Thunder (NBA) 18,203 2002
Orlando, Florida• Amway Arena: Magic (NBA) 18,846 2010• Orlando City Stadium Orlando City SC (MLS) 25,500 2017
Ottawa, Ontario, Canada• Canadian Tire Centre: Senators (NHL) 17,373 1996
Philadelphia, Pennsylvania• Citizens Bank Park: Phillies (MLB) 43,651 2004• Lincoln Financial Field: Eagles (NFL) 69,144 2003• Talen Energy Stadium: Union (MLS) 18,500 2010• Wells Fargo Center: 76ers (NBA) 20,478 1996
Flyers (NHL) 19,543
Phoenix/Glendale, Arizona• Chase Field: Diamondbacks (MLB) 48,686 1998• Gila River Arena: Coyotes (NHL) 17,125 2003• State Farm Stadium: Cardinals (NFL) 63,400* 2006• Talking Stick Resort Arena: Mercury (WNBA) 19,032 1992
Suns (NBA) 18,055
Pittsburgh, Pennsylvania• Heinz Field: Steelers (NFL) 65,050 2001• PNC Park: Pirates (MLB) 38,496 2001• PPG Paints Arena: Penguins (NHL) 18,087 2010
Portland, Oregon• Moda Center: Trail Blazers (NBA) 19,441 1995• Providence Park: Timbers (MLS) 21,144 2011
Raleigh, North Carolina• PNC Center: Hurricanes (NHL) 18,680 1999
SPORTS MARKETING 2020-2021
• 118 •

Sacramento, California• Golden 1 Center: Kings (NBA) 17,583 2016
Salt Lake City/Sandy, Utah• Rio Tinto Stadium: Real Salt Lake (MLS) 20,213 2008• Vivint Smart Home Arena: Jazz (NBA) 18,306 1991
San Antonio, Texas• AT&T Center: Spurs (NBA) 18,418 2002
Stars (WNBA) 18,418
San Diego, California• Petco Park: Padres (MLB) 40,209 2004
San Francisco/Oakland, California• Oakland-Alamdea County Coliseum: Athletics (MLB) 47,170* 1966
Raiders (NFL) 53,286• Oracle Arena: Warriors (NBA) 19,596 1996• Oracle Park: Giants (MLB) 45,971* 2000
San Jose/Santa Clara, California• Avaya Stadium: Earthquakes (MLS) 18,000 2015• SAP Center: Sharks (NHL) 17,562 1993• Levi’s Stadium: 49ers (NFL) 69,596 1960
Seattle, Washington• CenturyLink Field: Seahawks (NFL) 68,000* 2002
Sounders FC (MLS) 30,419• Key Arena: Storm (WNBA) 17,072 1962• T-Mobile Park: Mariners (MLB) 47,717 1999
St. Louis, Missouri• Busch Stadium: Cardinals (MLB) 45,529* 2006• Enterprise Center: Blues (NHL) 18,724 1994
Tampa/St. Petersburg, Florida• Amalie Arena: Lightning (NHL) 19,092 1996• Raymond James Stadium: Buccaneers (NFL) 65,890* 1998• Tropicana Field: Blue Rays (MLB) 31,042* 1990
Toronto, Ontario, Canada• Scotiabank Arena: Raptors (NBA) 19,800 1989
Maple Leafs (NHL) 18,819 1999
SPORTS MARKETING 2020-2021
• 119 •

• BMO Field: Toronto FC (MLS) 21,800 2007• Rogers Centre: Blue Jays (MLB) 49,282 2009
Vancouver, British Columbia, Canada• BC Place: WhitecapsFC (MLS) 22,120 1983• Rogers Arena: Canucks (NHL) 18,910 1995
Washington, D.C./Landover, Maryland• Audi Field: D.C. United (MLS) 20,000 2018• CapitalOne Arena: Mystics (WNBA) 20,173 1997
Wizards (NBA) 20,356Capitals (NHL) 18,560
• FedEx Field: Redskins (NFL) 91,704 1997• Nationals Park: Nationals (MLB) 41,888 2008
Winnipeg, Manitoba, Canada• Bell MTS Centre: Jets (NHL) 15,373 2004
* Total capacity exceeds seating capacity because of standing room, tarp-covered seats, or expandable
design.
SPORTS MARKETING 2020-2021
• 120 •

21
COLLEGIATE STADIUMS AND ARENAS
21.1 Football StadiumsThere are 126 NCAA Division I football stadiums, by capacity as follows:
Opened/Most Capacity Recent Renovation
• Michigan Stadium (Michigan): 107,601 1927/2015• Beaver Stadium (Penn State): 106,572 1960/2001• Kyle Field (Texas A&M): 102,733 1904/2015• Neyland Stadium (Tennessee): 102,455 1921/2010• Tiger Stadium (LSU): 102,321 1924/2014• Ohio Stadium (Ohio State): 102,082 1922/2014• Bryant-Denny Stadium (Alabama): 101,821 1929/2010• Darrell K Royal-Texas Memorial Stadium (Texas): 100,119 1924/2009• Sanford Stadium (Georgia): 92,746 1929/2004• Rose Bowl Stadium (UCLA): 90,888 1921/1949• Steve Spurrier-Florida Field at Ben Hill Griffin
Stadium (Florida): 90,916 1930/2003• Pat Dye Field at Jordan-Hare Stadium (Auburn): 87,451 1939/2004• Gaylord Family - Oklahoma Memorial Stadium
at Owen Field (Oklahoma): 86,112 1925/2016• Memorial Stadium, Tom Osborne Field (Nebraska): 86,047 1923/2017• Frank Howard Field at Clemson Memorial
Stadium (Clemson): 86,092 1942/2006• Camp Randall Stadium (Wisconsin): 83,184 1917/2005• Williams-Brice Stadium (South Carolina): 80,250 1934/1996• Bobby Bowden Field at Doak S. Campbell
Stadium (Florida State): 79,560 1950/2003• Notre Dame Stadium (Notre Dame): 77,622 1930/2017• Los Angeles Memorial Coliseum (Southern California): 77,500 1923/2008• Spartan Stadium (Michigan State): 75,005 1923/2005• Donald W. Reynolds Razorback Stadium, Frank Broyles
Field (Arkansas): 72,000 1938/2006• Legion Field (UAB): 71,594 1927/2015• Faurot Field at Memorial Stadium (Missouri): 71,168 1927/2014• Kinnick Stadium (Iowa): 70,585 1929/2006• Qualcomm Stadium (San Diego State): 70,561 1967/1997• Alaska Airlines Field at Husky Stadium (Washington): 70,500 1920/2013
SPORTS MARKETING 2020-2021
• 121 •

• Lincoln Financial Field (Temple): 68,532 2003/ -• Heinz Field (Pittsburgh): 68,400 2001/ -• Lane Stadium/Worsham Field (Virginia Tech): 66,233 1965/2005• Raymond James Stadium (South Florida): 65,857 1998/ -• Hard Rock Stadium (Miami): 65,326 1987/2016• Alamodome (UT San Antonio): 65,000 1993/ -• Vaught-Hemingway Stadium at Hollingsworth
Field (Mississippi): 64,038 1915/2016• LaVell Edwards Stadium (Brigham Young): 63,470 1964/1982• California Memorial Stadium (California Berkeley): 83,000 1923/2012• Liberty Bowl Memorial Stadium (Memphis): 62,380 1965/1987• Carl Smith Center, Home of David A. Harrison III Field
at Scott Stadium (Virginia): 61,500 1931/2000• Jack Trice Stadium (Iowa State): 61,500 1975/2015• Davis Wade Stadium at Scott Field (Mississippi State): 61,337 1914/2014• Cardinal Stadium (Louisville): 61,000 1998/2018• Kroger Field at C.M. Newton Grounds (Kentucky): 61,000 1973/2015• Jones AT&T Stadium (Texas Tech): 60,862 1957/2013• Memorial Stadium (Illinois): 60,670 1923/2011• Boone Pickens Stadium (Oklahoma State): 60,218 1919/2005• Mountaineer Field at Milan Puskar Stadium
(West Virginia): 60,000 1980/2004• Wayne Day Family Field at Carter-Finley Stadium
(North Carolina): 57,583 1966/2006• Ross-Ade Stadium (Purdue): 57,236 1924/2006• Sun Devil Stadium, Frank Kush Field (Arizona State): 56,232 1958/2016• Arizona Stadium (Arizona): 56,029 1928/1988• Bobby Dodd Stadium at Grant Field (Georgia Tech): 55,000 1913/2003• Autzen Stadium (Oregon): 54,000 1967/2002• Memorial Stadium (Indiana): 52,959 1960/2010• High Point Solutions Stadium (Rutgers): 52,454 1994/2009• Capital One Field at Maryland Stadium (Maryland): 51,802 1950/2009• Sun Bowl Stadium (UT El Paso): 51,500 1963/1981• Kenan Memorial Stadium (North Carolina): 51,000 1927/2011• TCF Bank Stadium (Minnesota): 50,805 2009/ -• Stanford Stadium (Stanford): 50,424 2006/ -• Folsom Field (Colorado): 50,183 1924/2003• David Booth Kansas Memorial Stadium (Kansas): 50,071 1921/1999• Aloha Stadium (Hawaii): 50,000 1975/2003• Bagwell Field at Dowdy-Ficklen Stadium (East Carolina): 50,000 1963/2010• Bill Snyder Family Football Stadium (Kansas State): 50,000 1968/2005• Carrier Dome (Syracuse): 49,250 1980/2020• Ryan Field (Northwestern): 47,130 1926/1997• Rice Stadium (Rice): 47,000 1950/ -
SPORTS MARKETING 2020-2021
• 122 •

• Falcon Stadium (Air Force): 46,692 1962/ -• Rice-Eccles Stadium (Utah): 45,807 1998/ -• Reser Stadium (Oregon State): 45,674 1953/2005• McLane Stadium (Baylor): 45,140 2014/ -• Amon G. Carter Stadium (Texas Christian): 45,000 1929/2012• Alumni Stadium (Boston College): 44,500 1957/1995• Spectrum Stadium (Central Florida): 44,206 2007/ -• Cajun Field (Louisiana): 41,426 1971/2015• Sonny Lubick Field at Canvas Stadium (Colorado State): 41,200 2017/ -• Bulldog Stadium at Jim Sweeney Field (Fresno State): 41,031 1980/1992• Vanderbilt Stadium (Vanderbilt): 40,350 1922/2012• Brooks Field at Wallace Wade Stadium (Duke): 40,000 1929/2016• John O'Quinn Field at TDECU Stadium (Houston): 40,000 2014/ - • Ladd-Peebles Stadium (South Alabama): 40,000 1948/2009• Nippert Stadium (Cincinnati): 40,000 1915/2015• Pratt & Whitney Stadium at Rentschler Field
(Connecticut): 40,000 2003/ -• Dreamstyle Stadium (New Mexico): 39,224 1960/2007• Joan C. Edwards Stadium (Marshall): 38,019 1991/2000• Blaik Field at Michie Stadium (Army): 38,000 1924/2001• Sam Boyd Stadium (UNLV): 36,800 1971/1999• Albertsons Stadium (Boise State): 36,387 1970/2012• Carlisle-Faulkner Field at M.M. Roberts Stadium
(Southern Mississippi): 36,000 1932/2008• Navy-Marine Corps Memorial Stadium (Navy): 34,000 1959/2005• Martin Stadium (Washington State): 32,248 1972/2000• Gerald J. Ford Stadium (SMU) 32,000 2000/ -• BB&T Field (Wake Forest): 31,500 1968/2007• Johnny "Red" Floyd Stadium (Middle Tennessee): 31,000 1933/1998• Centennial Bank Stadium (Arkansas State): 30,964 1974/2002• Apogee Stadium (North Texas): 30,850 2011/ -• CEFCU Stadium (San Jose State): 30,456 1933/1985• JPS Field at Malone Stadium (Louisiana-Monroe): 30,427 1978/1993• Veterans Memorial Stadium at Larry Blakeney
Field (Troy): 30,402 1950/2018• Aggie Memorial Stadium (New Mexico State): 30,343 1978/2005• Kelly/Shorts Stadium (Central Michigan): 30,255 1972/1997• Rynearson Stadium (Eastern Michigan): 30,200 1969/1992• Waldo Stadium (Western Michigan): 30,200 1939/2003• Benson Field at Yulman Stadium (Tulane): 30,000 2014/ -• FAU Stadium (Florida Atlantic): 30,000 2011/ - • InfoCision Stadium-Summa Field (Akron): 30,000 2009/ -• Jim Wacker Field at Bobcat Stadium (Texas State): 30,000 1981/2012• Kidd Brewer Stadium (Appalachian State): 30,000 1962/2017
SPORTS MARKETING 2020-2021
• 123 •

• Skelly Field at H. A. Chapman Stadium (Tulsa): 30,000 1930/2008• Jonah Field at War Memorial Stadium (Wyoming): 29,181 1950/2010• UB Stadium (Buffalo): 29,013 1993/ - • Joe Aillet Stadium (Louisiana Tech): 28,109 1968/2017• Glass Bowl (Toledo): 26,248 1937/1990• Merlin Olsen Field at Maverik Stadium (Utah State): 25,513 1968/1980• Allen E. Paulson Stadium (Georgia Southern): 25,000 1984/2014• Arthur L. Williams Stadium (Liberty): 25,000 1989/2018• Dix Stadium (Kent State): 25,000 1969/2008• Georgia State Stadium (Georgia State): 25,000 1996/2017• Fred C. Yager Stadium (Miami [Ohio]): 24,286 1983/2005• Doyt L. Perry Stadium (Bowling Green): 24,000 1996/ -• Peden Stadium (Ohio): 24,000 1929/2001• Brigham Field at Huskie Stadium (Northern Illinois): 23,595 1965/1995• FIU Stadium (FIU): 23,500 1995/2012• Scheumann Stadium (Ball State): 22,500 1967/2007• T. Smith Stadium at Jimmy Feix Field
(Western Kentucky): 22,113 1968/2008• Foreman Field at S. B. Ballard Stadium (Old Dominion): 20,118 1936/2009• Brooks Stadium (Coastal Carolina): 20,000 2003/2018• Warren McGuirk Alumni Stadium (UMass): 17,000 1965/2014• McColl-Richardson Field at Jerry Richardson Stadium
(UNC Charlotte): 15,314 2013/ -
21.2 Basketball ArenasThere are 354 NCAA Division I basketball arenas, by capacity as follows:
Capacity Opened
• Carrier Dome (Syracuse): 35,446 1980• Rupp Arena (Kentucky): 23,500 1976• KFC Yum! Center (Louisville): 22,090 2010• Dean Smith Center (North Carolina): 21,750 1986• Thompson-Boling Arena (Tennessee): 21,678 1987• Capital One Arena (Georgetown): 20,308 1997• Madison Square Garden (St. John's): 19,812 1968• PNC Arena (North Carolina State): 19,557 1999• Bud Walton Arena (Arkansas): 19,368 1993• Marriott Center (BYU): 19,000 1971• Value City Arena (Ohio State): 18,809 1998• Thomas & Mack Center (UNLV): 18,776 1983• Prudential Center (Seton Hall): 18,711 2007• CHI Health Center Omaha (Creighton): 18,320 2003• FedExForum (Memphis): 18,119 2004• Colonial Life Arena (South Carolina): 18,000 2002
SPORTS MARKETING 2020-2021
• 124 •

• Xfinity Center (Maryland): 17,950 2002• Fiserv Forum (Marquette): 17,500 2018• Simon Skjodt Assembly Hall (Indiana): 17,472 1971• Kohl Center (Wisconsin): 17,249 1998• Frank Erwin Center (Texas): 16,734 1977• State Farm Center (Illinois): 16,618 1963• Allen Fieldhouse (Kansas): 16,300 1955• Save Mart Center (Fresno State): 15,544 2003• Carver-Hawkeye Arena (Iowa): 15,500 1983• Dreamstyle Arena (New Mexico): 15,411 1966• Coleman Coliseum (Alabama): 15,383 1968• Bryce Jordan Center (Penn State): 15,261 1996• Times Union Center (Siena): 15,229 1990• Pinnacle Bank Arena (Nebraska): 15,147 2013• Mizzou Arena (Missouri): 15,061 2004• Arena-Auditorium (Wyoming): 15,028 1982• United Supermarkets Arena (Texas Tech): 15,020 1999• Jon M. Huntsman Center (Utah): 15,000 1969• Mackey Arena (Purdue): 14,848 1967• Breslin Student Events Center (Michigan State): 14,797 1989• Lawrence Joel Veterans Memorial Coliseum
(Wake Forest): 14,665 1989• Williams Arena (Minnesota): 14,625 1928• John Paul Jones Arena (Virginia): 14,593 2006• McKale Center (Arizona): 14,545 1973• Hilton Coliseum (Iowa State): 14,376 1971• Memorial Gymnasium (Vanderbilt): 14,316 1952• WVU Coliseum (West Virginia): 14,000 1970• Pauley Pavilion (UCLA): 13,800 1965• Gallagher-Iba Arena (Oklahoma State): 13,611 1938• Wolstein Center (Cleveland State): 13,610 1991• Cajundome (Louisiana): 13,500 1985• University of Dayton Arena (Dayton): 13,435 1969• Pete Maravich Assembly Center (LSU): 13,215 1972• Convocation Center (Ohio): 13,080 1968• Reed Arena (Texas A&M): 12,989 1998• Crisler Center (Michigan): 12,707 1967• Bramlage Coliseum (Kansas State): 12,528 1988• Petersen Events Center (Pittsburgh): 12,508 2002• Pan American Center (New Mexico State): 12,482 1968• Taco Bell Arena (Boise State): 12,480 1982• Viejas Arena (San Diego State): 12,414 1997• Dunkin' Donuts Center (Providence): 12,400 1972• Matthew Knight Arena (Oregon): 12,369 2011
SPORTS MARKETING 2020-2021
• 125 •

• Don Haskins Center (UTEP): 12,222 1976• Donald L. Tucker Civic Center (Florida State): 12,100 1981• Fifth Third Arena (Cincinnati): 12,012 1989• O'Connell Center (Florida): 12,000 1980• Haas Pavilion (California): 11,877 1933• Beasley Coliseum (Washington State): 11,671 1973• Lawlor Events Center (Nevada): 11,536 1983• Lloyd Noble Center (Oklahoma): 11,528 1973• Murphy Center (Middle Tennessee): 11,520 1972• Dee Events Center (Weber State): 11,500 1977• John E. Worthen Arena (Ball State): 11,500 1991• Walkup Skydome (Northern Arizona): 11,230 1977• Carver Arena (Bradley): 11,164 1982• CU Events Center (Colorado): 11,064 1979• JQH Arena (Missouri State): 11,000 2008• McKenzie Arena (Chattanooga): 10,928 1982• UW-Milwaukee Panther Arena (Milwaukee): 10,783 1950• Wells Fargo Arena (Arizona State): 10,754 1974• Montagne Center (Lamar): 10,746 1984• Chaifetz Arena (Saint Louis): 10,600 2008• Humphrey Coliseum (Mississippi State): 10,575 1975• First National Bank Arena (Arkansas State): 10,563 1987• Mabee Center (Oral Roberts): 10,554 1972• Stegeman Coliseum (Georgia): 10,523 1964• Charles Koch Arena (Wichita State): 10,506 1955• Gentry Complex (Tennessee State): 10,500 1980• Yuengling Center (South Florida): 10,411 1980• Nutter Center (Wright State): 10,400 1990• Wintrust Arena (DePaul): 10,387 2017• Ferrell Center (Baylor): 10,347 1988• Stan Sheriff Center (Hawaii): 10,300 1994• Smith Spectrum (Utah State): 10,270 1968• Galen Center (USC): 10,258 2006• Cintas Center (Xavier): 10,250 2000• Liacouras Center[b] (Temple): 10,205 1997• Hulman Center (Indiana State): 10,200 1973• Redbird Arena (Illinois State): 10,200 1989• Harry A. Gampel Pavilion (Connecticut): 10,167 1990• Cassell Coliseum (Virginia Tech): 10,052 1962• Mitchell Center (South Alabama): 10,041 1998• UNT Coliseum (North Texas): 10,032 1973• Alaska Airlines Arena at Hec Edmundson Pavilion
(Washington): 10,000 1927• Convocation Center (Northern Illinois): 10,000 2002
SPORTS MARKETING 2020-2021
• 126 •

• EagleBank Arena (George Mason): 10,000 1985• Ford Center (Evansville): 10,000 2011• Littlejohn Coliseum (Clemson): 10,000 1968• Municipal Auditorium (UMKC): 9,987 1936• Resch Center (Green Bay): 9,729 2002• Teaching Gym (Florida A&M): 9,639 2009• Gill Coliseum (Oregon State): 9,604 1949• Vines Center (Liberty): 9,547 1990• The Pavilion at Ole Miss (Mississippi): 9,500 2016• William D. Mullins Memorial Center (Massachusetts): 9,493 1993• CFE Arena (UCF): 9,465 2007• BB&T Arena (Northern Kentucky): 9,400 2008• Cameron Indoor Stadium (Duke): 9,314 1940• Eblen Center (Tennessee Tech): 9,282 1977• Edmund P. Joyce Center (Notre Dame): 9,149 1968• Auburn Arena (Auburn): 9,121 2010• Dale F. Halton Arena (Charlotte): 9,105 1996• Hinkle Fieldhouse (Butler): 9,100 1928• Cam Henderson Center (Marshall): 9,048 1981• Dunn Center (Austin Peay): 9,000 1975• Webster Bank Arena (Fairfield): 9,000 2001• Lakefront Arena (New Orleans): 8,933 1983• Convocation Center (Eastern Michigan): 8,824 1998• Moby Arena (Colorado State): 8,745 1966• Palestra (Penn): 8,722 1927• Conte Forum (Boston College): 8,606 1988• CFSB Center (Murray State): 8,602 1998• Hank McCamish Pavilion (Georgia Tech): 8,600 1956• Kaplan Arena (William & Mary): 8,600 1971• Bartow Arena (UAB): 8,508 1988• Schollmaier Arena (TCU): 8,500 1961• UCCU Center (Utah Valley): 8,500 1996• Ted Constant Convocation Center (Old Dominion): 8,472 2002• Reynolds Center (Tulsa): 8,355 1998• SIU Arena (Southern Illinois): 8,339 1964• George M. Holmes Convocation Center
(Appalachian State): 8,325 2000• Calihan Hall (Detroit Mercy): 8,295 1952• Welsh-Ryan Arena (Northwestern): 8,117 1952• Health and Physical Education Arena (Texas Southern): 8,100 1989• Thomas Assembly Center (Louisiana Tech): 8,098 1982• Reed Green Coliseum (Southern Miss): 8,095 1965• American Bank Center Arena (Texas A&M-Corpus Christi): 8,000 2004• Holt Arena (Idaho State): 8,000 1970
SPORTS MARKETING 2020-2021
• 127 •

• Louis Brown Athletic Center (Rutgers): 8,000 1977• Williams Arena at Minges Coliseum (East Carolina): 8,000 1968• Williams Assembly Center (Jackson State): 8,000 1981• Watsco Center (Miami): 7,972 2003• Ramsey Center (Western Carolina): 7,826 1986• Ryan Center (Rhode Island): 7,657 2002• Siegel Center (Virginia Commonwealth): 7,617 1999• Greensboro Coliseum (UNC Greensboro): 7,613 1959• The Pavilion at ARC (UC Davis): 7,600 1977• Baxter Arena (Omaha): 7,500 2015• F. G. Clark Center (Southern): 7,500 1975• Fredrick C. Hobdy Assembly Center (Grambling): 7,500 2007• GCU Arena (Grand Canyon): 7,500 2011• University Center (Southeastern Louisiana): 7,500 1982• Dunn-Oliver Acadome (Alabama State): 7,400 1992• Maples Pavilion (Stanford): 7,329 1969• E. A. Diddle Arena (Western Kentucky): 7,326 1963• Dahlberg Arena (Montana): 7,321 1953• Savage Arena (Toledo): 7,300 1976• Worthington Arena (Montana State): 7,250 1957• William R. Johnson Coliseum (Stephen F. Austin): 7,203 1974• Robins Center (Richmond): 7,201 1972• Hampton Convocation Center (Hampton): 7,200 1993• Magness Arena (Denver): 7,200 1999• Strahan Coliseum (Texas State): 7,200 1982• James Madison University Convocation Center
(James Madison): 7,156 1982• Knapp Center (Drake): 7,152 1992• Fertitta Center (Houston): 7,100 1969• Fant-Ewing Coliseum (Louisiana-Monroe): 7,085 1971• College Park Center (Texas-Arlington): 7,000 2012• Cowan Spectrum (Idaho): 7,000 1975• Davey Whitney Complex (Alcorn State): 7,000 1975• Emil and Patricia Jones Convocation Center
(Chicago State): 7,000 2007• Joseph G. Echols Memorial Hall (Norfolk State): 7,000 1982• Moody Coliseum (SMU): 7,000 1956• Show Me Center (Southeast Missouri State): 6,972 1987• UIC Pavilion (UIC): 6,958 1982• Jadwin Gymnasium (Princeton): 6,854 1969• Indiana Farmers Coliseum (IUPUI): 6,841 1939• McLeod Center (Northern Iowa): 6,650 2006• Alumni Coliseum (Eastern Kentucky): 6,500 1963• Beeghly Center (Youngstown State): 6,500 1972
SPORTS MARKETING 2020-2021
• 128 •

• Ellis Johnson Arena (Morehead State): 6,500 1981• Frost Arena (South Dakota State): 6,500 1973• William B. Finneran Pavilion (Villanova): 6,500 1986• William J. Nicks Building (Prairie View A&M): 6,500 1968• Tsongas Center at UMass Lowell (UMass Lowell): 6,496 1998• Millett Hall (Miami [Ohio]): 6,400 1968• Memorial Athletic and Convocation Center (Kent State): 6,327 1950• Alex G. Spanos Center (Pacific): 6,150 1981• Freedom Hall Civic Center (East Tennessee State): 6,149 1974• Alumni Arena (Buffalo): 6,100 1982• Bernard Johnson Coliseum (Sam Houston State): 6,100 1976• Winthrop Coliseum (Winthrop): 6,100 1982• Elmore Gymnasium (Alabama A&M): 6,000 1973• Farris Center (Central Arkansas): 6,000 1972• Matthews Arena (Northeastern): 6,000 1910• McAlister Field House (The Citadel): 6,000 1939• McCarthey Athletic Center (Gonzaga): 6,000 2004• Reese Court (Eastern Washington): 6,000 1981• Sanford Coyote Sports Center (South Dakota): 6,000 2016• Stabler Arena (Lehigh): 6,000 1979• Tiger Arena (Savannah State): 6,000 2000• Clune Arena (Air Force): 5,858 1968• Cameron Hall (VMI): 5,800 1981• Cross Insurance Center (Maine): 5,800 2013• UNF Arena (North Florida): 5,800 1993• Tudor Fieldhouse (Rice): 5,750 1950• Alumni Hall (Navy): 5,710 1991• Scheels Center (North Dakota State): 5,700 2016• Corbett Sports Center (North Carolina A&T): 5,700 1978• Jack Stephens Center (Little Rock): 5,600 2005• UC Santa Barbara Events Center (UC Santa Barbara): 5,600 1979• Hytche Athletic Center (Maryland Eastern Shore): 5,500 1999• James A. Rhodes Arena (Akron): 5,500 1983• Reilly Center (St. Bonaventure): 5,480 1966• University Arena (Western Michigan): 5,421 1957• America First Events Center (Southern Utah): 5,300 1985• Lantz Arena (Eastern Illinois): 5,300 1967• McGuirk Arena (Central Michigan): 5,300 1973• Pete Mathews Coliseum (Jacksonville State): 5,300 1974• War Memorial Gymnasium (San Francisco): 5,300 1958• John M. Belk Arena (Davidson): 5,223 1989• SECU Arena (Towson): 5,200 2013• Trask Coliseum (UNC Wilmington): 5,200 1977• Trojan Arena (Troy): 5,200 2012
SPORTS MARKETING 2020-2021
• 129 •

• Binghamton University Events Center (Binghamton): 5,142 2004• Western Hall (Western Illinois): 5,139 1964• Hofstra Arena (Hofstra): 5,124 2000• Jenny Craig Pavilion (San Diego): 5,100 2000• Schar Center (Elon): 5,100 2018• TD Arena (Charleston): 5,100 2008• Curb Event Center (Belmont): 5,085 2003• CBU Events Center (California Baptist): 5,050 2017• Christl Arena (Army): 5,043 1985• Allen Arena (Lipscomb): 5,028 2001• Athletics-Recreation Center (Valparaiso): 5,000 1984• Bob Carpenter Center (Delaware): 5,000 1992• Charles E. Smith Center (George Washington): 5,000 1975• Edmunds Center (Stetson): 5,000 1974• Event Center Arena (San Jose State): 5,000 1989• FAU Arena (Florida Atlantic): 5,000 1984• Harrison HPER Complex (Mississippi Valley State): 5,000 1970• Ocean Bank Convocation Center (Florida International): 5,000 1986• Paul Porter Arena (Gardner-Webb): 5,000 1982• Rothman Center (Fairleigh Dickinson): 5,000 1987• Tom and Kathleen Elam Center (Tennessee-Martin): 5,000 1969• UMBC Event Center (UMBC): 5,000 2018• Walter Pyramid (Long Beach State): 5,000 1994• Bren Events Center (UC Irvine): 4,984 1987• Pete Hanna Center (Samford): 4,974 2007• Chiles Center (Portland): 4,852 1984• KSU Convocation Center (Kennesaw State): 4,792 2003• Stroh Center (Bowling Green): 4,700 2011• Moody Coliseum (Abilene Christian): 4,600 1968• SEFCU Arena (Albany): 4,538 1992• Alico Arena (Florida Gulf Coast): 4,500 2002• Bender Arena (American): 4,500 1988• K. L. Johnson Complex (Arkansas-Pine Bluff): 4,500 1982• Leavey Center (Santa Clara): 4,500 1975• Joseph J. Gentile Arena (Loyola (Chicago)): 4,486 1996• Newman Arena (Cornell): 4,473 1990• Palumbo Center (Duquesne): 4,406 1988• Hanner Fieldhouse (Georgia Southern): 4,325 1969• Talmadge L. Hill Field House (Morgan State): 4,250 1975• Hagan Arena (Saint Joseph's): 4,200 1949• Health and Human Performance Education Complex
(McNeese State): 4,200 2018• Island Federal Credit Union Arena (Stony Brook): 4,160 1967• Gersten Pavilion (Loyola Marymount): 4,156 1981
SPORTS MARKETING 2020-2021
• 130 •

• OceanFirst Bank Center (Monmouth): 4,100 2009• Physical Education Complex (Coppin State): 4,100 2009• Convocation Center (UTSA): 4,080 1975• Chase Arena (Hartford): 4,017 1990• Athletics Center O'rena (Oakland): 4,005 1998• Sojka Pavilion (Bucknell): 4,000 2003• Timmons Arena (Furman): 4,000 1998• Titan Gym (Cal State Fullerton): 4,000 1964• UPMC Events Center[h] (Robert Morris): 4,000 2019• Vadalabene Center (SIU Edwardsville): 4,000 1984• Flowers Hall (North Alabama): 3,900 1972• Prather Coliseum (Northwestern State): 3,900 1964• GSU Sports Arena (Georgia State): 3,854 1973• Icardo Center (Cal State Bakersfield): 3,800 1989• Stopher Gymnasium (Nicholls): 3,800 1967• Devlin Fieldhouse (Tulane): 3,600 1933• Hart Center (Holy Cross): 3,600 1975• HTC Center (Coastal Carolina): 3,600 2012• TD Bank Sports Center (Quinnipiac): 3,570 2007• DeGol Arena (Saint Francis [PA]): 3,500 1972• Hawkins Arena (Mercer): 3,500 2004• Kirby Sports Center (Lafayette): 3,500 1973• Lundholm Gym (New Hampshire): 3,500 1938• McKeon Pavilion (Saint Mary's): 3,500 1978• Wellness and Events Center (NJIT): 3,500 2017• Levien Gymnasium (Columbia): 3,408 1974• Jerry Richardson Indoor Stadium (Wofford): 3,400 2017• Tom Gola Arena (La Salle): 3,400 1998• Betty Engelstad Sioux Center (North Dakota): 3,300 2004• Patrick Gym (Vermont): 3,228 1963• Dedmon Center (Radford): 3,205 1981• Kimmel Arena (UNC Asheville): 3,200 2011• McCann Field House (Marist): 3,200 1977• Rose Hill Gymnasium (Fordham): 3,200 1925• SHM Memorial Center (South Carolina State): 3,200 1968• Yanitelli Center (Saint Peter's): 3,200 1975• Student Recreation Center Arena (UC Riverside): 3,168 1994• Knott Arena (Mount St. Mary's): 3,121 1987• Firestone Fieldhouse (Pepperdine): 3,104 1973• John W. Pope, Jr. Convocation Center (Campbell): 3,095 2008• McLendon-McDougald Gymnasium
(North Carolina Central): 3,056 1955• Mott Gym (Cal Poly): 3,032 1960• Memorial Hall (Delaware State): 3,000 1982
SPORTS MARKETING 2020-2021
• 131 •

• Moore Gymnasium (Bethune-Cookman): 3,000 1953• Reitz Arena (Loyola [Maryland]): 3,000 1984• Bank of Colorado Arena (Northern Colorado): 2,992 1975• Pizzitola Sports Center (Brown): 2,800 1989• Burr Gymnasium (Howard): 2,700 1963• Chace Athletic Center (Bryant): 2,700 2001• William H. Detrick Gymnasium (Central Connecticut): 2,654 1965• Hynes Athletic Center (Iona): 2,611 1974• Payne Whitney Gymnasium (Yale): 2,532 1932• Daskalakis Athletic Center (Drexel): 2,509 1974• UTRGV Fieldhouse (UTRGV): 2,500 1969• Wellness, Recreation & Athletics Center (LIU Brooklyn): 2,500 2006• Gallagher Center (Niagara): 2,400 1949• Matadome (Cal State Northridge): 2,400 1962• Draddy Gymnasium (Manhattan): 2,345 1978• Hilliard Gates Sports Center (Purdue Fort Wayne): 2,300 1981• Templeton Physical Education Center (Presbyterian): 2,300 1975• Lavietes Pavilion (Harvard): 2,195 1982• Koessler Athletic Center (Canisius): 2,176 1968• Costello Athletic Center (UMass Lowell): 2,100 1964• Leede Arena (Dartmouth): 2,100 1986• Spiro Sports Center (Wagner): 2,100 1999• William H. Pitt Center (Sacred Heart): 2,062 1997• McDermott Center (Incarnate Word): 2,000 1989• Peter Stott Center (Portland State): 2,000 1966• Alumni Gymnasium (Rider): 1,950 1958• Willett Hall (Longwood): 1,807 1980• Case Gym (Boston University): 1,800 1972• Cotterell Court (Colgate): 1,750 1959• Millis Athletic Convocation Center (High Point): 1,750 1992• Swisher Gymnasium (Jacksonville): 1,500 1953• Generoso Pope Athletic Complex (St. Francis Brooklyn): 1,200 1971• Hornets Nest (Sacramento State): 1,012 1955• Sharp Gymnasium (Houston Baptist): 1,000 1963• Redhawk Center (Seattle): 999 1959• CSU Field House (Charleston Southern): 881 1965• G. B. Hodge Center (USC Upstate): 878 1973
SPORTS MARKETING 2020-2021
• 132 •

22
SPORTS FACILITY CONSTRUCTION
22.1 Sports Facility Construction SpendingSportsBusiness Journal assesses spending for sports facility construction as
follows: Stadiums Arenas Total
• 2002: $2.29 billion $1.20 billion $3.48 billion• 2003: $2.88 billion $1.74 billion $4.63 billion• 2004: $1.53 billion $ 732 million $2.26 billion• 2005: $1.03 billion $1.34 billion $2.37 billion• 2006: $2.00 billion $ 556 million $2.56 billion• 2007: $ 706 million $ 962 million $1.67 billion• 2008: $2.51 billion $1.16 billion $3.66 billion• 2009: $5.13 billion $ 732 million $5.87 billion• 2010: $3.70 billion $1.61 billion $5.31 billion• 2011: $1.63 billion $ 648 million $2.28 billion• 2012: $2.39 billion $1.64 billion $4.03 billion• 2013: $1.87 billion $1.71 billion $3.58 billion• 2014: $3.90 billion $ 944 million $4.33 billion• 2015: $2.17 billion $1.03 billion $3.19 billion• 2016: $3.40 billion $2.53 billion $5.92 billion• 2017: $5.46 billion $1.90 billion $7.35 billion• 2018: $3.13 billion $1.78 billion $4.91 billion• 2019: $1.84 billion $2.03 billion $3.90 billion• 2020: $7.04 billion $1.07 billion $8.11 billion• 2021: $3.14 billion $2.94 billion $6.08 billion
22.2 Spending By Type Of VenueSpending for sports facility construction has been as follows (source:
SportsBusiness Journal):Major League Stadiums• 2015: $ 570 million• 2016: $2.10 billion• 2017: $3.47 billion• 2018: $1.58 billion
SPORTS MARKETING 2020-2021
• 133 •

Major League Arenas• 2015: $ 635 million• 2016: $1.59 billion• 2017: $1.25 billion• 2018: $ 820 million
Minor League Stadiums• 2015: $ 317 million• 2016: $ 62 million• 2017: $ 410 million• 2018: $ 104 million
Minor League Arenas• 2015: $ 84 million• 2016: $ 106 million• 2017: $ 167 million• 2018: $ 100 million
College Stadiums• 2015: $1.28 billion• 2016: $1.01 billion• 2017: $1.41 billion• 2018: $1.19 billion
College Arenas• 2015: $ 323 million• 2016: $ 828 million• 2017: $ 407 million• 2018: $ 527 million
22.3 Most Expensive Sports FacilitiesThe highest spending for sports facility construction projects has been as follows
(sources: SportsBusiness Journal and The Brookings Institution):Venue Year Type of Construction Cost
• Yankee Stadium: 2009 New Venue $2.53 billion• MetLife Stadium: 2010 New Venue $1.74 billion• Mercedes-Benz Stadium: 2017 New Venue $1.50 billion• AT&T Stadium: 2009 New Venue $1.32 billion• Levi’s Stadium: 2014 New Venue $1.31 billion• U.S. Bank Stadium: 2016 New Venue $1.08 billion• Barclays Center: 2012 New Venue $1.03 billion• Madison Square Garden: 2013 Major Renovation $ 983 million• Nationals Park: 2008 New Venue $ 846 million
SPORTS MARKETING 2020-2021
• 134 •

• Citi Field: 2009 New Venue $ 817 million• Lucas Oil Stadium: 2008 New Venue $ 792 million• Soldier Field: 2003 Major Renovation $ 755 million• Wrigley Field: 2018 Major Renovation $ 750 million• Little Caesars Arena: 2017 New Venue $ 733 million• Marlins Park: 2012 New Venue $ 684 million• SunTrust Park: 2017 New Venue $ 672 million• Lincoln Financial Field: 2003 New Venue $ 667 million• Ford Field: 2002 New Venue $ 658 million• NRG Stadium: 2002 New Venue $ 624 million• Paul Brown Stadium: 2000 New Venue $ 619 million
Los Angeles Stadium at Hollywood Park, now under construction with an estimatedcost of $4.0 billion, will be the most expensive sports facility in history.
22.4 Current ProjectsSports facility projects currently under construction and estimated spending in 2019
were as follows:• Chase Center (San Francisco Warriors): $1.00 billion• Dickies Arena (exposition and livestock shows; Fort Worth): $ 540 million• United Airlines Memorial Coliseum (Los Angeles Rams): $ 297 million*• Allianz Field (Minnesota United FC): $ 250 million• Quickens Loan Arena (Cleveland Cavaliers): $ 185 million*• Las Vegas Ballpark (minor league baseball Class AAA): $ 150 million• Amon G. Carter Stadium (Texas Christian football): $ 100 million*• TD Garden (Boston Celtics): $ 100 million*• Fauropt Field at Memorial Stadium (Univ. of Missouri football): $ 98 million*• Maryvale Park (Milwaukee Brewers spring training facility): $ 75 million*• University of Dayton Arena (basketball): $ 72 million*• Miami Open at Hard Rock Stadium (tennis): $ 70 million• Foreman Field at Ballard Stadium (Old Dominion football): $ 65 million• Gateway Center (Atlanta Hawks’ G League Team): $ 65 million• Dudy Noble at Polk-Dement Stadium (Univ. of Mississippi baseball): $ 64 million*• Whitney Athletic Center (University of Delaware): $ 60 million*• Providence Park (MLS Portland Timbers): $ 55 million*• Prosper (Texas) Stadium (high school football): $ 51 million• Talladega Superspeedway (NASCAR track): $ 50 million*• UPMC Events Center (Robert Morris University): $ 50 million• Kentucky Proud Park (University of Kentucky baseball): $ 49 million• Amarillo Ballpark (minor league baseball Class AA): $ 45 million* Renovation
SPORTS MARKETING 2020-2021
• 135 •

23
NAMING RIGHTS
23.1 OverviewNaming-rights deals for sports venues is a relatively modern concept, an idea
conceived to help facilities raise new capital for construction and operations. The conceptwas developed with the naming of professional sports venues during the late 1980s. Ithas spread over the past decade to venues of all type, such as minor league sportsvenues, college sports venues, performing arts and concert venues, convention centers,and other facilities. Deal makers include banks and financial institutions – which maintainabout a third of naming-rights deals – energy companies, insurers, airlines, telecoms, autocompanies, brewers, and software makers.
According to SportsBusiness Journal, over $10 billion has been committed tonaming-rights deals for new major league sports facilities. An additional $500 million iscommitted for college and minor league venues. Many of the deals have 20-year and 30-year terms.
_________________________________________________________________
“In 1998, 45 big-league venues were called by acorporate name. Today, 114 such deals are inplay.”
SportsBusiness Journal, 4/30/18 _________________________________________________________________
23.2 Top Naming-Rights DealsThe following are the largest naming-rights deals among professional sports
stadiums and arenas (source: SportsBusiness Journal):Stadium/Arena (Location) Total Value/Period
• Scotiabank Arena: $639 million; 2017-2038• MetLife Stadium: $425-$625 million; 2010-2036• Chase Center: $300-$400 million; 2016-2040• Citi Field: $400 million; 2006-2028• Mercedes-Benz Stadium: $324 million; 2015-2043
SPORTS MARKETING 2020-2021
• 136 •

• NRG Stadium: $310 million; 2000-2032• SunTrust Park: $250 million; 2014-2042• Hard Rock Stadium: $250 million; 2016-2034• Levi’s Stadium: $220 million; 2013-2033• US Bank Stadium: $220 million; 2015-2041• FedEx Field: $205 million; 1999-2025• Barclays Center: $200 million; 2007-2032• American Airlines Center: $195 million; 1999-2030• Philips Arena: $185 million; 1999-2019• Minute Maid Park: $178 million; 2002-2029• Bank of America Stadium: $140 million; 2004-2023• Lincoln Financial Field: $139 million; 2002-2022• Little Caesars Arena: $125 million; 2016-2036• Lucas Oil Stadium: $122 million; 2006-2027
23.3 College Stadium Naming RightsRanked by average annual value, the largest college stadium naming rights
deals are as follows:School Sponsor Total Value/Period
• USC: United Airlines $70 million; 2016-2031• Washington: Alaska Airlines $41 million; 2015-2025• Minnesota: TCF National Bank $35 million; 2009-2034• Kentucky: Kroger $22 million; 2016-2028• North Texas: Apogee $20 million; 2010-2030• Central Florida: Charter Comm. $15 million; 2007-2022• College World Series: TD Ameritrade $15 million; 2007-2022• Houston: TDECU $15 million; 2014-2024• Texas: University Federal $13 million; 2006-2021• Boise State: Albertsons $12 million; 2014-2029
SPORTS MARKETING 2020-2021
• 137 •

24
PREMIUM SEATING
24.1 OverviewPremium seating options include private lofts (suites), party lofts (shared suites),
club cabanas, and field boxes.According to SportsBusiness Journal, major league stadiums and arenas have a
total of approximately 10,500 suites and 500,000 club seats.Expanding beyond simply a place for fans to get a better view of a game, teams
are reshaping premium seating as high-end customers seek social spaces.
_________________________________________________________________
“Premium seating’s shift to mobile and socialmay sound a lot like apps on your phone ortablet, but it reflects broader themes in oursociety. As more Americans move back intocities and reconnect with public life, sports sitsat the nexus of this urban renewal, providing amodern meeting place. Despite the power ofsocial media, there’s still demand for old-school,in-person face time and chat sessions. Sportsteams and facilities think they have the rightspot, with drinks and hors d’oeuvres in a hipcommon area adjacent to premium seating. Newand refurbished venues not only look but alsooperate in radically different ways than priorgenerations of buildings.”
SportsBusiness Journal, 9/18/19 _________________________________________________________________
SPORTS MARKETING 2020-2021
• 138 •

24.2 Market AssessmentAnnual revenues to professional sports teams from premium seating and suites
is estimated at $5 billion. A team’s income from premium seats is not typically sharedwith other teams in the league, as are general admission and television broadcastrevenue.
For the NBA, NFL, NHL, and MLB, suites account for up to 20% of total teamrevenue. For many teams, the boxes have become a matter of survival, oftenrepresenting 50% of a team’s profit, according to The Wall Street Journal.
Premium seating has changed the way team owners approach the business,with stadium owners insisting on more and more luxury seating options with each newstadium.
_________________________________________________________________
“Luxury suites have been growing in importancesince the 1990s and are an essential part of anynew stadium being built. In fact, most newstadiums are built not because they arephysically obsolete, but because they arefinancially obsolete.”
Prof. Emily Sparvero, Ph.D.Sports Industry Research CenterTemple University
_________________________________________________________________
24.3 Personal Seat LicensesPersonal seat licenses (PSLs) as a means to help finance construction dates to
the late 1990s. For new stadiums, PSLs are a significant part of the projects. To helpfund MetLife Stadium, for example, the New York Giants is charging $1,000 to $20,000a seat for PSLs; in addition to the seat license is the cost of the ticket: $85 to $700each.
PSLs are sold at 28 U.S. stadiums and arenas, as follows:Major League Baseball (5)• Arizona Diamondbacks, Minnesota Twins, San Diego Padres, San Francisco
Giants, St. Louis Cardinals
National Basketball Association (3)• Charlotte Bobcats, Toronto Raptors, Utah Jazz
SPORTS MARKETING 2020-2021
• 139 •

National Football League (18)• Atlanta Falcons, Baltimore Ravens, Carolina Panthers, Chicago Bears, Cincinnati
Bengals, Cleveland Browns, Dallas Cowboys, Green Bay Packers, Los AngelesChargers, Los Angeles Rams, New York Giants, New York Jets, Houston Texans,Philadelphia Eagles, Pittsburgh Steelers, San Francisco 49ers, Seattle Seahawks,Tennessee Titans
National Hockey League (2)• Columbus Blue Jackets, Toronto Maple Leafs
Seat license fees for the most recent and upcoming stadiums are as follows(source: SportsBusiness Journal): Least Expensiv e Most Expensive Year Open
• Dallas Cowboys: $2,000 $150,000 2009• New York Giants: $1,000 $ 20,000 2010• San Francisco 49ers: $2,000 $ 80,000 2014• Minnesota Vikings: $ 500 $ 9,500 2016• Atlanta Falcons: $ 500 $ 45,000 2017• Los Angeles Chargers: $ 100 $ 75,000 2020• Los Angeles Rams: $1,000 $100,000 2020
SPORTS MARKETING 2020-2021
• 140 •

25
SPEEDWAYS
25.1 OverviewOf the 1,000 speedways, or motorsport racetracks, in the U.S., approximately
800 are dirt tracks, most no bigger than a half mile. Among the larger speedways, 12have seating capacity for more than 100,000 people, making them the largest categoryof sports venue.
Some tracks accommodate spectators in the infield. Others have sitting orstanding areas on grassy banks. Capacity estimates vary for these tracks.
25.2 Major SpeedwaysThe following are the major speedways in the United States and their seating
capacity:• Atlanta Motor Speedway (Hampton, GA): 124,000• Auto Club Raceway (Pomona, CA): 40,000• Auto Club Speedway (Fontana, CA): 122,000• Bristol Motor Speedway (Bristol, TN): 160,000• Charlotte Motor Speedway (Concord, NC): 140,000• Chicagoland Speedway (Joliet, IL): 75,000• Darlington Raceway (Darlington, SC): 63,000• Daytona International Speedway (Daytona Beach, FL): 168,000• Dover International Speedway (Dover, DE): 95,500• Gateway International Raceway (Madison, IL): 78,000• Homestead-Miami Speedway (Homestead, FL): 65,000• Indianapolis Motor Speedway (Speedway, IN): 250,000• Iowa Speedway (Newton, IA): 30,000• Kansas Speedway (Kansas City, KS): 81,700• Kentucky Speedway (Sparta, KY): 107,000• Las Vegas Motor Speedway (Clark County, NV): 142,000• Martinsville Speedway (Martinsville, VA): 65,000• Memphis Motorsports Park (Millington, TN): 35,000• Michigan International Speedway (Brooklyn, MI): 137,000• Mid-Ohio Sports Car Course (Lexington, OH): 75,000• Milwaukee Mile (West Allis, WI): 37,000• New Hampshire Motor Speedway (Loudon, NH): 91,000
SPORTS MARKETING 2020-2021
• 141 •

• ISM Raceway (Avondale, AZ): 76,800• Pocono Raceway (Long Pond, PA): 76,800• Portland International Raceway (Portland, OR): 86,000• Richmond International Raceway (Richmond, VA): 121,000• Road America (Elkhart Lake, WI): 50,000• Rockingham Speedway (Rockingham, NC): 34,500• Sebring International Raceway (Sebring, FL): varies• Sonoma Raceway (Sonoma, CA): 47,000• Talladega Superspeedway (Talladega, AL): 175,000• Texas Motor Speedway (Fort Worth, TX): 191,100• Watkins Glen International (Watkins Glen, NY): 41,000
SPORTS MARKETING 2020-2021
• 142 •

PART IV: SPORTS MEDIA
SPORTS MARKETING 2020-2021
• 143 •

26
SPORTS TELEVISION BROADCASTING
26.1 Sports Network OverviewTelevision sports networks include major sports networks (see 26.5), sport-
specific networks (see 26.6), league networks (see 26.7), and regional sports networks(see 26.8).
The following number of homes are served by sports networks (source: Nielsen[www.nielsen.com]):• ESPN: 87,437• ESPN2: 87,349• FXX (Formerly Fox Soccer Channel): 85,573• Fox Sports 1: 84,159• NBC Sports Network: 83,790• GOLF Channel: 75,678• ESPNU: 68,574• MLB Network: 64,014• The Tennis Channel: 52,150• NBA-TV: 50,838• Fox Sports 2: 50,164• Univision Deportes: 46,595• Outdoor Channel: 38,160• Sportsman Channel: 31,081• beIN Sport: 22,679• Fox Deportes: 21,282• beIN Sport en Español: 18,319
According to SNL Kagan (www.snl.com), sports channels contribute about $8 tothe monthly bill – about $100 annually – for each U.S. cable and satellite household.
Among all channels, ESPN is the priciest, with a charge of slightly over $5.00 amonth for each cable and satellite household, a f igure that increases to about $6.50 persubscriber when ESPN2 and ESPN Classic are included. Other sports channels,including Fox Sports Net, NFL Network, and NBC Sports Network, account for anadditional $1.50. Regional sports networks (RSNs) add about $2.50 per subscriber permonth, a cost that has increased 53% since 2008.
SPORTS MARKETING 2020-2021
• 144 •

26.2 Sports Television Viewership DemographicsAccording to Nielsen, the median age of viewers for select sports is as follows:
• PGA Champions Tour: 64• Figure skating: 64 • LPGA: 63 • Horse racing: 63 • ATP: 61 • Monster Energy NASCAR Cup Series: 58 • Pro rodeo: 57 • MLB: 57 • WNBA: 55 • WTA Tour: 55 • Pro wrestling: 54• Olympics: 53 • College football: 52 • College basketball (men’s): 52 • NFL: 50 • Boxing: 49 • NHL: 49 • UFC: 49• Action sports: 47• English Premier League (EPL): 43• NBA: 42 • MLS: 40 • International soccer: 39
26.3 Most Watched Sports TV BroadcastsIn 2018, 63 of the Top 100 TV broadcasts were sports. The following were the
most watched sports TV programs in 2018 (source: Nielsen):Program Netw ork Date Avg. No. Viewers
• Super Bowl LII: NBC Feb. 4 103.39 million• NFC Championship: Fox Jan. 21 42.30 million• Winter Olympics Opening Ceremony: NBC Feb. 9 27.84 million• College Football Playoff Championship: ESPN Jan. 8 27.38 million• NFL Divisional Playoff: CBS Jan. 13 26.69 million• Sunday Night Football: NBC Nov. 4 23.68 million• NFL Wild Card: NBC Jan. 6 22.82 million• Winter Olympics: NBC Feb. 11 22.69 million• Sunday Night Football: NBC Sept. 9 22.12 million• NFL Special: NBC Nov. 22 21.73 million• Winter Olympics: NBC Feb. 10 21.39 million• Thursday Night Football: Fox Nov. 29 21.39 million• Sunday Night Football: NBC Oct. 14 21.11 million
SPORTS MARKETING 2020-2021
• 145 •

• Sunday Night Football: NBC Sept. 16 20.66 million• Winter Olympics: NBC Feb. 13 20.53 million• Sunday Night Football: NBC Nov. 25 20.44 million• Winter Olympics: NBC Feb. 12 20.33 million• Sunday Night Football: NBC Nov. 11 20.10 million• Sunday Night Football: NBC Dec. 23 19.57 million• Sunday Night Football: NBC Sept. 23 19.46 million• Sunday Night Football: NBC Dec. 9 19.39 million• NFL Kickoff Game: NBC Sept. 6 19.03 million• Sunday Night Football: NBC Nov. 18 18.84 million• Sunday Night Football: NBC Oct. 7 18.59 million• Orange Bowl/CFP Semifinal: ESPN Dec. 29 18.49 million• NBA Finals Game 2: ABC June 3 18.47 million• Sunday Night Football: NBC Dec. 16 18.12 million• NBA Finals Game 3: ABC June 6 17.94 million• Sunday Night Football: NBC Sept. 30 17.92 million• Sunday Night Football: NBC Dec. 2 17.83 million• NBA Finals Game 1: ABC May 31 17.67 million• World Series Game 5: Fox Oct. 28 17.63 million• Winter Olympics: NBC Feb. 20 17.53 million• Thursday Night Football: Fox Dec. 13 17.41 million• Winter Olympics: NBC Feb. 14 17.08 million• Thursday Night Football: Fox Nov. 15 16.89 million• Monday Night Football: ESPN Nov. 19 16.61 million• Winter Olympics: NBC Feb. 16 16.59 million• Winter Olympics: NBC Feb. 18 16.38 million• Winter Olympics: NBC Feb. 19 16.34 million• NBA Finals Game 4: ABC June 8 16.24 million• Winter Olympics: NBC Feb. 15 16.22 million• Sunday Night Football: NBC Dec. 30 16.05 million• Sunday Night Football: NBC Oct. 21 16.02 million• Winter Olympics: NBC Feb. 8 16.00 million• Winter Olympics: NBC Feb. 22 15.25 million• NBA West Finals Game 7: TNT May 28 14.81 million• Thursday Night Football: Fox Nov. 8 14.80 million• Winter Olympics Closing Ceremony: NBC Feb. 25 14.78 million• Thursday Night Football: Fox Oct. 11 14.76 million• Winter Olympics: NBC Feb. 17 14.52 million• Thursday Night Football: Fox Sept. 27 14.51 million• Winter Olympics: NBC Feb. 21 14.17 million• Sunday Night Football: NBC Oct. 28 14.09 million• World Series Game 1: Fox Oct. 23 13.81 million• World Series Game 4: Fox Oct. 27 13.56 million• World Series Game 2: Fox Oct. 24 13.51 million
SPORTS MARKETING 2020-2021
• 146 •

• NBA East Finals Game 7: ESPN May 27 13.31 million• NCAA Men's Championship: TBS April 2 13.28 million• Thursday Night Football: Fox Oct. 4 13.27 million• World Series Game 3: Fox Oct. 26 13.25 million• Monday Night Football: ESPN Oct. 1 13.21 million• Monday Night Football: ESPN Dec. 17 13.01 million
26.4 Broadcast Rights AgreementsThe following is a summary of major sports broadcast rights agreements:
Big Ten Conference College Football• Network: Big Ten Network• Annual broadcast rights fee: $112 million• Contract years: 2018-2032
Major League Baseball (MLB)• Networks: ESPN, Fox, and Turner Sports’ TBS• Annual broadcast rights fee: $1.5 billion• Contract years: 2014-2021
NASCAR• Networks: Fox• Annual broadcast rights fee: $300 million• Contract years: 2015-2022
National Basketball Association (NBA)• Networks: ESPN/ABC and Turner Sports’ TNT• Annual broadcast rights fee: $2.6 billion• Contract years: 2016/2017 thru 2023/2024
National Hockey League (NHL)• Networks: NBC and NBC Sports Network• Annual broadcast rights fee: $200 million• Contract years: 2012-2022
NCAA College Football Playoffs• Networks: ESPN• Annual broadcast rights fee: $470 million• Contract years: 2014-2026
NCAA Men’s Basketball Championship• Networks: CBS and Turner Sports’ TNT• Annual broadcast rights fee: $740 million• Contract years: 2010-2024
SPORTS MARKETING 2020-2021
• 147 •

NFL (AFC Package)• Networks: CBS• Annual broadcast rights fee: $960 million• Contract years: 2014-2022
NFL (Monday Night Football package)• Networks: ESPN• Annual broadcast rights fee: $1.9 billion• Contract years: 2014-2021
NFL (NFC Package)• Networks: Fox Sports• Annual broadcast rights fee: $1.1 billion• Contract years: 2014-2022
NFL (Sunday Night Football package)• Networks: NBC• Annual broadcast rights fee: $950 million• Contract years: 2014-2022
Notre Dame Football• Networks: NBC• Annual broadcast rights fee: $20 million• Contract years: 2016-2025
PGA Tour• Networks: CBS, NBC, Golf Channel• Annual broadcast rights fee: $500 million• Contract years: 2011-2021
SEC Conference College Football• Networks: CBS and ESPN• Annual broadcast rights fee: $210 million• Contract years: 2008-2023
U.S. Open Tennis• Networks: ESPN• Annual broadcast rights fee: $75 million• Contract years: 2015-2026
World Cup• Networks: Fox and Telemundo• Annual broadcast rights fee: $1 billion (estimated) • Contract years: 2018 and 2022
SPORTS MARKETING 2020-2021
• 148 •

For MLB, the following are the highest annual rights deals with RSNs (source:SportsBusiness Journal):• Los Angeles Dodgers: Time Warner Cable $320 million• Los Angeles Angels: Fox Sports West $150 million• Texas Rangers: Fox Sports Southwest $150 million• New York Yankees: YES $ 90 million• Boston Red Sox: NESN $ 60 million• San Diego Padres: Fox Sports San Diego $ 60 million• New York Mets: SportsNet New York $ 52 million
The Los Angeles Dodgers entered into a $8 billion, 25-year TV rights deal withTime Warner Cable beginning with the 2014 season. Averaging $320 million perseason, the deal is significantly higher than RSN rights in the past and suggests anescalation in rights fees is forthcoming upon expiration of contracts for other teams.
26.5 Major Sports NetworksThe following summarizes the broadcast rights of major sports properties by
broadcast and national cable networks:ABC Sports Network• Indy Racing League, including the Indianapolis 500• Major League Soccer• NASCAR• National Basketball Association, including championship finals• PGA Tour• U.S. Figure Skating Championships• Women’s National Basketball Association
CBS Sports Network• National Football League• NCAA Basketball Tournament• PGA Championship• PGA Tour• SEC college football• Supercross• The Masters• USTA US Open Tennis
ESPN/ESPN2• Breeders’ Cup• Indy Racing League• Major League Baseball
SPORTS MARKETING 2020-2021
• 149 •

• Major League Soccer• NASCAR• National Basketball Association• National Football League• U.S. Open (golf)• Women’s National Basketball Association• Wrangler National Finals Rodeo
Fox Sports• College Football Playoffs• FIFA World Cup• Major League Baseball, including the All-Star Game and World Series• NASCAR, including the Daytona 500• National Football League
NBC Sports Network• America’s Cup• Belmont Stakes• Kentucky Derby• NASCAR• National Hockey League, including The Stanley Cup• Notre Dame football• Olympics: Winter and Summer Games• PGA Tour• Preakness Stakes• Professional Bull Riders• Tour de France• U.S. Figure Skating• U.S. Open (golf)• Wimbledon
Turner Sports/TNT• Major League Baseball• National Basketball Association, including the All-Star Game• NASCAR• PGA Tour, PGA Championship, PGA Grand Slam
26.6 Sport-Specific NetworksThere are five major sport-specific networks, as follows:
Fox Sports 1• Speed, the second-largest sport-specific network, rebranded as Fox Sports 1 in
2013. The network, which launched in 1995, broadcasts several NASCAR Sprint
SPORTS MARKETING 2020-2021
• 150 •

Cup races along with other racing circuit events. Fox Sports 1 is distributed to 88.0 million households.
Fox Sports 2• Fuel TV rebranded as Fox Sports 2 in 2013. The network, which launched in 2003,
broadcasts the Men’s Association of Surfing events, Professionals World Tour, ProWakeboarding Tour, Ultimate Fighting Championship (UFC), Vans Triple Crown ofSurfing, and Women’s Association of Surfing events. Fox Sports 2 is distributed to45.4 million homes.
Golf Channel• The success of Golf Channel, which launched in 1995 and is distributed to 84.8
million households, spurred other sport-specific networks. The channel’s success islinked to its broadcast rights contract for the PGA Tour.
Tennis Channel• Tennis Channel, a 24-hour sports and lifestyle channel that launched in 2003,
reaches 34 million households. The channel is offered on Dish Network’s America’sTop 200 tier of programming and on sports tiers by major cable operators. TennisChannel was acquired by Sinclair Broadcasting in 2016 for $350 million. With 164local television stations in 79 markets, Sinclair was able to significantly increase thechannel’s reach.
The Ski Channel• The Ski Channel, launched in 2008, is devoted to year round mountain activities
such as skiing, snowboarding, hiking, biking, backpacking, climbing, and otherregional sports. Distribution is on AT&T U-Verse, Brighthouse Networks,Cablevision, Comcast, Cox Communications, DirecTV, RCN, Time Warner Cable,and Verizon FiOS.
26.7 League NetworksThe National Basketball Association launched NBA TV in 1999. NBA TV
broadcasts 96 regular-season games that are not included in its broadcast rights dealswith networks. NBA TV is available through Cablevision, Cox Communications,Comcast, DirecTV, DISH Network, and Time Warner Cable. NBA TV distribution is50.8 million households.
The National Football League launched the NFL Network in 2003. The channelbroadcasts highlights, classic games, and other content from the more than 4,000hours of footage from the NFL library. In 2006, the NFL Network began broadcastingeight prime-time regular-season NFL games, dubbed “The Run to the Playoffs.” NFLNetwork reaches 69.3 million households.
The National Hockey League launched the NHL Network in 2007 with cable and
SPORTS MARKETING 2020-2021
• 151 •

satellite distribution mostly on dedicated sports tiers. The network offers 50 live gamesin high definition. NHL Network reaches approximately 43 million homes.
Major League Baseball launched MLB Network, a 24-hour channel, in 2009; itwas the largest cable launch in history. MLB Network reaches 64.0 million cable andsatellite customers.
League networks have expanded online as well as through cable distribution.
26.8 Regional Sports NetworksRegional sports networks provide sports programming – generally local
professional or college games – to regional markets. Fox Sports Net (FSN) is a cluster of 17 regional cable sports networks with a
foundation of local game action as well as national sports news that can be insertedlocally.
Regional sports networks, their reach, and the sports rights they hold are asfollows (source: SportsBusiness Journal):AT&T SportsNet Northwest (http://northwest.rootsports.com): 1.2 million households (HH)• Gonzaga University• MLB Seattle Mariners• MLS Seattle Sounders FC• Oregon State University• Portland Beavers (AAA)• Seattle University• University of Washington• USL Portland Timbers• Washington State University• WHL
AT&T SportsNet Pittsburgh (http://pittsburgh.rootsports.com): 1.2 million HH• MLB Pittsburgh Pirates• NHL Pittsburgh Penguins• University of Pittsburgh• West Virginia University
AT&T SportsNet Utah (http://utah.rootsports.com): 921,000 HH• Utah Jazz
Altitude Sports and Entertainment (www.altitude.tv): 3.1 million HH• Big Sky Conference• ECHL Colorado Eagles• NBA Denver Nuggets• NHL Colorado Avalanche• Rocky Mountain Athletic Conference
SPORTS MARKETING 2020-2021
• 152 •

Comcast Sportsnet Bay Area/California (www.csnbayarea.com): 3.9 million HH • MLB Oakland Athletics• MLS San Jose Earthquakes• NBA Sacramento Kings• NHL San Jose Sharks• University of California
Comcast Sportsnet Chicago (www.csnchicago.com): 3.5 million HH• MLB Chicago Cubs• MLB Chicago White Sox• MLS Chicago Fire• NBA Chicago Bulls• NHL Chicago Blackhawks• Notre Dame
Comcast SportsNet Houston (www.csnhouston.com): 6.1 million HH• MLB Houston Astros• MLS Houston Dynamo• NBA Houston Rockets• Rice University• University of Houston
Comcast Sportsnet Mid-Athletic (www.csnmidatlantic.com): 2.4 million HH• Atlantic Coast Conference• Colonial Athletic Association• MLS D.C. United• NBA Washington Wizards• NHL Washington Capitals• University of Maryland• University of Virginia• Virginia Tech
Comcast Sportsnet New England (www.csnne.com): 2.4 million HH• MLS New England Revolution• NBA Boston Celtics
Comcast Sportsnet Philadelphia (www.csnphilly.com): 3.0 million HH• MLB Philadelphia Phillies• NBA Philadelphia 76ers• NHL Philadelphia Flyers
Cox Sports Television (www.coxsportstv.com): 652,000 HH• Louisiana high schools• Louisiana State University
SPORTS MARKETING 2020-2021
• 153 •

• Louisiana Tech University• NBA New Orleans Pelicans• New Orleans Zephyrs (AAA)• Pensacola Pelicans (Independent)• Southeastern Conference• Southern University• Sun Belt Conference• Texas A&M University• Tulane University• University of Arkansas• University of Florida• University of Louisiana, Lafayette• University of New Orleans
Fox Sports Arizona (www.foxsportsarizona.com): 1.9 million HH• Arizona State University• MLB Arizona Diamondbacks• NBA Phoenix Suns• NHL Phoenix Coyotes• Northern Arizona University• WNBA Phoenix Mercury
Fox Sports Detroit (www.foxsportsdetroit.com): 1.9 million HH• Central Collegiate Hockey Association• Michigan High School Athletic Association• MLB Detroit Tigers• NBA Detroit Pistons• NHL Detroit Red Wings
Fox Sports Florida (www.foxsportsflorida.com): 5.0 million HH• Atlantic Coast Conference• MLB Florida Marlins• NBA Orlando Magic• NHL Florida Panthers
Fox Sports Indiana (www.foxsports.com/indiana): 1.1 million HH• NBA Indiana Pacers• WNBA Indiana Fever
Fox Sports Kansas City (www.foxsports.com/kansas-city): 942,000 HH• MLB Kansas City Royals
Fox Sports Midwest (www.foxsportsmidwest.com): 1.2 million HH• Big 12 Conference
SPORTS MARKETING 2020-2021
• 154 •

• Kansas State University• Missouri high school championships• Missouri Valley Conference• MLB St. Louis Cardinals• NHL St. Louis Blues• University of Missouri• University of Nebraska
Fox Sports New Orleans (www.foxsports.com/new-orleans): 652,000 HH• NBA New Orleans Pelicans
Fox Sports Oklahoma (www.foxsports.com/oklahoma): 730,000 HH• NBA Oklahoma City Thunder
Fox Sports North (www.foxsportsnorth.com): 1.8 million HH• MLB Minnesota Twins• NBA Minnesota Timberwolves• NHL Minnesota Wild• University of Minnesota• University of Wisconsin• WIAA Championships• WIAC Events• WNBA Minnesota Lynx
Fox Sports Ohio (www.foxsports.com/ohio): 3.3 million HH• Cleveland State University• Mid-American Conference• MLB Cincinnati Reds• MLB Cleveland Indians• NBA Cleveland Cavaliers• NHL Columbus Blue Jackets• Ohio Athletic Conference• Ohio High School Athletic Association
Fox Sports San Diego (www.foxsports.com/san-diego): 1.5 million HH• MLB San Diego Padres
Fox Sports South/Sportsouth (www.foxsportssouth.com): 6.4 million HH• Atlantic Coast Conference• MLB Atlanta Braves• NBA Atlanta Hawks• NBA Charlotte Hornets• NBA Memphis Grizzlies• NHL Carolina Hurricanes
SPORTS MARKETING 2020-2021
• 155 •

• NHL Nashville Predators• Southern Conference• University of Kentucky• University of South Carolina• University of Tennessee
Fox Sports Southwest (www.foxsportssouthwest.com): 3.6 million HH• Baylor University• MLB Texas Rangers• MLS FC Dallas• NBA Dallas Mavericks• NBA Oklahoma City Thunder• NBA San Antonio Spurs• NHL Dallas Stars• Oklahoma Secondary School Activities Association• Oklahoma State University• Texas A&M Univesity• Texas Tech University• University Interscholastic League (Texas)• University of Oklahoma• University of Texas
Fox Sports West (www.foxsportswest.com): 5.7 million HH• MLB Los Angeles Angels• MLB Los Angeles Dodgers• MLS Chivas USA• MLS Los Angeles Galaxy• NBA Los Angeles Clippers• NBA Los Angeles Lakers• NHL Anaheim Ducks• NHL Los Angeles Kings• WNBA Los Angeles Sparks
Fox Sports Wisconsin (www.foxsports.com/wisconsin): 917,000 HH• MLB Milwaukee Brewers• NBA Milwaukee Bucks
Mid-Atlantic Sports Networks (www.masnsports.com): 5.5 million HH• BB&T Classic (basketball)• Big East Conference• Big South Conference• Colonial Athletic Association• George Mason University• Georgetown University
SPORTS MARKETING 2020-2021
• 156 •

• MLB Baltimore Orioles• MLB Washington Nationals• University of North Carolina, Wilmington
MSG Network (www.msg.com): 7.5 million HH• MLS New York Red Bulls• NBA New York Knicks• NHL Buffalo Sabres• NHL New Jersey Devils• NHL New York Islanders• NHL New York Rangers• WNBA New York Liberty
New England Sports Network (www.nesn.com): 2.4 million HH• American East Conference• Atlantic Coast Conference Hockey East• Beanpot Hockey Tournament• Champions Cup Boston Tennis• Little League New England Regional Tournament• MLB Boston Red Sox• NHL Boston Bruins
Sportsnet Los Angeles (www.sportsnetla.com): 5.7 million HH• MLB Los Angeles Dodgers
Sportsnet New York (www.sny.tv): 7.5 million HH• Big East Conference• Broadway Boxing• Brooklyn Cyclones (A)• Buffalo Bisons (AAA)• MLB New York Mets• Rutgers University• University of Connecticut
Sun Sports (www.foxsportsflorida.com): 5.0 million HH• Florida State University• MLB Tampa Bay Rays• NBA Miami Heat• NBA Orlando Magic• NHL Tampa Bay Lightning• Southeastern Conference• University of Florida
SPORTS MARKETING 2020-2021
• 157 •

YES Network (www.yesnetwork.com): 7.5 million HH• MLB New York Yankees• NBA New Jersey Nets
26.9 RSN RatingsThe following was the highest-rated RSN programming in 2019 (source:
SportsBusiness Journal):Major League Baseball Avg. Rating
• Milwaukee Brewers: Fox Sports Wisconsin 6.34• St. Louis Cardinals: Fox Sports Midwest 6.22• Minnesota Twins: Fox Sports North 6.12• Cleveland Indians: Sports Time Ohio 5.76• Cincinnati Reds: Fox Sports Ohio 5.71
National Basketball Association• Golden State Warriors: CSN Bay Area 7.42• Oklahoma City Thunder: Fox Sports Oklahoma 6.69• Utah Jazz: AT&T Rocky Mountain 6.60• San Antonio Spurs: Fox Sports Southwest 4.58• Portland Trail Blazers: NBC Sports Northwest 3.55
National Hockey League• Buffalo Sabres: MSG 8.13• Pittsburgh Penguins: AT&T Pittsburgh 6.38• Vegas Golden Knights AT&T Rocky Mountain 4.05• St. Louis Blues: Fox Sports Midwest 3.66• Minnesota Wild: Fox Sports North 2.90
26.10 Sports Programming On Cable NetworksThe following is the sports tier content on cable systems (sources:
SportsBusiness Journal and the cable systems):Cablevision• Fox Sports Atlantic, Fox Sports Central, Fox Sports Pacific, Golf Channel, GolTV,
MavTV, NBA TV, NBC Sports Network, NHL Network, Outdoor Channel, and TVG(horse racing channel)
Charter Communications• CBS College Sports, Fox Sports Atlantic, Fox Sports Central, Fox Sports Pacific,
Fox Sports World, Fuel, HRTV, MavTV, Outdoor Channel, Sportsman Channel, andTennis Channel
SPORTS MARKETING 2020-2021
• 158 •

Comcast• CBS College Sports, Fox Sports Atlantic, Fox Sports Central, Fox Sports Pacific,
NBA TV, NFL Network, NHL Network, and Tennis Channel
Cox Communications• ESPN Classic, ESPNews, ESPNU, Fit TV, Fox Soccer Channel, Golf Channel,
GolTV, NBA TV, NBC Sports Network, NFL Network, NHL Network, and TennisChannel
Time Warner Cable• CBS College Sports, ESPNews, Fox Soccer Channel, Fox Sports Atlantic, Fox
Sports Central, Fox Sports Pacific, Fuel, NBA TV, NHL Network, and TennisChannel
26.11 College Sports BroadcastsMajor college conferences have contracted with networks to broadcast their
sports events. Broadcast rights deals are as follows (source: SportsBusiness Journal):Conference Networks Deal Contract Years
• ACC ESPN/ABC $3.60 billion/15 years 2011-12 - 2026-27• Big 12 ESPN/ABC $1.30 billion/13 years 2012-13 - 2024-25
Fox $1.17 billion/13 years 2012-13 - 2024-25• Big East ESPN/ABC $ 240 million/12 years 2013-14 - 2024-25• Big Ten Big Ten Network $2.80 billion/25 years 2007-08 - 2031-32
Fox $1.32 billion/6 years 2016-17 - 2022-23ESPN $1.14 billion/6 years 2016-17 - 2022-23CBS $ 60 million/6 years 2016-17 - 2022-23
• Pac-12 ESPN/ABC $3.00 billion/12 years 2011-12 - 2022-23• SEC ESPN/ABC $2.25 billion/15 years 2009-10 - 2023-24
CBS $ 825 million/15 years 2009-10 - 2023-24
In addition to its telecasts of The Big Ten Network games for the conference,Fox holds a 49% stake in the network.
College Sports Television (CSTV), launched in 2006 and owned by CBS,reaches 15 million cable sports-tier subscribers. While the network broadcasts somemajor sports events, such as Navy football games, for the most part it offers nicheprogramming – soccer, swim meets, women’s volleyball – that appeals to localenthusiasts.
In 2006, ESPN launched ESPNU, delivering college programming to eight millionsubscriber households. The network reaches 73.6 million households.
In 2011, ESPN and the University of Texas launched a 24-hour televisionnetwork showing Longhorns sports as well as original programming, studio shows,historical programming, and other academic and cultural events. In addition, there isuniversity news, coverage of lectures and visiting speakers, commencement
SPORTS MARKETING 2020-2021
• 159 •

ceremonies, and even high school coverage on an authenticated online/broadband site. It is the first network dedicated to a single school. The deal is worth $300 million over20 years.
26.12 European Sports NetworksEuropean broadcast rights for U.S. sports leagues are as follows:
• BT Sport: IndyCar, MLB, NASCAR, NBA, NCAA football and basketball, UFC• Eurosport: Arena Football League, Big Ten football, NFL Monday Night
football (in the U.K.)• Sport1 US: IndyCar, MLS, NBA, NCAA football and basketball, NFL
U.S. sports leagues have been able to achieve only niche popularity acrossEurope. U.S. hockey is big in Scandinavia and Eastern Europe – approximately 30% ofNHL players are from this region. NBA games are a draw in Spain, Italy, and otherWestern European countries where basketball is popular. But, even in these regions,Europeans remain loyal to local clubs rather that U.S. teams.
SPORTS MARKETING 2020-2021
• 160 •

27
SPORTS RADIO
27.1 Sports Radio StationsNew York City-based WFAN (660 AM) is credited with pioneering the
24-hour-per-day sports-talk format. Its success spawned rapid growth of sports-talkradio in the 1990s and 2000s. Every major metropolitan area now has at least oneradio station offering 24/7 sports programming; some have two or more.
According to the Streaming Radio Guide (http://streamingradioguide.com), therewere 566 streaming AM sports radio stations and 171 streaming FM sports radiostations in the U.S. as of July 2019, distributed as follows:
Total AM FM
• National sports talk: 510 407 103• Local sports talk: 103 61 42• Sports variety: 61 45 16• Total: 674 513 161
A list of streaming sports radio stations is available online athttp://streamingradioguide.com/internet-radio.php.
The following are sports talk radio stations:Alabama• WJOX - Jox 94.5 (Birmingham)• WUMP - SportsRadio 730 The UMP (Huntsville)• WYTK - 93.9 THE SCORE (Florence)
Arizona• KGME - XTRA Sports 910 (Phoenix)• KTAR - Sports 620 (Phoenix)
Arkansas• KTTG - ESPN Sports Radio 96.3 (Mena)
California • KGMZ - 95.7 The Game (San Francisco-Oakland)• KHTK - CBS Sports 1140 (Sacramento)• KIFM - ESPN 1320 (Sacramento)• KLAA - AM 830 KLAA (Los Angeles)• KLAC - AM 570 KLAC (Los Angeles)
SPORTS MARKETING 2020-2021
• 161 •

• KLSD - XTRA Sports 1360, San Diego’s Sports Station (San Diego)• KNBR - The Sports Leader (San Francisco/Sacramento)• KSPN - 710 ESPN, Experience Sports! (Los Angeles)• KTCT - The Sports Leader (San Mateo)• KTDD - Fox Sports Radio 1350 (San Bernardino)• KWKW - Radio Deportes (Los Angeles)
Colorado • KCKK - Mile High Sports Radio (Denver)• KKFN - Sportsradio 104.3 The Fan (Denver)
Connecticut • WPOP - Fox Sports Radio 1410 (Hartford)• WUCS - 97.9 ESPN (Hartford)
Delaware • WWTX - 1290 The Ticket (Wilmington)
District of Columbia • WJFK-FM - 106.7 The Fan (Washington)• WTEM - ESPN 980 (Washington)
Florida • WAXY - 790 The Ticket (South Miami)• WCCF - The Sports Ministry 1580 AM (Port Charlotte)• WDAE - 620 WDAE The Sports Animal (Tampa)• WFXJ - Sports Radio 930 (Jacksonville)• WHBO - ESPN 1040 (Tampa Bay)• WJXL - 1010 XL (Jacksonville)• WQAM - Sportsradio 560 (Miami)• WUUB - ESPN 106.3 (West Palm Beach)
Georgia • WCNN - 680 The Fan (Atlanta)• WLOP - 1370 The BUZZ (Jessup)• WQXI - 790 The Zone (Atlanta)
Hawaii • KHKA - NBC Sports Radio 1500AM (Honolulu)
Illinois• WMVP - ESPN Radio 1000 (Chicago)• WSCR - Chicago Sports Radio 670 The Score (Chicago)• WSJK - ESPN 93.5 (Champaign-Urbana)
SPORTS MARKETING 2020-2021
• 162 •

Indiana • WFNI - 1070 The Fan (Indianapolis)• WNDE - Sportsradio 1260 (Indianapolis)• WXFN - Sports Muncie (Muncie)
Iowa • KBGG - 1700 The Champ (Des Moines)• KXNO - Des Moines’ Sports Station (Des Moines)
Kansas • KSEK - 99.1 The Ticket (Pittsburg)
Kentucky • WKRD - Cards Radio 790 (Louisville)
Maryland • WJZ-FM - 105.7 The Fan (Baltimore)• WJZ - ESPN Radio 1300 (Baltimore)• WNST - Sports Talk 1570 WNST (Towson)• WSPZ - Sports Talk 570 (Bethesda)
Massachusetts • WBZ-FM - 98.5 The Sports Hub (Boston)• WEEI-FM - WEEI Sports Radio Network (Boston)• WEEI - ESPN on WEEI (Boston)• WHLL - Sports Radio 1450 The Hall (Springfield)• WVEI - SportsRadio 1440 WEEI (Worcester)• WWEI - SportsRadio 105.5 WEEI-FM (Springfield)
Michigan • WBBL - The Ball (Grand Rapics)• WDFN - 1130 AM WDFN: The Fan (Detroit)• WTKA - The Leaders and Best (Ann Arbor)• WXYT-FM - 97.1 The Ticket (Detroit)
Minnesota • KFXN-FM - 100.3 KFAN (Minneapolis-Saint Paul)• KSTP - 1500 ESPN (Minneapolis-Saint Paul)
Mississippi • WSFZ - SuperSport 930 (Jackson)
SPORTS MARKETING 2020-2021
• 163 •

Missouri • KCSP - 610 Sports (Kansas City)• KGIR - ESPN Radio 1220 (Cape Girardeau)• WHB - Sports Radio 810 WHB (Kansas City)• WXOS - ESPN 101.1 (St. Louis)
Nebraska • KOZN - 1620 AM The Zone (Omaha)
Nevada • KBAD - 920 The Game (Las Vegas)• KPLY - Fox Sports Radio 630 (Reno)
New Hampshire • WGAM - 1250 The Game (Manchester)
New York • WEPN-FM - ESPN New York 98.7 FM (New York)• WFAN - Sports Radio 66 and 101.9 FM WFAN: The Fan (New York)• WFAN-FM - Sports Radio 66 and 101.9 FM WFAN: The Fan (New York)• WGR - WGR Sports Radio 550 (Buffalo)• WHLD - Sportsradio 1270 The FAN (Buffalo)• WTMM-FM - 104.5 The Team (Albany)
North Dakota• KDKT - KDKT Sports Radio (Bismarck)• KMSR - Sports Radio 1520 (Grand Forks and Fargo)
North Carolina • WCMC-FM - 99.9 the Fan (Raleigh)• WDNC - 620 the Buzz (Raleigh)• WFNZ - The Franchise (Charlotte)
Ohio • WARF - Fox Sports 1350 (Akron)• WBNS-FM - 97.1 The Fan (Columbus)• WBNS - 1460 ESPN (Columbus)• WCKY - ESPN 1530 (Cincinnati)• WKNR - ESPN 850 WKNR (Cleveland)• WKRK-FM - 92.3 The Fan (Cleveland)• WSAI - Fox Sports 1360 (Cincinnati)• WWGK - ESPN 1540 KNR2 (Cleveland)
SPORTS MARKETING 2020-2021
• 164 •

Oklahoma • KRXO - 1270 The Franchise (Claremore/Tulsa)• KSPI - Sports Talk 780 (Stillwater)
Oregon • KEJO - 1240 Joe Radio (Corvallis)• KFXX - ESPN Sports Radio 1080 The FAN (Eugene)• KUJZ - Sportsradio 95.3 (Eugene)• KXTG - 750/102.9 The Game (Portland)
Pennsylvania • KDKA-FM - SportsRadio 93.7 The Fan (Pittsburgh)• WEEX - SportsRadio 1230 and 1320 (Lehigh Valley)• WICK - NEPA Sports Radio The Game (Scranton/Wilkes-Barre)• WIP-FM - Sports Radio 94 WIP (Philadelphia)• WLLF - ESPN 96.7 (Mercer)• WOYK - Sports Radio 1350 (York)• WPEN - 97.5 The Fanatic (Philadelphia)• WTEL - CBSSportsRadio 610AM (Philadelphia)
Rhode Island • WVEI-FM - SportsRadio 103.7 WEEI-FM (Providence)
Tennessee • KQPN - 730 Fox Sports (Memphis)• WEMB (AM) - 1420 NBC Sports Radio Tri-Cities (Tri-Cities)• WGFX - 104.5 The Zone (Nashville)• WHBQ - Sports 56 (Memphis)• WMFS - ESPN 92.9 & 680 (Memphis)• WMFS-FM - ESPN 92.9 & 680 (Memphis)• WNML - The Sports Animal (Knoxville)• WNSR - Sports Radio 560 (Nashville)• WPRT-FM - 102.5 The Game (Nashville)
Texas • KBME - 790 The Sports Animal (Houston)• KESN - 103.3 FM ESPN (Dallas/Fort Worth)• KFNC - ESPN 97.5 The Ticket (Houston)• KGOW - 1560 The Game (Houston)• KIKR - Sports Radio 1450 (Beaumont)• KILT - Sports Radio 610 (Houston)• KJTV - AM 950/100.7 FM (Lubbock)• KRLD-FM - 105.3 The Fan (Dallas)• KTCK - The Ticket (Dallas)
SPORTS MARKETING 2020-2021
• 165 •

• KTLT - The Ticket (Anson)• KVET - AM 1300 The Zone (Austin)
Utah • KZNS - 1280 The Zone (Salt Lake City)
Virginia • WRNL - Sports Radio 910 (Richmond)• WVSP-FM - ESPN Radio 94.1 (Virginia Beach)• WWBU - SuperSports 101.7 (Radford)
Washington • KFNQ - AM 1090 The Fan (Seattle)• KHHO - Fox Sports Radio 850 (Tacoma)• KIRO - 710 ESPN Seattle (Seattle)• KJR - Sports Radio 950 and 92.7 (Seattle)• KRKO - Fox Sports Radio 1380 (Everett)
Wisconsin • WAUK - 540 ESPN (Milwaukee)• WDUZ - Sports Radio 107.5 and 1400 The Fan (Green Bay)• WTLX - FM 100.5 ESPN (Madison)
Wyoming • KFBC - 1240 AM Sports and Talk (Cheyenne)• KHAT - ESPN Sportsradio 1210 (Laramie)
The following links to a list of sports play-by-play radio stations:www.rkma.com/sportsradio.pdf.
Nielsen Audio ratings (www.nielsen.com/us/en/solutions/capabilities/audio.html)represent average quarter-hour shares (percentage of households tuned into a specif icstation) within a given market. Forty-two (42) sports radio stations have a rating of 1.0or higher. The following are the sports radio stations with the highest ratings:• WEEI/WEEI-FM (Boston, MA): 6.2• WWLS/WWLS-FM (Oklahoma City, OK): 4.8• WFAN (Nassau-Suffolk, NY): 4.3• KFAM (Minneapolis-Saint Paul, MN): 3.9• WIP (Philadelphia, PA): 3.7• WHTK (Sacramento, CA): 3.5• WHB (Kansas City, MO-KS): 2.9• WFAN (New York, NY): 2.7• WBNS (Columbus, OH): 2.6• WEAE (Pittsburgh, PA): 2.4• WSAI (Cincinnati, OH): 2.4
SPORTS MARKETING 2020-2021
• 166 •

• KJR (Seattle, WA): 2.3• WDAE (Tampa-St. Petersburg, FL): 2.3• KNBR (San Francisco, CA): 2.2• WTEM (Washington, DC): 2.2• WFNZ/WFNA (Charlotte, NC): 2.2
According to SportsBusiness Journal, annual sports radio broadcast rights feesare approximately $460 million.
27.2 Sports Radio NetworksSports radio networks broadcast talk radio shows and live events. Talk radio
includes proprietary content and nationally syndicated radio shows, such as The JimRome Show and 2 Live Stews.
The sports radio networks and their major sports rights are as follows:ESPN Radio (www.espnradio.com)• Bowl Championship Series• Major League Baseball• Major League Soccer• NCAA Football
ESPN Deportes Radio (www.espndeportesradio.com)• Major League Baseball• Major League Soccer
MRN - Motor Racing Network (www.motorracingnetwork.com)• NASCAR Camping World Truck Series races• NASCAR Nationwide Series Races• NASCAR Sprint Series; 14 races
PRN - Performance Racing Network (PRN, www.goprn.com)• NASCAR Camping World Truck Series races• NASCAR Nationwide Series races• NASCAR Sprint Series; 9 races
Sporting News Radio (www.sportingnewsradio.com)• College Football Saturday• NFL Notebook • NFL pre-game specials
Sports Byline USA (www.sportsbyline1.com)• 24-hour talk radio programming
SPORTS MARKETING 2020-2021
• 167 •

Westwood One (www.westwoodone.com)• British Open• Masters Golf Tournament• NCAA Final Four• NCAA regular-season games• NCAA Women’s Final Four• NFL Monday Night Football (NFL)• NFL Playoffs• NFL Pro Bowl• NFL Saturday Night Football (NFL)• NFL Thursday Night Football (NFL)• NFL Sunday Night Football (NFL)• PGA Championship• Super Bowl• U.S. Open (golf)
National Public Radio (NPR, www.npr.org) and Premier Radio Networks(www.premierradio.com) also broadcast some sports programming.
27.3 The Sports Radio AudienceAccording to Nielsen Audio, 41.8 million people listen to sports radio each week.Based on data from Scarborough Research (www.scarborough.com), Abritron
provides the following profile of adult sports radio listeners:Gender• Male: 74%• Female: 26%
Age (men only)• 18-to-34: 24%• 35-to-49: 36%• 50 and older: 40%
Household Income• Less than $25,000: 8%• $25,000 to $49,999: 22%• $50,000 to $74,999: 18%• $75,000 and higher: 52%
Education• Less than high school: 4%• High school graduate: 26%• Some college: 30%• College graduate: 39%
SPORTS MARKETING 2020-2021
• 168 •

Among those who listen to sports radio, average time spent listening to theformat, by age demographic, is as follows:• 12-to-24: 2 hours, 45 minutes• 18-to-34: 4 hours, 45 minutes• 25-to-54: 5 hours, 15 minutes• 35-to-64: 5 hours, 00 minutes
Sports radio listening is distributed by location as follows:• Away from home: 70%• At home: 30%
Although audiences are dwarfed by market-leading rock stations, sports stationsare a good vehicle for products aimed at the male audience. According to radio salesrepresentation firm Interep (www.interep.com), more than 65% of sports-radio listenersare men; 70% are ages 25-to-54. These listeners are 81% more likely than all radiolisteners to be college graduates; 67% are more likely to have household income over$75,000.
27.4 AdvertisingSportsBusiness Journal estimates annual sports radio advertising revenues at
$2.2 billion.According to BIA Financial Network (www.bia.com) and SportsBusiness Journal,
the following all-sports stations have the highest annual advertising revenue:• WFAN 660 (Nassau-Suffolk, NY): $40.5 million• WEEI 850 (Boston, MA): $35.2 million• WIP 610 (Philadelphia, PA): $23.7 million• KNBR 680 (San Francisco, CA): $21.6 million• WTCK 1310 (Dallas-Ft. Worth, TX): $20.1 million• KSPN 91.1 (Los Angeles, CA): $18.0 million• WSCR 670 (Chicago, IL): $15.0 million• WTEM 940/94.3 (Washington, DC): $14.0 million• WBZ 98.5 (Boston, MS): $13.2 million• WMVP 1000 (Chicago, IL): $12.2 million• WRLD 105.3 (Dallas, TX): $11.9 million• WJFK 106.7 (Washington, DC): $10.5 million• KLAC 570 (Los Angeles, CA): $10.3 million• WQXI 790 (Atlanta, GA): $ 9.8 million• WEPN 1050 (New York, NY): $ 7.5 million
SPORTS MARKETING 2020-2021
• 169 •

27.5 Sports on Satellite RadioSiriusXM Radio (www.siriusxm.com), the only satellite operator in the United
States, had 34 million paid subscribers as of January 2019. SiriusXM had 229 sports radio channels; 210 are play-by-play channels and 19
are sports-talk format; 159 are online-only. Sports-talk format channels are as follows:• SiriusXM 83 - ESPN Radio• SiriusXM 84 - ESPN Xtra• SiriusXM 85 - Mad Dog Sports Radio• XM 86 - SiriusXM NBA Radio• XM 87 - SiriusXM Fantasy Sports Radio• SiriusXM 88 - SiriusXM NFL Radio• XM 89 - MLB Network Radio• SiriusXM 90 - SiriusXM NASCAR Radio• SiriusXM 91 - SiriusXM College Sports Nation• SiriusXM 92 - SiriusXM Sports Zone• Sirius 93 - SiriusXM Bleacher Report Radio• XM 93 - PGA Tour Network• SiriusXM 94 - SiriusXM FC• SiriusXM 157 - ESPN Deportes Radio (Spanish)• Sirius 207 - SiriusXM NBA Radio• Sirius 208 - PGA Tour Network• XM 208 - SiriusXM Bleacher Report Radio• Sirius 209 - MLB Network Radio• Sirius 210 - SiriusXM Fantasy Sports Radio
27.6 Live Broadcast BaseballAccording to Nielsen Audio PPMTM Radio Listening for Pro Baseball, the top
sports radio stations, ranked by the average number of listeners, are as follows: Flagship Station Avg. Audience
• New York Yankees: WCBS-AM 297,200• San Francisco Giants: KNBR-AM 216,200• New York Mets: WFAN-AM 209,100• Detroit Tigers: WXYT-AM/WXYT-FM 199,700• Philadelphia Phillies: WPHT-AM 169,400• Chicago Cubs: WGN-AM 138,000• Chicago White Sox: WSCR-AM 135,500• Seattle Mariners: KIRO-AM 120,800• Cincinnati Reds: WLW-AM 114,800• Texas Rangers: KESN-FM 100,700
The following stations rank highest in average percentage of male listeners, ages25-to-54:
SPORTS MARKETING 2020-2021
• 170 •

Station Rating
• Cincinnati Reds: WLW-AM 26.3• Detroit Tigers: WXYT-AM/WXYT-FM 25.9• Milwaukee Brewers: WTMJ 20.8• Pittsburgh Pirates: KDKA-FM 15.5• St. Louis Cardinals: KTRS-AM 15.4• Philadelphia Phillies: WPHT-AM 15.4• San Francisco Giants: KNBR-AM 12.9• Cleveland Indians: WTAM 11.0• Boston Red Sox: WEEI-AM 9.9• Seattle Mariners: KIRO-AM 9.8
SPORTS MARKETING 2020-2021
• 171 •

28
SPORTS PERIODICALS
28.1 Market AssessmentAccording to Advertising Age, the combined revenue of the top 15 sports
magazines is $2.2 billion, of which approximately 77% is derived from advertising and23% from circulation.
The following are the top sports magazine titles based on advertising revenue(source: The Association of Magazine Media [AMM, www.magazine.org]):• Sports Illustrated: $545 million• ESPN Magazine: $290 million
28.2 CirculationAccording to the AMM, the top sports magazine titles, based on total readership
in March 2019, are as follows:• ESPN The Magazine: 117.38 million• Sports Illustrated: 27.35 million• Muscle & Fitness: 7.18 million• Golf Digest: 12.80 million• Game & Fish: 3.98 million• Runners World: 6.29 million• Ski: 1.44 million
28.3 List of Sports PeriodicalsThe following is a list of sports-focused magazines:
• 90:00 Soccer Magazine (www.90soccer.com)• American Cheerleader (www.americancheerleader.com)• American Fencing (www.americanfencingmagazine.com)• American Quarter Horse Journal (www.aqha.com)• American Track & Field (www.american-trackandfield.com)• American Turf Monthly (www.americanturf.com)• Athletic Business Magazine (www.atheleticbusiness.com)• Athletic Management (www.atheleticmanagement.com)• Athletics Administration (www.nacda.com)• Athlon Sports (www.athlonsports.com)• Backpacker (www.backpacker.com)
SPORTS MARKETING 2020-2021
• 172 •

• Baseball America (www.baseballamerica.com)• Baseball Digest (www.baseballdigest.com)• Basketball Times (www.basketballtimes.com)• Bassin’ Magazine (www.ebassin.com)• Bassmaster (www.bassmaster.com)• Bicycling (www.bicycling.com)• Bike Magazine (www.bikemag.com)• Billiards Digest (www.billiardsdigest.com)• Black Belt (www.blackbeltmag.com)• Blades on Ice (www.bladesonice.com)• BMX Plus! (www.bmxplusmag.com)• Bowlers Journal International (www.bowlersjournal.com)• Bowling This Month (www.bowlingthismonth.com)• Canoe & Kayak (www.canoekayak.com)• Card Player (www.cardplayer.com)• Champion (www.ncaachampionmagazine.org)• Circle Track (www.circletrack.com)• Climbing (www.climbing.com)• Coach and Athletic Director (www.coachad.com)• Concrete Wave (www.concretewavemagazine.com)• Crappie World (www.crappieworldonline.com)• Cross Country Skier (www.crosscountryskier.com)• Curl (www.curl.co.nz)• Cycle Sport America (www.cyclesportmag.com)• Daily Racing Form (www.drf.com)• Dime Magazine (www.dimemag.com)• Dirt Rag (www.dirtragmag.com)• Dirt Rider (www.dirtrider.com)• Drag Racer (www.dragracermag.com)• Dressage Today (www.equisearch.com/dressagetoday)• Equus (www.equissearch.com/equus)• ESPN The Magazine (www.espn.go.com/magazine)• Executive Golfer (www.executivegolfermagazine.com)• Explore (www.explore-mag.com)• Facility Manager (www.iaam.org/facility_manager/pages/facility_issues.htm)• Fantasy Football & Baseball Index (www.fantasyindex.com)• Fantasy Football Cheatsheets (www.footballdiehards.com)• Fantasyguru.com Magazine (www.fantasyguru.com)• Field & Stream (www.fieldandstream.com)• Fight! (www.fightmagazine.com)• Fly Fishing (www.flyfisinsalt.com)• Freeskier (www.freeskier.com)• Gameplan’s College and Pro Football Annual (www.gameplanmagazines.com)
SPORTS MARKETING 2020-2021
• 173 •

• Go Indoor (www.usindoor.com)• Golf Business (www.golfbusiness.com)• Golf Digest (www.golfdigest.com)• Golf Illustrated (www.golfillustrated.com)• Golf Inc. (www.golfincmagazine.com)• Golf Magazine (www.golf.com)• Golf Tips (www.golftipsmag.com)• Golf World (www.golfworld.com)• Golfweek (www.goffweek.com)• Grassroots Motorsports (www.grassrootsmotorsports.com)• Hoop (www.nba.com/hoop)• In-Fisherman (www.in-fisherman.com)• Inside Cheerleading (www.insidecheerleading.com)• Inside Gymnastics (www.insidegymnastics.com)• Inside Kung-Fu (www.insidekung-fu.com)• Inside Lacrosse (www.insidelacrosse.com)• Inside Tennis (www.insidetennis.com)• Inside Track Motorsports News (www.insidetracknews.com)• Inside Triathlon (www.insidetri.com)• International Figure Skating (www.ifsmagazine.com)• International Gymnast (www.intlgymnast.com)• Juice Magazine (www.juicemagazine.com)• Lacrosse (www.laxmagazine.com)• Lindy’s Sports Annuals (College and Pro) (www.lindyssports.com)• Links Magazine (www.linksmagazine.com)• Little League Magazine Presented by Major League Baseball (www.littleleague.org)• Marathon & Beyond (www.marathonandbeyond.com)• MMA Worldwide (www.mmaworldwide.com)• Motorcross Action (www.motorcrossactionmag.com)• Mountain Bike (www.mountainbike.com)• Mountain Bike Action (www.mbaction.com)• NASCAR Illustrated (http://nascarillustrated.scendaily.com)• National Dragster (www.nhra.net/dragster)• National Speed Sport News (www.nationalspeedsportnews.com)• New England Hockey Journal (www.hockeyjournal.com)• North American Fisherman (www.fishingclub.com)• Outdoor Life (www.outdoorlife.com)• Outside (www.outsideonline.com)• Paddler (www.paddlermagazine.com)• Performance Racing News (www.prnmag.com)• Phil Steele’s College & Pro Football Review (www.philsteele.com)• Pool & Billiard (www.poolmag.com)• Powder (www.powdermag.com)
SPORTS MARKETING 2020-2021
• 174 •

• Prep Illustrated (www.prepsportsillustrated.com)• Prep Star (www.prepstar.com)• Pro Bull Rider (www.pbrnow.com)• Pro Football Weekly (www.profootballweekly.com)• Pro Sports Wives (www.prosportswives.com)• Professional Motorsport Circuit (www.ukipme.com/mag_circuit.htm)• Racer (www.racer.com)• Racer X Illustrated (www.racerxonline.com)• Referee (www.referee.com)• Rise Magazine (www.espnrise.com)• Road Bike Action (www.roadbikeaction.com)• Road Racer X (www.roadracerx.com)• Rugby (www.rugbymag.com)• Runner Triathlete News (www.runnertriathletenews.com)• Runner’s World (www.runnersworld.com)• Running Journal (www.running.net)• Running Times (www.runningtimes.com)• Sailing Magazine (www.sailingmagazine.net)• Sailing World (www.sailingworld.com)• Saltwater Sportsman (www.saltwatersportsman.com)• Scoregolf (www.scoregolf.com)• Sea Kayaker (www.seakayakermag.com)• Skateboarder (www.skateboardermag.com)• Skating (www.usfigureskating.org)• Ski Magazine (www.skimag.com)• Ski Press Magazine (www.skipressworld.com)• Ski Racing (www.skiracing.com)• Skiing Magazine (www.skiingmag.com)• Slam (www.slamonline.com)• Slap Magazine (www.slapmagazine.com)• Smash (www.tennis.com)• Snow (www.thesnowmag.com)• Snowboarder (www.snowboardermag.com)• Soccer America (www.socceramerica.com)• Softball (www.softballmag.com)• Speedway Illustrated (www.speedwayillustrated.com)• Spin To Win Rodeo (www.myhorse.com/magazines/rodeo.html)• Splash (www.usaswimming.org)• Sport Fishing (www.sportfishingmag.com)• Sporting Goods Business (www.sportinggoodsbusiness.com)• Sporting Goods Dealer (www.sportsonesource.com)• Sporting News (www.sportingnews.com) and (www.sportingnewstoday.com)• Sports Afield (www.sportsafield.com)
SPORTS MARKETING 2020-2021
• 175 •

• Sports Illustrated (www.si.com)• Sports Illustrated Kids (www.sikids.com)• Sports Spectrum (www.sportsspectrum.com)• Sports Weekly (www.mysportsweekly.com)• Sportstravel (www.sportstravelmagazine.com)• Sportsturf (www.sportsturfonline.com)• Street & Smith’s SportsBusiness Journal (www.sportsbusinessjournal.com)• Surfer (www.surfermag.com)• Surfing (www.surfingthemag.com)• Swimming World Magazine (www.swimmingworldmagazine.com)• Taekwondo Times (www.taekwondotimes.com)• Tapout (www.tapoutmagazine.com)• Tennis (www.tennis.com)• Tennis Life (www.tennislife.com)• Tennis View Magazine (www.tennisviewmag.com)• Thoroughbred Times (www.thoroughbredtimes.com)• Thrasher (www.thrashermagazine.com)• The Blood-Horse (www.bloodhorse.com)• The Green (www.thegreenmagazine.com)• The Hockey News (www.thehockeynews.com)• The Ring (www.ringtv.com)• The Sports Forecaster (www.sportsforecaster.com)• Track and Field News (www.trackandfieldnews.com)• Trail Runner (www.trailrunnermag.com)• Transworld Business (www.twsbiz.com)• Transworld Motorcross (www.transworldmx.com)• Transword Ride BMX (www.ridebmx.com)• Transworld Skateboarding (www.skateboarding.com)• Transworld Snowboarding (www.transworldsnowboarding.com)• Transworld Surf (www.transworldsurf.com)• Triathlete (www.triathletemag.com)• Tuff Stuff’s Sports Collectors Monthly (www.tuffstuff.com)• UFC (www.ufc.com/magazine)• Ultimate MMA (www.ultimatemmamag.com)• US Bowler (www.bowl.com)• USA Hockey (www.usahockemagazine.com)• Velonews (www.velonews.com)• Venues Today (www.venuestoday.com)• Volleyball (www.volleyballmag.com)• Wakeboarding (www.wakeboardingmag.com)• Women’s Running (www.womensrunning.com)• Yachting (www.yachtingmagazine.com)
SPORTS MARKETING 2020-2021
• 176 •

29
NEWSPAPER SPORTS SECTIONS
29.1 How Fans Obtain Sports NewsAccording to an ESPN Sports Poll, fans use the following media sources most
frequently for information about their favorite professional sports team:Fans Avid Fans
• Newspaper* hardcopy: 41% 36%• Team website: 29% 36%• Newspaper* website: 15% 17%• Other: 15% 11%* Only local newspapers
By age, fans’ preferred source of team information is as follows: Age 12-34 Age 35-44 Age 45+
• Newspaper hardcopy: 28% 44% 58%• Team website: 45% 23% 11%• Newspaper website: 19% 17% 7%• Other: 8% 16% 24%
_________________________________________________________________
“Pro sports fans still overwhelmingly choosenewspaper sports sections as the way to followtheir favorite teams.”
SportsBusiness Journal _________________________________________________________________
29.2 Sports Section ReadershipThe sports section is the third-most-read section of daily newspapers, trailing
only the front page and business sections. According to The Media Audit(www.themediaaudit.com), 38 million U.S. adults, or 25.5% of the adult population,regularly read the sports section. Among those earning more than $100,000, that f igureis 31.0%.
SPORTS MARKETING 2020-2021
• 177 •

29.3 Sports EditorsThe following are sports editors for the largest U.S. newspapers (source: Mundo
Conde [www.easymedialist.com/usa/top100sports.html]):• Akron Beacon Journal: Scot Fagerstrom• Albany Times Union: Pete Iorizzo• Albuquerque Journal: Randy Harrison• Allentown Morning Call: Ernie Long• Arizona Daily Star: Ryan Finley• Arizona Republic: Mark Faller• Arkansas Democrat-Gazette: Jeff Krupsaw• Arlington Heights Daily Herald: Tom Quinlan• Asbury Park Press: Steve Feitl• Atlanta Journal-Constitution: Ray Cox• Austin American-Statesman: James Wangemann• Baltimore Sun: Ron Fritz• Baton Rouge Advocate: Joseph Schiefelbein• Bergen County Record: John Balkun• Birmingham News: Izzy Gould• Boston Globe: Joseph Sullivan• Boston Herald: Hank Hryniewicz• Buffalo News: Lisa WIlson• Charleston Post and Courier: Malcolm DeWitt• Charlotte Observer: Mike Persinger• Chattanooga Times Free Press: Stephen Hargis• Chicago Sun-Times: Chris De Luca• Chicago Tribune: Tim Bannon• Cincinnati Enquirer: David Niinemets• Cleveland Plain Dealer: Dave Campbell• Colorado Springs Gazette: Matt Wiley• Columbus Dispatch: Ray Stein• Dallas Morning News: Garry Leavell• Dayton Daily News: John Boyle• Daytona Beach News-Journal: Scott Zucker• Delaware News Journal: Jason Levine• Denver Post: Scott Monserud• Des Moines Register: Zack Creglow• Deseret News: Kent Condon• Detroit Free Press: Gene Myers• Detroit News: Phil Laciura• El Paso Times: Felix Chavez• Florida Times-Union: Chet Fussman• Fort Worth Star-Telegram: Celeste Williams• Fresno Bee: Matt Lloyd
SPORTS MARKETING 2020-2021
• 178 •

• Grand Rapids Press: Nate Reens• Harrisburg Patriot-News: Michael Sedor• Hartford Courant: Jeff Otterbein• Honolulu Star-Advertiser: Paul Arnett• Houston Chronicle: Randy Harvey• Indianapolis Star: Jenny Green• Kansas City Star: Jeff Rosen• Knoxville News Sentinel: Phil Kaplan• La Opinion: Ricardo Lopez-Juarez• Las Vegas Review-Journal: Allen Leiker• Lexington Herald-Leader: Mat Graf• Lincoln Journal Star: Clark Grell• LNP: Chris Otto• Long Beach Press-Telegram: Tom Moore• Los Angeles Daily News: Tom Moore• Los Angeles Times: Angel Rodriguez• Louisville Courier-Journal: Chris White• Memphis Commercial Appeal: David WiIliams• Miami Herald: Jorge Rojas• Milwaukee Journal Sentinel: Mike Davis• Minneapolis Star Tribune: Glen Crevier• Mobile Press-Register: Izzy Gould• Nashville Tennessean: David Ammenheuser• New Haven Register: Sean Barker• New Orleans Times-Picayune: Marcus Carmouche• New York Post: Chris Shaw• New York Times: Jason Stallman• Newport News Daily Press: Andi Petrini• Newsday: Hank Winnicki• Northwest Indiana Times: Greg Smith• Oakland Press: Jeff Kuehn• Oklahoman: Mike Sherman• Omaha World-Herald: Thad Livingston• Orange County Register: Todd Harmonson• Orlando Sentinel: Steve Ruiz• Palm Beach Post: Nick Moschella• Philadelphia Daily News: Rich Hofmann• Philadelphia Inquirer: John Quinn• Pittsburgh Post-Gazette: Jerry Micco• Pittsburgh Tribune-Review: Kevin Smith• Portland Oregonian: Ben Sherman• Providence Journal: Bill Corey• Raleigh News & Observer: Steve Ruinsky
SPORTS MARKETING 2020-2021
• 179 •

• Richmond Times-Dispatch: Mike Szvetitz• Riverside Press-Enterprise: Jeff Parenti• Roanoke Times: Steven Hemphill• Rochester Democrat and Chronicle: Steve Bradley• Sacramento Bee: Tom Couzens• Salt Lake Tribune: Joe Baird• San Antonio Express-News: Jim Lefko• San Francisco Chronicle: Alan Saracevic• Sarasota Herald-Tribune: Scott Peterson• Seattle Times: Don Shelton• South Carolina State: Rick Millians• South Florida Sun-Sentinel: David Selig• Spokane Spokesman-Review: Joe Palmquist• St. Louis Post-Dispatch: Roger Hensley• St. Paul Pioneer Press: Tad Reeve• Syracuse Post-Standard: Jason Murray• Tacoma News Tribune: Darrin Beene• Tampa Bay Times: Jack Sheppard• Tampa Tribune: Joanne Korth• Toledo Blade: Frank Corsoe• Torrance Daily Breeze: Tom Moore• Tulsa World: Michael Peters• U-T North County Times: Jay Posner• U-T San Diego: Jay Posner• USA Today: David Meeks• Ventura County Star: Jon Catalini• Virginian-Pilot: Tom White• Wall Street Journal: Sam Walker• Washington Post: Matt Vita• Washington Times: Zac Boyer• White Plains Journal News: Sean Mayer• Wichita Eagle: Kirk Seminoff• Wisconsin State Journal: Greg Sprout• Worcester Telegram & Gazette: Dave Nordman
SPORTS MARKETING 2020-2021
• 180 •

30
SPORTS ONLINE
30.1 Digital Sports Media TrafficAccording to comScore (www.comscore.com), digital sports media generated a
cumulative audience of 186.86 million in January 2019. The average time spent onsports content was 99.3 minutes per visitor.
Ranked by number of unique visitors, the most popular sports sites were asfollows:• ESPN: 94,962,000• CBS Sports: 69,157,000• NFL Internet Group: 58,604,000• Yahoo Sports-NBC Sports Network: 57,667,000• USA Today Sports Media Group: 49,840,000• Bleacher Report-Turner Sports Network: 49,643,000• SB Nation: 40,067,000• Sports Illustrated sites: 28,178,000• Minute Media: 22,526,000• MSN Sports: 18,021,000• MLB: 13,132,000• Fox Sports Digital: 13,031,000• Deadspin.com: 11,504,000• Fox News Sports: 10,918,000• NESN: 10,094,000
Total time spent on sports sites was as follows:• ESPN: 5.31 billion minutes• Yahoo Sports-NBC Sports Network: 3.10 billion minutes• NFL Internet Group: 1.70 billion minutes• Bleacher Report-Turner Sports Network: 1.30 billion minutes• CBS Sports: 1.24 billion minutes• MSN Sports: 542 million minutes• USA Today Sports Media Group: 490 million minutes• Minute Media: 428 million minutes• SB Nation: 403 million minutes• Sports Illustrated sites: 193 million minutes
SPORTS MARKETING 2020-2021
• 181 •

NOTES: • CBS Sports includes 247Sports.com, MaxPreps, and Scout Media. • Yahoo Sports-NBC Sports Network includes Rivals, Rotoworld, and FanDuel. • USA Today Sports Media Group includes 81 local Gannett-owned newspaper sites, 23 Gannett-owned broadcast
TV sites, USA Today High School Sports, The Big Lead, and For The Win. • Bleacher Report-Turner Sports Network includes NBA.com, NCAA.com and WNBA.com. • Minute Media includes 90min, 12UP, DBLTap and The Spun.
Digital traffic has fluctuated between 170 million and 190 million unique visitorssince 2016, with traffic varying seasonally and with major events, but with no overallincrease.
_________________________________________________________________
“Amid all the industry debate around decliningTV ratings for many major sports properties,another media measurement issue lurks quietlyin the background: a marked retreat in theoverall audience and consumption for digitalsports media. Monthly reports frommeasurement agency comScore tracking onlineand mobile traffic have shown a consistenttrend of smaller overall audiences anddramatically lower consumption for sportsproperties. There has been an overallmacro-level flattening of the category, and thereis probably only so much room for growth inwhat is now a mature segment.”
SportsBusiness Daily, 2/20/19 _________________________________________________________________
30.2 Major League Sports Streaming PackagesThe following is a summary of the paid video streaming packages of major sports
leagues:Major League Baseball• Package: MLB.TV• Pricing (2019 season): $24.99/month; $118.99 annual• Selection: All out-of-market games
SPORTS MARKETING 2020-2021
• 182 •

National Basketball Association• Package: NBA League Pass• Pricing (2018-2019 season): $28.99/month; $199.99 annual• Selection: All games of seven selected teams
• Package: NBA All Teams + In-Arena Stream • Pricing (2018-2019 season): $39.99/month; $249.99 annual• Selection: All out-of-market games
• Package: NBA Team Pass• Pricing (2018-2019 season): $17.99/month; $119.99 annual• Selection: All out-of-market games of one select team
National Football League• Package: NFL Sunday Ticket• Pricing (2019-2020): $293.94• Selection: Any out-of-market Sunday game
• Package: NFL Sunday Ticket Max• Pricing (2019-2020): $395.94• Selection: All out-of-market Sunday games (up to 14 per week)
National Hockey League• Package: NHL All Access• Pricing: $139.99 (full season); $24,99 (monthly pass)• Selection: Every NHL game
30.3 Live Sports OnlineThe following is a summary of some of the live sports events accessible online:
• ESPN3 features millions of hours of live events online, including MLB, NBA andWNBA basketball, Major League Lacrosse, NCAA baseball, NCAA basketball (bothmen’s and women’s), NCAA football games, NCAA lacrosse, all four Grand Slamtennis events, major golf championships, high school football, Canadian FootballLeague, Premier League and other major international soccer leagues, cricket(international), rugby (international), American Le Mans Series races, FIFA WorldCup, and more. ESPN3 allows fans to switch among as many as 20 events in amain viewing window. To watch ESPN3, a user’s Internet service provider musthave a licensing agreement with ESPN.
• More than five million college basketball fans watch March Madness on theircomputers, streamed by CBS SportsLine and available for free at NCAA.com.
• Major League Baseball draws more than one million subscribers to its $89 MLB.tvpackage of live baseball games and highlights.
SPORTS MARKETING 2020-2021
• 183 •

• More than 300 live college football games are offered on sports sites such asESPN3 and CSTV.com.
• Most regular-season out-of-market hockey games are streamed on NHL.com.
Marquee events such as championship series and all-star games that drivetelevision ratings are generally available only on television and not streamed online.
30.4 Independent Sports SitesSeveral independent sports sites have gained a large online following without
being under the control of a TV network, league, or major online portal. The followingare the largest of such sites (source: SportsBusiness Journal): 24/7 Sports (www.247sports.com)• 24/7 Sports is a network of program-specific sites offering news about college sports
teams. Subscribers pay more than $100 a year for content.
Big Lead Sports (www.thebiglead.com)• Big Lead Sports is a network of more than 500 independent sites covering a wide
range of sports blogs, fantasy content, news, and statistics.
Bleacher Report (www.bleacherreport.com)• Bleacher Report is an open-source platform for sports writers to publish their work.
The site employs professional writers, and contributors may have commentarypublished following review for compliance with the site’s editorial standards.
SB Nation (www.sbnation.com)• SB Nation is a network of sports blogs. According to comScore, SB Nation sites
receive more than six million unique monthly visitors.
Sports Media Ventures (www.thepostgame.com, www.sportsfanlive.com)• The Los Angeles-based company operates ThePostGame.com, a sports journalism
site in partnership with Yahoo! Sports; SportsFanLive.com; FanFinder, an onlineand mobile tool to find sports bars with specific team loyalties; a social-orientedsports news aggregation site; and a series of sports-related Twitter aggregations.
SPORTS MARKETING 2020-2021
• 184 •

31
PODCASTS
31.1 OverviewThe popularity of sports podcasts has lagged other genres. However, several
podcasts have recently achieved a large audience and some analysts feel thatpodcasts may soon become a significant part of sports media.
_________________________________________________________________
“Unlike TV, where live games account for all buta handful of the most-watched programs in theU.S. each year, sports podcasts trail showsfocused on news and political shows or generalinterest in both audience size and revenue. Butthat could soon change.”
SportsBusiness Journal, 5/7/18 _________________________________________________________________
31.2 Top Sports Podcasts Two sports podcast publishers ranked among the Top 10 in total mobile and
desktop unique U.S. audience in June 2019, as follows (source: Podtrac[www.podtrac.com]):
Audience No. of Shows
• Barstool Sports: 6,399,000 29• ESPN: 5,761,000 62
Apple, the dominant podcast host in the U.S., owns an estimated 60% ofpodcast delivery.
Ranked by unique U.S. monthly audience, the following were the top sports andrecreation podcasts on Apple in June 2019 (source: Chartable [www.chartable.com]):1. Anchored2. Fantasy Football Podcast - Championship Fantasy Football Radio3. The PulpMX.com Show
SPORTS MARKETING 2020-2021
• 185 •

4. Shea Anything5. The Trail Show6. Shifting Gears: The Zach Osborne Podcast7. The Fly Racing Moto:60 Show8. The Larry Meiller Show9. Southern Fried Soccer10. Oxygenaddict Triathlon Podcast, with Coach Rob Wilby and Helen Murray12. Minnesota Wild Hockey Official PONDcast13. Two Man Weave14. The Jet Stream15. Sharp Football Analysis16. Dinner With The King17. The Second Captains Podcast18. Holding Court with Geno Auriemma19. Rocky Mountain ATV/MC Keefer Tested20. NASCAR Newscast: Official NASCAR Slideshow Podcast
SPORTS MARKETING 2020-2021
• 186 •

32
SOCIAL MEDIA
32.1 Sports Social MediaCatalyst, an IMG company (www.catalystimg.com), conducted the Sports Fan
Engagement Study to examine sports-related social media activities among avid sportsfans. The following is a summary of the study:Which of the following social media sites do you use in relation to sports?• Facebook: 75%• YouTube: 54%• Twitter: 37%• Instagram: 18%
By sport, which social media sites do you use? College College
Soccer NBA Basketball Football MLB NFL
• Facebook: 72% 70% 71% 72% 72% 78%• YouTube: 78% 60% 63% 51% 42% 37%• Twitter: 45% 39% 41% 36% 36% 32%• Instagram: 25% 25% 19% 14% 17% 12%
On a typical game day, which social media do you use?• Facebook
- Before game: 50%- During game: 54%- After game: 70%
• YouTube- Before game: 15%- During game: 10%- After game: 59%
• Twitter- Before game: 48%- During game: 64%- After game: 64%
SPORTS MARKETING 2020-2021
• 187 •

• Instagram- Before game: 35%- During game: 54%- After game: 56%
32.2 Sports League/Organization FollowersHookit (www.hookit.com) assesses sports fan engagement based on social
media interactions. Hookit tracks every league, team, player, event, venue, and brandin sports.
Ranked by number of social media followers in June 2019, the top leagues,tours, and organizations were as follows:• National Basketball Association: 157.6 million• National Football League: 62.7 million• Ultimate Fighting Championship: 50.9 million• International Olympic Committee: 31.0 million• Major League Baseball: 22.9 million• National Hockey League: 16.6 million• World Surf League: 12.7 million• Major League Soccer: 8.3 million• ATP World Tour: 7.1 million• PGA Tour: 6.9 million• Professional Bull Riders: 4.2 million• Women's Tennis Association: 4.2 million• Arena Football League: 2.6 million• Women’s National Basketball Association: 2.5 million
32.3 Team FollowersRanked by number of social media followers in June 2019, the top teams were
as follows (source: Hookit):Major League Baseball• New York Yankees: 14.3 million• Boston Red Sox: 9.2 million• Chicago Cubs: 7.6 million• Los Angeles Dodgers: 7.6 million• San Francisco Giants: 6.0 million• Toronto Blue Jays: 5.2 million• Detroit Tigers: 4.5 million• St. Louis Cardinals: 4.4 million• Texas Rangers: 4.3 million• Philadelphia Phillies: 4.2 million
SPORTS MARKETING 2020-2021
• 188 •

Major League Soccer• LA Galaxy: 3.8 million• New York City FC: 3.3 million• Atlanta United FC: 1.7 million• Seattle Sounders: 1.6 million• Orlando City SC: 1.4 million• New York Red Bulls: 1.4 million• Toronto FC: 986,900• Los Angeles Football Club: 944,300• Sporting KC: 889,500• Houston Dynamo: 877,200
National Basketball Association• Los Angeles Lakers: 44.5 million• Golden State Warriors: 39.8 million• Chicago Bulls: 29.3 million• Miami Heat: 27.3 million• Houston Rockets: 26.3 million• Cleveland Cavaliers: 24.1 million• Boston Celtics: 19.7 million• San Antonio Spurs: 17.7 million• Oklahoma City Thunder: 17.5 million• New York Knicks: 12.9 million
National Football League• New England Patriots: 16.1 million• Dallas Cowboys: 15.5 million• Pittsburgh Steelers: 12.4 million• Green Bay Packers: 9.3 million• Seattle Seahawks: 8.7 million• Philadelphia Eagles: 8.6 million• Denver Broncos: 8.2 million• San Francisco 49ers: 7.8 million• New York Giants: 7.8 million• Carolina Panthers: 7.0 million
National Hockey League• Chicago Blackhawks: 6.7 million• Pittsburgh Penguins: 5.3 million• Boston Bruins: 4.9 million• Toronto Maple Leafs: 4.3 million• Detroit Red Wings: 4.0 million• New York Rangers: 3.9 million• Montreal Canadiens: 3.8 million
SPORTS MARKETING 2020-2021
• 189 •

• Philadelphia Flyers: 3.3 million• Los Angeles Kings: 2.8 million• Vancouver Canucks: 2.6 million
Women’s National Basketball Association• Minnesota Lynx: 320,400• Los Angeles Sparks: 294,500• Phoenix Mercury: 239,900• Seattle Storm: 200,700• Chicago Sky: 193,500• New York Liberty: 175,400• Atlanta Dream: 154,900• Indiana Fever: 151,800• Dallas Wings: 123,400• Washington Mystics: 112,600
32.4 Athlete FollowersRanked by number of social media followers in June 2019, the top athletes were
as follows (source: Hookit):Major League Baseball• Mike Trout: 3.0 million• Yu Darvish: 2.2 million• David Price: 1.8 million• Robinson Cano: 1.8 million• Masahiro Tanaka: 1.6 million• Buster Posey: 1.4 million• Noah Syndergaard: 1.3 million• CC Sabathia: 1.1 million• Eric Hosmer: 952,000• Francisco Lindor: 901,400
Major League Soccer• Wayne Rooney: 55.9 million• Zlatan Ibrahimovic: 32.0 million• Bastian Schweinsteiger: 14.2 million• Nani: 10.7 million• Bacary Sagna: 3.3 million• Jonathan Dos Santos: 2.2 million• Tim Howard: 2.0 million• Jozy Altidore: 1.3 million• Raul Ruidiaz: 1.3 million• Carlos Vela: 1.2 million
SPORTS MARKETING 2020-2021
• 190 •

National Basketball Association• Lebron James: 66.1 million• Dwyane Wade: 33.1 million• Stephen Curry: 27.3 million• Paul George: 13.4 million• Pau Gasol: 11.9 million• Russell Westbrook: 11.0 million• Lonzo Ball: 8.3 million• Kevin Love: 8.1 million• Giannis Antetokounmpo: 7.2 million• Tony Parker: 5.3 million
National Football League• Tom Brady: 11.2 million• Russell Wilson: 7.6 million• JJ Watt: 7.5 million• Odell Beckham: 5.4 million• Julian Edelman: 4.9 million• Richard Sherman: 3.9 million• Robert Griffin: 3.0 million• Adrian Peterson: 3.0 million• Jarvis Landry: 2.4 million• Tyrann Mathieu: 2.3 million• Le'Veon Bell: 2.3 million
National Hockey League• Alex Ovechkin: 2.7 million• Henrik Lundqvist: 1.6 million• P.K. Subban: 1.3 million• Carey Price: 890,300• Vladimir Tarasenko: 629,700• T.J. Oshie: 586,200• Brad Marchand: 489,000• Matt Duchene: 368,000• Logan Couture: 349,700• Erik Karlsson: 293,000
Women’s National Basketball Association• Skylar Diggins-Smith: 1.1 million• Candace Parker: 811,200• Maya Moore: 713,000• Elena Delle Donne: 550,700• Brittney Griner: 325,300• Breanna Stewart: 291,900
SPORTS MARKETING 2020-2021
• 191 •

• Diana Taurasi: 229,300• Sue Bird: 182,700• Seimone Augustus: 119,900• Tina Charles: 69,200
32.5 Market ResourcesHookit, 3398 Carmel Mountain Road, Suite 100, San Diego, CA 92121. (888) 874-3374. (www.hookit.com)
SPORTS MARKETING 2020-2021
• 192 •

PART V: MAJOR EVENTS
SPORTS MARKETING 2020-2021
• 193 •

33
ALL-STAR GAMES
33.1 MLB All-Star GameViewership on Fox for the MLB All-Star Game has been as follows:
• 2001: 16.0 million• 2002: 14.7 million• 2003: 13.8 million• 2004: 14.0 million• 2005: 12.3 million• 2006: 14.4 million• 2007: 12.5 million• 2008: 14.5 million• 2009: 14.6 million• 2010: 12.1 million
• 2011: 11.0 million• 2012: 10.9 million• 2013: 11.0 million• 2014: 11.3 million • 2015: 10.9 million• 2016: 8.7 million• 2017: 9.3 million• 2018: 8.7 million• 2019: 8.1 million
The cost of a 30-second spot for the MLB All-Star Game is about $550,000.The economic impact of All-Star Games on its host cities and communities has
been as follows (source: www.baseball-almanac.com): • 2001 (Seattle): $ 50 million• 2002 (Milwaukee): $ 50 million• 2003 (Chicago): $ 60 million• 2004 (Houston): $ 65 million• 2005 (Detroit): $ 52 million• 2006 (Pittsburgh): $ 52 million• 2007 (San Francisco): $ 65 million• 2008 (New York City): $148 million• 2009 (St. Louis): $ 60 million• 2010 (Anaheim): $ 85 million• 2011 (Phoenix): $ 60 million• 2012 (Kansas City): $ 60 million• 2013 (New York City): $192 million• 2014 (Minneapolis): $ 55 million• 2015 (Cincinnati): $ 65 million• 2016 (San Diego): $ 80 million• 2017 (Miami): $ 70 million• 2018 (Washington, DC): $ 68 million• 2019 (Cleveland): $ 65 million
SPORTS MARKETING 2020-2021
• 194 •

33.2 NBA All-Star GameNBA All-Star games have had the following viewership on TNT (sources: Nielsen
[www.nielsen.com]):• 2007: 6.8 million• 2008: 6.3 million• 2009: 7.6 million• 2010: 6.8 million• 2011: 9.1 million• 2012: 8.2 million• 2013: 8.0 million
• 2014: 7.5 million• 2015: 7.2 million• 2016: 7.6 million• 2017: 7.8 million• 2018: 7.7 million• 2019: 6.8 million
Host cities for NBA All-Star Games have been as follows:• 2007: Las Vegas, NV• 2008: New Orleans, LA• 2009: Phoenix, AZ• 2010: Arlington, TX• 2011: Los Angeles, CA• 2012: Orlando, FL• 2013: Houston, TX• 2014: New Orleans, LA• 2015: New York, NY• 2016: Toronto, ON, Canada• 2017: New Orleans, LA• 2018: Los Angeles, CA• 2019: Charlotte, NC
33.3 NFL Pro BowlViewership for NFL Pro Bowl games has been as follows (source: Nielsen):
• 2006: 7.8 million• 2007: 7.0 million• 2008: 7.3 million• 2009: 10.1 million• 2010: 8.8 million• 2011: 12.3 million• 2012: 13.4 million
• 2013: 12.5 million• 2014: 11.7 million• 2015: 8.8 million• 2016: 8.0 million• 2017: 7.4 million• 2018: 8.6 million• 2019: 8.2 million
ESPN has the exclusive broadcast rights to the Pro Bowl through 2022.The Pro Bowl is the only major all-star game that draws lower TV ratings than its
regular-season games.The Pro Bowl was played at Aloha Stadium (Honolulu, HI) between 1980 and
2016, except 2010 and 2015. The game was moved to Camping World Stadium(Orlando, FL) in a multi-year deal beginning with the 2017 game.
SPORTS MARKETING 2020-2021
• 195 •

33.4 NHL All-Star GameThe NHL All-Star game is telecast by NBC Sports Network. Viewership has
been as follows:• 2007: 691,000• 2008: 852,000• 2009: 1.1 million• 2011: 1.5 million• 2012: 1.3 million
• 2015: 1.2 million• 2016: 1.6 million• 2017: 2.3 million• 2018: 2.0 million• 2019: 1.8 million
Host cities for NHL All-Star Games have been as follows:• 2005: Cancelled due to the lockout• 2006: No game due to the Winter Olympic Games• 2007: Dallas, TX• 2008: Atlanta, GA• 2009: Montreal, QC, Canada• 2010: No game due to the Winter Olympic Games• 2011: Raleigh, NC• 2012: Ottawa, ON, Canada• 2013: Cancelled due to the lockout• 2014: No game due to the Winter Olympic Games• 2015: Columbus, OH• 2016: Nashville, TN• 2017: Los Angeles, CA• 2018: Tampa, FL• 2019: San Jose, CA
SPORTS MARKETING 2020-2021
• 196 •

34
CHAMPIONSHIP PARADES
34.1 OverviewA victory parade is a parade held to celebrate championships in all major sports
leagues. The events draw some of the largest crowds among events of all types.
34.2 Most Attended ParadesBased on estimated crowds, the following are the largest sports championship
parades:• Over 5 million people attended the 2016 World Series parade in Chicago after the
Chicago Cubs won their first World Series since 1908.• An estimated 3 million people attended a parade in Boston celebrating the Boston
Red Sox's World Series victory in October 2004.• An estimated 2 million people attended a parade and rally in Chicago for the 2013
Stanley Cup Champion Chicago Blackhawks.• An estimated 2 million people gathered in Philadelphia for the Stanley Cup parade
for the 1974 Stanley Cup Champions, the Philadelphia Flyers.• An estimated 2 million people lined Broad Street in Philadelphia in October 2008 f or
a ticker-tape parade celebrating the World Series champions, the PhiladelphiaPhillies.
• Over 1.5 million Raptors fans packed downtown Toronto in June 2019 for a paradefor the NBA champions.
• An estimated 1.3 million people attended the Cleveland Cavaliers Basketball NBAChampionship Parade in June 2016. It was the first major professional sportchampionships for the City of Cleveland in 52 years.
• An estimated crowd of over 1 million people gathered in Denver in February 2016for the Broncos Super Bowl 50 parade.
SPORTS MARKETING 2020-2021
• 197 •

35
COLLEGE FOOTBALL PLAYOFF
& BOWL GAMES
35.1 College Football PlayoffThe College Football Playoff (CFP, www.collegefootballplayoff.com) launched in
the 2014-2015 season, replacing the Bowl Championship Series (BCS). The CFP isthe first time the NCAA football championship has been determined by bracketcompetition.
The four top-ranked NCAA football teams, selected by a 13-member NCAA-appointed committee, compete each season in College Football Playoff semi-finalgames on December 31 and January 1. The winners of the semi-final games competein the College Football Playoff National Championship.
The host venue for the Championship game is selected based on bids submittedby cities. The hosts for the semi-final games rotate between six bowls, as follows:
Game Venue
• Allstate Sugar Bowl Mercedes-Benz Superdome(New Orleans, LA)
• Capital One Orange Bowl Hard Rock Stadium(Miami Gardens, FL)
• Chick-fil-A Peach Bowl Mercedes-Benz Stadium (Atlanta, GA)• Fiesta Bowl University of Phoenix Stadium
(Glendale, AZ)• Goodyear Cotton Bowl Classic AT&T Stadium (Arlington, TX)• Rose Bowl Game presented by
Northwestern Mutual Rose Bowl (Pasadena, CA)
The schedule for the CFP semi-final games is as follows:• 2015-2016: Cotton Bowl and Orange Bowl• 2016-2017: Fiesta Bowl and Peach Bowl• 2017-2018: Rose Bowl and Sugar Bowl• 2018-2019: Cotton Bowl and Orange Bowl• 2019-2020: Peach Bowl and Fiesta Bowl
Permanent seating capacity for the CFP venues are as follows:• AT&T Stadium: 80,000• Mercedes-Benz Stadium: 71,000
SPORTS MARKETING 2020-2021
• 198 •

• Mercedes-Benz Superdome: 73,208• Rose Bowl: 92,542• Hard Rock Stadium: 65,326• University of Phoenix Stadium: 63,400
Recent and upcoming hosts for the College Football Playoff NationalChampionship are as follows:• 2015: AT&T Stadium (Arlington, TX)• 2016: University of Phoenix Stadium (Glendale, AZ)• 2017: Raymond James Stadium (Tampa, FL)• 2018: Mercedes-Benz Stadium (Atlanta, GA)• 2019: Levi’s Stadium (Santa Clara, CA)• 2020: Mercedes-Benz Superdome (New Orleans, LA)• 2021: Hard Rock Stadium (Miami Gardens, FL)• 2022: Lucas Oil Stadium (Indianapolis, IN)• 2023: Los Angeles Stadium at Hollywood Park (Inglewood, CA)• 2024: NRG Stadium (Houston, TX)
35.2 Bowl GamesIncluding the CFP bowls and the Championship, there are 40 bowl games, as
follows:Game Venue
• AdvoCare Texas Bowl NRG Stadium (Houston, TX)• AutoNation Cure Bowl Orlando Citrus Bowl Stadium
(Orlando, FL)• AutoZone Liberty Bowl Liberty Bowl Memorial Stadium
(Memphis, TN)• Belk Bowl Bank of America Stadium
(Charlotte, NC)• Birmingham Bowl Legion Field (Birmingham, AL)• Boca Raton Bowl FAU Stadium (Boca Raton, FL)• Buffalo Wild Wings Citrus Bowl Orlando Citrus Bowl Stadium
(Orlando, FL)• Camping World Independence Bowl Independence Stadium
(Shreveport, LA)• Dollar General Bowl Ladd Peebles Stadium
(Mobile, AL)• Famous Idaho Potato Bowl Albertsons Stadium (Boise, ID)• Foster Farms Bowl Levi’s Stadium (Santa Clara, CA)• Franklin American Mortgage Music City Bowl Nissan Stadium (Nashville, TN)• Geico Las Vegas Bowl Sam Boyd Stadium
(Whitney, NV)
SPORTS MARKETING 2020-2021
• 199 •

• Gildan New Mexico Bowl University Stadium (Albuquerque, NM)
• Hawai’i Bowl Aloha Stadium (Honolulu, HI)• Hyundai Sun Bowl Sun Bowl Stadium (El Paso, TX)• Lockheed Martin Armed Forces Bowl Amon G. Carter Stadium
(Fort Worth, TX)• Miami Beach Bowl Marlins Park (Miami, FL)• Motel 6 Cactus Bowl Chase Field (Phoenix, AZ)• National University Holiday Bowl Qualcomm Stadium
(San Diego, CA)• New Era Pinstripe Bowl Yankee Stadium (Bronx, NY)• Northrop Grumman Military Bowl Navy-Marine Corps Memorial
Stadium (Annapolis, MD)
• Nova Home Loans Arizona Bowl Arizona Stadium (Tucson, AZ)• Outback Bowl Raymond James Stadium
(Tampa, FL)• Popeyes Bahamas Bowl Thomas Robinson Stadium
(Nassau, Bahamas)• Quick Lane Bowl Ford Field (Detroit, MI)• R+L Carriers New Orleans Bowl Mercedes-Benz Superdome
(New Orleans, LA)• Raycom Media Camellia Bowl Cramton Bowl (Montgomery, AL)• Russell Athletic Bowl Orlando Citrus Bowl Stadium
(Orlando, FL)• St. Petersburg Bowl Tropicana Field
(St. Petersburg, FL)• TaxSlayer Bowl EverBank Field (Jacksonville, FL)• Valero Alamo Bowl Alamodome (San Antonio, TX)• Zaxby’s Heart of Dallas Bowl Cotton Bowl (Dallas, TX)
Title sponsors may change each year.
35.3 Per-Team PayoutsPer-team payouts for bowl games are as follows:
• Orange Bowl: $6.00 million• Cotton Bowl Classic: $6.00 million• Citrus Bowl: $4.55 million• Fiesta Bowl: $4.00 million• Peach Bowl: $4.00 million• Rose Bowl: $4.00 million• Sugar Bowl: $4.00 million• Outback Bowl: $3.50 million
SPORTS MARKETING 2020-2021
• 200 •

• TaxSlayer Bowl: $3.50 million• Cactus Bowl: $3.35 million• Alamo Bowl: $3.18 million• Russell Athletic Bowl: $2.28 million• Holiday Bowl: $2.08 million• Sun Bowl: $2.00 million• Music City Bowl: $1.84 million• Pinstripe Bowl: $1.80 million• Belk Bowl: $1.70 million• Texas Bowl: $1.70 million• Liberty Bowl: $1.44 million• Cure Bowl: $1.35 million• Quick Lane Bowl: $1.20 million• Independence Bowl: $1.15 million• Las Vegas Bowl: $1.10 million• Birmingham Bowl: $1.00 million• Miami Beach Bowl: $1.00 million• Military Bowl: $1.00 million• Foster Farms Bowl: $ 838,000• Heart of Dallas Bowl: $ 800,000• Dollar General Bowl: $ 750,000• Hawaii Bowl: $ 650,000• Armed Forces Bowl: $ 600,000• St. Petersburg Bowl: $ 538,000• New Orleans Bowl: $ 500,000• New Mexico Bowl: $ 456,000• Bahamas Bowl: $ 450,000• Boca Raton Bowl: $ 400,000• Famous Idaho Potato Bowl: $ 325,000• Camellia Bowl: $ 200,000
35.4 Broadcast Rights And ViewershipESPN contracted for rights to broadcast the playoff games through 2025. This
includes the New Year’s Six bowls and the Championship each year. The 12-yearcontract has been valued at $7.3 billion.
Including the CFP games, bowl games are broadcast as follows:• ESPN: 33• ABC: 3• ESPN2: 2• CBS: 1• CBS Sports Network: 1
SPORTS MARKETING 2020-2021
• 201 •

The recent TV audience for the College Football Playoff National Championship,broadcast on ESPN, has been as follows:• 2015: 33.4 million• 2016: 26.7 million• 2017: 26.0 million• 2018: 28.4 million• 2019: 25.3 million
35.5 SponsorsCFP National Sponsors for the 2018-2019 season were Allstate, AT&T, Buick,
CapitalOne, Chick-fil-A, Dos Equis, Dr. Pepper, Gatorade, Goodyear, Mercedes-Benz,Nissan, Northwestern Mutual, PlayStation, Samsung, and Taco Bell. CFP GameSponsors were Eckrich, Nike, Panini, Ticketmaster, and Wilson.
SPORTS MARKETING 2020-2021
• 202 •

36
FIFA MEN’S WORLD CUP
36.1 OverviewThe FIFA World Cup is an international football (referred to as soccer in the
United States) tournament of men’s national teams of the members of FédérationInternationale de Football Association (FIFA, www.fifa.com/worldcup/index.html), thesport’s global governing body. The event is held every four years. The World Cup is,arguably, the “biggest show on earth.”
Brazil hosted the 2014 World Cup. The 2018 World Cup was held in Moscow,Russia. World Cup 2022 will take place in Qatar.
36.2 World Cup 2014Thirty-two teams qualified in tournaments that began in 2011 to play in the 2014
World Cup. The 64 World Cup matches were played in 12 host stadiums in 12 Brazilian
cities, with the final game played at Maracanâ Stadium in Rio de Janeiro.Total attendance at the 64 matches was 3,386,810. Final game attendance was
74,738.An estimated one billion people worldwide watched the Germany vs. Argentina
2014 World Cup final, an all-time record for a TV broadcast of any kind. U.S.viewership was 17.3 million, according to Nielsen (www.nielsen.com).
The United States vs. Portugal match during the 2014 World Cup had a TVaudience of 18.2 million.
The total TV audience for the 64 World Cup matches was over 3 billion.According to government figures, 1 million foreign tourists visited Brazil during
the month-long 2014 World Cup, far exceeding its pre-Cup projection of 600,000. Additionally, the government reported that 95% of foreign visitors said they intend toreturn to Brazil. About 3 million Brazilians traveled around the country during the event,just short of the expected 3.1 million.
The government reported that the World Cup created one million jobs andpumped nearly $14 billion into the national economy in initial, direct, indirect, andinduced impacts.
SPORTS MARKETING 2020-2021
• 203 •

36.3 World Cup 2018The 2018 FIFA World Cup, the 21st event, took place in Russia from June 14 to
July 15. The finals involved 32 teams. A total of 64 matches were played in 12 venuesacross 11 cities.
France won the final match 4–2 to claim their second World Cup title.The 2018 World Cup games were watched by 3.03 million people; average
attendance was 47,371.GlobalWebIndex (www.globalwebindex.com/uk) estimated total TV viewership of
3.4 billion, or nearly half the total world population of 7.6 billion, for the entiretournament.
At a cost of over $14.2 billion, it was the most expensive World Cup. The boostfor the Russian GDP, or economic impact, was estimated at $26 billion and $31 billion. This figure includes pre- and post- tournament spending over the 10 years from 2013through to 2023.
36.4 Broadcast RightsBroadcasting rights for the 2018 World Cup were sold directly by FIFA, or
through licensed companies or organizations, to over 100 television and radio entitiesworldwide.
In 2011, Fox outbid ESPN and NBC for the U.S. English-speaking rights for the2014 World Cup. SportsBusiness Journal estimated the total rights fee between $400million to $500 million. Telemundo paid $600 million for the U.S. Spanish TV rights.
In 2015, FIFA announced it had extended U.S. media rights agreements withFox and NBC’s Universal’s Telemundo through the 2026 World Cup.
The English-language television rights for the 2015 FIFA Women’s World Cup were held by Fox Sports, with coverage carried on the Fox broadcast network alongwith the Fox Sports 1 and Fox Sports 2 channels. Spanish-language rights were heldby NBC Deportes, with telecasts airing on Telemundo and NBCUniverso.
36.5 SponsorsFIFA Partners are adidas, Coca-Cola, Gazprom, Hyundai/Kia Motors, Qatar
Airlines, VISA, and Wanda Group. FIFA World Cup Sponsors are Anheuser-BuschInBev, Hisense, McDonald's, Mengniu Dairy, and Vivo.The same sponsorships are active for men’s and women’s World Cups.
VISA signed an extension in 2013 of its sponsorship for the World Cup through2022. SportsBusiness Journal estimated the deal at $170 million.
SPORTS MARKETING 2020-2021
• 204 •

37
FIFA WOMEN’S WORLD CUP
37.1 OverviewThe FIFA Women’s World Cup has been held every four years since 1991.
Canada hosted the 2015 Women’s World Cup. The 2019 FIFA Women's World Cup,the 8th edition of the quadrennial international football championship, took place June 7through July 7, 2019; France was the host.
37.2 Women’s World Cup 2015The FIFA Women’s World Cup matches were hosted by the cities of Edmonton,
Moncton, Montreal, Ottawa, Vancouver, and Winnipeg. The final match was inVancouver. Twenty-four teams competed in the 2015 Women’s World Cup.
The Women’s World Cup final on July 5, won by the United States 5-2 overJapan, was seen by 25.4 million viewers on Fox, a record for any soccer match – men’sor women’s – shown on English-language television in the U.S. With 1.3 millionviewers watching on Telemundo, the Spanish-language station, the total of 26.7 millionalso exceeded the record 26.5 million combined viewers that saw Germany beatArgentina in the 2014 men’s World Cup final on ABC and Spanish-language Univision.
Using the Sport Tourism Economic Assessment Model, the Canadian SoccerAssociation (www.canadasoccer.com) estimated the 2015 Women’s World Cupsupported $267.3 million in Canadian economic activity; the GDP was boosted by $132 million.
37.3 Women’s World Cup 2019The 52 matches of the 2019 FIFA Women's World Cup were hosted by nine
stadiums across France. The semi-finals and final were played at Parc OlympiqueLyonnais in the Lyon suburb of Décines-Charpieu, with 58,000 capacity.
Total attendance across the 52 matches was 1,131,312, or 21,756 per match.FIFA estimated a total global TV and streamed media audience of 1 billion
viewers. The 2019 tournament has set several new viewership records for variouscountries.
The United States entered the competition as defending champions after winningthe 2015 edition in Canada and successfully defended their title with a 2-0 victory overthe Netherlands in the final.
SPORTS MARKETING 2020-2021
• 205 •

About 14 million people watched the final match on TV in the U.S., according toNielsen. Fox's streaming viewership added to the total, thus about 14.3 million peopletuned to the network for the U.S.-Netherlands match. Viewership during the matchpeaked at 19.6 million viewers. An additional 1.6 million viewers watched it in Spanishon Telemundo.
_________________________________________________________________
“The U.S. women's national soccer team victoryin the 2019 World Cup ranked as one of thehighest-rated soccer telecasts in the history ofthe sport. The strong ratings back up what wasobservable: Widespread enthusiasm for the U.S.women's national team. Last year's men'sWorld Cup final between France and Croatiaaveraged 11.4 million viewers on Fox, whichmeans the U.S. women drew a 22% biggeraudience in the U.S.”
CNN, 7/8/19 _________________________________________________________________
SPORTS MARKETING 2020-2021
• 206 •

38
INDIANAPOLIS 500
38.1 OverviewThe Indianapolis 500 race has become synonymous with the Memorial Day
weekend. Held at Indianapolis Motor Speedway, the event has been run since 1911.The annual race is part of the Verizon IndyCar Series.
Billed as The Greatest Spectacle in Racing, the Indianapolis 500 is part of the Triple Crown of Motorsport, along with 24 Hours of Le Mans and the Monaco GrandPrix.
Gainbridge (www.gainbridge.com) has a multi-year agreement as presentingsponsor of the Indianapolis 500 that started with the 2019 edition of race.
38.2 Spectators And Economic ImpactThe seats at the Indianapolis Motor Speedway – the largest sporting facility in
the world with more than 250,000 permanent seats – are all reserved months beforethe race. Infield patrons raise the race-day attendance to approximately 350,000.
Hulman & Co. (www.hulman.com), which owns IndyCar and Indianapolis MotorSpeedway, reported attendance for the 101st running of the Indianapolis 500 at300,000. While that figure was down from the approximately 350,000 fans whoattended the promotion-rich 100th running in 2016, it was up solidly from 2015.
The race, 500 Festival, and associated weekend events have an economicimpact on the city of Indianapolis of approximately $340 million, according toSportsBusiness Journal.
38.3 Television Viewership NBC became the exclusive media rights partner for the Indianapolis 500 in 2019. NBC has previously split rights with ABC.
Broadcast viewership for recent Indianapolis 500 races have been as follows(source: Nielsen Media Research [www.nielsen.com]):• 2008: 7.2 million• 2009: 6.3 million• 2010: 5.8 million• 2011: 6.4 million• 2012: 6.9 million• 2013: 5.7 million
• 2014: 6.1 million• 2015: 6.4 million• 2016: 6.0 million• 2017: 5.5 million• 2018: 4.9 million• 2019: 5.4 million
SPORTS MARKETING 2020-2021
• 207 •

In 2019, the 103rd running of Indianapolis 500, won by Simon Pagenaud, had thehighest metered markets (i.e., HH Rating) as follows (source: Nielsen):• Indianapolis, IN: 10.98• Dayton, OH: 9.77• Sacramento, CA: 7.97• Cincinnati, OH: 7.34• Ft. Myers-Naples, FL: 7.30
• West Palm Beach, FL: 6.94• Louisville, KY: 6.77• Columbus, OH 6.36• Richmond, VA: 6.34• Tulsa, OK: 6.18
_________________________________________________________________
“With a thrilling finish and 300,000+ fans inattendance, the 103rd Indianapolis 500 – the firstever broadcast on NBC – delivered an 11%viewership increase vs. 2018, its besthousehold rating in three years.”
NBC Sports, 5/27/19 _________________________________________________________________
SPORTS MARKETING 2020-2021
• 208 •

39
KENTUCKY DERBY
39.1 OverviewThe Kentucky Derby (www.kentuckyderby.com), a thoroughbred race that dates
to 1875, is held annually at Churchill Downs (www.churchhilldowns.com) in Louisville,Kentucky, on the first Saturday in May. It is the first of the Triple Crown races, followedby the Preakness Stakes and the Belmont Stakes.
Among all thoroughbred races in North America, the Kentucky Derby ranks firstin attendance and television viewership.
The 146th running of the Kentucky Derby will be May 2, 2020.
39.2 AttendanceAttendance at the Kentucky Derby has been as follows (source: Churchill
Downs):• 2004: 140,054• 2005: 156,435• 2006: 157,536• 2007: 156,635• 2008: 157,770• 2009: 153,563• 2010: 155,804• 2011: 164,858
• 2012: 165,307• 2013: 151,616• 2014: 164,906• 2015: 170,513• 2016: 167,227• 2017: 158,070• 2018: 157,813 • 2019: 150,729
39.3 Broadcast TVThe Kentucky Derby has been broadcast by NBC Sports since 2001. Viewership
has been as follows (source: Nielsen [www.nielsen.com]):• 2004: 14.6 million• 2005: 13.6 million• 2006: 12.9 million• 2007: 13.7 million• 2008: 14.2 million• 2009: 16.1 million• 2010: 16.5 million• 2011: 14.5 million
• 2012: 14.8 million• 2013: 16.2 million• 2014: 15.3 million• 2015: 16.0 million• 2016: 15.5 million• 2017: 16.4 million• 2018: 14.9 million• 2019: 16.3 million
SPORTS MARKETING 2020-2021
• 209 •

Viewership of Country House’s win in 2019 peaked at 18.0 million viewers from6:45-7:00 p.m. and 18.5 million for post-race coverage.
In 2019, the 145 th edition of the Kentucky Derby had the highest meteredmarkets (i.e., HH Rating) as follows (source: Nielsen):• Louisville, KY: 39.5• Cincinnati, OH: 20.3• Ft. Myers, FL: 19.4• Indianapolis, IN: 18.6• Knoxville, TN: 17.9
• Buffalo, NY: 17.6• Dayton, OH: 17.6• West Palm Beach, FL: 17.1• Tampa, FL: 16.5• Columbus, OH: 16.2
39.4 Top AdvertisersThe top advertisers for the 2019 Kentucky Derby were as follows (source:
SportsBusiness Journal):• Woodford Reserve: $1.75 million• Ram Trucks: $1.50 million• Twin Spires: $1.50 million• Angry Orchard: $1.25 million• Audible: $1.25 million• Geico: $1.25 million• MassMutual: $1.25 million• Canada Dry: $1.00 million• Quicken Loans: $1.00 million
39.5 SponsorsWoodford Reserve is the Official Presenting Sponsor of the Kentucky Derby. The following were 2019 Kentucky Derby sponsors: Angry Orchard, Blue Moon,
Brisnet.com, Budweiser, Chrysler/Ram Trucks, Coca-Cola, Corona, Finlandia, G.H.Mumm, Galt House Hotel, LaCroix Sparking Water, Longines, Old Forester,TwinSpires.com, and Vineyard Vines.
SPORTS MARKETING 2020-2021
• 210 •

40
NBA FINALS
40.1 OverviewThe National Basketball Association (NBA) Finals is a best-of-seven game
championship series played between the Western and Eastern champions of theConference Finals. The Finals are played annually in June.
The 2019 NBA Finals saw the Toronto Raptors beat the Golden State Warriorsin six games.
40.2 TV ViewershipTelecasts of the NBA Finals have been broadcast on ABC since 2003.Average ratings and viewership for the NBA finals have been as follows (source:
Nielsen [www.nielsen.com]): No. Games Avg. Rating Avg. Viewers
• 2007: 4 6.2 9.3 million• 2008: 6 9.3 14.9 million• 2009: 5 8.4 14.3 million• 2010: 7 10.6 18.1 million• 2011: 6 10.2 17.4 million• 2012: 5 10.1 16.9 million• 2013: 7 10.4 17.5 million• 2014: 5 9.3 15.5 million• 2015: 6 11.6 20.1 million• 2016: 7 11.4 20.3 million• 2017: 5 11.3 20.4 million• 2018: 4 10.0 17.6 million• 2019: 6 8.8 15.1 million
Game viewership in 2018 was as follows:• Game 1: 13.5 million• Game 2: 14.1 million• Game 3: 13.4 million• Game 4: 13.2 million• Game 5: 18.3 million• Game 6: 18.3 million
SPORTS MARKETING 2020-2021
• 211 •

40.3 Economic ImpactThe economic impact of the NBA Finals is approximately $5 million per game.Destination Cleveland (www.thisiscleveland.com) estimated that each Finals
game in 2017 had a $5 million economic impact. Nearly all hotel rooms in downtownCleveland were booked at premium rates for the two home games.
NBA Finals were played in the Bay Area in 2017, 2018, and 2019. East BayTimes estimated the total annual economic impact of the home games at Oracle Arenain Oakland at $20 million for the Bay area.
While there was no recognized impact for Toronto, CBC reported spending atbars and restaurants rose by 865% compared to the same days in 2018.
SPORTS MARKETING 2020-2021
• 212 •

41
NCAA MEN’S FINAL FOUR
41.1 OverviewDubbed ‘March Madness,’ the NCAA Division I Men’s Championship Basketball
Tournament ranks among the most popular American sports competitions. More than 100 million people follow the tournament each year on the Internet at
work, and 57% participate in office pools.The following are venues and host cities for upcoming tournament finals games:
• 2020: Mercedes-Benz Stadium (Atlanta, GA)• 2021: Lucas Oil Stadium (Indianapolis, IN)• 2022: Mercedes-Benz Superdome (New Orleans, LA)• 2023: NRG Stadium (Houston, TX)• 2024: State Farm Stadium (Glendale, AZ)• 2025: Alamodome (San Antonio, TX)• 2026: Lucas Oil Stadium (Indianapolis, IN)
41.2 SpectatorsChampionship game attendance has been as follows:
• 2002 (Georgia Dome; Atlanta, GA): 52,647• 2003 (Louisiana Superdome; New Orleans, LA): 54,524• 2004 (Alamodome; San Antonio, TX): 44,468• 2005 (Edward Jones Dome; St. Louis, MO): 47,262• 2006 (RCA Dome; Indianapolis, IN): 43,168• 2007 (Georgia Dome; Atlanta, GA): 51,458• 2008 (Alamodome; San Antonio, TX): 43,257• 2009 (Ford Field; Detroit, MI): 72,456• 2010 (Lucas Oil Stadium; Indianapolis, IN): 70,930• 2011 (Reliant Stadium; Houston, TX): 70,376• 2012 (Mercedes-Benz Superdome; New Orleans, LA): 70,913• 2013 (Georgia Dome; Atlanta, GA): 74,326• 2014 (Cowboys Stadium; Arlington, TX): 79,238• 2015 (Lucas Oil Stadium; Indianapolis, IN): 72,238• 2016 (NRG Stadium; Houston, TX): 74,340• 2017 (University of Phoenix Stadium; Glendale, AZ): 76,168• 2018 (Alamodome; San Antonio, TX): 67,831• 2019 (U.S. Bank Stadium; Minneapolis, MN): 72,062
SPORTS MARKETING 2020-2021
• 213 •

41.3 TV ViewershipThe NCAA has a 14-year, $10.8 billion deal with CBS Sports and Turner Sports
for the rights to broadcast the NCAA Tournament from 2011 until 2024. CBS asksabout $1.5 million per 30-second TV spot for the two Final Four games and thechampionship game.
The following is TV broadcast viewership of championship finals games,broadcast by CBS:• 2002 (Maryland vs. Indiana): 23.7 million• 2003 (Syracuse vs. Kansas): 18.6 million• 2004 (Georgia Tech vs. Connecticut): 17.1 million• 2005 (Illinois vs. North Carolina): 23.9 million• 2006 (Florida vs. UCLA): 17.5 million• 2007 (Florida vs. Ohio State): 19.6 million• 2008 (Kansas vs. Memphis): 19.5 million• 2009 (North Carolina vs. Michigan State): 17.6 million• 2010 (Duke vs. Butler): 22.6 million• 2011 (Connecticut vs. Butler): 20.1 million• 2012 (Kentucky vs. Kansas): 20.9 million• 2013 (Louisville vs. Michigan): 23.4 million• 2014 (Connecticut vs. Kentucky): 21.3 million• 2015 (Duke vs. Wisconsin): 28.3 million• 2016 (Villanova vs. North Carolina): 17.8 million• 2017 (North Carolina vs. Gonzaga): 23.0 million• 2018 (Villanova vs. Michigan): 16.5 million• 2019 (Virginia vs. Texas Tech): 19.6 million
41.4 March Madness AdvertisingAds for telecasts of NCAA playoff games are among the most costly on network
television. Total national TV ad spending for the NCAA Men’s Division I Basketball
Championship has been as follows (source: Kantar Media [www.kantarmedia.com]):• 2007: $ 525 million• 2008: $ 648 million• 2009: $ 598 million• 2010: $ 623 million• 2011: $ 782 million• 2012: $1.10 billion• 2013: $1.12 billion
• 2014: $1.13 billion• 2015: $1.19 billion• 2016: $1.24 billion• 2017: $1.28 billion• 2018: $1.32 billion• 2019: $1.36 billion
Total annual ad revenue for the NCAA Men’s Basketball playoffs is higher thanthat of MLB, NBA, or NFL playoffs. According to Kantar Media, March Madness
SPORTS MARKETING 2020-2021
• 214 •

attracts almost 75% of the total advertising dollars spent on NCAA basketballthroughout the season.
41.5 Economic ImpactAccording to Rockport Analytics (www.rockportanalytics.com), more than 90,000
people came to the Twin Cities during the NCAA Final Four in 2019, pumping a net of$143 million into the local economy.
A study by SABÉR Research Institute (www.saberinstitute.org), released by theSan Antonio Local Organizing Committee, estimated the local economy received aboost of $135 million as a result of hosting the 2018 Final Four; there was an influx of71,000 out-of-town visitors to the San Antonio area.
The Arizona Republic assessed the 2017 Final Four generated $100 million to$150 million in direct economic impact and $1.5 billion in direct and indirect spending.
The city of Houston generated $300 million in revenue during the 2016 FinalFour, according to Forbes and Houston Business Journal. More than 100,000 fanstraveled to Houston for the game or weekend festivities
Visit Indy (www.visitindy.com) estimated that the 2015 Final Four tournamenthad an economic impact of $71 million for the city. The assessment was based on theEconomic Impact Calculator developed by Rockport Analytics(www.rockportanalytics.com).
North Texas estimated $276 million in economic impact from hosting the 2014Final Four.
SPORTS MARKETING 2020-2021
• 215 •

42
NCAA WOMEN’S FINAL FOUR
42.1 OverviewThe NCAA Division I Women’s Championship Basketball Tournament shares
with the Men’s Championship the excitement that is dubbed ‘March Madness.’ Nielsen (www.nielsen.com) reported that 63% of adult viewers of women’s
championship games are men.The following are venues and host cities for upcoming tournament finals games:
• 2020: Smoothie King Center (New Orleans, LA)• 2021: Alamodome (San Antonio, TX)• 2022: Target Center (Minneapolis, MN)• 2023: American Airlines Center (Dallas, TX)• 2024: Quicken Loans Arena (Cleveland, OH)
42.2 SpectatorsChampionship game attendance has been as follows:
• 2014 (Bridgestone Arena; Nashville, TN): 17,570• 2015 (Amalie Arena; Tampa, FL): 19,810• 2016 (Bankers Life Fieldhouse; Indianapolis, IN): 14,514• 2017 (American Airlines Center; Dallas, TX): 19,810• 2018 (Nationwide Arena; Columbus, OH): 19,599• 2019 (Amalie Arena; Tampa, FL): 20,062
42.3 TV ViewershipIn 2019, ESPN televised all 63 games of the NCAA Division I Women’s
(NCAAW) Basketball Championship for the 15th consecutive year. The following are viewership estimates of NCAAW championship finals games
(source: Nielsen):• 2002 (Connecticut vs. Oklahoma): 5.68 million• 2003 (Connecticut vs. Stanford): 4.37 million• 2004 (Tennessee vs. Connecticut): 5.58 million• 2005 (Baylor vs. Michigan State): 3.24 million• 2006 (Maryland vs. Duke): 3.56 million• 2007 (Tennessee vs. Rutgers): 2.92 million
SPORTS MARKETING 2020-2021
• 216 •

• 2008 (Tennessee vs. Stanford): 3.86 million• 2009 (Connecticut vs. Louisville): 2.67 million• 2010 (Connecticut vs. Stanford): 3.77 million• 2011 (Texas A&M vs. Notre Dame): 3.83 million• 2012 (Baylor vs. Notre Dame): 4.24 million• 2013 (Connecticut vs. Louisville): 3.21 million• 2014 (Connecticut vs. Notre Dame): 4.27 million• 2015 (Connecticut vs. Notre Dame): 3.08 million• 2016 (Connecticut vs. Syracuse): 2.97 million• 2017 (Mississippi State vs. South Carolina): 3.88 million• 2018 (Notre Dame vs. Mississippi State): 3.56 million• 2019 (Baylor vs. Notre Dame): 3.69 million
42.4 Economic ImpactThe Tampa Bay Sports Commission (www.tampabaysports.org) estimated
spending by NCAAW Final Four fans at $25 million.The Greater Columbus Sports Commission (www.columbussports.org) assessed
that hosting the 2018 Women’s Final Four generated $21.7 million in direct visitorspending for the region. Visitors from outside Ohio accounted for 83% of the 22,000people who attended one or more of the games, staying for an average 3.6 days,spending an average of $271 per day, and accounting for 32,747 room nights. Spending was distributed as follows:• Food and drink: $5.70 billion• Accommodations: $4.60 billion• Local transportation: $2.44 billion• Merchandise: $2.36 billion• Retail shopping: $1.50 billion• Entertainment: $ 985 million• Car rental: $ 209 million• Miscellaneous: $ 66 million
The 2017 NCAA Division I women’s basketball Final Four, held in Dallas, Texas,brought an economic impact of $30 million to the region.
SPORTS MARKETING 2020-2021
• 217 •

43
OLYMPIC GAMES
43.1 Television Broadcast RightsNBCUniversal broadcast the 1996 Summer Olympic Games, has broadcast both
the Summer and Winter Olympic Games since 2000, and has contracted for broadcastrights through 2020. U.S. rights fees are as follows:
Games Location Rights Fee Ad Revenue
• 1996: Summer Atlanta, GA $ 456 million $ 680 million• 1998:* Winter Nagano, Japan $ 375 million $ 590 million• 2000: Summer Sydney, Australia $ 715 million $ 900 million• 2002: Winter Salt Lake City, UT $ 555 million $ 740 million• 2004: Summer Athens, Greece $ 793 million $ 927 million• 2006: Winter Turin, Italy $ 613 million $ 920 million• 2008: Summer Beijing, China $ 894 million $1.1 billion• 2010: Winter Vancouver, BC, Canada $ 820 million $ 800 million• 2012: Summer London, England $1.18 billion $1.0 billion• 2014: Winter Sochi, Russia $ 775 million $ 946 million• 2016: Summer Rio de Janeiro, Brazil $1.23 billion $1.2 billion• 2018: Winter Pyeongchang, South Korea $ 950 million n/a• 2020: Summer Tokyo, Japan $1.43 billion n/a* The 1998 Winter Games were telecast by CBS.
43.2 Prime-Time TV AudiencesSeventeen-night average prime-time TV audiences (including NBC Sports Digital’s
streaming platforms) for Summer Olympic TV broadcasts have been as follows (sources:NBC, Nielsen [www.nielsen.com], and SportsBusiness Journal):• 1996: 36.3 million• 2000: 21.4 million• 2004: 26.0 million
• 2008: 30.4 million• 2012: 31.1 million• 2016: 25.4 million
The following is average prime-time viewership for Winter Olympic Games (source:Nielsen):• 1992: 29.0 million• 1994: 43.2 million• 1998: 25.1 million• 2002: 31.9 million
• 2006: 20.2 million• 2010: 24.8 million• 2014: 21.3 million• 2018: 19.8 million*
SPORTS MARKETING 2020-2021
• 218 •
43.3 Online ActivitiesThe declines seen in TV viewing is, in part, attributed to an increase in online
viewing.A survey by Penn, Schoen & Berland Associates (www.psbresearch.com) found
adults that followed the 2016 Summer Olympics did so in the following ways:• Watched on TV: 84%• Watched/listened for results on news sites/blogs: 59%• Watched live online: 44%• Listened on radio: 37%• Watched live on mobile device: 36%
Second-screen activities conducted simultaneously while watching the 2016Summer Olympics on TV were as follows:• Browsing the Internet: 51%• Reading email: 47%• Looking at sports scores: 40%• Viewing local media: 39%• Checking the news: 35%• Texting with friends of family: 35%
43.4 Opening and Closing CeremoniesThe opening ceremonies are typically the most-watched telecasts of the Olympic
games. Closing ceremonies are generally the second-most-watched events.The opening ceremony of the 2016 Rio de Janeiro Summer Olympics (August 5)
had an average 26.5 million viewers during the 4-hour telecast. For comparison with2016, the average number of viewers for recent Summer Olympic opening ceremonieshas been as follows:• 1996 Atlanta: 39.8 million• 2000 Sydney: 27.3 million• 2004 Athens: 25.4 million• 2008 Beijing: 34.9 million• 2012 London: 40.7 million• 2016 Rio de Janeiro: 26.5 million
The 2016 Summer Olympics closing ceremony telecast (August 21) was watchedby an average audience of 15.0 million viewers, a drop from the 31.0 million averageaudience that watched the 2012 London Olympics closing ceremony telecast.
The 2018 PyeongChang Winter Olympics opening ceremony was watched by 28.3million viewers. The closing ceremony had a television audience of 14.7 million.
The 2014 Sochi Winter Olympics opening ceremony was watched by 31.7 millionviewers. The closing ceremony had a television audience of 15.1 million.
SPORTS MARKETING 2020-2021
• 219 •

43.5 Venue and Infrastructure SpendingStaging to host the Olympic Games ranks among the costliest construction projects
in history and the inevitable cost overruns are staggering. Public sector funding to stagethe 2012 Summer Games in London, for example, totaled $14.0 billion, an overrun fromthe original funding estimate of $3.7 billion.
Russia reportedly spent $51 billion on venues and infrastructure for the 2014Winter Olympic Games, more than four times the original budget. In his proposal to theIOC Committee in 2007, President Vladimir Putin pledged to spend $12 billion in Sochi, abid that dwarfed finalists from South Korea and Austria.
A study conducted at the Saïd Business School at the University of Oxfordassessed the overall cost of the 2016 Summer Olympic Games in Rio de Janiero, including all Olympic-related projects, at $12 billion; sports-related costs of the gameswere $4.6 billion and infrastructure spending accounted for the rest. The state of Rio wasresponsible for a quarter of spending.
The highest spending to host Olympic Games has been as follows:Games Location Spending
• 2014: Winter Sochi, Russia $51.0 billion• 2008: Summer Beijing, China $42.6 billion• 2004: Summer Athens, Greece $18.2 billion• 1998: Winter Nagano, Japan $17.6 billion• 1992: Summer Barcelona, Spain $15.4 billion• 2012: Summer London, England $14.0 billion• 2018: Winter PyeongChang, South Korea $13.0 billion• 2016: Summer Rio de Janiero, Brazil $12.0 billion• 2010: Winter Vancouver, BC, Canada $ 8.3 billion
43.6 United States Olympic CommitteeThe United States Olympic Committee (USOC; (www.teamusa.org) is chartered
under the Ted Stevens Olympic and Amateur Sports Act to host the teams representingthe United States in the summer and winter Olympic games. Despite this federalmandate, the organization receives no continuous financial assistance from the U.S.government.
The USOC hosts teams in the following sports:• Archery• Badminton• Baseball• Basketball• Biathlon• Bobsled• Bowling• Boxing• Canoe/kayak
• Curling• Cycling• Diving• Equestrian• Fencing• Field hockey• Figure skating• Gymnastics• Team handball
SPORTS MARKETING 2020-2021
• 220 •

• Hockey• Judo• Karate• Luge• Modern pentathlon• Racquetball• Roller sports• Rowing• Sailing• Shooting• Ski & snowboard• Soccer• Softball
• Speedskating• Squash• Swimming• Synchronized swimming• Table tennis• Tae kwon do• Tennis• Track & Field• Triathlon• Volleyball• Water polo• Water ski• Weightlifting
The USOC provides $43.5 million in annual funding through national governingbodies (NGBs) to support athletes’ training for summer and winter Olympic games. Thefollowing are the largest funding recipients among the 39 National Governing Bodies(NGBs):• USA Track & Field: $4.40 million• U.S. Ski & Snowboard: $3.88 million• US Speedskating: $2.63 million• USA Swimming: $2.38 million• USA Gymnastics: $1.62 million
43.7 National Governing BodiesNational Governing Bodies are as follows:
• U.S. Biathlon Association• U.S. Figure Skating• U.S. Speedskating• United States Bobsled and Skeleton Federation• United States Curling Association• United States Equestrian Federation• United States Fencing Association• United States Ski and Snowboard Association• United States Soccer Federation• United States Tennis Association• US Rowing• US Sailing• USA Archery• USA Badminton• USA Basketball• USA Boxing• USA Canoe/Kayak
SPORTS MARKETING 2020-2021
• 221 •

• USA Cycling• USA Diving• USA Field Hockey• USA Gymnastics• USA Hockey• USA Judo• USA Luge• USA Pentathlon• USA Roller Sports• USA Rugby• USA Shooting• USA Swimming• USA Synchronized Swimming• USA Table Tennis• USA Taekwondo• USA Team Handball• USA Track & Field• USA Triathlon• USA Volleyball• USA Water Polo• USA Weightlifting• USA Wrestling
43.8 Market ResourcesInternational Olympic Committee, Château de Vidy, Case postale 356, 1001 Lausanne, Switzerland. Tel. +41 21 621 6111. (www.olympic.org)
United States Olympic Committee, 1 Olympic Plaza, Colorado Springs, CO 80909. (719) 632-5551. (www.teamusa.org)
SPORTS MARKETING 2020-2021
• 222 •

44
RUGBY WORLD CUP
44.1 OverviewThe Rugby World Cup (www.rugbyworldcup.com), held every four years, is the
premier international rugby union competition and one of the largest sporting competitionsin the world, exceeded in television audience only by the FIFA World Cup and theSummer Olympics.
The Rugby World Cup is under the control and direction of the International RugbyBoard (www.worldrugby.org).
The host for the 2015 Rugby World Cup was England. The host for the 2019tournament is Japan. France will host the 2023 Rugby World Cup.
44.2 Rugby World Cup 2015Rugby World Cup 2015 was hosted by England from September 18 to October 31,
2015. Twenty-five (25) nations competed in the 2015 tournament. Attendance was466,000 people across the duration of the tournament.
The television audience was 2.4 billion, making it the second-most-watched teamsports event worldwide, trailing only the FIFA World Cup 2014.
The Economic Impact Of Rugby World Cup 2015, published by Ernst & Young(www.ey.com), reported direct spending by international visitors was an estimated £869million ($1.34 billion). Investment in infrastructure for the tournament was £85 million($131 million). In total, the economic impact of World Cup 2015 was assessed at £2.2billion ($3.4 billion), with £982 million ($1.4 billion) value added to GDP.
44.3 Rugby World Cup 2019Rugby World Cup 2019, the 9th Rugby World Cup, will be held September 20 to
November 2. Among 93 qualifying countries, 20 will compete in the tournament.All 48 matches will be live on NBC Sports Gold and selected matches (including
USA and Argentina matches) live and free on NBC and Univision.
44.4 SponsorsWorldwide Partners of Rugby World Cup 2019 were DHL, Emirates, Heineken,
Land Rover, MasterCard, Société Générale. Official Sponsors are Canon, Mitsubishi,NEC, Secom, Taisho Pharmaceutical, and Toto.
SPORTS MARKETING 2020-2021
• 223 •

45
STANLEY CUP
45.1 OverviewThe Stanley Cup, originally commissioned in 1892, is awarded annually to the
National Hockey League (NHL) playoff winner. While ‘Stanley Cup’ technically applies tothe winner’s trophy, it is generally used synonymously with the NHL finals.
The Stanley Cup Finals is a best-of-seven series. The playoffs take place in May.
45.2 TV ViewershipTelecasts of the NHL finals have been broadcast on NBC and NBC Sports since
2006.Average ratings and viewership for the Stanley Cup finals have been as follows
(source: Nielsen [www.nielsen.com]): No. Games Avg. Viewers
• 2008: 6 4.3 million• 2009: 7 4.9 million• 2010: 6 5.2 million• 2011: 7 4.6 million• 2012: 6 3.0 million• 2013: 6 5.8 million• 2014: 5 4.7 million• 2015: 6 5.6 million• 2016: 6 4.1 million• 2017: 6 4.7 million• 2018: 5 4.9 million• 2019: 7 5.3 million
The final, Game 7, in 2019 drew a telecast audience of 8.3 million on NBC; St.Louis Blues defeated the Boston Bruins to win the Stanley Cup.
45.3 Economic ImpactProf. Victor Matheson, Ph.D., a sports economist at the College of the Holy Cross,
estimates spending of $2 million to $3 million in the host city per Stanley Cup game.
SPORTS MARKETING 2020-2021
• 224 •

46
SUPER BOWL
46.1 OverviewThe Super Bowl is, by far, the biggest sports and TV event of the year. The Super
Bowl is also the top at-home party event of the year, surpassing New Year’s Eve. Behindonly Thanksgiving, Super Sunday is the second-biggest day of food consumption.
The game is currently played on the first Sunday in February.
46.2 Host Cities And Game AttendanceRecent host stadiums and game attendance have been as follows:
Stadium Attendance
• XLIV (2010): Sun Life Stadium (Miami Gardens, FL) 74,059• XLV (2011): Cowboys Stadium (Arlington, TX) 103,219• XLVI (2012): Lucas Oil Stadium (Indianapolis, IN) 68,658• XLVII (2013): Mercedes-Benz Superdome (New Orleans, LA) 71,024• XLVIII (2014): MetLife Stadium (East Rutherford, NJ) 82,529• XLIX (2015): University of Phoenix Stadium (Glendale, AZ) 70,288• 50 (2016): Levi’s Stadium (Santa Clara, CA) 71,088• LI (2017): NRG Stadium (Houston, TX) 70,807• LII (2018): U.S. Bank Stadium (Minneapolis, MN) 67,612• LIII (2019): Mercedes-Benz Stadium (Atlanta, GA) 70,018
Future Super Bowl venues and host cities are as follows:• 2020: Hard Rock Stadium (Miami Gardens, FL)• 2021: Raymond James Stadium (Tampa, FL)• 2022: Los Angeles Stadium (Los Angeles, CA)• 2023: State Farm Stadium (Glendale, AZ)• 2024: Mercedes-Benz Superdome (New Orleans, LA)
SPORTS MARKETING 2020-2021
• 225 •

_________________________________________________________________
“When the NFL considers sites for future SuperBowl locations, many requirements must be metby potential cities, their venues and theiraccommodations. Stadium quality is among thepriorities, which is why several of the next fiveSuper Bowls will be played in new or recentlyrenovated stadiums.”
Sporting News, 2/17/19 _________________________________________________________________
46.3 TV ViewershipRecent television viewership has been as follows (source: Nielsen):
Network Viewers
• Super Bowl XXXIX (2005): Fox 86.4 million• Super Bowl XL (2006): ABC 89.2 million• Super Bowl XLI (2007): CBS 93.2 million• Super Bowl XLII (2008): Fox 97.4 million• Super Bowl XLIII (2009): ABC 98.7 million• Super Bowl XLIV (2010): CBS 106.5 million• Super Bowl XLV (2011): Fox 111.0 million• Super Bowl XLVI (2012): NBC 111.3 million• Super Bowl XLVII (2013): CBS 108.7 million• Super Bowl XLVIII (2014): Fox 112.2 million• Super Bowl XLIX (2015): NBC 114.4 million• Super Bowl 50 (2016): CBS 111.9 million• Super Bowl LI (2017): Fox 111.3 million• Super Bowl LII (2018): NBC 103.4 million• Super Bowl LIII (2019): CBS 98.2 million
Ranked by local rating, the top marketers for Super Bowl LIII were as follows:• Boston, MA: 57.1• Richmond, VA: 52.6• Buffalo, NY: 54.4• Minneapolis-Saint Paul, MN: 49.3• Denver, CO: 49.3
SPORTS MARKETING 2020-2021
• 226 •

The Super Bowl television audience is approximately 57% male. The SuperBowl attracts more female viewers than other sports events; most broadcasts of sportsevents garner a male audience of 70%. Worldwide, viewership is estimated at 800million.
46.4 Super Bowl AdsThe Super Bowl’s advertising lineup has become its own high-stakes competition
for marketers. With a television viewership topping 110 million, the Super Bowl is themost-watched American television broadcast yearly. Super Bowl advertisements havebecome a cultural phenomenon of their own alongside the game itself; many viewerswatch the game primarily for the commercials.
Ad rates for a 30-second spot airing during Super Bowl and total ad spendinghave been as follows (source: Kantar Media [www.kantarmedia.com]):
:30 Ad Cost Spending
• 2004: $2.3 million $149.6 million• 2005: $2.4 million $158.4 million• 2006: $2.5 million $162,5 million• 2007: $2.4 million $151.5 million• 2008: $2.7 million $186.3 million• 2009: $3.0 million $213.0 million• 2010: $3.0 million $205.2 million• 2011: $3.1 million $227.9 million• 2012: $3.5 million $262.5 million• 2013: $4.0 million $292.0 million• 2014: $4.2 million $331.8 million• 2015: $4.5 million $345.0 million• 2016: $5.0 million $370.0 million• 2017: $5.0 million $419.0 million• 2018: $5.2 million $408.0 million• 2019: $5.3 million $382.0 million
The 2019 Super Bowl saw a total of 49.8 minutes of advertising during the game;ads accounted for 23% of the total broadcast.
The highest spenders for Super Bowl LIII ads were as follows (source: KantarMedia):• Anheuser Busch In Bev: $59 million• Amazon.com: $25 million• Google: $20 million• Deutsche Telekom: $20 million• Toyota: $20 million
SPORTS MARKETING 2020-2021
• 227 •

46.5 Economic ImpactThe National Football League (www.nfl.com) claims an economic impact from
the Super Bowl of around $400 million; direct spending by attending fans is estimatedat $150 million or more.
According to the National Retail Federation (www.nrf.com), 45 million peoplehosted a Super Bowl Party in 2019; 12.0 million watched the game at a bar orrestaurant. Consumers spent $14 billion related to Super Bowl LIII. Among the 76% ofU.S. adults that watched the game on TV, 80% purchased food and beverages, 10%bought team apparel or accessories, and 6% purchased a new television to watch thegame at home.
SPORTS MARKETING 2020-2021
• 228 •

47
WORLD SERIES
47.1 OverviewThe World Series, held in October, is the best-of-seven game championship
between the National and American Leagues of Major League Baseball (MLB).The 2018 World Series, which celebrated its 114th year, saw the Boston Red Sox
beat the Los Angeles Dodgers in five games.
47.2 TV ViewershipThe World Series has been telecast by Fox since 1996.World Series broadcast ratings on Fox have been as follows: Games Avg. Rating Avg. Viewers
• 2003: 6 12.8 20.1 million• 2004: 4 15.8 25.4 million• 2005: 4 11.1 17.2 million• 2006: 5 10.1 15.8 million• 2007: 4 10.6 17.1 million• 2008: 5 8.4 13.6 million• 2009: 6 11.4 18.7 million• 2010: 5 8.4 14.2 million• 2011: 7 9.9 16.6 million• 2012: 4 7.6 12.7 million• 2013: 6 8.9 14.9 million• 2014: 7 8.3 13.9 million• 2015: 5 8.7 14.7 million• 2016: 7 12.9 22.8 million• 2017: 7 10.6 18.7 million• 2018: 5 8.4 14.6 million
By game, 2018 World Series viewership was as follows: Avg. Rating Avg. Viewers
• Game 1: 8.2 13.7 million• Game 2: 8.1 13.4 million• Game 3: 7.9 13.2 million• Game 4: 7.9 13.5 million• Game 5: 10.0 17.6 million
SPORTS MARKETING 2020-2021
• 229 •

47.3 Economic ImpactMajor League Baseball (www.mlb.com) attaches an economic benefit of up to
$250 million for the World Series.
SPORTS MARKETING 2020-2021
• 230 •

PART VI: PROFESSIONAL LEAGUE SPORTS
SPORTS MARKETING 2020-2021
• 231 •

48
MAJOR LEAGUE BASEBALL
48.1 League RevenueMajor League Baseball (MLB, www.mlb.com) revenue has been as follows:
• 2005: $ 4.7 billion• 2006: $ 5.1 billion• 2007: $ 5.4 billion• 2008: $ 5.8 billion• 2009: $ 5.9 billion• 2010: $ 6.1 billion• 2011: $ 6.3 billion
• 2012: $ 6.8 billion• 2013: $ 8.1 billion• 2014: $ 9.0 billion• 2015: $ 9.4 billion• 2016: $ 9.8 billion• 2017: $10.0 billion• 2018: $10.3 billion
These figures include revenue from all sources, including admission,concessions, licensing, media rights, and sponsorship.
48.2 StadiumsStadiums and seating capacity for MLB teams are as follows:
Team Stadium Capacity
• Arizona Diamondbacks Chase Field (Phoenix) 48,519• Atlanta Braves SunTrust Park 41,500• Baltimore Orioles Oriole Park at Camden Yards 45,971• Boston Red Sox Fenway Park 37,949• Chicago Cubs Wrigley Field 41,268• Chicago White Sox Guaranteed Rate Field 40,615• Cincinnati Reds Great American Ball Park 42,319• Cleveland Indians Progressive Field 35,225• Colorado Rockies Coors Field (Denver) 50,398• Detroit Tigers Comerica Park 41,297• Houston Astros Minute Maid Park 41,676• Kansas City Royals Kauffman Stadium 37,903• Los Angeles Angels Angel Stadium (Anaheim) 45,957• Los Angeles Dodgers Dodger Stadium 56,000• Miami Marlins Marlins Park 36,742• Milwaukee Brewers Miller Park 41,900• Minnesota Twins Target Field (Minneapolis) 38,871• New York Mets Citi Field 41,922
SPORTS MARKETING 2020-2021
• 232 •

• New York Yankees Yankee Stadium 49,638• Oakland Athletics Oakland-Alameda County Coliseum 35,067• Philadelphia Phillies Citizens Bank Park 43,651• Pittsburgh Pirates PNC Park 38,362• San Diego Padres Petco Park 40,162• San Francisco Giants Oracle Park 41,915• Seattle Mariners T-Mobile Park 47,943• St. Louis Cardinals Busch Stadium 43,975• Tampa Bay Rays Tropicana Field (St. Petersburg) 31,042• Texas Rangers Globe Life Park in Arlington 48,114• Toronto Blue Jays Rogers Centre 49,282• Washington Nationals Nationals Park 41,313
48.3 Team ValuationsAccording to Forbes (May 2019), valuations of Major League Baseball teams are
as follows:• New York Yankees: $4.60 billion• Los Angeles Dodgers: $3.30 billion• Boston Red Sox: $3.20 billion• Chicago Cubs: $3.10 billion• San Francisco Giants: $3.00 billion• New York Mets: $2.30 billion• St. Louis Cardinals: $2.10 billion• Los Angeles Angels: $1.90 billion• Philadelphia Phillies: $1.85 billion• Houston Astros: $1.78 billion• Washington Nationals: $1.75 billion• Atlanta Braves: $1.70 billion• Texas Rangers: $1.65 billion• Chicago White Sox: $1.60 billion• Seattle Mariners: $1.58 billion• Toronto Blue Jays: $1.50 billion• San Diego Padres: $1.35 billion• Arizona Diamondbacks: $1.29 billion• Baltimore Orioles: $1.28 billion• Pittsburgh Pirates: $1.27 billion• Detroit Tigers: $1.25 billion• Colorado Rockies: $1.22 billion• Minnesota Twins: $1.20 billion• Milwaukee Brewers: $1.18 billion• Cleveland Indians: $1.15 billion• Oakland Athletics: $1.10 billion• Cincinnati Reds: $1.05 billion
SPORTS MARKETING 2020-2021
• 233 •

• Kansas City Royals: $1.02 billion• Tampa Bay Rays: $1.01 billion• Miami Marlins: $1.00 billion
48.4 Player SalariesMLB implements a luxury tax whereby teams whose total payroll exceeds a
threshold are taxed on the excess amount. The MLB team salary threshold has beenas follows:• 2005: $128.0 million• 2006: $136.5 million• 2007: $148.0 million• 2008: $155.0 million• 2009: $162.0 million• 2010: $170.0 million• 2011: $178.0 million• 2012: $178.0 million• 2013: $178.0 million• 2014: $189.0 million• 2015: $189.0 million• 2016: $189.0 million• 2017: $195.0 million• 2018: $197.0 million• 2019: $206.0 million
The highest salaries for the 2019 MLB season were as follows:• Stephen Strasburg (Washington Nationals): $38.3 million• Max Scherzer (Washington Nationals): $37.4 million• Zack Greinke (Arizona Diamondbacks): $34.5 million• Mike Trout (Los Angeles Angels): $34.1 million• Clayton Kershaw (Los Angeles Dodgers): $31.0 million• David Price (Boston Red Sox): $31.0 million• Miguel Cabrera (Detroit Tigers): $30.0 million• Yoenis Cespedes (New York Mets): $29.0 million• Albert Pujols (Los Angeles Angels): $28.0 million• Justin Verlander (Detroit Tigers): $28.0 million• Felix Hernandez (Seattle Mariners): $27.9 million• Jon Lester (Chicago Cubs): $27.5 million• Nolan Arenado (Colorado Rockies): $26.0 million• Giancarlo Stanton (New York Yankees): $26.0 million• Jake Arrieta (Philadelphia Phillies): $25.0 million• Joey Votto (Cincinnati Reds): $25.0 million• Jordan Zimmermann (Detroit Tigers): $25.0 million• Robinson Cano (New York Mets): $24.0 million
SPORTS MARKETING 2020-2021
• 234 •

• J.D. Martinez (Boston Red Sox): $23.8 million• Josh Donaldson (Toronto Blue Jays): $23.0 million
48.5 AttendanceThe MLB season includes 2,429 regular-season games, with 30 teams playing
81 home games. Regular-season total and average game attendance has been asfollows:
Total Average
• 2005: 74,926,174 30,923• 2006: 76,042,787 31,419• 2007: 79,503,175 32,785• 2008: 78,588,004 32,543• 2009: 73,367,479 30,351• 2010: 73,054,781 30,141• 2011: 73,415,359 30,334• 2012: 74,859,268 30,895• 2013: 74,028,227 30,514• 2014: 73,739,622 30,358• 2015: 73,760,020 30,514• 2016: 73,159,044 30,169• 2017: 72,678,797 29,908• 2018: 69,671,272 28,659
_________________________________________________________________
“MLB’s attendance had already been on a slow,steady ebb this decade, dropping four out offive seasons entering 2018. But this year’s 4%decline more than doubled typical season-to-season shifts and sank the league to its lowestlevel since 2003.”
SportsBusiness Journal, 12/24/18 _________________________________________________________________
Average attendance for home games during the 2018 season was as follows: • Los Angeles Dodgers: 48,484• St. Louis Cardinals: 42,782• New York Yankees: 41,020
SPORTS MARKETING 2020-2021
• 235 •

• Chicago Cubs: 37,810• Los Angeles Angels: 37,443• Colorado Rockies: 37,154• Boston Red Sox: 36,054• Philadelphia Phillies: 35,472• Houston Astros: 34,969• Milwaukee Brewers: 34,682• San Francisco Giants: 33,218• Atlanta Braves: 32,706• New York Mets: 30,326• San Diego Padres: 29,198• Washington Nationals: 27,480• Texas Rangers: 27,110• Minnesota Twins: 27,001• Arizona Diamondbacks: 26,565• Cincinnati Reds: 22,928• Seattle Mariners: 21,937• Chicago White Sox: 21,699• Toronto Blue Jays: 20,870• Cleveland Indians: 20,546• Detroit Tigers: 19,864• Pittsburgh Pirates: 19,484• Oakland Athletics: 19,100• Kansas City Royals: 18,502• Baltimore Orioles: 17,849• Tampa Bay Rays: 15,602• Miami Marlins: 9,808
48.6 SponsorsMLB’s Official Sponsors for the 2019 season were Arm & Hammer, AWS, Bank
of America, Barbasol, Budweiser, Camping World, Chevrolet, Clear, Coca-Cola,DooSan, Draft Kings, Esurance, Evan Williams, Falken Tires, Gatorade, Geico, GoodSam, Google, Hankook, Kingsford, MasterCard, MGM Resorts International, Mitel,Netspend, OxiClean, Old Dominion Freight Line, Papa John’s Pizza, Scotts, SiriusXM,Snapple, SuperCuts, T-Mobile, Taco Bell, The Hartford, Utz, W.B. Mason, andYouTube TV.
48.7 Television Broadcast RightsMLB’s television rights contracts with ESPN, Fox, and Turner Sports’ TBS are for
a combined $1.5 billion through 2021.MLB and ESPN have been partners since 1990. A new deal was signed in 2013
SPORTS MARKETING 2020-2021
• 236 •

covering 2014 through 2021, with ESPN paying MLB an average of $700 millionannually for the rights to regular-season games.
The World Series and All-Star Game are broadcast on Fox. The LeagueChampionship Series and Division Series are shared across Fox Sports Media Group(FSMG), TBS, and MLB Network. The Fox and TBS deals include digital rights tostream televised games and other MLB-related programming online and through mobiledevices.
In 2009, Major League Baseball launched its own 24-hour channel, withviewership reaching approximately 50 million cable and satellite customers. Thechannel carries 26 Saturday night games (some of which compete with localbroadcasts), archival and fantasy programming, studio shows, and some originalprogramming.
48.8 Franchise SalesThe most recent MLB team sales are as follows:
Year Price
• Los Angeles Angels: 2003 $ 200 million• Los Angeles Dodgers: 2004 $ 421 million• Tampa Bay Rays: 2004 $ 85 million• Oakland Athletics: 2005 $ 180 million• Milwaukee Brewers: 2005 $ 220 million• Cincinnati Reds: 2006 $ 270 million• Washington Nationals: 2006 $ 450 million• Atlanta Braves: 2007 $ 450 million• Chicago Cubs: 2009 $ 845 million• Texas Rangers: 2010 $ 500 million• Houston Astros: 2011 $ 675 million• Los Angeles Dodgers: 2012 $2.15 billion• Miami Marlins: 2018 $1.30 million
48.9 World SeriesThe World Series is assessed in Chapter 47 of this handbook.
48.10 All-Star GameThe MLB All-Star Game is assessed in Chapter 33 of this handbook.
48.11 Fan DemographicsAccording to an ESPN Sports Poll, MLB fan distribution is as follows:
SPORTS MARKETING 2020-2021
• 237 •

Gender• Male: 59%• Female: 41%
Age• 12-to-17: 11%• 18-to-24: 9%• 25-to-34: 15%• 35-to-44: 14%• 45-to-54: 20%• 55 and older: 29%
Ethnicity• Caucasian: 74%• Hispanic-American: 12%• African-American: 9%• Other: 5%
48.12 Fan LoyaltyBrand Keys (www.brandkeys.com) assessed fan loyalty for each MLB team.
The following teams were ranked highest in fan loyalty:1. Chicago Cubs2. Washington Nationals3. Los Angeles Dodgers4. Boston Red Sox5. San Francisco Giants
48.13 Market ResourcesMajor League Baseball, 245 Park Avenue, New York, NY 10167. (212) 931-7800. (www.mlb.com)
SPORTS MARKETING 2020-2021
• 238 •

49
NATIONAL BASKETBALL ASSOCIATION
49.1 League RevenueNational Basketball Association (NBA, www.nba.com) revenue has been as
follows:• 2004-2005: $3.19 billion• 2005-2006: $3.37 billion• 2006-2007: $3.57 billion• 2007-2008: $3.77 billion• 2008-2009: $3.79 billion• 2009-2010: $3.81 billion• 2010-2011: $3.96 billion
• 2011-2012: $3.68 billion• 2012-2013: $4.56 billion• 2013-2014: $4.79 billion• 2014-2015: $5.18 billion• 2015-2016: $5.87 billion• 2016-2017: $7.35 billion• 2017-2018: $8.01 billion
These figures include revenue from all sources, including admission,concessions, licensing, media rights, and sponsorship.
49.2 ArenasArenas and seating capacity for NBA teams are as follows:
Team Arena Capacity
• Atlanta Hawks: State Farm Arena 18,047• Boston Celtics: TD Garden 18,624• Brooklyn Nets: Barclays Center 17,732• Charlotte Hornets: Spectrum Center 19,077• Chicago Bulls: United Center 20,917• Cleveland Cavaliers: Quicken Loans Arena 20,562• Dallas Mavericks: American Airlines Center 19,200• Denver Nuggets: Pepsi Center 19,155• Detroit Pistons: Little Caesars Arena 19,971• Golden State Warriors: Oracle Arena (Oakland) 19,596• Houston Rockets: Toyota Center 18,055• Indiana Pacers: Bankers Life Fieldhouse 18,165• Los Angeles Clippers: Staples Center 19,060• Los Angeles Lakers: Staples Center 18,997• Memphis Grizzlies: FedExForum 18,119• Miami Heat: American Airlines Arena 19,600• Milwaukee Bucks: Fiserv Forum 18,717
SPORTS MARKETING 2020-2021
• 239 •

• Minnesota Timberwolves: Target Center (Minneapolis) 19,356• New Orleans Pelicans: Smoothie King Center 16,867• New York Knicks: Madison Square Garden 19,812• Oklahoma City Thunder: Chesapeake Energy Arena 18,203• Orlando Magic: Amway Center 18,846• Philadelphia 76ers: Wells Fargo Center 21,600• Phoenix Suns: Talking Stick Resort Arena 18,055• Portland Trail Blazers: Moda Center 19,441• Sacramento Kings: Golden 1 Center 17,500• San Antonio Spurs: AT&T Center 18,418• Toronto Raptors: Scotiabank Arena 19,800• Utah Jazz: Vivint Smart Home Arena 19,911• Washington Wizards: Capital One Center 20,356
49.3 Team ValuationsForbes published 21st Annual NBA Team Valuations in February 2019.
Valuations of NBA teams are as follows:• New York Knicks: $4.00 billion• Los Angeles Lakers: $3.70 billion• Golden State Warriors: $3.50 billion• Chicago Bulls: $2.90 billion• Boston Celtics: $2.80 billion• Brooklyn Nets: $2.35 billion• Houston Rockets: $2.30 billion• Dallas Mavericks: $2.25 billion• Los Angeles Clippers: $2.20 billion• Miami Heat: $1.75 billion• Toronto Raptors: $1.68 billion• Philadelphia 76ers: $1.65 billion• San Antonio Spurs: $1.62 billion• Portland Trail Blazers: $1.60 billion• Sacramento Kings: $1.58 billion• Washington Wizards: $1.55 billion• Phoenix Suns: $1.50 billion• Oklahoma City Thunder: $1.48 billion• Utah Jazz: $1.42 billion• Indiana Pacers: $1.40 billion• Denver Nuggets: $1.38 billion• Milwaukee Bucks: $1.35 billion• Orlando Magic: $1.32 billion• Atlanta Hawks: $1.30 billion• Cleveland Cavaliers: $1.28 billion• Detroit Pistons: $1.27 billion
SPORTS MARKETING 2020-2021
• 240 •

• Minnesota Timberwolves: $1.26 billion• Charlotte Hornets: $1.25 billion• New Orleans Pelicans: $1.22 billion• Memphis Grizzlies: $1.20 billion
49.4 Player SalariesThe NBA team salary cap has been as follows:
• 2005-2006: $ 49.5 million• 2006-2007: $ 53.1 million• 2007-2008: $ 55.6 million• 2008-2009: $ 58.7 million• 2009-2010: $ 57.7 million• 2010-2011: $ 58.0 million• 2011-2012: $ 58.0 million• 2012-2013: $ 58.0 million
• 2013-2014: $ 58.7 million• 2014-2015: $ 63.1 million• 2015-2016: $ 70.0 million• 2016-2017: $ 94.1 million• 2017-2018: $ 99.1 million• 2018-2019: $101.9 million• 2019-2020: $109.0 million
Various exemptions to the salary cap are allowed. Teams pay a luxury tax whentotal payroll exceeds the salary cap.
The highest salaries for the 2019-2020 NBA season were as follows:• Stephen Curry (Golden State Warriors): $40,231,758• Chris Paul (Oklahoma City Thunder): $38,506,482• Russell Westbrook (Houston Rockets): $38,506,482• Kevin Durant (Brooklyn Nets): $38,199,000• James Harden (Houston Rockets): $38,199,000• LeBron James (Los Angeles Lakers): $37,436,858• Kyle Lowry (Toronto Raptors): $34,996,296• Blake Griffin (Detroit Pistons): $34,449,964• Tobias Harris (Philadelphia 76ers): $32,742,000• Jimmy Butler (Miami Heat): $32,742,000• Kawhi Leonard (Los Angeles Clippers): $32,742,000• Klay Thompson (Golden State Warriors): $32,742,000• Kemba Walker (Boston Celtics): $32,742,000• Gordon Hayward (Boston Celtics): $32,700,690• Mike Conley (Utah Jazz): $32,511,624• Kyrie Irving (Brooklyn Nets): $31,742,000• Khris Middleton (Milwaukee Bucks): $30,603,448• Paul George (LA Clippers): $30,560,700• Paul Millsap (Denver Nuggets): $30,350,000• Damian Lillard (Portland Trail Blazers): $29,802,321
SPORTS MARKETING 2020-2021
• 241 •

49.5 AttendanceThe NBA season includes 1,230 regular-season games, with 30 teams each
playing 41 home games. Regular-season total and average game attendance hasbeen as follows: Total A verage
• 2005-2006: 21,586,804 17,543• 2006-2007: 21,841,480 17,760• 2007-2008: 21,369,686 17,311• 2008-2009: 21,528,650 17,520• 2009-2010: 21,094,015 17,149• 2010-2011: 21,305,573 17,323• 2011-2012*: 17,100,861 17,273• 2012-2013: 21,320,299 17,348• 2013-2014: 21,411,543 17,408• 2014-2015: 21,926,548 17,826• 2015-2016: 21,972,129 17,864• 2016-2017: 21,997,412 17,884• 2017-2018: 22,128,921 17,991• 2018-2019: 21,948,390 17,844* Lockout-shortened season
Average attendance for home games during the 2018-2019 season for NBAteams was as follows: • Philadelphia 76ers: 20,441• Chicago Bulls: 20,084• Dallas Mavericks: 20,013• Topronto Raptors: 19,824• Miami Heat: 19,640• Golden State Warriors: 19,596• Portland Trail Blazers: 19,496• Cleveland Cavaliers: 19,349• New York Knicks: 19,002• Los Angeles Lakers: 18,997• Boston Celtics: 18,624• Denver Nuggets: 18,450• San Antonio Spurs: 18,307• Utah Jazz: 18,306• Oklahoma City Thunder: 18,203• Houston Rockets: 18,058• Milwaukee Bucks: 17,602• Orlando Magic: 17,561• Washington Wizards: 17,487• Los Angeles Clippers: 17,325• Sacramento Kings: 17,096
SPORTS MARKETING 2020-2021
• 242 •

• Indiana Pacers: 16,812• Charlotte Hornets: 16,501• Detroit Pistons: 16,486• New Orleans Pelicans: 16,004• Memphis Grizzlies: 15,578• Atlanta Hawks: 15,327• Minnesota Timberwolves: 15,305• Phoenix Suns: 15,293• Brooklyn Nets: 14,941
49.6 SponsorsNBA sponsors for the 2018-2019 season were adidas, Anheuser-Busch InBev,
AutoTrader.com, BBVA, Cisco, Coca-Cola, Diageo, Foot Locker, Gatorade, Harman,Kaiser Permanente, Kia Motors, Kumho Tire, McDonald’s, Nike, Samsung, SAP,Spalding, Sprint, State Farm, and Taco Bell.
49.7 Television Broadcast RightsIn 2014, the NBA extended its television broadcast rights contracts with
ABC/ESPN and TNT/Turner Sports through the 2023-2024 season at $2.6 billionannually. The deals include broadcasts of live games and content on digital media.
NBA TV, launched by the league in 1999, is available to approximately 12 millionsubscribers of cable and satellite sports tiers. The network broadcasts 96 regular-season games that are not included in its broadcast rights deals with networks.
Regular-season broadcast network ratings for the NBA have been as follows(source: SportsBusiness Journal and the networks):
ABC ESPN TNT NBA TV
• 2007-2008: 3.17 million 1.46 million 1.47 million -• 2008-2009: 3.68 million 1.68 million 1.71 million -• 2009-2010: 3.69 million 1.56 million 1.72 million -• 2010-2011: 5.11 million 1.99 million 2.40 million 253,000• 2011-2012: 5.42 million 1.86 million 2.50 million 337,000• 2012-2013: 4.70 million 1.77 million 2.00 million 336,000• 2013-2014: 3.64 million 1.68 million 1.90 million 316,000• 2014-2015: 3.59 million 1.51 million 1.67 million 291,000• 2015-2016: 3.93 million 1.65 million 1.68 million 350,000• 2016-2017: 3.27 million 1.54 million 1.57 million 310,000• 2017-2018: 3.82 million 1.74 million 1.63 million 310,000• 2018-2019: 4.46 million 1.81 million 1.85 million 313,000
SPORTS MARKETING 2020-2021
• 243 •

49.8 Franchise SaleThe most recent NBA team sales are as follows:
Year Price
• Boston Celtics: 2003 $ 360 million• Phoenix Suns: 2004 $ 401 million• New Jersey Nets: 2004 $ 300 million• Atlanta Hawks/Thrashers: 2004 $ 250 million*• Cleveland Cavaliers: 2005 $ 375 million• Oklahoma City Thunder: 2006 $ 350 million• New Jersey Nets: 2009 $ 380 million**• Charlotte Hornets: 2010 $ 270 million• Golden State Warriors: 2010 $ 450 million• Philadelphia 76ers: 2011 $ 280 million• Atlanta Hawks: 2011 $ 300 million***• New Orleans Pelicans: 2012 $ 338 million• Sacramento Kings: 2013 $ 345 million for 65% stake• Milwaukee Bucks: 2014 $ 550 million• Los Angeles Clippers: 2014 $2.00 billion• Atlanta Hawks: 2015: $ 730 million• Houston Rockets: 2017 $2.20 billion* total price for sale of NBA and NHL teams, which were sold together** price for 80% stake in the team and 45% of the Brooklyn arena at Atlantic Yards; includes $180 million in assumed debt*** Estimated; terms of the sale were not made public; price includes Philips Arena and associated debt,estimated at $120 million
49.9 NBA FinalsThe NBA Finals are assessed in Chapter 40 of this handbook.
49.10 All-Star GameThe NBA All-Star Game is assessed in Chapter 33 of this handbook.
49.11 Fan DemographicsAccording to an ESPN Sports Poll, NBA fan distribution is as follows:
Gender• Male: 60%• Female: 40%
Age• 12-to-17: 16%• 18-to-24: 15%
SPORTS MARKETING 2020-2021
• 244 •

• 25-to-34: 18%• 35-to-44: 13%• 45-to-54: 18%• 55 and older: 21%
Ethnicity• Caucasian: 65%• African-American: 15%• Hispanic-American: 14%• Other: 6%
49.12 Fan LoyaltyBrand Keys (www.brandkeys.com) assessed fan loyalty for each NBA team.
The following teams were ranked highest in fan loyalty:1. Oklahoma City Thunder2. San Antonio Spurs3. Miami Heat4. Golden State Warriors5. (tie) Chicago Bulls5. (tie) Los Angeles Clippers
49.13 Market ResourcesNational Basketball Association, 645 5 th Avenue, New York, NY 10022. (212) 407-8000. (www.nba.com)
SPORTS MARKETING 2020-2021
• 245 •

50
NATIONAL FOOTBALL LEAGUE
50.1 League RevenueNational Football League (NFL, www.nfl.com) revenue has been as follows:
• 2004-2005: $ 6.16 billion• 2005-2006: $ 6.54 billion• 2006-2007: $ 7.09 billion• 2007-2008: $ 7.57 billion• 2008-2009: $ 8.02 billion• 2009-2010: $ 8.35 billion• 2010-2011: $ 8.82 billion• 2011-2012: $ 9.17 billion
• 2012-2013: $ 9.58 billion• 2013-2014: $11.09 billion• 2014-2015: $12.00 billion• 2015-2016: $13.10 billion• 2016-2017: $14.00 billion• 2017-2018: $15.00 billion• 2018-2019: $16.00 billion
These figures include revenue from all sources, including admission,concessions, licensing, media rights, and sponsorship.
50.2 StadiumsStadiums and seating capacity for NFL teams are as follows:
Team Stadium Capacity
• Arizona Cardinals: State Farm Stadium (Glendale) 63,400• Atlanta Falcons: Mercedes-Benz Stadium 71,000• Baltimore Ravens: M&T Bank Stadium 71,008• Buffalo Bills: New Era Field (Orchard Park) 71,608• Carolina Panthers: Bank of America Stadium (Charlotte) 75,419• Chicago Bears: Soldier Field 61,500• Cincinnati Bengals: Paul Brown Stadium 65,515• Cleveland Browns: FirstEnergy Stadium 67,431• Dallas Cowboys: AT&T Stadium (Arlington) 80,000• Denver Broncos: Broncos Field at Mile High 76,125• Detroit Lions: Ford Field 65,000• Green Bay Packers: Lambeau Field 81,435• Houston Texans: NRG Stadium 72,220• Indianapolis Colts: Lucas Oil Stadium 67,000• Jacksonville Jaguars: TIAA Bank Field 67,246• Kansas City Chiefs: Arrowhead Stadium 76,416• Los Angeles Rams: Los Angeles Memorial Coliseum 93,607
SPORTS MARKETING 2020-2021
• 246 •

• Los Angeles Chargers: Dignity Health Sports Park (Carson) 30,000• Miami Dolphins: Hard Rock Stadium 65,326• Minnesota Vikings: U.S. Bank Stadium (Minneapolis) 66,655• New England Patriots: Gillette Stadium (Foxborough) 66,829• New York Giants: MetLife Stadium (East Rutherford, NJ) 82,500• New York Jets: MetLife Stadium (East Rutherford, NJ) 82,500• New Orleans Saints: Mercedes-Benz Superdome 73,000• Oakland Raiders: Oakland-Alameda County Coliseum 56,063• Philadelphia Eagles: Lincoln Financial Field 69,596• Pittsburgh Steelers: Heinz Field 68,400• San Francisco 49ers: Levi’s Stadium (Santa Clara) 68,500• Seattle Seahawks: CenturyLink Field 68,000• Tampa Bay Buccaneers: Raymond James Stadium 65,890• Tennessee Titans: Nissan Stadium (Nashville) 69,143• Washington Redskins: FedExField (Landover, MD) 82,000
50.3 Team ValuationsAccording to Forbes (September 2018), valuations of NFL teams are as follows:
• Dallas Cowboys: $5.00 billion• New England Patriots: $3.80 billion• New York Giants: $3.30 billion• Los Angeles Rams: $3.20 billion• Washington Redskins: $3.10 billion• San Francisco 49ers: $3.05 billion• Chicago Bears: $2.90 billion• New York Jets: $2.85 billion• Houston Texans: $2.80 billion• Philadelphia Eagles: $2.75 billion• Denver Broncos: $2.65 billion• Green Bay Packers: $2.62 billion• Atlanta Falcons: $2.60 billion• Baltimore Ravens: $2.59 billion• Pittsburgh Steelers: $2.58 billion• Seattle Seahawks: $2.58 billion• Miami Dolphins: $2.57 billion• Oakland Raiders: $2.42 billion• Minnesota Vikings: $2.40 billion• Indianapolis Colts: $2.38 billion• Carolina Panthers: $2.30 billion• Los Angeles Chargers: $2.28 billion• Arizona Cardinals: $2.15 billion• Kansas City Chiefs: $2.10 billion• Jacksonville Jaguars: $2.08 billion
SPORTS MARKETING 2020-2021
• 247 •
• New Orleans Saints: $2.07 billion• Tennessee Titans: $2.05 billion• Tampa Bay Buccaneers: $2.00 billion• Cleveland Browns: $1.95 billion• Cincinnati Bengals: $1.80 billion• Detroit Lions: $1.70 billion• Buffalo Bills: $1.60 billion
Valued at $5.0 billion, the Dallas Cowboys is the most valuable professionalsports team in the United States.
50.4 Player SalariesThe NFL team salary cap has been as follows:
• 2005: $ 85.5 million• 2006: $102.0 million• 2007: $109.0 million• 2008: $116.0 million• 2009: $123.0 million• 2010: uncapped• 2011: $120.0 million• 2012: $120.0 million• 2013: $123.0 million• 2014: $133.0 million• 2015: $143.0 million• 2016: $155.0 million• 2017: $167.0 million• 2018: $177.2 million
The highest salaries for the 2018-2019 NFL season were as follows:• Aaron Rodgers (Green Bay Packers): $33,500,000• Matt Ryan (Atlanta Falcons): $30,000,000• Kirk Cousins (Minnesota Vikings): $28,000,000• Jimmy Garoppolo (San Francisco 49ers): $27,500,000• Matthew Stafford (Detroit Lions): $27,000,000• Derek Carr (Oakland Raiders): $25,005,000• Drew Brees (New Orleans Saints): $25,000,000• Andrew Luck (Indianapolis Colts): $24,594,000• Alex Smith (Washington Redskins): $23,500,000• Khalil Mack (Chicago Bears): $23,500,000• Aaron Donald (Los Angeles Rams): $22,500,000• Joe Flacco (Baltimore Ravens): $22,133,333• Russell Wilson (Seattle Seahawks): $21,900,000• Ben Roethlisberger (Pittsburgh Steelers): $21,850,000
SPORTS MARKETING 2020-2021
• 248 •

• Eli Manning (New York Giants): $21,000,000• Philip Rivers (Los Angeles Chargers): $20,812,500• Cam Newton (Carolina Panthers): $20,760,000• Tom Brady (New England Patriots): $20,500,000• Sam Bradford (Arizona Cardinals): $20,000,000• Ryan Tannehill (Miami Dolphins): $19,250,000
50.5 AttendanceThe NFL season includes 256 regular-season games, with 32 teams each
playing eight home games. Regular-season total and average game attendance hasbeen as follows: Total A verage
• 2005-2006: 17,012,453 66,455• 2006-2007: 17,340,879 67,738• 2007-2008: 17,345,205 67,755• 2008-2009: 17,055,982 66,625• 2009-2010: 16,651,126 65,043• 2010-2011: 17,141,760 66,960• 2011-2012: 17,243,648 67,358• 2012-2013: 17,303,296 67,591• 2013-2014: 17,510,656 68,401• 2014-2015: 17,606,643 68,776• 2015-2016: 17,510,312 68,400• 2016-2017: 17,788,671 69,483• 2017-2018: 17,253,425 67,396• 2018-2019: 17,177,581 67,100
Average attendance for home games during the 2018-2019 season for NFLteams was as follows: • Dallas Cowboys: 91,619• New York Jets: 77,982• Green Bay Packers: 77,834• New York Giants: 76,940• Denver Broncos: 76,446• Kansas City Chiefs: 75,972• Carolina Panthers: 73,772• New Orleans Saints: 73,051• Atlanta Falcons: 72,898• Los Angeles Rams: 72,429• Houston Texans: 71,804• Baltimore Ravens: 70,431• Philadelphia Eagles: 69,696• San Francisco 49ers: 69,148
SPORTS MARKETING 2020-2021
• 249 •

• Seattle Seahawks: 69,001• Minnesota Vikings: 66,811• Jacksonville Jaguars: 66,674• New England Patriots: 65,878• Cleveland Browns: 65,765• Miami Dolphins: 65,560• Buffalo Bills: 64,961• Tennessee Titans: 64,520• Pittsburgh Steelers: 63,456• Detroit Lions: 62,795• Arizona Cardinals: 62,013• Chicago Bears: 61,815• Washington Redskins: 61,028• Indianapolis Colts: 59,199• Oakland Raiders: 57,919• Tampa Bay Buccaneers: 54,356• Cincinnati Bengals: 50,753• Los Angeles Chargers: 32,768
50.6 SponsorsNFL sponsors for the 2018-2019 season were Anheuser-Busch, AWS,
Barclaycard, Bose Corporation, Bridgestone Americas, Campbell Soup Company,Castrol, Dairy Management Inc., Extreme Networks, FedEx Corporation, Ford,Frito-Lay, Inc., Gatorade, Intel, Intuit Turbotax, Lowes, Marriott International, Inc.,MARS Snackfood, Microsoft Corporation, Nationwide Mutual Insurance Group, NewsAmerica Marketing, PepsiCo, Pizza Hut, Procter & Gamble Co., Quaker OatsCompany, Sleep Number, Surface, The Dannon Company, USAA, Verizon Wireless,and VISA.
50.7 Television Broadcast RightsThe NFL has four broadcast rights contracts that net the league $4.95 billion
annually through 2022. These deals are as follows:Network Annual Rights Fee
• Monday Night Football Package: ESPN $1.9 billion• NFC Package: Fox Sports $1.1 billion• AFC Package: CBS $ 960 million• Sunday Night Football Package: NBC $ 950 million
The National Football League launched the NFL Network in 2003. The channelbroadcasts highlights, classic games, and other content from the more than 4,000
SPORTS MARKETING 2020-2021
• 250 •

hours of footage available in the NFL library. NFL Network also broadcasts ThursdayNight Football.
Average regular-season, prime-time viewership has been as follows: NBC SNF Fox CBS NBC/CBS/NFL Net TNF ESPN M NF
• 2012: 21.5 million 19.7 million 17.7 million 6.4 million 12.8 million• 2013: 21.7 million 21.2 million 18.7 million 7.1 million 13.7 million• 2014: 21.3 million 20.7 million 18.6 million 11.8 million 13.3 million• 2015: 22.5 million 20.7 million 19.1 million 12.4 million 12.9 million• 2016: 20.3 million 19.4 million 17.7 million 12.4 million 11.4 million• 2017: 18.2 million 17.6 million 15.6 million 14.3 million 10.7 million• 2018: 19.3 million 18.0 million 16.5 million 14.9 million 11.6 millionSNF: Sunday Night Football; TNF: Thursday Night Football; MNF: Monday Night Football
50.8 Franchise SalesRecent NFL team sales have been as follows:
Year Price
• Baltimore Ravens: 2004 $ 325 million for 49% stake• Minnesota Vikings: 2005 $ 600 million• Miami Dolphins: 2008 $1.00 billion for 95% stake• Cleveland Browns 2012 >$1.00 billion for 70% stake• Jacksonville Jaguars: 2012 $ 760 million• Buffalo Bills: 2014 $1.40 billion• Carolina Panthers: 2018 $2.30 billion
50.9 Super BowlThe Super Bowl is assessed in Chapter 46 of this handbook.
50.10 Pro Bowl GameThe NFL Pro Bowl Game is assessed in Chapter 33 of this handbook.
50.11 Fan DemographicsAccording to an ESPN Sports Poll, NFL fan distribution is as follows:
Gender• Male: 59%• Female: 41%
Age• 12-to-17: 12%• 18-to-24: 11%
SPORTS MARKETING 2020-2021
• 251 •

• 25-to-34: 19%• 35-to-44: 15%• 45-to-54: 20%• 55 and older: 22%
Ethnicity• Caucasian: 73%• African-American: 11%• Hispanic-American: 11%• Other: 5%
50.12 Fan LoyaltyBrand Keys (www.brandkeys.com) assessed fan loyalty for each NFL team.
The following teams were ranked highest in fan loyalty:1. New England Patriots2. Green Bay Packers3. Seattle Seahawks4. Denver Broncos5. Indianapolis Colts
50.13 Market ResourcesNational Football League, 345 Park Avenue, New York, NY 10054. (212) 450-2000.(www.nfl.com)
SPORTS MARKETING 2020-2021
• 252 •

51
NATIONAL HOCKEY LEAGUE
51.1 League RevenueNational Hockey League (NHL, www.nhl.com) revenue has been as follows:
• 2005-2006: $2.27 billion• 2006-2007: $2.44 billion• 2007-2008: $2.75 billion• 2008-2009: $2.82 billion• 2009-2010: $2.93 billion• 2010-2011: $3.09 billion• 2011-2012: $3.20 billion
• 2012-2013: $3.50 billion• 2013-2014: $3.70 billion• 2014-2015: $3.98 billion• 2015-2016: $4.10 billion• 2016-2017: $4.43 billion• 2017-2018: $4.86 billion
These figures include revenue from all sources, including admission,concessions, licensing, media rights, and sponsorship.
51.2 ArenasArenas and seating capacity for NHL teams are as follows:
Team Arena Capacity
• Anaheim Ducks: Honda Center 17,174• Arizona Coyotes: Gila River Arena (Glendale) 17,125• Boston Bruins: TD Garden 17,565• Buffalo Sabres: KeyBank Center 19,070• Calgary Flames: Scotiabank Saddledome 19,289• Carolina Hurricanes: PNC Arena (Raleigh) 18,680• Chicago Blackhawks: United Center 19,717• Colorado Avalanche: Pepsi Center (Denver) 18,007• Columbus Blue Jackets: Nationwide Arena 18,500• Dallas Stars: American Airlines Center 18,532• Detroit Red Wings: Little Caesars Arena 20,027• Edmonton Oilers: Rogers Place 18,641• Florida Panthers: BB&T Center (Sunrise) 19,250• Los Angeles Kings: Staples Center 18,230• Minnesota Wild: Xcel Energy Center (Saint Paul) 17,954• Montreal Canadiens: Bell Centre 21,288• Nashville Predators: Bridgestone Arena 17,113• New Jersey Devils: Prudential Center 16,514
SPORTS MARKETING 2020-2021
• 253 •

• New York Islanders: Barclays Center 15,795• New York Rangers: Madison Square Garden 18,006• Ottawa Senators: Canadian Tire Centre 18,694• Philadelphia Flyers: Wells Fargo Center 19,543• Pittsburgh Penguins: PPG Paints Arena 18,387• San Jose Sharks: SAP Center 17,562• St. Louis Blues: Enterprise Center 19,150• Tampa Bay Lightning: Amalie Arena 19,092• Toronto Maple Leafs: Scotiabank Arena 18,819• Vancouver Canucks: Rogers Arena 18,910• Vegas Golden Knights: T-Mobile Arena 17,368• Washington Capitals: Capital One Arena 18,506• Winnipeg Jets: Bell MTS Centre 15,294
51.3 Team ValuationsAccording to Forbes (December 2018), valuations of NHL teams are as follows:
• New York Rangers: $1.55 billion• Toronto Maple Leafs: $1.45 billion• Montreal Canadiens: $1.30 billion• Chicago Blackhawks: $1.05 billion• Boston Bruins: $ 925 million• Los Angeles Kings: $ 810 million• Philadelphia Flyers: $ 800 million• Detroit Red Wings: $ 775 million• Vancouver Canucks: $ 735 million• Washington Capitals: $ 725 million• Pittsburgh Penguins: $ 650 million• Vegas Golden Knights: $ 575 million• Edmonton Oilers: $ 540 million• Dallas Stars: $ 525 million• San Jose Sharks: $ 510 million• Minnesota Wild: $ 490 million• St Louis Blues: $ 465 million• Anaheim Ducks: $ 460 million• New Jersey Devils: $ 455 million• Calgary Flames: $ 450 million• Tampa Bay Lightning: $ 445 million• New York Islanders: $ 440 million• Ottawa Senators: $ 435 million• Colorado Avalanche: $ 430 million• Nashville Predators: $ 425 million• Carolina Hurricanes: $ 420 million• Winnipeg Jets: $ 415 million
SPORTS MARKETING 2020-2021
• 254 •

• Buffalo Sabres: $ 375 million• Columbus Blue Jackets: $ 320 million• Florida Panthers: $ 295 million• Arizona Coyotes: $ 290 million
51.4 Player SalariesThe NHL team salary cap has been as follows:
• 2005-2006: $39.0 million• 2006-2007: $44.0 million• 2007-2008: $50.3 million• 2008-2009: $56.7 million• 2009-2010: $56.8 million• 2010-2011: $59.4 million• 2011-2012: $64.3 million
• 2012-2013: $70.2 million• 2013-2014: $64.3 million• 2014-2015: $69.0 million• 2015-2016: $71.4 million• 2016-2017: $74.0 million• 2017-2018: $75.0 million• 2018-2019: $79.5 million
The team salary floor for the 2018-2019 season was $58.8 million. No playercould earn more than $15.9 million.
The highest salaries for the 2018-2019 NHL season were as follows:• John Tavares (Toronto Maple Leafs): $15,900,000• Carey Price (Montreal Canadiens): $15,000,000• Connor McDavid (Edmonton Oilers): $15,000,000• Jamie Benn (Dallas Stars): $13,000,000• Anze Kopitar (Los Angeles Kings): $12,000,000• Jonathan Toews (Chicago Blackhawks): $12,000,000• John Carlson (Washington Capitals): $12,000,000• Patrick Kane (Chicago Blackhawks): $12,000,000• Alex Ovechkin (Washington Capitals): $10,000,000• Brent Burns (San Jose Sharks): $10,000,000• Evgeny Kuznetsov (Washington Capitals): $10,000,000• Jack Eichel (Buffalo Sabres): $10,000,000• P.K. Subban (Nashville Predators): $10,000,000• Sidney Crosby (Pittsburgh Penguins): $10,000,000• Evgeni Malkin (Pittsburgh Penguins): $ 9,500,000• Steven Stamkos (Tampa Bay Lightning): $ 9,500,000• Jakub Voracek (Philadelphia Flyers): $ 9,250,000• Brent Seabrook (Chicago Blackhawks): $ 9,000,000• Claude Giroux (Philadelphia Flyers): $ 9,000,000• Corey Perry (Anaheim Ducks): $ 9,000,000• Evander Kane (San Jose Sharks): $ 9,000,000• Leon Draisaitl (Edmonton Oilers): $ 9,000,000• Ryan Suter (Minnesota Wild): $ 9,000,000
SPORTS MARKETING 2020-2021
• 255 •

51.5 AttendanceThe NHL season includes 1,230 regular-season games, with 30 teams each
playing 41 home games. Regular-season total and average game attendance hasbeen as follows: Total Average
• 2005-2006: 20,853,420 16,954• 2006-2007: 20,855,880 16,956• 2007-2008: 21,288,840 17,308• 2008-2009: 21,475,800 17,460• 2009-2010: 20,006,100 17,070• 2010-2011: 20,928,036 17,132• 2011-2012: 21,365,425 16,737• 2012-2013:* 12,758,849 17,721• 2013-2014: 21,632,479 17,587• 2014-2015: 21,528,192 17,502• 2015-2016: 21,451,041 17,482• 2016-2017: 21,545,024 17,516• 2017-2018: 22,174,362 17,446• 2018-2019: 22,186,851 17,456* Lockout-shortened season
Average attendance for home games during the 2018-2019 season for NHLteams was as follows: • Chicago Blackhawks: 22,734• Montreal Canadiens: 21,046• Philadelphia Flyers: 20,371• Toronto Maple Leafs: 19,276• Detroit Red Wings: 19,120• Tampa Bay Lightning: 19,092• Minnesota Wild: 18,907• Pittsburgh Penguins: 18,565• Washington Capitals: 18,508• Calgary Flames: 18,501• Edmonton Oilers: 18,347• Vegas Golden Knights: 18,318• Dallas Stars: 18,178• Vancouver Canucks: 18,022• Los Angeles Kings: 18,000• Buffalo Sabres: 17,908• Boston Bruins: 17,565• Nashville Predators: 17,445• St. Louis Blues: 17,361• New York Rangers: 17,318• San Jose Sharks: 17,266
SPORTS MARKETING 2020-2021
• 256 •

• Colorado Avalanche: 17,132• Anaheim Ducks: 16,814• Columbus Blue Jackets: 16,658• Winnipeg Jets: 15,276• New Jersey Devils: 14,834• Ottawa Senators: 14,553• Carolina Hurricanes: 14,322• Arizona Coyotes: 13,989• Florida Panthers: 13,261• New York Islanders: 12,442
51.6 SponsorsNHL Corporate Partners for the 2018-2019 season were as follows:
• Global Partners: adidas, Apple, EA Sports, O.R.G. Packaging, SAP• North American Partners: Bridgestone, Chemours, Coors Light, Enterprise, Federal-
Mogul, Honda, Kraft Heinz, Las Vegas Convention & Visitors Association, MGMResorts International, Molson, Pepsico, PPG, Ticketmaster, Travel Nation Hockey,Upper Deck
• Canada Partners: Canadian Tire, Danone, Esso, Kellogg’s, Reese, Kruger Products,Mitsubishi Heating and Cooling, Scotiabank, Tim Hortons, Visa
• USA Partners: Cigna, Dunkin’, Discover, Geico, FanDuel, Jägermeister, NavyFederal Credit Union, New Amsterdam Vodka
51.7 Television Broadcast RightsNBC broadcasts select regular-season NHL games. NHL games are broadcast
on NBC Sports Network. The broadcast rights deal, which runs 2012 to 2022, pays theNHL $200 million per year.
The league launched the NHL Network in October 2007 with cable distributionthrough Comcast, Time Warner Cable, Cox Communications, and CablevisionSystems, as well as satellite distribution thorough DirecTV and EchoStar, mostly ondedicated sports tiers.
Average viewership for regular season games on NBC Sports Network has beenas follows:• 2010-2011: 348,000• 2011-2012: 332,000• 2012-2013*: 392,000• 2013-2014: 351,000• 2014-2015: 349,000• 2015-2016: 378,000• 2016-2017: 336,000
SPORTS MARKETING 2020-2021
• 257 •

• 2017-2018: 302,000• 2018-2019: 313,000* Lockout-shortened season
51.8 Franchise SalesRecent NHL team sales are as follows:
Year Price
• Ottawa Senators: 2003 $ 110 million• Buffalo Sabres: 2003 $ 92 million• Atlanta Thrashers/Hawks: 2004 $ 250 million*• St. Louis Blues: 2006 $ 150 million• Nashville Predators: 2007 $ 193 million• Phoenix Coyotes: 2009 $ 140 million• Montreal Canadiens: 2009 $ 575 million**• Tampa Bay Lightening: 2010 $ 93 million• Atlanta Thrashers: 2011 $ 110 million• Toronto Maple Leafs: 2012 $1.30 billion***• Arizona Coyotes: 2014 $ 152 million• New York Islanders: 2014: $ 485 million• Arizona Coyotes: 2017: $ 240 million****• Carolina Hurricanes: 2018 $ 500 million****** total price for sale of NHL and NBA teams, which were sold together** includes Bell Centre Arena*** includes Maple Leaf Sports & Entertainment network**** valuation based on sale of 49% of franchise***** valuation based on sale of 52% of franchise
The Vegas Golden Knights, an expansion team, began play in the 2017-2018season. The owners paid the NHL a $500 million expansion fee.
51.9 Stanley CupThe Stanley Cup is assessed in Chapter 45 of this handbook.
51.10 All-Star GameThe NHL All-Star Game is assessed in Chapter 33 of this handbook.
51.11 Fan DemographicsAccording to an ESPN Sports Poll, NHL fan distribution is as follows:
SPORTS MARKETING 2020-2021
• 258 •

Gender• Male: 64%• Female: 36%
Age• 12-to-17: 13%• 18-to-24: 11%• 25-to-34: 18%• 35-to-44: 21%• 45-to-54: 20%• 55 and older: 17%
Race/Ethnicity• Caucasian: 78%• Hispanic-American: 9%• African-American: 8%• Other: 5%
51.12 Fan LoyaltyBrand Keys (www.brandkeys.com) assessed fan loyalty for each NHL team.
The following teams were ranked highest in fan loyalty:1. Pittsburgh Penguins2. Chicago Blackhawks3. (tie) St. Louis Blues3. (tie) Washington Capitals5. (tie) Boston Bruins5. (tie) New York Rangers
By the NHL’s count, there are some 53 million avid hockey fans in NorthAmerica.
51.13 Market ResourcesNational Hockey League, 1185 Avenue Of The Americas, New York, NY 10036.(212) 789-2000. (www.nhl.com)
SPORTS MARKETING 2020-2021
• 259 •

52
MAJOR LEAGUE SOCCER
52.1 OverviewMajor League Soccer (MLS; www.mlssoccer.com) launched in 1996. The
regular season runs March through October. Each MLS team plays 17 home games.
52.2 StadiumsMLS stadiums and capacity are as follows:
Stadium Capacity
• Atlanta United FC: Mercedes-Benz Stadium 40,000• Chicago Fire: SeatGeek Stadium (Bridgeview) 20,000• Colorado Rapids: Dick’s Sporting Goods Park
(Commerce City) 18,086• Columbus Crew SC: Mapfre Stadium 20,455• D.C. United: Audi Field 20,000• FC Cincinnati: Nippert Stadium 33,800• FC Dallas: Toyota Stadium (Frisco) 21,193• Houston Dynamo: BBVA Compass Stadium 22,039• LA Galaxy: Dignity Health Sports Park (Carson) 27,000• Los Angeles FC: Banc of California Stadium 22,000• Minnesota United FC: Alliance Field (Minneapolis) 19,400• Montreal Impact: Saputo Stadium 20,801• New England Revolution: Gillette Stadium (Foxborough) 22,385• New York City FC: Yankee Stadium (Bronx) 30,321• New York Red Bulls: Red Bull Arena (Harrison, NJ) 25,189• Orlando City SC: Orlando City Stadium 25,500• Philadelphia Union: Talen Energy Stadium (Chester) 18,500• Portland Timbers: Providence Park 21,144• Real Salt Lake: Rio Tinto Stadium (Sandy) 20,008• San Jose Earthquakes: Avaya Stadium 18,000• Seattle Sounders FC: CenturyLink Field 35,700• Sporting Kansas City: Children’s Mercy Park 18,467• Toronto FC: BMO Field 21,800• Vancouver Whitecaps FC: BC Place 22,120
SPORTS MARKETING 2020-2021
• 260 •

52.3 Team ValuationsForbes (November 2018) assesses the most valuable MLS teams as follows:
• Atlanta United: $330 million• LA Galaxy: $320 million• Seattle Sounders: $310 million• Los Angeles FC: $305 million• Toronto FC: $290 million• Portland Timbers: $280 million• New York City FC: $278 million• Orlando City SC: $275 million• Sporting Kansas City: $270 million• D.C. United: $265 million• New York Red Bulls: $250 million• Minnesota United: $248 million• Chicago Fire: $245 million• San Jose Earthquakes: $235 million• New England Revolution: $225 million• Houston Dynamo: $220 million• FC Dallas: $190 million• Philadelphia Union: $175 million• Real Salt Lake: $170 million• Montreal Impact: $168 million• Vancouver Whitecaps: $165 million• Columbus Crew: $160 million• Colorado Rapids: $155 million
52.4 Highest-Paid PlayersThe following were the highest-paid MLS players in 2018 (source: Forbes):
• Zlatan Ibrahimovic (LA Galaxy): $7,200,000• Michael Bradley (Toronto FC): $6,428,571• Jozy Altidore (Toronto FC): $6,332,250• Carlos Vela (Los Angeles FC): $6,300,000• Bastian Schwinsteiger (Chicago Fire): $5,600,000• Ignacio Pilatti (Montreal Impact): $5,600,000• Alejandro Pozuelo Melero (Toronto FC): $3,800,000• Wayne Rooney (DC United): $3,507,500• Josef Martinez (Atlanta United): $3,000,000
52.5 AttendanceRegular-season average game attendance has been as follows:
SPORTS MARKETING 2020-2021
• 261 •

• 1996: 17,406• 1997: 14,619 • 1998: 14,312• 1999: 14,282• 2000: 13,756• 2001: 14,961• 2002: 15,882• 2003: 14,898• 2004: 15,559• 2005: 15,108• 2006: 15,390• 2007: 16,770
• 2008: 16,459• 2009: 16,120• 2010: 16,675• 2011: 17,872• 2012: 18,807• 2013: 18,611• 2014: 19,147• 2015: 21,558• 2016: 21,692• 2017: 22,113• 2018: 21,875
Average attendance for home games during the 2018 season for MLS teamswas as follows: • Atlanta United FC: 53,002• Seattle Sounders FC: 40,641• Toronto FC: 26,628• LA Galaxy: 24,444• Minnesota United FC: 23,902• Orlando City SC: 23,866• New York City FC: 23,211• Los Angeles FC: 22,042• Vancouver Whitecaps FC: 21,946• Portland Timbers: 21,144• Sporting Kansas City: 19,950• San Jose Earthquakes: 19,032• Real Salt Lake: 18,605• New York Red Bulls: 18,601• Montreal Impact: 18,569• New England Revolution: 18,347• D.C. United: 17,635• Houston Dynamo: 16,906• Philadelphia Union: 16,518• FC Dallas: 15,512• Colorado Rapids: 15,333• Chicago Fire: 14,806• Columbus Crew: 12,447
52.6 SponsorsOfficial sponsors of MLS for 2019 were adidas, Advocare, Alcatel, Allstate,
AT&T, Audi, Coca-Cola, Continental Tire, EA Sports, Etihad Airways, Heineken, JLAB
SPORTS MARKETING 2020-2021
• 262 •

Audio, Johnson & Johnson, Kellogg’s, SeatGeek, Southern New Hampshire University,TAGHeuer, Target, The Home Depot, Trivento, and Wells Fargo.
52.7 Television Broadcast RightsMLS has eight-year broadcast rights agreements, 2015 through 2022, with
ESPN, Fox Sports, and Univision (in Spanish). ESPN and Fox Sports pay a combined$75 million per season, and Univision’s Unimas pays $15 million per-season. Thecurrent rights agreements are more than five times the value of the league’s 2006-2014deals. Rights include digital as well as television.
The league’s MLS Direct Kick Package, which broadcasts out-of-marketmatches, has been expanded to air every league match which is not televised. MLSNET.com offers streaming of live video of some matches.
52.8 Fan DemographicsAccording to an ESPN Sports Poll, MLS fan distribution is as follows:
Gender• Male: 61%• Female: 39%
Ethnicity• Caucasian: 61%• Hispanic-American: 23%• African-American: 9%• Other: 7%
52.9 Market ResourcesMajor League Soccer, 420 Fifth Avenue, 7th Floor, New York, NY 10018. (212) 450-1200. (www.mlssoccer.com)
SPORTS MARKETING 2020-2021
• 263 •

53
PREMIER LEAGUE
53.1 OverviewThe Premier League (www.premierleague.com), based in England and referred
to as the English Premier League (EPL) outside of the country, is the most-watchedprofessional sports league in the world and broadcasts in 212 territories to over 650million homes. There are 20 Premier League clubs; each hosts 19 home matches perseason, which runs from August to May.
Premier League soccer (referred to as football outside the U.S.) is gainingpopularity in North America. EPL matches are televised in the United States by NBC.
53.2 ClubsTotal attendance was 14,508,981 for the 380 games of the 2018-2019 Premier
League season. Average attendance has been as follows:
• 2010-2011: 35,273• 2011-2012: 34,601• 2012-2013: 35,921• 2013-2014: 36,631• 2014-2015: 36,176• 2015-2016: 36,452• 2016-2017: 35,822• 2017-2018: 38,274• 2018-2019: 38,182
Average home game attendance for the 2018-2019 season for Premier Leagueclubs was as follows:• Manchester United (Trafford, Greater Manchester): 74,498• Arsenal FC (London Borough of Islington): 59,899• West Ham United (London Borough of Newham): 58,336• Tottenham Hotspur (London Borough of Haringey): 54,216• Manchester City (Manchester): 54,130• Liverpool FC (Liverpool): 52,983• Newcastle United (Newcastle upon Tyne, Tyneside): 51,121• Chelsea FC (London Borough of Hammersmith and Fulham): 40,437• Everton FC (Liverpool): 38,780
SPORTS MARKETING 2020-2021
• 264 •

• Leicester City (Leicester): 31,851• Cardiff City (Cardiff, Wales): 31,413• Wolverhampton Wandereers (Wolverhampton, West Midlands): 31,030• Brighton & Hove Albion (Brighton): 30,426• Southampton FC (Southampton): 30,139• Crystal Palace (London Borough of Croydon): 25,455• Fulham FC (Fulham, London): 24,371• Huddersfield Town A.F.C. (Huddersfield, West Yorkshire): 23,201• Burnley FC (Burnley): 20,534• Watford FC (Watford, Hertfordshire): 20,016• AFC Bournemouth (Bournemouth, Dorset): 10,532
53.3 Team ValuationsForbes (May 2019) assesses the EPL clubs with the highest valuation as follows:
• Manchester United: $3.81 billion• Manchester City: $2.69 billion• Chelsea: $2.57 billion• Arsenal: $2.26 billion• Liverpool: $2.18 billion• Tottenham Hotspur: $1.62 billion• West Ham United: $ 616 million• Everton: $ 476 million• Newcastle United: $ 381 million
53.4 U.S. Broadcast RightsNBC networks have broadcast EPL games since the 2013-2014 season. In
2015, a six-year extension valued at $1 billion was announced, extending NBC Sportsbroadcast rights through the 2021-2022 season.
All 380 regular season matches are carried on NBC networks and digitalplatforms. NBC Sports broadcasts 154 matches on Saturday and Sunday morningsand on Monday afternoons. NBC broadcasts 20 Saturday afternoon matches. Matches are also broadcasted on USA Network and CNBC.
Premier League broadcast rights in Canada are jointly owned by Sportsnet andTSN, with each network holding rights to 190 matches per season.
SPORTS MARKETING 2020-2021
• 265 •

54
UEFA CHAMPIONS LEAGUE
54.1 OverviewUEFA Champions League is an annual soccer (referred to as football outside the
United States) competition among the top-division European clubs organized by theUnion of European Football Associations (UEFA, www.uefa.com). It is the mostprestigious club competition in European football, played by the national leaguechampion (and, for some nations, one or more runners-up) of each UEFA nationalassociation.
Several European clubs base their preseason in North America with participationin the International Champions Cup (see Chapter 122 of this handbook).
54.2 UEFA Champions League FinalThe UEFA Champions League final is the most-watched annual sporting event
worldwide.The 2018/19 UEFA Champions League final took place at Wanda Metropolitano
Stadium (Madrid, Spain), on June 1, 2019. Liverpool beat Tottenham Hotspur 2-0 inthe final. Attendance was 63,272.
In the U.S., the final averaged 2.9 million viewers across TNT, Univision, andUnivision Deportes Network combined.
An estimated global TV audience of 200 million in over 200 countries watchedthe match on TV.
54.3 2018/19 UEFA Champions League ParticipantsThirty-two (32) teams participate each season in the UEFA Champions League. A total of 22 teams automatically entered the 2018/19 UEFA Champions League
group stage with the 10 remaining slots taken by the 10 sides who qualified. Fifty-six(56) teams competed in the 2018/19 season qualifying rounds.
A country’s representation in the UEFA Champions League is determined by itsUEFA coefficient ranking at the start of the previous season, which is calculated over afive-year basis.
Ranked by coefficient, 2018/19 UEFA Champions League participants were asfollows:
SPORTS MARKETING 2020-2021
• 266 •

• Real Madrid CF (Spain)• FC Barcelona (Spain)• FC Bayern München (Germany)• Club Atlético de Madrid (Spain)• Juventus (Italy)• Manchester City FC (England)• Sevilla FC (Spain)• Paris Saint-Germain (France)• Arsenal FC (England)• FC Porto (Portugal)• Liverpool FC (England)• Chelsea FC (England)• Borussia Dortmund (Germany)• AS Roma (Italy)• SSC Napoli (Italy)• FC Shakhtar Donetsk (Ukraine)• Tottenham Hotspur (England)• Manchester United FC (England)• FC Zenit (Russia)• AFC Ajax (Netherlands)• SL Benfica (Portugal)• Villarreal CF (Spain)• FC Dynamo Kyiv (Ukraine)• FC Schalke 04 (Germany)• Besiktas JK (Turkey)• AS Monaco FC (France)• Olympique Lyonnais (France)• Bayer 04 Leverkusen (Germany)• FC Salzburg (Austria)• FC Basel 1893 (Switzerland)• Sporting Clube de Portugal (Portugal)• PFC CSKA Moskva (Russia)
54.4 Top TeamsForbes (May 2019) assesses the European football clubs with the highest
valuation as follows:• Real Madrid: $4.24 billion• Barcelona: $4.02 billion• Manchester United: $3.81 billion• Bayern Munich: $3.02 billion• Manchester City: $2.69 billion• Chelsea: $2.57 billion• Arsenal: $2.26 billion
SPORTS MARKETING 2020-2021
• 267 •

• Liverpool: $2.18 billion• Tottenham Hotspur: $1.62 billion• Juventus: $1.51 billion• Paris Saint-Germain: $1.09 billion• Atletico de Madrid: $ 953 million• Borussia Dortmund: $ 896 million• Schalke 04: $ 683 million• Inter Milan: $ 672 million• AS Roma: $ 622 million• West Ham United: $ 616 million• AC Milan: $ 583 million• Everton: $ 476 million• Newcastle United: $ 381 million
54.5 Top PlayersThe highest-paid European football players in 2019 were as follows (source:
Forbes): Salary Endorsements Total
• Lionel Messi (FC Barcelona): $92.0 million $35.0 million $127.0 million• Cristiano Ronaldo (Juventus): $65.0 million $44.0 million $109.0 million• Neymar Jr. (Paris Saint-Germain): $75.0 million $30.0 million $105.0 million• Paul Pogba (Manchester United): $29.0 million $ 4.0 million $ 33.0 million• Alexis Sánchez (Manchester United): $28.3 million $ 2.5 million $ 30.8 million• Kylian Mbappé (Paris Saint-Germain): $26.6 million $ 4.0 million $ 30.6 million• Mesut Özil (Arsenal): $23.7 million $ 6.5 million $ 30.2 million• Antoine Griezmann (Atlético Madrid): $23.2 million $ 4.5 million $ 27.7 million• Gareth Bale (Real Madrid): $20.6 million $ 6.5 million $ 27.1 million• Mohamed Salah (Liverpool): $16.1 million $ 9.0 million $ 25.1 million• Ángel Di María (Paris Saint-Germain): $21.7 million $ 2.0 million $ 23.7 million• Luis Suárez (Barcelona): $20.1 million $ 3.5 million $ 23.6 million• Sergio Agüero (Manchester City): $17.1 million $ 5.5 million $ 22.6 million• Thiago Silva (Paris Saint-Germain): $21.5 million $ 1.0 million $ 22.5 million• James Rodríguez (Bayern Munich): $16.3 million $ 4.5 million $ 22.1 million• Sergio Ramos (Real Madrid): $19.9 million $ 2.0 million $ 21.9 million• Gerard Piqué (Barcelona): $17.7 million $ 4.0 million $ 21.7 million
SPORTS MARKETING 2020-2021
• 268 •

55
MAJOR LEAGUE LACROSSE
55.1 OverviewMajor League Lacrosse (MLL, www.majorleaguelacrosse.com), which plays
games outdoors, launched its 19 th season in 2019.The season consists of a total of 63 regular-season games running from April to
August; each team plays seven home games.MLL decreased from nine to six teams for the 2019 season.
55.2 Teams And StadiumsTeams, stadiums, and seating capacity for MLL teams in 2019 were as follows:
Team Stadium Capacity
• Atlanta Blaze: Grady Stadium 10,500• Boston Cannons: Veterans Memorial Stadium (Quincy) 5,000• Chesapeake Bayhawks: Navy-Marine Corps Memorial Stadium
(Annapolis) 34,000• Dallas Rattlers: The Ford Center at The Star (Frisco) 12,000• Denver Outlaws: Broncos Stadium at Mile High 76,125• New York Lizards: James M. Shuart Stadium (Hempstead) 11,929
55.3 AttendanceRegular-season attendance has been as follows:
• 2006: 4,295• 2007: 4,429• 2008: 4,515• 2009: 5,557• 2010: 5,337• 2011: 6,417• 2012: 5,608
• 2013: 5,069• 2014: 4,757• 2015: 4,383• 2016: 4,268• 2017: 3,844• 2018: 3,619
55.4 Broadcast RightsMajor League Lacrosse partners with regional sports networks to televise games
nationally.
SPORTS MARKETING 2020-2021
• 269 •

In 2013, the MLL and YouTube agreed to an exclusive 15-game schedule; MLLshares ad revenue with YouTube.
ESPN3 streamed all regular-season games for the 2018 season.For the 2019 season, the league announced that 12 games would be broadcast
on Stadium and the network would air a weekly studio show.
55.5 SponsorsMLL sponsors for the 2019 season were ‘47 BRAND, Brine, Cascade,
Coca-Cola, Gotpro, Kinduct, Maverik, New Balance, Parkside Collectibles, PowellLacrosse, Powerade, Rocket Mesh, Source One Digital, String King Lacrosse, STX,Teamworks, Trilogy Lacrosse, True, and Warrior Lacrosse.
55.6 Market ResourcesMajor League Lacrosse, 20 Guest Street, Suite 125, Boston, MA 02135. (617) 746-2233. (www.majorleaguelacrosse.com)
SPORTS MARKETING 2020-2021
• 270 •

56
NATIONAL LACROSSE LEAGUE
56.1 OverviewThe National Lacrosse League (NLL, www.nll.com), which plays indoor games,
has been in existence since 1986. The season runs from January through April, witheach team playing nine home games. There were 13 franchises in the 2019 season.
56.2 ArenasArenas and seating capacity for NLL teams are as follows:
Team Arena Capacity
• Buffalo Bandits: KeyBank Center 19,070• Calgary Roughnecks: Scotiabank Saddledome 19,289• Colorado Mammoth: Pepsi Center (Denver) 18,007• Georgia Swarm: Infinite Energy Arena (Duluth) 11,355• Halifax Thunderbirds: Scotiabank Centre 10,595• New England Black Wolves: Mohegan Sun Arena (Uncasville, CT) 7,700• New York Riptide: Nassau Veterans Memorial Coliseum 13,917• Philadelphia Wings Wells Fargo Center 19,543• Rochester Knighthawks: Blue Cross Arena 10,664 • San Diego Seals: Pechanga Arena 12,920• Saskatchewan Rush: SaskTel Centre (Saskatoon) 15,100• Toronto Rock: Scotiabank Arena 18,819 • Vancouver Stealth: Rogers Arena 18,910
56.3 AttendanceNLL average regular-season game attendance has been as follows:
• 2003: 8,757• 2004: 9,885• 2005: 10,237• 2006: 10,703• 2007: 10,293• 2008: 10,475• 2009: 10,018• 2010: 9,559• 2011: 9,722
• 2012: 9,468• 2013: 9,663• 2014: 9,430• 2015: 8,970• 2016: 9,152• 2017: 9,454• 2018: 9,411• 2019: 9,596
SPORTS MARKETING 2020-2021
• 271 •

By team, average regular-season attendance for the 2019 season was asfollows:• Saskatchewan Rush: 13,459• Buffalo Bandits: 13,046• Colorado Mammoth: 12,815• Calgary Roughnecks: 12,593• Philadelphia Wings: 10,905• Toronto Rock: 9,476• San Diego Seals: 7,769• Vancouver Stealth: 6,833• Georgia Swarm: 6,698• Rochester Knighthawks: 6,440• New England Black Wolves: 5,526
56.4 Broadcast RightsSince the 2012 season, CBS Sports Network has broadcast NLL games
beginning with the All-Star Game, followed by six weekly games and two playoff games,including the championship game.
In 2013, NLL entered into an agreement with YouTube to stream all games. NLL handles production of the games and has a revenue-share agreement withYouTube for advertising sold. NLL had previously streamed games at NLL.com.
Regional sports networks also provide some coverage of individual teams.
56.5 SponsorsNLL sponsors for the 2019 season were Covo Drinkware, Geico, Michelob Ultra,
New Era, Pointstreet Sports Technologies, Sports Interactive, Trans-Lux, UnderArmour, and Warrior.
56.6 Market ResourcesNational Lacrosse League, 53 West 36th Street, Suite 406, New York, NY 10018. (212) 764-1390. (www.nll.com)
SPORTS MARKETING 2020-2021
• 272 •

57
PREMIER LACROSSE LEAGUE
57.1 OverviewPremier Lacrosse League (PLL, www.premierlacrossleague.com) launched in
2019. The PLL features six teams, each with a 26-player roster. Games are playedoutdoors.
As opposed to tying teams to a specific market, the league tours major marketcities. The season has 14 weeks: 10 regular-season weekends, 1 all-star weekend,and 3 playoff weekends. Each regular season weekend has three games.
57.2 Inaugural SeasonThe 2019 season schedule was as follows:
• June 1-2: Boston, MA• June 8-9: New York, NY• June 15-16: Chicago, IL• June 22-23: Baltimore, MD• June 28-29: Atlanta, GA• July 6-7: Washington, DC• July 21: Los Angeles, CA• July 27-28: Denver, CO• August 10-11: San Jose, CA• August 17-18: Hamilton, ON, Canada• August 24-25: Albany, NY• September 6-7: Columbus, OH• September 14: New York, NY• September 21: Philadelphia, PA
57.3 TeamsThe 2019 season opened with six teams, as follows:
• Archers Lacrosse Club• Atlas Lacrosse Club• Chaos Lacrosse Club• Chrome Lacrosse Club• Redwoods Lacrosse Club• Whipsnakes Lacrosse Club
SPORTS MARKETING 2020-2021
• 273 •

57.4 MediaThe league has an exclusive media rights agreement with NBC Sports Group.
57.5 Sponsorsadidas is the exclusive footwear and apparel brand. Capital One Bank is the
official bank sponsor for the PLL; uniforms bear a Capital One logo patch.
SPORTS MARKETING 2020-2021
• 274 •

58
MAJOR LEAGUE RUGBY
58.1 OverviewMajor League Rugby (MLR, www.usmlr.com) launched in 2018 with seven
teams. Two teams were added in 2019 and three teams will join the league in 2020.The MLR season spans six months from late January through to mid June.
Each team plays sixteen games, half of them at home. The regular season is a doubleround-robin with all clubs playing each other home and away. This is followed by apost-season for the top four teams consisting of two semi-final matches and aChampionship Game.
58.2 Teams and StadiumsThe 2019 season opened with nine teams. Stadiums and seating capacity for
MLR teams are as follows:Stadium Capacity
• Austin Elite Dell Diamond 11,631• Glendale Raptors Infinity Park (Denver) 5,000• Houston SaberCats Aveva Stadium 4,000
Constellation Field 7,500• New Orleans Gold Eagle Athletic Facility 3,000• Rugby United New York MCU Park (Brooklyn) 7,000• San Diego Legion Torero Stadium 6,000• Seattle Seawolves Starfire Stadium 4,500• Toronto Arrows York Lions Stadium 3,700
Lamport Stadium 9.600• Utah Warriors Zions Bank Stadium (Salt Lake City) 5,000
58.3 Expansion TeamsThree teams will join MLR in 2020, as follows:
• Atlanta, GA (team not yet named)• Washington, DC (team not yet named)• New England Free Jacks (Boston, MA)
SPORTS MARKETING 2020-2021
• 275 •

58.4 Broadcast RightsCBS Sports Network televises 13 matches. This includes a Game of the Week
during each of the 10 rounds of the MLR regular season along with all threepost-season matches.
ESPN has the national and international rights to an 18-game package coveringregular season matches to audiences across its various platforms.
AT&T Sports Networks have a 17-game package covering six of the seven MLRteams for games not broadcast on the CBS Sports Network.
Live streaming is available through the CBS Sports Network streaming platforms.The June 16, 2019, Championship Match was the first time a MLR game had
been broadcast on CBS; viewership was 510,000.
58.5 Market ResourcesMajor League Rugby, 125 Burton Avenue, Suite B, Salt Lake City, UT 84115.(323) 476-0016. (www.usmlr.com)
SPORTS MARKETING 2020-2021
• 276 •

59
CANADIAN FOOTBALL LEAGUE
59.1 OverviewThe Canadian Football League (CFL; French: Ligue canadienne de football,
LCF; www.cfl.ca), founded in 1958, is the largest professional sports league in Canada. The 20-week season runs from late June to early November; each team plays 18games.
Following the regular season, six teams compete in the league’s three-weekdivisional playoffs, which culminate in the late-November Grey Cup championship, thecountry’s largest annual sports and television event.
59.2 StadiumsStadiums and seating capacity for the nine CFL teams are as follows:
Stadium Capacity
• BC Lions: BC Place (Vancouver) 54,320• Calgary Stampeders: McMahon Stadium 35,400• Edmonton Eskimos: The Brick Field at
Commonwealth Stadium 56,302• Hamilton Tiger-Cats: Tim Hortons Field 24,390• Montreal Alouettes: Percival Molson Memorial Stadium 25,012• Ottawa Redblacks: TD Place Stadium 24,000• Saskatchewan Roughriders: Mosaic Stadium (Regina) 33,000• Toronto Argonauts: BMO Field 26,500• Winnipeg Blue Bombers: Investors Group Field 33,500
59.3 AttendanceTotal and per game average attendance for regular-season CFL games have
been as follows: Total Average
• 2008: 2,071,702 28,774• 2009: 2,049,392 28,464• 2010: 1,953,527 27,132• 2011: 1,999,256 27,767• 2012: 2,029,875 28,193• 2013: 1,944,349 27,005
SPORTS MARKETING 2020-2021
• 277 •

• 2014: 2,048,157 25,286• 2015: 2,003,714 24,737• 2016: 2,000,010 24,692• 2017: 1,996,150 24,644• 2018: 1,935,076 23,890
Regular-season average attendance in 2018, by team, was as follows:• Saskatchewan Roughriders: 32,762• Edmonton Eskimos: 32,435• Winnipeg Blue Bombers: 27,681• Calgary Stampeders: 27,381• Ottawa Redblacks: 24,523• Hamilton Tiger-Cats: 23,722• BC Lions: 19,858• Montreal Alouettes: 19,521• Toronto Argonauts: 13,913
59.4 Broadcast RightsTSN has held broadcast rights for CFL games, including the playoffs and Grey
Cup, since 1985. TSN’s French-language network RDS broadcasts Montreal Alouettesgames for the Quebec television market. The current deal is worth about $16 millionannually and runs through 2018.
ESPN holds U.S. broadcasts rights. The current five-year deal runs through2019 and stipulates that at least 17 games are carried on ESPN2 (or another ESPNnetwork such as ESPN or ESPNEWS) each season. All other games are available onESPN3 for free viewing.
59.5 Market ResourcesCanadian Football League, 50 Wellington Street East, 3rd Floor, Toronto, ON M5E 1C8,Canada. (416) 322-9650. (www.cfl.ca)
SPORTS MARKETING 2020-2021
• 278 •

60
ARENA FOOTBALL LEAGUE
60.1 OverviewThe Arena Football League (AFL, www.arenafootball.com), an indoor football
league, launched in 1987 and played 22 seasons. From 2000 to 2009, AFL attendanceaveraged between 10,000 and 13,000. The league cancelled the 2009 season andfiled for Chapter 11 bankruptcy in July 2009. The league relaunched in February 2010.
Regular-season AFL games are played March through August. Following theregular season, four teams from each conference (the division winners and two WildCard teams) compete in the AFL Playoffs, an eight-team single-elimination tournamentthat culminates with the Arena Bowl.
60.2 Teams And StadiumsThe 2019 season opened with six teams, as follows:
Stadium Capacity
• Albany Empire: Times Union Center 15,500• Atlantic City Blackjacks: Boardwalk Hall 10,500• Baltimore Brigade: Royal Farms Arena 11,261• Columbus Destroyers: Nationwide Arena 18,500• Philadelphia Soul: Wells Fargo Center 17,597• Washington Valor: Capital One Arena 18,506
60.3 AttendanceSince the relaunch of the AFL, total and average game regular-season
attendance has been as follows:• 2010: 8,135• 2011: 8,241• 2012: 7,841• 2013: 8,195• 2014: 8,473
• 2015: 8,947• 2016: 9,342• 2017: 9,248• 2018: 7,601
60.4 Broadcast RightsESPN became an AFL broadcast partner in 2014, with weekly games being
shown on ESPN2. ESPN2 and ESPNEWS broadcast nine regular-season games and
SPORTS MARKETING 2020-2021
• 279 •

the conference championship. All regular-season AFL games are streamed on ESPN3for free viewing.
ESPN Deportes and ESPN Latin America started broadcasting AFL games inSpanish during the 2016 season.
60.5 Market ResourcesArena Football League, 8945 W. Post Road, Suite 210, Las Vegas, NV 89148.(702) 802-3905. (www.arenafootball.com)
SPORTS MARKETING 2020-2021
• 280 •

61
MINOR LEAGUE BASEBALL
61.1 OverviewMinor League Baseball (MiLB, www.milb.com) has experienced a renaissance
across the U.S. The key has been marketing good, old-fashioned summerentertainment at a reasonable price.
MiLB teams are affiliated with teams of Major League Baseball. Minor leagueteams retain revenues and pay operational expenses while the parent MLB teams payplayers’ salaries.
The affiliated baseball minor leagues are as follows:• Class AAA: International League, Pacific Coast League• Class AA: Eastern League, Southern League, Texas League• Class A Advanced: California League, Carolina League, Florida State League• Class A: Midwest League, New York-Penn League, Northwest League,
South Atlantic League• Rookie Advanced: Appalachian League, Pioneer League• Rookie: Arizona League, Dominican Summer League, Gulf Coast League
Information about teams is available at www.minorleaguebaseball.com. There are also independent leagues, as follows:
• American Association (www.americanassociationbaseball.com)• Atlantic League (www.atlanticleague.com)• CanAm League (www.canamleague.com)• Freedom Pro Baseball League (www.freedomprofessionalbaseballleague.com)• Frontier League (www.frontierleague.com)• Pacific Association (www.pacificproclubs.com)• Pecos League (www.pecosleague.com)• United Baseball League (www.unitedleaguebaseball.pointstreaksites.com)
61.2 Team ValuationsAccording to Forbes, valuations of MiLB teams are as follows:
• Sacramento River Cats (Pacific Coast League): $49.0 million• Charlotte Knights (International League): $47.5 million• Dayton Dragons (Midwest League): $45.0 million• Lehigh Valley IronPigs (International League): $43.0 million
SPORTS MARKETING 2020-2021
• 281 •

• Columbus Clippers (International League): $41.0 million• Round Rock Express (Pacific Coast League): $40.0 million• Durham Bulls (International League): $39.0 million• El Paso Chihauhuas (Pacific Coast League): $38.5 million• Indianapolis Indians (International League): $37.5 million• Frisco RoughRiders (Texas League): $37.0 million• Louisville Bats (International League): $36.0 million• Toledo Mud Hens (International League): $35.5 million• Birmingham Barons (Southern League): $35.0 million• Albuquerque Isotopes (Pacific Coast League): $34.0 million• Buffalo Bisons (International League): $34.0 million• Oklahoma City Dodgers (Pacific Coast League): $33.0 million• Fort Wayne TinCaps (Midwest League): $31.0 million• Salt Lake Bees (Pacific Coast League): $30.5 million• Nashville Sounds (Pacific Coast League): $30.5 million• Reading Fightin Phils (Eastern League): $30.0 million• Pawtucket Red Sox (International League): $30.0 million• Iowa Cubs (Pacific Coast League): $30.0 million• Richmond Flying Squirrels (Eastern League): $29.0 million• Tulsa Drillers (Texas League): $28.5 million• Corpus Christi Hooks (Texas League): $28.5 million• Scranton/Wilkes Barre Rail Riders (International League): $28.0 million• Rochester Red Wings (International League): $27.5 million• Jacksonville Suns (Southern League): $27.5 million• Omaha Storm Chasers (Pacific Coast League): $27.0 million• Trenton Thunder (Eastern League): $26.5 million
_________________________________________________________________
“Not so long ago, minor league baseball teams inmost regions of the country were available for asong, often less than $1 million. In some cases,they were acquired for nothing more than thewillingness to pull the prior owner out of a hole.”
SportsBusiness Journal _________________________________________________________________
SPORTS MARKETING 2020-2021
• 282 •

61.3 Attendance By LeagueIn total, there are 14 affiliated leagues with 160 teams. Minor League Baseball
affiliated teams drew 40,450,337 fans during the 2018 regular season.
_________________________________________________________________
“For the first time since 2004, Minor LeagueBaseball's attendance dipped below 41 million.There are a number of possible factors at playhere, including the reduction of scheduledgames across Double-A and Triple-A andincreasingly unseasonable extreme weatheracross large swaths of the country.”
BaseballAmerica.com, 9/23/18 _________________________________________________________________
Attendance by league in 2018 was as follows: Teams Games Total Average
• International League (AAA): 14 936 6,560,116 7,082• Pacific Coast League (AAA): 16 1,087 6,921,810 6,368• Eastern League (AA): 12 786 3,767,671 4,793• Southern League (AA): 10 665 2,261,834 3,401• Texas League (AA): 8 541 2,677,297 4,949• California League (A): 8 559 1,341,157 2,399• Carolina League (A): 10 654 1,901,228 2,907• Florida State League (A): 12 762 1,027,241 1,348• Midwest League (A): 16 1,061 3,937,721 3,711• South Atlantic League (A): 14 885 2,907,297 3,285• New York-Penn League (A): 14 509 1,391,016 2,733• Northwest League (A): 8 303 1,089,930 3,597• Appalachian League (Rookie): 10 314 389,180 1,239• Pioneer League (Rookie): 8 292 604,337 2,070
61.4 Top Team AttendanceAmong the 160 affiliated minor league teams, the following had the highest
attendance in 2018 (source: BaseballAmerica.com): Total Average
• Charlotte Knights: 619,639 8,980• Indianapolis Indians: 619,122 8,845
SPORTS MARKETING 2020-2021
• 283 •

• Round Rock Express: 616,636 8,809• Nashville Sounds: 603,135 8,741• Columbus Clippers: 587,067 8,633• Lehigh Valley IronPigs: 561,745 8,511• Albuquerque Isotopes: 556,330 7,948• Dayton Dragons: 550,725 7,868• El Paso Chihuahuas: 539,520 7,819• Sacramento River Cats: 538,785 7,808• Durham Bulls: 536,304 7,661• Buffalo Bisons: 527,988 8,250• Toledo Mud Hens: 507,965 7,362• Salt Lake Bees: 477,528 6,921• Frisco RoughRiders: 468,259 6,886• Louisville Bats: 466,026 6,658• Iowa Cubs: 463,399 7,356• Oklahoma City Dodgers: 463,195 6,713• Rochester Red Wings: 437,974 6,537• Hartford Yard Goats: 408,942 6,014• Fresno Grizzlies: 405,403 6,051• Richmond Flying Squirrels: 396,686 6,198• Pawtucket Red Sox: 394,811 5,982• Birmingham Barons: 391,061 5,751• Reading Fightin Phils: 388,510 5,713• Scranton Wilkes-Barre RailRiders: 386,819 6,140• West Michigan Whitecaps: 386,609 5,770• Fort Wayne TinCaps: 376,422 5,703• Tacoma Rainiers: 372,780 5,403• Reno Aces: 351,298 5,019• Trenton Thunder: 351,297 5,019• Tulsa Drillers: 350,396 5,230• Kane County Cougars: 350,028 5,469• Portland Sea Dogs: 346,341 5,678• Omaha Storm Chasers: 345,830 5,320• Akron RubberDucks: 344,754 4,996• South Bend Cubs: 343,763 4,911• Norfolk Tides: 341,369 5,334• Corpus Christi Hooks: 340,607 4,866• Memphis Redbirds: 340,476 5,007• Las Vegas 51s: 332,224 4,746• San Antonio Missions: 327,276 4,885• Springfield Cardinals: 326,362 4,871• Greensboro Grasshoppers: 322,156 4,881• New Hampshire Fisher Cats: 319,099 5,065• Jacksonville Jumbo Shrimp: 317,335 5,037
SPORTS MARKETING 2020-2021
• 284 •

• Lansing Lugnuts: 313,592 4,612• Greenville Drive: 313,507 4,823• Tennessee Smokies: 308,069 4,668• Charleston RiverDogs: 305,040 4,486
61.5 SponsorsMinor League Baseball sponsors for the 2019 season were Allegiant Airlines,
Applegate, Bush’s Beans, Echo Outdoor Power Equipment, FIS, Guardian Protection,ISM Connect, Peerless, Terminex, and Tickets.com.
61.6 Market ResourcesMinor League Baseball, 9550 16 th Street N., St. Petersburg, FL 33716. (727) 822-6937. (www.milb.com)
SPORTS MARKETING 2020-2021
• 285 •
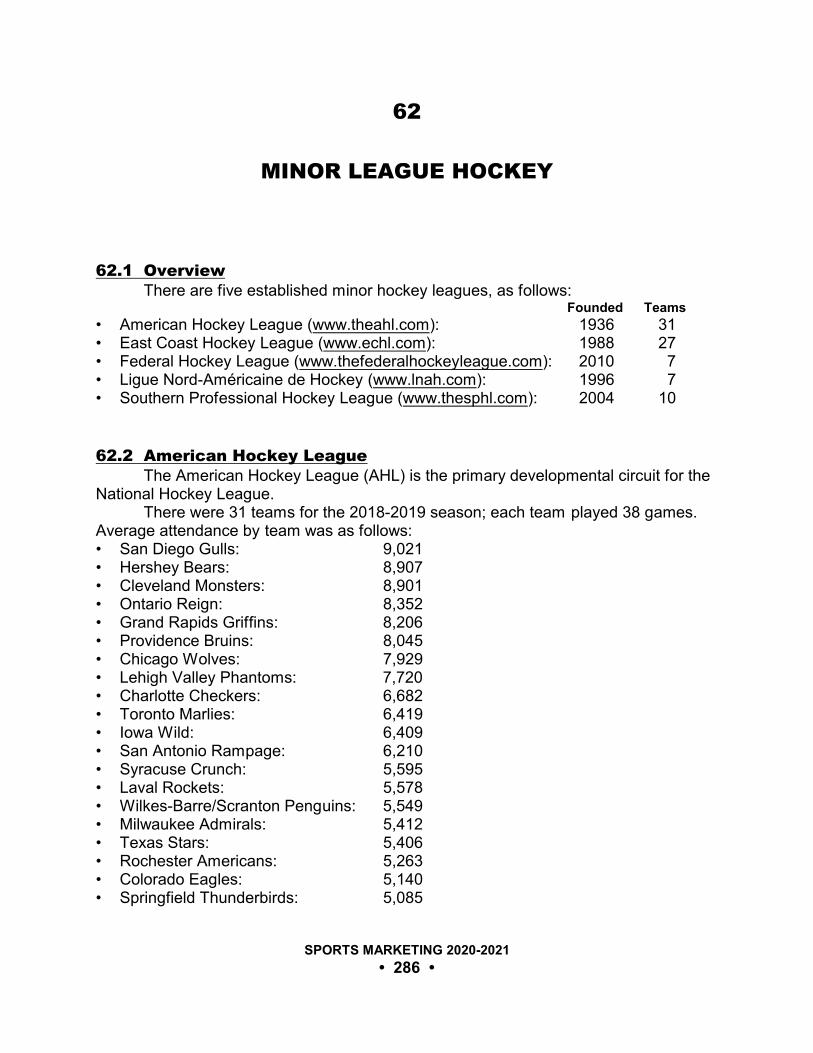
62
MINOR LEAGUE HOCKEY
62.1 OverviewThere are five established minor hockey leagues, as follows:
Founded Teams
• American Hockey League (www.theahl.com): 1936 31• East Coast Hockey League (www.echl.com): 1988 27• Federal Hockey League (www.thefederalhockeyleague.com): 2010 7• Ligue Nord-Américaine de Hockey (www.lnah.com): 1996 7• Southern Professional Hockey League (www.thesphl.com): 2004 10
62.2 American Hockey LeagueThe American Hockey League (AHL) is the primary developmental circuit for the
National Hockey League. There were 31 teams for the 2018-2019 season; each team played 38 games.
Average attendance by team was as follows:• San Diego Gulls: 9,021• Hershey Bears: 8,907• Cleveland Monsters: 8,901• Ontario Reign: 8,352• Grand Rapids Griffins: 8,206• Providence Bruins: 8,045• Chicago Wolves: 7,929• Lehigh Valley Phantoms: 7,720• Charlotte Checkers: 6,682• Toronto Marlies: 6,419• Iowa Wild: 6,409• San Antonio Rampage: 6,210• Syracuse Crunch: 5,595• Laval Rockets: 5,578• Wilkes-Barre/Scranton Penguins: 5,549• Milwaukee Admirals: 5,412• Texas Stars: 5,406• Rochester Americans: 5,263• Colorado Eagles: 5,140• Springfield Thunderbirds: 5,085
SPORTS MARKETING 2020-2021
• 286 •

• Bakersfield Condors: 5,034• Manitoba Moose: 4,722• Tucson Roadrunners: 4,294• Bridgeport Sound Tigers: 4,107• Hartford Wolf Pack: 3,942• Utica Comets: 3,917• Rockford IceHogs: 3,876• Stockton Heat: 3,690• San Jose Barracuda: 3,680• Binghamton Devils: 3,471• Belleville Senators: 3,067
62.3 East Coast Hockey LeagueThere were 27 East Coast Hockey League teams for the 2018-2019 season;
each team played 36 games. Average attendance by team was as follows:• Fort Wayne Komets: 7,932• Toledo Walleye: 7,783• Jacksonville Icemen: 5,993• Tulsa Oilers: 5,762• Wichita Thunder: 5,679• Orlando Solar Bears: 5,612• Florida Everblades: 5,586• Utah Grizzlies: 5,496• Cincinnati Cyclones: 5,068• Kansas City Mavericks: 4,859• Atlanta Gladiators: 4,686• Idaho Steelheads: 4,539• South Carolina Stingrays: 4,250• Westchester Railers: 4,233• Greenville Swamp Rabbits: 4,206• Indy Fuel: 4,156• Allen Americans: 4,073• Newfoundland Growlers: 3,784• Norfolk Admirals: 3,590• Adirondack Thunder: 3,409• Reading Royals: 3,166• Maine Mariners: 2,998• Rapid City Rush: 2,897• Brampton Beast: 2,816• Kalamazoo Wings: 2,720• Manchester Monarchs: 2,458• Wheeling Nailers: 2,265
SPORTS MARKETING 2020-2021
• 287 •

62.4 Market ResourcesAmerican Hockey League, One Monarch Place, Suite 2400, Springfield, MA 01144.(413) 495-1035. (www.theahl.com)
East Coast Hockey League, 116 Village Boulevard, Suite 230, Princeton, NJ 08540.(609) 452-0770. (www.echl.com)
SPORTS MARKETING 2020-2021
• 288 •

63
NBA G LEAGUE
63.1 OverviewThe NBA Development League, the NBA’s first official minor league, launched in
2001. Beginning with the 2017-2018 season, the Development League was renamedthe NBA Gatorade League (NBA G League; https://gleague.nba.com) as part of amultiyear expanded partnership. This marked the first time a U.S. professional sportsleague had named an entitlement partner.
A NBA G-League logo is featured on game balls, team jerseys, on-court signage,and digital properties. G-League teams also have assistance from the Gatorade SportsScience Institute in programs to enhance player sports performance and recovery.
The D-League had 29 teams for the 2019-2020 season, each affiliated with anNBA team.
63.2 Teams and NBA AffiliatesNBA G League teams and affiliates are as follows:
• Agua Caliente Clippers: Los Angeles Clippers• Austin Spurs: San Antonio Spurs• Canton Charge: Cleveland Cavaliers• Capital City Go-Go: Washington Wizards• College Park Skyhawks: Atlanta Hawks• Delaware Blue Coats: Philadelphia 76ers• Erie BayHawks: New Orleans Pelicans• Fort Wayne Mad Ants: Indiana Pacers• Grand Rapids Drive: Detroit Pistons• Greensboro Swarm: Charlotte Hornets• Iowa Wolves: Minnesota Timberwolves• Lakeland Magic: Orlando Magic• Long Island Nets: Brooklyn Nets• Maine Red Claws: Boston Celtics• Memphis Hustle: Memphis Grizzlies• Northern Arizona Suns: Phoenix Suns• Oklahoma City Blue: Oklahoma City Thunder• Raptors 905: Toronto Raptors• Rio Grande Valley Vipers: Houston Rockets• Salt Lake City Stars: Utah Jazz
SPORTS MARKETING 2020-2021
• 289 •
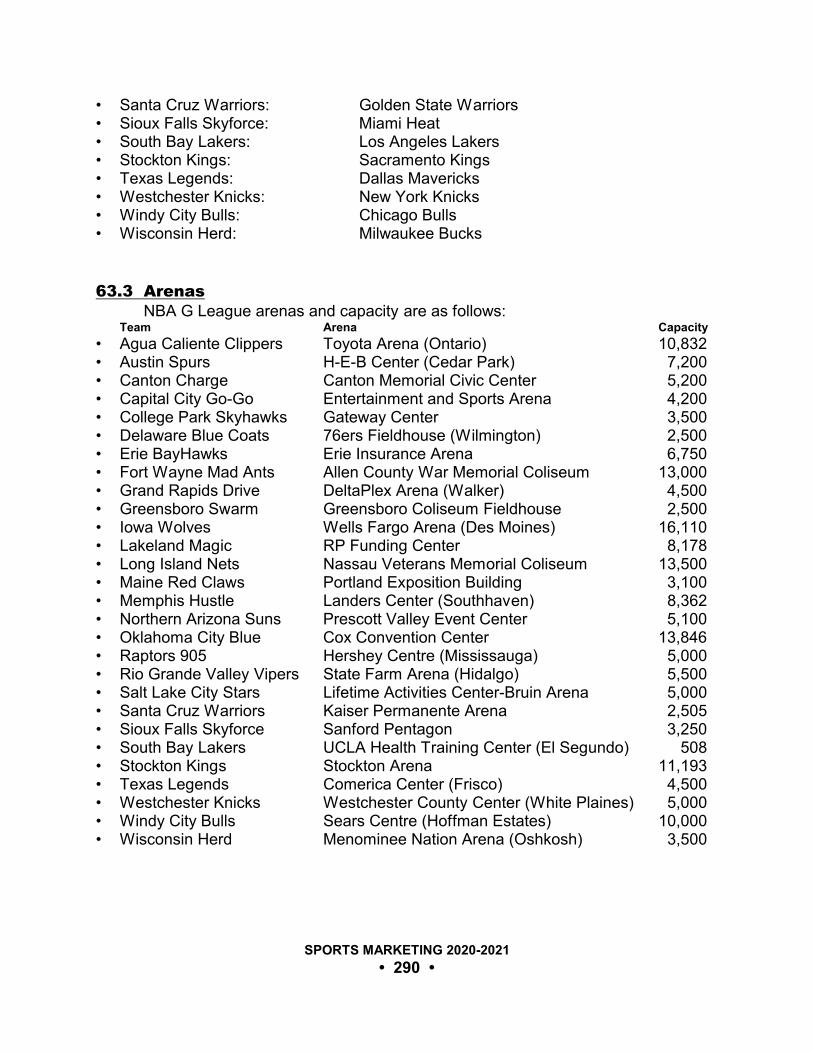
• Santa Cruz Warriors: Golden State Warriors• Sioux Falls Skyforce: Miami Heat• South Bay Lakers: Los Angeles Lakers• Stockton Kings: Sacramento Kings• Texas Legends: Dallas Mavericks• Westchester Knicks: New York Knicks• Windy City Bulls: Chicago Bulls• Wisconsin Herd: Milwaukee Bucks
63.3 ArenasNBA G League arenas and capacity are as follows:
Team Arena Capacity
• Agua Caliente Clippers Toyota Arena (Ontario) 10,832• Austin Spurs H-E-B Center (Cedar Park) 7,200• Canton Charge Canton Memorial Civic Center 5,200• Capital City Go-Go Entertainment and Sports Arena 4,200• College Park Skyhawks Gateway Center 3,500• Delaware Blue Coats 76ers Fieldhouse (Wilmington) 2,500• Erie BayHawks Erie Insurance Arena 6,750• Fort Wayne Mad Ants Allen County War Memorial Coliseum 13,000• Grand Rapids Drive DeltaPlex Arena (Walker) 4,500• Greensboro Swarm Greensboro Coliseum Fieldhouse 2,500• Iowa Wolves Wells Fargo Arena (Des Moines) 16,110• Lakeland Magic RP Funding Center 8,178• Long Island Nets Nassau Veterans Memorial Coliseum 13,500• Maine Red Claws Portland Exposition Building 3,100• Memphis Hustle Landers Center (Southhaven) 8,362• Northern Arizona Suns Prescott Valley Event Center 5,100• Oklahoma City Blue Cox Convention Center 13,846• Raptors 905 Hershey Centre (Mississauga) 5,000• Rio Grande Valley Vipers State Farm Arena (Hidalgo) 5,500• Salt Lake City Stars Lifetime Activities Center-Bruin Arena 5,000• Santa Cruz Warriors Kaiser Permanente Arena 2,505• Sioux Falls Skyforce Sanford Pentagon 3,250• South Bay Lakers UCLA Health Training Center (El Segundo) 508• Stockton Kings Stockton Arena 11,193• Texas Legends Comerica Center (Frisco) 4,500• Westchester Knicks Westchester County Center (White Plaines) 5,000• Windy City Bulls Sears Centre (Hoffman Estates) 10,000• Wisconsin Herd Menominee Nation Arena (Oshkosh) 3,500
SPORTS MARKETING 2020-2021
• 290 •

63.4 AttendanceThe 2018-2019 season marked the 10th straight year that total attendance
surpassed 1 million fans.Overall league attendance has been as follows:
• 2012-2013: 1,123,124• 2013-2014: 1,128,739• 2014-2015: 1,197,793• 2015-2016: 1,291,013
• 2016-2017: 1,410,902• 2017-2018: 1,616,656• 2018-2019: 1,644,603
_________________________________________________________________
“The league is boosting its gate by having someof its NBA parent clubs host G League games intheir home arenas.”
SportsBusiness Journal _________________________________________________________________
63.5 Media RightsAs part of a nine-year agreement that began with the 2016-2017 season, at least
20 NBA G League games will be aired on ESPN television networks each seasonthrough 2024-2025.
ESPN televised the entire NBA D-League 2018-2019 postseason, with theplayoffs and Finals airing on ESPNU and ESPNEWS.
NBA TV and YouTube combined to present more than 400 NBA D-Leaguegames, highlights, and short-form digital content during the 2018-2019 season.
SPORTS MARKETING 2020-2021
• 291 •

64
UNITED SOCCER LEAGUE
64.1 OverviewThe United Soccer League (USL, www.uslsoccer.com), a professional men’s
soccer league in the United States and Canada, launched in 2011 and has doubled insize since 2014. The league rebranded from USL Pro in 2015. Six teams were addedin 2016.
In 2013, USL and MLS agreed to integrate USL competition with the MLSReserve League, with the aim of improving player development in North America. Twenty (20) USL teams are affiliated with MLS teams.
The regular season consists of 34 games per team. The regular season runsMarch through September. The USL Cup follows the regular season.
64.2 AttendanceRegular-season total and average game attendance has been as follows:
Total Teams Average
• 2013: 464,723 13 2,611• 2014: 623,019 15 3,084• 2015: 1,121,962 24 3,369• 2016: 1,496,493 29 3,439• 2017: 2,061,159 30 4,294• 2018: 2,756,759 33 4,923
Average attendance for home games during the 2018 season for USL teamswas as follows: • FC Cincinnati: 25,717• Sacramento Republic FC: 11,311• Indy Eleven: 10,163• Nashville SC: 9,561• Louisville City FC: 7,891• Las Vegas Lights FC: 7,256• San Antonio FC: 6,939• Phoenix Rising FC: 6,381• Tampa Bay Rowdies: 5,553• Reno 1868 FC: 5,066• Fresno FC: 4,871• Ottawa Fury FC: 4,752
SPORTS MARKETING 2020-2021
• 292 •

• North Carolina FC: 4,730• Rio Grande Valley FC: 4,650• Oklahoma City Energy FC: 4,298• Richmond Kickers: 3,976• Saint Louis FC: 4,271• Seattle Sounders FC 2: 3,370• Colorado Springs Switchbacks FC: 3,295• Orange County SC: 3,095• Tulsa Roughnecks FC: 3,065• Charleston Battery: 2,872• Atlanta United 2: 2,598• Pittsburgh Riverhounds: 2,401• Penn FC: 2,147• Portland Timbers 2: 2,015• Bethlehem Steel FC: 2,347• Real Monarchs: 1,731• Charlotte Independence: 1,659• LA Galaxy II: 1,048• Toronto FC II: 810• Swope Park Rangers: 881• New York Red Bulls II: 812
_________________________________________________________________
“The league, now in its eighth season, has seenits profile improve recently largely due to thesuccess of Cincinnati and Sacramento, both ofwhich are competing for MLS expansion spotsand consistently top the league’s attendance.”
SportsBusiness Journal, 3/19/18 _________________________________________________________________
64.3 Media RightsThe United Soccer League has a media deal with ESPN. The championship
final game is broadcast on ESPN. There is additional exposure through ESPNU andESPN2 broadcasts during the regular season. All USL games are streamed onESPN+.
In 2017, the league made a $10 million investment to launch a centralizedbroadcast platform called USL Productions.
SPORTS MARKETING 2020-2021
• 293 •
USL matches are also broadcast on SiriusXM.
64.4 Market ResourcesUnited Soccer League, 1715 N. Westshore Boulevard, Suite 825, Tampa, FL 33607.(www.uslsoccer.com)
SPORTS MARKETING 2020-2021
• 294 •

PART VII: WOMEN’S LEAGUE SPORTS
SPORTS MARKETING 2020-2021
• 295 •

65
WOMEN’S NATIONAL BASKETBALL ASSOCIATION
65.1 OverviewThe Women’s National Basketball Association (WNBA, www.wnba.com) season
runs May (pre-season) through September, with each team playing 17 home games.
65.2 Teams And ArenasThe 2019 season began with 12 teams. Arenas and seating capacity for WNBA
teams are as follows:Team Arena Capacity
• Atlanta Dream State Farm Arena 18,118• Chicago Sky Wintrust Arena 10,387• Connecticut Sun Mohegan Sun Arena (Uncasville) 9,323• Dallas Wings College Park Center (Arlington) 7,000• Indiana Fever Bankers Life Fieldhouse (Indianapolis) 18,165• Las Vegas Aces Mandalay Bay Events Center (Paradise) 12,000• Los Angeles Sparks Staples Center 18,997• Minnesota Lynx Target Center (Minneapolis) 19,356• New York Liberty Westchester County Center 5,000• Phoenix Mercury Talking Stick Resort Arena 18,055• Seattle Storm Alaska Airlines Arena 10,000• Washington Mystics St. Elizabeth’s East Entertainment
and Sports Center 4,200
Several WNBA teams have NBA counterparts and play in the same arena.
65.3 AttendanceRegular-season average game attendance has been as follows (change from
previous season in parenthesis):• 1997: 9,669 (inaugural season)• 1998: 10,869 (12.4%)• 1999: 10,207 (-6.1%)• 2000: 9,072 (-11.1%)• 2001: 9,075 (no change)
• 2002: 9,228 (1.7%)• 2003: 8,800 (-4.3%)• 2004: 8,613 (-4.1%)• 2005: 8,172 (-4.5%)• 2006: 7,490 (-7.0%)
SPORTS MARKETING 2020-2021
• 296 •

• 2007: 7,750 (1.7%)• 2008: 7,948 (2.4%)• 2009: 8,039 (1.1%)• 2010: 7,834 (-2.6%)• 2011: 7,955 (1.5%)• 2012: 7,456 (-6.3%)
• 2013: 7,531 (1.0%)• 2014: 7,578 (0.6%)• 2015: 7,318 (-3.4%)• 2016: 7,655 (4.6%)• 2017: 7,716 (0.7%)• 2018: 6,168 (-12.2%)
Average regular-season attendance for home games during the 2018 season for WNBA teams was as follows: • Los Angeles Sparks: 10,642• Minnesota Lynx: 10,036• Phoenix Mercury: 9,950• Seattle Storm: 8,109• Connecticut Sun: 6,569• Chicago Sky: 6,358• Indiana Fever: 6,311• Washington Mystics: 6,136• Las Vegas Aces: 5,307• Dallas Wings: 4,752• Atlanta Dream: 4,194• New York Liberty: 2,823
65.4 SponsorsAT&T was the NBA Marquee Partner in 2019. WNBA marketing partners for the
2019 season were adidas, American Express, Anheuser-Busch InBev, EA Sports,ExxonMobil, FanDuel, Gatorade, Google, Jack Daniels, Kaiser Permanente, KIA, MGMResorts, Nike, Pepsico, Puma, SAP, Spalding, State Farm, Tissot, Under Armour, andYouTube TV.
WNBA team jersey sponsorships for the 2019 season were as follows:• Chicago Sky: Magellan Corporation, University of Chicago Medicine• Connecticut Sun: Mohegan Sun, Yale-New Haven Health System• Dallas Wings: Arlington Convention & Visitor Bureau, Texas Capital Bank• Indiana Fever: Salesforce.com• Las Vegas Aces: MGM Resorts International• Los Angeles Sparks: EquiTrust Life Insurance• Minnesota Lynx: Mayo Clinic, Sharecare• New York Liberty: Hospital for Special Surgery• Phoenix Mercury: Casino Arizona, PayPal, Talking Stick Resort• Seattle Storm: Swedish Medical Center, Symetra• Washington Mystics: GEICO
Atlanta Dream was the only team without a jersey sponsor for the 2019 season.
SPORTS MARKETING 2020-2021
• 297 •

In 2011, the WNBA signed a league-wide marquee sponsorship deal with BoostMobile that allows the Boost Mobile logo to be placed on teams’ jerseys in addition tobranding on the courts and in arenas.
65.5 Television Broadcast RightsWNBA games are televised by ABC, ESPN2, and NBA TV. The broadcast rights
deal with ESPN and ABC runs through the 2020 season. ABC broadcasts the f irstregular-season game and the All-Star game; other games are on ESPN2. ESPN paysthe WNBA $12 million annually for broadcast rights.
All teams have select games broadcast on local television. Coverage is asfollows:• Atlanta Dream: WSB-TV• Chicago Sky: WCIU, The U Too• Connecticut Sun: NESN, WCCT-TV• Dallas Wings: Fox Sports Southwest• Indiana Feaver: Fox Sports Indiana, WISH, WNDY• Los Angeles Sparks: Spectrum SportsNet• Las Vegas Aces: KVMY• Minnesota Lynx: Fox Sports North• New York Liberty: YES• Phoenix Mercury: Fox Sports Arizona• Seattle Storm: KZJO• Washington Mystics: Monumental Sports Network, NBC Sports
Washington
WNBA LiveAccess, launched on WNBA.com in 2009, provides access to morethan 200 live game webcasts throughout the WNBA season. Every game except thosebroadcast on ABC, ESPN, or ESPN2 (which are available on ESPN3.com) is streamedand archived for on-demand viewing.
65.6 Fan DemographicsAccording to an ESPN Sports Poll, WNBA fan distribution is as follows:
Gender• Male: 60%• Female: 40%
Age• 12-to-17: 23%• 18-to-24: 25%• 25-to-34: 10%• 35-to-44: 12%
SPORTS MARKETING 2020-2021
• 298 •

• 45-to-54: 17%• 55 and older: 24%
65.7 Market ResourcesWomen’s National Basketball Association, 645 Fifth Avenue, New York, NY 10022. (www.wnba.com)
SPORTS MARKETING 2020-2021
• 299 •

66
LEGENDS FOOTBALL LEAGUE
66.1 OverviewThe Lingerie Football League, founded in 2009, was rebranded as the Legends
Football League (LFL, www.lflus.com) in 2013. LFL plays 7-on-7 tackle football. Games are played in the spring and summer at
NBA, NFL, NHL, and MLS arenas and stadiums. The season concludes with thechampionship game, where Eastern Conference and Western Conference winnerscompete for the Legends Cup.
The LFL, based in the United States, has two affiliated leagues: the five-teamLegends Football League Australia and the four-team Legends Football LeagueCanada.
66.2 2019 SeasonThe tenth LFL season opened April 5 and played through August 10, 2019,
with eight teams, as follows:Team Venue
• Atlanta Steam (Duluth, GA): Infinite Energy Arena• Austin Acoustic (Cedar Park, TX): H-E-B Center• Chicago Bliss (Hoffman Estates, IL): Sears Centre• Denver Dream (Loveland, CO): Budweiser Events Center• Los Angeles Temptation (Ontario, CA): Citizens Business Bank Arena• Nashville Knights (Nashville, TN): Nashville Municipal Auditorium• Omaha Heart (Ralston, NE): Ralston Arena• Seattle Mist (Kent, WA): Accesso ShoWare Center
The Legends Cup was hosted by Accesso ShoWare Center (Kent, WA) andplayed September 7, 2019.
66.3 MediaSince 2013, LFL has aired games on a week-delayed basis on YouTube.Fuse became the exclusive broadcaster of LFL games in the U.S. in 2015.
Games are still uploaded to YouTube seven days after the broadcast.
SPORTS MARKETING 2020-2021
• 300 •

67
NATIONAL PRO FASTPITCH
67.1 OverviewNational Pro Fastpitch (NPF, www.profastpitch.com) is a women’s professional
softball league in the United States. There is no professional league for men. NPF launched in 2004 following the demise of its predecessor, the Women’s Pro
Softball League. NPF is an Official Developmental Partner of Major League Baseball. The NPF season is from June through August.
67.2 TeamsThe 2019 season opened with six teams, as follows:
Team Stadium
• Aussie Peppers (North Mankato, MN): Caswell Park Softball Complex• Beijing Eagles (traveling team) -• Canadian Wild (Marion, IL): Rent One Park• Chicago Bandits (Rosemont, IL): Rosemont Stadium• Cleveland Comets (traveling team) -• USSSA Pride (Viera, FL): Space Coast Stadium
67.3 MediaDuring the 2019 season, game content was shared on a variety of media
platforms, including NPFTV, ESPN+, ELEVEN Sports, B/R Live presented by Turner,Flo Sports, mlb.com, Olympic Channel, and others.
In the 2019 season, the entire slate of action, all 144 games plus theChampionship Series, streamed live on a myriad of digital platforms, including NPFTV,FloSoftball, and ESPN+.
67.4 SponsorsNPF sponsors for 2019 were Blast Motion, Boombah, Defiance Fuel, Diamond
Sports, Easton, FWV Sports & Entertainment, Marucci Sports, Park Planet, RapsodoSoftball, Rawlings, The Vigilance Group, Vaultz, and Wilson Sporting Goods Co.
SPORTS MARKETING 2020-2021
• 301 •

67.5 Market ResourcesNational Pro Fastpitch, 3350 Hobson Pike, Hermitage, TN 37076. (615) 232-2900.(www.profastpitch.com)
SPORTS MARKETING 2020-2021
• 302 •

68
NATIONAL WOMEN’S HOCKEY LEAGUE
68.1 OverviewThe National Women’s Hockey League (NWHL, www.nwhl.zone) launched in
March 2015. Dani Rylan is the league’s founder and commissioner.Prior to the formation of the NWHL, the Canadian Women’s Hockey League was
the only professional women’s hockey league in North America.Players were paid a minimum of $5,000 and there is an incentive program where
players from the home team split the revenue generated by tickets sold in excess of500 units per game.
The NWHL champion is awarded the Isobel Cup, named after Lady IsobelGathorne-Hardy.
68.2 2018-2019 SeasonThe 18-game season runs October through February. The fourth season was
played with five teams, as follows:Team Arena
• Boston Pride Warrior Ice Arena• Buffalo Beauts Harbor Center• Connecticut Whale (Danbury) Danbury Ice Arena• Metropolitan Riveters (Newark, NJ) Banrabas Health Hockey Center• Minnesota Whitecaps (Saint Paul) TRIA Rink
Attendance was about 750 per game.
68.3 MediaDuring the inaugural season, some games were shown on ESPN3. In 2016,
third-party broadcasts moved from ESPN3 to Cheddar, an Internet television channel.The 2018-2019 games were available on Cheddar, with games streamed live
and on demand via Sling TV, Amazon, Twitter, and Facebook Live. NWHL alsostreams and archives some games on its YouTube channel for free.
The NWHL has a broadcast partnership with Twitter for a Game of the Weekthat can be seen globally.
NESN broadcasts all Boston Pride home games.
SPORTS MARKETING 2020-2021
• 303 •

68.4 All-Star GameThe 2019 NWHL All-Star Game and weekend festivities took place on February
9-10, 2019, at Bridgestone Arena in Nashville, Tennessee. Attendance was 6,120, thelargest ever to watch a women’s professional hockey game in the U.S.
68.5 SponsorsDunkin’ was the first and only NWHL sponsor for the inaugural season. There were seven sponsors for the 2018-2019 season: Dunkin’, Legend Rings,
MeiGray Group, NYU Langone Health, SPARX, VEDA, and WISS.
SPORTS MARKETING 2020-2021
• 304 •
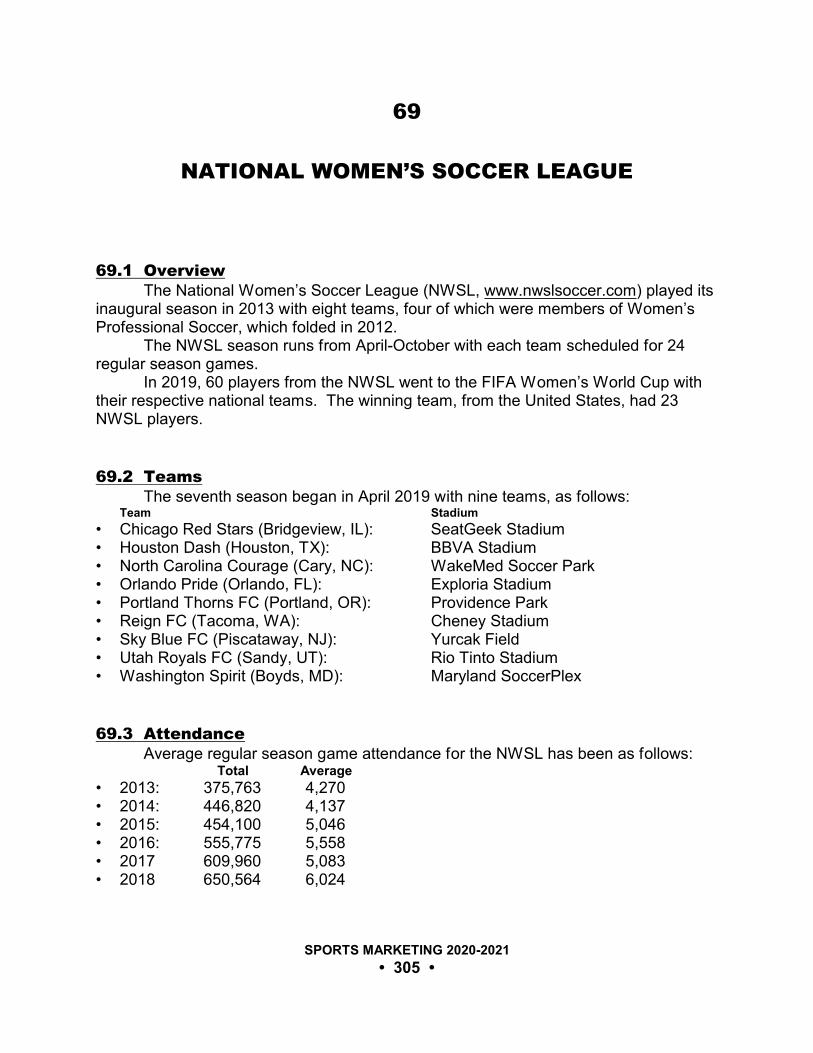
69
NATIONAL WOMEN’S SOCCER LEAGUE
69.1 OverviewThe National Women’s Soccer League (NWSL, www.nwslsoccer.com) played its
inaugural season in 2013 with eight teams, four of which were members of Women’sProfessional Soccer, which folded in 2012.
The NWSL season runs from April-October with each team scheduled for 24regular season games.
In 2019, 60 players from the NWSL went to the FIFA Women’s World Cup withtheir respective national teams. The winning team, from the United States, had 23NWSL players.
69.2 TeamsThe seventh season began in April 2019 with nine teams, as follows:
Team Stadium
• Chicago Red Stars (Bridgeview, IL): SeatGeek Stadium• Houston Dash (Houston, TX): BBVA Stadium• North Carolina Courage (Cary, NC): WakeMed Soccer Park• Orlando Pride (Orlando, FL): Exploria Stadium• Portland Thorns FC (Portland, OR): Providence Park• Reign FC (Tacoma, WA): Cheney Stadium• Sky Blue FC (Piscataway, NJ): Yurcak Field• Utah Royals FC (Sandy, UT): Rio Tinto Stadium• Washington Spirit (Boyds, MD): Maryland SoccerPlex
69.3 AttendanceAverage regular season game attendance for the NWSL has been as follows:
Total Average
• 2013: 375,763 4,270• 2014: 446,820 4,137• 2015: 454,100 5,046• 2016: 555,775 5,558• 2017 609,960 5,083• 2018 650,564 6,024
SPORTS MARKETING 2020-2021
• 305 •

Average attendance for home games during the 2018-2019 season for NWSLteams was as follows: • Portland Thorns FC: 16,959• Utah Royals FC: 9,466• North Carolina Courage: 5,129• Orlando Pride: 4,837• Chicago Red Stars: 4,368• Houston Dash: 3,896• Washington Spirit: 3,892• Seattle Reign FC: 3,824• Sky Blue FC: 2,531
69.4 Media RightsESPN had a 14-match package for the 2019 season including the semi-finals
and championship match. Broadcasts were divided among ESPNews and ESPN2.The Chicago Red Stars had a television deal for the 2019 season with the
regional sports network NBC Sports Chicago.Verizon Media is the U.S. digital rightsholder to the league, with streams on
Yahoo! Sports website and apps.Most NWSL games are available on YouTube and team websites.
69.5 SponsorsNWSL sponsors for the 2019 season were Budweiser, Cutter Insect Repellents,
Lifetime, Nike, and Thorne Research.
69.6 Market ResourcesNational Women’s Soccer League, 1556 S. Michigan Avenue, 2nd Floor, Chicago, IL60616. (312) 808-1300. (www.nwslsoccer.com)
SPORTS MARKETING 2020-2021
• 306 •

PART VIII: COLLEGIATE & HIGH SCHOOL SPORTS
SPORTS MARKETING 2020-2021
• 307 •

70
COLLEGE ATHLETIC PROGRAMS
70.1 Profiles of Major Programs
Alabama A&M University• Nickname: Bulldogs• Conference: Southwestern Athletic • Sports program website: www.aamusports.com
Alabama State University• Nickname: Hornets• Conference: Southwestern Athletic • Sports program website: www.bamastatesports.com
Alcorn State University• Nickname: Braves• Conference: Southwestern Athletic • Sports program website: www.alcornsports.com
American University• Nickname: Eagles• Conference: Patriot League • Sports program website: www.aueagles.com
Appalachian State University• Nickname: Mountaineers• Conference: Southern • Sports program website: www.goasu.com
Arizona State University• Nickname: Sun Devils• Conference: Pac-12 • Sports program website: www.thesundevils.com
Arkansas State University• Nickname: Red Wolves• Conference: Sun Belt • Sports program website: www.astateredwolves.com
SPORTS MARKETING 2020-2021
• 308 •

Auburn University• Nickname: Tigers• Conference: Southeastern • Sports program website: www.auburntigers.com
Austin Peay State University• Nickname: Governors• Conference: Ohio Valley • Sports program website: www.letsgopeay.com
Ball State University• Nickname: Cardinals• Conference: Mid-American • Sports program website: www.ballstatesports.com
Baylor University• Nickname: Bears• Conference: Big 12• Sports program website: www.baylorbears.com
Belmont University• Nickname: Bruins• Conference: Atlantic Sun• Sports program website: www.belmontbruins.com
Bethune-Cookman University• Nickname: Wildcats• Conference: Mid-Eastern Atlantic • Sports program website: www.b-cuathletics.com
Binghamton University• Nickname: Bearcats• Conference: America East• Sports program website: www.bubearcats.com
Boise State University• Nickname: Broncos• Conference: Western Athletic • Sports program website: www.broncosports.com
Boston College• Nickname: Eagles• Conference: Atlantic Coast• Sports program website: www.bceagles.com
SPORTS MARKETING 2020-2021
• 309 •

Boston University• Nickname: Terriers• Conference: Patriot• Sports program website: www.goterriers.com
Bowling Green State University• Nickname: Falcons• Conference: Mid-American • Sports program website: www.bgsufalcons.com
Bradley University• Nickname: Braves• Conference: Missouri Valley • Sports program website: www.bradleybraves.com
Brigham Young University• Nickname: Cougars• Conference: Mountain West • Sports program website: www.byucougars.com
Brown University• Nickname: Bears• Conference: Ivy League • Sports program website: www.brownbears.com
Bryant University• Nickname: Bulldogs• Conference: Northeast • Sports program website: www.bryantbulldogs.com
Bucknell University• Nickname: Bison• Conference: Patriot League • Sports program website: www.bucknellbison.com
Butler University• Nickname: Bulldogs• Conference: Horizon League • Sports program website: www.butlersports.com
California Polytechnic State University• Nickname: Mustangs• Conferences: Big West, Great West• Sports program website: www.gopoly.com
SPORTS MARKETING 2020-2021
• 310 •

California State University, Fullerton• Nickname: Titans• Conference: Big West• Sports program website: www.fullertontitans.com
California State University, Northridge• Nickname: Matadors• Conference: Big West• Sports program website: www.gomatadors.com
Campbell University• Nickname: Camels• Conference: Atlantic Sun• Sports program website: www.gocamels.com
Canisius College• Nickname: Golden Griffins• Conference: Metro Atlantic Athletic • Sports program website: www.gogriffs.com
Centenary College• Nickname: Gents and Ladies• Conference: The Summit League • Sports program website: www.gocentenary.com
Central Connecticut State University• Nickname: Blue Devils• Conference: Northeast • Sports program website: www.ccsubluedevils.com
Central Michigan University• Nickname: Chippewas• Conference: Mid-American • Sports program website: www.cmuchippewas.com
Charleston State University• Nickname: Buccaneers• Conference: Big South• Sports program website: www.csusports.com
Chicago State University• Nickname: Cougars• Conference: Great West • Sports program website: www.gocsucougars.com
SPORTS MARKETING 2020-2021
• 311 •

Clemson University• Nickname: Tigers• Conference: Atlantic Coast• Sports program website: www.clemsontigers.com
Cleveland State University• Nickname: Vikings• Conference: Horizon League • Sports program website: www.csuvikings.com
Coastal Carolina University• Nickname: Chanticleers• Conference: Big South• Sports program website: www.goccusports.com
Colgate University• Nickname: Raiders• Conference: Patriot League • Sports program website: www.gocolgateraiders.com
College of Charleston• Nickname: Cougars• Conference: Southern • Sports program website: www.cofcsports.com
College of the Holy Cross• Nickname: Crusaders• Conference: Patriot League • Sports program website: www.goholycross.com
College of William and Mary• Nickname: Tribe• Conference: Colonial Athletic Association• Sports program website: www.tribeathletics.com
Colorado State University• Nickname: Rams• Conference: Mountain West • Sports program website: www.csurams.com
Columbia University• Nickname: Lions• Conference: Ivy League • Sports program website: www.gocolumbialions.com
SPORTS MARKETING 2020-2021
• 312 •

Coppin State University• Nickname: Eagles• Conference: Mid-Eastern Atlantic • Sports program website: www.coppinstatesports.com
Cornell University• Nickname: Big Red• Conference: Ivy League • Sports program website: www.cornellbigred.com
Creighton University• Nickname: Bluejays• Conference: Missouri Valley • Sports program website: www.gocreighton.com
Dartmouth College• Nickname: Big Green• Conference: Ivy League • Sports program website: www.dartmouthsports.com
Davidson College• Nickname: Wildcats• Conference: Southern • Sports program website: www.davidsonwildcats.com
Delaware State University• Nickname: Hornets• Conference: Mid-Eastern Atlantic • Sports program website: www.dsuhornets.com
DePaul University• Nickname: Blue Deamons• Conference: Big East• Sports program website: www.depaulbluedeamons.com
Drake University• Nickname: Bulldogs• Conference: Missouri Valley • Sports program website: www.godrakebulldogs.com
Drexel University• Nickname: Dragons• Conference: Colonial Athletic Association• Sports program website: www.drexeldragons.com
SPORTS MARKETING 2020-2021
• 313 •

Duke University• Nickname: Blue Devils• Conference: Atlantic Coast• Sports program website: www.goduke.com
Duquesne University• Nickname: Dukes• Conference: Atlantic 10• Sports program website: www.goduquesne.com
Earlham College• Nickname: Quakers• Conference: NCAA• Sports program website: www.goearlham.com
East Carolina University• Nickname: Pirates• Conference: USA • Sports program website: www.ecupirates.com
East Tennessee State University• Nickname: Buccaneers• Conference: Atlantic Sun• Sports program website: www.etsubucks.com
Eastern Illinois University• Nickname: Panthers• Conference: Ohio Valley • Sports program website: www.eiupanthers.com
Eastern Kentucky University• Nickname: Colonels• Conference: Ohio Valley • Sports program website: www.ekusports.com
Eastern Michigan University• Nickname: Eagles• Conference: Mid-American • Sports program website: www.emueagles.com
Eastern Washington University• Nickname: Eagles• Conference: Big Sky• Sports program website: www.goeags.com
SPORTS MARKETING 2020-2021
• 314 •

Elon University• Nickname: Phoenix• Conference: Southern • Sports program website: www.elonphoenix.com
Fairfield University• Nickname: Stags• Conference: Metro Atlantic Athletic • Sports program website: www.fairfieldstags.com
Fairleigh Dickinson University• Nickname: Knights• Conference: Northeast • Sports program website: www.fduknights.com
Florida A&M University• Nickname: Rattlers• Conference: Mid-Eastern Atlantic • Sports program website: www.famuathletics.com
Florida Atlantic University• Nickname: Owls• Conference: Sun Belt • Sports program website: www.fausports.com
Florida Gulf Coast University• Nickname: Eagles• Conference: Atlantic Sun• Sports program website: www.fgcuathletics.com
Florida International University• Nickname: Golden Panthers• Conference: Sun Belt • Sports program website: www.fiusports.com
Florida State University• Nickname: Seminoles• Conference: Atlantic Coast• Sports program website: www.seminoles.com
Fordham University• Nickname: Rams• Conference: Atlantic 10• Sports program website: www.fordhamsports.com
SPORTS MARKETING 2020-2021
• 315 •

Fresno State University• Nickname: Bulldogs• Conference: Western Athletic • Sports program website: www.gobulldogs.com
Furman University• Nickname: Paladins• Conference: Southern • Sports program website: www.furmanpaladins.com
Gardner-Webb University• Nickname: Bulldogs• Conference: Big South• Sports program website: www.gwusports.com
George Mason University• Nickname: Patriots• Conference: Colonial Athletic Association• Sports program website: www.gomason.com
George Washington University• Nickname: Colonials• Conference: Atlantic 10• Sports program website: www.gwsports.com
Georgetown University• Nickname: Hoyas• Conference: Big East• Sports program website: www.guhoyas.collegesports.com
Georgia Institute of Technology• Nickname: Yellow Jackets• Conference: Atlantic Coast• Sports program website: www.ramblinwreck.com
Georgia Southern University• Nickname: Eagles• Conference: Southern • Sports program website: www.georgiasoutherneagles.com
Georgia State University• Nickname: Panthers• Conference: Sun Belt• Sports program website: www.georgiastatesports.com
SPORTS MARKETING 2020-2021
• 316 •

Gonzaga University• Nickname: Bulldogs• Conference: West Coast Conference • Sports program website: www.gozags.com
Grambling State University• Nickname: Tigers• Conference: Southwestern Athletic • Sports program website: www.gsutigers.com
Hampton University• Nickname: Pirates• Conference: Mid-Eastern Atlantic • Sports program website: www.hamptonpirates.com
Harvard University• Nickname: Crimson• Conference: Ivy League • Sports program website: www.gocrimson.com
High Point University• Nickname: Panthers• Conference: Big South• Sports program website: www.highpointpanthers.com
Hofstra University• Nickname: Pride• Conference: Colonial Athletic Association• Sports program website: www.gohofstra.com
Houston Baptist University• Nickname: Huskies• Conference: Southland• Sports program website: www.hbuhuskies.com
Howard University• Nickname: Bison• Conference: Mid-Eastern Atlantic • Sports program website: www.howard-bison.com
Idaho State University• Nickname: Bengals• Conference: Big Sky• Sports program website: www.isubengals.com
SPORTS MARKETING 2020-2021
• 317 •

Illinois State University• Nickname: Redbirds• Conference: Missouri Valley • Sports program website: www.goredbirds.com
Indiana State University• Nickname: Sycamores• Conference: Missouri Valley • Sports program website: www.gosycamores.com
Indiana University• Nickname: Hoosiers• Conference: Big Ten• Sports program website: www.iuhoosiers.com
Indiana University-Purdue University, Fort Wayne• Nickname: Mastodons• Conference: The Summit League • Sports program website: www.gomastodons.com
Indiana University-Purdue University, Indianapolis• Nickname: Jaguars• Conference: The Summit League • Sports program website: www.iupuijags.com
Iona College• Nickname: Gaels• Conference: Metro Atlantic Athletic • Sports program website: www.icgaels.com
Iowa State University• Nickname: Cyclones• Conference: Big 12• Sports program website: www.cyclones.com
Jackson State University• Nickname: Tigers• Conference: Southwestern Athletic • Sports program website: www.jsutigers.com
Jacksonville State University• Nickname: Gamecocks• Conference: Ohio Valley • Sports program website: www.jsugamecocksports.com
SPORTS MARKETING 2020-2021
• 318 •

Jacksonville University• Nickname: Dolphins• Conference: Atlantic Sun• Sports program website: www.judolphins.com
James Madison University• Nickname: Dukes• Conference: Colonial Athletic Association• Sports program website: www.jmusports.com
Kansas State University• Nickname: Wildcats• Conference: Big 12• Sports program website: www.k-statesports.com
Kennesaw State University• Nickname: Owls• Conference: Atlantic Sun• Sports program website: www.ksuowls.com
Kent State University• Nickname: Golden Flashes• Conference: Mid-American • Sports program website: www.kentstatesports.com
La Salle University• Nickname: Explorers• Conference: Atlantic 10• Sports program website: www.goexplorers.com
Lafayette College• Nickname: Leopards• Conference: Patriot League • Sports program website: www.goleopards.com
Lamar University• Nickname: Cardinals• Conference: Southland • Sports program website: www.lamarcardinals.com
Lehigh University• Nickname: Mountain Hawks• Conference: Patriot League • Sports program website: www.lehighsports.com
SPORTS MARKETING 2020-2021
• 319 •

Liberty University• Nickname: Flames• Conference: Big South• Sports program website: www.libertyflames.com
Lipscomb University• Nickname: Bisons• Conference: Atlantic Sun• Sports program website: www.lipscombsports.com
Long Beach State University• Nickname: 49ers• Conference: Big West• Sports program website: www.longbeachstate.com
Long Island University• Nickname: Blackbirds• Conference: Northeast • Sports program website: www.liuathletics.com
Louisiana State University• Nickname: Tigers• Conference: Southeastern • Sports program website: www.lsusports.com
Louisiana Tech University• Nickname: Bulldogs• Conference: Western Athletic • Sports program website: www.latechsports.com
Loyola College (Maryland)• Nickname: Greyhounds• Conference: Metro Atlantic Athletic • Sports program website: www.loyolagreyhounds.com
Loyola Marymount University• Nickname: Lions• Conference: West Coast Conference • Sports program website: www.lmulions.com
Loyola University (Chicago)• Nickname: Ramblers• Conference: Horizon League • Sports program website: www.loyolaramblers.com
SPORTS MARKETING 2020-2021
• 320 •

Manhattan College• Nickname: Jaspers• Conference: Metro Atlantic Athletic • Sports program website: www.gojaspers.com
Marist College• Nickname: Red Foxes• Conference: Metro Atlantic Athletic • Sports program website: www.goredfoxes.com
Marquette University• Nickname: Golden Eagles• Conference: Big East• Sports program website: www.gomarquette.com
Marshall University• Nickname: Thundering Herd• Conference: USA • Sports program website: www.herdzone.com
McNeese State University• Nickname: Cowboys• Conference: Southland • Sports program website: www.mcneesesports.com
Mercer University• Nickname: Bears• Conference: Pioneer• Sports program website: www.mercerbears.com
Miami University (Ohio)• Nickname: Redhawks• Conference: Mid-American • Sports program website: www.muredhawks.com
Michigan State University• Nickname: Spartans• Conference: Big Ten• Sports program website: www.msuspartans.com
Middle Tennessee State University• Nickname: Blue Raiders• Conference: Sun Belt • Sports program website: www.goblueraiders.com
SPORTS MARKETING 2020-2021
• 321 •

Mississippi State University• Nickname: Bulldogs• Conference: Southeastern • Sports program website: www.mstateathletics.com
Mississippi Valley State University• Nickname: Delta Devils• Conference: Southwestern Athletic • Sports program website: www.vsu/edu/athletics
Missouri State University• Nickname: Bears• Conference: Missouri Valley • Sports program website: www.missouristatebears.com
Monmouth University• Nickname: Hawks• Conference: Northeast • Sports program website: www.gomuhawks.com
Montana State University• Nickname: Bobcats• Conference: Big Sky• Sports program website: www.msubobcats.com
Morehead State University• Nickname: Eagles• Conference: Ohio Valley • Sports program website: www.msueagles.com
Morgan State University• Nickname: Bears• Conference: Mid-Eastern Atlantic • Sports program website: www.morganstatebears.com
Mount St. Mary’s University• Nickname: Mount• Conference: Northeast • Sports program website: www.mountathletics.com
Murray State University• Nickname: Racers• Conference: Ohio Valley • Sports program website: www.goracers.com
SPORTS MARKETING 2020-2021
• 322 •
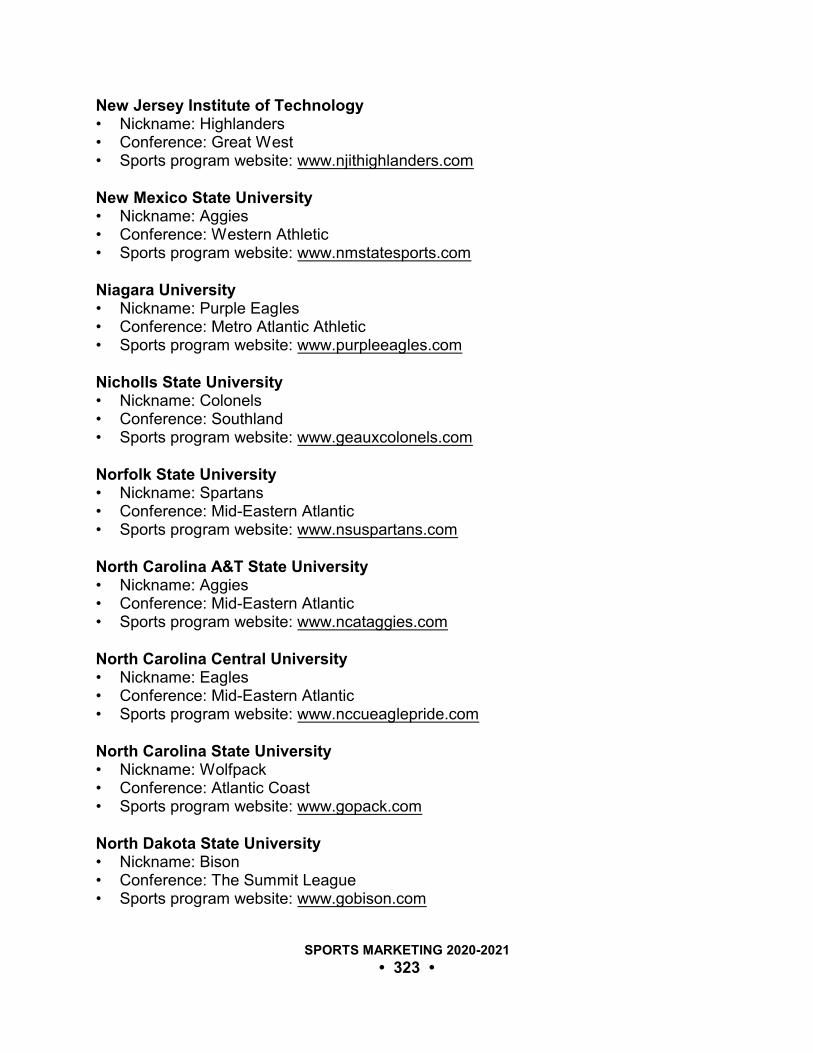
New Jersey Institute of Technology• Nickname: Highlanders• Conference: Great West • Sports program website: www.njithighlanders.com
New Mexico State University• Nickname: Aggies• Conference: Western Athletic • Sports program website: www.nmstatesports.com
Niagara University• Nickname: Purple Eagles• Conference: Metro Atlantic Athletic • Sports program website: www.purpleeagles.com
Nicholls State University• Nickname: Colonels• Conference: Southland • Sports program website: www.geauxcolonels.com
Norfolk State University• Nickname: Spartans• Conference: Mid-Eastern Atlantic • Sports program website: www.nsuspartans.com
North Carolina A&T State University• Nickname: Aggies• Conference: Mid-Eastern Atlantic • Sports program website: www.ncataggies.com
North Carolina Central University• Nickname: Eagles• Conference: Mid-Eastern Atlantic • Sports program website: www.nccueaglepride.com
North Carolina State University• Nickname: Wolfpack• Conference: Atlantic Coast• Sports program website: www.gopack.com
North Dakota State University• Nickname: Bison• Conference: The Summit League • Sports program website: www.gobison.com
SPORTS MARKETING 2020-2021
• 323 •

Northeastern University• Nickname: Huskies• Conference: Colonial Athletic Association• Sports program website: www.gonu.com
Northern Arizona University• Nickname: Lumberjacks• Conference: Big Sky• Sports program website: www.nauathletics.com
Northern Illinois University• Nickname: Huskies• Conference: Mid-American • Sports program website: www.niuhuskies.com
Northwestern State University• Nickname: Demons• Conference: Southland • Sports program website: www.nsudemons.com
Northwestern University• Nickname: Wildcats• Conference: Big Ten• Sports program website: www.nusports.com
Oakland University• Nickname: Golden Grizzlies• Conference: The Summit League • Sports program website: www.ourgrizzlies.com
Ohio State University• Nickname: Buckeyes• Conference: Big Ten• Sports program website: www.ohiostatebuckeyes.com
Ohio University• Nickname: Bobcats• Conference: Mid-American • Sports program website: www.ohiobobcats.com
Oklahoma State University• Nickname: Cowboys, Cowgirls• Conference: Big 12• Sports program website: www.okstate.com
SPORTS MARKETING 2020-2021
• 324 •

Old Dominion University• Nickname: Monarchs• Conference: Conference USA• Sports program website: www.odusports.com
Oral Roberts University• Nickname: Golden Eagles• Conference: The Summit League • Sports program website: www.orugoldeneagles.com
Oregon State University• Nickname: Beavers• Conference: Pac-12 • Sports program website: www.osubeavers.com
Pennsylvania State University• Nickname: Nittany Lions• Conference: Big Ten• Sports program website: www.gopsusports.com
Pepperdine University• Nickname: Waves• Conference: West Coast Conference • Sports program website: www.pepperdinesports.com
Portland State University• Nickname: Vikings• Conference: Big Sky• Sports program website: www.goviks.com
Prairie View A&M University• Nickname: Panthers• Conference: Southwestern Athletic • Sports program website: http://sports/pvamu.edu
Presbyterian College• Nickname: Blue Hose• Conference: Big South• Sports program website: www.gobluehose.com
Princeton University• Nickname: Tigers• Conference: Ivy League • Sports program website: www.goprincetontigers.com
SPORTS MARKETING 2020-2021
• 325 •

Providence College• Nickname: Friars• Conference: Big East• Sports program website: www.friars.com
Purdue University• Nickname: Boilermakers• Conference: Big Ten• Sports program website: www.purduesports.com
Quinnipiac University• Nickname: Bobcats• Conference: Northeast • Sports program website: www.quinnipiacbobcats.com
Radford University• Nickname: Highlanders• Conference: Big South• Sports program website: www.radfordathletics.com
Rice University• Nickname: Owls• Conference: USA • Sports program website: www.riceowls.com
Rider University• Nickname: Broncos• Conference: Metro Atlantic Athletic • Sports program website: www.gobroncos.com
Robert Morris University• Nickname: Colonials• Conferences: Northeast• Sports program website: www.rmucolonials.com
Rutgers University• Nickname: Scarlet Knights• Conference: Big East• Sports program website: www.scarletknight.com
Sacramento State University• Nickname: Hornets• Conference: Big Sky• Sports program website: www.hornetsports.com
SPORTS MARKETING 2020-2021
• 326 •

Sacred Heart University• Nickname: Pioneers• Conference: Northeast • Sports program website: www.sacredheartpioneers.com
Saint Bonaventure University• Nickname: Bonnies• Conference: Atlantic 10• Sports program website: www.gobonnies.com
Saint Francis College (New York)• Nickname: Terriers• Conference: Northeast • Sports program website: www.sfcathletics.com
Saint Francis University (Pennsylvania)• Nickname: Red Flash• Conference: Northeast • Sports program website: www.goredflash.com
Saint Joseph’s University• Nickname: Hawks• Conference: Atlantic 10• Sports program website: www.sjuhawks.com
Saint Louis University• Nickname: Billikens• Conference: Atlantic 10• Sports program website: www.slubillikens.com
Saint Mary’s College of California• Nickname: Gaels• Conference: West Coast Conference • Sports program website: www.smcgaels.com
Sam Houston State University• Nickname: Bearkats• Conference: Southland • Sports program website: www.gobearkats.com
Samford University• Nickname: Bulldogs• Conference: Southern • Sports program website: www.samfordsports.com
SPORTS MARKETING 2020-2021
• 327 •

San Diego State University• Nickname: Aztecs• Conference: Big West• Sports program website: www.goaztecs.com
San Jose State University• Nickname: Spartans• Conference: Western Athletic • Sports program website: www.sjsuspartams.com
Santa Clara University• Nickname: Broncos• Conference: West Coast Conference • Sports program website: www.santaclarabroncos.com
Savannah State University• Nickname: Tigers• Conference: Mid-Eastern Atlantic • Sports program website: www.ssuathletics.com
Seton Hall University• Nickname: Pirates• Conference: Big East• Sports program website: www.shupirates.com
Siena College• Nickname: Saints• Conference: Metro Atlantic Athletic • Sports program website: www.sienasaints.com
South Carolina State University• Nickname: Bulldogs• Conference: Mid-Eastern Atlantic • Sports program website: www.scsuathletics.com
South Dakota State University• Nickname: Jackrabbits• Conference: The Summit League • Sports program website: www.gojacks.com
Southeast Missouri State University• Nickname: Redhawks• Conference: Ohio Valley • Sports program website: www.gosoutheast.com
SPORTS MARKETING 2020-2021
• 328 •

Southeastern Louisiana University• Nickname: Lions• Conference: Southland • Sports program website: www.lionsports.net
Southern Illinois University• Nickname: Salukis• Conference: Missouri Valley • Sports program website: www.siusalukis.com
Southern Illinois University, Edwardsville• Nickname: Cougars• Conference: Ohio Valley • Sports program website: www.siuecougars.com
Southern Methodist University• Nickname: Mustangs• Conference: American Athletic• Sports program website: www.smumustangs.com
Southern University• Nickname: Jaguars• Conference: Southwestern Athletic • Sports program website: www.gojagsports.com
Southern Utah University• Nickname: Thunderbirds• Conferences: Great West, The Summit League• Sports program website: www.suutbirds.com
St. Johns University• Nickname: Red Storm• Conference: Big East• Sports program website: www.redstormsports.com
St. Peter’s College• Nickname: Peacocks• Conference: Metro Atlantic Athletic • Sports program website: www.spc.edu/athletics
Stanford University• Nickname: Cardinals• Conference: Pac-12 • Sports program website: www.gostanford.com
SPORTS MARKETING 2020-2021
• 329 •

Stephen F. Austin State University• Nickname: Lumberjacks• Conference: Southland • Sports program website: www.sfajacks.com
Stetson University• Nickname: Hatters• Conference: Pioneer• Sports program website: www.gohatters.com
Stony Brook University• Nickname: Seawolves• Conference: America East• Sports program website: www.goseawolves.org
Syracuse University• Nickname: Orange• Conference: Atlantic Coast• Sports program website: www.suathletics.com
Temple University• Nickname: Owls• Conference: Atlantic 10• Sports program website: www.owlsports.com
Tennessee State University• Nickname: Tigers• Conference: Ohio Valley • Sports program website: www.tsutigers.com
Tennessee Technological University• Nickname: Golden Eagles• Conference: Ohio Valley • Sports program website: www.ttusports.com
Texas A&M University• Nickname: Aggies• Conference: Big 12• Sports program website: www.aggieathletics.com
Texas A&M University, Corpus Christi• Nickname: Islanders• Conference: Southland • Sports program website: www.goislanders.com
SPORTS MARKETING 2020-2021
• 330 •

Texas Christian University• Nickname: Horned Frogs• Conference: Mountain West • Sports program website: www.gofrogs.com
Texas Southern University• Nickname: Tigers• Conference: Southwestern Athletic• Sports program website: www.tsu.edu/athletics
Texas State University• Nickname: Bobcats• Conference: Southland • Sports program website: www.txstatebobcats.com
Texas Tech University• Nickname: Red Raiders• Conference: Big 12• Sports program website: www.texastech.com
The Citadel• Nickname: Bulldogs• Conference: Southern • Sports program website: www.citadelsports.com
Towson University• Nickname: Tigers• Conference: Colonial Athletic Association• Sports program website: www.towsontigers.com
Troy University• Nickname: Trojans• Conference: Sun Belt • Sports program website: www.troytrojans.com
Tulane University• Nickname: Green Wave• Conference: USA • Sports program website: www.tulanegreenwave.com
U.S. Air Force Academy• Nickname: Falcons• Conference: Mountain West • Sports program website: www.goairforcefalcons.com
SPORTS MARKETING 2020-2021
• 331 •

U.S. Military Academy• Nickname: Black Knights• Conference: Patriot League • Sports program website: www.goarmysports.com
U.S. Naval Academy• Nickname: Midshipmen• Conference: Patriot League • Sports program website: www.navysports.com
University of Akron• Nickname: Zips• Conference: Mid-American • Sports program website: www.gozips.com
University of Alabama• Nickname: Crimson Tide• Conference: Southeastern • Sports program website: www.rolltide.com
University of Alabama, Birmingham• Nickname: Blazers• Conference: USA • Sports program website: www.uabsports.com
University of Albany• Nickname: Great Danes• Conference: America East• Sports program website: www.ualbanysports.com
University of Arizona• Nickname: Wildcats• Conference: Pac-12 • Sports program website: www.arizonaathletics.com
University of Arkansas• Nickname: Razorbacks• Conference: Southeastern • Sports program website: www.arkansasrazorbacks.com
University of Arkansas, Little Rock• Nickname: Trojans• Conference: Sun Belt • Sports program website: www.ualrtrojans.com
SPORTS MARKETING 2020-2021
• 332 •

University of Arkansas, Pine Bluff• Nickname: Golden Lions• Conference: Southwestern Athletic • Sports program website: www.uapblionsroar.com
University of Buffalo• Nickname: Bulls• Conference: Mid-American • Sports program website: www.buffalobulls.com
University of California, Berkeley• Nickname: Golden Bears• Conference: Pac-12 • Sports program website: www.calbears.com
University of California, Davis• Nickname: Aggies• Conference: Big West, Great West• Sports program website: www.ucdavisaggies.com
University of California, Irvine• Nickname: Anteaters• Conference: Big West• Sports program website: www.ucirvinesports.com
University of California, Los Angeles• Nickname: Bruins• Conference: Pac-12 • Sports program website: www.uclabruins.com
University of California, Riverside• Nickname: Highlanders• Conference: Big West• Sports program website: www.gohighlanders.com
University of California, Santa Barbara• Nickname: Gauchos• Conference: Big West• Sports program website: www.ucsbgauchos.com
University of Central Arkansas• Nickname: Bears• Conference: Southland • Sports program website: www.ucasports.com
SPORTS MARKETING 2020-2021
• 333 •

University of Central Florida• Nickname: Knights• Conference: American Athletic• Sports program website: www.ucfathletics.com
University of Cincinnati• Nickname: Bearcats• Conference: Big East• Sports program website: www.gobearcats.com
University of Colorado at Boulder• Nickname: Buffaloes• Conference: Big 12• Sports program website: www.cubuffs.com
University of Connecticut• Nickname: Huskies• Conference: Big East• Sports program website: www.uconnhuskies.com
University of Dayton• Nickname: Flyers• Conference: Atlantic 10• Sports program website: www.daytonflyers.com
University of Delaware• Nickname: Fightin’ Blue Hens• Conference: Colonial Athletic Association• Sports program website: www.bluehens.com
University of Denver• Nickname: Pioneers• Conference: Sun Belt • Sports program website: www.denverpioneers.com
University of Detroit Mercy• Nickname: Titans• Conference: Horizon League • Sports program website: www.detroittitans.com
University of Evansville• Nickname: Purple Aces• Conference: Missouri Valley • Sports program website: www.gopurpleaces.com
SPORTS MARKETING 2020-2021
• 334 •

University of Florida• Nickname: Gators• Conference: Southeastern • Sports program website: www.gatorzone.com
University of Georgia• Nickname: Bulldogs• Conference: Southeastern • Sports program website: www.georgiadogs.com
University of Hartford• Nickname: Hawks• Conference: America East• Sports program website: www.hartfordhawks.com
University of Hawaii• Nickname: Warriors• Conference: Western Athletic • Sports program website: www.hawaiiathletics.com
University of Houston• Nickname: Cougars• Conference: American Athletic• Sports program website: www.uhcougers.com
University of Idaho• Nickname: Vandals• Conference: Western Athletic • Sports program website: www.govandals.com
University of Illinois• Nickname: Fighting Illini• Conference: Big Ten• Sports program website: www.fightingillini.com
University of Illinois at Chicago• Nickname: Flames• Conference: Horizon League • Sports program website: www.uicflames.com
University of Iowa• Nickname: Hawkeyes• Conference: Big Ten• Sports program website: www.hawkeyesports.com
SPORTS MARKETING 2020-2021
• 335 •

University of Kansas• Nickname: Jayhawks• Conference: Big 12• Sports program website: www.kuathletics.com
University of Kentucky• Nickname: Wildcats• Conference: Southeastern • Sports program website: www.ukathletics.com
University of Louisiana, Lafayette• Nickname: Ragin’ Cajun’s• Conference: Sun Belt • Sports program website: www.ragincajuns.com
University of Louisiana, Monroe• Nickname: Warhawks• Conference: Sun Belt • Sports program website: www.ulmwarhawks.com
University of Louisville• Nickname: Cardinals• Conference: Big East• Sports program website: www.uoflsports.com
University of Maine• Nickname: Black Bears• Conference: America East• Sports program website: www.goblackbears.com
University of Maryland• Nickname: Terrapins• Conference: Atlantic Coast• Sports program website: www.umterps.com
University of Maryland, Baltimore County• Nickname: Retrievers• Conference: America East• Sports program website: www.umbcretrievers.com
University of Maryland, Eastern Shore• Nickname: Hawks• Conference: Mid-Eastern Atlantic • Sports program website: www.umeshawks.com
SPORTS MARKETING 2020-2021
• 336 •

University of Massachusetts• Nicknames: Minutemen, Minutewomen• Conference: Atlantic 10• Sports program website: www.umassathletics.com
University of Memphis• Nickname: Tigers• Conference: American Athletic• Sports program website: www.gotigersgo.com
University of Miami• Nickname: Hurricanes• Conference: Atlantic Coast• Sports program website: www.hurricanesports.com
University of Michigan• Nickname: Wolverines• Conference: Big Ten• Sports program website: www.mgoblue.com
University of Minnesota• Nickname: Gophers• Conference: Big Ten• Sports program website: www.gophersports.com
University of Mississippi• Nickname: Rebels• Conference: Southeastern • Sports program website: www.olemisssports.com
University of Missouri• Nickname: Tigers• Conference: Big 12• Sports program website: www.mutigers.com
University of Missouri, Kansas City• Nickname: Kangaroos• Conference: The Summit League • Sports program website: www.umkckangaroos.com
University of Montana• Nickname: Grizzlies• Conference: Big Sky• Sports program website: www.montanagrizzlies.com
SPORTS MARKETING 2020-2021
• 337 •

University of Nebraska• Nickname: Cornhuskers• Conference: Big Ten• Sports program website: www.huskers.com
University of Nevada• Nickname: Wolf Pack• Conference: Western Athletic • Sports program website: www.nevadawolfpack.com
University of Nevada, Las Vegas• Nickname: Rebels• Conference: Mountain West • Sports program website: www.unlvrebels.com
University of New Hampshire• Nickname: Wildcats• Conference: America East• Sports program website: www.unhwildcats.com
University of New Mexico• Nickname: Lobos• Conference: Mountain West • Sports program website: www.golobos.com
University of New Orleans• Nickname: Privateers• Conference: Independent• Sports program website: www.unoprivateers.com
University of North Carolina• Nickname: Tar Heels• Conference: Atlantic Coast• Sports program website: www.tarheelblue.com
University of North Carolina, Asheville• Nickname: Bulldogs• Conference: Big South• Sports program website: www.uncabulldogs.com
University of North Carolina, Charlotte• Nickname: 49ers• Conference: Atlantic 10• Sports program website: www.charlotte49ers.com
SPORTS MARKETING 2020-2021
• 338 •

University of North Carolina, Greensboro• Nickname: Spartans• Conference: Southern • Sports program website: www.uncgspartans.com
University of North Carolina, Wilmington• Nickname: Seahawks• Conference: Colonial Athletic Association• Sports program website: www.uncwsports.com
University of North Dakota• Nickname: Fighting Sioux• Conference: Great West • Sports program website: www.fightingsioux.com
University of North Florida• Nickname: Ospreys• Conference: Atlantic Sun• Sports program website: www.unfospreys.com
University of North Texas• Nickname: Mean Green• Conference: Sun Belt • Sports program website: www.meangreensports.com
University of Northern Colorado• Nickname: Bears• Conference: Big Sky• Sports program website: www.uncbears.com
University of Northern Iowa• Nickname: Panthers• Conference: Missouri Valley • Sports program website: www.unipanthers.com
University of Notre Dame• Nickname: Fighting Irish• Conference: Big East• Sports program website: www.und.com
University of Oklahoma• Nickname: Sooners• Conference: Big 12• Sports program website: www.soonersports.com
SPORTS MARKETING 2020-2021
• 339 •

University of Oregon• Nickname: Ducks• Conference: Pac-12 • Sports program website: www.goducks.com
University of Pennsylvania• Nickname: Quakers• Conference: Ivy League • Sports program website: www.pennathletics.com
University of Pittsburgh• Nickname: Panthers• Conference: Atlantic Coast• Sports program website: www.pittsburghpanthers.com
University of Portland• Nickname: Pilots• Conference: West Coast Conference • Sports program website: www.portlandpilots.com
University of Richmond• Nickname: Spiders• Conference: Atlantic 10• Sports program website: www.richmondspiders.com
University of Rhode Island• Nickname: Rams• Conference: Northeast• Sports program website: www.gorhody.com
University of San Diego• Nickname: Toreros• Conference: West Coast Conference • Sports program website: www.usdtoreros.com
University of San Francisco• Nickname: Dons• Conference: West Coast Conference • Sports program website: www.usfdons.com
University of South Alabama• Nickname: Jaguars• Conference: Sun Belt • Sports program website: www.usajaguars.com
SPORTS MARKETING 2020-2021
• 340 •

University of South Carolina• Nickname: Gamecocks• Conference: Southeastern • Sports program website: www.gamecocksonline.com
University of South Carolina Upstate• Nickname: Spartans• Conference: Atlantic Sun• Sports program website: www.upstatespartans.com
University of South Dakota• Nickname: Coyotes• Conference: Great West • Sports program website: www.usdcoyotes.com
University of South Florida• Nickname: Bulls• Conference: Big East• Sports program website: www.gousfbulls.com
University of Southern California• Nickname: Trojans• Conference: Pac-12 • Sports program website: www.usctrojans.com
University of Southern Mississippi• Nickname: Golden Eagles• Conference: USA • Sports program website: www.southernmiss.com
University of Tennessee• Nickname: Volunteers, Lady Vols• Conference: Southeastern • Sports Websites: www.utsports.com and www.utladyvols.com
University of Tennessee, Chattanooga• Nickname: Mocs• Conference: Southern • Sports program website: www.gomocs.com
University of Tennessee, Martin• Nickname: Skyhawks• Conference: Ohio Valley • Sports program website: www.utmsports.com
SPORTS MARKETING 2020-2021
• 341 •

University of Texas• Nickname: Longhorns• Conference: Big 12• Sports program website: www.texassports.com
University of Texas, Arlington• Nickname: Mavericks• Conference: Southland • Sports program website: www.utamavs.com
University of Texas, El Paso• Nickname: Miners• Conference: USA • Sports program website: www.utepathletics.com
University of Texas, Pan American• Nickname: Broncos• Conference: Great West • Sports program website: www.utpabroncs.com
University of Texas, San Antonio• Nickname: Roadrunners• Conference: Southland • Sports program website: www.goutsa.com
University of the Pacific• Nickname: Tigers• Conference: Big West• Sports program website: www.pacifictigers.com
University of Toledo• Nickname: Rockets• Conference: Mid-American • Sports program website: www.utrockets.com
University of Tulsa• Nickname: Golden Hurricane• Conference: USA • Sports program website: www.tulsahurricane.com
University of Utah• Nickname: Utes• Conference: Mountain West • Sports program website: www.utahutes.com
SPORTS MARKETING 2020-2021
• 342 •

University of Vermont• Nickname: Catamounts• Conference: America East• Sports program website: www.uvmathletics.com
University of Virginia• Nickname: Cavaliers• Conference: Atlantic Coast• Sports program website: www.virginiasports.com
University of Washington• Nickname: Huskies• Conference: Pac-12 • Sports program website: www.gohuskies.com
University of Wisconsin• Nickname: Badgers• Conference: Big Ten• Sports program website: www.uwbadgers.com
University of Wisconsin, Green Bay• Nickname: Phoenix• Conference: Horizon League • Sports program website: www.greenbayphoenix.com
University of Wisconsin, Milwaukee• Nickname: Panthers• Conference: Horizon League • Sports program website: www.uwmpanthers.com
University of Wyoming• Nickname: Cowboys, Cowgirls• Conference: Mountain West • Sports program website: www.wyomingathletics.com
Utah State University• Nickname: Aggies• Conference: Western Athletic • Sports program website: www.utahstateaggies.com
Utah Valley University• Nickname: Wolverines• Conference: Great West • Sports program website: www.wolverinegreen.com
SPORTS MARKETING 2020-2021
• 343 •

Valparaiso University• Nickname: Crusaders• Conference: Horizon League • Sports program website: www.valpoathletics.com
Vanderbilt University• Nickname: Commodores• Conference: Southeastern • Sports program website: www.vucommodores.com
Villanova University• Nickname: Wildcats• Conference: Big East• Sports program website: www.villanova.com
Virginia Commonwealth University• Nickname: Rams• Conference: Colonial Athletic Association• Sports program website: www.vcuathletics.com
Virginia Military Institute• Nickname: Keydets• Conference: Big South• Sports program website: www.vmikeydets.com
Virginia Polytechnic Institute and State University• Nickname: Hokies• Conference: Atlantic Coast• Sports program website: www.hokiesports.com
Wagner University• Nickname: Seahawks• Conference: Northeast • Sports program website: www.wagnerathletics.com
Wake Forest University• Nickname: Demon Deacons• Conference: Atlantic Coast• Sports program website: www.wakeforestsports.com
Washington State University• Nickname: Cougars• Conference: Pac-12 • Sports program website: www.wsucougars.com
SPORTS MARKETING 2020-2021
• 344 •

Weber State University• Nickname: Wildcats• Conference: Big Sky• Sports program website: www.weberstatesports.com
West Virginia University• Nickname: Mountaineers• Conference: Big East• Sports program website: www.msnsportsnet.com
Western Carolina University• Nickname: Catamounts• Conference: Southern • Sports program website: www.catamountsports.com
Western Illinois University• Nicknames: Leathernecks (men’s), Westerwinds (women’s)• Conference: The Summit League • Sports program website: www.goleathernecks.com
Western Kentucky University• Nickname: Hilltoppers• Conference: Sun Belt • Sports program website: www.wkusports.com
Western Michigan University• Nickname: Broncos• Conference: Mid-American • Sports program website: www.wmubroncos.com
Wichita State University• Nickname: Shockers• Conference: Missouri Valley • Sports program website: www.goshockers.com
Winston-Salem State University• Nickname: Rams• Conference: Mid-Eastern Atlantic• Sports program website: www.wssurams.com
Winthrop University• Nickname: Eagles• Conference: Big South• Sports program website: www.winthropeagles.com
SPORTS MARKETING 2020-2021
• 345 •

Wofford College• Nickname: Terriers• Conference: Southern • Sports program website: www.woffordterriers.com
SPORTS MARKETING 2020-2021
• 346 •

71
DIVISION I CONFERENCES
71.1 Division I ConferencesThe NCAA is divided into three divisions, based roughly on school size. There are 35 Division I multi-sport conferences, as follows:
Member Schools
• America East Conference (www.americaeast.com): 9• American Athletic Conference (www.theamerican.org): 11• Atlantic 10 Conference (www.atlantic10.com): 14• Atlantic Coast Conference (ACC; www.theacc.com): 15• Atlantic Sun Conference (www.atlanticsun.org): 8• Big 12 Conference (www.big12sports.com): 10• Big East Conference (www.bigeast.org): 10• Big Sky Conference (www.bigskyconf.com): 12• Big South Conference (www.bigsouthsports.com): 11• Big Ten Conference (www.bigten.org): 14• Big West Conference (www.bigwest.org): 9• Colonial Athletic Association (CAA; www.caasports.com): 10• Conference USA (C-USA; www.conferenceusa.com): 14• Horizon League (www.horizonleague.org): 10• Ivy League (www.ivyleaguesports.com): 8• Metro Atlantic Athletic Conference (MAAC; www.maacsports.com): 9• Mid-American Conference (MAC; www.mac-sports.com): 12• Mid-Eastern Athletic Conference (MEAC; www.meacsports.com): 13• Missouri Valley Conference (MVC; www.mvc-sports.com): 8• Missouri Valley Football Conference (MVFC; www.valleyfootball.org): 10• Mountain Pacific Sports Federation (www.mpsports.org): 14• Mountain West Conference (MW; www.themw.com): 11• Northeast Conference (NEC; www.northeastconference.org): 10• Ohio Valley Conference (OVC; www.ovcsports.com): 12• Pacific-12 Conference (Pac-12; www.pac-12.com): 12• Patriot League (www.patriotleague.org): 10• Pioneer Football League (PFL; www.pioneer-football.org): 11• Southeastern Conference (SEC; secsports.go.com): 14• Southern Conference (www.soconsports.com): 10• Southland Conference (www.southland.org): 13• Southwestern Athletic Conference (SWAC; www.swac.org): 10
SPORTS MARKETING 2020-2021
• 347 •

• Sun Belt Conference (www.sunbeltsports.org): 11• The Summit League (www.thesummitleague.org): 10• West Coast Conference (WCC; www.wccsports.com): 9• Western Athletic Conference (WAC; www.wacsports.com): 10
There are five Division I independent schools: Army, Brigham Young University,East Tennessee State University, Navy, and Notre Dame.
71.2 Conference RevenueSportsBusiness Journal (August 2018) reports revenue of the major conferences
as follows:Total Revenue Avg. Per Team
• SEC: $650 million $41 million• Big Ten: $513 million $37 million• Pac-12: $509 million $31 million• ACC: $418 million $27 million• Big 12: $371 million $34 million
71.3 Athletic Department RevenueDivision I athletic department revenue for the 2017-2018 academic year was as
follows (source: NCAA):• Texas (Big 12): $214,830,647• Texas A&M (SEC): $211,960,034• Ohio State (Big Ten): $185,409,602• Michigan (Big Ten): $185,173,187• Alabama (SEC): $174,307,419• Georgia (SEC): $157,852,479• Oklahoma (Big 12): $155,238,481• Florida (SEC): $149,165,475• LSU (SEC): $147,744,233• Auburn (SEC): $147,511,034• Tennessee (SEC): $145,653,191• Oregon (Pac-12): $145,417,315• Florida State (ACC): $144,514,413• Penn State (Big Ten): $144,017,055• Wisconsin (Big Ten): $143,420,668• South Carolina (SEC): $136,032,845• Kentucky (SEC): $130,706,744• Iowa (Big Ten): $130,681,467• Arkansas (SEC): $129,680,808• Washington (Pac-12): $128,745,183• Michigan State (Big Ten): $126,021,377
SPORTS MARKETING 2020-2021
• 348 •

• Louisville (ACC): $120,445,303• Nebraska (Big Ten): $120,205,090• Mississippi (SEC): $117,834,511• Minnesota (Big Ten): $116,376,862• Clemson (ACC): $112,600,964• West Virginia (Big 12): $110,565,870• Indiana (Big Ten): $106,139,192• UCLA (Pac-12): $104,106,646• Arizona State (Pac-12): $101,579,860• Mississippi State (SEC): $100,062,237• Missouri (SEC): $ 97,848,195• Illinois (Big Ten): $ 97,447,731• Rutgers (Big Ten): $ 96,883,027• North Carolina (ACC): $ 96,551,626• Kansas (Big 12): $ 95,251,461• Maryland (Big Ten): $ 94,881,357• Colorado (Pac-12): $ 94,226,111• Virginia (ACC): $ 92,865,175• Oklahoma State (Big 12): $ 91,644,865• Arizona (Pac-12): $ 90,976,758• California (Pac-12): $ 90,976,576• Texas Tech (Big 12): $ 88,804,476• Virginia Tech (ACC): $ 87,427,526• Kansas State (Big 12): $ 86,081,528• Purdue (Big Ten): $ 84,841,133• North Carolina State (ACC): $ 83,741,572• Utah (Pac-12): $ 83,672,639• Connecticut (AAC): $ 83,374,223• Iowa State (Big 12): $ 82,659,447• Georgia Tech (ACC): $ 81,762,024• Oregon State (Pac-12): $ 78,959,875• Washington State (Pac-12): $ 64,294,520• Cincinnati (AAC): $ 60,458,195• Air Force (Mt. West): $ 59,577,780• Houston (AAC): $ 57,174,900• Central Florida (AAC): $ 56,327,225• San Diego State (Mt. West): $ 52,454,787• South Florida (AAC): $ 49,960,338• Memphis (AAC): $ 48,716,830• East Carolina (AAC): $ 48,312,311• James Madison (CAA): $ 48,210,400• Massachusetts (A-10): $ 48,054,005• Hawaii (Big West): $ 47,780,885• Nevada-Las Vegas (Mt. West): $ 47,327,478
SPORTS MARKETING 2020-2021
• 349 •

• Fresno State (Mt. West): $ 46,215,249• Old Dominion (C-USA): $ 46,203,813• Boise State (Mt. West): $ 45,486,486• Colorado State (Mt. West): $ 44,672,317• New Mexico (Mt. West): $ 44,421,019• Delaware (CAA): $ 40,883,947• Wyoming (Mt. West): $ 40,372,222• Arkansas State (Sun Belt): $ 39,459,027• Western Michigan (MAC): $ 38,516,531• Texas State (Sun Belt): $ 38,445,832• Charlotte (C-USA): $ 37,931,802• Miami (Ohio) (MAC): $ 37,766,348• Nevada (Mt. West): $ 36,955,558• California-Davis (Big West): $ 35,954,033• Buffalo (MAC): $ 35,892,221• Akron (MAC): $ 35,331,217• Appalachian State (Sun Belt): $ 35,058,621• Central Michigan (MAC): $ 34,692,784• Florida Atlantic (C-USA): $ 34,509,259• Utah State (Mt. West): $ 34,398,296• Virginia Commonwealth (A-10): $ 34,297,744• Middle Tennessee (C-USA): $ 34,040,334• Coastal Carolina (Sun Belt): $ 33,703,994• Florida International (C-USA): $ 33,389,929• Toledo (MAC): $ 32,925,921• Stony Brook (Am East): $ 32,458,520• Eastern Michigan (MAC): $ 32,311,247• Ohio (MAC): $ 32,234,688• North Texas (C-USA): $ 32,150,203• Texas-El Paso (C-USA): $ 31,781,343• New Hampshire (Am East): $ 31,621,272• California Polytechnic (Big West): $ 31,435,074• San Jose State (Mt. West): $ 31,252,553• South Alabama (Sun Belt): $ 30,693,877• Western Kentucky (C-USA): $ 30,439,066• Georgia State (Sun Belt): $ 30,230,203• Troy (Sun Belt): $ 29,962,107• George Mason (A-10): $ 29,649,087• Marshall (C-USA): $ 29,287,471• Georgia Southern (Sun Belt): $ 28,895,052• Kent State (MAC): $ 28,837,710• Texas-San Antonio (C-USA): $ 28,772,631• William & Mary (CAA): $ 28,401,480• Louisiana-Lafayette (Sun Belt): $ 28,326,919
SPORTS MARKETING 2020-2021
• 350 •

• Sacramento State (Big Sky): $ 28,275,369• Rhode Island (A-10): $ 28,203,093• North Dakota (Big Sky): $ 28,201,349• Illinois State (Mo. Valley): $ 27,852,407• Wichita State (Mo. Valley): $ 27,791,259• North Dakota State (Summit): $ 27,267,507• Montana (Big Sky): $ 27,192,240• Towson (CAA): $ 26,989,399• Missouri State (Mo. Valley): $ 26,374,654• New Mexico State (WAC): $ 26,114,479• Ball State (MAC): $ 26,098,565• Northern Illinois (MAC): $ 25,795,597• Kennesaw State (Atl Sun): $ 25,326,240• Bowling Green (MAC): $ 25,303,291• Alabama at Birmingham (C-USA): $ 24,795,218• Louisiana Tech (C-USA): $ 24,722,695• Southern Mississippi (C-USA): $ 23,984,639• Idaho (Big Sky): $ 23,825,002• Albany (Am East): $ 23,502,958• Nebraska-Omaha (Summit): $ 22,956,239• Southern Illinois (Mo. Valley): $ 22,722,740• South Dakota State (Summit): $ 22,075,310• Montana State (Big Sky): $ 21,927,521• Vermont (Am East): $ 21,889,573• Maine (Am East): $ 20,941,860• California-Santa Barbara (Big West): $ 20,484,071• College of Charleston (CAA): $ 20,450,663• Long Beach State (Big West): $ 20,258,440• California-Irvine (Big West): $ 19,978,266• Massachusetts-Lowell (Am East): $ 19,931,925• Binghamton (Am East): $ 19,753,526• Northern Iowa (Mo. Valley): $ 19,497,119• California-Riverside (Big West): $ 19,362,719• South Dakota (Summit): $ 19,256,962• East Tennessee State (Southern): $ 18,870,608• Sam Houston State (Southland): $ 18,742,450• California State-Fullerton (Big West): $ 18,374,475• Northern Arizona (Big Sky): $ 18,353,486• Illinois-Chicago (Horizon): $ 18,197,670• California State-Northridge (Big West): $ 17,987,771• Prairie View A&M (SWAC): $ 17,851,213• Tennessee-Chattanooga (Southern): $ 17,804,067• Lamar (Southland): $ 17,746,157• Central Connecticut (Northeast): $ 17,616,876
SPORTS MARKETING 2020-2021
• 351 •

• Citadel (Southern): $ 17,610,176• Northern Colorado (Big Sky): $ 17,289,706• Maryland-Baltimore Cty (Am East): $ 17,217,652• Eastern Kentucky (Ohio Valley): $ 17,024,583• North Carolina Greensboro (Southern): $ 16,832,309• Jacksonville State (Ohio Valley): $ 16,761,667• Stephen F. Austin (Southland): $ 16,747,580• North Carolina Wilmington (CAA): $ 16,443,174• New Jersey Tech (Atl Sun): $ 16,323,383• Oakland (Horizon): $ 16,262,483• Louisiana-Monroe (Sun Belt): $ 16,132,421• Indiana State (Mo. Valley): $ 16,098,113• Florida Gulf Coast (Atl Sun): $ 15,954,757• California State-Bakersfield (WAC): $ 15,953,381• Austin Peay (Ohio Valley): $ 15,726,585• Murray State (Ohio Valley): $ 15,629,362• Youngstown State (Horizon): $ 15,410,657• Tennessee Tech (Ohio Valley): $ 15,051,335• Southeastern Louisiana (Southland): $ 15,027,967• Utah Valley (WAC): $ 15,010,051• Missouri-Kansas City (WAC): $ 14,807,781• Eastern Washington (Big Sky): $ 14,797,340• Texas-Rio Grande Valley (WAC): $ 14,638,376• Wisconsin-Milwaukee (Horizon): $ 14,382,462• Alabama State (SWAC): $ 14,374,967• Northern Kentucky (Horizon): $ 14,213,168• Texas-Arlington (Sun Belt): $ 14,054,524• Weber State (Big Sky): $ 13,855,419• Western Carolina (Southern): $ 13,723,606• Portland State (Big Sky): $ 13,684,434• Norfolk State (MEAC): $ 13,656,202• Northwestern State La (Southland): $ 13,607,151• Central Arkansas (Southland): $ 13,562,018• North Carolina Central (MEAC): $ 13,561,933• Southern (SWAC): $ 13,360,450• VMI (Southern): $ 13,359,816• Winthrop (Big South): $ 13,287,467• Idaho State (Big Sky): $ 13,228,486• Southern Utah (Big Sky): $ 13,143,866• Cleveland State (Horizon): $ 13,083,041• North Carolina A&T (MEAC): $ 13,075,494• Arkansas-Little Rock (Sun Belt): $ 13,004,365• Radford (Big South): $ 12,954,767• Texas A&M-Corpus Christi (Southland): $ 12,761,032
SPORTS MARKETING 2020-2021
• 352 •

• Delaware State (MEAC): $ 12,674,589• Tennessee State (Ohio Valley): $ 12,481,256• Morehead State (Ohio Valley): $ 12,147,957• Southeast Missouri State (Ohio Valley): $ 12,072,270• North Florida (Atl Sun): $ 12,051,332• Western Illinois (Summit): $ 11,944,035• Longwood (Big South): $ 11,876,406• McNeese State (Southland): $ 11,654,790• Eastern Illinois (Ohio Valley): $ 11,329,430• Tennessee-Martin (Ohio Valley): $ 11,308,729• Morgan State (MEAC): $ 11,023,152• Wright State (Horizon): $ 10,922,076• Texas Southern (SWAC): $ 10,899,527• Florida A&M (MEAC): $ 10,741,985• Indiana-Purdue Fort Wayne (Summit): $ 10,607,866• Indiana-Purdue Indianapolis (Summit): $ 10,143,238• Southern Illinois Edwardsville (Ohio Valley): $ 9,524,882• Jackson State (SWAC): $ 9,466,619• Wisconsin-Green Bay (Horizon): $ 9,390,830• Nicholls State (Southland): $ 8,463,641• North Carolina Asheville (Big South): $ 8,395,210• Arkansas-Pine Bluff (SWAC): $ 7,904,735• Grambling State (SWAC): $ 7,853,609• South Carolina Upstate (Atl Sun): $ 7,591,880• South Carolina State (MEAC): $ 7,232,850• Alcorn State (SWAC): $ 6,321,380• Maryland-Eastern Shore (MEAC): $ 5,916,647• New Orleans (Southland): $ 5,819,807• Chicago State (WAC): $ 5,249,433• Savannah State (MEAC): $ 4,508,343• Mississippi Valley State (SWAC): $ 4,332,784• Coppin State (MEAC): $ 3,452,610• Alabama A&M (SWAC): $ 3,293,950
SPORTS MARKETING 2020-2021
• 353 •

72
NCAA SPORTS
72.1 OverviewAnnual attendance at college sports events is approximately 100 million.
College sports generates about $10.5 billion annually. College and university sports are organized through the National Collegiate
Athletic Association (NCAA, www.ncaa.org) and (www.ncaa.com).The popularity of collegiate sports is immense. According to an ESPN Sports
Poll, 58% of adults are fans of NCAA football and 48% are fans of NCAA basketball.
_________________________________________________________________
“The television contracts are juicy. Across all sports, college athletic revenues are $10.5 billion a year, more than the NFLgenerates. About 30% of that goes towardsscholarships and financial aid for players.”
The Economist _________________________________________________________________
All regular-season college games, conference tournaments, and football bowlgame broadcast rights remain the property of the NCAA member colleges, universities,and individual conferences. The NCAA retains exclusive copyright to all video of NCAAchampionships.
72.2 Men’s and Women’s SportsThe following sports competitions are sponsored by NCAA schools:
Fall• Cross country (men’s) • Cross country (women’s) • Field hockey (women’s) • Football (men’s)
SPORTS MARKETING 2020-2021
• 354 •

• Soccer (men’s) • Soccer (women’s) • Volleyball (women’s) • Water polo (men’s)
Winter• Basketball (men’s) • Basketball (women’s) • Bowling (women’s) • Fencing (men’s/women’s) • Gymnastics (men’s) • Gymnastics (women’s) • Ice hockey (men’s) • Ice hockey (women’s) • Indoor track and field (men’s) • Indoor track and field (women’s) • Rifle (men’s/women’s) • Skiing (men’s/women’s) • Swimming and diving (men’s) • Swimming and diving (women’s) • Wrestling (men’s)
Spring• Baseball (men’s) • Golf (men’s) • Golf (women’s) • Lacrosse (men’s) • Lacrosse (women’s) • Outdoor track and field (men’s) • Outdoor track and field (women’s) • Rowing (women’s) • Softball (women’s) • Tennis (women’s) • Tennis (men’s) • Volleyball (men’s) • Water polo (women’s)
The development of women’s athletic programs has, in large part, been driven byTitle IX of the Education Amendments of 1972. According to the NCAA’s SportsSponsorship and Participation Rates Report, women’s share among all intercollegiateathletes is 42.8%; in 1972 that f igure was 15%.
SPORTS MARKETING 2020-2021
• 355 •

72.3 NCAA RevenueEstimated annual NCAA revenue is $1.1 billion, approximately 90% of which is
derived from media rights payments. The largest revenue source is the 14-year, $10.8billion agreement with Turner Broadcasting and CBS Sports for rights to the Division IMen’s Basketball Championship.
Sixty percent (60%) of NCAA revenue is distributed directly to Division Iconferences, which pass most of the funds along to their member institutions to supporttheir athletics programs. Another major use of NCAA revenue is the support of 89national championships in 23 sports. In addition to travel expenses for all participants,other benefits include catastrophic-injury insurance coverage for all student-athletes,various scholarship programs, and more.
72.4 Broadcast RightsNCAA championships are broadcast on network television, cable television,
broadcast radio, satellite radio, and the Internet. The NCAA oversees only thebroadcasts of its 88 NCAA championships.
Twenty-five (25) of the 88 championships receive some sort of live televisioncoverage. All remaining championships receive coverage on a tape-delay or highlightsshow basis.
CBS owns the rights to 67 championships while ESPN maintains 21championships. CBS, ESPN, ESPN2, ESPNU, and ESPNEWS broadcast NCAAchampionships via television and the Internet. In addition, CSTV, FSN, NCAAProductions, and selected regional sports networks air telecasts of remainingchampionship games.
72.5 SponsorsNCAA’s sponsorships are led by their three Corporate Champions: AT&T,
Capital One, and Coca-Cola. This sponsorship level is worth approximately $35 millionannually.
NCAA Corporate Partners for 2019-2020, with sponsorships of about $10 millionannually, are Buffalo Wild Wings, Buick, Dove Men+Care, Geico, Google Cloud, Infiniti, Lowe’s, Marriott Bonvoy, Nabisco, Pizza Hut, Reese’s, Uber Eats, and Wendy’s.
72.6 Market ResourcesNational Collegiate Athletic Association, 700 West Washington Street, Indianapolis, IN46206. (317) 917-6222. (www.ncaa.org) and (www.ncaa.com)
SPORTS MARKETING 2020-2021
• 356 •

73
NCAA FOOTBALL
73.1 Football Program RevenueAccording to Forbes (December 2018), based on data from the U.S. Department
of Education, the following universities have the highest football program revenue:• Texas A&M Aggies: $148 million• Texas Longhorns: $133 million• Alabama Crimson Tide: $127 million• Michigan Wolverines: $127 million• Ohio State Buckeyes: $120 million• Oklahoma Sooners: $118 million• Auburn Tigers: $112 million• Louisiana State Tigers: $112 million• Notre Dame Fighting Irish: $112 million• Florida Gators: $111 million• Tennessee Volunteers: $108 million• Arkansas Razorbacks: $ 92 million• Oregon Ducks: $ 92 million• Penn State Nittany Lions: $ 92 million• South Carolina Gamecocks: $ 90 million• Georgia Bulldogs: $ 89 million• Florida State Seminoles: $ 88 million• USC Trojans: $ 87 million• Washington Huskies: $ 84 million• Nebraska Cornhuskers: $ 83 million• Michigan State Spartans: $ 80 million• Ole Miss Rebels: $ 80 million• Iowa Hawkeyes: $ 79 million• Wisconsin Badgers: $ 78 million• Texas Tech Red Raiders: $ 60 million
73.2 Fans and SpectatorsAccording to an ESPN Sports Poll, 58% of adults who follow sports are fans of
NCAA football; 23% say they are avid fans.
SPORTS MARKETING 2020-2021
• 357 •

In a recent Harris Poll (www.theharrispoll.com), 11% of adults said collegefootball is their favorite sport.
For the 2018 season, 666 NCAA schools f ielded football teams. Regular-seasongame attendance at games in 2018 was as follows: Teams Games Attendance Average
• Division I: 253 1,546 41.96 million 27,142• Division II: 166 895 2.75 million 3,075• Division III: 247 1,252 2.14 million 1,705
According to the NCAA, the following were the Division I universities with thehighest average game attendance for the 2018 season:• Michigan: 110,737• Penn State: 105,485• Ohio State: 101,947• Alabama: 101,562• LSU: 100,819• Texas A&M: 99,844• Texas: 97,713• Tennessee: 92,984• Georgia: 92,746• Nebraska: 89,034• Oklahoma: 86,735• Auburn: 84,462• Florida: 82,328• Clemson: 80,400• Notre Dame: 77,622
• Wisconsin: 77,153• South Carolina: 73,628• Michigan State: 72,584• Washington: 69,068• Florida State: 68,288• Iowa: 68,043• Miami (FL): 61,469• Arkansas: 59,884• Virginia Tech: 59,574• West Virginia: 58,158• Mississippi State: 58,057• North Carolina State: 56,855• Texas Tech: 56,034• Iowa State: 56,010• Ole’ Miss: 55,685
73.3 College Football Playoff and Bowl GamesThe College Football Playoff and bowl games are assessed in Chapter 35 of this
handbook.
73.4 Fan DemographicsAccording to an ESPN Sports Poll, college football fan distribution is as follows:
Gender• Male: 62%• Female: 38%
Age• 12-to-17: 13%• 18-to-24: 10%• 25-to-34: 17%
SPORTS MARKETING 2020-2021
• 358 •

• 35-to-44: 15%• 45-to-54: 19%• 55 and older: 25%
Ethnicity• Caucasian: 75%• African-American: 11%• Hispanic-American: 9%• Other: 5%
73.5 Regular-Season BroadcastsThe following are television rights deals for broadcasts of football games for the
major conferences:• ACC: ESPN• Big 12: Fox Sports Net• Big East: ESPN• Pac-12: ESPN and Fox Sports Net• SEC: CBS and ESPN
College Sports Television (www.cstv.com), a broadcast and online providerowned by CBS, reaches 15 million cable subscribers.
The Big Ten and Mountain West Conference have established their ownnetworks.
SPORTS MARKETING 2020-2021
• 359 •

74
NCAA MEN’S BASKETBALL
74.1 Basketball Program RevenueAccording to Forbes (March 2019), based on data from the U.S. Department of
Education, the following universities have the highest basketball program revenue:• Louisville Cardinals: $52.0 million• Kentucky Wildcats: $49.4 million• Indiana Hoosiers: $35.5 million• Duke Blue Devils: $33.1 million• Kansas Jayhawks: $32.2 million• Ohio State Buckeyes: $29.0 million• Syracuse Orange: $28.5 million• Arizona Wildcats: $26.9 million• Illinois Fighting Illini: $25.8 million• Wisconsin Badgers: $25.5 million• North Carolina Tar Heels: $24.8 million• Michigan State Spartans: $23.9 million• Maryland Terrapins: $23.5 million• Arkansas Razorbacks: $21.8 million• Michigan Wolverines: $20.9 million• Texas Longhorns: $18.1 million• North Carolina State Wolfpack: $17.9 million• Marquette Golden Eagles: $17.7 million• Tennessee Volunteers: $17.7 million• Alabama Crimson Tide: $17.4 million
74.2 Fans and SpectatorsAccording to an ESPN Sports Poll, 48% of adults who follow sports are fans of
NCAA basketball; 16% say they are avid fans.In a recent Harris Poll (www.theharrispoll.com), 3% of adults said college
basketball is their favorite sport.A survey by The Media Audit (www.themediaaudit.com) found that 38% of all
U.S. adults regularly follow college basketball on television or radio.According to the NCAA, regular-season game attendance at college men’s
basketball games for the 2018-2019 season was as follows:
SPORTS MARKETING 2020-2021
• 360 •

Teams Games Attendance Average
• Division I: 346 5,542 27.23 million 4,914• Division II: 301 4,112 2.80 million 680• Division III: 413 4,980 1.97 million 396
Division I universities with the highest average attendance for the 2018-2019season are as follows:• Syracuse: 21,992• Kentucky: 21,695• North Carolina: 19,715• Tennessee: 19,034• Wisconsin: 17,170• Louisville: 16,601• Kansas: 16,236• Creighton: 15,980• Marquette: 15,611• Nebraska: 15,341• Arkansas: 15,278• Indiana: 15,206• Michigan State: 14,797• Purdue: 14,467• Iowa State: 14,099
• Virginia: 14,087• Memphis: 14,065• Maryland: 14,009• Ohio State: 13,922• NC State: 13,897• Arizona: 13,744• Dayton: 12,957• Iowa: 12,869• Michigan: 12,505• Illinois: 12,456• Texas Tech: 12,098• BYU: 11,958• South Carolina: 11,472• Cincinnati: 11,256• New Mexico: 11,107
74.3 Fan DemographicsAccording to an ESPN Sports Poll, college basketball fan distribution is as
follows:Gender• Male: 63%• Female: 37%
Age• 12-to-17: 15%• 18-to-24: 8%• 25-to-34: 15%• 35-to-44: 15%• 45-to-54: 20%• 55 and older: 28%
Ethnicity• Caucasian: 73%• African-American: 13%• Hispanic-American: 9%• Other: 5%
SPORTS MARKETING 2020-2021
• 361 •

74.4 NCAA Divison I FinalsThe NCAA Division I Men’s Basketball Championship is assessed in Chapter 41
of this handbook.
74.5 Favorite TeamsSports fans responding to a recent Harris Poll ranked their favorite college men’s
basketball teams as follows:1. Duke2. Kentucky3. North Carolina4. Connecticut5. Ohio State6. UCLA7. Michigan8. Michigan State9. Notre Dame10. Wisconsin
74.6 Regular-Season BroadcastsThe following are television rights deals for broadcasts of basketball games for
the major conferences (source: SportsBusiness Journal):• ACC: ESPN• Big 12: ESPN• Big East: ESPN• Big Ten: ESPN and CBS• Pac-12: Fox Sports Net• SEC: ESPN and CBS
The Big Ten and Mountain West Conference have established their ownnetworks.
SPORTS MARKETING 2020-2021
• 362 •

75
NCAA WOMEN’S BASKETBALL
75.1 Fans and SpectatorsAccording to the National Collegiate Athletic Association (NCAA), regular-season
attendance at college women’s basketball games for the 2018-2019 basketball seasonwas as follows:
Teams Games Attendance Average
• Division I: 349 5,312 8.63 million 1,625• Division II: 303 4,203 1.74 million 415• Division III: 437 5,385 1.03 million 206
Division I universities with the highest average attendance for the 2018-2019women’s basketball season were as follows:• South Carolina: 10,406• Iowa State: 9,573• Louisville: 9,531• UConn: 8,870• Mississippi State: 8,446• Notre Dame: 8,434• Tennessee: 8,028• Oregon: 7,148• Iowa: 6,797• Purdue: 6,515• Baylor: 6,131• Gonzaga: 5,625• Maryland: 5,575• Minnesota: 5,570• Michigan State: 5,496
• Oregon State: 5,438• New Mexico: 5,236• Kentucky: 4,767• Missouri: 4,669• Middle Tennessee: 4,353• Ohio State: 4,336• Nebraska: 4,101• Texas: 4,035• Texas A&M: 4,022• Indiana: 3,920• Wisconsin: 3,894• Duke: 3,883• Georgia: 3,830• Drake: 3,788• Toledo: 3,728
75.2 Favorite TeamsSports fans responding to a recent Harris Poll (www.theharrispoll.com) ranked
their favorite college women’s basketball teams as follows:1. Connecticut2. Tennessee3. Duke4. (tie) North Carolina4. (tie) Notre Dame
6. Ohio State7. (tie) Baylor7. (tie) Kentucky7. (tie) Stanford10. UCLA
SPORTS MARKETING 2020-2021
• 363 •

76
HIGH SCHOOL SPORTS
76.1 OverviewAccording to the National Federation of State High School Associations (NFHS,
www.nfhs.org), participation in high school sports has been as follows: Boys Girls Total
• 2000-2001: 3,921,069 2,784,154 6,705,223• 2001-2002: 3,960,517 2,806,998 6,767,515• 2002-2003: 3,988,738 2,856,358 6,845,096• 2003-2004: 4,038,253 2,865,299 6,903,552• 2004-2005: 4,110,319 2,908,390 7,018,709• 2005-2006: 4,206,549 2,953,355 7,159,904• 2006-2007: 4,321,103 3,021,807 7,342,910• 2007-2008: 4,372,115 3,057,266 7,429,381• 2008-2009: 4,422,662 3,114,091 7,536,753• 2009-2010: 4,455,740 3,172,637 7,628,377• 2010-2011: 4,494,406 3,173,549 7,667,955• 2011-2012: 4,484,987 3,207,533 7,692,520• 2012-2013: 4,490,854 3,222,723 7,713,577• 2013-2014: 4,527,994 3,267,664 7,795,658• 2014-2015: 4,519,312 3,287,735 7,807,047• 2015-2016: 4,541,959 3,324,306 7,866,265• 2016-2017: 4,563,238 3,400,297 7,963,535• 2017-2018: 4,565,580 3,415,306 7,980,886
According to the NFHS, attendance at high school sports events each year isapproximately 500 million.
76.2 Most Popular SportsThe following are the most popular boys programs, ranked by participation
during the 2017-2018 school year:• Football: 1,036,842• Track & field (outdoor): 600,097• Basketball: 551,373• Baseball: 487,097• Soccer: 456,362
SPORTS MARKETING 2020-2021
• 364 •

• Cross country: 270,095• Wrestling: 245,564• Tennis: 158,151• Golf: 144,024• Swimming & diving: 138,935
The following are the most popular programs for girls:• Track & field (outdoor): 488,592• Volleyball: 446,583• Basketball: 412,407• Soccer: 390,482• Softball (fast pitch): 367,861• Cross country: 223,518• Tennis: 190,768• Swimming & diving: 175,594• Competitive spirit squads: 162,669• Lacrosse: 96,904
76.3 Participation by SportParticipation by sport during the 2017-2018 school year was as follows:
Boys Girls Total
• Archery: 5,484 4,976 10,460• Badminton: 4,753 13,145 17,898• Baseball: 487,097 1,762 488,859• Basketball: 551,373 412,407 963,780• Bass Fishing: 1,821 136 1,957• Bocce (outdoor): 373 386 759• Bowling: 32,159 27,880 60,039• Canoe paddling: 1,242 1,434 2,676• Competitive spirit: 3,851 162,669 166,520• Crew: 2,423 2,094 4,517• Cross country: 270,095 223,518 493,613• Dance: 153 14,875 15,028• Decathlon: 292 139 431• Drill team: 682 9,842 10,524• Equestrian: 106 1,200 1,306• Fencing: 2,428 2,085 4,513• Field hockey: 473 59,856 60,329• Flag football: 1,144 11,007 12,151• Football, 11-player: 1,036,842 2,237 1,039,079• Football, 6-player: 5,102 11 5,113• Football, 8-player: 19,554 108 19,662• Football, 9-player: 4,971 45 5,016
SPORTS MARKETING 2020-2021
• 365 •

• Golf: 144,024 78,781 222,805• Gymnastics: 1,715 18,867 20,582• Ice hockey: 35,060 9,609 44,669• Judo: 688 507 1,195• Kayaking: 86 110 196• Lacrosse: 113,313 96,904 210,217• Mountain biking: 467 197 664• Riflery: 2,149 1,285 3,434• Riflery, air: 524 427 951• Rodeo: 114 117 231• Roller hockey: 268 47 315• Rugby: 2,054 539 2,593• Sailing: 188 158 346• Skiing, alpine: 5,317 4,616 9,933• Skiing, cross country: 4,417 4,705 9,122• Snowboarding: 493 246 739• Soccer: 456,362 390,482 846,844• Softball, fast pitch: 1,589 367,861 369,450• Softball, slow pitch: 28 6,891 6,919• Squash: 172 63 235• Surfing: 895 407 1,302• Swimming & diving: 138,935 175,594 314,529• Swimming, synchronized: 35 592 627• Tennis: 158,151 190,768 348,919• Tennis, team: 25,338 26,609 51,947• Track & field, indoor: 80,754 72,662 153,416• Track & field, outdoor: 600,097 488,592 1,088,689• Trap shooting: 1,561 440 2,001• Ultimate frisbee: 683 547 1,230• Volleyball: 60,976 446,583 507,559• Volleyball, mixed 6-coed: 275 715 990• Volleyball, sand: 709 1,734 2,443• Water polo: 22,501 21,054 43,555• Weightlifting: 19,908 10,950 30,858• Wrestling: 245,564 16,562 262,126
76.4 Participation by StateParticipation by state during the 2017-2018 school year was as follows:
Boys Girls Total Rank
• Alabama: 88,374 47,616 135,990 20• Alaska: 11,998 10,647 22,645 48• Arizona: 69,335 51,983 121,318 22• Arkansas: 39,818 28,186 68,004 34
SPORTS MARKETING 2020-2021
• 366 •

• California: 465,775 353,850 819,625 2• Colorado: 72,901 59,525 132,426 21• Connecticut: 59,217 51,911 111,128 25• Delaware: 16,902 13,139 30,041 45• District of Columbia: 7,623 5,203 12,826 50• Florida: 175,225 136,136 311,361 7• Georgia: 120,987 80,480 201,467 13• Hawaii: 20,989 16,690 37,679 41• Idaho: 26,845 21,456 48,301 37• Illinois: 195,266 143,582 338,848 5• Indiana: 89,868 62,884 152,752 18• Iowa: 82,696 56,344 139,040 19• Kansas: 60,835 40,710 101,545 29• Kentucky: 57,533 48,518 106,051 28• Louisiana: 61,689 47,430 109,119 27• Maine: 27,693 24,156 51,849 36• Maryland: 67,014 50,611 117,625 23• Massachusetts: 126,433 100,613 227,046 11• Michigan: 169,527 127,098 296,625 8• Minnesota: 122,595 117,838 240,433 10• Mississippi: 68,873 43,662 112,535 24• Missouri: 102,897 71,464 174,361 17• Montana: 16,885 13,704 30,589 44• Nebraska: 46,129 32,429 78,558 33• Nevada: 24,942 18,211 43,153 40• New Hampshire: 24,028 20,831 44,859 49• New Jersey: 161,740 120,060 281,800 9• New Mexico: 26,359 21,875 48,234 38• New York: 202,358 175,707 378,065 3• North Carolina: 113,708 89,766 203,474 12• North Dakota: 15,599 11,530 27,129 47• Ohio: 204,214 143,353 347,567 4• Oklahoma: 55,755 42,528 98,283 31• Oregon: 55,572 44,335 99,907 30• Pennsylvania: 169,051 150,816 319,867 6• Rhode Island: 17,335 13,547 30,882 43• South Carolina: 60,413 36,447 96,860 32• South Dakota: 16,404 13,386 29,790 46• Tennessee: 69,579 40,458 110,037 26• Texas: 492,351 332,268 824,619 1• Utah: 38,906 28,575 67,481 35• Vermont: 5,412 4,246 9,658 51• Virginia: 99,616 75,914 175,530 16• Washington: 100,980 74,803 175,783 15
SPORTS MARKETING 2020-2021
• 367 •

• West Virginia: 21,382 15,418 36,800 42• Wisconsin: 106,986 74,514 181,500 14• Wyoming: 10,968 8,853 19,821 49
76.5 Local Television BroadcastingLocal television stations are increasing high school sports programming within
their markets. WNYW New York, for example, has game-of-the-week highlights duringits 10 p.m. news broadcasts; WMC Memphis airs Game of the Week; and KUTV SaltLake City presents the High School Touchdown Report. WFSB, Meredith’s CBSaffiliate in Hartford, Connecticut, reports that Friday Night Football “rules its sportssegments.”
76.6 High School Sports OnlineDespite the high level of interest in high school sports, major media companies
have not been active in high school sports broadcasting. A flurry of companies, however, have poured tens of millions of dollars into
purchasing or developing online properties devoted to high school sports. The followingare some of the ventures:• HighSchoolPlaybook.com is operated by Hearst-Argyle Television Inc. in nine of its
26 local TV markets.• MaxPreps, owned by CBS, provides information on some 80,000 high school
football games and more than 500,000 basketball games each year.• Rivals.com, owned by Yahoo!, is a network of more than 150 high school and
college sports websites.• Takkle (www.takkle.com), in a partnership with Alloy Media, operates a social-
networking website for high school athletes. • Varsity Networks (www.varsitynetworks.com) develops online communities built
around individual high school sports teams.
76.7 Sponsors and PromotionsHome Team Marketing (www.hometeammarketing.com) has developed a
nationwide network to facilitate marketing and sponsorships for high school sportsprograms. Approximately 3,000 high schools are members of the network. Marketerscan purchase local, regional, or national campaigns for exposure at thousands of highschool events. Companies and organizations that have participated in the programinclude Ace Hardware, Allstate, AT&T, Grand Home Furnishings, the National Guard,and the U.S. Army, among others.
USA Today High School Sports and MaxPreps (www.maxpreps.com) routinelygenerate seven-figure monthly audiences for high school games.
SPORTS MARKETING 2020-2021
• 368 •

_________________________________________________________________
“A traditionally fragmented landscape for highschool sports is becoming an attractive targetfor top-tier corporate marketers, thanks in partto advancements in digital technology, a rise inshowcase prep sports events, and a criticalneed among many schools for additional sportsfunding. Long a challenging environment toamass audience scale given the highlyprovincial nature of high school sports, severaldeveloping companies have begun to amasssizable audiences that are comparable to manyother forms of sports media.”
SportsBusiness Journal _________________________________________________________________
A survey by Turnkey Sports (www.turnkeysports.com) found significant interestamong consumers in patronizing companies that support local high school sportsprograms. When asked “which one of the following should a company or organizationutilize to have the greatest impact on you?” participants responded as follows:• Sponsor local high school: 69.2%• Television advertising: 14.4%• Sponsor local professional sports team: 4.4%• Other (newspaper, radio, Internet, etc.): 12.0%
76.8 Market ResourcesNational Federation of State High School Associations, P.O. Box 690, Indianapolis, IN 46206. (317) 822-5700. (www.nfhs.org)
SPORTS MARKETING 2020-2021
• 369 •

77
YOUTH TEAM SPORTS
77.1 ParticipationThe Sports & Fitness Industry Association (SFIA, www.sfia.org) reported sports
participation by youths ages 6-to-17 as follows:• Basketball: 6.71 million• Football: 9.69 million• Field hockey: 370,000• Football, tackle: 3.25 million• Football, touch: 2.03 million• Gymnastics: 2.81 million• Ice hockey: 743,000• Lacrosse: 804,000• Rugby: 301,000• Soccer, indoor: 2.17 million• Soccer, outdoor: 7.65 million• Softball, fast pitch: 1.00 million• Softball, slow pitch: 1.62 million• Track and field: 2.42 million• Volleyball, court: 2.68 million• Volleyball, sand/beach: 652,000• Wrestling: 805,000
_________________________________________________________________
“Disturbing research shows a serious drop inyouth participation numbers. And advocatesare desperately looking for answers.”
SportsBusiness Journal _________________________________________________________________
Among youths who participate in team sports, participation was in 2.14 sports,on average.
SPORTS MARKETING 2020-2021
• 370 •

77.2 AAU SportsThe Amateur Athletic Union (AAU, www.aau.org) is dedicated exclusively to the
promotion and development of amateur sports and physical fitness programs. TheAAU provides sport programs in individual and team sports in local communities whereyouth, ages 9-to-18, can compete with other athletes their own age. There are teams inmost sports. AAU has more than 700,000 members in the U.S., including more than100,000 volunteers.
77.3 Youth BaseballParticipation in the three primary organized youth baseball leagues is as follows:
• Little League Baseball (www.littleleague.org): 1.9 million• Babe Ruth League (www.baberuthleague.org): 886,500• PONY League Baseball (www.pony.org): 500,000
Little League Baseball reported 2.4 million players on 160,000 teams across 76countries. There are 1.9 million Little League Baseball players and 5,500 leagues inthe U.S.
Little League Baseball has an eight-year, $76 million broadcast rights agreementwith ESPN for the LLB World Series through 2022.
Little League Baseball sponsors are Active Network, Baseball Factory, BombPop, Canon, Easton Baseball/Softball, Gatorade, Heinz Ketchup, Honda, HondaSponsorship Program, Kellogg’s Frosted Flakes, Lance, Musco Sports Lighting, NewEra, Russell, and Subway.
Babe Ruth League sponsors are Babe Ruth Store, FlipGive, Game Changer,HotelPlanner.com, Hershey’s, K&K Insurance, Lifetouch Sports, Musco Sports Lighting,NationalTravelDeals.com, Nationwide Insurance, OxiClean, Pitchin Baseball, Rawlings,The Sports Authority, and Under Armour.
PONY League Baseball does not seek sponsorship.USA Baseball (www.usabaseball.com) has implemented several programs to
encourage youth participation. These include Play Ball, Reviving Baseball In InnerCities, and Urban Youth Academies.
77.4 Youth BasketballUSA Basketball (www.usab.com) conducts a youth development division that
includes a coaches and league accreditation program.The National Basketball Association (NBA), through its Jr. NBA program,
supports a network of affiliated youth organizations, camps, clinics, and tournaments.
SPORTS MARKETING 2020-2021
• 371 •

77.5 Youth FootballPop Warner (www.popwarner.com) football was founded in 1929, making it the
oldest among youth sports organizations. Over 240,000 youths participate in PopWarner-sanctioned football programs each year.
Pop Warner’s regional and national playoff system, culminating with the week-long Pop Warner Super Bowl and National Cheer & Dance Championships, arebroadcast on ESPN.
Pop Warner National Sponsors are Active Network, Backyard Sports RookieRush, Bike Athletic, Chartis Insurance, H.K. Anderson, Jostens/OurHubub, Modell’sSporting Goods, Panini America (formerly Donruss), Russell Athletic, Schutt Sports,Spalding, Team Cheer, and The Sports Authority.
American Youth Football (www.americanyouthfootball.com) sanctions over16,000 teams, with some 574,000 players ages 5 though 16. Official Sponsors areAcademy Sports + Outdoors, Edge Cheer & Dance, Lifetouch Sports, NorthwestDesigns, Sadler Sports & Recreation Insurance, TeamLeader, Wilson Sports, andXtreme Procision.
USA Football (www.usafootball.com) has about 9,500 affiliated leagues. Toreduce injuries among young players, USA Football instituted Heads Up Football, aprogram that requires coaches to be certified in proper blocking and tacklingtechniques.
The National Football League (NFL) contributed $45 million to the Heads UpFootball program. The NFL also set up a program to educate Pop Warner trainers.
77.6 Youth HockeyIn 2010, USA Hockey (www.usahockey.com) launched the American
Development Model (ADM) for its affiliated youth programs. The program is creditedwith the 43.7% five-year growth in participation among youth. ADM curtailed bodychecking, dropped championship games that required travel among participants, andimplemented measures to make the game more accessible.
The National Hockey League (NHL) launched Hockey Is For Everyone, aprogram that provides financial support and programming to youth organizations. TheNHL Players Association has donated $22 million to provide equipment for youthhockey programs.
77.7 Youth SoccerUS Youth Soccer (www.usyouthsoccer.org) is the largest member of the United
States Soccer Federation (www.ussoccer.com), the governing body for soccer in theUnited States. US Youth Soccer is made up of 55 member-state associations; one ineach state and two in California, New York, Ohio, Pennsylvania, and Texas.
Annually, the organization registers over 3,000,000 youth players between theages of five and 19, representing over 85% of all who play organized soccer in the U.S.
SPORTS MARKETING 2020-2021
• 372 •

The organization has over 600,000 volunteers and administrators, along with over300,000 dedicated coaches, most of whom also are volunteers.
US Youth Soccer sponsors are Capri Sun, Kohl’s, Liberty Mutual Insurance,National Mango Board, Nestlé Nesquik, Nike, Positive Coaching Alliance, The SportsAuthority, and Wilson Trophy Company.
American Youth Soccer Organization (www.ayso.org) coordinates participationamong 650,000 kids. Sponsors are American Soccer Co./Score, Continental Tire,Dole, Fold-A-Goal, Fox Sports 1, Herbalife, Kerrygold, Nestlé Nesquik, Shutterfly, SportPins International, and World’s Finest Chocolates.
Major League Soccer (MLS) requires that its clubs operate under-14 and under-18 academy teams that compete in the US. Soccer development league.
SPORTS MARKETING 2020-2021
• 373 •

PART IX: FIGHTING SPORTS
SPORTS MARKETING 2020-2021
• 374 •
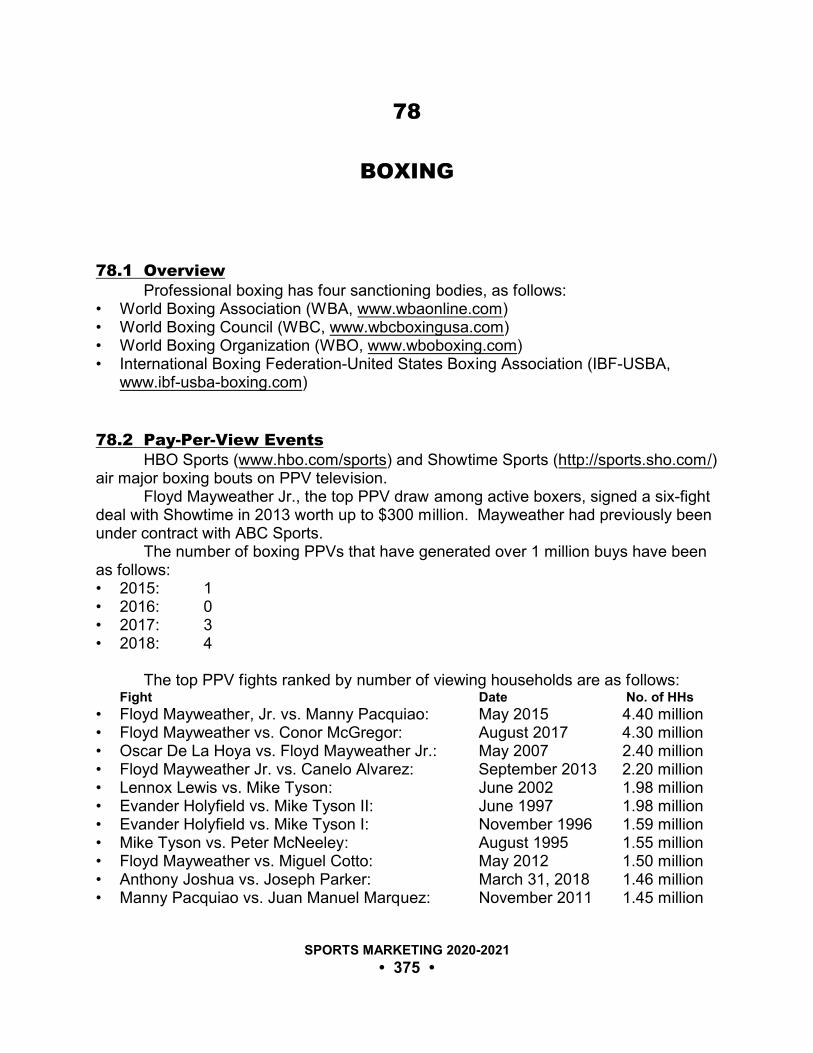
78
BOXING
78.1 OverviewProfessional boxing has four sanctioning bodies, as follows:
• World Boxing Association (WBA, www.wbaonline.com)• World Boxing Council (WBC, www.wbcboxingusa.com)• World Boxing Organization (WBO, www.wboboxing.com)• International Boxing Federation-United States Boxing Association (IBF-USBA,
www.ibf-usba-boxing.com)
78.2 Pay-Per-View EventsHBO Sports (www.hbo.com/sports) and Showtime Sports (http://sports.sho.com/)
air major boxing bouts on PPV television.Floyd Mayweather Jr., the top PPV draw among active boxers, signed a six-fight
deal with Showtime in 2013 worth up to $300 million. Mayweather had previously beenunder contract with ABC Sports.
The number of boxing PPVs that have generated over 1 million buys have beenas follows:• 2015: 1• 2016: 0• 2017: 3• 2018: 4
The top PPV fights ranked by number of viewing households are as follows:Fight Date No. of HHs
• Floyd Mayweather, Jr. vs. Manny Pacquiao: May 2015 4.40 million• Floyd Mayweather vs. Conor McGregor: August 2017 4.30 million• Oscar De La Hoya vs. Floyd Mayweather Jr.: May 2007 2.40 million• Floyd Mayweather Jr. vs. Canelo Alvarez: September 2013 2.20 million• Lennox Lewis vs. Mike Tyson: June 2002 1.98 million• Evander Holyfield vs. Mike Tyson II: June 1997 1.98 million• Evander Holyfield vs. Mike Tyson I: November 1996 1.59 million• Mike Tyson vs. Peter McNeeley: August 1995 1.55 million• Floyd Mayweather vs. Miguel Cotto: May 2012 1.50 million• Anthony Joshua vs. Joseph Parker: March 31, 2018 1.46 million• Manny Pacquiao vs. Juan Manuel Marquez: November 2011 1.45 million
SPORTS MARKETING 2020-2021
• 375 •

• Evander Holyfield vs. George Foreman: April 1991 1.42 million• Floyd Mayweather Jr. and Shane Mosley: May 2010 1.40 million• Oscar De La Hoya vs. Felix Trinidad: September 1999 1.40 million• Mike Tyson vs. Frank Bruno II: March 1996 1.37 million• Manny Pacquiao vs. Shane Mosley: May 2011 1.34 million
The May 2015 bout between Floyd Mayweather, Jr. and Manny Pacquiao wasthe most-watched PPV fight of all time. It was also the most lucrative, generating $418million in PPV sales. Including all revenue streams, the fight generated more than $500million, according to HBO and Showtime.
78.3 Televised BoxingAll of the major networks have air some boxing programming. The longest-
running program is Friday Night Fights, broadcast on ESPN2 since 2008. NBC SportsNetwork’s has aired Fight Night since 2012.
According to SportsBusiness Journal, Friday Night Fights typically garners400,000 to 600,000 viewers; Fight Night draws about half that audience.
In 2018, ESPN signed an exclusive deal with boxing promotion company TopRank that includes as many a 54 boxing events a year.
Premier Boxing Champions (PBC), launched in 2015, brokered cards scheduledacross all four of the United States' major television networks (ABC, CBS, Fox, NBC)and their affiliated sports-oriented cable networks (ESPN, CBS Sports Network, FS1,and NBCSN, respectively), as well as Spike and Bounce TV.
PBC viewership in 2018 was as follows: Shows Avg. No. Viewers
• CBS: 2 2.75 million• NBC: 3 2.45 million• Fox: 3 1.75 million• Spike: 7 538,000• Showtime: 10 452,000• ESPN: 7 418,000• Bounce: 4 397,000• NBC Sports Network: 3 237,000• FS1: 15 189,000
The following were the most-watched TV boxing matches in 2018:• Terence Crawford vs. Jose Benavidez Jr. (Oct. 13): 2.25 million ESPN• Vasiliy Lomachenko vs. Guillermo Rigondeaux (Dec. 9): 1.73 million ESPN• Vasiliy Lomachenko vs. Jorge Linares (May 12): 1.44 million ESPN• Gennady Golovkin vs. Vanes Martirosyan (May 5): 1.25 million HBO• Andre Berto vs. Devon Alexander (Aug. 4): 1.19 million Fox• Devon Alexander vs. Victor Ortiz (Feb. 17): 1.14 million Fox• Oscar Valdez vs. Scott Quigg (March 11): 1.08 million ESPN
SPORTS MARKETING 2020-2021
• 376 •

• Deontay Wilder vs. Luis Ortiz (March 3): 1.06 million Showtime• Miguel Cotto vs. Sadam Ali (Dec. 2): 961,000 HBO• Sergey Kovalev vs. Vyacheslav Shabranskyy (Nov. 25): 869,000 HBO• Josesito Lopez vs. Miguel Cruz (April 28): 839,000 Fox• Deontay Wilder vs. Bermane Stiverne (Nov. 4): 824,000 Showtime• Daniel Jacobs vs. Maciej Sulecki (April 28): 811,000 HBO• Adrien Broner vs. Jessie Vargas (April 21): 782,000 Showtime• Jaime Munguia vs. Liam Smith (July 21): 777,000 HBO• Gilberto Ramirez vs. Habib Ahmed (Feb. 3): 741,000 ESPN• Lucas Matthysse vs. Tewa Kiram (Jan. 27): 719,000 HBO• Billy Joe Saunders vs. David Lemieux (Dec. 16): 716,000 HBO• Sadam Ali vs. Jaime Munguia (May 12): 711,000 HBO• Daniel Jacobs vs. Luis Arias (Nov. 11): 706,000 HBO• Raymundo Beltran vs. Paulus Moses (Feb. 16): 703,000 ESPN• Jessie Magdaleno vs. Isaac Dogboe (April 28): 701,000 ESPN
78.4 Boxing FansThe popularity of professional boxing in the United States has remained
relatively unchanged throughout the past decade. According to an ESPN Sports Poll, 37% of adults who follow sports are fans of
boxing.In a recent Harris Poll (www.theharrispoll.com), 2% of adults said boxing is their
favorite sport.Boxing is most popular among men ages 18-to-49 and Hispanic-Americans.
Experian (www.experian.com) and SportsBusiness Journal provide the followingassessment:
Hispanic Non-Hisp. U.S. Avg.
• Viewed any boxing program in past year: 29% 12% 15%• Viewed any pay-per-view (PPV) sports in the past year: 16% 7% 9%• Viewed boxing on PPV in the past year: 13% 2% 4%• Viewed HBO boxing within the past four weeks: 10% 3% 5%• Viewed HBO boxing within the past week: 8% 3% 4%
A survey by Scarborough Research (www.scarborough.com) reported 5.3% ofadults are avid fans of professional boxing. The following metropolitan areas have thehighest percentage of avid fans:• Harlington-McAllen, TX: 17.2%• El Paso, TX: 11.6%• Fresno, CA: 11.5%• Bakersfield, CA: 11.0%• San Antonio, TX: 10.9%• Los Angeles, CA: 9.7%• Memphis, TN: 9.4%
SPORTS MARKETING 2020-2021
• 377 •

• Las Vegas, NV: 9.2%• Albuquerque-Santa Fe, NM: 8.1%• Honolulu, HI: 7.9%
SPORTS MARKETING 2020-2021
• 378 •

79
ULTIMATE FIGHTING CHAMPIONSHIP
79.1 OverviewMixed martial arts (MMA) has surpassed boxing as the biggest sports draw in Las
Vegas. Ultimate Fighting Championship (UFC, www.ufc.com) is the premier MMA league.Previously owned by Las Vegas-based Zuffa LLC., UFC was acquired by
Endeavor, Silver Lake Partners, and Kohlberg Kravis Roberts in 2016 for $4 billion.UFC revenue was over $600 million in 2018, according to Moody’s.
79.2 Live EventsMatches of the Ultimate Fighting Championship circuit frequently sell out venues
like the Mandalay Bay Events Center and MGM Grand Garden Arena, both in Las Vegasand with a capacity of more than 10,000. Events are also held at larger venues likeRogers Centre (Toronto) and Bell Centre (Montreal).
The largest UFC gates have been as follows: Date Venue Gate
• UFC 205: November 2016 Madison Square Garden $17.7 million• UFC 229: October 2018 T-Mobile Arena $17.2 million• UFC 129: April 2010 Rogers Centre $12.1 million• UFC 200: July 2016 T-Mobile Arena $10.7 million• UFC 194: December 2015 MGM Grand $10.0 million• UFC 196: March 2016 MGM Grand $ 8.1 million• UFC 202: August 2016 T-Mobile Arena $ 7.7 million• UFC 189: July 2015 MGM Grand $ 7.2 million• UFC 148: July 2012 MGM Grand $ 6.9 million• UFC 193: November 2015 Etihad Stadium (Australia) $ 6.8 million• UFC 168: December 2013 MGM Grand $ 6.2 million• UFC 66: December 2006 MGM Grand $ 5.4 million• UFC 187: May 2015 MGM Grand $ 5.2 million• UFC 100: July 2009 Mandalay Bay $ 5.1 million• UFC 83: March 2008 Bell Centre $ 5.1 million
79.3 Pay-Per-View EventsUFC’s pay-per-view events typically draw 400,000 to 500,000 buys, according to
SPORTS MARKETING 2020-2021
• 379 •

Multichannel News. Buys for 20 monthly events have surpassed 700,000. The best-selling events have been as follows (source: UFC): Date Main Event Buys
• UFC 229: October 2018 Nurmagomedov vs. McGregor 2.50 million• UFC 202: August 2016 McGregor vs. Diaz II 1.65 million• UFC 100: July 2009 Lesnar vs. Mir 1.60 million• UFC 196: March 2016 McGregor vs. Diaz 1.50 million• UFC 194: December 2015 McGregor vs. Alto 1.40 million• UFC 205: November 2016 Alvarex vs. McGregor 1.30 million• UFC 116: July 2010 Lesnar vs. Carwin 1.12 million• UFC 158: March 2013 St-Pierre vs. Diaz 1.10 million• UFC 168: December 2013 Weidman vs. Silva 2 1.10 million• UFC 193: November 2015 Rousey vs. Holm 1.10 million• UFC 207: December 2016 Nunes vs. Rousey 1.10 million• UFC 66: December 2006 Liddell vs. Ortiz II 1.05 million• UFC 121: October 2010 Lesnar vs. Velasquez 1.05 million• UFC 91: November 2008 Couture vs. Lesnar 1.01 million• UFC 92: December 2008 The Ultimate 2008 1.00 million• UFC 148: July 2012 Silva vs. Sonnen II 1.00 million
ESPN and UFC announced in March 2019 that UFC’s PPV events will bebroadcast exclusively on the network’s ESPN+ digital subscription service through 2025. A subscription to ESPN+, accessed through the company’s mobile app or ESPN.com at$4.99 per month or $49.99 per year is required. As part of the PPV deal, new ESPN+subscribers can purchase a one-year subscription for $79.99, which includes one UFCPPV event. For existing ESPN+ subscribers, the UFC PPVs will cost $59.99, $5 less thanwhat UFC previously charged for the cards.
_________________________________________________________________
“The move gives ESPN a valuable chunk ofcontent for its fledgling streaming service,which was launched last April in an attempt tostem the loss of revenue from cable subscriberswho have cut the cord.”
SportsBusiness Journal, 3/18/19 _________________________________________________________________
SPORTS MARKETING 2020-2021
• 380 •

79.4 UFC On TVIn 2011, UFC and Fox agreed to a seven-year broadcast rights deal valued at an
estimated $90 million a year.UFC on Fox averaged 1,867,000 viewers in 2018.
79.5 MMA FansAccording to a recent ESPN Sports Poll, 36% of adults who follow sports are
fans of mixed martial arts.Scarborough Research (www.scarborough.com) reported the following
distribution of mixed martial arts fans:Gender• Male: 74.6%• Female: 25.4%
Age• 18-to-29: 36.5%• 30-to-44: 37.1%
• 45-to-64: 21.7%• 65 and older: 4.4%
According to Scarborough Research, 5.1% of adults are avid UFC fans. UFC ismost popular in the following metropolitan areas:• Honolulu, HI: 10.9%• Bakersfield, CA: 9.2%• El Paso, TX: 8.9%• Fresno, CA: 8.7%• Mobile, AL-Pensacola, FL: 8.5%• Memphis, TN: 8.5%• Albany, NY: 7.8%• Colorado Springs, CO: 7.7%• Las Vegas, NV: 7.6%• Jacksonville, FL: 7.4%
79.6 SponsorsReebok became the exclusive outfitter for the UFC in a $70 million, six-year
partnership that began in July 2015. Under the sponsorship agreement, third-partylogos will no longer be allowed on UFC broadcasts. The bulk of the sponsorshiprevenue is paid directly to UFC fighters. Fighters will also receive royalty paymentsrepresenting 20% of any UFC merchandise sold that bears their likeness.
SPORTS MARKETING 2020-2021
• 381 •

79.7 Market ResourcesUltimate Fighting Championship, 2960 West Sahara Avenue, Suite 100, Las Vegas, NV89102. (702) 221-4780. (www.ufc.com)
SPORTS MARKETING 2020-2021
• 382 •

80
WORLD WRESTLING ENTERTAINMENT
80.1 OverviewWorld Wrestling Entertainment (WWE, www.wwe.com) is the top producer of
wrestling events. The fact that WWE events are scripted productions rather than truesports competitions does not diminish their popularity. From a sports marketingperspective, WWE is noteworthy for its success with a wide range of entertainment andmedia formats. In addition to live events, broadcast television, and pay-per-view (PPV)television, WWE generates revenue from film, music, product licensing, and directproduct sales.
World Wrestling Entertainment Inc. (stock symbol: WWE) has reported revenueand operating income as follows:
Revenue Operating Income
• 2005: $366 million $ 50 million• 2006: $263 million $ 39 million• 2007: $486 million $ 68 million• 2008: $526 million $ 70 million• 2009: $475 million $ 77 million• 2010: $447 million $ 82 million• 2011: $484 million $ 37 million• 2012: $484 million $ 43 million• 2013: $508 million $ 6 million• 2014: $543 million <$ 42 million>• 2015: $659 million $ 39 million• 2016: $729 million $ 56 million• 2017: $801 million $ 76 million• 2018: $903 million $114 million
WWE revenue is distributed by source as follows:• Pay-per-view: 17%• Domestic television rights fees: 12%• Live events, North America: 12%• DVDs: 11%• Live events, international: 8%• International television rights fees: 7%• Digital media: 7%• Other: 26%
SPORTS MARKETING 2020-2021
• 383 •

International business generates approximately 28% of WWE’s revenue. Ofthis, about $40 million is from 74 international shows, which have an averageattendance of 7,800.
80.2 Live Events and TelevisionA perpetual traveling roadshow that crisscrosses the nation while broadcasting
from packed arenas 52 weeks a year, WWE draws more than two million fans eachyear. And each week, wrestling shows attract up to 15 million television viewers,making them a fixture among the top-rated cable programs.
80.3 The WWE NetworkIn 2014, WWE launched The WWE Network, a 24/7 streaming network. The
network includes past and present WWE shows, pay-per-views, and shows from theWWE Library. The subscription cost is $9.99 monthly.
The WWE Network averaged 1.58 million paid subscribers in First Quarter 2019.
80.4 Pay-Per-View EventsWWE produces 12 pay-per-view (PPV) events annually and is the largest
provider of PPV live-event programming in the U.S.The 2019 WWE pay-per-view schedule was as follows:
• January 27: Royal Rumble (Phoenix, AZ)• February 17: Elimination Chamber (Houston, TX)• March 10: Fastlane (Cleveland, OH)• April 7: WrestleMania 35 (East Rutherford, NJ)• May 19 Money in the Bank (Hartford, CT)• June 7: Super ShowDown (Jeddah, Saudi Arabia)• June 23: Stomping Grounds (Tacoma, WA)• July 14: Extreme Rules (Philadelphia, PA)• August 11: SummerSlam (Toronto, ON, Canada)• September 15: Clash of Champions (Charlotte, NC)• October 6: Hell in a Cell (Sacramento, CA)• November 1: Crown Jewel (Riyadh, Saudi Arabia)• November 24: Survivor Series (Rosemont, IL)• December 15: TLC: Tables, Ladders, Chairs (Minneapolis, MN)
PPV buys for WrestleMania, WWE’s premier annual event, peaked at 1.22million in 2012. PPV buys have dropped since 2013 because fans can now watch onthe WWE Network. Approximately 40% of WrestleMania PPV buys are international.
SPORTS MARKETING 2020-2021
• 384 •
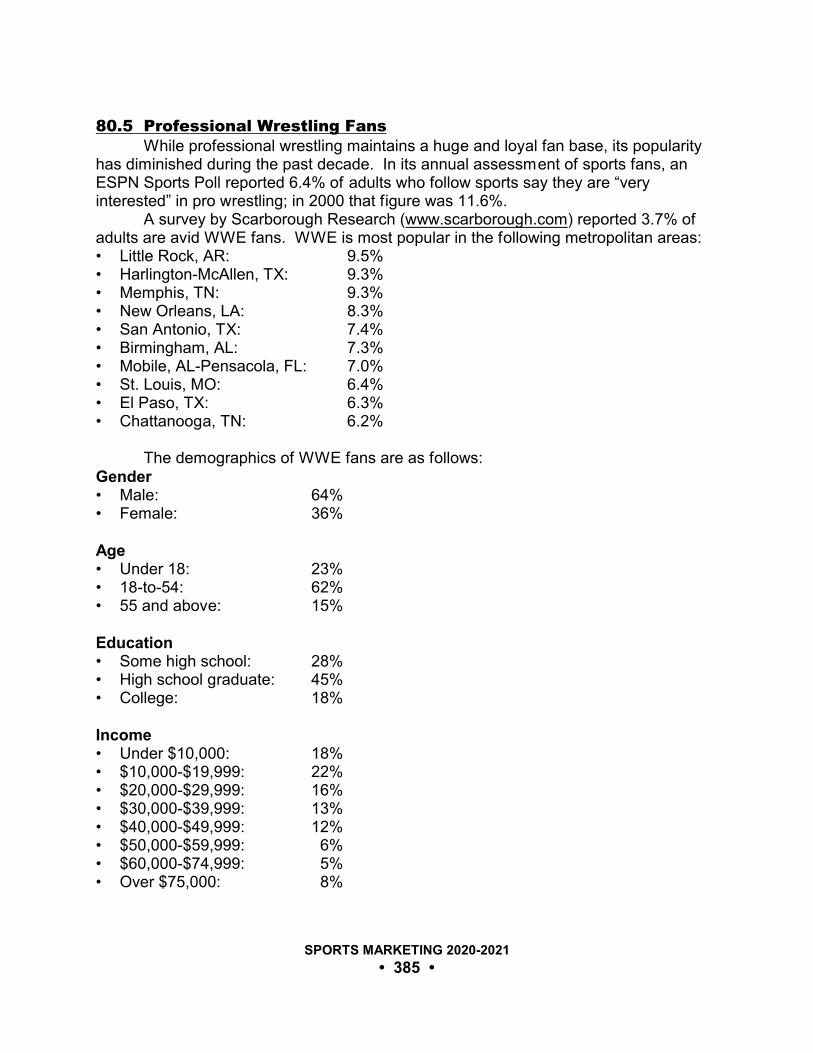
80.5 Professional Wrestling FansWhile professional wrestling maintains a huge and loyal fan base, its popularity
has diminished during the past decade. In its annual assessment of sports fans, anESPN Sports Poll reported 6.4% of adults who follow sports say they are “veryinterested” in pro wrestling; in 2000 that figure was 11.6%.
A survey by Scarborough Research (www.scarborough.com) reported 3.7% ofadults are avid WWE fans. WWE is most popular in the following metropolitan areas:• Little Rock, AR: 9.5%• Harlington-McAllen, TX: 9.3%• Memphis, TN: 9.3%• New Orleans, LA: 8.3%• San Antonio, TX: 7.4%• Birmingham, AL: 7.3%• Mobile, AL-Pensacola, FL: 7.0%• St. Louis, MO: 6.4%• El Paso, TX: 6.3%• Chattanooga, TN: 6.2%
The demographics of WWE fans are as follows:Gender• Male: 64%• Female: 36%
Age• Under 18: 23%• 18-to-54: 62%• 55 and above: 15%
Education• Some high school: 28%• High school graduate: 45% • College: 18%
Income • Under $10,000: 18%• $10,000-$19,999: 22%• $20,000-$29,999: 16%• $30,000-$39,999: 13%• $40,000-$49,999: 12%• $50,000-$59,999: 6%• $60,000-$74,999: 5%• Over $75,000: 8%
SPORTS MARKETING 2020-2021
• 385 •

80.6 Market ResourcesWorld Wrestling Entertainment, 1241 East Main Street, Stamford, CT 06902. (203) 352-8600. (www.wwe.com)
SPORTS MARKETING 2020-2021
• 386 •

PART X: GOLF
SPORTS MARKETING 2020-2021
• 387 •

81
GOLF PARTICIPATION
81.1 ParticipationThere are 105 million self-professed golf fans and 36 million people have played.According to Golf Participation in the U.S., by the National Golf Foundation
(NGF, www.ngf.org), there are 24.1 million golfers in the U.S. ages 6 and up, a figurethat has remained relatively unchanged since 2012. Approximately 37 millionnon-golfers say they are interested in taking up the game.
Total golf participation in 2018 was 32.1 million. The NFG reported that 23.8million people played golf on a course in 2018, about the same as in 2016. Another 8.3million participated solely at off-course locations such as Topgolf.
_________________________________________________________________
“More consumers are being drawn to off-courseattractions such as Topgolf, the entertainment-themed ranges that mix chip shots with musicand drinks, or other driving ranges andsimulators. Getting them to a regular golfcourse is another story.”
SportsBusiness Journal, 5/21/18 _________________________________________________________________
An estimated 456 million rounds of golf were played in 2018, a slight drop from466 million rounds in 2015.
81.2 SpendingThe National Golf Foundation estimates that golfers spend $19.7 billion on public
and private green fees and dues each year. On equipment (clubs, balls, bags, gloves,shoes) golfers spend $4.7 billion. Golfers spend about $16 billion a year on golf travel,75% of which goes to the hotel, transportation, and food and beverage industries.
SPORTS MARKETING 2020-2021
• 388 •

_________________________________________________________________
“Golf has a tremendous impact on the U.S.economy. Golf is roughly a $69 billion annualindustry in the U.S.”
Ted Bishop, President PGA of America
_________________________________________________________________
81.4 DemographicsPercentages of select demographics that played on-course golf in 2018 were as
follows (source: NGF):• Juniors (ages 6-to-17): 11%• Young adults (18-to-34): 26%• Women: 24%• Non-Caucasian: 18%• Ages 65 and older: 15%
Women make up 19% of what the National Golf Foundation defines as coregolfers – those playing at least eight rounds of golf a year. The average age of femalegolfers is 40.7. Core female golfers average 18.0 rounds a year.
81.5 Market ResourcesGolf Datatech, 204 South Rose Avenue, Kissimmee, FL 34741. (888) 944-4116. (www.golfdatatech.com)
National Golf Foundation, 501 N. Highway A1A, Jupiter, FL 33477. (561) 744-6006. (www.ngf.org)
SPORTS MARKETING 2020-2021
• 389 •

82
GOLF COURSES
82.1 Number Of Golf CoursesIn 2018, there were 14,118 golf courses (includes regulation, executive and
par-3 courses) in the U.S. (measured in 18-hole equivalents, meaning number of golfholes divided by 18), according to the National Golf Foundation (NGF, www.ngf.org). There were 15,014 golf facilities in the U.S. (a facility is defined as a business locationwhere golf can be played on one or more golf courses).
The following are the states with the most golf courses:• Florida: 1,157• California: 873• Michigan: 777• New York: 734• Texas: 721
82.2 Top Golf CoursesGolf ranks the top golf courses in the United States as follows:
1. Pine Valley (Pine Valley, NJ)2. Cypress Point (Pebble Beach, CA)3. Augusta National (Augusta, GA)4. Shinnecock Hills (Southampton, NY)5. Pebble Beach (Pebble Beach, CA)6. Oakmont (Oakmont, PA)7. National Golf Links of America (Southampton, NY)8. Merion East (Ardmore, PA)9. Sand Hills (Mullen, NE)10. Pinehurst No. 2 (Pinehurst, NC)
Golf Digest ranked the following as the top U.S. golf courses in its 2019-2020biennial ranking:1. Pine Valley (Pine Valley, NJ)2. Augusta National (Augusta, GA)3. Cypress Point (Pebble Beach, CA)4. Shinnecocck Hills (Southampton, NY)5. Oakmont (Oakmont, PA)
SPORTS MARKETING 2020-2021
• 390 •

6. Merion East (Ardmore, PA)7. Pebble Beach (Pebble Beach, CA)8. National Golf Links of America (Southampton, NY)9. Sand Hills (Mullen, NE)10. Fishers Island Club (Fisher’s Island, NY)
SPORTS MARKETING 2020-2021
• 391 •

83
MEN’S TOUR
83.1 OverviewThe United States Golf Association (USGA, www.usga.org) is the governing
body for golf in the U.S. The USGA sanctions the United States’ nationalchampionships, including the U.S. Open, the U.S. Women’s Open, the U.S. SeniorOpen, 10 national amateur championships, and the State Team Championships.
The Professional Golfer’s Association of America (PGA, www.pga.com) is anassociation of 28,000 golf professionals, the vast majority of whom oversee thebusiness operations at 10,000 golf facilities nationwide. The PGA of America alsoconducts several premier golf events, such as the PGA Championship, Ryder Cup,Senior PGA Championship, and PGA Grand Slam of Golf.
The PGA Tour (www.pgatour.com), which branched off from the PGA of Americain 1968, conducts weekly tournaments throughout the calendar year.
83.2 Highest-Earning GolfersForbes ranked the highest-earning golfers in 2018 as follows:
Winnings Endorsements Total
• Tiger Woods: $ 1.3 million $42.0 million $43.3 million• Phil Mickelson: $ 4.3 million $37.0 million $41.3 million• Jordan Spieth: $11.2 million $30.0 million $41.2 million• Rory McIlroy: $ 3.7 million $34.0 million $37.7 million• Justin Thomas: $21.0 million $ 5.0 million $26.0 million
Leading tournament money winners in 2018 were as follows (source: PGA):• Justin Thomas: $8,694,821• Dustin Johnson: $8,457,352• Justin Rose: $8,130,678• Bryson DeChambeau: $8,094,489• Brooks Koepka: $7,094,047• Bubba Watson: $5,793,748• Tony Finau: $5,620,138• Tiger Woods: $5,443,841• Webb Simpson: $5,376,417• Jason Day: $5,087,461
SPORTS MARKETING 2020-2021
• 392 •

83.3 The PGA TourThe PGA Tour had 46 tournaments on its 2018-2019 schedule, with prize money
totaling $389.35 million.Awarded since 2007, the FedEx Cup is the championship trophy for the PGA
Tour.
_________________________________________________________________
“The race for the FedEx Cup is a story thatcontinues throughout the entire season and itculminates in what makes for an exciting finishto the end of the season.”
Sean McManus, Chairman CBS Sports SportsBusiness Journal
_________________________________________________________________
Events of the 2018-2019 PGA Tour were as follows:• October 4-7: Safeway Open (Napa, CA)• October 11-14: CIMB Classic (Kuala Lumpur, Malaysia)• October 18-21: CJ Cup at Nine Bridges (Jeju Island, South Korea)• October 25-28: WGC-HSBC Champions (Shanghai, China)• October 25-28: Sanderson Farms Championship (Jackson, MS)• November 1-4: Shriners Hospital Open (Las Vegas, NV)• November 8-11: Mayakoba Golf Classic (Playa del Carmen, Mexico)• November 15-18: RSM Classic (St. Simons Island, GA)• January 3-6: Sentry Tournament of Champions (Kapalua, HI)• January 10-13: Sony Open (Honolulu, HI)• January 17-20: Desert Classic (La Quinta, CA)• January 24-27: Farmers Insurance Open (La Jolla, CA)• January 31-
February 3: Waste Management Phoenix Open (Scottsdale, AZ)• February 7-10: AT&T Pebble Beach Pro-Am (Pebble Beach, CA)• February 14-17: Genesis Open (Pacific Palisades, CA)• February 21-24: WGC-Mexico Championship (Mexico City, Mexico)• February 21-24: Puerto Rico Open (Rio Grande, Puerto Rico)• February 28-March 3: Honda Classic (Palm Beach Gardens, FL)• March 7-10: Arnold Palmer Invitational (Orlando, FL)• March 14-17: Players Championship (Ponte Vedra Beach, FL)• March 21-24: Valspar Championship (Palm Harbor, FL)
SPORTS MARKETING 2020-2021
• 393 •

• March 28-31: WGC-Dell Technologies Match Play (Austin, TX)• March 28-31: Corales Puntacana Resort & Club Championship (Punta
Cana, Dominician Republic)• April 4-7: Valero Texas Open (San Antonio, TX)• April 11-14: Masters Tournament (Augusta, GA)• April 18-21: RBC Heritage (Hilton Head Island, SC)• April 25-28: Zurich Classic: TPC Louisiana (Avondale, LA)• May 2-5: Wells Fargo Championship (Charlotte, NC)• May 9-12: AT&T Byron Nelson (Dallas, TX)• May 16-19: PGA Championship (Farmingdale, NY)• May 23-26: Charles Schwab Challenge (Fort Worth, TX)• May 30-June 2: The Memorial Tournament (Dublin, ON, Canada)• June 6-9: RBC Canadian Open (Hamilton, ON, Canada)• June 13-16: U.S. Open (Pebble Beach, CA)• June 20-23: Travelers Championship (Cromwell, CT)• June 27-30: Rocket Mortgage Classic (Detroit, MI)• July 4-7: 3M Open (Blaine, MN)• July 11-14: John Deere Classic (Silvis, IL)• July 18-21: The Open (Portrush, Northern Ireland)• July 18-21: Barbasol Championship (Nicholasville, KY)• July 25-28: WGC-FedEx St. Jude Invitational (Memphis, TN)• July 25-28: Reno-Tahoe Tournament (Reno, NV)• August 1-4: Wyndham Championship (Greensboro, NC)FedEx Cup Playoffs• August 8-11: The Northern Trust (Jersey City, NJ)• August 15-18: BMW Championship (Medinah, IL)• August 22-25: Tour Championship (Atlanta, GA)• December 12-15: Presidents Cup (Melbourne, Australia)
83.4 The Major ChampionshipsThe Major Championships are as follows:
• The Masters• U.S. Open Championships• The British Open Championship• PGA Championship
These four events are assessed in Chapter 85 of this handbook.
83.5 Broadcast RightsIn 2006, the PGA Tour signed broadcast rights deals with CBS Sports, NBC
Sports, and Golf Channel through 2012. Rights with all three broadcasters were
SPORTS MARKETING 2020-2021
• 394 •

extended through 2022. In 2013, the U.S. Golf Association signed a 12-year multimedia deal with Fox
network and Fox Sports 1 to be the domestic broadcast partner for the U.S. Open andother USGA championships beginning in 2015. The deal was reported at about $100million a year, more than double the previous contract.
83.6 SponsorsUSGA Partners in 2019 were American Express, Cisco, Deloitte, Lexus, and
Rolex.PGA Tour Corporate Partners in 2019 were AON, Astellas, Avis Car Rental, BH
Sports, Bridgestone, Carey, CDW, Charles Schwab, Citi, Coca-Cola, Cologuard,EZlinks Golf, FedEx, Fortune, Getty Images, Golf Digest, Grant Thornton, Grey Goose,Hawaii Tourism Authority, John Deere, Konica Minolta, Korn Ferry, MackenzieInvestments, Mastercard, MD Anderson, MetLife, Michelob Ultra, Mitsubishi Electric,Morgan Stanley, NetJets, O'Doul's, Omni Hotels & Resorts, Rocket Mortgage byQuicken Loans, Rolex, Servpro, Southern Company, Teeoff.com by PGA Tour,ThriveHive, Tiffany & Co., Travelers, United Airlines, United Rentals, USA Today, andValspar.
83.7 Market ResourcesNational Golf Foundation, 501 N. Highway A1A, Suite 401, Jupiter, FL 33477. (561) 744-6006. (www.ngf.org)
PGA Tour, 100 PGA Tour Boulevard, Ponte Vedra Beach, FL 32082. (904) 285-3700.(www.pgatour.com)
The PGA of America, 100 Avenue of the Champions, Palm Beach Gardens, FL 33418.(561) 624-8400. (www.pga.com)
United States Golf Association, P.O. Box 708, Far Hills, NJ 07931. (908) 234-2300. (www.usga.org)
SPORTS MARKETING 2020-2021
• 395 •

84
WOMEN’S TOUR
84.1 OverviewThe Ladies Professional Golf Association (LPGA, www.lpga.com), the primary
organization for female professional golfers in the United States, hosts the LPGA Tour.
84.2 Highest-Earning GolfersBy season, leading money winners were as follows (source: LPGA):
Player Win Total
• 2005: Annika Sörenstam $2,588,240• 2006: Lorena Ochoa $2,592,872• 2007: Lorena Ochoa $4,364,994• 2008: Lorena Ochoa $2,754,660• 2009: Jiyai Shin $1,807,334• 2010: Na Yeon Choi $1,871,166• 2011: Yani Tseng $2,921,713• 2012: Inbee Park $2,287,080• 2013: Inbee Park $2,456,619• 2014: Stacy Lewis $2,539,039• 2015: Lydia Ko $2,800,802• 2016: Ariya Jutanugarn $2,550,928• 2017: Sung Hyun Park $2,335,883• 2018: Ariya Jutanugarn: $2,550,928
Leading tournament money winners in 2018 were as follows (source: LPGA:• Lydia Ko: $2,492,994• Brooke M. Henderson: $1,724,409• In Gee Chun: $1,501,102• Shanshan Feng: $1,458,579• Sei Young Kim: $1,445,937• Anna Nordqvist: $1,424,685• Ha Na Jang: $1,383,575• Brittany Lang: $1,259,787• So Yeon Ryu: $1,259,485
SPORTS MARKETING 2020-2021
• 396 •

84.3 The LPGA TourThe 2019 LPGA Tour, which launched January 14, included 33 tournaments,
13 of which were held outside the United States. All LPGA tournaments are part of aplayoff system, leading up to the CME Group Tour Championship.
The following are the U.S.-based 2019 LPGA Tour tournaments:• January 20: Diamond Resorts Tournament of Champions (Lake
Buena Vista, FL)• March 8-24: Bank of Hope Founders Cup (Phoenix, AZ)• March 25-31: Kia Classic (Carlsbad, CA)• April 1-7: ANA Inspiration (Rancho Mirage, CA)• April 15-20: LOTTE Championship (Oahu, HI)• April 22-28: Hugel-Ar Premia LA Open (Los Angeles, CA)• April 29-May 5: LPGA Mediheal Championship (Daly City, CA)• May 20-26: Pure Silk Championship (Williamsburg, VA)• May 27-June 2: U.S. Women’s Open (Charleston, SC)• June 3-9: ShopRite LPGA Classic (Galloway, NJ)• June 10-16: Meijer LPGA Classic for Simply Give (Grand Rapids, MI)• June 17-23: KPMG Women’s PGA Championship (Chaska, MN)• June 24-30: Walmart NW Arkansas Championship (Rogers, AR)• July 1-7: Thornberry Creek LPGA Classic (Oneida, WI)• July 8-14: Marathon Classic Presented by Dana (Sylvania, OH)• July 17-20: Dow Great Lakes Bay Invitational (Midland, MI)• August 26-September 1: Cambia Portland Classic (Portland, OR)• September 23-29: Indy Women in Tech Championship (Indianapolis, IN)• September 30-October 6: Volunteers of America Classic (The Colony, TX)• November 18-24: CME Group Tour Championship (Naples, FL)
Total prize money for the LPGA Tour in 2019 was $70.6 million, up from the$65.4 million purse in 2018.
84.4 Grand SlamFive events comprise the LPGA Grand Slam, as follows:
• U.S. Women’s Open• KPMG Women’s PGA Championship• RICOH Women’s British Open• ANA Inspiration• The GME Group Tour Championship
84.5 Broadcast RightsLPGA Tour events are broadcast by ESPN/ESPN2 and Golf Channel.
SPORTS MARKETING 2020-2021
• 397 •

84.6 SponsorsLPGA Corporate Partners in 2019 were 18Birdies, Acer, All Nippon Airways,
Andrews Sports Medicine & Orthopaedic Center, Aon, Arpin Van Lines, AXA XL,Consumer Cellular, Dormie Network, DOW, Getty Images, Global Rescue, Golfzon,HotelPlanner.com, Leaders Cosmetics, MailChimp, National Car Rental, NEC, ParadiseCity, PureSilk, Rolex, Jeju SamDaSoo, The J.M. Smucker Co., Titleist, TransPerfect,Versant Health, and Weatherman.
84.7 Market ResourcesLadies Professional Golf Association, 100 International Golf Drive, Daytona Beach, FL 32124. (386) 274-6200. (www.lpga.com)
SPORTS MARKETING 2020-2021
• 398 •

85
MAJOR TOURNAMENTS
85.1 OverviewThe Major Championships, generally referred to simply as ‘The Majors,’ are the
most prestigious annual tournaments in professional golf. The Majors are as follows:• The Masters• U.S. Open Championships• The British Open Championship• PGA Championship
Along with the Majors, the biennial Ryder Cup and Presidents Cup teamcompetitions are marquee golf tournaments.
85.2 The MastersThe Masters (www.masters.org) is hosted in April as an invitational and played at
Augusta National Golf Club (www.augusta.com). The Masters operates under one-year broadcast rights contracts; CBS has been
the tournament’s TV partner every year since 1956. ESPN televises the first andsecond rounds. Viewership for the final round has been as follows:• 2015: 14.0 million• 2016: 12.4 million• 2017: 11.1 million• 2018: 13.0 million• 2019: 10.8 million
Average viewership was low in 2019 because the match was interrupted byweather. The final round peaked with 18.3 million viewers as Tiger Woods won his 5th
Masters title.CBS Sports reported that the 2019 f inal round was the most-streamed Masters
ever, with 1 billion total minutes streamed and an average per-minute audience of447,000 across the CBS Sports and The Masters websites and mobile apps.
TV advertising revenue for the 2019 Masters on CBS and ESPN was $34.1million, according to iSpot.tv, an increase from $24.2 million the year prior.
SPORTS MARKETING 2020-2021
• 399 •

85.3 U.S. Open ChampionshipsU.S. Open Championships (www.usopen.com), played in June, is hosted by the
USGA and played at various locations throughout the U.S. The United States Golf Association estimates the U.S. Open has an annual
economic impact of $125 million to $150 million on the region hosting the tournament.SportsBusiness Journal estimates annual revenue for the tournament at $100
million, including $40 million from domestic and international television revenue, $20million in ticket sales, $15 million from corporate hospitality, $15 million in merchandisesales, and $5 million in food and beverage sales. Expenses are estimated at about $50million.
The 119th U.S. Open Championship was held June 13-16, 2019, at PebbleBeach Golf Links (Pebble Beach, CA). The purse was $12.5 million.
The final round on Fox averaged 7.3 million viewers and peaked at 10.2 millionviewers, the best final round performance since 2013, according to Nielsen.
Fox Sports’ fifth presentation of the U.S. Open Championship in 2019 averaged3.7 million viewers across all four rounds, a 28% increase from the previous year.
85.4 The British Open ChampionshipThe [British] Open Championship (www.theopen.com), played in July and hosted
by the R&A (which takes its name from The Royal and Ancient Golf Club of St.Andrews), is played on a links course at various locations in the U.K.
In 2018, final round coverage of the British Open had 6.5 million viewers in theU.S. on NBC. Sparked by a large following for Tiger Woods, it was the highestviewership in 18 years.
Tiger Woods missed the cut in 2019, as did fellow stars Phil Mickelson and RoryMcIlroy. U.S. viewership dropped to 3.8 million.
_________________________________________________________________
“No Tiger and no drama meant a steep declinein ratings for the British Open. Sunday’s finalround of the British Open on NBC was down42% from last year. Overall, it is the fifth-lowestfor final round coverage since 1995, ahead ofonly 2010, 2011, 2014 and 2015.”
Sports Media Watch, 7/22/19 _________________________________________________________________
SPORTS MARKETING 2020-2021
• 400 •

85.5 PGA ChampionshipThe PGA Championship is hosted by the Professional Golfers’ Association of
America and is played in August at various locations in the U.S. The 101st PGA Championship took place May 16-19, 2019, at Bethpage State
Park, Black Course (Farmingdale, NY). The purse was $11.0 million.CBS and TNT have long-term broadcast rights contracts for the PGA
Championship. Viewership of the final round on CBS has been as follows:• 2017: 4.9 million• 2018: 8.5 million• 2019: 5.0 million
85.6 Ryder CupThe Ryder Cup (www.rydercup.com) is a biennial men’s golf competition
between teams from Europe and the United States. The tournament is jointlyadministered by the PGA of America and Ryder Cup Europe (a joint venture of the PGAEuropean Tour, the PGA of Great Britain and Ireland, and the PGA of Europe). Thevenue alternates between courses in the U.S. and Europe.
In 2016, the 41st Ryder Cup matches were held at Hazeltine National Golf Club(Chaska, MN). Twin Cities Business estimated the event brought $135 million to thelocal economy.
The 42nd Ryder Cup matches were held September 28-30, 2018 on the AlbatrosCourse of Le Golf National in Guyancourt, France.
NBC contracted for broadcast rights for the 2016-2030 matches, with Fridaybeing covered on Golf Channel and on NBC on weekends.
NBC’s final-day coverage in 2018 posted a total audience of 2.7 million viewersacross a 5½-hour telecast, up 23% from the prior Ryder Cup.
Ryder Cup Sponsors are American Express, BMW, Emirates Airline, Ernst &Young, Johnnie Walker, National Car Rental, Omega, RBC, and Rolex.
Future Ryder Cup tournaments are scheduled in the U.S. as follows:• 2020: Whistling Straits, Straits Course (Haven, WI)• 2024: Bethpage State Park, Black Course (Farmingdale, NY)
85.7 Presidents CupThe Presidents Cup (www.presidentscup.com), organized by the PGA Tour and
held biennially since 1994, pits a team from the United States against an internationalteam, excluding Europe. The venue alternates between courses in the U.S. andabroad.
In 2017, the 12th edition of the Presidents Cup golf competition was played atLiberty National Golf Club (Jersey City, NJ).
The 2019 Presidents Cup is scheduled for December 12-25 at Royal MelbourneGolf Club in Melbourne, Australia.
SPORTS MARKETING 2020-2021
• 401 •

The Presidents Cup is broadcast on NBC. Final day coverage of the 2017Presidents Cup had 2.3 million viewers.
Presidents Cup Global Partners are Rolex and Citi. Future U.S. President Cup tournaments are scheduled as follows:
• 2021: Quail Hollow Club (Charlotte, NC)• 2025: TPC Harding Park (San Francisco, CA)
SPORTS MARKETING 2020-2021
• 402 •

PART XI: MOTOR SPORTS
SPORTS MARKETING 2020-2021
• 403 •

86
INDYCAR
86.1 OverviewIndyCar (www.indycar.com) sanctions the NTT IndyCar Series, an open-wheel
racing series. IndyCar is owned by Hulman & Co. (www.hulman.com), which also ownsthe Indianapolis Motor Speedway.
Though spectator sports options are increasing among sports fans, IndyCar hasmaintained a strong following, in large part, because of the enduring popularity of theIndianapolis 500, the recognition of team owners such as racing legends the Foyt andAndretti families, and interest in several current drivers.
IndyCar changed its name from Indy Racing League (IRL) after the 2010 racingseason.
The Indianapolis 500 is assessed in Chapter 38 of this handbook.IndyCar Races, excluding the Indianapolis 500, average more than 35,000
spectators, according to SportsBusiness Journal.
86.2 SponsorsNTT became the IndyCar Series title sponsor in January 2019. Prior title
sponsors were Verizon (2014-2018) and Izod (2009-2013). Annual rights fees areestimated at more than $10 million annually.
IndyCar’s Official Sponsors for the 2019 racing season are AMR, Autodesk,BorgWarner Turbo Systems, Chevrolet, Clabber Girl, Coors Light, Dallara, Firestone,Holmatro, Honda, Honda Generators, Jostens, Larsens, Lincoln Electric, NTT,PerkinElmer, PFC Breaks, Racing Electronics, Safety Kleen, Sherwin-Williams,SiriusXM, Speedway, TAGHeuer, United Rentals, and Xtrac.
86.3 Television and Radio Broadcast RightsNBC Sports Network contracted for the rights to televise a minimum of 13 races
per year from 2009 through 2018. The deal was extended through 2021. NBC SportsNetwork also offers 10 hours each season of IndyCar Series ancillary programmingfocused on drivers and tracks. Select races are broadcast by ABC.
The average number of viewers for recent racing seasons has been as follows:
SPORTS MARKETING 2020-2021
• 404 •

No. of Races Avg. No. Viewers
• 2012: 15 1.22 million• 2013: 19 953,000• 2014: 17 1.02 million• 2015: 16 1.16 million• 2016: 15 1.28 million• 2017: 17 1.14 million• 2018: 16 1.02 million
All IndyCar races have been broadcast on SiriusXM Satellite Radio since 2005.
86.4 Racing TeamsIndyCar teams and main sponsors for 2019 were as follows:
• A.J. Foyt Enterprises: ABC Supply• Andretti Autosport: DHL, Group One, Indiana Donor
Network, NAPA Auto Parts• Andretti Herta Autosport with Curb Agajanian: Ruoff Home Mortgage• Carin Motorsport: Arthur J. Gallagher & Co.
Novo Norodisk• Chip Ganassi Racing: NTT Data, PNC Bank• Dale Coyne Racing: PaySafe, Sealmaster,
Susan G. Komen for the Cure• Ed Carpenter Racing: Fuzzy’s Ultra Premium Vodka• Harding Racing: Harding Group• Rahal Letterman Lanigan Racing: Panasonic, United Rentals• Schmidt Peterson Motorsports: Arrow Electronics, Lucas Oil,
Team One Cure• Team Penske: Hitachi/Pennzoil/AAA, Menards,
Verizon Wireless
Part-time teams are Dreyer & Reinbold Racing, Jonathan Byrd’s Racing, LazierBurns Racing, and Pirtek Team Murray.
86.5 IndyCar SeriesThe 29th IndyCar Series season ran from March through September 2019,
as follows:• March 10: Firestone Grand Prix Of St. Petersburg (St. Petersburg, FL)• March 24: IndyCar Classic (Austin, TX)• April 7: Honda Indy Grand Prix of Alabama (Birmingham, AL)• April 14: Grand Prix of Long Beach (Long Beach, CA)• May 11: IndyCar Grand Prix (Indianapolis, IN)
SPORTS MARKETING 2020-2021
• 405 •

• May 26: 103rd Running to the Indianapolis 500 (Indianapolis, IN)• June 1-2: Chevrolet Detroit Grand Prix Race (Detroit, MI)• June 8: DXC Technology 600 (Fort Worth, TX)• June 23: REV Group Grand Prix at Road America (Elkhart Lake, WI)• July 14: Honda Indy Toronto (Toronto, Ontario, Canada)• July 20: Iowa 300 (Newton, IA)• July 28: Honda Indy 200 at Mid-Ohio (Lexington, OH)• August 18: ABC Supply 500 (Long Pond, PA)• August 24: Bommarito Automotive Group 500 (Madison, IL)• September 1: Grand Prix of Portland (Portland, OR)• September 22: Firestone Grand Prix of Monterey (Monterey, CA)
86.6 Market ResourcesIndyCar, 4551 West 16th Street, Indianapolis, IN 46222. (317) 492-6526.(www.indycar.com)
SPORTS MARKETING 2020-2021
• 406 •

87
NASCAR
87.1 OverviewTotal attendance in 2018 at the 36 races of National Association for Stock Car
Auto Racing (NASCAR, www.nascar.com) was an estimated 3.0 million, with anaverage television audience of 4.0 million viewers per race. NASCAR estimates itstotal U.S. fan base at 75 million.
According to an ESPN Sports Poll, 36% of adults who follow sports are fans ofNASCAR; 11% say they are avid fans.
Fortune estimates NASCAR revenues at $3 billion annually, distributed asfollows:• Sponsorship: $1.5 billion• Television and media: $ 550 million• Tickets: $ 430 million• Merchandise: $ 320 million• Food and beverages: $ 180 million
NASCAR’s Daytona 500 and Brickyard 400 have been estimated to have a localeconomic impact of $240 million and $220 million, respectively.
87.2 Advertising and SponsorshipsMonster Energy entered into a title sponsorship deal with NASCAR in December
2016. SportsBusiness Journal reported the two-year deal with a two-year option worthabout $20 million in annual rights fees.
According to Forbes, team sponsors spend $650 million annually for the 35 carsin the Sprint Cup Series.
Advertisers spend $300 million annually for ads during NASCAR broadcasts.
_________________________________________________________________
“Sponsorships are the lifeblood of NASCAR ...75% of team revenues are derived from them.”
Forbes _________________________________________________________________
SPORTS MARKETING 2020-2021
• 407 •

Series Entitlement Sponsors for 2019 were Monster Energy, Xfinity, and GanderOutdoors.
The following were 2019 NASCAR Official Sponsors: 3M, AMR, AWS, Axalta,Busch, CapitalOne, Chevrolet, Coca-Cola, Digital-Ally, DraftKings, Fanatics, FDP,Featherlite Trailers, Ford, Geico, Goodyear, Growth Energy, Hotels for Hope, IngersollRand, Jacob Companies, K&N, Lilly, Lixar, M&M Mars, Mack Trucks, Microsoft, Mobil 1,Moog, Netjets, Peak, Pit Boss, PNC, Prevost, Safety-Kleen, SiriusXM, SugarlandsShine, Sunoco, The Weather Company, Toyota, TruNorth, Universal TechnicalInstitute, Visa, Whelen Engineering, and Yeti.
The following brands have the highest NASCAR-related spending (source:SportsBusiness Journal):• Sprint: $323 million• Chevrolet: $124 million• Toyota: $ 86 million• Coca-Cola: $ 78 million• Lowe’s: $ 70 million• Ford: $ 64 million• AT&T: $ 48 million• Aflac: $ 40 million• Budweiser: $ 39 million• Amp: $ 33 million
87.3 Television Broadcast Rights and RatingsFox and NBC share broadcast rights for NASCAR’s 36 Sprint Cup races.Fox and NASCAR signed an eight-year extension of their deal through 2022 to
air the Daytona 500 and the first half of the NASCAR season. SportsBusiness Journalestimated the deal at more than $2.4 billion over eight years, or more than $300 millionper year, a sizable increase from the $220 million Fox has paid annually since 2001.
NBC signed a $4.4 billion, 10-year broadcast rights deal to broadcast the secondhalf of the Sprint Cup and Nationwide Series through 2022.
Under the current media rights revenue split, tracks receive 65%, teams earn25%, and NASCAR retains 10%.
Average viewership for NASCAR Cup Series telecasts on Fox/FS1 have been asfollows (source: The Nielsen Company [www.nielsen.com]):• 2007: 9.3 million• 2008: 9.3 million• 2009: 8.7 million• 2010: 7.8 million• 2011: 8.6 million• 2012: 7.9 million• 2013: 7.8 million• 2014: 7.0 million• 2015: 5.9 million
SPORTS MARKETING 2020-2021
• 408 •

• 2016: 5.6 million• 2017: 4.9 million• 2018: 4.0 million• 2019: 4.1 million
87.4 Drivers and Racing TeamsAccording to Forbes (June 2019), the following are the NASCAR drivers with the
highest annual earnings: Total Earnings Salary /Winnings Endorsements/Licensing
• Jimmie Johnson: $17.5 million $14.0 million $3.5 million• Kyle Busch: $15.8 million $13.8 million $2.0 million• Denny Hamlin: $14.2 million $12.7 million $1.5 million• Kevin Harvick: $13.1 million $11.6 million $1.5 million• Joey Logano: $11.0 million $ 9.6 million $1.4 million• Brad Keselowski: $10.4 million $ 9.2 million $1.2 million• Chase Elliott: $ 9.5 million $ 7.5 million $2.0 million• Kyle Larson: $ 9.0 million $ 8.0 million $1.0 million• Martin Truex: $ 8.2 million $ 7.3 million $ 900,000• Clint Bowyer: $ 7.3 million $ 6.6 million $ 700,000
The following are estimates of 2018 valuations for NASCAR racing teams(source: Forbes):• Hendrick Motorsports: $325 million• Joe Gibbs Racing: $220 million• Stewart-Haas Racing: $175 million• Richard Childress Racing: $170 million• Team Penske: $142 million• Roush Fenway Racing: $140 million• Chip Ganassi Racing: $ 68 million• Front Row Motorsports: $ 21 million
87.5 TracksThe following are the major operators of NASCAR-sanctioned tracks:
• International Speedway Corp. (www.iscmotorsports.com): 12 tracks• Speedway Motorsports Inc. (www.speedwaymotorsports.com): 5 tracks• Dover Motorsports Inc. (www.dovermotorsportsinc.com): 4 tracks
With only one weekend of NASCAR racing hosted annually, track operators areconstantly looking for new streams of revenue. Through a variety of events andactivities, most are able to have about 300 revenue-generating days a year.
In order to attract an upscale market, several tracks have built condominium
SPORTS MARKETING 2020-2021
• 409 •

units on their property. Speedway Motorsports has 174 condo units at three tracks itowns: Atlanta Motor Speedway, Lowe’s Motor Speedway, and Texas Motor Speedway.
Ever-more elaborate condos are part of a trend that has seen tracks addamenities like high-end spas, where fans can get $75 facials in between races.
Lowe’s Motor Speedway replaced a 9,000-seat grandstand with a luxurymotorcoach camping area. Annual passes cost $17,000 to $22,000; sing le-racepasses sell for $6,000 to $8,000.
According to an assessment by Washington Economics Group (www.weg.com),year-round operations at Daytona International Speedway generate $1.9 billion in theFlorida economy. Operations of Homestead-Miami Speedway have an economicimpact of $248 million.
NASCAR speedways are listed in Chapter 25 this handbook.
87.6 Monster Energy Cup SeriesThe following was the 2019 Monster Energy NASCAR Cup Schedule:
• February 17: Daytona 500 (Daytona International Speedway)• February 24: Folds of Honor QuikTrip 500 (Atlanta Motor Speedway) • March 3: Pennzoil 400 presented by Jiffy Lube (Las Vegas Motor
Speedway)• March 10: TicketGuardian 500 (ISM Raceway)• March 17: Auto Club 400 (Auto Club Speedway)• March 24: STP 500 (Martinsville Speedway)• March 31: O'Reilly Auto Parts 500 (Texas Motor Speedway)• April 7: Food City 500 (Bristol Motor Speedway)• April 13: Toyota Owners 400 (Richmond Raceway)• April 28: Geico 500 (Talladega Superspeedway)• May 6: Gander RV 400 (Dover International Speedway)• May 11: Digital Ally 400 (Kansas Speedway)• May 26: Coca-Cola 600 (Charlotte Motor Speedway)• June 2: Pocono 400 (Pocono Raceway)• June 10: FireKeepers Casino 400 (Michigan International Speedway)• June 23: Toyota/Save Mart 350 (Sonoma Raceway)• June 30: Camping World 400 (Chicagoland Speedway)• July 7: Coke Zero Sugar 400 (Daytona International Speedway)• July 13: Quaker State 400 presented by Walmart (Kentucky Speedway)• July 21: Foxwoods Resort Casino 301 (New Hampshire Motor
Speedway)• July 28: Gander RV 400 (Pocono Raceway)• August 4: Go Bowling at The Glen (Watkins Glen International)• August 11: Consumers Energy 400 (Michigan International Speedway)• August 17: Bass Pro Shops NRA Night Race (Bristol Motor Speedway)• September 1: Bojangles' Southern 500 (Darlington Raceway)• September 8: Big Machine Vodka 400 at the Brickyard (Indianapolis Motor
Speedway)
SPORTS MARKETING 2020-2021
• 410 •

• September 15: South Point 400 (Las Vegas Motor Speedway)• September 21: Federated Auto Parts 400 (Richmond Raceway)• September 29: Bank of America Roval 400 (Charlotte Motor Speedway)• October 6: Dover 400 (Dover International Speedway)• October 13: 1000Bulbs.com 500 (Talladega Superspeedway)• October 20: Hollywood Casino 400 (Kansas Speedway)• October 27: First Data 500 (Martinsville Speedway)• November 3: AAA Texas 500 (Texas Motor Speedway)• November 10: Can-Am 500 (ISM Raceway)• November 17: Championship - Ford EcoBoost 400 (Homestead-Miami
Speedway)
87.7 Fan DemographicsAccording to an ESPN Sports Poll, NASCAR fan distribution is as follows:
Gender• Male: 63%• Female: 37%
Age• 12-to-17: 9%• 18-to-24: 9%• 25-to-34: 18%• 35-to-44: 18%• 45-to-54: 22%• 55 and older: 23%
Ethnicity• Caucasian: 77%• African-American: 9%• Hispanic-American: 9%• Other: 5%
_________________________________________________________________
“NASCAR says that its multicultural audience is20% of its total audience, which is pegged at 75million. About half of that multiculturalaudience is Hispanic, which would equal 7.5million fans.”
SportsBusiness Journal _________________________________________________________________
SPORTS MARKETING 2020-2021
• 411 •

87.8 Market ResourcesNASCAR, P.O. Box 2875, Daytona Beach, FL 32120. (386) 681-5977. (www.nascar.com)
SPORTS MARKETING 2020-2021
• 412 •

88
FORMULA ONE
88.1 OverviewFormula One World Championship, generally referred to as Formula One or F1,
is the premier racing series sanctioned by the Fédération Internationale de l’Automobile(FIA, www.fia.com). F1 cars are the fastest road course racing cars in the world, racingat speeds of up to 220 mph.
The F1 racing season consists of 19 Grand Prix races, with the lineup of venueschanging somewhat each year. About half of races are hosted in Europe, where F1 isimmensely popular. One F1 race is generally scheduled in the United States eachseason.
In September 2016, U.S.-based Liberty Media purchased Formula One fromCVC, an Italian private equity company, for $8 billion.
Formula One annual revenue was $1.7 billion in 2017, down 1% from theprevious year.
88.2 Formula One 2019The 2019 racing season schedule was as follows:
• March 14-17: Australian Grand Prix (Melbourne)• March 28-31: Bahrain Grand Prix (Sakhir)• April 11-14: Chinese Grand Prix (Shanghai)• April 25-28: Azerbaijan Grand Prix (Baku)• May 9-12: Spanish Grand Prix (Barcelona)• May 23-26: Monaco Grand Prix (Monte Carlo)• June 6-9: Canadian Grand Prix (Montreal)• June 20-23: French Grand Prix (Le Castellet)• June 27-30: Austrian Grand Prix (Spielberg)• July 11-14: British Grand Prix (Silverstone)• July 25-28: German Grand Prix (Hockenheim)• August 1-4: Hungarian Grand Prix (Budapest)• August 29-September 1: Belgian Grand Prix (Stavelot)• September 5-8: Italian Grand Prix (Monza)• September 19-22: Singapore Grand Prix• September 26-29: Russian Grand Prix (Sochi)• October 10-13: Japanese Grand Prix (Suzuka)
SPORTS MARKETING 2020-2021
• 413 •

• October 24-27: Mexican Grand Prix (Mexico City)• October 31-November 3: United States Grand Prix (Austin)• November 14-17: Brazilian Grand Prix (São Paulo)• November 28-October 1: Abu Dhabi Grand Prix (United Arab Emirates)
88.3 United States Grand PrixCircuit of the Americas (COTA, www.circuitoftheamericas.com), a $400 million
speedway and entertainment venue in Austin, Texas, was purpose-built for FormulaOne. COTA has hosted the United States Grand Prix since 2012.
COTA has a capacity of 120,000. Each of the Grand Prix events between 2013and 2018 were complete or near-sellouts.
A study commissioned by COTA assessed the economic impact of the UnitedStates Grand Prix on the Austin metropolitan area at about $600 million.
COTA sponsors are Austin American-Statesman, Bud Light, Coca-Cola, CrownRoyal, H-E-B, Pizza Hut, Seton Healthcare, Texas Lottery, Tito’s Handmade Vodka,Topo Chico, and United Rentals.
88.4 Grand Prix of AmericaGrand Prix of America has been proposed for the Port Imperial Street Circuit in
Weehawken, New Jersey. The race was included in the FIA calendar in 2014 and 2015but later dropped. The location is attractive because New York City could serve as abase for fan activities. The venue remains under consideration for future F1 races.
There is also talk of adding races in Las Vegas, Long Beach, or Miami.
88.5 Media CoverageFormula One can be seen live or tape-delayed in almost every country and
territory around the world and attracts one of the largest global television audiences. In the U.S., F1 races are broadcast on ESPN, which picked up media rights in
2018 from NBC. ESPN Deportes is F1 spanish-language broadcaster in the U.S.Formula One had a total global television audience of 400 million people for the
19 races of the 2018 season, a drop from 600 million 10 years prior. The decline is, inlarge part, because F1 is moving away from free-to-air broadcasts in favor of pay-TVdeals.
Many of those who previously watched F1 on television are now watching thesport via other means. The sport has drawn criticism for moving away from free-to-airbroadcasts in favor of pay-television deals.
SPORTS MARKETING 2020-2021
• 414 •

_________________________________________________________________
“Since Formula 1 made the widespread moveaway from free-to-air television, swapping alarge fanbase for a smaller group of payingcustomers, there has been much hand-wringingover the sport’s declining global fanbase.”
Motorsport.com _________________________________________________________________
Formula One launched F1 TV, an over-the-top service, in 2018. The producthas two tiers: The premium F1 TV Pro, which shows live races and costs $70 to $150annually, or $8 to $12 monthly, depending on locations; and a non-live tier called F1 TVAccess that costs $20 to $25 annually, or $2 to $3 per month. In the U.S., F1 TVcompetes with ESPN because F1 TV Pro also shows live races for the entire season,all 20 driver cameras, plus additional exclusive feeds. F1 TV does not reportsubscription data but has set 5 million as a potential high-water mark, which wouldrepresent 1% of the 500 million fans F1 claims worldwide.
SPORTS MARKETING 2020-2021
• 415 •

89
FORMULA E
89.1 OverviewThe FIA Formula E Championship (www.fiaformulae.com/en), or Formula E, a
class of auto racing using electric-powered cars, launched in 2014. Formula E is sanctioned by the Fédération Internationale de l’Automobile (FIA,
www.fia.com), which also sanctions Formula One (F1). Jean Todt, president of FIA,founded Formula E with the vision of engaging the F1 audience and with the goal ofadvancing electric vehicle technology.
Formula E is owned by a consortium that includes Discovery Communications,Julius Baer, Liberty Global, and NewWave. According to CEO Alejandro Agag, recenttransactions have placed the valuation at $1 billion.
_________________________________________________________________
“The Formula E Series is already worth around$1 billion despite debuting less than five yearsago. The electric racing series is still in itsinfancy and far from joining the ranks of themost popular motorsports series in the U.S. But with several auto manufacturers joining in recent years, Formula E has seen its valueskyrocket.”
SportsBusiness Journal, 6/10/19 _________________________________________________________________
89.2 Racing TeamsThere are 10 Formula E racing teams, as follows:
• ABT (http://abt.fiaformulae.com)• Andretti Auto Sport (www.andrettiautosport.com)• Dragon Racing (www.dragonracing.com)• Edams Renault (www.edamsrenault.com)
SPORTS MARKETING 2020-2021
• 416 •

• Mahindra Racing (http://mahindra.fiaformulae.com)• NEXTEV TRC Racing (www.teamchina-racing.com)• Team Aguri (www.fiaformulae.com/en/teams/team-aguri.aspx)• Trulli (http://trulli.fia-fe.com)• Venturi (http://venturi.fiaformulae.com)• Virgin Racing (www.virginracing.com)
89.3 U.S. RacesThe first Formula E race in the U.S. was held in Miami, Florida, in 2015. Paid
grandstand spectator attendance was estimated at 15,000 to 20,000; another 20,000 to30,000 attendees were in the general admission area, which was free.
Long Beach, California, hosted Formula E races in 2015 and 2016. The eventswere free; attendance was approximately 25,000. Faraday Future, an electric-carstart-up based in Gardena, signed on as the race’s title sponsor. Other electric carcompanies, including Tesla, sponsored the Formula E event as well.
Qualcomm New York City ePrix races were held 2017 through 2019. There weretwo races each year. Race attendance averaged about 20,000.
89.4 Formula E Championship Season FiveThe 5th season of the FIA Formula E Championship is as follows:
• December 15, 2018: Ad Diriyah, Saudi Arabia• January 12, 2019: Marrakesh, Morocco• January 26, 2019: Santiago, Chile• February 16, 2019: Mexico City, Mexico• March 10, 2019: Hong Kong• March 23, 2019: Sanya, China• April 13, 2019: Rome, Italy• April 27, 2019: Paris, France• May 11, 2019: Monaco• May 25, 2019: Berlin, Germany• June 22, 2019: Bern, Switzerland• July 13-14, 2019: New York, NY - two rounds
89.5 MediaBroadcast on Fox Sports 1 and Fox Sports 2, Formula E races averaged 42,000
viewers for its first 10 races of the 2019 season, according to SportsBusiness Journal, a59% drop from the prior season.
SPORTS MARKETING 2020-2021
• 417 •

89.6 SponsorsFormula E sponsors for 2018-2019 were ABB, Allianz, Antofagasta Minerals,
BMW, Bosch, DHL, ENEL, Heineken, Hugo Boss, Julius Bär Private Swiss Banking,Michelin, Modis, Saudia Airlines, and TAG Heuer.
SPORTS MARKETING 2020-2021
• 418 •

90
NHRA DRAG RACING
90.1 OverviewNational Hot Rod Association (NHRA, www.nhra.org) is the governing body for
drag racing in the United States and Canada. NHRA had more than 40,000 licensedcompetitors and more than 65,000 members as of April 2019.
The 24-event Mello Yello Drag Racing Series is NHRA’s premier series. Thereare also three Sportsman Drag Racing Series.
By age, the share of adults who attended NHRA Drag Racing events in 2018were as follows:• 18-to-29: 2.57%• 30-to-49: 1.63%• 50-to-64: 0.56%
NHRA is noted for diversity among participants and its fan base.
_________________________________________________________________
“The NHRA has long been the most diverseracing series in the U.S., positioning itself wellin a country that is rapidly changing alongdemographic lines. At a time when other majormotorsports are trying to add more women andpeople of color to their driver ranks, the NHRApremier Mello Yellow Series has a long historyof women, African-Americans, and Hispanicscompeting and winning.”
SportsBusiness Journal, 7/15/19 _________________________________________________________________
90.2 TracksNHRA operates four tracks, as follows:
SPORTS MARKETING 2020-2021
• 419 •

• Atlanta Dragway (Commere, GA)• Auto-Plus Raceway (Gainesville, FL)• Historic Auto Club Raceway (Pomona, CA)• Lucas Oil Raceway (Indianapolis, IN)
There are also 126 independently operated member tracks(www.nhra.org/nhra101/membertracks.aspx).
90.3 NHRA Mello Yello Drag Racing SeriesThe Mello Yello Drag Racing Series features racing in five professional classes,
as follows:• Top Fuel Dragster• Funny Car• Pro Stock• Pro Stock Motorcycle• Pro Modified
The following was the 2019 schedule of races:• February 7-10: Lucas Oil NHRA Winternationals (Pomona, CA)• February 22-24: NHRA Arizona Nationals (Phoenix, AZ)• March 14-17: Amalie Motor Oil NHRA Gatornationals (Gainesville, FL)• April 5-7: DENSO Spark Plugs NHRA Four-Wide Nationals
(Las Vegas, NV)• April 12-14: NHRA SpringNationals (Houston, TX)• April 26-28: NGK Spark Plugs NHRA Four-Wide Nationals
(Charlotte, NC)• May 3-5: NHRA Southern Nationals (Atlanta, GA)• May 17-19: Virginia NHRA Nationals (Richmond, VA)• May 30-June 2: Route 66 NHRA Nationals (Chicago, IL)• June 7-9: Menards NHRA Heartland Nationals (Topeka, KS)• June 14-16: NHRA Thunder Valley Nationals (Bristol, TN)• June 20-23: Summit Racing Equipment NHRA Nationals (Norwalk, OH)• July 5-7: NHRA New England Nationals (Epping, NH)• July 19-21: Dodge Mile-High NHRA Nationals (Denver, CA)• July 26-28: NHRA Sonoma Nationals (Sonoma, CA)• August 2-4: NHRA Northwest Nationals (Seattle, WA)• August 15-18: Lucas Oil NHRA Nationals (Brainerd, MN)• August 28-September 2: Chevrolet Performance U.S. Nationals (Indianapolis, IN)• September 12-15: Dodge NHRA Nationals (Reading, PA)• September 27-29: AAA Insurance NHRA Midwest Nationals (St. Louis, MO)• October 11-13: NHRA Carolina Nationals (Charlotte, NC)• October 17-20: AAA Texas NHRA Fall Nationals (Dallas, TX)
SPORTS MARKETING 2020-2021
• 420 •

• October 31-November 3: NHRA Nevada Nationals (Las Vegas, NV)• November 14-17: Auto Club NHRA Finals (Pomona, CA)
90.4 Broadcast RightsThe NHRA Mello Yello Drag Racing Series was televised by Fox Sports 1 (FS1)
starting with the 2016 season. Fox Sports provided four appearances on broadcast TVfor the first time in the series’ history, plus 17 live airings across Fox networks. NHRA’s15-year broadcast rights deal with ESPN ended with the 2015 season.
90.5 SponsorsNHRA sponsors for 2019 were Advertising Edge, Allegiant Airlines, AMKUS
Rescue Systems, BlueDEF Diesel Exhaust Fluid/Equipment, Blue Media, BuffaloTurbine, CatSpot, Chevrolet, Dasani, E3, Goodyear, Harley-Davidson, Honda, LucasOil, Magic Dry, Main Gate, Mello Yello, Peak Antifreeze, Pegasus Race Trailers,Powerade, Racing Electronics, Sioux City Truck and Trailer, Summit Racing Equipment,Sunoco, and Toyota.
90.6 Market ResourcesNational Hot Rod Association, 2035 Financial Way, Glendora, CA 91741. (626) 914-4761. (www.nhra.com)
SPORTS MARKETING 2020-2021
• 421 •

91
SPORTSCAR CHAMPIONSHIP
91.1 OverviewAmerican Le Mans Series presented by Tequila Patrón and Grand-Am Road
Racing merged in September 2012 to form the WeatherTech SportsCar Championship(https://sportscarchampionship.imsa.com/). The circuit was dormant in 2013 andrelaunched in March 2014. WeatherTech signed a deal to take over title sponsorship ofthe series starting in 2016, rebranding the series.
There are 13 circuits, as follows:• Canadian Tire Motorsport Park (Clarington, Ontario, Canada)• Circuit of the Americas (Austin, TX)• Daytona International Speedway (Daytona, FL)• Detroit Belle Isle Street Circuit (Detroit, MI)• Lime Rock Park (Lakeville, CT)• Long Beach Street Circuit (Long Beach, CA)• Mid-Ohio Sports Car Course (Troy Township, OH)• Road America (Elkhart Lake, WI)• Road Atlanta (Braselton, GA)• Sebring International Raceway (Sebring, FL)• Virginia International Raceway (Alton, VA)• Watkins Glen International (Watkins Glen, NY)• WeatherTech Raceway Laguna Seca (Monterey, CA)
The International Motor Sports Association (IMSA, www.imsa.com) sanctions theSportsCar Championship.
91.2 WeatherTech SportsCar ChampionshipThe 2019 WeatherTech SportsCar Championship racing season was as follows:
• January 24-27: Rolex 24 at Daytona (Daytona Beach, FL)• March 13-16: Mobil 1 Twelve Hours of Sebring Presented by Advance
Auto Parts (Sebring, FL)• April 12-13: Bubba Burger Sports Car Grand Prix at Long Beach
(Long Beach, CA)• May 3-5: Acura Sports Car Challenge at Mid-Ohio (Lexington, OH)• May 31-June 1: Chevrolet Detroit Grand Prix Presented by Lear (Detroit, MI)• June 27-30: Sahlen’s Six Hours of the Glen (Watkins Glen, NY)
SPORTS MARKETING 2020-2021
• 422 •

• July 5-7: Sportscar Grand Prix (Clarington, ON)• July 19-20: Northeast Grand Prix (Lakeville, CT)• August 3-6: Road America (Elkhart Lake, WI)• August 23-25: Michelin GT Challenge at VIR (Alton, VA)• September 13-15: WeatherTech Raceway Laguna Seca (Monterey, CA)• October 9-12: Motul Petit Le Mans (Braselton, GA)
91.3 Broadcast RightsNBC contracted with IMSA to televise the entire 2019 season, replacing Fox
Sports 1 as SCC broadcaster.
91.4 SponsorsSportsCar Championship Partners for 2019 were Alkamel Systems, Automobile
Club de l’Ouest, Autoweek, Axalta, Bubba Burger, Featherlite Trailers, Global MedicalResponse, Grassroots Motorsports, Konica Minolta, Michelin, Motul, National Carts,NetJets, OMP, Racer Media & Marketing, Road & Track, Skelton Optics, SunTrust,Tudor, USA Today Sports, VP Racing Fuels, WeatherTech, and ZF.
91.5 Market ResourcesInternational Motor Sports Association, International Motorsports Center, One Day tonaBoulevard, Daytona Beach, FL 32114. (386) 310-6500. (www.imsa.com)
SPORTS MARKETING 2020-2021
• 423 •

92
WORLD OF OUTLAWS
92.1 OverviewAn estimated 4.5 million people attend dirt racing events each year. Of the
1,000 speedways in the U.S., some 800 are dirt tracks, most no bigger than a half mile. More than 50,000 competitive dirt racers enjoy the sport as a hobby.
The World of Outlaws (www.worldofoutlaws.com) is the only sanctioning body forfull-time professional dirt racers. There are two racing series: Craftsman Sprint CarSeries and Craftsman Late Model Series. More than 1.2 million fans attended World ofOutlaws events in 2018. World of Outlaws events have been broadcast on ESPN andSpeed since 2007.
92.2 SponsorsNOS Energy Drink is the title sponsor for the Sprint Car Series. Morton Buildings
is the title sponsor for the Late Model Series.Sponsoring partners in 2019 for the Sprint Car Series were Cometic Gasket,
Comp Cams, Drydene Performance Products, Edelbrock Racing, Hoosier Racing Tire,Impact Racing, Intercomp, iRacing, JE Pistons, J&J Auto Racing, KSE RacingProducts, Morton Buildings, MSD Performance, NGK Spark Plugs, NOS Energy Drink,Racing Electronics, Sports Insurance Specialists, Textron Off Road, TNT Rescue, andVP Racing Fuels.
Sponsoring partners in 2019 for the Late Model Series were Arizona SportShirts, Capital Race Cars, Cometic Gasket, Comp Cams, Drydene PerformanceProducts, Edelbrock Racing, Hoosier Racing Tire, Impact Racing, Integra RacingShocks, Intercomp, iRacing, JE Pistons, Morton Buildings, MSD Performance, NGKSpark Plugs, Penske Shocks, Performance Friction Corporation, QA1, Quartermaster,Racing Electronics, Rocket Chassis, Sports Insurance Specialists, Textron Off Road,TNT Rescue, VP Racing Fuels, and Wrisco Industries.
92.1 Market ResourcesWorld of Outlaws, 7575-D West Winds Boulevard, Concord, NC 28027. (704) 795-7223. (www.worldofoutlaws.com)
SPORTS MARKETING 2020-2021
• 424 •

93
MOTORCYCLE RACING
93.1 OverviewFederation of International Motorcycling (www.fim-live.com) classifies motorcycle
racing (also called moto racing) into four main categories, as follows:• Road Racing
- Traditional road racing- Motorcycle Grand Prix- Superbike racing- Supersport racing- Endurance racing- Sidecar racing
• Motocross- Supercross- Supermoto
• Enduro and Cross-Country- Enduro- Hare Scramble- Cross-country rally
• Track Racing- Indoor short track and TT racing- Speedway- Grasstrack- Ice speedway- Board track- Auto race track
Other categories of motorcycle racing are drag racing/sprints, hill climb,landspeed racing, UK sprinting, and vintage.
93.2 AMA Pro MotocrossMotocross (or MX) is off-road racing on a closed circuit. The Lucas Oil Pro Motocross Championship (www.promotocross.com), held
since 1972 and the major motocross series in the U.S., consists of 12 rounds held fromearly May through mid-September. There are three classes:
SPORTS MARKETING 2020-2021
• 425 •

• 250 Motocross Class for 0-125 cc 2-stroke or 150-250 cc 4-stroke machines• 450 Motocross Class for 150-250 cc 2-stroke or 251-450 cc 4-stroke machines• Women’s National Championship Series
The Motocross Championship is sanctioned by the American MotorcyclistAssociation (www.americanmotorcyclist.com) and managed by MX Sports Pro Racing(www.mxsportsproracing.com).
Lucas Oil has held title sponsorship of the Motocross Championship since 2009;the current deal runs through 2020.
NBC Sports Group presented comprehensive coverage of every 2019 qualifier,Moto 1 and Moto 2 from every race across NBC, NBCSN and NBC Sports Gold – NBCSports Digital’s direct-to-consumer live streaming product. NBC Sports Group and MXSports Pro Racing began their partnership in the 2012 season.
Total series viewership is 5.5 million. NBC averages about 550,000 viewers forits three broadcasts.
The 2019 Lucas Oil AMA Pro Motocross Championship race schedule was asfollows:• May 18: Hangtown Motocross Classic (Sacramento, CA)• May 25: Pala National (Pala, CA)• June 1: Thunder Valley National (Lakewood, CO)• June 15: High Point National (Mt. Morris, PA)• June 22: Florida National (Jacksonville, FL)• June 29: Southwick National (Southwick, MA)• July 6: RedBud National (Buchanan, MI)• July 20: Spring Creek National (Millville, MN)• July 27: Washougal National (Washougal, WA)• August 10: Unadilla National (New Berlin, NY)• August 17: Budds Creek National (Mechanicsville, MD)• August 24: Ironman National (Crawfordsville, IN)
Series Partners for 2019 were 100%, Acerbis, Alpine Stars, Deltran BatteryTender, Fly Racing, FLY Racing, FMF Racing, Garmin, Geico Motorcycle, HusqvarnaMotorcycles, KMC Wheels, KTM, Lucas Oil, Lucas Oil, Motion Pro, MotoSport, MXSports, Pirelli, Pivot Works, Racer X, Red Bull, Suzuki, Vertex, VP Racing, and WesternPower Sports.
93.3 MotoGPGrand Prix motorcycle racing is the premier category of motorcycle road racing.
MotoGP (www.motogp.com) is the highest class of GP racing. The 2019 Grand Prix motorcycle racing season is the 71st FIM. Road Racing
World Championship season. The 2019 MotoGP season comprises 19 Grands Prix, with 12 held in Europe,
three in Asia, two in the Americas, and one each in Australia and the Middle East.
SPORTS MARKETING 2020-2021
• 426 •

One race was held in the United States: the Red Bull Grand Prix of TheAmericas at Circuit of the Americas (Austin, TX) on April 14.
Official sponsors for the 2019 season were BMW, DHL, Michelin, Singha Beer,and Tissot. Race title sponsors were Eyetime, GoPro, HJC Helmets, Michelin, MonsterEnergy, Motul, Movistar de Aragon, Oakley, Octo, PPT, Pramac, Red Bull, and Shell.
93.4 SupercrossSupercross (or SX) is indoor motocross; it is notable for its numerous jumps. In
2007, Monster Beverage Co. was named title sponsor for the series, which wasrenamed Monster Energy Supercross (www.supercrosslive.com).
Monster Energy Supercross evolved in the 1970s out of motocross. Supercrossinvolves racing of off-road motorcycles on artificial dirt tracks typically at baseball andfootball stadiums and consisting of steep jumps and obstacles.
Supercross is sanctioned by the American Motorcyclist Association (AMA,www.americanmotorcyclist.com). Feld Entertainment acquired Supercross from LiveNation Motor Sports in 2008 for $205 million.
SportsBusiness Journal estimates the Supercross series annual revenue at$44.4 million, distributed as follows:• Ticket sales: $20.8 million• Sponsorship: $14.2 million• Merchandise: $ 8.3 million• Television rights: $ 1.1 million
Attendance figures have not been released by Supercross since 2014. Attendance for 2010-2014 seasons averaged about 850,000.
Supercross has been broadcast on Fox Sports 1 since 2006. Eleven live raceswere broadcast in 2019. Average viewership is 385,000.
The 2019 Monster Energy Supercross racing season had 17 events, as follows:• January 5: Angel Stadium (Anaheim, CA)• January 12: State Farm Stadium (Glendale, AZ)• January 19: Angel Stadium (Anaheim, CA)• January 26: Oakland-Alameda Coliseum (Oakland, CA)• February 2: Petco Park (San Diego, CA)• February 9: U.S. Bank Stadium (Minneapolis, MN)• February 16: AT&T Stadium (Arlington, TX)• February 23: Ford Field (Detroit, MI)• March 2: Mercedes-Benz Stadium (Atlanta, GA)• March 9: Daytona International Speedway (Daytona Beach, FL)• March 16: Lucas Oil Stadium (Indianapolis, IN)• March 23: CenturyLink Field (Seattle, WA)• March 30: NRG Stadium (Houston, TX)• April 6: Nissan Stadium (Nashville, TN)• April 13: Broncos Stadium at Mile High (Denver, CO)
SPORTS MARKETING 2020-2021
• 427 •

• April 27: MetLife Stadium (East Rutherford, NJ)• May 4: Sam Boyd Stadium (Las Vegas, NV)
93.5 Supercross FuturesSupercross Futures (www.supercrosslive.com/supercross-futures), formerly
Arenacross, is the advancement platform of Monster Energy AMA Supercross, an FIMWorld Championship. The series features amateur competition on a full-size,Supercross track. Supercross Futures is comprised of 8 events leading to an AMANational Championship with approximately 6,100 amateurs competing in 26 classes.
93.6 Market ResourcesAMA Pro Racing, 525 Fentress Boulevard, Suite B, Daytona Beach, FL 32114.(386) 492-1014. (www.amaproracing.com)
Federation of International Motorcycling, 11 Route de Suisse, 1295 Mies, Switzerland.Tel. +41 (0) 22 950 95 00. (www.fim-live.com)
Feld Motor Sports, 4255 Meridian Parkway, Aurora, IL 60504. (630) 566-6100.(www.feldmotorsportsonline.com)
MX Sports Pro Racing, 122 Vista Del Rio Drive, Morgantown, WV 26508. (304) 284-0084. (www.mxsportsproracing.com)
SPORTS MARKETING 2020-2021
• 428 •

PART XII: TENNIS
SPORTS MARKETING 2020-2021
• 429 •

94
TENNIS PARTICIPATION
94.1 ParticipationAccording to the United States Tennis Association (USTA, www.usta.com),
27 million people identify as tennis players, a total that includes those who have played in the past as well as current players. In total, there are approximately 600 million play occasions each year.
According to 2018 SFIA Participation Topline Report, published by the Sports & Fitness Industry Association (www.sfia.org), the following number of people played tennis at least once:• 2008: 17.7 million• 2009: 18.5 million• 2010: 18.7 million• 2011: 17.8 million• 2012: 17.0 million
• 2013: 17.7 million• 2014: 17.9 million• 2015: 17.9 million• 2016: 18.1 million• 2017: 17.7 million
94.2 SpendingAccording to Tennis Consumer Spending in the U.S., a report by the National
Tennis Foundation (www.nationaltennisfoundation.org), overall consumer spending ontennis equipment and tennis activities exceeds $16 billion annually, distributed asfollows:• Playing fees (reserved court time fees, club memberships, etc.): $10.1 billion• Equipment (primarily rackets): $ 2.3 billion• Other merchandise (court bags, balls, shoes, and apparel): $ 2.9 billion• Accessories: $ 947 million
94.3 DemographicsThe following is a profile of USTA members:
Gender Youth Adults Overall
• Female: 47% 57% 54%• Male: 53% 43% 46%
Age• 18 and under: 24%• 19-to-34: 14%
SPORTS MARKETING 2020-2021
• 430 •

• 35-to-44: 22%• 45-to-54: 22%• 55-to-64: 12%• 65 and older: 6%
Household Income• Under $25,000: 1%• $25,000 to $49,999: 12%• $50,000 to $74,999: 18%• $75,000 to $99,999: 14%• $100,000 to $149,999: 35%• $150,000 to $199,999: 9%• $200,000 and higher: 11%
94.4 Market ResourcesNational Tennis Foundation (www.nationaltennisfoundation.org)
United States Tennis Association, 70 West Red Oak Lane, White Plains, NY 10604.(914) 696-7000. (www.usta.com)
SPORTS MARKETING 2020-2021
• 431 •

95
TENNIS VENUES
95.1 Top Tournament CourtsRanked by seating capacity, the following are the largest tennis tournament
courts in the United States:• Arthur Ashe Stadium (Flushing, NY): 23,771
Located at Billie Jean King National Tennis Center
• Indian Wells Tennis Garden - Stadium 1 (Indian Wells, CA): 16,102• Louis Armstrong Stadium (Flushing, NY): 14,000
Located at Billie Jean King National Tennis Center
• Center Court - Hard Rock Stadium (Miami Gardens): 13,800• Lindner Family Tennis Center - Center Court (Mason, OH): 11,435• Volvo Stadium (Charleston, SC): 10,200• Delray Beach Tennis Center - Stadium Court (Delray Beach): 8,200• Grandstand Court (Flushing, Queens, NY): 8,125
Located at Billie Jean King National Tennis Center
• Indian Wells Tennis Garden - Stadium 2 (Indian Wells, CA): 8,000• William H.G. FitzGerald Tennis Center (Washington, D.C.): 7,500• Nassau Veterans Memorial Coliseum (Uniondale, NY): 6,500• Lindner Family Tennis Center - Grandstand Court (Mason, OH): 5,000• Lindner Family Tennis Center - Court #3 (Mason, OH): 4,000• Newport Casino (Newport, RI): 3,038• River Oaks Country Club (Houston, TX): 3,000• Court 17 (Flushing, Queens, NY): 2,500
Located at Billie Jean King National Tennis Center
• Lindner Family Tennis Center - Court 10 (Mason, OH): 2,000
95.2 Venue ProfilesThe following are profiles of tennis venues that host major tournaments:
Billie Jean King National Tennis Center• Venues: Arthur Ashe Stadium, Louis Armstrong Stadium, Court 17• Owner: United States Tennis Association• Opened: 1997• Major event hosted: US Open
SPORTS MARKETING 2020-2021
• 432 •

Delray Beach Tennis Center• Owner: Delray Swim & Tennis Club• Opened: 1992• Major event hosted: Chris Evert/Raymond James Pro-Celebrity Tennis Classic
Indian Wells Tennis Garden• Courts: Stadium 1, Stadium 2• Owner: Larry Ellison• Opened: 2000• Major event hosted: BNP Paribas Open
Lindner Family Tennis Center• Owner: Tennis for Charity, Inc.• Venues: Center Court, Grandstand Court, Court 3.• Opened: 1981 - Center Court• Opened: 1995 - Grandstand Court (Court 2)• Opened: 1997 - Court 3• Major event hosted: Western & Southern Open
Nassau Veterans Memorial Coliseum• Owner: Nassau County• Opened: 1972• Major event hosted: New York Open
Newport Casino• Owner: National Tennis Club• Opened: 1897• Home of the International Tennis Hall of Fame
River Oaks Country Club• Owner: privately owned• Opened: 1931• Major events hosted: River Oaks International Tennis Tournament, U.S. Men's Clay
Court Championships
Volvo Stadium• Owner: privately owned• Opened: 2001• Major event hosted: Volvo Cars Open
William H.G. FitzGerald Tennis Center• Owner: Municipality of Washington, DC• Opened: 1991• Major event hosted: Citi Open
SPORTS MARKETING 2020-2021
• 433 •

96
MEN’S TOURS
96.1 OverviewThe Association of Tennis Professionals (ATP, www.atpworldtour.com), which
represents the interests of male professional tennis players, organizes the ATP WorldTour. Under the leadership of Etienne de Villiers, who took over as CEO in 2005, thetour has instituted significant changes to make it more viewer-friendly for televisionbroadcasts. Tournaments now start on Sundays instead of Mondays to attract moreweekend fans, for example. Also, five-set matches, which often took four hours, havebeen replaced by best-of-three matches.
The United States Tennis Association (USTA, www.usta.com) is the governingbody for tennis in the United States. With more than 700,000 individual members and7,000 organizational members, USTA is the largest tennis organization in the world. USTA manages the US Open – the world’s largest attended annual sporting event –and the recently launched US Open Series, which links 10 summer tournaments to theUS Open. It also oversees three professional tour events, 94 Pro Circuit eventsnationwide, and all operations of the USTA National Tennis Center, the world’s largestpublic tennis facility and home of the US Open. USTA also manages and selects theU.S. teams for Davis Cup, Fed Cup, the Olympics, and the Paralympic Games. In2006, USTA acquired partial ownership of The Tennis Channel.
96.2 Highest-Earning Tennis PlayersForbes ranks the highest-earning men’s tennis players in 2018 as follows:
Winnings Endorsements Total
• Roger Federer: $12.2 million $65.0 million $77.2 million• Rafael Nadal: $14.4 million $27.0 million $41.4 million• Kei Nishikori: $ 1.6 million $33.0 million $34.6 million• Novak Djokovic: $ 1.5 million $22.0 million $23.5 million• Grigor Dmitrov: $ 6.7 million $ 6.7 million $12.7 million• Andy Murray: $ 1.0 million $10.5 million $11.5 million
96.3 APT World TourAccording to SportsBusiness Journal, ATP World Tour annual revenue is
$107.1 million.
SPORTS MARKETING 2020-2021
• 434 •

The 2019 ATP World Tour had 60 events (www.atpworldtour.com), withtournaments classified as 1000 Series (nine events), 500 Series (11 events), and 250Series (40 events).
Twelve of the 60 events were held in the U.S. and Canada, as follows:• February 11-17: New York Open (USTA Billie Jean King National
Tennis Center, Flushing Meadows, NY)• February 18-24: Delray Beach Open by Vitacost.com (Delray Beach, FL)• March 7-17: BNP Paribas Open (Indian Wells, CA)• March 20-31: Miami Open Presented by Itaú (Miami Lakes, FL)• April 8-14: Fayez Sarofim & Co. US Men’s Clay Court
(Houston, TX)• July 14-21: Newport Hall of Fame Open (Newport, RI)• July 22-28: BB&T Atlanta Open (Atlanta, GA)• July 27-August 4: Citi Open (Washington, DC)• August 5-11: Rogers Cup (Montreal, Canada)• August 11-18: Western & Southern Open (Cincinnati, OH)• August 18-24: Winston-Salem Open (Winston-Salem, NC)• August 26-September 8: 2019 US Open (USTA Billie Jean King National
Tennis Center, Flushing Meadows, NY)
ATP Media has international and domestic TV rights for the ATP 1000 Series, international rights for the ATP 500 Series, and international rights for the Davis CupQuarterfinals, Semifinals, and Finals. Host venues for the 500 Series and 250 Seriescontrol domestic TV rights.
SportsBusiness Journal estimates that ATP Media garners $60 million inrevenue from rights fees and online purchases of streamed matches, a figure that hasgrown 500% since 2006.
ATP World Tour sponsors in 2019 were Emirates Airline, FedEx, Infosys, andPeugot.
_________________________________________________________________
“There is not a comparable entity that doeswhat they do for their sport. They representtheir rights globally and understand the marketsthroughout the world. And then they help makeit an efficient production, pivoting between thetournament, the ATP and then the broadcasters. It is one-stop shopping.”
SportsBusiness Journal _________________________________________________________________
SPORTS MARKETING 2020-2021
• 435 •

96.4 Grand Slam TournamentsGenerally recognized as the most important tennis events each year, the four
Grand Slam tournaments (also called the Majors) are as follows:• The Australian Open• The French Open• The US Open• Wimbledon
The French Open is played on clay, Wimbledon is played on grass, and theother two tournaments are played on hard courts.
96.5 Market ResourcesAssociation of Tennis Professionals (ATP Americas), 201 ATP Tour Boulevard, Ponte Vedra Beach, FL 32082. (904) 285-8000. (www.atpworldtour.com)
United States Tennis Association, 70 West Red Oak Lane, White Plains, NY 10604.(914) 696-7000. (www.usta.com)
SPORTS MARKETING 2020-2021
• 436 •

97
WOMEN’S TOURS
97.1 OverviewThe Women’s Tennis Association (WTA, www.wtatennis.com), the organizing
body for women’s professional tennis, organizes the WTA Tour, the worldwideprofessional tennis tour for women.
97.2 Highest-Earning Tennis PlayersForbes ranks the highest-earning female tennis players in 2018 as follows:
Winnings Endorsements Total
• Serena Williams: $0.1 million $18.0 million $18.1 million• Caroline Wozniacki: $7.0 million $ 6.0 million $13.0 million• Sloane Stephans: $5.7 million $ 5.5 million $11.2 million• Garbine Muguruza: $5.5 million $ 5.5 million $11.0 million
97.3 WTA TourAccording to SportsBusiness Journal, WTA tour annual revenue is $69.7 million.The 2019 WTA World Tour had 78 events. Twelve of the 78 events were held in
the U.S. and Canada, as follows:• January 21-27: Oracle Challenger Series (Newport Beach, CA)• February 25-March 3: Oracle Challenger Series (Indian Wells, CA)• March 19-30: Miami Open presented by Itau (Miami Lakes, FL)• April 1-7: Volvo Car Open (Charleston, SC)• July 29-August 4: Mubadala Silicon Valley Classic (San Jose, CA)• July 29-August 4: Citi Open (Washington, DC)• August 5-11: Rogers Cup (Montreal, Quebec, Canada)• August 12-18: Western & Southern Open (Cincinnati, OH)• August 18-24: NYJTL Bronx Open (Flushing Meadows, NY)• August 26-September 7: 2019 US Open Tennis Championships (Flushing
Meadows, NY)• September 2-8: Oracle Challenger Series (New Haven, CT)• November 10-17: Oracle Challenger Series (Houston, TX)
WTA World Tour matches are broadcast by CBS Sports, ESPN, ESPN2, NBC,and Tennis Channel.
SPORTS MARKETING 2020-2021
• 437 •

97.4 Grand Slam TournamentsWTA recognizes eight Grand Slam tournaments as follows:
• Australian Open (Melbourne)• BNP Paribas Open (Indian Well, CA)• China Open (Beijing)• French Open (Paris)• Miami Open Presented by Itaú (Miami Gardens, FL)• Mutua Madrid Open (Madrid, Spain)• US Open (Flushing Meadows, NY)• Wimbledon (London)
97.5 SponsorsWTA Tour sponsors for 2019 were Dubai Duty Free, iQIYI, Porsche, and SAP.
97.6 Market ResourcesWomen’s Tennis Association, 100 Second Avenue S, Suite 1100-S, St. Petersburg, FL33701. (727) 895-5000. (www.wtatennis.com)
SPORTS MARKETING 2020-2021
• 438 •

98
MAJOR TOURNAMENTS
98.1 BNP Paribas OpenThe BNP Paribas Open (www.bnpparibasopen.com), also called the Indian
Wells Masters, has been played at the Indian Wells Tennis Garden (Indian Wells, CA)since 1974. The tournament is a Masters 1000 event on the men’s tour and is aPremier Mandatory event on the women’s tour. Indian Wells Tennis Garden is thesecond-largest permanent tennis stadium in the world. The tournament is one of themost lavish events among all sports competitions.
BNP Paribas Open attendance has been as follows:• 2009: 332,498• 2010: 339,657• 2011: 350,086• 2012: 370,406• 2013: 382,227• 2014: 431,527
• 2015: 456,672• 2016: 438,058• 2017: 439,261• 2018: 450,502• 2019: 475,372
BNP Paribas was the Premier Sponsor for 2019. Sponsors were Audi, EmiratesAirline, Fila, Masimo, Oracle, Penn, and Steve Furgal’s International Tennis Tours.
The 2020 BNP Paribas Open is scheduled for March 11-22.
98.2 Davis CupThe Davis Cup (www.daviscup.com), sanctioned by the International Tennis
Federation (ITF, www.itftennis.com), is the most important international tournamentbetween national teams in men’s tennis. The tournament was launched in 1900.
The 2019 Davis Cup by Rakuten, the 119th of the tournament, was hosted byCaja Mágica in Madrid, Spain, November 18-24, 2019.
In 2015, ITF signed a seven-year rights agreement with beIN Media Group toprovide global television and digital coverage of the Davis Cup and Fed Cup.
The tournament is streamed live at www.daviscup.tv.Sponsors for 2019 were Adecco, beIN Sports, Head, and Rakuten.
98.3 Fed CupThe Fed Cup (www.fedcup.com), sanctioned by the ITF, is the most important
SPORTS MARKETING 2020-2021
• 439 •

international tournament between national teams in women’s tennis. The tournamentwas launched in 1963.
The 2019 Fed Cup by BNP Paribas, the 57th edition of the tournament, wasscheduled at RAC Arena (Perth, Australia), November 9-10, 2019.
Sponsors were Adecco, beIN Sports, and BNP Paribas.
98.4 Miami OpenHeld in March at Hard Rock Stadium (Miami Lakes, FL), the two-week combined
men’s and women’s Miami Open Presented by Itaú (www.miamiopen.com) has becomeone of the top sporting events in the U.S. for corporate hospitality. IMG (www.img.com)owns the Miami Open.
The tournament had historically been held at the Tennis Center at Crandon Parkin Key Biscayne, Florida, from 1988 through 2018, before moving to Miami Gardens for2019.
The Miami Open annually generates an economic impact of over $380 million forthe Miami-Fort Lauderdale region.
In 2016, the tournament was televised in the United States on ESPN, ESPN2,and Tennis Channel, with 106.5 hours of recorded coverage. The tournament was alsobroadcast to 193 territories around the world and received an estimated 12,000 hoursof global television coverage.
Miami Open Presented by Itaú attendance has been as follows:• 2009: 293,228• 2010: 312,386• 2011: 316,267• 2012: 326,131• 2013: 307,809• 2014: 306,842
• 2015: 308,486• 2016: 300,952• 2017: 304,643• 2018: 303,339• 2019: 388,734
Itaú became the title sponsor in 2015; Sony was the previous sponsor. Platinumsponsors in 2019 were Emirates Airline, Lacoste, Peugeot, Rolex, and UltimateSoftware.
Gold sponsors were Advocare, Assist Card, Baptist Health South Florida, Claro,Dekton, FedEx, Kim Crawford, Laykold, Moët & Chandon, SAP, Stella Artois, SteveFurgal’s International Tennis Tours, and The British Virgin Islands,
The 2020 event will be held March 23-April 5.
98.5 US OpenThe US Open (www.usopen.org) is the final event of the US Open Series. The
main court for the event is the 22,547-seat Arthur Ashe Stadium, located at the USTABillie Jean King National Tennis Center in Flushing Meadows, New York.
SPORTS MARKETING 2020-2021
• 440 •

US Open attendance has been as follows:• 2009: 721,059• 2010: 712,976• 2011: 658,664• 2012: 710,803• 2013: 713,026
• 2014: 713,642• 2015: 691,280• 2016: 688,542• 2017: 691,143• 2018: 732,665
An $825 million, 11-year broadcast rights agreement between the US Open andESPN began in 2015. CBS had broadcast the US Open for the previous 46 years.
US Open sponsors for 2018 were American Express, Chase, Deloitte, EmiratesAirline, Evian, IBM, JPMorgan, Mercedes-Benz, Polo Ralph Lauren, Rolex, andSpectrum.
_________________________________________________________________
“The US Open, which attracts over 700,000visitors per year, offers brands access to arelatively well-educated and affluent demographicand, unlike many sporting events, has anaudience that’s split equally between men andwomen.”
SportsBusiness Journal _________________________________________________________________
The 2019 US Open was scheduled for August 19 - September 8.
98.6 WimbledonSince the first championships in 1877, Wimbledon’s (www.wimbledon.org)
history, elegance, and timeless grass-court setting have held a special place in sports. Wimbledon is jointly hosted by The All England Tennis and Croquet Club and The LawnTennis Association.
In 2011, the All England Tennis and Croquet Club awarded broadcast rights tothe Wimbledon Championships through 2024 to ESPN. The New York Timesestimated the value of the deal, which ended NBC’s 43-year run of coverage of theevent, at $500 million. Viewership for Wimbledon 2019 finals matches averaged 3.8million on ESPN and ESPN2.
Wimbledon is the most-watched TV sports event in the United Kingdom. Broadcast by BBC, viewership in 2019 peaked at 9.3 million.
Attendance at Wimbledon is limited by the capacity and fluctuates only slightly
SPORTS MARKETING 2020-2021
• 441 •

year-to-year. Attendance crossed and has stayed over the 400,000 mark since 1997,reaching more than 500,000 once. Attendance was 473,169 in 2019.
Wimbledon sponsors in 2019 were American Express, Evian, Häagen-Dazs,HSBC, IBM, Jaguar Land Rover, Lanson, LavAzza, OPPO, Pimms, Polo Ralph Lauren,Robinsons, Slazenger, and Stella Artois.
The 133rd Wimbledon Championships were held July 1-14, 2019. The 134th
Wimbledon Championships are scheduled for June 29-July 12, 2020.
SPORTS MARKETING 2020-2021
• 442 •

PART XIII: ESPORTS
SPORTS MARKETING 2020-2021
• 443 •

99
ESPORTS MARKET ASSESSMENT
99.1 OverviewEsports, defined as video game competitions in which players compete in front
of live audiences, are rapidly gaining popularity in the United States.
_________________________________________________________________
“The growth of competitive esports has beenanything but an overnight phenomenon, withthe market swelling from humble fighting andshooting games in the 1990s, when tournamentprizes would be a few hundred dollars, to anindustry that generates hundreds of millions ofdollars annually. The global championships,whose tournament prize pools are in themillions of dollars, currently see their finalespack arenas worldwide.”
The New York Times _________________________________________________________________
According to a survey by McKinsey & Company’s Global Sports and GamingPractice (www.mckinsey.com), 37% of people who play competitive video games atleast once a week also watch esports weekly.
99.2 Esports Viewers‘Esports Enthusiasts’ are defined by Newzoo (www.newzoo.com) as frequent
viewers and active participants of esports. In 2019, this group numbered 201.2 millionglobally and is 71% male; 50% are ages 21-to-35. Including 252.6 million ‘OccasionalViewers,’ the total global audience is 453.8 million.
eMarketer (www.emarketer.com) assesses the number of people (any age) inthe U.S. that watch professional esports on hosted digital video platforms at least oncea month, as follows (change from prior year in parenthesis):
SPORTS MARKETING 2020-2021
• 444 •

• 2018: 25.7 million (22.9%)• 2019: 30.3 million (18.1%)• 2020: 34.8 million (14.8%)• 2021: 39.2 million (12.5%)• 2022: 43.1 million (10.1%)• 2023: 46.2 million (7.3%)
Tech & Media Outlook 2019, by Activate Inc. (www.activate.com), estimated thatthere are 63 million people in the U.S. had viewed at least one esports event.
99.3 Market AssessmentThe 2019 Global Esports Market Report, by Newzoo, assesses the 2019 esports
global market at $1.1 billion, an increase of 36.7% from the previous year. Most of theglobal esports business in 2019 was from North America (38%) and China (18%). Revenue was distributed as follows:• Sponsorship: 40%• Advertising: 19%• Media rights: 18%• Game publishing fees: 13%• Merchandise and tickets: 11%
Newzoo estimates the esports market will generate $1.8 billion in 2022.PricewaterhouseCoopers (PwC, www.pwc.com) estimated worldwide esports
revenues in 2018 at $805 million, distributed as follows:• Sponsorship: $277 million• Media rights: $181 million• Streaming advertising: $163 million• Consumer contribution: $129 million• Consumer ticket sales: $ 55 million
PwC projected worldwide esports revenues of $1.58 billion by 2022, an 18.4%compounded annual growth rate (CAGR). Media rights revenue is projected to grow ata 11.5% CAGR to $449 million by 2022; the CAGR of rate of sponsorship andadvertising is projected at 5.5%.
Goldman Sachs (www.goldmansachs.com) assessed that total global esportsrevenues reached $869 million in 2018. Revenues are forecast to more than triple by2022, reaching $2.96 billion.
99.4 Top Esports CompaniesRanked by 2018 valuation, Forbes ranked the most valuable esports companies*
as follows
SPORTS MARKETING 2020-2021
• 445 •

Valuation Rev enue # Players # Teams
• Cloud9: $310 million $22 million 92 11• Team SoloMid: $250 million $25 million 39 7• Team Liquid: $200 million $17 million 65 14• Echo Fox: $150 million $11 million 23 8• OpTic Gaming: $130 million $10 million 52 6• Fnatic: $120 million $11 million 45 11• Gen.G Esports: $110 million $12 million 50 7• G2 Esports: $105 million $ 8 million 53 11• Immortals: $100 million $ 5 million 22 4• Envy Gaming: $ 95 million $ 5 million 69 7• 100 Thieves: $ 90 million $ 5 million 33 4• Counter Logic Gaming: $ 50 million $ 4 million 45 7* Includes only companies that compete in gaming and excludes game publishers and arena builders.
_________________________________________________________________
“The nascent esports industry resembles theWild West. Esports companies are constantlybuying and selling teams and players tocompete in the best leagues and buildaudiences on Amazon’s Twitch and Alphabet’sYouTube. Facilities are being built wheregamers can train. It’s a shootout to see whocan be the biggest and baddest brand.”
Forbes, 10/26/18 _________________________________________________________________
99.5 InvestmentSeven- and eight-figure rounds of venture capital funding gone to esports,
according to Bloomberg Businessweek.In 2017, there were 74 deals worth $1.52 billion involving esports companies,
according to PitchBook (www.pitchbook.com). The majority of investments were fromangel and venture capital investors. During the first nine months of 2018, there were 63deals worth $2.34 billion. For comparison, there were six deals worth $34 million in2008.
Several iconic sports names have invested in esports franchises. Robert Kraft,owner of the New England Patriots, and Magic Johnson have invested in OverwatchLeague. Dan Gilbert, owner of the NBA’s Cleveland Cavaliers, invested in 100 Thieves
SPORTS MARKETING 2020-2021
• 446 •

after it got its League of Legends team in 2017. Boston Celtics co-owner Jim Pallotta’sRaptor Group invested in Fnatic. Memphis Grizzlies co-owner Steve Kaplan holds ashare in the ownership group behind Immortals. Houston Rocket’s owner TilmanFeritta owns Clutch Gaming.
Investments have paid off, at least in the short term. Riot Games began sellingfranchises for its game League of Legends at $10 million in the summer of 2017. Activision Blizzard began selling franchises for $20 million for its Overwatch Leaguearound the same time. In late 2019, League of Legends franchises were being valuedat $50 million by bankers. Overwatch franchise valuations are $60 million to $80million, depending on location.
SPORTS MARKETING 2020-2021
• 447 •

100
LEAGUES & CHAMPIONSHIPS
100.1 ELeagueEleague (www.eleague.com), a professional league for Counter-Strike: Global
Offensive, launched in September 2015 as a joint venture of Turner Broadcasting andtalent agency WME-IMG, now called Endeavor (www.endeavorco.com). The 24-teamleague has two 10-week seasons annually, with each season comprised of a regularseason, playoffs, and a championship. Matches are played at the Turner Studiosfacility in Atlanta, Georgia, and broadcast live on TBS on Friday nights. The broadcastis simultaneously available on Twitch, an online streaming service.
100.2 ESL Gaming NetworkESL Gaming Network (www.eslgaming.com), an esports production and
broadcasting company, operates several high profile, branded international andnational leagues and tournaments, including top tier stadium-size events as well asgrassroots amateur cups, leagues, and matchmaking systems. As of March 2017, ESLhad operated more than 3,500 tournaments and paid out over $19 million in prizemoney.
Owned by Swiss media conglomerate MTG and headquarted in Cologne,Germany, ESL has a global footprint, with offices in the United States, Canada, Russia,France, Poland, Spain, and China. ESL opened its U.S. studio in Burbank, Calif ornia,in 2014.
Major tournaments are the 59-event Intel Extreme Masters, the 20-event ESLOne Series, and ESL National Championships. ESL also runs events for gamemakers, including Riot’s League of Legends and Blizzard Entertainment’s Overwatch.
ESL has filled 12 stadiums around the world – including Madison Square Garden(New York, NY) and SAP Center (San Jose, CA) – with fans for its esportstournaments.
Corporate partners are BenQ, Blizzard, Intel, Red Bull, Riot, Smart Checker,Twitch, and Wargaming.net.
SPORTS MARKETING 2020-2021
• 448 •

_________________________________________________________________
“The biggest tournaments are already fillingentire arenas, including New York City’sMadison Square Garden. ESL’s broadcasterssit at SportsCenter-esque desks providingplay-by-plays with enthusiasm levels suited tothe Super Bowl, which has helped competitivegaming appeal to a broader audience. Thecompany regularly streams esports content sixor seven days a week.”
MarketWatch _________________________________________________________________
100.3 Evolution Championship SeriesThe Evolution Championship Series, commonly known as Evo, is an annual
esports event that focuses exclusively on fighting games. It has been held at variousvenues in Las Vegas since 2005.
Evo 2019 took place at Mandalay Bay, August 2-4.
100.4 FIFA eWorld Cup and eMLS CupThe FIFA eWorld Cup (www.fifa.com/fifaeworldcup/) has been presented by EA
Sports (www.easports.com) since 2004. Each tournament has players competing ingames of the latest incarnation of the FIFA video game series. The open qualifyingformat allows millions to compete in the initial online stages, which has resulted in theFIWC being recognized as the largest online eSports game by Guinness WorldRecords.
In April 2019, Major League Soccer (MLS, www.mlssoccer.com) launched eMLSCup, an esports tournament, in conjunction with the EA Sports FIFA franchise. Thetournament serves as an official league qualifier for the FIFA eWorld Cup.
SPORTS MARKETING 2020-2021
• 449 •

_________________________________________________________________
“MLS and its clubs see an opportunity to moredeeply connect with one of sports’ more digital-centric fan bases.”
SportsBusiness Journal, 2/5/19 _________________________________________________________________
100.5 Fortnite World CupBased on the video game Fortnite and hosted by Epic Games, Fortnite World
Cup (www.epicgames.com/fortnite/competitive/en-US/events/world-cup) is an annualesports competition. The inaugural event took place in July 2019 at the Arthur AsheStadium (Flushing, NY). The World Cup is split into two different events, one for soloplayers and a separate for two-player teams. The prize pool was $30 million.
Epic Games reported that tickets for the 23,700-seat stadium were sold out.An estimated 2.3 concurrent million viewers on Twitch.tv and YouTube streamingservices watched the Fortnite World Cup finales.
100.6 League Of Legends World Championship SeriesRiot Games (www.riotgames.com), publisher of League of Legends, the most
popular game in the world with 100 million monthly players, has hosted the League ofLegends World Championship since 2011.
According to Esports Charts (www.esportscharts.com), Worlds 2018 Grand Finalhad a peak global viewership of more than 200 million spectators from all broadcastand digital media, a record for esports.
In 2017, Riot Games awarded 10 permanent franchise spots in the NorthAmerican League Championship Series for $10 million each. The league started playin 2018.
In 2019, the league was rebranded as League of Legends Championship Series(LCS). There were 10 teams, as follows:• 100 Thieves• Cloud9• Clutch Gaming• Counter Logic Gaming• Echo Fox• FlyQuest• Golden Guardians• OpTic Gaming
SPORTS MARKETING 2020-2021
• 450 •

• Team SoloMid• Team Liquid
With the exception of some touring events, all games of the LCS are played liveat Riot Games' studios (Los Angeles, CA). All games are streamed live in severallanguages on Twitch.tv and YouTube, with broadcasts regularly attracting over 300,000viewers.
100.7 Major League GamingMajor League Gaming (MLG, www.mlg.com), launched in 2002, holds official
video game tournaments throughout the United States and Canada. MLG operates the MLG Pro Circuit, the longest-running eSports league in North
America, CWL Global Pro League, and GameBattles, the largest cross platform onlinegaming tournament system with 9 million registered users across the globe.
MLG hosts a premium streaming service, mlg.tv, which streams competitions. Competitions have also been broadcast on ESPN.com.
In 2014, MLG opened the 14,000 sq. ft. MLG.tv Arena in Columbus, Ohio.Activision Blizzard, publisher of Call of Duty, acquired MLG in 2016 for $46
million.
100.8 NBA 2K LeagueIn 2018, the National Basketball Association launched the NBA 2K Leag ue
(https://2kleague.nba.com), becoming the first U.S. professional sports organization to have an esports league of its own. Based around the popular NBA 2K video gameseries, esports players compete in 5-on-5 games throughout a season running fromspring to summer.
In its inaugural season, 17 of the 30 NBA franchises participated in the 2KLeague. Four additional NBA franchises participated in 2019. 2K League teams usethe same team names as their professional counterparts.
100.9 Overwatch LeagueThe Overwatch League (OWL, www.overwatchleague.com), a professional
esports league for the video game Overwatch, produced by its developer BlizzardEntertainment (www.blizzard.com), launched in 2018. OWL follows the model oftraditional professional sporting leagues by using a set of permanent, city-based teamsbacked by separate ownership groups. The league plays a regular season and playoffsformat rather than the use of promotion and relegation common in other esportsleagues.
The 2019 season opened with 20 teams, 13 of which were in the United Statesand Canada. Other teams were based in China, France, South Korea, and the United
SPORTS MARKETING 2020-2021
• 451 •

Kingdom. U.S. and Canadian teams were as follows:• Atlanta Reign• Boston Uprising• Dallas Fuel• Florida Mayhem (Miami-Orlando)• Houston Outlaws• Los Angeles Valiant• Los Angeles Gladiators• New York Excelsior• Philadelphia Fusion• San Francisco Shock• Toronto Defiant• Vancouver Titans• Washington Justice
In 2019, the total prize pool was $5.0 million, an increase from $3.5 million in theinaugural season.
In 2018, Activision Blizzard signed a multiyear deal with Walt Disney tobroadcast the Overwatch League on ESPN, Disney XD and ABC.
OWL sponsors for the 2019 season were Coca-Cola, Intel, OMEN by HP, State Farm, T-Mobile, and Toyota.
100.10 Super League GamingSuper League Gaming (SLG, www.superleague.com), founded in 2014, hosts
esports tournaments in underused spaces such as malls and movie theaters. Theesports platform is aimed at amateur level players.
SLG has a deal with about 25 Cinemark theaters to host weekly intercitytournaments for Minecraft, Clash Royale, and other titles.
Super League Gaming went public on NASDAQ in 2018 (stock symbol: SLGG).
SPORTS MARKETING 2020-2021
• 452 •

101
ESPORTS VENUES
101.1 OverviewVenues of all type are being staged to host esports tournaments. Sports arenas
and performing arts centers including KeyArena (Seattle, WA), Madison Square Garden(New York, NY), SAP Center (San Jose, CA), and Staples Center (Los Angeles, CA)have hosted esports tournaments. Cinemark has opened at least 25 of its theaters forSuper League Gaming tournaments. And spaces in existing buildings at over 500universities have been converted for esports competitions.
The large crowds drawn by esports tournaments have spurred the constructionof venues dedicated to esports. According to SportsBusiness Journal, there wereabout a dozen professional esports venues across the U.S. at year-end 2018.
_________________________________________________________________
“If it seems like new facilities for esports arepopping up everywhere, it's because they kindof are.”
Forbes, 5/31/19 _________________________________________________________________
101.2 Venue ProfilesThe following are the largest professional esports venues in the U.S.:
Blizzard Arena (Burbank, CA)• Capacity: 50,000 sq. ft.• Owner: Blizzard Entertainment Inc.• Opened: 2018• Major event hosted: Overwatch League games
Esports Arena (Oakland, CA)• Capacity: 16,000 sq. ft.• Owner: Esports Arena franchise• Opened: 2017
SPORTS MARKETING 2020-2021
• 453 •

Esports Arena (Santa Ana, CA)• Capacity: 15,000 sq. ft.• Owners: Tyler Endres and Paul Ward• Opened: 2015
Esports Stadium (Arlington, VA)• Capacity: 100,000 sq. ft.• Owner: Arlington Convention center• Opened: 2016• Cost: $10 million
Fusion Arena (Philadelphia, PA)• Capacity: 60,000 sq. ft.; 3,500 seats• Owner: Comcast Spectacor and The Cornish Cos.• Opening: scheduled for 2021• Cost: $50 million
HyperX Esports Arena (Las Vegas, NV)• Capacity: 30,553 sq. ft.• Owner: Allied Esports (www.elcgaming.com/company/allied-esports)• Opened: 2018• Cost: $10 million
LCS Studio (Los Angeles, CA)• Capacity: 14,000 sq. ft.• Owner: Riot Games• Opened: 2015• Major event hosted: League of Legends Championship Series
Localhost Arena (Lakewood, CO)• Capacity: 18,000 sq. ft.• Owners: Mile High Esports and N3rd Street Gamers• Opened: 2018
MLG.tv Arenna (Columbus, OH)• Capacity: 14,000 sq. ft.• Owner: Major League Gaming• Opened: 2014
Planet Oasis eSports Arena (Columbus, OH)• Capacity: 30,000 sq. ft.• Owner: Major League Gaming• Opening: Scheduled for 2020• Cost: $10 million
SPORTS MARKETING 2020-2021
• 454 •

Among the largest esports venues on colleges campuses are those at BellevueUniversity (Bellevue, NE), Concordia University (Austin, TX), Full Sail University (WinterPark, FL), Hawaii Pacific University (Honolulu, HI), Ohio State University (Columbus,OH), Tiffin University (Tiffin, OH), University of Akron (Akron, OH), University ofCalifornia (Irvine, CA), University of North Texas (Denton, TX), University ofWashington (Seattle, WA), and Western Michigan University (Kalamazoo, MI).
SPORTS MARKETING 2020-2021
• 455 •

102
MEDIA & ADVERTISING
102.1 Esports MediaEsports media competes directly for viewer’s time with traditional sports media.
_________________________________________________________________
“The rising popularity of competitive video-gaming,or esports, is chipping away at viewership oftraditional sports, a new study shows. About 76%of esports fans say they are spending less timewatching games such as football and baseballbecause they are tuned into video gamecompetitions instead, according to Newzoo.”
The Wall Street Journal, 10/13/16 _________________________________________________________________
The following is a summary of esports media:• Online streaming service Twitch is the largest esports media company (see 102.3).• Turner Broadcasting, in partnership with Endeavor, formed ELeague, a professional
league for Counter-Strike: Global Offensive, in 2015. Matches are broadcast live onTBS on Friday nights.
• YouTube Gaming, launched in 2015, contracted for exclusive English-languagestreaming rights to the ESL Pro League in 2017.
• In January 2017, Facebook Live secured exclusive streaming rights to Blizzard’sHeroes of the Dorm tournament, which had aired on ESPN the prior two seasons.
• ESPN unveiled a newsgathering operation to cover esports in 2016.• Major League Gaming (MLG, www.majorleaguegaming.com) operates MLG.tv, an
online broadcast network for professional level competitive gaming.• ESL Gaming Network signed a partnership in February 2017 with former Fox TV
executive David Hill.• In December 2016, Riot Games, publisher of League of Legends, signed a deal with
MLBAM’s BAMTech subsidiary that gives the Major League Baseball spinoff
SPORTS MARKETING 2020-2021
• 456 •

exclusive rights to create a dedicated viewing app for fans and to sell sponsorshipsand ads.
• Activision Blizzard, publisher of iconic video game titles Call of Duty, World ofWarcraft, Heroes of the Storm, and Overwatch operates MLG.tv.
102.2 TwitchGaming networks provide a platform for gamers to play or watch games online.
Twitch.tv, acquired by Amazon in 2014 for $970 million, is the most popular gamingnetwork.
The average Twitch user spends two hours a day engaging with the site. Duringits peak hours, Twitch is the web’s fourth largest source of traffic, behind Netflix,Google, and Apple.
_________________________________________________________________
“While new competitors are gunning for itsstreaming dominance, Twitch remains thedestination of choice for anyone who wants towatch others play video games.”
SportsBusiness Journal _________________________________________________________________
In total, Twitch had more than 1.5 million broadcasters and logged more than100 million unique viewers a month, with those viewers racking up a collective 20 billionminutes of viewing time of the more than 11 million videos that are broadcast.
SPORTS MARKETING 2020-2021
• 457 •

_________________________________________________________________
“Twitch boasts more than 2 million uniquestreamers per month, drawing 9.7 million activedaily viewers with an engagement rate of 106minutes watched per person per day. Twitchstreams most of the biggest esports competitionsacross the globe, drawing huge audiences. Thesite is free, but Twitch’s secret sauce is its adrevenue model. The top 17,000 streamers, whichinclude professional esports players, canparticipate in an ad-revenue-sharing program. The players, not Twitch, decide in real time whenthe ads run during their streaming sessions. So a top esports player might hop on Twitch topractice playing, draw thousands of viewers, andthen take a quick break and ask viewers to watchan ad, noting that it will help support their career.”
Advertising Age _________________________________________________________________
SPORTS MARKETING 2020-2021
• 458 •

103
COLLEGIATE ESPORTS
103.1 Collegiate ClubsEsports clubs have been organized at most major U.S. universities. In 2009,
the gaming club at Princeton University spearheaded the formation of the CollegiateStarleague (CSL, www.cstarleague.com).
CSL hosts tournaments in some of the most popular game titles and hasawarded over $400,000 in scholarship money to collegiate champions. During the2018-2019 academic year, clubs from 900 schools and 30,000 players participated inCSL.
_________________________________________________________________
“Esports have taken off on campuses acrossthe country, including Harvard and Florida StateUniversity. More than 10,000 students now playin the biggest college league, 4,600 more thanthe number of men who play on Division Icollege basketball teams. The stakes keepclimbing, too: Winning a big tournament cansometimes earn players several years’ worth oftuition money.”
The New York Times _________________________________________________________________
Many college clubs also participate in the Ivy League of Legends (IvyLoL,www.ivylol.com), which formed in 2012. IvyLoL is organized into four Premier Leagues(East, North, South, and West) and an Open League.
103.2 Varsity Esports ProgramsRobert Morris University (Chicago, IL) created a sanctioned video game team in
2014, becoming the first college to do so.
SPORTS MARKETING 2020-2021
• 459 •

In July 2016, seven colleges sanctioned esports programs. By April 2017, thenumber of collegiate varsity programs had grown to 35.
Most colleges are letting esports evolve on their own, sanctioning clubs andproviding practice space but not imposing the regulations governing traditional sports.
National Association of Collegiate eSports (NACE, https://nacesports.org)formed in July 2016 to coordinate in areas such as competition, eligibility, path tograduation, and scholarships. One of NACE’s first tasks was to define what makes anesports program a varsity sport. Largely, it means that the program is fully integratedinto the school, receives funding, recruits, offers scholarships, has an esports-specificfacility for practice and play, and provides equipment.
According to Michael Brooks, Executive Director of NACE, about 40% of varsityesports are run by athletic departments, 40% are run by student affairs or other studentservices departments, and 20% are managed by an academic department such asmedia or entertainment studies.
_________________________________________________________________
“Schools are intrigued by the connection withstudents focused on science, technology,engineering and math. Essentially, administratorssee esports as another way to recruit students intheir hyper-competitive landscape. In their mind, it has become a way to engage the science,technology, engineering and math students, forwhom it becomes their sport.”
Val Ackerman, President Big East SportsBusiness Journal
_________________________________________________________________
Most esports team budgets start at around $200,000. Salaries, facilities,equipment, and scholarships are the main costs; many schools are able to get gamingequipment donated. NACE estimates over $15 million in scholarships and aid havebeen granted.
As of June 2019, over 130 schools had sanctioned varsity esports teams.
103.3 High School Esports LeagueHigh School Esports League (HSEL, www.highschoolesportsleague.com) was
founded in 2012 to assist high school students and teachers organize esports teams.
SPORTS MARKETING 2020-2021
• 460 •

HSEL also organizes regional and national competitive gaming competitions.As of August 2019, HSEL had partnered with over 1,500 high schools.
103.4 Market ResourcesHigh School Esports League. (816) 287-1962. (www.highschoolesportsleague.com)
National Association of Collegiate eSports, 1200 Grand Boulevard, Kansas City, MO64106. (https://nacesports.org)
SPORTS MARKETING 2020-2021
• 461 •

PART XIV: RODEO
SPORTS MARKETING 2020-2021
• 462 •

104
RODEO FANS
104.1 OverviewAccording to the Professional Rodeo Cowboys Association (PRCA,
www.prorodeo.com), more than 43 million people identify themselves as rodeofans. An estimated 22 million people attend rodeo events annually, and another 40million watch from home.
The PRCA now holds over 600 sanctioned rodeos a year; over 5,000 cowboysand cowgirls participate in PRCA events.
104.2 Major EventsAttendance at select major rodeo and western lifestyle events is as follows:
• Houston Livestock Show & Rodeo (Houston, TX;(www.rodeohouston.com): 2.1 million
• San Antonio Stock Show & Rodeo (San Antonio, TX;www.sarodeo.com): 1.1 million
• Fort Worth Stock Show and Rodeo (Fort Worth, TX;www.fwssr.com): 920,000
• National Western Stock Show (Denver, CO;www.nationalwestern.com): 633,000
• Cheyenne Frontier Days (Cheyenne, WY; www.cfdrodeo.com): 583,000• Greeley Independence Stampede (Greeley, CO
www.greeleystampede.org): 448,000
104.3 Fan DemographicsCities with the highest percentages of adults that are pro rodeo fans are as follows
(sources: Nielsen Scarborough and SportsBusiness Journal):• Oklahoma City, OK: 18.9%• Tulsa, OK: 16.5%• Spokane, WA: 15.2%• Albuquerque/Santa Fe, NM: 14.7%• Salt Lake City, UT: 14.5%• Las Vegas, NV: 13.3%• Bakersfield, CA: 12.6%
SPORTS MARKETING 2020-2021
• 463 •

• Denver, CO: 11.9%• Little Rock/Pine Bluff, AR: 11.6%• Houston, TX: 10.8%• San Antonio, TX: 10.6%
Demographics of professional rodeo fans are as follows (source: Scarborough):Gender• Male: 55%• Female: 45%
Age• 18-to-24: 12%• 25-to-34: 17%• 35-to-44: 18%• 45-to-54: 21%• 55-to-64: 15%• 65 and older: 16%
Household Income• Below $35,000: 14%• $35,000 to $49,999: 22%• $50,000 to $74,999: 21%• $75,000 and higher: 28%• $100,000 and higher: 14%
Education• High school graduate: 40%• Some college: 31%• College graduate: 16%
SPORTS MARKETING 2020-2021
• 464 •

105
PROFESSIONAL RODEO COWBOYS ASSOCIATION
105.1 OverviewThe Professional Rodeo Cowboys Association (PRCA, www.prorodeo.com)
PRCA has five rodeo tours and circuits, as follows:• ProRodeo Tour• RAM National Circuit Finals• PRCA Xtreme Bulls• PRCA Xtreme Broncs• All-American ProRodeo Series
The Wrangler National Finals Rodeo is the season-ending championship eventfor the PRCA.
105.2 Wrangler National Finals RodeoThe primary circuit of the PRCA is the Wrangler National Finals Rodeo (NFR).
Held annually since 1959, the event is widely acknowledged to be the world’s premierrodeo.
Since 1985, Wrangler National Finals Rodeo has been held every December atthe Thomas & Mack Center in Las Vegas, Nevada. The current contract with LasVegas Events keeps the Wrangler NFR in Las Vegas through 2024. The event isattended annually by approximately 170,000 people.
Broadcast on CBS Sports Network, the 2018 National Rodeo Finals attracted anaverage of 630,000 viewers per broadcast, down from the 720,000 per night for theprevious year.
Viewership by age was as follows (percentage of population in each age group):• 18-to-29: 5.95%• 30-to-49: 6.79%• 50-to-64: 3.07%
105.3 ProRodeo TourThe top cowboys and cowgirls compete in 55 of the PRCA’s largest regular
season rodeos where they try to earn points for the tour’s finals event, the ProRodeoTour Finale, held every September in Puyallup, Washington. The competitor with the
SPORTS MARKETING 2020-2021
• 465 •

highest total points in each rodeo event is crowned the ProRodeo Tour Champion. Several of the ProRodeo Tour events, including the finale, are broadcast on CBSSports Network. All of the tour stops are broadcast live on the ProRodeoTV website.
The 2019 ProRodeo Tour stops were as follows:• Arlington, TX• Austin, TX• Baker, MT• Billings, MT• Bremerton, WA• Caldwell, ID• Canby, OR• Casper, WY• Cheyenne, WY• Clovis, CA• Cody, WY• Colorado Springs, CO• Corpus Christi, TX• Deadwood, SD• Denver, CO• Dodge City, KS• Ellensburg, WA• Filer, ID• Fort Worth, TX• Gooding, ID• Greeley, CO• Guymon, OK• Heber City, UT• Hermiston, OR• Houston, TX• Kennewick, WA• Lawton, OK• Livingston, MT
• Logandale, NV• Lovington, NM• Nampa, ID• Oakley City, UT• Ogden, UT• Pecos, TX• Phillipsburg, KS• Prescott, AZ• Puyallup, WA• Rapid City, SD• Red Bluff, CA• Redding, CA• Redmond, OR• Reno, NV• Salinas, CA• San Angelo, TX• San Antonio, TX• Santa Maria, CA• Sheridan, WY• Sikeston, MO• Spanish Fork, UT• Spooner, WI• Springdale, AR• St. Paul, OR• Tucson, AZ• Vernal, UT• Walla Walla, WA
In 2019, the ProRodeo payout was $30,443,413.
105.4 RAM National Circuit FinalsThe Circuit System is the cornerstone of the PRCA. Every PRCA participant
belongs to a circuit and has an opportunity to advance to the National CircuitChampionship.
The system that breaks up the United States into 12 circuits. The circuits includeas few as one state, such as the California, Texas and Montana circuits, to as many as13 states.
SPORTS MARKETING 2020-2021
• 466 •

A competitor must qualify in his or her regional circuit to move on to the NationalCircuit Finals Rodeo (NCFR), held every spring in Kissimmee, Florida. The top twocontestants in each of the seven rodeo events from the 12 different PRCA regionalcircuits compete in the four-day championship event.
The NCFR is comprised of eight events, as follows:• Bareback riding• Barrel racing• Bull riding• Saddle bronc riding• Steer wrestling• Team roping (headers)• Team roping (heelers)• Tie-down roping
In addition to the eight individual event winners, there is also an overallchampion titled the All-Around Cowboy.
The championship round of the NCFR is broadcast on CBS Sports Network.
105.5 Xtreme Bulls Tour The Xtreme Bulls Tour, launched in 2003, features only bull riding competitions.
The tour has 55 two-day stops; 40 PRCA bull riders compete in each event. The top 12riders in the tour standings along with the top in the PRCA world standings compete forthe tour title.
The Xtreme Bulls tour has Division 1 and Division 2 events. The Division 1events, including the tour finale, are broadcast live on the Wrangler Network website.
The Xtreme Bulls Tour World Finale is held in conjunction with the PRCA-sanctioned Ellensburg (Washington) Rodeo.
105.6 Xtreme Broncs TourThe Xtreme Broncs Tour, launched by PRCA in 2016, is a series of events that
features only saddle bronc riding competition. In 2019, the tour had 20 stopsthroughout the U.S.
Qualifiers from the tour compete in the PRCA Xtreme Broncs Finals in August.Rapid City, South Dakota, was the host site for the 2019 finals.
105.7 All-American ProRodeo SeriesThe All-American ProRodeo Series is considered the minor league series of the
PRCA. Professional, as well as semi-professional, cowboys and cowgirls compete onthis tour of smaller PRCA rodeos to quality for the All-American ProRodeo SeriesFinale, held every October in Waco, Texas.
SPORTS MARKETING 2020-2021
• 467 •

The championship round of the All-American ProRodeo Series Finale isbroadcast on CBS Sports Network.
105.8 SponsorsPRCA sponsors for 2019 were American Quarter Horse Association, Boot Beer,
Boyd Gaming, Cactus Gear Ropes & Saddlery, Carroll Original Wear, Cinch Jeans &Shirts, Coors Brewing Co., Dodge RAM, Golden Buckle Beer, Heel-O-Matic, Hesstonby Massey Ferguson, Justin Boots, Las Vegas Convention & Visitors Authority, LasVegas Events, MGM Grand, Mirage Las Vegas, Montana Silversmiths, Outlaw Equine,Pendleton Whiskey, Polaris Ranger, Priefert Rodeo & Ranch Equipment, Restol Hats,South Point Hotel Casino & Spa, and Wrangler.
105.9 Market ResourcesProfessional Rodeo Cowboys Association, 101 ProRodeo Drive, Colorado Springs, CO80919. (719) 593-8840. (www.prorodeo.com)
SPORTS MARKETING 2020-2021
• 468 •

106
PROFESSIONAL BULL RIDERS
106.1 OverviewProfessional Bull Riders (PBR) was created in 1992 when a group of bull riders
broke away from the Professional Rodeo and Cowboys Association and started a circuitfor bull riders only. WME-IMG, which rebranded as Endeavor (www.endeavorco.com),acquired PBR in 2015 for a reported $100 million.
Annual attendance at PBR tour events is more than 3 million.There are also tours in Australia, Brazil, Canada, and Mexico.
106.2 Unleash The Beast TourIn 2018, PBR’s elite series tour was rebranded as the Unleash The Beast Tour;
Monster Energy is the title sponsor. The 2020 Unleash The Beast Tour has 25 stops, as follows:
• January 3-5: Madison Square Garden (New York, NY)• January 11-12: Allstate Arena (Chicago, IL)• January 24-26: Golden 1 Center (Sacramento, CA)• January 31-February 1: Chesapeake Energy Arena (Oklahoma City, OK)• February 7-8: Staples Center (Los Angeles, CA)• February 22-23: Enterprise Center (St. Louis, MO)• February 29-March 1: Sprint Center (Kansas City, MO)• March 6-7: Verizon Arena (North Little Rock, AR)• March 14-15: Infinite Energy Arena (Duluth, GA)• March 21-22: Gila River Arena (Glendale, AZ)• March 27-29: Dreamstyle Arena (Albuquerque, NM)• April 3-5: Denny Sanford Premier Center (Sioux Falls, SD)• April 17-19: Rimrock Auto Arena (Billings, MT)• July 20-21: Frontier Days Park (Cheyenne, WY)• August 7-8: BOK Center (Tulsa, OK)• August 15-16: Fertitta Center (Houston, TX)• August 21-22: Bridgestone Arena (Nashville, TN)• August 29-30: Tacomadome (Takoma, WA)• September 11-12: Honda Center (Anaheim, CA)• September 18-20: JQH Arena (Springfield, MO)
SPORTS MARKETING 2020-2021
• 469 •

• September 26-27: Eaglebank Center (Fairfax, VA)• October 3-4: Yuengling Center (Tampa, FL)• October 10-11: Greensboro Coliseum (Greensboro, NC)• October 17-18: Target Center (Minneapolis, MN)• October 24-25: Ford Idaho Center (Nampa, ID)
106.3 PBR World FinalsThe Unleash The Beast Tour culminates in the PBR World Finals, held in
November at T-Mobile Arena in Las Vegas, Nevada. The champion is awarded $1 million.
Daily attendance is 13,000 to 15,000, totaling about 70,000 for the five-dayevent.
PBR XXVI was held November 6-10, 2019.
106.4 MediaCBS has broadcast rights for PBR events through 2028. In 2019, CBS carried 20 hours of PBR programming and its cable channel, CBS
Sports Network, carried more than 85 hours from 28 events. PBR events averagedmore that 1 million viewers per CBS broadcast during the 2019 season.
RidePass, a digital network owned by PBR and simulcast in partnership withFloSports, launched in 2018. Live and on-demand content includes 150 live events and700 hours of PBR programming.
106.5 SponsorsPBR sponsors for 2019 were Ariat, B&W Trailer Hitches, Boot Barn, Caterpillar,
Cooper Tires, Coors, Express Ranches, Ford, Jack Daniel’s, Lincoln Welders, Lucas OilProducts, MGM Grand Las Vegas, Monster Energy, Montana Silversmiths, NationalHigh School Rodeo Association, Priefert Rodeo & Ranch Equipment, Real Time PainRelief, Rocky Mountain Elk Foundation, Rogue, Sonic, U.S. Border Patrol, Visa, VisitLas Vegas, Wrangler, and YETI.
106.6 Market ResourcesProfessional Bull Riders, 101 West Riverwalk, Pueblo, CO 81003. (719) 242-2800.(www.pbr.com)
SPORTS MARKETING 2020-2021
• 470 •

PART XV: ORGANIZED SPORTS/COMPETITIONS
SPORTS MARKETING 2020-2021
• 471 •

107
AIR RACING
107.1 OverviewIn air racing competitors race against the clock and complete tight turns through
a slalom course consisting of pylons, or ‘air gates.’Air races date to 1909. There are two major competitions: The Red Bull Air
Race and The National Championship Air Races.
107.2 Red Bull Air RaceThe Red Bull Air Race (www.redbullairrace.com), created by Red Bull and
established in 2003, is a series of races held at eight venues. At each venue the topeight places earn World Championship points. The air racer with the most points at theend of the Championship becomes Red Bull Air Race World Champion.
After a three-year hiatus for safety improvements and reorganization, the RedBull Air Race resumed in 2014.
The 2019 World Championship had the following stops:• February 8-9: Abu Dhabi, United Arab Emirates• June 15-16: Kazan, Russia• July 13-14: Budapest, Hungary• September 7-8: Chiba, Japan• October 14-15: Indianapolis, IN• November 8-9: Saudi Arabia
The events attract large crowds and are broadcast, both live and taped,worldwide.
Global Partners for the 2019 Red Bull Air Race were DHL, Hamilton Watch, andRauch.
107.3 Reno Air RacesThe National Championship Air Races, commonly known as the Reno Air Races
(http://airrace.org), began in 1964 and take place each September at the Reno SteadAirport.
The Reno Air Races include several days of qualifying followed by four and ahalf days of multi-aircraft heat racing culminating in the Unlimited Class Gold Race.
SPORTS MARKETING 2020-2021
• 472 •

Sponsors for the 2019 races were Amador Stage Lines, AV Fuel, BreakthruBeverage, Circus Circus Reno, City of Reno, Classic Adventures, Click Bond,CrossCheck Aviation, Dassault Falcon, DP Air Corporation, El Jimador, EldoradoResort Casino, Fallon, Flying, Grand Sierra Resort and Casino, Honda Generators,Hondalet, Insurance Technologies and Programs, Ladd Gardner Insurance, LincolnMilitary Housong, Mercer-Fraser Company, Model Dairy, Morrey, New AmsterdamVodka, Nugget Casino Resort, Oris, Peppermill Reno, Pepsi, Sierra Office Solutions,Silver Legacy Resort Casino, State of Nevada, Stella Artois, Stihl, SwissTrax, TruMoo,and Visit Reno Tahoe.
The 2019 races were held September 11-15.
SPORTS MARKETING 2020-2021
• 473 •

108
AMERICA’S CUP
108.1 OverviewAmerica’s Cup (www.americascup.com), held every four years, is the most
famous and most prestigious regatta and match race in sailing. The Louis Vuitton Cupregattas of the America’s Cup are a challenge-driven yacht series that consist of a best-of-nine series of match racing (a duel between two boats).
Held around the world, over six million people attend regattas each year. Theregattas are among the most extravagant social events in all of sports.
Among sporting competitions, the America’s Cup is the most costly forparticipants. The average cost for entry is a minimum $200 million.
_________________________________________________________________
“Though the America’s Cup is less familiar toAmericans than other major global sportsproperties like Formula One and the UEFAChampions League, it is considered alongsideFIFA’s World Cup and the Olympics to be one ofthe world’s largest sporting events.”
SportsBusiness Journal _________________________________________________________________
108.2 The 35th America’s CupThe 35th America’s Cup took place June 2017 in Great Sound, Hamilton,
Bermuda. The races were conducted using hydrofoiling America’s Cup Class yachts,which are slightly larger than the AC45F yachts used in the world series.
Each America’s Cup winner gets to pick the venue and set the rules for the nextcompetition. Such control is unique among sports events; America’s Cup does nothave an organizing body. Typically, each winning team sets up its own event organizerto review and select potential host cities, sell broadcast rights, and negotiatesponsorships.
SPORTS MARKETING 2020-2021
• 474 •

The challenger, Emirates Team New Zealand, won by a score of 7 to 1 over thedefender, Oracle Team USA. Emirates Team New Zealand had defeated the other fourchallengers to win the Louis Vuitton America’s Cup Challenger Playoffs trophy. Otherchallenging clubs were Artemis Racing (Sweden), Groupama Team France, LandRover BAR (United Kingdom), and Softbank Team Japan.
108.3 The 36th America’s CupThe 36th America's Cup presented by Prada will be contested by the winner of
the 2017 America's Cup, Royal New Zealand Yacht Squadron, represented by EmiratesTeam New Zealand, and the winner of the 35th Prada Cup. The challenger selectionseries will take place January-February 2021. The series will be contested in the AC75class monohulls.
The Presenting and Naming Partner of the 36th America’s Cup is Prada. GlobalPartners are G.H. Mumm Champagne and Yanma.
108.4 Market ResourcesAmerica’s Cup Headquarters, Pier 23, Suite 100, San Francisco, CA 94111.(www.americascup.com)
SPORTS MARKETING 2020-2021
• 475 •

109
BASS FISHING & SPORTFISHING
109.1 OverviewBass, indigenous to the waters of every state except Alaska, are the most
pervasive sport fish in the U.S. And bass prove to be a worthy opponent even for proanglers. In the cult-like devotion it inspires, bass fishing is similar to NASCAR. In fact,many bass fishermen are NASCAR fans.
According to Sports Illustrated, 30 million Americans fish for bass every year.The average amateur angler spends about $200 a month on equipment, which
adds up to a $40 billion industry, according to B.A.S.S. (Bass Anglers SportsmanSociety, www.bassmaster.com). That is more than is spent on tennis or biking.
American Sportfishing Association (ASA, www.asafishing.org) assesses that thefishing industry generates $31 billion in U.S. retail sales. Including travel and otherexpenses such as equipment, licensed anglers spend $46 billion annually.
Several bass fishing competitions are held across the U.S., the largest of whichare hosted by B.A.S.S, FLW Outdoors (www.flwoutdoors.com), and Western OutdoorNews Bass (WON BASS, www.wonbass.com).
109.2 Bass Anglers Sportsman’s SocietyB.A.S.S., primarily a conservation and advocacy group, has about 600,000
members. Founded by Ray Scott in 1967, B.A.S.S. manages more than 30 nationalfishing tournaments annually. ESPN paid an estimated $35 million to $40 million in2001 to buy the family-run operation. B.A.S.S. was sold to private investors in 2010.
The top 50 anglers compete in 12 annual events. The top prize in theBassmaster Classic is $500,000.
The Bassmaster Tournament Trail consists of four series, as follows:• Academy Sports + Outdoors B.A.S.S. Nation Series• Bassmaster Elite Series• Bassmaster Opens• Costa Bassmaster High School Series presented by Dick’s Sporting Goods
The 2019 Bassmaster Tournament Trail schedule was as follows:• March 16-18: GeicoICO Bassmaster Classic presented by Dick’s Sporting
Goods (Lake Hartwell, Greenville, SC)
SPORTS MARKETING 2020-2021
• 476 •

• April 19-21: Academy Sports + Outdoors B.A.S.S. Nation Western Regionalpresented by Magellan (Lake Shasta, Redding, CA)
• April 19-21: Carhartt Bassmaster College Western Conference RegionalCalifornia pesented by Bass Pro Shops (Lake Shasta, Redding,CA)
• April 20-22: Bass Pro Shops Southern Open #2 (Lake Chickamauga, Dayton, TN)
• April 27-30: Academy Sports + Outdoors Bassmaster Elite at Ross Barnett(Ross Barnett Reservoir, Ridgeland, MS)
• April 29: Costa Bassmaster High School Southern Open presented byDick’s Sporting Goods (Lake Chickamauga, Dayton, TN)
• May 11-13: Carhartt Bassmaster College Eastern Conference Regionalpresented by Bass Pro Shops (Lake Cherokee, Dandridge, TN)
• May 17-21: Toyota Bassmaster Texas Fest benefitting the Texas Parks andWildlife Department (Lake Sam Rayburn, Lufkin, TX)
• June 2-5: GoPro Bassmaster Elite at Dardanelle presented by EconoLodge (Lake Dardanelle, Russellville, AR)
• June 8-10: Carhartt Bassmaster College Wildcard presented by Bass ProShops (Lay Lake, Shelby County, AL)
• June 14-16: Academy Sports + Outdoors B.A.S.S. Nation Eastern Regionalpresented by Magellan (Upper Chesapeake Bay, North East,MD)
• June 15-17: Bass Pro Shops Central Open #2 (Sabine River, Orange, TX)
• June 29-July 1: Bass Pro Shops Northern Open #1 (Oneida Lake, Syracuse, NY)
• July 20-23: HUK Bassmaster Elite at St. Lawrence presented by Go Rving (St. Lawrence River, Waddington, NY)
• July 27-30: Bassmaster Elite at Champlain presented by Dick Cepek Tires& Wheels (Lake Champlain, Plattsburgh, NY)
• August 3-5: Bass Pro Shops Northern Open #2 (James River, Richmond, VA)
• August 24-27: Advance Auto Parts Bassmaster Elite at St. Clair (Lake St.Clair, Macomb County, MI)
• September 7-9: Bass Pro Shops Northern Open #3 (Douglas Lake, Dandridge,TN)
• September 14-17: Toyota Bassmaster Angler of the Year Championship (MilleLacs Lake, Mille Lacs, MN)
• September 19-22: Bassmaster Classic Bracket (Pokegama Lake, Grand Rapids,MN)
• September 28-30: Bass Pro Shops Southern Open #3 (Smith Lake, Jasper, AL)
• October 5-7: Bass Pro Shops Central Open #3 (Grand Lake O’ theCherokees, Grove, OK)
SPORTS MARKETING 2020-2021
• 477 •

Premier B.A.S.S. sponsors for 2019 were Bass Pro Shops, Berkley Fishing, Huk,Hummingbird, Mercury, Minn-Kota Sports, Nitro Performance Bass Boats, Power-Pole,Shell Rotella, Skeeter Fishing Boats, Toyota Trucks, Triton Boats, and Yamaha.
109.3 Fishing League WorldwideFishing League Worldwide (www.flwfishing.com), also known as FLW, the
world’s largest tournament-fishing organization, offers anglers of all skill levels theopportunity to compete for millions in prize money.
The top bass tournament on the FLW Tour, the Forrest Wood Cup, is the mostlucrative tournament in professional bass fishing. Named for Forrest L. Wood, founderof Ranger Boats and developer of the modern bass-fishing boat, the Forest Wood Cupwas the first to offer a $1 million prize for the winner, in 2007.
The four major tournament circuits, which offer a path to the Forrest Wood Cup,are as follows:• Costa FLW Series• FLW Tour• T-H Marine Bass Fishing League• YETI College Fishing
There is also a High School Fishing tournament circuit.The FLW television show, broadcast to more than 564 million households
worldwide, airs on the NBC Sports Network (NBCSN), the Pursuit Channel, and theWorld Fishing Network (WFN). Episodes are also broadcast online at FLWFishing.comand the FLW YouTube channel at YouTube.com/FLWFishing.
Fishing League Worldwide has hosted FLW Fantasy Fishing since 2008. The Fantasy Fishing season consists of seven tournaments held in conjunction with the FLW Tour. At each event of the Tour season – six regular-season tournaments and theForrest Wood Cup – more than $7,000 in cash and prizes are awarded to the top 50Fantasy Fishing teams.
FLW Outdoors administers fantasy fishing competitions in conjunction with its sixregular-season FLW tournaments. Players pick 10 anglers from the 155 pros whoenter each tourney in the order they believe the fishermen will finish. The player withthe most points at the end of each competition wins $100,000. Whoever compiles themost points over all six tournaments wins $1 million, a record fantasy-sports payout.
FLW Tour sponsors for 2019 were BoatBling.net, Buck Knives, Carrot Stix,Charlie’s Worms, Columbia PFG, Costa, Denta Stix, Duracell, Evinrude, FalconGraphite Rods, Frabill, Gene Larew Lures, General Tire, Go Pro, Jackson Kayak, KidCasters, Leer, Lew’s, Lipton Tea, Livingston Lures, Lowrance, Lunkerhunt FishingProducts, Motorsports Designs, Mudhole, Navionics, Old Spice, Pedigree, PlanoMolding, Polaris Off-Road Vehicles, Power-Pole, Quaker State, Ranger Boats, StrikeKing, T-H Marine Supplies, The Bass Federation, Yamamoto Custom Boats, YETI, andZoom Bait Company.
SPORTS MARKETING 2020-2021
• 478 •

109.4 Western Outdoor News BassWON BASS is the bass fishing tournament arm of Western Outdoor News, the
largest outdoor weekly newspaper. WON BASS has been the main regional circuit inthe West since the 1980s.
WON BASS conducts the annual U.S. Open of Bass Fishing at Lake Mead,Nevada, a test of both angling skill and endurance as the anglers compete for 3 days inthe scorching hot sun and windy conditions of the Mohave desert. Winners collect upto $500,000. The 2019 U.S. Open was held October 17-19.
WON BASS also hosts the annual California Open at Clear Lake. The 2020event is scheduled ford April 8-10.
WON BASS sponsors for 2019 were Bass Cat, Costa, Daiwz, Mercury, PlanoMolding, Rich Tauber Fishing, Savage Gear, Seaguar, St. Croix Rods, and Yo-ZuriAmerica.
109.5 Major League FishingMajor League Fishing (MLF, www.majorleaguefishing.com), established in
partnership between the Professional Bass Tour Anglers' Association (PBTAA) andOutdoor Channel, was founded in 2012. There are two competitions, the Selects andCups, which are each fished by a different set of anglers. The Cup anglers compete fora chance to fish the MLF World Championship.
The 2019 Bass Pro Tour had nine stops, as follows:• January 29-February 3: Kissimmee, FL• February 12-17: Conroe, TX• March 26-31: Raleigh, NC• April 9-14: Dayton, TN• April 30-May 5: Cullman, AL• May 17-22: Branson, MO• May 31-June 5: Table Rock, MO• June 25-30: Neehah, WI• August 21-25: Redcrest Bass Pro Tour Championship, La Crosse, WI
MFL airs on Outdoor Channel, World Fishing Network, and Discovery Channel.In 2018, MLF was the top-rated show on Outdoor Channel. The show focuses
on personalities and struggles of anglers in competition rather than purely on results.
109.6 SportfishingFor a variety of reasons, bass tournaments are the biggest in the sport, but there
are other fishing tournaments. Saltwater fishing offers a bluefish tournament with a$1.8 million purse. The American Carp Society (www.americancarpsociety.com) hasoffered purses of $1 million for its events. And there are numerous regionaltournaments of all types.
SPORTS MARKETING 2020-2021
• 479 •

The following are some of the major fishing tournaments (source: USA Today):Alabama Deep Sea Fishing Rodeo• Mobile, AL; held in July (www.adsfr.com)• Started in 1929, this is the oldest ongoing fishing tournament in the U.S. More than
3,000 contestants chase tarpon, king mackerel, amberjack, and two dozen otherkinds of sport fish. Prizes total $400,000.
Big Rock Blue Marlin Tournament• Morehead City, NC; held in June (www.thebigrock.com)• This is the most notable among several big-money ocean fishing tournaments held
on the East Coast. More than 150 boats convene on the Crystal Coast of NorthCarolina to try for $1.8 million in prizes.
Bisbee’s Black & Blue Marlin Tournament• Cabo San Lucas, Mexico; held in October (www.bisbees.com)• This event is billed as the richest fishing tournament in the world. A single crew took
home a check for almost $4 million one year.
Brainerd Jaycees $150,000 Ice Fishing Extravaganza• Brainerd, MN; held in January (www.icefishing.org)• Some 20,000 holes are drilled in the ice and 9,000 bundled-up ang lers brave the
freezing weather for this annual three-hour contest. Acclaimed as the largest ice-fishing tournament in the world, the first-place prize is a pickup truck. The BrainerdJaycees are the event sponsors.
Okie Noodling Tournament• Pauls Valley, OK; held in July (www.okienoodling.com)• Participants prowl the lakeshores and riverbanks in search of catfish holes, then
reach in and try to pull out the fish by hand.
Martha’s Vineyard Striped Bass & Bluefish Derby• Martha’s Vineyard, MA; held in September (www.mvderby.com)• Fishing enthusiasts spend five weeks chasing stripers and bluefish while competing
for more than $250,000 in cash and prizes. To a Vineyarder, winning the derby islike slipping on the green jacket at the Masters.
S. Tokunaga Store Ulua Challenge• Hilo, HI; held in June (www.tokunagastore.com)• In a unique feature among ocean-fishing tournaments, all participants must fish from
shore. The quarry is the ulua, or giant trevally, which can top 100 pounds.
SPORTS MARKETING 2020-2021
• 480 •

109.7 CollegiateIn 2011, B.A.S.S. created a national title for the best two-person collegiate bass
team. Also, one angler is recognized as the College Fisherman of the Year. Teamscompete in the Carhartt Bassmaster College Series presented by Bass Pro Shops toqualify for the championship.
_________________________________________________________________
“Some 250 boats took the water for the CarharttBassmaster College Series. The tournamentsprovide good exposure for students and thesport overall. They’re part of Bassmaster’sefforts to encourage youth from second gradeand up to wet a line.”
SportsBusiness Journal, 4/1/19 _________________________________________________________________
Most schools sanction fishing teams as a club sport. Bethel University(McKenzie, TN) has elevated bass fishing to team sport status, providing coachingsupport and scholarships.
Unlike NCAA athletes, collegiate anglers can accept prize money and equipmentfrom sponsors.
109.8 Market ResourcesAmerican Sportfishing Association, 1001 North Fairfax Street, Suite 501, Alexandria,VA 22314. (703) 519-9691. (www.asafishing.org)
Bass Anglers Sportsman Society (B.A.S.S.), 3500 Blue Lake Drive, Suite 330,Birmingham, AL 35243. (877) BASS-USA. (www.bassmaster.com)
FLW Outdoors, 30 Gamble Lane, Benton KY, 42025. (270) 252-1000. (www.flwoutdoors.com)
Major League Fishing, 4500 S. 129th E. Avenue, Tulsa, OK 74134. (918) 281-4555.(www.majorleaguefishing.com)
WON BASS, 185 Avenida La Pata, San Clemente, CA 92673. (949) 366-0030. (www.wonbass.com)
SPORTS MARKETING 2020-2021
• 481 •

110
BOWLING
110.1 ParticipationIn 2018, 67 million people bowled at least once, according to GoBowling!
(www.gobowling.com).According to 2018 Sports, Fitness And Leisure Activities Topline Participation
Report, published by the Sports & Fitness Industry Association (SFIA, www.sfia.org),45.5 million people bowl at least once each year, 9.6 million bowl 13 or more times.
According to the National Federation of State High School Associations(www.nfhs.org), 32,159 boys and 27,880 girls competed in bowling in the 2017-2018academic year.
110.2 United States Bowling CongressRecognized by the United States Olympic Committee, the United States Bowling
Congress (USBC, www.bowl.com) is the national sanctioning body for bowling.USBC was formed in 2005 by a merger of the American Bowling Congress,
Women’s International Bowling Congress, Young American Bowling Alliance, and USABowling.
More than 2 million compete regularly in league play certified by the USBC.
110.3 Professional Bowlers AssociationThe Professional Bowlers Association (PBA, www.pba.com) is the major
governing body for professional bowling in the United States. Membership, whichnumbers over 4,300, includes pro shop owners and staff, teaching professionals, andbowlers who compete in the various events hosted by the PBA.
G. Chris Peters, a former Microsoft executive, bought the beleaguered PBA for$5 million in 2001. The PBA appeared headed for extinction before being revived byMr. Peters.
The PBA oversees competition between professional bowlers as follows:PBA Tour• The PBA Tour is an annual calendar of events running from September to April. The premier event, the PBA World Series of Bowling XX, was held November 2019,
in Las Vegas, Nevada.
SPORTS MARKETING 2020-2021
• 482 •

PBA Women’s Series• Select PBA Tour events include a series for female professionals. The PBA
Women’s Series, broadcast on ESPN, marked a return to televised women’sbowling for the first time since the Professional Women’s Bowling Association(PWBA) folded in 2003. The Women’s Series has eight events.
PBA 50• PBA members 50 years and older compete in events through the PBA Senior Tour.
PBA Regional Tour• Developed to allow members and amateurs to compete in weekend events, the PBA
Regional Tour consists of seven regions: Central, East, Midwest, Northwest, South,Southwest, and West.
In 2003, ESPN began televising PBA events on Sunday afternoons and Tuesdayevenings. ABC had dropped the league in 1996 after a 35-year run.
Professional Bowlers Association sponsors for 2019 were Brunswick, GoBowling!, and United States Bowling Congress.
110.4 Professional Women’s Bowling AssociationThe Professional Women’s Bowling Association (PWBA, www.pwba.com) Tour
re-launched in 2015 following a 12-year hiatus.Broadcast on ESPN2, the national PWBA Tour schedule features seven
regular-season events and three nationally televised majors, concluding with the PWBATour Championship tournament in September.
Each PWBA Tour event includes a pro-am experience where amateurs bowl in acompetition paired with PWBA players.
The PWBA Tour provides an opportunity for collegiate bowling stars to continueplaying professionally.
110.5 Collegiate TeamsCollegiate bowling has grown in popularity under the USBC Collegiate programs.
The programs include men’s and women’s teams at the club, National Association ofIntercollegiate Athletics (NAIA), National Junior College Athletic Association (NJCAA)levels, and women’s varsity teams with the National Collegiate Athletic Association(NCAA).
More than 3,500 student-athletes on 200 college and university intercollegiatebowling teams compete in more than 80 certified tournaments each year. Approximately 100 colleges and universities across the country offer bowlingscholarships.
SPORTS MARKETING 2020-2021
• 483 •

USBC Collegiate oversees and conducts the Intercollegiate Team and SinglesChampionships. The country’s top 80 men’s and top 64 women’s collegiate teamscompete in regional events for the right to advance to the annual Intercollegiate TeamChampionship, a nationally-televised tournament.
_________________________________________________________________
“We have 63 schools across the country nowwhere the bowling program is now a part of theathletic department. The NCAA championshipstook place in April and it was just natural forthese ladies to graduate from that program ontoour tour. There is also a nice pipeline in placefrom an athlete perspective that we will seerealized in the next decade.”
Chad Murphy, Co-Commissioner Professional Women’s Bowling Association
_________________________________________________________________
110.6 World Bowling AssociationWorld Bowling (www.worldbowling.org) governs the sport of bowling throughout
the world. PBA coordinates events with World Bowling.There are over 100 million bowlers worldwide; 10 million take part in World
Bowling tournaments, leagues, and championships.World Single Championships – men and women – are held once every four
years. The most recent Championships were held in December 2016 in Doha, Qatar. The next Championship will be played in 2020 in Tokyo, Japan.
World Championships – men and women – are held every four years. The 2017 World Championships were held in Kuwait.
World Tenpin Bowling Championships for men are held once every four years. The 2018 Championships were held in Hong Kong.
World Bowling Association sponsors for 2019 were AMF, bowlingdigital.com, BPAA, Brunswick, Kegel, Lanetalk, and Storm.
SPORTS MARKETING 2020-2021
• 484 •

110.7 Media And AdvertisingIn 2003, ESPN and CBSSports Network began televising PBA events on Sunday
afternoons and Tuesday evenings. The top advertisers during bowling telecasts in 2018 were as follows:
• Barbasol: $969 million• Geico: $568 million• HotelPlanner.com: $494 million• AMF Bowling Centers: $393 million• Concrete Software: $372 million• Pepsi: $360 million
In 2019, PBA signed a broadcast rights deal with Fox Sports.
110.8 Market ResourcesProfessional Bowlers Association, 55 E. Jackson Boulevard, Suite 401, Chicago, IL60604. (206) 332-9688. (www.pba.com)
Professional Women’s Bowling Association, 621 Six Flags Drive, Arlington, TX 76011. (800) 514-2695. (www.pwba.com)
United States Bowling Congress, 621 Six Flags Drive, Arlington, TX 76011. (800) 514-2695. (www.bowl.com)
World Bowling, 2208 Brookside Drive, Arlington, TX 76012. (414) 803-9188. (www.worldbowling.org)
SPORTS MARKETING 2020-2021
• 485 •

111
COMPETITIVE CHEERLEADING
111.1 OverviewLong recognized as an activity to generate fan spirit at sports competitions,
cheerleading itself began to be recognized as a sport in the early 1980s whencheerleading squads not associated with schools or sports leagues and whose mainobjective was competition began to emerge.
Competitive cheerleading, also called competitive cheer and all-starcheerleading, has an estimated 1.5 million participants in the United States and about100,000 abroad.
According to the National Federation of State High School Associations(www.nfhs.org), 162,669 girls and 3,8511 boys competed in competitive spiritcompetitions during the 2017-2018 academic year.
ESPN has broadcast various competitive cheer events since 1997.
111.2 Sanctioning OrganizationsThe National Cheerleaders Association (NCA, http://nca.varsity.com), founded in
1948, sponsors cheerleading competitions and camps throughout the United States. The following are the three major national competitions:NCA Senior and Junior High School National Championship• January 26-27, 2019: Kay Bailey Hutchison Convention Center (Dallas, TX)
NCA All-Star National Championship• March 1-3, 2019: Kay Bailey Hutchison Convention Center (Dallas, TX)
NCA & NDA Collegiate Cheer and Dance Championship• April 4-6, 2019: The Band Shell/Ocean Center/Peabody Auditorium
(Daytona Beach, FL)
The Universal Cheerleaders Association (UCA, http://uca.varsity.com), foundedin 1974, provides training for college and high school cheerleaders through summercamps and clinics on college campuses.
Several organizations host their own state and national competition. Theseinclude AmeriCheer (www.americheer.com), America’s Best Championships(www.abchampionships.com), Cheersport (www.cheersport.net), Eastern Cheer and
SPORTS MARKETING 2020-2021
• 486 •

Dance Association (www.ecaeda.com), the JAM Brands Cheer and DanceCompetitions (www.jambrands.com), Planet Spirit (www.planetspirit.com), andUniversal Spirit (www.universalspirit.com).
In 2003, the NCA, UCA, and several competition hosting organizations formed theU.S. All Star Federation (USASF, www.usasf.net) to unify competitive cheerleading as asport. The founding organizations continue to exist in their original capacities but workthrough USASF to develop a standard set of safety rules and competition regulations. USASF hosts the annual Cheerleading Worlds, the largest event in the field.
In 2006, USASF created the International All-Star Federation (IASF), the f irstinternational governing body for the sport of cheerleading.
Major competitions are broadcast on Varsity TV.
111.3 Collegiate Competitive CheerIn 2010, a federal court ruled that competitive cheerleading is not an official sport
that colleges can use to meet gender-equality requirements mandated by Title IX, the1972 federal law that requires equal opportunities for men and women in athletics.
_________________________________________________________________
“Competitive cheer may, some time in the future,qualify as a sport under Title IX. Today, however,the activity is still too underdeveloped anddisorganized to be treated as offering genuinevarsity participation opportunities for students.”
The Honorable Stefan R. Underhill United States District Judge
_________________________________________________________________
The National Collegiate Athletic Association (NCAA, www.ncaa.org) does notofficially recognize competitive cheerleading as a sport.
111.4 Market ResourcesNational Cheerleaders Association, 2010 Merritt Drive, Garland, TX 75041. (800) 622-2946. (http://nca.varsity.com)
U.S. All Star Federation, 8275 Tournament Drive, Suite 325, Memphis, TN 38125. (901) 231-1952. (www.usasf.net)
SPORTS MARKETING 2020-2021
• 487 •

112
CRICKET
112.1 OverviewCricket, which dates to the 15 th century when it was first played in England, is the
world’s second-most-popular sport, after soccer.The International Cricket Council (ICC, http://icc-cricket.yahoo.net), the
governing body for the sport, has 104 member countries. Australia, Bangladesh,England, India, New Zealand, Pakistan, South Africa, Sri Lanka, West Indies, andZimbabwe are Full Members. There are 35 Associates Members, including the UnitedStates, and 59 Affiliate Members.
Smithsonian estimates that 30,000 Americans play or watch cricket annually.Cricket was popular in the U.S. during the 18th and 19th centuries, but the rise of
baseball displaced cricket as the favored pastime.
_________________________________________________________________
“Cricket holds its position on the globalbusiness stage as the world’s second largestsport economy but its share in the U.S. sportsindustry has been insignificant despite havingrich history, including the honor to host the firstinternational cricket match in 1844. However,thanks to an emerging commitment from theInternational Cricket Council to develop thesport in the States, cricket could find its wayback into American favor.”
SportsBusiness Journal _________________________________________________________________
There are several variations in the length of a game of cricket – ranging fromTest Cricket, which is played over five days, to Twenty20 (T20), which places a limit of20 overs per side and takes about three hours.
SPORTS MARKETING 2020-2021
• 488 •

Professional cricket is most active in India, where some players earn salaries of$400,000. The sport was reorganized in India in 2008 with the formation of the IndianPremier League (IPL, www.iplt20.com). Brand Finance (www.brandfinance.com)values the league at $4.1 billion. Franchises have sold for as much as $370 million.
112.2 Organized Cricket in the United StatesThe USA Cricket Association (USACA, www.usaca.org) is the governing body for
cricket in the United States and is recognized by the International Cricket Council.There is currently no professional cricket league in the United States. Pro
Cricket organized in 2004 and disbanded after playing only one season. Major LeagueCricket was organized in 2000 but disbanded in 2007 without playing a season. Neitherleague was sanctioned by the USACA.
USACA recognizes 40 leagues, each of which has eight or more teams. Leagues are as follows:• American Cricket Conference (Chicago; www.accleague.org)• American Cricket League (New York; www.newyorkcricket.com)• Arizona Cricket Association (www.dreamcricket.com/azcricket/)• Atlanta-Georgia Cricket Conference (www.atlantacricket.com)• Bay Area Cricket Alliance (California; www.bayareacricket.org)• California Cricket Academy (www.calcricket.org)• Central Florida Cricket Association (www.centralfloridacricket.com)• Central Texas Cricket League (www.centraltxcricket.org)• Colorado Cricket League (www.coloradocricket.org)• Cricket League of New Jersey (www.dreamcricket.com/clnj)• Eastern American Cricket Association (New York; www.newyorkcricket.com)• Florida Southeast Cricket League (www.fsclcricket.org)• Garden State Cricket League (New Jersey; www.dreamcricket.com/gsclnj)• Great Lakes Cricket Conference (www.greatlakescricket.org)• Houston Cricket League (www.houstoncricket.org)• International Cricket Management League (www.dreamcricket.com/icml/)• Massachusetts State Cricket League (www.mscl.org)• Metropolitan Cricket League (New York; www.newyorkcricket.com)• Michigan Cricket Association (www.michca.org)• Midwest Cricket Conference (www.midwestcricket.org)• Millennium Cricket League (New Jersey; www.millenniumcricketleague.com)• Minnesota Cricket Association (www.minnesotacricket.com)• Nassau New York Cricket Association (www.newyorkcricket.com)• National Cricket League (New York; www.newyorkcricket.com)• New Jersey Cricket Association (www.dreamcricket.com/njca)• New Jersey State Cricket & Umpire’s Association (www.njscua.com)• New York Cricket League (www.newyorkcricket.com)• New York Metropolitan and District Association League (no website)• North Texas Cricket Association (www.ntcricket.com)
SPORTS MARKETING 2020-2021
• 489 •

• Northern California Cricket Association (www.ncalcricket.org)• NorthWest Cricket League (Washington; www.nwcl.org)• NYPD Cricket League (New York; no website)• Orange County Cricket Association (www.occricket.com) • Sacramento Cricket Association (www.sca.hitscricket.com)• San Diego Cricket Association (www.sandiegocricket.com)• South Florida Cricket Association (www.southfloridacricket.com)• Southern California Cricket Association (www.sccacricket.org)• Southern Connecticut Cricket Association (www.dreamcricket.com/sctca/)• Washington Cricket League (District of Columbia; www.wclinc.com)• Washington Metro Cricket League (District of Columbia; www.wmcl.net)
The USACA selects a national cricket team to compete in the ICC AmericasChampionship.
The Staten Island Cricket Club (www.statenislandcc.org), established in 1872, isbelieved to be the oldest continuous cricket club in the United States.
A few colleges – Boston University, Carnegie Mellon University, MontgomeryCollege, University of Miami, University of South Florida, among others – have cricketclubs; they exist primarily as social clubs. The National Collegiate Athletic Association(NCAA, www.ncaa.org) does not officially recognize cricket.
Cricket is popular in New York City; there are 18 dedicated cricket fields in theBronx, 16 in Brooklyn, and 13 in Queens. A complex of 10 cricket fields in the Bronx’sCortlandt Park that opened in 2013 is considered the best f acility in the United States.
In 2015, a three-match tour of international cricket stars called Cricket All Stars(www.cricketallstars2015.com) was hosted at Citi Field (New York, NY), Minute MaidPark (Houston, TX), and Dodger Stadium (Los Angeles, CA). Playing T20, the tourdrew a combined crowd of over 60,000. The exhibition was discontinued after theinaugural games.
India-West Indies exhibition matches in August 2016 drew a capacity audienceof 15,000 at Central Broward Regional Park (Lauderhill, Florida). Broward Countyopened the $10-million, taxpayer-funded stadium there in 2008, noting a growingCaribbean population in the region.
112.3 Cricket World CupThe ICC Cricket World Cup, organized by the International Cricket Council, is the
premier international championship of men’s One Day International (ODI) cricket. Heldevery four years, the tournament is the world’s fourth-most-viewed sporting event.
SPORTS MARKETING 2020-2021
• 490 •

The 12th ICC Cricket World Cup (www.cricketworldcup.com), won by England,took place May 30-July 14, 2019, in England and Wales. The 2019 World Cup wasbroadcast by 44 licensees and in seven languages across 220 territories. The globaltelevision viewership was estimated at 2.6 billion.
112.4 ICC World Twenty20The ICC World Twenty20, or World T20, is the international championship of
Twenty20 cricket organized by the ICC. The tournament currently consists of 16 teams,comprising all ten ICC full members and six other associate or affiliate memberschosen through the World Twenty20 Qualifier. The event has generally been heldbiennially. The 6th tournament, held March-April 2016, was hosted by India.
Competing in the 2016 tournament were Afghanistan, Australia, Bangladesh,England, Hong Kong, India, Ireland, Netherlands, New Zealand, Oman, Pakistan,Scotland, South Africa, Sri Lanka, West Indies, and Zimbabwe. West Indies won theICC World Twenty20 final.
In India alone, the cumulative in-house viewership for the event was 730 million. In the U.S., more than 1.4 million households tuned in to Willow TV during odd hours towatch the Twenty20. On Twitter, the tournament generated 5.75 billion impressions oftweets related to ICC World Twenty20. For comparison, Super Bowl 50 generated 4.3billion impressions on Twitter.
The 2018 tournament, planned to be played in South Africa, was cancelled.Australia will host the tournament in 2020 and India will host in 2021.
112.5 Television BroadcastsESPN Star Sports, a 24-hour channel dedicated to cricket, launched in 2007.
The network is reported to have paid $1.1 billion for the broadcast rights for a packageof games that includes two Cricket World Cups.
NBC Sports Network has carried Cricket Australia’s Big Bash League matcheslive since January 2017.
112.6 Market ResourcesInternational Cricket Council, Street 69, Dubai Sports City, Sh Mohammed Bin ZayedRoad, Dubai, PO Box 500 070, United Arab Emirates. Tel. +971 4 3828800.([email protected])
USA Cricket Association, 8461 Lake Worth Road, Suite B-1-185, Lake Worth, FL33467. (561) 839-1888. (www.usaca.org)
SPORTS MARKETING 2020-2021
• 491 •

113
CYCLING
113.1 OverviewBicycle racing, generally referred to as cycling, encompasses many formats in
which bicycles are used for competition, including road bicycle racing, cyclo-cross,mountain bike racing, track cycling, BMX, bike trials, and cycle speedway. Amongthese competitions, road bicycle races are most recognized.
In addition to road races in which all riders start simultaneously, individual timetrial and team time trial events are also held on road-based courses.
Criteriums, a popular form of road racing in North America, are races based oncircuits typically less than a mile in length and sometimes run for a set time (generally60 minutes or 90 minutes) rather than a specific distance.
Cycling is governed internationally by the Union Cycliste Internationale (UCI,www.uci.ch), or the International Cycling Union, which sponsors UCI WorldChampionships to determine world champion cyclists. The championships take placeannually and are organized around nations rather than trade teams.
There are three major European professional cycling stage races, referred to asthe Grand Tour: Tour de France (Tour of France), Giro d’Italia (Tour of Italy), andVuelta a España (Tour of Spain).
113.2 USA CyclingRecognized by the United States Olympic Committee and the Union Cycliste
Internationale, USA Cycling (www.usacycling.org) is the official governing body for alldisciplines of competitive cycling in the United States, including road, track, mountainbike, BMX, and cyclo-cross.
USA Cycling, with 63,000 members and 2,750 clubs, sanctioned over 3,000events in 2019. Club activities generally focus on touring and club rides and do notinvolve racing.
Sponsors in 2019 were ASSOS of Switzerland, Frog Bikes, Just Bare Chicken,KT Tape, Nationwide Insurance, Science in Sport, Solos Smart Glasses, and UnitedAirlines.
113.3 Major U.S. RacesThe 2019 USA Cycling National Championship Schedule is a follows:
SPORTS MARKETING 2020-2021
• 492 •

• March 29-31: USA Cycling Elite BMX National Championships (Rock Hill, SC)• April 6-7: USA Cycling Collegiate BMX National Championship (DeSoto, TX)• May 10-12: USA Cycling Collegiate Road National Championships• (Augusta, GA)• May 11: USA Cycling Marathon Mountain Bike National Championships
(Palo Duro Canyon, TX)• June 20-23: USA Cycling Amateur Road National Championships
(Hagerstown, MD)• June 27-29: USA Cycling Para-cycling Road National Championship
(Knoxville, TN)• June 27-30: USA Cycling Professional Road National Championships
(Knoxville, TN)• July 2-7: USA Cycling Junior & Elite Track National Championships
(Carson, CA)• July 23-28: USA Cycling Mountain Bike National Championships
(Winter Park, CO)• August 8-11: USA Cycling Masters Road National Championships
(Colorado Springs, CO)• August 27-31: USA Cycling Masters Track National Championships (Carson, CA)• Sept. 12-15: USA Cycling Collegiate Track National Championships
(Rock Hill, SC)• October 18-20: USA Cycling Collegiate Mountain Bike National Championships
(Durango, CO)• December 10-15: USA Cycling Cyclocross National Championships (Tacoma, WA)
Major annual tours and race dates in 2019 were as follows:• May 1-5: Tour of the Gila (Silver City, NM; www.tourofthegila.com)• May 12-18: Amgen Tour of California (14 host cities;
www.amgentourofcalifornia.com)• May 26-28: Winston-Salem Cycling Classic (Winston-Salem, NC;
www.winstonsalemcycling.com)• August 12-18: Larry H. Miller Tour of Utah (www.tourofutah.com)• September 8: Thompson Bucks County Classic (Bucks County, PA;
www.buckscountyclassic.com)
According to SportsBusiness Journal, the major races (Amgen Tour of Californiaand Larry H. Miller Tour of Utah) have annual operating budgets of $10 million to $12million; none are profitable. The Tour de France, for comparison, has an estimatedoperating budget of $100 million and nets $30 million to $50 million, primarily fromtelevision rights.
The major U.S. events endure because of the personal commitment of eventowners.
SPORTS MARKETING 2020-2021
• 493 •

113.4 Velodrome Bicycle RacingCycling arenas, or velodromes, have steeply banked oval tracks consisting of two
180E circular bends connected by two straights that transition to the circular turn through amoderate easement curve. Races are held throughout the year.
There are 30 active velodromes in the United States, as follows:• Alkek Velodrome (Houston, TX; www.houstoncycling.org)• Alpenrose Velodrome (Gresham, OR; www.obra.org/track)• Asheville Mellowdrome (Asheville, NC; www.ashevillecycling.com/track.html)• Baton Rouge Velodrome (Baton Rouge, LA;
www.batonrougebikeclub.com/BRBC_Web_Site/Velodrome.htm)• Boulder Valley Velodrome (Boulder, CO; www.bouldervalleyvelodrome.com)• Brian Piccolo Park Velodrome (Cooper City, FL; www.flavelo.org)• Chicago Velo Campus (Chicago, IL; www.chicagovelocampus.com)• Cleveland Velodrome (Cleveland, OH; www.clevelandvelodrome.org)• Colorado Springs Velodrome (Colorado Springs, CO;
(www.teamusa.org/about-the-usoc/olympic-training-centers/csotc/velodrome)• Dick Lane Velodrome (East Point, GA; www.dicklanevelodrome.com)• Ed Rudolph Velodrome (Northbrook, IL; www.northbrookvelodrome.org)• Encino Velodrome (Encino, CA; www.encinovelodrome.org)• Garden State Velodrome (Wall, NJ; www.gsvelodrome.com)• Giordana Velodrome (Rock Hill, SC; http://riderockhill.com/track/)• Hellyer Park Velodrome (San Jose, CA; www.ridethetrack.com)• International Velodrome at Bloomer Park (Rochester Hills, MI; www.ivbp.org)• Island 200 Indoor Velodrome (Neville Island, PA; www.island200.com)• Jerry Baker Memorial Velodrome (Redmond, WA; http://velodrome.org/jbmv/)• Kissena Velodrome (Queens, NY; www.kissena.info)• Major Taylor Velodrome (Indianapolis, IN; http://indycycloplex.com) • National Sports Center Velodrome (Blaine, MN; http://velodrome.nscsports.org)• National Velodrome and Events Center (Reading, PA;
www.worldcyclingleague.com/national-velodrome/)• Northeast Velodrome (Londonberry, NH; www.facebook.com/pg/northeastvelo/about/)• Penrose Park Velodrome (St. Louis, MO; http://penroseparkvelo.com)• San Diego Velodrome (San Diego, CA; www.sdvelodrome.com)• Superdrome (Frisco, TX; www.superdrome.com)• Valley Preferred Cycling Center (Trexlertown, PA; www.thevelodrome.com)• VELO Sports Center (Carson, CA; www.stubhubcenter.com/velo)• Washington Park Velodrome (Kenosha, WI; www.kenoshavelodrome.com)
The American Track Racing Association (ATRA, www.raceatra.com) sanctionsraces at the velodromes.
TeamTrak by the World Cycling League (WCL, www.worldcyclingleague.com), avelodrome bicycle racing circuit, were announced in 2015. A premiere event was held atthe Velo Sports Center (Carson, CA) in March 2016 as a showcase to possible sponsors,investors, velodrome owners, fans and media partners. As of 2019, the league was still
SPORTS MARKETING 2020-2021
• 494 •

seeking funding and had not yet launched.Worldwide, there are 80 indoor velodromes in 32 countries.
113.5 Tour de FranceThe Tour de France (www.letour.fr), a 22-day, 20-stage road race run over more
than 3,000 km, is the world’s premier cycling race. The time taken to complete each stagebecomes a cumulative total to decide the winner at the end of the Tour. The race consistsof 20 to 22 teams each with nine riders. The Tour de France is a familiar sporting namearound the globe, even to those not generally interested in cycling.
Sponsorship is key to the Tour de France. Few images of the Tour don’t feature acompany name emblazoned on a bicycle, jersey, helmet, or team van. Each team isknown by the name of its sponsor.
_________________________________________________________________
“As much as cycling is about sport, it is alsoabout advertising. And the Tour de France,more than any other event, is the time whencompanies hope to reap the benefit of themillions of dollars they spend each yearsupplying teams with salaries, uniforms, bikes,hotel rooms, and all manner of luxury. Thepresence of advertising at the Tour can hardlybe overstated. Each of the main prizes in therace – for the overall winner, the best mountainclimber, the best sprinter and so forth –conforms to the colors or logo of its corporatesponsor. The race is preceded each day overits entire route by a publicity caravan, a mile-long parade of 45 corporate floats.”
The New York Times _________________________________________________________________
The level of television exposure during the tour is significant, particularly forcompanies doing business in France. The television broadcast of the Tour regularlyreaches more than 4.5 million viewers in France, nearly half of the global televisionaudience.
SPORTS MARKETING 2020-2021
• 495 •

Most stages are in mainland France, although since the 1960s stages in nearbycountries have been common. The 106th Tour de France began with an individual timetrial in Brussels, Belgium, on July, 6, 2019, and concluded with the Champs-Élyséesstage in Paris on July 28, 2019. The 21-stage, 3,460 km (2,150 mile) race featured 20cycling teams.
113.6 Market ResourcesUSA Cycling, 210 USA Cycling Point, Suite 100, Colorado Springs, CO 80919. (719) 434-4200. (www.usacycling.org)
SPORTS MARKETING 2020-2021
• 496 •

114
DARTS
114.1 ParticipationDarts is most popular in bars and pubs, with the most serious participants
playing in leagues. According to the Sports & Fitness Industry Association (SFIA, www.sfia.org),
16.6 million people play darts at least once a year – 11.3 million are casual participants(<13 times per year) and 5.3 million are core participants (>13 times per year).
The American Darts Organization (ADO, www.adodarts.com) sanctions local andregional tournaments throughout the U.S. ADO has about 250 member clubsrepresenting roughly 50,000 members.
The sport is most popular in the U.K., where about 4.5 million play in leagues,more than double the number of league players in the U.S.
114.2 Darts Championships On TVTelevised darts is popular in international markets. In the U.K., Sky Sports
produces more than 1,000 hours of sports coverage annually.Fox Sports broadcast the PDC World Series of Darts North American
Championship on FS1.
_________________________________________________________________
“Programming like darts will fare much betterthan sports afternoon studio shows that havebeen garnering a lot of press. If poker can finda niche, darts can, too, given that it’s nowbecome a worldwide phenomenon.”
David Hill, FounderFox Sports
_________________________________________________________________
BBC America broadcast the William Hill World Darts Championship in December2018.
SPORTS MARKETING 2020-2021
• 497 •

_________________________________________________________________
“Smaller properties like darts can find a home –and coveted time slots – at channels like BBCAmerica.”
SportsBusiness Journal, 12/17/18 _________________________________________________________________
114.3 Market ResourcesAmerican Darts Organization, P.O. Box 182, Loveland, OH 45140. (618) 207-0788. (www.adodarts.com)
SPORTS MARKETING 2020-2021
• 498 •

115
DOG SHOWS
115.1 OverviewDog shows, or conformation shows, are competitions in which a judge evaluates
individual purebred dogs for how well the dogs conform to the individual breedstandard.
Among hundreds of dog shows held annually in the United States,championships hosted by recognized national kennel clubs are the most prestigious.
The Westminster Kennel Club Dog Show, the National Dog Show, andAKC/Eukanuba National Championship, each of which are televised nationally, rank asthe top American dog shows.
115.2 Westminster Kennel Club Dog ShowThe Westminster Kennel Club Dog Show (www.westminsterkennelclub.org), the
largest and most prestigious dog show in the U.S., was established in 1877 and is thesecond longest continuously held sporting event in America. The two-day show is heldannually at Madison Square Garden (New York, NY).
Fox Sports and the Westminster Kennel Club announced a 10-year worldwide,multi-platform rights agreement to bring the show to Fox Sports 1 and Nat Geo WILDbeginning in 2017. USA Network, in conjunction with NBC, had broadcast theWestminster Kennel Club Dog Show since 1984. Viewership on the first night ofprimetime coverage on FS1 averaged 970,000.
The 143rd Westminster Kennel Club Dog Show was held February 11-12, 2019. Purina ProPlan is the title sponsor. Cosequin and Embark also sponsor the show.
115.3 National Dog ShowThe National Dog Show (http://nds.nationaldogshow.com), inaugurated in 1879,
is sponsored by The Kennel Club of Philadelphia. The show is held at the GreaterPhiladelphia Expo Center at Oaks.
The National Dog Show is televised on NBC on Thanksgiving Day immediatelyafter the Macy’s Thanksgiving Day Parade as part of a five-hour block of familyprogramming. The broadcast had 20 million viewers in 2018, according to TheWashington Post.
Purina is the presenting sponsor of the National Dog Show.
SPORTS MARKETING 2020-2021
• 499 •

115.4 AKC/Eukanuba National ChampionshipAKC National Championship presented by Royal Canin (www.akc.org/events/aenc/),
sponsored by the American Kennel Club, has been held annually in December since2005. Over 3,000 dogs compete; seven go to the Best In Show competition.
The 18th Championship was held December 15-16, 2018 in Orlando, Florida. The Championship is streamed at http://live.eukanuba.com.
115.5 Market ResourcesAmerican Kennel Club, 101 Park Avenue, New York, NY 10178. (212) 696-8200.(www.akc.org)
The Westminster Kennel Club, 111 Broadway, Suite 805, New York, NY 10006. (212) 213-3165. (www.westminsterkennelclub.org)
SPORTS MARKETING 2020-2021
• 500 •

116
DRONE RACING
116.1 OverviewIn the sport of drone racing, pilots control drones through a 3D course using first-
person view (FPV), or a live stream camera feed from the drones. Drone racing began inAustralia in 2013; organized participation is now worldwide.
The are two primary leagues, each with an annual worldwide championship. Venture capital-backed Drone Racing League (DRL, www.thedroneracingleague.com)produces high-budget made-for-TV races. MultiGP (www.multigp.com) is a grassrootsorganization that helps pilots organize local and regional races.
116.2 Drone Racing LeagueThe Drone Racing League season consists six sets of competitions called Levels
and the Allianz World Championship. Eighteen (18) pilots compete in the championship,which is held in December. The winner of each Level secures a place in thechampionship. The remaining championship slots go to pilots with the best averagefinishes.
DRL airs on NBC Sports, Twitter, Sky Sports, ProSieben, Groupe AB, OSN, andFox Sports Asia.
116.3 MultiGPMultiGP is a global, professional, drone racing league with over 1,000 chapters and
20,000 members. The league is headquartered in the U.S.; chapters are throughout Asia,Australia, Europe, and South Africa.
Championships have been held since 2015.
116.4 Market ResourcesDrone Racing League, 2880 S. Las Vegas Boulevard, Las Vegas, NV 89109. (www.thedroneracingleague.com)
MultiGP, 111 Enterprise Avenue SE, Palm Bay, FL 32909. (321) 549-3002. (www.multigp.com)
SPORTS MARKETING 2020-2021
• 501 •

117
EQUESTRIAN
117.1 OverviewEquestrian includes a wide range of activities, from horseback riding to racing,
show competitions to trail riding, and more.Competitive sports involving horses include dressage, endurance riding, eventing,
reining, show jumping, tent pegging, vaulting, polo, horse racing, driving, and rodeo.There are three equestrian events in the Summer Olympics, as follows:
• Dressage - horses carrying a rider perform natural movements while running loose• Show jumping - a timed event where the horse and rider jump over a series of
obstacles• Eventing, or combined training - combines dressage, show jumping, and cross-country
jumping, where horses jump over fixed obstacles on a course
According to the Sports & Fitness Industry Association (SFIA, www.sfia.org), 8.4million people (ages six and older) ride at least once each year; 2.8 million ride 13 times ormore. It is estimated that 27 million people in the United States have ridden a horse.
According to the American Quarter Horse Association (www.aqha.com), the U.S. equestrian industry includes 9.2 million horses and 4.6 million people (1.2 million ofwhich are employed in the sector) and contributes $102 billion in economic impact.
117.2 Horse ShowsThe following are the major organizations managing equestrian events in the
United States:• American Quarter Horse Association (www.aqha.com)• National Cutting Horse Association (www.nchacutting.com)• United States Dressage Federation (www.usdf.org)• United States Equestrian Federation (www.usef.org)• United States Eventing Association (www.useventing.com)
The following are among the major annual horse shows:Adequan Select (http://aqha.com/selectworld)• This eight-day event at the Amarillo (Texas) National Center hosts 1,290 riders.
Bank of America Amateur World Show and the FedEx Open World Show(http://aqha.com/worldshow)
SPORTS MARKETING 2020-2021
• 502 •

• The two events are held concurrently over 14 days every November in Oklahoma City.• There are 2,000 horses and 100,000 spectators at the events.
U.S. National Arabian & Half-Arabian Horse Show(www.arabianhorses.org/competitions/nationalevents/usnationals/2011/)• This nine-day event is held in October at Expo Square fairgrounds in Tulsa, OK.• Approximately 1,800 Arabian horses compete in the show.• The estimated economic impact is $33 million.
117.3 PoloAccording to MediaLife Magazine, polo has the most affluent audience among all
sports. Nearly a quarter of those attending matches make more than $500,000 a year; the average net worth of a polo fan is $4.68 million.
The United States Polo Association (USPA, www.uspolo.org) is the nationalgoverning body for the sport of polo in the United States.
There are 250 sanctioned polo clubs in the United States. The following are themost prominent (source: National Geographic):• Eldorado Polo Club (Indio, CA; www.eldoradopolo.com)• Santa Barbara Polo & Racquet Club (Carpinteria, CA; www.sbpolo.com)• The International Polo Club Palm Beach (Wellington, FL;
www.internationalpoloclub.com)• Will Rogers Polo Club (Pacific Palisades, CA; www.willrogerspolo.com)
In 2019, USPA sanctioned 98 tournaments, the largest of which was the 115th U.S.Open Polo Championship, held March 27-April 21 in Wellington, Florida. Broadcast byNBC Sports, the Championship typically has 350,000 to 500,000 viewers.
Among the elite polo tournaments is the Miami Beach Polo World Cup(www.miamipolo.com), inaugurated in 2005. Teams from Argentina, Brazil, Germany, andthe United States compete for the La Martina Trophy during the four-day event. Annualattendance is about 10,000 people. Sponsors are E! Entertainm ent, Heys, LufthansaPrivate Jet, Maserati, and The Raleigh.
The World Polo Championship, organized by the Federation of International Polo(FIP, www.fippolo.com) and held every three or four years, is polo’s major competitionbetween countries. The event was last held in the United States in 1998, when SantaBarbara, California, hosted the 5th edition of the Championship. The 11th edition of theChampionship took place at Sydney Polo Club (Australia) in 2017.
117.4 RodeosRodeos are assessed in Part XIV of this handbook.
SPORTS MARKETING 2020-2021
• 503 •

117.5 World Equestrian GamesThe World Equestrian Games (WEG), administered by Fédération Equestre
Internationale (www.fei.org) and held every four years, are the major internationalchampionships for equestrianism. The WEG include eight disciplines: combined driving,dressage, endurance riding, eventing, paraequestrianism, reining, show jumping, andvaulting.
The World Equestrian Games were held at Kentucky Horse Park in Lexington,Kentucky, in 2010, the first time WEG were held outside of Europe. Attendance wasestimated at 500,000.
The 8th edition of the World Equestrian Games were held September 11-23, 2018at Tryon International Equestrian Center (Tryon, NC). Attendance was approximately200,000, significantly less than the anticipated 300,000 to 400,000 because the ev entoccurred shortly after Hurricane Florence. Only one day of the event was cancelledbecause of flooding but many people cancelled plans to come or didn’t make the attemptbecause national news broadcasts painted North Carolina as a total disaster af ter thehurricane.
117.6 Market ResourcesAmerican Quarter Horse Association, 1600 Quarter Horse Drive, Amarillo, TX 79104. (806) 376-4811. (www.aqha.org)
United States Equestrian Federation, 4047 Iron Works Parkway, Lexington, KY 40511. (859) 258-2472. (www.usef.org)
United States Polo Association, 9011 Lake W orth Road, Lake Worth, FL 33467. (800) 232-8727. (www.uspolo.org)
SPORTS MARKETING 2020-2021
• 504 •

118
EVENTS FOR ATHLETES WITH DISABILITIES
118.1 OverviewAccording to U.S. Paralympics (www.usparalympics.org), there are 21 million
individuals in the United States who are living with a disability. One in 10 take part infitness activities on a daily basis.
U.S. Paralympics, a division of the U.S. Olympic Committee formed in 2001,sanctions paralympic sports in the United States. The group’s activities extend beyondhosting teams for international competitions, and through a range of sports programsstrives to make a difference in the lives of physically disabled people.
Special Olympics (www.specialolympics.org) is the world’s largest organization forpeople with intellectual disabilities. Like the International Paralympic Committee, theSpecial Olympics organization is recognized by the International Olympic Committee;however, Special Olympics World Games are not held in the same year or in conjunctionwith the Olympic Games.
118.2 Summer and Winter Paralympic GamesThe Summer and Winter Paralympic Games, hosted by the International
Paralympic Committee (www.paralympic.org), are Olympic-equivalent competitions forindividuals with disabilities and are recognized by the International Olympic Committee(www.ioc.org). There are national and international competitions in alpine and nordicskiing, track and field, volleyball, swimming, cycling, and powerlifting, along with variousother sports.
The Summer and Winter Paralympic Games are held every four years, immediatelyfollowing their respective Olympic Games. The Summer Paralympic Games comprise thesecond-largest international series of multi-sport events, trailing only the Summer OlympicGames.
The 2018 Winter Paralympics, the 12th Paralympic Winter Games, held inPyeongChang, South Korea, featured five sports, as follows:• Alpine skiing• Biathlon• Cross-country skiing• Sledge hockey• Wheelchair curling
SPORTS MARKETING 2020-2021
• 505 •

NBC Sports Network aired 94 hours of live coverage, almost double the broadcastsof the Winter Paralympics in Sochi, Russia, four years prior. There was also onlinestreaming content.
The 15th Summer Paralympic Games, in Rio de Janeiro, Brazil, September 7-18,2016, featured 20 sports, as follows:• Archery• Athletics• Boccia• Cycling• Equestrian• Football 5-a-side• Football 7-a-side• Goalball• Judo• Powerlifting
• Rowing• Sailing• Shooting• Swimming• Table tennis• Volleyball• Wheelchair basketball• Wheelchair fencing• Wheelchair rugby• Wheelchair tennis
_________________________________________________________________
“Following Rio, one thing we’ve noticed is thegrowth of the Paralympic movement in scaleand reach. Television ratings quadrupled in theUnited States for 2016 over London 2012. Bestof all, a few Paralympians ... are taking oncelebrity-level followings and could potentiallyscore some major endorsement deals in thefuture. Add to this the fact that many countrieshave drastically increased their investment andinterest in Paralympic sports over the pastdecade or so.”
SportsBusiness Journal _________________________________________________________________
U.S Paralympic sponsors are 24 Hour Fitness, Adecco, Allstate, AT&T, BMW,BP, Deloitte, GE, Hilton Hotels, Liberty Mutual Insurance, McDonald’s, Nike, Oroweat,Procter & Gamble, Samsung, The Hartford, United Airlines, and Visa.
International Paralympic sponsors are Allianz, Atos, BP, Ottobock, Panasonic,Samsung, Toyota, and Visa.
SPORTS MARKETING 2020-2021
• 506 •

118.3 Special OlympicsMore than 5.3 million athletes of all ages are involved in Special Olympics sports
training and competition worldwide. There are national, regional, and local SpecialOlympics competitions in over 170 countries. There are more than 108,000 events ayear, 19,000 of which are in the United States.
The major global competitions are the Special Olympics World Games, whichalternate between summer and winter games. Special Olympics World Games are heldevery two years, most recently in Los Angeles, California, July 25-August 2, 2015. Itwas the largest event in Los Angeles since the 1984 Olympic Games. ESPN provideddaily coverage.
The 11th Special Olympics World Winter Games were held March 14-21, 2019 inAbu Dhabi, United Arab Emirates.
The quadrennial Special Olympics USA National Games have been held since2006. Host cities have been, and will be, as follows:• 2006: Ames, IA• 2010: Lincoln, NE• 2014: Newark, NJ• 2018: Seattle, WA• 2022: Orlando, FL
Special Olympics sponsors are 21st Century Fox, AmeriHealth New Jersey,Barnabas Health, Bloomberg Business, Hess, Hill Wallack LLC Attorneys At Law,Johnson & Johnson, KPMG, Mercer County Park Commission, Mid-Jersey Chamber ofCommerce, Moose International, NJM Insurance Group, Prudential, PSE&G, ShopRite,STS Tire & Auto Centers, Toys ‘R’ Us, Trenton Thunder, US Law Network, WasteManagement, WWE, and Wyndham Worldwide.
118.4 Disabled Sports USADisabled Sports USA (DS/USA, www.disabledsportsusa.org), a national nonprofit
organization established in 1967 by disabled Vietnam Veterans, offers sportsrehabilitation programs to anyone with a permanent disability. Activities include winterskiing, water sports, summer and winter competitions, and fitness and special sportsevents. Participants include those with visual impairments, amputations, spinal cordinjury, dwarfism, multiple sclerosis, head injury, cerebral palsy, and other neuro-muscular and orthopedic conditions.
DS/USA Gold Sponsors are Anthem Life, Ariel Corp., Beaver Run Resort &Conference Center, Breckenridge Ski Resort, Challenged Athletes Foundation, Harry &Jeanette Weinberg Foundation, No Bats Baseball Club, Non-Commissioned OfficersAssociation, Oshkosh Defense, Ping, Tee It Up From The Troops, The Chart Group,The Hartford, The United States Association of Former Members of Congress, Trijicon,U.S. Department of Education, and Wounded Warrior Project.
SPORTS MARKETING 2020-2021
• 507 •

Silver Sponsors are BAE Systems, Battelle Science & Technology International,Burr, Pilger & Mayer, CVS Caremark Charitable Trust, Fournier Family Foundation,Franklin Templeton Investments, Hartford Foundation, Heisman Trophy Trust, HUBFinancial Charities, KBR, Phoenix Beehive Lobo Distributing, Robert Trent Jones GolfClub Charitable Foundation, and The Moore Charitable Foundation.
Bronze Sponsors are American Board Certification, Bank of America, BIC Sport,BMW of Fairfax, Clear Brook Advisors, Commerce Street Capital, CranaleithFoundation, FDNY Family Transport Foundation, Fire Department of New York,Flancer’s Café, Freedom Group, Gallagher Briody & Butler, Gary and Kathryn Purwin,General Electric, Genesis Today, Graybeards Ltd., Health Discovery Corporation,Intermedia Partners, John Doyle, Loyola Recovery Foundation, Luck FamilyFoundation, Maritime Telecommunications Network, National Rural ElectricCooperative Association, National Beer Wholesalers Association, New York City PoliceDepartment, Pentagon Ski Club, PGA of America, R&B Sports, South CarolinaResearch Authority, Thunderbirds Charities, Turner Foundation, US Family Health Plan,and W.H. Mell Associates.
118.5 Market ResourcesAthletes with Disabilities Network, 2845 Crooks Road, Rochester Hills, MI 48309. (248) 829-8353. (www.adnpage.org)
Challenged Athletes Foundation, 9591 Waples Street, San Diego, CA 92191. (858) 866-0959. (www.challengedathletes.org)
Disabled Sports USA, 451 Hungerford Drive, Suite 100, Rockville, MD 20850. (301) 217-0960. (www.disabledsportsusa.org)
Special Olympics, 1133 19th Street NW, Washington, DC 20036. (202) 628-3630.(www.specialolympics.org)
U.S. Paralympics Division, United States Olympic Committee, 27 South Tejon,Colorado Springs, CO 80909. (719) 866-2030. (www.usparalympics.org)
SPORTS MARKETING 2020-2021
• 508 •

119
FIGURE SKATING
119.1 OverviewFigure skating is a sport in which individuals, pairs, or groups perform spins,
jumps, footwork, and other intricate moves on ice. There are local, national, andinternational competitions. Figure skating is an official event in the Winter OlympicGames.
According to an ESPN Sports Poll, 45% of adults who follow sports are fans offigure skating; 10% say they are avid fans.
NBC drew 24.2 million viewers for its evening telecasts of figure skating at the2018 Winter Olympics in PyeongChang, South Korea. This was a slight drop from 25.1million viewers from the Winter Olympics in Sochi, Russia. The decline was attributed,in part, to a threefold increase in online streaming coverage. For comparison, NBCattracts an average of 21 million viewers for its Sunday NFL coverage.
Among those who regularly watched figure skating, 67.4% were women and32.6% were men, according to The Media Audit (www.themediaaudit.com).
_________________________________________________________________
“Figure skating is the most popular of all thesports in the [Winter] Olympic Games. Itattracts a family audience, with a female focus.”
Kevin Collins, Senior V.P.Initiative Media Agency
_________________________________________________________________
119.2 Sanctioning OrganizationsInternational Skating Union (ISU, www.isu.org) sanctions international figure
skating competitions. These include the Winter Olympic Games, the WorldChampionships, the World Junior Figure Skating Championships, the European FigureSkating Championships, the Four Continents Figure Skating Championships, and theISU Grand Prix of Figure Skating.
SPORTS MARKETING 2020-2021
• 509 •

The United States Figure Skating Association (USFS, www.usfigureskating.org)is responsible for figure skating in the United States. USFS is recognized by the UnitedStates Olympic Committee and organizes the U.S. team for the Winter Olympics. Withmore than 170,000 members, USFS is composed of more than 700 member clubs,collegiate clubs, school-affiliated clubs, individual members, Friends of Figure Skating,and more than 900 Basic Skills programs.
The USFS Basic Skills Program, created in 1968, has taught more than 1.5million people how to skate. The program has 946 skating schools throughout theUnited States.
Skaters represent the USFS in world level figure skating competitions includingthe World Figure Skating Championships and Four Continents. USFS sanctionscompetitions and testing for pairs, singles, and ice dance skating in the United States,and executes programs like the Special Olympics programs and collegiate programs formembers.
Skate America and other international and made-for-television competitions areproduced each year by the association.
USFSA hosts the World Figure Skating Museum & Hall of Fame in ColoradoSprings, Colorado, which is toured by more than 15,000 visitors annually.
The USFSA annual budget is approximately $16 million.United States Figure Skating Association 2019 Partners are Bridgestone,
Consumers Cellular, Folgres, Geico, HomeLight, Jif, Toyota, Viking River Cruises, andWayfair.
119.3 ISU Grand Prix of Figure SkatingThe ISU Grand Prix of Figure Skating is a series of invitational senior
internationals organized by the International Skating Union. Medals are awarded in thedisciplines of men's singles, ladies's singles, pair skating, and ice dancing. Skatersearn points based on their placement at each event and the top six in each disciplinequalified to compete at the Grand Prix Final.
The following are the events of the 2019 Grand Prix of Figure Skating:• 2019 Skate America: October 18-20• 2019 Skate Canada October 25-27• 2019 Internationaux de France: November 1-3• 2019 Cup of China: November 8-10• 2019 Rostelecom Cup (Russia): November 15-17• 2019 NHK Trophy (Japan): November 22-24• 2019 Grand Prix Final (Turin, Italy): December 5-8
119.4 Skate AmericaSkate America (www.2019skateamerica.com), launched in 1979, is an annual
SPORTS MARKETING 2020-2021
• 510 •

senior-level figure skating competition hosted by U.S. Figure Skating. Medals areawarded in four disciplines: men’s singles, ladies’ singles, pair skating, and ice dancing. Progressive is the title sponsor for the competition.
Host cities for Skate America have been as follows:• 2008: Everett, WA• 2009: Lake Placid, NY• 2010: Portland, OR• 2011: Ontario, CA• 2012: Kent, OH• 2013: Detroit, MI• 2014: Chicago, IL• 2015: Milwaukee, WI• 2016: Chicago, IL• 2017: Lake Placid, NY• 2018: Everett, WA• 2019: Las Vegas, NV
119.5 Market ResourcesInternational Skating Union, Chemin de Primerose 2, 1007 Lausanne, Switzerland.+41 (21) 612 66 66. (www.isu.org)
U.S. Figure Skating, 20 First Street, Colorado Springs, CO 80906. (719) 635-5200.(www.usfigureskating.org)
SPORTS MARKETING 2020-2021
• 511 •

120
FITNESS & STRENGTH COMPETITIONS
120.1 Profiles of Major EventsSeveral annual events feature athletes in specialized fitness and strength
competitions. Typically designed for televised broadcasting, the following are the mostprominent among such events:American Ninja Warrior (www.nbc.com/american-ninja-warrior/)• American Ninja Warrior is a contest in which competitors attempt to complete a four-stage obstacle course. The competition is a spin-off of Japan-based Sasuke.
The series launched in 2009 and airs on NBC and G4TV.
America’s Strongest Man (www.strongmancorporation.com)• America’s Strongest Man, established in 1997, is an annual strongman competition
featuring only American athletes. The event is held at Hollywood Casino (St. Louis,MO).
CrossFit Games (http://games.crossfit.com)• The CrossFit Games, a series of competitions held annually since 2007, are
designed to recognize the fittest men and women in the world. There are threestages of the CrossFit Games: worldwide Opens, with several thousandcompetitors, 17 Regionals, and the annual Reebok CrossFit Games, where 100athletes compete in three days of events. At each stage, athletes engage in aseries of challenges unknown to them until just before the competition. Final eventsare televised on ESPN. Reebok is the title sponsor; other sponsors are FRS, GNC,Rogue Fitness, and Vita Coco.
Lumberjack World Championship (www.lumberjackworldchampionships.com)• The Lumberjack World Championships, where men and women compete in timber
sport events, have been held annually in Hayward, Wisconsin, since 1960. Over100 athletes compete in 21 events including log rolling, pole climbing, sawing, andwood chopping. The championship has been featured on major television networksand ESPN. John Deere and Nortrax are title sponsors.
North America’s Strongest Man (www.strongmancorporation.com)• North America’s Strongest Man, established in 1992, is an annual strongman
competition featuring American and Canadian athletes.
SPORTS MARKETING 2020-2021
• 512 •

The World’s Strongest Man (www.theworldsstrongestman.com)• The World’s Strongest Man, launched in 1997, is an annual event of strength
athletics. Competitors qualify based on top placings at the World’s Strongest ManSuper Series events or are invited based on a top placing in national or internationalcompetitions. Thirty contestants take part across five heats; the top two in eachheat compete in the 10-man finals. The competition is organized by Trans WorldInternational, a division of IMG Media (www.imgworld.com). Met-RX is the eventsponsor.
Ultimate Beastmaster (www.netflix.com/title/80095299)• Ultimate Beastmaster is a competition with 12 contestants who run an obstacle
course known as The Beast; the winner is crowned “Beastmaster”. The competitionis broadcast as a reality show that premiered on Netflix in 2017.
SPORTS MARKETING 2020-2021
• 513 •

121
GYMNASTICS
121.1 OverviewAccording to 2018 Sports, Fitness And Leisure Activities Topline Participation
Report, published by the Sports & Fitness Industry Association (SFIA, www.sfia.org), 1.7 million people in the U.S. participate in gymnastics on a weekly basis; 4.8 millionparticipate at least once each year.
Gymnastics is recognized as an official sport for both men and women by theNational Collegiate of Athletic Association (NCAA, www.ncaa.org).
More than 550 gymnastics camps are held each summer throughout the U.S.
121.2 Sanctioning OrganizationsThe Fédération Internationale de Gymnastique (FIG, www.fedingym.com), or
International Federation of Gymnastics (IFG), is the governing body of competitivegymnastics.
USA Gymnastics (www.usa-gymnastics.org), recognized by the U.S. OlympicCommittee and FIG, is the sole national governing body for the sport of gymnastics inthe United States. The organization has programs in men’s and women’s artisticgymnastics, rhythmic gymnastics, trampoline and tumbling, and acrobatic gymnastics. USA Gymnastics has more than 90,000 athletes registered in competitive programs, aswell as more than 20,000 professionals, instructors, and club members. Approximately3,500 competitions and events throughout the U.S. are sanctioned annually.
121.3 Major EventsThe following were the major gymnastics competitions for 2019:
• March 1: 2019 Nastia Liukin Cup (Greensboro Coliseum, Greensboro, NC)• March 2: 2019 American Cup (Greensboro Coliseum, Greensboro, NC)• March 2: 2019 Elite Team Cup (Greensboro Coliseum, Greensboro, NC)• July 2-6: 2019 USA Gymnastics Championships (Iowa Events Center,
Des Moines, IA)• August 8-10: 2019 U.S. Gymnastics Championships(Sprint Center,
Kansas City, MO)
The 2019 U.S. Gymnastics Championships had an attendance of 33,984, arecord. Viewership on NBC was 2.78 million, a drop from 3.07 million in 2018.
SPORTS MARKETING 2020-2021
• 514 •

121.4 Market ResourcesInternational Federation of Gymnastics, Ave de la Gare 12, 1003 Lausanne,Switzerland. Tel: +41 21 321 5510. (www.fedintgym.com)
USA Gymnastics, 130 East Washington Street, Suite 700, Indianapolis, IN 46204. (317) 237-5050. (www.usagym.org)
SPORTS MARKETING 2020-2021
• 515 •

122
HORSE RACING
122.1 OverviewThere are 96 horse racetracks (excluding tracks at county fairs) in the U.S.
There were 4,432 race days at these tracks in 2018, up 3.1% from the previous year. Purses were $1.12 billion in 2018, 3.1% higher than in 2017. There is live horse racing with parimutuel wagering in 36 states. According toEquibase Corporation (www.equibase.com), wagering on U.S. thoroughbred races, orhandle, totaled $11.27 billion in 2018, up 3.5% f rom a year prior. Handle on horseracing peaked in 2003 at $15.2 billion. Approximately 10% of race wagers are made atthe track site of live racing; the bulk is bet off-track through simulcast races and online.
Top-earning jockeys in 2018 were as follows (source: BloodHorse):• Irad Ortiz, Jr.: $27,727,039• Jose L. Ortiz: $26,792,697• Javier Castellano $22,125,615• Joel Rosario: $21,538,452• Florent Geroux: $21,471,603
122.2 Top RacesRanked by attendance in 2018, the following were the top thoroughbred races:
• Kentucky Derby: 157,813• Preakness Stakes: 134,487• Kentucky Oaks: 113,510• Belmont Stakes: 90,327• Breeders' Cup Classic: 70,423• Travers Stakes: 49,418• Black-Eyed Susan Stakes: 48,265• Breeders’ Cup Distaff: 42,249
122.3 Triple CrownThe Triple Crown consists of the Kentucky Derby (www.kentuckyderby.com),
held at Churchill Downs (www.churchilldowns.com) in Louisville, Kentucky; thePreakness Stakes (www.preakness.com), held at Pimlico Race Course(www.pimlico.com) in Baltimore; and the Belmont Stakes (www.belmontstakes.com),held at Belmont Park (www.nyra.com/belmont) in Elmont, New York.
SPORTS MARKETING 2020-2021
• 516 •

The Kentucy Derby is assessed in Chapter 39 of this handbook.
122.4 Breeders’ CupThe Breeders’ Cup World Championships (www.breederscup.com) was created
in 1984 by the National Thoroughbred Racing Association (www.ntra.com) inconjunction with other racing organizations as a year-end championship forthoroughbred racing. The location of the race changes each year. With $20 million inprize money, the final day of the Breeders’ Cup is the richest day in sports.
The Breeders’ Cup was expanded in 2007 from a one-day, seven-event meetingto a two-day event with 15 races plus a host of surrounding events and parties.
The Breeders’ Cup is generally held at Santa Anita Park (Arcadia, CA), although the meet was moved to Churchill Downs in 2010 and 2011, and was held in Keenland Race Course (Lexington, KY) in 2015.
The 2019 Breeders’ Cup was held November 1-2 in Santa Anita Park.
122.5 SaratogaThe Saratoga Race Course opened in 1863 and is the oldest organized sporting
venue of any kind in the United States. Its six-week meet in upstate New York has longbeen recognized among the premier upscale social events in the country.
Travers Stakes, dating to 1864 and often referred to as Saratoga’s MidsummerDerby, is the most popular racing day during the Satatoga meet.
122.6 Pegasus World CupThe Pegasus World Cup, a thoroughbred race at Gulfstream Park (Hallandale
Beach, FL), was first run in 2017. With a purse of $12 million, the Pegasus World Cupis the richest horse race in the world. The first-place purse is $7 million.
122.7 Market OutlookThoroughbred breeders and race tracks, working through The Jockey Club
(www.jockeyclub.com), are working hard to promote racing to Millennials.America’s Best Racing (ABR, www.americasbestracing.net), a multimedia fan
development and awareness-building platform funded by The Jockey Club, has invitedsocial media influencers to race tracks to generate ethusiasm about racing. ABR hasalso built up social media followings on Facebook, Instagram, and Twitter, and hasposted video of young people enjoying a day at the races on YouTube.
A survey by Turnkey Sports & Entertainment (www.turnkeyse.com) askedsenior-level sports industry executives what they see as the biggest detrerrent todrawing Millennials to the sport of horse racing. Responses were as follows:
SPORTS MARKETING 2020-2021
• 517 •

• Lack of personalities: 40%• Limited media coverage of non-Triple Crown events: 18%• Use/treatment of animals: 17%• Short duration of events: 7%• Gambling aspect: 2%
When asked what strategies would most help grow the popularity of horseracing, responses were as follows:• Mobile betting apps: 35%• Including a form of team competition: 12%• Global series/competition: 10%• Online streaming or races: 9%
122.8 Market ResourcesBloodHorse, 3101 Beaumont Centre Circle, Suite 300, Lexington, KY 40513.(800) 582-5604. (www.bloodhorse.com)
Equibase Corporation, 821 Corporate Drive, Lexington, KY 40503. (800) 333-2211.(www.equibase.com)
National Thoroughbred Racing Association, 2525 Harrodsburg Road, Lexington, KY40504. (859) 223-5444. (www.ntra.com)
SPORTS MARKETING 2020-2021
• 518 •
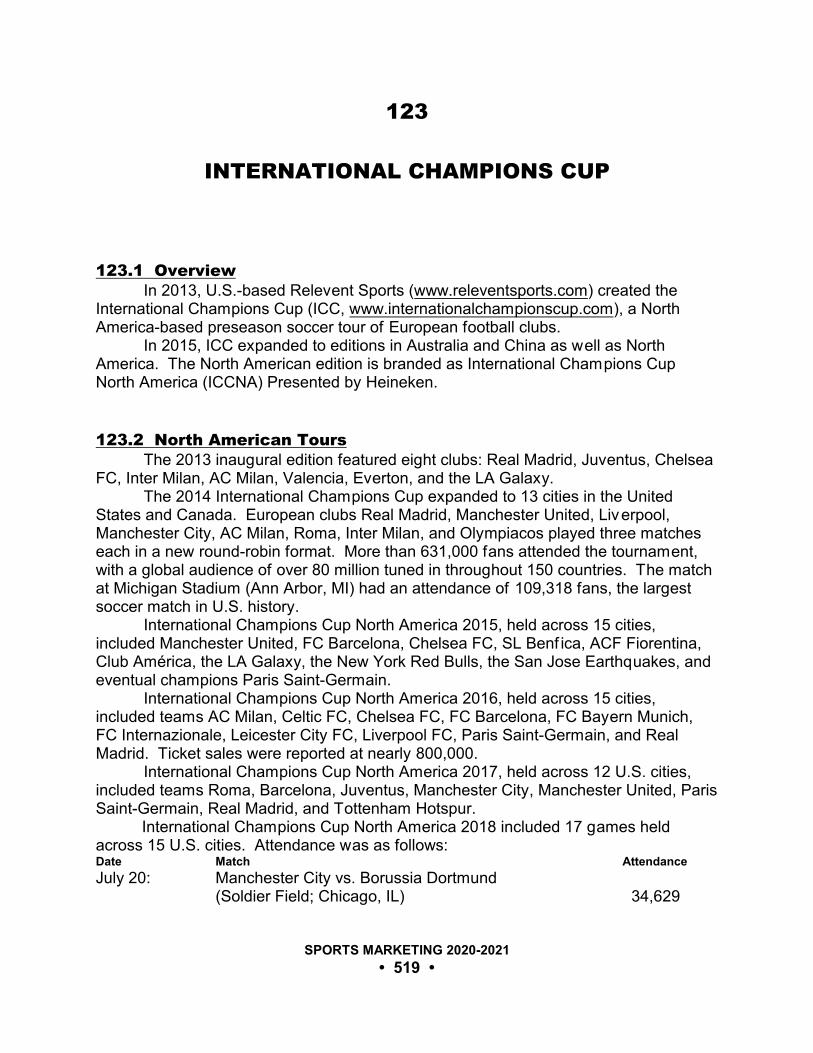
123
INTERNATIONAL CHAMPIONS CUP
123.1 OverviewIn 2013, U.S.-based Relevent Sports (www.releventsports.com) created the
International Champions Cup (ICC, www.internationalchampionscup.com), a NorthAmerica-based preseason soccer tour of European football clubs.
In 2015, ICC expanded to editions in Australia and China as well as NorthAmerica. The North American edition is branded as International Champions CupNorth America (ICCNA) Presented by Heineken.
123.2 North American ToursThe 2013 inaugural edition featured eight clubs: Real Madrid, Juventus, Chelsea
FC, Inter Milan, AC Milan, Valencia, Everton, and the LA Galaxy. The 2014 International Champions Cup expanded to 13 cities in the United
States and Canada. European clubs Real Madrid, Manchester United, Liverpool,Manchester City, AC Milan, Roma, Inter Milan, and Olympiacos played three matcheseach in a new round-robin format. More than 631,000 fans attended the tournament,with a global audience of over 80 million tuned in throughout 150 countries. The matchat Michigan Stadium (Ann Arbor, MI) had an attendance of 109,318 fans, the largestsoccer match in U.S. history.
International Champions Cup North America 2015, held across 15 cities,included Manchester United, FC Barcelona, Chelsea FC, SL Benf ica, ACF Fiorentina,Club América, the LA Galaxy, the New York Red Bulls, the San Jose Earthquakes, andeventual champions Paris Saint-Germain.
International Champions Cup North America 2016, held across 15 cities,included teams AC Milan, Celtic FC, Chelsea FC, FC Barcelona, FC Bayern Munich,FC Internazionale, Leicester City FC, Liverpool FC, Paris Saint-Germain, and Real Madrid. Ticket sales were reported at nearly 800,000.
International Champions Cup North America 2017, held across 12 U.S. cities,included teams Roma, Barcelona, Juventus, Manchester City, Manchester United, ParisSaint-Germain, Real Madrid, and Tottenham Hotspur.
International Champions Cup North America 2018 included 17 games heldacross 15 U.S. cities. Attendance was as follows:Date Match Attendance
July 20: Manchester City vs. Borussia Dortmund(Soldier Field; Chicago, IL) 34,629
SPORTS MARKETING 2020-2021
• 519 •

July 22: Liverpool vs. Borussia Dortmund(Bank of America Stadium; Charlotte, NC) 55,447
July 25: Juventus vs. Bayern Munich(Lincoln Financial Field; Philadelphia, PA) 32,105
July 25: Borussia Dortmund vs. Benfica(Heinz Field; Pittsburgh, PA) 16,171
July 25: Manchester City vs. Liverpool(MetLife Stadium; East Rutherford, NJ) 52,635
July 25: Roma vs. Tottenham Hotspur(SDCCU; San Diego, CA) 18,861
July 25: Milan vs. Manchester United(StubHub Center; Carson, CA) 21,742
July 28: Benfica vs. Juventus(Red Bull Arena, Harrison, NJ) 24,194
July 28: Manchester United vs. Liverpool(Michigan Stadium; Ann Arbor, MI) 101,254
July 28: Bayern Munich vs. Manchester City(Hard Rock Stadium; Miami Gardens, FL) 29,195
July 28: Barcelona vs. Tottenham Hotspur (Rose Bowl; Pasadena, CA) 66,805
July 31: Manchester United vs. Real Madrid(Hard Rock Stadium; Miami Gardens, FL) 64,141
July 31: Tottenham Hotspur vs. Milan(U.S. Bank Stadium; Minneapolis, MN) 31,264
July 31: Barcelona vs. Roma(AT&T Stadium; Arlington, TX) 54,726
August 4: Real Madrid vs. Juventus(FedEx Field; Landover, MD) 71,597
August 4: Milan vs. Barcelona(Levi’s Stadium; Santa Clara, CA) 51,391
August 7: Real Madrid vs. Roma(MetLife Stadium; East Rutherford, NJ) 51,528
SPORTS MARKETING 2020-2021
• 520 •

124
LACROSSE
124.1 Overview Lacrosse is North America’s oldest sport. Its origin stretches back to the 15 th century, when Native Americans played matches with hundreds of players that lastedover several days on miles-long fields.
According to 2018 SFIA Participation Topline Report, published by the Sports &Fitness Industry Association (SFIA, www.sfia.org), 2.2 million people in the U.S. playlacrosse each year; 1.0 million play monthly.
124.2 Sanctioning OrganizationUS Lacrosse (www.uslacrosse.org) was founded in 1998 as the national
governing body of men’s and women’s lacrosse. In 2018, there were 450,000 membersand 68 chapters in 45 states.
US Lacrosse National Partners for 2019 were Greenfields and NationwideInsurance. Official Partners were DJC, The Pearl by Guardian, Impact Instant Canopy,MedStar Sports Medicine, National Center for Safety Initiatives, NCSU, and SISU.
124.3 Growth of Lacrosse in the United StatesThe SFIA estimates that participation in lacrosse among children ages six and
older increased 118% during the past decade, ranking it as the most rapidly growingyouth sport in the U.S.
Lacrosse participation has expanded nationwide from a base that had previouslyexisted only in prep schools around Baltimore and parts of New York State and NewEngland.
Rick Burton, Ph.D., the David B. Falk Professor of Sport Management atSyracuse University, identifies the following market drivers for lacrosse:• Lacrosse is a relatively easy game to learn and understand. It sets up easily on a
football or soccer field.• Lacrosse is generally a high-scoring game that is played and enjoyed by both men
and women.• Lacrosse helps NCAA athletic departments comply with gender equality mandates
because the sport is popular with women and team sizes are large.• Lacrosse can be played in a low-cost way. The full competition game requires a
SPORTS MARKETING 2020-2021
• 521 •

helmet/eye guard and some padding, but other than the stick and a ball, the gamecan be played recreationally on any area of grass with two makeshift nets. A decentgame can be played with as few as six people, and two people can play a game ofcatch almost anywhere.
• Lacrosse has caught the attention of big-time sports apparel and equipmentcompanies who are helping grow the game while extending their businesses.
Approximately 520,000 people play lacrosse as members of high school andcollege varsity or intramural teams.
There are more than 300 women’s and more than 240 men’s college lacrosseteams playing in Divisions I, II, and III.
According to the National Federation of State High School Associations(www.nfhs.org), 113,313 boys and 96,904 girls competed in lacrosse during the 2017-2018 school year. Over 3,000 high schools have lacrosse teams.
124.4 Major EventsThe following are the major lacrosse events for 2019:
• May 8-11: WCLA National Championships (Princess Anne Athletic Complexand Sportsplex in Virginia Beach, VA)
• May 25-26: Women’s National Tournament (Cedar Lane Regional Park; Bel Air, MD)
• July 19-21: US Lacrosse Nationals (United Sports; Downingtown, PA)
124.5 Market ResourcesUS Lacrosse, 113 West University Parkway, Baltimore, MD 21210. (410) 235-6882.(www.uslacrosse.org)
SPORTS MARKETING 2020-2021
• 522 •

125
MARATHONS & ENDURANCE EVENTS
125.1 ParticipationAccording to Running USA (www.runningusa.org), there were 17.0 million
running event finishers in 2018; 9.7 million women and 7.3 million men completedendurance races. Race finishers by distance were as follows:• 5K: 8.3 million• Half-marathon: 2.0 million• 10K: 1.4 million• Marathon: 550,600• Other: 6.4 million
125.2 Major EventsAccording to Running USA, there were 30,400 organized running events in 2018.
Races by distance were as follows:• 5K: 17,000• 10K: 4,200• Half-marathon: 2,800• 8K/5 mile: 1,200• Marathon: 1,100• Other: 4,100
Ranked by number of race finishers, the top 20 running events were as follows:• AJC Peachtree Roadrace 10K (Atlanta, GA): 56,993• TCS New York City Marathon (New York, NY): 51,267• Bolder Boulder (Boulder, CO): 44,671• Lilac Bloomsday Run (Spokane, WA): 42,206• Bank of America Chicago Marathon (Chicago, IL): 40,523• Blue Cross Broad Street Run (Philadelphia, PA): 34,237• Bay to Breakers (San Francisco, CA): 28,009• Brooklyn Half Marathon (Brooklyn, NY): 27,428• Cooper River Bridge Run (Charleston, SC): 26,804• Boston Marathon (Boston, MA): 26,640• OneAmerica 500 Festival Mini-Marathon (Indianapolis, IN): 24,768• Army Ten Miler (Washington, DC): 24,008• Bank of America Shamrock Shuffle (Chicago, IL): 23,379
SPORTS MARKETING 2020-2021
• 523 •
• Ukrop’s Monument Avenue 10K (Richmond, VA): 23,127• Rock ‘n’ Roll Las Vegas (Las Vegas, NV): 22,086• Walt Disney World Marathon Weekend (Lake Buena Vista, FL): 21,495• Across the Bay 10K (Annapolis, MD): 20,908• Los Angeles Marathon (Los Angeles, CA): 20,608• 12th Annual Pat’s Run (Tempe, AZ): 20,385• United Airlines NYC Half (New York, NY): 20,140
125.3 Economic ImpactMarathon races are recognized as more than niche sports events as they have
become major tourist destinations. The following are economic impacts of selectmarathons (sources: U.S. Travel Association [www.ustravel.org] and Advertising Age):• TCS New York City Marathon: $250 million• Honolulu Marathon: $100 million• Boston Marathon: $ 95 million• Chicago Marathon: $ 80 million• Asics Los Angeles Marathon: $ 60 million• P.F. Chang’s Rock ‘n’ Roll Arizona Marathon: $ 41 million• Miami Marathon: $ 35 million• Marine Corps Marathon (Washington, DC): $ 20 million• Shamrock Run (Portland, OR): $ 15 million• Baltimore Marathon: $ 15 million• Chevron Houston Marathon: $ 12 million• AJC Peachtree Roadrace (Atlanta, GA): $ 10 million
_________________________________________________________________
“Cities are embracing marathons for the economicupswing. One of the benefits of a marathon of anysize is that it brings people to your city, it showcasesyour city, it brings people back.”
Running USA _________________________________________________________________
125.4 Business AssessmentAmong U.S. marathons, the New York City Marathon is the top revenue
generator, bringing in $50 million annually. About half of the revenue comes fromrunners’ entry fees, and approximately $10 million is from sponsorships. The
SPORTS MARKETING 2020-2021
• 524 •

remainder comes from licensing, merchandise sales, and TV broadcast rights. Theentry fee for the race ranges between $125 and $210. The race turns away about50,000 applicants a year. New York Road Runners (NYRR, www.nyrr.org) owns therace. Like many corporations, NYRR is aggressively looking to expand its business.
By contrast, the Boston Marathon, the oldest marathon in the country, pulls inaround $7 million annually in revenue and has a negligible profit. According to GuyMorse, executive director of the Boston Athletic Association (www.baa.org), which ownsthe race, the promoters don’t go overboard in overly commercializing the race. Runners must qualify for the Boston race, and therefore only about half the number ofrunners as in New York compete.
_________________________________________________________________
“Organized racing [is] a $1.4 billion-and-growingindustry (shoe sales not included), as raceorganizers and sponsors alike increasinglyclamor for a piece of the growing world ofparticipatory sports.”
Fortune _________________________________________________________________
125.5 SponsorsThe following are title sponsors of major marathons:
• Broad Street Run (Philadelphia): Blue Cross• Charlottesville Marathon: Miller Lite• Chicago Marathon: Bank of America• Columbus Marathon: Nationwide Children’s Hospital• Corporate Challenge Boston: JPMorgan Chase• Corporate Challenge Central Park: J.P. Morgan• Corporate Challenge Rochester: JPMorgan Chase• Corporate Run Miami: Mercedes Benz• Detroit Marathon: Talmer Bank• Falmouth (MA) Road Race: New Balance• Georgia Marathon: Publix• Houston Marathon: Chevron• Knoxville Marathon: Covenant Health• Miami Marathon: Life Time Fitness• Minneapolis Marathon: Ortho• New York City Half Marathon: United Airlines
SPORTS MARKETING 2020-2021
• 525 •

• New York City Marathon: TATA Consultancy Services (TCS)• New York Mini 10K: Oakley• Orlando Marathon: Disney Princess• Peachtree Road Race: Atlanta Journal-Constitution (AJC)• Rock ‘n’ Roll Arizona Marathon: P.F. Chang’s• Rock ‘n’ Roll Nashville Marathon: St. Jude’s• San Francisco Women’s Marathon: Nike• Shamrock Shuffle (Chicago): Bank of America• Silicon Valley Turkey Trot (San Jose): Applied Materials• Tacoma City Marathon: Michelob Ultra • Ten Miler (Washington, DC): U.S. Army• Twin Cities Marathon: Medtronic
An appeal for marketers of marathon sponsorships is the high-end demographicof race participants.
_________________________________________________________________
“You have an average household income of$160,000. It is an affluent group that spends,and from a marketer’s perspective, it is a very attractive demographic.”
SportsBusiness Journal _________________________________________________________________
125.6 Market ResourcesNew York Road Runners, 9 East 89 th Street, New York, NY 10128. (212) 860-4455.(www.nyrr.org)
Running USA, 3450 N. Ridgewood Street, Suite 311, Wichita, KS 67220. (313) 408-3655. (www.runningusa.org)
SPORTS MARKETING 2020-2021
• 526 •

126
MOUNTAIN BIKE RACES
126.1 OverviewMountain bike racing dates to the mid-1970s. The Union Cycliste International
(UCI, www.uci.ch), the world governing body for sports cycling which overseesinternational competitive cycling events, sanctioned its first mountain bike competition,the UCI Mountain Bike Cup, in 1990.
Cross-country mountain biking events were added to the Summer OlympicGames in 1996.
126.2 UCI EventsThe UCI Mountain Bike World Cup (www.uci.ch/mountain-bike/) has been held
annually since 1991. In 2019, eight Mountain Bike World Cup events were held Aprilthough September in Andorra, Australia, Austria, Canada, France (two events),Germany, and Great Britain. Events are broadcast live and globally on Red Bull TV.
The UCI Mountain Bike & Trials World Championships, held annually since1991, are considered the most prestigious competition in mountain bike racing. Eventsinclude the disciplines of cross country, downhill, four-cross, cross-country eliminator,and trials. UCI Mountain Bike World Championships were held in Lenzerheide,Switzerland, and Mont-Sainte-Anne, Canada, in 2018 and 2019, respectiv ely.
UCI Official Partners for 2019 were GoPro, Mercedes-Benz, Mitas, Oakley,Santini, Shimano, and Tissot Swiss Watches.
126.3 USA Cycling Mountain Bike National ChampionshipsUSA Cycling (www.usacycling.org) hosts the USA Cycling Mountain Bike
National Championships, considered to be the premier event mountain bike racingevent in the U.S. The 2019 Championships were held in Winter Park, Colorado, July23-28.
USA Cycling also hosted other major mountain bike racing events in 2019, asfollows:• March 29-31: USA Cycling Elite BMX National Championships
(Rock Hill, SC)• April 6-7: USA Cycling Collegiate BMX National Championship
(DeSoto, TX)
SPORTS MARKETING 2020-2021
• 527 •

• May 10-12: USA Cycling Collegiate Road National Championships(Augusta, GA)
• May 11: USA Cycling Marathon Mountain Bike NationalChampionships (Palo Duro Canyon, TX)
• June 20-23: USA Cycling Amateur Road National Championships(Hagerstown, MD)
• June 27-30: USA Cycling Professional Road National Championships(Knoxville, TN)
• July 2-7: USA Cycling Junior & Elite Track National Championships (Carson, CA)
• August 8-11: USA Cycling Masters Road National Championships (Colorado Springs, CO)
• August 27-31: USA Cycling Masters Track National Championships(Carson, CA)
• September 12-15: USA Cycling Collegiate Track National Championships(Rock Hill, SC)
• October 18-20: USA Cycling Collegiate Mountain Bike NationalChampionships (Durango, CO)
• December 10-15: USA Cycling Cyclocross National Championships (Tacoma, WA)
USA Cycling sponsors for 2019 were ASSOS of Switzerland, Frog Bikes, JustBare Chicken, KT Tape, Nationwide Insurance, Science in Sport, Solos Glasses, andUnited Airlines.
126.4 Sea Otter ClassicThe Sea Otter Classic (www.seaotterclassic.com), held annually at Mazda
Raceway Laguna Seca (Monterey, CA) since 1991, is the world’s largest cyclingfestival. The 2019 Sea Otter Classic was held April 11-14.
The festival includes mountain bike races, road bike racing, recreational rides, akids’ carnival, and outreach activities for women and girls. The Sea Otter Classic alsoincludes the largest consumer bike exposition in North America, with more than 450vendors representing nearly 800 brands displaying their products.
The four-day event draws approximately 10,000 professional and amateurathletes and 70,000 fans.
Sea Otter Classic Partners for 2019 were Bosch, Bulls eBikes, Hyper Treads,Kenda, Prologo, Specialized, and SRAM.
126.5 Market ResourcesSea Otter Classic, 215 West Franklin Street, Suite 214, Monterey, CA 93940. (831) 373-2331. (www.seaotterclassic.com)
SPORTS MARKETING 2020-2021
• 528 •

USA Cycling, 210 USA Cycling Point, Suite 100, Colorado Springs, CO 80919.(719) 434-4200. (www.usacycling.org)
SPORTS MARKETING 2020-2021
• 529 •

127
ROLLER DERBY
127.1 OverviewRoller derby dates to the mid-1930s. Popularity peaked in the 1940s when more
than 5 million spectators watched the sport in about 50 cities across the U.S. Thepopularity of roller derby faded in the second half of the 20th century.
Dominated by all-female amateur leagues, roller derby experienced a revival inthe early 2000s. There are also male, co-ed, and junior leagues.
There are approximately 1,000 amateur roller derby leagues in the United Statesand about the same number abroad.
Roller derby audiences at larger venues in the U.S. are reported at 4,000 to7,000.
Roller derby were one of eight sports considered by the 123rd InternationalOlympic Committee but are not included in the 2020 Olympic Summer Games.
127.2 Women’s Flat Track Derby AssociationThe Women’s Flat Track Derby Association (WFTDA, www.wftda.org),
established in 2004, is the governing body for women’s roller derby leagues. WFTDAhad 430 Full Member Leagues and 36 Apprentice Leagues at year-end 2018.
WFTDA developed formal rules for roller derby game play that are followed bymost non-member leagues as well as members. Derby News Network estimates thatmore than 98% of roller derby competitions worldwide are conducted under WFTDArules.
WFTDA announces monthly team rankings and hosts an annual series ofplayoffs and a championship for member leagues. The top 40 teams as of June 30compete in four Division 1 Playoff Tournaments and the WFTDA ChampionshipTournament.
WFTDA sponsors in 2019 were Atom Skates, Bont, Chaya, Heraty Law, LeftTurn Clothing, Radar Wheels, Ridell, RollerCon Las Vegas, and S1 Helmet Co.
127.3 Other LeaguesEstablished in 2007, the Men’s Roller Derby Association (MRDA,
www.mensrollerderbyassociation.com) is the governing body for male-only amateur(skater-owned and -operated) leagues. As of January 2019, MRDA had 67 memberleagues.
SPORTS MARKETING 2020-2021
• 530 •

The Junior Roller Derby Association (JRDA, www.juniorrollerderby.org),established in 2009, is the governing body for leagues with players ages 18 andyounger. There are 160 junior roller derby leagues.
The 2019 JRDA Championships were held July 26-29 in Loveland, Colorado.
127.4 Market ResourcesJunior Roller Derby Association, P.O. Box 439437, Chicago, IL 60643.(www.juniorrollerderby.org)
Men’s Roller Derby Association (www.mensrollerderbyassociation.com)
Women’s Flat Track Derby Association, P.O. Box 14100, Austin, TX 78761. (www.wftda.org)
SPORTS MARKETING 2020-2021
• 531 •

128
ROWING
128.1 OverviewRowing, sometimes referred to as crew, is one of the oldest collegiate sports in
the United States. Approximately 6,700 women and 1,800 men compete in crew asmembers of college teams. Approximately 2,200 boys and 2,100 girls compete on highschool rowing teams. Rowing is also one of the oldest Olympic sports.
In the U.S. races are referred to as regattas. Competition is limited because notall universities have access to suitable bodies of water and because of the status ofrowing as an amateur sport.
The North American Rowing Association (www.noara.org) organizes regattasoutside of college and high schools competitions.
128.2 Intercollegiate RowingThere are two collegiate rowing team categories: heavyweight (or openweight)
and lightweight.Men’s rowing (neither heavyweight or lightweight) has never had a national
organizing body. Women’s heavyweight rowing is organized through the NationalCollegiate Athletic Association (NCAA, www.ncaa.org). The NCAA does not sponsorwomen’s lightweight rowing championships.
An annual championship regatta is hosted by the American Collegiate RowingAssociation (www.americancollegiaterowing.com).
Regattas are coordinated by 13 conferences, as follows:Big Ten Conference• Men’s crew: none• Women’s crew: Indiana University, Michigan State University, Ohio State University,
University of Iowa, University of Michigan, University of Minnesota, University ofWisconsin
Colonial Athletic Association• Men’s crew: none• Women’s crew: Drexel University, George Mason University, Old Dominion
University, Northeastern University, SUNY at Buffalo, University of Delaware
SPORTS MARKETING 2020-2021
• 532 •

Conference USA• Men’s Crew: none• Women’s crew: California State University Sacramento, Kansas State University,
San Diego State University, University of Alabama, University of Kansas, Universityof Oklahoma, University of Tennessee, University of Texas at Austin, West VirginiaUniversity
Eastern Association of Rowing Colleges• Men’s crew: Boston University, Brown University, College of the Holy Cross,
Columbia University, Cornell University, Dartmouth College, George WashingtonUniversity, Georgetown University, Harvard University, Massachusetts Institute of Technology, Princeton University, Rutgers University, Syracuse University, UnitedStates Naval Academy, University of Delaware, University of Pennsylvania,University of Wisconsin, Yale University
• Women’s crew: Boston College, Boston University, Brown University, ColumbiaUniversity, Cornell University, Dartmouth College, George Washington University,Georgetown University, Harvard (Radcliff), Massachusetts Institute of Technology,Northeastern University, Princeton University, Rutgers University, SyracuseUniversity, United States Naval Academy, University of Delaware, University ofPennsylvania, Yale University
Eastern Colleges Athletic Conference/Metro League• Men’s crew: none• Women’s crew: Colgate, Fordham University, University of Buffalo, University of
Delaware, University of Massachusetts, University of New Hampshire, University of Rhode Island, Villanova University, West Virginia University
Liberty League Conference• Men’s crew: Hamilton College, Hobart College, Rochester Institute of Technology,
Skidmore College, St. Lawrence University, Union College, Vassar College• Women’s crew: Hamilton College, Rochester Institute of Technology, Skidmore
College, St. Lawrence University, Union College, Vassar College, William SmithCollege
Metro Atlantic Athletic Conference• Men’s crew: Fairfield University, Iona College, Jacksonville University, Manhattan
College, Marist College• Women’s crew: Canisius College, Drake University, Fairfield University, Iona
College, Jacksonville University, Loyola University Maryland, Manhattan College,Marist College, Robert Morris University, Sacred Heart University, Stetson University
Mid-Atlantic Rowing Conference• Men’s crew: Franklin & Marshall College, North Park University, Richard Stockton
College, Rutgers University Camden, University of Mary Washington, Washington
SPORTS MARKETING 2020-2021
• 533 •

College• Women’s crew: Bryn Mawr College, Franklin & Marshall College, Marietta College,
North Park University, Richard Stockton College, Rutgers University Camden,University of Mary Washington, Washington College
New England Rowing Conference• Men’s crew: Amherst College, Bates College, Brandeis University, Boston College,
Bowdoin College, Clark University, Colby College, Connecticut College, FranklinPierce University, Massachusetts Maritime Academy, Middlebury College, TrinityCollege, Tufts University, United States Coast Guard Academy, University ofMassachusetts Amherst, University of Massachusetts Lowell, University of NewHampshire, University of Rhode Island, University of Vermont, Wesleyan University,Williams College, Worcester Polytechnic Institute
• Women’s crew: Amherst College, Bates College, Brandeis University, BowdoinCollege, Clark University, Colby College, College of the Holy Cross, ConnecticutCollege, Franklin Pierce University, Middlebury College, Mount Holyoke College,Simmons College, Smith College, Trinity College, Tufts University, United StatesCoast Guard Academy, University of Massachusetts Lowell, University of NewHampshire, University of Vermont, Wellesley College, Wesleyan University,Williams College
Northwest Collegiate Rowing Conference• Men’s crew: Humboldt State University, Lewis & Clark College, Pacific Lutheran
University, Seattle Pacific University, University of Puget Sound, WesternWashington University, Willamette University
• Women’s crew: Humboldt State University, Lewis & Clark College, Pacific LutheranUniversity, Seattle Pacific University, University of Puget Sound, WesternWashington University, Willamette University
Pac 12 Conference• Men’s crew: Oregon State University, Stanford University, University of California,
University of California Los Angeles, University of Southern California, University ofWashington, Washington State University
• Women’s crew: Oregon State University, Stanford University, University ofCalifornia, University of California Los Angeles, University of Southern California,University of Washington, Washington State University
Patriot League• Men’s crew: none • Women’s crew: Boston University, Bucknell University, Colgate University, College
of the Holy Cross, Lehigh University, Massachusetts Institute of Technology, UnitedStates Naval Academy
SPORTS MARKETING 2020-2021
• 534 •

Western Intercollegiate Rowing Association• Men’s crew: Arizona State University, California State University - Humboldt,
California State University - Long Beach, California State University - Sacramento,Chapman University, Gonzaga University, Lewis & Clark College, Loyola MarymountUniversity, Orange Coast College, Pacific Lutheran University, Portland StateUniversity, San Diego State University, Santa Clara University, Seattle University,Seattle Pacific University, Sonoma State University, St. Mary’s College, University ofCalifornia Berkeley, University of California Davis, University of California Irvine,University of California San Diego, University of California Santa Barbara, Universityof Colorado, University of Portland, University of Puget Sound, University of SanDiego, University of the Pacific, Washington State University, Western WashingtonUniversity, Willamette University
• Women’s crew: Arizona State University, California State University - Humboldt,California State University - Long Beach, California State University - Sacramento,Chapman University, Evergreen State College, Gonzaga University, Lewis & ClarkCollege, Loyola Marymount University, Mills College, Orange Coast College, PacificLutheran University, Portland State University, San Diego State University, SantaClara University, Seattle University, Seattle Pacific University, Sonoma StateUniversity, St. Mary’s College, Stanford University, University of California Berkeley,University of California Davis, University of California Irvine, University of CaliforniaSan Diego, University of California Santa Barbara, University of Colorado, Universityof Portland, University of Puget Sound, University of San Diego, University of thePacific, Washington State University, Western Washington University, WillametteUniversity
The following are the major collegiate regattas:Dad Vail Regatta• Held annually in Philadelphia, the Dad Vail Regatta is recognized as the national
championship for smaller men’s college rowing teams unable to compete at the IRAChampionship Regatta. It is the largest collegiate race in the nation.
Eastern Sprints• The Eastern Sprints is the annual rowing championship for the men’s teams of the
Eastern Association of Rowing Colleges. Since 1946, the Rowe Cup has beenawarded to the college whose heavyweight men’s crews score the highest combinedtotal number of points in the varsity, junior varsity, and freshman races. TheWomen’s Eastern Sprints have been held as part of the event since 1974.
Harvard-Yale Regatta• The Yale-Harvard Regatta, America’s oldest collegiate athletic competition, has
been held annually between Yale University and Harvard University since 1852.
IRA Championship Regatta• The IRA Championship Regatta (www.row2k.com/ira) is considered the United
SPORTS MARKETING 2020-2021
• 535 •

States’ collegiate national championship of rowing. The Intercollegiate RowingAssociation, of which Columbia, Cornell, Pennsylvania, Navy, and Syracuse aremembers, organizes the championship events. The five member schools inviteother colleges to participate. The regatta includes both men’s and women’s(lightweight) events for sweep boats of all sizes.
NCAA Rowing Championship• Since 1997, the NCAA has hosted an invitational rowing championship for women.
There are championships for Division I, Division II, and Division III colleges.
128.3 Rowing At The Summer Olympic GamesRowing has been part of the Summer Olympic Games since 1900. The following 14 events were held at the 2016 Summer Olympic Games in Rio
de Janeiro, Brazil:• Men: Quad sculls, Double sculls, Single sculls, Eight, Coxless four, Coxless pair• Lightweight Men: Coxless four, Double sculls• Women: quad sculls, Double sculls, Single sculls, Eight, Coxless pair• Lightweight Women: Double sculls
Olympic rowing events fall under the jurisdiction of the International RowingFederation (FISA, www.worldrowing.com).
128.4 The World Rowing ChampionshipsThe World Rowing Championships, organized by FISA, is a week-long
international rowing regatta. Held annually since 1974, the championships includemen’s open weight and lightweight events, women’s open weight and lightweightevents, and adaptive rowing events for athletes with disabilities. The Junior WorldRowing Championships are held concurrently with the events.
World Rowing Championships have been held and are scheduled as follows:• 2016: Rotterdam, Netherlands• 2017: Sarasota, FL• 2018: Plovdiv, Bulgaria• 2019: Linz-Ottensheim, Austria• 2020: Bled, Slovenia• 2021: Shanghai, China• 2022: Racice, Czech Republic
128.5 Market ResourcesNorth American Rowing Association, 6 Essex Road, Suite 4, Ipswich, MA 01938. (978) 238-9005. (www.noara.org)
SPORTS MARKETING 2020-2021
• 536 •

129
RUGBY
129.1 OverviewRugby, also called rugby football, is one of the world’s most popular sports. The
sport has only modest popularity in the United States. The global popularity of rugbycan be traced to its English roots and the spread of the game throughout Europe andthe Commonwealth nations. The popularity of rugby in England is similar to that ofAmerican football in the United States. It is the national sport in New Zealand, SouthAfrica, Wales, Fiji, Samoa, Tonga, and Madagascar.
A full-contact team sport, rugby has several formats, the most popular of whichare rugby union, rugby sevens, and rugby league.
Rugby union, played with 15 players per side, is administered by World Rugby(www.worldrugby.org) and is the most popular form of rugby globally.
Rugby sevens, also known as seven-a-side, is a variant of rugby union in whichteams are made up of seven players, instead of the usual 15, and play shortermatches.
Rugby league, played with 13 players per side, is administered by the RugbyLeague International Federation (www.rlif.org). Rugby league is most prominent inAustralia, England, New Zealand, France, Fiji, and Papua New Guinea.
According to 2018 SFIA Participation Topline Report, published by the Sports &Fitness Industry Association (SFIA, www.sfia.org), 1.6 million people in the U.S. playrugby each year; 524,000 play eight or more times, a 14% increase from the previousyear.
129.2 Growth In PopularityRugby has been growing in popularity far beyond its traditional base in Western
Europe. In China, for example, e-commerce and media company Alibaba entered intoa broadcast rights deal with World Rugby and launched an initiative with the goal ofgetting one million Chinese to play by 2026. In Brazil, seven times more peoplewatched the 2015 Rugby World Cup than four years prior. And the African RugbyConfederation has grown to 32 nations from six in 1986.
In the U.S., the popularity of rugby is spreading beyond its traditional base ofEast Coast college campuses and prep schools.
SPORTS MARKETING 2020-2021
• 537 •

_________________________________________________________________
“Over the past decade, American rugby officialshave made a concerted effort to court footballplayers, sprinters, and other athletes withtranslatable skills – a push that coincided with a burgeoning college sevens league whosechampionship is televised by NBC Sports.”
Time _________________________________________________________________
Since 2009, when rugby secured a spot in the 2016 Summer Olympics, rugbyparticipation doubled worldwide, to 7.7 million players, according to World Rugby. Women’s participation increased fivefold, to almost 2 million.
129.3 Major League RugbyMajor League Rugby is assessed in Chapter 58 of this handbook.
129.4 USA Rugby LeagueThe American National Rugby League (AMNRL), the country’s first domestic
rugby league, launched in 1998. Seven teams split from the AMNRL in 2011 to formthe USA Rugby League (USARL, www.usarl.com). Three former AMNRL clubs joinedthe USARL. AMNRL folded in 2014.
The USARL season launches in June and ends with the Championship inAugust.
The 2019 USARL season opened with the following 12 clubs:• Atlanta Rhinos (Atlanta, GA)• Boston Thirteens (Boston, MA)• Brooklyn Kings (Brooklyn, NY)• Delaware Black Foxes (New Castle, DE)• Jacksonville Axemen (Jacksonville, FL)• Lakeland Renegades (Lakeland, FL)• New York Knights (New York, NY)• Northern Virginia Eagles (Nokesville, VA)• Philadelphia Fight (Conshohocken, PA)• Southwest Florida Copperheads (Fort Myers, FL)• Tampa Mayhem (Tampa, FL)• White Plains Wombats (White Plains, NY)
SPORTS MARKETING 2020-2021
• 538 •

129.5 USA Rugby SeriesUSA Rugby (www.usarugby.org) is the national governing body for the sport of
rugby union in the United States.USA Rugby sponsors two major series, as follows:
• The Rugby Weekend Tripleheader Presented by UL, held annually in November inChicago
• Emirates Airline Summer Series, held annually in June, with two weekend matchesheld in various stadiums
129.6 Rugby in the Summer Olympic GamesThe International Olympic Committee reinstated rugby sevens as an Olympic
sport in the 2016 Summer Olympics, held in Rio de Janeiro, Brazil. Both men’s andwomen’s teams competed. Rugby had previously last played in the Summer OlympicGames in 1924, when fifteen-a-side version of rugby union was played. Rugby willagain be played in the 2020 Olympics, to be held in Tokyo, Japan.
_________________________________________________________________
“The Olympic gold medal is considered to bethe pinnacle of our sport.”
Bernard Lapasset, President International Rugby Board
_________________________________________________________________
129.7 Six Nations ChampionshipThe Six Nations, Europe’s Premier International Rugby Tournament
(www.sixnationsrugby.com), is the largest rugby tournament in Europe. England,France, Ireland, Italy, Scotland, and Wales play in the annual tournament.
Matches for the tournament, held in February and March, are played in thefollowing stadiums:
Capacity
• Twickenham Stadium (London, England): 82,000• Stade de France (Paris, France): 81,338• Principality Stadium (Cardiff, Wales): 74,500• Stadio Olimpico (Rome, Italy): 72,698• Murrayfield Stadium (Edinburgh, Scotland): 67,144• Aviva Stadium (Dublin, Ireland): 51,700
SPORTS MARKETING 2020-2021
• 539 •

An assessment commissioned by MasterCard found that the games deliver a$632.8 million total economic impact for the six competing nations.
Royal Bank of Scotland has been the title sponsor since 2004. Partners areAccenture, Guiness, and Tissot.
The current champions are Ireland, having won the 2018 tournament.
129.8 Rugby World CupThe Rugby World Cup is assessed in Chapter 44 of this handbook.
129.9 Market ResourcesUSA Rugby League, 39 Broadway, 12th Floor, New York, NY 10006. (www.usarl.com)
World Rugby, Huguenot House, 35-38 St Stephen’s Green, Dublin 2 Ireland. Tel. (+00 353) 1 240 9200. (www.worldrugby.org)
SPORTS MARKETING 2020-2021
• 540 •

130
SENIOR GAMES
130.1 OverviewThe National Senior Games Association (NSGA, www.nsga.com) organizes and
presents the biennial Summer National Senior Games, also known as The SeniorOlympics. The Summer National Senior Games is the largest multi-sport event in theworld for seniors. Participants must be over 50 years of age.
NSGA serves as the umbrella for member state organizations across the UnitedStates that host State Senior Games or Senior Olympics. There are Senior Games in49 states; only North Dakota is without games. Athletes must place in State SeniorGames to qualify for participation in the National Senior Games. State games qualify25,000 to 30,000 athletes; about 12,000 actually participate in the national games.
There are 19 medal sports in the National Senior Games and most state seniorgames, as follows: archery, badminton, basketball, bowling, cycling, golf, horseshoes,pickleball, race walk, racquetball, road race, shuffleboard, softball, swimming, tabletennis, tennis, track and field, triathlon, and volleyball. Demonstration sports includeequestrian, fencing, lawn bowling, rowing, sailing, soccer, and water polo.
NSGA’s overall mission is to assist seniors in achieving greater value and qualityin their lives by staying healthy, active, and fit. Some 250,000 senior athletesparticipate in NSGA-sponsored events.
130.2 State Games
Alabama• Alabama Senior Olympics
(http://physicalfitness.alabama.gov/Sports.aspx)
Alaska• Alaska International Senior Games (www.alaskaisg.org)
Arizona• Arizona Senior Olympics (www.seniorgames.org)
Arkansas• Arkansas Senior Olympics (www.srsports.org)
SPORTS MARKETING 2020-2021
• 541 •

California• California Senior Games (www.californiaseniorgames.org)
Colorado• Rocky Mountain Senior Games (www.rockymountainseniorgames.com)
Connecticut• Connecticut Masters Games (www.ctmastersgames.org)
Delaware• Delaware Senior Olympics (www.delawareseniorolympics.org)
District of Columbia• DC Senior Games (http://dpr.dc.gov/DC/DPR)
Florida• Florida Senior Games (www.flasports.com/senior-games/senior-games-home.html)
Georgia• Georgia Golden Olympics (www.georgiagoldenolympics.org)
Hawaii• Hawaii Senior Olympics (http://hawaii.fuesport.com)
Idaho• Idaho Senior Games (www.idahoseniorgames.org)
Illinois• Illinois Senior Games (www.ilsenoly.org)
Indiana• Indiana Senior Games (www.indiana.fusesport.com)
Iowa• Iowa Senior Games (www.iowaseniorolympics.com)
Kansas• Kansas Senior Olympics (http://kansasseniorolympics.fusesport.com)
Kentucky• Kentucky Senior Games (www.kentuckyseniorgames.com)
SPORTS MARKETING 2020-2021
• 542 •

Louisiana• Louisiana Senior Olympic Games (www.lsog.net)
Maine• Maine Senior Games (www.smaaa.org)
Maryland• Maryland Senior Olympics (www.mdseniorolympics.org)
Massachusetts• Massachusetts Senior Games (www.maseniorgames.org)
Michigan• Michigan Senior Olympics (www.michiganseniorolympics.org)
Minnesota• Minnesota Senior Games (www.mnseniorgames.com)
Mississippi• Mississippi Senior Olympics (www.msseniorolym.org)
Missouri• Missouri State Senior Games (www.smsg.org/senior_games/)
Montana• Montana Senior Olympics (www.montanaseniorolympics.org)
Nebraska• Nebraska Senior Games (www.nebraskaseniorgames.com)
Nevada• Nevada Senior Games (www.nevadaseniorgames.com)
New Hampshire• Granite State Senior Games, Inc. (www.nhseniorgames.org)
New Jersey• New Jersey Senior Olympics (www.njseniorolympics.com)
New Mexico• New Mexico Senior Olympics (www.nmseniorolympics.org)
SPORTS MARKETING 2020-2021
• 543 •

New York• Empire State Senior Games (www.nyseniorgames.com)
North Carolina• North Carolina Senior Games (www.ncseniorgames.org)
North Dakota• no state games
Ohio• Ohio Senior Olympics (www.ohioseniorolympics.org)
Oklahoma• Oklahoma Senior Games (www.okseniorgames.com)
Oregon• Oregon Senior Games (www.visitbend.com)
Pennsylvania• Pennsylvania Senior Games (www.keystonegames.com/sportsenior.html)
Rhode Island• Ocean State Senior Games (www.riseniorolympics.org)
South Carolina• South Carolina Senior State Games (www.scseniorgames.com)
South Dakota• South Dakota Senior Games (www.southdakotaseniorgames.org)
Tennessee• Tennessee Senior Olympics (www.tnseniorolympics.com)
Texas• Texas Senior Games (www.tsga.org)
Utah• Huntsman World Senior Games (www.seniorgames.net)
Vermont• Vermont Senior Games (www.vermontseniorgames.org)
SPORTS MARKETING 2020-2021
• 544 •

Virginia• Virginia Senior Games (www.virgniniaseniorgames.org)
Washington• Washington State Senior Games (www.washingtonseniorgames.com)
West Virginia• West Virginia Senior Sports Classic (www.wvssc.com)
Wisconsin• Wisconsin Senior Olympics (www.wiseniorolympics.com)
Wyoming• Wyoming Senior Olympics (www.wyseniorolympics.com)
130.3 Biennial Summer GamesNational Senior Games participation has been as follows:
Year Location Participants
• 1987: St. Louis, MO 2,500• 1989: St. Louis, MO 3,400• 1991: Syracuse, NY 5,000• 1993: Baton Rouge, LA 7,200• 1995: San Antonio, TX 8,200• 1997: Tucson, AZ 10,300• 1999: Orlando, FL 12,000• 2001: Baton Rouge, LA 8,900• 2003: Hampton Roads, VA 10,700• 2005: Pittsburgh, PA 12,000• 2007: Louisville, KY 12,100• 2009: San Francisco, CA 10,000• 2011: Houston, TX 10,000• 2013: Cleveland, OH 10,700• 2015: Minneapolis/Saint Paul, MN 12,000• 2017: Birmingham, AL 12,000• 2019: Albuquerque, NM 12,000
130.4 Winter Senior GamesIn 2000, the first Winter National Senior Games were staged. More than 350
senior competitors came to Lake Placid, New York, for alpine skiing, cross-countryskiing, curling, ice hockey, and snowshoeing. National winter games were discontinuedafter the inaugural event.
SPORTS MARKETING 2020-2021
• 545 •

California (www.calwintergames.com), Michigan (www.michiganseniorolympics.org),and Wyoming (www.wyswintergames.com) have Winter Senior Games for residents oftheir states.
130.5 SponsorsHumana is the presenting sponsor for the Summer National Senior Games.
Zibrio, is the gold medal sponsor.
130.6 Market ResourcesNational Senior Games Association, P.O. Box 82059, Baton Rouge, LA 70884. (225) 766-6800. (www.nsga.com)
SPORTS MARKETING 2020-2021
• 546 •

131
SKIING & SNOWBOARDING
131.1 OverviewThe two general types of skiing are as follows:
Alpine• Alpine skiing is the sport of downhill skiing, straight racing, and slalom racing around
a series of markers on skis with fixed-heel bindings.
Nordic• Nordic skiing is the sport of cross-country racing, jumping, and biathlon where the
heel of the boot is not fixed to the ski.
Both Alpine skiing and Nordic skiing are Winter Olympic sports.Snowboarding is a hybrid of skateboarding, skiing, and surfing. Snowboarding
was developed in the U.S. in the 1960s and became a Winter Olympic sport in 1998.
131.2 ParticipationAccording to the 2018 SFIA Participation Topline Report, published by the Sports
& Fitness Industry Association (www.sfia.org), 9.9 million people in the U.S. (age 6 andolder) participate at least once per year in downhill skiing and 7.6 million snowboard.
According to the National Ski Areas Association (NSAA, www.nsaa.org), the U.S.ski industry recorded 59.0 million visits for the 2018-2019 season, an 11% increaseover the previous year. Visits by region were as follows: • Northeast: 11.6 million• Southeast: 4.3 million• Midwest: 6.4 million• Rocky Mountains: 21.7 million• Pacific West: 11.5 million
The number of annual ski visits varies based on snowfall, among other factors.The National Federation of State High School Associations (www.nfhs.org)
reported that 5,317 boys and 4,616 girls competed in alpine skiing in the 2017-2018academic year.
SPORTS MARKETING 2020-2021
• 547 •

131.3 Governing OrganizationsThe U.S. Ski and Snowboard Association (USSA, (http://ussa.org), founded in
1905, is the national governing body for Olympic skiing and snowboarding. The USSAis composed of over 30,000 athletes, officials and coaches, with a network of over100,000 parents, volunteers, and supporters helping to create opportunities for youngathletes. There are 425 member clubs.
The USSA and its local clubs coordinate programs in seven Olympic sports: alpine, cross country, disabled, freestyle, ski jumping, Nordic combined, andsnowboarding.
International Ski Federation (FIS, www.fis-ski.com), based in Switzerland, is thegoverning body for international winter sports, including the Olympic disciplines ofAlpine skiing, cross-country skiing, ski jumping, Nordic combined, freestyle skiing, andsnowboarding.
131.4 Winter Olympic EventsThe following were skiing and snowboarding events of the 2018 Winter Olympic
Games, held in Pyeongchang, South Korea:• Alpine skiing• Biathlon• Big air snowboarding• Cross country skiing• Freestyle skiing• Nordic combined• Ski jumping• Snowboard• Team event, alpine skiing
131.5 FIS World ChampionshipsFIS conducts three biennial World Championships, as follows:
FIS Alpine World Ski Championships • The FIS Alpine World Ski Championships have been held since 1931. • The 2019 FIS Alpine World Ski Championships were held at ARE ski resort,
Sweden, in February. The Championships were broadcast on NBC, NBC Sports,and Universal Sports Network.
FIS Nordic World Ski Championships• The FIS Nordic World Ski Championships have been held since 1925 for men and
since 1954 for women. Championship events include cross-country skiing, skijumping, and Nordic combined (a combination sport consisting of both cross-countryand ski jumping). The event is biennial.
SPORTS MARKETING 2020-2021
• 548 •

• The 2019 FIS Nordic World Ski Championships were held in Seefeld, Austria.• The 2021 FIS Nordic World Ski Championships will be held in Oberstdorf, Germany.• The 2023 FIS Nordic World Ski Championships will be held in Planica, Slovenia.
FIS Ski Flying World Championships• The Ski Flying World Champion is determined after four jumps. Forty jumpers
qualify for the competition and jump the first round, 10 are eliminated, and the 30remaining jumpers compete in the last three rounds. The person with the mostpoints combined after four jumps is declared the World Champion. There is also ateam event between National teams of four jumpers, with two jumps each. Theevent is biennial.
• The 2018 FIS Ski Flying World Championships were held in Oberstdorf, Germany.• The 2020 FIS Ski Flying World Championships will be held in Planica, Slovenia.• The 2022 FIS Ski Flying World Championships will be held in Vikersund, Norway.
131.6 USSA Grand Prix SeriesThe major series for freeskiing and snowboarding is the Toyota U.S. Freeskiing
Grand Prix (http://usfreeskiing.com/events/sprint-us-grand-prix-0). The events of the2018-2019 series were as follows:• December 5-6, 2018: Copper Mountain, CO• March 6-9, 2019: Mammoth Mountain, CA
2019-2020 sponsors were Bose, GoPro, High West Distillery, L.L. Bean, Orig3n,and Toyota.
131.7 Market ResourcesInternational Ski Federation (FIS), Marc Hodler House, Blochstrasse 2, 3653 Oberhof en Thunersee, Switzerland. Tel. +41 (0)33 244 6161. (www.fis-ski.com)
National Ski Areas Association, 133 S. Van Gordon Street, Suite 300, Lakew ood, CO80228. (303) 987-1111. (www.nsaa.org)
U.S. Ski and Snowboard Association, 1 Victory Lane, Park City, UT 84060. (435) 649-9090. (http://ussa.org)
SPORTS MARKETING 2020-2021
• 549 •

132
SOCCER
132.1 OverviewWith over 3.5 billion fans worldwide, soccer, generally called football outside the
United States, is the world’s most popular sport. The FIFA Men’s World Cup, which isassessed in Chapter 36 of this handbook, is the world’s most popular sports event.
The Federation Internationale de Football Association (FIFA, www.fifa.com) issoccer’s global governing body.
Founded in 1913, the United States Soccer Federation (www.ussoccer.com) isthe governing body of soccer in all its forms in the United States.
Soccer is recognized as an official sport for both men and women by theNational Conference of Athletic Association (NCAA, www.ncaa.org).
Major League Soccer is assessed in Chapter 52 of this handbook.
132.2 Growth of Soccer in the United StatesSoccer has seen significant growth in the United States, both in participation
and as a spectator sport.The number of youth soccer players in the United States has doubled to 4.0
million players since 1990, according to the United States Soccer Federation. 2018 Sports, Fitness And Leisure Activities Topline Participation Report ,
published by the Sports & Fitness Industry Association (SFIA, www.sfia.org), reportedthat 11.9 million people participate in outdoor soccer at least once a year; 5.3 millionpeople play 26 or more times. Indoor soccer sees annual participation of 5.4 millionpeople.
According to the National Federation of State High School Associations(www.nfhs.org), 456,362 boys and 390,482 girls competed in soccer during the 2017-2018 school year. Approximately 12,000 high schools have soccer teams.
The number of women’s collegiate teams has increased 115% since the UnitedStates hosted the Women’s World Cup in 1994, and the number of men’s teams rose28% over the same period, according to the NCAA.
With a growing number of soccer channels available through cable and satellitetelevision providers, U.S. fans are also following England’s Premier League, Spain’s LaLiga, and other international leagues.
SPORTS MARKETING 2020-2021
• 550 •

132.3 SponsorsVolkswagen is the presenting partner for the U.S. Soccer Federation. Sponsors
in 2019 were AT&T, Budweiser, Coca-Cola, Continental Tire, Cutter, Deloitte, HisenseUSA, Johnson & Johnson, Nike, Powerade, Secret Deodorant, TAG Heuer, Thorne,VISA, and Volpi Foods.
132.4 Market ResourcesFédération Internationale de Football Association, Strasse 20, P.O. Box 8044, Zurich,Switzerland. +41 (0) 43 222 7777. (www.fifa.com)
U.S. Soccer Federation, 1801 South Prairie Avenue, Chicago, IL 60616. (312) 808-1300. (www.ussoccer.com)
SPORTS MARKETING 2020-2021
• 551 •

133
SOFTBALL
133.1 OverviewAccording to 2018 SFIA Participation Topline Report, published by the Sports &
Fitness Industry Association (SFIA, www.sfia.org), 7.3 million people play slow pitchsoftball at least once each year; 4.2 million play 13 or more times. Also, 2.3 millionpeople play fast pitch softball; 1.2 million play 26 or more times.
According to the National Federation of State High School Associations(www.nfhs.org), 367,861 girls played on high school softball teams during the 2017-2018 academic year.
The National Collegiate Athletic Association (NCAA, www.ncaa.org) recognizeswomen’s softball as an official sport and has hosted the Women’s College World Seriessince 1982.
Women’s softball was played in the Summer Olympic Games from 1996 to 2008. The sport was dropped for the 2012 Games.
National Pro Fastpitch (NPF, www.profastpitch.com), the women’s professionalsoftball league, is assessed in Chapter 67 of this handbook.
133.2 Amateur Softball AssociationThe 1976 Amateur Sports Act designated the Amateur Softball Association
(ASA, www.teamusa.org/USA-Softball) as the national governing body of softball in theUnited States.
The ASA has registered over 230,000 softball teams comprising over threemillion players annually. The ASA runs competitions in every state through a networkof 76 state associations and conducts over 100 National Championships in which30,000 players compete.
Annually, the ASA registers over 83,000 youth girls’ fast pitch softball teamscomprising over 1.2 million girls.
ASA sponsors for 2019 were GameChanger, IHG, MTM Recognition, NFCA,Nike, Oklahoma City Convention & Visitors Bureau, Pocket Radar, Softball Factory,SportsEngine, Thorne, United Airlines, and US Sports Camps.
133.3 Market ResourcesAmateur Softball Association of America, 2801 NE 50th Street, Oklahoma City, OK73111. (405) 424-5266. (www.asasoftball.com)
SPORTS MARKETING 2020-2021
• 552 •

National Softball Association, P.O. Box 7, Nicholasville, KY 40340. (859) 887-4114.(www.playnsa.com)
SPORTS MARKETING 2020-2021
• 553 •

134
SPORT CLIMBING
134.1 OverviewSport climbing competitions are usually held indoors on climbing walls. There
are three categories of climbing competition, as follows:Lead Climbing• In lead climbing, the most popular discipline of sport climbing, competitors climb a
route within a certain time frame, clipping into pre-placed quickdraws along theroute.
Speed Climbing• Competitors climb a slightly overhanging IFSC-certified vertical piste; the person or
team that can climb a route the fastest is the winner.
Bouldering• The bouldering competition consists of climbing without belay ropes on short walls.
This discipline is marked by high difficulty concentrated into a short route, limitedcompetition time, and close proximity to the spectators. The climber can attempt aroute more than once. The score is determined by the overall number of routes sentby the competitor and the number of attempts needed.
Sport climbing will be included in the 2020 Summer Olympic Games in Tokyo,Japan.
134.2 ParticipationAccording to the 2018 Sports, Fitness And Leisure Activities Topline Participation
Report, published by the Sports & Fitness Industry Association (SFIA, www.sfia.org),participation in climbing is as follows:• Indoor: 5.0 million• Ice/Mountaineering: 2.5 million• Sport/boulder: 2.1 million
134.3 USA ClimbingUSA Climbing (www.usaclimbing.org) is the official governing body of climbing
competitions in the United States.
SPORTS MARKETING 2020-2021
• 554 •

There are three national championships, as follows:
Bouldering National Cup• The Bouldering National Cup Series consists of four bouldering competitions across
the country culminating in the Bouldering Open National Championships. A total of$50,000 is awarded to competitive climbers over the course of the season throughthis series. The 2018-2019 regional events were held as follows:- September 21-22, 2018: Ascend Pittsburgh (Pittsburgh, PA)
- October 12-13, 2018: Mesa Rim Academy (San Diego, CA)- November 16-17, 2018: Momentum Silver Street (Houston, TX)- December 14-15, 2018: Ascent Studio (Fort Collins, CO)
• The 2018-2019 Bouldering Open National Championships were held at DeschutesCounty Fair and Expo Center (Redmond, OR), February 1-2, 2019.
Sport & Speed Open National Championships• The 2019 Sport & Speed Open National Championships were held Sportrock
(Alexandria, VA), March 8-9.
Collegiate National Championships• A participant must be a student at a four-year university, must compete in one local
competition (October through February), and must compete in one regionalcompetition (held late-March through early April). The 2019 championship was heldat Climb Murfreesboro (Murfreesboro, TN), April 26-27.
There are also Bouldering Youth National Championships and Sport & SpeedYouth National Championships.
134.4 International Federation of Sport ClimbingThe International Federation of Sport Climbing (IFSC, www.ifsc-climbing.org) is
the international governing body for the sport of competitive climbing. There are two international championships, as follows:
Climbing World Championship• The IFSC Climbing World Championship is a competition held biennially in
September. This event determines the male and female world champions in thethree disciplines of sport climbing. IFSC World Championships 2016 and 2018 wereheld in Paris, France, and Innsbruck, Austria, respectivley.
Climbing World Cup• The IFSC Climbing World Cup is a series of competitions held annually. The
athletes compete in three disciplines: lead, bouldering, and speed. The number of
SPORTS MARKETING 2020-2021
• 555 •

competitions and venues vary from year to year. The 2018 Climbing World Cupcompetition was held in Munich, Germany.
134.5 Market ResourcesInternational Federation of Sport Climbing, Via Carlo Matteucci 4, 10143 Torino, Italy. Tel. +39 011 385 3995. (www.ifsc-climbing.org)
USA Climbing, 4665 Nautilus Court, Suite 502A, Boulder, CO 80301. (303) 499-0715.(www.usaclimbing.org)
SPORTS MARKETING 2020-2021
• 556 •

135
STATE GAMES
135.1 OverviewThirty-one states conduct statewide sports festivals known as State Games,
which are modeled after the Olympic Games. Nationwide more than 90 sports are offered each year in State Games, with
competitions held in 536 communities for participants from over 6,000 cities and towns. Both recreational and competitive, State Games events have been the first step formany Olympic and professional athletes.
State Games competitions include Olympic or Pan American sports such asbasketball, bowling, diving, figure skating, ice hockey, road races, soccer, softball,swimming, tae kwon do, tennis, track & field, and volleyball, as well as a wide variety of local favorites such as arm wrestling, equestrian, field hockey, horseshoes, mountainbiking, and more.
Each year nearly 500,000 athletes of all ages, backgrounds, and skill levels takepart in State Games competitions nationwide. An additional 1.2 million spectatorsattend State Games events, all made possible by the work of thousands of coaches,parents, officials, sponsors, and more than 100,000 volunteers.
135.2 Profiles of State Games
AlabamaAlabama Sports Festival (www.alagames.net)• Summer Games: June
ArizonaGrand Canyon State Games (www.gcsg.org)• Summer Games: June• Winter Games: January - April
CaliforniaCalifornia State Games (www.calstategames.org)• Summer Games: July-August• Winter Games: February-March
SPORTS MARKETING 2020-2021
• 557 •

ColoradoRocky Mountain State Games (www.coloradospringssports.com)• Summer Games: July
ConnecticutNutmeg State Games (www.nutmegstategames.org)• Summer Games: July-August
FloridaSunshine State Games (www.flasports.com)• Summer Games: April-June
GeorgiaGeorgia Games (www.georgiagames.org)• Summer Games: July
IowaIowa Games (www.iowagames.org)• Summer Games: July• Winter Games: January-February
KansasSunflower State Games (www.sunflowergames.com)• Summer Games: July
KentuckyBluegrass State Games (www.bluegrassstategames.org)• Summer Games: July
MaineMaine Games (www.mainegames.org)• Summer Games: March-July
MassachusettsBay State Games (www.baystategames.org)• Summer Games: July• Winter Games: January
MichiganState Games of Michigan (www.stategamesofmichigan.com)• Summer Games: June
SPORTS MARKETING 2020-2021
• 558 •

MinnesotaStar of the North State Games (www.starofthenorthgames.org)• Summer Games: June
MississippiState Games of Mississippi (www.stategamesofms.org)• Summer Games: June
MissouriShow-Me State Games (www.smsg.org)• Summer Games: July
MontanaBig Sky State Games (www.bigskygames.org)• Summer Games: April, July
NebraskaCornhusker State Games (www.cornhuskerstategames.com)• Summer Games: July
New MexicoNew Mexico State Games (www.newmexicogames.org)• Summer Games: May, July
New YorkEmpire State Games (www.empirestategames.org)• Summer Games: July• Winter Games: February
North CarolinaState Games of North Carolina (www.ncsports.org)• Summer Games: June
North DakotaPrairie Rose State Games (www.prairierose.org)• Summer Games: July
OklahomaSooner State Games (www.soonerstategames.org)• Summer Games: June• Winter Games: January-March
SPORTS MARKETING 2020-2021
• 559 •

OregonState Games of Oregon (www.stategamesoforegon.org)• Summer Games: July
PennsylvaniaKeystone State Games (www.premiersportingevents.com)• Summer Games: July• Winter Games: January
TexasGames of Texas (www.taaf.com)• Summer Games: July• Winter Games: January
UtahUtah Summer Games (www.utahsummergames.org)• Summer Games: June
VirginiaCommonwealth Games of Virginia (www.commonwealthgames.org)• Summer Games: July
WashingtonWashington Games (www.washingtongames.org)• Summer Games: August-September
WisconsinBadger State Games (www.sportsinwisconsin.com)• Summer Games: June• Winter Games: January-February
135.3 State Games Of AmericaThe State Games of America is a biennial Olympic-style event featuring
competition between State Games medal winners (gold, silver, bronze) from across thenation.
The 2019 State Games of America were held July 31-August 4, in Lynchburg,Virginia.
135.4 Market ResourcesNational Congress of State Games, 171 Monroe Avenue NW, Suite 700, Grand Rapids,MI 49503. (616) 233-3563. (www.stategames.org)
SPORTS MARKETING 2020-2021
• 560 •

136
SURFING
136.1 ParticipationAccording to 2018 SFIA Participation Topline Report, by the Sports & Fitness
Industry Association (SFIA, www.sfia.org), 2.7 million people surf; 975,000do so eight or more times each year.
136.2 World Surf LeagueThe World Surf League (WSL, www.worldsurfleague.com) is the governing body
for professional surfers. The WSL changed its name in 2015 from the Association ofSurfing Professionals.
WSL sanctions eight tours, as follows:• WSL Men’s Championship Tour• WSL Women’s Championship Tour• WSL Men’s Qualifying Series• WSL Women’s Qualifying Series• WSL Men’s Longboard Championships• WSL Women’s Longboard Championships• WSL Junior Championships• WSL Big Wave Tour
136.3 Championship TourThe 2019 Men’s & Women’s Championship Tour is as follows:
• April 3-13: Quiksilver Pro Gold Coast(Gold Coast, Queensland, Australia)
• April 17-27: Rip Curl Pro Bells Beach(Bells Beach, Victoria, Australia)
• May 13-25: Indonesia Bali Pro (Keramas, Bali)• May 29-June 9: Margaret River Pro
(Margaret River, Western Australia)• June 20-28: Oi Rio Pro (Saquarema, Rio de Janeiro, Brazil)• July 9-22: J-Bay Open (Jeffreys Bay, South Africa)• August 21-31: Tahiti Pro Teahupo’o
(Teahupo’o, Tahiti, French Polynesia)• September 19-22: Surf Ranch Pro (Lemoore, CA)
SPORTS MARKETING 2020-2021
• 561 •

• October 3-13: France Pro (Landes, Aquitaine, France)• October 16-28: Meo Pro Peniche (Peniche, Portugal)
• December 8-20: Billabong Pipe Masters [Men] (Banzai Pipeline,Oahu, HI)
• November 25-December 7: Maui Women’s Pro (Honolua Bay, Maui, HI)
136.4 Market ResourcesWorld Surf League, 149 Bay Street, Santa Monica, CA 90405. (310) 450-1212.(www.worldsurfleague.com)
SPORTS MARKETING 2020-2021
• 562 •

137
SWIMMING, DIVING & WATER POLO
137.1 OverviewAn estimated 300,000 people swim competitively in the United States. An
additional seven million swim for recreation and fitness.Club swimming in the U.S. has two major seasons. During the short-course
season, from September to the end of March, swimmers swim in 25-yard pools. Thelong-course season is swum in 50-meter Olympic pools and lasts from April to the endof August.
According to the National Federation of State High School Associations(www.nfhs.org), 175,594 girls and 138,935 boys competed in swimming and diving during the 2017-2018 school year.
Swimming, diving, and water polo are recognized as official sports for both menand women by the National College Athletic Association (NCAA, www.ncaa.org).
137.2 Sanctioning OrganizationsSwimming is governed internationally by the Fédération Internationale de
Natation (FINA, www.fina.org). FINA organizes swimming, diving, synchronizedswimming, and water polo competitions at the Summer Olympics.
United States Aquatic Sports (USAS, www.usaaquaticsports.com) is the nationalfederation for aquatic sports which represents the United States in FINA.
Five separate national governing bodies make up USAS, as follows: • United States Masters Swimming (USMS, www.usms.org)• United States Synchronized Swimming (www.usasynchro.org)• USA Diving (www.usadiving.org)• USA Swimming (www.usaswimming.org), • USA Water Polo (www.usawaterpolo.org)
Of the five, only USMS is not a member of the United States Olympic Committee. USMS’s main focus is adult swimming, exclusive of Olympic-swimming, which is thedomain of USA Swimming. USAS exists as an umbrella organization because FINAregulations limit countries to a single national federation.
USA Swimming, the national governing body for the sport in the U.S., sanctionsover 4,000 events each year. Membership, comprised of swimmers from the age-grouplevel to the Olympic Team as well as coaches and volunteers, is approximately 300,000.
SPORTS MARKETING 2020-2021
• 563 •

USA Diving offers a variety of programs for divers of all ages and skill levels. Themost visible annual events run by USA Diving are the AT&T National Divingchampionships, the AT&T USA Diving Grand Prix, and the Junior and Age GroupNational Diving Championships.
U.S. Synchronized Swimming, also known as USA Synchro and SynchroSwimming USA, was established in 1977 as the national governing body forsynchronized swimming.
USA Water Polo, the governing body for the sport, has approximately 500registered clubs across the United States.
U.S. Masters Swimming, founded in 1971, organizes swimming programs foradults that range from lap swimming to international competition. Membership numbersmore than 50,000 and programs are open to all adult swimmers (fitness, triathlete,competitive, non-competitive). There are more than 500 local and regional competitionsfor adult swimmers around the country each year. Almost half of USMS memberscompete in meets. USMS holds two national championship meets each year. Thespring championships are held in April or May and are contested in a short coursevenue. The summer championships are held in August and are contested in a longcourse venue.
137.3 SponsorsSponsors for swimming, diving, and water polo are as follows:
United States Masters Swimming• Adolph Kiefer & Associates, Agon Sport, All American Swim Supply, Bank of
America, Barracuda, blueseventy, BullFrog Sunblock, Colorado Time Systems,Endless Pools, FINIS, FitMagnet, Fitness Nutrition, Hammer Nutrition, Kast-A-WaySwimwear, Liberty Mutual, Nike, Speedo, SwimOutlet.com, Tyr Sports, and Ultra Swim
USA Diving• AT&T, Colorado Time Systems, Hilton Hhonors, Li-Ning, Ludus Tours, Sport
Graphics, and St. Vincent Sports Performance
USA Swimming• AT&T, BMW, CeraVe, ConocoPhillips, Marriott, Mutual of Omaha, Myrtha Pools,
Omega, Speedo, and VISA
USA Synchro• Clark Synthesis Tactile Sound, Colorado Time Systems, E-Synchro, Sports
Graphics, and United Airlines
USA Water Polo• AQUAhydrate, Big Fish Payroll Services, Clubspaces, Colorado Time Systems,
SPORTS MARKETING 2020-2021
• 564 •

Kaenon Polarized, Kitasa, KT Tape, Sea Air Federal Credit Union, S&R Sport,United Airlines, and Vistaprint
137.4 International Swimming LeagueThe International Swimming League (ISL; https://isl.global/) is scheduled to
debut in October 2019 as the f irst professional sports league for elite swimming. ISLwill host a series of U.S. and European-based competitions that culminate in a globalchampionship at the Mandalay Bay Events Center in Las Vegas.
ISL was founded by Ukrainian financier Konstantin Grigorishin. Mixed genderteams will compete for points in fast-paced races – including sprint, relay and skin.
ISL has four U.S.-based teams, as follows:• Cali Condors• DC Trident• Los Angeles Current• New York Breakers
137.5 Market ResourcesFédération Internationale de Natation (FINA), Avenue de l’Avant-Poste 4, CH - 1005Lausanne, Switzerland. Tel. +41 21 310 4710. (www.fina.org)
International Swimming League, Alfred-Escher-Strasse 17, 8002 Zurich, Switzerland.(https://isl.global/)
U.S. Masters Swimming, 655 North Tamiami Trail, Sarasota, FL 34236. (800) 550-7946. (www.usms.org)
United States Synchronized Swimming, 132 E. Washington Street, Suite 820,Indianapolis, IN 46204. (317) 237-5700. (www.usasynchro.org)
USA Aquatic Sports, One Olympic Plaza, Colorado Springs, CO 80909. (719) 866-4578. (www.usaaquaticsports.org)
USA Diving, 132 East Washington Street, Suite 850, Indianapolis, IN 46204. (317) 237-5252. (www.usadiving.org)
USA Swimming, One Olympic Plaza, Colorado Springs, CO 80909. (719) 866-4578. (www.usaswimming.org)
USA Water Polo, 2124 Main Street, Suite 240, Huntington Beach, CA 92648. (714) 500-5445. (www.usawaterpolo.org)
SPORTS MARKETING 2020-2021
• 565 •

138
TRACK & FIELD
138.1 OverviewThere are more than 30 million adult runners in the United States. This figure
includes those who run for recreation and fitness as well as those who compete inevents.
According to 2018 SFIA Participation Topline Report, published by the Sports &Fitness Industry Association (SFIA, www.sfia.org), 4.2 million people in the U.S.participate in track & field activities at least once each year; 2.1 million participate atleast twice per month.
According to the National Federation of State High School Associations(www.nfhs.org), 600,097 boys and 488,592 girls competed in track & field during the2017-2018 school year.
Track & field is recognized as an official sport for both men and women by theNational College Athletic Association (NCAA, www.ncaa.org).
Among television broadcasts of Summer Olympic events, track & field has thehighest viewership.
138.2 Sanctioning OrganizationUSA Track & Field (USATF, www.usatf.org) is the governing body for track and
field, long-distance running, and race walking in the United States.USATF has approximately 100,000 members. Member organizations include the
U.S. Olympic Committee (www.teamusa.org), NCAA, National Association ofIntercollegiate Athletics (www.naia.org), NFSHSA, Road Runners Club of America(www.rrca.org), and Running USA (www.runningusa.org).
Fifty-seven USATF-affiliated associations oversee the sport and its 2,500 clubsat the local level.
138.3 Major EventsUSATF sponsors a U.S. team (i.e., Team USA) in several events each year.
The 2019 Team USA Events were as follows:USATF Championship Series• January 26: New Balance Indoor Grand Prix (Boston, MA)• January 26: Dr. Norb Sander Invitational (New York, NY)
SPORTS MARKETING 2020-2021
• 566 •

• February 9: NYRR Millrose Games (New York, NY)• February 22-24: USATF Indoor Championships (New York, NY)• April 26-27: Penn Relays (Philadelphia, PA)• April 27: Drake Relays (Des Moines, IA)• May 16: USATF Distance Classic (Pasadena, CA)• June 16: adidas Boost Boston Games (Boston, MA)• June 30: Nike Prefontaine Classic (Eugene, OR)• July 25-28: USATF Outdoor Championships (Des Moines, IA)
2019 Team USA Events• January 12: Great Stirling Cross Country• February 16: NACAC Cross Country Championships• March 24-30: 2019 WMA Indoor Championships• March 30: 2019 IAAF World Cross Country Championships• Apr. 20-21: Pan American Race Walk Cup• June 8: Trail World Championships• July 14: NACAC Mountain Running Championships• July 26 - August 11: Pan American Games• September 1: IAU 50km World Championships• September 27 - October 6: IAAF World Championships in Athletics• November 15: 35th World Mountain Running Championships• November 16: WMRA Long Distance Mountain Running
Championships
2019 National Championships• January 26: USATF 50 km Race Walk Championships• February 2: USATF Cross Country Championships• February 15: USATF 100 Mile Road Championships• February 16: USATF 50 km Trail Championships• February 22-24: Toyota USATF Indoor Championships• March 1-3: USATF Masters Indoor Track and Field
Championships• March 9: USATF 15 km Championships• March 15-17: USATF Hershey Youth Indoor Championships• March 16: USATF Masters 8 km Championships• March 17: USATF 20 km Race Walk Championships &
Pan Am RW Cup Trials• April 23: USATF 1 Mile Championships• April 28: USATF Masters 10 km Championships• May 5: USATF Half Marathon Championships• May 11: USATF 25 km Championships• June 8: USATF Women's 10 km Championship• June 9: USATF Half Marathon Trail Championships• June 21-23: USATF U20 Outdoor Championships
SPORTS MARKETING 2020-2021
• 567 •

• June 25-30: 2019 USATF Youth Outdoor National Championship• July 11-14: USATF Masters Outdoor Championships• July 25-28: Toyota USATF Outdoor Championships• August 17: USATF Masters 5 km Championships• August 23: USATF Masters 1 Mile Championship• September 2: USATF 20 km Championships• October 6: USATF 10 Mile Championships• October 26: USATF Masters 15 km Championships• November 2: USATF 5 km Championships• December 7: USATF 100 Mile Trail Championships
USA Track & Field sponsors for 2019 were Chobani, Garden of Life, Hershey,Nike, and University of Phoenix.
138.4 IAAF Diamond LeagueLaunched in 2010, IAAF Diamond League (www.diamondleague.com),
sanctioned by the International Association of Athletics Federations, is an annualinternational series of track and field meetings.
There are 14 meetings each year, with one held in the United States. In 2019,the Prefontaine Classic was held at Hayward Field (Eugene, Washington), June 30.
138.5 TrackTown USATrackTown USA (www.gotracktownusa.com), a non-profit organization, hosts
track & field events with the goal of inspiring the next generation of track and fieldathletes and fans. The organization is responsible for organizing the 2019 IAAF WorldJunior Championships, the 2019 USA Track & Field Outdoor Championships, the 2019IAAF World Indoor Championships in Portland, the 2020 U.S. Olympic Track & FieldTeam Trials, and the 2021 IAAF World Track & Field Championships.
TrackTown sponsors are Beynon, Nike, Oakley, Oregon Track Club, PeaceHealth, and U.S. Army.
138.6 Market ResourcesTracktown USA, 2350 Oakmont Way, Suite 201, Eugene, OR 97401. (541) 343-6129.(www.gotracktownusa.com)
USA Track & Field, 132 East Washington Street, Suite 800, Indianapolis, IN 46204. (317) 261-0500. (www.usatf.org)
SPORTS MARKETING 2020-2021
• 568 •

139
TRIATHLONS
139.1 OverviewA triathlon is a racing event consisting of swimming, cycling, and running
components over various distances. Triathlon has grown significantly in recent yearsand now includes thousands of races with hundreds of thousands of competitorsworldwide.
In 2019, USA Triathlon (www.usatriathlon.org) had more than 800 local clubswith 400,000 members.
USA Triathlon Partners for 2019 were 2XU, Active Network, After Shokz, AshfordAwards, Boca Gear, Body Glide, Gatorade Endurance, Hand & Stone Massage andFacial Spa, Health IQ, KT Tape, Nationwide, Normatec, Pilates For Sports, QuintanaRoo, Roka, Rudy Project, Science In Sport, TechnoGyn, Thorne, Toyota, TrainingPeaks, and Wahoo.
An estimated 2.5 million people complete a triathlon each year. USA Triathlonsanctioned 4,300 races in 2019.
139.2 DemographicsAccording to USA Triathlon, the average triathlete is a married 38-year-old with
an income of $126,000. Forty-four percent (44%) have children living at home; 60%are male.
The 60,000 subscribers of Triathlete magazine have a median income of$122,600; 93.4% earn more than $100,000.
The sport attracts a disproportionate share of entrepreneurs, executives,physicians, and attorneys, many with a willingness to spend thousands of dollarsannually on entry fees, travel, and top-of-the-line equipment and training. Averageincome among athletes competing in the 22 official Ironman events: nearly $160,000.
_________________________________________________________________
“The demographics are intriguing. Factor in theexplosive growth the sport is seeing, and it’senough to make any marketer look twice.”
Advertising Age _________________________________________________________________
SPORTS MARKETING 2020-2021
• 569 •

139.3 Major EventsThe following are the major annual triathlon events:
Escape From Alcatraz• Escape from Alcatraz (www.escapealcatraztri.com) is a non-standard-length race
that begins with a 1.5 mile swim in frigid San Francisco Bay waters from AlcatrazIsland to shore, followed by an 18-mile bicycle and eight-mile run in the extremelyhilly terrain of the San Francisco Bay area. The run includes the notorious SandLadder – a 400-step staircase climb up a beachside cliff. The 37th Escape fromAlcatraz Triathlon was held June 10, 2019.
• Sponsors for 2019 were Actelion, AfterShokz, Echo-Sigma, FinisherPix, HornblowerCruises & Events, Rudy Project, San Francisco Chronicle, Science In Sport, SFGate, Sports Basement, Tervis, Tribike Transport, U.S. Air Force Special Ops, andWhite Claw Hard Seltzer.
Iron Girl• Launched in 2004, Iron Girl (www.irongirl.com) now hosts three events nationwide,
varying in distance from 5K, 10K, ½ marathon, and triathlon. The following are 2019events:- March 31: Clearwater Half Marathon & 5K (Clearwater, FL)- August 11: Pleasant Prairie Sprint Triathlon (Pleasant Prairie, WI)- August 11: Grimsby, Canada Sprint Triathlon (Grimsby, ON)
• Iron Girl Event Series Partner for 2019 was FinisherPix.
Ironman• The World Triathlon Corporation (www.ironman.com) sanctions and organizes a
series of Ironman and Ironman 70.3 distance races each year. These races serveas qualifying events for the World Championship, held annually in Kailua-Kona,Hawaii (October), and the Ironman World Championship 70.3 in Clearwater, Florida(November).
• Sales of licensed Ironman products are $500 million annually, according toSportsBusiness Journal.
Life Time Fitness Triathlon• The Life Time Fitness Triathlon (www.lifetimetri.com) hosts the Life Time Tri Series,
which in 2019 consisted of seven events, as follows:- April 14: Miami Beach, FL- May 27: Austin, TX- July 13: Minneapolis, MN- July 21: New York, NY- August 24: Chicago, IL- September 15: Tempe, AZ- September 22: Miami, FL
SPORTS MARKETING 2020-2021
• 570 •
St. Anthony’s Triathlon• St. Anthony’s Triathlon (https://satriathlon.com) attracts more than 4,000
competitors and is viewed by many as the kickoff to the triathlon season. The April 26-28, 2019, event was the 36th annual. St. Anthony’s Triathlon, held in
St. Petersburg, Florida, is sponsored by BayCare Health System.
Major international triathlon events that draw athletes from the U.S. include theNorseman Xtreme Triathlon (www.nxtri.com), the Michelob ULTRA London Triathlon(www.londontriathlon.com), and the Ironman France (http://eu.ironman.com).
139.4 Market ResourcesLife Time Fitness Triathlon, 2902 Corporate Place, Chanhassen, MN 55317.(952) 947-0000. (www.lifetimetri.com)
USA Triathlon, 5825 Delmonico Drive, Suite 200, Colorado Springs, CO 80919.(719) 597-9090. (www.usatriathlon.org)
World Triathlon Corporation, 2701 North Rocky Point Drive, Suite 1250, Tampa, FL33607. (813) 868-5940. (www.ironman.com)
SPORTS MARKETING 2020-2021
• 571 •

140
ULTIMATE
140.1 ParticipationUltimate Frisbee, commonly called Ultimate, is a rapidly growing non-contact
sport played with a flying disc. The object of the game is to score points by passing thedisc to a player in the opposing end-zone, similar to an end-zone in American football orrugby.
According to the 2018 SFIA Participation Topline Report, by the Sports & FitnessIndustry Association (SFIA, www.sfia.org), 3.1 million people play Ultimate; 850,000 doso 13 or more times a year. These figures were 5.1 million and 1.5 million, respectively,five years prior.
Ultimate is hugely popular in the Pacific Northwest region, and co-ed leaguesoffer games for players of every level. The Potlatch Tournament, held annually in July,attracts the West Coast’s best players.
140.2 USA UltimateUSA Ultimate (www.usaultimate.org) is the national governing body for the sport
of Ultimate. Ultimate membership was 62,000 in 2018, up 55% from five years prior. USA Ultimate has established regional- and state-based organizations in
California, Illinois, Minnesota, New England, and North Carolina.USA Ultimate owns and operates 14 championship events annually, attracting
teams in collegiate, youth, and adult club divisions. Six of the events attract more than1,000 competitors.
_________________________________________________________________
“As in most sports, Ultimate events with largeyouth fields are attractive to communitiesbecause they bring families that fill additionalhotel rooms.”
SportsBusiness Journal _________________________________________________________________
SPORTS MARKETING 2020-2021
• 572 •

140.3 Collegiate TeamsAccording to USA Ultimate, there are over 800 college teams in North America,
separated into Men’s (nearly 550 teams) and Women’s (around 250 teams) Divisions. Approximately 18,000 students compete for the teams. Teams compete in the UFAChampionship series during the spring, with winners advancing to nationals to competefor the championship title in May.
The 2018 USA Ultimate college championships, held in Cincinnati, Ohio,generated 12,000 room nights and $4 million in Economic Impact.
The Division-I Men’s and Women’s College Championships were held inMilwaukee, Wisconsin, May 25-28.
140.4 Market ResourcesUSA Ultimate, 5825 Delmonico Drive, Suite 350, Colorado Springs, CO 80919.(800) 872.4384. (www.usaultimate.org)
SPORTS MARKETING 2020-2021
• 573 •

141
VOLLEYBALL
141.1 OverviewAccording to 2018 SFIA Participation Topline Report, published by the Sports &
Fitness Industry Association (SFIA, www.sfia.org), participation in volleyball is asfollows:
One or more times 13 or more times
• Court Volleyball: 6.3 million 3.4 million• Beach Volleyball: 4.9 million 1.4 million• Grass Volleyball: 3.9 million 947,000
According to the National Federation of State High School Associations(www.nfhs.org), 446,583 girls and 60,976 boys participated in volleyball competitionduring the 2017-2018 academic year.
Volleyball is recognized as an official sport for both men and women by theNational Collegiate Athletic Association (NCAA, www.ncaa.org).
Volleyball is a sport of the Summer Olympic Games.
141.2 Sanctioning OrganizationUSA Volleyball (USAV, www.teamusa.org/usa-volleyball.aspx) is the national
governing body for the sport of volleyball in the United States and is recognized as suchby the Federation International de Volleyball (FIVB, www.fivb.org) and the United StatesOlympic Committee (USOC).
USAV-affiliated organizations are American Latvian Association(www.alausa.org), California Beach Volleyball Association (www.cbva.com), DisabledSports USA (www.dsusa.org), Girl Scouts of America (www.girlscouts.org), JewishCommunity Centers (www.jcca.org), Maccabi USA Sports for Israel(www.maccabiusa.com), National Congress of State Games (www.stategames.org),National Recreation & Parks Association (www.npra.org), People to People SportsAmbassadors (www.peopletopeople.com/ourprograms/sport/pages/default.aspx),Positive Coaching Alliance (www.positivecoach.org), the President’s Council onPhysical Fitness and Sports (www.fitness.gov), Professional Association of VolleyballOfficials (www.pavo.org), Starlings Volleyball Clubs USA (www.starlings.org), UnitedStates Wallyball Association (www.uswalleyball.org), US Specialty Sports(www.usssa.com), US Youth Volleyball League (www.ysyvl.org), USA Deaf SportsFederation (www.usdeafsports.org), and the Volleyball Hall of Fame(www.volleyhall.org).
SPORTS MARKETING 2020-2021
• 574 •

141.3 AVP Pro Beach VolleyballAVP Pro Beach Volleyball (www.avp.com), organized in 2001, ceased operations
in 2010. Over one million people attended an AVP event as recently as 2008 and thecircuit reported annual revenue of $25 million.
In 2011, AVP announced a reorganization and events were again hostedbeginning in 2012.
The 2019 tour schedule included eight events, as follows:• May 3-5: Huntington Beach Open (Huntington Beach, CA)• May 17-19: Austin Open (Austin, TX)• June 7-9: Gold Series New York City Open (New York, NY)• June 21-23: Seattle Open (Seattle, WA)• July 26-28: Hermosa Beach Open (Hermosa Beach, CA)• August 16-18: Gold Series Manhattan Beach Open (Manhattan
Beach, CA)• August 30-September 1: Gold Series Championships (Chicago, IL)• September 20-22: Hawaii Open (Waikiki, Hawaii)
141.4 P1440 SeriesThe p1440 volleyball tournaments (www.p1400.com), founded by three-time
Olympic gold medalist Kerri Walsh Jennings, launched in 2018 with events inHuntington Beach, Las Vegas, and San Jose.
The p1440 events had a prize purse of $900,000 for its 2018 events.
_________________________________________________________________
“P1440 goes to market with a key distinguishingfactor compared to the AVP: It chargesadmission, $40 per day and $80 for the three-day event. That price includes concerts, fitnesstalks, yoga and meditation sessions, cookingdemonstrations, and other experiences.”
SportsBusiness Journal, 9/24/18 _________________________________________________________________
141.5 Market ResourcesAVP Pro Beach Volleyball, 560 Newport Circle, Corona CA 92881. (949) 679-3599. (www.avp.com)
SPORTS MARKETING 2020-2021
• 575 •

USA Volleyball, 4065 Sinton Road, Suite 200, Colorado Springs, CO 80907. (719) 228-6800. (www.teamusa.org/USA-Volleyball.aspx)
SPORTS MARKETING 2020-2021
• 576 •

142
X GAMES
142.1 OverviewThe X Games (http://xgames.espn.go.com/), owned by Walt Disney Company
and managed by ESPN, includes the Summer X Games (held in June or July) andWinter X Games (held in January or February).
Summer X Games were inaugurated in 1995. Competitions include five sports:freestyle BMX (three events), MotoX (six events), skateboard (six events), surfing (twoevents), and rallying.
Winter X Games launched in 1997. There are day and evening events includingskiing, snowboarding, and snowmobiling.
Summer and Winter X Games combine concerts and other entertainment withthe competitions.
142.2 Summer X GamesAttendance at Summer X Games has been as follows:
• 1995: Newport/Providence, RI 198,000• 1996: Newport/Providence, RI 201,000• 1997: San Diego, CA 177,500• 1998: San Diego, CA 231,450• 1999: San Francisco, CA 222,886• 2000: San Francisco, CA 179,132• 2001: Philadelphia, PA 235,550• 2002: Philadelphia, PA 221,652• 2003: Los Angeles, CA 186,641• 2004: Los Angeles, CA 170,471• 2005: Los Angeles, CA 122,614• 2006: Los Angeles, CA 138,672• 2007: Los Angeles, CA 122,402• 2008: Los Angeles, CA 109,725• 2009: Los Angeles, CA 111,200• 2010: Los Angeles, CA 138,525• 2011: Los Angeles, CA 141,500• 2012: Los Angeles, CA 144,700• 2013: Los Angeles, CA 92,000
SPORTS MARKETING 2020-2021
• 577 •

• 2014: Austin, TX 160,000• 2015: Austin, TX 138,780• 2016: Austin, TX 100,000• 2017: Minneapolis, MN 105,000• 2018: Minneapolis, MN 119,000
142.3 Winter X GamesAttendance at Winter X Games has been as follows:
• 1997: Big Bear Lake, CA 29,800• 1998: Crested Butte, CO 25,500• 1999: Crested Butte, CO 23,500• 2000: Mount Snow, VT 83,500• 2001: Mount Snow, VT 85,000• 2002: Aspen, CO 36,300• 2003: Aspen, CO 48,700• 2004: Aspen, CO 66,500• 2005: Aspen, CO 66,750• 2006: Aspen, CO 69,650• 2007: Aspen, CO 76,150• 2008: Aspen, CO 72,500• 2009: Aspen, CO 68,100• 2010: Aspen, CO 81,400• 2011: Aspen, CO 114,200• 2012: Aspen, CO 108,000• 2013: Aspen, CO 114,500• 2014: Aspen, CO 116,600• 2015: Aspen, CO 115,500• 2016: Aspen, CO 102,600• 2017: Aspen, CO 109,000• 2018: Aspen, CO 115,000
142.4 Television ViewershipSummer X Games 2018 viewership across ESPN, ESPN2 and ABC was 530
million, 38% year-over-year (YOY) for all telecasts. Winter X Games 2018 viewership across ESPN, ESPN2 and ABC was 990
million, 10% YOY for all telecasts.
142.5 Digital MediaThe following is a summary of the digital and social media following (source:
ESPN):
SPORTS MARKETING 2020-2021
• 578 •

Summer X Games 2018• The X Games’ YouTube channel had more than 26 million minutes streamed, up
646% year-over-year, with the average watch time reaching more than 11 minutes• The total number of video views on X Games’ YouTube channel topped 2.3 million• The X Games Facebook page reached more than 9 million fans, up 120% YOY.
Those fans logged 4 million video views, up 210% YOY.• On Instagram, the X Games page reached more than 1.6 million people, with 8.5
million video views, up 225% YOY.• X Games social media accounts gained over 50,000 new followers during the week
of the event.
Winter X Games 2018• The number of minutes streamed on X Games’ YouTube channel nearly tripled in
2018, with 11.5 million minutes streamed, up 185% YOY.• The total number of video views on X Games’ YouTube channel was 2.0 million, up
183% YOY.• Streaming of X Games Aspen content provided a 9.5% lift for the 18-to-34 TV
audience.• During the event period, there were nearly 12,000 X Games-related social media
posts, generating 53.8 million total interactions; nearly one of every four interactionswas driven by an athlete’s social media content.
• Across X Games Facebook, Twitter and Instagram, video engagement hit 10.6million video views, with Instagram driving 92% of total actions.
142.6 SponsorsSponsors for Summer X Games 2019 were Explore Minnesota, Fruit of the
Loom, GEICO, Go RVing, Harley-Davidson, Hotels.com, LifeProof, Monster Energy,Nexcare, Pacifico, SoFi, The Real Cost, and Toyota.
Sponsors for Winter X Games 2019 were GEICO, Great Clips, Harley-Davidson,Jeep, Monster Energy, Nobis, Pacifico, Polaris, SoFi, The Real Cost, Timbersled, andWendy’s.
SPORTS MARKETING 2020-2021
• 579 •

APPENDIX A
ACADEMIC CENTERS
Center for Sport and the LawUniversity of Baltimore, School of Law, 1420 N. Charles Street, Baltimore, MD 21201.(https://law.ubalt.edu/centers/csl/)
Center for Sport LeadershipVirginia Commonwealth University, 1300 West Broad Street, P.O. Box 842003,Richmond, VA 23284. (www.sportleadership.vcu.edu/contact/index.html)
Center for Sport ManagementGeorge Mason University, 4400 University Drive, Bull Run Hall Room 218, Fairfax, VA22030. (http://csm.gmu.edu/)
Center for Sports AdministrationOhio University, College of Business, Department of Sports Administration, CSC 001I,Athens, OH 45701. (www.sportsad.ohio.edu/home/)
Center for Sports Business & ResearchThe Pennsylvania State University, Smeal College of Business, 433 Business Building,University Park, PA 16802. (www.smeal.psu.edu/csbr/)
Center for Sports Law & PolicyDuke University, School of Law, 210 Science Drive, P.O. Box 90362, Durham, NC27708. (https://law.duke.edu/sportscenter/)
Shirley Povich Center for Sports JournalismUniversity of Maryland, 1100 Knight Hall, College Park, MD 20742. (www.povichcenter.com)
Sports Business InstituteUniversity of Southern California, Marshall School of Business, 3660 TrousdaleParkway, Los Angeles, CA 90089. (www.marshall.usc.edu/faculty/centers/sbi)
Sports Industry Research CenterTemple University, School of Tourism & Hospitality Management, 1810 N. 13th Street,Speakman Hall 111 (006-68), Philadelphia, PA 19122. (http://sthm.temple.edu/sirc/)
SPORTS MARKETING 2020-2021
• 580 •

Warsaw Sports Marketing CenterUniversity of Oregon, Lundquist College of Business, 1208 University of Oregon,Eugene, OR 97403. (http://business.uoregon.edu/centers/warsaw)
SPORTS MARKETING 2020-2021
• 581 •

APPENDIX B
ANALYSTS
H2R Market Research, 4650 S. National Avenue, Springfield, MI 65810. (417) 877-7808. (www.h2rmarketresearch.com)
Hookit, 3398 Carmel Mountain Road, Suite 100, San Diego, CA 92121. (888) 874-3375. (www.hookit.com)
IEG, 350 North Orleans Street, Suite 1200, Chicago, IL 60654. (312) 944-1727. (www.sponsorship.com)
Kantar Media, 11 Madison Avenue, 12th Floor, New York, NY 10010. (212) 991-6000. (www.kantarmedia.com)
Plunkett Research, P.O. Drawer 541737, Houston, TX 77254. (713) 932-0000. (www.plunkettresearch.com)
Richard K. Miller & Associates, 2413 Main Street, Suite 331, Miramar, FL 33025. (888) 928-7562. (www.rkma.com)
Simmons Research, 800 Fairway Drive, Suite 295, Deerfield Beach, FL 33441. (866) 256-4468. (www.simmonsresearch.com)
The Harris Poll, 1100 Wilson Boulevard, Suite 1000, Arlington, VA 22209.(www.theharrispoll.com)
The Marketing Arm, 1999 Bryan Street, 32nd Floor, Dallas, TX 75201. (214)259-3200.(www.themarketingarm.com)
The Media Audit, 1400 Broadfield Boulevard, Suite 200, Houston, TX 77084. (713) 626-0333. (www.themediaaudit.com)
The Nielsen Company, 770 Broadway, New York, NY 10003. (646) 654-8300. (www.nielsen.com)
The NPD Group, 900 West Shore Road, Port Washington, NY 11050. (516) 625-0700. (www.npd.com)
SPORTS MARKETING 2020-2021
• 582 •

Turnkey Sports & Entertainment, 9 Tanner Street, Suite 8, Haddonfield, NJ 08033. (856) 685-1450. (www.turnkeysports.com)
SPORTS MARKETING 2020-2021
• 583 •

APPENDIX C
ASSOCIATIONS
International Health, Racquet & Sportsclub Association (IHRSA), 70 Fargo Street,Boston, MA 02210. (800) 228-4772. (www.ihrsa.org)
National Association of Sports Commissions, 9916 Carver Road, Suite 100, Cincinnati,OH 45242. (513) 281-3888. (www.sportscommissions.org)
National Sporting Goods Association, 1601 Feehanville Drive, Suite 300, Mt. Prospect,IL 60056. (847) 296-6742. (www.nsga.org)
North American Society for Sport Management, 120 Sycamore Avenue, Suite 23,Vermillion, SD 57069. (724) 991-7518. (www.nassm.com)
Sports & Fitness Industry Association (SFIA), 962 Wayne Avenue, Suite 300,Silver Spring, MD 20910. (301) 495-6321. (www.sfia.org)
SPORTS MARKETING 2020-2021
• 584 •

APPENDIX D
COLLEGE DEGREE PROGRAMS IN SPORTS BUSINESS
Adelphia University (New York)Alabama A&M University (Alabama)Alvernia University (Pennsylvania)American International College (Massachusetts)American Public University (West Virginia)Anna Maria College (Massachusetts)Aquinas College (Michigan)Arizona State University (Arizona)Arkansas State University (Arkansas)Ashland University (Ohio)Auburn University (Alabama)Averett University (Virginia)Baker University (Kansas)Baldwin-Wallace College (Ohio)Ball State University (Indiana)Barry University (Florida)Barton College (North Carolina)Baylor University (Texas)Belmont Abbey College (North Carolina)Belmont University (Tennessee)Bemidji State University (Minnesota)Bethany College (Kansas)Blackburn College (Illinois)Bluefield College (Virginia)Bowling Green State University (Ohio)California Baptist University (California)California State University, Bakersfield (California)California State University, Long Beach (California)California University of Pennsylvania (Pennsylvania)Campbell University (North Carolina)Canisius College (New York)Cardinal Stritch University (Wisconsin)Carson-Newman University (Tennessee)Castleton State College (Vermont)Cazenovia College (New York)
SPORTS MARKETING 2020-2021
• 585 •

Cedarville University (Ohio)Centenary University (New Jersey)Central Michigan University (Michigan)Chowan University (North Carolina)Claflin University (South Carolina)Clark University (Iowa)Clemson University (South Carolina)Cleveland State University (Ohio)Coastal Carolina University (South Carolina)Colby-Sawyer College (New Hampshire)College of Idaho (Idaho)College of Mouth St. Joseph (Ohio)College of Saint Rose (New York)Columbia College Chicago (Illinois)Columbia International University (South Carolina)Columbia University (New York)Concordia University (Minnesota)Concordia University Chicago (Illinois)Coppin State University (Maryland)Daemen College (New York)Dakota Wesleyan University (South Dakota)Daniel Webster College (New Hampshire)Davenport University (Michigan)Dean College (Massachusetts)Defiance College (Ohio)Delaware State University (Delaware)Delaware Valley College (Pennsylvania)DePaul University (Illinois)Desales University (Pennsylvania)Drexel University (Pennsylvania)Duquesne University (Pennsylvania)East Carolina University (North Carolina)East Central University (Oklahoma)East Stroudsburg University (Pennsylvania)East Tennessee State University (Tennessee)Eastern Connecticut State University (Connecticut)Eastern Illinois University (Illinois)Eastern Kentucky University (Kentucky)Eastern Michigan University (Michigan)Eastern New Mexico University (New Mexico)Elms College (Massachusetts)Elon University (North Carolina)Endicott College (Massachusetts)Erskine College (South Carolina)
SPORTS MARKETING 2020-2021
• 586 •

Fairleigh-Dickinson University (New Jersey)Farmingdale State College (New York)Flagler College (Florida)Florida Atlantic University (Florida)Florida A&M University (Florida)Florida Southern College (Florida)Florida State University (Florida)Fordham University (New York)Franklin Pierce University (New Hampshire)Fresno State University (California)Full Sail University (Florida)Gannon University (Pennsylvania)Gardner-Webb University (North Carolina)George Mason University (Virginia)George Washington University (District of Columbia)Georgetown University (District of Columbia)Georgia Southern University (Georgia)Georgia State University (Georgia)Glenville State College (West Virginia)Gonzaga University (Washington)Grambling State University (Louisiana)Grand Canyon University (Arizona)Grand View University (Iowa)Greensboro College (North Carolina)Guilford University (North Carolina)Hampton University (Virginia)Henderson State University (Arkansas)High Point University (North Carolina)Hofstra University (New York)Holy Family University (Pennsylvania)Howard University (District of Columbia)Howard Payne University (Texas)Idaho State University (Idaho)Illinois State University (Illinois)Indiana State University (Indiana)Indiana University (Indiana)Indiana University-Purdue University Indianapolis (Indiana)Indiana University of Pennsylvania (Pennsylvania)Indiana Wesleyan University (Indiana)Iona College (New York)Iowa Wesleyan College (Iowa)Ithaca College (New York)Jacksonville University (Florida)James Madison University (Virginia)
SPORTS MARKETING 2020-2021
• 587 •

Johnson & Wales University Charlotte (North Carolina)Johnson & Wales University Denver (Colorado)Johnson and Wales University North Miami (Florida)Johnson & Wales University Providence (Rhode Island)Judson University (Illinois)Keiser University (Florida)Kennesaw State University (Georgia)Kent State University (Ohio)Kentucky Wesleyan College (Kentucky)Keuka College (New York)Keystone College (Pennsylvania)Kutztown University (Pennsylvania)Lancaster Bible College (Pennsylvania)Lassell College (Massachusetts)Lees-McCrae College (North Carolina)Lenoir-Rhyne University (North Carolina)Lewis University (Illinois)Liberty University (Virginia)Limestone College (South Carolina)Lincoln College - Normal (Illinois)Livingstone College (North Carolina)Lock Haven University (Pennsylvania)Long Island University (New York)Loras College (Iowa)Louisiana State University (Louisiana)Loyola University Chicago (Illinois)Lubbock Christian University (Texas)Luther College (Iowa)Lynchburg College (Virginia)Lynn University (Florida)Malone University (Ohio)Manhattanville College (New York)Marian University (Wisconsin)Marquette University Law School (Wisconsin)Marshall University (West Virginia)Martin Methodist College (Tennessee)Maryville University (Missouri)Massachusetts College of Liberal Arts (Massachusetts)Medialle College (New York)Menlo College (California)Meredith College (North Carolina)Merrimack College (Massachusetts)Mesa State College (Colorado)Messiah College (Pennsylvania)
SPORTS MARKETING 2020-2021
• 588 •

Methodist University (North Carolina)Metropolitan State University of Denver (Colorado)Michigan State University (Michigan)MidAmerica Nazarene University (Kansas)Middle Tennessee State University (Tennessee)Millikin University (Illinois)Minnesota State University Mankato (Minnesota)Misericordia University (Pennsylvania)Mississippi State University (Mississippi)Missouri Baptist University (Missouri)Missouri State University (Missouri)Mitchell College (Colorado Connecticut)Montana State University Billings (Montana)Morehead State University (Kentucky)Mount Ida College (Massachusetts)Mount St. Mary’s University (Maryland)Nebraska Wesleyan University (Nebraska)Neumann University (Pennsylvania)New England College (New Hampshire)New Hampshire Technical Institute (New Hampshire)New York University (New York)Newberry College (South Carolina)Niagara University (New York)Nichols College (Massachusetts)North Carolina State University (North Carolina)North Central College (Illinois)North Dakota State University (North Dakota)North Greenville College (South Carolina)Northern Illinois University (Illinois)Northern Kentucky University (Kentucky)Northwestern State University (Louisiana)Northwestern University (Illinois)Northwood University (Florida)Northwood University (Michigan)Nova Southern University (Florida)Ohio Dominican University (Ohio)Ohio State University (Ohio)Ohio University (Ohio)Old Dominion University (Virginia)Olivet College (Michigan)Olivet Nazarene University (Illinois)Otternein College (Ohio)Pennsylvania State University (Pennsylvania)Pfeiffer University (North Carolina)
SPORTS MARKETING 2020-2021
• 589 •

Point Loma Nazarene University (California)Point Park University (Pennsylvania)Post University (Connecticut)Quincy University (Illinois)Radford University (Virginia)Rice University (Texas)Robert Morris University (Pennsylvania)Rockhurst University (Missouri)Rogers State University (Oklahoma)Rutgers University (New Jersey)Sacred Heart University (Connecticut)Saint Joseph’s University (Pennsylvania)Saint Leo University (Florida)Saint Mary’s College of California (California)Salem International University (West Virginia)Salem State University (Massachusetts)Sam Houston State University (Texas)Samford University (Alabama)San Diego State University (California)San Jose State University (California)Schreiner University (Texas)Seattle University (Washington)Seton Hall University (New Jersey)Shawnee State University (Ohio)Shenandoah University (Virginia)Shepherd University (West Virginia)Siena Heights University (Michigan)Simpson College (Iowa)Slippery Rock University (Pennsylvania)Southeast Missouri State University (Missouri)Southeastern University (Florida)Southern Adventist University (Tennessee)Southern Connecticut State University (Connecticut)Southern Illinois University (Illinois)Southern Methodist University (Texas)Southern Nazarene University (Oklahoma)Southern New Hampshire University (New Hampshire)Southern Wesleyan University (South Carolina)Southwest College (Kansas)Southwestern Oklahoma State University (Oklahoma)Springfield College (Massachusetts)St. Ambrose University (Iowa)St. John Fisher College (New York)St. John’s University (New York)
SPORTS MARKETING 2020-2021
• 590 •

St. Thomas University (Florida)State University of New York, Brockport (New York)State University of New York, Cortland (New York)State University of New York, Sullivan (New York)Stephen F. Austin State University (Texas)Stetson University (Florida)Syracuse University (New York)Tabor College (Kansas)Taylor University (Indiana)Temple University (Pennsylvania)Texas A&M University (Texas)Texas A&M University Corpus Christi (Texas)Texas Southern University (Texas)Texas Tech University (Texas)Texas Women’s University (Texas)The Citadel (South Carolina)Thomas College (Maine)Tiffin University (Ohio)Tompkins Cortland Community College (New York)Towson University (Maryland)Trine University (Indiana)Troy University (Alabama)Tulane University (Louisiana)Tusculum College (Tennessee)Union College (Kentucky)Union University (Tennessee)United States Sports Academy (Alabama)University of Akron (Ohio)University of Alabama (Alabama)University of Arizona (Arizona)University of Arkansas (Arkansas)University of Arkansas, Little Rock (Arkansas)University of California, Los Angeles (California)University of California, Riverside (California)University of Central Florida (Florida)University of Central Missouri (Missouri)University of Charleston (West Virginia)University of Cincinnati (Ohio)University of Colorado, Colorado Springs (Colorado)University of Colorado, Denver (Colorado)University of Connecticut (Connecticut)University of Dallas (Texas)University of Dayton (Ohio)University of Delaware (Delaware)
SPORTS MARKETING 2020-2021
• 591 •
University of Evansville (Indiana)University of Findlay (Ohio)University of Florida (Florida)University of Georgia (Georgia)University of Houston (Texas)University of Illinois (Illinois)University of Indianapolis (Indiana)University of Iowa (Iowa)University of Kansas (Kansas)University of Kentucky (Kentucky)University of Louisiana Lafayette (Louisiana)University of Louisville (Kentucky)University of Mary Hardin-Baylor (Texas)University of Massachusetts (Massachusetts)University of Memphis (Tennessee)University of Miami (Florida)University of Michigan (Michigan)University of Minnesota (Minnesota)University of Minnesota Crookston (Minnesota)University of Missouri (Missouri)University of Mount Union (Ohio)University of Nebraska Kearney (Nebraska)University of Nebraska - Lincoln (Nebraska)University of New England (Maine)University of New Hampshire (New Hampshire)University of New Haven (Connecticut)University of New Mexico (New Mexico)University of North Carolina (North Carolina)University of North Florida (Florida)University of North Texas (Texas)University of Northern Colorado (Colorado)University of Oklahoma (Oklahoma)University of Oregon (Oregon)University of Pennsylvania (Pennsylvania)University of Pittsburgh Bradford (Pennsylvania)University of Saint Mary (Kansas)University of San Francisco (California)University of South Carolina (South Carolina)University of South Dakota (South Dakota)University of Southern Indiana (Indiana)University of Southern Maine (Maine)University of Southern Mississippi (Mississippi)University of St. Francis (Illinois)University of St. Thomas (Minnesota)
SPORTS MARKETING 2020-2021
• 592 •

University of Tampa (Florida)University of Tennessee (Tennessee)University of Tennessee Chattanooga (Tennessee)University of Tennessee Martin (Tennessee)University of Texas (Texas)University of the Incarnate Word (Texas)University of the Pacific (California)University of Washington (Washington)University of West Georgia (Georgia)University of West Florida (Florida)University of Wisconsin La Crosse (Wisconsin)University of Wisconsin Parkside (Wisconsin)Valparaiso University (Indiana)Villanova School of Law (Pennsylvania)Virginia Commonwealth University (Virginia)Virginia Intermont College (Virginia)Warner University (Florida)Washington State University (Washington)Wayne State College (Nebraska)Wayne State University (Michigan)Webber International University (Florida)West Chester University (Pennsylvania)West Liberty University (West Virginia)West Virginia University (West Virginia)Western Illinois University (Illinois)Western Kentucky University (Kentucky)Western Michigan University (Michigan)Western New England University (Massachusetts)Western Oregon University (Oregon)Wichita State University (Kansas)Widener University (Pennsylvania)Wilkes University (Pennsylvania)William Penn University (Iowa)William Woods University (Missouri)Wilmington University (Delaware)Wilson College (Pennsylvania)Wingate University (North Carolina)Winston-Salem State University (North Carolina)Winthrop University (South Carolina)Xavier University (Ohio)York College of Pennsylvania (Pennsylvania)
SPORTS MARKETING 2020-2021
• 593 •

APPENDIX E
PERIODICALS
ESPN The Magazine, Plaza Bristol, CT 06010.(http://insider.espn.go.com/insider/espn-the-magazine/)
Journal of Sport Management, P.O. Box 5076, Champaign, IL 61825. (800) 747-4457.(http://journals.humankinetics.com/JSM)
SportBusiness, 2nd Floor, 5 Thomas More Square, London, E1W 1YW, UnitedKingdom. +44 (0) 20 7954 3514. (www.sportbusiness.com)
SportsBusiness Journal, 120 West Morehead Street, Suite 310, Charlotte, NC 28202. (704) 973-1400. (www.sportsbusinessjournal.com)
Sports Illustrated, 1271 Avenue Of The Americas, New York, NY 10020. (212) 522-1212. (www.si.com)
SPORTS MARKETING 2020-2021
• 594 •

APPENDIX F
SPORTS COMMISSIONS
AlabamaAlabama Sports Foundation, 100 Grandview Place, Suite 110, Birmingham, AL 25243.(www.brunoeventteam.com/alabama-sports-foundation.php)
Mobile Sports Authority, 301 Government Street, Suite 204, Mobile, AL 36602.(www.mobilesportsauthority.com)
ArizonaArizona Sports & Entertainment Commission, 2120 East 6th Street, Suite 4, Tempe, AZ85281. (http://azsportsent.com)
Phoenix Regional Sports Commission, 400 E. Van Buren Street, Suite 600, Phoenix,AZ 85004. (www.visitphoenix.com/members/1608/phoenix-regional-sports-commission/details.aspx)
CaliforniaBay Area Sports Organizing Committee, 2275 East Bayshore Road, Suite 115, Palo Alto, CA 94303. (www.basoc.org)
L.A. Sports & Entertainment Commission, 333 S. Hope Street, 18 th Floor, Los Angeles,CA 90071. (www.lasec.net)
L.A. Sports Council, 350 S. Bixel Street, Suite 250, Los Angeles, CA 90017. (www.lasports.org)
Sacramento Sports Commission, 1030 15th Street, Suite 200, Sacramento, CA 95814. (www.sacsports.com)
San Diego Sports Commission, 2131 Pan American Plaza, San Diego, CA 92101. (www.sdsportscommission.com)
San Jose Sports Authority, 345 Park Avenue, MS A9-432, San Jose, CA 95110. (www.sjsa.org)
SPORTS MARKETING 2020-2021
• 595 •

ColoradoDenver Sports Commission, 1555 California Street, Suite 300, Denver, CO 80202.(www.denver.org/sports-commission/)
ConnecticutFairfield County Sports Commission, 1 University Place, Stamford, CT 06901.(http://fairfieldcountysports.com)
FloridaCentral Florida Sports Commission, 400 W Church Street, Suite 205, Orlando, FL32801. (www.centralfloridasports.org)
Tallahassee Sports Council, 106 E. Jefferson Street, Tallahassee, FL 32301. (www.visittallahassee.com/industry/sports-council/)
Gainesville Sports Commission, 300 E. University Avenue, Suite 100, Gainesville, FL32601. (www.gainesvillesportscommission.com)
JEDC Sports & Entertainment, 1 W. Adams Street, Suite 200, Jacksonville, FL 32202
Lee County Sports Authority, 2305 Broadway, Fort Myers, FL 33901
Miami-Dade Sports Commission, 8491 NW 17th Street, Suite 109, Doral, FL 33126
Palm Beach Sports Commission, 1555 Palm Beach Lake Boulevard, Suite 930, WestPalm Beach, FL 33401. (www.palmbeachsports.com)
Pensacola Sports Association, 101 W. Main Street, Pensacola, FL 32502. (www.pensacolasports.com)
Polk County Sports Marketing, 2701 Lake Myrtle Park Road, Auburndale, FL 33823.(www.centralfloridasports.com)
Sarasota County Sports Commission, 766 Hudson Avenue, Suite A, Sarasota, FL34236. (http://sports.visitsarasota.org)
Tampa Bay Sports Commission, 401 E. Jackson Street, Suite 2100, Tampa, FL 33607(www.tampabaysports.org)
GeorgiaAtlanta Sports Council, 235 Andrew Young Boulevard NW, Atlanta, GA 30303. (www.metroatlantachamber.com/business/sports)
SPORTS MARKETING 2020-2021
• 596 •

Greater Augusta Sports Council, 1450 Greene Street, Suite 110, Augusta, GA 30901.(www.augustasportscouncil.org)
Sports Council Columbus Georgia, P.O. Box 1519, Columbus, GA 31902.(www.columbusga.com/sportscouncil/)
IndianaHoosier Sports Corp., 2855 N. Walnut Street, Bloomington, IN 47404. (www.hoosiersports.org)
Indiana Sports Corp., 201 S. Capitol Avenue, Suite 1200, Indianapolis, IN 46225.(www.indianasportscorp.org)
IllinoisChicago Sports Commission, 72 East Randolph Street, 3 rd Floor, Chicago, IL 60601.(www.choosechicago.com/sports-commission/)
Quad Cities Sports Commission, 1601 River Drive, Suite 110, Moline, IL 61265.(www.visitquadcities.com/sports/sports-planners)
KansasGreater Wichita Area Sports Commission, 515 S. Main, Suite 115, Wichita, KS 67202. (www.wichitasports.com)
KentuckyKentucky Sports Authority, 500 Metro Street, 24th Floor, Frankfort, KY 40601. (www.teamkentucky.com)
Louisville Sports Commission, 401 W. Main Street, Suite 2200, Louisville, KY 40202. (www.louisvillesports.org)
MichiganDetroit Metro Sports Commission, 211 W. Fort Street, Suite 1000, Detroit, MI 48226. (www.detroitsports.org)
MinnesotaMinnesota Amateur Sports Commission, 1700 105th Avenue NE, Blaine, MN 55449.(www.mnsports.org)
Rochester Sports Commission, 30 Civic Center Drive SE, Suite 200, Rochester, MN55904. (www.rochsports.org)
SPORTS MARKETING 2020-2021
• 597 •

MissouriJoplin Sports Authority, 3301 W. 1st Street, Joplin, MO 64801. (www.joplinsports.org)
St. Louis Sports Commission, 308 N. 21st Street, Suite 501, St. Louis, MO 63103. (http://stlsports.org)
NebraskaOmaha Sports Commission, 11235 Davenport Street, Suite 106, Omaha, NE 68154. (www.omahasports.org)
NevadaLas Vegas Sports Committee, 1820 Cypress Greens Avenue, Henderson, NV 89012.(www.lvsports.org)
New JerseyNew Jersey Sports and Exposition Authority, 50 State Route 120, East Rutherford, NJ07073. (www.njsea.com)
New YorkCortland Regional Sports Council, 37 Church Street, Cortland, NY 13045. (www.courtlandsports.org)
Monroe County Sports Commission, 400 Andrews Street, Suite 100, Rochester, NY14604. (www.monroecountysports.org)
North CarolinaCharlotte Regional Sports Commission, 333 E. Trade Street, Charlotte, NC 28202.(www.charlottesports.org)
Greater Raleigh Sports Council, 800 South Salisbury Street, Raleigh, NC 27602.(www.thesportscouncil.org)
Jacksonville-Onslow Sports Commission, P.O. Box 207, Jacksonville, NC 28541.(www.jacksonvilleonslowsports.org)
OhioGreater Cincinnati Sports Corp., 9514 Kenwood Road, Cincinnati, OH 45242. (www.cincysports.org)
Greater Cleveland Sports Commission, 334 Euclid Avenue, Suite 100, Cleveland, OH44114. (www.clevelandsports.org)
Greater Columbus Sports Commission, 155 W. Nationwide Boulevard, Suite 125,Columbus, OH 43215. (www.columbussports.org)
SPORTS MARKETING 2020-2021
• 598 •

OklahomaOklahoma City All Sports Association, 211 N. Robinson Avenue, Suite 250, OklahomaCity, OK 73102. (www.okcallsports.org)
Tulsa Sports Commission, 2 West Second Street, Tulsa, OK 74103. (www.tulsasports.org)
OregonOregon Sports Authority, 1888 S.W. Madison Street, Portland, OR 97205. (www.oregonsports.org)
PennsylvaniaBerks County Sports Commission, 2525 N. 12th Street, Suite 101, Reading, PA 19605. (www.gogreaterreading.com)
Discover Lehigh Valley Sports, 840 Hamilton Street, Suite 200, Allentown, PA 18101.(http://sports.discoverlehighvalley.com)
Erie Area Sports Commission, 208 E. Bayfront Parkway, Suite 103, Erie, PA 16507. (www.visiteriepa.com)
Philadelphia Sports Congress, 1700 Market Street, Suite 3000, Philadelphia, PA 19103. (www.philadelphiasportscongress.org)
Sport York, 155 West Market Street, York, PA 17401. (www.sportyork.org)
South CarolinaCharleston Area Sports Commission, 423 King Street, Charleston, SC 29403. (www.charlestonsports.org)
Columbia Regional Sports Commission, 1010 Lincoln Street, Columbia, SC 29201.(www.columbiacvb.com/about/contact-us/sports-council/)
TennesseeNashville Sports Council, 414 Union Street, Suite 500, Nashville, TN 37219. (www.nashvillesports.com)
TexasAustin Sports Commission, 111 Congress Avenue, Suite 700 Austin, TX 78701.(www.austintexas.org/sports-commission)
El Paso Sports Commission, 4100 E. Saisano Drive, El Paso, TX 79905. (www.elpasosports.org)
SPORTS MARKETING 2020-2021
• 599 •

San Antonio Sports Foundation, 100 Montana Street, San Antonio, T X 78203. (www.sanantoniosports.org)
UtahUtah Sports Commission, 201 S. Main, Suite 2125, Salt Lake City, UT 84111. (www.utahsportscommission.com)
VirginiaHampton Roads Sports Commission, 500 E. Main Street, Suite 700, Norfolk, VA 23501. (www.hamptonroadssports.org)
Metro Richmond Sports Backers, 100 Avenue of the Champions, Suite 300, Richmond,VA 23230. (www.sportsbackers.org)
WashingtonSeattle Sports Commission, 701 Pike Street, Suite 800, Seattle, W A 98101. (www.seattlesports.org)
Spokane Sports Commission, 714 N. Iron Bridge Way, Suite 202, Spokane, WA 99202. (www.spokanesports.org)
Tacoma-Pierce County Sports Commission, 1119 Pacific Avenue, Suite 500, Tacoma,WA 98402 (www.tacomasports.org)
WisconsinWisconsin Sports Development Corp., 313 W. Beltline Highway, Suite 161, Madison,WI 53713. (http://clarity.sportsinwisconsin.com/sportsinwisconsin_home)
SPORTS MARKETING 2020-2021
• 600 •

REFERENCES
Chapter 5: Participation & Recreation2018 Sports, Fitness And Leisure Activities Topline Participation Report , Sports &Fitness Industry Association, May 2018.
Chapter 6: Top Sports CitiesBerger, Sarah, “These Are The Best Cities For Sports Fans,” CNBC, November 30, 2018.
“Minor League Markets - 2017 Rankings,” SportsBusiness Journal, September 18,2017.
Chapter 7: Advertising & Sponsorships“Top Advertising Spenders,” SportsBusiness Journal, December 24, 2018, p. 37.
Chapter 8: Agents & AgenciesMullen, Liz, “NFL Agents To Meet, Consider Forming An Association,” SportsBusinessJournal, January 14, 2019, p. 15.
Chapter 9: ConcessionsSunnucks, Mike, “Study: In-Seat F&B Ordering Still Top Of Mind,” SportsBusinessJournal, October 15, 2018, p. 16.
“Who’s Got The Business?” SportsBusiness Journal, July 8, 2019, p. 31.
Chapter 12: Game PromotionsBroughton, David and Brandon McClung, “2018 MLB Game-Day Giveaway Wrap-Up,”SportsBusiness Journal, December 10, 2018, pp 15-18.
Chapter 13: Licensed Merchandise“Licensed To Sell,” SportsBusiness Journal, December 24, 2018, p. 37.
Chapter 14: MemorabiliaBelson, Ken, “Trading Sports Memorabilia, Not Just For Love But For Money,” The NewYork Times, October 27, 2018.
Chapter 15: Sports Betting“State Sportsbook Snapshot,” SportsBusiness Journal, April 15, 2019, pp 23-30.
SPORTS MARKETING 2020-2021
• 601 •

Chapter 17: Sports Halls Of Fame & MuseumsMuret, Don, “The Thrill Of History,” SportsBusiness Journal, August 28, 2018, pp 1, 26.
Chapter 18: Sports TravelKing, Bill, “Staying Power,” SportsBusiness Journal, July 9, 2018, pp 28-29.
Chapter 19: TicketingFisher, Eric, “10 Stories That Will Define The Future Of Ticketing,” SportsBusinessJournal, January 15, 2019, pp 16-18.
Giles, Chris, “It’s Time To Adapt To A New Ticketing Model,” SportsBusiness Journal,August 13, 2018, p. 27.
Lombardo, John, “The Laws Of Attraction,” SportsBusiness Journal, June 17, 2019, pp 23-25.
Chapter 22: Sports Facility Construction“Work Zone,” SportsBusiness Journal, April 30, 2018, p. 17.
“The Most Expensive Sports Facilities,” SportsBusiness Journal, April 30, 2018, p. 21.
“In-Depth Facilities 2019,” SportsBusiness Journal, January 14, 2019, pp 21-22.
Kaplan, Daniel, “Rams Stadium Tops $4 Billion,” SportsBusiness Journal, May 14,2017, pp 1, 36.
Chapter 23: Naming RightsBroughton, David, “Top Naming-Rights Deals,” SportsBusiness Journal, April 30, 2018, p. 36.
Chapter 24: Premium SeatingGray, Robert, “Mixing It Up,” SportsBusiness Journal, September 18, 2018, pp 17-20.
Kaplan, Daniel, “Low-Priced SSLs Will Cost Chargers,” SportsBusiness Journal, p. 10.
Sunnucks, Mike, “The Premium Pitch,” SportsBusiness Journal, September 17, 2018, pp 30-34.
Chapter 26: Sports Television BroadcastingPorter, Rick, “The Top 100 Primetime Telecasts of 2018,” The Hollywood Reporter,December 31, 2018.
SPORTS MARKETING 2020-2021
• 602 •

Chapter 30: Sports OnlineFisher, Eric, “Digital Sports Media Audience Avoids Typical January Drop Off,”SportsBusiness Daily, February 20, 2019.
Chapter 31: PodcastsSpanberg, Erik, “The Podcast Revolution,” SportsBusiness Journal, May 7, 2018, pp 1, 26.
Chapter 37: FIFA Women’s World CupSpringer, Shira, “World-Class Players Take Soccer Beyond Prove-It-To-Me Territory,”SportsBusiness Journal, July 15, 2019, p. 43.
Stelter, Brian, “U.S. Viewers Tuned Into Women's World Cup Final In RecordNumbers,” CNN, July 8, 2019.
Chapter 38: Indianapolis 500Stern, Adam, “Solid State For NBC’s First Indianapolis 500 Broadcast,” SportsBusinessJournal, June 3, 2019, p. 9.
Chapter 39: Kentucky Derby“Biggest Ad Spenders For The Kentucky Derby,” SportsBusiness Journal, April 29, 2019, p. 24.
Chapter 42: NCAA Women’s Final FourKing, Bill, “Staying Power,” SportsBusiness Journal, July 9, 2018.
Chapter 48: Major League BaseballBrown, Muray, “MLB Sees Record Revenues Of $10.3 Billion For 2018,” Forbes,January 7, 2019.
Fisher, Eric, “MLB Attendance Drops 4%,” SportsBusiness Journal, December 24, 2018, p. 21.
Chapter 49: National Basketball Association“The NBA’s Most Valuable Teams,” Forbes, February 28, 2019, pp 20-21.
Chapter 50: National Football League“Game Of Inches: Exclusive NFL Team Values,” Forbes, October 31, 2018, pp 25-27.
Chapter 51: National Hockey League“Most Valuable Hockey Teams,” Forbes, December 31, 2018, p. 24.
SPORTS MARKETING 2020-2021
• 603 •

Chapter 52: Major League SoccerSmith, Chris, “Major League Soccer's Most Valuable Teams 2018: Atlanta UnitedDebuts On Top,” Forbes, November 14, 2018.
Chapter 54: UEFA Champions LeagueOzanian, Mickael K., Kurt Badenhausen and Christina Settimi, “The World’s MostValuable Soccer Teams 2019: Real Madrid Is Back On Top,” Forbes, May 29, 2019.
Chapter 55: Major League LacrosseLefton, Terry, “MLL Folds Three Teams As Part Of Restructure,” SportsBusinessJournal, April 1, 2019, p. 9.
Chapter 57: Premier Lacrosse LeagueStern, Adam, “Field Is Crowded, But Lacrosse Leagues Each Claim Momentum,”SportsBusiness Journal, June 24, 2019.
Chapter 61: Minor League BaseballNorris, Josh, “2018 Minor League Baseball Attendance Numbers For Every Team,”Baseball America, September 20, 2018.
Chapter 64: United Soccer LeagueThomas, Ian, “USL Continues To Find Traction As Several Key Metrics Climb,”SportsBusiness Journal, March 19, 2018, p. 4.
Chapter 69: National Women’s SoccerLeagueMcCormick, Bret, “NWSL Looks To Capitalize, Grow,” SportsBusiness Journal, July 12, 2019, p. 12.
Ourad, John, “ESPN Gets League Rights, Aiming To Ride World Cup Wave,”SportsBusiness Journal, July 12, 2019, p. 12.
Chapter 72: NCAA Sports“Conference-By-Conference Revenue,” SportsBusiness Journal, August 6, 2019, p. 15.
Chapter 78: BoxingKing, Bill, “PBS Plots Path To Maximize Rights, Distribution,” SportsBusiness Journal,April 24, 2018.
King, Bill, “The Fight Game: Landing A Direct Hit,” SportsBusiness Journal, November 12, 2018.
SPORTS MARKETING 2020-2021
• 604 •

Chapter 79: Ultimate Fighting ChampionshipBonesteel, Matt, “ESPN+ Subscriptions Will Now Be Required To Buy UFCPay-Per-View Events,” The Washington Post, March 18, 2019.
Ourand, John, “The Fight To Get The Deal Done,” SportsBusiness Journal, July 9,2018, pp 22-24.
Chapter 81: Golf ParticipationLombardo, John, “Study Shows Opportunity For Golf Participation,” SportsBusinessJournal, May 21, 2018, p. 5.
Chapter 86: IndyCarStern, Adam, “IndyCar Wraps Up Season With Title Sponsor Top Of Mind,”SportsBusiness Journal, September 24, 2018, p. 10.
Chapter 87: NASCARBadenhausen, Kurt, “NASCAR’s Highest-Paid Drivers 2019,” Forbes, June 30, 2019.
Stern, Adam, “NASCAR Discussing Tiered Sponsorship Model,” SportsBusinessJournal, June 18, 2018, p. 4.
Stern, Adam, “Owners To NASCAR: Pick Up The Pace,” SportsBusiness Journal, May 14, 2018, pp 1, 7.
Stern, Adam, “TV Numbers Flat, But NASCAR Has Good Stories To Tell From Daytona500,” SportsBusiness Journal, February 25, 2019, p. 11.
Chapter 88: Formula OneStern, Adam, “Formula One Set To Hit The Road With OTT Effort,” SportsBusinessJournal, May 7, 2018, p. 8.
Chapter 89: Formula EStern, Adam, “Formula E Founder Says Electric Racing Series Valued Around $1Billion,” SportsBusiness Journal, June 10, 2019, p. 10.
Chapter 90: NHRA Drag RacingStern, Adam, “NHRA Says Diverse Driver Group Reflects Fan Base,” SportsBusinessJournal, July 15, 2019, p. 32.
Chapter 96: Men’s ToursBadenhausen, Kurt, “Highest-Paid Tennis Players 2018,” Forbes, August 27, 2018.
SPORTS MARKETING 2020-2021
• 605 •

Chapter 99: Esports Market Assessment“Esports Playing In The Big Leagues Now,” eMarketer, February 5, 2019.
“How The NBA Is Using Esports To Grow Its Audience,” eSports, March 19, 2019.
Ozanian, Mickael K. and Christina Settimi, “The World’s Most Valuable EsportsCompanies,” Forbes, October 23, 2018.
Singer, Dan and Jayson Chi, “Esports: Don’t Get Ganked,” SportsBusiness Journal,April 22, 2019, p. 34.
“Sports Industry: Lost in Transition?” PricewaterhouseCoopers, September 25, 2018.
Tech & Media Outlook 2019, Activate Inc., November 13, 2019.
“U.S. Esports Viewers,” eMarketer, March 2019.
Chapter 100: Leagues & ChampionshipsFischer, Ben, “New League Of Legends Looks Similar To Past,” SportsBusinessJournal, April 2, 2018.
Fischer, Ben, “State Farm Goes Deeper With Esports,” SportsBusiness Journal, May 21, 2018.
Thomas, Ian, “MLS Teams Line Up Players For Inaugural eMLS Cup,” SportsBusinessJournal, February 5, 2019, p. 4.
Chapter 101: Esports VenuesBloom, David, “Esports Stadiums Are Popping Up Everywhere,” Forbes, May 31, 2019.
Sunnucks, Mike, “$50M Esports Arena Coming To Philly,” SportsBusiness Journal, March 25, 2019
Chapter 106: Professional Bull RidersOurand, John, “CBS Climbs On For More PBR With Extension,” SportsBusinessJournal, April 1, 2019, p. 12.
“Professional Bull Riders: Celebrating 25 Years,” SportsBusiness Journal, June 18, 2018.
Chapter 109: Bass Fishing & SportfishingBourne, David, “Catching Bass After Class,” SportsBusiness Journal, April 1, 2019, p.38.
SPORTS MARKETING 2020-2021
• 606 •

Chupita, Mike, “The Bait That Shook Up Bass Fishing,” SportsBusiness Journal, December 3, 2018, pp 16-19.
Chapter 110: BowlingThomas, Ian, “A Perfect Game,” SportsBusiness Journal, May 7, 2018, pp 16-19.
Chapter 114: DartsOurand, John, “BBC America Aims For Bull’s-Eye Of Niche Sports With DartsChampionship,” SportsBusiness Journal, December 17, 2018, p. 16.
Ourand, John, “David Hill Thinks Darts Might Hit Bull’s-Eye As Sports Television,”SportsBusiness Journal, July 10, 2017, p. 10.
Chapter 116: EquestrianStern, Adam, “World Equestrian Games Expect Big Numbers,” SportsBusiness Journal,September 10, 2018, p. 12.
Chapter 139: UltimateKing, Bill, “Sportsmanship, Fun Part Of The Appeal For USA Ultimate,” SportsBusinessJournal, October 23, 2018, pp 10-12.
Chapter 140: VolleyballFisher, Ben, “Walsh Jennings Goes On Attack With P1440 Series,” SportsBusinessJournal, September 24, 2018, p. 7.
Chapter 142: X GamesKrammer, Andrew, “X Games Organizers Already Looking To 2019,” Star Tribune, July 22, 2018.
SPORTS MARKETING 2020-2021
• 607 •
Copyright © 2022 FDOKUMEN