Experimental studies of zero pressure-gradient turbulent ...

ELSEVIER Palaeogeography, Palaeoclimatology, Palaeoecology 145 (1999) 95–117
Evidence for a steeper Eemian than Holocene sea surface temperaturegradient between Arctic and sub-Arctic regions
Henning A. Bauch a,Ł, Helmut Erlenkeuser b, Kirsten Fahl c, Robert F. Spielhagen a,Mara S. Weinelt d, Harald Andruleit e, Rudiger Henrich f
a GEOMAR, Zentrum fur marine Geowissenschaften, Wischhofstrasse 1-3, 24148 Kiel, Germanyb Leibniz Labor, Christian-Albrechts-Universitat, Max-Eyth-Strasse 11, 24098 Kiel, Germany
c Alfred-Wegener-Institut fur Polar- und Meeresforschung, Columbusstrasse, 27515 Bremerhaven, Germanyd Institut fur Geologie and Palaontologie, Christian-Albrechts-Universitat, Olshausenstrasse 40–50, 24098 Kiel, Germany
e Bundesanstalt fur Geowissenschaften und Rohstoffe, P.O. Box 510153, 30631 Hanover, Germanyf Fachbereich Geowissenschaften, Universitat Bremen, Postfach 330440, 28334 Bremen, Germany
Received 8 July 1997; revised version received 2 June 1998; accepted 23 June 1998
Abstract
Sediment proxy data from the Norwegian, Greenland, and Iceland seas (Nordic seas) are presented to evaluate surfacewater temperature (SST) differences between Holocene and Eemian times and to deduce from these data the particularmode of surface water circulation. Records from planktic foraminiferal assemblages, CaCO3 content, oxygen isotopes offoraminifera, and iceberg-rafted debris form the main basis of interpretation. All results indicate for the Eemian compar-atively cooler northern Nordic seas than for the Holocene due to a reduction in the northwardly flow of Atlantic surfacewater towards Fram Strait and the Arctic Ocean. Therefore, the cold polar water flow from the Arctic Ocean was less in-fluencial in the southwestern Nordic seas during this time. As can be further deduced from the Eemian data, slightly higherEemian SSTs are interpreted for the western Iceland Sea compared to the Norwegian Sea (ca. south of 70ºN). This Eemiansituation is in contrast to the Holocene when the main mass of warmest Atlantic surface water flows along the Norwegiancontinental margin northwards and into the Arctic Ocean. Thus, a moderate northwardly decrease in SST is observed in theeastern Nordic seas for this time, causing a meridional transfer in ocean heat. Due to this distribution in SSTs the Holoceneis dominated by a meridional circulation pattern. The interpretation of the Eemian data imply a dominantly zonal surfacewater circulation with a steep meridional gradient in SSTs. 1999 Elsevier Science B.V. All rights reserved.
Keywords: Eemian; Holocene; climate; foraminifera; sea surface temperature; surface water circulation; Nordic seas; ArcticOcean
1. Introduction
Terrestrial evidence from ice cores and floralrecords reveal that during the past 140 ka only
Ł Corresponding author. Tel.: C49 431 600 2856; Fax: C49 431600 2941; E-mail: [email protected]
the last interglaciation, the Eemian (marine oxygenisotope stage 5e), had climatic conditions which inmany respect appear comparable to the Holocene(e.g., Woillard, 1978), for example, indicating forwestern Europe slightly higher temperatures for mid-to higher latitudes then (Velichko et al., 1984; Guiotet al., 1993). During the past 20 years many studies
0031-0182/99/$ – see front matter 1999 Elsevier Science B.V. All rights reserved.PII: S 0 0 3 1 - 0 1 8 2 ( 9 8 ) 0 0 1 0 4 - 7
96 H.A. Bauch et al. / Palaeogeography, Palaeoclimatology, Palaeoecology 145 (1999) 95–117
have dealt with the paleoceanography of the Ice-land, Greenland, and Norwegian (Nordic) seas. Theywere based on calcium carbonate, stable isotope,and micropalaeontological data that, on a broaderscale, greatly enhanced the knowledge about majorglacial=interglacial variations during the late Qua-ternary oceanographical evolution of the NordicSeas (e.g., Kellogg, 1980; Belanger, 1982; CLIMAP,1984; Labeyrie et al., 1987; Henrich et al., 1989).Although more interest in marine Eemian records atnorthern latitudes was initiated recently (e.g., Keig-win et al., 1994; McManus et al., 1994; Boden andBackman, 1996), profound palaeoceanographic re-constructions as they have been suggested for thepast 20 ka (e.g., Lehman et al., 1991; Sarnthein etal., 1995) are still lacking for the last interglacia-tion in the Nordic seas despite some first attempts(Kellogg, 1980; Cortijo et al., 1994; Bauch, 1996;Fronval and Jansen, 1996)
Studying sediments from the Nordic seas, Kellogg(1980) was the first to note that Holocene-like surfacewater conditions occurred during marine oxygen iso-tope stage 5e (MIS 5e). His conclusions were basedon planktic foraminiferal data and the deduced patternof surface water circulation did not differ significantlyfrom the Holocene situation. Haake and Pflaumann(1989) recognized development of ‘modern-like’ sur-face water circulation and bottom water formationduring the last interglaciation in the later part of MIS5e. Although their study was based on cores from avery limited area of the NE Norwegian Sea recentinvestigations of the last interglaciation confirm theprevious conclusion that the planktic foraminiferalassemblage over the southern part of the Nordic seasis in general quite comparable to the Holocene (Bauchet al., 1996; Fronval and Jansen, 1996).
All species of planktic foraminifera that occur inlate Pleistocene or Holocene sediments of the higherlatitudes can be assigned to either a polar or a subpo-lar assemblage (Kipp, 1976; Hemleben et al., 1989).In the Nordic seas these assemblages correspond toeither a glacial or an interglacial group. Neoglobo-quadrina pachyderma sinistral (sin.) is the only truepolar species in this area. This species has been re-lated to cold water masses (<10ºC) and makes up>95% of the assemblage in surface waters below5ºC (Be and Tolderlund, 1971). In comparison, thesubpolar group is predominantly made up of Tur-
borotalita quinqueloba (Bauch, 1994, 1996). Speciesof temperate or subtropical provenance occur oc-casionally (Kellogg, 1984; Haake and Pflaumann,1989). These latter species are sparse and mostlyrestricted to the Eemian and then only to the south-eastern part of the Nordic seas where the influenceof North Atlantic surface water is strongest todayand was also presumably strong during the past in-terglaciation (Kellogg, 1980).
Estimates of past sea surface temperatures (SST)derived from foraminiferal assemblages have longbeen a common tool to express glacial–interglacialcontrasts (CLIMAP, 1981, 1984). The same methodshave been transferred to other planktic proxy data(e.g., Koc-Karpuz and Jansen, 1992). However, ter-restrial and marine records (e.g., Stute et al., 1995;Bard et al., 1997) now indicate that for instance dur-ing the last glacial maximum (LGM) temperaturesin the tropics were much lower than suggested bythe CLIMAP studies based on foraminifera, essen-tially leaving doubt on the methodological validity offoraminiferal-derived SSTs at these latitudes. Theseproblems should be kept in mind when evaluatingenvironmental parameter from foraminiferal data ofthe Nordic seas, where very complex gradients intemperature and salinity shape the upper hydrogra-phy today and presumably also in the past.
The intent of this study is to demonstrate the use-fulness of various important climate proxy tools forregional paleoceanography, and to show that by us-ing a multiproxy approach, surface water conditionsin the Nordic seas during the last interglaciation werein a qualitative respect quite dissimilar from those ofHolocene times.
2. Oceanographic setting, material, and methods
Today, the surface water regime of the Nordic seasis characterized by a threefold subdivision (Swift,1986). Salinity and temperatures decrease towardsthe north and west. Relatively warm high salinityAtlantic surface water (6–11ºC, >35‰) flows asNorwegian Current (NC) along the Norwegian andSvalbard shelf margins northward into the easternArctic Ocean basin. This forms the Atlantic Domain(Fig. 1). The western part of the Nordic seas ismarked by the outflow of the relatively cold and at

H.A. Bauch et al. / Palaeogeography, Palaeoclimatology, Palaeoecology 145 (1999) 95–117 97
Fig. 1. Simplified modern surface water circulation of the Nordic seas and its major oceanographic regimes (Swift, 1986); POD (PolarDomain), ARD (Arctic Domain), AND (Atlantic Domain). Grey and black arrows denote warmer and cooler surface currents, respectively.EGC (East Greenland Current), NC (Norwegian Current); KR (Kolbeinsey Ridge).
the surface low salinity water (<0ºC, <34.4‰) ofthe East Greenland Current (EGC) from the ArcticOcean. The EGC flows from the Nordic seas throughDenmark Strait into the North Atlantic making upthe Polar Domain. The Polar and Atlantic Domainare separated by mixed water termed the ArcticDomain. The Arctic Domain is the main site ofdeep water formation in the Nordic seas, and hastwo distinct oceanographic fronts on either side.Due to the northerly flow of the Atlantic water theNordic seas display a S–N alignment of these frontswith a moderate temperature decrease on the easternside but with a steep temperature gradient towardsGreenland (Dietrich, 1969; Swift, 1986).
The data presented here derive from long grav-ity cores and trigger box cores that were collectedfrom the Nordic seas during several cruises over thepast decade (Fig. 1, Table 1). The stratigraphicalframework of these cores is mainly based on oxy-gen stable isotope records measured on the plank-tic foraminifera N. pachyderma sin. Benthic stableisotope analyses which were performed on Cibici-doides wuellerstorfi and Oridorsalis umbonatus arecorrected by C0.64‰ and C0.36‰, respectively, toaccount for their individual species-dependent de-parture from isotopic equilibrium (Duplessy et al.,1988). All isotope measurements were carried outon multi-specimen samples using a fully automated

98 H.A. Bauch et al. / Palaeogeography, Palaeoclimatology, Palaeoecology 145 (1999) 95–117
Table 1List of investigated cores
Site Geographical position Water depth(m)
latitude (N) longitude
PS1243 69º22.30 06º32.10W 2710PS1244 69º22.00 08º40.00W 2162PS1246 69º23.60 12º52.10W 1902PS1247 69º29.50 17º7.00W 1400PS1535 78º44.80 01º47.40E 2557PS1906 76º50.10 02º09.10W 2939M17732 71º36.80 04º12.80E 3103M23055 68º25.40 04º01.30E 2311M23059 70º18.30 03º07.40W 2281M23062 68º43.70 00º10.10E 2244M23063 68º45.00 00º00.00W 2299M23065 68º29.70 00º49.10E 2802M23342 71º38.20 08º38.20W 1974M23352 70º00.40 12º25.80W 1819M23359 65º31.70 04º09.60W 2820
Finnigan MAT 251 mass spectrometer (Leibniz Lab-oratory at Kiel University). Where radiocarbon mea-surements have been performed on N. pachydermasin. for age determination, all marine datings arereservoir corrected by subtracting 400 years.
Sample intervals are 5–10 cm for the long coresand 2–5 cm for the box cores and Holocene sections.Some Eemian sections have been sampled at 1 and2 cm intervals, although in most cases the Eemianinterval was sampled at wider spacings than theHolocene. But the large number of investigated coresand the fact that certain cores from key positionswere also sampled at closer intervals in the Eemiansections will ensure a reliable picture of the generaltrends. Furthermore, care was taken to sample thecentral part of the Eemian interglacial section, whichcan be usually recognized by its distinct sedimentcolour due to high carbonate content.
In studying the planktic foraminiferal fauna, the125–250 and 250–500 µm size-fraction were exam-ined separately to make better estimates of abun-dance of the relatively small subpolar species T.quinqueloba and other rarely occurring species thatare larger than 250 µm (Bauch, 1992, 1994). Thefaunal results are expressed as test concentrations(specimens per gram of dry sediment) and as relativeabundances (%).
From some Holocene and Eemian samples the
content of long-chain alkenones were measured inorder to (1) derive SSTs from the alkenone U K 0
37and (2) to compare these SSTs with the overallpattern deduced from the foraminiferal assemblagedata. The alkenone composition was analysed byGC=MS which consists of a gas chromatograph (HP5890, column 30 m ð 0.25 mm; film thickness 0.25µm; liquid phase: HP 5) and a mass spectrometer(MSD, HP 5972, 70 eV electron-impact-ionisation,Scan 50–650 m=z, 1 scan=s, ion source tempera-ture 175ºC). For further details concerning extractionand saponification see Fahl and Stein (1998). Theunsaturation index U K 0
37 was calculated according tothree different calibration methods (Prahl and Wake-ham, 1987; Sikes and Volkman, 1993; Rosell-Meleet al., 1995; Table 2). Due to the comparability ofthe investigation areas, the calibration published byRosell-Mele et al. (1995) was used for our inter-pretation. We want to point out that the records oflong-chain unsaturated alkenones in high-latitude,low temperature areas are difficult to interpret andoften discussed (e.g., Conte and Eglinton, 1993).Thus, the results should be assessed as an estima-tion which, however, appears to be permissible incombination with the other data.
To be sure that we would compare core sectionswhich were deposited under similar climatic condi-tions (Bauch et al., 1996), the cessation and recur-rence of the iceberg-rafted debris (IRD) in relationto the Holocene and Eemian intervals were carefullynoted. This approach allows a defined separationof those core section which were deposited duringthe time of major deglaciation (Termination), i.e.,marked by input of IRD and freshwater from meltingicebergs, from the ensuing core sections which arecharacterized by low or no IRD content but highabundance of warm-water indicating foraminiferalspecies (Bauch et al., 1996).
3. Palaeoceanographic proxy records
3.1. Conditions during the last twoglacial–interglacial cycles
Fig. 2 provides a general overview of changingconditions during the last two glacial–interglacialcycles, showing the distribution of various proxies
H.A. Bauch et al. / Palaeogeography, Palaeoclimatology, Palaeoecology 145 (1999) 95–117 99
Table 2Results of U K 0
37 analyses and calculated SST-estimates
Core U K 037 T (ºC) T (ºC) T (ºC) T (ºC)
(cm) (a) (b) (c) (d)
M233522 0.35 11.5 12.3 8.57 0.38 12.3 13.2 9.7
12 0.33 11.0 11.9 815 0.37 12.1 12.9 9.418 0.34 11.4 12.2 8.421 0.37 11.9 12.8 9.2 8.830 n.d. n.d. n.d. n.d.34 n.d. n.d. n.d. n.d.
219 n.d. n.d. n.d. n.d.222 n.d. n.d. n.d. n.d.225 n.d. n.d. n.d. n.d.227 0.39 12.6 13.4 10228 0.44 13.9 14.7 11.7232 0.37 11.9 12.7 9.1238 0.39 12.6 13.4 10241 0.45 14.0 14.8 12 10.5244 n.d. n.d. n.d. n.d.250 n.d. n.d. n.d. n.d.260 n.d. n.d. n.d. n.d.
PS12436 0.45 14.1 14.7 11.9
10 0.42 13.2 13.8 10.914 0.42 13.2 13.9 10.917 0.43 13.5 14.1 11.218 0.42 13.2 13.9 10.920 0.45 14.1 14.6 11.922 0.46 14.3 14.9 12.2 11.4
210 0.36 11.6 12.5 8.9216 0.38 12.2 13 9.6219 0.37 11.9 12.8 9.2225 0.38 12.2 12.9 9.6230 0.39 12.4 13.2 9.9 9.2
M1773230 0.49 15.0 15.8 13.350 0.54 16.2 17 14.9 14.1
355 0.43 13.4 14.2 11.1370 0.46 14.2 15 12.2395 0.43 13.6 14.4 11.3 11.5
(a) After Prahl and Wakeham (1987); (b) after Sikes and Volk-man (1993); (c) after Rosell-Mele et al. (1995); (d) average Tfor the Holocene and Eemian samples of (c); n.d. D not detected.
in a core from the eastern Nordic seas. The rel-ative records of IRD and CaCO3 indicate variableinput of terrigenous material from melting icebergson one hand and pelagic carbonate productivity onthe other. The results demonstrate that similar cli-
mate boundary conditions existed during the lateHolocene and the upper part of MIS 5e and alsoagree in this respect with previously published ac-cumulation rates of CaCO3 and IRD for this area(Baumann et al., 1995). As can be deduced fromthe intervals with low IRD and high CaCO3 con-tents in relation to the benthic and δ18O record, onlythese sections reflect full-marine interglacial con-ditions and times of lowest global ice volume. Itbecomes further apparent that Termination II pen-etrates far into the interval of MIS 5e which ischaracterized by rather low δ18O values and, thus,is not just restricted to the part of the δ18O slopewhich follows MIS 6. This feature (see also Fig. 3a)appears to be typical for Eemian sections in coresfrom the Norwegian continental margin (Vogelsang,1990; Baumann et al., 1995; Fronval and Jansen,1996) and is probably due to enhanced depositionof particularly fine-grained clastic sediments dis-charged from melting icebergs during TerminationII in this area (Henrich et al., 1989). This dischargeobviously led to relatively high average sedimenta-tion rates in Termination II compared with the laterpart of MIS 5e when deposition of coarser-grainedpelagic components (e.g. foraminifera) became moredominant. Therefore, much of the variability in theplanktic δ18O records which is observed in Termi-nation II of cores M23055 and M23065 can beattributed to rather short-termed and highly variableseasonal meltwater fluxes rather than being the re-sult of longer-termed climatic changes. Due to theseobvious problems associated with the particular sed-imentation dynamics in this area throughout MIS 5e,we refrained from constructing an age model for thisinterval, even more so because an age model is notessential to the outcome of this study.
For the following comparison of Eemian andHolocene data, it is important to note that the car-bonate record shows highest values together withlow IRD and lowest benthic oxygen isotope values,i.e., smallest global ice volume. Due to the lack ofIRD we infer that freshwater from melting icebergscould neither affect the planktic δ18O records northe foraminiferal habitat by lowering surface salinityduring this time. Furthermore, because these inter-vals which are marked by warm-water indicatingplanktic foraminifera also coincide with low globalice volume during the Holocene and the Eemian re-
100 H.A. Bauch et al. / Palaeogeography, Palaeoclimatology, Palaeoecology 145 (1999) 95–117
Fig. 2. Comparison of δ18O records of the benthic species Oridorsalis umbonatus and Cibicidoides wuellerstorfi and the plankticforaminifera Neogloboquadrina sin. with IRD (% of total entities) and CaCO3 (% of total weight of sample) over the past twoglacial=interglacial cycles. Shaded bars mark the marine interglacial optimum (MIO) within the Eemian (MIS 5e) and Holocene intervalsas interpreted from the lowest observed IRD content (note the difference in sample intervals between the upper and lower graph, whichmay explain some of the slight offsets observed between the various records). Arrows indicate major oxygen isotope events (Martinsonet al., 1987), which frame the two interglaciations (figure is redrawn from Bauch et al., 1996).
spectively (Fronval and Jansen, 1996), we will referto each of these as the marine interglacial optimum(MIO) proper. Therefore, only the data from theMIOs are used for comparing Holocene with Eemiansea surface conditions (Bauch et al., 1996).
Fig. 3. Species distribution of the Eemian (a) and Holocene (b) intervals in comparison with planktic δ18O and IRD. Shaded verticalbars indicate the marine interglacial optimum (MIO) which is interpreted on the basis of low abundance (%) of the polar species N.pachyderma sin. and none or lowest concentrations of iceberg-rafted debris (IRD). Subpolar species concentrations per gram of sedimentare shown on different scales (number in parentheses behind these species names refer to the top scale of the vertical axis on the righthand side). VA D Vedde Ash.
3.2. Composition of Eemian and Holocene faunalassemblages
Both Eemian and Holocene faunal records (Fig. 3a,b) show a decrease in the relative abundance of the po-lar water species N. pachyderma sin. towards the end
H.A. Bauch et al. / Palaeogeography, Palaeoclimatology, Palaeoecology 145 (1999) 95–117 101

102 H.A. Bauch et al. / Palaeogeography, Palaeoclimatology, Palaeoecology 145 (1999) 95–117
of the terminations. The highest abundances of in-terglacial (subpolar) species are always found in theIRD-free core sections. Of the subpolar foraminiferain core M23055 T. quinqueloba totals ¾40% dur-ing the Eemian and is by far the dominant species.In the Holocene, the main phase of high subpo-lar abundances falls between 8.5–4.5 ka (14C); thistime interval covers the Atlantic chronozone duringwhich highest Holocene temperatures were recordedglobally as well as regionally (COHMAP Members,1988; Nesje and Kvamme, 1991). Turborotalita quin-queloba dominates the subpolar fauna and makes upto 70% of the total assemblage, whereas the othersubpolar species do not exceed 10% altogether. Thiswestward decline of subpolar species other than T.quinqueloba is typical, indicating the wider range ofthe latter in terms of water mass adaptation. There-fore, the fauna of the Holocene and Eemian sectionsis more diverse in the cores from the east, i.e., theVøring Plateau and further south, beneath the mainflow of Atlantic water, than to the west and north (seealso Kellogg, 1980). Globigerina bulloides, for exam-ple, may be strictly regarded an Atlantic water type,because on the Iceland Plateau (west of core PS1243)and outside the Atlantic Domain this species is basi-cally not encountered in both, surface and interglacialsediments (Johannessen et al., 1994; Bauch, 1997).In contrast, Eemian core sections from the southeastcontain, besides the shown species, also very low con-centrations of, e.g., Globorotalia inflata, Glr. scitula,Glr. truncatulinoides (Bauch, 1993). These speciesare not usually considered subpolar, but belong to typ-ical subtropical and=or temperate assemblages (Kipp,1976). Their maximum abundances usually coincidewell with that of all other subpolar species (Bauch,1993).
3.3. Holocene record
In Fig. 4 the relative distribution of the most abun-dant subpolar and polar species in the Nordic seas,
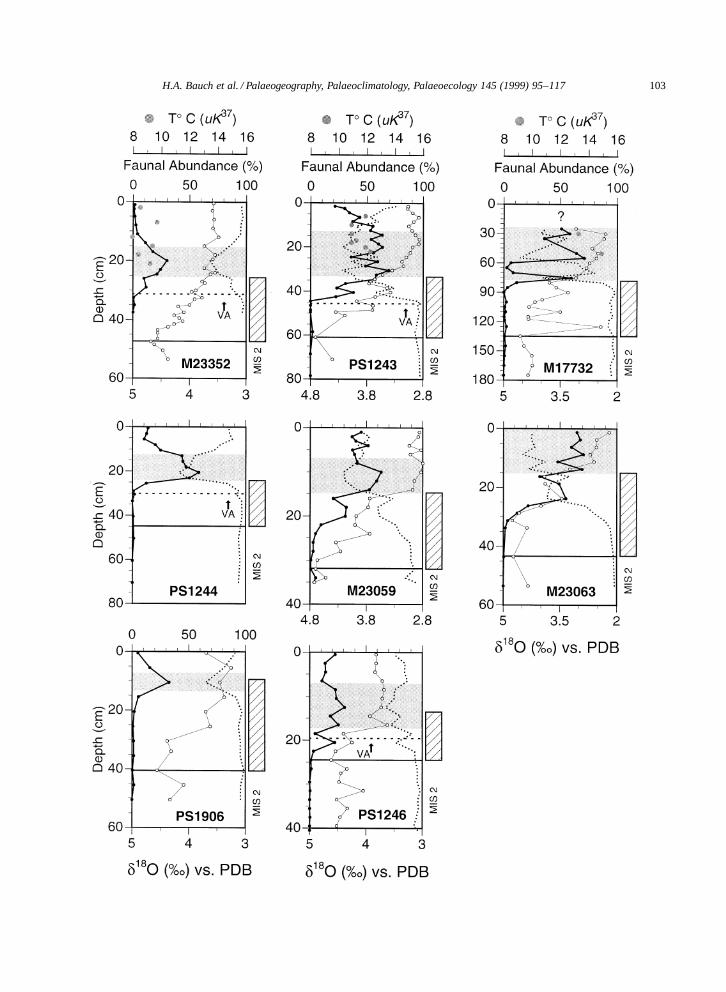
Fig. 4. Faunal records (%) of the subpolar species T. quinqueloba (filled circle) and the polar species N. pachyderma sin. (stippled line)since the LGM (MIS 2) in comparison with planktic δ18O analyzed on N. pachyderma sin. (open circle). The shaded interval representsthe marine interglacial optimum (MIO) as interpreted from the faunal evidence. The hatched bar marks the glacial–interglacial transition(Termination I) and the upper limit of this bar the observed last occurrence of deglacial IRD. Grey dots in the graphs of cores M17732,M23352, and PS1243 relate to the U K 0
37 temperature estimates (data from Table 2). Note the different scales for the δ18O records; VA DVedde Ash.
T. quinqueloba and N. pachyderma sin. are given incomparison with the δ18O record for the time periodsince the LGM. MIS 2 is clearly confirmed in all ofthese cores not only by high glacial δ18O values butalso by the identification of the benthic foraminiferaSiphotextularia rolshauseni (Bauch, 1993) which inthe Nordic seas exhibits a renowned biostratigraphicevent throughout MIS 2 (Nees and Struck, 1994;Struck, 1995). In nearly all cores, the abundancerecord of T. quinqueloba, which, in the cooler re-gions, is almost inversely related to N. pachydermasin. reveals a similar pattern after MIS 2: duringTermination I, there is a notable initial increase ofthis species. But it is only after the deglaciation hadceased that the abundance rises to peak values withinthe Holocene. In core PS1243 the highest abun-dances of T. quinqueloba fall between 8–5 ka (seeFig. 3b). This is clearly above the Younger Dryas,which in this region is commonly identified by thestratigraphic position of the Vedde Ash (Mangerudet al., 1984), and above the final deposition of IRD.Ages between 9–6 ka for the main occurrence ofsubpolar species and about 8.5 ka for the end of IRDdeposition have been recently reported from the SENorwegian Sea (Fronval and Jansen, 1996). Theseages are in good agreement with core PS1243.
There are some obvious differences in sedimen-tation rates among our cores, e.g., PS 1243 recordsan average sedimentation rate of ¾4 cm=kyr (sam-ple resolution ¾460 yr) since the Vedde Ash datumwhereas PS1246 records only ¾1.8 cm=kyr (sampleresolution ¾1000 yr). In most cores the relation be-tween faunal data on one hand and δ18O decreaseduring Termination I on the other appears to besimilar at the end of IRD deposition, implying thatoceanographic changes in the Nordic seas since thefinal stage of the last deglaciation occurred rapidlyand without major time lag.
In PS1243 there is a significant increase in polarabundances between 8–7 ka. This cooling event canalso be observed in other cores (M17732, M23063)
H.A. Bauch et al. / Palaeogeography, Palaeoclimatology, Palaeoecology 145 (1999) 95–117 103
104 H.A. Bauch et al. / Palaeogeography, Palaeoclimatology, Palaeoecology 145 (1999) 95–117
H.A. Bauch et al. / Palaeogeography, Palaeoclimatology, Palaeoecology 145 (1999) 95–117 105
but appears to be restricted to the Norwegian Sea(Bauch and Weinelt, 1997). In general, the faunalrecords of al cores during the Holocene optimum re-flect the present day situation: subpolar abundancesare highest along the Arctic Front and within theAtlantic Domain whereas the western part revealsa dominance of the polar species. Another inter-esting feature is the continuous abundance decreasein subpolar species in the Arctic Domain after 5ka. Similar changes are also recognized in diatomrecords from the Iceland Sea (Koc et al., 1993) andin shelf sediments from SE Greenland (Williams etal., 1995). Altogether, these records indicate that therelative temperature gradient in the surface water be-tween the western and the eastern Nordic seas hassteepened since the end of the Holocene climaticoptimum.
3.4. Eemian record
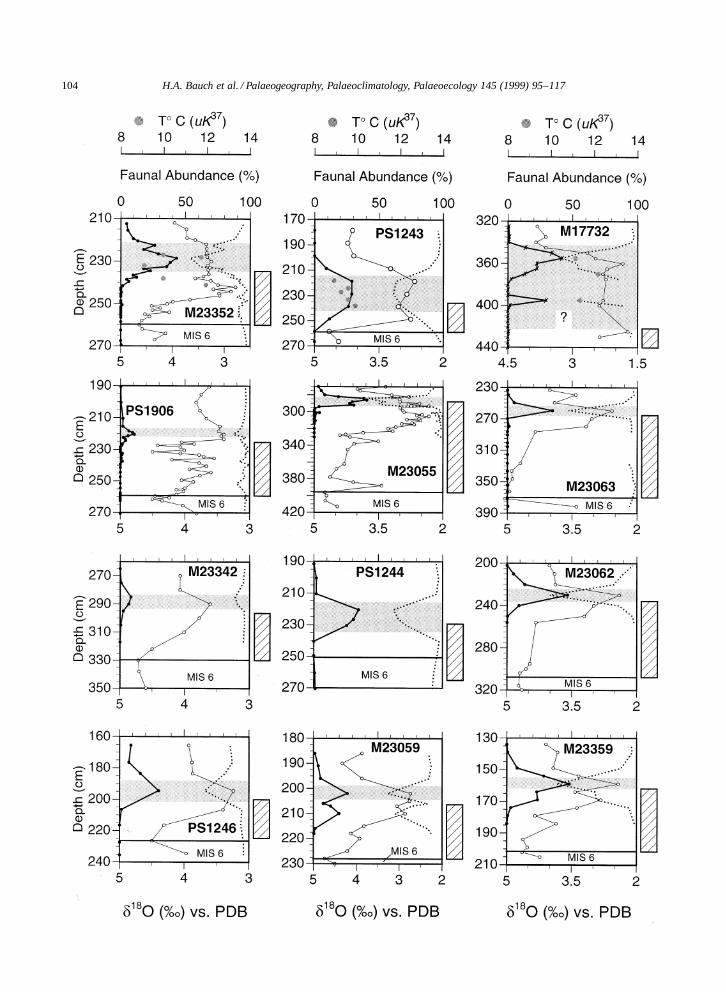
The variations in relative abundances of T. quin-queloba and N. pachyderma sin. in comparison tothe isotope record for the time period of the lastinterglacial are given in Fig. 5. The highest val-ues of T. quinqueloba correlate well with the upperpart of MIS 5e, i.e., the IRD-free section. Like inthe Holocene, the increase of this species starts to-wards the end of the deglacial interval. Within thedeglacial core sections δ18O records reveal charac-teristic low values in most cores. These anomaliesare recognized in cores from either side of the south-ern Nordic seas (see cores M23055, M17732, andM23352 in Fig. 5) and it is believed that they reflectmeltwater discharge from thawing icebergs pairedwith increased surface warming due to the rise insolar irradiance during Termination II (Crowley andKim, 1994; Bauch et al., 1996). In all cores IRD wasnoted again above the maximum of T. quinqueloba.Together with a simultaneous increase in δ18O values(see Figs. 2 and 3) this reappearance of IRD impliesenhanced iceberg calving around the Nordic seas
Fig. 5. Eemian faunal records (%) of the subpolar species T. quinqueloba (filled circle) and the polar species N. pachyderma sin.(stippled line) in comparison with planktic δ18O analyzed on N. pachyderma sin. (open circle). The shaded interval represents the marineinterglacial optimum (MIO) as interpreted from the faunal evidence. The hatched bar marks the glacial–interglacial transition after MIS 6(Termination II) and the upper limit of this bar the observed last occurrence of deglacial IRD. Grey dots in the graphs of cores M17732,M23352, and PS1243 relate to the U K 0
37 temperature estimates (data from Table 2). Note the different scales for the δ18O records.
and a change in global ice volume towards the endof MIS 5e (Bauch et al., 1996).
4. Eemian vs. Holocene: palaeoceanographic andclimatic implication
4.1. Estimates of surface water temperaturegradients
As the data above have shown, among the plankticforaminiferal assemblage Turborotalita quinquelobahas proven to be the best interglacial indicatorspecies in the Nordic seas due to its widespreadoccurrence only in warm and iceberg-free intervalsand, thus, its obvious relation to times of thermoha-line water mass circulation. In the ice-free IcelandSea plankton tow studies have revealed that thissymbiont-bearing species predominantly occurs inthe upper 50 m of the water column and within nor-mal marine salinities (Carstens, 1991). This habitatis well above the main calcification depth commonlyattributed to N. pachyderma sin., which lies deeper,between 100–200 m (Hemleben et al., 1989). In thewestern areas of the Iceland Sea and the Fram Strait,which are covered by sea-ice and a halocline duringsummer, T. quinqueloba lives between ¾50–100 mwater depth and distinctly within the higher salinitywaters (Carstens, 1991; Carstens et al., 1997). Thisindicates that T. quinqueloba usually despises brack-ish waters, an assumptions which seems consistentwith our observation of highest abundance of thisspecies only during IRD-free core intervals. It canthus be concluded that the maxima in abundanceof T. quinqueloba noted for the Holocene and theEemian reflect times of full-marine conditions dur-ing these two interglaciations, at least with regard tosea surface salinities which in this area are inherentlylinked to the advection of relatively high-salinity N.Atlantic surface water.
In terms of ’absolute’ SST difference between the

106 H.A. Bauch et al. / Palaeogeography, Palaeoclimatology, Palaeoecology 145 (1999) 95–117
Fig. 6. Modern mean SSTs in the Nordic seas for the summer months of the period 1950–1990 (Environmental Working Group, 1998).Both, U K 0
37 -derived SSTs and the faunal records from the Holocene reveal geographical gradients, which are similar to this modern SSTdistribution (compare with Figs. 4 and 5).
two interglaciations, the results of the alkenone anal-yses are given in Table 2 for cores M23352, PS1243,and M17732 (along an E–W transect at about 70ºN).We also have analysed core PS1906 from the BoreasBasin but failed to find any alkenone signal in theEemian core section and only traces were detected inHolocene samples. Compared with the modern SSTsthe U K 0
37 -derived average SSTs for the Holocene fitmodern temperature distribution in general patternbut not in absolute value (Table 2; Figs. 4–6). Thisdeviation from the modern distribution may be dueeither because we mainly analysed the climatic op-timum or the common U K 0
37 -temperature calibrationsare not perfectly adjusted to estimate the relatively
cold SSTs in a polar–subpolar region. We do notregard the short evolutionary changes in coccol-ithophorid species composition as a problem, be-cause Emiliani huxleyi and species of the genusGephyrocapsa are also present in Eemian sedimentsfrom the Nordic seas (Bleil and Gard, 1989; Bau-mann, 1990). Moreover, recent downcore studiesindicate that both of these groups produce compa-rable C37 : C38 alkenone ratios (Muller et al., 1997).Regardless of these various problems, the averageU K 0
37 -temperatures calculated for the Holocene andEemian at the three investigated sites clearly corrob-orate the trends inferred from the relative proportionsof subpolar and polar foraminifera: Site M23352
H.A. Bauch et al. / Palaeogeography, Palaeoclimatology, Palaeoecology 145 (1999) 95–117 107
Fig. 7. Geographical distribution of faunal data (%) from Figs. 4 and 5 for the Holocene and Eemian MIOs, respectively. Numbers inparentheses refer to N. pachyderma sin. and the other numbers to T. quinqueloba. Due to different sampling intervals applied on theinterglacial core sections, the shown numbers of T. quinqueloba are the highest observed in a specific region — for N. pachyderma sin.the lowest — and are, therefore, equal or smaller than the actual peak abundance of the MIO. Despite some differences in sample densityapplied to Holocene and Eemian core intervals, our values of N. pachyderma sin. (%) agree with other data from this area (Fronval andJansen, 1997).
shows a warmer Eemian than Holocene whereas incores PS1243 and M17732 SSTs appear cooler inthe Eemian than in the Holocene.
By using the maximum values of the faunal datagiven in Figs. 4 and 5 it is possible to deduce abasic palaeoceanographic scenario for the Holoceneand Eemian MIOs. From this it follows that bothof these intervals show a general south to northdecrease in subpolar abundance (Fig. 7). However,there are marked regional differences, that is, in thegradients between the Norwegian Sea in the east,the Iceland Sea in the west, and the Boreas Basinin the north. During the Holocene by far the high-est subpolar abundances occur at the eastern sitesdirectly underlying today’s flowpath of Atlantic sur-face water. These Holocene subpolar values decreasetowards the north and the west, i.e., towards thoseregions with increasingly cooler modern surface wa-ter conditions (Fig. 6). In contrast, the Eemian faunalvalues display relatively similar conditions betweenthe Norwegian and the western Iceland Sea but asharp decrease towards the Greenland Sea and theBoreas Basin. Although Eemian conditions wereequally favourable for T. quinqueloba approximately
south of 70ºN, they were comparatively better inthe western Iceland Sea in the Eemian than in theHolocene.
It has been interpreted from surface sedimentanalyses that T. quinqueloba may be tied to water-mass frontal zones, in particular to the Arctic Front(Johannessen et al., 1994). Indeed, we also note rela-tively high abundances in Holocene sections at sitesclose to this frontal zone (cores PS1243, M23059).From this one could draw the conclusion that dur-ing the Eemian the Atlantic Domain (i.e. the ArcticFront) had shifted westwards at the expense of theArctic Domain. But besides that we observe thehighest abundances of T. quinqueloba at these sitesduring the Holocene climatic optimum (and also fur-ther east of the Arctic Front), a possible westwardshift in Eemian times is not confirmed by other data.In core PS1244, Eemian test concentrations of G.bulloides, a typical indicator for Atlantic waters inthe Nordic seas, remain as low as in the Holocene.Farther west and north this species is not present ineither interglaciation (Bauch, 1997). Nevertheless, itseems that the SE Norwegian Sea was still relativelywarm during the Eemian. This may be assumed from
108 H.A. Bauch et al. / Palaeogeography, Palaeoclimatology, Palaeoecology 145 (1999) 95–117
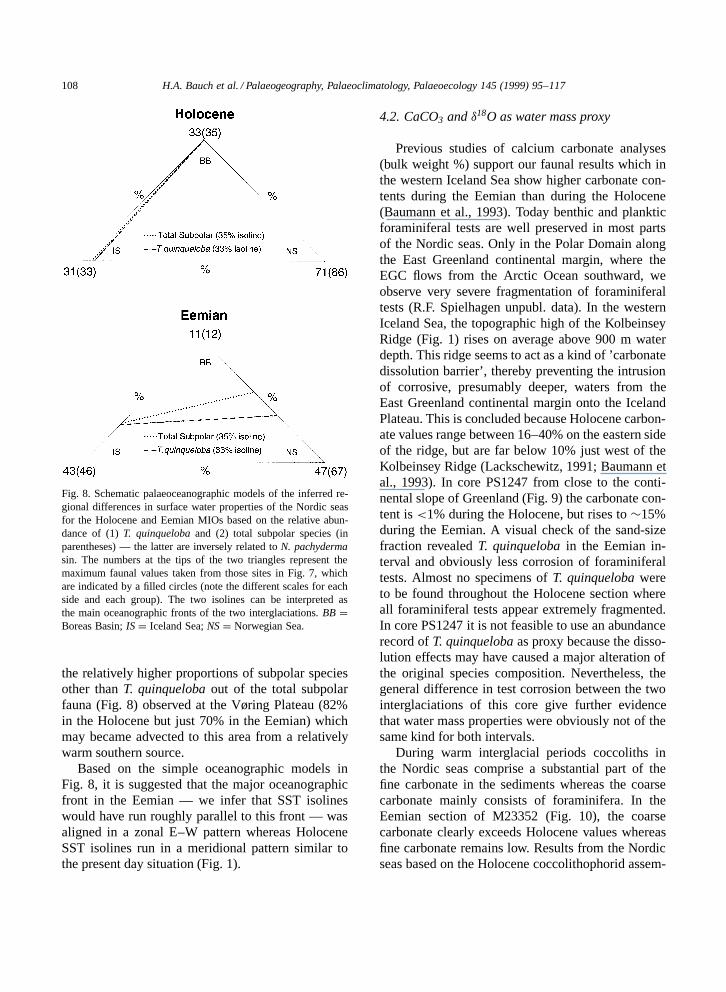
Fig. 8. Schematic palaeoceanographic models of the inferred re-gional differences in surface water properties of the Nordic seasfor the Holocene and Eemian MIOs based on the relative abun-dance of (1) T. quinqueloba and (2) total subpolar species (inparentheses) — the latter are inversely related to N. pachydermasin. The numbers at the tips of the two triangles represent themaximum faunal values taken from those sites in Fig. 7, whichare indicated by a filled circles (note the different scales for eachside and each group). The two isolines can be interpreted asthe main oceanographic fronts of the two interglaciations. BB DBoreas Basin; IS D Iceland Sea; NS D Norwegian Sea.
the relatively higher proportions of subpolar speciesother than T. quinqueloba out of the total subpolarfauna (Fig. 8) observed at the Vøring Plateau (82%in the Holocene but just 70% in the Eemian) whichmay became advected to this area from a relativelywarm southern source.
Based on the simple oceanographic models inFig. 8, it is suggested that the major oceanographicfront in the Eemian — we infer that SST isolineswould have run roughly parallel to this front — wasaligned in a zonal E–W pattern whereas HoloceneSST isolines run in a meridional pattern similar tothe present day situation (Fig. 1).
4.2. CaCO3 and Ž18O as water mass proxy
Previous studies of calcium carbonate analyses(bulk weight %) support our faunal results which inthe western Iceland Sea show higher carbonate con-tents during the Eemian than during the Holocene(Baumann et al., 1993). Today benthic and plankticforaminiferal tests are well preserved in most partsof the Nordic seas. Only in the Polar Domain alongthe East Greenland continental margin, where theEGC flows from the Arctic Ocean southward, weobserve very severe fragmentation of foraminiferaltests (R.F. Spielhagen unpubl. data). In the westernIceland Sea, the topographic high of the KolbeinseyRidge (Fig. 1) rises on average above 900 m waterdepth. This ridge seems to act as a kind of ’carbonatedissolution barrier’, thereby preventing the intrusionof corrosive, presumably deeper, waters from theEast Greenland continental margin onto the IcelandPlateau. This is concluded because Holocene carbon-ate values range between 16–40% on the eastern sideof the ridge, but are far below 10% just west of theKolbeinsey Ridge (Lackschewitz, 1991; Baumann etal., 1993). In core PS1247 from close to the conti-nental slope of Greenland (Fig. 9) the carbonate con-tent is <1% during the Holocene, but rises to ¾15%during the Eemian. A visual check of the sand-sizefraction revealed T. quinqueloba in the Eemian in-terval and obviously less corrosion of foraminiferaltests. Almost no specimens of T. quinqueloba wereto be found throughout the Holocene section whereall foraminiferal tests appear extremely fragmented.In core PS1247 it is not feasible to use an abundancerecord of T. quinqueloba as proxy because the disso-lution effects may have caused a major alteration ofthe original species composition. Nevertheless, thegeneral difference in test corrosion between the twointerglaciations of this core give further evidencethat water mass properties were obviously not of thesame kind for both intervals.
During warm interglacial periods coccoliths inthe Nordic seas comprise a substantial part of thefine carbonate in the sediments whereas the coarsecarbonate mainly consists of foraminifera. In theEemian section of M23352 (Fig. 10), the coarsecarbonate clearly exceeds Holocene values whereasfine carbonate remains low. Results from the Nordicseas based on the Holocene coccolithophorid assem-

H.A. Bauch et al. / Palaeogeography, Palaeoclimatology, Palaeoecology 145 (1999) 95–117 109
Fig. 9. Records of CaCO3 and δ18O of core PS1247 from the Greenland continental margin and below the modern track of the cold EastGreenland Current (note the much larger sample intervals applied to the δ18O record). Shaded bar marks the interval which is interpretedas the correlative of the Eemian and Holocene MIO, respectively. The stratigraphic position of the Eemian MIO is confirmed by a highpeak in CaCO3 (260–270 cm) which coincides with highest and lowest proportions of foraminifera and IRD respectively, as well asby the identification of the Pullenia bulloides horizon (¾230 cm) as stratigraphic marker for MIS 5a in this core (Birgisdottir, 1990).Foraminiferal tests in the Holocene section are less fragmented than in the Eemian interval, implying less CaCO3 corrosion. CaCO3 dataare from Birgisdottir (1990) and the δ18O record is from Kohler (1992).
blage (mainly 3 species) show a dominance of the’cold’ species C. pelagicus (Samtleben et al., 1995),which in core M23352 makes up between 80–90%of the total assemblage. This species is absent in theEemian section of this core (H. Andruleit unpubl.data).
Can the spatial and temporal trends in T. quin-queloba abundance and carbonate patterns also berecognized in stable isotope data? As already notedin core M23065 (Fig. 2), the level of oxygen isotopevalues of Holocene and Eemian times do not differmuch at the Vøring Plateau, where the main mass ofwarm Atlantic surface water enters the Nordic seas.Therefore significant interglacial climate changes are
probably difficult to identify here. They should bemore pronounced where temperature gradients aresteeper, i.e., closer to Greenland. The detailed plank-tic δ18O record of core M23352 from the NW IcelandPlateau (Fig. 10) corroborates our findings basedon T. quinqueloba and CaCO3: the Eemian intervaldiffers significantly from the Holocene. The con-stantly lower Eemian δ18O values of ¾0.25‰ duringthe IRD-free intervals would indicate a tempera-ture difference of about 1ºC (Epstein et al., 1953)at the main calcification depth of N. pachydermasin., which appears to lie between 100–200 m waterdepth even in ice-covered regions (Carstens and We-fer, 1992; Bauch et al., 1997). Therefore, an effect

110 H.A. Bauch et al. / Palaeogeography, Palaeoclimatology, Palaeoecology 145 (1999) 95–117
Fig. 10. Planktic δ18O and CaCO3 content from the NW Iceland Plateau. Note the significant Holocene=Eemian discrepancy in δ18Ovalues and the differences between fine and coarse CaCO3 content. Shaded bars mark IRD-free core sections (MIO). The prominentspike in the δ18O record prior to the Eemian MIO seems to correlate with a spike recorded in core PS1247 at a similar stratigraphic level(Fig. 9).
of other freshwater sources, e.g. from sea-ice melt-ing, river run-off, or precipitation that might haveled to a lowering of these Eemian δ18O values canalso be ruled out, because these would occur at thevery surface. Moreover, the inference that relativelynormal marine salinities existed in the upper surfacewater during this time is further corroborated by thepresumed ecological preference of T. quinqueloba tolive within a certain range of full-marine salinities(Carstens et al., 1997).
From carbonate content, T. quinqueloba abun-dance as well as from the planktic δ18O and U K 0
37records we may conclude that during the EemianMIO the influence of the cold Polar Domain on thesurface water temperature of the western Iceland Seawas weaker than in the Holocene MIO.
A strong Eemian decrease of T. quinquelobaabundances towards the north is well documentedin our cores, even though this is not really seen inthe δ18O values (Figs. 4 and 5). But closer to theFram Strait, there is further evidence that the Eemianwas indeed less ’warm’ as an interglacial than theHolocene (Fig. 11). Here, the δ18O curve shows ashift of more than 1.4‰ since the LGM. This is incontrast to the transition from MIS 6 to MIS 5e,which only varies between 0.7 to 1.0‰. As docu-mented in many benthic δ18O records from outsidethe Nordic seas, there is no reason to believe that theglobal ice volume was significantly smaller in MIS6 than in MIS 2 (e.g., Shackleton, 1987; see alsoFig. 2). Assuming that about 1‰ of the total δ18Ochange since the LGM can be attributed to the global

H.A. Bauch et al. / Palaeogeography, Palaeoclimatology, Palaeoecology 145 (1999) 95–117 111
Fig. 11. Planktic δ18O and CaCO3 records from the Fram Strait area. Note the relative difference in the δ18O values between the twoMIOs. In contrast, similar δ18O values are recorded for the glacial maxima of late MIS 6 and 2 (compare with, e.g., Fig. 10).
ice volume effect (Schrag et al., 1996), the remain-ing 0.4‰ observed in core PS1535 are either due toenhanced freshwater input or a temperature increase.In all our studied cores planktic δ18O records fromthe Nordic seas based on N. pachyderma sin. showδ18O values of about 4.5–4.8‰ for the glacial max-ima of MIS 2 and 6, indicating similar SSTs andsurface salinities for these two periods. Such valuesare also recorded for core PS1535, implying thatthe relatively small change of about 0.7–1‰ duringTermination II is either due to relatively cold surfacewater or caused by a smaller input of freshwaterfrom melted ice. A freshening of the surface water inthis region would be obviously also directly linkedto a temperature increase.
In Core PS1535 it is not a supposedly warmEemian section that reveals the lowest oxygen valuesduring MIS 5, but the later event MIS 5a (Kohlerand Spielhagen, 1990). The stratigraphic position of
MIS 5a in this core is clearly recognized by theoccurrence of the benthic foraminifera Pullenia bul-loides, which can be used as stratigraphic indicatorfor MIS 5a (Haake et al., 1992), whereas MIS 5e isalso confirmed through nannoplankton studies (Bau-mann, 1990). A relatively cold Eemian in the FramStrait region has been also interpreted by othersinvestigating coccolith abundances, various marinesedimentological proxies as well as bivalves aroundSvalbard (Gard and Backman, 1990; Hebbeln andWefer, 1997; Mangerud et al., 1998). Although thelast glacial to Holocene climate change is also welldocumented in planktic δ18O records from the ArcticOcean proper (Stein et al., 1994; Nørgaard-Pedersenet al., 1998), a similar δ18O signal for the Eemian pe-riod is not recognizable (Nørgaard-Pedersen, 1997;Spielhagen et al., 1997), implying a different type ofocean circulation in the sub-arctic region during thelatter period.
112 H.A. Bauch et al. / Palaeogeography, Palaeoclimatology, Palaeoecology 145 (1999) 95–117
5. Palaeoceanographic implication of Eemiantemperature gradients
The modern surface water circulation pattern ofthe northern Nordic seas reveals that still relativelywarm Atlantic surface water of about 2ºC intrudesthe eastern Arctic Ocean via Fram Strait by subduc-tion below the cold halocline and across the BarentsSea (Rudels, 1995; Environmental Working Group,1998). To maintain a mass-balanced water budget inthe Arctic Ocean, only as much water can leave theArctic Ocean as is replaced by Atlantic water (¾5–6Sv; Hanzlick, 1983) of which most flows throughFram Strait, as well as by water from the PacificOcean (¾0.8 Sv; Coachman and Aagaard, 1988)and Arctic rivers (¾0.1 Sv; Aagaard and Carmack,1989).
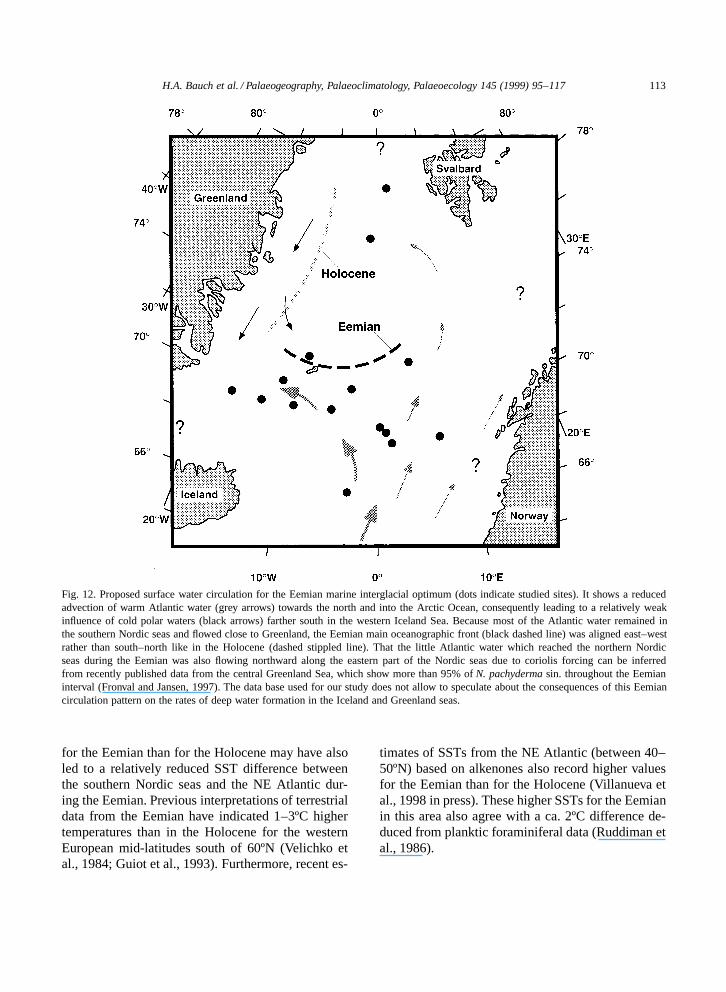
Based on the conclusions reached before, theEGC, which is the main source of cold upper waterin the Polar Domain of the Nordic seas today, didprobably not protrude as far south during the Eemianas during the Holocene. This Eemian situation can beexplained by a pattern of ocean circulation in whichthe Fram Strait area (and eastern Arctic Ocean) wassomehow shut off from a modern-type water massexchange, and only little Atlantic water reached thisArctic region. A reduced advection of Atlantic watermasses would not only have led to a decrease inthe northwardly directed ocean heat flux, but wouldhave also resulted in a much weaker outflow of coldpolar water from the Arctic Ocean itself (Fig. 12).Today, cold polar surface waters flow along the EastGreenland continental margin southward and acrossthe Greenland and Iceland seas and accounts formuch of the observed cold SSTs in these areas. Asimilarly cold western Iceland Sea cannot be inferredfrom any of the shown data for the Eemian. Instead,the main mass of inflowing warm Atlantic waterremained in the southern part of the Nordic seas.
So, why did the Atlantic surface water duringthe Eemian not influence also the northern Nordicseas the way it happens today and during most ofthe Holocene? The answer to this important ques-tion is somewhat speculative because the historyof Saalian (MIS 6) ice sheet decay in Fenoscandiaas well as the impact of the meltwater from theseice sheets on the surface water circulation in theNordic seas is rather uncertain. For the deglacial and
postglacial time after MIS 6 this impact must beassumed to have been at least as strong as duringTermination I (Sarnthein et al., 1995) and the earlyHolocene (Bauch and Weinelt, 1997). As can be in-ferred from our own data (see Figs. 2 and 3) and dataof other sediment cores from the eastern NorwegianSea (e.g., Fronval and Jansen, 1997), TerminationII penetrated far into MIS 5e, making a substantialpart of the MIS 5e interval to have been influencedby meltwater. Freshening the surface water in theNorwegian Sea during this time would have causedsalinities less suitable for most planktic foraminiferaand may have promoted sea-ice formation duringwinter season. It further would have stratified theupper water column, conditions which are thoughtto have an enormous effect on surface water circu-lation (Dickson et al., 1988; Broecker and Denton,1989; Rahmstorf, 1995). The fact that in the northernNorwegian Sea the part of MIS 5e with highest testconcentrations of subpolar species is still associatedwith some IRD may indicate lowered salinities evenwithin the MIO (Fig. 3). If the northern NorwegianSea surface water was indeed marked by relativelylow salinities in the Eemian MIO compared to theHolocene, these fresher waters in the northern Nor-wegian could have forced most of the more salineAtlantic surface water towards the west rather thanallowing it to flow further north (Fig. 12).
A variable watermass exchange between the Arc-tic Ocean and the Nordic seas may be an importantcontrol on the interglacial climate system with con-sequences for the entire N. Atlantic sector. The pro-posed Eemian zonal surface circulation would resultin a much steeper meridional temperature gradientin the eastern Nordic seas than is indicated for theHolocene. Previous investigations on the last inter-glaciation have not revealed a major deviation fromthe Holocene situation (Kellogg, 1980; Sejrup andLarsen, 1991). Our steep Eemian temperature gradi-ent probably occurred along a front that run roughlyEast–West at about 70ºN rather than between theNordic seas and the NE Atlantic as suggested byother investigators who had only very few data froma limited area of the Nordic seas at their hands(Cortijo et al., 1994; Labeyrie et al., 1995).
The paleoclimate and palaeoceanographic conse-quences of our inferred steep temperature gradientat 70ºN and a partially warmer southern Nordic seas
H.A. Bauch et al. / Palaeogeography, Palaeoclimatology, Palaeoecology 145 (1999) 95–117 113
Fig. 12. Proposed surface water circulation for the Eemian marine interglacial optimum (dots indicate studied sites). It shows a reducedadvection of warm Atlantic water (grey arrows) towards the north and into the Arctic Ocean, consequently leading to a relatively weakinfluence of cold polar waters (black arrows) farther south in the western Iceland Sea. Because most of the Atlantic water remained inthe southern Nordic seas and flowed close to Greenland, the Eemian main oceanographic front (black dashed line) was aligned east–westrather than south–north like in the Holocene (dashed stippled line). That the little Atlantic water which reached the northern Nordicseas during the Eemian was also flowing northward along the eastern part of the Nordic seas due to coriolis forcing can be inferredfrom recently published data from the central Greenland Sea, which show more than 95% of N. pachyderma sin. throughout the Eemianinterval (Fronval and Jansen, 1997). The data base used for our study does not allow to speculate about the consequences of this Eemiancirculation pattern on the rates of deep water formation in the Iceland and Greenland seas.
for the Eemian than for the Holocene may have alsoled to a relatively reduced SST difference betweenthe southern Nordic seas and the NE Atlantic dur-ing the Eemian. Previous interpretations of terrestrialdata from the Eemian have indicated 1–3ºC highertemperatures than in the Holocene for the westernEuropean mid-latitudes south of 60ºN (Velichko etal., 1984; Guiot et al., 1993). Furthermore, recent es-
timates of SSTs from the NE Atlantic (between 40–50ºN) based on alkenones also record higher valuesfor the Eemian than for the Holocene (Villanueva etal., 1998 in press). These higher SSTs for the Eemianin this area also agree with a ca. 2ºC difference de-duced from planktic foraminiferal data (Ruddiman etal., 1986).
114 H.A. Bauch et al. / Palaeogeography, Palaeoclimatology, Palaeoecology 145 (1999) 95–117
6. Conclusions
Sediment core sections from the Nordic seascovering the Eemian and Holocene intervals wereinvestigated. A multiproxy approach based mainlyon the polar=subpolar proportion in the plank-tic foraminiferal assemblage, planktic and benthicforaminiferal δ18O records, CaCO3 as well as IRDcontents supported by U K 0
37 -SST estimates was usedin order to allow for a detailed comparison of thesurface water circulation pattern of these two warmperiods. Only the proxy data from those parts ofthe two interglaciation were used for this compari-son which are characterized by lowest IRD contentand highest proportion of warm surface water indi-cating subpolar foraminifera. These parts are, thus,interpreted as the time of the marine interglacialoptimum.
All the proxy records investigated indicate for theEemian a comparatively cooler northern Nordic seas(ca. north of 70º latitude) than for the Holocene dueto a reduction in the northwardly flow of Atlanticsurface water on one hand and, consequently, lessoutflow of polar waters from the Arctic Ocean onthe other. For the southern part of the Nordic seasslightly higher Eemian sea surface temperature canbe deduced from our data for the western Iceland Seacompared to the Norwegian Sea, which is contrary tothe Holocene situation. The IRD records in relationto subpolar abundance and δ18O clearly indicate thatTermination II penetrated far into MIS 5e, possiblydue to reduced salinities in the surface water of thenorthern Norwegian Sea. Such conditions may haveaffected surface water circulation in the way thatdespite coriolis forcing most of the Atlantic waterwas deflected into the Iceland Sea rather than flowingfurther north towards Fram Strait and into the ArcticOcean as today. The particular Eemian conditionsresulted in a zonal surface water circulation with asteep meridional temperature gradient in SSTs.
If our Eemian scenario of a strong meridionaltemperature gradient between the Arctic Ocean andsouthern Nordic seas is correct, then this situationshould have left an imprint on the polar regionsitself. A relatively cold northern Eurasian margincould have resulted in more glaciated areas with con-sequences for the atmospheric circulation patterns,sea-ice cover, and albedo at these high northern lati-
tudes. Obviously, this hypothesis may be difficult toprove in those areas which after the Eemian wereoverrun by the Fenoscandian, Barents and Kara icesheets of Weichselian age. Instead such evidencemay be preserved in biotic records from ArcticSiberia, a region which is far beyond Atlantic mois-ture supply and which, therefore, probably remainedrather unaffected by the dynamic behaviour of largeice sheets.
The revealed fundamental differences betweenthe Eemian and Holocene periods indicate that aone to one modern climatic analog may be dif-ficult to find in late Quaternary records. But thedata also show that Eemian climate conditions arestill in many respect Holocene-like. Therefore, thisperiod remains an object well suited for climatemodelling, because it can be studied from its begin-ning after glacial MIS 6 until it terminated towardsMIS 5.4. Moreover, since highest temperatures ex-ceeded those of the Holocene optimum and sea levelwas higher by several meters, the marine records ofthe Eemian should provide important information ofthose changes which may occur in the near future.
Acknowledgements
We are indebted to the shipboard crews of RVMeteor and RV Polarstern for collecting the sedi-ment cores from the Nordic seas. Thanks are alsoexpressed to the Deutsche Forschungsgemeinschaftfor providing most of the financial support to carryout this study through Sonderforschungsbereich 313at Kiel University (Publication No. 316). We are alsograteful to W.W. Hay for comments on the text, to R.Cheddadi and G. Ganssen for their helpful reviewingremarks, and to L. Timokhov for making availablenew oceanographic data.
References
Aagaard, K., Carmack, E., 1989. The role of sea ice and otherfreshwater in the Arctic circulation. J. Geophys. Res. 94,14485–14498.
Bard, E., Rostek, F., Sonzogni, C., 1997. Interhemisphericsynchrony of the last deglaciation inferred from alkenonepalaeothermometry. Nature 385, 707–710.
Bauch, H.A., 1992. Test size variation of planktic foraminifers

H.A. Bauch et al. / Palaeogeography, Palaeoclimatology, Palaeoecology 145 (1999) 95–117 115
as response to climatic changes. International Conference onPaleoceanography (ICP 4). GEOMAR Report 15, 56.
Bauch, H.A., 1993. Planktische Foraminiferen im EuropaischenNordmeer — ihre Bedeutung fur die palaozeanographischeInterpretation wahrend der letzten 600,000 Jahre. Report SFB313 Kiel Univ. 40, 1–108.
Bauch, H.A., 1994. Significance of variability in Turborotalitaquinqueloba (Natland) test size and abundance for paleoceano-graphic interpretations in the Norwegian–Greenland Sea. Mar.Geol. 121, 129–141.
Bauch, H.A., 1996. Monitoring Termination II at high latitude:Anomalies in the planktic foraminiferal record. Mar. Geol.131, 89–102.
Bauch, H.A., 1997. Paleoceanography of the N. Atlantic Ocean(68º–78ºN) during the past 450 ky deduced from plankticforaminiferal assemblages and stable isotopes. In: Hass, H.C.,Kaminski, M.A. (Eds.), Contributions to the Micropaleontol-ogy and Paleoceanography of the Northern North Atlantic.Grzybrowski Found. Spec. Publ. 5, 83–100.
Bauch, H.A., Weinelt, M.S., 1997. Surface water changes inthe Norwegian Sea during last deglacial and Holocene times.Quat. Sci. Rev. 16 (10), 1115–1124.
Bauch, H.A., Erlenkeuser, H., Grootes, P.M., Jouzel, J., 1996.Implications of stratigraphic and paleoclimatic records of thelast interglaciation from the Nordic seas. Quat. Res. 46, 260–269.
Bauch, D., Carstens, J., Wefer, G., 1997. Oxygen isotope com-position of living Neogloboquadrina pachyderma (sin.) in theArctic Ocean. Earth Planet. Sci. Lett. 146, 47–58.
Baumann, M., 1990. Coccoliths in sediments of the eastern Arc-tic Basin. In: Bleil, U., Thiede, J. (Eds.), Geological Historyof the Polar Oceans: Arctic versus Antarctic. Kluwer, Norwell,pp. 437–445.
Baumann, K.-H., Lackschewitz, K.S., Erlenkeuser, H., Henrich,R., Junger, B., 1993. Late Quaternary calcium carbonate sed-imentation and terrigenous input along the east Greenlandcontinental margin. Mar. Geol. 114, 13–36.
Baumann, K.H., Lackschewitz, K.S., Mangerud, J., Spielhagen,R.F., Wolf-Welling, T.C.W., Henrich, R., Kassens, H., 1995.Reflections of Scandinavian ice sheet fluctuations in Norwe-gian sea sediments during the past 150,000 years. Quat. Res.43, 185–197.
Be, A.W., Tolderlund, D.S., 1971. Distribution and ecology ofliving planktonic foraminifera in surface waters of the At-lantic and Indian Oceans. In: Funnel,B.M., Riedel,W.R. (Eds.),The Micropaleontology of the Oceans. Cambridge UniversityPress, Cambridge, pp. 105–149.
Belanger, P.E., 1982. Paleo-oceanography of the Norwegian-Sea during the past 130,000 years: Coccolithophorid andforaminiferal data. Boreas 11, 29–36.
Birgisdottir, L., 1990. Die palao-ozeanographische Entwicklungder Island See in den letzten 550,000 Jahren. Report SFB 313Kiel Univ. 34, 1–112.
Bleil, U., Gard, G., 1989. Chronology and correlation of Qua-ternary magnetostratigraphy and nannofossil biostratigraphyin Norwegian–Greenland Sea sediments. Geol. Rundsch. 78,1173–1187.
Broecker, W.S., Denton, G.H., 1989. The role of ocean–atmosphere reorganizations in glacial cycles. Geochim. Cos-mochim. Acta 53, 2465–2501.
Boden, P., Backman, J., 1996. A laminated sediment sequencefrom the northern North Atlantic and its climatic record.Geology 24, 507–510.
Carstens, J., 1991. Verteilung planktischer Foraminiferen in derWassersaule. In: Thiede, J., Hempel, G. (Eds.), The ExpeditionARKTIS-VII=1 of RV Polarstern in 1990. Reports Polar Res.80, 60–62.
Carstens, J., Wefer, G., 1992. Recent distribution of planktonicforaminifera in the Nansen Basin, Arctic Ocean. Deep-SeaRes. 39, 507–524.
Carstens, J., Hebbeln, D., Wefer, G., 1997. Distribution of plank-tic foraminifera at the ice margin. Mar. Micropaleontol. 29,257–269.
CLIMAP, 1981. Seasonal reconstructions of the earth’s surfaceat the last glacial maximum. Geological Society America,Boulder CO, Chart Series MC-36.
CLIMAP (Project Members), 1984. The last interglacial ocean.Quat. Res. 21, 123–224.
Coachman, L.K., Aagaard, K., 1988. Transport through BeringStrait: Annual and interannual variability. J. Geophys. Res. 93(C12), 15535–15539.
COHMAP Members, 1988. Climate changes of the last 18000years: observations and model simulations. Science 241,1043–1052.
Conte, M.H., Eglinton, G., 1993. Alkenone and alkenoate distri-butions within the euphotic zone of the eastern north Atlantic:correlation with production temperature. Deep-Sea Res. 40,1935–1961.
Cortijo, E., Duplessy, J.-C., Labeyrie, L., Leclaire, H., Duprat, J.,van Weering, T.C.E., 1994. Eemian cooling in the NorwegianSea and North Atlantic ocean preceding continental ice-sheetgrowth. Nature 372, 446–449.
Crowley, T.J., Kim, K.-Y., 1994. Milankovitch forcing of the lastinterglacial sea level. Science 265, 1566–1568.
Dickson, R., Meincke, J., Malmberg, S.-A., Lee, A., 1988.The ’Great Salinity Anomaly’ in the Northern North Atlantic1968–1982. Progr. Oceanogr. 20, 103–151.
Dietrich, G., 1969. Atlas of the hydrography of the North-ern North Atlantic Ocean. Conseil International pourL’Exploration de la Mer Service Hydrographique, Chalotten-lund Slot Danemark.
Duplessy, J.C., Labeyrie, L., Blanc, P.L., 1988. Norwegian SeaDeep Water variations over the last climatic cycle: Paleo-oceanographical implications. In: Wanner, H., Siegenthaler, U.(Eds.), Long and Short Term Variability of Climate. Springer,New York, pp. 83–116.
Environmental Working Group, 1998. Joint U.S.–Russian atlasof the Arctic Ocean: Oceanography atlas for the summerperiod. NSIDC Boulder, CO, Version 1.0.
Epstein, S., Buchsbaum, R., Lowenstam, H.A., Urey, H.C.,1953. Revised carbonate–water isotopic temperature scale.Bull. Geol. Soc. Am. 65, 1315–1328.
Fahl, K., Stein, R., 1998. Biomarkers as organic-carbon-source
116 H.A. Bauch et al. / Palaeogeography, Palaeoclimatology, Palaeoecology 145 (1999) 95–117
and environmental indicators in the Late Quaternary ArcticOcean: ‘problems and perspectives’. Mar. Chem., in press.
Fronval, T., Jansen, E., 1996. Rapid changes in Ocean circulationand heat flux in the Nordic seas during the last interglacialperiod. Nature 383, 806–810.
Fronval, T., Jansen, E., 1997. Eemian and early Weichselian(140–60 ka) paleoceanography and paleoclimate in the Nordicseas with comparisons to Holocene conditions. Paleoceanog-raphy 12, 443–462.
Gard, G., Backman, J., 1990. Synthesis of Arctic and Sub-Arcticcoccolith biochronology and history of North Atlantic DriftWater Influx during the last 500,000 years. In: Bleil, U.,Thiede, J. (Eds.), Geological History of the Polar Oceans:Arctic versus Antarctic. Kluwer, Norwell, pp. 417–436.
Guiot, J., de Beaulieu, J.L., Chedaddi, R., David, F., Ponel, P.,Reille, M., 1993. The climate in western Europe during thelast glacial=interglacial cycle derived from pollen and insectsremains. Palaeogeogr. Palaeoclimatol. Palaeoecol. 103, 73–93.
Haake, F.W., Pflaumann, U., 1989. Late Pleistocene foraminiferalstratigraphy on the Vøring Plateau, Norwegian Sea. Boreas 18,343–356.
Haake, F.W., Erlenkeuser, H., Pflaumann, U., 1992. Pullenia bul-loides (ORBIGNY) in sediments of the Norwegian=GreenlandSea and the Northeastern Atlantic Ocean: Paleo-oceanographicevidence. In: Studies in Benthic Foraminifera, Benthos ’90.Conf. Proc. Benthos ’90. Tokai University Press, Sendai, pp.235–244.
Hanzlick, D., 1983. The West Spitsbergen Current: Transport,forcing and variability. PhD thesis, Univ. of Washington, pp.127
Hebbeln, D., Wefer, G., 1997. Late Quaternary paleoceanographyin the Fram Strait. Paleoceanography 12, 65–78.
Hemleben, C., Spindler, M., Anderson, O.R., 1989. ModernPlanktonic Foraminifera. Springer, New York, pp. 363.
Henrich, R., Kassens, H., Vogelsang, E., Thiede, J., 1989. Sedi-mentary facies of glacial=interglacial cycles in the NorwegianSea during the last 350 ka. Mar. Geol. 86, 283–319.
Johannessen, T., Jansen, E., Flatøy, A., Ravelo, A., 1994. The re-lationship between surface water masses, oceanographic frontsand paleoclimatic proxies in surface sediments of the Green-land, Iceland, Norwegian Seas. In: Zahn, R., Pedersen, T.F.,Kaminski, M.A., Labeyrie, L. (Eds.), Carbon Cycling in theGlacial Ocean: constraints of the Oceans’s Role in GlobalChange. Springer, Berlin, pp. 61–85.
Keigwin, L., Curry, W., Lehman, S., Johnsen, S., 1994. The roleof the deep ocean in North Atlantic climate change between70 and 130 kyr ago. Nature 371, 323–326.
Kellogg, T.B., 1980. Paleoclimatology and paleoceanographyof the Norwegian and Greenland Seas: Glacial–interglacialcontrasts. Boreas 9, 115–137.
Kellogg, T.B., 1984. Paleoclimatic significance of subpolarforaminifera in high-latitude marine sediments. Can. J. EarthSci. 21, 189–193.
Kipp, N.G., 1976. New transfer function for estimating pastsea-surface conditions from sea-bed distribution of planktonicforaminiferal assemblages in the North Atlantic. Geol. Soc.Mem. 145, 3–41.
Koc-Karpuz, N., Jansen, E., 1992. A high-resolution diatomrecord of the last deglaciation from the SE Norwegian Sea;documentation of rapid climatic changes. Paleoceanography 7,499–520.
Koc, N., Jansen, E., Haflidason, H., 1993. Paleoceanograhicreconstructions of surface ocean conditions in the Greenland,Iceland and Norwegian Seas through the last 14 ka based ondiatoms. Quat. Sci. Rev. 12, 115–140.
Kohler, S.E.I., 1992. Spatquartare palao-ozeanographische En-twicklung des Nordpolarmeeres und Europaischen Nord-meeres anhand von Sauerstoff- und Kohlenstoff — Isotopen-verhaltnissen der planktischen Foraminifere Neogloboquad-rina pachyderma (sin.) GEOMAR Report 13, 1–104.
Kohler, S.E.I., Spielhagen, R.F., 1990. The Enigma of OxygenIsotope Stage 5 in the Central Fram Strait. In: Bleil, U.,Thiede, J. (Eds.), Geological History of the Polar Oceans:Arctic versus Antarctic. Kluwer, Dordrecht, pp. 489–497.
Labeyrie, L.D., Duplessy, J.C., Blanc, P.L., 1987. Variations inmode of formation and temperature of oceanic deep waterover the past 125,000 years. Nature 327, 477–482.
Labeyrie, L., Vidal, L., Cortijo, E., Paterne, M., Arnold, M., Du-plessy, J., Vautravers, M., Labracherie, M., Duprat, J., Turon,J., Grousset, F., Van Weering, T., 1995. Surface and deep hy-drology of the northern Atlantic ocean during the past 150,000years. Philos. Trans. R. Soc. London B 348, 255–264.
Lackschewitz, K.S., 1991. Sedimentation am aktiven mit-telozeanischen Kolbeinsey Rucken (N’Island) — Vulkanischund klimatisch gesteuerte Ablagerungsprozesse im Spatquar-tar. GEOMAR Report 9, 1–133.
Lehman, S.J., Jones, G.A., Keigwin, L.D., Andersen, E.S.,Butenko, G., Østmo, S.-R., 1991. Initiation of Fennoscan-dian ice-sheet retreat during the last deglaciation. Nature 349,513–516.
Mangerud, J., Lie, S.E., Furnes, H., Kristiansen, I.L., Lømo, L.,1984. A Younger Dryas ash bed in Western Norway, and itspossible correlations with tephra in cores from the NorwegianSea and the North Atlantic. Quat. Res. 21, 85–104.
Mangerud, J., Dokken, T., Hebbeln, D., Heggen, B., Ingolfsson,O., Landvik, J., Mejdahl, V., Svendsen, J.I., 1998. Fluctuationsof the Svalbard–Barents Sea ice sheet, the last 150,000 years.Quat. Sci. Rev. in press.
Martinson, D.G., Pisias, N.G., Hays, J.D., Imbrie, J., Moore,T.C., Shackleton, N.J., 1987. Age dating and the orbital the-ory of the Ice Ages: Development of a high-resolution 0 to300,000 years chronostratigraphy. Quat. Res. 27, 1–29.
McManus, J., Bond, G., Broecker, W., Johnsen, S., Labeyrie, L.,Higgins, S., 1994. High-resolution climate records from theNorth Atlantic during the last interglacial. Nature 371, 326–329.
Muller, P.J., Cepek, M., Ruhland, G., Schneider, R., 1997.Alkenone and coccolithophorid species changes in late Qua-ternary sediments from the Walvis Ridge: implications for thealkenone paleotemperature method. Palaeogeogr. Palaeoclima-tol. Palaeoecol. 135, 71–96.
Nees, S., Struck, U., 1994. The biostratigraphic and pale-oceanographic significance of Siphotextularia roslhauseni
H.A. Bauch et al. / Palaeogeography, Palaeoclimatology, Palaeoecology 145 (1999) 95–117 117
Phleger and Parker in Norwegian–Greenland Sea sediments. J.Foraminiferal Res. 24, 233–240.
Nesje, A., Kvamme, M., 1991. Holocene glacier and climatevariations in western Norway: Evidence for early Holoceneglacier demise and multiple Neoglacial events. Geology 19,610–612.
Nørgaard-Pedersen, N., 1998. Late Quaternary Arctic Oceansediment records: surface ocean conditions and provenance ofice-rafted debris. GEOMAR Rep. 65, 1–115.
Nørgaard-Pedersen, N., Spielhagen, R.F., Thiede, J., Kassens, H.,1998. Central Arctic surface ocean environment during thepast 80,000 years. Paleoceanography 13 (2), 193–204.
Prahl, F.G., Wakeham, S.G., 1987. Calibration of unsaturationpattern in long-chain ketone composition for paleotemperatureassessment. Nature 320, 367–369.
Rahmstorf, S., 1995. Bifurcations of the Atlantic thermohalinecirculation in response to changes in the hydrological cycle.Nature 378, 145–149.
Rosell-Mele, A., Eglinton, G., Pflaumann, U., Sarnthein, M.,1995. Atlantic core-top calibration of U K 0
37 index as a sea-sur-face paleotemperature indicator. Geochim. Cosmochim. Acta59, 3099–3107.
Ruddiman, W.F., Shackleton, N.J., McIntyre, A., 1986. NorthAtlantic sea-surface temperatures for the last 1.1 million years.In: Summerhayes, C.P., Shackleton, N.J. (Eds.), North AtlanticPaleoceanography. Geol. Soc. Spec. Publ. 21, 155–173.
Rudels, B., 1995. The thermohaline circulation of the Arctic andthe Greenland seas. Philos. Trans. R. Soc. London 352, 1–13.
Samtleben, C., Schafer, P., Andruleit, H., Baumann, A., Bau-mannn, K.-H., Kohly, A., Mathiessen, J., Schroder-Ritzrau,A., 1995. Plankton in the Norwegian-Greenland Sea: fromliving communities to sediment assemblages — an actualisticapproach. Geol. Rundsch. 84, 108–136.
Sarnthein, M., Jansen, E., Weinelt, M.S., Arnold, M., Duplessy,J.-C., Erlenkeuser, H., Flatøy, A., Johannessen, G., Johan-nessen, T., Jung, S., Koc, N., Labeyrie, L., Maslin, M., Pflau-mann, U., Schulz, H., 1995. Variations in Atlantic surfaceocean paleoceanography, 50º–80ºN: A time-slice record of thelast 30,000 years. Paleoceanography 10, 1063–1094.
Schrag, D.P., Hampt, G., Murray, D.W., 1996. Pore fluid con-straints on the temperature and oxygen isotopic compositionof the glacial ocean. Science 272, 1930–1932.
Sejrup, H.P., Larsen, E., 1991. Eemian–Early Weichselian N–S
temperature gradients; North Atlantic–NW Europe. Quat. Int.10/12, 161–166.
Shackleton, N.J., 1987. Oxygen isotopes, ice volume and sealevel. Quat. Sci. Rev. 6, 183–190.
Sikes, E.L., Volkman, J.K., 1993. Calibration of alkenones unsat-uration ratios (U K 0
37 ) for paleotemperature estimation in coldpolar waters. Geochim. Cosmochim. Acta 57, 1883–1889.
Spielhagen, R.F., Bonani, G., Eisenhauer, A., Frank, M., Fred-erichs, T., Kassens, H., Kubik, P.W., Mangini, A., Nørgaard-Pedersen, N., Nowaczyk, N.R., Schaper, S., Stein, R., Thiede,J., Tiedemann, R., Wahsner, M., 1997. Arctic Ocean evidencefor late Quaternary initiation of northern Eurasian ice sheets.Geology 25, 738–786.
Stein, R., Nam, S.-I., Schubert, C., Vogt, C., Futterer, D., Heine-meier, J., 1994. The last deglaciation event in the easternCentral Arctic Ocean. Science 264, 692–696.
Struck, U., 1995. Stepwise post-glacial migration of benthicforaminifera into the abyssal NE Norwegian Sea. Mar. Mi-cropaleontol. 26, 207–213.
Stute, M., Forster, M., Frischkorn, H., Serejo, A., Clark, J.F.,Schlosser, P., Broecker, W.S., Bonani, G., 1995. Cooling oftropical Brazil (5ºC) during the last glacial maximum. Science269, 379–383.
Swift, J., 1986. The Arctic Waters. In: Hurdle, B. (Ed.), TheNordic Seas. Springer, New York, pp. 129–151.
Velichko, A.A., Barash, M.S., Grichuk, M.P., Gurtoyova, Y.Y.,Zelikson, E.M., 1984. Climate of the northern hemisphere inthe last interglacial (Mikulino). Russ. Acad. Sci. USSR, Ser.Geogr. N1, 30–45.
Villanueva, J., Grimalt, J.O., Vidal, L., Cortijo, E., Labeyrie,L., 1998. Assessment of SST variations in the North AtlanticOcean using the Uk37 index. Geochim. Cosmochim. Acta, inpress.
Vogelsang, E., 1990. Palao-Ozeanographie des EuropaischenNordmeeres anhand stabiler Kohlenstoff- und Sauerstoffiso-tope. Report SFB 313 Kiel Univ. 23, 1–136.
Williams, K.M., Andrews, J.T., Weiner, N.J., Mudie, P.J., 1995.Late Quaternary paleoceanography of the mid- to outer con-tinental shelf, East Greenland. Arct. Antarct. Res. 27, 352–363.
Woillard, G.M., 1978. Grande Pile peat bog: A continuous pollenrecord for the last 140,000 years. Quat. Res. 9, 1–21.
Copyright © 2022 FDOKUMEN