Genetic correlations between mandibular molar cusp areas in baboons
Upload
independentCategory
view
0download
0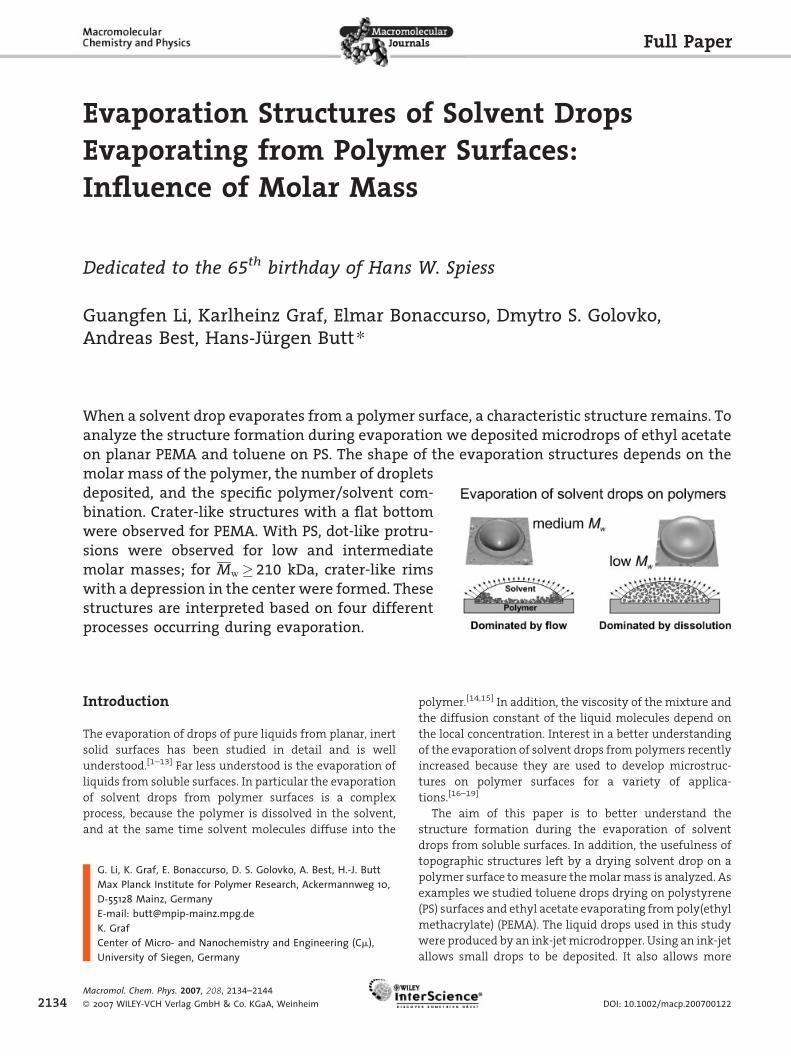
Full Paper
2134
Evaporation Structures of Solvent DropsEvaporating from Polymer Surfaces:Influence of Molar Mass
Dedicated to the 65th birthday of Hans W. Spiess
Guangfen Li, Karlheinz Graf, Elmar Bonaccurso, Dmytro S. Golovko,Andreas Best, Hans-Jurgen Butt*
When a solvent drop evaporates from a polymer surface, a characteristic structure remains. Toanalyze the structure formation during evaporation we deposited microdrops of ethyl acetateon planar PEMA and toluene on PS. The shape of the evaporation structures depends on themolar mass of the polymer, the number of dropletsdeposited, and the specific polymer/solvent com-bination. Crater-like structures with a flat bottomwere observed for PEMA. With PS, dot-like protru-sions were observed for low and intermediatemolar masses; for Mw� 210 kDa, crater-like rimswith a depression in the center were formed. Thesestructures are interpreted based on four differentprocesses occurring during evaporation.
Introduction
The evaporation of drops of pure liquids from planar, inert
solid surfaces has been studied in detail and is well
understood.[1–13] Far less understood is the evaporation of
liquids from soluble surfaces. In particular the evaporation
of solvent drops from polymer surfaces is a complex
process, because the polymer is dissolved in the solvent,
and at the same time solvent molecules diffuse into the
G. Li, K. Graf, E. Bonaccurso, D. S. Golovko, A. Best, H.-J. ButtMax Planck Institute for Polymer Research, Ackermannweg 10,D-55128 Mainz, GermanyE-mail: [email protected]. GrafCenter of Micro- and Nanochemistry and Engineering (Cm),University of Siegen, Germany
Macromol. Chem. Phys. 2007, 208, 2134–2144
� 2007 WILEY-VCH Verlag GmbH & Co. KGaA, Weinheim
polymer.[14,15] In addition, the viscosity of the mixture and
the diffusion constant of the liquid molecules depend on
the local concentration. Interest in a better understanding
of the evaporation of solvent drops from polymers recently
increased because they are used to develop microstruc-
tures on polymer surfaces for a variety of applica-
tions.[16–19]
The aim of this paper is to better understand the
structure formation during the evaporation of solvent
drops from soluble surfaces. In addition, the usefulness of
topographic structures left by a drying solvent drop on a
polymer surface to measure the molar mass is analyzed. As
examples we studied toluene drops drying on polystyrene
(PS) surfaces and ethyl acetate evaporating from poly(ethyl
methacrylate) (PEMA). The liquid drops used in this study
were produced by an ink-jet microdropper. Using an ink-jet
allows small drops to be deposited. It also allows more
DOI: 10.1002/macp.200700122
Evaporation Structures of Solvent Drops Evaporating from Polymer Surfaces: . . .
drops to be deposited at the same position while or after
the previous drop has evaporated. This adds another
dimension to the possibilities of creating surface topol-
ogies and using them to analyze the molar mass of the
underlying substrate. The surface structures left on the
polymer surface were less than 200 mm in diameter and
3 mm in height/depth. Therefore the technique is almost
non-invasive and little material is required. It is a relative
method and depends on the specific chemical structure of
the polymer and the nature of the solvent.
Experimental Part
Polystyrene (PS) was synthesized by anionic polymerization. The
molar masses and polydispersities were Mw ¼ 20.9, 24.3, 29.6, 62.5,
97.5, 210, 339, 643, 1 102, 1 445 kDa and Mw=Mn ¼1.03, 1.05, 1.03,
1.06, 1.04, 1.07, 1.07, 1.10, 1.09, 1.16, respectively. To produce flat,
smooth surfaces, PS powder was compression-molded at 160 8Cunder vacuum into transparent disks that were 25 mm wide
(except for PS of Mw ¼ 20.9 kDa, which formed an opaque sample).
The PS samples were cleaned with methanol (HPLC grade) in an
ultrasonic bath for 15 min prior to the deposition of toluene drops
(HPLC grade, Merck KGaA, Darmstadt, Germany, surface tension at
20 8C: g ¼28.4 mN �m�1).
Poly(ethyl methacrylate) (PEMA, PSS GmbH, Mainz, Germany)
with molar masses of Mw ¼ 4.7, 7.5, 45, 142, 500 kDa and
polydispersity indices of Mw=Mn ¼ 1.08, 1.07, 1.05, 1.02, 1.11,
respectively, was compression-molded as a powder at 100 8Cunder vacuum into transparent disks that were 25 mm wide.
The PEMA samples were rinsed with pure water several times
before depositing ethyl acetate drops (CH3CH2OCOCH3, ana-
lytical grade, Sigma-Aldrich, Chemie GmbH, Germany; g ¼23.8 mN �m�1 at 20 8C).
Solvent drops were placed onto the polymer surfaces with a
home-made piezoelectric droplet generator (Verfahrenstechnik,
Universitat Bremen, Germany). Each droplet was expelled by
contraction impulses of the piezo of 1 ms, located around an
adapted drop-on-demand nozzle at a distance of approximately
0.3 mm from the sample. The frequency of the drop expulsion can
be in the range of about 1 kHz to some seconds. The nozzle had
outer and inner diameters of 1 mm and 45 mm, respectively. The
drops had diameters of 40–60 mm and thus a typical volume of
V�50 pL was ejected. A camera system consisting of an objective
5� (Mitutoyo, Japan), a 6.5� ultra-zoom tube (Navitar Inc.
Rochester, NY, USA) and a uEye UI-2210-C, 1/200 CCD camera
(VGA IDS Imaging Development Systems GmbH, Obersulm,
Germany), together with a white-light source (KL 1500 LCD,
Schott, Mainz, Germany) were used to visualize the process. The
optical resolution was about 1 mm. Digitized images were stored
and analyzed (1.05 mm pixel size). The height and diameter of the
droplets in the images were measured manually. From the derived
drop height h0 and contact radius a, the contact angle Q was
calculated as Q¼ 2 arctan(h0/a).
After drop evaporation the topography of the polymer surface
was imaged with a three-dimensional optical measurement
system based on white-light confocal microscopy of the disk-
scanning type (msurf, NanoFocus AG, Oberhausen, Germany).
Macromol. Chem. Phys. 2007, 208, 2134–2144
� 2007 WILEY-VCH Verlag GmbH & Co. KGaA, Weinheim
Using a 20� or 50� objective, the resolution was 1.5 and 0.6 mm
laterally and 5 and 2 nm in height, respectively.
To characterize the optical properties of the evaporation
structures, we used a commercial laser scanning confocal
microscope (Carl Zeiss, Gottingen, Germany) consisting of the
LSM 510 module and the inverted microscope model Axiovert
200M. A Plan-Neofluar 10� objective with a numerical aperture of
0.3 and a working distance of 5.6 mm was used. The optical system
was modified by adding an external 5 mW helium-neon laser
working at 633 nm, aligned perpendicular to the xy scanning
plane of the microscope and collinear to the objective lens. In order
to generate a plane wavefront the laser beam was expanded
10 times using a beam expander, working in Keplerian mode.
This modification enabled illumination of the samples in the
transmitted-light configuration. For the reflected-light configura-
tion, the 543 nm line of a 1 mW helium-neon laser was used. The
transmitted and reflected light collected from the objective was
separated with a dichroic mirror and routed to two independent
channels. In one channel, a band-pass filter transmitting in the
range from 500–550 nm was chosen to detect the light at 543 nm.
In the second channel a long-pass filter with a cut-on wavelength
of 560 nm was applied. For detection, photomultipliers were used.
By using pinholes with a diameter of 71 mm for the green light and
78 mm for the red light in the confocal position, in front of the
corresponding detector, light from thin optical slices with a
thickness of about 12 mm could be collected from the focal plane.
Results and Discussion
Observation of the Evaporation Process
When depositing solvent drops onto the polymer surfaces
by a nozzle, the optically visible evaporation process
typically took 0.3 s. During evaporation, the contact radius
was constant and the contact angle decreased (Figure 1).
The contact angle of toluene on PS was lower than that of
ethyl acetate on PEMA. Correspondingly, the contact
radius was larger for toluene/PS. For example, for PS of
Mw ¼ 210 kDa, the initial contact angle was Q¼ 13� 18and the contact radius was a¼ 81� 5 mm, leading to an
initial volume of �105 mm3. For ethyl acetate on PEMA of
Mw ¼ 142 kDa, the respective values were Q¼ 22� 18,a¼ 57� 3 mm, and initial volume �6� 104 mm3. These
values were characteristic also for the other molecular
weights. The errors are typical differences measured
between different experiments with polymers of similar
molar mass. Since the initial volumes of the toluene drops
on PS were bigger than those of ethyl acetate on PEMA, the
apparent evaporation time of toluene from PS of toluene
from PS (0.33 s) was longer than that for ethyl acetate from
PEMA (0.27 s). The ‘‘apparent’’ evaporation time was
derived by extrapolating the decreasing volume-versus-
time to zero volume. It does not correspond to the time
required to evaporate all of the solvent: some solvent will
diffuse into the polymer and remain in the polymer for
www.mcp-journal.de 2135
G. Li, K. Graf, E. Bonaccurso, D. S. Golovko, A. Best, H.-J. Butt
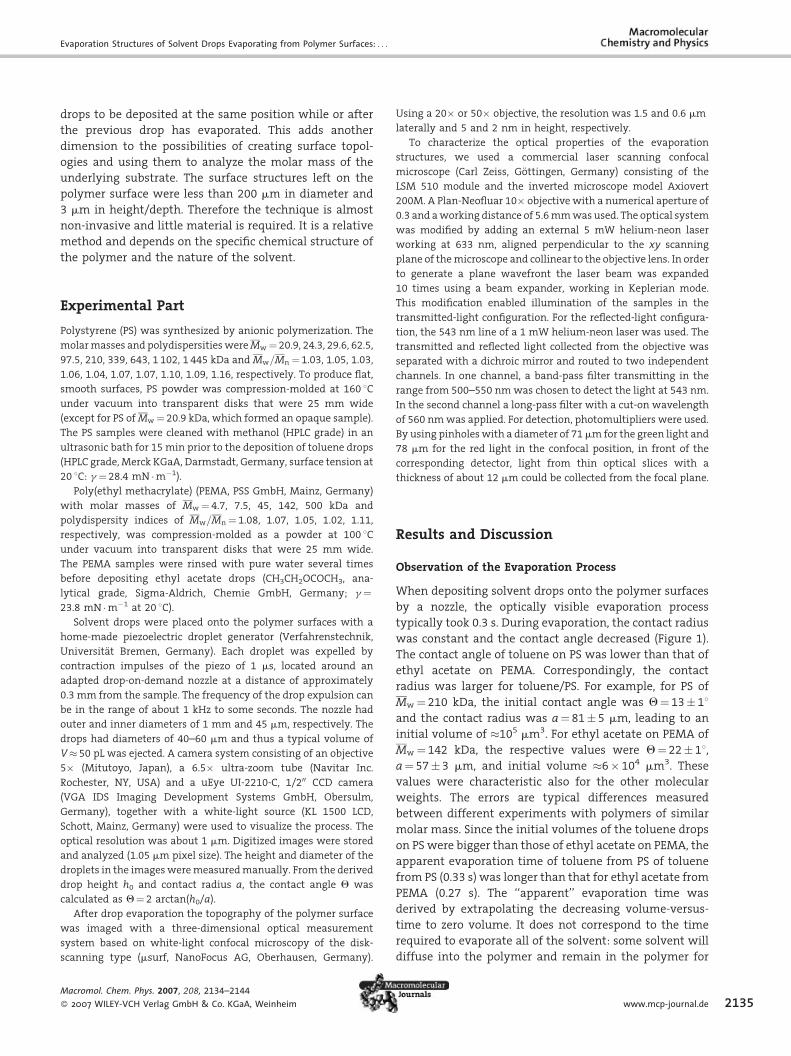
Figure 1. (A) Contact angle and (B) drop volume versus time forthree typical drops of ethyl acetate evaporating from PEMA(Mw ¼ 142 kDa, filled symbols) and three drops of toluene evapo-rating from PS (Mw ¼ 210 kDa, open symbols). The contact radii inthe six cases were 55.1, 60.9, 55.1 mm for ethyl acetate on PEMA,and 86.1, 75.6, 82.4 mm for toluene on PS, respectively.
2136
much longer times. This effect explains the strongly
reduced vapor pressure.
From the evaporation rate, the diffusion constant of the
solvent molecules in the vapor phase can be calculated.
The evaporation rate, that is the decrease in solvent
volume per unit time, dV=dtj j, can be derived assuming
that the diffusion of molecules in the gas phase is rate
limiting, that a steady state is reached at each stage of
evaporation, that the temperature is constant, and that the
vapor pressure of the liquid far away from the drop is
zero:[3]
Macrom
� 2007
dV
dt
�������� ¼ 2pDtRcf
P0M
rRT(1)
Here, Dt is the diffusion constant of solvent in air, Rc is
the radius of curvature of the drop, P0 is the vapor pressure
of the solvent, M is its molar mass, R is the gas constant, T
the temperature, and r is the liquid density. The function
f is given by f ¼ (0:00008957 þ 0:6333Qþ 0:116Q2 �0:08878Q3 þ 0:01033Q4): For toluene evaporating from
PS we have an evaporation rate of 4.2� 105 mm3 � s�1 at a
contact angle of Q¼ 13.38 at the beginning. With
ol. Chem. Phys. 2007, 208, 2134–2144
WILEY-VCH Verlag GmbH & Co. KGaA, Weinheim
f¼ 0.1522, Rc¼ 334 mm, P0 ¼ 3.79 kPa, M¼ 92.13 g �mol�1,
r¼ 866 kg �m�3 and at 25 8C, we find a diffusion coefficient
Dt ¼ 8.2� 10�6 m2 � s�1. This agrees well with a value of
8.0� 10�6 m2 � s�1 measured previously in tube and sessile
drop evaporation experiments[20] and 8.0� 10�6 m2 � s�1
measured from a toluene drop evaporating from an inert
surface.
After 0.20 s the corresponding values are 2.6� 105
mm3 � s�1 at a contact angle of Q¼ 5.98, f¼ 0.0664, and
Rc ¼ 780 mm. Assuming that the diffusion coefficient of
toluene does not change, we can calculate the vapor
pressure of toluene after 0.2 s to be 3.08 kPa. We attribute
this reduction in vapor pressure to the presence of
dissolved PS, according to Raoult’s law. Dissolved PS
should reduce the vapor pressure of toluene.
For ethyl acetate evaporating from PEMA we have an
evaporation rate of 2.4� 105 mm3 � s�1 at a contact angle of
Q¼ 22.28 at the beginning. With f¼ 0.2577, Rc ¼ 151 mm,
P0 ¼ 12.6 kPa, M¼ 88.12 g �mol�1, r¼ 894.5 kg �m�3 and at
25 8C, we find a diffusion coefficient Dt¼ 1.9� 10�6 m2 � s�1
for ethyl acetate in air at normal pressure. After 0.20 s the
corresponding values are 2.4� 105 mm3 � s�1 at a contact
angle of Q¼ 8.48, f¼ 0.0951, and Rc ¼ 440 mm. Assuming
that the diffusion coefficient of ethyl acetate does not
change we can calculate the vapor pressure of ethyl
acetate after 0.2 s to be 4.4 kPa. Since ethyl acetate
evaporated faster than toluene, after 0.2 s the volume ratio
of ethyl acetate in the polymer containing droplet is even
lower than that of toluene evaporating from PS. This effect
explains the strongly reduced vapor pressure. Summariz-
ing, the diffusion coefficient for ethyl acetate in air
dominates the slow evaporation rate and counteracts the
higher vapor pressure compared to toluene on PS. An
additional effect comes from the lower wettability of ethyl
acetate on PEMA. A drop of the same volume covers a
lower contact area on the polymer than toluene on PS,
leading to a lower radius of curvature and a higher contact
angle, i.e. a higher value of f. For ethyl acetate on PEMA the
product of both is smaller than for toluene of PS,
contributing to the lower evaporation rate in addition to
the diffusion coefficient (cf. Equation (1)).
Crater-Like Structures
When comparing the evaporation structures left by dif-
ferent combinations of solvent and polymer (Figure 2, 3)
some characteristic features are generally observed, while
others are qualitatively and quantitatively different and
depend on the specific combination. One characteristic
feature generally observed are crater-like rings with a
depression in the middle. Such crater-like structures have
been described before.[14,16,21] In PS the central part is
typically shaped like an inverted, spherical cap, while for
PEMA the central depression is flat. The formation of
DOI: 10.1002/macp.200700122

Evaporation Structures of Solvent Drops Evaporating from Polymer Surfaces: . . .
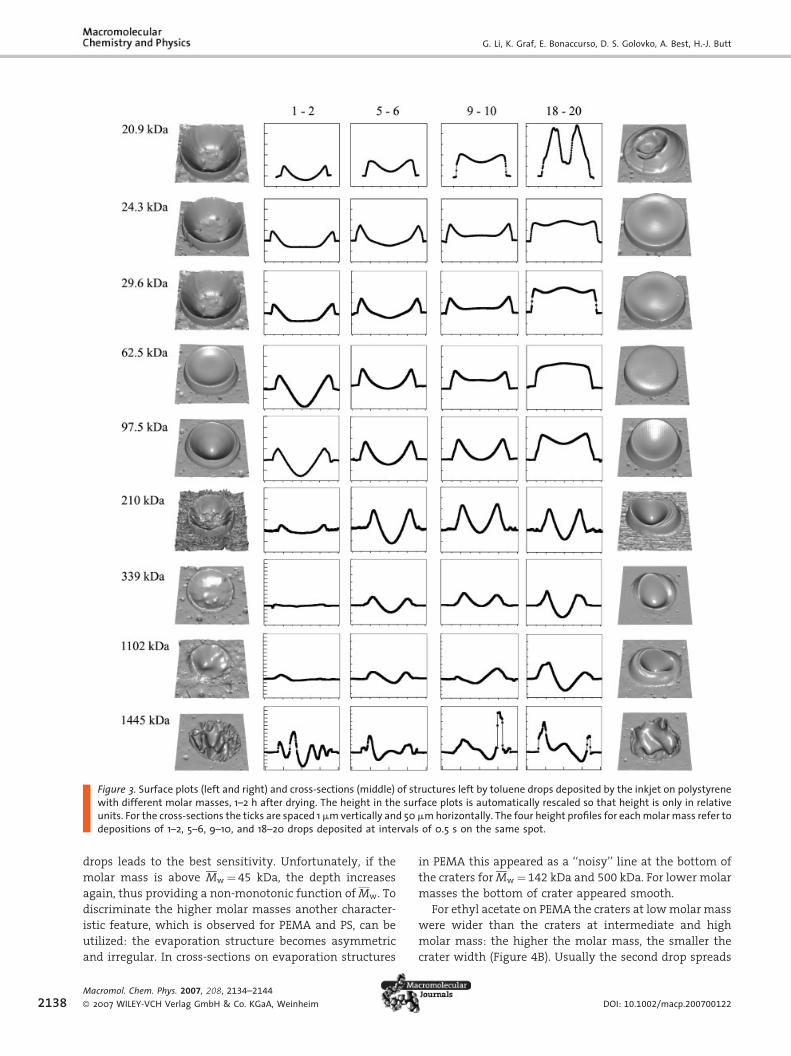
Figure 2. Surface plots (left and right) and cross-sections (middle) of structures left by ethyl acetate drops deposited by the ink-jet onpoly(ethyl methacrylate) with different molar masses, 1–2 h after drying. The height in the surface plots is automatically rescaled so thatheight is only in relative units. For the cross-sections, the ticks are spaced 1 mmvertically and 50mmhorizontally. The four height profiles foreach molar mass refer to depositions of 1–2, 5–6, 9–10, and 18–20 drops deposited at intervals of 0.5 s on the same spot.
crater-like structures can be understood, based on a model
developed to interpret the formation of ring-shaped
‘‘coffee stains’’.[14,16,18,22–26] When the solvent gets into
contact with the substrate, polymer chains are dissolved.
In a pinned evaporating drop, a radial flow occurs to
compensate the difference in volume change and evapora-
tion rate across the drop.[27] In the edge region of the drop,
the evaporation rate is high because the available angle of
evaporation is increased (for Q< 908), but the change in
volume is restricted by the pinned contact line. In the
center, on the other hand, the evaporation rate is lower
but the volume changes drastically. The radial flow
supplies the liquid from the center to the edge region to
compensate the difference. The dissolved polymer is
carried with the flow and finally deposited at the rim.
Multiple Drops
When depositing multiple drops at the same place and
allowing 0.5 s for each drop to evaporate before the next
drop was deposited, the evaporation structures became
more pronounced. For ethyl acetate on PEMA the
protruding rim became higher and the central depression
deeper. This indicates that the same liquid flow to the rim
and evaporation pattern prevails for each drop.
For toluene on PS with a molecular weight below 100
kDa the picture changed qualitatively. For only a few drops
a central depression was formed, while for 10 and more
Macromol. Chem. Phys. 2007, 208, 2134–2144
� 2007 WILEY-VCH Verlag GmbH & Co. KGaA, Weinheim
drops a dot-like elevation formed in the center. Two
interpretations are possible: firstly, the crater-like struc-
ture formed by the first few drops influences the flow and
evaporation pattern for the subsequent drops; secondly,
toluene diffuses into PS; some toluene of the first drop is
certainly left when the second drop arrives. The presence
of toluene will cause the polymer-polymer interactions to
be gradually replaced with polymer-solvent interactions.
Thus when the second drop wets the PS surface the
polymer chains are already solvated. This accelerates
the total dissolution process and more PS gets dissolved
before the majority of the solvent has evaporated.
Influence of Molar Mass for PEMA
With PEMA for all molar masses and irrespective of the
number of drops deposited, crater-like structures are
formed. The depth of the craters (as counted from the
mean height of the rim) decreased with increasing molar
mass (Figure 4A). The reason for the decrease in depth is
probably the reduced dissolution rate of polymer with a
high molar mass. If less material gets dissolved, less
material is transported to the rim.
The fact that the evaporation structure depends on the
molar mass of the polymer may be able to be used to
determine the molar mass. One simple parameter, which,
after calibration, can be used to determine the molar mass,
is the depth of the crater-like structure. Using 15 to 20
www.mcp-journal.de 2137
G. Li, K. Graf, E. Bonaccurso, D. S. Golovko, A. Best, H.-J. Butt
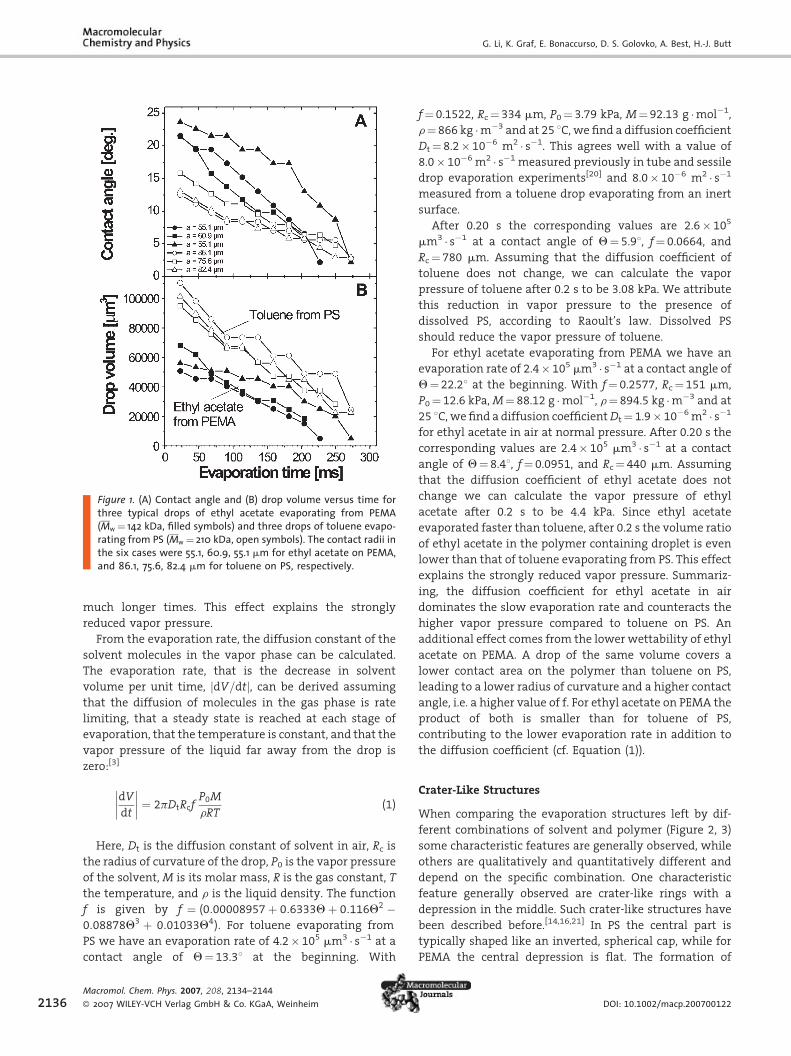
Figure 3. Surface plots (left and right) and cross-sections (middle) of structures left by toluene drops deposited by the inkjet on polystyrenewith different molar masses, 1–2 h after drying. The height in the surface plots is automatically rescaled so that height is only in relativeunits. For the cross-sections the ticks are spaced 1mmvertically and 50mmhorizontally. The four height profiles for eachmolarmass refer todepositions of 1–2, 5–6, 9–10, and 18–20 drops deposited at intervals of 0.5 s on the same spot.
2138
drops leads to the best sensitivity. Unfortunately, if the
molar mass is above Mw ¼ 45 kDa, the depth increases
again, thus providing a non-monotonic function of Mw. To
discriminate the higher molar masses another character-
istic feature, which is observed for PEMA and PS, can be
utilized: the evaporation structure becomes asymmetric
and irregular. In cross-sections on evaporation structures
Macromol. Chem. Phys. 2007, 208, 2134–2144
� 2007 WILEY-VCH Verlag GmbH & Co. KGaA, Weinheim
in PEMA this appeared as a ‘‘noisy’’ line at the bottom of
the craters for Mw ¼ 142 kDa and 500 kDa. For lower molar
masses the bottom of crater appeared smooth.
For ethyl acetate on PEMA the craters at low molar mass
were wider than the craters at intermediate and high
molar mass: the higher the molar mass, the smaller the
crater width (Figure 4B). Usually the second drop spreads
DOI: 10.1002/macp.200700122

Evaporation Structures of Solvent Drops Evaporating from Polymer Surfaces: . . .
Figure 4. (A) Depth and (B) contact radius of craters left on PEMAafter evaporation of different numbers of drops of ethyl acetate.The depth is the height difference between the depression in thecenter of the crater and the mean height of the rim. For thecontact radius, only results for the first drops are shown. Sub-sequent drops spread to the same radius.
to the same radius as the first one. For this reason only the
results for the first drop are shown in Figure 4B. In only a
few cases, the second drop with the same solvent volume
tended to shrink and create another rim inside the first
rim. After that, the rest of drops were directed into this
second rim.
Evaporation Structures on PS
After evaporation of toluene from low and intermediate
molar mass PS, the volume of the polymer had obviously
increased (Figure 3). This effect increased with increasing
number of drops. The bottom of the evaporation craters for
Mw � 97.5 kDa was above the level of the original polymer
surface. At Mw ¼ 62.5 kDa even a dot-like structure was
observed when depositing 18–20 on one spot. A similar
effect was observed when carefully looking at PEMA after
the first drop had evaporated: for high molar mass the
polymer swelled. We interpret this swelling of polymer
due to a permanent local decrease of the density (increase
in free volume) with solvent molecules staying in.
At high molar masses of PS the craters became
asymmetric. With increasing Mw, the degree of asymmetry
and the length scale, on which the asymmetric feature
appeared, decreased. At Mw ¼ 339 kDa, the outer ridge
typically showed a height modulation; it was significantly
Macromol. Chem. Phys. 2007, 208, 2134–2144
� 2007 WILEY-VCH Verlag GmbH & Co. KGaA, Weinheim
higher on one side than on the opposite one. The length
scale of the asymmetry was of the order of 200–300 mm. At
Mw ¼ 1 445 kDa, the crater was filled with an irregular
pattern of small depressions and protrusions with a width
of typically 50 mm.
A closer look at the surface topologies reveals different
classes of symmetry. For low and intermediate molar
masses between 24.3 and 210 kDa the resulting topology
showed nearly axial symmetry. Nevertheless, the topology
changed from centrally bulged (24.3 kDa) to over-dimpled
(29.6 kDa) to concave (210 kDa). This observation is
described in the literature for an evaporating sessile
droplet with dissolved polymer on an insoluble substrate
when the polymer concentration is decreased.[28] It was
discussed as a bulging in the center of the droplet for an
initially-high polymer concentration[29] and a coffee-
stain-like effect for lower initial concentrations. In our
case the polymer concentration is mediated through the
molar mass. Thus, it confirms our interpretation and
additionally suggests that the basic principles for insoluble
substrates can be transferred to the description of the
process on soluble ones. Consequently, for much higher
molar masses above 210 kDa the polymer concentration
should be increasingly lower. Since it is associated with an
increasing asymmetry of the resulting surface topology,
instabilities as an origin for theses structures are likely. For
a decreasing polymer concentration with increasing molar
mass of the substrate, the viscosity inside the droplet
decreases. This leads to an increasing Marangoni number
und thus might favor a Marangoni-type convection inside
the droplet.[10,30,31] Undulations with characteristic dis-
tances in the order of 50 mm were found for the dissolution
of PMMA layers into solvent droplets.[32]
Modes of Evaporation
Evaporation structures left by an evaporating solvent are
determined by at least three processes: (1) the dissolution
of polymer; (2) the radial flow of the solvent caused by
evaporation; and (3) the diffusion of dissolved polymer in
the solvent. To analyze structure formation it is instructive
to consider two extreme cases (Figure 5); for simplicity
we assume the dissolution rate to be independent on the
concentration of already-dissolved polymer:
� Fast flow: if we assume that the evaporation-driven
flow is much faster than the equilibration due to
diffusion, the dissolved material is deposited mainly at
the periphery of the drop and a rim is formed.
� Fast diffusion: if we assume that the diffusion of
the dissolved molecules is much faster than the
evaporation-driven flow, we have an equal concentra-
tion of dissolved molecules in the whole solvent at all
times. The final pattern of the deposited material is then
www.mcp-journal.de 2139

G. Li, K. Graf, E. Bonaccurso, D. S. Golovko, A. Best, H.-J. Butt
Figure 5. Schematic depiction of two extreme cases of solvent evaporation.
2140
similar to the shape of the drop. Polymer is mainly
deposited in the center and forms a dot-like structure.
A real evaporation structure is between the two extreme
cases and the final structure will depend on the time and
length scales over which the three processes occur. We
now estimate the time and length scales of the three
processes.
Dissolution
To estimate the rate of dissolution one can measure the
depth of craters formed, after the first drop has been
deposited. Assuming that most of the dissolved materials
is transported to the rim by the evaporation-driven flow,
the depth of the crater should be a measure of the amount
dissolved. When plotting the depth versus the molar mass
(Figure 6) it is obvious, that the dissolution of PS in toluene
Figure 6. Central depth/height of the evaporation structuresversus molar mass of the polymer substrate after evaporationof one drop of ethyl acetate on PEMA and toluene on PS,respectively.
Figure 7. Radiafor the initial sestimated fromfrom PEMAdV/dt¼�2.2�PS (h0¼9.5 mm105 mm3 � s�1).illustrates the
Macromol. Chem. Phys. 2007, 208, 2134–2144
� 2007 WILEY-VCH Verlag GmbH & Co. KGaA, Weinheim
is more efficient than the dissolution of
PEMA in ethyl acetate. The maximal depth
in the center is 1.8 mm for PS (Mw ¼ 62 kDa)
and only 0.12 mm for PEMA (Mw ¼ 7.5 kDa).
Thus the lower limit for the dissolution
rate is 1.8 mm per 0.33 s¼ 5.5 mm � s�1 and
0.12 mm per 0.27 s¼ 0.44 mm � s�1, respec-
tively.
The plot of depth versus molar mass
shows a maximum in depth (minimum in
height) for both solvent/polymer combina-
tions. For PEMA this is at a lower molar
mass than for PS. This corresponds to the
lower entanglement molar mass of PEMA
of Me ¼ 8.6 kDa as compared to that of PS of
Me ¼ 18.1 to 19.1 kDa.[33–35] One would
expect the dissolution rate to increase with
decreasing molar mass because entangle-
ment, which resists dissolution, is lower.
This, however, does not correspond to the depth of craters.
In addition, for low molar mass PEMA (4.7 kDa) no change
in depth at all was observed. Thus as a second process
swelling must be present. Swelling of the polymer is stable
even when keeping the polymer in air and giving the
solvent several hours to evaporate.
Evaporation-Driven Flow
When the drop evaporates with a pinned contact line, a
radial flow occurs to compensate the difference in volume
change and evaporation rate across the drop (Figure 7).
We estimated the velocity of the flow v in our system from
l flow velocity in an evaporating drop, calculatedtage with Equation (7). The parameters used wereexperiments with ethyl acetate drops evaporating
(h0¼ 11.0 mm, l¼0.430, dh0/dt¼�41 mm � s�1,105 mm3 � s�1) and toluene drops evaporating from, l¼0.461, dh0/dt¼�29 mm � s�1, dV/dt¼ �3.0�
At the top left, a schematic of an evaporating dropparameters.
DOI: 10.1002/macp.200700122
Evaporation Structures of Solvent Drops Evaporating from Polymer Surfaces: . . .
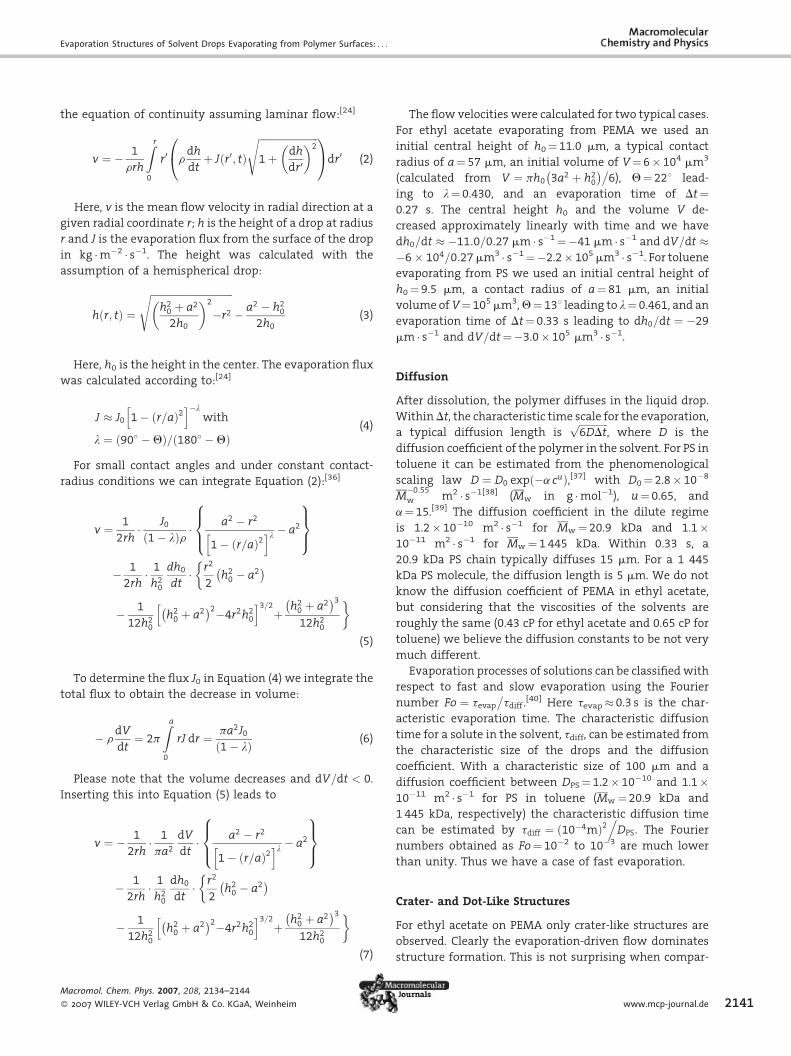
the equation of continuity assuming laminar flow:[24]
Macrom
� 2007
v ¼ � 1
rrh
Zr
0
r0 rdh
dtþ Jðr0; tÞ
ffiffiffiffiffiffiffiffiffiffiffiffiffiffiffiffiffiffiffiffiffiffiffiffi1 þ dh
dr0
� �2s0
@1Adr0 (2)
Here, v is the mean flow velocity in radial direction at a
given radial coordinate r; h is the height of a drop at radius
r and J is the evaporation flux from the surface of the drop
in kg �m�2 � s�1. The height was calculated with the
assumption of a hemispherical drop:
hðr; tÞ ¼
ffiffiffiffiffiffiffiffiffiffiffiffiffiffiffiffiffiffiffiffiffiffiffiffiffiffiffiffiffiffiffiffiffih2
0 þ a2
2h0
� �2
�r2
s� a2 � h2
0
2h0(3)
Here, h0 is the height in the center. The evaporation flux
was calculated according to:[24]
J � J0 1 � r=að Þ2h i�l
with
l ¼ 90 �Qð Þ= 180 �Qð Þ(4)
For small contact angles and under constant contact-[36]
radius conditions we can integrate Equation (2):v ¼ 1
2rh� J0
1 � lð Þr � a2 � r2
1 � r=að Þ2h il � a2
8><>:
9>=>;
� 1
2rh� 1
h20
dh0
dt��r2
2h2
0 � a2� �
� 1
12h20
h20 þ a2
� �2�4r2h20
h i3=2þ
h20 þ a2
� �3
12h20
�(5)
To determine the flux J0 in Equation (4) we integrate the
total flux to obtain the decrease in volume:
� rdV
dt¼ 2p
Za0
rJ dr ¼ pa2J0
ð1 � lÞ (6)
Please note that the volume decreases and dV=dt < 0.
Inserting this into Equation (5) leads to
v ¼ � 1
2rh� 1
pa2
dV
dt� a2 � r2
1 � r=að Þ2h il � a2
8><>:
9>=>;
� 1
2rh� 1
h20
dh0
dt��r2
2h2
0 � a2� �
� 1
12h20
h20 þ a2
� �2�4r2h20
h i3=2þ
h20 þ a2
� �3
12h20
�(7)
ol. Chem. Phys. 2007, 208, 2134–2144
WILEY-VCH Verlag GmbH & Co. KGaA, Weinheim
The flow velocities were calculated for two typical cases.
For ethyl acetate evaporating from PEMA we used an
initial central height of h0 ¼ 11.0 mm, a typical contact
radius of a¼ 57 mm, an initial volume of V¼ 6� 104 mm3
(calculated from V ¼ ph0 3a2 þ h20
� �6), Q¼ 228 lead-
ing to l¼ 0.430, and an evaporation time of Dt¼0.27 s. The central height h0 and the volume V de-
creased approximately linearly with time and we have
dh0=dt � �11:0=0:27 mm � s�1 ¼�41 mm � s�1 and dV=dt ��6 � 104=0:27 mm3 � s�1 ¼�2.2� 105 mm3 � s�1. For toluene
evaporating from PS we used an initial central height of
h0 ¼ 9.5 mm, a contact radius of a¼ 81 mm, an initial
volume of V¼ 105 mm3, Q¼ 138 leading to l¼ 0.461, and an
evaporation time of Dt¼ 0.33 s leading to dh0=dt ¼ �29
mm � s�1 and dV=dt¼�3.0� 105 mm3 � s�1.
Diffusion
After dissolution, the polymer diffuses in the liquid drop.
Within Dt, the characteristic time scale for the evaporation,
a typical diffusion length isffiffiffiffiffiffiffiffiffiffiffiffi6DDt
p, where D is the
diffusion coefficient of the polymer in the solvent. For PS in
toluene it can be estimated from the phenomenological
scaling law D ¼ D0 expð�a cuÞ,[37] with D0 ¼ 2.8� 10�8
M�0:55w m2 � s�1[38] (Mw in g �mol�1), u¼ 0.65, and
a¼ 15.[39] The diffusion coefficient in the dilute regime
is 1.2� 10�10 m2 � s�1 for Mw ¼ 20.9 kDa and 1.1�10�11 m2 � s�1 for Mw ¼ 1 445 kDa. Within 0.33 s, a
20.9 kDa PS chain typically diffuses 15 mm. For a 1 445
kDa PS molecule, the diffusion length is 5 mm. We do not
know the diffusion coefficient of PEMA in ethyl acetate,
but considering that the viscosities of the solvents are
roughly the same (0.43 cP for ethyl acetate and 0.65 cP for
toluene) we believe the diffusion constants to be not very
much different.
Evaporation processes of solutions can be classified with
respect to fast and slow evaporation using the Fourier
number Fo ¼ tevap
tdiff .[40] Here tevap � 0.3 s is the char-
acteristic evaporation time. The characteristic diffusion
time for a solute in the solvent, tdiff, can be estimated from
the characteristic size of the drops and the diffusion
coefficient. With a characteristic size of 100 mm and a
diffusion coefficient between DPS ¼ 1.2� 10�10 and 1.1�10�11 m2 � s�1 for PS in toluene (Mw ¼ 20.9 kDa and
1 445 kDa, respectively) the characteristic diffusion time
can be estimated by tdiff ¼ ð10�4mÞ2.DPS. The Fourier
numbers obtained as Fo¼ 10�2 to 10�3 are much lower
than unity. Thus we have a case of fast evaporation.
Crater- and Dot-Like Structures
For ethyl acetate on PEMA only crater-like structures are
observed. Clearly the evaporation-driven flow dominates
structure formation. This is not surprising when compar-
www.mcp-journal.de 2141

G. Li, K. Graf, E. Bonaccurso, D. S. Golovko, A. Best, H.-J. Butt
2142
ing typical time and length scales. Assuming diffusion
coefficients like for PS in toluene of the order of
D¼ 10�11�10�10 m2 � s�1 the distance a polymer diffuses
in 0.27 s is 4–13 mm. At a radius of 30 mm the flow velocity
calculated with Equation (7) is 91 mm � s�1. Thus within
0.27 s, a distance of 25 mm is covered. The evaporation-
driven flow will thus dominate the whole process and
craters are formed.
For toluene on PS the situation is different because the
flow velocities are lower (Figure 7). In addition, more
polymer is dissolved, in particular for low and inter-
mediate molar masses. Dissolution is further enhanced for
multiple drops because not all the toluene evaporates
completely within the time interval between two
subsequent drops: part of it diffuses into the polymer
and remains there before the next drop is deposited.
Dissolved polymer increases the viscosity of the liquid and
further decreases the evaporation-driven flow. Thus dif-
fusion is more dominant and dot-like structures can be
formed. This explains the dot-like structures formed at low
and intermediate molar masses. To explain the detailed
features, the extent of the dissolution, the evaporation-
driven flow, and the diffusion have to
be known locally. This can only be
achieved with future quantitative
simulations.
In previous experiments with tolu-
ene on PS, mainly crater-like structures
were observed.[15,36] The reasons are
the different length and time scales of
these experiments. Drops were depos-
ited by a micropipette. As a result the
initial volume (2� 106 mm3) and con-
tact radius (�200 mm) was larger and
the apparent evaporation time (5 s)
was longer. This reduces the influence
of diffusion and the evaporation-
driven flow dominates, leading to the
formation of crater-like structures.
Figure 8. Optical set-up for characterizing the shape of evaporation structures. As anexample, in the bottom half, pictures are shown that were taken in the respectivepositions of a PS sample of Mw ¼ 210 kDa, after evaporation of a toluene drop placedby a syringe.
Optical Determination of theMolar Mass of PS
The topographies of the surface struc-
tures, namely the height/depth of the
center and the asymmetry, are char-
acteristic enough to obtain informa-
tion about the molar mass of the
underlying PS substrate. In the series
of ten polymers used, each one could
be discriminated from the topography
and thus its molar mass could be
determined. Based on this series, in
Macromol. Chem. Phys. 2007, 208, 2134–2144
� 2007 WILEY-VCH Verlag GmbH & Co. KGaA, Weinheim
which each polymer had an average molar mass 1.5 times
greater than the previous one, the accuracy is of the order
of 50%.
Analyzing the molar mass by depositing a drop of
solvent onto the polymer and observing the evaporation
structure is an almost non-invasive method, because the
height changes are in the sub-10 mm range. This
advantage, on the other hand, poses a problem: it requires
expensive equipment to quantitatively measure the
topography. Therefore, we tried a simple alternative,
which does not give the precise topography, but might be
sufficient to determine the molar mass after calibration.
A camera (objective lens plus imaging plane) was
positioned approximately 2.8 cm above the polymer
sample and adjusted so that the planar polymer surface
(beside the structure) was in focus (Figure 8). The polymer
sample was illuminated from below with a parallel light
beam. The structure diffracts the light in a characteristic
way. A large fraction of the shape of evaporation
structures can be described as spherical;[14] they act like
a focusing or divergent lens. For example, for PS with an
intermediate molar mass, the structure diverges the light
DOI: 10.1002/macp.200700122
Evaporation Structures of Solvent Drops Evaporating from Polymer Surfaces: . . .
beam owing to the concave shape. To compensate for this
diverging light the camera has to be moved closer to the
sample by a distance Dz. The divergence is just compen-
sated, when this distance is equal to the focal point of the
structure.
Dependence of the Optical Propertieson the Molar Mass
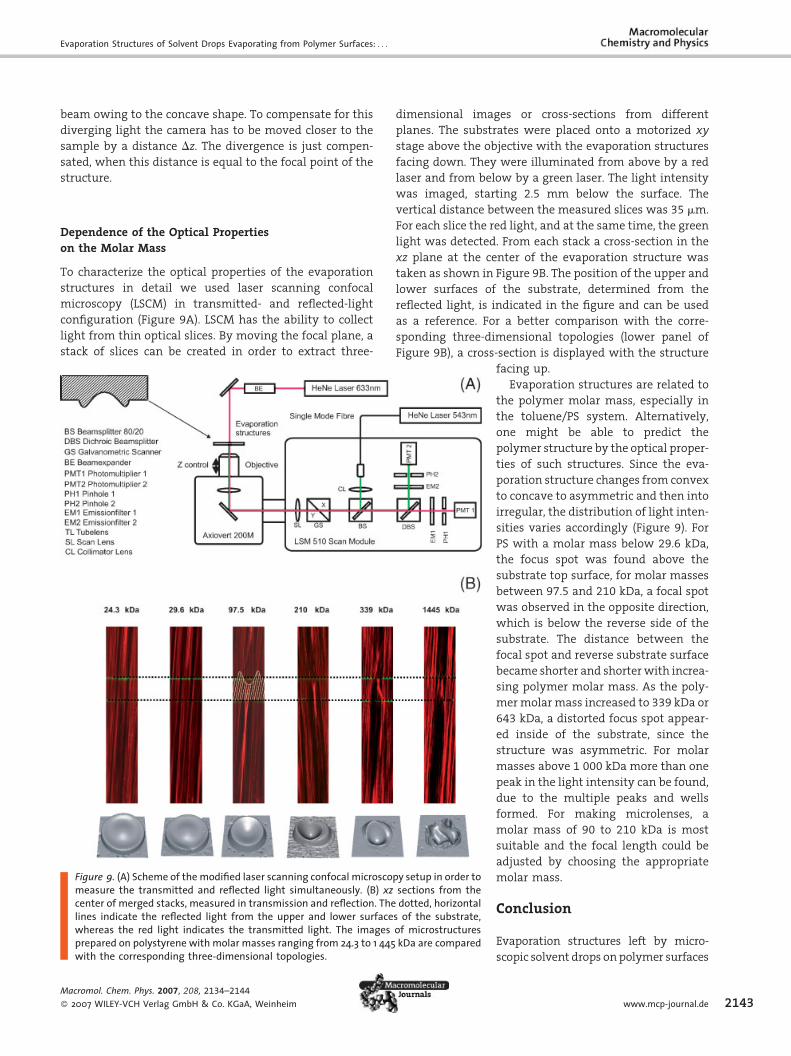
To characterize the optical properties of the evaporation
structures in detail we used laser scanning confocal
microscopy (LSCM) in transmitted- and reflected-light
configuration (Figure 9A). LSCM has the ability to collect
light from thin optical slices. By moving the focal plane, a
stack of slices can be created in order to extract three-
Figure 9. (A) Scheme of the modified laser scanning confocal microscomeasure the transmitted and reflected light simultaneously. (B) xzcenter of merged stacks, measured in transmission and reflection. Thelines indicate the reflected light from the upper and lower surfacewhereas the red light indicates the transmitted light. The imagesprepared on polystyrene with molar masses ranging from 24.3 to 1 445with the corresponding three-dimensional topologies.
Macromol. Chem. Phys. 2007, 208, 2134–2144
� 2007 WILEY-VCH Verlag GmbH & Co. KGaA, Weinheim
dimensional images or cross-sections from different
planes. The substrates were placed onto a motorized xy
stage above the objective with the evaporation structures
facing down. They were illuminated from above by a red
laser and from below by a green laser. The light intensity
was imaged, starting 2.5 mm below the surface. The
vertical distance between the measured slices was 35 mm.
For each slice the red light, and at the same time, the green
light was detected. From each stack a cross-section in the
xz plane at the center of the evaporation structure was
taken as shown in Figure 9B. The position of the upper and
lower surfaces of the substrate, determined from the
reflected light, is indicated in the figure and can be used
as a reference. For a better comparison with the corre-
sponding three-dimensional topologies (lower panel of
Figure 9B), a cross-section is displayed with the structure
py setup in order tosections from thedotted, horizontals of the substrate,of microstructureskDa are compared
facing up.
Evaporation structures are related to
the polymer molar mass, especially in
the toluene/PS system. Alternatively,
one might be able to predict the
polymer structure by the optical proper-
ties of such structures. Since the eva-
poration structure changes from convex
to concave to asymmetric and then into
irregular, the distribution of light inten-
sities varies accordingly (Figure 9). For
PS with a molar mass below 29.6 kDa,
the focus spot was found above the
substrate top surface, for molar masses
between 97.5 and 210 kDa, a focal spot
was observed in the opposite direction,
which is below the reverse side of the
substrate. The distance between the
focal spot and reverse substrate surface
became shorter and shorter with increa-
sing polymer molar mass. As the poly-
mer molar mass increased to 339 kDa or
643 kDa, a distorted focus spot appear-
ed inside of the substrate, since the
structure was asymmetric. For molar
masses above 1 000 kDa more than one
peak in the light intensity can be found,
due to the multiple peaks and wells
formed. For making microlenses, a
molar mass of 90 to 210 kDa is most
suitable and the focal length could be
adjusted by choosing the appropriate
molar mass.
Conclusion
Evaporation structures left by micro-
scopic solvent drops on polymer surfaces
www.mcp-journal.de 2143
G. Li, K. Graf, E. Bonaccurso, D. S. Golovko, A. Best, H.-J. Butt
2144
are characteristic of the specific polymer/solvent combi-
nation and the molar mass of the polymer. Solvent
evaporates at constant contact radius from a polymer
surface. The shape of the evaporation structures is
determined by at least four processes: the dissolution of
the polymer, the evaporation-driven radial flow of the
solvent, the diffusion of dissolved polymer molecules, and
swelling of the polymer. Depending on which of these
processes dominates different topologies can be formed. If,
on the time scale of evaporation, the dissolved molecules
diffuse a larger distance than covered by evaporation-
driven flow, dot-like structures are formed. If evaporation-
driven flow dominates, crater-like structures prevail. The
amount of dissolved polymer influences this relation by
increasing the viscosity and thus reduces evaporation-
driven flow. This also explains why dot-like structures are
only found for microdrops. In large drops, diffusion is less
significant, evaporation-driven flow dominates and crater-
like structures are formed. For ethyl acetate/PEMA, only
concave structures were observed, which we attribute to a
reduced rate of dissolution as compared to PS/toluene.
For toluene evaporating from polystyrene the evapora-
tion structures were characteristic for the molar mass.
Change in the molar mass by 50% led to detectable changes
in the evaporation structures. Before the method can be
used to measure the molar mass of a specific polymer, a
better understanding of the evaporation process is requi-
red; namely, the role of entanglements in the dissolution
rate, the flow pattern of the solvent, the mobility of the
polymer at different solvent concentrations, and possible
temperature gradients require a better understanding.
Acknowledgements: The authors thank Thomas Wagner forproviding the polystyrene. This research was supported by theDeutsche Forschungsgemeinschaft (GR2003/2) within the researchgroup FOR 516.
Received: March 6, 2007; Revised: May 8, 2007; Accepted: May 9,2007; DOI: 10.1002/macp.200700122
Keywords: coffee-stain effect; drop evaporation; ink-jet; poly(ethyl methacrylate); polystyrene (PS); polymer surfaces
[1] H. W. Morse, Proc. Am. Acad. Arts Sci. 1910, 45, 363.[2] I. Langmuir, Phys. Rev. 1918, 12, 368.[3] R. G. Picknett, R. Bexon, J. Colloid Interface Sci. 1977, 61, 336.[4] R. N. O’Brien, P. Saville, Langmuir 1987, 3, 41.[5] S. M. Rowan, M. I. Newton, G. McHale, J. Phys. Chem. 1995, 99,
13268.[6] C. Bourges-Monnier, M. E. R. Shanahan, Langmuir 1995, 11,
2820.
Macromol. Chem. Phys. 2007, 208, 2134–2144
� 2007 WILEY-VCH Verlag GmbH & Co. KGaA, Weinheim
[7] A. J. H. McGaughey, C. A. Ward, J. Appl. Phys. 2002, 91,6406.
[8] H. Y. Erbil, G. McHale, M. I. Newton, Langmuir 2002, 18,2636.
[9] Y. Takata, S. Hidaka, A. Yamashita, H. Yamamoto, Int. J. HeatFluid Flow 2004, 25, 320.
[10] H. Hu, R. G. Larson, Langmuir 2005, 21, 3972.[11] C. Poulard, G. Guena, A. M. Cazabat, A. Boudaoud, M. Ben
Amar, Langmuir 2005, 21, 8226.[12] E. Bonaccurso, H.-J. Butt, J. Phys. Chem. B 2005, 109, 253.[13] S. David, K. Sefiane, L. Tadrist, Colloids Surf. A: Physicochem.
Eng. Aspects 2007, 298, 108.[14] E. Bonaccurso, H.-J. Butt, B. Hankeln, B. Niesenhaus, K. Graf,
Appl. Phys. Lett. 2005, 86, 124101.[15] G. Li, N. Hohn, K. Graf, Appl. Phys. Lett. 2006, 89, 241920.[16] T. Kawase, H. Sirringhaus, R. H. Friend, T. Shimoda, Adv.
Mater. 2001, 13, 1601.[17] B.-J. de Gans, U. S. Schubert, Langmuir 2004, 20, 7789.[18] E. Tekin, B.-J. de Gans, U. S. Schubert, J. Mater. Chem. 2004, 14,
2627.[19] E. Bonaccurso, H.-J. Butt, K. Graf, Eur. Polymer J. 2004, 40,
975.[20] H. Y. Erbil, Y. Avci, Langmuir 2002, 18, 5113.[21] C. Stupperich-Sequeira, K. Graf, W. Wiechert, Mathematical
Comput. Modelling Dynamical Syst. 2006, 12, 263.[22] J. Conway, H. Korns, M. R. Fisch, Langmuir 1997, 13, 426.[23] R. D. Deegan, O. Bakajin, T. F. Dupont, G. Huber, S. R. Nagel,
T. A. Witten, Nature 1997, 389, 827.[24] R. D. Deegan, O. Bakajin, T. F. Dupont, G. Huber, S. R. Nagel,
T. A. Witten, Phys. Rev. E 2000, 62, 756.[25] H. Hu, R. G. Larson, J. Phys. Chem. B 2002, 106, 1334.[26] B. Rieger, L. R. van den Doel, L. J. van Vliet, Phys. Rev. E: Stat.
Nonlinear Soft Matter Phys. 2003, 68, 036312.[27] A. J. Petsi, V. N. Burganos, Phys. Rev. E: Stat. Nonlinear Soft
Matter Phys. 2006, 73, 041201.[28] T. Kajiya, E. Nishitani, T. Yamaue, M. Doi, Phys. Rev. E: Stat.
Nonlinear Soft Matter Phys. 2006, 73, 011601.[29] Y. Gorand, L. Pauchard, G. Calligari, J. P. Hulin, C. Allain,
Langmuir 2004, 20, 5138.[30] E. Bormashenko, R. Pogreb, A. Musin, O. Stanevsky,
Y. Bormashenko, G. Whyman, O. Gendelman, Z. Barkay,J. Colloid Interface Sci. 2006, 297, 534.
[31] S. T. Chang, O. D. Velev, Langmuir 2006, 22, 1459.[32] M. Gonuguntla, A. Sharma, Langmuir 2004, 20, 3456.[33] L. J. Fetters, D. J. Lohse, S. T. Milner, W. W. Graessley, Macro-
molecules 1999, 32, 6847.[34] Polymer Handbook, 4th edition, J. Brandrup, E. H. Immergut,
E. A. Grulke, Eds., John Wiley & Sons, New York 1999.[35] S. Wu, J. Polymer Sci., Part B: Polym. Phys. 1989, 27, 723.[36] G. Li, H.-J. Butt, K. Graf, Langmuir 2006, 22, 11395.[37] G. D. J. Phillies, Macromolecules 1986, 19, 2367.[38] G. Min, D. Savin, Z. Gu, G. D. Patterson, S. H. Kim, D. J. Ramsay,
D. Fishman, I. Ivanov, E. Sheina, E. Slaby, J. Oliver, Int. J. Polym.Analysis Characterization 2003, 8, 187.
[39] R. Liu, X. Gao, J. Adams, W. Oppermann, Macromolecules2005, 38, 8845.
[40] E. Bormashenko, Y. Bormashenko, R. Pogreb, O. Stanevsky,G. Whyman, T. Stein, M. H. Itzhaq, Z. Barkay, Colloids Surf. A:Physicochemical Eng. Aspects 2006, 290, 273.
DOI: 10.1002/macp.200700122
Copyright © 2022 FDOKUMEN