
Court drops district ·from Huntsmcm suit - City of Newport Beach
Upload
independentCategory
view
4download
0
I
Aa
b
c
a
ARRAA
KIPCDV
1
ltamayttsdwtcmtbli
0d
Colloids and Surfaces A: Physicochem. Eng. Aspects 365 (2010) 145–153
Contents lists available at ScienceDirect
Colloids and Surfaces A: Physicochemical andEngineering Aspects
journa l homepage: www.e lsev ier .com/ locate /co lsur fa
nterface and bulk exchange: Single drops experiments and CFD simulations
. Javadia, J.K. Ferrib, Th.D. Karapantsiosc, R. Millera,∗
Max Planck Institute of Colloids and Interfaces, Am Muehenberg 1, 14424 Potsdam,GermanyLafayette College, Easton, PA 18042, USAAristotle University of Thessaloniki, GR-54124 Thessaloniki, Greece
r t i c l e i n f o
rticle history:eceived 9 February 2010eceived in revised form 20 April 2010ccepted 26 April 2010vailable online 26 May 2010
eywords:nterface and bulk exchangeulse-like flow
a b s t r a c t
The coaxial double capillary for controlling pendant drops is an interesting experimental technique forinvestigating adsorption kinetics and transport properties of soluble components in the bulk which canexchange with the interface. The key process of this technique is the exchange of the entire bulk of adroplet without any direct perturbations of the interface due to forced convection. Therefore efficientexchange conditions should be determined in order to provide results during the exchange protocol thatcan be used for a reliable data interpretation of the adsorption process. In this paper we report on theflow into a drop formed with a double capillary set-up, as visualized by using a dye and simulated bycomputational fluid dynamics (CFD) of the flow field and mass transfer during the drop bulk exchange.
FD simulationsrop profile analysisisualized flow pattern in a drop
Regarding the experimental protocols, for better monitoring and control of the droplet size a pulse-likeflow with different injection volumes (dV) and pulse intervals (dt) combined with drop profile analysistensiometry (PAT1) was used. The visualized experimental concentration fields are confirmed by theconcentration contours obtained from CFD simulations. Both approaches give access to estimate themoment when the dye arrives at the drop surface. The drop surface exchange is also monitored via themeasured surface tension. The computational results for average drop interface concentration (DIC) and
(DO
drop outlet concentration. Introduction
Investigations of the equilibrium and dynamics of adsorptionayers of surfactants and macromolecules at fluid interfaces are inhe focus of interest due to their importance in fundamental andpplied science. Single liquid drops can be used as a great experi-ental lab for this purpose by using techniques such as drop profile
nalysis tensiometry (PAT) which is developed during the last 25ears from a new idea [1] to one of the most versatile tools appliedo various investigations in surface science [2,3]. Wege et al. showedhat the drop profile tensiometry has additional potential when apecial drop exchange mechanism is used [4]. It consists in a specialesign of a double capillary combined with a double dosing systemhere the liquid in the drop formed at its tip can be exchanged by
he inflow and outflow through one of the two coaxially arrangedapillaries, respectively. This procedure is complementary to theethodology of Svitova et al. [5] who used a convection cell for
he exchange of the external liquid in a cuvette around a drop orubble. Both techniques combined, even allow the exchange of the
iquid inside a drop and additionally in the cuvette surroundingt, which gives a large number of experimental possibilities. This
∗ Corresponding author.E-mail address: [email protected] (R. Miller).
927-7757/$ – see front matter © 2010 Elsevier B.V. All rights reserved.oi:10.1016/j.colsurfa.2010.04.035
C) are discussed for different conditions.© 2010 Elsevier B.V. All rights reserved.
technique has been used frequently for different purposes such asstudying competitive adsorption of surfactants/proteins at an inter-face [6,7] and layer-by-layer microencapsulation processes [8]. Thedrop exchange method is also advantageous for long time studies,as it allows to compensate for evaporation effects by adding onlythe solvent for the lost volume instead of the solution [9]. There aremany more successful applications as recently summarized [10].
Drop interface and bulk exchange in this paper means: initiallywe form a fresh drop through the outer capillary using the syringepump 1 filled with the solution of concentration C1,∞, which in ourcase is pure water, i.e. C1,∞ = 0. For surfactant or protein solutions,we wait a respective time for reaching the adsorption equilib-rium. Now, the second solution of concentration C2,∞ is injectedinto the drop through the inner capillary using the second syringepump 2. During this procedure, the syringe pump 1 success liquidvia the outer capillary to keep the drop at constant size. The tar-get of this process is the complete exchange of the liquid insidethe drop without significant perturbations of the interfacial layer.This means that the exchange between interface and bulk is notformed by convection but happens via transport by diffusion and
adsorption or desorption, respectively. A low flow injection/suctionprocess through the inner/outer capillary tips, respectively, is suit-able for this aim. However at low flow rates, a long exchange timeis required which depends on the solution’s concentrations and thedensity difference between the initial drop liquid and the injected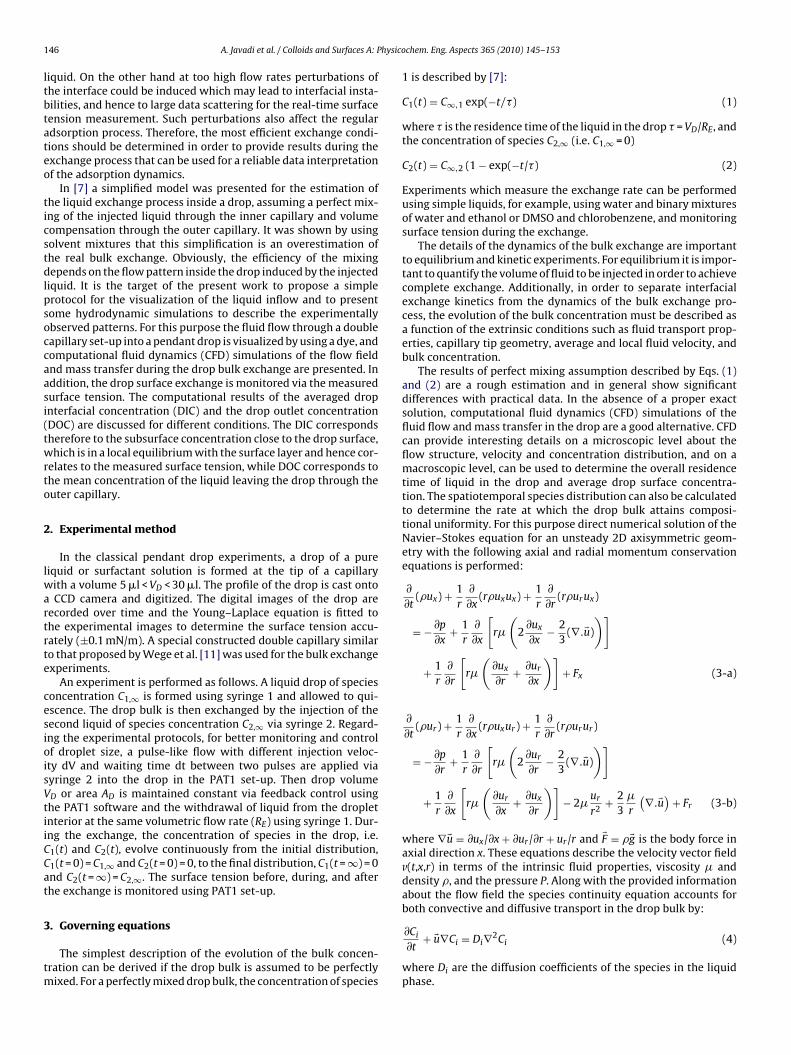
1 hysico
ltbtateo
ticstdlpsoccaasi(twrto
2
lwartrte
cesioisVtiiCCat
3
tm
about the flow field the species continuity equation accounts forboth convective and diffusive transport in the drop bulk by:
46 A. Javadi et al. / Colloids and Surfaces A: P
iquid. On the other hand at too high flow rates perturbations ofhe interface could be induced which may lead to interfacial insta-ilities, and hence to large data scattering for the real-time surfaceension measurement. Such perturbations also affect the regulardsorption process. Therefore, the most efficient exchange condi-ions should be determined in order to provide results during thexchange process that can be used for a reliable data interpretationf the adsorption dynamics.
In [7] a simplified model was presented for the estimation ofhe liquid exchange process inside a drop, assuming a perfect mix-ng of the injected liquid through the inner capillary and volumeompensation through the outer capillary. It was shown by usingolvent mixtures that this simplification is an overestimation ofhe real bulk exchange. Obviously, the efficiency of the mixingepends on the flow pattern inside the drop induced by the injected
iquid. It is the target of the present work to propose a simplerotocol for the visualization of the liquid inflow and to presentome hydrodynamic simulations to describe the experimentallybserved patterns. For this purpose the fluid flow through a doubleapillary set-up into a pendant drop is visualized by using a dye, andomputational fluid dynamics (CFD) simulations of the flow fieldnd mass transfer during the drop bulk exchange are presented. Inddition, the drop surface exchange is monitored via the measuredurface tension. The computational results of the averaged dropnterfacial concentration (DIC) and the drop outlet concentrationDOC) are discussed for different conditions. The DIC correspondsherefore to the subsurface concentration close to the drop surface,hich is in a local equilibrium with the surface layer and hence cor-
elates to the measured surface tension, while DOC corresponds tohe mean concentration of the liquid leaving the drop through theuter capillary.
. Experimental method
In the classical pendant drop experiments, a drop of a pureiquid or surfactant solution is formed at the tip of a capillary
ith a volume 5 �l < VD < 30 �l. The profile of the drop is cast ontoCCD camera and digitized. The digital images of the drop are
ecorded over time and the Young–Laplace equation is fitted tohe experimental images to determine the surface tension accu-ately (±0.1 mN/m). A special constructed double capillary similaro that proposed by Wege et al. [11] was used for the bulk exchangexperiments.
An experiment is performed as follows. A liquid drop of speciesoncentration C1,∞ is formed using syringe 1 and allowed to qui-scence. The drop bulk is then exchanged by the injection of theecond liquid of species concentration C2,∞ via syringe 2. Regard-ng the experimental protocols, for better monitoring and controlf droplet size, a pulse-like flow with different injection veloc-ty dV and waiting time dt between two pulses are applied viayringe 2 into the drop in the PAT1 set-up. Then drop volumeD or area AD is maintained constant via feedback control usinghe PAT1 software and the withdrawal of liquid from the dropletnterior at the same volumetric flow rate (RE) using syringe 1. Dur-ng the exchange, the concentration of species in the drop, i.e.1(t) and C2(t), evolve continuously from the initial distribution,1(t = 0) = C1,∞ and C2(t = 0) = 0, to the final distribution, C1(t = ∞) = 0nd C2(t = ∞) = C2,∞. The surface tension before, during, and afterhe exchange is monitored using PAT1 set-up.
. Governing equations
The simplest description of the evolution of the bulk concen-ration can be derived if the drop bulk is assumed to be perfectly
ixed. For a perfectly mixed drop bulk, the concentration of species
chem. Eng. Aspects 365 (2010) 145–153
1 is described by [7]:
C1(t) = C∞,1 exp(−t/�) (1)
where � is the residence time of the liquid in the drop � = VD/RE, andthe concentration of species C2,∞ (i.e. C1,∞ = 0)
C2(t) = C∞,2 (1 − exp(−t/�) (2)
Experiments which measure the exchange rate can be performedusing simple liquids, for example, using water and binary mixturesof water and ethanol or DMSO and chlorobenzene, and monitoringsurface tension during the exchange.
The details of the dynamics of the bulk exchange are importantto equilibrium and kinetic experiments. For equilibrium it is impor-tant to quantify the volume of fluid to be injected in order to achievecomplete exchange. Additionally, in order to separate interfacialexchange kinetics from the dynamics of the bulk exchange pro-cess, the evolution of the bulk concentration must be described asa function of the extrinsic conditions such as fluid transport prop-erties, capillary tip geometry, average and local fluid velocity, andbulk concentration.
The results of perfect mixing assumption described by Eqs. (1)and (2) are a rough estimation and in general show significantdifferences with practical data. In the absence of a proper exactsolution, computational fluid dynamics (CFD) simulations of thefluid flow and mass transfer in the drop are a good alternative. CFDcan provide interesting details on a microscopic level about theflow structure, velocity and concentration distribution, and on amacroscopic level, can be used to determine the overall residencetime of liquid in the drop and average drop surface concentra-tion. The spatiotemporal species distribution can also be calculatedto determine the rate at which the drop bulk attains composi-tional uniformity. For this purpose direct numerical solution of theNavier–Stokes equation for an unsteady 2D axisymmetric geom-etry with the following axial and radial momentum conservationequations is performed:
∂
∂t(�ux) + 1
r
∂
∂x(r�uxux) + 1
r
∂
∂r(r�urux)
= −∂p
∂x+ 1
r
∂
∂x
[r�
(2
∂ux
∂x− 2
3(∇.�u)
)]
+ 1r
∂
∂r
[r�
(∂ux
∂r+ ∂ur
∂x
)]+ Fx (3-a)
∂
∂t(�ur) + 1
r
∂
∂x(r�uxur) + 1
r
∂
∂r(r�urur)
= −∂p
∂r+ 1
r
∂
∂r
[r�
(2
∂ur
∂r− 2
3(∇.�u)
)]
+ 1r
∂
∂x
[r�
(∂ur
∂x+ ∂ux
∂r
)]− 2�
ur
r2+ 2
3�
r
(∇.�u)
+ Fr (3-b)
where ∇�u = ∂ux/∂x + ∂ur/∂r + ur/r and �F = ��g is the body force inaxial direction x. These equations describe the velocity vector fieldv(t,x,r) in terms of the intrinsic fluid properties, viscosity � anddensity �, and the pressure P. Along with the provided information
∂Ci
∂t+ �u∇Ci = Di∇2Ci (4)
where Di are the diffusion coefficients of the species in the liquidphase.
A. Javadi et al. / Colloids and Surfaces A: Physico
Fp
4
sfiscipp0ua
zi(du(
ig. 1. Geometry and computational domain of the applied coaxial double capillaryedant drop similar to the experimental conditions.
. Computational approach and boundary conditions
The given set of axisymmetric conservation equations wereolved computationally using the FLUENT 6.2 CFD software via anite volume approach with a segregated implicit solver. Fig. 1hows the geometry and computational domain for the appliedoaxial double capillary with pedant drop, equivalent to our exper-mental conditions. The inlet flow is a pulse-like flow with differentulse periods (dt = 0. 33 s and 0.2 s as time between two subsequentulses) and different injected volumes per pulse (dV = 0.033, 0.067,.1, 0.2 mm3/pulse). The pulse duration for the given injected vol-me can be calculated from the syringe dosing rate kept constantt 20 mm3/s in all experiments.
No slip boundary conditions on the tube walls (Ux = Uy=0) andero shear stress at the drop surface (referring to a free gas–liquid
nterface) are applied. At t = 0 the system contains pure waterC2,0 = 0) inside the drop and tube. To visualize the spatiotemporalistribution of bulk concentration, experiments were performedsing an inlet aqueous solution of a low molecular weight dyeBrilliant Green, C2,∞ = 3.3 mg/ml, D2 ≈ 5 × 10⁻⁶ cm2/s).Fig. 2. Comparison of dye exchange experimental snapshots (top) and CFD simulatio
chem. Eng. Aspects 365 (2010) 145–153 147
5. Results and discussion
In this section first the comparison of experimental imagesof dye exchange with CFD simulation of concentration contoursare discussed. These results present an overall idea of the dropexchange process and also illustrate the validity of the appliedCFD simulation. Then measured surface tension data are discussedwhich support the visual observation including possible Marangoniconvections. In the last section the CFD results of the area weightedaverage of the drop interfacial (subsurface) concentration (DIC) anddrop outlet concentration (DOC) are discussed for different condi-tions.
5.1. Drop exchange visualization
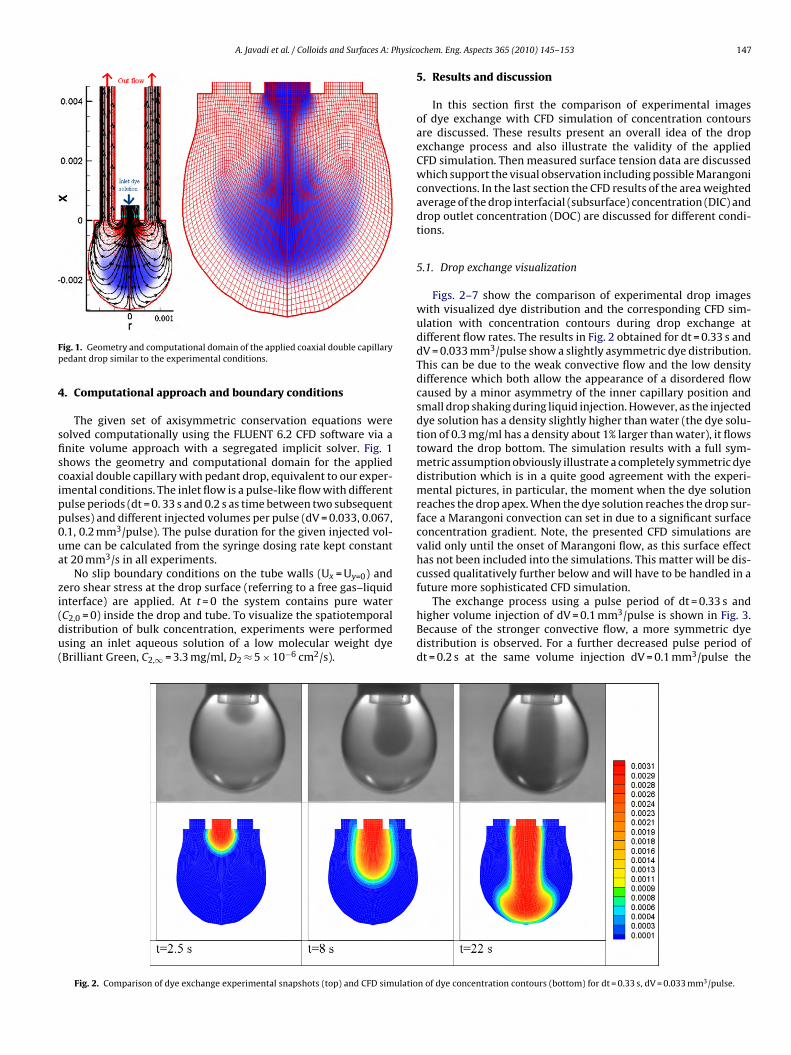
Figs. 2–7 show the comparison of experimental drop imageswith visualized dye distribution and the corresponding CFD sim-ulation with concentration contours during drop exchange atdifferent flow rates. The results in Fig. 2 obtained for dt = 0.33 s anddV = 0.033 mm3/pulse show a slightly asymmetric dye distribution.This can be due to the weak convective flow and the low densitydifference which both allow the appearance of a disordered flowcaused by a minor asymmetry of the inner capillary position andsmall drop shaking during liquid injection. However, as the injecteddye solution has a density slightly higher than water (the dye solu-tion of 0.3 mg/ml has a density about 1% larger than water), it flowstoward the drop bottom. The simulation results with a full sym-metric assumption obviously illustrate a completely symmetric dyedistribution which is in a quite good agreement with the experi-mental pictures, in particular, the moment when the dye solutionreaches the drop apex. When the dye solution reaches the drop sur-face a Marangoni convection can set in due to a significant surfaceconcentration gradient. Note, the presented CFD simulations arevalid only until the onset of Marangoni flow, as this surface effecthas not been included into the simulations. This matter will be dis-cussed qualitatively further below and will have to be handled in afuture more sophisticated CFD simulation.
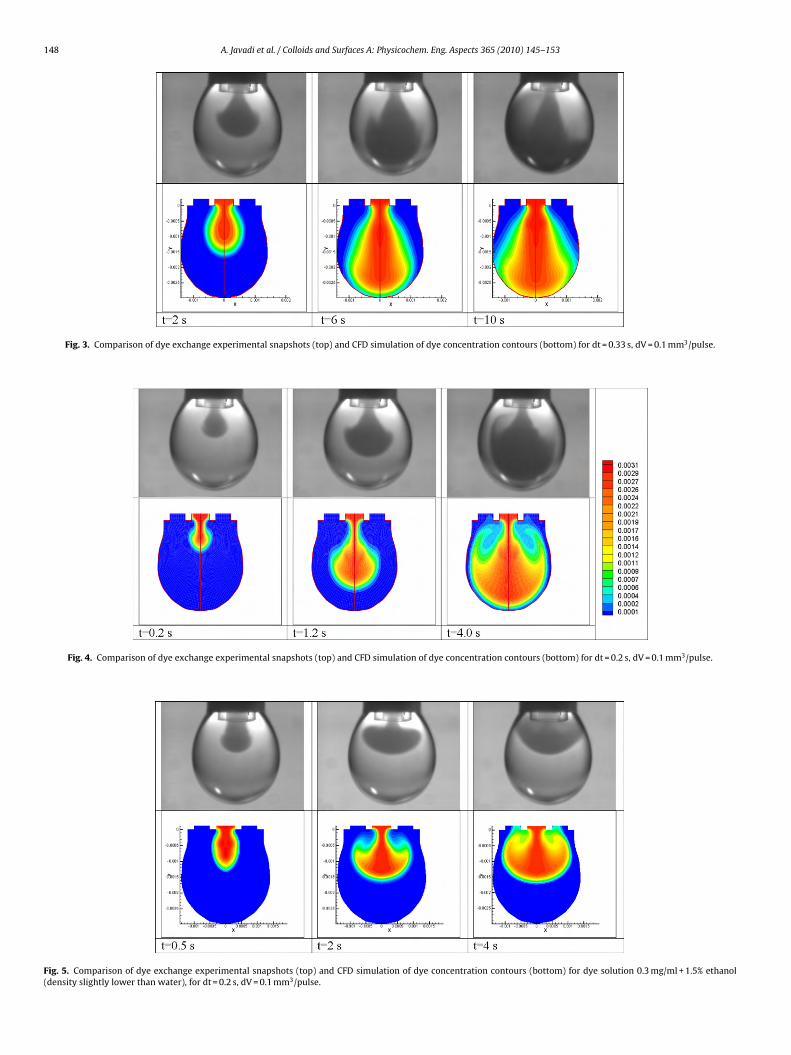
The exchange process using a pulse period of dt = 0.33 s andhigher volume injection of dV = 0.1 mm3/pulse is shown in Fig. 3.Because of the stronger convective flow, a more symmetric dyedistribution is observed. For a further decreased pulse period ofdt = 0.2 s at the same volume injection dV = 0.1 mm3/pulse the
n of dye concentration contours (bottom) for dt = 0.33 s, dV = 0.033 mm3/pulse.
148 A. Javadi et al. / Colloids and Surfaces A: Physicochem. Eng. Aspects 365 (2010) 145–153
Fig. 3. Comparison of dye exchange experimental snapshots (top) and CFD simulation of dye concentration contours (bottom) for dt = 0.33 s, dV = 0.1 mm3/pulse.
Fig. 4. Comparison of dye exchange experimental snapshots (top) and CFD simulation of dye concentration contours (bottom) for dt = 0.2 s, dV = 0.1 mm3/pulse.
Fig. 5. Comparison of dye exchange experimental snapshots (top) and CFD simulation of dye concentration contours (bottom) for dye solution 0.3 mg/ml + 1.5% ethanol(density slightly lower than water), for dt = 0.2 s, dV = 0.1 mm3/pulse.

A. Javadi et al. / Colloids and Surfaces A: Physicochem. Eng. Aspects 365 (2010) 145–153 149
F , appe0 vol% e
cbsmo
5
dcesfohtds
F(
ig. 6. The effects of density difference on the concentration contours and flow filed.3 mg/ml dye (top line—density slightly higher than water), and 0.3 mg/ml dye + 1.5
onvection effects become stronger and the flow reaching theottom of the drop shows a clear circulating flow due to thetagnant point in the impinging liquid flow. In Fig. 4 a good agree-ent between experimental images and the CFD simulation is
bserved.
.2. Density difference effects
For many applications the inlet flow for liquid exchange in theroplet contains a mixture of components and solvents which canhange the density of the injected solution. For this purpose 1.5 wt%thanol was added to the dye solution so that the density of thisolution was slightly less than water. The results presented in Fig. 5or dt = 0.2 s and dV = 0.1 mm3/pulse illustrate a quick reverse flow
f the injected liquid with exchanging the liquid in even less thanalf of the droplet. A continuation of this liquid exchange over longimes cannot provide a complete bulk exchange. This matter isiscussed further below in some more detail. For a better under-tanding of the density effects on the drop exchange mechanism, aig. 7. Comparison of dye exchange experimental snapshots (top) and CFD simulation ofdensity slightly lower than water), for dt = 0.2 s, dV = 0.2 mm3/pulse.
aring secondary circulating flow in the bottom of droplet for low density solution;thanol (bottom line—density slightly less than water); dt = 0.2 s, dV = 0.1 mm3/pulse.
comparison of the streamlines and flow pattern is shown in Fig. 6 fora dye solution of 0.3 mg/ml in absence (density slightly higher thanwater), and presence of 1.5 wt% ethanol (density slightly lower thanwater). There is a secondary circulating flow at the bottom of thedroplet which separates the entrance circulation of the dye solu-tion at the top from the region at the drop bottom when a liquid oflower density is injected.
To improve the exchange process for injections of low densitysolutions, we have to increase the injection velocity. Fig. 7 showsthe results for a drop exchange at dt = 0.2 s and dV = 0.2 mm3/pulse.Because of the high inertial force, the injected dye solution reachesthe bottom of the drop quicker. Simultaneously, a reverse flowout of the drop is visible, leading to a mushroom like shape ofthe concentration contour. The results of CFD simulations repro-
duce this pattern well. A good drop exchange is observed after 8 s,however because of the stagnation point and the reverse flow fromthe bottom, the drop surface concentration DIC needs much longertime to approach an equilibrium situation, as discussed furtherbelow.dye concentration contours (bottom) for dye solution 0.3 mg/ml + 1.5 vol% ethanol
150 A. Javadi et al. / Colloids and Surfaces A: Physicochem. Eng. Aspects 365 (2010) 145–153
F shak(
5
cwcat
baiolbTts
5
et(bciepeb
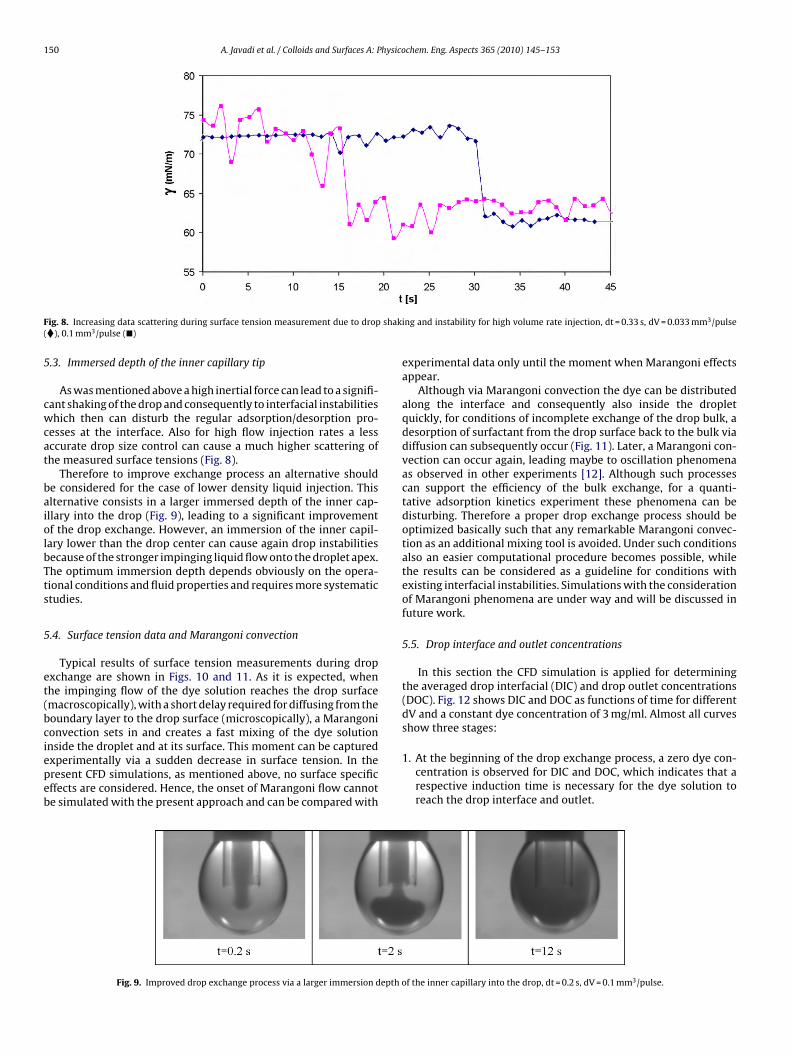
ig. 8. Increasing data scattering during surface tension measurement due to drop�), 0.1 mm3/pulse (�)
.3. Immersed depth of the inner capillary tip
As was mentioned above a high inertial force can lead to a signifi-ant shaking of the drop and consequently to interfacial instabilitieshich then can disturb the regular adsorption/desorption pro-
esses at the interface. Also for high flow injection rates a lessccurate drop size control can cause a much higher scattering ofhe measured surface tensions (Fig. 8).
Therefore to improve exchange process an alternative shoulde considered for the case of lower density liquid injection. Thislternative consists in a larger immersed depth of the inner cap-llary into the drop (Fig. 9), leading to a significant improvementf the drop exchange. However, an immersion of the inner capil-ary lower than the drop center can cause again drop instabilitiesecause of the stronger impinging liquid flow onto the droplet apex.he optimum immersion depth depends obviously on the opera-ional conditions and fluid properties and requires more systematictudies.
.4. Surface tension data and Marangoni convection
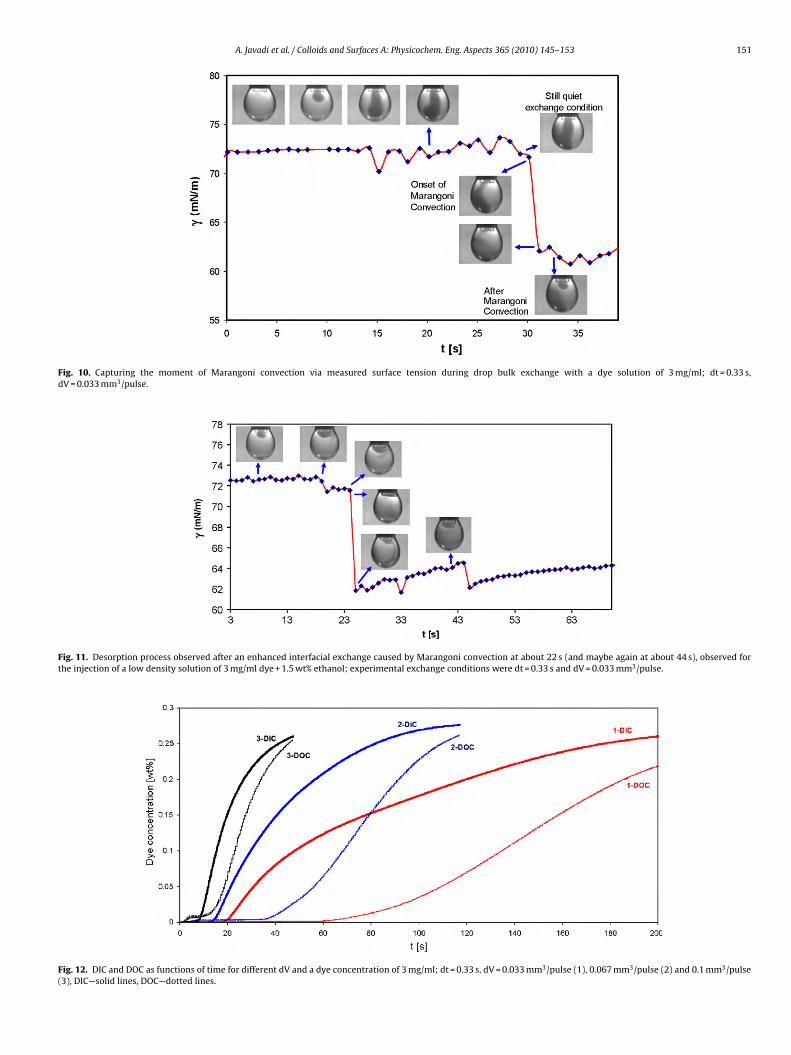
Typical results of surface tension measurements during dropxchange are shown in Figs. 10 and 11. As it is expected, whenhe impinging flow of the dye solution reaches the drop surfacemacroscopically), with a short delay required for diffusing from theoundary layer to the drop surface (microscopically), a Marangonionvection sets in and creates a fast mixing of the dye solution
nside the droplet and at its surface. This moment can be capturedxperimentally via a sudden decrease in surface tension. In theresent CFD simulations, as mentioned above, no surface specificffects are considered. Hence, the onset of Marangoni flow cannote simulated with the present approach and can be compared withFig. 9. Improved drop exchange process via a larger immersion depth o
ing and instability for high volume rate injection, dt = 0.33 s, dV = 0.033 mm3/pulse
experimental data only until the moment when Marangoni effectsappear.
Although via Marangoni convection the dye can be distributedalong the interface and consequently also inside the dropletquickly, for conditions of incomplete exchange of the drop bulk, adesorption of surfactant from the drop surface back to the bulk viadiffusion can subsequently occur (Fig. 11). Later, a Marangoni con-vection can occur again, leading maybe to oscillation phenomenaas observed in other experiments [12]. Although such processescan support the efficiency of the bulk exchange, for a quanti-tative adsorption kinetics experiment these phenomena can bedisturbing. Therefore a proper drop exchange process should beoptimized basically such that any remarkable Marangoni convec-tion as an additional mixing tool is avoided. Under such conditionsalso an easier computational procedure becomes possible, whilethe results can be considered as a guideline for conditions withexisting interfacial instabilities. Simulations with the considerationof Marangoni phenomena are under way and will be discussed infuture work.
5.5. Drop interface and outlet concentrations
In this section the CFD simulation is applied for determiningthe averaged drop interfacial (DIC) and drop outlet concentrations(DOC). Fig. 12 shows DIC and DOC as functions of time for differentdV and a constant dye concentration of 3 mg/ml. Almost all curvesshow three stages:
1. At the beginning of the drop exchange process, a zero dye con-centration is observed for DIC and DOC, which indicates that arespective induction time is necessary for the dye solution toreach the drop interface and outlet.
f the inner capillary into the drop, dt = 0.2 s, dV = 0.1 mm3/pulse.
A. Javadi et al. / Colloids and Surfaces A: Physicochem. Eng. Aspects 365 (2010) 145–153 151
Fig. 10. Capturing the moment of Marangoni convection via measured surface tension during drop bulk exchange with a dye solution of 3 mg/ml; dt = 0.33 s,dV = 0.033 mm3/pulse.
Fig. 11. Desorption process observed after an enhanced interfacial exchange caused by Marangoni convection at about 22 s (and maybe again at about 44 s), observed forthe injection of a low density solution of 3 mg/ml dye + 1.5 wt% ethanol; experimental exchange conditions were dt = 0.33 s and dV = 0.033 mm3/pulse.
Fig. 12. DIC and DOC as functions of time for different dV and a dye concentration of 3 mg/ml; dt = 0.33 s, dV = 0.033 mm3/pulse (1), 0.067 mm3/pulse (2) and 0.1 mm3/pulse(3), DIC—solid lines, DOC—dotted lines.
152 A. Javadi et al. / Colloids and Surfaces A: Physicochem. Eng. Aspects 365 (2010) 145–153
F of 3 mg/ml; dt = 0.2 s, dV = 0.033 mm3/pulse (1), 0.067 mm3/pulse (2) and 0.1 mm3/pulse(
2
3
ACdiegth
ctadttca(vdmip
reason can be a computational instability due to the mentionedpulse-like flow.
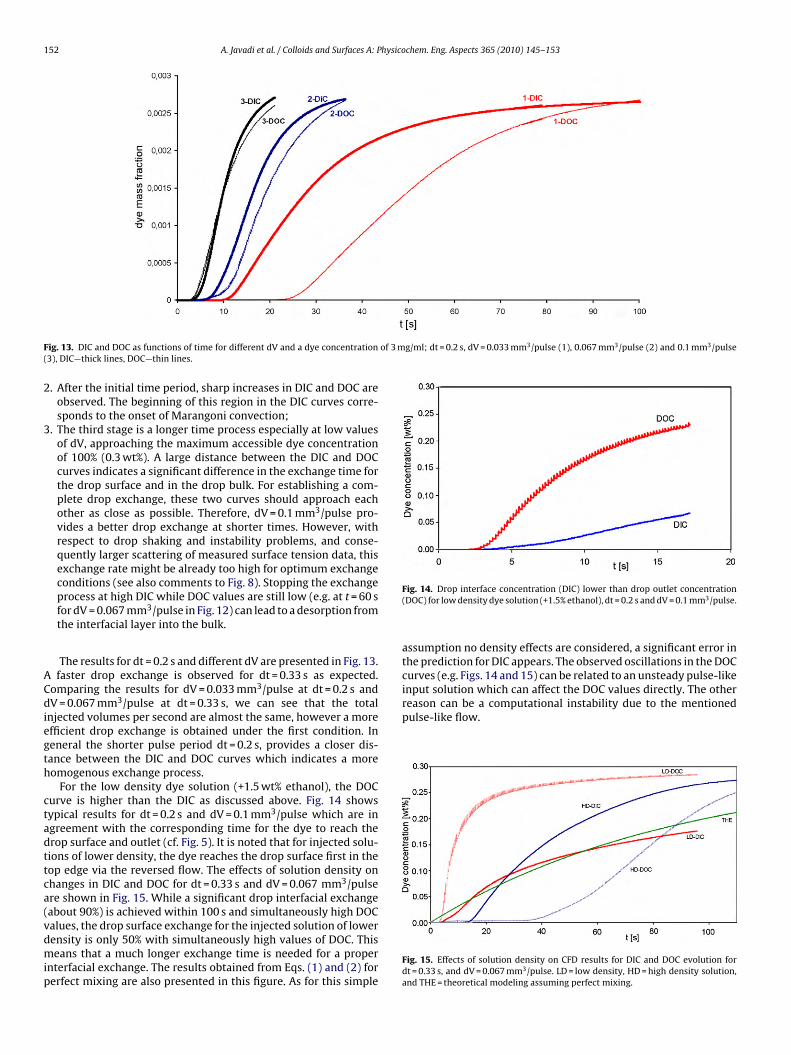
ig. 13. DIC and DOC as functions of time for different dV and a dye concentration3), DIC—thick lines, DOC—thin lines.
. After the initial time period, sharp increases in DIC and DOC areobserved. The beginning of this region in the DIC curves corre-sponds to the onset of Marangoni convection;
. The third stage is a longer time process especially at low valuesof dV, approaching the maximum accessible dye concentrationof 100% (0.3 wt%). A large distance between the DIC and DOCcurves indicates a significant difference in the exchange time forthe drop surface and in the drop bulk. For establishing a com-plete drop exchange, these two curves should approach eachother as close as possible. Therefore, dV = 0.1 mm3/pulse pro-vides a better drop exchange at shorter times. However, withrespect to drop shaking and instability problems, and conse-quently larger scattering of measured surface tension data, thisexchange rate might be already too high for optimum exchangeconditions (see also comments to Fig. 8). Stopping the exchangeprocess at high DIC while DOC values are still low (e.g. at t = 60 sfor dV = 0.067 mm3/pulse in Fig. 12) can lead to a desorption fromthe interfacial layer into the bulk.
The results for dt = 0.2 s and different dV are presented in Fig. 13.faster drop exchange is observed for dt = 0.33 s as expected.
omparing the results for dV = 0.033 mm3/pulse at dt = 0.2 s andV = 0.067 mm3/pulse at dt = 0.33 s, we can see that the total
njected volumes per second are almost the same, however a morefficient drop exchange is obtained under the first condition. Ineneral the shorter pulse period dt = 0.2 s, provides a closer dis-ance between the DIC and DOC curves which indicates a moreomogenous exchange process.
For the low density dye solution (+1.5 wt% ethanol), the DOCurve is higher than the DIC as discussed above. Fig. 14 showsypical results for dt = 0.2 s and dV = 0.1 mm3/pulse which are ingreement with the corresponding time for the dye to reach therop surface and outlet (cf. Fig. 5). It is noted that for injected solu-ions of lower density, the dye reaches the drop surface first in theop edge via the reversed flow. The effects of solution density onhanges in DIC and DOC for dt = 0.33 s and dV = 0.067 mm3/pulsere shown in Fig. 15. While a significant drop interfacial exchangeabout 90%) is achieved within 100 s and simultaneously high DOC
alues, the drop surface exchange for the injected solution of lowerensity is only 50% with simultaneously high values of DOC. Thiseans that a much longer exchange time is needed for a propernterfacial exchange. The results obtained from Eqs. (1) and (2) forerfect mixing are also presented in this figure. As for this simple
Fig. 14. Drop interface concentration (DIC) lower than drop outlet concentration(DOC) for low density dye solution (+1.5% ethanol), dt = 0.2 s and dV = 0.1 mm3/pulse.
assumption no density effects are considered, a significant error inthe prediction for DIC appears. The observed oscillations in the DOCcurves (e.g. Figs. 14 and 15) can be related to an unsteady pulse-likeinput solution which can affect the DOC values directly. The other
Fig. 15. Effects of solution density on CFD results for DIC and DOC evolution fordt = 0.33 s, and dV = 0.067 mm3/pulse. LD = low density, HD = high density solution,and THE = theoretical modeling assuming perfect mixing.
hysico
6
secFueb
•
•
•
[9] V.B. Fainerman, A.V. Makievski, J. Krägel, A. Javadi, R. Miller, J. Colloid InterfaceSci. 308 (2007) 249–253.
[10] J.K. Ferri, Cs. Kotsmar and R. Miller, Adv. Colloid Interface Sci., in press.
A. Javadi et al. / Colloids and Surfaces A: P
. Conclusion
Despite the small size of pendant drops used in drop profile ten-iometry, the coaxial double capillary allows an efficient drop bulkxchange. Choosing the right experimental conditions for an effi-ient drop exchange disturbances and drop shaking can be avoided.low visualization using dye solutions for exchange and CFD sim-lation demonstrate details for the optimization of this interestingxperimental tool and improve the understanding of the effects ofasic parameters, which can be summarized as follows:
The liquid exchange process can be visualized by injection ofdye solutions and are comparable with CFD simulation, untilthe moment Marangoni convection sets in. The CFD resultsfor the drop interfacial concentration (DIC) and drop outletconcentration (DOC) are in good agreement with observed exper-imental images and measured surface tension data before theonset of Marangoni convection. Although Marangoni convectionenhances mass transfer at the drop surface and in the bulk sig-nificantly, it should be better avoided to allow for a quantitativeevaluation of adsorption or desorption processes at the drop sur-face.Density differences between drop and injected liquids influencethe structure of the circulating flow significantly even for small��. For the injection of lower density solutions, a quick reverseflow is the major barrier for a perfect drop exchange. To avoidto drop perturbation effects and instabilities, at sufficiently lowinjection rates dV the drop exchange can be improved by a larger
immersed depth of the inner capillary into the drop.The consideration of the trends and distance of the DIC andDOC curves obtained by CFD simulation provides a useful toolfor understanding the exchange process mechanism and findingoptimum process parameters.[
[
chem. Eng. Aspects 365 (2010) 145–153 153
• Simplified theoretical models assuming a perfect mixing showsignificant errors in the prediction of DIC and DOC, while the pre-sented combination of dye injection and CFD simulation providea sufficiently accurate tool.
Acknowledgements
The work was financially supported by a project of the GermanSpace Agency (DLR 50WM0941) and the DFG (Mi418/16-1). Theauthors are also very grateful for the important support by K. Javadiin the performance of the CFD simulations.
References
[1] Y. Rotenberg, L. Boruvka, A.W. Neumann, J.Colloid Interface Sci. 93 (1983)169–183.
[2] P. Cheng, A.W. Neumann, Colloid Surf. 62 (1992) 297–305.[3] G. Loglio, P. Pandolfini, R. Miller, A.V. Makievski, F. Ravera, M. Ferrari, L. Liggieri,
Drop and bubble shape analysis as tool for dilational rheology studies of inter-facial layers, in: D. Möbius, R. Miller (Eds.), Novel Methods to Study InterfacialLayers, vol. 11, Elsevier, 2001.
[4] H.A. Wege, J.A. Holgado-Terriza, A.W. Neumann, M.A. Cabrerizo-Vilchez, Col-loid Surf. A 156 (1999) 509–517.
[5] T.F. Svitova, M.J. Wetherbee, C.J. Radke, J. Colloid Interface Sci. 261 (2003)170–179.
[6] V.B. Fainerman, M.E. Leser, M. Michel, E.H. Lucassen-Reynders, R. Miller, J. Phys.Chem. B 109 (2005) 9672–9677.
[7] J.K. Ferri, N. Gorevski, Cs. Kotsmar, M.E. Leser, R. Miller, Colloid Surf. A 319(2008) 13–20.
[8] J.K. Ferri, W.-F. Dong, R. Miller, J. Phys. Chem. B 109 (2005) 14764–14768.
11] H.A. Wege, J.A. Holgado-Terriza, M.A. Cabrerizo-Vilchez, J. Colloid Interface Sci.249 (2002) 263–273.
12] N.M. Kovalchuk, D. Vollhardt, Adv. Colloid Interface Sci. 120 (2006) 1–31.
Copyright © 2022 FDOKUMEN