Evaluation of Persistence of Resistant Variants with Ultra-Deep Pyrosequencing in Chronic Hepatitis...
10
Evaluation of Persistence of Resistant Variants with Ultra-Deep Pyrosequencing in Chronic Hepatitis C Patients Treated with Telaprevir Xiomara V. Thomas 1 * . , Joep de Bruijne 2. , James C. Sullivan 3 , Tara L. Kieffer 3 , Cynthia K. Y. Ho 1 , Sjoerd P. Rebers 1 , Michel de Vries 4 , Hendrik W. Reesink 2 , Christine J. Weegink 2 , Richard Molenkamp 1 , Janke Schinkel 1 1 Academic Medical Center, Department of Medical Microbiology, Section of Clinical Virology, Amsterdam, The Netherlands, 2 Academic Medical Center, Department of Gastroenterology and Hepatology, Amsterdam, The Netherlands, 3 Vertex Pharmaceuticals Incorporated, Cambridge, Massachusetts, United States of America, 4 Academic Medical Center, Department of Medical Microbiology, Section of Human Retro Virology, Amsterdam, The Netherlands Abstract Background & Aims: Telaprevir, a hepatitis C virus NS3/4A protease inhibitor has significantly improved sustained viral response rates when given in combination with pegylated interferon alfa-2a and ribavirin, compared with current standard of care in hepatitis C virus genotype 1 infected patients. In patients with a failed sustained response, the emergence of drug-resistant variants during treatment has been reported. It is unclear to what extent these variants persist in untreated patients. The aim of this study was to assess using ultra-deep pyrosequencing, whether after 4 years follow-up, the frequency of resistant variants is increased compared to pre-treatment frequencies following 14 days of telaprevir treatment. Methods: Fifteen patients from 2 previous telaprevir phase 1 clinical studies (VX04-950-101 and VX05-950-103) were included. These patients all received telaprevir monotherapy for 14 days, and 2 patients subsequently received standard of care. Variants at previously well-characterized NS3 protease positions V36, T54, R155 and A156 were assessed at baseline and after a follow-up of 461.2 years by ultra-deep pyrosequencing. The prevalence of resistant variants at follow-up was compared to baseline. Results: Resistance associated mutations were detectable at low frequency at baseline. In general, prevalence of resistance mutations at follow-up was not increased compared to baseline. Only one patient had a small, but statistically significant, increase in the number of V36M and T54S variants 4 years after telaprevir-dosing. Conclusion: In patients treated for 14 days with telaprevir monotherapy, ultra-deep pyrosequencing indicates that long- term persistence of resistant variants is rare. Citation: Thomas XV, de Bruijne J, Sullivan JC, Kieffer TL, Ho CKY, et al. (2012) Evaluation of Persistence of Resistant Variants with Ultra-Deep Pyrosequencing in Chronic Hepatitis C Patients Treated with Telaprevir. PLoS ONE 7(7): e41191. doi:10.1371/journal.pone.0041191 Editor: Erica Villa, University of Modena & Reggio Emilia, Italy Received February 20, 2012; Accepted June 18, 2012; Published July 27, 2012 Copyright: ß 2012 Thomas et al. This is an open-access article distributed under the terms of the Creative Commons Attribution License, which permits unrestricted use, distribution, and reproduction in any medium, provided the original author and source are credited. Funding: The authors have no support or funding to report. Competing Interests: The authors have read the journal’s policy and have the following conflicts: HR serves as advisor for Roche Molecular Diagnostics, Anadys, Merck, Arrows, and Gilead, consults for PRA-International, Tibotec, GlaxoSmithKline, Chiron Novartis, and Roche Therapeutics, and receives grant/research support from Merck & Co. TK and J. Sullivan are employees and stock owners of Vertex Pharmaceuticals Incorporated. This does not alter the authors’ adherence to all the PLoS ONE policies on sharing data and materials. All other authors have nothing to disclose. * E-mail: [email protected] . These authors contributed equally to this work. Introduction Worldwide, an estimated 170 million people are chronically infected with hepatitis C virus (HCV) [1]. Chronic hepatitis C is a major cause of liver cirrhosis and hepatocellular carcinoma. HCV- related end-stage liver disease is now the main indication for liver transplantation in North America and Western Europe [2]. The current standard of care, pegylated interferon-a-2a/b (PEG-IFN) combined with ribavirin (RBV), has limited efficacy and causes significant side effects. In patients infected with HCV genotype 1, the most prevalent genotype in developed countries, treatment for 48 weeks results in rates of sustained virologic response (SVR) of only 40-50%. Efforts to improve patients’ outcomes have resulted in the development of direct-acting antiviral agents (DAAs) such as non- structural protein 3/4A (NS3/4A) serine protease inhibitors. The NS3/4A protease mediates the cleavage of the HCV polyprotein into functional viral proteins essential for viral replication [3]. NS3/4A serine protease inhibitors block this NS3/4A protease- dependent cleavage [4–6]. Two of those protease inhibitors, telaprevir and boceprevir, are now licensed in several countries for clinical use in combination PLoS ONE | www.plosone.org 1 July 2012 | Volume 7 | Issue 7 | e41191
-
Upload
independent -
Category
Documents
-
view
0 -
download
0
Transcript of Evaluation of Persistence of Resistant Variants with Ultra-Deep Pyrosequencing in Chronic Hepatitis...

Evaluation of Persistence of Resistant Variants withUltra-Deep Pyrosequencing in Chronic Hepatitis CPatients Treated with TelaprevirXiomara V. Thomas1*., Joep de Bruijne2., James C. Sullivan3, Tara L. Kieffer3, Cynthia K. Y. Ho1,
Sjoerd P. Rebers1, Michel de Vries4, Hendrik W. Reesink2, Christine J. Weegink2, Richard Molenkamp1,
Janke Schinkel1
1 Academic Medical Center, Department of Medical Microbiology, Section of Clinical Virology, Amsterdam, The Netherlands, 2 Academic Medical Center, Department of
Gastroenterology and Hepatology, Amsterdam, The Netherlands, 3 Vertex Pharmaceuticals Incorporated, Cambridge, Massachusetts, United States of America,
4 Academic Medical Center, Department of Medical Microbiology, Section of Human Retro Virology, Amsterdam, The Netherlands
Abstract
Background & Aims: Telaprevir, a hepatitis C virus NS3/4A protease inhibitor has significantly improved sustained viralresponse rates when given in combination with pegylated interferon alfa-2a and ribavirin, compared with current standardof care in hepatitis C virus genotype 1 infected patients. In patients with a failed sustained response, the emergence ofdrug-resistant variants during treatment has been reported. It is unclear to what extent these variants persist in untreatedpatients. The aim of this study was to assess using ultra-deep pyrosequencing, whether after 4 years follow-up, thefrequency of resistant variants is increased compared to pre-treatment frequencies following 14 days of telaprevirtreatment.
Methods: Fifteen patients from 2 previous telaprevir phase 1 clinical studies (VX04-950-101 and VX05-950-103) wereincluded. These patients all received telaprevir monotherapy for 14 days, and 2 patients subsequently received standard ofcare. Variants at previously well-characterized NS3 protease positions V36, T54, R155 and A156 were assessed at baselineand after a follow-up of 461.2 years by ultra-deep pyrosequencing. The prevalence of resistant variants at follow-up wascompared to baseline.
Results: Resistance associated mutations were detectable at low frequency at baseline. In general, prevalence of resistancemutations at follow-up was not increased compared to baseline. Only one patient had a small, but statistically significant,increase in the number of V36M and T54S variants 4 years after telaprevir-dosing.
Conclusion: In patients treated for 14 days with telaprevir monotherapy, ultra-deep pyrosequencing indicates that long-term persistence of resistant variants is rare.
Citation: Thomas XV, de Bruijne J, Sullivan JC, Kieffer TL, Ho CKY, et al. (2012) Evaluation of Persistence of Resistant Variants with Ultra-Deep Pyrosequencing inChronic Hepatitis C Patients Treated with Telaprevir. PLoS ONE 7(7): e41191. doi:10.1371/journal.pone.0041191
Editor: Erica Villa, University of Modena & Reggio Emilia, Italy
Received February 20, 2012; Accepted June 18, 2012; Published July 27, 2012
Copyright: � 2012 Thomas et al. This is an open-access article distributed under the terms of the Creative Commons Attribution License, which permitsunrestricted use, distribution, and reproduction in any medium, provided the original author and source are credited.
Funding: The authors have no support or funding to report.
Competing Interests: The authors have read the journal’s policy and have the following conflicts: HR serves as advisor for Roche Molecular Diagnostics, Anadys,Merck, Arrows, and Gilead, consults for PRA-International, Tibotec, GlaxoSmithKline, Chiron Novartis, and Roche Therapeutics, and receives grant/research supportfrom Merck & Co. TK and J. Sullivan are employees and stock owners of Vertex Pharmaceuticals Incorporated. This does not alter the authors’ adherence to all thePLoS ONE policies on sharing data and materials. All other authors have nothing to disclose.
* E-mail: [email protected]
. These authors contributed equally to this work.
Introduction
Worldwide, an estimated 170 million people are chronically
infected with hepatitis C virus (HCV) [1]. Chronic hepatitis C is a
major cause of liver cirrhosis and hepatocellular carcinoma. HCV-
related end-stage liver disease is now the main indication for liver
transplantation in North America and Western Europe [2]. The
current standard of care, pegylated interferon-a-2a/b (PEG-IFN)
combined with ribavirin (RBV), has limited efficacy and causes
significant side effects. In patients infected with HCV genotype 1,
the most prevalent genotype in developed countries, treatment for
48 weeks results in rates of sustained virologic response (SVR) of
only 40-50%.
Efforts to improve patients’ outcomes have resulted in the
development of direct-acting antiviral agents (DAAs) such as non-
structural protein 3/4A (NS3/4A) serine protease inhibitors. The
NS3/4A protease mediates the cleavage of the HCV polyprotein
into functional viral proteins essential for viral replication [3].
NS3/4A serine protease inhibitors block this NS3/4A protease-
dependent cleavage [4–6].
Two of those protease inhibitors, telaprevir and boceprevir, are
now licensed in several countries for clinical use in combination
PLoS ONE | www.plosone.org 1 July 2012 | Volume 7 | Issue 7 | e41191
with PEG-IFN and RBV, after extensive preclinical and clinical
evaluation [7,8].
Telaprevir (TVR) is a selective, reversible, orally bio-available
NS3/4A protease inhibitor that has demonstrated potent antiviral
activity in patients infected with HCV genotype 1 [9,10]. Phase 3
clinical studies investigating TVR, PEG-IFN and RBV combina-
tion therapy demonstrated significant improvement of SVR rates
compared to standard treatment in both treatment-naive and prior
treatment-experienced patients infected with HCV genotype 1
[11,12].
However, the flexibility of the HCV genome, caused by the
high error rate of its polymerase, allows the virus to adapt
rapidly to the presence of an antiviral drug through the
selection of minor variants with drug resistant mutations
[13,14]. Both clinical and replicon studies have demonstrated
that resistant variants are characterized by mutations at
positions V36, T54, R155 or A156 [15,16]. Indeed, in 74%
of patients who failed to respond to TVR combination
treatment in phase 3 clinical TVR trials, the virus population
was dominated by resistant variants immediately after treatment
[Sullivan et al. Unpublished]. The abundant presence of
resistant variants in patients who failed treatment is cause for
concern, as this may limit the options for future retreatment in
these patients and ultimately may also result in the spread of
resistant viruses. Whether the virus population returns to
baseline with respect to frequency of resistant variants is
therefore an important issue to address. Using population and
clonal sequencing, a few studies have monitored the frequency
of resistant variants at different time points following TVR
treatment in phase 1 and phase 3 clinical trials. These studies
suggest that after termination of TVR treatment, the resistant
virus population is gradually replaced by WT virus [17],
[Sullivan et al. Unpublished]. The observed decline in
frequency of resistant variants is not surprising as their fitness
is impaired compared to WT virus [14,15,17].
The aim of the study presented here was to study the frequency
of resistant variants in patients 4 years after 14-days of
monotherapy with TVR using the novel ultra-deep pyrosequenc-
ing (UDPS) technique. The extreme sensitivity of UDPS enables a
comparison of changes in frequency of minor variants compared
to baseline far beyond the limit of detection of conventional
techniques. In addition, the large number of sequences that are
generated also allows for a robust statistical analysis of observed
changes in the virus population.
Materials and Methods
Study Design and Patient CharacteristicsThe VX04-950-101 and VX05-950-103 clinical phase 1 studies
investigated the safety and antiviral activity of TVR [9,10]. Both
studies were conducted at 2 collaborative sites in The Netherlands
and one site in Germany in 2005 and 2006. These studies were
conducted in full compliance with the guidelines of Good Clinical
Practice and of the World Medical Assembly Declaration of
Helsinki. Prior to study initiation, the protocol and informed
consent form were reviewed and approved by the institutional
review boards at each site. All patients provided written informed
consent before participating in any study-related activity.
For the 101-study, patients naı̈ve or experienced to an
interferon-based regimen were enrolled, whereas for the 103-
study only treatment-naı̈ve patients were eligible. All patients were
chronically infected with HCV genotype 1. In the 101-study, 34
patients were randomized to receive placebo or TVR at doses of
450 mg or 750 mg every 8 hours or 1250 mg every 12 hours for
14 days. In the 103-study, 20 patients were randomized to receive
TVR monotherapy, TVR with PEG-IFN or PEG-IFN with
placebo for 14 days. At the completion of the 14-day study dosing,
off-study standard of care with PEG-IFN and RBV was offered to
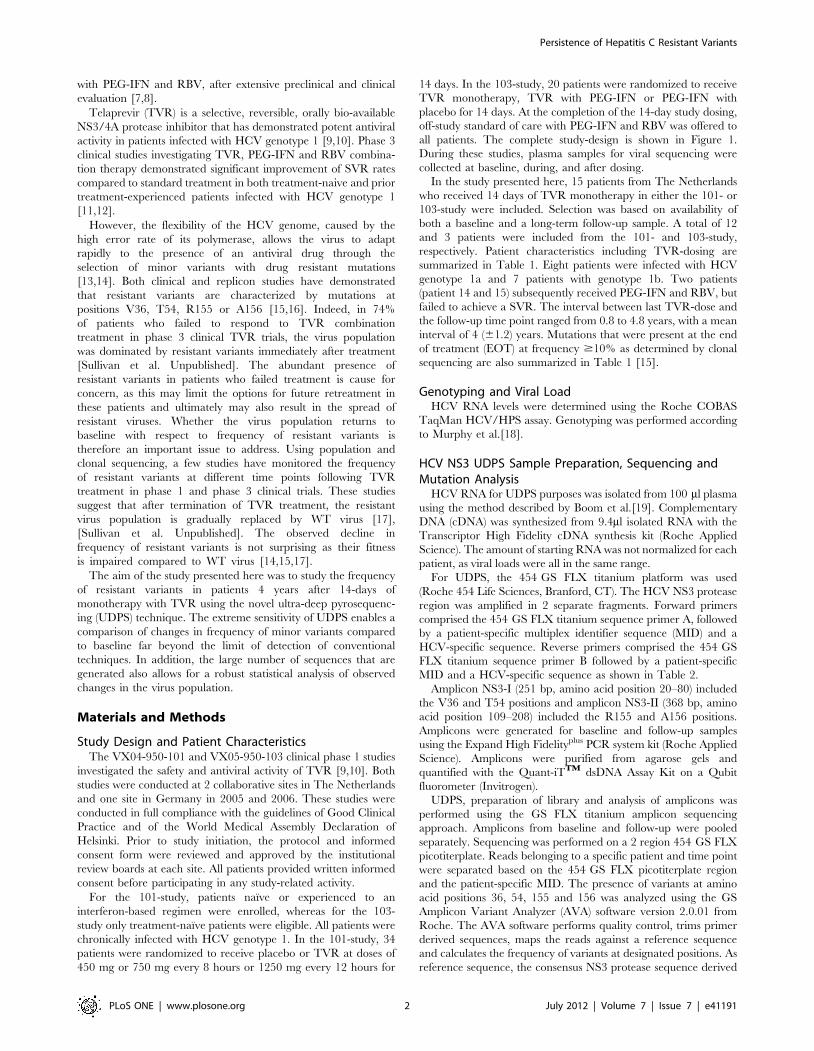
all patients. The complete study-design is shown in Figure 1.
During these studies, plasma samples for viral sequencing were
collected at baseline, during, and after dosing.
In the study presented here, 15 patients from The Netherlands
who received 14 days of TVR monotherapy in either the 101- or
103-study were included. Selection was based on availability of
both a baseline and a long-term follow-up sample. A total of 12
and 3 patients were included from the 101- and 103-study,
respectively. Patient characteristics including TVR-dosing are
summarized in Table 1. Eight patients were infected with HCV
genotype 1a and 7 patients with genotype 1b. Two patients
(patient 14 and 15) subsequently received PEG-IFN and RBV, but
failed to achieve a SVR. The interval between last TVR-dose and
the follow-up time point ranged from 0.8 to 4.8 years, with a mean
interval of 4 (61.2) years. Mutations that were present at the end
of treatment (EOT) at frequency $10% as determined by clonal
sequencing are also summarized in Table 1 [15].
Genotyping and Viral LoadHCV RNA levels were determined using the Roche COBAS
TaqMan HCV/HPS assay. Genotyping was performed according
to Murphy et al.[18].
HCV NS3 UDPS Sample Preparation, Sequencing andMutation Analysis
HCV RNA for UDPS purposes was isolated from 100 ml plasma
using the method described by Boom et al.[19]. Complementary
DNA (cDNA) was synthesized from 9.4ml isolated RNA with the
Transcriptor High Fidelity cDNA synthesis kit (Roche Applied
Science). The amount of starting RNA was not normalized for each
patient, as viral loads were all in the same range.
For UDPS, the 454 GS FLX titanium platform was used
(Roche 454 Life Sciences, Branford, CT). The HCV NS3 protease
region was amplified in 2 separate fragments. Forward primers
comprised the 454 GS FLX titanium sequence primer A, followed
by a patient-specific multiplex identifier sequence (MID) and a
HCV-specific sequence. Reverse primers comprised the 454 GS
FLX titanium sequence primer B followed by a patient-specific
MID and a HCV-specific sequence as shown in Table 2.
Amplicon NS3-I (251 bp, amino acid position 20–80) included
the V36 and T54 positions and amplicon NS3-II (368 bp, amino
acid position 109–208) included the R155 and A156 positions.
Amplicons were generated for baseline and follow-up samples
using the Expand High Fidelityplus PCR system kit (Roche Applied
Science). Amplicons were purified from agarose gels and
quantified with the Quant-iTTM dsDNA Assay Kit on a Qubit
fluorometer (Invitrogen).
UDPS, preparation of library and analysis of amplicons was
performed using the GS FLX titanium amplicon sequencing
approach. Amplicons from baseline and follow-up were pooled
separately. Sequencing was performed on a 2 region 454 GS FLX
picotiterplate. Reads belonging to a specific patient and time point
were separated based on the 454 GS FLX picotiterplate region
and the patient-specific MID. The presence of variants at amino
acid positions 36, 54, 155 and 156 was analyzed using the GS
Amplicon Variant Analyzer (AVA) software version 2.0.01 from
Roche. The AVA software performs quality control, trims primer
derived sequences, maps the reads against a reference sequence
and calculates the frequency of variants at designated positions. As
reference sequence, the consensus NS3 protease sequence derived
Persistence of Hepatitis C Resistant Variants
PLoS ONE | www.plosone.org 2 July 2012 | Volume 7 | Issue 7 | e41191
from the 15 included patients (separate for genotype 1a and 1b)
was used.
Sensitivity of UDPSUsing basic calculation of probabilities, the chance of detecting
at least one specific minor variant (P[m]) with 95% certainty is:
P[m] = 1-0.05 (1/N), where N is the number of individual reads.
Thus, in theory, when analyzing 1000 reads, a minor variant
present at 1-0.051/1000 = 0.3% can be detected with 95% certainty.
Analysis of Genetic VariabilityTo identify changes in quasispecies diversity, genetic variability
was determined at both time points using average pairwise
distances (APD) and average Shannon entropy (ASE) values.
Genetic diversity of viral populations at both time points was
determined by calculating the APD for each time point using a p-
distance model [20] as implemented in MEGA 5.05 software [21].
The APD between baseline and follow-up were compared for both
amplicons and separately for each genotype with a paired T-Test.
The APD between genotypes were compared with the indepen-
dent sample T-test.
The Shannon entropy was calculated with a script implemented
in the software package ANDES [22]. The average Shannon
entropy (ASE) per amplicon between time points and genotypes
were also statistically compared using the same methods described
for APD. In addition, Shannon entropy per positions of NS3-I and
NS3-II were calculated for both time points.
Statistical AnalysisResistant variants were tabulated at each time point and
compared statistically between time points at each position,
evaluating the null hypothesis of equivalence between time points
(baseline and follow-up) in the proportion of resistant variants.
This was approached in 2 ways: (i) in an evaluation of the
hypothesis of equivalence across all patients, and (ii) in an
evaluation of the hypothesis of equivalence between time points
independently for each patient and at each position.
(i) To test for the equivalence of the proportion of resistant
variants between time points across patients, the arcsine-square root
transformed percentage of resistant variants present at each time
point was compared using least squares estimation with variation
between subjects controlled by considering the ‘patient’ to be a
random variable and considering ‘time point’ a fixed variable in a
mixed model (JMP, v8.0.1). In this way, the effect of the fixed
variable of time was tested while controlling for patient-level
variation. The hypothesis of equivalence between time points in
the proportion of resistant variants was evaluated independently
for each position.
(ii) The count of resistant (V36A/M, T54A/S, R155K/T/M/I,
and A156S/T/V) and ‘non-resistant’ variants was tabulated at
each position independently for each patient. The null hypothesis
of equivalence was evaluated independently at each position (4
positions; NS3-36, 54, 155, and 156) and for each patient (n = 20)
using a two-sided Fisher’s Exact test (R, v.2.8.1), for a total of 80
tests of hypothesis (4620 = 80). Type I error was controlled using a
Bonferonni correction.
Phylogenetic AnalysisFor one patient (patient 15) NS3 clonal analysis of the EOT [17]
and follow-up time point was performed. For clonal sequencing of
the follow-up time point, viral RNA was extracted from plasma
using the QIAamp BioRobot 9604 (Qiagen, Valencia, CA; Kit
965662). A cDNA fragment was synthesized from viral RNA and
amplified by nested PCR. Agarose gel purified amplicons
containing the entire NS3 protease coding region were cloned
using the TOPOH XL PCR Cloning Kit (Invitrogen Corp).
Cloning plates were sent to Beckman-Coulter (AgencourtHBiosciences; Danvers, MA), where 96 clones were amplified and
sequenced.
For this patient the evolutionary history of resistant variants
detected at follow-up was reconstructed through time using the
Bayesian inference framework implemented in the program
BEAST 1.6.1 [23–25]. Given an alignment of sequences sampled
at different points in time, the rate of viral evolution and the
phylogenetic history of infection were estimated on the observed
time scale [26,27]. Sequences were analysed using the Hasegawa,
Kishino & Yano substitution model with gamma distribution
under a relaxed molecular clock. A constant-size coalescent model
was applied. Using this model structure, the dates of the most
common recent ancestor (tMRCA) of the resistant variants present
at follow-up were estimated using Bayesian Bayesian Markov
Chain Monte Carlos (MCMC) sampling. The MCMC algorithm
was run for 5*107 states sampling every 5*103 states. Seven
independent runs were combined using Logcombiner v1.6.1.
Chain convergence and posterior distributions were investigated
using Tracer v1.5.
Results
UDPS ResultsAmplification of fragments NS3-I and NS3-II succeeded in 13
out of 15 patients at both baseline and follow-up. For the 2
Figure 1. 101 and 103 Study design. All 15 patients received TVR monotherapy for 14 days. Off-study treatment with PEG-IFN and RBV wasoffered to all study participants after day 14. Only 2 patients received the off-study standard of care.doi:10.1371/journal.pone.0041191.g001
Persistence of Hepatitis C Resistant Variants
PLoS ONE | www.plosone.org 3 July 2012 | Volume 7 | Issue 7 | e41191

Ta
ble
1.
Bas
elin
ech
arac
teri
stic
so
fp
atie
nts
and
pre
vio
usl
yp
ub
lish
ed
resi
stan
cem
uta
tio
ns
fou
nd
atEO
T.
Pa
tie
nt
ID(a
ge
iny
ea
rs,
sex
)T
VR
do
se(m
gti
d)
EO
Tre
sist
an
cem
uta
tio
nsa
Pre
vio
us
Tre
atm
en
tO
utc
om
eG
TB
ase
lin
eH
CV
RN
A(I
U/m
L)
Fo
llo
w-u
pH
CV
RN
A(I
U/m
L)
Ye
ars
be
twe
en
ba
seli
ne
an
dfo
llo
w-u
p
1(5
3,
M)
45
0V
36
M+R
15
5K
(75
%)
NR
1a
1.0
E+0
61
.3E+0
62
.0
2(4
3,
M)
45
0V
36
M(2
0%
),V3
6A
(13
%),
R1
55
K(1
6%
),R
15
5T
(16
%),R
15
5I(
11
%),
A1
56
T(1
1%
)N
R1
a1
.2E+0
63
.2E+0
54
.8
3(4
7,
M)
45
0V
36
M(2
2%
),V
36
A(1
3%
),R
15
5K
(10
%),
R1
55
T(1
8%
)N
1a
8.2
E+0
66
.7E+0
54
.7
4(5
2,
M)
45
0N
on
e$
10
%N
R1
b2
.6E+0
73
.8E+0
63
.4
5(4
9,
M)
45
0T
54
A(2
2%
),A
15
6V
(35
%)
NR
1b
9.4
E+0
62
.2E+0
54
.7
6(3
3,
M)
45
0V
36
A(4
7%
),T5
4A
(22
%),
A1
56
S(2
1%
)N
R1
b1
.3E+
06
1.5
E+0
54
.7
7b
(48
,F)
75
0T
54
A(2
6%
)N
R1
b5
.6E+
06
3.2
E+0
64
.6
8(5
0,
M)
75
0V
36
M(2
5%
),V3
6A
(16
%),
R1
55
K(2
6%
),R
15
5T
(13
%),
R1
55
I(1
6%
)N
R1
a9
.2E+
05
1.2
E+0
64
.5
9(6
2,
M)
12
50
V3
6A
(35
%),T
54
A(2
7%
),A
15
6T
(12
%)
R1
b2
.2E+
06
1.9
E+0
61
.9
10
(37
,M
)1
25
0V
36
M(1
3%
)R
1a
3.1
E+0
53
.2E+0
54
.5
11
(46
,M
)1
25
0V
36
M(2
9%
),V
36
M+R
15
5K
(49
%)
N1
a6
.8E+0
61
.8E+0
50
.8
12
(44
,M
)1
25
0T
54
A(6
7%
),A
15
6V
(30
%)
NR
1b
2.9
E+0
62
.3E+0
63
.8
13
(52
,F)
75
0R
15
5K
(22
%),
V3
6M
+R1
55
K(6
3%
),V
36
M+A
15
6T
(12
%)
N1
a1
.1E+0
76
.1E+0
53
.9
14
(51
,M
)7
50
A1
56
V/T
(10
0%
)N
1b
4.2
E+0
64
.9E+0
53
.8
15
(61
,M
)7
50
R1
55
K(1
9%
),V
36
M+R
15
5K
(57
%)
N1
a3
.9E+0
74
.8E+0
63
.8
aR
esi
stan
cem
uta
tio
ns
fou
nd
at$
10
%o
fcl
on
alp
op
ula
tio
nat
EOT
[15
].V
iral
vari
ants
we
recl
on
ed
atEO
Tan
dth
ep
rop
ort
ion
of
resi
stan
tva
rian
tsw
asca
lcu
late
db
ase
do
nth
eto
tal
nu
mb
er
of
clo
ne
sse
qu
en
ced
.bEn
do
ftr
eat
me
nt
seq
ue
nce
dat
aw
ere
no
tav
aila
ble
for
pat
ien
t7
,sh
ort
-te
rmfo
llow
-up
(7to
10
day
sp
ost
do
sin
g)
dat
aar
ep
rovi
de
dh
ere
.G
T,g
en
oty
pe
;F,
fem
ale
;M
,m
ale
,N
R,n
on
-re
spo
nd
er;
N,n
aı̈ve
;R
,re
lap
se.
do
i:10
.13
71
/jo
urn
al.p
on
e.0
04
11
91
.t0
01
Persistence of Hepatitis C Resistant Variants
PLoS ONE | www.plosone.org 4 July 2012 | Volume 7 | Issue 7 | e41191

remaining patients (patient 9 and patient 10) amplification of
fragment NS3-I failed at both baseline and follow-up. UDPS of
fragment NS3-I succeeded in 12 out of 13 amplicons at both
baseline and follow-up and in 14 out of 15 amplicons for fragment
NS3-II. UDPS of one patient (patient 6) failed in both fragments at
both baseline and follow-up.
UDPS of fragment NS3-I, spanning positions V36 and T54,
resulted in a median of 14840 sequence reads (range 8687–20588)
and 13717 sequence reads (range 8687–19968), per position in
baseline samples. UDPS of fragment NS3-II, spanning positions
R155 and A156, resulted in a median of 4017 (range 545–7363)
and 3994 (range 545–7361) sequence reads, respectively, per
position as shown in Tables 3 and 4.
In follow-up samples, UDPS of fragment NS3-I, resulted in a
median of 9628 (range 3927–88567) and 10009 (range 3869–
86402) sequence reads at positions V36 and T54 respectively. A
median of 4930 reads (range 1253–20478) and 6074 reads (range
1253-20466) for positions R155 and A156 respectively were
analyzed for fragment NS3-II.
Frequency of Resistant VariantsResistant variants, if present at either the baseline or follow-up
time points, constituted a small fraction of the viral population
(Figure 2, Table 3 and Table 4). Resistant variants were detected at
baseline in 5 out of 12 patients. In 4 of these 5 patients, the baseline
resistant variants were present at 0.04% of the population or less. In
the remaining patient (patient 12) the baseline variant T54A was
present at 0.54%. Together, resistant variants were detected at
,0.5% or less of the viral population in 12 out of 14 patients.
As described before, at the end of the 14-day TVR-dosing period,
all patients had TVR-selected variants as summarized in Table 1.
After cessation of TVR-dosing, the proportion of the viral population
comprising these TVR-selected variants decreased with a commen-
surate increase in the frequency of WT virus as published before
[15,17]. At the long-term follow-up assessment, the distribution of
resistant variants was comparable to the baseline state. With the
exception of 2 patients (patient 12 and 15; discussed below), resistant
variants were detected at follow-up in 4 out of 11 patients with data
from both amplicons, with a prevalence of 0.05% or less.
In one patient (patient 15) the combination of V36+T54S was
observed in one variant. In all other patients no combination of
resistance mutations was observed.
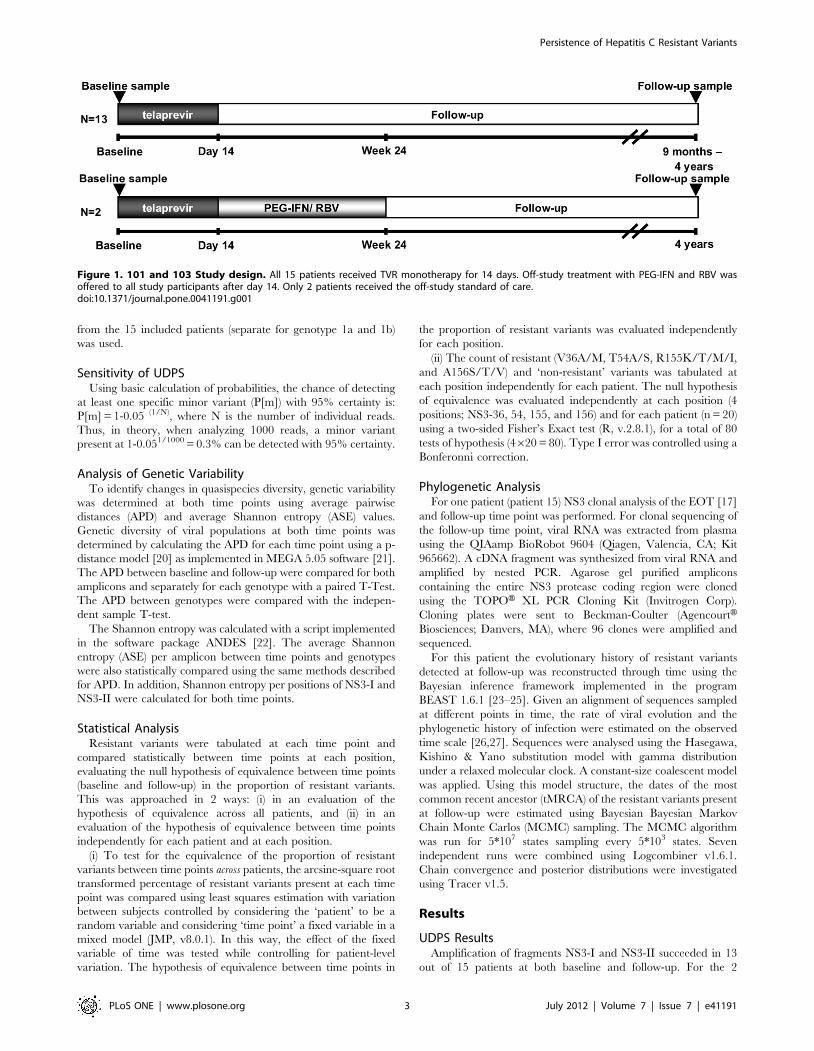
Genetic Diversity at Baseline and Follow-upBoth APD and ASE values were used to study changes in viral
diversity between follow-up and baseline. No significant difference
in the APD and ASE values were observed between the two time
points as seen in Figure 3A and 3B. Subanalysis per genotype also
did not indicate a differential diversity of the virus population
between genotype 1a and 1b (data not shown).
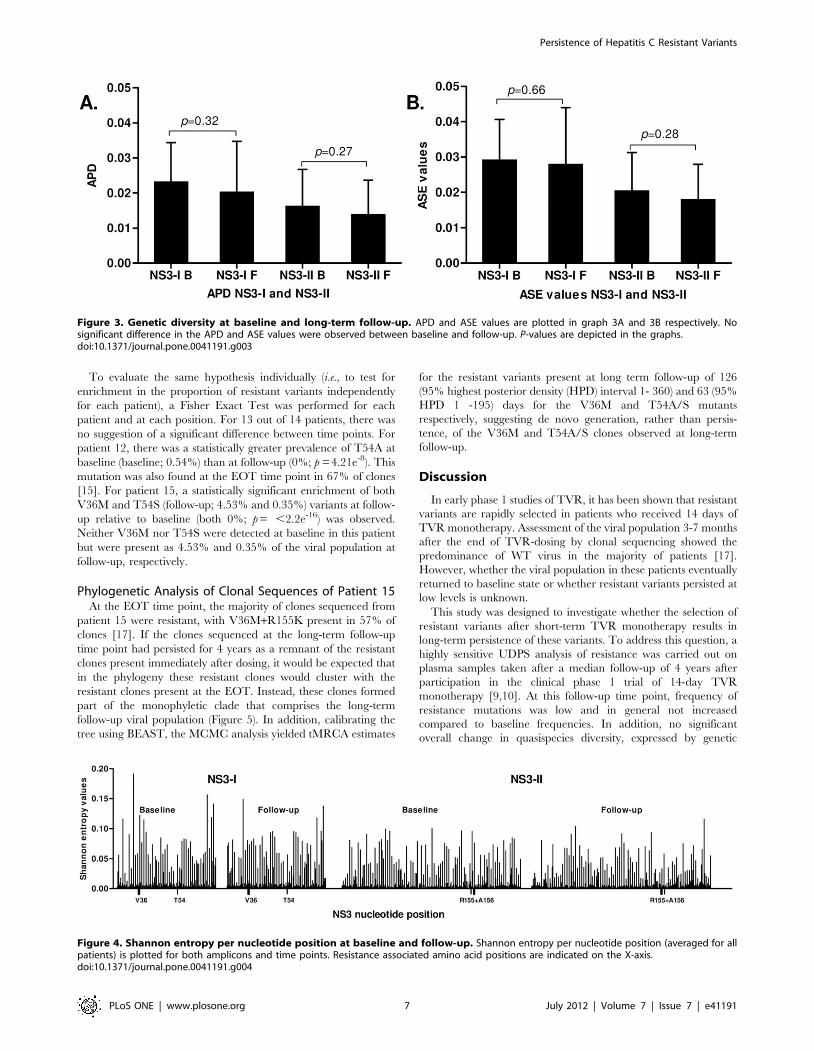
In Figure 4 the Shannon entropy per position is plotted for both
amplicons and time points averaged for all patients. No statistical
Table 2. HCV NS3-specific UDPS-primers.
Genomic region and primer Sequence Position*Amplicon coverage(bp)
Amplicon NS3-I: V36/T54
VX1-Sense 59- 454A-MID- AGCYTIACYGGCCGRGA - 39 3477–3493 181
VX1-Antisense 59- 454B-MID- TGGTCYACATTGGTRTACATYTG - 39 3636–3658
Amplicon NS3-II: R155/A156
VX2-Sense 59- 454A-MID- CAYGCYGATGTCATYCC -39 3747–3763 298
VX2-Antisense 59- 454B-MID- CCRCTICCIGTRGGRGC - 39 4029–4045
*Relative to H77 (GenBank accession number AF00960).doi:10.1371/journal.pone.0041191.t002
Table 3. HCV-1a NS3 UDPS mutation analysis.
HCV-1a Amplicon NS3-I HCV-1a Amplicon NS3-II
V36 T54 R155 A156
ID Baseline Follow-up Baseline Follow-up Baseline Follow-up Baseline Follow-up
1 0 (13817) 0.05 M (10541) 0 (13113) 0 (9386) 0 (2977) 0 (4854) 0 (2977) 0 (4853)
2 0.28 L; 0.04 A (12481) 0 (5383) 0 (12305) S 0.04 (5327) 0 (545) 0 (2780) 0 (545) 0 (2757)
3 0.03 A (18294) 0 (15074) 0 (17191) A 0.02 (13650) 0 (3534) 0 (2249) 0 (3532) 0 (2248)
8 0.08 L (16263) 0 (4791) 0 (14215) 0 (4517) 0 (5453) 0 (8700) 0 (4456) 0 (8696)
10 NA NA NA NA 0 (5379) 0.55 G (8154) 0 (5379) 0 (8146)
11 0 (8687) 0 (6448) 0 (8687) I 0.01 (10631) 0.14 S (2873) 0 (2986) 0 (2873 0 (8116)
13 0 (20588) 0 (17458) 0 (19968) 0 (17201) 0 (5398) 0 (7147) 0 (5396) 0 (7144)
15 0 (18993) 4.53 M (12836) 0 (18320) S 0.35 (11769) 0 (5291) 0 (9032) 0 (5722) 0.01 T (9032)
Percentage of UDPS reads with mutations. The parenthetical values indicate the number of reads analyzed. The bold numbers indicate variation present at a frequencyabove 0.1%. Underlined amino acids indicate resistant variants that were also observed by clonal sequencing at EOT.doi:10.1371/journal.pone.0041191.t003
Persistence of Hepatitis C Resistant Variants
PLoS ONE | www.plosone.org 5 July 2012 | Volume 7 | Issue 7 | e41191

significant difference was observed comparing baseline Shannon
entropies to follow up.
Test for Resistant Variant Enrichment: Baseline vs. Follow-up
The null-hypothesis of equivalent proportions of resistant
variants between baseline and follow-up was evaluated indepen-
dently at NS3 amino acid positions 36, 54, 155, and 156. Results
suggested that, across patients, there was no difference in the
frequency of resistant variants at baseline and follow-up. P-values
were 0.53, 0.80, and 0.74 for NS3-36, 54, and 156. A comparison
between time points in the case of NS3-155 variants was not
possible, as no resistant variants were observed at this position at
either time point (indicating equivalence between the time points).
Table 4. HCV-1b NS3 UDPS mutation analysis.
HCV-1b Amplicon NS3-I HCV-1b Amplicon NS3-II
V36 T54 R155 A156
ID Baseline Follow-up Baseline Follow-up Baseline Follow-up Baseline Follow-up
4 0.02 A (16899) 0 (7312) 0 (16564) 0 (7224) 0.02 S (4500) 0 (2459) 0.02 G (4523) 0.04 D;0.04 V
(2459)
5 0.39 I (15804) 0 (13911) 0.02 I (15191) 0 (13333) 0 (7363) 0 (5005) 0.04 T (7361) 0 (5004)
7 0 (10184) 0 (88567) 0 (10068) A 0.02 (86402) 0 (3030) 0.03 W (7924) 0 (3029) 0.05 D (7916)
9 NA NA NA NA 0 (988) 0 (3046) 0 (988) 0 (3045)
12 0 (10433) 0.03 G (3927) 0.54 A (10257) 0 (3869) 0.72 P (2340) 0 (1253) 0.68 G (2340) 0 (1253)
14 0 (13875) 0 (8714) 0 (13218) 0 (8129) 0.03 W (7180) 0 (20478) 0 (7180) 0 (20466)
Percentage of UDPS reads with mutations. The parenthetical values indicate the number of reads analyzed. The bold numbers indicate variation present at a frequencyabove 0.1%. Underlined amino acids indicate resistant variants that were also observed by clonal sequencing at EOT. UDPS of both fragments (NS3-I, NS3-II) failed forpatient 6 at both baseline and follow-up.doi:10.1371/journal.pone.0041191.t004
Figure 2. Prevalence of TVR resistance mutations at baseline and long-term follow-up. The percentage of resistant variants in the viralpopulation at baseline (B) and at long-term follow-up time point (F) is depicted for each patient. For display purposes, only the segment from 95–100% is displayed; the portion of the viral population from 0–95% for all patients is WT. For comparison, viral population composition at the EOT timepoint is provided in Table 1. Note that amplification of amplicon NS3-I for UDPS failed for patients 9 and 10 (B, F). Furthermore UDPS of bothfragments (NS3-I, NS3-II) failed for patient 6 (B, F).doi:10.1371/journal.pone.0041191.g002
Persistence of Hepatitis C Resistant Variants
PLoS ONE | www.plosone.org 6 July 2012 | Volume 7 | Issue 7 | e41191
To evaluate the same hypothesis individually (i.e., to test for
enrichment in the proportion of resistant variants independently
for each patient), a Fisher Exact Test was performed for each
patient and at each position. For 13 out of 14 patients, there was
no suggestion of a significant difference between time points. For
patient 12, there was a statistically greater prevalence of T54A at
baseline (baseline; 0.54%) than at follow-up (0%; p = 4.21e-8). This
mutation was also found at the EOT time point in 67% of clones
[15]. For patient 15, a statistically significant enrichment of both
V36M and T54S (follow-up; 4.53% and 0.35%) variants at follow-
up relative to baseline (both 0%; p = ,2.2e-16) was observed.
Neither V36M nor T54S were detected at baseline in this patient
but were present as 4.53% and 0.35% of the viral population at
follow-up, respectively.
Phylogenetic Analysis of Clonal Sequences of Patient 15At the EOT time point, the majority of clones sequenced from
patient 15 were resistant, with V36M+R155K present in 57% of
clones [17]. If the clones sequenced at the long-term follow-up
time point had persisted for 4 years as a remnant of the resistant
clones present immediately after dosing, it would be expected that
in the phylogeny these resistant clones would cluster with the
resistant clones present at the EOT. Instead, these clones formed
part of the monophyletic clade that comprises the long-term
follow-up viral population (Figure 5). In addition, calibrating the
tree using BEAST, the MCMC analysis yielded tMRCA estimates
for the resistant variants present at long term follow-up of 126
(95% highest posterior density (HPD) interval 1- 360) and 63 (95%
HPD 1 -195) days for the V36M and T54A/S mutants
respectively, suggesting de novo generation, rather than persis-
tence, of the V36M and T54A/S clones observed at long-term
follow-up.
Discussion
In early phase 1 studies of TVR, it has been shown that resistant
variants are rapidly selected in patients who received 14 days of
TVR monotherapy. Assessment of the viral population 3-7 months
after the end of TVR-dosing by clonal sequencing showed the
predominance of WT virus in the majority of patients [17].
However, whether the viral population in these patients eventually
returned to baseline state or whether resistant variants persisted at
low levels is unknown.
This study was designed to investigate whether the selection of
resistant variants after short-term TVR monotherapy results in
long-term persistence of these variants. To address this question, a
highly sensitive UDPS analysis of resistance was carried out on
plasma samples taken after a median follow-up of 4 years after
participation in the clinical phase 1 trial of 14-day TVR
monotherapy [9,10]. At this follow-up time point, frequency of
resistance mutations was low and in general not increased
compared to baseline frequencies. In addition, no significant
overall change in quasispecies diversity, expressed by genetic
Figure 3. Genetic diversity at baseline and long-term follow-up. APD and ASE values are plotted in graph 3A and 3B respectively. Nosignificant difference in the APD and ASE values were observed between baseline and follow-up. P-values are depicted in the graphs.doi:10.1371/journal.pone.0041191.g003
Figure 4. Shannon entropy per nucleotide position at baseline and follow-up. Shannon entropy per nucleotide position (averaged for allpatients) is plotted for both amplicons and time points. Resistance associated amino acid positions are indicated on the X-axis.doi:10.1371/journal.pone.0041191.g004
Persistence of Hepatitis C Resistant Variants
PLoS ONE | www.plosone.org 7 July 2012 | Volume 7 | Issue 7 | e41191

distance or Shannon entropy, was present comparing the follow-
up time point to baseline.
To our knowledge, this is the first study that investigated the
frequency of protease inhibitor-resistant variants at baseline and
after treatment using UDPS. Using UDPS, clonal and population
sequencing, the sporadic presence of naturally occurring resistance
mutations at low frequencies have been reported by others [17,28–
30]. In the present study, mutations associated with resistance
were detected in baseline samples of naı̈ve patients in 6 out of 12
patients, with frequencies of less than 0.1% in 4 of these 6 patients.
Of note, the observed baseline resistant variants were not
predictive of the presence of resistance at the end of the 14 days
dosing period as in all but one patient resistant variants were
detected at a level exceeding 10% post-dosing. Furthermore, the
low level presence of resistance mutations at baseline did not
necessarily result in selection of that variant during treatment as
shown by the baseline A156T mutation in patient 5. Interestingly,
mutations R155K or R155T, which are key mutations for
resistance to both linear and macrocyclic protease inhibitors in
genotype 1a, were not detected in any of the baseline or follow-up
samples. At the follow-up time point, frequency of resistant
variants was in general not increased.
Only patient 15 had a small but statistically significant increase
in the low-level resistant variants, V36M and T54S. Interestingly,
the T54S mutant, that was considered enriched in patient 15
relative to baseline, was not observed by clonal sequencing of 88
clones at EOT [15]. In addition, the phylogenetic analysis of
clonal sequences of this patient suggests that the most recent
common ancestors of the two clusters with resistant variants
present at the follow-up time point are estimated to have an origin
of 126 and 63 days before the long-term follow-up time point for
the V36M and the T54S respectively. This suggests that in this
patient the variants with the T54S and V36M mutations
sequenced at follow-up are naturally occurring variants that arose
after treatment.
Using conventional population or clonal sequencing others
have reported a gradual decline to WT virus population after
treatment discontinuation of either short term monotherapy or
Figure 5. Molecular clock phylogeny from patient 15. The tree represents the maximum clade credibility tree from the Bayesian MCMCanalysis. The bullets at the nodes indicate the tMRCA estimates for the V36M (N= 126 days, 95% HPD 1 - 360) and T54A/S (#= 63 days, 95% HPD 1 -195) resistant variants. The V36M, T54A and T54S mutations are indicated in green, blue and pink respectively. The vertical grey shaded bar indicatesthe TVR-treatment period. Time scale in years relative to the EOT period is indicated on the X-axis.doi:10.1371/journal.pone.0041191.g005
Persistence of Hepatitis C Resistant Variants
PLoS ONE | www.plosone.org 8 July 2012 | Volume 7 | Issue 7 | e41191

combination treatment with interferon for longer treatment
periods [17,31]. In other viral infections treated with DAAs, such
as human immunodeficiency virus or hepatitis B virus infections,
mechanisms to improve the fitness of resistant variants, such as
selection of compensatory mutations, enable the resistant variants
to persist. The short dosing period of 14 days was perhaps
insufficient for the development of adaptive mutations that may
restore fitness to WT levels. It is possible that with longer
treatment durations, the fitness of resistant variants could be
compensated by additional mutations that enhance the replica-
tion efficiency [17]. However, the evolution of resistant variants
may be limited by the implementation of stopping rules that
instruct to discontinue use of TVR in patients who are likely to
have virologic failure. Furthermore, the currently approved TVR
combination regimen includes PEG-IFN and RBV, which
synergistically suppress virus replication thereby reducing the
likelihood of occurrence and persistence of mutations.
There are some limitations to this study. First, there is a
theoretical possibility of oversampling but as viral loads of all
samples exceeded 105 IU/ml (or 5*105 copies/ml), viral RNA
input was at least 104 virus copies per test, demonstrating that
redundancy or oversampling was not a problem in the UDPS test
set up. Second, while at EOT resistant variants were detected in all
patients [15], at follow-up the results from three patients (patient 6,
9 and 10) were missing due to unsuccessful amplification or UDPS.
However it is unlikely that this has affected the conclusion of our
study, as these sequence failures were random. Third, the intrinsic
error rate of the UDPS technique may have caused some of the
variability that was observed. A cut off of 0.1% or even 0.5% is
often used for reliable detection of mutants based on plasmid
controls [32]. If we would have implemented such a cut off in this
study, observed variation at resistant sites would have been even
less than the limited variation already present, as most of the
observed variation at resistance associated sites was present at a
level of less than 0.5%. In stead, sequencing errors in our system
set up seem to occur at a much lower level than 0.5%. This can be
inferred from the fact that observed variation at the resistance
associated sites was very limited with 100% WT amino acid
residues and nucleotide conservation in most samples, as shown in
Tables 3 and 4. The little variation that was observed resulted in
amino acid changes that have been described as polymorphisms of
resistance associated mutations, indicating that these mutations do
not result in non-viable virus and could well be true variation.
Results from a previous study by Susser et al. [31] who used
clonal sequencing indicate that at long-term follow-up after initial
TVR-monotherapy the majority of the viral population consisted
of wild-type variants. Our study confirms and extends the results
from this study as we demonstrate that in most patients,
frequencies of resistant NS3 variants after 4 years of a 14 day
monotherapy course measured by an extremely sensitive sequence
analysis technique are comparable to baseline. Since HCV is not
known to be archived, patients could potentially be retreated in the
future with more expanded combination therapy regimens that
still contain TVR or other protease inhibitors from the same class.
Indeed, in a recent study, such quadruple combination regimens,
consisting of PEG-IFN, RBV, a protease- and a polymerase
inhibitor was very powerful [33]. However, re-treatment clinical
trials are necessary to fully understand the implications of
resistance.
Author Contributions
Conceived and designed the experiments: XVT JdB J. Schinkel RM HR.
Performed the experiments: XVT SPR. Analyzed the data: XVT RM J.
Schinkel CKYH TK J. Sullivan. Contributed reagents/materials/analysis
tools: MdV RM TK J. Sullivan. Wrote the paper: XVT JdB J. Schinkel.
Helped with study set-up: CJW.
References
1. World Health Organization (2011) Hepatitis C. Fact sheet No. 164. Revised
June 2011. Available: http://www.who.int/mediacentre/factsheets/fs164/en/
index.html. Accessed 2012 Jan 23.
2. Terrault NA, Berenguer M (2006) Treating hepatitis C infection in liver
transplant recipients. Liver Transpl 12: 1192–1204. 10.1002/lt.20865 [doi].
3. Foy E, Li K, Wang C, Sumpter R Jr, Ikeda M, et al. (2003) Regulation of
interferon regulatory factor-3 by the hepatitis C virus serine protease. Science
300: 1145–1148. 10.1126/science.1082604 [doi];1082604 [pii].
4. Foster GR (2004) Past, present, and future hepatitis C treatments. Semin Liver
Dis 24 (Suppl.2): 97–104. 10.1055/s-2004–832934 [doi].
5. McHutchison JG, Bartenschlager R, Patel K, Pawlotsky JM (2006) The face of
future hepatitis C antiviral drug development: recent biological and virologic
advances and their translation to drug development and clinical practice. J
Hepatol 44: 411–421. S0168–8278(05)00777-4 [pii];10.1016/j.jhep.2005.12.001
[doi].
6. Pawlotsky JM, McHutchison JG (2004) Hepatitis C. Development of new drugs
and clinical trials: promises and pitfalls. Summary of an AASLD hepatitis single
topic conference, Chicago, IL, February 27-March 1, 2003. Hepatology 39:
554–567. 10.1002/hep.20065 [doi].
7. Bacon BR, Gordon SC, Lawitz E, Marcellin P, Vierling JM, et al. (2011)
Boceprevir for previously treated chronic HCV genotype 1 infection. N Engl J
Med 364: 1207–1217. 10.1056/NEJMoa1009482 [doi].
8. Poordad F, McCone J Jr, Bacon BR, Bruno S, Manns MP, et al. (2011)
Boceprevir for untreated chronic HCV genotype 1 infection. N Engl J Med 364:
1195–1206. 10.1056/NEJMoa1010494 [doi].
9. Forestier N, Reesink HW, Weegink CJ, McNair L, Kieffer TL, et al. (2007)
Antiviral activity of telaprevir (VX-950) and peginterferon alfa-2a in patients
with hepatitis C. Hepatology 46: 640–648. 10.1002/hep.21774 [doi].
10. Reesink HW, Zeuzem S, Weegink CJ, Forestier N, van VA, et al. (2006) Rapid
decline of viral RNA in hepatitis C patients treated with VX-950: a phase Ib,
placebo-controlled, randomized study. Gastroenterology 131: 997-1002. S0016-
5085(06)01539-3 [pii];10.1053/j.gastro.2006.07.013 [doi].
11. Jacobson IM, McHutchison JG, Dusheiko G, Di Bisceglie AM, Reddy KR, et al.
(2011) Telaprevir for previously untreated chronic hepatitis C virus infection. N
Engl J Med 364: 2405–2416. 10.1056/NEJMoa1012912 [doi].
12. Zeuzem S, Andreone P, Pol S, Lawitz E, Diago M, et al. (2011) Telaprevir for
retreatment of HCV infection. N Engl J Med 364: 2417–2428. 10.1056/
NEJMoa1013086 [doi].
13. Bartenschlager R, Lohmann V (2000) Replication of hepatitis C virus. J Gen
Virol 81: 1631–1648.
14. Lin C, Lin K, Luong YP, Rao BG, Wei YY, et al. (2004) In vitro resistance
studies of hepatitis C virus serine protease inhibitors, VX-950 and BILN 2061:
structural analysis indicates different resistance mechanisms. J Biol Chem 279:
17508–17514. 10.1074/jbc.M313020200 [doi];M313020200 [pii].
15. Kieffer TL, Sarrazin C, Miller JS, Welker MW, Forestier N, et al. (2007)
Telaprevir and pegylated interferon-alpha-2a inhibit wild-type and resistant
genotype 1 hepatitis C virus replication in patients. Hepatology 46: 631–639.
10.1002/hep.21781 [doi].
16. Sarrazin C, Zeuzem S (2010) Resistance to direct antiviral agents in patients
with hepatitis C virus infection. Gastroenterology 138: 447–462. S0016-
5085(09)02113-1 [pii];10.1053/j.gastro.2009.11.055 [doi].
17. Sarrazin C, Kieffer TL, Bartels D, Hanzelka B, Muh U, et al. (2007) Dynamic
hepatitis C virus genotypic and phenotypic changes in patients treated with the
protease inhibitor telaprevir. Gastroenterology 132: 1767–1777. S0016-
5085(07)00394-0 [pii];10.1053/j.gastro.2007.02.037 [doi].
18. Murphy DG, Willems B, Deschenes M, Hilzenrat N, Mousseau R, et al. (2007)
Use of sequence analysis of the NS5B region for routine genotyping of hepatitis
C virus with reference to C/E1 and 5’ untranslated region sequences. J Clin
Microbiol 45: 1102-1112. JCM.02366-06 [pii];10.1128/JCM.02366-06 [doi].
19. Boom R, Sol CJ, Salimans MM, Jansen CL, Wertheim-van Dillen PM, et al.
(1990) Rapid and simple method for purification of nucleic acids. J Clin
Microbiol 28: 495–503.
20. Nei M, Kumar S (2000) Molecular Evolution and Phylogenetics.New York:
Oxford University Press.
21. Tamura K, Peterson D, Peterson N, Stecher G, Nei M, et al. (2011) MEGA5:
molecular evolutionary genetics analysis using maximum likelihood, evolution-
ary distance, and maximum parsimony methods. Mol Biol Evol 28: 2731-2739.
msr121 [pii];10.1093/molbev/msr121 [doi].
22. Li K, Venter E, Yooseph S, Stockwell TB, Eckerle LD, et al. (2010) ANDES:
Statistical tools for the ANalyses of DEep Sequencing. BMC Res Notes 3: 199.
1756-0500-3-199 [pii];10.1186/1756-0500-3-199 [doi].
Persistence of Hepatitis C Resistant Variants
PLoS ONE | www.plosone.org 9 July 2012 | Volume 7 | Issue 7 | e41191

23. Drummond AJ, Rambaut A, Shapiro B, Pybus OG (2005) Bayesian coalescent
inference of past population dynamics from molecular sequences. Mol Biol Evol
22: 1185–1192. msi103 [pii];10.1093/molbev/msi103 [doi].
24. Drummond AJ, Ho SY, Phillips MJ, Rambaut A (2006) Relaxed phylogenetics
and dating with confidence. PLoS Biol 4: e88. 05-PLBI-RA-0392R4
[pii];10.1371/journal.pbio.0040088 [doi].
25. Drummond AJ, Rambaut A (2007) BEAST: Bayesian evolutionary analysis by
sampling trees. BMC Evol Biol 7: 214. 1471–2148–7-214 [pii];10.1186/1471-
2148-7-214 [doi].
26. Strimmer K, Pybus OG (2001) Exploring the demographic history of DNA
sequences using the generalized skyline plot. Mol Biol Evol 18: 2298–2305.
27. Pybus OG, Rambaut A, Harvey PH (2000) An integrated framework for the
inference of viral population history from reconstructed genealogies. Genetics
155: 1429–1437.
28. Bartels DJ, Zhou Y, Zhang EZ, Marcial M, Byrn RA, et al. (2008) Natural
prevalence of hepatitis C virus variants with decreased sensitivity to NS3.4A
protease inhibitors in treatment-naive subjects. J Infect Dis 198: 800–807.
10.1086/591141 [doi].
29. Kuntzen T, Timm J, Berical A, Lennon N, Berlin AM, et al. (2008) Naturally
occurring dominant resistance mutations to hepatitis C virus protease andpolymerase inhibitors in treatment-naive patients. Hepatology 48: 1769–1778.
10.1002/hep.22549 [doi].
30. Nasu A, Marusawa H, Ueda Y, Nishijima N, Takahashi K, et al. (2011) Geneticheterogeneity of hepatitis C virus in association with antiviral therapy
determined by ultra-deep sequencing. PLoS One 6: e24907. 10.1371/journal.-pone.0024907 [doi];PONE-D-11–11004 [pii].
31. Susser S, Vermehren J, Forestier N, Welker MW, Grigorian N, et al. (2011)
Analysis of long-term persistence of resistance mutations within the hepatitis Cvirus NS3 protease after treatment with telaprevir or boceprevir. J Clin Virol.
S1386–6532(11)00342-8 [pii];10.1016/j.jcv.2011.08.015 [doi].32. Tsibris AM, Korber B, Arnaout R, Russ C, Lo CC, et al. (2009) Quantitative
deep sequencing reveals dynamic HIV-1 escape and large population shiftsduring CCR5 antagonist therapy in vivo. PLoS One 4: e5683. 10.1371/
journal.pone.0005683 [doi].
33. Lok AS, Gardiner DF, Lawitz E, Martorell C, Everson GT, et al. (2012)Preliminary study of two antiviral agents for hepatitis C genotype 1. N Engl J
Med 366: 216–224. 10.1056/NEJMoa1104430 [doi].
Persistence of Hepatitis C Resistant Variants
PLoS ONE | www.plosone.org 10 July 2012 | Volume 7 | Issue 7 | e41191