Evaluation of laboratory-based measures of soil mineral nitrogen and potentially mineralizable...
12
REGULAR ARTICLE Evaluation of laboratory-based measures of soil mineral nitrogen and potentially mineralizable nitrogen as predictors of field-based indices of soil nitrogen supply in potato production Mehdi Sharifi & Bernie J. Zebarth & David L. Burton & Cynthia A. Grant & Gregory A. Porter & Julia M. Cooper & Yves Leclerc & Gilles Moreau & Walter J. Arsenault Received: 4 July 2007 / Accepted: 23 September 2007 / Published online: 6 October 2007 # Springer Science + Business Media B.V. 2007 Abstract Accurate estimation of soil nitrogen (N) supply in the field is required to optimize fertilizer N management and to minimize environmental N losses in humid environments. Laboratory-based measures of N availability were evaluated as predictors of field-based indices of soil N supply within potato production systems. Pre-plant soil samples (0–15 cm) were collect- ed from a series of forty treatments in established potato trials located in Atlantic Canada and Maine, USA. Total plant N uptake at topkill with no fertilizer N applied (PNU 0N ), PNU 0N plus soil mineral N to 30 cm depth at harvest and relative yield were considered as field- based indices of soil N supply. The potentially mineralizable N (N 0 ) was determined by aerobic Plant Soil (2007) 301:203–214 DOI 10.1007/s11104-007-9438-7 DO09438; No of Pages Responsible Editor: Elizabeth (Liz) A. Stockdale. M. Sharifi : B. J. Zebarth (*) Potato Research Centre, Agriculture and Agri-Food Canada, PO Box 20280, Fredericton, NB, Canada, E3B 4Z7 e-mail: [email protected] D. L. Burton : J. M. Cooper Department of Environmental Science, Nova Scotia Agricultural College, PO Box 550, 21 Cox Rd., Truro, NS, Canada, B2N 5E3 C. A. Grant Agriculture and Agri-Food Canada, Brandon Research Centre, Grand Valley Road, Brandon, MB, Canada, R7A 5Y3 G. A. Porter Department of Plant, Soil and Environmental Science, University of Maine, 114 Deering Hall, Orono, ME 04469, USA, Y. Leclerc McCain Foods (Canada), 107 Main Street, Florenceville, NB, Canada, E7L 1B2 G. Moreau McCain Foods (Canada), PO Box 11400, Trans Canada Highway, Grand Falls, NB, Canada, E3Z 3E3 W. J. Arsenault Crops and Livestock Research Centre, Agriculture and Agri-Food Canada, 440 University Ave., Charlottetown, PE, Canada, C1A 4N6
-
Upload
independent -
Category
Documents
-
view
7 -
download
0
Transcript of Evaluation of laboratory-based measures of soil mineral nitrogen and potentially mineralizable...
REGULAR ARTICLE
Evaluation of laboratory-based measures of soil mineralnitrogen and potentially mineralizable nitrogen as predictorsof field-based indices of soil nitrogen supplyin potato production
Mehdi Sharifi & Bernie J. Zebarth &
David L. Burton & Cynthia A. Grant &Gregory A. Porter & Julia M. Cooper &
Yves Leclerc & Gilles Moreau & Walter J. Arsenault
Received: 4 July 2007 /Accepted: 23 September 2007 / Published online: 6 October 2007# Springer Science + Business Media B.V. 2007
Abstract Accurate estimation of soil nitrogen (N)supply in the field is required to optimize fertilizer Nmanagement and to minimize environmental N losses inhumid environments. Laboratory-based measures of Navailability were evaluated as predictors of field-basedindices of soil N supply within potato productionsystems. Pre-plant soil samples (0–15 cm) were collect-
ed from a series of forty treatments in established potatotrials located in Atlantic Canada and Maine, USA. Totalplant N uptake at topkill with no fertilizer N applied(PNU0N), PNU0N plus soil mineral N to 30 cm depth atharvest and relative yield were considered as field-based indices of soil N supply. The potentiallymineralizable N (N0) was determined by aerobic
Plant Soil (2007) 301:203–214DOI 10.1007/s11104-007-9438-7
DO09438; No of Pages
Responsible Editor: Elizabeth (Liz) A. Stockdale.
M. Sharifi :B. J. Zebarth (*)Potato Research Centre,Agriculture and Agri-Food Canada,PO Box 20280, Fredericton, NB, Canada, E3B 4Z7e-mail: [email protected]
D. L. Burton : J. M. CooperDepartment of Environmental Science,Nova Scotia Agricultural College,PO Box 550, 21 Cox Rd.,Truro, NS, Canada, B2N 5E3
C. A. GrantAgriculture and Agri-Food Canada,Brandon Research Centre,Grand Valley Road,Brandon, MB, Canada, R7A 5Y3
G. A. PorterDepartment of Plant, Soil and Environmental Science,University of Maine,114 Deering Hall,Orono, ME 04469, USA,
Y. LeclercMcCain Foods (Canada),107 Main Street,Florenceville, NB, Canada, E7L 1B2
G. MoreauMcCain Foods (Canada),PO Box 11400, Trans Canada Highway,Grand Falls, NB, Canada, E3Z 3E3
W. J. ArsenaultCrops and Livestock Research Centre,Agriculture and Agri-Food Canada,440 University Ave.,Charlottetown, PE, Canada, C1A 4N6
incubation at 25°C and periodic leaching for 24 weeks.A series of laboratory-based measures of soil N supplywere measured in soil samples. Pre-plant soil nitrate ortotal mineral N at 0–30 cm depth was the best singlepredictor of PNU0N (r=0.67 and 0.71, respectively)and relative yield (r=0.58 and 0.61). The ultravioletabsorbance of 0.01 M NaHCO3 extract at 205 nm(NaHCO3-205) was suitable as a predictor of PNU0N
and relative yield in each growing season, however, therelationship between this parameter and PNU0N orrelative yield varied somewhat among years. Acombination of pre-plant mineral N plus N mineralizedin the first 2 weeks period of incubation after re-wetting is proposed as a more robust measure of Navailability compared with use of mineral N alone.
Keywords Field experiment .
Long term aerobic incubation . Plant N uptake .
Potentially mineralizable N . Soil mineral N .
Solanum tuberosum
AbbreviationsHKCl–NH4 Extractable NH4–N with 2 M KCl
at 100°CISNT Illinois Soil N Test for amino sugar-Nk Mineralization rate coefficientKCl–NO3 Extractable NO3–N with 1.7 M KCl
at 0–30 cm soil depth prior toplanting
KCl–NH4 Extractable NH4–N with 1.7 M KClat 0–30 cm soil depth prior toplanting
MBC Microbial biomass C by chloroformfumigation extraction method
NaHCO3–200 Ultraviolet absorbance of 0.01 MNaHCO3 extract at 200 nm
NaHCO3-205 Ultraviolet absorbance of 0.01 MNaHCO3 extract at 205 nm
NaHCO3-260 Ultraviolet absorbance of 0.01 MNaHCO3 extract at 260 nm
NaOH-DD Direct-distillation with NaOH(12.5 M)
N0 Potentially mineralizable NPNU0N Total plant N uptake measured at
topkill with no fertilizer N applicationas a field-based index of soil N supply
PNU0N+SMNh Total plant N uptake measured attopkill with no fertilizer N applica-
tion plus soil mineral N at 0–30 cmsoil depth measured at harvest as afield-based index of soil N supply
POM-C Particulate organic matter CPOM-N Particulate organic matter NPool-I The flush in mineral N which occurs
in the first 2 week period of incuba-tion at 25°C following rewetting
Pool-II Cumulative amount of N mineral-ized between 2 and 24 weeks ofincubation at 25°C
Pool-III N0 minus pool-II
Introduction
There is increasing concern over environmental N lossesthrough nitrate leaching or nitrous oxide emissionswithin potato (Solanum tuberosum L.) production(Zebarth and Rosen 2007). One of the most practicalapproaches to reduce environmental losses and improveprofitability is to tailor fertilizer N applications to meetcrop fertilizer N requirements. The supply of N fromthe soil, which consists of N mineralized from soilorganic matter and crop residues and residual mineral Nfrom the previous growing season, is an important butvariable contributor of N to crop production (Zebarthet al. 2005). In arid and sub-humid environments,residual mineral N from one season to the nextrepresents a significant component of soil N supply. Insuch environments, pre-plant soil mineral N tests havebeen developed to estimate the magnitude of residualmineral N and thereby improve fertilizer N recommen-dations (Hergert 1987). These tests are successfullyused in western Canada and USA to predict fertilizer Nrequirements for barley (Hordeum vulgare L.), wheat(Triticum aestivum L.) and corn (Zea mays L.) (Soperand Huang 1963; Dahnke and Johnson 1990). Inhumid environments, the loss of residual mineral Nover winter results in soil N supply being dominatedby in-season soil N mineralization; however, there is alack of practical methods for routine estimation of soilN supply. Consequently, variation in soil N supply iscommonly not considered in making crop fertilizer Nrecommendations in humid environments. Develop-ment of a reliable index of soil N supply for use inhumid environments could improve fertilizer N rec-ommendations, thereby optimizing economics of cropproduction and minimizing environmental N losses.
204 Plant Soil (2007) 301:203–214
The most common approaches for estimation ofsoil N supply include measurement of crop N uptakein unfertilized plots (PNU0N) and accumulation of soilmineral N in vegetation-free plots (Schepers andMeisinger 1994). The former approach has theadvantage of being conducted under field conditionswhere temperature, moisture, and aeration are repre-sentative of that experienced by the crop. It alsoincorporates the root interactions of the specific cropspecies, and is therefore expected to provide a betterestimate of the crop specific soil N supply (Zebarthet al. 2005). Soil N supply also can be estimated as thesum of PNU0N plus residual soil mineral N in the rootzone after crop harvest (Redman et al. 1989; Delphin2000; Zebarth et al. 2005), hereafter referred to asPNU0N+SMNh. These approaches have been used fora variety of crop species including corn (Fox andPiekielek 1978), orchardgrass (Dactylis glomerata L.)(Bittman et al. 2004), broccoli (Brassica olearacea L.Italica) (Zebarth et al. 1995) and potato (Zebarth et al.2005). While both PNU0N and PNU0N+SMNh providemeasures of soil N supply to the crop, both parametersrequire information measured at crop harvest andtherefore cannot be used as a predictor of soil Nsupply in making fertilizer N recommendations.
In some cases, increased N supply may not resultin increased crop yield (Griffin and Hesterman 1991).Crop yield response to fertilizer N addition istherefore a practical alternative means of evaluatingsoil N supply. Some of the variation in absolute yieldamong sites which are not related to soil N supply canbe eliminated by using relative yield i.e. yield from azero fertilizer N rate plot divided by yield from a fullytreated plot expressed as percentage (Evans 1987).
Considerable effort has been made to developlaboratory-based measures of soil N mineralizationwhich could be used as predictors of soil N supply inhumid environments. A standard laboratory-based meth-od for measuring potentially mineralizable N was firstproposed by Stanford and Smith (1972). This methodrequires an incubation of soil for more than 20 weeksunder optimum temperature and moisture conditions toassess the potentially mineralizable N (N0) and itsmineralization rate coefficient (k). However, this meth-od is time consuming, and not practical for routine use.Consequently, recent research has focused on thedevelopment of more rapid chemical extraction meth-ods. Among several proposed laboratory-based meth-ods, encouraging results have been reported for hot
(100°C) KCl (Gianello and Bremner 1986a; Jalil et al.1996), phosphate–borate buffer at pH=11.2 (Gianelloand Bremner 1986b), direct-distillation with NaOH(Stanford 1978; Sharifi et al. 2007), ultraviolet absor-bance of 0.01 M NaHCO3 extracts at 200, 205 and260 nm (Fox and Piekielek 1978; Hong et al. 1990),Illinois Soil N Test for amino sugar-N (Khan et al.2001; Williams et al. 2007), microbial biomass-C or -N(Carter and MacLeod 1987; Deng et al. 2000) andparticulate organic matter-C or -N (Willson et al. 2001).The advantage of a laboratory-based approach is that anestimate of the contribution of soil N mineralization tosoil N supply can be obtained. However, suchlaboratory tests estimate soil N mineralization potential,do not account for the effects of environmentalconditions on N mineralization under field conditions,or take into account losses of soil mineral N during thegrowing season due to leaching and denitrification.
The development and validation of laboratory-basedpredictors of field soil N supply generally rely on thestatistical relationship between test results and standardfield-based indices of soil N supply (e.g. PNU0N orPNU0N+SMNh). Few studies have assessed the rela-tionship between N0 (as a standard laboratory-basedindex) and field-based methods of estimating soil Nsupply. Stanford et al. (1977) found that a simplestatistical model that includes both pre-plant NO3–Nand N0 could be used to predict sugar beet N uptake(r=0.80, combining 2 years field data in Idaho).Carpenter-Boggs et al. (2000) reported that corn Nuptake (without N fertilizer) was strongly correlatedwith total available N (mineralized N during 189dincubation plus pre-plant mineral N; r=0.89). Kuo et al.(1996) reported that N mineralization from cover cropsduring a 98 d aerobic incubation had no relationshipwith corn N uptake or yield; however, combiningmineralized N and pre-plant soil mineral N increasedcorrelation coefficients (r=0.75 and 0.86, for N uptakeand yield, respectively). Net N mineralization during a275 day aerobic incubation and corn field N mineral-ization estimated by the mass balance approach werecorrelated (r=0.72); however, the laboratory incubationover-predicted field N mineralization (Delphin 2000).
Other studies mostly focused on assessment of therelationship between laboratory-based N availabilitytests and PNU0N or PNU0N+SMNh. Fox and Piekielek(1984) found ultraviolet absorbance of a boiling0.01 M CaCl2 extract (121°C, 16 h) was not wellcorrelated to N uptake in corn; however, when poorly
Plant Soil (2007) 301:203–214 205
drained soils and fields planted to legumes within thepreceding 2 years were omitted, the correlationcoefficient was improved (r=0.65). Hong et al.(1990) evaluated the ability of several chemical soilN availability indices to predict the N supply of soil tocorn in 49 field experiments over 3 years in Pennsyl-vania. They found significant correlations between soilN supply (PNU0N minus 75% of starter N fertilizerapplied) and both pre-plant NO3–N concentration (r=0.75) and NaHCO3-200 (r=0.73) for 0–20 cm soildepth. McTaggart and Smith (1993) evaluated someindices of N availability across ten soils and threegrowing seasons in Scotland, and found that soilmineral N at planting and hot KCl (100°C) werereasonable predictors of barley N uptake with exclu-sion of a few sites (r=0.88 and 0.81, respectively).
In the present study, laboratory-based measures ofsoil mineral N and soil N mineralization potentialwere evaluated as predictors of field-based indices ofsoil N supply within potato production systems ineastern Canada and the north-eastern USA, a regioncharacterized by a cool Maritime climate and humidsoil moisture regimes. These laboratory-based meas-ures were previously evaluated as predictors of soil Nmineralization potential (i.e. N0) (Sharifi et al. 2007).
Materials and methods
Field experiments
Soil samples were collected from a series of fortytreatments in established potato trials located in NewBrunswick and Prince Edward Island, Canada andMaine, USA, between 2000 and 2005. In Maine,samples were taken from the potato year of twodifferent rotation trials in each of 2004 and 2005. Ineach plot, an area was established which received nofertilizer N; the remainder of the plot received anoptimal fertilizer N rate. In New Brunswick and PrinceEdward Island, samples were collected during 2000–2004 from the zero N rate plots within established Nfertility experiments. All trials had at least fourreplicates. Soils in this region were mostly developedon medium-textured glacial till deposits, and wereclassified as Spodosols (Typic Haplorthods and TypicHaplohumods). Selected sites represented a range ofsoil characteristics, rotations and management historyand practices of potato production in the region.
Trials were planted to Russet Burbank, Shepody orAtlantic, three primary processing potato cultivars inthe region, in early to mid-May in rows 91 cm apart.The P and K fertilizers were applied at recommendedrates. Standard commercial practices were used fortillage and weed, insect and disease control. Noirrigation was applied.
Soil samples were taken from 0 to 7.5 cm depth in2000 to 2003 and from 0 to 15 cm depth in 2004 and2005. Samples were taken before planting and anyfertilizer application. Soils were air dried and sieved(<2 mm) before analysis. Soil pH was determined in a1:1 soil:water suspension. Particle-size distributionwas determined by the pipette method after organicmatter removal by hydrogen peroxide (Gee and Bauder1986). Soil total organic-C and -N were measured bydry combustion method using a LECO CNS-1000analyzer (LECO Corporation, St. Joseph, MI, USA.)after carbonate removal. The physicochemical prop-erties of the tested soils are summarized in Table 1.
Separate soil samples were collected from 0 to30 cm depth in each plot just prior to planting andafter tuber harvest for determination of soil mineral Nconcentration. Samples were frozen until analysis.These soils were extracted with 1.7 M KCl (20 g fieldmoist soil/ 100 ml extractent; 30 min shaking time)and concentrations of NO3–N and NH4–N (KCl–NO3
and KCl–NH4, respectively) in the extract determinedspectrophotometrically using a Technicon TRAACS800 autoanalyzer (Zebarth and Milburn 2003). SoilKCl–NO3 and KCl–NH4 concentrations were con-verted to units of kg N ha−1 using soil bulk densitymeasured by the soil core method at each site(Zebarth and Milburn 2003). The sum of pre-plantKCl–NO3 and KCl–NH4 contents at 0–30 cm ishereafter referred to as soil mineral N.
Table 1 Summary of selected chemical and physical character-istics of tested soil samples
Parameter Mean SD Minimum Maximum
pH 5.6 0.4 4.7 6.4Sand (g kg−1) 453 75 366 627Silt (g kg−1) 410 55 277 472Clay (g kg−1) 137 25 69 182Total organicC (g kg−1)
17.5 5 10.4 26.3
Total organicN (g kg−1)
1.32 0.43 0.76 1.78
206 Plant Soil (2007) 301:203–214
Field-based indices of soil N supply
Four adjacent whole potato plants in one row wereharvested from each plot just prior to topkill, andpartitioned into tubers, vines and readily recoverableroots, and dry matter and N accumulation of eachplant component was determined as in Zebarth andMilburn (2003). In addition, tuber fresh weight yieldwas determined in the zero fertilizer N rate plot, andin either an adjacent area of the same plot or inanother N rate treatment in the same trial, whichreceived the recommended fertilizer N rate.
Total plant N uptake in zero fertilizer N rate plotsincluding vines, tubers and readily recoverable rootsmeasured at topkill was considered as PNU0N (Meisinger1984; Zebarth et al. 2005). The PNU0N+SMNh wasestimated by adding 0–30 cm depth mineral N contentmeasured at tuber harvest to PNU0N (Meisinger 1984;Zebarth et al. 2005). Relative yield was calculated as thetotal tuber yield for the zero N rate plots divided by theyield for the recommended fertilizer N rate andexpressed as a percentage.
Laboratory-based measures of potentiallymineralizable N or N availability
The long term aerobic incubation procedure describedby Campbell et al. (1993), a modification of themethod of Stanford and Smith (1972), was used tomeasure potentially mineralizable N. Soil sampleswere rewetted to field capacity during the firstleaching and incubated at 25°C for 24 weeks asdescribed by Sharifi et al. (2007). The soils wereleached periodically (every 2 weeks for the first12 weeks and every 4 weeks thereafter) with 0.01 MCaCl2 followed by a zero-N nutrient solution (Camp-bell et al. 1993). Leachates were analyzed for NH4–Nand NO3–N using a Technicon TRAACS 800 auto-analyzer (Zebarth and Milburn 2003). The N miner-alized in the first 2 weeks period was not used for thecurve fitting procedure because this represents the initialflush of mineralization upon rewetting. The followingfirst-order kinetic model was fitted to data using theMarquardt iteration method:
Nmin ¼ N0 1� exp �ktð Þ½ � ð1Þwhere Nmin is the cumulative amount of N mineralizedat time, t, N0 is potentially mineralizable N, and k is themineralization rate coefficient (Campbell et al. 1993).
Three different pools of mineralizable N based on longterm aerobic incubation were calculated (Sharifi et al.2007): [Pool-I]. The flush in soil mineral N whichoccurs in the first 2 weeks period following rewetting.This pool represents the mineralization of a labileorganic N pool. [Pool-II] The cumulative amount of Nwhich mineralized between 2 and 24 weeks and isrepresentative of the release of an intermediate pool oforganic N [Pool-III]. The amount of N which waspredicted to be potentially mineralizable based oncurve fitting but did not mineralize during theincubation period.
Hot KCl-extractable NH4–N (HKCl–NH4) wasdetermined by heating 9.0 g soil with 60 ml of 2 MKCl on a digestion block set at 100°C for 4 h(Gianello and Bremner 1986a) followed by filtrationand analysis for NH4–N as described above. Theultraviolet absorbance of the NaHCO3 0.01 Mextract at 205 and 260 nm (NaHCO3-205 andNaHCO3-260), Illinois Soil N Test (ISNT), phos-phate–borate buffer extractable N (PBN), and NaOHdirect-distillation -NH4 (NaOH-DD) were deter-mined in soil samples as described by Sharifi et al.(2007). The chloroform fumigation extractable Cwas determined as an index of soil microbialbiomass C (MBC) (Voroney et al. 1993). Particulateorganic matter C and N (POM-C and POM-N) weredetermined by passing a 25-g dispersed air-dried soilsample through a 53-μm sieve (Gregorich and Ellert1993). Retained sand and macroorganic matter weredried and weighed. Carbon and N concentrationswere then determined by dry combustion using aLECO CNS-1000 and the masses of C and N pergram of air-dry soil were calculated as POM-C andPOM-N, respectively. The NaOH-DD, POM-C andPOM-N were only measured for the 2004–2005samples. Measurement units were converted to unitsof kg N ha−1 using soil bulk density measured by thesoil core method at each site in each sampling year(Blake and Hartge 1986).
Statistical analyses
Correlation analyses and regression analyses usinglinear and segmented models were used to assess therelationships between the laboratory-based measuresof N availability and field-based indices of soil Nsupply in each group of soils and overall (SASInstitute Inc., Cary, NC, Version 8.2).
Plant Soil (2007) 301:203–214 207
Results and discussion
Field-based indices of soil N supply
The PNU0N ranged from 39 to 156 kg N ha−1 with anaverage of 79 kg N ha−1 (Table 2). Likewise, PNU0N+SMNh ranged from 47 to 185 kg N ha−1 with anaverage of 106 kg N ha−1. Soil mineral N prior toplanting was the equivalent of 25–96% (average of48%) of PNU0N and 14–107% (average of 36%) ofPNU0N+SMNh within individual treatments. Thecombination of pre-plant soil mineral N plus pool-I
was equivalent to 48–158% (average of 95%) ofPNU0N and 36–125% (average of 71%) of PNU0N+SMNh within individual sites. Relative yield rangedfrom 39 to 100% with an average of 72%.
Laboratory-based measures of soil N supply
The parameter N0, estimated from the periodically-leached incubation, was considered the standardmeasure of soil N mineralization potential, representingpools II and III of mineralizable N. The N0 rangedfrom 64 to 187 kg N ha−l (Table 2) and represented an
Table 2 Mean and range of values for laboratory-based measures of N availability and field-based indices of soil N supply
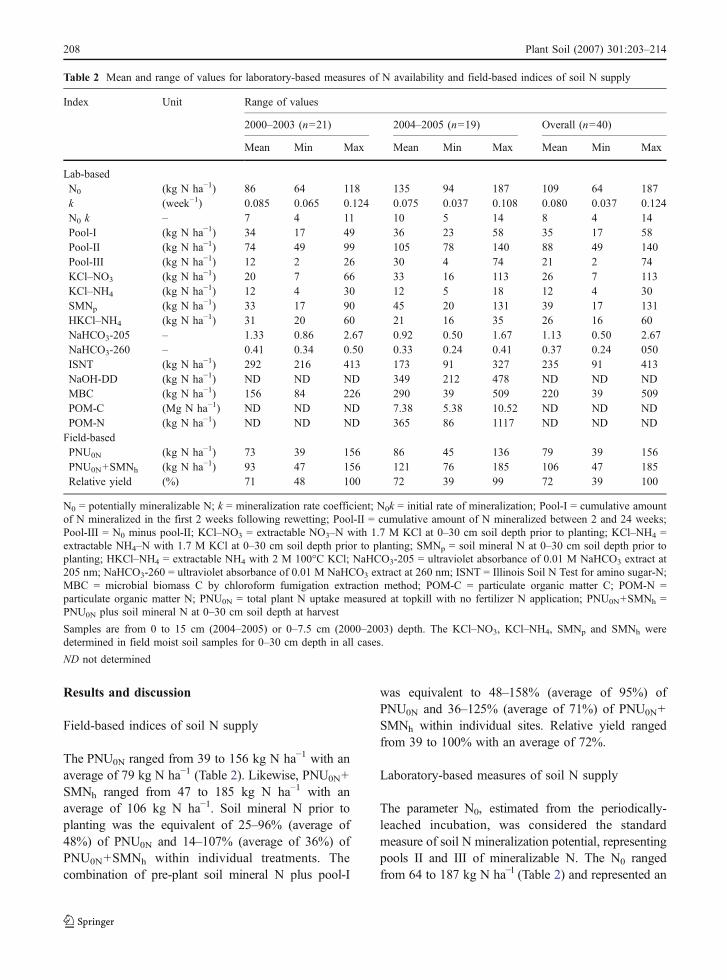
Index Unit Range of values
2000–2003 (n=21) 2004–2005 (n=19) Overall (n=40)
Mean Min Max Mean Min Max Mean Min Max
Lab-basedN0 (kg N ha−1) 86 64 118 135 94 187 109 64 187k (week−1) 0.085 0.065 0.124 0.075 0.037 0.108 0.080 0.037 0.124N0 k – 7 4 11 10 5 14 8 4 14Pool-I (kg N ha−1) 34 17 49 36 23 58 35 17 58Pool-II (kg N ha−1) 74 49 99 105 78 140 88 49 140Pool-III (kg N ha−1) 12 2 26 30 4 74 21 2 74KCl–NO3 (kg N ha−1) 20 7 66 33 16 113 26 7 113KCl–NH4 (kg N ha−1) 12 4 30 12 5 18 12 4 30SMNp (kg N ha−1) 33 17 90 45 20 131 39 17 131HKCl–NH4 (kg N ha−1) 31 20 60 21 16 35 26 16 60NaHCO3-205 – 1.33 0.86 2.67 0.92 0.50 1.67 1.13 0.50 2.67NaHCO3-260 – 0.41 0.34 0.50 0.33 0.24 0.41 0.37 0.24 050ISNT (kg N ha−1) 292 216 413 173 91 327 235 91 413NaOH-DD (kg N ha−1) ND ND ND 349 212 478 ND ND NDMBC (kg N ha−1) 156 84 226 290 39 509 220 39 509POM-C (Mg N ha−1) ND ND ND 7.38 5.38 10.52 ND ND NDPOM-N (kg N ha−1) ND ND ND 365 86 1117 ND ND NDField-basedPNU0N (kg N ha−1) 73 39 156 86 45 136 79 39 156PNU0N+SMNh (kg N ha−1) 93 47 156 121 76 185 106 47 185Relative yield (%) 71 48 100 72 39 99 72 39 100
N0 = potentially mineralizable N; k = mineralization rate coefficient; N0k = initial rate of mineralization; Pool-I = cumulative amountof N mineralized in the first 2 weeks following rewetting; Pool-II = cumulative amount of N mineralized between 2 and 24 weeks;Pool-III = N0 minus pool-II; KCl–NO3 = extractable NO3–N with 1.7 M KCl at 0–30 cm soil depth prior to planting; KCl–NH4 =extractable NH4–N with 1.7 M KCl at 0–30 cm soil depth prior to planting; SMNp = soil mineral N at 0–30 cm soil depth prior toplanting; HKCl–NH4 = extractable NH4 with 2 M 100°C KCl; NaHCO3-205 = ultraviolet absorbance of 0.01 M NaHCO3 extract at205 nm; NaHCO3-260 = ultraviolet absorbance of 0.01 M NaHCO3 extract at 260 nm; ISNT = Illinois Soil N Test for amino sugar-N;MBC = microbial biomass C by chloroform fumigation extraction method; POM-C = particulate organic matter C; POM-N =particulate organic matter N; PNU0N = total plant N uptake measured at topkill with no fertilizer N application; PNU0N+SMNh =PNU0N plus soil mineral N at 0–30 cm soil depth at harvest
Samples are from 0 to 15 cm (2004–2005) or 0–7.5 cm (2000–2003) depth. The KCl–NO3, KCl–NH4, SMNp and SMNh weredetermined in field moist soil samples for 0–30 cm depth in all cases.
ND not determined
208 Plant Soil (2007) 301:203–214
average of 6% of total organic-N. The measured valuesfor N0 were at the low end range of N0 values reportedby Carter and MacLeod (1987; 79–445 kg N ha−1 if asoil bulk density of 1.2 Mg m−3 is assumed) forPrince Edward Island, Canada and by Milburn et al.(1990; 177–281 kg N ha−1 if a soil bulk density of1.1 Mg m−3 is assumed) for five potato trials in NewBrunswick, Canada. The slightly higher N0 values inthese reports compared with the values in our studycan be attributed to the higher incubation temper-atures, longer periods of incubation and use of siteswith a history of manure application. Pool-I valuesranged from 17 to 58 kg N ha−1. Pool-II and -IIIvalues ranged from 49 to 140 and 2 to 74 kg N ha−1,respectively, and represented an average of 80 and20% of N0, respectively. Pool-III had the highestvariability among potentially mineralizable N compo-nents (CV=92% compared with CVs of 24, 27, and18% for N0, pool-I and pool-II, respectively).
The calculated values of k ranged from 0.037 to0.124 week−1 (average of 0.080 week−1) (Table 2).This range is similar to the range of values reportedby Jalil et al. (1996; 0.031–0.138 week−1) and Curtinand Wen (1999; 0.025–0.178 week−1) but slightlyhigher than the values reported by Stanford and Smith(1972) for 39 soils collected throughout the USA(average of 0.054 week−1) and by Milburn et al.(1990) for 5 potato trials in New Brunswick, Canada(average of 0.051 week−1).
The KCl–NO3 ranged from 7 to 113 kg N ha−l
(average of 26 kg N ha−l) (Table 2). The KCl–NH4
ranged from 4 to 30 kg N ha−l (average of 12 kg N ha−l).The soil mineral N ranged from 17 to 131 kg N ha−l
(average 39 kg N ha−l), which on average consisted of68% NO3–N and 32% NH4–N. The amount of NH4–Nextracted byHKCl–NH4 ranged from 16 to 60 kg N ha−l,representing 0.7–2.5% of total organic-N. The ultra-violet absorbance of 0.01 M NaHCO3 extracts rangedfrom 0.50 to 2.67 at 205 nm and from 0.24 to 0.50 at260 nm. The ISNT ranged from 91 to 413 kg N ha−l,representing 5–17% of total organic-N. The NaOH-DD extractable N ranged from 212 to 478 kg N ha−l
for 2004 and 2005 samples, which represented 16–26% of total organic-N. The MBC ranged from 39 to509 kg C ha−l which accounted for 0.2–17% (average6%) of soil total organic-C. The POM-N ranged from86 to 1118 kg N ha−l for 2004 and 2005 samples, andwas equivalent to 4–61% (average 33%) of total organic-N. The POM-N was the largest measured organic-N
fraction among tested methods. The POM-C rangedfrom 5.4 to 10.5 Mg C ha−1 and was equivalent to 21 to52% (average 20%) of soil total organic-C. The KCl–NO3, POM-N, KCl–NH4 and MBC had the highest CVsamong the tested laboratory-based measures of soil Nsupply (CV=86, 62, 61, and 55%, respectively).
Relationships between laboratory-based measuresand field-based indices of soil N supply
Linear correlation coefficients were calculated betweenlab-based measures of soil N supply and field-basedindices of soil N supply for 2000–2003, 2004–2005 andoverall data (Table 3). All potentially mineralizable Nparameters in the 2004–2005 data, except N0, had asignificant (P<0.05) correlation with at least one of thefield-based indices of soil N supply (Table 3). The kand N0k were significantly correlated with PNU0N andPNU0N+SMNh (r=0.54–0.67). Pool-I was significant-ly correlated with PNU0N and relative yield (r=0.47and 0.69, respectively) and pool-II had a significantpositive correlation with relative yield (r=0.54). Incontrast, pool-III had a significant negative correlationwith PNU0N (r=−0.50). There were no significantcorrelations between mineralizable N parameters andfield-based indices of soil N supply in the 2000–2003data alone. In many cases significant correlationspresent in the 2004–2005 data were also reflected inthe overall data.
Organic-C, organic-N and clay were poorly corre-lated with the different measures of soil N supply inthis study. This reflects the narrow range of valuesresulting from the generally similar soil types fromwhich the soil samples were collected. Consequently,the differences in mineralizable N among sites likelyreflect variation in recent management practices and/or variation in environmental conditions.
Among lab-based measures of soil N supply in the2004–2005 data, KCl–NO3 and soil mineral N at 0–30 cm depth were significantly correlated with all threefield-based indices of soil N supply (Table 3; r=0.51 to0.68). The NaHCO3-205 was significantly correlatedwith PNU0N and PNU0N+SMNh (r=0.73 and 0.61,respectively). There was also a significant correlationbetween POM-N and relative yield (r=0.55).
The pattern of correlation coefficients between lab-based measures of soil N supply and field-basedindices of soil N supply in the 2000–2003 data wassimilar to that for the 2004–2005 data. The KCl–NO3,
Plant Soil (2007) 301:203–214 209
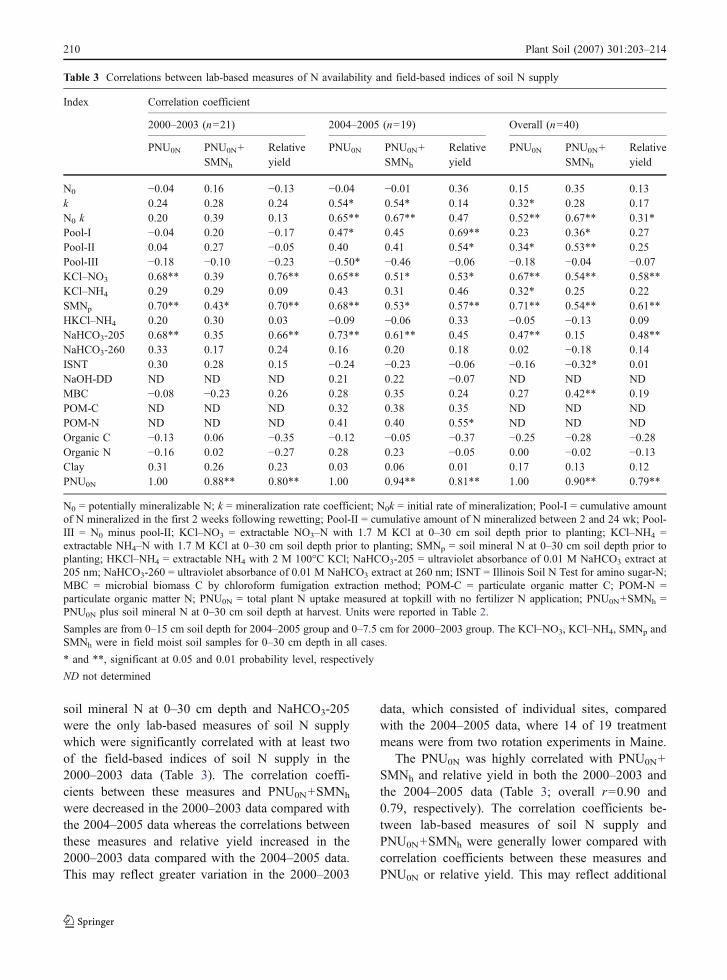
soil mineral N at 0–30 cm depth and NaHCO3-205were the only lab-based measures of soil N supplywhich were significantly correlated with at least twoof the field-based indices of soil N supply in the2000–2003 data (Table 3). The correlation coeffi-cients between these measures and PNU0N+SMNh
were decreased in the 2000–2003 data compared withthe 2004–2005 data whereas the correlations betweenthese measures and relative yield increased in the2000–2003 data compared with the 2004–2005 data.This may reflect greater variation in the 2000–2003
data, which consisted of individual sites, comparedwith the 2004–2005 data, where 14 of 19 treatmentmeans were from two rotation experiments in Maine.
The PNU0N was highly correlated with PNU0N+SMNh and relative yield in both the 2000–2003 andthe 2004–2005 data (Table 3; overall r=0.90 and0.79, respectively). The correlation coefficients be-tween lab-based measures of soil N supply andPNU0N+SMNh were generally lower compared withcorrelation coefficients between these measures andPNU0N or relative yield. This may reflect additional
Table 3 Correlations between lab-based measures of N availability and field-based indices of soil N supply
Index Correlation coefficient
2000–2003 (n=21) 2004–2005 (n=19) Overall (n=40)
PNU0N PNU0N+SMNh
Relativeyield
PNU0N PNU0N+SMNh
Relativeyield
PNU0N PNU0N+SMNh
Relativeyield
N0 −0.04 0.16 −0.13 −0.04 −0.01 0.36 0.15 0.35 0.13k 0.24 0.28 0.24 0.54* 0.54* 0.14 0.32* 0.28 0.17N0 k 0.20 0.39 0.13 0.65** 0.67** 0.47 0.52** 0.67** 0.31*Pool-I −0.04 0.20 −0.17 0.47* 0.45 0.69** 0.23 0.36* 0.27Pool-II 0.04 0.27 −0.05 0.40 0.41 0.54* 0.34* 0.53** 0.25Pool-III −0.18 −0.10 −0.23 −0.50* −0.46 −0.06 −0.18 −0.04 −0.07KCl–NO3 0.68** 0.39 0.76** 0.65** 0.51* 0.53* 0.67** 0.54** 0.58**KCl–NH4 0.29 0.29 0.09 0.43 0.31 0.46 0.32* 0.25 0.22SMNp 0.70** 0.43* 0.70** 0.68** 0.53* 0.57** 0.71** 0.54** 0.61**HKCl–NH4 0.20 0.30 0.03 −0.09 −0.06 0.33 −0.05 −0.13 0.09NaHCO3-205 0.68** 0.35 0.66** 0.73** 0.61** 0.45 0.47** 0.15 0.48**NaHCO3-260 0.33 0.17 0.24 0.16 0.20 0.18 0.02 −0.18 0.14ISNT 0.30 0.28 0.15 −0.24 −0.23 −0.06 −0.16 −0.32* 0.01NaOH-DD ND ND ND 0.21 0.22 −0.07 ND ND NDMBC −0.08 −0.23 0.26 0.28 0.35 0.24 0.27 0.42** 0.19POM-C ND ND ND 0.32 0.38 0.35 ND ND NDPOM-N ND ND ND 0.41 0.40 0.55* ND ND NDOrganic C −0.13 0.06 −0.35 −0.12 −0.05 −0.37 −0.25 −0.28 −0.28Organic N −0.16 0.02 −0.27 0.28 0.23 −0.05 0.00 −0.02 −0.13Clay 0.31 0.26 0.23 0.03 0.06 0.01 0.17 0.13 0.12PNU0N 1.00 0.88** 0.80** 1.00 0.94** 0.81** 1.00 0.90** 0.79**
N0 = potentially mineralizable N; k = mineralization rate coefficient; N0k = initial rate of mineralization; Pool-I = cumulative amountof N mineralized in the first 2 weeks following rewetting; Pool-II = cumulative amount of N mineralized between 2 and 24 wk; Pool-III = N0 minus pool-II; KCl–NO3 = extractable NO3–N with 1.7 M KCl at 0–30 cm soil depth prior to planting; KCl–NH4 =extractable NH4–N with 1.7 M KCl at 0–30 cm soil depth prior to planting; SMNp = soil mineral N at 0–30 cm soil depth prior toplanting; HKCl–NH4 = extractable NH4 with 2 M 100°C KCl; NaHCO3-205 = ultraviolet absorbance of 0.01 M NaHCO3 extract at205 nm; NaHCO3-260 = ultraviolet absorbance of 0.01 M NaHCO3 extract at 260 nm; ISNT = Illinois Soil N Test for amino sugar-N;MBC = microbial biomass C by chloroform fumigation extraction method; POM-C = particulate organic matter C; POM-N =particulate organic matter N; PNU0N = total plant N uptake measured at topkill with no fertilizer N application; PNU0N+SMNh =PNU0N plus soil mineral N at 0–30 cm soil depth at harvest. Units were reported in Table 2.
Samples are from 0–15 cm soil depth for 2004–2005 group and 0–7.5 cm for 2000–2003 group. The KCl–NO3, KCl–NH4, SMNp andSMNh were in field moist soil samples for 0–30 cm depth in all cases.
* and **, significant at 0.05 and 0.01 probability level, respectively
ND not determined
210 Plant Soil (2007) 301:203–214
variation in PNU0N+SMNh which is the sum ofparameters, i.e. soil mineral N in 0–30 cm depth atharvest plus PNU0N, or may reflect additionalvariation in availability in soil N late in the growing
season which may not be reflected in plant uptake oryield (Griffin and Hesterman 1991).
Soils which had a preceding legume crop commonlyhad higher average values of PNU0N, PNU0N+SMNh and
a
c
b
d
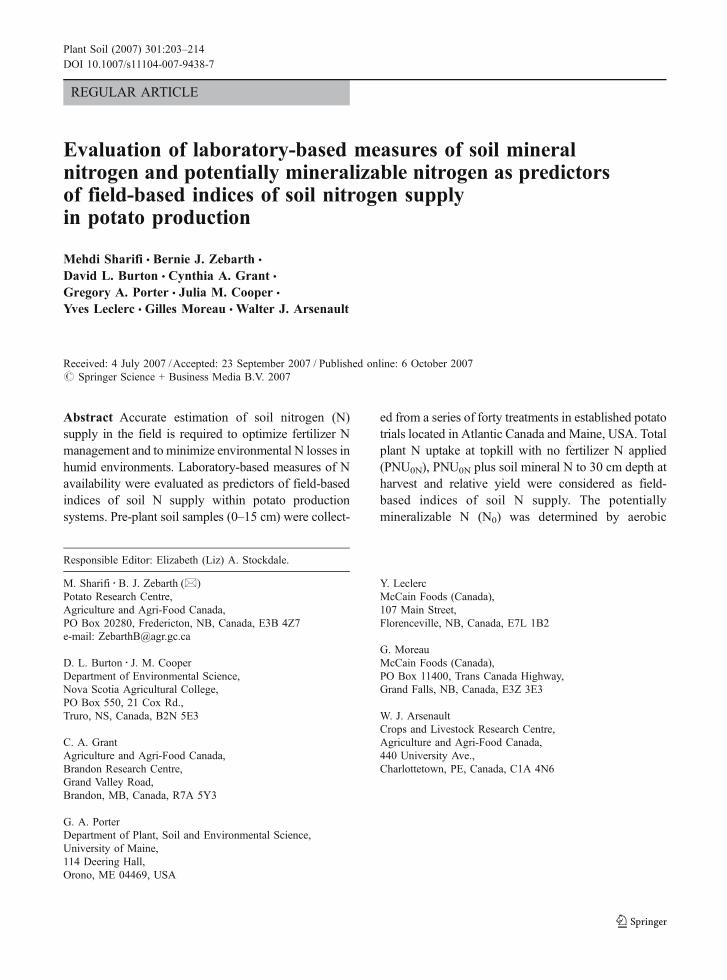
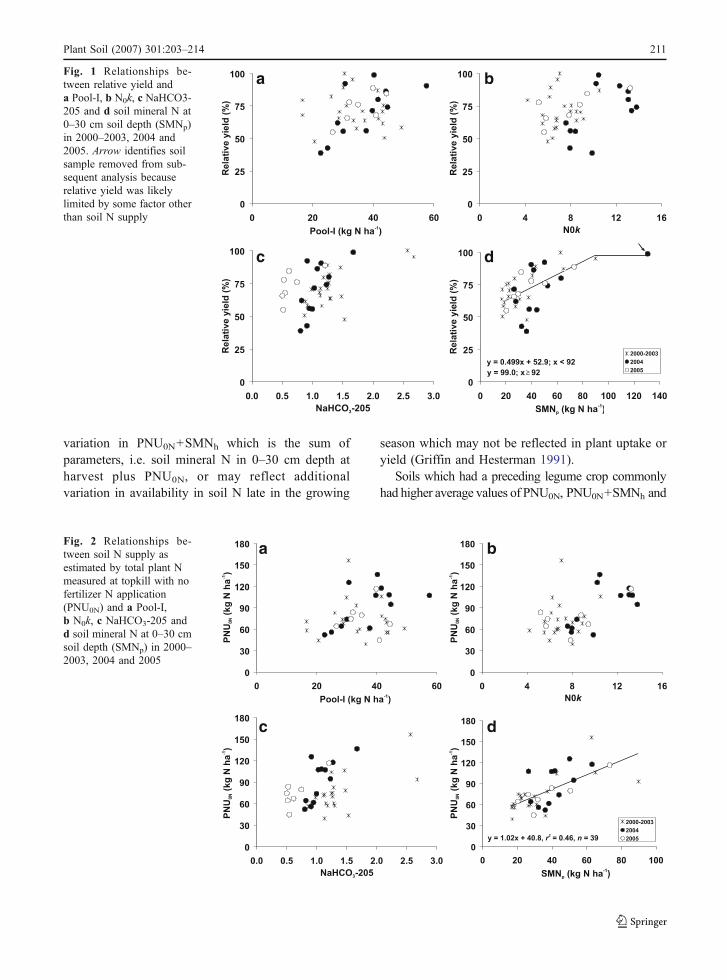
Fig. 1 Relationships be-tween relative yield anda Pool-I, b N0k, c NaHCO3-205 and d soil mineral N at0–30 cm soil depth (SMNp)in 2000–2003, 2004 and2005. Arrow identifies soilsample removed from sub-sequent analysis becauserelative yield was likelylimited by some factor otherthan soil N supply
a
c
b
d
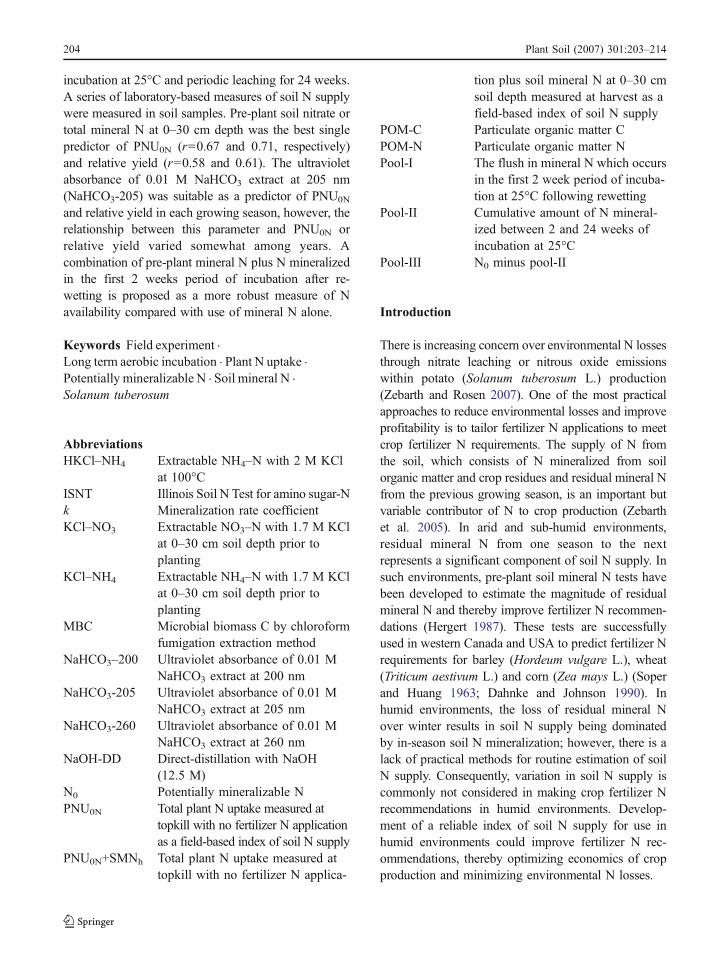
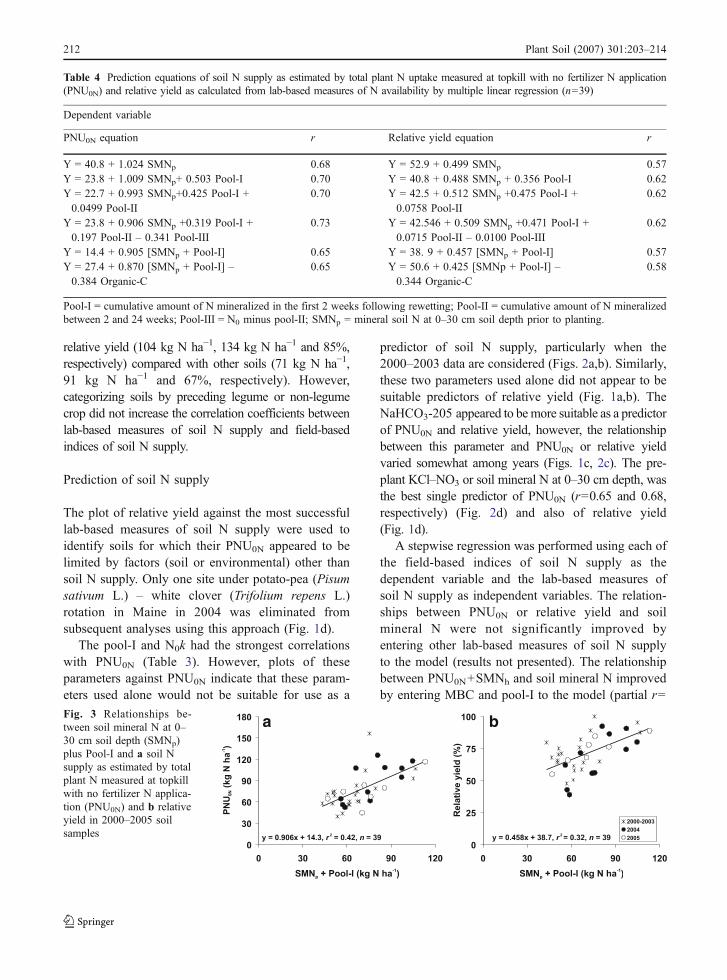
Fig. 2 Relationships be-tween soil N supply asestimated by total plant Nmeasured at topkill with nofertilizer N application(PNU0N) and a Pool-I,b N0k, c NaHCO3-205 andd soil mineral N at 0–30 cmsoil depth (SMNp) in 2000–2003, 2004 and 2005
Plant Soil (2007) 301:203–214 211
relative yield (104 kg N ha−1, 134 kg N ha−1 and 85%,respectively) compared with other soils (71 kg N ha−1,91 kg N ha−1 and 67%, respectively). However,categorizing soils by preceding legume or non-legumecrop did not increase the correlation coefficients betweenlab-based measures of soil N supply and field-basedindices of soil N supply.
Prediction of soil N supply
The plot of relative yield against the most successfullab-based measures of soil N supply were used toidentify soils for which their PNU0N appeared to belimited by factors (soil or environmental) other thansoil N supply. Only one site under potato-pea (Pisumsativum L.) – white clover (Trifolium repens L.)rotation in Maine in 2004 was eliminated fromsubsequent analyses using this approach (Fig. 1d).
The pool-I and N0k had the strongest correlationswith PNU0N (Table 3). However, plots of theseparameters against PNU0N indicate that these param-eters used alone would not be suitable for use as a
predictor of soil N supply, particularly when the2000–2003 data are considered (Figs. 2a,b). Similarly,these two parameters used alone did not appear to besuitable predictors of relative yield (Fig. 1a,b). TheNaHCO3-205 appeared to bemore suitable as a predictorof PNU0N and relative yield, however, the relationshipbetween this parameter and PNU0N or relative yieldvaried somewhat among years (Figs. 1c, 2c). The pre-plant KCl–NO3 or soil mineral N at 0–30 cm depth, wasthe best single predictor of PNU0N (r=0.65 and 0.68,respectively) (Fig. 2d) and also of relative yield(Fig. 1d).
A stepwise regression was performed using each ofthe field-based indices of soil N supply as thedependent variable and the lab-based measures ofsoil N supply as independent variables. The relation-ships between PNU0N or relative yield and soilmineral N were not significantly improved byentering other lab-based measures of soil N supplyto the model (results not presented). The relationshipbetween PNU0N+SMNh and soil mineral N improvedby entering MBC and pool-I to the model (partial r=
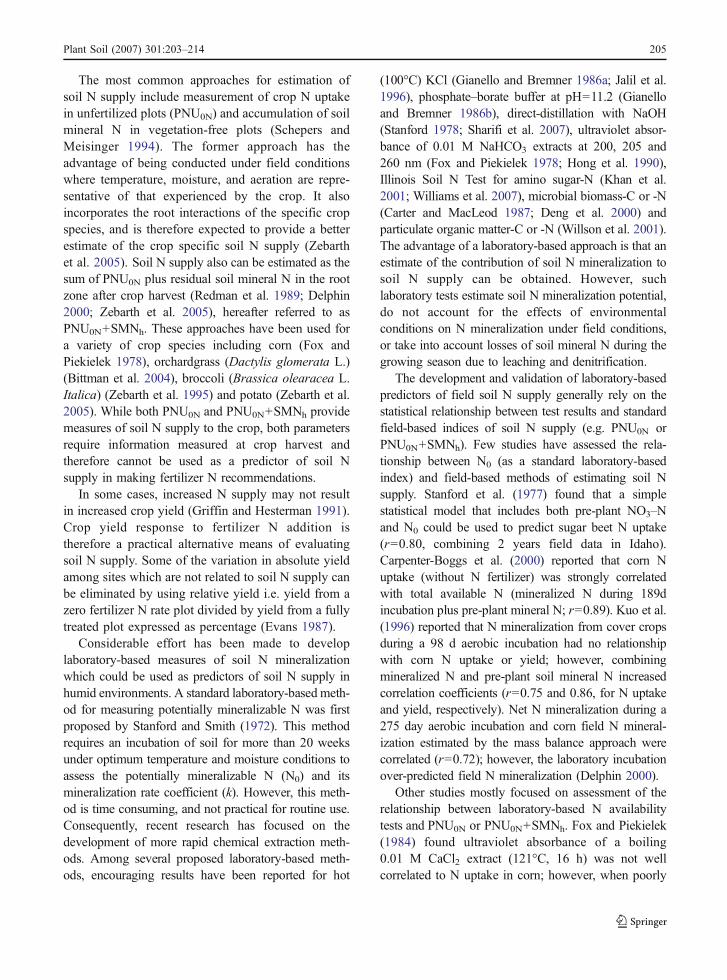
a bFig. 3 Relationships be-tween soil mineral N at 0–30 cm soil depth (SMNp)plus Pool-I and a soil Nsupply as estimated by totalplant N measured at topkillwith no fertilizer N applica-tion (PNU0N) and b relativeyield in 2000–2005 soilsamples
Table 4 Prediction equations of soil N supply as estimated by total plant N uptake measured at topkill with no fertilizer N application(PNU0N) and relative yield as calculated from lab-based measures of N availability by multiple linear regression (n=39)
Dependent variable
PNU0N equation r Relative yield equation r
Y = 40.8 + 1.024 SMNp 0.68 Y = 52.9 + 0.499 SMNp 0.57Y = 23.8 + 1.009 SMNp+ 0.503 Pool-I 0.70 Y = 40.8 + 0.488 SMNp + 0.356 Pool-I 0.62Y = 22.7 + 0.993 SMNp+0.425 Pool-I +0.0499 Pool-II
0.70 Y = 42.5 + 0.512 SMNp +0.475 Pool-I +0.0758 Pool-II
0.62
Y = 23.8 + 0.906 SMNp +0.319 Pool-I +0.197 Pool-II – 0.341 Pool-III
0.73 Y = 42.546 + 0.509 SMNp +0.471 Pool-I +0.0715 Pool-II – 0.0100 Pool-III
0.62
Y = 14.4 + 0.905 [SMNp + Pool-I] 0.65 Y = 38. 9 + 0.457 [SMNp + Pool-I] 0.57Y = 27.4 + 0.870 [SMNp + Pool-I] –0.384 Organic-C
0.65 Y = 50.6 + 0.425 [SMNp + Pool-I] –0.344 Organic-C
0.58
Pool-I = cumulative amount of N mineralized in the first 2 weeks following rewetting; Pool-II = cumulative amount of N mineralizedbetween 2 and 24 weeks; Pool-III = N0 minus pool-II; SMNp = mineral soil N at 0–30 cm soil depth prior to planting.
212 Plant Soil (2007) 301:203–214
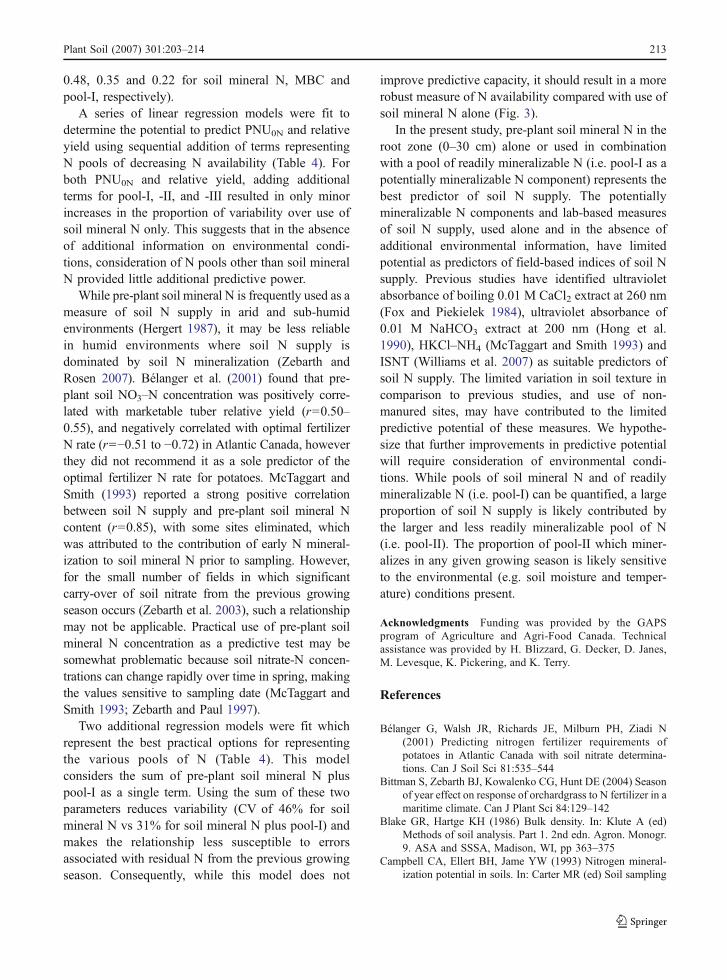
0.48, 0.35 and 0.22 for soil mineral N, MBC andpool-I, respectively).
A series of linear regression models were fit todetermine the potential to predict PNU0N and relativeyield using sequential addition of terms representingN pools of decreasing N availability (Table 4). Forboth PNU0N and relative yield, adding additionalterms for pool-I, -II, and -III resulted in only minorincreases in the proportion of variability over use ofsoil mineral N only. This suggests that in the absenceof additional information on environmental condi-tions, consideration of N pools other than soil mineralN provided little additional predictive power.
While pre-plant soil mineral N is frequently used as ameasure of soil N supply in arid and sub-humidenvironments (Hergert 1987), it may be less reliablein humid environments where soil N supply isdominated by soil N mineralization (Zebarth andRosen 2007). Bélanger et al. (2001) found that pre-plant soil NO3–N concentration was positively corre-lated with marketable tuber relative yield (r=0.50–0.55), and negatively correlated with optimal fertilizerN rate (r=−0.51 to −0.72) in Atlantic Canada, howeverthey did not recommend it as a sole predictor of theoptimal fertilizer N rate for potatoes. McTaggart andSmith (1993) reported a strong positive correlationbetween soil N supply and pre-plant soil mineral Ncontent (r=0.85), with some sites eliminated, whichwas attributed to the contribution of early N mineral-ization to soil mineral N prior to sampling. However,for the small number of fields in which significantcarry-over of soil nitrate from the previous growingseason occurs (Zebarth et al. 2003), such a relationshipmay not be applicable. Practical use of pre-plant soilmineral N concentration as a predictive test may besomewhat problematic because soil nitrate-N concen-trations can change rapidly over time in spring, makingthe values sensitive to sampling date (McTaggart andSmith 1993; Zebarth and Paul 1997).
Two additional regression models were fit whichrepresent the best practical options for representingthe various pools of N (Table 4). This modelconsiders the sum of pre-plant soil mineral N pluspool-I as a single term. Using the sum of these twoparameters reduces variability (CV of 46% for soilmineral N vs 31% for soil mineral N plus pool-I) andmakes the relationship less susceptible to errorsassociated with residual N from the previous growingseason. Consequently, while this model does not
improve predictive capacity, it should result in a morerobust measure of N availability compared with use ofsoil mineral N alone (Fig. 3).
In the present study, pre-plant soil mineral N in theroot zone (0–30 cm) alone or used in combinationwith a pool of readily mineralizable N (i.e. pool-I as apotentially mineralizable N component) represents thebest predictor of soil N supply. The potentiallymineralizable N components and lab-based measuresof soil N supply, used alone and in the absence ofadditional environmental information, have limitedpotential as predictors of field-based indices of soil Nsupply. Previous studies have identified ultravioletabsorbance of boiling 0.01 M CaCl2 extract at 260 nm(Fox and Piekielek 1984), ultraviolet absorbance of0.01 M NaHCO3 extract at 200 nm (Hong et al.1990), HKCl–NH4 (McTaggart and Smith 1993) andISNT (Williams et al. 2007) as suitable predictors ofsoil N supply. The limited variation in soil texture incomparison to previous studies, and use of non-manured sites, may have contributed to the limitedpredictive potential of these measures. We hypothe-size that further improvements in predictive potentialwill require consideration of environmental condi-tions. While pools of soil mineral N and of readilymineralizable N (i.e. pool-I) can be quantified, a largeproportion of soil N supply is likely contributed bythe larger and less readily mineralizable pool of N(i.e. pool-II). The proportion of pool-II which miner-alizes in any given growing season is likely sensitiveto the environmental (e.g. soil moisture and temper-ature) conditions present.
Acknowledgments Funding was provided by the GAPSprogram of Agriculture and Agri-Food Canada. Technicalassistance was provided by H. Blizzard, G. Decker, D. Janes,M. Levesque, K. Pickering, and K. Terry.
References
Bélanger G, Walsh JR, Richards JE, Milburn PH, Ziadi N(2001) Predicting nitrogen fertilizer requirements ofpotatoes in Atlantic Canada with soil nitrate determina-tions. Can J Soil Sci 81:535–544
Bittman S, Zebarth BJ, Kowalenko CG, Hunt DE (2004) Seasonof year effect on response of orchardgrass to N fertilizer in amaritime climate. Can J Plant Sci 84:129–142
Blake GR, Hartge KH (1986) Bulk density. In: Klute A (ed)Methods of soil analysis. Part 1. 2nd edn. Agron. Monogr.9. ASA and SSSA, Madison, WI, pp 363–375
Campbell CA, Ellert BH, Jame YW (1993) Nitrogen mineral-ization potential in soils. In: Carter MR (ed) Soil sampling
Plant Soil (2007) 301:203–214 213
and methods of analysis. Lewis Publishers, Boca Raton,FL, pp 341–349
Carpenter-Boggs L, Pikul JL Jr, Vigil MF, Riedell WE(2000) Soil nitrogen mineralization influenced by croprotation and nitrogen fertilization. Soil Sci Soc Am J64:2038–2045
Carter MR, MacLeod JA (1987) Biological properties of somePrince Edward Island soils: relationship between microbialbiomass nitrogen and mineralizable nitrogen. Can J SoilSci 67:333–340
Curtin D, Wen G (1999) Organic matter fractions contributingto soil nitrogen mineralization potential. Soil Sci Soc Am J63:410–415
Dahnke WC, Johnson GV (1990) Testing soil for availablenitrogen. In: Westerman RL (ed) Soil testing and plantanalysis. SSSA Inc, Madison, WI, pp 127–139
Delphin JE (2000) Estimation of nitrogen mineralization in thefield from an incubation test and from soil analysis.Agronomie 20:349–361
Deng SP, Moore JM, Tabatabai MA (2000) Characterization ofactive nitrogen pools in soils under different croppingsystems. Biol Fertil Soils 32:302–309
Evans CE (1987) Soil test calibration. In: Brown JR (ed) Soiltesting: sampling, correlation, calibration, and interpreta-tion. SSSA Inc., Madison, WI, pp 23–29
Fox RH, Piekielek WP (1978) Field testing of several nitrogenavailability indexes. Soil Sci Soc Am J 42:747–750
Fox RH, Piekielek WP (1984) Relationships among anaerobi-cally mineralized nitrogen, chemical indexes, and nitrogenavailability to corn. Soil Sci Soc Am J 48:1087–1090
Gee GW, Bauder JW (1986) Particle-size analysis. In: Klute A(ed) Methods of soil analysis. Part 1. 2nd edn. Agron.Monogr. 9. ASA and SSSA, Madison, WI, pp 383–411
Gianello C, Bremner JM (1986a) A simple chemical method ofassessing potentially available organic nitrogen in soil.Commun Soil Sci Plant Anal 17:195–214
Gianello C, Bremner JM (1986b) Comparison of chemicalmethods of assessing potentially mineralizable organicnitrogen in soil. Commun Soil Sci Plant Anal 17:215–236
Gregorich EG, Ellert BH (1993) Light fraction and macro-organic matter in mineral soils. In: Carter MR (ed) Soilsampling and methods of analysis. Lewis Publication,Boca Raton, FL, pp 397–407
Griffin TS, Hesterman OB (1991) Potato response to legumeand fertilizer nitrogen sources. Agron J 83:1004–1012
Hergert GW (1987) Status of residual nitrate–nitrogen soil testsin the United States of America. In: Brown JR (ed) Soiltesting: sampling, correlation, calibration, and interpreta-tion. SSSA Inc, Madison, WI, pp 73–88
Hong SD, Fox RH, Piekielek WP (1990) Field evaluation ofseveral chemical indexes of soil nitrogen availability. PlantSoil 123:83–88
Jalil A, Campbell CA, Schoenau J, Henry IL, Jame YW, Lafond GP(1996) Assessment of two chemical extraction methods asindices of available nitrogen. Soil Sci Soc Am J 60:1954–1960
Khan SA, Mulvaney RL, Hoeft RG (2001) A simple soil testfor detecting sites that are nonresponsive to nitrogenfertilization. Soil Sci Soc Am J 65:1751–1760
Kuo S, Sainju UM, Jellum E (1996) Winter cover croppinginfluence on nitrogen mineralization, presidedress soilnitrate test, and corn yields. Biol Fertil Soils 22:310–317
McTaggart IP, Smith KA (1993) Estimation of potentiallymineralisable nitrogen in soil by KCl extraction. Plant Soil157:175–184
Meisinger JJ (1984) Evaluating plant-available nitrogen in soil-crop systems. In: Hauck RD (ed) Nitrogen in cropproduction. ASA, Madison, WI, pp 391–416
Milburn P, Richards JE, Gartley C, Pollock T, O’Neill H, Bailey H(1990) Nitrate leaching from systematically tiled potato fieldsin New Brunswick, Canada. J Environ Qual 19:448–454
Redman MH, Wigglesworth SA, Vinten AJA (1989) Nitrogendynamics of a leguminous green manure. In: Hansen JA,Henriksen K (eds) Nitrogen in organic wastes applied tosoils. Academic, London, pp 11–24
Schepers JS, Meisinger JJ (1994) Field indicators of nitrogenmineralization. In: Havlin JL, Jacobsen JS (eds) Soiltesting: prospects for improving nutrient recommendations.Vol. Special Publ. 40. SSSA Inc, Madison, WI, pp 31–47
Sharifi M, Zebarth BJ, Burton DL, Grant CA, Cooper JM(2007) Evaluation of some indices of potentially mineral-izable nitrogen in soil. Soil Sci Soc Am J 71:1233–1239
Soper RJ, Huang PM (1963) The effect of nitrate nitrogen inthe soil profile on the response of barley to fertilizernitrogen. Can J Soil Sci 43:350–358
Stanford G (1978) Evaluation of ammonium release by alkalinepermanganate extraction as an index of soil nitrogenavailability. Soil Sci 126:244–253
Stanford G, Smith SJ (1972) Nitrogen mineralization potentialsof soils. Soil Sci Soc Am J 36:465–472
Stanford G, Carter JN, Westermann DT, Meisinger JJ (1977)Residual nitrate and mineralizable soil nitrogen in relation tonitrogen uptake by irrigated sugar beets. Agron J 69:303–308
Voroney RP, Winter JP, Beyaert RP (1993) Soil microbial biomassC and N. In: Carter MR (ed) Soil sampling and methods ofanalysis. Lewis Publication, Boca Raton, FL, pp 277–287
Williams JD, Crozier CR, White JG, Heiniger RW, Sripada RP,Crouse DA (2007) Illinois soil nitrogen test predictssouthern U.S. corn economic optimum nitrogen rate. SoilSci Soc Am J 71:735–744
Willson TC, Paul EA, Harwood RR (2001) Biologically activesoil organic matter fractions in sustainable croppingsystems. Appl Soil Ecol 16:63–76
Zebarth BJ, Paul JW (1997) Growing season nitrogen dynamicsin manured soils in south coastal British Columbia:implications for a soil nitrate test for silage corn. Can JSoil Sci 77:67–76
Zebarth BJ, Milburn PH (2003) Spatial and temporal distribu-tion of soil inorganic nitrogen concentration in potato hills.Can J Soil Sci 83:183–195
Zebarth BJ, Rosen CJ (2007) Research perspective on nitrogenBMP development for potato. Am J Potato Res 84:3–18
Zebarth BJ, Bowen PA, Toivonen PMA (1995) Influence ofnitrogen fertilization on broccoli yield, nitrogen accumu-lation and apparent fertilizer-nitrogen recovery. Can JPlant Sci 75:717–725
Zebarth BJ, Leclerc Y, Moreau G, Gareau R, Milburn PH (2003)Soil inorganic nitrogen content in commercial potato fieldsin New Brunswick. Can J Soil Sci 83:425–429
Zebarth BJ, Leclerc Y, Moreau G, Sanderson JB, Arsenault WJ,Botha E, Wang-Pruski G (2005) Estimation of soilnitrogen supply in potato fields using a plant bioassayapproach. Can J Soil Sci 85:377–386
214 Plant Soil (2007) 301:203–214