Soil Moisture Profile Model for Two-Layered Soil Based on Sharp Wetting Front Approach
9
JOURNAL OF HYDROLOGIC ENGINEERING / MARCH/APRIL 2001 / 141 SOIL MOISTURE PROFILE MODEL FOR TWO-LAYERED SOIL BASED ON SHARP WETTING FRONT APPROACH By Robert Leconte, 1 P.E., and Francois P. Brissette, 2 P.E., Member, ASCE ABSTRACT: A two-layer model for 1D vertical unsaturated flow based on the hypothesis of a sharp wetting front is presented. The model further assumes a uniform pore pressure throughout the wetting zone at any given time during the infiltration and redistribution processes. These assumptions allow to reduce the theoretical Rich- ards equation to an ordinary differential equation that can track average soil moisture in two soil layers behind the wetting front as the front moves downward. The model has been tested on many soil types by comparing results against numerical solutions of the Richards equation. It was shown that the conceptual model was able to represent local infiltration and average upper soil moisture accurately for complex rainfall sequences. Errors in soil moisture estimates never exceeded 0.04 cm 3 /cm 3 , which is the range of field measurement accuracies. Furthermore, as the conceptual model is numerically faster by an order of magnitude over the solution of the Richards equation, its use makes it possible to model spatially distributed infiltration and soil moisture at the watershed scale where soil layering is known to influence the water balance. INTRODUCTION There has been a growing interest over the past decades in the mathematical modeling of the rainfall-runoff process oc- curring in a watershed. The first models that were developed mostly treated watersheds as homogeneous units where hydro- logical processes such as infiltration and overland flow were described by relationships with varying degrees of empiricism. More recently, a trend toward more physically based models that describe the space-time variability of hydrologic processes [e.g., Grayson et al. (1992) and Wigmosta et al. (1994)] has occurred, which is in part, due to the increased availability of remote sensing data sources and the ease of access to powerful desktop computers. Infiltration plays a significant role on the volume of water- shed runoff. A combination of Darcy’s law as applied to un- saturated flow and the equation of continuity, sometimes re- ferred to as the Richards equation, is probably considered the best method available for computing vertical flow of soil mois- ture and infiltration. However, because of the natural spatial variability exhibited by many soils at the field and at the basin scale, the numerical solution of the Richards equation is too complex for practical applications (Corradini et al. 1997). For example, Hills et al. (1989) pointed out that the computer re- sources required to model infiltration at the field scale using the Richards equation was much larger than for modeling ground-water flow at the same scale, especially into dry soils. Perhaps in response to these limitations, conceptual models based on a sharp wetting front approach, such as the Green- Ampt equation (Green and Ampt 1911), which are also derived from a representation of moisture movement using Darcy’s law, have witnessed a revival of interest in watershed hydrol- ogy (Van Mullem 1991; Marcus and Lan 1992; Govindaraju and Kavvas 1993; Smith 1993; Corradini et al. 1994). The original formulation of the Green-Ampt equation was derived to calculate infiltration from a ponded surface into a deep ho- mogeneous soil with a uniform initial water content (Skaggs and Khaleel 1982). However, the basic equation has been ex- 1 PhD, Dept. of Constr. Engrg., Ecole de Technologie Superieure, 1100 Rue Notre-Dame Ouest, Montreal, PQ, Canada H3C 1K3. E-mail: [email protected] 2 PhD, Dept. of Constr. Engrg., Ecole de Technologie Superieure, 1100 Rue Notre-Dame Ouest, Montreal, PQ, Canada H3C 1K3. Note. Discussion open until September 1, 2001. To extend the closing date one month, a written request must be filed with the ASCE Manager of Journals. The manuscript for this paper was submitted for review and possible publication on September 30, 1998; revised May 8, 2000. This paper is part of the Journal of Hydrologic Engineering, Vol. 6, No. 2, March/April, 2001. qASCE, ISSN 1084-0699/01/0002-0141–0149/$8.00 1 $.50 per page. Paper No. 19352. tended to model steady and unsteady rainfall infiltration (Mein and Larson 1973; James et al. 1992), for soil profiles that become denser with depth (Childs and Bybordi 1969; Kim and James 1986), for soils with nonuniform initial water contents (Bouwer 1969), and to account for the formation of a soil crust on the infiltration rate (Rawls et al. 1990). These modifications have made the Green-Ampt equation useful for watershed modeling. A shortcoming of the single-event approach models such as the Green-Ampt equation is in their inability to provide a good approximation of infiltration if the rainfall distribution includes relatively long periods with little or no rainfall (Skaggs and Khaleel 1982). In such cases, soil-water redistribution can af- fect the infiltration process. In order to retain the benefits of using Green-Ampt formulation-type models for practical ap- plications at the watershed scale, conceptual approaches for multirainfall events with commensurate levels of complexity must be incorporated. Models based on the dependence of in- filtration capacity f c on cumulative infiltration depth F (Smith 1982) were developed as extensions of single-event ap- proaches. However these approaches produced an underesti- mation of both f and F as they failed to include the effects of redistribution (Corradini et al. 1997). More appropriate con- ceptual approaches that explicitly track the temporal changes of surface volumetric soil moisture were proposed. For in- stance, Groves (1989) considered the redistribution as a mov- ing piston in which infiltrated water moves downward as a wetting front along with the assumption of an initial uniform moisture content following each rainfall event. Govindaraju and Kavvas (1993) spatially integrated the continuity equation from the soil surface to the wetting front and coupled the re- sulting algebraic equation with the jump condition for the ve- locity of the sharp wetting front (Charbeneau 1989). In both models, the expressions of Brooks and Corey (1964) were used to define the moisture retention curves and the unsatu- rated hydraulic conductivity function. Smith et al. (1993) and Corradini et al. (1994) relaxed the piston wetting front as- sumption by adopting a similarity curve described by an ex- ponential function with a shape factor. Dagan and Bresler (1983) and Ogden and Saghafian (1997) also proposed similar conceptual approaches based on the notion of a wetting front. Although the foregoing approaches produce infiltration es- timates comparable to the ones obtained with the more theo- retical, but more computer-intensive, Richards formulation of soil moisture movement, they cannot deal with soil layering. The presence of a shallow layer of more permeable soil on top of a deep, less permeable soil layer can be a significant factor in the production of excess runoff in agricultural wa- tersheds (James and Kim 1990), in urbanized and in forested
-
Upload
independent -
Category
Documents
-
view
1 -
download
0
Transcript of Soil Moisture Profile Model for Two-Layered Soil Based on Sharp Wetting Front Approach

SOIL MOISTURE PROFILE MODEL FOR TWO-LAYERED SOIL BASED ON
SHARP WETTING FRONT APPROACH
By Robert Leconte,1 P.E., and Francois P. Brissette,2 P.E., Member, ASCE
ABSTRACT: A two-layer model for 1D vertical unsaturated flow based on the hypothesis of a sharp wettingfront is presented. The model further assumes a uniform pore pressure throughout the wetting zone at any giventime during the infiltration and redistribution processes. These assumptions allow to reduce the theoretical Rich-ards equation to an ordinary differential equation that can track average soil moisture in two soil layers behindthe wetting front as the front moves downward. The model has been tested on many soil types by comparingresults against numerical solutions of the Richards equation. It was shown that the conceptual model was ableto represent local infiltration and average upper soil moisture accurately for complex rainfall sequences. Errorsin soil moisture estimates never exceeded 0.04 cm3/cm3, which is the range of field measurement accuracies.Furthermore, as the conceptual model is numerically faster by an order of magnitude over the solution of theRichards equation, its use makes it possible to model spatially distributed infiltration and soil moisture at thewatershed scale where soil layering is known to influence the water balance.
INTRODUCTION
There has been a growing interest over the past decades inthe mathematical modeling of the rainfall-runoff process oc-curring in a watershed. The first models that were developedmostly treated watersheds as homogeneous units where hydro-logical processes such as infiltration and overland flow weredescribed by relationships with varying degrees of empiricism.More recently, a trend toward more physically based modelsthat describe the space-time variability of hydrologic processes[e.g., Grayson et al. (1992) and Wigmosta et al. (1994)] hasoccurred, which is in part, due to the increased availability ofremote sensing data sources and the ease of access to powerfuldesktop computers.
Infiltration plays a significant role on the volume of water-shed runoff. A combination of Darcy’s law as applied to un-saturated flow and the equation of continuity, sometimes re-ferred to as the Richards equation, is probably considered thebest method available for computing vertical flow of soil mois-ture and infiltration. However, because of the natural spatialvariability exhibited by many soils at the field and at the basinscale, the numerical solution of the Richards equation is toocomplex for practical applications (Corradini et al. 1997). Forexample, Hills et al. (1989) pointed out that the computer re-sources required to model infiltration at the field scale usingthe Richards equation was much larger than for modelingground-water flow at the same scale, especially into dry soils.
Perhaps in response to these limitations, conceptual modelsbased on a sharp wetting front approach, such as the Green-Ampt equation (Green and Ampt 1911), which are also derivedfrom a representation of moisture movement using Darcy’slaw, have witnessed a revival of interest in watershed hydrol-ogy (Van Mullem 1991; Marcus and Lan 1992; Govindarajuand Kavvas 1993; Smith 1993; Corradini et al. 1994). Theoriginal formulation of the Green-Ampt equation was derivedto calculate infiltration from a ponded surface into a deep ho-mogeneous soil with a uniform initial water content (Skaggsand Khaleel 1982). However, the basic equation has been ex-
1PhD, Dept. of Constr. Engrg., Ecole de Technologie Superieure, 1100Rue Notre-Dame Ouest, Montreal, PQ, Canada H3C 1K3. E-mail:[email protected]
2PhD, Dept. of Constr. Engrg., Ecole de Technologie Superieure, 1100Rue Notre-Dame Ouest, Montreal, PQ, Canada H3C 1K3.
Note. Discussion open until September 1, 2001. To extend the closingdate one month, a written request must be filed with the ASCE Managerof Journals. The manuscript for this paper was submitted for review andpossible publication on September 30, 1998; revised May 8, 2000. Thispaper is part of the Journal of Hydrologic Engineering, Vol. 6, No. 2,March/April, 2001. qASCE, ISSN 1084-0699/01/0002-0141–0149/$8.001 $.50 per page. Paper No. 19352.
JO
tended to model steady and unsteady rainfall infiltration (Meinand Larson 1973; James et al. 1992), for soil profiles thatbecome denser with depth (Childs and Bybordi 1969; Kim andJames 1986), for soils with nonuniform initial water contents(Bouwer 1969), and to account for the formation of a soil cruston the infiltration rate (Rawls et al. 1990). These modificationshave made the Green-Ampt equation useful for watershedmodeling.
A shortcoming of the single-event approach models such asthe Green-Ampt equation is in their inability to provide a goodapproximation of infiltration if the rainfall distribution includesrelatively long periods with little or no rainfall (Skaggs andKhaleel 1982). In such cases, soil-water redistribution can af-fect the infiltration process. In order to retain the benefits ofusing Green-Ampt formulation-type models for practical ap-plications at the watershed scale, conceptual approaches formultirainfall events with commensurate levels of complexitymust be incorporated. Models based on the dependence of in-filtration capacity fc on cumulative infiltration depth F (Smith1982) were developed as extensions of single-event ap-proaches. However these approaches produced an underesti-mation of both f and F as they failed to include the effects ofredistribution (Corradini et al. 1997). More appropriate con-ceptual approaches that explicitly track the temporal changesof surface volumetric soil moisture were proposed. For in-stance, Groves (1989) considered the redistribution as a mov-ing piston in which infiltrated water moves downward as awetting front along with the assumption of an initial uniformmoisture content following each rainfall event. Govindarajuand Kavvas (1993) spatially integrated the continuity equationfrom the soil surface to the wetting front and coupled the re-sulting algebraic equation with the jump condition for the ve-locity of the sharp wetting front (Charbeneau 1989). In bothmodels, the expressions of Brooks and Corey (1964) wereused to define the moisture retention curves and the unsatu-rated hydraulic conductivity function. Smith et al. (1993) andCorradini et al. (1994) relaxed the piston wetting front as-sumption by adopting a similarity curve described by an ex-ponential function with a shape factor. Dagan and Bresler(1983) and Ogden and Saghafian (1997) also proposed similarconceptual approaches based on the notion of a wetting front.
Although the foregoing approaches produce infiltration es-timates comparable to the ones obtained with the more theo-retical, but more computer-intensive, Richards formulation ofsoil moisture movement, they cannot deal with soil layering.The presence of a shallow layer of more permeable soil ontop of a deep, less permeable soil layer can be a significantfactor in the production of excess runoff in agricultural wa-tersheds (James and Kim 1990), in urbanized and in forested
URNAL OF HYDROLOGIC ENGINEERING / MARCH/APRIL 2001 / 141
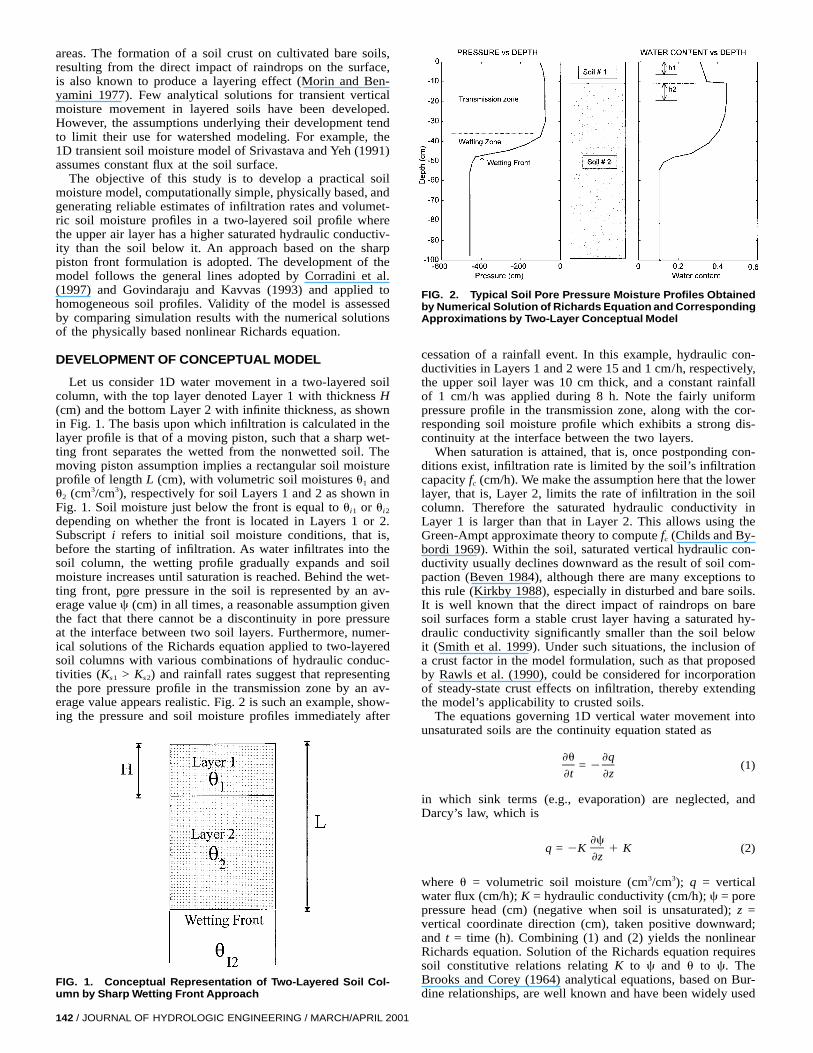
FIG. 1. Conceptual Representation of Two-Layered Soil Col-umn by Sharp Wetting Front Approach
areas. The formation of a soil crust on cultivated bare soils,resulting from the direct impact of raindrops on the surface,is also known to produce a layering effect (Morin and Ben-yamini 1977). Few analytical solutions for transient verticalmoisture movement in layered soils have been developed.However, the assumptions underlying their development tendto limit their use for watershed modeling. For example, the1D transient soil moisture model of Srivastava and Yeh (1991)assumes constant flux at the soil surface.
The objective of this study is to develop a practical soilmoisture model, computationally simple, physically based, andgenerating reliable estimates of infiltration rates and volumet-ric soil moisture profiles in a two-layered soil profile wherethe upper air layer has a higher saturated hydraulic conductiv-ity than the soil below it. An approach based on the sharppiston front formulation is adopted. The development of themodel follows the general lines adopted by Corradini et al.(1997) and Govindaraju and Kavvas (1993) and applied tohomogeneous soil profiles. Validity of the model is assessedby comparing simulation results with the numerical solutionsof the physically based nonlinear Richards equation.
DEVELOPMENT OF CONCEPTUAL MODEL
Let us consider 1D water movement in a two-layered soilcolumn, with the top layer denoted Layer 1 with thickness H(cm) and the bottom Layer 2 with infinite thickness, as shownin Fig. 1. The basis upon which infiltration is calculated in thelayer profile is that of a moving piston, such that a sharp wet-ting front separates the wetted from the nonwetted soil. Themoving piston assumption implies a rectangular soil moistureprofile of length L (cm), with volumetric soil moistures u1 andu2 (cm3/cm3), respectively for soil Layers 1 and 2 as shown inFig. 1. Soil moisture just below the front is equal to ui1 or ui2
depending on whether the front is located in Layers 1 or 2.Subscript i refers to initial soil moisture conditions, that is,before the starting of infiltration. As water infiltrates into thesoil column, the wetting profile gradually expands and soilmoisture increases until saturation is reached. Behind the wet-ting front, pore pressure in the soil is represented by an av-erage value (cm) in all times, a reasonable assumption givencthe fact that there cannot be a discontinuity in pore pressureat the interface between two soil layers. Furthermore, numer-ical solutions of the Richards equation applied to two-layeredsoil columns with various combinations of hydraulic conduc-tivities (Ks1 > Ks2) and rainfall rates suggest that representingthe pore pressure profile in the transmission zone by an av-erage value appears realistic. Fig. 2 is such an example, show-ing the pressure and soil moisture profiles immediately after
142 / JOURNAL OF HYDROLOGIC ENGINEERING / MARCH/APRIL 2001
FIG. 2. Typical Soil Pore Pressure Moisture Profiles Obtainedby Numerical Solution of Richards Equation and CorrespondingApproximations by Two-Layer Conceptual Model
cessation of a rainfall event. In this example, hydraulic con-ductivities in Layers 1 and 2 were 15 and 1 cm/h, respectively,the upper soil layer was 10 cm thick, and a constant rainfallof 1 cm/h was applied during 8 h. Note the fairly uniformpressure profile in the transmission zone, along with the cor-responding soil moisture profile which exhibits a strong dis-continuity at the interface between the two layers.
When saturation is attained, that is, once postponding con-ditions exist, infiltration rate is limited by the soil’s infiltrationcapacity fc (cm/h). We make the assumption here that the lowerlayer, that is, Layer 2, limits the rate of infiltration in the soilcolumn. Therefore the saturated hydraulic conductivity inLayer 1 is larger than that in Layer 2. This allows using theGreen-Ampt approximate theory to compute fc (Childs and By-bordi 1969). Within the soil, saturated vertical hydraulic con-ductivity usually declines downward as the result of soil com-paction (Beven 1984), although there are many exceptions tothis rule (Kirkby 1988), especially in disturbed and bare soils.It is well known that the direct impact of raindrops on baresoil surfaces form a stable crust layer having a saturated hy-draulic conductivity significantly smaller than the soil belowit (Smith et al. 1999). Under such situations, the inclusion ofa crust factor in the model formulation, such as that proposedby Rawls et al. (1990), could be considered for incorporationof steady-state crust effects on infiltration, thereby extendingthe model’s applicability to crusted soils.
The equations governing 1D vertical water movement intounsaturated soils are the continuity equation stated as
u q= 2 (1)
t z
in which sink terms (e.g., evaporation) are neglected, andDarcy’s law, which is
cq = 2K 1 K (2)
z
where u = volumetric soil moisture (cm3/cm3); q = verticalwater flux (cm/h); K = hydraulic conductivity (cm/h); c = porepressure head (cm) (negative when soil is unsaturated); z =vertical coordinate direction (cm), taken positive downward;and t = time (h). Combining (1) and (2) yields the nonlinearRichards equation. Solution of the Richards equation requiressoil constitutive relations relating K to c and u to c. TheBrooks and Corey (1964) analytical equations, based on Bur-dine relationships, are well known and have been widely used

l
u 2 u cr bs = = (3)S Du 2 u cs r
213l
cbK(c) = K (4)s S Dc
or expressed as a function of soil moisture312/l
u 2 urK(u) = K (5)s S Du 2 us r
where s = normalized water content; Ks = saturated hydraulicconductivity (cm/h); cb = Brooks and Corey bubbling pressurehead (cm); us = volumetric water content at saturation(cm3/cm3) or total porosity; ur = residual water content (cm3/cm3); and l = Brooks and Corey pore size distribution index.Rawls and Brakensiek (1985) have developed regression equa-tions to estimate Ks, cb, ur, and l given percent sand and clayof the soil and the soil porosity.
The spatial integration of continuity equation [(1)] over thewetting profile for a two-layer system, assuming that the wet-ting front is located in the bottom layer, gives the depth-in-tegrated continuity equation of the profile
du du dL2 1q = K = (L 2 H) 1 H 1 (u 2 u ) (6)0 i2 2 i2
dt dt dt
where q0 = soil surface infiltration (at z = 0) (cm/h); and Ki2
= hydraulic conductivity in soil Layer 2 corresponding to ui2.The average net downward flux q (cm/h) in the wetting profileis given by the sum of the flux producing the elongation ofthe profile plus the water flux Ki2 as a result of ui2, that is
dLq = K 1 (u 2 u ) (7)i2 2 i2
dt
Note that when the soil is entirely saturated behind the wettingfront, du1/dt and du2/dt are equal to zero and infiltration q0
becomes equal to the average net downward flux as given by(7) with u2 = us2.
Similarly, spatially integrating Darcy’s law over the wettingprofile gives the following equation for the average net down-ward water flux:
L1 c¯q = K(u , u , L) 2 K dz (8)1 2 EL z0
where the average hydraulic conductivity behind the wettingfront is given by
LK(u , u , L) = (9)1 2
H L 2 H1
K (u ) K (u )1 1 2 2
with K1 and K2 (cm/h) computed from (5) using u1 and u2
(cm3/cm3), respectively. Eq. (9) assumes that local flux q any-where inside the wetting front is equal to the net averagedownward flux, in other words, soil moisture can only take upone value at a given time in a given soil layer, which is con-sistent with the rectangular soil moisture profile approach usedhere. Numerical solutions of the Richards equation to two-layer soil systems also support that assumption, as seen, forexample, in Fig. 2.
The integral on the right-hand side of (8) can be related tothe capillary potential at the wetting front S (cm), also knownas the average capillary suction, in the following manner:
L1 c
S = 2 K dz (10)E¯ zK 0s
Govindaraju and Kavvas (1993) provide an analytical expres-sion for the integral on the right-hand side of (10), based on
J
the Brooks and Corey constitutive relationships. Assuming thatthe wetting front is located in bottom Layer 2, (10) becomes
1 cb2 21/l 21/l2 2S = [K s 2 K s ] (11)2 i2 i2 2 2S D¯ 1 1 3lK 2s
where s2 and si2 = normalized water content corresponding tou2 and ui2, respectively.
The depth integrated form of the continuity equation andDarcy’s law are not sufficient to obtain the soil moisture profilebecause there are four unknowns to calculate, namely L, q0,u1, and u2. Two more equations are therefore needed. Recallingthe assumption that the pore pressure is assumed uniformthroughout the wetting profile, the following equation is ob-tained, based on the Brooks and Corey constitutive equation[(3)]:
l l /l1 1 2c u 2 ub1 2 r2¯ ¯c = c ⇒ u = u 1 (u 2 u ) (12)1 2 1 r1 s1 r1 S D S Dc u 2 ub2 s2 r2
Taking the time derivative of (12), and combining the resultingequation with (6)–(8) and (10) gives the following nonlineardifferential equation in terms of u2 and L:
¯du 1 KS2 2¯= q 2 K 2 (13)0F G(l /l )211 2dt M(u 2 u ) 1 (L 2 H) L2 r2
where M is a constant equal tol1
l (u 2 u ) c1 s1 r1 b1M = H (14)S D S Dl /l1 2l (u 2 u ) c2 s2 r2 b2
Under preponding conditions when both u1 and u2 are belowsaturation, all precipitation infiltrates, that is, q0 = r, and thecumulative dynamic infiltration I (cm) is given by
t
I = (r 2 K ) dt = H(u 2 u ) 1 (L 2 H)(u 2 u ) (15)ij 1 i1 2 i2E0
and where subscript j takes the value of 1 or 2 depending onwhere the wetting front is located at a given time. Eqs. (13)and (14), along with (15), can therefore be used to obtain anestimate of u2(t) and L(t). Once u2 is known, u1 can be com-puted with (12).
Note that under the presence of a homogeneous soil, H = 0and M = 0. Eq. (13) reduces to
du 1 KS= q 2 K 2 (16)0F Gdt L L
which is a simplified case of the more general equation de-veloped by Corradini et al. (1997) based on the similaritycurve concept. Therefore, the model can be used when thewetting front is located in the upper soil layer. Adding a sinkterm to (16) would also make it identical to the one-layermodel developed by Govindaraju and Kavvas (1993).
Eqs. (13)–(15) are applicable when the wetting front is lo-cated in the bottom soil layer and when both u1 and u2 arebelow saturation. As more water infiltrates, the wetting profileelongates, and soil moisture in both layers and the correspond-ing average (negative) pore pressure gradually increase untilsaturation conditions are encountered. Because bubbling pres-sure generally becomes more negative with increasing clayfraction and decreasing sand fraction (Rawls and Brakensiek1985), the assumption of a uniform pore pressure in the wet-ting profile entails that the bottom layer behind the wettingfront will always reach saturation before the top soil layer.Under such conditions, a similar set of equations as those pre-sented previously can be written, this time with u2 = us2 anddu2/dt = 0, leading to the following differential equation ap-plicable to Layer 1:
OURNAL OF HYDROLOGIC ENGINEERING / MARCH/APRIL 2001 / 143

du 1 K S1 s2 s2= q 2 K 2 (17)0 s2F Gdt H (L 2 H)
where the capillary potential Ss2 and the average hydraulic con-ductivity are calculated using, respectively, (11) and (9) withK2 replaced by Ks2 and s2 = 1. Since u1 has not reached satu-ration, preponding conditions still prevail such that q0 = r. Eq.(15) with u2 = us2 can therefore be used along with (17) tosolve for u1 and L. Eq. (12), which ties u1 to u2 through theassumption of a uniform pressure distribution, is no longerrequired and would not be applicable here since the bottomlayer is now saturated behind the wetting front. In other words,the assumption of a uniform pressure profile behind the wet-ting front is no longer necessary to obtain the soil moistureprofile given by u1 and u2.
As more water is added to the soil column, Layer 1 even-tually saturates as the average pore pressure reaches cb1, u1 =us1, u2 = us2, du1/dt, and du2/dt = 0. Ponding conditions nowexist, precipitation rate is greater than infiltration capacity fc
(cm/h), and excess runoff is produced such that q0 = fc < r.Therefore from (17) we now have
K Ss s2¯f = q = q = K 1 (18)c 0 sL
where Ks corresponds to the saturated average hydraulic con-ductivity calculated from (9) with K1 and K2 replated by Ks1
and Ks2, respectively. Note that (15) and (18) form the Green-Ampt relations, which when solved, give L and q0. Under suchconditions, soil suction becomes larger than cb1 and the pres-sure profile behind the wetting front may not be uniform. This,again, does not have any consequences on model validity since(12), which assumes a uniform pressure profile, is not used inthe calculations.
The equations describing water redistribution in the soilwhen rainfall ceases or is reduced to r < fc are the same asthose used to determine the wetting profile under rainfall con-ditions. As the upper layer first falls below saturation, its av-erage soil moisture is computed from (17) and correspondingaverage pore pressure c = c1 from (3). The bottom layer isbeing replenished and remains saturated until c falls belowcb2, at which time the entire wetting profile becomes unsatu-rated. Eq. (13) is then used to solve for u2 and u1 is computedusing (12).
As a new rainfall event occurs after a limited period ofredistribution, reinfiltration is generated into a soil with adepth-dependent initial volumetric water content, causing anew, or ‘‘secondary’’ wetting profile to develop if the existingwetting front propagates slowly by comparison with the newfront. The approach proposed by Corradini et al. (1997), whotreated the existing profile as temporarily invariant in the pres-ence of a secondary wetting profile, has been incorporated intoour model.
NUMERICAL EXPERIMENTS
Eqs. (13) and (18) of the two-layer infiltration model weresolved using the classical fourth-order Runge-Kutta (RK-4)method (Chapra and Canale 1985). In the absence of suitablefield data, it was decided to evaluate the performance of thetwo-layer model against numerical solutions of the Richardsequation. Numerical simulation of the Richards equation hasbeen the focus of considerable research (Hills et al. 1989; Ce-lia et al. 1990; Pan and Wierenga 1995). Many variations offinite difference and finite-element methods have been devel-oped, and approaches that use implicit procedure have provento be more CPU-efficient (Haverkamp et al. 1977). In thiswork, we solved the mixed-based formulation of the Richardsequation, also known as the ‘‘modified Picard method’’ (Celia
144 / JOURNAL OF HYDROLOGIC ENGINEERING / MARCH/APRIL 200
TABLE 1. Soil Profiles Used in This Study
Testcase(1)
Soil Profile
Upper layer(2)
Lower layer(3)
1 10-cm sandy loam Clay loam2 10-cm sandy loam Clay loam3 Sandy loam of varying thickness (10 and
50 cm)Clay loam
4 10-cm sand Sandy loam
et al. 1990) using a Crank-Nicolson finite-difference scheme.This approach ensures perfect mass balance while providingaccurate solutions of the equation at reasonable CPU times.The mixed-based formulation of the Richards equation is
u c= K 2 K (19)S D
t z z
Solutions of the conceptual model and of the Richards equa-tion were obtained with various soil textural types and rainfallrates and distributions for two-layer soil profiles. A subsampleof the runs is presented and analyzed in this paper. Tables 1and 2 illustrate the soil profiles, rainfall rates, lower boundary,and initial conditions considered in this study. The correspond-ing soil parameters are shown in Table 3.
As a first series of tests, a soil profile composed of a10-cm layer of a typical sandy loam on top of a thick layer ofclay loam was subjected to simple and complex rainfall pat-terns. These numerical experiments are described in the fol-lowing in Test Cases 1 and 2. The effect of soil layering oninfiltration was investigated and is presented under Test Case3. Numerical experiments involving high- and low-permeabil-ity soils were also conducted in order to gain a better under-standing of the model’s behavior under a variety of situations.One such numerical experiment is summarized under TestCase 4.
All the soil parameters were obtained either from averagevalues tabulated by Rawls et al. (1983) or calculated usingregression equations of Rawls and Brakensiek (1985). It isimportant to point out that the values reported in Table 3should be considered typical values that may show a high de-gree of variability in application (Chow et al. 1988). Averageporosity values are most reliable, varying 15–30% from theaverage value. Hydraulic conductivity values are far less con-sistent, varying by one to two orders of magnitude (James etal. 1992). More reliable infiltration predictions can be expectedif model parameters are obtained from field measurementssince these measurements tend to lump the effect of soil het-erogeneities. Consequently, numerical solutions presented inthis paper can only serve as a means to evaluate the validityof the conceptual two-layer model against the more rigorousRichards equation. They are not indicative of actual field con-ditions.
The finite-difference grid and time steps used in solving theRichards equation were fixed at 1 cm and 30 s, respectively,for all the simulation runs, except for Test Case 1, where timestep was reduced to 20 s to avoid numerical oscillations. Thelower boundary condition was a fixed pressure at a soil depthof 100 cm. All the simulation runs resulted in the position ofthe wetting front well above this boundary. The maximum sur-face pressure head was set to zero (ponding effects were ne-glected). The soil pore pressure was assumed to be initiallyuniform for all the simulation runs. The initial soil moistureprofile in the two-layer conceptual model was calculated usingthe Brooks and Corey normalized water content equation [(3)].This resulted in nonuniform soil moisture profiles for the two-layer soil systems analyzed here. The time step used in theRunge-Kutta method was 60 s. Under these conditions, the
1

TABLE 2. Boundary and Initial Conditions Used in This Study
TABLE 3. Soil Parameters for USGS Soil Classes Based on Soil Texture
Soil type(1)
Total porosity us
(cm3/cm3)(2)
Residual watercontent ur
(cm3/cm3)(3)
Saturated hydraulicconductivity Ks
(cm/h)(4)
Air entry pressure cb
(cm)(5)
Pore sizedistribution index l
(6)
Sand 0.437 0.020 11.78 210 0.69Sandy loam 0.453 0.041 1.09 250 0.40Clay loam 0.464 0.029 0.07 280 0.30
CPU time required to run the two-layer conceptual model forthe numerical experiments reported in this paper was abouteight to 10 times less than for the Richards equation.
MODEL TESTING AND DISCUSSION OF RESULTS
We now evaluate the performance of the two-layer concep-tual model and compare the results with numerical solutionsof the Richards equation. Because solution of the Richardsequation provides soil moisture profiles over the entire wettingzone, representative soil moisture values for the upper andlower soil layer were extracted and compared against the u1
and u2 values computed from the conceptual model. Thesewere calculated as
hi1
u = u(z, t) dz (20)i Ehi 0
where hi corresponds to a sublayer located within the trans-mission zone (Fig. 2).
Test Case 1: Simple Rainfall Sequence
The event is characterized by two periods of rainfall of 7and 4 h, respectively, at a constant rate of 0.8 cm/h, separatedby a 3-h period of no rain, for a total amount of 8.8 cm over14 h (Table 1). The rainfall rates were selected to be betweenthe saturated hydraulic conductivities of the bottom and topsoil layers, thus potentially producing ponded conditions andgenerating rainfall excess for a sufficiently long rainfall event.The soil moisture profile was initially set up at 0.09 and 0.13cm3/cm3, respectively, for upper and lower soils and is closeto the residual water content values. These values correspondto a uniform soil pore pressure c of 210,000 cm.
J
FIG. 3. u-t Curves of Upper and Lower Soil Layers Obtainedwith Richards Equation and Two-Layer Conceptual Model (TestCase 1)
The temporal evolution of soil moisture in the upper andlower soil layers obtained with the conceptual two-layer modelis presented in Fig. 3. Also shown in this figure are averagesoil moisture curves for the wetted profile generated by solvingthe Richards equation. They were computed with (20) by set-ting h1 and h2 to 2 cm. Fig. 3 shows that the correspondencebetween the model and the Richards-generated u-t curves isgenerally good. Soil moisture in the upper soil layer is risingabruptly from 0.09 to 0.3 during the first hour of rainfall, fol-lowed by a more gradual increase as the wetting profile is
OURNAL OF HYDROLOGIC ENGINEERING / MARCH/APRIL 2001 / 145

expanding. After approximately 3.5 h of constant rainfall, thepiston front reaches the bottom layer. Then, soil moisture be-hind the front in the bottom layer rises sharply in a stepwisefashion from 0.13 to 0.437. This behavior is a direct conse-quence of the sharp wetting front approximation and followsfrom the assumption that the soil pore pressure is uniformthroughout the wetting profile. Notice that the curve from theRichards equation also produced a sharp soil moisture increasein the bottom layer; however, it is more gradual because ofthe presence of a distinct wetting zone. Upon entering the bot-tom layer, the downward velocity of the wetting front de-creases because Layer 2 has a much smaller hydraulic con-ductivity than Layer 1. As Layer 2 slows the downwardmigration of the front, water starts to accumulate in the toplayer, as witnessed by the more rapid increase in soil moistureas observed on the model’s generated curve. A similar behav-ior was also noted on the curve produced by the Richardsmodel, but it is much less pronounced. Both the conceptualmodel and Richards equation predict that the bottom layer inthe transmission zone will saturate first. However, the concep-tual model predicts that this will happen sooner (at t = 4.1 hcompared to 5.7 h with the Richards equation), which is againa direct consequence of the assumptions underlying themodel’s structure. As rainfall continues, the conceptual modeland the Richards equation predict an increase in soil moisturein the upper soil layer, however, without reaching saturation.Ponded conditions are never reached during the first rainfallhiatus and all the rainfall infiltrates. The maximum soil mois-ture is 0.430 and 0.429 for the conceptual model and Richardsequation, respectively, and occurred at t = 7 h, which corre-sponds to the time when rainfall ceased.
During the next 3 h, the top layer drains into the bottomlayer, which remains saturated as the wetting profile expands.This behavior predicted by the Richards equation was alsoreproduced by the conceptual model, as shown in Fig. 3. Therate of decrease is similar for both the conceptual model andthe Richards equation. Notice however that the rate as pre-dicted by the Richards equation diminishes gradually, as evi-denced by the exponential shape of the u-t curve. This partic-ular shape was not well reproduced by the conceptual model,where the rate of decrease is approximately constant betweent = 7 and t = 8 h. This was somewhat expected given (17),where H, q0, and Ss2 are constant terms, while the averagehydraulic conductivity, as obtained by (9), and the depth ofthe wetting profile, do not change appreciably with time. Therate of decrease in soil moisture as predicted by the conceptualmodel changes and becomes exponential in shape starting at t= 8 h. At this time both the upper and the lower soil layersare below saturation and the rate of decrease is now governedby (13), where the u2 term on the right-hand side is responsiblefor the observed nonlinearity. A subsequent period of rainfall,starting at t = 10 h, causes the top and bottom soil layersbehind the wetting front to replenish and to produce pondedconditions. Soil infiltration capacity becomes the limiting fac-tor and a function of the depth of the wetting profile L, asshown in (18). Cumulative infiltration is 8.39 and 8.53 cm,respectively, for the two-layer conceptual model and the Rich-ards equation, respectively, and excess rainfall is small with0.61 and 0.47 cm, respectively.
Test Case 2: Complex Rainfall Sequence
The soil profile presented in Case 1 was subjected to therainfall hyetograph shown in Fig. 4. Total precipitation is 10.1cm over a 21-h period. Again, the rainfall event is character-ized by two distinct rain periods. However, rainfall intensitieswere allowed to vary with values initially between K1s and K2s,followed by a period where intensities exceeded the top layer-saturated conductivity.
146 / JOURNAL OF HYDROLOGIC ENGINEERING / MARCH/APRIL 200
FIG. 6. Infiltration Rate and Cumulative Infiltration Curves Ob-tained with Richards Equation and Two-Layer ConceptualModel(Test Case 2)
FIG. 5. u-t Curves of Upper and Lower Soil Layers Obtainedwith Richards Equation and Two-Layer Conceptual Model (TestCase 2)
FIG. 4. Rainfall Hyetograph for Test Case 2
Fig. 5 presents the u-t curves for the top and bottom soillayers for both conceptual and Richards models. Correspond-ing infiltration rates are shown in Fig. 6. The correspondencebetween the u-t curves for the upper soil layer is generallyvery good, with differences in soil moisture values never ex-ceeding 0.02 cm3/cm3. However, significant discrepancies arefound for the bottom soil layer, especially when rainfall inten-sities are low. Here, the Richards equation predicted that themain wetting front would reach the bottom layer after approx-imately 5 h, as compared to 7.5 h for the conceptual model.Low rainfall rates, coupled with initially dry soil conditions,created and maintained an important wetting zone since thecapillary drive at the wetting front was high. This zone, whichis modeled by the Richards equation, is causing the early and
1

FIG. 7. Changes in u-t Curve of Upper Soil Layer Showing Lay-ering Effect (Test Case 3)
gradual rise of soil moisture into the bottom layer. As thewetting zone is not explicitly represented in the soil moistureprofile by the conceptual model, the arrival of the wetting frontis delayed and the rise is sudden. Note in Fig. 5 that anotherwetting front, caused by the second rainfall period, reachedthe bottom layer at approximately the same time, i.e., at t =10.2 and 10.7 h, respectively, for the Richards and conceptualmodels. As the soil moisture below this wetting front was high,the capillary drive at the front was low and the wetting zonewas small. Under these conditions, the conceptual model rep-resented more adequately the more theoretical Richards equa-tion, which explains the better concordance between the twomodels in this case.
The total infiltration calculated by the conceptual model isslightly below that observed using the Richards equation (Fig.6). This behavior, which was also observed in Case 1, is prob-ably related to the sharp wetting front approximation intro-duced in the conceptual model. In that respect, it is worthnoting that steeper infiltration fronts have been produced usingthe Richards equation when hysteresis effects were explicitlyincluded in the modeling scheme (van Dam et al. 1996).Therefore, by their very nature, models based on the sharpwetting front approximation, such as the Green-Ampt equationand our two-layer model presented here, may be partially in-cluding hysteresis effects. Such a hypothesis, of course, wouldneed to be verified through carefully controlled laboratory andnumerical experiments, which is beyond the scope of this pa-per. Nevertheless, including hysteresis effects in the solutionof the Richards equation would reduce the amount of infil-trated water (Hopmans and Dane 1986), possibly lessening thediscrepancy observed in Fig. 6.
Test Case 3: Effect of Soil Layering on Infiltration andSoil Moisture
In addition to its importance to the infiltration and surfacerunoff processes, near-surface soil moisture plays a major rolein partitioning the net radiative forcing between latent and sen-sible heat flux (Entekhabi et al. 1994). Furthermore, as activemicrowaves are sensitive to the presence of soil moisture inthe upper 5–10 cm soil layer (Dubois et al. 1995), hydrolog-ical models that are capable of estimating soil moisture at shal-low depths are required in order to make full use of radarremote-sensing images (Ragab 1995). Soils exhibiting layeringare typically found in urban and in agricultural environments.We tested the sensitivity of the conceptual two-layer model tothe depth of the upper soil layer for various soil types, rainfall
JO
FIG. 8. u-t Curves of Upper and Lower Soil Layers Obtainedwith Richards Equation and Two-Layer Conceptual Model (TestCase 4)
intensities, and upper layer thickness. A detailed descriptionof the results of all these tests is beyond the scope of thispaper. However, suffice it to say here that the thickness of theupper soil layer played an important role in estimating infil-tration, runoff, and soil moisture for moderate to heavy rainfallrates. As a typical example, a two-layer soil made of sandyloam on top of a clay loam was subjected to two pulses ofrainfall, totaling 7.8 cm (Table 2). Two thicknesses were con-sidered for the upper soil layer, namely 5 and 50 cm, and asensitivity analysis was carried out on initial soil moisture con-ditions, with 25% saturation for dry soil and 60% for wet soil.The corresponding u-t curves are presented in Fig. 7. In thatparticular numerical experiment, the wetting front reached thebottom layer when the top layer thickness was set at 5 cm,while it remained in the top layer for the 50-cm case. Thislatter case was therefore identical to a homogeneous one-layersoil condition. As expected, the effect of layering was to in-crease the soil moisture in the upper layer. Moreover, surfacerunoff was generated when the upper soil was shallow, as ev-idenced by two distinct periods where soil moisture reachedsaturation. A total of 2.1 and 0.8 cm of surface runoff, equiv-alent to 27 and 10% of total precipitation, was produced underwet and dry conditions, respectively. In areas where soil lay-ering is known to occur, it is thus important to take into ac-count such a characteristic to adequately partition net rainfallinto infiltration and runoff. One-layer models, such as that ofGovindaraju and Kavvas (1993) will therefore underestimaterunoff.
Test Case 4: Moderate to High-Permeability Soils
A series of numerical experiments were conducted in soilscharacterized by medium- to high-saturated hydraulic conduc-tivities. A typical example is presented in the following, wherea soil profile with a 10-cm sand on top of a thick layer ofsandy loam was used. The soil profile was subjected to a rain-fall pattern characterized by a first rainfall period of 2 h at aconstant rate of 4 cm/h, followed by a 18-h period with norain, and then by a 1-h rainfall at a constant rate of 3 cm/h.Both the conceptual model and the Richards equation pro-duced no runoff. The u-t curves for both models are presentedin Fig. 8. Again, the overall shape of the curves produced bythe two-layer conceptual model are close to the Richardscurves. Although the conceptual model overpredicted soilmoisture during drainage and underestimated it during the wet-ting stages, the discrepancy never exceeded 0.04 cm3/cm3.Moreover, a second wetting phase, starting at t = 20 h, which
URNAL OF HYDROLOGIC ENGINEERING / MARCH/APRIL 2001 / 147

was modeled as a secondary wetting profile evolving down-ward as the main wetting profile is assumed time-invariant(Corradini et al. 1997), was well reproduced by the conceptualmodel. As a means of comparison, curves produced by theconceptual model with the assumption of a single wetting pro-file migrating downward is also shown in the figure. Clearly,the two-layer conceptual model developed here is capable ofhandling complex rainfall sequences. In addition, equally goodresults were obtained in numerical experiments involving lowpermeability soils, making the model suitable for simulatingwater movement for a variety of soil types.
SUMMARY AND CONCLUSIONS
In this study, a conceptual model was developed for mod-eling unsaturated water movement in a two-layered soil. Themajor assumption of the conceptual model is the representa-tion of the downward water movement by a ‘‘piston flow’’ asin the Green-Ampt model. Moreover, the model assumes thatthe soil pore pressure is uniform throughout the wetted profileat any given time during the infiltration and redistribution pro-cesses. These assumptions allow us to reduce the more theo-retical, and highly nonlinear, Richards equation to a singleordinary differential equation that can track average soil mois-ture in the upper and lower soil layers as well as the advanceof the wetting front. Comparison of the model performanceagainst numerical solutions of the Richards equation indicatesthat the model presented here is able to represent local infil-tration and upper soil moisture accurately for complex rainfallsequences with significant periods of redistribution. Somesmall errors were observed between moisture and infiltrationrates estimated by the model and the Richards equation. How-ever, they are within the range of field measurement accuraciesand are probably smaller than the variances induced by thenatural variability of soil properties (Govindaraju et al. 1992).Moreover, total infiltration produced by the model was syste-matically lower than by the Richards equation. These perform-ances make the model presented here a conservative approachfor hydrological modeling and an attractive choice to link withmicrowave remote-sensing data for those watersheds wheresoil layering is known to exist. Finally, the CPU time requiredto run the two-layer conceptual model for the numerical ex-periments reported in this paper were about eight to 10 timesless than for the Richards equation. Additional time savingswould be possible by augmenting the time step of the RK-4method without significantly sacrificing the model’s accuracy.Such savings therefore represent a formidable advantage overthe use of the Richards equation for modeling spatially dis-tributed infiltration in layered soils at the watershed scale.
ACKNOWLEDGMENT
This research was supported by the Natural Science and EngineeringResearch Council of Canada through two individual research grants. Thissupport is gratefully acknowledged.
APPENDIX I. REFERENCES
Beven, K. (1984). ‘‘Infiltration into a class of vertically nonuniformsoils.’’ Hydrological Sci. J., Oxford, England, 29(4), 425–434.
Bouwer, H. (1969). ‘‘Infiltration of water into nonuniform soil.’’ J. Irrig.and Drain. Div., ASCE, 95(4), 451–462.
Brooks, R. H., and Corey, A. T. (1964). ‘‘Hydraulic properties of porousmedia.’’ Hydrology Paper No. 3, Colorado State University, Fort Col-lins, Colo.
Celia, M. A., Bouloutas, E. T., and Zarba, R. (1990). ‘‘A general mass-conservative numerical solution for the unsaturated flow equation.’’Water Resour. Res., 26(7), 1483–1496.
Chapra, S. C., and Canale, R. P. (1985). Numerical methods for engineers,with personal computer applications, McGraw-Hill, New York.
Charbeneau, R. J. (1989). ‘‘Liquid moisture redistribution: Hydrologicsimulation and spatial variability.’’ Unsaturated flow in hydrologic
148 / JOURNAL OF HYDROLOGIC ENGINEERING / MARCH/APRIL 200
modeling: Theory and practice, H. J. Morel-Seytoux, ed., Kluwer, Dor-drecht, The Netherlands, 127–160.
Childs, E. C., and Bybordi, M. (1969). ‘‘The vertical movement of waterin stratified porous material—1. Infiltration.’’ Water Resour. Res., 5(2),446–459.
Chow, V. T., Maidment, D. R., and Mays, L. W. (1988). Applied hydrol-ogy, McGraw-Hill, New York.
Corradini, C., Melone, F., and Smith, R. E. (1994). ‘‘Modeling infiltrationduring complex rainfall sequences.’’ Water Resour. Res., 30(10), 2777–2784.
Corradini, C., Melone, F., and Smith, R. E. (1997). ‘‘A unified model forinfiltration and redistribution during complex rainfall patterns.’’ J. Hy-dro., Amsterdam, 192, 104–124.
Dagan, G., and Bresler, E. (1983). ‘‘Unsaturated flow in spatially variablefields 1. Derivation of models of infiltration and redistribution.’’ WaterResour. Res., 19(2), 413–420.
Dubois, P., van Zyl, J., and Engman, T. (1995). ‘‘Measuring soil moisturewith imaging radars.’’ IEEE Trans. on Geoscience and Remote Sensing,33(4), 915–926.
Entekhabi, D., Nakamura, H., and Njoku, E. G. (1994). ‘‘Solving theinverse problem for soil moisture and temperature profiles by sequen-tial assimilation of multifrequency remotely sensed observations.’’IEEE Trans. on Geoscience and Remote Sensing, 32(2), 438–447.
Govindaraju, R. S., and Kavvas, M. L. (1993). ‘‘Development of an ap-proximate model for unsaturated flow with root water uptake underrectangular profiles assumption.’’ J. Hydro., Amsterdam, 146, 321–339.
Govindaraju, R. S., Or, D., Kavvas, M. L., Rolston, D. E., and Biggar, J.(1992). ‘‘Error analyses of simplified unsaturated flow models underlarge uncertainty in hydraulic properties.’’ Water Resour. Res., 28(11),2913–2924.
Grayson, R. B., Moore, I. D., and McMahon, T. A. (1992). ‘‘Physicallybased hydrologic modeling 1. A terrain-based model for investigativepurposes.’’ Water Resour. Res., 28(10), 2639–2658.
Green, W. H., and Ampt, G. (1911). ‘‘Studies of soil physics, Part I. Theflow of air and water through soils.’’ J. Agric. Sci., 4, 1–24.
Groves, J. R. (1989). ‘‘A practical soil moisture profile model.’’ WaterResour. Bull., 25(4), 875–880.
Haverkamp, R., Vauclin, M., Touma, J., Wierenga, P. J., and Vachaud, G.(1977). ‘‘A comparison of numerical simulation models for one-di-mensional infiltration.’’ Soil. Sci. Soc. Am. Proc., 41, 285–294.
Hills, R. G., Porro, I., Hudson, D. B., and Wierenga, P. J. (1989). ‘‘Mod-eling one-dimensional infiltration into very dry soils. 1. Model devel-opment and evaluation.’’ Water Resour. Res., 25(6), 1259–1269.
Hopmans, J. W., and Dane, J. H. (1986). ‘‘Combined effect of hysteresisand temperature on soil-water movement.’’ J. Hydro., Amsterdam, 83,161–171.
James, W. P., and Kim, K. W. (1990). ‘‘A distributed dynamic watershedmodel.’’ Water Resour. Bull., 26(4), 587–596.
James, W. P., Warinner, J., and Reedy, M. (1992). ‘‘Application of theGreen-Ampt infiltration equation to watershed modeling.’’ Water Re-sour. Bull., 28(3), 623–635.
Kim, W., and James, W. P. (1986). ‘‘A distributed dynamic watershedmodel.’’ Tech. Rep. No. 4, Civ. Engrg. Dept., Texas A&M University,College Station, Tex.
Kirkby, M. (1988). ‘‘Hillslope runoff processes and models.’’ J. Hydro.,Amsterdam, 100, 315–339.
Maidment, D. R., ed. in chf. (1993). Handbook of hydrology, McGraw-Hill, New York.
Marcus, K. B., and Lan, Y. (1992). ‘‘Surface runoff from moving stormusing two-dimensional finite-element diffusion wave approximation.’’Proc., 9th Int. Conf. on Finite Elements in Water Resour., Vol. 2, Com-putational Mechanics Inc., Southampton, England, 737–744.
Mein, R. G., and Larson, C. L. (1973). ‘‘Modeling infiltration during asteady rain.’’ Water Resour. Res., 9(2), 384–394.
Morin, J., and Benyamini, Y. (1977). ‘‘Rainfall infiltration into baresoils.’’ Water Resour. Res., 13(5), 813–817.
Ogden, F. L., and Saghafian, B. (1997). ‘‘Green and Ampt infiltration withredistribution.’’ J. Irrig. and Drain. Engrg., ASCE, 123(5), 386–393.
Pan, L., and Wierenga, P. J. (1995). ‘‘A transformed pressure head-basedapproach to solve Richards’ equation for variably saturated soils.’’ Wa-ter Resour. Res., 31(4), 925–932.
Ragab, R. (1995). ‘‘Toward a continuous operational system to estimatethe root-zone soil moisture from intermittent remotely sensed surfacemoisture.’’ J. Hydro., Amsterdam, 173, 1–25.
Rawls, W. J., and Brakensiek, D. L. (1985). ‘‘Prediction of soil-waterproperties for hydrologic modeling.’’ Watershed management in theeighties, E. B. Jones and T. J. Ward, eds., ASCE, New York, 293–299.
Rawls, W. J., Brakensiek, D. L., and Miller, N. (1983). ‘‘Green-Amptinfiltration parameters from soils data.’’ J. Hydr. Engrg., ASCE, 109(1),62–70.
1

Rawls, W. J., Brakensiek, D. L., Simanton, J. R., and Kohl, K. D. (1990).‘‘Development of a crust factor for a Green-Ampt model.’’ Trans.ASAE, 33(4), 1224–1228.
Skaggs, R. W., and Khaleel, R. (1982). ‘‘Infiltration.’’ Chapter 4, Hydro-logic modeling of small watersheds, C. T. Haan, H. P. Johnson, andD. L. Brakensiek, eds., Monograph No. 5, ASAE, St. Joseph, Mich.,121–166.
Smith, M. B. (1993). ‘‘GIS-based distributed parameter hydrologic modelfor urban areas.’’ Hydrological Processes, England, 7(1), 45–61.
Smith, R. E. (1982). ‘‘Rational models of infiltration hydrodynamics.’’Modeling components of the hydrologic cycle, V. P. Singh, ed., WaterResources Publications, Littleton, Colo., 107–126.
Smith, R. E., Corradini, C., and Melone, F. (1993). ‘‘Modeling infiltrationfor multistorm runoff events.’’ Water Resour. Res., 29(1), 133–144.
Smith, R. E., Corradini, C., and Melone, F. (1999). ‘‘A conceptual modelfor infiltration and redistribution in crusted soils.’’ Water Resour. Res.,35(5), 1385–1393.
Srivastava, R., and Yeh, T. C. J. (1991). ‘‘Analytical solutions for theone-dimensional, transient infiltration toward the water table in ho-mogeneous and layered soils.’’ Water Resour. Res., 27(5), 753–762.
van Dam, J. C., Wosten, J. H. M., and Nemes, A. (1996). ‘‘Unsaturatedsoil-water movement in hysteretic and water-repellent field soils.’’ J.Hydro., Amsterdam, 184, 153–173.
Van Mullem, J. A. (1991). ‘‘Precipitation distributions and Green-Amptrunoff.’’ J. Irrig. and Drain. Engrg., ASCE, 117(6), 944–959.
Wigmosta, M. S., Vail, L. W., and Lettenmaier, D. P. (1994). ‘‘A distrib-uted hydrology-vegetation model for complex terrain.’’ Water Resour.Res., 30(6), 1665–1679.
APPENDIX II. NOTATIONThe following symbols are used in this paper:
fc = infiltration capacity (cm/h);H = thickness of soil top layer (cm);
J
I = cumulative dynamic infiltration (cm);K = hydraulic conductivity (cm/h);K = average hydraulic conductivity behind wetting front (cm/h);Ki = initial hydraulic conductivity (cm/h);Ks = hydraulic conductivity at saturation (cm/h);L = depth of wetted profile (cm);
M = constant (cm);q = vertical water flux (cm/h);q = average net downward water flux in wetting profile (cm/h);
q0 = water flux at soil surface or infiltration (cm/h);r = rainfall rate (cm/h);S = average capillary suction at wetting front (cm);s = normalized water content;t = time (h);z = vertical coordinate direction (cm);c = pore pressure head (cm);c = average pore pressure behind wetting front (cm);
cb = bubbling pressure head (cm);l = pore size distribution index;u = volumetric water content or soil moisture (cm3/cm3);ui = initial soil moisture (cm3/cm3);ur = residual water content (cm3/cm3); andus = water content at saturation (cm3/cm3).
Subscripts
1 = soil top layer (Layer 1); and2 = soil bottom layer (Layer 2).
OURNAL OF HYDROLOGIC ENGINEERING / MARCH/APRIL 2001 / 149