Soil nitrogen status as a regulator of carbon substrate flows through microbial communities with...
14
Soil nitrogen status as a regulator of carbon substrate flows through microbial communities with elevated CO 2 Susan E. Ziegler 1 and Sharon A. Billings 2 Received 20 May 2010; revised 5 November 2010; accepted 17 November 2010; published 4 February 2011. [1] To assess how microbial processing of organic C inputs to forest soils may be influenced by elevated CO 2 and altered N dynamics, we followed the fate of 13 C‐labeled substrates in soils from the Duke Free Air Carbon Enrichment site where differences in soil N status have been imposed by 7 years of N amendments. Heterotrophic respiration and d 13 C of respired CO 2 ‐C and phospholipid fatty acids (PLFA) were measured to track activities of microbial groups and estimate a relative measure of substrate use efficiency (PLFA‐based SUE). Results indicate an increased proportion of fungal and actinomycete activity in elevated CO 2 soils, which varied with substrate. The negative effect of N on vanillin phenolic‐C incorporation into actinomycete PLFA suggests legacies of fertilization can mitigate increased C flow into actinomycetes with elevated CO 2 . Further, the fourfold increase in PLFA‐based SUE for vanillin phenolic‐C in elevated CO 2 soils that received N suggests future enhanced N limitation in elevated CO 2 soils may promote enhanced respiratory loss relative to incorporation of some C‐substrates into microbial biomass. These short‐term incubations did not reveal greater loss of soil organic carbon via respiration or shifts in SUE with elevated CO 2 . However, observed relative increases in activity of actinomycetes and fungi with elevated CO 2 and mitigation of this effect on actinomycetes with N amendments suggests that elevated CO 2 and predicted N limitation may alter the fate of slow‐turnover soil organic matter (SOM) in two competing ways. Investigations need to focus on how these microorganisms may increase slow‐turnover substrate use while possibly enhancing the prevalence of microbial cell wall structures that can serve as precursors of stabilized SOM. Citation: Ziegler, S. E., and S. A. Billings (2011), Soil nitrogen status as a regulator of carbon substrate flows through microbial communities with elevated CO 2 , J. Geophys. Res., 116, G01011, doi:10.1029/2010JG001434. 1. Introduction [2] The long‐term effectiveness of the North American forest carbon (C) sink will depend in part on how the pro- cesses controlling the transformations and fate of soil organic C (SOC) will function in an elevated CO 2 world [Schlesinger and Lichter, 2001; Langley et al., 2009]. Though the mag- nitude of organic matter inputs to the soil profile, the pre- cursors of SOC, may increase in an elevated CO 2 world [Matamala et al., 2003; Lichter et al., 2005; Huang et al., 2007; Pritchard et al., 2008], most C associated with increased litterfall is released as CO 2 relatively soon after its deposition [Schlesinger and Lichter, 2001; Bernhardt et al., 2006]. However, the fate of material remaining in the soil profile for longer time periods with elevated CO 2 is unclear [Billings et al., 2010]. Greater inputs could promote increased SOC formation and stabilization [Hoosbeek et al., 2006], or induce a priming effect that presumably would increase turnover of extant SOC pools by soil microbial communities [Hoosbeek et al., 2006; Carney et al., 2007]. Several studies report altered activities of heterotrophic microorganisms in forest soils with elevated CO 2 [Billings and Ziegler, 2005, 2008; Finzi et al., 2006; Carney et al., 2007; Langley et al., 2009]. Collectively, these studies sug- gest that the degree to which substrate inputs to the soil profile are retained versus mineralized may change in a high CO 2 world: in other words, that the aggregated C use effi- ciency of the microbial communities within a soil profile, perhaps influenced by the chemical composition of microbial biomass itself, may change. [3] Further complicating the complex processes regulat- ing the cycling and fate of SOC, nitrogen (N) availability can drive the response of forest productivity to elevated CO 2 [Oren et al., 2001; Finzi et al., 2007], and in turn impact SOC processes including heterotrophic respiration (R h ) via changes in litterfall and root exudates [Andrews and Schlesinger, 2001; Bernhardt et al., 2006; Pregitzer et al., 2006]. Nitrogen availability also can influence microbial community structure and function directly, with associated effects on SOC cycling and loss [Waldrop et al., 1 Department of Earth Science, Memorial University of Newfoundland, St. John’s, Newfoundland and Labrador, Canada. 2 Department of Ecology and Evolutionary Biology and Kansas Biological Survey, University of Kansas, Lawrence, Kansas, USA. Copyright 2011 by the American Geophysical Union. 0148‐0227/11/2010JG001434 JOURNAL OF GEOPHYSICAL RESEARCH, VOL. 116, G01011, doi:10.1029/2010JG001434, 2011 G01011 1 of 14
Transcript of Soil nitrogen status as a regulator of carbon substrate flows through microbial communities with...
Soil nitrogen status as a regulator of carbon substrate flowsthrough microbial communities with elevated CO2
Susan E. Ziegler1 and Sharon A. Billings2
Received 20 May 2010; revised 5 November 2010; accepted 17 November 2010; published 4 February 2011.
[1] To assess how microbial processing of organic C inputs to forest soils may beinfluenced by elevated CO2 and altered N dynamics, we followed the fate of 13C‐labeledsubstrates in soils from the Duke Free Air Carbon Enrichment site where differences insoil N status have been imposed by 7 years of N amendments. Heterotrophic respirationand d13C of respired CO2‐C and phospholipid fatty acids (PLFA) were measured totrack activities of microbial groups and estimate a relative measure of substrate useefficiency (PLFA‐based SUE). Results indicate an increased proportion of fungal andactinomycete activity in elevated CO2 soils, which varied with substrate. The negativeeffect of N on vanillin phenolic‐C incorporation into actinomycete PLFA suggests legaciesof fertilization can mitigate increased C flow into actinomycetes with elevated CO2.Further, the fourfold increase in PLFA‐based SUE for vanillin phenolic‐C in elevated CO2
soils that received N suggests future enhanced N limitation in elevated CO2 soils maypromote enhanced respiratory loss relative to incorporation of some C‐substrates intomicrobial biomass. These short‐term incubations did not reveal greater loss of soil organiccarbon via respiration or shifts in SUE with elevated CO2. However, observed relativeincreases in activity of actinomycetes and fungi with elevated CO2 and mitigation of thiseffect on actinomycetes with N amendments suggests that elevated CO2 and predictedN limitation may alter the fate of slow‐turnover soil organic matter (SOM) in twocompeting ways. Investigations need to focus on how these microorganisms may increaseslow‐turnover substrate use while possibly enhancing the prevalence of microbial cellwall structures that can serve as precursors of stabilized SOM.
Citation: Ziegler, S. E., and S. A. Billings (2011), Soil nitrogen status as a regulator of carbon substrate flows through microbialcommunities with elevated CO2, J. Geophys. Res., 116, G01011, doi:10.1029/2010JG001434.
1. Introduction
[2] The long‐term effectiveness of the North Americanforest carbon (C) sink will depend in part on how the pro-cesses controlling the transformations and fate of soil organicC (SOC) will function in an elevated CO2 world [Schlesingerand Lichter, 2001; Langley et al., 2009]. Though the mag-nitude of organic matter inputs to the soil profile, the pre-cursors of SOC, may increase in an elevated CO2 world[Matamala et al., 2003; Lichter et al., 2005; Huang et al.,2007; Pritchard et al., 2008], most C associated withincreased litterfall is released as CO2 relatively soon after itsdeposition [Schlesinger and Lichter, 2001; Bernhardt et al.,2006]. However, the fate of material remaining in the soilprofile for longer time periods with elevated CO2 is unclear[Billings et al., 2010]. Greater inputs could promoteincreased SOC formation and stabilization [Hoosbeek et al.,
2006], or induce a priming effect that presumably wouldincrease turnover of extant SOC pools by soil microbialcommunities [Hoosbeek et al., 2006; Carney et al., 2007].Several studies report altered activities of heterotrophicmicroorganisms in forest soils with elevated CO2 [Billingsand Ziegler, 2005, 2008; Finzi et al., 2006; Carney et al.,2007; Langley et al., 2009]. Collectively, these studies sug-gest that the degree to which substrate inputs to the soilprofile are retained versus mineralized may change in a highCO2 world: in other words, that the aggregated C use effi-ciency of the microbial communities within a soil profile,perhaps influenced by the chemical composition of microbialbiomass itself, may change.[3] Further complicating the complex processes regulat-
ing the cycling and fate of SOC, nitrogen (N) availabilitycan drive the response of forest productivity to elevatedCO2 [Oren et al., 2001; Finzi et al., 2007], and in turnimpact SOC processes including heterotrophic respiration(Rh) via changes in litterfall and root exudates [Andrewsand Schlesinger, 2001; Bernhardt et al., 2006; Pregitzeret al., 2006]. Nitrogen availability also can influencemicrobial community structure and function directly, withassociated effects on SOC cycling and loss [Waldrop et al.,
1Department of Earth Science, Memorial University of Newfoundland,St. John’s, Newfoundland and Labrador, Canada.
2Department of Ecology and Evolutionary Biology and KansasBiological Survey, University of Kansas, Lawrence, Kansas, USA.
Copyright 2011 by the American Geophysical Union.0148‐0227/11/2010JG001434
JOURNAL OF GEOPHYSICAL RESEARCH, VOL. 116, G01011, doi:10.1029/2010JG001434, 2011
G01011 1 of 14
2004a, 2004b]. Enhanced N availability, for example, canreduce soil Rh even when forest productivity has beenenhanced by elevated CO2 [Maier and Kress, 2000; Butnoret al., 2003]. It is not clear, however, if these declines in Rh
with N fertilization are driven by changes in autotrophicor heterotrophic activities. Some incubation studies reportRh declines with added N [Agren et al., 2001; Teklay et al.,2007; Billings and Ziegler, 2008], suggesting that alteredheterotrophic activity may be an important driver ofreduced soil CO2 fluxes with enhanced N availabilityobserved in the field.[4] At the longest running elevated CO2 experiment in an
intact forest ecosystem (the Duke Free Air C Enrichment(FACE) site, North Carolina, USA), increases in NPP withelevated CO2 have been sustained since 1999 [Schlesingeret al., 2006]. However, relative increases in soil Rh havedeclined since that time [Bernhardt et al., 2006], suggestingthat soil microbial community function has changed overthe past 10 years. Further, incubation studies indicatereduced Rh in soils receiving N fertilizer months prior tocollection [Billings and Ziegler, 2008], suggesting thatchanges in soil N cycling can regulate Rh in these forestsoils by altering the activity of the soil microbial commu-nity. Gram‐positive bacteria, actinomycetes, and fungiaccess recently formed SOC in these elevated CO2 soils to agreater extent than in control soils, and N fertilizationpromotes the use of recently formed photosynthates byGram‐negative bacteria while reducing that of Gram‐posi-tive bacteria, particularly actinomycetes [Billings andZiegler, 2008]. Overall these results are congruent with theidea that N limitation brought on by elevated CO2 maystimulate fungal and actinomycete activities. If realized, thismechanism could promote degradation of SOC pools typi-cally exhibiting relatively slow turnover times with elevatedCO2 [McCarthy and Williams, 1992; Paul and Clark, 1996;Fierer et al., 2003a].[5] There are obvious challenges associated with experi-
mentally augmenting N limitation in elevated CO2 plots todiscern how soil microorganisms may function in the future.Experimentally lowering soil N levels in field plots is notpossible without extensive manipulation that would greatlyalter the soil structure, chemistry and biology we are inter-ested in studying. Instead, we examine the influence oflegacy effects of years of low‐level N amendments on rel-ative activities of multiple microbial groups to assessmicrobial responses to elevated CO2 with varying degrees ofN limitation. Specifically, we employ the varied N statusresulting from N amendments in these soils and compare Namended versus more severely N limited soils as a way ofunderstanding which microbial groups may experience acompetitive advantage for substrate access in the future,when N limitation with elevated CO2 is predicted to increase[Luo et al., 2004]. By observing how legacy effects of fieldN amendments can govern microbial responses to elevatedCO2, we can develop hypotheses about how future, enhancedN limitation with elevated CO2 will influence the competi-tive advantages of and organic substrate flow through mul-tiple microbial groups.[6] As part of a larger project aimed at understanding
the impact of elevated CO2 and N dynamics on the cyclingand fate of SOC, we address two questions: Does elevated
CO2 and/or N limitation: (1) promote activity of actino-mycetes and fungi, oligotrophic microorganisms moreassociated with the degradation of relatively slow‐turnoverSOC than their more copiotrophic counterparts [Rob et al.,1997; Schroter et al., 2003; Waldrop and Firestone,2004]; and (2) Do these perturbations alter the fate oflabile soil inputs such that the balance between losses ofthese inputs to Rh changes relative to their retention inthe living soil microbial biomass? In earlier works, weaddressed the first question by tracing the distinct d13Csignature of elevated CO2 photosynthate at Duke FACEinto multiple soil microbial groups [Billings and Ziegler,2005, 2008], but because of the lack of a similarly dis-tinct d13C label in control plots we could not draw firmconclusions about the effect of elevated CO2 in the field.By adding 13C labeled substrates to these soils in labora-tory incubations, however, we can design appropriatelycontrolled experiments. Tracking the fate of individualsubstrates commonly encountered by soil microbial com-munities can be advantageous over using labeled litter, inwhich 13C labeling can vary significantly among com-pound classes [Benner et al., 1987; Hayes, 2001]. Thesecond question invokes an exploration of microbial C useefficiency, a parameter notoriously challenging to quantify[Holland and Coleman, 1987; del Giorgio and Cole, 1998;Thiet et al., 2006]. However, we can address associatedquestions by examining how microbial processing ofindividual substrates, proxies for recently formed organiccompounds in a soil, is influenced by elevated CO2 andaltered N status.[7] To address these questions, we followed the fate of
13C‐labeled substrates (glucose and vanillin) added to soilsfrom the Duke FACE site in a series of relatively short‐termincubation experiments. Glucose and vanillin representsubstrates similar to root exudates (glucose) and derivedfrom cellulose and lignin (glucose and vanillin, respec-tively), biomolecules commonly derived from litterfall anddead roots. We assessed activity levels of multiple microbialgroups and their partitioning of added C into Rh‐CO2 versuscomponents of microbial cell walls, which are composed ofseveral compounds known to serve as precursors to rela-tively slow‐turnover soil organic matter [Guggenbergeret al., 1999], and how these activities varied with elevatedCO2 and soil N status. Interpreting data from soil incuba-tions can be challenging because conditions are necessarilydifferent from those in situ, but tracking the fate of 13C‐labeled substrates of varying lability in short‐term incuba-tions permits us to assess the relative abilities of microbialgroups to compete for individual substrates in a controlledenvironment [Waldrop and Firestone, 2004], to observehow substrate inputs are initially processed [Boschker andMiddelburg, 2002; Phillips et al., 2002], and to highlightthe mechanisms determining the degree to which soil inputsare respired versus incorporated into microbial biomass,where it has a chance of being transformed into relativelyslow‐turnover soil organic matter (SOM). Further, suchexperiments can guide the development of hypotheses forfuture studies, when direct observation of altered SOC poolsizes that change slowly over time becomes increasinglymore feasible, and when 13C labels provided in the fieldbecome increasingly incorporated into relatively slow‐
ZIEGLER AND BILLINGS: SOIL C-SUBSTRATE FLOW WITH ELEVATED CO2 G01011G01011
2 of 14
turnover pools and the microbial communities that accessthem.
2. Materials and Methods
2.1. Study Site and Sample Collection
[8] The Duke FACE experiment was established in aloblolly pine (Pinus taeda L.) forest planted in 1983 inOrange County, North Carolina, USA (35°58′N, 79°05′W).Soils at the site possess relatively low fertility, and areclassified as Ultic Hapludalfs (Enon series). Three of theeight, 30 m diameter plots established have been exposedelevated atmospheric CO2 (∼200 ml l−1 above ambientconcentrations) since August 1996; one plot has beenexposed to treatment since July 1994. Further details on thesite are available in several other studies [Andrews andSchlesinger, 2001; Lichter et al., 2005; Finzi et al., 2006;Schlesinger et al., 2006]. Briefly, circular treatment plots aredefined and fumigated with supplemental CO2 via pipes thatextend to the top of the canopy. Control plots are similarlydesigned, but supplied with air through these pipes withambient atmospheric CO2 levels. Since 1998, half of each ofthe eight plots (two of four quadrants) has been fertilizedwith NH4NO3 each spring (11.2 g N m−2 yr−1). This fer-tilization rate represents approximately 10% of the grossrates of N mineralization reported for the top 10 cm of thesoil profile at this site [Zak et al., 2003], and about one orderof magnitude greater than local atmospheric N deposition inboth wet and dry forms (1.37 g N m−2) [Sparks et al., 2008].[9] We collected two soil samples (mineral soil profile,
5 cm diameter, 30 cm deep) from all four quadrants in eachplot, including fertilized and unfertilized halves, of all eightplots in late October and early November 2005. Approxi-mately 99% of this forest’s root biomass is contained withinthe top 30 cm [Matamala and Schlesinger, 2000] and rootbiomass is relatively high in forests such as this in Octoberand November [McClaugherty et al., 1982; Waring andSchlesinger, 1985]. Samples were subsequently shipped incoolers to the University of Kansas for processing. Soilswere sieved (2 mm) and all roots >1 mm in diameterremoved, with soil clinging to roots returned to the soilsamples. The four cores collected from each fertilized andunfertilized half‐plots (two from each quadrant) were pooledto generate one homogenized sample from each plot’s fer-tilized and unfertilized sections, to generate a total of fourhomogenized samples from each treatment: elevated CO2
fertilized plots, elevated CO2 unfertilized plots, controlfertilized plots, and control unfertilized plots. Soils werestored at 4°C, except when being readied for incubationexperiments in the laboratory, for approximately 2 weeks,until processing was completed and incubations commenced.[10] At the time of collection, differences in inorganic N
availability associated with N fertilization were not evident,nor were differences in organic N in bulk soil or SOMfractions separated by size fractionation or hydrolysis(S. Billings, unpublished data, 2008). Known legacies offertilization on soil N status at the time of soil collectioninclude enhanced uptake of photosynthate by Gram‐negativesoil microorganisms, slight but significant declines inactivity of the extracellular enzyme N‐acetyl‐glucosamine,and significant, large increases in urease activity [Billingsand Ziegler, 2008]. Additional influences of N fertilization
at the site on N‐related soil properties include declinesin abundance of some ectomycorrhizal taxa [Parrent andVilgalys, 2007], reduced biomass‐specific rates of rootexudation [Phillips et al., 2009], increased arbuscularmycorrhizal infection rates, and reduced C:N ratios of foliarlitterfall (J. Li et al., unpublished data, 2009). Combined,these results indicate a legacy effect of N fertilization onmicrobially mediated SOM transformations that alters soilN status in complex ways, and that this effect is an importantdriver of belowground activity even when differences ininorganic N availability are undetectable.
2.2. Soil Incubations
[11] We weighed 30 g of field moist soil into ∼1 Lincubation jars, establishing the 5 laboratory replicates foreach soil treatment required for the 5 time points destruc-tively sampled during the time course experiment. To oneset of control replicates we added water to bring the soilsto 60% water holding capacity (WHC, as determinedon sieved samples). Two other sets of replicates received a13C‐labeled substrate as either glucose (1954‰; D‐gluco-se−13C6; Sigma Aldrich) or vanillin (1888‰; vanillin‐ring−13C6; Sigma Aldrich) in deionized water to 60% WHCin order to determine treatment effects on microbial use ofsubstrates with contrasting reactivity. Because the carboxylic‐and methoxy‐C of the vanillin were not 13C‐labeled, initialsteps (decarboxylation and demethoxylation or demethyla-tion) of vanillin degradation will liberate C possessing d13Csignatures that are not distinct from background levels.However, byproducts of the phenolic ring comprising vanillin,which eventually participate in ATP production and metabo-lite generation [Ribbons and Ohta, 1970; Crawford, 1981;Dec et al., 2001], and hence PLFA, were fully labeled with13C. As a result, our approach permits us to test treatmentdifferences in the relative accessibility and fates of both asimple ring C (monosaccharide) and more complex ring C(phenol) from the added glucose and vanillin substrates,respectively. Substrate additions were equivalent to ∼8%of mineralizable SOC (170 mg C gsoil
−1 ), as calculated fromtotal C respired in long‐term incubations presented byBillings and Ziegler [2008]. All additions were mixed wellwith the soil.[12] Jars were then sealed with air‐tight lids equipped
with septa for gas sampling, and two, 14 ml gas sampleswere immediately taken from each jar to establish startingCO2 concentration and isotopic composition in the incuba-tion vessels. One sample was injected into a previouslyevacuated, air‐tight vial (Teledyne Tekmar, Akron, Ohio,USA) for analysis of CO2 concentration. The other samplewas injected into a previously evacuated, air‐tight Exetainer(Labco, Buckinghamshire, England) for analysis of d13C ofCO2. For subsequent time points we destructively sampledone set of soils and immediately froze them at −70°C forPLFA extraction and analyses immediately after gas sam-pling. All incubations were conducted at 22°C. Incubationjars were sampled at time 0, 8, 18, 36 and 60 h for all threetreatments (DI water control, glucose, and vanillin) with theexception of 60 h for glucose amendments; pilot studiesconfirmed that glucose is incorporated into SOC or respiredsignificantly before 60 h in these soils (see below). Thesesamples were frozen until data from pilot studies could be
ZIEGLER AND BILLINGS: SOIL C-SUBSTRATE FLOW WITH ELEVATED CO2 G01011G01011
3 of 14
analyzed to determine the most appropriate time points touse to assess incorporation of labeled substrates into PLFA.[13] We conducted a pilot study, consisting of an initial
time course experiment using soils collected outside of theexperimental rings at the Duke FACE site in September2005, to determine the time points to sample and analyzeduring subsequent soil incubations. This test was conductedto approximate the minimum time required to detect sub-strate 13C in microbial PLFA to avoid significant recyclingof the 13C label and maximize the accuracy of the inter-pretation of these data. Previous studies have indicated boththe significance of recycling of the added 13C‐substrate C tothe interpretation of active microbial groups [Ziegler et al.,2005], and a lag time between microbial uptake of 13C‐substrates and actual mineralization [Thiet et al., 2006]. Wesampled, processed, and incubated soils in the same mannerdescribed above, with a greater number of sampling timepoints during the pilot incubations (0, 4, 12, 24, 48, 72, and120 h) to assess changes in 13C incorporation over time.Results from this pilot study indicated that the substrateswere initially respired within the first 4 and 12 h, and initialincorporation into microbial biomass was detected in thephospholipid fatty acids (PLFA) between 12 and 24 h andbetween 24 and 48 h for the glucose and vanillin, respec-tively. We used these data to guide our choice of final timepoints used to investigate incorporation of glucose (18 h)and vanillin (36 h) in the full experimental incubations.[14] CO2 concentrations were determined via gas chro-
matography (thermal conductivity detector, Varian CP3800,Varian Inc., Walnut Creek, California), and d13C of CO2
was analyzed on a ThermoFinnigan MAT253 mass spec-trometer (ThermoElectron Corporation, Bremen, Germany)in the stable isotope laboratory at the University of Kansas.Soil respiration rates were calculated from CO2 productionat each sampled time point using CO2 concentration data,calculated dry weight of the soil, and the headspace of eachincubation vessel. The quantity of substrate‐C (glucose orvanillin‐phenolic ring) respired at each time point wasdetermined from the d13C of CO2 respired in the
13C‐labeledincubations and the DI controls, the d13C of the addedsubstrate, and the quantity of CO2‐C respired using:
substrate� derived CO2 ¼ �gCrespg
*�13ClabelCO2 � �13CdiCO2
�13Clabel � �13CdiCO2ð1Þ
where the first term represents the quantity of CO2‐Crespired during the specified time interval per gram soil,d13ClabelCO2 is the d13C of CO2‐C respired from incubatingsoils receiving either glucose or vanillin additions, d13CdiCO2
is the d13C of CO2‐C respired from incubating soilsreceiving deionized water only, and d13Clabel is the d13C ofglucose or vanillin added.[15] The substrate‐C respired as a percent of total respi-
ration (R) was calculated using:
Substrate� C respired as%of total R ¼ Rsubstrate
R*100 ð2Þ
where Rsubstrate refers to the quantity of CO2‐C derived fromglucose or vanillin phenolic‐C as defined in equation (1)and R is the total CO2 evolved at the final time point forthe soil incubation.
[16] To assess whether our substrate additions stimulatedthe respiration of extant SOC we compared respiration ofSOC across all three substrate treatments (deionized watercontrol, glucose, and vanillin). The respiration of extantSOC in the glucose and vanillin amended soils was calcu-lated as the difference between the total CO2‐C respired andsubstrate‐C respired in these incubations, while the totalCO2‐C respired in the deionized water control incubationswas assumed to be respiration of extant SOC.
2.3. Phospholipid Fatty Acid Analyses
[17] Frozen soil samples collected as part of the incuba-tion experiments were transported to the University ofArkansas for phospholipid fatty acid (PLFA) analyses.Samples were freeze‐dried and extracted within 2 weeksof collection using a modified Bligh‐Dyer method [Pinkartet al., 1998; White and Ringelberg, 1998] and subsequentlyfractionated into neutral lipids, glycolipids, and phospholi-pids using solid phase extraction [Dobbs and Findlay, 1993;White and Ringelberg, 1998]. Phospholipids were saponi-fied and PLFAs transmethylated into their correspondingfatty acid methyl esters (FAMEs) according to Findlay[2007]. The resulting FAMEs were purified using reverse‐phase solid phase extraction according to Findlay andDobbs [1993]. FAMEs were quantified using a gas chro-matograph with a flame ionization detector (GC‐FID; Agi-lent 6890). Samples were also analyzed to identify eachFAME using the same GC interfaced with a mass selectivedetector (Agilent 5973inert). Identification was based onretention time and mass spectra of known standards inaddition to direct comparison of mass spectra to a NISTdatabase. PLFA sample recovery was determined fromphospholipid recovery standards (phosphatidylcholine de-heptadecanoyl, and phosphatidylcholine nonadecanoyl;Avanti Lipids, Alabaster, AL, USA).[18] Phospholipid fatty acids provide a means of sepa-
rating microbial communities into biogeochemically rele-vant components; here they were employed to track relativedifferences in the activities of these broadly defined groups.Functional group separation, rather then phylogenetic sep-aration, was the ultimate goal in this study. As such, weassessed the quantities and activity levels of Gram‐positivebacteria, Gram‐negative bacteria, actinomycetes (a specificgroup of Gram positive bacteria important for SOC trans-formations), and fungi. Terminally branched PLFA andmonounsaturated PLFA were used to investigate substrateincorporation into Gram positive and Gram negative organ-isms, respectively [Ringelberg et al., 1989; Zelles et al.,1992; White et al., 1996]. Because previous work demon-strated the importance of discerning relative activity levels ofactinomycetes and fungi [Billings and Ziegler, 2005, 2008],we used 10Me18:0 and 18:1w9 + 18:2w6 to investigatethe role of these two groups, respectively [Federle, 1986;Frostegärd and Bääth, 1996]. The PLFA 18:1w9 and18:2w6 were assessed separately because 18:1w9, thoughcommon in fungi, may also be found in bacteria [Frostegärdet al., 1993a; Frostegärd and Bääth, 1996; Olsson, 1999].Here 18:1w9 is only used to corroborate the results for18:2w6, which is a more specific biomarker for fungi in soil.Further, we used the sum of 16:0 and 18:0 as a means totrack substrate C into the general microbial community, andrefer to this sum as the “general” microbial grouping.
ZIEGLER AND BILLINGS: SOIL C-SUBSTRATE FLOW WITH ELEVATED CO2 G01011G01011
4 of 14
[19] Stable C isotopic composition of individual FAMEswas determined using an Agilent 6890 GC coupled to astable isotope ratio mass spectrometer (Thermo FinniganDelta+) via a combustion interface (Thermo Finnigan GC/CIII; GC‐C‐IRMS). The same GC column, injector, flowand oven parameters used for the quantification and iden-tification of PLFA via GC‐FID and GCMS were employedfor the GC‐C‐IRMS analyses. A standard mixture of fourphospholipids, each with fatty acid moieties that were pre-determined for d13C, was used to correct each fatty acid forthe addition of the methyl C by mass balance [Silfer et al.,1991; Abrajano et al., 1994]. d13C values were measuredrelative to high purity, reference gas standards expressedrelative to international standard PDB (Pee Dee Belemnite).Accuracy, determined from a working standard of 8 satu-rated fatty acids, ranged between 0.1 and 0.4 ‰ and pre-cision for FAMEs analyzed were determined from triplicateinjections of samples, and ranged between 0.2 and 0.6 ‰.[20] Substrate‐C incorporation into individual PLFA was
calculated as:
Substrate derived PLFAC ¼ �gPLFA� C
g
*�13Clabel�PLFA � �13Cdi�PLFA
�13Clabel � �13Cdi�PLFAð3Þ
where the first term represents the quantity of an individualPLFA in mg C at the final time interval per gram soil,d13Clabel‐PLFA is the d13C of the individual PLFA at the finaltime interval in soil receiving either glucose or vanillinadditions, d13Cdi‐PLFA is the d13C of an individual PLFA atthat same final time interval but in soil receiving deionizedwater only, and d13Clabel is the d13C of glucose or vanillinadded. Slight negative values for this measure could beencountered when no significant incorporation of substrateoccurs due to the variation in the d13C of PLFA from thetreatment and DI controls. The substrate‐derived PLFA‐Cwas calculated for all individual PLFA that could beresolved isotopically as well as groups of PLFA represent-ing Gram negative and Gram positive organisms, and gen-eral and total PLFA. The calculation for groups wasaccomplished by summing the substrate‐derived PLFA‐Cfor each individual PLFA representing that group.[21] The calculated substrate‐derived PLFA‐C was used
to estimate relative substrate use among the broadly definedmicrobial groups by calculating the substrate‐derived C inan individual PLFA as a percent of total PLFA‐C derivedfrom the substrate as determine from the summation ofsubstrate‐derived C in all PLFA resolved:
Substrate derived C as% total PLFA
¼ substrate derived PLFACindividualPsubstrate derived PLFACindividual
*100 ð4Þ
where substrate derived PLFA Cindividual represents thequantity of glucose or vanillin phenolic‐C incorporated intoan individual PLFA and the summation is that for all PLFAresolved isotopically from the soil sample. This measure ofthe relative substrate‐C incorporation was used to determinepotential shifts in the composition of the active microbialcommunity with elevated CO2 or N fertilization.
[22] To assess potential differences in the efficiency withwhich soil microbial communities incorporated substrate‐Cinto microbial biomass, we calculated a PLFA‐based proxyfor substrate use efficiency (PLFA‐based SUE):
PLFA� based SUE
¼P
substrate derived PLFACindividualPsubstrate derived PLFACindividual þ substrate derived CO2
*100 ð5Þ
where the summation is that for all PLFA resolved isoto-pically in the soil and substrate‐derived CO2 (equation (1))for either glucose‐ or vanillin phenolic‐C. PLFA‐based SUEis not an absolute measure of substrate use efficiency,because we consider only one class of biomolecule (PLFA),and potential recycling of the added substrate precludes usfrom accurately obtaining total microbial substrate‐C use.However, because PLFA provides a robust measure of com-munity composition and relative estimates of biomass [Whiteand Findlay, 1988; Tunlid and White, 1992; Zelles et al.,1992; Frostegärd et al., 1993b; Frostegärd and Bääth,1996], PLFA‐based SUE is a useful means of assessingresponses of relative SUE to experimentally imposed variationin CO2 and N dynamics.
2.4. Statistical Analyses
[23] Rates of soil respiration were tested to determine ifthe substrate additions themselves, in addition to the ele-vated CO2 and N amendment, affected soil communityrespiration, using a generalized linear model (GLM[Lindsey, 1997]; JMP 7.1; SAS; Cary, North Carolina).A subsequent pair of GLMs were conducted to test the twoseparate substrate amendments (glucose and vanillin) rela-tive to the respective DI‐control, to determine which sub-strates were responsible for the overall model substrateeffect on soil respiration. We tested for the effect of sub-strate addition on the respiration of extant SOC, the effectsof CO2 and N fertilization, and the interaction of elevatedCO2 and N addition on the relative substrate incorporationinto individual and groups of PLFA using GLM as well. Itis important to note that statistical tests of N amendmentson microbial function assess the combined influence of alllegacy effects of fertilization on soil N status describedabove, not the effect of variation in inorganic N avail-ability, which did not vary with treatment at the time ofsoil collection.[24] For each of the tests described, chi‐square (c2) sta-
tistics from analysis of deviance within the framework of theGLM were used to assess significance of treatment effectsand, where appropriate, their interactions. We checkedassumptions of homogeneous and normal errors for eachGLM [Lindsey, 1997] by plotting residuals versus fits, andby plotting residuals as probability plots. In cases whereassumptions were violated, a GLM entailing the samestructural model but with a different error structure wasused. The exponential error distribution produced acceptableresiduals in those cases where normal error assumptionswere violated. The exponential distribution is a special caseof the gamma distribution, and like the gamma distributionits effect is to reduce the weight given to observationsexhibiting greater error [Lindsey, 1997]. In the GLMs using
ZIEGLER AND BILLINGS: SOIL C-SUBSTRATE FLOW WITH ELEVATED CO2 G01011G01011
5 of 14
the exponential error distribution (12 out of 44 total), thedeviance residual by predicted plot was assessed to deter-mine if the assumptions of the model were met before c2
and p values were calculated and used [Hoffmann, 2004].All GLMs were calculated using JMP 7.1 (SAS; Cary,North Carolina). All analyses employed an alpha level of0.05.
3. Results
3.1. Soil Respiration and the Influence of AddedSubstrates
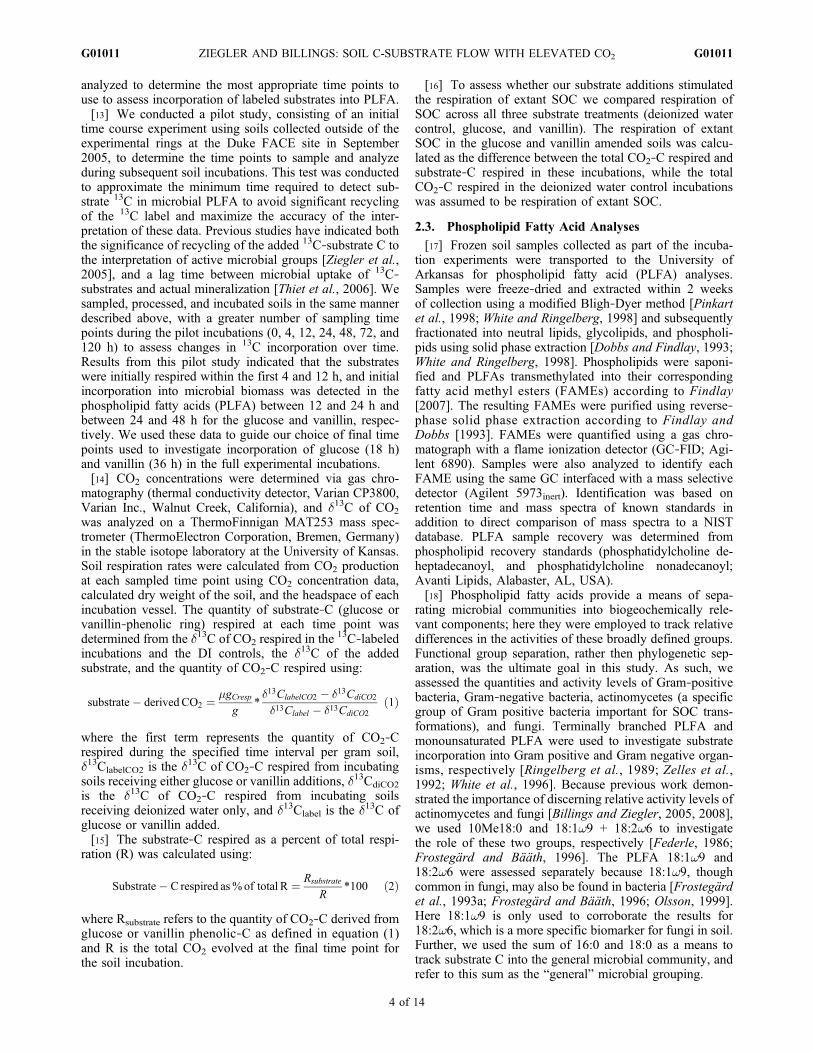
[25] Substrate treatment (S) had a significant effect onrates of soil respiration; no other factor significantly affectedsoil respiration in these experiments. Specifically, glucoseamended soils exhibited significantly higher respiration
rates relative to the DI controls for the same incubationperiod (Figure 1a). This effect was not observed in vanillinamended soils, for which respiration rates were not signifi-cantly different from DI control soils (Figure 1b).[26] We observed a significant S (c1,16
2 = 55.27, p <0.0001) and N (c1,16
2 = 4.25, p = 0.0392) effect on substrate‐C respired as a percent of total respiration in the substrateamended soils. Respired glucose‐C represented between 57and 63% of total respiration in the glucose amended soilswhile vanillin phenolic‐C respired only represented between11 and 15% of the total respired CO2 in the vanillinamended soils. Further, substrate‐C respired during the in-cubations, regardless of substrate type, was significantlylower in the fertilized soils relative to unfertilized soils(c2,36
2 = 4.25, p = 0.0394), consistent with the lower con-centrations of PLFA detected in the fertilized soils.[27] We observed no significant effect of S, CO2, or N on
estimates of respiration derived from the extant SOC (total Rminus substrate‐C respired). Rates of extant SOC respirationranged from 1.0 to 1.5 mg CO2‐C g soil−1 h−1 in the glucoseincubations, and from 0.7 to 1.4 mg CO2‐C g soil−1 h−1 inthe vanillin incubations, and were both comparable to ratesobserved in the deionized water control soils (1.1 to 2.2 mgCO2‐C g soil−1 h−1).
3.2. Soil Phospholipid Fatty Acids and theIncorporation of Substrates
[28] Total phospholipid fatty acid concentration in all soilsranged from 58 to 89 nmol PLFA g soil−1 and exhibited asignificant (c1,12
2 = 5.2; p = 0.0224), negative N effect (meanvalues of 60 and 85 nmol PLFA g soil−1 for the fertilizedand unfertilized soils, respectively), consistent with otherstudies attributing such responses to competitive interactions[Parrent et al., 2006; Parrent and Vilgalys, 2007] and rel-ative reductions in soil C availability [Waldrop et al., 2004a,2004b; Hogberg et al., 2007]. There were 25 individualPLFA detected and quantified in all samples. Functionalgroups investigated include eight Gram‐positive bacterialPLFA (ia15:0, ia16:0, ia17:0, 10Me17:0, 10Me18:0), eightGram‐negative bacterial PLFA (16:1w7, three separate 16:1PLFA where the monounsaturation point was not clearlyidentified, cy17:0, 18:1w7, 18:1w5, cy19:0), one fungalPLFA (18:2w6), two actinomycete PLFA (10Me17:0 and10Me18:0), and one PLFA associated with fungi and, to alesser extent, Gram‐negative bacteria (18:1w9). No signifi-cant differences in PLFA composition (weight % Gram‐negative bacteria, Gram‐positive bacteria, fungi, ratio ofbacteria/fungi) were observed with any treatment in thesesoils, except for weight % of 10Me18:0 which exhibited asignificant, positive N fertilization effect (c1,12
2 = 17.5; p <0.0001).[29] We resolved the C isotopic composition of six of the
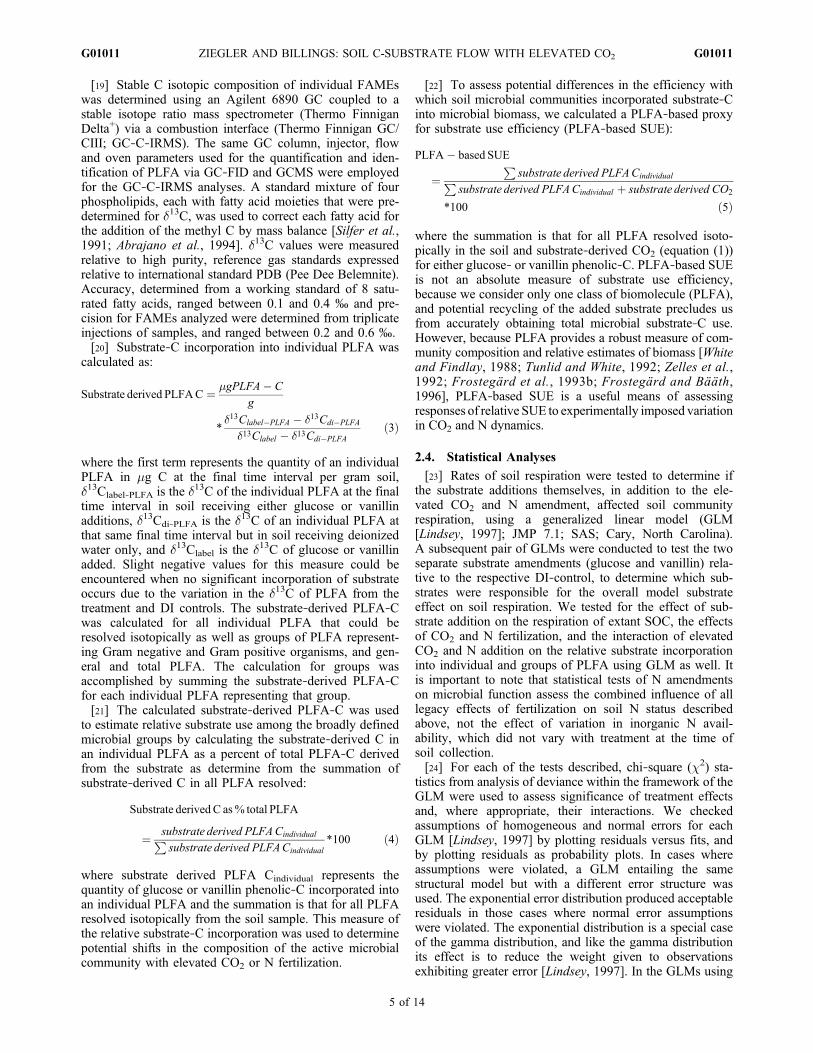
eight Gram‐positive and six of the eight bacterial PLFAdetected, the fungal PLFA, one actinomycete PLFA,18:1w9, and the two PLFA assigned to the general group(16:0 and 18:0). Glucose and vanillin amendments wereboth incorporated into these PLFA. We observed significantS, N and S*N effects on substrate‐C incorporation into thetotal soil PLFA pool. Across the total PLFA pool, incor-poration of glucose‐C was greater than vanillin phenolic‐C(Figure 2). Incorporation of glucose‐C exhibited a signifi-cant increase in the fertilized soils. This effect was not
Figure 1. Rates of respiration (mg C g soil−1) obtained for(a) 18 h soil incubations with (glucose, striped bars) and with-out (control, solid bars) glucose additions and (b) 36 h soilincubations with (vanillin, striped bars) and without (control,solid bars) vanillin additions. Values are provided as means(n = 4) ± one standard deviation. Substrate level (S), as deio-nized water (DI) control, glucose, and vanillin, had a signif-icant effect (c2,50
2 = 38.6, p < 0.0001). Glucose amended soilsexhibited a significantly higher respiration rate relative to theDI controls (c1,22
2 = 8.16, p = 0.0190) whereas vanillinamended soils were not significantly different from therespective DI control soils (c1,22
2 = 0.003, p = 0.4839).
ZIEGLER AND BILLINGS: SOIL C-SUBSTRATE FLOW WITH ELEVATED CO2 G01011G01011
6 of 14
significant for vanillin phenolic‐C incorporation into thetotal PLFA pool.[30] Incorporation of substrate‐C into PLFA of four
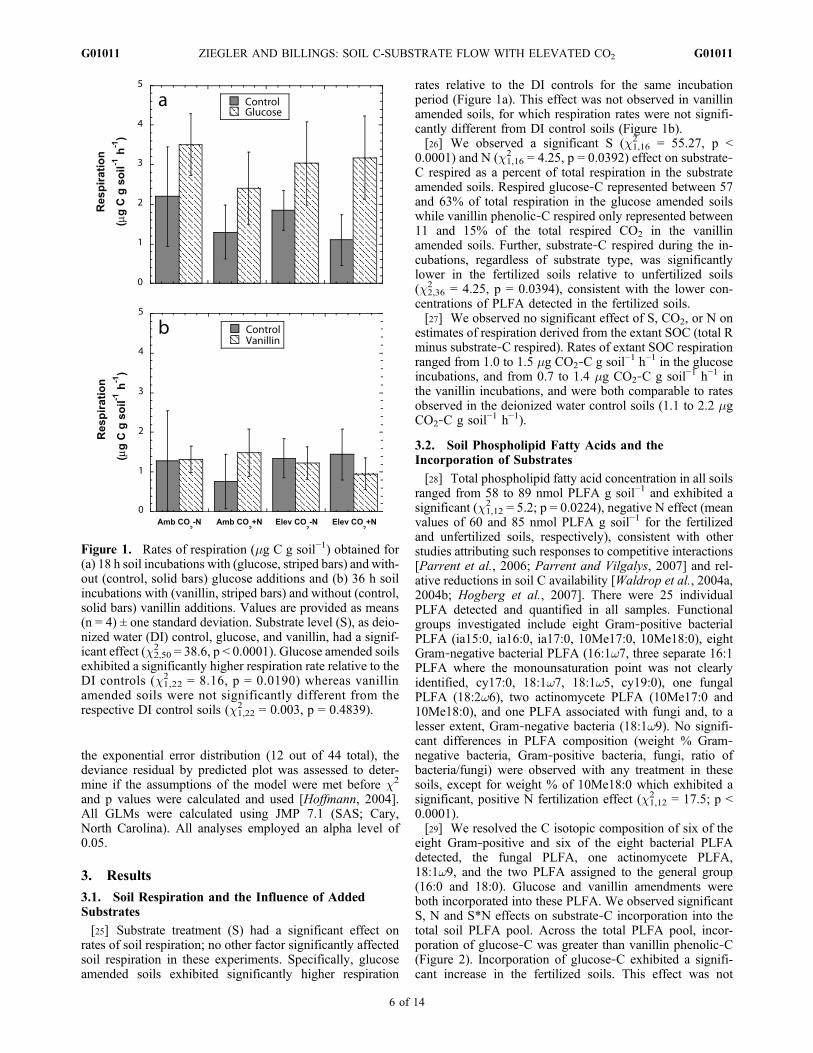
microbial groups (Gram‐negative and Gram‐positive bac-teria, fungi, and actinomycetes), relative to incorporation ofsubstrate‐C total PLFA exhibited a significant S effect(Table 1), with a greater proportion of vanillin phenolic‐Cincorporated into Gram‐negative bacterial PLFA relative toglucose‐C incorporation. The opposite effect occurred in theother groupings (Gram‐positive bacteria, fungi, actinomy-cetes; Figures 3 and 4). Similarly, a significant S effect wasobserved for the relative incorporation of substrate‐C intothe “general” PLFA (c1,22
2 = 17.13; p < 0.0001) such thatgreater incorporation of glucose occurred relative to vanillinphenolic‐C. Elevated CO2 imposed a positive effect of rel-ative substrate‐C incorporation into both actinomycete andfungal PLFA, which varied with substrate (Table 1 andFigure 4). We observed a negative effect of elevated CO2
(c1,222 = 6.43; p = 0.0112) on relative substrate‐C incorpo-
ration into general PLFA biomarkers, an effect that was notsubstrate specific.[31] A significant S*CO2 effect on relative substrate
incorporation into both actinomycete and fungal PLFA18:2w6, and a significant S*N effect on relative substrateincorporation into actinomycete PLFA (Table 1) promptedus to test the effect of CO2 and N on the relative incorpo-ration of the two substrates separately. We observed a sig-nificant, positive effect of elevated CO2 on relative glucose‐C incorporation into the fungal PLFA 18:2w6 (Table 2 andFigure 4b). We also observed a significant, positive effect ofelevated CO2 and a negative effect of N amendments on
relative vanillin phenolic‐C incorporation into actinomycetePLFA (Table 2 and Figure 4c).
3.3. Phospholipid Fatty Acid‐Based Substrate UseEfficiency
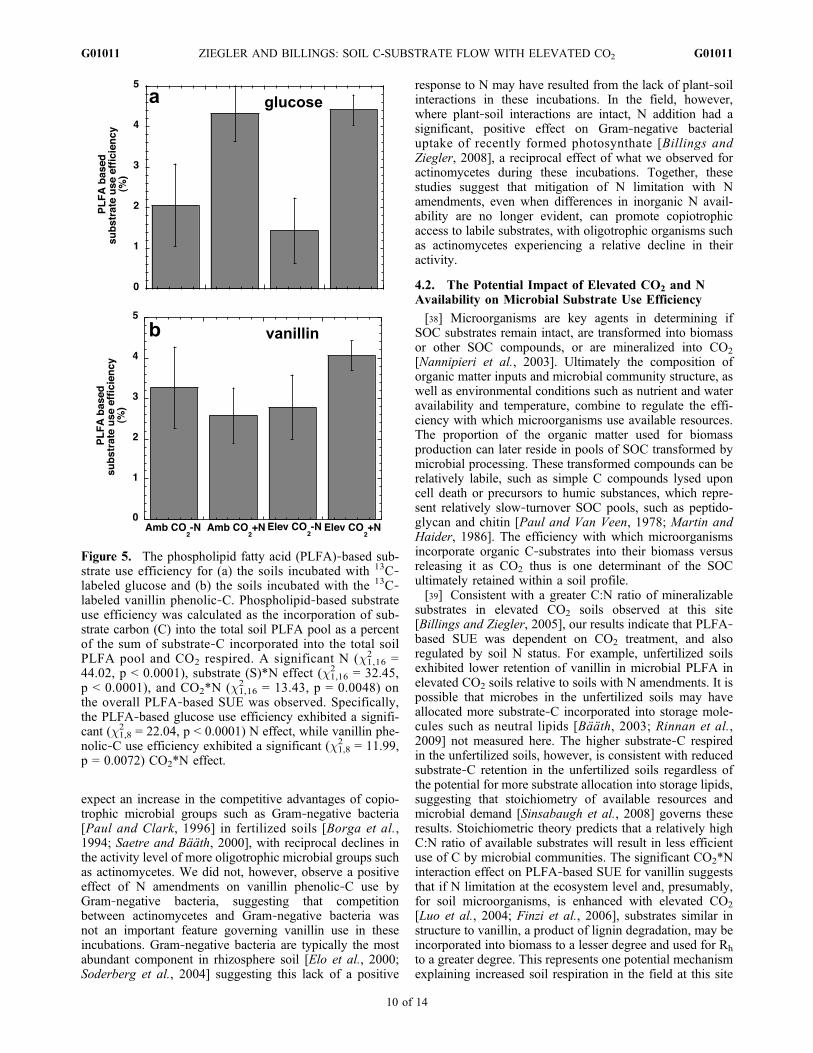
[32] A significant CO2*N effect on PLFA‐based SUE wasobserved for vanillin but not for glucose (c1,8
2 = 1.13, p =0.2887), such that PLFA‐based SUE for vanillin phenolic‐Cincreased by 46% with N fertilization only in the elevatedCO2 soils (Figure 5a). The increase in PLFA‐based SUEwith N treatment was congruent with increased overallsubstrate‐C incorporation into PLFA with N fertilization inthese soils. Further, the significant S*N interaction effect onPLFA‐based SUE was due to the significant increasedglucose PLFA‐based SUE with the field additions ofN which was not observed for vanillin PLFA‐based SUE(c1,8
2 = 0.64, p = 0.4240; Figure 5).
4. Discussion
[33] Because of the challenges of directly observingchanges in the size of SOC pools in situ, the lack of in situ13C labeling in control plots at Duke FACE, and the difficultnature of imposing N limitation in the field, we employed13C tracers in soil ex situ to assess how the activity levels ofmicrobial groups associated with the degradation of SOCpools respond to elevated CO2 and varied soil N status. Byinvoking isotopic labeling in a laboratory setting, we dem-onstrate that both elevated CO2 and the legacies of Namendments can influence the relative activity of soilmicrobial groups. These effects, in turn, influence incorpo-ration of some organic C‐substrates into microbial PLFAand, presumably, microbial biomass more generally. Thusaltering the opportunity for the formation of relatively sta-bilized SOM through biomass generation versus respiratoryloss. We have previously employed the distinct 13C signa-
Figure 3. The proportion of glucose‐derived (solid bars)and vanillin phenolic derived C (striped bars) in Gram neg-ative bacteria (gram −) and Gram positive bacteria (gram +)as a percent of total substrate‐C incorporated in the total ofall PLFA exhibiting a significant substrate (S) effect (c2,50
2 =8.2; p = 0.03835 and c2,50
2 = 55.5; p < 0.0001, respectively).There was no significant effect of elevated CO2 or N addi-tion. Values are means (n = 16) of all four treatments±onestandard deviation.
Figure 2. Incorporation of glucose carbon (C) and vanillinphenolic‐C into the total soil phospholipid fatty acid (PLFA)pool in ambient CO2 soils without added nitrogen (AmbCO2 −N) and with added nitrogen (Amb CO2 +N), elevatedCO2 soils without added nitrogen (Elev CO2 −N) and withadded nitrogen (Elev CO2 +N). Values are means (n = 4)±one standard deviation. Significant substrate (S; c1,23
2 =36.9; p < 0.0001), N (c1,23
2 = 6.6; p = 0.0343) and S*N(c1,23
2 = 6.5; p = 0.0362) effects on substrate‐C incorpora-tion into the total soil PLFA pool were observed with incor-poration of glucose‐C into the total PLFA pool havingexhibited a significant (c1,11
2 = 3.908; p = 0.0315) increasewithin the fertilized soils.
ZIEGLER AND BILLINGS: SOIL C-SUBSTRATE FLOW WITH ELEVATED CO2 G01011G01011
7 of 14
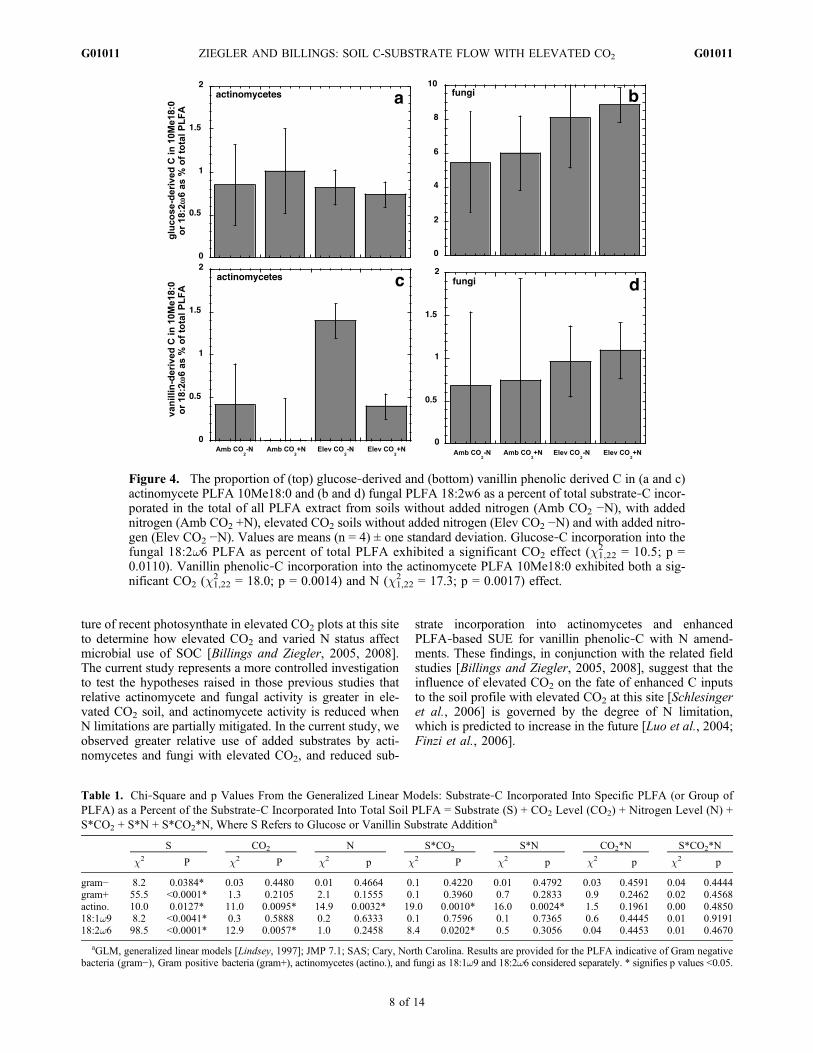
ture of recent photosynthate in elevated CO2 plots at this siteto determine how elevated CO2 and varied N status affectmicrobial use of SOC [Billings and Ziegler, 2005, 2008].The current study represents a more controlled investigationto test the hypotheses raised in those previous studies thatrelative actinomycete and fungal activity is greater in ele-vated CO2 soil, and actinomycete activity is reduced whenN limitations are partially mitigated. In the current study, weobserved greater relative use of added substrates by acti-nomycetes and fungi with elevated CO2, and reduced sub-
strate incorporation into actinomycetes and enhancedPLFA‐based SUE for vanillin phenolic‐C with N amend-ments. These findings, in conjunction with the related fieldstudies [Billings and Ziegler, 2005, 2008], suggest that theinfluence of elevated CO2 on the fate of enhanced C inputsto the soil profile with elevated CO2 at this site [Schlesingeret al., 2006] is governed by the degree of N limitation,which is predicted to increase in the future [Luo et al., 2004;Finzi et al., 2006].
Figure 4. The proportion of (top) glucose‐derived and (bottom) vanillin phenolic derived C in (a and c)actinomycete PLFA 10Me18:0 and (b and d) fungal PLFA 18:2w6 as a percent of total substrate‐C incor-porated in the total of all PLFA extract from soils without added nitrogen (Amb CO2 −N), with addednitrogen (Amb CO2 +N), elevated CO2 soils without added nitrogen (Elev CO2 −N) and with added nitro-gen (Elev CO2 −N). Values are means (n = 4) ± one standard deviation. Glucose‐C incorporation into thefungal 18:2w6 PLFA as percent of total PLFA exhibited a significant CO2 effect (c1,22
2 = 10.5; p =0.0110). Vanillin phenolic‐C incorporation into the actinomycete PLFA 10Me18:0 exhibited both a sig-nificant CO2 (c1,22
2 = 18.0; p = 0.0014) and N (c1,222 = 17.3; p = 0.0017) effect.
Table 1. Chi‐Square and p Values From the Generalized Linear Models: Substrate‐C Incorporated Into Specific PLFA (or Group ofPLFA) as a Percent of the Substrate‐C Incorporated Into Total Soil PLFA = Substrate (S) + CO2 Level (CO2) + Nitrogen Level (N) +S*CO2 + S*N + S*CO2*N, Where S Refers to Glucose or Vanillin Substrate Additiona
S CO2 N S*CO2 S*N CO2*N S*CO2*N
c2 P c2 P c2 p c2 P c2 p c2 p c2 p
gram− 8.2 0.0384* 0.03 0.4480 0.01 0.4664 0.1 0.4220 0.01 0.4792 0.03 0.4591 0.04 0.4444gram+ 55.5 <0.0001* 1.3 0.2105 2.1 0.1555 0.1 0.3960 0.7 0.2833 0.9 0.2462 0.02 0.4568actino. 10.0 0.0127* 11.0 0.0095* 14.9 0.0032* 19.0 0.0010* 16.0 0.0024* 1.5 0.1961 0.00 0.485018:1w9 8.2 <0.0041* 0.3 0.5888 0.2 0.6333 0.1 0.7596 0.1 0.7365 0.6 0.4445 0.01 0.919118:2w6 98.5 <0.0001* 12.9 0.0057* 1.0 0.2458 8.4 0.0202* 0.5 0.3056 0.04 0.4453 0.01 0.4670
aGLM, generalized linear models [Lindsey, 1997]; JMP 7.1; SAS; Cary, North Carolina. Results are provided for the PLFA indicative of Gram negativebacteria (gram−), Gram positive bacteria (gram+), actinomycetes (actino.), and fungi as 18:1w9 and 18:2w6 considered separately. * signifies p values <0.05.
ZIEGLER AND BILLINGS: SOIL C-SUBSTRATE FLOW WITH ELEVATED CO2 G01011G01011
8 of 14
4.1. Effects of Elevated CO2 and Soil N Statuson Substrate‐C Flow Through the Soil MicrobialCommunity
[34] Our results suggest a greater proportion of glucoseand vanillin phenolic‐C incorporation into actinomycetesand fungi with elevated CO2. It is likely that our isolation ofPLFA prevents us from detecting variations in labeledsubstrate storage in other biomass components [Rinnan andBääth, 2009], but results reported here are congruent withthose from a temperate deciduous forest site where uptake ofcellobiose by soil fungi was enhanced with elevated CO2
[Phillips et al., 2002], as well as incorporation of 13C‐labeled photosynthates in the field at this site [Billings andZiegler, 2005, 2008]. It is unlikely that microbial commu-nities across multiple forests, using varied substrates, wouldexhibit consistent trends in substrate flows through PLFAwith elevated CO2 that were not reflective of more generaltrends in biomass. If we accept the assumption that substrateflow through PLFA is indicative of substrate flows throughmicrobial biomass, this suggests the observed enhancedincorporation of added substrates into actinomycete andfungal PLFA with elevated CO2 is likely indicative ofsubstrate incorporation into whole microbial biomass, assuggested by numerous PLFA studies [Tunlid et al., 1987;Pelz et al., 1997; Abraham and Hesse, 2003]. Further, theseresults have important implications for the future activitylevels of soil microbial groups responsible for processingSOC pools in this forest.[35] Microbial groups preferentially access different pools
of SOM. Gram‐positive bacteria generally access morecomplex C sources, while Gram‐negative bacteria appear touse relatively labile, structurally simpler substrates [Bossioand Scow, 1995; Phillips et al., 2002; Kramer andGleixner, 2008]. More specifically, actinomycetes (onetype of Gram‐positive bacteria) and fungi are relativelyadept at degrading more recalcitrant SOM due both to theenzymes they are capable of producing and their physicalstructure [Rob et al., 1997; Fierer et al., 2003b; Schroteret al., 2003]. Given variation in how these groups of mi-crobes access different pools of SOM, our findings suggest amechanism for enhanced mineralization of relatively slowturnover SOC pools in the future with elevated CO2, con-gruent with an elevated CO2‐induced priming effect sug-gested by several investigators [Xie et al., 2005; Carneyet al., 2007; Langley et al., 2009]. If realized, such an
effect on slow‐turnover SOC would have important impli-cations for SOC mineralization [Kuzyakov et al., 2000;Fontaine et al., 2007] given the large size of slow‐turnoverSOC pools.[36] We did not observe a positive effect of elevated CO2
on incorporation of both substrates into both actinomycetesand fungi, highlighting potential substrate preferences ofthese groups and important deviations from generalizationsabout these groups’ proclivity for relatively slow‐turnoverSOM. For example, glucose additions experienced greaterflow into fungal PLFA with elevated CO2. Similar effectswere not observed for the vanillin phenolic‐C, a substrateoften viewed as less labile than glucose [Bewley andParkinson, 1986] given its conjugated aromatic structure,derivation from the decomposition of lignin, and decom-position by a more limited number of microorganisms rel-ative to glucose. However, fungi are known to take upglucose [Chen and Hampp, 1993; Rinnan and Bääth, 2009].Enhanced incorporation of vanillin phenolic‐C into actino-mycete PLFA with elevated CO2, with no analogous effectobserved for glucose, is consistent with actinomycete use ofrelatively less labile substrates [Rob et al., 1997], particu-larly after it has been transformed into microbial byproducts,including microbial necromass [Ziegler et al., 2005]. Theseresults impart the importance of employing multiple sub-strates when probing microbial community function in lab-oratory settings [Waldrop et al., 2004a; Rinnan and Bääth,2009]. Moreover, they indicate that elevated CO2 can inducediffering effects on the flows of multiple substrates throughdifferent microbial groupings in a forest soil.[37] The negative response of actinomycete incorporation
of vanillin phenolic‐C to N additions observed here,regardless of CO2 level, suggests potential competitiveinteractions between microbial groups in these soils drivenby some feature of soil N status affected by previous fer-tilization. Previous work at the site suggests that N additionsresult in relatively N‐rich organic inputs to the soil profile(J. Li et al., unpublished data, 2009), and greatly enhancedrates in the activity of urease, an extracellular enzymeassociated with N acquisition [Billings and Ziegler, 2008].Such data suggest that one effect of N amendments at thissite has been to enhance soil N cycling; in conjunction withknowledge of the site’s ecosystem‐level N limitation [Orenet al., 2001], they further suggest that microbial communi-ties in nonamended soils are N limited. One might thus
Table 2. Chi‐Square and p Values From the Generalized Linear Models: Glucose‐Carbon (C) Incorporated Into Specific PLFA asPercent of Total PLFA = CO2 Level (CO2) + Nitrogen Level (N) + CO2*N, and Vanillin‐Phenolic C Incorporated Into Specific PLFAas Percent of Total PLFA = CO2 + N + CO2*N
a
CO2 N CO2*N
c2 p c2 p c2 p
Glucose‐C Incorporated Into PLFA (Percent of Total PLFA)action. 1.67 0.1804 0.07 0.4270 1.21 0.2180fungi 10.5 0.0110* 0.78 0.2668 0.03 0.4542
Vanillin‐Phenolic C Incorporated Into PLFA (Percent of Total PLFA)actino. 18.0 0.0014* 17.3 0.0017* 0.57 0.2961fungi 1.79 0.1722 0.20 0.3767 0.02 0.4621
aGLM, generalized linear models [Lindsey, 1997]; JMP 7.1; SAS; Cary, North Carolina. Results are provided for the PLFA specific to actinomycetes(actino.) and fungi as 18:2w6 because they were the groups exhibiting a significant interaction in the full generalized linear model (see bottom of Table 1).* signifies p values <0.05.
ZIEGLER AND BILLINGS: SOIL C-SUBSTRATE FLOW WITH ELEVATED CO2 G01011G01011
9 of 14
expect an increase in the competitive advantages of copio-trophic microbial groups such as Gram‐negative bacteria[Paul and Clark, 1996] in fertilized soils [Borga et al.,1994; Saetre and Bääth, 2000], with reciprocal declines inthe activity level of more oligotrophic microbial groups suchas actinomycetes. We did not, however, observe a positiveeffect of N amendments on vanillin phenolic‐C use byGram‐negative bacteria, suggesting that competitionbetween actinomycetes and Gram‐negative bacteria wasnot an important feature governing vanillin use in theseincubations. Gram‐negative bacteria are typically the mostabundant component in rhizosphere soil [Elo et al., 2000;Soderberg et al., 2004] suggesting this lack of a positive
response to N may have resulted from the lack of plant‐soilinteractions in these incubations. In the field, however,where plant‐soil interactions are intact, N addition had asignificant, positive effect on Gram‐negative bacterialuptake of recently formed photosynthate [Billings andZiegler, 2008], a reciprocal effect of what we observed foractinomycetes during these incubations. Together, thesestudies suggest that mitigation of N limitation with Namendments, even when differences in inorganic N avail-ability are no longer evident, can promote copiotrophicaccess to labile substrates, with oligotrophic organisms suchas actinomycetes experiencing a relative decline in theiractivity.
4.2. The Potential Impact of Elevated CO2 and NAvailability on Microbial Substrate Use Efficiency
[38] Microorganisms are key agents in determining ifSOC substrates remain intact, are transformed into biomassor other SOC compounds, or are mineralized into CO2
[Nannipieri et al., 2003]. Ultimately the composition oforganic matter inputs and microbial community structure, aswell as environmental conditions such as nutrient and wateravailability and temperature, combine to regulate the effi-ciency with which microorganisms use available resources.The proportion of the organic matter used for biomassproduction can later reside in pools of SOC transformed bymicrobial processing. These transformed compounds can berelatively labile, such as simple C compounds lysed uponcell death or precursors to humic substances, which repre-sent relatively slow‐turnover SOC pools, such as peptido-glycan and chitin [Paul and Van Veen, 1978; Martin andHaider, 1986]. The efficiency with which microorganismsincorporate organic C‐substrates into their biomass versusreleasing it as CO2 thus is one determinant of the SOCultimately retained within a soil profile.[39] Consistent with a greater C:N ratio of mineralizable
substrates in elevated CO2 soils observed at this site[Billings and Ziegler, 2005], our results indicate that PLFA‐based SUE was dependent on CO2 treatment, and alsoregulated by soil N status. For example, unfertilized soilsexhibited lower retention of vanillin in microbial PLFA inelevated CO2 soils relative to soils with N amendments. It ispossible that microbes in the unfertilized soils may haveallocated more substrate‐C incorporated into storage mole-cules such as neutral lipids [Bääth, 2003; Rinnan et al.,2009] not measured here. The higher substrate‐C respiredin the unfertilized soils, however, is consistent with reducedsubstrate‐C retention in the unfertilized soils regardless ofthe potential for more substrate allocation into storage lipids,suggesting that stoichiometry of available resources andmicrobial demand [Sinsabaugh et al., 2008] governs theseresults. Stoichiometric theory predicts that a relatively highC:N ratio of available substrates will result in less efficientuse of C by microbial communities. The significant CO2*Ninteraction effect on PLFA‐based SUE for vanillin suggeststhat if N limitation at the ecosystem level and, presumably,for soil microorganisms, is enhanced with elevated CO2
[Luo et al., 2004; Finzi et al., 2006], substrates similar instructure to vanillin, a product of lignin degradation, may beincorporated into biomass to a lesser degree and used for Rh
to a greater degree. This represents one potential mechanismexplaining increased soil respiration in the field at this site
Figure 5. The phospholipid fatty acid (PLFA)‐based sub-strate use efficiency for (a) the soils incubated with 13C‐labeled glucose and (b) the soils incubated with the 13C‐labeled vanillin phenolic‐C. Phospholipid‐based substrateuse efficiency was calculated as the incorporation of sub-strate carbon (C) into the total soil PLFA pool as a percentof the sum of substrate‐C incorporated into the total soilPLFA pool and CO2 respired. A significant N (c1,16
2 =44.02, p < 0.0001), substrate (S)*N effect (c1,16
2 = 32.45,p < 0.0001), and CO2*N (c1,16
2 = 13.43, p = 0.0048) onthe overall PLFA‐based SUE was observed. Specifically,the PLFA‐based glucose use efficiency exhibited a signifi-cant (c1,8
2 = 22.04, p < 0.0001) N effect, while vanillin phe-nolic‐C use efficiency exhibited a significant (c1,8
2 = 11.99,p = 0.0072) CO2*N effect.
ZIEGLER AND BILLINGS: SOIL C-SUBSTRATE FLOW WITH ELEVATED CO2 G01011G01011
10 of 14

with elevated CO2 [DeLucia et al., 1999; Andrews andSchlesinger, 2001; Hamilton et al., 2002] and its apparentregulation by N availability [Butnor et al., 2003] and, morespecifically, by soil microorganisms in isolation fromautotrophic respiration [Billings and Ziegler, 2008].[40] In contrast to the results for vanillin, we observed an
effect of N amendments on glucose‐derived PLFA‐basedSUE with no interaction effect of elevated CO2. The sig-nificantly higher respiration in the glucose amended soilsrelative to the controls suggest that the addition of a highlybioavailable substrate likely induced relative N limitation,consistent with the stoichiometric needs of microorganisms[Sinsabaugh et al., 2008]. If so, any potential CO2 effectin these soils may have been masked by stimulation ofmicrobial activity with glucose additions, and overshadowedby N amendment effects likely enhanced by glucose‐imposed exacerbation of N limitation. These results dem-onstrate the important influence of potential microbial Nlimitation with elevated CO2 on the fate of enhanced labile Cinputs such as root exudates, which experience declines on amass‐specific basis with N amendments at this site [Phillipset al., 2009].[41] Differences in the influence of elevated CO2 and N
on PLFA‐based SUE for the two substrates also reflectsvaried microbial responses to glucose and vanillin avail-ability [Schimel and Gulledge, 1998; Phillips et al., 2002;Rinnan and Bääth, 2009], and provide some insight intowhat may drive microbial processing of substrates withvarying lability in these soils. The significant effect of Non glucose incorporation into all four microbial PLFAgroupings assessed (Gram‐negative, Gram‐positive bacteria,actinomycetes, and fungi) suggests that many populationswithin this soil’s microbial community were influenced bythe altered stoichiometry induced by glucose addition,consistent with the utility of glucose for a wide cross sectionof microbial heterotrophs [Anderson and Domsch, 1978]. Incontrast, only actinomycete PLFA exhibited an effect of soilN status on vanillin phenolic‐C incorporation. This is con-sistent with studies that suggest the importance of actino-mycetes in mineralizing less labile substrates [McCarthyand Williams, 1992; Rob et al., 1997], and emphasizes theimportance of providing substrates of varying structuralcomplexity to assess responses of multiple microbial groupsto experimental treatments.
4.3. Regulation of Soil Organic Matter Fate WithElevated CO2 by N Status: Hypotheses for FutureResearch
[42] Without the benefit of truly long‐term soil experi-ments that permit direct observation of changes in pools anddynamics of fast‐ and slow‐turnover SOC, we are limited inhow to experimentally deduce the effects of perturbationson these pools and the microbial communities that transformthem. Though the application of isotopically labeled Ccompounds to soils permits inferences about activity levelsof multiple microbial groups, our inferences about futuredynamics of slow‐turnover SOC from such studies arelimited by the restricted availability of relatively recalcitrant,13C‐labeled substrates available for experimentation. Van-illin, used here, is a byproduct of lignin degradation and isapparently accessed by many microorganisms at a slowerrate than glucose, but is nevertheless far less structurally
complex than many of the stable SOC compounds found insitu. However, these and related studies can serve a criticalrole by guiding the scientific community in the developmentof hypotheses for future research, when it becomes morefeasible to directly measure the influence of elevated CO2
and the enhanced N limitation likely associated with iton SOC cycling. We offer two hypotheses based on ourobservations of how legacy effects of field N amendmentsgovern microbial responses to elevated CO2.[43] 1. Continued increases in atmospheric CO2 and the
ecosystem‐level N limitation associated with it will result inprogressively enhanced activity rates of actinomycetes andsome fungal populations in forest soils.[44] 2. These perturbations will further result in: (1) greater
relative abundances of compounds derived from thesegroups’ cell walls such as chitin and peptidoglycan, whichcan serve as precursors to stabilized SOM; and (2) lowerrelative abundances of slow‐turnover SOC pools subjectedto greater actinomycete and fungal processing.[45] Testing these hypotheses will become increasingly
feasible after multiple decades of exposure to elevated CO2,imposed either experimentally or via anthropogenic altera-tions of Earth’s atmospheric composition.[46] The first hypothesis is a direct inference from the
current study, as well as our previous work [Billings andZiegler, 2005, 2008]. Over time, activity rates of actino-mycetes and fungi may be assessed even in experimentalplots no longer receiving supplemental CO2. For example, atDuke FACE, SOC pools currently exhibit varying levels of13C label incorporation [Lichter et al., 2005]. We can exploitthis knowledge and track the relatively depleted d13C sig-nature of recently formed photosynthate as it is transformedwithin the site’s soil profiles long after CO2 treatments haveceased. Presumably, some of that label will becomeincreasingly incorporated into more slow‐turnover SOCpools over time, and into the microbial populations respon-sible for those transformations. Such studies are not per-fect (we lack decades‐long, in situ experiments and propercontrols), but tracking the fate of the field‐applied 13C labelcould be an important complement to our knowledge ofmicrobial processing of slow‐turnover SOC in these forestsoils.[47] The second hypothesis reflects two processes with
potentially counteracting influences on pool sizes of slow‐turnover SOC, with unknown net effects. One might predictan increase in the relative abundance of slow‐turnover SOCas inputs of peptidoglycan and chitin (important precursorsto slow‐turnover SOC pools; Paul and Van Veen, 1978;Martin and Haider, 1986; Guggenberger et al., 1999) withinsoil profiles are enhanced, due to an increase in the activityrates and thus cell wall production of actinomycetes andfungi, respectively [Sollins et al., 1996; Simpson et al., 2007].The other process reflects the substrate choice of actinomy-cetes and fungi; though these organisms may help producerelatively slow‐turnover SOC via their cell wall structures,they also are adept at accessing such pools to obtain energyand nutrients [McCarthy and Williams, 1992; Rob et al.,1997; Fierer et al., 2003b].[48] Currently, ecosystem scientists have difficulty pre-
dicting SOC stocks in a high CO2 world. We are uncertainabout the relative magnitudes of NPP enhancements versussoil respiration with elevated CO2. Further, we are unable to
ZIEGLER AND BILLINGS: SOIL C-SUBSTRATE FLOW WITH ELEVATED CO2 G01011G01011
11 of 14
predict whether these enhanced C fluxes will be sustainedover the long‐term. This study clarifies two potentiallycounteractive mechanisms that can influence soil respiratoryresponses to elevated CO2 and the size of relatively slow‐turnover SOC stocks. First, enhanced inputs to those poolsmay occur via increased relative abundances of microbialcell wall structures that are precursors of stabilized SOM.Second, increased degradation of relatively slow‐turnoverSOC pools may occur via those same organisms. Our workemphasizes the need to couple assessments of the chemicaland isotopic composition of SOC [Billings et al., 2010] withradiocarbon measurements of multiple SOC pools to assesstheir age [Trumbore, 2009]. Such future explorations elu-cidating the linkages among active microbial groups andSOC chemical composition and age will be critical forpredicting SOC dynamics in a high CO2 world.
[49] Acknowledgments. This research was supported by the Officeof Science (BER) Program, U.S. Department of Energy grant DE‐FG02‐95ER62083, the U.S. Department of Energy’s National Institute of ClimateChange Research (NICCR) grant DE‐FC02‐03ER63613 (awarded from theNational Institute for Global Environmental Change Southeast RegionalCenter (NIGEC SERC)), the Natural Sciences and Engineering ResearchCouncil of Canada (NSERC), and the Canada Research Chair program.We thank Erik Pollock, Laurel Haavik, Andrea Kopecky, David Lyon,Tom Millican, Glenn Piercey, Jeff Pippen, Ryan Rastok, Alexis Reed,Vaughn Salisbury, Lisa Tiemann, and Guihong Zhang for assistance inthe field and laboratory. Thanks also go to David Schneider for his assis-tance with statistical analyses.
ReferencesAbraham, W.‐R., and C. Hesse (2003), Isotope fractionations in the biosyn-thesis of cell components by different fungi: A basis for environmentalcarbon flux studies, FEMS Microbiol. Ecol., 46, 121–128, doi:10.1016/S0168-6496(03)00203-4.
Abrajano, T. A., Jr., D. E. Murphy, J. Fang, P. Comet, and J. M. Brooks(1994), 13C/12C ratios in individual fatty acids of marine mytilids withand without bacterial symbionts, Org. Geochem., 21, 611–617, doi:10.1016/0146-6380(94)90007-8.
Agren, G. I., E. Bosatta, and A. H. Magill (2001), Combining theory andexperiment to understand effects of inorganic nitrogen on litter decompo-sition, Oecologia, 128, 94–98, doi:10.1007/s004420100646.
Anderson, J. P. E., and K. H. Domsch (1978), Physiological method forquantitative measurement of microbial biomass in soils, Soil Biol. Bio-chem., 10, 215–221, doi:10.1016/0038-0717(78)90099-8.
Andrews, J. A., and W. H. Schlesinger (2001), Soil CO2 dynamics, acidi-fication, and chemical weathering in a temperate forest with experimentalCO2 enrichment, Global Biogeochem. Cycles, 15, 149–162, doi:10.1029/2000GB001278.
Bääth, E. (2003), The use of neutral lipid fatty acids to indicate the physio-logical conditions of soil fungi,Microb. Ecol., 45, 373–383, doi:10.1007/s00248-003-2002-y.
Benner, R., M. Fogel, E. K. Sprague, and R. Hodson (1987), Depletion of13C in lignin and its implications for stable isotope studies, Nature, 329,708–710, doi:10.1038/329708a0.
Bernhardt, E. S., J. J. Barber, J. S. Pippen, L. Taneva, J. A. Andrews, andW. H. Schlesinger (2006), Long‐term effects of free air CO2 enrichment(FACE) on soil respiration, Biogeochemistry, 77, 91–116, doi:10.1007/s10533-005-1062-0.
Bewley, R. J. F., and D. Parkinson (1986), Monitoring the impact of aciddeposition on the soil microbiota, using glucose and vanillin decomposi-tion, Water Air Soil Pollut., 27, 57–68, doi:10.1007/BF00464769.
Billings, S. A., and S. E. Ziegler (2005), Linking microbial activity and soilorganic matter transformations in forest soils under elevated CO2, GlobalChange Biol., 11, 203–212, doi:10.1111/j.1365-2486.2005.00909.x.
Billings, S. A., and S. E. Ziegler (2008), Altered patterns of soil carbonsubstrate usage and heterotrophic respiration in a pine forest with ele-vated CO2 and N fertilization, Global Change Biol., 14, 1025–1036,doi:10.1111/j.1365-2486.2008.01562.x.
Billings, S. A., J. Lichter, S. E. Ziegler, B. A. Hungate, and D. B. Richter(2010), A call to investigate drivers of soils organic matter retention vs.
mineralization in a high CO2 world, Soil Biol. Biochem., 42, 665–668,doi:10.1016/j.soilbio.2010.01.002.
Borga, P., M. Nilsson, and A. Tunlid (1994), Bacterial communities in peatin relation to botanical composition as revealed by phospholipid fatty‐acid analysis, Soil Biol. Biochem., 26, 841–848, doi:10.1016/0038-0717(94)90300-X.
Boschker, H. T. S., and J. J. Middelburg (2002), Stable isotopes and bio-markers in microbial ecology, FEMS Microbiol. Ecol., 40, 85–95,doi:10.1111/j.1574-6941.2002.tb00940.x.
Bossio, D. A., and K. M. Scow (1995), Impact of carbon and flooding onthe metabolic diversity of microbial communities in soils, Appl. Environ.Microbiol., 61, 4043–4050.
Butnor, J. R., K. H. Johnsen, R. Oren, and G. G. Katul (2003), Reduction offorest floor respiration by fertilization on both carbon dioxide‐enrichedand reference 17‐year‐old loblolly pine stands, Global Change Biol.,9, 849–861, doi:10.1046/j.1365-2486.2003.00630.x.
Carney, K. M., B. A. Hungate, B. G. Drake, and J. P. Megonigal (2007),Altered soil microbial community at elevated CO2 leads to loss of soilcarbon, Proc. Natl. Acad. Sci. U. S. A., 104, 4990–4995, doi:10.1073/pnas.0610045104.
Chen, X. Y., and R. Hampp (1993), Sugar uptake by protoplasts of theectomycorrhizal fungus, Amanita muse aria (L. ex fr.) Hooker, NewPhytol., 125, 601–608, doi:10.1111/j.1469-8137.1993.tb03909.x.
Crawford, R. L. (1981), Lignin Biodegradation and Transformation, 154pp., John Wiley, New York.
Dec, J., K. Haider, and J. M. Bollag (2001), Decarboxylation anddemethoxylation of naturally occurring phenols during coupling reac-tions and polymerization, Soil Sci., 166, 660–671, doi:10.1097/00010694-200110000-00002.
del Giorgio, P. A., and J. J. Cole (1998), Bacterial growth efficiency innatural aquatic systems, Annu. Rev. Ecol. Syst., 29, 503–541, doi:10.1146/annurev.ecolsys.29.1.503.
DeLucia, E. H., et al. (1999), Net primary production of a forest ecosystemwith experimental CO2 enrichment, Science , 284, 1177–1179,doi:10.1126/science.284.5417.1177.
Dobbs, F. C., and R. H. Findlay (1993), Analysis of microbial lipids todetermine biomass and detect the response of sedimentary microorgan-isms to disturbance, in Current Methods in Aquatic Microbial Ecology,edited by P. F. Kemp et al., pp. 347–358, Lewis, Baton Rouge, La.
Elo, S., L. Maunuksela, M. Salkinoja‐Salonen, A. Smolander, andK. Haahtela (2000), Humus bacteria of Norway spruce stands: Plantgrowth promoting properties and birch, red fescue and alder colonizingcapacity, FEMS Microbiol. Ecol., 31, 143–152, doi:10.1111/j.1574-6941.2000.tb00679.x.
Federle, T. W. (1986), Microbial distribution in soil—New techniques, inPerspectives in Microbial Ecology, edited by F. Megusar and M. Gantar,pp. 493–498, Slovene Soc. for Microbiol., Ljubljana, Slovenia.
Fierer, N., A. S. Allen, J. P. Schimel, and P. A. Holden (2003a), Controlson microbial CO2 production: A comparison of surface and subsurfacesoil horizons, Global Change Biol., 9, 1322–1332, doi:10.1046/j.1365-2486.2003.00663.x.
Fierer, N., J. P. Schimel, and P. A. Holden (2003b), Variations in microbialcommunity composition through two soil depth profiles, Soil Biol. Bio-chem., 35, 167–176, doi:10.1016/S0038-0717(02)00251-1.
Findlay, R. H. (2007), Determination of microbial community structureusing phospholipid fatty acid profiles, in Molecular Microbial EcologyManual, edited by G. A. Kowalchuk et al., pp. 983–1003, Springer,New York.
Findlay, R. H., and F. C. Dobbs (1993), Quantitative description of micro-bial communities using lipid analysis, in Current Methods in AquaticMicrobial Ecology, edited by P. F. Kemp et al., pp. 271–284, Lewis,Boca Raton, Fla.
Finzi, A. C., et al. (2006), Progressive nitrogen limitation of ecosystemprocesses under elevated CO2 in a warm‐temperate forest, Ecology, 87,15–25, doi:10.1890/04-1748.
Finzi, A. C., et al. (2007), Increases in nitrogen uptake rather than nitrogen‐use efficiency support higher rates of temperate forest productivity underelevated CO2, Proc. Natl. Acad. Sci. U. S. A., 104, 14,014–14,019,doi:10.1073/pnas.0706518104.
Fontaine, M., R. Aerts, K. Ozkan, A.Mert, S. Gulsoy, H. Suel, M.Waelkens,and B. Muys (2007), Elevation and exposition rather than soil types deter-mine communities and site suitability inMediterraneanmountain forests ofsouthern Anatolia, Turkey, For. Ecol. Manage., 247, 18–25, doi:10.1016/j.foreco.2007.04.021.
Frostegärd, A., and E. Bääth (1996), The use of phospholipid fatty acidanalysis to estimate bacterial and fungal biomass in soil, Biol. Fertil.Soils, 22, 59–65, doi:10.1007/BF00384433.
Frostegärd, A., E. Bääth, and A. Tunlid (1993a), Shifts in the structure ofsoil microbial communities in limed forests as revealed by phospholipid
ZIEGLER AND BILLINGS: SOIL C-SUBSTRATE FLOW WITH ELEVATED CO2 G01011G01011
12 of 14
fatty‐acid analysis, Soil Biol. Biochem., 25, 723–730, doi:10.1016/0038-0717(93)90113-P.
Frostegärd, A., A. Tunlid, and E. Bääth (1993b), Phospholipid fatty‐acidcomposition, biomass, and activity of microbial communities from 2 soiltypes experimentally exposed to different heavy‐metals, Appl. Environ.Microbiol., 59, 3605–3617.
Guggenberger, G., S. D. Frey, J. Six, K. Paustian, and E. T. Elliott (1999),Bacterial and fungal cell‐wall residues in conventional and no‐tillageagroecosystems, Soil Sci. Soc. Am. J., 63, 1188–1198, doi:10.2136/sssaj1999.6351188x.
Hamilton, J. G., E. H. DeLucia, K. George, S. L. Naidu, A. C. Finzi, andW. H. Schlesinger (2002), Forest carbon balance under elevated CO2,Oecologia, 131, 250–260, doi:10.1007/s00442-002-0884-x.
Hayes, J. M. (2001), Fractionation of carbon and hydrogen isotopes inbiosynthetic processes, in Reviews in Mineralology and Geochemistry,edited by J. W. Valley and D. R. Cole, pp. 225–277, Mineral. Soc. ofAm., Blacksberg, Va.
Hoffmann, J. P. (2004), Generalized Linear Models: An Applied Approach,1st ed., 204 pp., Pearson, Boston, Mass.
Hogberg, M. N., P. Hogberg, and D. D. Myrold (2007), Is microbial com-munity composition in boreal forest soils determined by pH, C‐to‐Nratio, the trees, or all three?, Oecologia, 150, 590–601, doi:10.1007/s00442-006-0562-5.
Holland, E. A., and D. C. Coleman (1987), Litter placement effects onmicrobial and organic‐matter dynamics in an agroecosystem, Ecology,68, 425–433, doi:10.2307/1939274.
Hoosbeek, M. R., Y. T. Li, and G. E. Scarascia‐Mugnozza (2006), Freeatmospheric CO2 enrichment (FACE) increased labile and total carbonin the mineral soil of a short rotation Poplar plantation, Plant Soil,281, 247–254, doi:10.1007/s11104-005-4293-x.
Huang, J. G., Y. Bergeron, B. Denneler, F. Berninger, and J. Tardif (2007),Response of forest trees to increased atmospheric CO2, Crit. Rev. PlantSci., 26, 265–283, doi:10.1080/07352680701626978.
Kramer, C., and G. Gleixner (2008), Soil organic matter in soil depth pro-files: Distinct carbon preferences of microbial groups during carbontransformation, Soil Biol. Biochem., 40, 425–433, doi:10.1016/j.soil-bio.2007.09.016.
Kuzyakov, Y., J. K. Friedel, and K. Stahr (2000), Review of mechanismsand quantification of priming effects, Soil Biol. Biochem., 32, 1485–1498, doi:10.1016/S0038-0717(00)00084-5.
Langley, J. A., D. C. McKinley, A. A. Wolf, B. A. Hungate, B. G. Drake,and J. P. Megonigal (2009), Priming depletes soil carbon and releasesnitrogen in a scrub‐oak ecosystem exposed to elevated CO2, Soil Biol.Biochem., 41, 54–60, doi:10.1016/j.soilbio.2008.09.016.
Lichter, J., S. H. Barron, C. E. Bevacqua, A. C. Finzli, K. E. Irving,E. A. Stemmler, and W. H. Schlesinger (2005), Soil carbon sequestrationand turnover in a pine forest after six years of atmospheric CO2 enrich-ment, Ecology, 86, 1835–1847, doi:10.1890/04-1205.
Lindsey, J. K. (1997), Applying Generalized Linear Models, 271 pp.,Springer, New York.
Luo, Y., et al. (2004), Progressive nitrogen limitation of ecosystemresponses to rising atmospheric carbon dioxide, BioScience, 54,731–739, doi:10.1641/0006-3568(2004)054[0731:PNLOER]2.0.CO;2.
Maier, C. A., and L. W. Kress (2000), Soil CO2 evolution and root respi-ration in 11 year‐old loblolly pine (Pinus taeda) plantations as affected bymoisture and nutrient availability, Can. J. For. Res., 30, 347–359,doi:10.1139/cjfr-30-3-347.
Martin, J. P., and K. Haider (1986), Influence of mineral colloids on turn-over rates of soil organic carbon, in Interactions of Soil Minerals WithNatural Organics and Microbes, edited by P. M. Huang and M. Schnit-zer, pp. 283–304, Soil Soc. of Am., Madison, Wis.
Matamala, R., and W. H. Schlesinger (2000), Effects of elevated atmo-spheric CO2 on fine root production and activity in an intact temperateforest ecosystem, Global Change Biol., 6, 967–979, doi:10.1046/j.1365-2486.2000.00374.x.
Matamala, R., M. A. Gonzalez‐Meler, J. D. Jastrow, R. J. Norby, andW. H. Schlesinger (2003), Impacts of fine root turnover on forest NPPand soil C sequestration potential, Science, 302, 1385–1387, doi:10.1126/science.1089543.
McCarthy, A. J., and S. T. Williams (1992), Actinomycetes as agents ofbiodegradation in the environment—A review, Gene, 115, 189–192,doi:10.1016/0378-1119(92)90558-7.
McClaugherty, C. A., J. D. Aber, and J. M. Melillo (1982), The role of fineroots in the organic‐matter and nitrogen budgets of 2 forested ecosys-tems, Ecology, 63, 1481–1490, doi:10.2307/1938874.
Nannipieri, P., J. Ascher, M. T. Ceccherini, L. Landi, G. Pietramellara, andG. Renella (2003), Microbial diversity and soil functions, Eur. J. SoilSci., 54, 655–670, doi:10.1046/j.1351-0754.2003.0556.x.
Olsson, P. A. (1999), Signature fatty acids provide tools for determination ofthe distribution and interactions of mycorrhizal fungi in soil, FEMSMicrobiol. Ecol., 29, 303–310, doi:10.1111/j.1574-6941.1999.tb00621.x.
Oren, R., et al. (2001), Soil fertility limits carbon sequestration by forestecosystems in a CO2‐enriched atmosphere, Nature, 411, 469–472,doi:10.1038/35078064.
Parrent, J. L., and R. Vilgalys (2007), Biomass and compositionalresponses of ectomycorrhizal fungal hyphae to elevated CO2 and nitro-gen fertilization, New Phytol., 176, 164–174, doi:10.1111/j.1469-8137.2007.02155.x.
Parrent, J. L., W. F. Morris, and R. Vilgalys (2006), CO2‐enrichment andnutrient availability alter ectomycorrhizal fungal communities, Ecology,87, 2278–2287, doi:10.1890/0012-9658(2006)87[2278:CANAAE]2.0.CO;2.
Paul, E. A., and F. E. Clark (1996), Soil Microbiology and Biochemistry,340 pp., Academic, Toronto, Ont., Canada.
Paul, E. A., and H. Van Veen (1978), The use of tracers to determine thedynamic nature of organic matter, Trans. 11th Int. Congr. Soil Sci., 3,61–102.
Pelz, O., C. Hesse, M. Tesar, R. B. Coffin, and W.‐R. Abraham (1997),Development of methods to measure carbon isotope ratios of bacterialbiomarkers in the environment, Isotopes Environ. Health Stud., 33,131–144.
Phillips, R. L., D. R. Zak, W. E. Holmes, and D. C. White (2002), Micro-bial community composition and function beneath temperate treesexposed to elevated atmospheric carbon dioxide and ozone, Oecologia,131, 236–244, doi:10.1007/s00442-002-0868-x.
Phillips, R. P., E. S. Bernhardt, and W. H. Schlesinger (2009), ElevatedCO2 increases root exudation from loblolly pine (Pinus taeda) seedlingsas an N‐mediated response, Tree Physiol., 29, 1513–1523, doi:10.1093/treephys/tpp083.
Pinkart, H. C., R. Devereux, and P. J. Chapman (1998), Rapid separation ofmicrobial lipids using solid phase extraction columns, J. Microbiol.Methods, 34, 9–15, doi:10.1016/S0167-7012(98)00060-8.
Pregitzer, K., W. Loya, M. Kubiske, and D. Zak (2006), Soil respiration innorthern forests exposed to elevated atmospheric carbon dioxide andozone, Oecologia, 148, 503–516, doi:10.1007/s00442-006-0381-8.
Pritchard, S. G., A. E. Strand, M. L. McCormack, M. A. Davis, A. C. Finz,R. B. Jackson, R. Matamala, H. H. Rogers, and R. Oren (2008), Fine rootdynamics in a loblolly pine forest are influenced by free‐air‐CO2‐enrich-ment: A six‐year‐minirhizotron study, Global Change Biol., 14, 588–602, doi:10.1111/j.1365-2486.2007.01523.x.
Ribbons, D. W., and Y. Ohta (1970), Uncoupling of electron transport fromoxygenation in mono‐oxygenase, orcinol hydroxylase, FEBS Lett., 12,105, doi:10.1016/0014-5793(70)80574-9.
Ringelberg, D. B., et al. (1989), Validation of signature polarlipid fattyacids biomarkers for alkane‐utilizing bacteria in soils and subsurfaceaquifer materials, FEMS Microbiol. Ecol., 62, 39–50, doi:10.1111/j.1574-6968.1989.tb03656.x.
Rinnan, R., and E. Bääth (2009), Differential utilization of carbon sub-strates by bacteria and fungi in tundra soil, Appl. Environ. Microbiol.,75, 3611–3620, doi:10.1128/AEM.02865-08.
Rinnan, R., S. Stark, and A. Tolvanen (2009), Responses of vegetation andsoil microbial communities to warming and simulated herbivory ina subarctic heath, J. Ecol., 97, 788–800, doi:10.1111/j.1365-2745.2009.01506.x.
Rob, A.,M. Hernandez, A. S. Ball, M. Tuncer,M. E. Arias, andM. T.Wilson(1997), Production and partial characterization of extracellular peroxidasesproduced by Streptomyces avermitilis UAH30, Appl. Biochem. Biotech-nol., 62, 159–174, doi:10.1007/BF02787992.
Saetre, P., and E. Bääth (2000), Spatial variation and patterns of soil micro-bial community structure in a mixed spruce‐birch stand, Soil Biol. Bio-chem., 32, 909–917, doi:10.1016/S0038-0717(99)00215-1.
Schimel, J. P., and J. Gulledge (1998), Microbial community structure andglobal trace gases, Global Change Biol., 4, 745–758, doi:10.1046/j.1365-2486.1998.00195.x.
Schlesinger, W. H., and J. Lichter (2001), Limited carbon storage in soiland litter of experimental forest plots under increased atmosphericCO2, Nature, 411, 466–469, doi:10.1038/35078060.
Schlesinger, W. H., et al. (2006), The Duke Forest FACE experiment: CO2enrichment of a loblolly pine forest, in Managed Ecosystems and CO2:Case Studies, Processes, and Prospectives, Ecological Studies, editedby J. Nosberger et al., pp. 197–212, Springer, Berlin.
Schroter, D., V. Wolters, and P. C. De Ruiter (2003), C and N mineralisa-tion in the decomposer food webs of a European forest transect, Oikos,102, 294–308, doi:10.1034/j.1600-0579.2003.12064.x.
Silfer, J. A., M. H. Engel, S. A. Macko, and E. J. Jumeau (1991), Stablecarbon isotope analysis of amino acid enantiomers by conventional iso-tope ratio mass spectrometry and combined gas chromatography‐isotope
ZIEGLER AND BILLINGS: SOIL C-SUBSTRATE FLOW WITH ELEVATED CO2 G01011G01011
13 of 14
ratio mass spectrometry, Anal. Chem., 63, 370–374, doi:10.1021/ac00004a014.
Simpson, A. J., G. X. Song, E. Smith, B. Lam, E. H. Novotny, andM. H. B. Hayes (2007), Unraveling the structural components of soilhumin by use of solution‐state nuclear magnetic resonance spectroscopy,Environ. Sci. Technol., 41, 876–883, doi:10.1021/es061576c.
Sinsabaugh, R. L., et al. (2008), Stoichiometry of soil enzyme activity atglobal scale, Ecol. Lett., 11, 1252–1264.
Soderberg, K. H., A. Probanza, A. Jumpponen, and E. Bääth (2004), Themicrobial community in the rhizosphere determined by community‐levelphysiological profiles (CLPP) and direct soil‐ and cfu‐PLFA techniques,Appl. Soil Ecol., 25, 135–145, doi:10.1016/j.apsoil.2003.08.005.
Sollins, P., P. Homann, and B. A. Caldwell (1996), Stabilization and desta-bilization of soil organic matter: Mechanisms and controls, Geoderma,74, 65–105, doi:10.1016/S0016-7061(96)00036-5.
Sparks, J. P., J. Walker, A. Turnipseed, and A. Guenther (2008), Drynitrogen deposition estimates over a forest experiencing free air CO2enrichment, Global Change Biol., 14, 768–781, doi:10.1111/j.1365-2486.2007.01526.x.
Teklay, T., A. Nordgren, G. Nyberg, and A. Malmer (2007), Carbon min-eralization of leaves from four Ethiopian agroforestry species under lab-oratory and field conditions, Appl. Soil Ecol., 35, 193–202, doi:10.1016/j.apsoil.2006.04.002.
Thiet, R. K., S. D. Frey, and J. Six (2006), Do growth yield efficienciesdiffer between soil microbial communities differing in fungal: Bacterialratios? Reality check and methodological issues, Soil Biol. Biochem.,38, 837–844, doi:10.1016/j.soilbio.2005.07.010.
Trumbore, S. (2009), Radiocarbon and soil carbon dynamics, Annu.Rev. Earth Planet. Sci., 37, 47–66, doi:10.1146/annurev.earth.36.031207.124300.
Tunlid, A., and D. C. White (1992), Biochemical analysis of biomass,community structure, nutritional status, and metabolic activity of micro-bial communities in soil, in Soil Biochemistry, edited by G. Stotzky andJ.‐M. Bollag, pp. 229–262, Marcel Decker, New York.
Tunlid, A., H. Ek, G. Westerdahl, and G. Odham (1987), Determination of13C‐enrichment in bacterial fatty acids using chemical ionization massspectrometry with negative ion detection, J. Microbiol. Methods, 7,77–89, doi:10.1016/0167-7012(87)90028-5.
Waldrop, M. P., and M. K. Firestone (2004), Microbial community utili-zation of recalcitrant and simple carbon compounds: Impact of oak‐
woodland plant communities, Oecologia, 138, 275–284, doi:10.1007/s00442-003-1419-9.
Waldrop, M. P., D. R. Zak, and R. L. Sinsabaugh (2004a), Microbial com-munity response to nitrogen deposition in northern forest ecosystems,Soil Biol. Biochem., 36, 1443–1451, doi:10.1016/j.soilbio.2004.04.023.
Waldrop, M. P., D. R. Zak, R. L. Sinsabaugh, M. Gallo, and C. Lauber(2004b), Nitrogen deposition modifies soil carbon storage throughchanges in microbial enzymatic activity, Ecol. Appl., 14, 1172–1177,doi:10.1890/03-5120.
Waring, R. H., and W. H. Schlesinger (1985), Forest Ecosystems: Conceptsand Management, Academic, San Diego, Calif.
White, D. C., and R. H. Findlay (1988), Biochemical markers for measure-ment of predation effects on the biomass, community structure, nutri-t ional status, and metabolic act ivi ty of microbial biofi lms,Hydrobiologia, 159, 119–132.
White, D. C., and D. B. Ringelberg (1998), Signature lipid biomarker anal-ysis, in Techniques in Microbial Ecology, edited by R. S. Burlage et al.,pp. 255–272, Oxford Univ. Press, New York.
White, D. C., J. O. Stair, and D. B. Ringelberg (1996), Quantitative com-parisons of in situ microbial biodiversity by signature biomarker analysis,J. Ind. Microbiol., 17, 185–196, doi:10.1007/BF01574692.
Xie, Z. B., G. Cadisch, G. Edwards, E. M. Baggs, and H. Blum (2005),Carbon dynamics in a temperate grassland soil after 9 years exposureto elevated CO2 (Swiss FACE), Soil Biol. Biochem., 37, 1387–1395,doi:10.1016/j.soilbio.2004.12.010.
Zak, D. R., W. E. Holmes, A. C. Finzi, R. J. Norby, and W. H. Schlesinger(2003), Soil nitrogen cycling under elevated CO2: A synthesis of forestface experiments, Ecol. Appl., 13, 1508–1514, doi:10.1890/03-5055.
Zelles, L., Q. Y. Bai, T. Beck, and F. Besse (1992), Signature fatty acids inphospholipids and lipopolysaccharides as indicators of microbial biomassand community structure in agricultural soils, Soil Biol. Biochem., 24,317–323, doi:10.1016/0038-0717(92)90191-Y.
Ziegler, S. E., P. M. White, D. C. Wolf, and G. J. Thoma (2005), Trackingthe fate and recycling of 13C‐labeled glucose in soil, Soil Sci., 170, 767–778, doi:10.1097/00010694-200510000-00002.
S. A. Billings, Department of Ecology and Evolutionary Biology,University of Kansas, 2101 Constant Ave., Lawrence, KS 66047, USA.S. E. Ziegler, Department of Earth Science, Memorial University of
Newfoundland, St. John’s, NL A1B 3X5, Canada. ([email protected])
ZIEGLER AND BILLINGS: SOIL C-SUBSTRATE FLOW WITH ELEVATED CO2 G01011G01011
14 of 14