3D facial expression recognition using SIFT descriptors of ...

Evaluation of Human Intestinal Absorption Data andSubsequent Derivation of a Quantitative Structure±ActivityRelationship (QSAR) with the Abraham Descriptors
YUAN H. ZHAO,1 JOELLE LE,1 MICHAEL H. ABRAHAM,1 ANNE HERSEY,2 PETER J. EDDERSHAW,2
CHRIS N. LUSCOMBE,2 DARKO BOUTINA,2 GORDON BECK,3 BRAD SHERBORNE,3 IAN COOPER,3
JAMES A. PLATTS4
1Department of Chemistry, University College London, 20 Gordon Street, London WC1H 0AJ, U.K.2BioMet, Technology and Information Group, Glaxo Wellcome Research and Development, Park Road, WareSG12 0DP, U.K.3Roche Products Ltd.; Welwyn Garden City, Herts AL7 3AY, U.K.4Department of Chemistry, Cardiff University, P.O. Box 912, Cardiff CF10 3TB, U.K.
Received 19 July 2000; revised 8 November 2000; accepted 16 November 2000
ABSTRACT: The human intestinal absorption of 241 drugs was evaluated. Three mainmethods were used to determine the human intestinal absorption: bioavailability,percentage of urinary excretion of drug-related material following oral administration,and the ratio of cumulative urinary excretion of drug-related material following oral andintravenous administration. The general solvation equation developed by Abraham'sgroup was used to model the human intestinal absorption data of 169 drugs we con-sidered to have reliable data. The model contains ®ve Abraham descriptors calculated bythe ABSOLV program. The results show that Abraham descriptors can successfullypredict human intestinal absorption if the human absorption data is carefully classi®edbased on solubility and administration dose to humans. ß 2001 Wiley-Liss, Inc. and the
American Pharmaceutical Association J Pharm Sci 90:749±784, 2001
Keywords: intestinal absorption; QSAR; solvation equation; solubility
INTRODUCTION
The prediction of human intestinal absorption is amajor goal in the design, optimization, and selec-tion of candidates for the development of oraldrugs. The focus of modern drug discovery is nownot simply on the pharmacological activity, butalso on seeking favorable absorption, distribution,metabolism, and excretion properties.1±4 Thegrowth in drug discovery of combinatorial chemi-stry methods, where large numbers of candidatecompounds are synthesized and screened inparallel for in vitro pharmacological activity, has
dramatically increased the demand for rapid andef®cient models for estimating human intestinalabsorption. Although cell membrane methods5±7
and in vivo animal studies8 have been used insteadof human intestinal absorption methods, thesetechniques are still costly and labor intensive.
Quantitative structure±activity relationships(QSARs) are mathematical models that statisti-cally relate the biological activity of a compoundto its physicochemical properties. Several recentstudies have shown their importance to the pre-diction of human intestinal absorption.9±14 Theso-called ``rule of 5'' has proved very popular as arapid screen for compounds that are likely to bepoorly absorbed.9,15 This rule states that if acompound satis®es any two of the following rules,it is likely to exhibit poor intestinal absorption: (1)molecular weight > 500, (2) number of hydrogen
JOURNAL OF PHARMACEUTICAL SCIENCES, VOL. 90, NO. 6, JUNE 2001 749
Correspondence to: M. H. Abraham (Telephone: 44020 76794639; Fax: 44 020 7679 7463; E-mail: [email protected])
Journal of Pharmaceutical Sciences, Vol. 90, 749±784 (2001)ß 2001 Wiley-Liss, Inc. and the American Pharmaceutical Association

bond donors > 5 (a donor being any O-H or N-Hgroup), (3) number of hydrogen acceptors > 10 (anacceptor being any O or N including those in donorgroups), and (4) C log P> 5.0 or M log P> 4.15.
Palm and Clark9,11,16 recently developed atheoretical method, based on the determinationof dynamic surface properties±polar molecularsurface area (PSA), to predict the human intest-inal absorption. An excellent sigmoidal relation-ship was established between the absorbedfraction after oral administration to humans andPSA for 20 drugs (r2� 0.94). Drugs that arecompletely absorbed (> 90%) had a PSA � 60 AÊ 2,whereas drugs that are <10% absorbed hada PSA� 104 AÊ 2. However, the prediction for alarge set (74 drugs) was not as good.9 Wesselet al.10 used a neural network to ®nd the sixindependent calculated molecular structure des-criptors that best described human absorption fora training set consisting of 67 structurally dif-ferent drug and drug-like compounds. The net-work was fed with > 100 topological, electronic,and geometric descriptors and binary stringsindicating the presence or absence of substructurefeatures or fragments. In addition to percentabsorption data, other human absorption data inthe form of permeability coef®cients is availablefrom the Lennernas group using his LOC-1-GUTtechnique.17
The largest data set of compounds yet analyzedis that of Wessel et al.10 who constructed a set of86 compounds. However, there was potentiallymuch more data available. The ®rst aim of thepresent work was to collect data from the liter-ature and, unlike previous work,9,10 to assess thedata to obtain a much larger data set that could beanalyzed with some con®dence. The second aimwas to construct a QSAR for human intestinalabsorption that could be used as a rapid screeningmethod for candidate drugs.
MATERIALS AND METHODS
Human Intestinal Absorption Data
The names of drug and drug-like compounds andrelated data are listed in Table 1 and 2. Theabsorption data was collected and evaluated from244 papers.1±5,8±12,18±251 The following informa-tion concerning human drug absorption was re-corded from the literature:
* absorption data given from the literature;* oral bioavailability or absolute bioavailability;
* percentage of cumulative urinary excretionof unchanged drug and its metabolites follo-wing oral and intravenous administration;
* percentage of metabolites in urine or ®rst-pass effect following oral and intravenousadministration;
* percentage of unchanged drug in urine fol-lowing oral and intravenous administration;
* percentage of excretion of drug in bile follow-ing oral and intravenous administration;
* percentage of cumulative excretion of drug infeces following oral and intravenous admi-nistration;
* total recovery of drug in urine and feces fol-lowing oral and intravenous administration;
* single dose level in mg or mg/kg and dailyoral dose in mg.
Physicochemical Descriptors
The water solubility (WS) at 25�C listed in Table 1was estimated by WS-KOW for Windows (WilliamMeylan 1994±1996),252 and experimental valueswere obtained from a data base of Syracuse Cor-poration. Melting points were not used to correctsolubility because most of them were unavailable.
The logarithm of the octanol±water partitioncoef®cient (C log P) was calculated by use of theC log P for Windows software (Biobyte version2.0.0b, Claremont, CA).
The QSAR that we use is of the form of ourgeneral solvation equation,253
SP � c� eE� sS� aA � bB� vV �1�
Here, the dependent variable, SP, is a property ofa series of compounds in a given system. Speci®-cally, in this work, SP will be the percent drugabsorbed in vivo. We use a simpli®ed notation forthe independent variables, or solute descriptorsas follows: E is an excess molar refraction in unitsof (cm3 molÿ 1)/10, S is the dipolarity/polarizabil-ity, A and B are the hydrogen bond acidity andbasicity, respectively, and V is the McGowancharacteristic volume in units of (cm3 molÿ 1)/100that can simply be calculated from structure. Theequation coef®cients, c, e, s, a, b, and v, are obtai-ned by multiple linear regression. Equation 1 hasbeen applied to numerous physicochemical andbiochemical processes, mostly using experimen-tally derived descriptors.254±260 More recently,Platts et al.261 have calculated the descriptorsusing a fragment based scheme, ABSOLV, andhave shown 262 how partition coef®cients can then
750 ZHAO ET AL.
JOURNAL OF PHARMACEUTICAL SCIENCES, VOL. 90, NO. 6, JUNE 2001

Table 1. Molecular Weight (MW), Water Solubility (WS), and Octanol±WaterPartition Coef®cient (C Log P)
No. Name MW WS(Calc)a (mg/L) M log Pc C log Pd
Training set 1f
1 Cisapride 466 2.71 3.432 Valproicacid 144 895 2.75 2.763 Salicylicacid 138 3808b/2059 2.26 2.194 Diazepam 285 59b/50 2.99 3.295 Sudoxicam 337 3015 1.64 2.606 Glyburide 358 35 4.087 Gallopamil 485 0.52 3.148 Mexiletine 179 8248 2.15 2.579 Nefazodone 470 0.060 5.00e
10 Naproxen 230 145 3.34 2.8211 Lamotrigine 256 3127 3.2412 Tolmesoxide 214 10850 0.8913 Disul®ram 296 64b/4.09 3.88 3.8814 Torasemide 348 137 3.3415 Metoprolol 267 4777 1.88 1.2016 Naloxone 327 1415 2.09 ÿ 0.0417 Terazosin 387 205 2.7118 Sulindac 356 17 3.05 2.8119 Sultopride 354 724 1.9320 Topiramate 339 13640 ÿ 0.0721 Tolbutamide 270 183b/109 2.34 2.5022 Propiverine 367 8.85 4.0623 Digoxin 781 3.78b/64 1.26 1.3224 Mercaptoethanesulfonicacid 142 1000000 ÿ 0.5225 Cimetidine 252 10460 0.40 0.3526 Furosemide 330 149 2.03 1.8727 Metformin 129 1000000 ÿ 2.64e
28 Rimiterol 223 399500 0.3629 Cymarin 548 99 ÿ 0.1530 Ascorbic acid 176 1000000 ÿ 1.64 ÿ 2.2131 Fosfomycin 138 960700 ÿ 0.4832 Fosmidomycin 183 1000000 ÿ 3.1133 k-strophanthoside 873 20510 ÿ 5.4234 Adefovir 273 42380 ÿ 2.0835 Acarbose 646 1000000 ÿ 10.6236 Ouabain 584 10340 ÿ 1.70 ÿ 4.5837 Kanamycin 484 1000000 ÿ 7.7738 Lactulose 342 1000000 ÿ 5.56
Test set39 Camazepam 372 24 3.6440 Indomethacin 358 3.11b/0.94 4.27 4.1841 Levonorgestrel 312 36 3.3142 Tenoxicam 337 442 2.4243 Theophylline 180 2800b/7356 ÿ 0.02 ÿ 0.0644 Oxatomide 426 0.60 5.4145 Desipramine 266 0.99b/59 4.90 4.0946 Fenclofenac 297 2.52 4.80 4.9647 Imipramine 280 1.00b/18 4.80 4.4148 Lormetazepam 335 94 2.6049 Diclofenac 296 5.61 4.40 3.0350 Granisetron 312 28 1.7951 Testosterone 288 68 3.32 3.22
HUMAN INTESTINAL ABSORPTION OF 241 DRUGS 751
JOURNAL OF PHARMACEUTICAL SCIENCES, VOL. 90, NO. 6, JUNE 2001

Table 1. (Continued)
No. Name MW WS(Calc)a (mg/L) M log Pc C log Pd
52 Caffeine 194 2632b/21000 ÿ 0.07 ÿ 0.0653 Corticosterone 346 143 1.94 2.3254 Ethinylestradiol 296 116 3.67 3.6655 Isoxicam 335 1046 2.83 2.4056 Lornoxicam 372 1572 3.1557 Nicotine 162 1000000 1.17 1.3258 Ondansetron 293 5.70 2.6459 Piroxicam 331 521b/23 1.98 2.7060 Verapamil 455 4.47 3.79 3.7161 Progesterone 314 5.00 3.87 3.7862 Stavudine 224 6595 ÿ 0.81 ÿ 0.4863 Toremifene 406 0.072 6.3564 Cyproterone acetate 417 0.65 3.3965 Praziquantel 312 88 3.4366 Cicaprost 374 21 2.0167 Aminopyrine 231 4227 1.0068 Nordiazepam 270 57 2.93 3.0169 Carfecillin 454 2.91 2.96 3.1270 Prednisolone 360 221b/223 1.62 1.6471 Propranolol 259 609 2.98 2.7572 Viloxazine 237 29210 1.3473 Warfarin 308 17 2.70 2.4474 Atropine 289 3944 1.83 1.3275 Minoxidil 209 3423 1.24 1.0976 Clo®brate 243 21 3.6877 Trimethoprim 290 2334b/400 0.91 0.9578 Venlafaxine 277 267 2.1179 Antipyrine 188 23760b/51900 0.38 0.4180 Bumetanide 364 32 3.9081 Trapidil 205 1696 1.9482 Fluconazole 306 1086 ÿ 0.1183 Sotalol 272 136800 ÿ 0.44 0.2384 Codeine 299 13400 1.14 0.8285 Flumazenil 303 128 1.0686 Ibuprofen 206 2440 3.50 3.6887 Labetalol 328 73 2.5088 Oxprenolol 265 3182 2.10 1.6989 Practolol 266 4472 0.79 0.7590 Timolol 316 2741 1.83 1.6191 Alprenolol 249 547 2.89 2.6592 Amrinone 189 8067 ÿ 0.5993 Ketoprofen 254 120 3.12 2.7694 Hydrocortisone 362 219b/320 1.61 1.7095 Betaxolol 307 451 2.81 2.1796 Ketorolac 255 572 1.6297 Meloxicam 351 3.60 3.01 3.1098 Phenytoin 252 1267 2.47 2.0899 Amphetamine 135 28000 1.76 1.59100 Chloramphenicol 323 389b/3750 1.14 0.69101 Felbamate 238 6116 ÿ 0.29102 Nizatidine 331 77690 0.50103 Alprazolam 309 13 2.12 2.30104 Tramadol 263 1151 2.63 2.31105 Nisoldipine 388 25 4.53 4.24106 Oxazepam 287 179 2.24 2.29
752 ZHAO ET AL.
JOURNAL OF PHARMACEUTICAL SCIENCES, VOL. 90, NO. 6, JUNE 2001

Table 1. (Continued)
107 Tenidap 321 2676 0.63e
108 Dihydrocodeine 301 6866 1.30109 Felodipine 384 20 4.80 4.96110 Nitrendipine 360 77 4.15 3.39111 Saccharin 183 789 0.91 0.52112 Moxonidine 242 16450 1.02113 Bupropion 240 140 3.21114 Pindolol 248 7883 1.75 1.67115 Lamivudine 229 1000000 ÿ 0.93 ÿ 1.54116 Morphine 285 13810b/40000 0.76 0.24117 Lansoprazole 369 3.43 3.07118 Oxyfedrine 313 3.43 2.84119 Captopril 217 6857 1.19120 Bromazepam 316 1394 1.69 1.69121 Acetylsalicylicacid 180 4600 1.19 1.02122 Sorivudine 349 1207 ÿ 1.66123 Methylprednisolone 374 123 1.96124 Mifobate 359 3298 0.69125 Flecainide 414 1.48 4.43126 Quinidine 324 104b/140 2.64 2.93127 Piroximone 217 11890 0.96128 Acebutolol 336 259 1.71 1.63129 Ethambutol 204 948800 0.12130 Acetaminophen 151 30350 0.51 0.49131 Dexamethasone 392 93b/89 2.01 2.01132 Guanabenz 231 1055 2.96133 Isoniazid 137 16700 ÿ 0.70 ÿ 0.71134 Omeprazole 345 82 2.23 2.53135 Methadone 309 48 3.93 3.13136 Famciclovir 321 2609 ÿ 0.36137 Metolazone 366 133 2.42138 Fenoterol 303 41370 0.83139 Nadolol 309 22400 0.71 0.23140 Atenolol 266 685 0.16 ÿ 0.11141 Sulpiride 341 2275 1.11142 Metaproterenol 211 973500 0.08143 Famotidine 337 1271 ÿ 0.57 ÿ 0.56144 Foscarnet 126 1000000 ÿ 1.93c
145 Cidofovir 279 1000000 ÿ 3.56146 Isradipine 371 49 4.18 3.57147 Terbutaline 225 212800 0.08 0.48148 Reproterol 389 1424 ÿ 0.98149 Lincomycin 406 927 0.20 ÿ 0.12150 Streptomycin 582 1000000 ÿ 7.17151 Fluvastatin 411 0.47 3.19152 Urapidil 387 157 2.56153 Propylthiouracil 170 514 2.80154 Recainam 263 2158 1.13155 Cycloserine 102 166000 ÿ 1.72e
156 Hydrochlorothiazide 298 1292b/722 ÿ 0.07 ÿ 0.40157 Pirbuterol 240 521000 ÿ 0.93158 Sumatriptan 295 21360 0.93 0.58159 Amiloride 230 1256 ÿ 0.26160 Mannitol 182 1000000b/216300 ÿ 3.10 ÿ 4.67161 Ganciclovir 255 28340 ÿ 2.07 ÿ 2.99162 Neomycin 615 1000000 ÿ 9.03
HUMAN INTESTINAL ABSORPTION OF 241 DRUGS 753
JOURNAL OF PHARMACEUTICAL SCIENCES, VOL. 90, NO. 6, JUNE 2001

Table 1. (Continued)
No. Name MW WS(Calc)a (mg/L) M log Pc C log Pd
163 Raf®nose 504 1000000b/202600 ÿ 7.96164 Phenglutarimide 288 325 1.54165 Bornaprine 329 2.16 4.30166 DphenylalanineLproline167 Scopolamine 303 17400b/100000 0.26168 Noloxone169 Ziprasidone 413 2.13 4.42170 Guanoxan 207 16120 0.33171 Netivudine 282 5918 ÿ 2.03172 Gentamicin-C1 484 1000000 ÿ 3.77
Zwitterionic drugs173 Cefadroxil 363 1110 ÿ 2.06 ÿ 2.57174 O¯oxacin 361 28260 ÿ 0.28 ÿ 0.24175 Pre¯oxacin 333 11390 0.27 0.08176 Cephalexin 347 1789 ÿ 1.74 ÿ 1.90177 Loracarbef 349 2785 ÿ 0.47178 Glycine 75 625600b/249000 ÿ 3.21 ÿ 3.21179 Amoxicillin 365 3433 ÿ 1.99 ÿ 1.92180 Tiagabine 376 0.66 2.79181 Telmisartan 514 0.0000029 7.26182 Trovo¯axicin (CP99219) 416 285 ÿ 1.19183 Acrivastine 348 262 1.13184 Nicotinic acid 123 48000 0.80185 Levodopa 197 320100 ÿ 2.74 ÿ 2.82186 Cefatrizine 463 2505 ÿ 2.96187 Ampicillin 349 3574b/10100 ÿ 1.13 ÿ 1.25188 Vigabatrin 129 55140 ÿ 2.94189 Tranexamicacid 157 25000 ÿ 1.80190 E¯ornithine 182 256000 ÿ 3.00191 Methyldopa 211 41810 ÿ 2.11192 Ceftriaxone 554 958 ÿ 2.09e
Drugs with missing fragments from ABSOLV program193 Distigminebromide 578194 Zidovudine 267 311 0.05 ÿ 0.20195 Ximoprofen 261 453 2.18196 Clonidine 230 13580 1.57 1.37197 Viomycin 685 1000000 ÿ 8.03198 Ceftizoxime 382 910000 ÿ 4.30e
199 Capreomycin 653 1000000 ÿ 7.25200 AAFC 243 1000000 ÿ 3.91e
201 Bretvliumtosylate 244 4280 ÿ 1.25
Dose-limited, dose-dependent, and formulation-dependent drugs202 Spironolactone 417 28b/22 2.26 2.25203 Etoposide 588 59 0.60 ÿ 1.89204 Cefetamet pivoxil 511 19 2.33205 Cefuroximeaxetil 510 29 0.89 0.25206 Azithromycin 749 7.09 1.83207 Fosinopril 564 0.000033 7.74208 Pravastatin 425 12 0.57209 Cyclosporin 1202 0.0000076 3.80e
210 Bromocriptine 654 0.0020 6.69211 Doxorubicin 543 93 0.10 ÿ 1.45212 Cefuroxime 424 145 ÿ 0.16 ÿ 0.17
754 ZHAO ET AL.
JOURNAL OF PHARMACEUTICAL SCIENCES, VOL. 90, NO. 6, JUNE 2001

be calculated from these solute descriptors. Wehave used the ABSOLV program to calculate allthe descriptors used in this work, other than V.The program was written to read molecular stru-ctures as SMILES strings. After calculation of thesolvation descriptors, an error code was given bythe program for each drug as an indication of thequality of the parameter calculations.
Although the basis of calculation of descriptorsby Platts' method is that of group contributions,the method incorporates provision for intramole-cular interactions. For example, phenol hasA� 0.60 and B� 0.30, but the calculated valuesfor catechol (1,2-dihydroxybenzene) are A� 0.84and B� 0.68; intramolecular hydrogen bondingbetween the ortho-hydroxyl groups considerablyreduces overall hydrogen bond acidity. Platts
et al.261 list several examples of ortho-substitutedphenols in which the overall hydrogen bond aci-dity in less than the sum of the A values for theindividual monofunctional compounds.
Statistical Analysis
The data set was analysed using Excel 97. Step-wise regression analysis was used to determinethe most signi®cant descriptors. The regressioncoef®cients were obtained by least-squares regres-sion analysis. For each regression, the followingdescriptive information is provided: number ofobservations used in the analysis (n), square ofthe correlation coef®cient (r2), cross-validated r2
(r2 cv), standard error of the estimate (S), andFisher's criterion (F).
Table 1. (Continued)
213 Iothalamatesodium 613 7.24 1.42214 Sulfasalazine 398 2.44 3.83215 Benazepril 425 2.23 1.82216 Lisinopril 405 13 ÿ 1.71217 Enalaprilat 348 11 0.86218 Amphotericin B 924 1.16 ÿ 2.46e
219 Aztreonam 435 810 ÿ 3.46e
220 Mibefradil 516 0.041 4.41221 Ranitidine 314 24660 0.27 1.33222 Chlorothiazide 296 1854b/283 ÿ 0.24 ÿ 0.31223 Acyclovir 225 33990 ÿ 1.56 ÿ 2.07224 Nor¯oxacin 319 177900 ÿ 1.03 1.57225 Methotrexate 454 2600 ÿ 0.30226 Gabapentin 171 4491 ÿ 1.18227 Prazosin 383 310 2.45228 Olsalazine 302 1.92 4.50
Drugs expected to have higher absorption229 Cipro¯oxacin 331 11480 ÿ 1.08 1.40230 Ribavirin 244 67180 ÿ 1.85 ÿ 3.23231 Pafenolol 337 172 1.67232 Azosemide 371 201 1.35233 Xamoterol 339 11810 0.61 0.39234 Enalapril 376 35 0.79235 Phenoxymethylpenicillin 350 101 2.09 1.90236 Gliclazide 323 138 1.09237 Benzylpenicillin 334 210 1.83 1.70238 Thiacetazone 236 3302 0.88239 Lovastatin 405 2.14 4.26 4.08240 Cromolynsodium 468 210 1.92 1.85241 Erythromycin 734 1.43 2.54 0.65
aCalculated WS values (Calc) from Meylan method.bExperimental WS Values from a data base of Syracuse Corporation.cExperimental log P (M log P) from C log P program.dCalculated log P (C log P)eCalculated log P from Meylan method.fTraining set 2: Drugs 7±8, 11, 15, 18±19, 21±22, 24±38, 136±141, and 143±145.
HUMAN INTESTINAL ABSORPTION OF 241 DRUGS 755
JOURNAL OF PHARMACEUTICAL SCIENCES, VOL. 90, NO. 6, JUNE 2001

Table 2. Absorption, Dose and Percentage of Excretion in Urine, Bile, and Feces of Drugs From Literature
Ratiol
% Between
Parentf Excretioni Insolublek Insoluble Methodn Qualityo
Excretiond Metab.e Drug in Excretiong Excretionh in Urine Drug (IS) Drug and for Obt- of the
in Urine in Urine Urine in Bile in Feces & Feces Oral Dosej in 250 ml Dose After % Abs.m aining % Abs.m
No. % Abs.a % Abs.b % Bio.c (% Dose) (% Dose) (% Dose) (% Dose) (% Dose) (% Dose) (mg) of Water Absorption Chosen %Abs.m Data Ref.p
Training set 1
1 100 100 53 <1 5 100 5±20 96 0 100 BIO Good 1,18±20
2 100 �100 90(68±100) 26/17 0 600 63 0 100 BIO�RA Good 21
3 100 100 100 0 100 EU Good 22±23
4 97±100 100 71 small /5.4 10±20 17 0 100 REV Good 24
5 100 100 REV Good 25
6 �50 �50 1.25±5 0 0 100 REV�EUB Good 4
7 �100 15 25 99 0 100 REV Good 26
8 100 88 <10 100±400 0 0 100 REV Good 27
9 100 15±23 100 100 0 100 REV Good 28
10 94±99 100 99 250 86 0 99 BIO Good 2,29
11 70 98 70 63/.0 7±30 15±240 0 0 98 BIO Good 3,30
12 100 85 98 200±400 0 0 98 EU Good 31
13 91 97 �91 0 97 250 100 3 97 EU Good 32
14 96 10 0 0 96 BIO Good 26
15 95±100 >90 50 95(50F) 3 >95 300 mg/d 0 0 95 EU Good 33,34
16 59/65 0.1 0 0 91 RA Good 35
17 91 �100 90 38.8 > 10.4 55.6 94.4 7.5 0 0 90 BIO Good 36
18 90 40±60 25 20�30 200 98 8 90 REV Good 37
19 100 �100 89 50±100 0 0 89 EU OK 38
20 81±95 >80 59 100±1200 0 0 86 BIO OK 39
21 85 85 EU OK 40
22 84 54/75 15 85 1 84 RA Good 41
23 67 66/81 52/76 32/17 1.2 21 0 81 RA Good 42
24 49/65 17/32 800 0 0 77 RA Good 43
25 62±98 60 48/75 <2 200 0 0 64 RAP OK 1
26 61 61 61 30±50 >2/6±9 32±52 40 7 0 61 BIO�RA Good 44
/50±95 /59±100
27 50±60A 35±50/80 27 500±1500 0 0 53 RAP�BIO OK 45±46
28 44/92 40/1.4 76/94 10 0 0 48 RA Good 47
29 47 21/46 3 0 0 47 RA Good 48
30 30/85 1000 0 0 35 RA Good 49
31 25/80 20±40 mg/kg 0 0 31 RAP OK 50±51
32 30 26/86 500 0 0 30 RAP OK 52
33 16 11.3/73 4.77 0 0 16 RA Good 48
34 12 12 16/98 3 mg/kg 0 0 16 RAP OK 53
35 1±2 35 1.7/94 51/<1 200 0 0 2 RA Good 54
36 1.4 0.5/33 8 0 0 1.4 RA Good 48
37 0.7/94 /94 4000 0 0 1 RA Good 55±56
38 0.6 0.6 0.53/93 10000 0 0 0.6 RA Good 57±59

Table 2. (Continued)
Test set
39 99 100A 20 70 0 100 BIO Good 60
40 100 100A 50 100 0 100 BIO Good 61
41 100A 40±68 16±48 56±100 0 100 BIO Good 4
42 100 66 traces 33 99 10±100 0 0 100 BIO Good 25
43 96 100A 0 100 BIO Good 62
44 100 >80 0.1 0.5 >80 60 100 0 100 EF Good 63
45 95±100 >95 40 >95 <5 50 71 0 100 EU Good 64
46 100 99.5 200±600 100 0 100 EU Good 65±66
47 95±100 >95 22±77 >95 <5 40±60 91 0 100 EU Good 64
48 100 100 80 /75 (20F) 1±3 0 0 100 Good 67
49 100 90A 60±70/61 /30 /91 50 97 0 100 RA Good 68
50 100 100 60/60 5±25 36/36 97/95 0.1 mg/kg 0 0 100 RA Good 69
51 100 100 100/100 >30 small 20 15 0 100 RA Good 70
52 100 100 1 1±300 0 0 100 REV Good 71
53 100 100 100 REV Good 72
54 100 �100 59 30 3 0 100 REV Good 4,73
55 100 2 200 0 0 100 REV Good 25
56 100 4 0 0 100 REV Good 25
57 100 100 17±50 0 100 REV Good 71
58 100 100 60 44±53 /5 8 82 0 100 REV Good 74
59 100 100 5±10 20 71 0 100 REV Good 25
60 100 >90 10±52 70 3 15 85 80±160 99 0 100 REV Good 75
61 91±100 91 1±2.5 38 0 100 Good 76
62 100 40 40 0 0 100 BIO Good 26
63 100 120 100 0 100 BIO Good 26
64 100 100 25 99 0 100 BIO Good 77
65 100 80±90 6±50 mg/kg 89 0 100 REV Good 78
66 100 60/60 35/35 95/95 0.008 0 0 100 RA Good 79
67 100 100 0.2 250 0 0 100 EU Good 80
68 99 99A 10 0 0 99 BIO Good 81
69 100 99 <1 100 650 100 1 99 EU Good 82
70 99 70±100 99 60 98 10±50 0 0 99 EU Good 83±85
71 90±100 >90 30 99(60F) <1 300 49 0 99 EU Good 34,86
72 100 �100 61±98A <2 200 0 0 98 EF Good 87±88
73 98 �100 93±98 �100 traces 100 5 15 0 98 EU Good 89
74 90 65/66 5/1.5 69±86/67 2 0 0 98 RA Good 90
75 95 98 REV Good 91
76 96 95±99 78±122 43±73 11 <1 1000±2000 100 3 97 BIO Good 92±93
77 97 92±102 2 0 0 97 BIO Good 94
78 92 97 50 0 0 97 EU Good 95
79 100 �100 97A 67/69.5 2.5/3.7 0.5±1 68/70 10 mg/kg 0 0 97 RA Good 96
80 100 �100 78/81 33 16/8.7 94/90 0.5 0 0 96 RA Good 97
81 96 96 BIO Good 98
82 95±100 >90 11 64±90 50±150 0 0 95 BIO Good 99
83 95 �100 90±100A <20(0F) 75 240 mg/d 0 0 95 BIO Good 34,
100±101
84 95 91 0.18 1 mg/kg 0 0 95 EU Good 102±103
85 95 >95 16 90±95 0.2 5±10 95±100 200 84 0 95 EU Good 104

Table 2. (Continued)
Ratiol
% Between
Parentf Excretioni Insolublek Insoluble Methodn Qualityo
Excretiond Metab.e Drug in Excretiong Excretionh in Urine Drug (IS) Drug and for Obt- of the
in Urine in Urine Urine in Bile in Feces & Feces Oral Dosej in 250 ml Dose After % Abs.m aining % Abs.m
No. % Abs.a % Abs.b % Bio.c (% Dose) (% Dose) (% Dose) (% Dose) (% Dose) (% Dose) (mg) of Water Absorption Chosen %Abs.m Data Ref.p
86 100 95 80 400 0 0 95 EU Good 105
87 90±95 > 90 33 95(�60F) <4 600 mg/d 91 0 95 EU Good 34
88 97 90 50 95(40F) 3 160 mg/d 0 0 95 EU Good 34
89 95 �100 95 0 95 25±600 0 0 95 EU Good 106
90 72 > 90 75 (25F) 5 6 81 30 mg/d 0 0 95 REV Good 34,107
91 93±96 > 93 93 0.4 100 0 0 93 EU Good 108±109
92 93 75±150 0 0 93 REV Good 98
93 100 �100 >92A 80 80 0±50 1 25±200 73 0 92 BIO Good 110
94 89±95 84±95 84/90 �4 /4 200 60 0 91 RA Good 111±112
95 90 90 80±89 > 80 15 > 80 20 mg/d 0 0 90 BIO Good 33
96 100 well 80±100A 92 75 5±10 10 0 0 90 BIO Good 113
97 90 90A 43 > 43 0.25 47 90 30 97 7 90 BIO Good 114
98 90 90 90A 400 21 0 90 BIO Good 85,115
99 90 30 15±25 0 0 90 EU Good 71
100 90 80 90 5±15 2.7 250 0 0 90 EU Good 116±117
101 90±95 90 43±63 100±1200 0 0 90 EU Good 3,118
102 99 > 90 > 90 60 <6 �100 150 mg/d 0 0 90 EU Good 1
103 80±100 1 0 0 90 BIO good 26
104 65±75 90 �15 10 90 EU Good 119
105 74/82 �0 12.0/14 10±20 58 0 90 RA Good 120
106 97 �100 92.8 71/80 71.9 15 0 0 89 RA Good 121
107 90 89A 120 0 0 89 BIO OK 122
108 20 > 89 > 59 �30 60 0 0 89 EU OK 119
109 100 100 16 62/70 0 9.8/11 72/81 27.5 82 0 88 RA Good 123
110 23 88(80±113) 0.5/0.5 20 3 0 88 EU OK 124±125
111 97 88 89/101 2000 90 2 88 RAP OK 126
112 88 88 BIO OK 98
113 87 87 <1 50±200 72 0 87 EU OK 4,127
114 92±95 > 90 87 60(13F) 35 15 mg/kg 0 0 87 EU OK 34
115 86±88A 100 0 0 87 BIO OK 128
116 100 �100 20±30 85 2 20 0 0 85 EU OK 129
117 85 30 97 12 85 BIO OK 26
118 85 85 BIO OK 98
119 67 71 62A 67±76/93 45±50 38/40 16/0.3 91 100 0 0 84 RA�EF Good 130±131
120 84 84 /63±76 6 0 0 84 BIO OK 132±133
121 84 1200 4 0 84 EU OK 22±134
122 82 82 61 70/84 47/71 7.0/2 77/86 20 0 0 82 RA Good 135
123 82 82 0.6 mg/kg 0 0 82 BIO OK 2,136
124 74±88 400±600 0 0 82 EU OK 93
125 81 100 100 19 81 BIO OK 137
126 80 81 81 330 89 8 81 BIO OK 138±139

Table 2. (Continued)
127 81 0.6±1 mg/kg 0 0 81 BIO OK 98
128 90 90 50 65(30F) 18 >90 300mg/d 35 0 80 REV Good 33±34,140
129 75±80 40±80 79±94/82 15±25 mg/kg 0 0 80 REV Good 55,141
130 80±100 80 68±95 85±95 4 500±1000 0 0 80 BIO OK 142±143
131 92±100 80A 1.5 80 BIO OK 144
132 75 77±80 1.4 8±32 87±98 16±32 0 0 80 EU OK 145
133 75±95 75±95 300 0 0 80 EU OK 55
134 75±80 �0.1 20±25 95±100 80 EU OK 1
135 80 80 BIO OK 119
136 77 50±60/94 125±500 0 0 77 BIO� OK 146
RAP
137 64 62±64 56/90 2.5 mg/d 0 0 64 RA Good 147
138 60 35/60 2.0/27 40/15 75/75 5±20 0 0 60 RA Good 148±149
139 20±35 34 34 0 34/60 /15 /75 80 mg/d 0 0 57 RA DP? 34,150,
151, 271
140 50±54 50 50 10(<10F) 40/90±95 >95 200 mg/d 0 0 50 BIO� OK 34±150
RAP
141 36 30 40/91 200 0 0 44 RAP OK 152
142 44 10 36/82 1.6 0 0 44 RA Good 153
143 37±45 25±30 38 BIO�RAP OK 1
/65±80
144 17 17 /73±94 /73±94 16000 mg/d 0 0 17 RA Good 154
(12±22)
145 <5 2.7/90 10 mg/kg 0 0 3 RAP OK 53
146 92 90±95 17 60±67 0 26�32 86±99 5±20 7 0 92 EF 155
147 60±73 50±73 16 (78F) 8.7/56 5 0 0 62 156
148 60 60 REV 157
149 20±35 28 REV 158
150 poor small 1 REV 55
151 100 >90 19±29 4.9/3.4 <1 92/89 100 2±10 98 0 100 RA IVL 159±160
152 78 78 BIO OK? 98
153 75 76 400 68 0 76 BIO OK? 161±162
(53±88)A
154 71 60 18 500 98 27 71 EU OK? 163
155 64±81 250 0 0 73 EU OK? 55
156 67±90 65±72 65±72 12.5±75 0 0 69(65±72) EU OK? 164
157 60 10 10 0 0 60 EU OK? 165
158 55±75 >57 14 57 36/<15 94 200 0 0 57 EU OK? 166±168
159 50 88 20 0 0 50 EU OK? 169
160 16±26 15.6 500 0 0 16 EU OK? 57±58
161 3±3.8 3 3 0 3 50±100 0 0 3 EU OK? 170
mg/d
162 0.6 2800 0 0 1 EU OK? 56
163 0.3 0.26 8000 0 0 0.3 EU OK? 171
164 100 100 Check 8
165 100 100 Check 8
166 100 100 Check 5
167 90±100 95 Check 9±10,12

Table 2. (Continued)
Ratiol
% Between
Parentf Excretioni Insolublek Insoluble Methodn Qualityo
Excretiond Metab.e Drug in Excretiong Excretionh in Urine Drug (IS) Drug and for Obt- of the
in Urine in Urine Urine in Bile in Feces & Feces Oral Dosej in 250 ml Dose After % Abs.m aining % Abs.m
No. % Abs.a % Abs.b % Bio.c (% Dose) (% Dose) (% Dose) (% Dose) (% Dose) (% Dose) (mg) of Water Absorption Chosen %Abs.m Data Ref.p
168 91 91 Check 5
169 60 60 Check 5,9±10
170 50 50 Check 172
171 28 28 Check 7
172 0 Poor Poor Check 9,158
Zwitterionic drugs
173 100 70 500 45 0 100 BIO Good 173
174 100 100 BIO Good 174
175 100 400 0 0 100 BIO Good 26
176 98 100 85±100 500 11 0 100 EU Good 173
177 100 100 100 100±500 0 0 100 EU Good 175
178 100 100 Check 5
179 94 93 71/82 375±1000 0 0 93 BIO� Good 176±180
RAP
180 90A 90 BIO Good 26
181 90 Rapid 43 <2 > 98 >98/> 90 40 100 10 90 Check 5
182 88 88A 23 6 63 86 200 64 0 88 BIO OK 4,181
183 88 88 59 12 100 4±8 0 0 88 EU OK 182
184 88 88 EU OK 93
185 100 80±90 86A 250 0 0 86 BIO OK 183
186 75A 42±60/80 250 0 0 75 BIO� OK 184
RAP
187 46/73 500 0 0 62 RAP OK 185
188 50±65 1000±3000 0 0 58 EU OK? 30
189 55 53/> 95 <10 500±2000 0 0 55 RA Good 186
190 44/80 10±20 0 0 55 RAP OK 187
mg/kg
191 41 /57 250 0 0 41 Good 188±189
192 1 1 1 Check 190
Drugs with missing fragments from the ABSOLV program
193 4.7 6.5/85 88/4 5 0 0 8 RA Good 191
194 100 100 63 60±75 14±20/19 10 mg/kg 89 0 100 RA Good 192±193
/60±75
195 100 98 30 0 0 98 BIO Good 194
196 95±100 100 75±95 50 30±33 0.3 0 0 95 BIO Good 195±197
197 85 85 EU OK 50
198 58/81 500 0 0 72 RA Good 198
199 50 100 mg/d 0 0 50 EU OK? 55
200 32 24/74 19±35 2±20 0 0 32 RA Good 199
mg/kg

Table 2. (Continued)
201 23 23 /100 13/71 5±200 0 0 23 BIO� OK 200
(12±37)A RAP
Dose-limited, dose-dependent,and formulation-dependent drugs
202 > 73 53 0 20 37 40±95 50±200 96 23 73 EUB DL 201
203 50 50 6±25 /0±16 /30±66 100±600 96 46 50 BIO DL 202±203
(25±75) /30±50 (25±75)
204 47 38/80 500 99 52 47 RAP DL 204
205 36 36±52 36 500 99 63 44 RA DL 205
(36±52)
206 35±37 37 4.5/12 500 100 63 37 RAP� DL 206
BIO
207 36 25±29 8.6/29 63±81 72±90 10 100 64 36 RA DL 207±208
/42±61
208 34 34 18 20/60 71/34 91/94 20 85 51 34 RA DL? 159,209
209 35 10±60 8 mg/kg 100 65 28(10±65) BIO DL 210±211
210 28 28 6 2.5±5.5 > 5 85 0.5±2.5 100 72 28 REV DL 4,212
mg/d
211 5 trace 5 5(0.7±23) 25±45 50±60 58 53 12 BIO� DL 213±214
(0.7±23) EU
212 1.0/95 1000 96 95 1 RAP DL? 215
213 1.9 1.9 1.4/75 800 100 98 1.9 RAP DL 216
214 12±13 56±61 2000 100 35 59(56±61) EU DL? 217
215 37 > 37 37 0.4 97 20 97 60 � 37 EU DL? 218±219
216 25 25 25±50A /100 29 56 97 10±20 78 40 28 BIO� DL? 220±221
(25±50) EF
217 9±10 10±40 29 69 98 10 72 43 25(10±40) EU DL? 222±224
218 5 poor 2±5 0 2000±5000 100 95 3(2±5) EU DL 225
219 <1 <1 0.7/68 500 60 59 1 RA DL? 226±227
220 37±109 10±320 100 31 69 BIO DP 228
(37±100)
221 50±61 50 30/70 40±80 0 0 64(39±88) BIO DP 1
(39±88)
222 13±56 0 33±56/92 50±250 0 0 49(36±61) RA DP 229
223 20±30 15±30 /98 8±14 14/75 /2 100±600 0 0 23(15±30) BIO DP 230
224 35 30±40 �70 30 small 29 69 400 0 0 71 EF DP 231±232
225 20±100 100 48±70/84 35/10 0±7 78/88 0.1±10 0 0 70(57±83) RA DP 233±235
mg/kg
226 50 well 60A 0 74±43 100±900 0 0 59(43±74) BIO�EU DP 3,30,143
(36±74)
227 100 44±69 <4 77±95 1 0 0 86(77±95) EUB FD 236
228 2.3 2.3A 17±31 0.25±1.1 1000±4000 100 76 24(17±31) EU DL?-M 237
/22
Drugs expected to have higher absorption
229 69±100 69 42/60 200 0 0 � 69 RAP 238±239
230 33 4.4/17 6.2/29 800 0 0 � 33 BIO� 240
RAP
231 28 1.9/4.8 16/56 74/28 40 0 0 � 29 RAP 241

Table 2. (Continued)
Ratiol
% Between
Parentf Excretioni Insolublek Insoluble Methodn Qualityo
Excretiond Metab.e Drug in Excretiong Excretionh in Urine Drug (IS) Drug and for Obt- of the
in Urine in Urine Urine in Bile in Feces & Feces Oral Dosej in 250 ml Dose After % Abs.m aining % Abs.m
No. % Abs.a % Abs.b % Bio.c (% Dose) (% Dose) (% Dose) (% Dose) (% Dose) (% Dose) (mg) of Water Absorption Chosen %Abs.m Data Ref.p
232 10 2.0/20 20±80 0 0 �10 RAP 242
233 5 /90 3.1/62 50±200 0 0 �5 RAP 243
234 66 60±70 29±50 61 29 90 10 13 0 66 EU� 223±224
(61±71) EF 244±246
235 45 45 49 30 0 32 71±100 22 0 0 59(49±68) EU� 247
(31±60) (22±52) EF
236 60±70 10±20 70±90 �65 EU 40
237 30 15±30 15±30 500 90 60 �30 EU DL? 248
238 20 150 0 0 �20 EU 55
239 30 31 9.6 83 93 20±100 99 68 �10 EU DL 159,249
240 0 0.4 82 20 0 0 � 0.4 EU 250
241 35 35 > 4.5 �35 BIO 2,251
aThe data used for QSAR studies was taken from Clark (1999) and Wessel (1998), Palm (1997), Yazdanian (1998), Yee (1997), and Chiou (1998).bAbsorption data obtained from the original and review literature.cBioavailability or absolute bioavailability of oral administration.dPercentage of cumulative drug and its metabolites in urine following oral/intravenous administration.ePercentage of metabolites in urine by oral/intravenous administration or ®rst pass effect (F).fPercentage of unchanged drug in urine by oral/intravenous administration.gPercentage of excretion in bile by oral/intravenous administration.hPercentage of excretion in feces by oral/intravenous administration.iPercentage of cumulative recovery in urine and feces by oral/intravenous administration.jSingle dose (mg or mg/kg) and daily dose (mg/d).kPercentage of insoluble oral dosed drugs in 250 ml water (IS).lRatio between insoluble drug and dose administered after absorption 100� [Dose � (1ÿ fraction absorbed)ÿ 0.25 � WS] /Dose.mAbsorption data (or averaged values) chosen here based on the analysis of literature.nMethod for obtaining absorption data (%Abs.m).oQuality of the data based on the analysis of literature.pNotes for some of the drugs from literature:1. Drug 35: Additionally, up to 35% of radioactivity of acarbose was absorbed after degradation by digestive enzymes and/or intestinal microorganisms.2. Drug 59: 100% oral absorption in humans was obtained from studies in rabbits.3. Drug 61: Absorption data were obtained from the small intestinal zone 100±200 cm.4. Drugs 144, 191, and 205: Absorption was evaluated from the urinary excretion ratio of oral and intravenous administration based on literature, although the authors did not give the
urinary excretion in detail.5. Drug 146: Assuming all intact PN200-100 found in feces to represent unabsorbed drug, the extent of absorption could be as high as 90±95% of the dose. Although the possibility of drug
metabolism by intestinal epithelium or microbial ¯ora cannot be predicted, rapid urinary excretion of the administered dose also supported ef®cient oral absorption.6. Drug 147: The absorbed amount was calculated as the sum of unchanged drug, systemically and presystemically conjugated terbutaline plus de®cit.7. Drug 202: The extent of absorption must be at least �73% because 53% and 20% of an orally administered radioactive dose of spironolactone in an alcoholic solution were excreted in
urine and bile, respectively.8. Durg 206: Azithromycin gains entry into cells by both passive and active transport.9. Drug 215: If biliary excretion occured, the extent of absorption may well have been greater. In animal studies, signi®cant biliary excretion has been found (>50% of intravenous dose or
of absorbed fraction of oral dose).10. Drug 224: Recovery of the drug in feces from 12 healthy volunteers given single oral 400-mg doses averaged 28% over the ensuing 48 h. Because the drug is excreted in the bile to only a
small extent, these results imply an oral bioavailability of �70%.11. Drug 227: the data of 77±95 is the percentage of excretion in urine and bile.12. Drug 239: Estimate for absorption in humans based upon hydroxyacid form as intravenous reference.

RESULTS AND DISCUSSION
Evaluation of Human Intestinal Absorption Data
Drug absorption is a complex process that isdependent on numerous biochemical, physiologi-cal, and physicochemical factors. In a thoroughreview of the subject, Sietsema263 accuratelypoints out that the terms absorption and bioavail-ability are often incorrectly and interchangeablyused. Sietsema de®ned absorption as ``the drugpassing from the lumen of the gastrointestinal(GI) tract into the tissue of the GI tract. Once inthe tissue, the drug is considered absorbed''.
Surveying the papers, it was found thatthe absorption data were obtained by differentmethods. Most of the absorption data from theliterature were based on one of the three mainmethods outlined next. These data form the basisby which all methods of predicting absorption arejudged and from which all are devised.
Method 1: Bioavailability
Bioavailability measurements are one method ofobtaining absorption data (Drugs 1±2, 10, 39±40,64, 76±77, and 96±98). If bioavailability is high(> 80%), it can be assumed that the bioavail-ability of the drug can re¯ect absorption becausethe effect of ®rst-pass metabolism is minimal andalmost all the absorbed drug can reach the sys-temic circulation. However, it may underestimateabsorption if the bioavailability of the drug is low(Drug 241) because a fraction of the absorbed drugmay not reach the systemic circulation. Followingabsorption from the gastrointestinal tract, thedrug passes directly to the liver via the hepaticportal vein where it may be extensively metabo-lized before reaching the systemic circulation.
Methods 2: Excretion in Urine and FecesFollowing Oral Administration
The percentage of cumulative excretion of drug inurine or feces following oral administration isanother common method used to derive absorp-tion data. For example, absorption data werederived from the percentage of cumulative urin-ary excretion of unchanged drug and its metabo-lites (Drugs 3, 12, 15, 45±47, 69±71, and 84±89),percentage of cumulative fecal excretion of un-changed drug (Drug 146) or drug-related material(Drugs 44, 72, and 224), and the range betweenthe percentage of parent drug in urine and 100%of metabolites excreted in the feces (Drug 234).
There were fewer excretion data in feces availablein comparison with urinary excretion data.
If the drug could be completely recovered fromthe urine and feces, and urinary excretion was themain elimination route for the absorbed drug, useof this method is correct. However, this methodwould result in signi®cant mis-estimation if one offollowing cases occurred. (1) The drug cannot becompletely recovered in urine and feces. A de®citfraction of the drug may still be in the humanintestinal tract or the absorbed drug may not havefully been excreted in urine because of the timelimit (Drugs 147 and 224).156 This situation can beseen on the total recovery of drugs 28, 44, 60, 74,79, 109, and 122 following oral administrationand drugs 74, 79, 109, 138, 139, and 203 followingintravenous administration. (2) If the urinarydata are used when the absorbed drug is also ex-creted by a route other than the urine. For exam-ple, after intravenous administration, <50% ofcertain drugs (Drugs 2, 151, and 207) were shownto be excreted in the urine. Thus a fraction of theabsorbed drug could also be excreted in the feces.In this respect, if it cannot be proved that urinaryexcretion is the main route for excretion of absor-bed drug (i.e., by intravenous administration), itis dif®cult to say whether absorption obtained bythis method is reliable (Drugs 236±240).
To investigate the excretion route of absorbeddrug, regression analysis was carried out by use ofpercentage of excretion in urine and feces (Table 2)following intravenous administration. The resultsshowed that the percentage of urinary excretiondecreased or fecal excretion increased with incre-asing octanol±water partition coef®cient, espe-cially for the drugs with C log P> 0 (Figure 1).This result suggests that the more hydrophobic adrug, the more likely it is to be excreted in thefeces. Figure 1 may suggest that if the C log P waslarger than zero, the absorbed drug would not be
Figure 1. Dependence of urinary excretion of drug-related material following intravenous administrationon C log P.
HUMAN INTESTINAL ABSORPTION OF 241 DRUGS 763
JOURNAL OF PHARMACEUTICAL SCIENCES, VOL. 90, NO. 6, JUNE 2001

completely excreted in urine; it would be excretedin feces as well. This would result in mis-esti-mation with use of the urinary excretion methodfor highly hydrophobic drugs.
Method 3: The Ratio of Cumulative UrinaryExcretion of Drug-Related Material FollowingOral and Intravenous Administration
The ratio of cumulative urinary excretion of drug-related material (parent drug and its metabolites)following oral and intravenous administrationwas used to evaluate the absorption of drug; forexample, drugs 22, 29, 32±36, 38, 50±51, 66, and79±80. This method is better than the urinaryexcretion method because the absorption data canbe estimated more accurately even if the urinaryexcretion of absorbed drug is not the main route orthe drug is not completely recovered from urineand feces. The greater the extent of urinaryexcretion of drugs from intravenous administra-tion, the greater the validity of the absorptiondata. This relationship would result in greatermistakes for drugs in which both urinary excre-tion fractions from oral and intravenous admin-istrations were very low.
Although this method is better than the uri-nary recovery method, the intravenous adminis-tration of some drugs has not been determinedin humans,141,167±232 sometimes because of thelow aqueous solubility of the drugs.201 If the drugundergoes extensive hepatic metabolism, theabsorption cannot be accurately evaluated bythe ratio of urinary excretion of parent drug; thismethod will under-estimate the absorption. Forexample, the absorptions evaluated by the ratio ofcumulative urinary excretion of mercaptoethaneand fenoterol are 75% and 60%, respectively.However the absorptions evaluated by the ratio ofurinary excretion of the parent drugs are 25% and7%, respectively. There are 25% and 53% estima-tion errors between the two approaches for thetwo drugs, respectively. Absorption evaluated bythe ratio of cumulative urinary excretion ofparent drug (Drugs 229±233) is not reliable.
Dif®culties in Evaluation of Absorption
(1) Low Solubility and Dose-Limited Absorption.Water solubility is an important factor in drugabsorption. Phenytoin is well known for its poorsolubility in water; its absorption varies consider-ably among different preparations and dosages.264
For dose-limited drugs with poor solubility, in-complete dissolution and hence incomplete absor-
ption may occur. Absorption is highly variable forthese drugs (Drugs 202±219).159,210,214 For insta-nce, the excretion in feces of fosinopril varies from63 to 81%, and total cumulative excretion in urineand feces of spironolactone varies from 40 to 95%,following oral administration. One reason for thisvariability may be their hydrophobic properties,which would prevent complete dissolution in theintestinal ¯uid. The lack of dispersion of the drugis one cause of incomplete absorption.210 Forinstance, the volume of water required to dissolve20 mg of lovastatin is > 15 L (the solubility is0.0013 g/L at pH 5.0 and 23�C).159 Some of thedrugs were completely insoluble in the intestinal¯uid (Drugs 181, 207, 209, and 210). Oily andalcoholic solution were used to dissolve drugs 202and 209.
To correct for low solubility, Dressman85 intro-duced the absorption potential (AP). With thisapproach, log P is corrected for molar fraction ofun-ionized species at pH 6.5 (Fnon), the solubilityof the un-ionized species in water (WS), thevolume of the luminal contents (VL), and the doseadministered (XO):
AP � log�P� Fnon �WS� VL=XO� �2�
Doses received by subjects listed in Table 2showed that 20 drugs were dosed singly at >1 g(Drugs 20, 27, 30, 37, 38, 76, 101, 111, 121, 130,144, 162, 163, 179, 188, 189, 212, 214, 218, and228); the highest single dosage being 10 g (Drug38). However, when a large dose was given orally,urinary excretion and bioavailability decreasedgreatly.184, 234, 235 This result could be understoodon the basis of an ``absorption window'' effect.184
The question then arises as to whether these drugswere completely dissolved in the intestinal ¯uid.
Generally, the average weight of subjects wastaken to be 70 kg for pharmacokinetic studies.The subjects either received single dosed drugswith 200 mL of water (usually 100±250 mL), orsubjects received the drugs three times a day.Because small intestinal volume is assumed to be250 mL,265 the percentage of undissolved drugsfor a single dose in 250 mL of water [100�(1ÿ 0.25�WS/Dose)] was calculated and listed inTable 2. The results showed (Table 2) that therewere 37 drugs for which the insoluble percentagewas > 90% in 250 mL of water. However, absor-ption is not a partition process and water is notthe same as intestinal ¯uid. Also, large estimationerrors in the Meylan solubility calculations mayarise for the larger drug molecules.
764 ZHAO ET AL.
JOURNAL OF PHARMACEUTICAL SCIENCES, VOL. 90, NO. 6, JUNE 2001

The ratios between the amount of insolubledrug and dose in 250 mL of water after absorption{100�Dose� (1ÿ fraction absorbed)ÿ 0.25�WS]/Dose} are also listed in Table 1. The results showthat there were 22 drugs for which the ratio wasstill > 20% after absorption. These drugs weredose limited because of their low solubility andabsorption. However, for a drug that has lowsolubility but a high absorption of 80%, the absor-ption of drug will still be reliably estimatedbecause, after absorption, the insoluble drugwould represent <20% of the administered dose(Drugs 1, 2, 7, 9, 13, 18, 40, 44, 46, 60, and 63).
(2) Formulation and Salt Dependent Absorption.Many drugs were not administered orally as thefree base or acids because of their poor watersolubility, stability, hygroscopicity, crystallinity,or purity. These drugs were usually combinedwith acids or bases to form a salt or formulatedwith a lipophilic solvent, a hydrophilic solvent,and a surfactant that interact to aid in dispersionand emulsi®cation. Therefore, the absorption ofsome drugs was formulation or salt dependent.236
(3) Dose-Dependent Absorption. Dose-dependentabsorption of the drug is based on the observationthat the percentage of the oral dose absorbed,bioavailability, and excretion in urine declinedwith increasing dose (Drugs 220±226). Variableurinary recovery or bioavailability with dose mayre¯ect a variation in absorption.232
(4) Drugs Metabolized in Intestinal Tract. Cer-tain drugs may be metabolized by enzymes ormicro¯ora that reside in the gut or gut wall and itis dif®cult to quantify this intestinal metabolism.Absorption can be unreliable if metabolism occursin the intestine. Within the gastrointestinal tract,metabolic reactions (namely, conjugation, enzy-matic hydrolysis of esters, and reduction processes)occur primarily via micro¯ora. Phase-I biotrans-formation occurs predominantly via cytochromesP450, the major enzyme being CYP3A. More than50% of drugs may be substrates for CYP3A, thusresulting in poor oral bioavailability due to ex-tensive metabolism in the intestine266±267 (forexample, drugs 35 and 228).
Classi®cation of Absorption Data
Because the absorption data obtained from theliterature was from different methods, it seemsunrealistic to expect to ®nd a single model that
will accurately predict all classes of compounds ifthe absorption data is not classi®ed carefully.9,268
Therefore, it is very necessary to sort out the databased on the original papers before embarking onQSAR studies.
The absorption data chosen for modeling inTable 2 (%Abs.m) were based on one of the fol-lowing methods:
1. BIO: Absorption was obtained from bioavail-ability values after oral administration. Ifthe bioavailability was low, the absorptionshould be equal to or higher than the valuesof bioavailability (Drug 241).
2. RA: Absorption was evaluated from theratio of urinary excretion of drug-relatedmaterial following oral and intravenousadministration.
3. RAP: Absorption was evaluated from theratio of urinary excretion of parent drug fol-lowing oral and intravenous administration.
4. EU: Absorption was obtained from cumula-tive urinary excretion of drug-related mate-rial following oral administration. If theurinary excretion was low (<80%) and itcould not be proved that urinary excretion ofabsorbed drug was the main route or nearlyall the drug was recovered in urine andfeces, the absorption should be equal to orhigher than the percentage of urinary excre-tion of the drug (Drugs 236±240).
5. EF: Absorption was obtained from excretionin feces (100ÿ% excreted in feces).
6. EUB: Absorption was obtained from thecumulative excretion of drug in urine andbile.
7. REV: Absorption was obtained from reviewpapers.
8. EU�EF: Intravenous administration sho-wed that nearly all of the drug was excretedin urine or that excretion in bile was small;however, the drug was not completely re-covered in urine and feces. Thus, the absorp-tion should be between the percentage ofexcretion in urine and feces (100ÿ% ex-creted in feces).
The following key was used as an indication ofthe quality of the data based on the analysis justpresented;
Good:
1. The absorption data are evaluated based onthe ratio of cumulative urinary excretion of
HUMAN INTESTINAL ABSORPTION OF 241 DRUGS 765
JOURNAL OF PHARMACEUTICAL SCIENCES, VOL. 90, NO. 6, JUNE 2001

drug-related material following oral and in-travenous administration, and intravenousadministration results showed that percen-tage of urinary excretion was > 20%, or
2. Drugs with bioavailability � 90% (absorp-tion would be 90±100%, estimation errorwould be <10%), or
3. Cumulative urinary excretion following oraladministration is > 90% (absorption wouldbe 90±100%, estimation error would be<10%) or cumulative fecal excretion is<10%, or
4. Values from review papers, provided thatthe quoted absorption was > 80%.
OK:
1. The bioavailability is 80±90% (absorptionwould be 80±100%; estimation error wouldbe <20%), or
2. The percentage of cumulative drug-relatedmaterial in urine is 80±90% (absorptionwould be 80±100%; estimation error wouldbe <20%) or the cumulative fecal excretionis 10±20%, or
3. The absorption data are evaluated based onthe ratio of urinary excretion of parent drugfollowing oral and intravenous administra-tion and percentage of urinary excretion ofparent drug following intravenous adminis-tration is > 70%. The absorption may beunderestimated by this approach. For exam-ple, the absorption evaluated by the ratios ofcumulative urinary excretion of sorivudine-related material and parent drug are 82%and 66%, respectively. There is 16% estima-tion error between the two approaches. Theapproach may (or partly) re¯ect the absorp-tion if the drug has a higher intravenousadministration.
OK? (Uncertain):
1. Based on the analysis of the excretion inurine following intravenous administration(Figure 1), the C log P of these drugs is <0;therefore, the urinary excretion may be themain route for the absorbed drug. If the drugcould be completely recovered in urine andfeces, the percentage of excretion in urinewould re¯ect the absorption of the drug, or
2. Bioavailability or the urinary excretion ofdrug-related material is 70±80% (estimationwould be <30%).
DP:
1. The absorption of the drugs is dose-depen-dent based on the literature.
DL:
1. The drugs are dose-limited and > 20% of thedrug is still insoluble in 250 mL of waterafter absorption. Absorption is highly vari-able and incomplete for these drugs.
DL?:
1. The drugs may not be dose-limited after thecorrection of solubility by pKa at pH� 6.5.
FD:
1. The absorption is variable depending onthe formulation of the drug (formulationdependent).
M:
1. The drugs were metabolized in the intestinebefore passing through the membrane.
IVL:
1. The excretion in urine is so low followingintravenous administration (� 20%) thatthe absorption data may not be reliablebased on the method of the ratio of urinaryexcretion following oral and intravenousadministration.
In summary, it is dif®cult to be absolutely surethat some of these data refer to true absorption®gures. If metabolism could occur during passageacross the gastrointestinal tract, absorption datawould be not reliable from the ratio of urinaryexcretion of drug-related material following oraland intravenous administration.54 Bioavailabilityand urinary excretion data > 70% may also re¯ectthe absorption (Drugs 152±154). Although thereis no doubt that some drugs are dose-limited, it isdif®cult to give a de®nition of a dose-limited drugbecause many factors can affect the solubility inthe intestinal ¯uid and absorption in humans,such as the absorption mechanisms,268 drug for-mulation, food composition, chemical composi-tion, pH of the intestinal secretions, gastricemptying time, intestinal motility, and blood¯ow.269 The pharmacokinetics of some drugs were
766 ZHAO ET AL.
JOURNAL OF PHARMACEUTICAL SCIENCES, VOL. 90, NO. 6, JUNE 2001

extremely complex, and our knowledge of theirin vivo behavior is still far from complete.225
Nadolol seems to be a dose-dependent drug.271
Some absorption data have not been checkedbecause these original papers have not been found(Drugs 164 ± 172 and 241). The absorption infor-mation contained in each of the original refer-ences were extracted and recorded in the hopethat this would be of value of investigators inter-ested in QSAR studies on oral drug absorption.
Relationship between Human IntestinalAbsorption and Abraham Descriptors
To apply eq.1 to the absorption data, we take %absorption as the dependent variable, SP. Al-though this approach is contrary to the idea of eq. 1as a linear free energy relationship, it is the onlypractical way of including all the relevant data. Itis possible to convert percent absorption into arate constant, or the logarithm of a rate constant,but only by omitting all drugs with 0% absorptionand 100% absorption. Thus, all our correlationequations are couched in terms of eq.1, with per-cent absorption as SP.
To model human intestinal absorption usingthe Abraham descriptors, two training sets wereselected from drugs 1± 145 because these absorp-tion data are considered to be comparatively reli-
able (Good and OK). Training set 1 is chosen by analternative space-®lling design technique devel-oped by Kennard and Stone.270 The principle ofthe method is based on the distribution of chosendescriptors. The descriptors of a training setshould cover the whole descriptor space of thetotal set, and the histogram of the training setshould relate to that of the total set, as shown inFigure 2 for training set 1. However, the histo-gram of the total set, and of course training set 1,is completely biased towards drugs with 100%absorption and it might be suggested that anymathematical analysis will also be biased in thisway. We therefore chose another training set,based on histogram analysis, that is not biasedtowards 100% absorption. Although this secondtraining set enables us to test for bias in thedependent variable, it is not statistically as soundas training set 1, because it does not take intoaccount the distribution of descriptors. Therefore,we use training set 2 only as a test for the afore-mented bias. Figure 2 shows the histograms forthe two separate training sets, the total data setand also the histogram of the data set from Wesselet al.10
Results of the two training set regression ana-lyses using the Abraham descriptors in eq. 1 aregiven in Table 3 (Models 1 and 3). Step-wise re-gression was carried out to ®nd the signi®cant
Figure 2. Histograms of training set and total set.
HUMAN INTESTINAL ABSORPTION OF 241 DRUGS 767
JOURNAL OF PHARMACEUTICAL SCIENCES, VOL. 90, NO. 6, JUNE 2001

descriptors. The result showed that the signi®-cant descriptors were A, B, and V (Models 2 and 4in Table 3) and the two dominant descriptors wereA and B. This is in agreement with previous workthat suggests hydrogen-bond donors and hydro-gen-bond acceptors or polar molecular surface aregood descriptors with which to model humanintestinal absorption.9±11 The coef®cient standarderrors of the variables are �±5 for the two train-ing sets (Models 1 ± 4) and 2.5 for the whole dataset (Models 5 ± 6). The results indicate that models1, 2, 3, and 4 are relatively similar. The two dif-ferent ways of obtaining a training set result invery similar absorption models. However, Models1 and 2 are statistically superior to Models 3 and4. Use of Kennard and Stone selection results intraining and test sets that have less bias (bias isde®ned as the average difference between thepredicted and actual values in the test set). Models1±4 show that increasing the volume (hydropho-bic part) and decreasing the polarity of a com-pound can increase human intestinal absorption.Introducing solubility, octanol±water partitioncoef®cient, molecular weight, and pKa terms didnot improve the regression results. The details ofdrugs used for analysis are listed in Table 4.
For the full equation (Model 5), we have calcu-lated the t-statistic as follows: E (1.05), S (1.71), A(8.20), B (ÿ 12.6), and V (5.11). These resultsshow, as already indicated by our step-wise re-gression, that the descriptors E and S are
statistically not very signi®cant. We have alsochecked the inter-correlation of descriptors, andfor the full data set of 169 compounds used inModels 5 and 6 we ®nd cross-correlations in r2 tobe as follows:
S A B VE 0.617 0.053 0.312 0.373S 0.197 0.426 0.460A 0.272 0.037B 0.404
The only cross-correlation that is rather high isthat between E and S. Fortunately, neither E norS is very signi®cant and so the E/S cross-corre-lation presents no real problem. Thus for thetruncated equation (Model 6) the largest cross-correlation in r2 is only 0.404, between B and V.
Table 3. Regression Results of Different Training Sets by Abraham Descriptorsa
Training Set Test Set
No. Data Set Model r2 r2cv n S F RMSE n RMSE AAE AE
1 Training 1 %Abs.� 90� 2.11E� 1.70Sÿ 20.7A 0.83 0.75 38 16 31 14 131 14 11 ÿ 1ÿ 22.3B� 15.0V
2 Training 1 % Abs.� 92ÿ 20.0Aÿ 21.9B� 17.2V 0.82 0.77 38 15 53 14 131 14 11 ÿ 13 Training 2 % Abs.� 82� 3.97Eÿ 3.58Sÿ 19.5A 0.85 0.73 31 14 28 12 138 19 16 ÿ 13
ÿ 18.0B� 14.0V4 Training 2 % Abs.� 83ÿ 19.9Aÿ 18.6B� 13.6V 0.85 0.78 31 13 50 12 138 19 17 ÿ 145 Total data % Abs.� 92� 2.94E� 4.10Sÿ 21.7A 0.74 0.72 169 14 93 14 Ð Ð Ð Ð
ÿ 21.IB� 10.6V6 Total data % Abs.� 96ÿ 20.0Aÿ 19.8B� 13.9V 0.72 0.71 169 15 144 14 Ð Ð Ð Ð7 Training 1 % Abs.� 89ÿ 24.0Aÿ 18.9B� 16.8V 0.80 0.75 49 17 43 16 Ð Ð Ð Ð
�DL ÿ 0.421IS8 Total data % Abs.� 93ÿ 21.3Aÿ 19.0B� 14.6V 0.74 0.72 180 15 124 15 Ð Ð Ð Ð
�DL ÿ 0.386IS
a Training Set 1: see Table 1. Training set 2: drugs 7±8, 11, 15, 18±19, 21±22, 24±38, 136±141, and 143±145. Total data: drugs 1±172. RMSE: root mean square error, RMSE� [S (CalcÿObs)2/n]0.5. AAE: average absolute error, AAE�S|CalcÿObs|n. AE:average error, AE�S (CalcÿObs)/n. IS: % insoluble oral dosed drug in 250 mL of water.
Table 4. Details of drugs used for analysis
Number of Drug No. inParameter Drugs Tabels 1,2, and 5
Total number 241 1±241investigated
Training set 1 38 1±38Test set 131 39±165,167,
169±171Dose-limited drugs 11 202±212
added for analysisin Models 7 and 8
768 ZHAO ET AL.
JOURNAL OF PHARMACEUTICAL SCIENCES, VOL. 90, NO. 6, JUNE 2001

Figure 3 shows the prediction result for the testset by Model 1 (Drugs 39±172). The predictedabsorption is in agreement with observed absorp-tion for 131 compounds. Only drug 161 (^ inFigure 3) is an obvious outlier according to theAbraham model. A possible reason for this outlieris that the drug may not be completely recoveredin the urine and feces, even if the urinary excre-tion is the main route. Absorption may be under-estimated by use of the percentage of excretion inurine. Absorption correction for dose-limiteddrugs was applied both to Model 2 and to thetotal data set by using additional descriptors (viz.:solubility, octanol±water partition coef®cient,molecular weight, and administered dose). Theresult (Models 7 and 8; Figure 3) shows that thebest additional descriptors were the solubility anddose. The latter was expressed by the percentageof insoluble drug (IS) administered in 250 mL ofwater (Table 2) for dose-limited drugs, with thepercentage taken as zero for drugs 1±172. Theregression result suggests that the more insolublea dose-limited drug, the lower the absorptionwill be.
Table 5 lists the predicted absorption and alsothe residuals (ObservedÿPredicted) for dose-dependent, dose-limited drugs before the doseand solubility correction and drugs 229±241 obtai-ned by Model 1 in Table 3. Results (Figure 4) showthat almost all the absorption predicted for dose-dependent drugs (Drugs 220±226) is in the rangeof observed absorption. Absorption prediction forsome of the dose-limited drugs (Drugs 203, 205,206, and 209) is in agreement with or is in therange of the observed absorption, and for some ofthe dose-limited drugs (202, 204, 207, 208, and210±212), the predicted values are higher thanthe observed absorption. This result is in agree-
ment with the point that absorption is highlyvariable and incomplete for the dose-limiteddrugs.163, 218, 223 Platts method cannot accuratelycalculate the descriptors for drugs 193±201 beca-use of missing fragments. The absorption predic-tion for some of these drugs does not agree wellwith the observed absorption, possibly because ofthe inaccurate calculation of descriptors.
The prediction of absorption for drugs 229±241is higher than the observed absorption; which isin agreement with what we would expect for thesedrugs based on the method from which the absor-ption was derived. For example, absorption evalu-ated by the percentage of urinary excretion ofdrugs 236±240 is lower than the predicted absor-ption because excretion in urine for the absorbeddrug may not be the only route for excretion.These drugs have C log P values above zero; fecalexcretion may be another route for the absorbeddrug. Hence, absorption would be underestimatedby the urinary excretion method.
All the descriptors used in our calculation referto the neutral form of drugs, and we have includedno correction for ionization of strong Brùnstedacids and bases. Inspection of the calculatedand observed % absorption reveals no particulartrend of ionizable drugs. However, to assess morerigorously any effects, we carried out an analysisof 169 drugs used in Model 5 with inclusion ofan indicator variable (I) for strong acids withpKa <4.5 and bases with pKa> 8.5; I is takenas unity for the strong acids and strong bases,and zero for all other compounds. The resultingequation is:
% Abs: � 94� 2:90E� 2:71Sÿ 20:7Aÿ 20:9B
� 11:2V ÿ 3:14I
n � 169 S � 14% r2 � 0:74 F � 78 �3�
It can be seen that the additional indicatorvariable (I) is hardly signi®cant (� � 0:25, t �ÿ1:16), and so we conclude that any ionization ofBrùnsted acids and bases has a very smalleffect indeed (3%) on the percent absorption. It isnoteworthy that previous workers9±11 have madeno ionization correction either.
It is useful to compare the statistics of thevarious equations put forward for the correlationof percent absorption. Clark9 carried out only aqualitative analysis, but Wessel et al.10 and Palmet al.11 both listed statistics as shown in Table 6.In their analysis, Palm et al.11 gave standarddeviations in the percent absorption observed
Figure 3. Relationship of the observed and predictedabsorption.
HUMAN INTESTINAL ABSORPTION OF 241 DRUGS 769
JOURNAL OF PHARMACEUTICAL SCIENCES, VOL. 90, NO. 6, JUNE 2001

Table 5. Observed and predicted absorption from Model 1
Method Qualityfor of the
obtaining %Abs. Observed Predicted Obs.ÿ ErrorNo %Abs. Data %Abs. %Abs. Pred. E S A B V Codea
1 BIO Good 100 97 3 2.30 3.40 0.46 2.04 3.40 ÿ 0P2 BIO�RA Good 100 89 11 0.24 0.47 0.59 0.44 1.31 ÿ 0P3 EU Good 100 85 14 1.05 0.89 0.72 0.38 0.99 ÿ 0P4 REV Good 100 104 ÿ 4 2.38 2.11 0.00 1.15 2.07 ÿ 0P5 REV Good 100 80 19 2.87 3.60 0.58 1.91 2.17 ÿ 0P6 REV�EUB Good 100 87 13 2.60 3.89 1.30 1.88 3.56 ÿ 0P7 REV Good 100 107 ÿ 7 1.72 2.56 0.00 2.28 3.99 ÿ 0P8 REV Good 100 98 2 0.97 0.81 0.03 0.84 1.58 ÿ 0P9 REV Good 100 109 ÿ 9 3.07 2.83 0.00 2.08 3.59 ÿ 0P10 BIO Good 99 94 5 1.62 1.40 0.59 0.75 1.78 ÿ 0P11 BIO Good 98 91 7 2.79 2.81 0.50 1.09 1.65 ÿ 0P12 EU Good 98 92 6 1.19 2.21 0.00 1.28 1.62 ÿ 0P13 EU Good 97 100 ÿ 3 2.12 1.25 0.00 1.39 2.29 ÿ 0P14 BIO Good 96 73 23 2.14 2.95 1.12 1.90 2.58 ÿ 0P15 EU Good 95 94 1 1.13 1.18 0.10 1.44 2.26 ÿ 0P16 RA Good 91 75 15 2.24 2.09 0.55 2.11 2.36 ÿ 0P17 BIO Good 90 82 8 3.25 3.78 0.25 2.64 2.83 ÿ 0P18 REV Good 90 98 ÿ 8 2.28 3.09 0.59 1.28 2.57 ÿ 0P19 EU OK 89 87 2 1.77 3.25 0.22 2.18 2.71 ÿ 0P20 BIO OK 86 57 29 1.20 2.40 0.54 2.78 2.21 ÿ 0P21 EU OK 85 84 1 1.35 2.15 0.93 1.09 2.06 ÿ 0P22 RA Good 84 109 ÿ 26 1.73 1.88 0.00 1.45 3.00 ÿ 0P23 RA Good 81 53 27 3.20 5.34 1.72 4.62 5.75 ÿ 0P24 RA Good 77 79 ÿ 3 1.13 1.60 0.35 0.99 0.89 ÿ 0P25 RAP OK 64 66 ÿ 3 1.53 2.11 0.59 2.14 1.96 ÿ 0P26 BIO�RA Good 61 69 ÿ 9 2.05 2.55 1.36 1.47 2.10 ÿ 0P27 RAP�BIO OK 53 57 ÿ 5 1.18 1.35 0.27 2.17 1.09 ÿ 0P28 RA Good 48 55 ÿ 7 1.55 1.45 1.41 1.68 1.73 ÿ 0P29 RA Good 47 78 ÿ 31 2.50 4.41 0.86 3.08 4.08 ÿ 0P30 RA Good 35 59 ÿ 24 1.39 2.18 0.78 1.71 1.11 ÿ 0P31 RAP OK 31 36 ÿ 5 0.67 1.42 1.52 1.78 0.86 ÿ 0P32 RAP OK 30 23 7 0.83 2.44 1.88 2.37 1.23 ÿ 0P33 RA Good 16 21 ÿ 5 3.94 6.54 2.13 6.12 6.14 ÿ 0P34 RAP OK 16 29 ÿ 14 2.08 3.00 1.76 2.72 1.79 ÿ 0P35 RA Good 2 ÿ 20 22 3.31 4.47 2.53 6.19 4.38 ÿ 0P36 RA Good 1.4 28 ÿ 28 3.13 5.12 2.32 4.09 4.16 ÿ 0P37 RA Good 1 6 ÿ 5 2.80 2.71 1.20 5.40 3.36 ÿ 0P38 RA Good 0.6 18 ÿ 18 1.95 2.57 1.70 3.53 2.23 ÿ 0P
Test set39 BIO Good 100 99 1 2.63 2.56 0.00 1.84 2.67 ÿ 0P40 BIO Good 100 99 1 2.39 2.72 0.59 1.19 2.53 ÿ 0P41 BIO Good 100 101 ÿ 1 1.79 2.46 0.43 1.18 2.58 ÿ 0P42 BIO Good 100 76 24 2.82 3.51 0.58 2.08 2.17 ÿ 0P43 BIO Good 100 76 24 1.93 1.84 0.42 1.38 1.22 ÿ 0P44 EF Good 100 96 4 3.43 2.83 0.33 2.25 3.40 ÿ 0P45 EU Good 100 106 ÿ 6 1.99 1.57 0.09 1.04 2.26 ÿ 0P46 EU Good 100 101 ÿ 1 1.80 1.76 0.59 0.62 1.98 ÿ 0P47 EU Good 100 107 ÿ 7 1.97 1.56 0.00 1.15 2.40 ÿ 0P48 Good 100 100 0 2.69 2.37 0.10 1.39 2.26 ÿ 0P49 RA Good 100 92 8 1.97 1.88 0.78 0.87 2.03 ÿ 0P50 RA Good 100 83 17 2.18 2.53 0.37 2.03 2.45 ÿ 0P
770 ZHAO ET AL.
JOURNAL OF PHARMACEUTICAL SCIENCES, VOL. 90, NO. 6, JUNE 2001

Table 5. (Continued)
51 RA Good 100 101 ÿ 1 1.61 2.32 0.35 1.13 2.38 ÿ 0P52 REV Good 100 85 15 1.94 1.81 0.00 1.47 1.36 ÿ 0P53 REV Good 100 91 9 1.90 2.98 0.53 1.71 2.74 ÿ 0P54 REV Good 100 89 11 2.12 2.50 0.97 1.16 2.39 ÿ 0P55 REV Good 100 80 20 2.47 3.53 0.58 1.92 2.21 ÿ 0P56 REV Good 100 79 21 2.95 3.60 0.58 2.04 2.30 ÿ 0P57 REV Good 100 90 10 1.05 1.09 0.00 1.11 1.37 ÿ 0P58 REV Good 100 100 0 2.13 2.15 0.00 1.46 2.27 ÿ 0P59 REV Good 100 78 22 2.84 3.61 0.58 2.06 2.25 ÿ 0P60 REV Good 100 108 ÿ 8 1.70 2.48 0.00 2.07 3.79 ÿ 0P61 Good 100 111 ÿ 11 1.58 2.47 0.00 1.16 2.62 ÿ 0P62 BIO Good 100 71 29 1.91 2.06 0.49 1.77 1.56 ÿ 0P63 BIO Good 100 123 ÿ 23 2.43 2.03 0.02 1.11 3.30 ÿ 0P64 BIO Good 100 111 ÿ 11 2.07 3.17 0.00 1.57 3.09 ÿ 0P65 REV Good 100 99 1 1.94 2.42 0.00 1.60 2.45 ÿ 0P66 RA Good 100 84 16 1.26 1.55 1.19 1.44 3.03 ÿ 0P67 EU Good 100 94 6 1.78 1.78 0.00 1.37 1.87 ÿ 0P68 BIO Good 99 94 5 2.33 2.21 0.28 1.24 1.93 ÿ 0P69 EU Good 99 83 16 2.83 3.31 0.56 2.47 3.20 ÿ 0P70 EU Good 99 82 17 2.19 3.26 0.72 2.00 2.75 ÿ 0P71 EU Good 99 98 1 1.85 1.36 0.10 1.29 2.15 ÿ 0P72 EF Good 98 83 15 1.15 1.42 0.32 1.47 1.87 ÿ 0P73 EU Good 98 94 4 2.30 2.43 0.55 1.26 2.31 ÿ 0P74 RA Good 98 90 8 1.44 1.71 0.35 1.48 2.28 ÿ 0P75 REV Good 98 75 23 2.46 2.87 0.50 1.71 1.59 ÿ 0P76 BIO Good 97 106 ÿ 9 0.93 1.23 0.00 0.69 1.82 ÿ 0P77 BIO Good 97 83 14 2.52 2.81 0.50 1.76 2.18 ÿ 0P78 EU Good 97 93 4 1.24 1.32 0.35 1.36 2.37 ÿ 0P79 RA Good 97 95 2 1.53 1.58 0.00 1.05 1.48 ÿ 0P80 RA Good 96 70 26 2.20 2.73 1.41 1.76 2.64 ÿ 0P81 BIO Good 96 99 ÿ 3 1.68 1.52 0.00 0.98 1.63 ÿ 0P82 BIO Good 95 84 11 1.69 2.30 0.35 1.62 2.01 ÿ 0P83 BIO Good 95 74 21 1.54 1.98 0.74 1.74 2.10 ÿ 0P84 EU Good 95 86 9 2.02 1.78 0.26 1.75 2.21 ÿ 0P85 EU Good 95 90 5 1.80 2.38 0.00 1.76 2.09 ÿ 0P86 EU Good 95 97 ÿ 2 0.86 0.84 0.59 0.50 1.78 ÿ 0P87 EU Good 95 86 9 2.20 2.13 0.77 1.62 2.64 ÿ 0P88 EU Good 95 93 2 1.26 1.18 0.10 1.49 2.22 ÿ 0P89 EU Good 95 80 15 1.45 1.95 0.58 1.64 2.18 ÿ 0P90 REV Good 95 84 11 1.47 1.81 0.10 2.03 2.38 ÿ 0P91 EU Good 93 97 ÿ 4 1.25 1.03 0.10 1.25 2.16 ÿ 0P92 REV Good 93 79 17 1.84 2.11 0.53 1.29 1.40 ÿ 0P93 BIO Good 92 95 ÿ 3 1.63 1.78 0.59 0.86 1.98 ÿ 0P94 RA Good 91 83 8 2.06 3.16 0.72 1.98 2.80 ÿ 0P95 BIO Good 90 99 ÿ 9 1.33 1.29 0.10 1.44 2.57 ÿ 0P96 BIO Good 90 85 5 1.69 2.02 0.59 1.23 1.87 ÿ 0P97 BIO Good 90 82 8 2.88 3.57 0.58 1.91 2.32 ÿ 0P98 BIO Good 90 89 1 2.21 1.68 0.48 1.21 1.87 ÿ 0P99 EU Good 90 94 ÿ 4 0.94 0.77 0.18 0.63 1.24 ÿ 0P100 EU Good 90 79 11 1.86 2.46 0.66 1.62 2.07 ÿ 0P101 EU Good 90 83 7 1.44 1.48 0.70 1.12 1.77 ÿ 0P102 EU Good 90 77 13 1.87 2.55 0.20 2.41 2.46 ÿ 0P103 BIO Good 90 103 ÿ 13 2.58 2.22 0.00 1.32 2.20 ÿ 0P104 EU Good 90 88 2 1.24 1.30 0.35 1.50 2.23 ÿ 0P105 RA Good 90 111 ÿ 11 1.71 2.43 0.32 1.54 2.92 ÿ 0P106 RA Good 89 88 1 2.51 2.33 0.38 1.49 1.99 ÿ 0P
HUMAN INTESTINAL ABSORPTION OF 241 DRUGS 771
JOURNAL OF PHARMACEUTICAL SCIENCES, VOL. 90, NO. 6, JUNE 2001

Table 5. (Continued)
Method Qualityfor of the
obtaining %Abs. Observed Predicted Obs. ErrorNo %Abs. Data %Abs. %Abs. Pred. E S A B V Codea
107 BIO OK 89 94 ÿ 5 2.70 2.63 0.68 1.04 2.07 ÿ 0P108 EU OK 89 87 2 1.88 1.68 0.26 1.73 2.25 ÿ 0P109 RA Good 88 101 ÿ 13 1.75 2.17 0.32 1.37 2.71 ÿ 0P110 EU OK 88 97 ÿ 9 1.72 2.47 0.32 1.53 2.64 ÿ 0P111 RAP OK 88 79 9 1.59 2.14 0.68 0.95 1.15 ÿ 0P112 BIO OK 88 57 31 1.62 2.06 0.61 2.34 1.67 ÿ 0P113 EU OK 87 98 ÿ 11 1.14 1.31 0.09 1.07 1.94 ÿ 0P114 EU OK 87 81 6 1.68 1.48 0.47 1.58 2.01 ÿ 0P115 BIO OK 87 69 18 2.34 2.36 0.51 1.92 1.53 ÿ 0P116 EU OK 85 78 7 2.10 1.68 0.55 1.76 2.06 ÿ 0P117 BIO OK 85 85 0 2.02 3.15 0.42 1.84 2.37 ÿ 0P118 BIO OK 85 93 ÿ 8 1.85 1.94 0.19 1.74 2.54 ÿ 0P119 RA�EF Good 84 80 4 1.15 1.68 0.50 1.31 1.62 ÿ 0P120 BIO OK 84 88 ÿ 4 2.48 2.46 0.28 1.54 1.94 ÿ 0P121 EU OK 84 84 0 0.93 1.35 0.59 0.80 1.29 ÿ 0P122 RA Good 82 57 25 2.55 2.71 0.93 2.39 2.00 ÿ 0P123 BIO OK 82 84 ÿ 2 2.18 3.23 0.72 2.02 2.90 ÿ 0P124 EU OK 82 80 2 0.76 2.38 0.00 2.28 2.36 ÿ 0P125 BIO OK 81 91 ÿ 10 0.82 1.80 0.54 1.41 2.60 ÿ 0P126 BIO OK 81 89 ÿ 8 2.30 1.90 0.26 1.88 2.55 ÿ 0P127 BIO OK 81 78 3 1.77 2.08 0.61 1.37 1.60 ÿ 0P128 REV Good 80 83 ÿ 3 1.60 2.40 0.58 1.97 2.76 ÿ 0P129 REV Good 80 76 4 0.78 0.79 0.22 1.81 1.83 ÿ 0P130 BIO OK 80 73 7 1.27 1.81 1.02 0.85 1.17 ÿ 0P131 BIO OK 80 83 ÿ 3 2.09 3.22 0.77 2.01 2.91 ÿ 0P132 EU OK 80 84 ÿ 4 1.85 1.60 0.11 1.51 1.56 ÿ 0P133 EU OK 80 66 14 1.21 1.89 0.55 1.51 1.03 ÿ 0P134 EU OK 80 82 ÿ 2 2.35 3.41 0.42 2.16 2.52 ÿ 0P135 BIO OK 80 109 ÿ 29 1.61 1.59 0.00 1.25 2.71 ÿ 0P136 BIO�RAP OK 77 88 ÿ 11 1.98 2.71 0.25 1.83 2.34 ÿ 0P137 RA Good 64 86 ÿ 22 2.84 3.09 0.81 1.59 2.50 ÿ 0P138 RA Good 60 50 10 2.21 2.16 1.82 2.05 2.36 ÿ 0P139 RA DP? 57 77 ÿ 20 1.61 1.63 0.70 1.88 2.49 ÿ 0P140 BIO�RAP OK 50 79 ÿ 29 1.45 1.89 0.55 1.75 2.18 ÿ 0P141 RAP OK 44 72 ÿ 28 1.84 2.93 0.75 2.21 2.53 ÿ 0P142 RA Good 44 56 ÿ 12 1.41 1.44 1.28 1.71 1.70 ÿ 0P143 BIO�RAP OK 38 57 ÿ 19 2.61 2.53 1.07 2.47 2.26 ÿ 0P144 RA Good 17 25 ÿ 8 0.79 1.76 1.78 1.93 0.70 ÿ 0P145 RAP OK 3 20 ÿ 17 2.15 3.08 2.02 2.96 1.85 ÿ 0P146 EF 92 96 ÿ 4 1.67 2.46 0.32 1.62 2.71 ÿ 0P147 62 58 4 1.41 1.40 1.28 1.74 1.84 ÿ 0P148 REV 60 50 10 3.23 3.15 1.28 3.06 2.81 ÿ 0P149 REV 28 56 ÿ 28 1.88 2.36 0.84 3.17 3.10 ÿ 0P150 REV 1 ÿ 4 5 3.50 3.75 0.81 6.78 4.02 ÿ 0P151 RA IVL 100 84 16 2.39 2.45 1.28 1.60 3.13 ÿ 0P152 BIO OK? 78 80 ÿ 2 2.98 2.99 0.20 2.81 3.02 ÿ 0P153 BIO OK? 76 78 ÿ 2 1.34 1.40 0.55 1.12 1.28 ÿ 0P154 EU OK? 71 88 ÿ 17 1.26 1.58 0.59 1.33 2.30 ÿ 0P155 EU OK? 73 66 7 0.88 1.11 0.19 1.55 0.70 ÿ 0P156 EU OK? 69(65±72) 55 14 2.19 3.13 1.49 1.78 1.73 ÿ 0P157 EU OK? 60 53 7 1.39 1.59 1.08 2.22 1.94 ÿ 0P158 EU OK? 57 73 ÿ 16 1.87 2.33 0.82 1.88 2.27 ÿ 0P
772 ZHAO ET AL.
JOURNAL OF PHARMACEUTICAL SCIENCES, VOL. 90, NO. 6, JUNE 2001

Table 5. (Continued)
159 EU OK? 50 54 ÿ 4 2.54 3.25 0.95 2.23 1.51 ÿ 0P160 EU OK? 16 37 ÿ 21 1.00 1.83 1.63 1.97 1.31 ÿ 0P161 EU OK? 3 55 ÿ 52 2.52 2.89 1.08 2.18 1.72 ÿ 0P162 EU OK? 1 ÿ 6 7 3.33 3.13 0.87 6.94 4.28 ÿ 0P163 EU OK? 0.3 ÿ 8 8 2.74 3.51 2.20 5.05 3.26 ÿ 0P164 Check 100 90 10 1.61 1.89 0.32 1.59 2.39 ÿ 0P165 Check 100 110 ÿ 10 1.29 1.38 0.00 1.20 2.79 ÿ 0P166 Check 100 90167 Check 95 82 13 1.64 1.96 0.35 1.84 2.23 ÿ 0P168 Check 91 90169 Check 60 100 ÿ 40 3.47 3.04 0.28 1.81 2.92 ÿ 0P170 Check 50 77 ÿ 27 1.62 1.99 0.11 1.83 1.55 ÿ 0P171 Check 28 54 ÿ 26 2.20 2.44 0.91 2.44 1.92 ÿ 0P172 Check Poor 45 2.16 1.84 0.04 4.80 3.65 ÿ 0P
Zwitterionic drugs173 BIO Good 100 53 47 2.72 3.07 1.12 2.80 2.49 ÿ 10P174 BIO Good 100 80 20 2.27 2.64 0.00 2.54 2.50 ÿ 10P175 BIO Good 100 85 15 2.05 2.45 0.00 2.22 2.41 ÿ 10P176 EU Good 100 69 31 2.54 2.77 0.58 2.50 2.43 ÿ 10P177 EU Good 100 72 28 2.34 2.74 0.58 2.32 2.39 ÿ 10P178 Check 100 70 30 0.47 0.59 0.52 0.89 0.56 ÿ 10P179 BIO�RAP Good 93 52 41 2.53 2.90 1.12 2.85 2.54 ÿ 10P180 BIO Good 90 100 ÿ 10 1.93 1.56 0.59 1.23 2.89 ÿ 10P181 Check 90 113 ÿ 23 3.90 3.15 0.59 1.71 3.98 ÿ 10P182 BIO OK 88 88 0 2.84 3.20 0.17 2.20 2.63 ÿ 10P183 EU OK 88 94 ÿ 6 2.10 2.07 0.59 1.50 2.81 ÿ 10P184 EU OK 88 77 11 0.86 1.11 0.59 0.78 0.89 ÿ 10P185 BIO OK 86 55 31 1.36 1.30 1.36 1.50 1.43 ÿ 10P186 BIO�RAP OK 75 37 38 3.65 4.11 1.73 3.48 3.04 ÿ 10P187 RAP OK 62 67 ÿ 5 2.36 2.60 0.58 2.56 2.48 ÿ 10P188 EU OK? 58 72 ÿ 14 0.56 0.76 0.77 0.93 1.09 ÿ 10P189 RA Good 55 76 ÿ 21 0.62 0.83 0.77 0.91 1.30 ÿ 10P190 RAP OK 55 65 ÿ 10 0.46 0.74 0.79 1.34 1.26 ÿ 10P191 Good 41 56 ÿ 15 1.35 1.26 1.36 1.54 1.57 ÿ 10P192 Check 1 43 ÿ 42 4.47 5.36 1.28 4.08 3.48 ÿ 10P
Drugs with missing fragments from ABSOLV program193 RA Good 8 96 ÿ 88 1.75 2.23 0.00 2.30 3.32 ÿ 20P194 RA Good 100 70 30 2.10 1.99 0.49 2.01 1.82 ÿ 60P195 BIO Good 98 89 9 1.31 1.34 0.94 0.79 2.07 ÿ 60P196 BIO Good 95 80 15 1.60 1.49 0.64 1.16 1.53 ÿ 60P197 EU OK 85 ÿ 70 155 4.31 6.77 4.02 7.65 4.91 ÿ 60P198 RA Good 72 60 12 2.62 3.23 0.97 2.58 2.43 ÿ 60P199 EU OK? 50 ÿ 45 95 3.96 6.12 3.18 7.20 4.84 ÿ 60P200 RA Good 32 65 ÿ 33 1.45 1.89 0.43 2.01 1.47 ÿ 60P201 BIO�RAP OK 23 116 ÿ 93 0.87 0.62 0.00 0.13 1.72 ÿ 60P
Dose-limited, dose-dependent, and formulation-dependent drugs202 EUB DL 73 108 ÿ 35 2.25 3.74 0.00 1.82 3.17 ÿ 0P203 BIO DL 50(25±75) 68 ÿ 18 3.03 3.81 0.38 3.81 3.90 ÿ 0P204 RAP DL 47 78 ÿ 31 2.97 4.16 0.31 3.22 3.49 ÿ 0P205 RA DL 44(36±52) 70 ÿ 26 2.58 3.89 0.41 3.31 3.36 ÿ 0P206 RAP�BIO DL 37 58 ÿ 21 1.97 3.26 0.93 5.04 6.00 ÿ 0P207 RA DL 36 90 ÿ 54 1.61 3.25 0.50 2.92 4.47 ÿ 0P208 RA DL? 34 73 ÿ 39 1.37 2.08 1.63 1.81 3.37 ÿ 0P209 BIO DL 28(10±65) 36 ÿ 8 3.97 6.84 1.54 8.65 10.02 ÿ 0P210 REV DL 28 66 ÿ 38 3.94 4.38 0.84 4.03 4.48 ÿ 0P
HUMAN INTESTINAL ABSORPTION OF 241 DRUGS 773
JOURNAL OF PHARMACEUTICAL SCIENCES, VOL. 90, NO. 6, JUNE 2001

for 16 drugs. The average of these standarddeviations is 9%, so that it is unreasonable toexpect any equation to correlate percent absorp-tion to less than this value. The RMSE values ofPalm et al.11 and Wessel et al.10 in Table 6 thusrepresent about the limit of correlative equations.Of course, predictions of percent absorption for a
test set cannot be expected to be better thancorrelations, as shown by the RMSE of 16% for10 drugs in the test set of Wessel et al.10 Bycomparison, our RMSE of 14% for a test set of noless than 131 drugs represents a very good pre-diction, bearing in mind the experimental error inthe data.
Table 5. (Continued)
Method Qualityfor of the
obtaining %Abs. Observed Predicted Obs. ErrorNo %Abs. Data %Abs. %Abs. Pred. E S A B V Codea
211 BIO�EU DL 120(0.7±23) 76 ÿ 74 3.51 2.91 0.81 2.93 3.73 ÿ 0P212 RAP DL? 1 58 ÿ 57 2.66 3.38 0.91 2.93 2.73 ÿ 0P213 RAP DL 1.9 78 ÿ 76 3.44 3.39 1.57 1.33 2.50 ÿ 60P214 EU DL? 59(56±61) 83 ÿ 24 3.18 3.10 1.27 1.49 2.70 ÿ 10P215 EU DL? � 37 101 ÿ 64 2.34 2.43 0.28 1.84 3.27 ÿ 10P216 BIO�EF DL? 28(25±50) 69 ÿ 41 1.79 2.42 0.96 2.56 3.19 ÿ 10P217 EU DL? 25(10±40) 74 ÿ 49 1.60 2.18 0.78 2.08 2.66 ÿ 10P218 EU DL 3(2±5) 17 ÿ 14 3.70 5.37 3.37 5.70 7.12 ÿ 10P219 RA DL? 1 50 ÿ 49 2.77 4.36 1.15 3.18 2.76 ÿ 10P220 BIO DP 69(37±100) 106 ÿ 37 2.28 2.57 0.43 1.91 3.89 ÿ 0P221 BIO DP 64(39±88) 78 ÿ 14 1.60 2.29 0.20 2.28 2.40 ÿ 0P222 RA DP 49(36±61) 56 ÿ 7 2.18 3.12 1.21 1.97 1.69 ÿ 0P223 BIO DP 23(15±30) 63 ÿ 40 2.34 2.67 0.83 1.87 1.52 ÿ 0P224 EF DP 71 79 ÿ 8 2.08 2.46 0.31 2.10 2.27 ÿ 10P225 RA DP 70(57±83) 56 14 3.91 4.73 1.80 2.77 3.22 ÿ 10P226 BIO�EU DP 59(43±74) 78 ÿ 19 0.63 0.83 0.77 0.93 1.44 ÿ 10P227 EUB FD 86(77±95) 87 ÿ 1 3.40 3.81 0.25 2.38 2.74 ÿ 0P228 EU DL?�M 24(17±31) 80 ÿ 56 2.21 1.61 1.43 0.81 2.03 ÿ 0P
Drugs expected to have higher absorption229 RAP � 69 80 ÿ 11 2.27 2.57 0.31 2.10 2.30 ÿ 10P230 BIO�RAP � 33 44 ÿ 11 1.71 2.66 1.13 2.44 1.58 ÿ 0P231 RAP � 29 80 ÿ 51 1.41 1.75 0.67 2.01 2.84 ÿ 0P232 RAP � 10 73 ÿ 63 2.84 3.17 1.46 1.50 2.34 ÿ 10P233 RAP � 5 62 ÿ 57 1.80 2.37 0.74 2.66 2.57 ÿ 0P234 EU�EF 66(61±71) 89 ÿ 23 1.50 2.29 0.28 2.09 2.94 ÿ 10P235 EU�EF 59(49±68) 76 ÿ 17 2.20 2.58 0.40 2.28 2.44 ÿ 0P236 EU � 65 78 ÿ 13 1.85 2.52 0.77 1.76 2.36 ÿ 0P237 EU DL? � 30 77 ÿ 47 2.18 2.49 0.56 2.06 2.38 ÿ 0P238 EU � 20 64 ÿ 44 2.05 2.25 0.98 1.82 1.77 ÿ 0P239 EU DL � 10 109 ÿ 99 1.29 2.22 0.35 1.32 3.29 ÿ 0P240 EU � 0.4 67 ÿ 66 3.10 3.64 1.35 2.41 3.04 ÿ 0P241 BIO � 35 61 ÿ 26 1.97 3.55 1.02 4.71 5.77 ÿ 0P
aError code:1. ÿ0P: The descriptors are OK by ABSOLV program.2. ÿ10P: Zwitterionic molecule. The program calculates descriptors for the neutral form, but in many environments the charged
form will dominate.3. ÿ20P: Charged molecule. There are no fragments for these molecules, such as COÿ2 or NR�4 .4. ÿ 60P: Missing fragment. The molecule has an atom or atoms for which no fragment values have been de®ned. The descriptors
calculated from ABSOLV will be wrong.5. All the drugs and drug-like materials with the error code of ÿ10P, ÿ 20P, and ÿ 60P were not used in all of the regression
analyses.6. Dose-limited drugs are de®ned as 100� [Dose � (1ÿ fraction absorbed) ÿ 0.25�WS]/Dose>20%.
774 ZHAO ET AL.
JOURNAL OF PHARMACEUTICAL SCIENCES, VOL. 90, NO. 6, JUNE 2001

In conclusion, the Abraham descriptors are ableto successfully predict absorption for a diverse setof drugs. The signi®cant descriptors are the sum-mation of solute hydrogen bond acidity (A) andthe summation of solute hydrogen (B), but thevolume term may also contribute to the ab-sorption. The predicted absorption could also be®tted very well with the observed absorption forlarge drugs (molecular weight> 500) if they werenot dose-limited (Drugs 150, 163 and 197). Most ofthe dose-limited drugs satis®ed the ``rule of 5'';that is, they have molecular weight of > 500 andnumber of hydrogen bond donors > 5 or numberof hydrogen bond acceptors > 10. They usuallyhave low solubility and their absorption variesconsiderably among different preparations.264
The absorption is usually higher dosed in solutionthan in solid form.26 The absorption of these drugsmay not only be controlled by the passive diffusionrate, but also by the in vivo dissolution rate insmall intestinal ¯uid. Therefore, the solubilityand dose are very important pieces of informationthat should be known before QSAR analysis isattempted on the human absorption because thedrug may be dose limited and have lower absorp-tion. The absorption model allows prediction of
human intestinal absorption to about� 15% andcan be used to determine how to modify drugstructure to improve absorption.
In a following paper, we aim to discuss themechanism of human intestinal absorption andfactors such as the rate-limiting step of absorptionand the contribution of ionized and unionizedspecies.
ACKNOWLEDGMENTS
Y. H. Zhao and J. Le are grateful to Glaxo Well-come and Roche Products Ltd. for a postdoctoralresearch fellowship and a research studentship.
REFERENCES
1. Lauritsen K, Laursen LS, Raskmadsen 1990. J.Clinical pharmacokinetics of drugs used in thetreatment of gastrointestinal diseases Part(I). Clinpharmacokinet 19:11±31.
2. Goodman LS. 1996. The pharmacological Basisof Therapeutics, 9th edition. New York: McGrawHill, PP. 641, 1712±1792.
3. Walker MC, Patsalos PN. 1995. Clinical pharma-cokinetics of new antiepileptic drugs. PharmacolTher 67:351±384.
4. Physicians' Desk Reference 53rd ed 1999. Mon-tvale, NJ: Medical Economics Data ProductionCompany, pp. 1323, 3257, 1252, 2414±2415, 2072.
5. Yee, S. 1997. In vitro permeability across caco-2cells (colonic) can predict in vivo (small intestinal)absorption in man-fact or myth. Pharm Res 14:763±766.
6. Biganzoli E, Cavenaghi LA, Rossi R, Brunati MC,Nolli ML. 1999. Use of a caco-2 cell culture modelfor the characterization of intestinal absorption ofabtibiotics. Il Farmaco 54:594±599.
7. Irvine ID, Takahashi L, Lockhart K, Cheong,Tolan JW, Selick HE, Russell Grove J. 1999.MDCK (madin-darby canine kidney) cells: A toolfor membrane permeability screening. J PharmSci 88:28±33.
8. Chiou WL, Barve A. 1998. Linear correlation ofthe fraction of oral dose absorbed of 64 drugsbetween humans and rats. Pharm Res 15:1792±1795.
9. Clark DE. 1999. Rapid calculation of polar mole-cular surface area and its application to the pre-diction of transport phenomena. 1. Prediction ofintestinal absorption J Pharm Sci 88:807±814.
10. Wessel MD, Jurs PC, Tolan JW, Muskal SM. 1998.Prediction of human intestinal absorption of drugsfrom molecular structure. J Chem Inf Comput Sci38:726±735.
Figure 4. Plot of absorption observed and predictedby Model 1.
Table 6. Comparison of Statistics for Equations forPercent Absorption
Training Set Test Set
Source r2 n RMSE, % n RMSE, %
Palm et al.11 0.94 20 9 Ð ÐWessel et al.10 Ð 67 9 10 16No. 1, Table 3 0.83 38 14 131 14No. 5, Table 3 0.74 169 14 Ð Ð
HUMAN INTESTINAL ABSORPTION OF 241 DRUGS 775
JOURNAL OF PHARMACEUTICAL SCIENCES, VOL. 90, NO. 6, JUNE 2001

11. Palm K, Stenberg P, Luthman K, Artursson P.1997. Polar molecular surface properties predictand the intestinal absorption of drugs in humans.Pharm Res 14:568±571.
12. Yazdanian M, Glynn SL, Wright JL, Hawi A. 1998.Correlating partitioning and caco-2 cell perme-ability of structurally diverse small molecularweight compounds. Pharm Res 15:1490±1494.
13. Breitkreutz J. 1998. Prediction of intestinal drugabsorption properties by three-dimensional solu-bility parameters. Pharm Res 15:1370±1375.
14. Sugawara M, Takekuma Y, Yamada H, KobayashiM, Iseki K, Miyazaki K. 1998. A general approachfor the prediction of the intestinal absorption ofdrugs: Regression analysis using the physicoche-mical properties and drug-membrane electrostaticinteraction. J Pharm Sci 87:960±966.
15. Lipinski CA, Lombardo F, Dominy BW, FeeneyPJ. 1997. Experimental and computational appro-aches to estimate solubility and permeability indrug discovery and development settings. AdvDrug Deliv Rev 23:3±25.
16. Palm K, Luthman K, Ungell AL, Strandlund G,Artursson P. 1996. Correlation of drug absorptionwith molecular surface properties. J Pharm Sci85:32±39.
17. Winiwarter S, Bonham NM, Ax F, Hallberg A,Lennernas H. 1998. Correlation of human jejunalpermeability (in vivo) of drugs with experimen-tally and theoretically derived parameters. Amultivariate data analysis approach J Med Chem41:4939±4949.
18. Vanpeer A, Woestenborghs R, Verlinden M,Meuldermans W, Heykants J. 1986. Pharmacoki-netics of cisapride in healthy volunteers. Diges-tion 34:138.
19. Meuldermans W, Vanpeer A, Hendrickx J,Lauwers W, Swysen E, Bockx M, WoestenborghsR, Heykants J. 1988. Excretion and biotrans-formation of cisapride in dogs and humans afteroral administraion. Drug Metab Dispos 16:403±409.
20. Wiseman LR, Faulds D. 1994. Cisapride. An up-dated review of its pharmacology and therapeuticef®cacy as a prokinetic agent in gastrointestinalmotility. Drugs 47:116±152.
21. Klotz U, Antonin KH. 1977. Pharmacokineticsand bioavailability of sodium valproate. ClinPharmacol Ther 21:736±743.
22. Latini R, Cerletti C, de Gaetano G, Dejana E,Galletti F, Urso R, Marzot M. 1986. Comparativebioavailability of aspirin from buffered, enteric-coated and plain preparations. Int J Clin Phar-macol Ther Toxicol 24:313±318.
23. Rowland M, Riegelman S. 1968. Pharmacoki-netics of acetylsalicylic acid and salicylic acidafter intravenous administration in man. J PharmSci 57:1313±1319.
24. Mandelli M, Tognoni G, Garattini S. 1978. Clinicalpharmacokinetics of diazepam. Clin Pharmacoki-net 3:72±91.
25. Olkkola KT, Brunetto AV, Mattila MJ. 1994. Phar-macokinetics of oxicam nonsteroidal anti-in¯am-matory agents. Clin Pharmacokinet 26: 107±120.
26. Rodighiero V. 1999. Effects of liver disease onpharmacokinetics - An update Clin Pharmacokinet37:399±431.
27. Labbe L, Turgeon J. 1999. Clinical pharmacokine-tics of mexiletine. Clin Pharmacokinet 37:361±384.
28. Greene DS, Barbhaiya RH. 1997. Clinical phar-macokinetics of nefazodone. Clin Pharmacokinet33:260±275.
29. Calvo MV, Dominguez-Gil A, Minalles JM, DePablo F. 1979. Pharmacokinetics of naproxen inhealthy volunteers and in patients with diabeticmicroangiopathy. Int J Clin Pharm Biopharm 17:486±491.
30. Elwes RD, Binnie CD. Clinical pharmacokineticsof newer antiepileptic drugsÐLamotrigine, viga-batrin, gabapentin and oxcarbazepine. Clin Phar-macokinet 31:403±415.
31. Lloyd-Jones JG, Henson R, Nichols JD, Green-slade D, Clifford JM. 1981. Pharmacokinetics ofintravenous and oral tolmesoxide. Eur J ClinPharmacol 19:119±125.
32. Brien J, Loomis C. 1983. Disposition and pharma-cokinetics of disul®ram and calcium carbamide(calcium cyanamide). Drug Metab Rev 14:113±126.
33. Frishman WH, Tepper D, Lazar E, Behrman D.1990. BetaxololÐa new long-acting betal-selectiveadrenergic blocker. J Clin Pharmacol 30:686±692.
34. Meier J. 1982. Pharmacokinetic comparison ofpindolol with other beta-adrenoceptor-blockingagents. J Am Heart J 104:364±373.
35. Fishman J, Roffwarg H, Hellman L. 1973. Disposi-tion of naloxone-7, 8-3H in normal and narcotic-dependent man J Pharmacol Exp Ther 187:575±580.
36. Sonders RC. 1986. Pharmacokinetics of terazosin.Am J Med 80:20±24.
37. Davies NM, Watson MS. 1997. Clinical pharma-cokinetics of sulindacÐA dynamic old drug. ClinPharmacokinet 32:437±459.
38. Kobari T, Iguro Y, Ito T, Namekawa H, Kato Y,Yamada S. 1985. Absorption, distribution andexcretion of sultopride in man and several animalspecies. Xenobiotica 15:605±613.
39. Sachdeo RC. 1998. TopiramateÐClinical pro®le inepilepsy. Clin Pharmacokinet 34:335±346.
40. Harrower ADB. 1996. Pharmacokinetics of oralantihyperglycaemic agents in patients with renalinsuf®ciency. Clin Pharmacokinet 31:111±119.
41. Haustein KO, Huller C. 1988. The pharmacoki-netics and metabolism of propiverine in man. EurJ Drug Metab Pharmacokinet 13:81±90.
776 ZHAO ET AL.
JOURNAL OF PHARMACEUTICAL SCIENCES, VOL. 90, NO. 6, JUNE 2001

42. Hinderling PH, Hartmann D. 1998. Pharmacoki-netics of digoxin and main metabolite derivativesin healthy humans. Ther Drug Monit 13:381±401.
43. James CA, Mant TGK, Rogers HJ. 1987. Pharma-cokinetics of intravenous and oral sodium 2-mercaptoethane sulfonate (mesna) in normalsubjects. Brit J Chin Pharmacol 23:561±568.
44. Benet LZ. 1979. Pharmacokinetics/pharmacody-namics of furosemide in man: A review. Pharma-cokinet Biopharm 7:1±27.
45. Tucker GT, Casey C, Phillips P, Connor H, WardJD, Woods HF. 1981. Metformin kinetics inhealthy-subjects and in patients with diabetes-mellitus. Br J Clin Pharmacol 12:235±246.
46. Scheen AJ. 1996. Clinical pharmacokinetics ofmetformin. Clin Pharmacokinet 30:359±371.
47. Euans ME, Shen®eld GM, Thomas N, Walker SR,Paterson JW. 1978. The pharmacokinetics of rimi-terol in man. Xenobiotica 4:681±692.
48. Strobach H, Wirth KE, Rojsathaporn K. 1986.Absorption, metabolism and elimination of stro-phanthus glycosides in man. Naunyn schmiede-bergs Arch Pharmacol 334:496±500.
49. Yung S, Mayersohn M, Robinson JB. 1982. Ascor-bic-acid absorption in humans-A comparisonamong several dosage forms. J Pharm Sci 71:282±285.
50. Goto M, Sugiyama M, Nakajima S, Yamashina H.1981. Fosfomycin kinetics after intravenous andoral-administration to human volunteers. Anti-microb Agents Chemother 20:393±397.
51. Shimizu K. 1977. Fosfomycin: Absorption andexcretion. Chemotherapy 23(Suppl 1):153±158.
52. Kuemmerle HP, Murakawa T, Desantis F. 1987.Pharmacokinetic evaluation of fos®domycin, anew phosphonic acid antibiotic. Chemioterapia 6:113±119.
53. Cundy KC. 1999. Clinical pharmacokinetics of theantiviral nucleotide analogues cidofovir and ade-fovir. Clin Pharmacokinet 36:127±143.
54. Ahr HJ, Boberg M, Krause HP, Maul W, MullerFO, Ploschke HJ, Weber H, Wunsche C. 1989.Pharmacokinetics of acarbose. I. Absorption, con-centration in plasma, metabolism and excretionafter single administration of [c-14]acarbose torats, dogs and man. Arzneimittelforschung 39-2:1254±1260.
55. Holdiness MR. 1984. Clinical pharmacokinetics ofthe antituberculosis drugs. Clin/Pharmacokinet9:511±544.
56. Kunin C, Chalmers TC, Leevy CM, Sebastyen SC,Lieber CS, Finland M. 1960. Absorption of orallyadministered neomycin and kanamycin. N Engl JMed 26:9380.
57. Ukabam SO, Clamp JR, Cooper BT. 1983. Abnor-mal small intestinal permeability to sugars inpatients with Crohn's disease of the terminalileum and colon. Digestion 27:70±74.
58. Ukabam SO, Cooper BT. 1984. Small intestinalpermeability to mannitol, lactulose, and polyethy-lene glycol 400 in celiac disease. Dig Dis Sci 29:809±816.
59. Maxton DG, Bjarnason I, Reynolds AP, Catt SD,Peters TI, Menzies IS. 1986. Lactulose CR-51labelled ethylenediamine tetra-acetate, L-Rham-nose and polyethyleneglycol-500 as probe markersfor assessment in vivo of human intestinal per-meability. Clin Sci 71:71±80.
60. Morino A, Nakamura A, Nakanashi K, Tatewaki,N, Sugiyama M. 1985. Species differences in thedisposition and metabolism of camazepam. Xeno-biotica 15:1033±1043.
61. Oberbauer R, Krivanek P, Turnheim K. 1993.Pharmacokinetics of indomethacin in the elderly.Clin Pharmacokinet 24:428±434.
62. Taburet AM, Schmidt B. 1994. Pharmacokineticoptimization of asthma treatment. Clin Pharma-cokinet 26:396±418.
63. Paton DM, Webster DR. 1985. Clinical pharma-cokinetics of H1-receptor antagonists (the anti-histamines). Clin Pharmacokinet 10:477±497.
64. Sallee FR, Pollock BG. 1990. Clinical pharmaco-kinetics of imipramine and desipramine. ClinPharmacokinet 18:346±364.
65. Henson R, Lloyd-Jones JG, Nichols JD, JordanBJ. 1980. Pharmacokinetics of fenclofenac follow-ing single and multiple doses. Eur J Drug MetabPharmacokinet 5:217±223.
66. Welling PG. 1977. In¯uence of food and diet ongastrointestinal drug absorption: A review. Phar-macokinet Biopharm 5:291±335.
67. Humpel M, Nieuweboer B, Milius W, Hanke H,Wend H. 1980. Kinetics and biotransformation oflormetazepam. J Clin Pharmacol Ther 28:673±679.
68. Davies NM, Anderson KE. 1987. Clinical pharma-cokinetics of diclofenc: Therapeutic insights andpitfalls. Clin Pharmacokinet 33:184±213.
69. Clarke SE, Austin NE, Bloomer JC, Haddock RE,Highams FC, Hollis FJ, Nash M, Shardlow PC,Tasker TC, Woods FR, Allen GD. 1994. Metabo-lism and disposition of 14C-granisetron in rat, dogand and man after intravenous and oral dosing.Xenobiotica 24:1119±1131.
70. Shinohara Y, Baba S, Kasuya Y. 1980. Absorption,metabolism, and excretion of oral testosterone inhumans by mass fragmentography. J Clin Endo-crinol Metab 51:1459±1462.
71. Busto U, Bendayan R, Sellers EM. 1989. Clinicalpharmacokinetics of non-opiate abused drugs.Clin Pharmacokinet 16:1±26.
72. Harvey SC, Winthrow CD. 1985. In: Remington'sPharmaceutical Sciences, Vol. 17; Gennaro AR,edito. Easton, PA: Mack Publishing Company, pp.951±1001.
73. Ormel, M, Back DJ, Ward S, Green S. 1991.The pharmacokinetics of ethinylestradiol in the
HUMAN INTESTINAL ABSORPTION OF 241 DRUGS 777
JOURNAL OF PHARMACEUTICAL SCIENCES, VOL. 90, NO. 6, JUNE 2001

presence and absence of gestodene and desoges-trel. Contraception 43:305±316.
74. Roila F, Del Favero A. 1995. Ondansetron clinicalpharmacokinetics. Clin Pharmacokinet 29:95±109.
75. McTavish D, Sorkin EM. 1989. Verapamil: Anupdated review of its pharmacodynamic andpharmacokinetic properties, and therapeutic usein hypertension. Drugs 38:19±76.
76. Schedl HP. 1965. Absorption of steroid hormonesfrom the human small intestine. J Clin EndocrinolMetab 25:1309±1316.
77. Mahler C, Verhelst J, Denis L. 1998. Clinicalpharmacokinetics of the antiandrogens and theiref®cacy in prostate cancer. Clin Pharmacokinet34: 405±417.
78. Sotelo J, Jung H. 1998. Pharmacokinetic optimi-sation of the treatment of neurocysticercosis. ClinPharmacokinet 34:503±515.
79. Hildebrand M, Staks T, Schutt A, Matthes H.1989. Pharmacokinetics of 3H cicaprost in heal-thy-volunteers. Prostaglandins 37: 259±273.
80. Agundez JAG, Martinez C, Benitez J. 1995.Metabolism of aminopyrine and derivatives inman-In-vivo study of monomorphic metabolicpathways. Xenobiotica 25:417±427.
81. Greenblatt DJ, Divoll MK, Soong MH, Boxen-baum HG, Harmatz JS, Shader RI. 1998. Desme-thyldiazepam pharmacokinetics: Studies followingintravenous and oral desmethyldiazepam, oralclorazepate, and intravenous diazepam. J ClinPharmacol 28:853±859.
82. Filer CW, Humphrey MJ, Jeffrey DJ, Jones KH,Langley PF. 1980. The metabolism of carfecillin inrat, dog and man. Xenobiotica 10:761±769.
83. Vermeulen A. 1959. The metabolism of 4-14 Cprednisolone. J Endocrinol. 18:278±291.
84. Frey BM, Brandenberger AW, Frey FJ, WidmerHR. 1984. The systemic availability of predniso-lone after orally administered prednisone. PharmActa Helv 59:301±309.
85. Dressman JB, Amidon GL, Fleisher D. 1985. Ab-sorption potential-estimating the fraction absor-bed for orally-administered compounds. J PharmSci 74:588±589.
86. Borgstrom L, Johansson CG, Larsson H, LenanderR. 1981. Pharmacokinetics of propanolol. J Phar-macokinet Biopharm 9:419±429.
87. Bayliss PFC, Case DE. 1975. Blood level studieswith viloxazine hydrochloride in man. Br J ClinPharmacol 2:209±214.
88. Pisani F. 1986. Pharmacokinetics of the antide-pressant drug viloxazine in normal subjects and inepileptic patients receiving chronic anticonvul-sant treatment. Psychopharmacology 90:295±298.
89. Holford NH. 1986. Clinical pharmacokinetics andpharmacodynamics of warfarinÐunderstandingthe dose-effect relationship. Clin Pharmacokinet11:483±504.
90. Beermann B, Hellstrom K, Rosen A. 1978. Thegastrointestinal absorption of atropine in man.Clin Sci 40:95±106.
91. Kirsten R, Nelson K, Kirsten D, Heintz B. 1998.Clinical pharmacokinetics of vasodilatorsÐPart I.Clin Pharmacokinet 34:457±482.
92. Sedaghat A, Ahrens Jr, EH. 1975. Lack of effect ofcholestyramine on the pharmacokinetics of clo®-brate in man. Eur J Clin Invest 5:177±185.
93. Cayen MN. 1985. Disposition, metabolism andpharmacokinetics of antihyperlipidemic agents inlaboratory animals and man. Pharmacol Ther29:157±204.
94. Schwartz DE, Ziegler WH. 1969. Assay and phar-macokinetics of trimethoprim in man and ani-mals. Postgrad Med J 45, Suppl:32±37.
95. Troy SM, Parker VP, Hicks DR, Pollack GM,Chiang ST. 1997. Pharmacokinetics and effect offood on the bioavailability of orally administeredvenlafaxine. J Clin Pharmacol 37:954±961.
96. Eichelbaum M, Ochs HR, Roberts G, Somogyi A.1982. Pharmacokinetics and metabolism of anti-pyrine (phenazone) after intravenous and oral-administration. Drug Res 32:575±578.
97. Pentikainen PJ, Penttila A, Neuvonen PJ, GothoniG. 1977. Fate of [14 C]-bumetanide in man. Br JClin Pharmacol 4:3944.
98. Kirsten R, Nelson K, Kirsten D, Heintz B. 1998.Clinical pharmacokinetics of vasodilatorsÐPartII. Clin Pharmacokinet 35:9±36.
99. Debruyne D, Ryckelynck J-P. 1993. Clinical phar-macokinetics of ¯uconazole. Clin Pharmacokinet24:10±27.
100. Anttila M, Arstila M, Pfeffer M, Tikkanen R,Vallinkoski V, Sundquist H. 1976. Human phar-macokinetics of sotalol. Acta Pharmacol Toxicol(Copenhagen) 39:118±128.
101. Hanyok JJ. 1993. Clinical pharmacokinetics ofsotalol. Am J Cardiol 72:19A±26A.
102. Quiding H, Anderson P, Bondesson U, Boreus LO,Hynning P-A. 1986. Plasma concentrations of cod-eine and its metabolite, morphine, after single andrepeated oral administration. Eur J Pharmacol30:673±677.
103. Bodd E, Beylich KM, Christopherson AS, MorlandJ. 1987. Oral administration of codeine in thepresence of ethanolÐA pharmacokinetic study inman. J Pharmacol Toxicol 61:297±300.
104. Whitwan JG, Amein R. 1995. Pharmacology of¯umazenil. Acta Anaesthesiol Scand 39 (suppl.108):3±14.
105. Lee EJD, Williams K, Day R, Graham G, Cham-pion D. 1985. Stereoselective disposition of ibu-profen enantiomers in man. Br J Clin Pharmacol19:669±674.
106. Bodem G, Chidsey CA. 1973. Pharmacokineticstudies of practolol, a beta adrenergic antagonistin man. Clin Pharmacol Ther 14:26±29.
778 ZHAO ET AL.
JOURNAL OF PHARMACEUTICAL SCIENCES, VOL. 90, NO. 6, JUNE 2001

107. Tocco DJ, Dunacan EW, Deluna FA, Hucker HB,Gruber VP, Vandenheuvel WJA. 1975. Physiolo-gical disposition and metabolism of timolol in manand laboratory animals. Drug Metab Dispos 3:361±370.
108. Johansson R, Regardh CG, Sjogren J. 1971. Absor-ption of alprenolol in man from tablets with dif-ferent rates of release. Acta Pharm Suec 8:59±70.
109. Artursson P, Karlsson J. 1991. Correlation be-tween oral drug absorption in humans and ap-parent drug permeability coef®cients in humanintestinal epithelial (caco-2) cells. Biochem Bio-phys Res Commun 175:880±885.
110. Jamali F, Brocks DR. 1990. Clinical pharmacoki-netics of ketoprofen and its enantiomers. ClinPharmacokinet 19:197±217.
111. Mlynaryk P, Kirsner JB. 1963. Absorption andexcretion of 1,2,H3-hydrocortisone in regionalenteritis and ulcerative colitis, with a note onhydrocortisone production rates. Gastroenterol-ogy 44:257±260.
112. Peterson RE, Wyngaarden JE, Guerra LS, BrodieBB, Bunim JJ. 1955. The physiological disposi-tion, and metabolic fate of hydrocortisone in man.J Clin Invest 34:1779±1794.
113. Brocks DR, Jamali F. 1992. Clinical pharmacoki-netics of Keterolac Tromethamine. Clin Pharma-cokinet 23:415±427.
114. Davies NM, Skjodt NM. 1999. Clinical pharmaco-kinetics of meloxicam. Clin Pharmacokinet 36:115±126.
115. Jung D, Powell JR, Walson P, Perrier D. 1980.Effect of dose on phenytoin absorption. Clin Phar-macol Ther 28:479±485.
116. Glazko AJ, Wolf LM, Dill WA, Bratton Jr AC.1949. Biochemical studies on chloramphenicol(chloromycetin). II. Tissue distribution and excre-tion studies. J Pharmacol Exp Ther 96:445±459.
117. Ambrose P. 1984. Clinical pharmacokinetics ofchloramphenicol and chloramphenicol succinate.J Clin Pharmacokinet 9:222±238.
118. Shumaker RC, Fantel C, Kelton E, Wong K,Weliky I. 1990. Evaluation of the elimination of14C Felbamate in healthy men. Epilepsia 31:642.
119. Tegeder I, Lotsch J, Geisslinger G. 1999. Pharma-cokinetics of opioids in liver disease. Clin Phar-macokinet 37:17±40.
120. Heinig R. 1998. Clinical pharmacokinetics ofnisoldipine coat-core. Clin Pharmacokinet 35:191±208.
121. Sonne J, Loft S, Dossing M, Vollmer-Larsen A,Olesen KL, Victor M, Andreasen F, AndreasenPB. 1988. Bioavailability and pharmacokinetics ofoxazepam. Eur J Clin Pharmacol 35:385±389.
122. Gardner MJ, Wilner KD, Hansen RA, Fouda HG,McMahon GF. 1995. Single and multiple dosepharmacokinetics of tenidap sodium in healthysubjects. Br J Clin Pharmacol 39(s1):s11±15.
123. Edgar B, Regardh CG, Johnsson G, Johansson L,Lundborg P, Lofberg L, Ronn O. 1985. Felodipinekinetics in healthy men. Clin Pharmacol Ther 38:205±211.
124. Soons PA, Breimer DD. 1991. Stereoselectivepharmacokinetics of oral and intravenous mitren-dipine in healthy male subjects. Br J Clin Phar-macol 32:11±16.
125. Mikus G, Fischer C. 1987. Application of stableisotope methodology to study the pharmacoki-netics, bioavailability and metabolism of nitrendi-pine after iv and po administration. Br J ClinPharmacol 24:561±569.
126. Sweatman TW, Renwick AG, Burgess CD. 1981.The pharmacokinetics of saccharin in man. Xeno-biotica 11:531±540.
127. Findlay JWA, Van Wyck Fleet J, Smith PG, ButzRF, Hinton ML, Blum MR, Schroeder DH. 1981.Pharmacokinetics of bupropion, a novel antide-pressant agent, following oral administration tohealthy patients. Eur J Clin Pharmacol 21:127±135.
128. Johnson MA, Moore KHP, Yuen GJ, Bye A, PakesGE. 1999. Clinical pharmacokinetics of lamivu-dine. Clin Pharmacokinet 36:41±66.
129. Glare PA, Walsh TD. 1991. Clinical pharmacoki-netics of morphine. Ther Drug Monit 13:1±23.
130. Kripalani KJ, McKinstry DN, Singhvi SM, WillardDA, Vukovich RA, Migdalof BH. 1980. Dispositionof captopril in normal subjects. Clin PharmacolTher 27:636±641.
131. Duchin KL, McKinstry DN, Cohen AI, MigdalofBH. 1988. Pharmacokinetics of captopril in heal-thy subjects and in patients with cardiovasculardiseases. Clin Pharmacokinet 14:241±259.
132. Raa¯aub J, Speiser-Courvoisier J. 1974. Zur phar-makokinetik von bromazepam beim menschen.Arzneimitteforschung 24:1841±1844.
133. Macheras P, Reppas C, Dressman JB. 1990. Esti-mate of volume ¯ow ratio of gastrointestinal (GI)¯uids in humans using pharmacokinetic data.Pharm Res 7:518±522.
134. Roberts MS, Rumble RH, Wanwimolruk S,Thomas D, Brooks PM. 1983. Pharmacokineticsof aspirin and salicylate in elderly subjects and inpatients with alcoholic liver disease. Eur J ClinPharmacol 25:253±261.
135. Everett DW, Olsen SJ, Sugerman AA, Ita C,Stewart MB, Sherman JW, Kripalani KJ. 1992.Disposition of SQ 32,756 (BV-araU) in healthymale subjects. Pharm Res 9:S316.
136. Lew KH, Ludwig EA, Milad MA, Donovan K,Middleton E, Jr Ferry JJ, Jusko WJ. 1993.Gender-based effects on methylprednisolonepharmacokinetics and pharmacodynamics. ClinPharmacol Ther 54: 402±414.
137. Lie-A-Huen L, Proost JH, Kingma JH, MeijerDKF. 1990. Absorption kinetics of oral and rectal
HUMAN INTESTINAL ABSORPTION OF 241 DRUGS 779
JOURNAL OF PHARMACEUTICAL SCIENCES, VOL. 90, NO. 6, JUNE 2001

¯ecainide in healthy subjects. Eur J Clin Pharma-col 38:595±598.
138. Guentert TW, Upton RA, Holford NH, Bostrom A,Rigelman S. 1990. Gastrointestinal absorption ofquinidine from solutions and commercial tablets.J Pharmacokinet Biopharm 8:243±255.
139. Greenblatt DG, Pfeifer HJ, Ochs HR, Franke K,McLaughlin DS, Smith TW, Koch-Wesser J. 1977.Pharmacokinetics of quinidine in humans afterintravenous, intramuscular and oral administra-tion J Pharmacol Exp Ther 202:365±378.
140. Foster RT, Carr RA. 1990. In: Florey K, editor.Analytical Pro®les of Drug Substances, Vol 19;New York: Academic pp 1±26.
141. Lee CS, Gambertoglio JG, Brater DG, Benet LZ.1977. Kinetics of oral ethambutol in the normalsubject. Clin Pharmacol Ther 22:615±621.
142. Forrest JAH, Clements JA, Prescott LF. 1982.Clinical pharmacokinetics of paracetamol. ClinPharmacokinet 7:93±107.
143. Stewart BH, Kugler AR, Thompson PR, Bockbra-der HN. 1993. A saturable transport mechanismin the intestinal absorption of gabapentin is theunderlying cause of the lack of proportionalitybetween increasing dose and drug levels in plas-ma. Pharm Res 10:276±281.
144. Duggan DE, Yeh KC, Matalia N, Ditzler CA,McMahon FG. 1975. Bioavailability of oral dexa-methasone. Clin Pharmacol Ther 18:205±209.
145. Holmes B, Brogden RN, Heel RC, Speight TM,Avergy GS. 1983. GuanabenzÐA review of itspharmacodynamic properties and therapeuticef®cacy in hypertension. Drugs 26:212±229.
146. Gill KS, Wood MJ. 1996. The clinical pharmacoki-netics of famciclovir. Clin Pharmacokinet 31:1±8.
147. Tilstone WJ, Dargie H, Dargie EN, Morgan HG,Kennedy AC. 1974. Pharmacokinetics of metola-zone in normal subjects and in patients with car-diac or renal failure. Clin Pharmacol Ther 16:322±329.
148. Heel RC, Brogden RN, Speight TM, Avery GS.1978. Fenoterol: Review of its pharmacologicalproperties and therapeutic ef®cacy in asthma.Drugs 15:3±32.
149. Rominger VKL, Pollmann W. 1972. Comparativepharmacokinetic studies on fenoterol hydrobro-mide in rat, dog and man. Arzneimmittelfor-schung 22:1190±1196.
150. Cruickshank JM. 1980. The clinical importance ofcardioselectivity and lipophilicity in beta blockers.Am Heart J 100:160±178.
151. Morrison RA, Singhvi SM, Greasey WA, WillardDA. 1988. Dose proportionality of nadolol phar-macokinetics after intravenous administration tohealthy subjects. Eur J Clin Pharmacol 33:625±628.
152. Bressolle F, Bres J, Faure-Jeantis A. 1992. Abso-lute bioavailability, rate of absorption, and dose
proportionality of sulpiride in humans. J PharmSci 81:26±32.
153. Docngler HJ, Hengstmann JH. 1976. Metabolismand pharmacokinetics of orciprenaline in variousanimal species and man. Arch Int PharmacodynTher 223:71±87.
154. Sjovall J, Karlsson A, Ogenstad S, Sandstrom E,Saarimaki M. 1988. Pharmacokinetics and absor-ption of foscarnet after intravenous and oraladministration of patients with human immuno-de®ciency virus. Clin Pharmacol Ther 44:65±73.
155. Tse FLS, Jaffe JM. 1987. Pharmacokinetics ofPN200-110 (isradipine), a new calcium-antago-nist, after oral administration in man. Eur J ClinPharmaol 32:361±365.
156. Borgstrom L, Nyberg L, Jonsson S, Lindberg O,Paulson J. 1989. Pharmacokinetic evaluation inman of terbutaline given as separate enantiomersand as the racemate. Br J Clin Pharmacol 27:49±56.
157. Morgan DJ. 1990. Clinical pharmacokinetics ofbeta-agonists. Clin Pharmacokinet 18:270±294.
158. Jack DB. 1992. Handbook of clinical Pharmacoki-netic Data Basingstoke: Macmillan Publishers Ltd.
159. Lennernas H, Fager G. 1997. Pharmacodynamicsand pharmacokinetics of the HMG-CoA reductaseinhibitors. Clin Pharmacokinet 32:403±425.
160. Tse FL, Jaffe JM, Troendle A. 1992. Pharmacoki-netics of ¯uvaststatin after single and multipledoses in normal volunteers. J Clin Pharmacol32:630±638.
161. Kampmann J, Skovsted L. 1975. The kinetics ofpropylthiouracil in Hyperthyroidism. Acta Phar-macol Toxicol 37:201±210.
162. Kampmann I, Skovsted L. 1974. The pharma-cokinetics of propylthiouracil. Acta PharmacolToxicol 35:361±369.
163. Scatina JA, Wells DS, Kimmel HB, Kemper CJ,Sisenwine SF. 1990. Excretion and metabolism ofrecainam, a new antiarrhythmic drug, in labora-tory-animals and humans. Drug Metab Dispos18:746±752.
164. Beermann B, Groschinsky-Grind M. 1977. Phar-macokinetics of hydrochlorothiazide in man. Eur JClin Pharmacol 12:297±303.
165. McIlhenny HM, Ghaly MSD. 1979. Biotransfor-mation of pirbuterol by the rat, dog, and human.Fed Proc 38:442.
166. Fowler PA, Lacey LF, Thomas M, Keene ON,Tanner RJ, Baber NS. 1991. The clinical pharma-cology, pharmacokinetics and metabolism of sum-atriptan. Eur Neurol 31:291±294.
167. Dixon CM, Saynor DA, Andrew PD, Oxford J,Bradlbury A, Tarbit MH. 1993. Disposition ofsumatriptan in laboratory animals and humans.Drug Metab Dispos 21:761±769.
168. Scott AK. 1994. Sumatriptan clinical pharma-cokinetics. Clin Pharmacokinet 27:337±344.
780 ZHAO ET AL.
JOURNAL OF PHARMACEUTICAL SCIENCES, VOL. 90, NO. 6, JUNE 2001

169. Grayson MF, Smith AJ, Smith RN. 1971. Absorp-tion, distribution and elimination of 14C-amilo-ride in normal human subjects. Br J Pharmacol43:473±474.
170. Jacobson MA, de Miranda P, Cederberg DM,Burnette T, Cobb E, Brodie HR, Mills J. Humanpharmacokinetics and tolerance of oral ganciclo-vir. Antimicrob Agents Chemother 31:1251±1254.
171. Lobley RW, Burrows PC, Warwick R, Dawson DJ,Holmes R. 1990. Simultaneous assessment ofintestinal permeability and lactose tolerance withorally administered raf®nose, lactose and L-arabinose. Clin Sci 79:175±183.
172. Data obtained from Roche Products Ltd173. Welling PG, Selen A, Pearson JG, Kwok F, Rogge
MC, Ifan A, Marrero D, Craig WA, Johnson CA.1985. A pharmacokinetic comparison of cepha-lexin and cefadroxil using HPLC assay proced-ures. Biopharm Drug Dispos 6:147±157.
174. Douglas JG, McLeod MJ. 1999. Pharmacokineticfactors in the modern drug treatment of tuber-culosis. Clin Pharmacokinet 37(2):127±146.
175. DeSante KA, Zeckel ML. 1992. Pharmacokineticpro®le of loracarbef. Am J Med 93(S6A):S16±S19.
176. Sjovall J, Alvan G, Huitfeldt B. 1986. Intra- andinter-individual variation in pharmacokinetics ofintravenously infused amoxycillin and ampicillinto elderly volunteers. Br J Clin Pharmacol 21:171±181.
177. Sinko PJ, Lessman GD, Amidon GL. 1991. Pre-dicting fraction dose absorbed in humans using amacroscopic mass balance approach. Pharm Res8:979±988.
178. Spyker DA, Rugloski RJ, Vann RL, Obrien WM.1977. Pharmacokinetics of amoxicillin: Dose depen-dence after intravenous, oral and intramuscularadministration. Antimicrob Agents Chemother11:132±141.
179. Sjovall J, Alvan G, Westerlund D. 1985. Dose-dependent absorption of amoxycillin and bacam-picillin. Clin Pharmacol Ther 38:241±250.
180. Arancibia A. 1998. Dose-dependent bioavailabilityof amoxycillin. Int J Clin Pharmacol Ther Toxicol26:300±303.
181. Haria M, Lamb HM. 1997. Trova¯axacin. Drugs54:435±445.
182. Simons FER, Simons KGJ. 1999. Clinical phar-macology of new histamine H-1 receptor antago-nists. Clin Pharmacokinet 36:329±352.
183. Robertson DRC, Wood ND, Everest H, Monks K,Waller DG, Renwick AG, George CF. 1989. Theeffect of age on the pharmacokinetics of levodopaadministered alone and in the presence of carbi-dopa. Br J Clin Pharmacol 28:61±69.
184. Pfeffer M, Gaver RC, Ximenez J. 1983. Humanintravenous pharmacokinetics and absolute oralbioavailability of cefatrizine. Antimicrob AgentsChemother 24:915±920.
185. Adithan C, Sriram G, Swaminathan RP, Shashin-dran CH, Bapna JS, Krishnan M, ChandrasekarS. 1989. Differential effect of type-i and type-iidiabetes-millitus on serum ampicillin levels. Int JClin Pharmacol Ther 27:493±498.
186. Pilbrant A, Schannong M, Vessman J. 1981.Pharmacokinetics and bioavailability of tranexa-mic acid. Eur J Clin Pharmacol 20:65±72.
187. Haegele KD, Alken RG, Grove J, Schechter PJ,Kochweser J. 1981. Kinetics of alpha-di¯uorome-thylornithineÐanirreversibleinhibitorofornithinedecarboxylase. Clin Pharmacol Ther 30: 210±217.
188. Campbell NRC, Skerjanec A, Tam Y, Robertson S,Burgess E. 1995. Methyldopa kinetics before andafter ingestion of methyldopa for 8 weeks. Eue JClin Pharmacol 48:397±400.
189. Amidon GL, Lee HJ. 1994. Absorption of peptideand peptidomimetic drugs. Anm Rev PharmacolToxicol 34:321±341.
190. Kansy M, Senner F, Gubernator K. 1998. Physi-cochemical higher throughput screening: paralletarti®cial membrane permeation assay in the des-cription of passive absorption precess. J MedChem 41:1007±1010.
191. Vree TB, Waitzinger J, Hammermaier A, Radhofer-Welte S. 1999. Absolute bioavailability, pharmaco-kinetics, renal and biliary clearance of distigmineafter a single oral dose in comparison to i.v. admini-stration of C-14-distigmine-bromide in healthyvolunteers. Int J Clin Pharmacol Ther 37:393±403.
192. Klecker RW, Collins JM, Yarchoan R, Thomas R,Jenkins JF, Broder S, Myers CE. 1987. Plasmaand cerebrospinal ¯uid pharmacokinetics of 3 0-azido-3 0-deoxythymidineÐA novel pyrimidineanalog with potential application for the treat-ment of patients with aids and related disease.Clin Pharmacol Ther 41:407±412.
193. Acosta EP, Page LM, Fletcher CV. 1996. Clinicalpharmacokinetics of zidovudineÐan update. ClinPharmacokinet 30:251±262.
194. Taylor IW, Taylor T, James I, Doyle G, Dorf G,Darragh A, Chasseaud LF. 1991. Pharmacoki-netics of the anti-in¯ammatory drug ximoprofenin healthy subjects and in disease states. Eur JClin Pharmacol 40:101±106.
195. Davies DS, Wing AM, Reid JL, Neill DM, TippettP, Dollery CT. 1977. Pharmacokinetics and con-centration-effect relationships of intravenous andoral clonidine. Clin Pharmacol Ther 21:593±601.
196. Lowenthal DT, Matzek KM, MacGregor TR. 1988.Clinical pharmacokinetics of clonidine. Clin Phar-macokinet 14:287±310.
197. Lowenthal DT. 1980. Pharmacokinetics of cloni-dine. J Cardiovasc Pharmacol 2(suppl. 1):S29±S37.
198. Adam D, Timmler R. 1982. Pharmacokinetics ofceftizoxime with and without administration ofprobenecid. Arzneimittelforschung 32:416±419.
HUMAN INTESTINAL ABSORPTION OF 241 DRUGS 781
JOURNAL OF PHARMACEUTICAL SCIENCES, VOL. 90, NO. 6, JUNE 2001
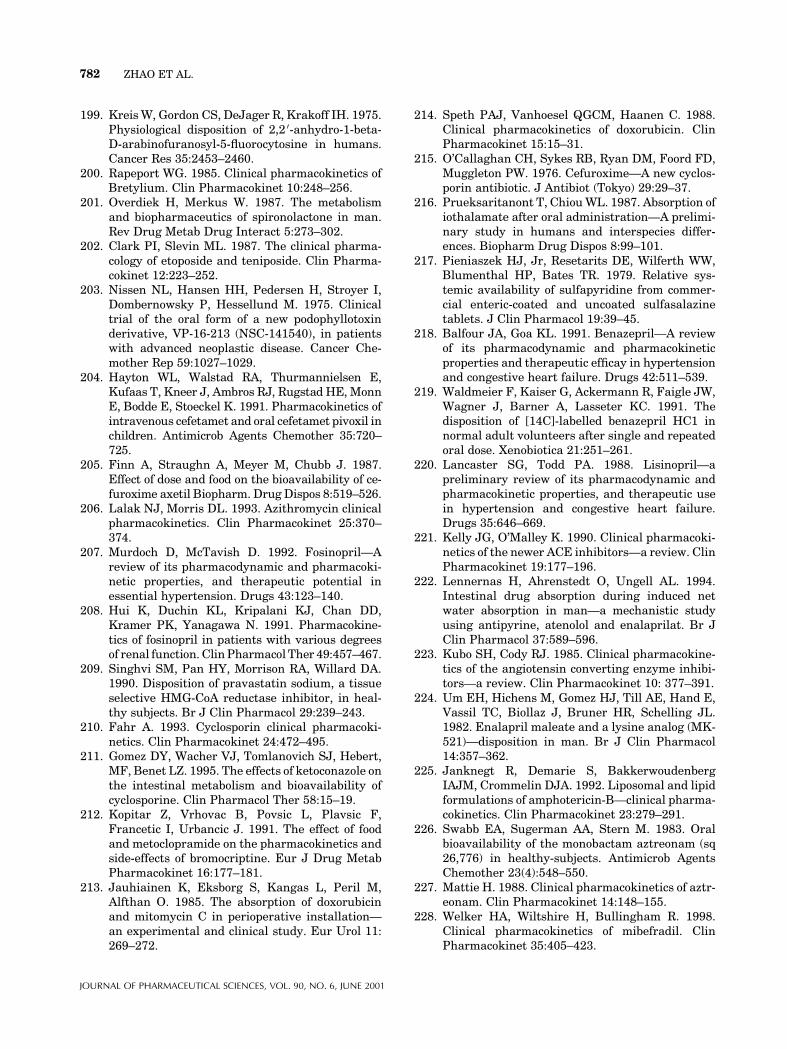
199. Kreis W, Gordon CS, DeJager R, Krakoff IH. 1975.Physiological disposition of 2,2 0-anhydro-1-beta-D-arabinofuranosyl-5-¯uorocytosine in humans.Cancer Res 35:2453±2460.
200. Rapeport WG. 1985. Clinical pharmacokinetics ofBretylium. Clin Pharmacokinet 10:248±256.
201. Overdiek H, Merkus W. 1987. The metabolismand biopharmaceutics of spironolactone in man.Rev Drug Metab Drug Interact 5:273±302.
202. Clark PI, Slevin ML. 1987. The clinical pharma-cology of etoposide and teniposide. Clin Pharma-cokinet 12:223±252.
203. Nissen NL, Hansen HH, Pedersen H, Stroyer I,Dombernowsky P, Hessellund M. 1975. Clinicaltrial of the oral form of a new podophyllotoxinderivative, VP-16-213 (NSC-141540), in patientswith advanced neoplastic disease. Cancer Che-mother Rep 59:1027±1029.
204. Hayton WL, Walstad RA, Thurmannielsen E,Kufaas T, Kneer J, Ambros RJ, Rugstad HE, MonnE, Bodde E, Stoeckel K. 1991. Pharmacokinetics ofintravenous cefetamet and oral cefetamet pivoxil inchildren. Antimicrob Agents Chemother 35:720±725.
205. Finn A, Straughn A, Meyer M, Chubb J. 1987.Effect of dose and food on the bioavailability of ce-furoxime axetil Biopharm. Drug Dispos 8:519±526.
206. Lalak NJ, Morris DL. 1993. Azithromycin clinicalpharmacokinetics. Clin Pharmacokinet 25:370±374.
207. Murdoch D, McTavish D. 1992. FosinoprilÐAreview of its pharmacodynamic and pharmacoki-netic properties, and therapeutic potential inessential hypertension. Drugs 43:123±140.
208. Hui K, Duchin KL, Kripalani KJ, Chan DD,Kramer PK, Yanagawa N. 1991. Pharmacokine-tics of fosinopril in patients with various degreesof renal function. Clin Pharmacol Ther 49:457±467.
209. Singhvi SM, Pan HY, Morrison RA, Willard DA.1990. Disposition of pravastatin sodium, a tissueselective HMG-CoA reductase inhibitor, in heal-thy subjects. Br J Clin Pharmacol 29:239±243.
210. Fahr A. 1993. Cyclosporin clinical pharmacoki-netics. Clin Pharmacokinet 24:472±495.
211. Gomez DY, Wacher VJ, Tomlanovich SJ, Hebert,MF, Benet LZ. 1995. The effects of ketoconazole onthe intestinal metabolism and bioavailability ofcyclosporine. Clin Pharmacol Ther 58:15±19.
212. Kopitar Z, Vrhovac B, Povsic L, Plavsic F,Francetic I, Urbancic J. 1991. The effect of foodand metoclopramide on the pharmacokinetics andside-effects of bromocriptine. Eur J Drug MetabPharmacokinet 16:177±181.
213. Jauhiainen K, Eksborg S, Kangas L, Peril M,Alfthan O. 1985. The absorption of doxorubicinand mitomycin C in perioperative installationÐan experimental and clinical study. Eur Urol 11:269±272.
214. Speth PAJ, Vanhoesel QGCM, Haanen C. 1988.Clinical pharmacokinetics of doxorubicin. ClinPharmacokinet 15:15±31.
215. O'Callaghan CH, Sykes RB, Ryan DM, Foord FD,Muggleton PW. 1976. CefuroximeÐA new cyclos-porin antibiotic. J Antibiot (Tokyo) 29:29±37.
216. Prueksaritanont T, Chiou WL. 1987. Absorption ofiothalamate after oral administrationÐA prelimi-nary study in humans and interspecies differ-ences. Biopharm Drug Dispos 8:99±101.
217. Pieniaszek HJ, Jr, Resetarits DE, Wilferth WW,Blumenthal HP, Bates TR. 1979. Relative sys-temic availability of sulfapyridine from commer-cial enteric-coated and uncoated sulfasalazinetablets. J Clin Pharmacol 19:39±45.
218. Balfour JA, Goa KL. 1991. BenazeprilÐA reviewof its pharmacodynamic and pharmacokineticproperties and therapeutic ef®cay in hypertensionand congestive heart failure. Drugs 42:511±539.
219. Waldmeier F, Kaiser G, Ackermann R, Faigle JW,Wagner J, Barner A, Lasseter KC. 1991. Thedisposition of [14C]-labelled benazepril HC1 innormal adult volunteers after single and repeatedoral dose. Xenobiotica 21:251±261.
220. Lancaster SG, Todd PA. 1988. LisinoprilÐapreliminary review of its pharmacodynamic andpharmacokinetic properties, and therapeutic usein hypertension and congestive heart failure.Drugs 35:646±669.
221. Kelly JG, O'Malley K. 1990. Clinical pharmacoki-netics of the newer ACE inhibitorsÐa review. ClinPharmacokinet 19:177±196.
222. Lennernas H, Ahrenstedt O, Ungell AL. 1994.Intestinal drug absorption during induced netwater absorption in manÐa mechanistic studyusing antipyrine, atenolol and enalaprilat. Br JClin Pharmacol 37:589±596.
223. Kubo SH, Cody RJ. 1985. Clinical pharmacokine-tics of the angiotensin converting enzyme inhibi-torsÐa review. Clin Pharmacokinet 10: 377±391.
224. Um EH, Hichens M, Gomez HJ, Till AE, Hand E,Vassil TC, Biollaz J, Bruner HR, Schelling JL.1982. Enalapril maleate and a lysine analog (MK-521)Ðdisposition in man. Br J Clin Pharmacol14:357±362.
225. Janknegt R, Demarie S, BakkerwoudenbergIAJM, Crommelin DJA. 1992. Liposomal and lipidformulations of amphotericin-BÐclinical pharma-cokinetics. Clin Pharmacokinet 23:279±291.
226. Swabb EA, Sugerman AA, Stern M. 1983. Oralbioavailability of the monobactam aztreonam (sq26,776) in healthy-subjects. Antimicrob AgentsChemother 23(4):548±550.
227. Mattie H. 1988. Clinical pharmacokinetics of aztr-eonam. Clin Pharmacokinet 14:148±155.
228. Welker HA, Wiltshire H, Bullingham R. 1998.Clinical pharmacokinetics of mibefradil. ClinPharmacokinet 35:405±423.
782 ZHAO ET AL.
JOURNAL OF PHARMACEUTICAL SCIENCES, VOL. 90, NO. 6, JUNE 2001

229. Osman MA, Patel RB, Irwin DS, Craig WA,Welling PG. 1982. Bioavailability of chlorothia-zide from 50, 100, and 250 mg solution doses.Biopharm Drug Dispos 3:89±94.
230. Laskin OL. 1983. Clinical pharmacokinetics ofacyclovir. Clin Pharmacokinet 187±201.
231. Holmes B, Brogden RN, Richards DM. 1985.Nor¯oxacinÐA review of its antibacterial activity,pharmacokinetic properties and therapeutic use.Drugs 30:482±513.
232. Stein GE. 1987. Review of the bioavailability andpharmacokinetics of oral nor¯oxacin. Am J Med82(6B):18±21.
233. Chabner BA, Donehower RC, Schilsky RL. 1981.Clinical pharmacology of methotrexate. CancerTreat Rep 65(S1):51±54.
234. Bleyer WA. 1978. The clinical pharmacology ofmethotrexate. Cancer 41:36±51.
235. Henderson ES, Adamson RH, Oliverio VT. 1965.The metabolic fate of titrated methotrexate II.Absorption and excretion in man. Cancer Res25:1018±1024.
236. Vincent J, Meredith PA, Reid JL, Elliot HL, RubinPC. 1985. Clinical pharmacokinetics of prazosinÐ1985. Clin Pharmacokinet 10:144±154.
237. Sorgel F, Jaehde U, Naber K, Stephen U. 1989.Pharmacokinetic disposition of quinolines inhuman body ¯uids and tissues. Clin Pharmacoki-net 16(IS):5±24.
238. Ryde EM, Ahnfelt NO. 1988. The pharmacoki-netics of olsalazine sodium in healthy volunteersafter a single iv dose and after oral doses with andwithout food. Eur J Clin Pharmacol 34:481±488.
239. Drusano GL, Standiford HC, Plaisance K, ForrestA, Leslie J, Caldwell J. 1986. Absolute oralbioavailability of cipro¯oxacin. Antimicrob AgentsChemother 30:444±446.
240. Morse GD, Shelton MJ, Odonnell AM. 1993.Comparative pharmacokinetics of antiviral nu-cleoside analogs. Clin Pharmacokinet 24:101±123.
241. Regardh CG, Lundborg P, Gabrielsson M, Hegge-lund A, Kylberghanssen K. 1990. Pharmacoki-netics of a single intravenous and oral dose ofpafenololÐa beta 1-adrenoceptor antagonist withatypical absorption and disposition propertiesÐinman. Pharm Res 7:1222±1227.
242. Brater DC, Day B, Anderson S, Seiwell R. 1983.Azosemide kinetics and dynamics. Clin Pharma-col Ther 34:454±458.
243. Bastain W, Boyce MJ, Stafford LE, Morton PB,Clarke DA, Marlow HF. 1988. Pharmacokineticsof xamoterol after intravenous and oral adminis-tration to volunteers. Eur J Clin Pharmacol 34:469±473.
244. Ulm EH. 1983. Enalapril maleate (MK-421), apotent, nonsulfhydryl angiotensin-convertingenzyme inhibitor:absorption, disposition,and meta-bolism in man. Drug Metab Rev 14:99±110.
245. Ranadive SA, Chen AX, Serajuddin ATM. 1992.Relative lipophilicities and structural pharmaco-logical considerations of various angiotensin-con-verting enzyme (ACE) inhibitors. Pharm Res9:1480±1483.
246. Macfayden RJ, Meredith PA, Elliot HL. 1993.Enalapril clinical pharmacokinetics and pharma-cokinetic-pharmacodynamicrelationships:Anover-view. Clin Pharmacokinet 25:274±282.
247. Hellstrom K, Rosen A, Swahn A. 1974. Absorptionand decomposition of potassiumÐ35 S-phenoxy-methyl penicillin. Clin Pharmacol Ther 16(5, part 1):826±833.
248. Barza M, Weinstein L. 1976. Pharmacokinetics ofthe penicillins in man. Clin Pharmacokinet 1:297±308.
249. Duggan DE, Chen IW, Bayne WF, Halpin RA,Duncan CA, Schwartz MS, Stubbs RJ, Vickers S.1989. The physiological disposition of lovastatin.Drug Metab Dispos 17:166±173.
250. Walker SR, Richards AJ, Paterson JW. 1971. Theabsorption, excretion and metabolism of disodium[14C] cromoglycate in man. Biochem J 125:27P.
251. Periti P, Mazzei T, Mini E, Novelli A. 1989.Clinical pharmacokinetic properties of the macro-lide antibioticsÐeffects of age and various patho-physiological states 1. Clin Pharmacokinet 16:193±214.
252. Meylan WM, Howard PH, Boethling RS. Impro-ved method for estimating water solubility fromoctanol water partition coef®cient. Environ Tox-icol Chem 15:100±106.
253. Abraham MH. 1993. Scales of hydrogen bonding:Their construction and application to physicoche-mical and biochemical processes. Chem Soc Revs22:73±83.
254. Abraham MH, Chadha HS, Martins F, MitchellRC, Bradbury MW, Gratton JA. 1999. Hydrogenbonding Part 46. A review of the correlation andprediction of transport properties by an LFERmethod: Physicochemical properties, brain pene-tration and skin permeation. Pestic Sci 55:78±88.
255. Abraham MH, Martins F, Mitchell RC, Salter CJ.1999. Hydrogen bonding 47. Characterization ofthe ethylene glycolÐheptane partition system;hydrogen bond acidity and basicity of peptides. JPharm Sci 88:241±247.
256. Abraham MH, Platts JA, Hersey A, Leo AJ, TaftRW. 1999. Correlation and estimation of gas-chlo-roform and water-chloroform partition coef®cientsby a linear free energy relationship method.J Pharm Sci 88:670±679.
257. Oumada FZ, Roses M, Bosch E, Abraham MH.1999. Solute-solvent interactions in normal-phaseliquid chromatography, A linear free-energy rela-tionships study. J Chromatogr A 382:301±308.
258. Roses M, Rafels C, Bosch E, Martinez AM,Abraham MH. 1999. Solute-solvent interactions
HUMAN INTESTINAL ABSORPTION OF 241 DRUGS 783
JOURNAL OF PHARMACEUTICAL SCIENCES, VOL. 90, NO. 6, JUNE 2001

in micellar electrokinetic chromatography. Char-acterization of sodium dodecyl sulfate-Brij 35micellar systems for quantitative structure-acti-vity relationship modelling. J Chromatogr A 845:217±226.
259. Abraham MH, Le J. 1999. The correlation andprediction of the solubility of compounds in water,An LFER approach using a modi®ed solvationequation. J Pharm Sci 88:868±880.
260. Platts JA, Abraham MH. 2000. The partition ofvolatile organic compounds from air and fromwater into plant cuticular matrix: an LFER ana-lysis. Environ Sci Technol 34:318±323.
261. Platts JA, Butina D, Abraham MH, Hersey A.1999. Estimation of molecular linear free energyrelation descriptors using a group contributionapproach. J Chem Inf Comput Sci 39:835±845.
262. Platts JA, Abraham MH, Hersey A, Butina D.2000. Estimation of molecular linear free energyrelationship descriptors by a group contributionapproach 2. Prediction of partition coef®cients. JChem Inf Comput Sci 40:71±80.
263. Sietsema WK. 1989. The absorption oral bioavail-ability of selected drugs. Int J Clin PharmacolTher Toxicol 27:179±211.
264. Sue YJ, Shannon M. 1992. Pharmacokinetics ofdrugs in overdose. Clin Pharmacokinet 23:93±105.
265. Curatolo W. 1998. Physical chemical properties oforal drug candidates in the discovery and explora-tory development settings. PSTT 1:387±393.
266. Benet LZ, Wu C-Y, Hebert MF, Wacher VJ. 1996.Intestinal drug metabolism and antitransportprocesses: A potential paradigm shift in oral drugdelivery. J Controlled Release 2-3:139±143.
267. Wacher VJ, Silverman JA, Zhang Y, Benet LZ.1998. Role of P-glycoprotein and cytochrome P450.3A in limiting oral absorption of peptides andpeptidomimetics. J Pharm Sci 87:1322±1330.
268. KraÈmer SD. 1999. Absorption prediction fromphysicochemical parameters. PSTT 2:36±42.
269. Loebstein R, Lalkin A, Koren G. 1997. Pharmaco-kinetic changes during pregnancy and their clin-ical relevance. Clin Pharmacokinet 33:328±343.
270. Kennard RW, Stone LA. 1969. Computer aideddesign of experiments. Technometrics 11:137±148.
271. Dreyfuss J, Shaw JM, Ross JJ, Jr. 1978. Absorp-tion of the beta-adrenergic-blocking agent, nadolol,by mice, rats, hamsters, rabbits, dogs, monkeys,and man: An unusual species difference. Xenobio-tica 8:503±508.
784 ZHAO ET AL.
JOURNAL OF PHARMACEUTICAL SCIENCES, VOL. 90, NO. 6, JUNE 2001
Copyright © 2022 FDOKUMEN