Evaluation of Erosion Intensity and Some of Its Consequences in Vineyards from Two Hilly...
48
6 Evaluation of Erosion Intensity and Some of Its Consequences in Vineyards from Two Hilly Environments Under a Mediterranean Type of Climate, Italy Giuseppe Corti 1 , Eugenio Cavallo 2 , Stefania Cocco 1 , Marcella Biddoccu 2 , Giorgia Brecciaroli 1 and Alberto Agnelli 3 1 Dipartimento di Scienze Ambientali e delle Produzioni Vegetali, Facoltà di Agraria. Università Politecnica delle Marche, Ancona; 2 Istituto per le Macchine Agricole e Movimento Terra, Consiglio Nazionale delle Ricerche, Torino; 3 Dipartimento di Scienze Agrarie ed Ambientali, Facoltà di Agraria. Università degli Studi di Perugia, Perugia; Italy 1. Introduction Viticulture is one of the most diffused cultivations in the world. It is present in five of the six continents (except Antarctica) and in the first decade of XXI century vineyards have covered about 7.8 million hectares. In the same period, the global surface used for arable land and under permanent crops amounted to about 1.5 billion hectares (Bruinsma, 2003). Viticulture accounts only for about 0.5% of the whole agricultural area, and it can be inferred that the impact of this cultivation might be negligible at a global scale. In contrast, in the year 2009, the market of both wine and grapes moved around 300 billion of dollars in the world (AA.VV., 2010; FAO, 2011), putting the products of the viticulture at the top of the agricultural market. Unfortunately, also disadvantages induced by viticulture are considerable as most of the soils planted with vines have a fine texture and a moderate to steep slope (5-30°), and are submitted to climates where dry and rain seasons are rather alternated. Because of this, most of the vineyard soils are subjected to erosion. In this chapter we briefly analyse the situation of viticulture in the world in terms of surface covered, parent materials and soils used, and types and degree of erosion usually found in the vineyards. Thus, we present the results of two managing experiences made in two different environments of Italy, where grass covered and harrowed soil vineyards were contrasted to assess the capability of the grass to reduce erosion. In the general conclusions, taking advantage of the results obtained, we give suggestions to preserve soil resilience and productivity.
Transcript of Evaluation of Erosion Intensity and Some of Its Consequences in Vineyards from Two Hilly...

6
Evaluation of Erosion Intensity and Some of Its Consequences in Vineyards
from Two Hilly Environments Under a Mediterranean
Type of Climate, Italy
Giuseppe Corti1, Eugenio Cavallo2, Stefania Cocco1, Marcella Biddoccu2, Giorgia Brecciaroli1 and Alberto Agnelli3
1Dipartimento di Scienze Ambientali e delle Produzioni Vegetali, Facoltà di Agraria. Università Politecnica delle Marche, Ancona;
2Istituto per le Macchine Agricole e Movimento Terra, Consiglio Nazionale delle Ricerche, Torino;
3Dipartimento di Scienze Agrarie ed Ambientali, Facoltà di Agraria. Università degli Studi di Perugia, Perugia;
Italy
1. Introduction
Viticulture is one of the most diffused cultivations in the world. It is present in five of the six continents (except Antarctica) and in the first decade of XXI century vineyards have covered about 7.8 million hectares. In the same period, the global surface used for arable land and under permanent crops amounted to about 1.5 billion hectares (Bruinsma, 2003). Viticulture accounts only for about 0.5% of the whole agricultural area, and it can be inferred that the impact of this cultivation might be negligible at a global scale. In contrast, in the year 2009, the market of both wine and grapes moved around 300 billion of dollars in the world (AA.VV., 2010; FAO, 2011), putting the products of the viticulture at the top of the agricultural market. Unfortunately, also disadvantages induced by viticulture are considerable as most of the soils planted with vines have a fine texture and a moderate to steep slope (5-30°), and are submitted to climates where dry and rain seasons are rather alternated. Because of this, most of the vineyard soils are subjected to erosion. In this chapter we briefly analyse the situation of viticulture in the world in terms of surface covered, parent materials and soils used, and types and degree of erosion usually found in the vineyards. Thus, we present the results of two managing experiences made in two different environments of Italy, where grass covered and harrowed soil vineyards were contrasted to assess the capability of the grass to reduce erosion. In the general conclusions, taking advantage of the results obtained, we give suggestions to preserve soil resilience and productivity.

Soil Erosion Issues in Agriculture
114
1.1 Viticulture in the world Viticulture is practised worldwide (Figure 1). The grape is cultivated on a commercial scale (for wine, fresh or dry grapes) in more than 40 Countries, mostly between 4° and 51° of latitude in the Northern Hemisphere and between 6° and 45° of latitude in the Southern Hemisphere, under a wide type of climates (Tonietto & Carbonneau, 2004). A small surface is cultivated with grape in some regions across the Equator line, in the desert and tropical climates, as well as vineyards go as far as the 55th parallel north and the 50th parallel south. In some of the Countries belonging to the Old World viticulture has been practised for millennia, while many Countries of the New World, Asia and Oceania were engaged in viticulture very recently. The surface occupied by vineyards was about 8.8 million hectares in the 1950s and increased till more than 10 million hectares in the 1970s; then the surface considerably decreased till about 7.7 million hectares in 2009 (Figure 2). If one considers that, especially in the last three decades, the vineyard surface increased a lot in the Countries recently interested by viticulture, the result is that viticulture has decreased to a large extent in the Old World.
Fig. 1. Schematic representation of the World map with indicated the Countries where viticulture is practised.
Last statistics available from OIV, the World Viticulture Organisation (OIV, 2007), reveal that after a period of sustained growth that continued until the late 1970s, global vineyard surface started to decline as a result of European Union vine pull schemes and extensive vine pulls in the former Soviet Union. In 1998, the global vineyard surface had reached its lowest level since 1950: 7.6 million hectares. The change in the world vineyard hectarage is the result of different situations in Continents and Countries. For example, in North and

Evaluation of Erosion Intensity and Some of Its Consequences in Vineyards from Two Hilly Environments Under Mediterranean Type of Climate, Italy
115
South America the surface under vines was 982,000 hectares; the USA area under vines levelled off at around 400,000 hectares, while Argentina and Brazil, as Chile to a lesser degree, maintained growth. In Africa, vineyards continue their expansion so to reach 394,000 hectares in 2007. In Asia, 1.649 million hectares are under vine. A large portion of the production is here destined for non-wine use, especially in Iran, Turkey and Syria. China's vineyards continue to increase in surface, although the Country's grape production is still dominated by table grapes. In Asia, China is not the only Country where vineyards are increasing surface, since Iran's area under vines (mainly destined to unfermented grape products) reached 330,000 hectares. Oceania continues to expand its vineyard surface, with a total of 204,000 hectares in Australia and New Zealand in the year 2007. Europe has seen its area under vines steadly to decline since the year 2000. In 2007, the vineyard surface was 4.563 million hectares. Spain, France and Italy cover most of this large surface, with 1.169 million, 867,000 and 847,000 hectares, respectively (FAO, 2011). It should be noted that most of this decrease took place in France, which was the only European Union Country to undertake another extensive subsidised vine grubbing scheme. Continental trends should be kept in perspective by weighing the relative size of surface under vines on each continent: in the year 2007, Europe, the EU-15 (the European Union considering the early 15 member States) and the EU-25 (the European Union considering the 25 member States in 2007) accounted for 58.6%, 43.7% and 45.5% of the global vineyard, respectively.
Wor
ld su
rfac
epl
ante
dw
ith
vin
es
1950 1960 1970 1980 1990 2000 2010
10,500
10,000
8,000
8,500
9,000
9,500
7,500
7,000
Years
(tho
usa
ndso
fhec
tare
s)
Fig. 2. Trend of the World’s surface planted with vines from 1950 to 2010.
1.2 Viticulture in Italy In Italy, viticulture dates back to 4000 years before present, when it was introduced in Sicily from Greece (Fregoni, 1998). A millennium after its introduction, viticulture had colonized so much of the southern Italy that the Greek people called this land Oinotria (), namely the "land of the vines supported by stakes". During the successive millennium, the Etruscan first and the Romans then spread the viticulture in Italy and in the Roman Empire. Diffusion of vineyards became of so large scale that in the AD 92 the Roman Emperor Titus

Soil Erosion Issues in Agriculture
116
Flavius Domitianus, preoccupied of the reduction of areas devoted to cereals cultivation, banned plantation of new vineyards and obliged to grub half of the vineyards (Suetonio Tranquillus, after AD 121). However, the reduction of vineyards persisted till the IV century, when the Roman Emperor Flavius Theodosius promulgated a law that contemplated the death penalty in case of vines grubbing. Nonetheless, the crisis of viticulture went on till the XIII-XIV century, surviving mainly in the proximity of monasteries, convents, churches and within the wall of the cities-states such as Florence and Siena. From the XIV-XV century, together with a certain economic and politic stability, viticulture regained surfaces and continued to increase till the middle of XIX century. Afterward, two plagues threatened the vine survival in Italy as in Europe: meldew (around 1850) and phylloxera (1880-1890). While the first illness was rather easily overcome by the use of sulphur, the second one exhausted vineyards till the first decades of the XX century. Only after the 1930, with the diffusion of the american rootstocks, viticulture recovered surfaces reaching a maximum of expansion in the 1950s with more than 3,700,000 hectares (Figure 3). Once again, after that period of glory, a surface reduction started and it persists till nowadays when a surface of about 800,200 hectares has been reached (Figure 3). Of
1950 1960 1970 1980 1990 2000 2010
Ital
ian
surf
ace
plan
ted
with
vine
s
Years
(tho
usan
dsof
hect
ares
)
4000
3500
1500
2000
2500
3000
1000
500
0
Fig. 3. Trend of the Italian surface planted with vines from 1960 to 2010.
these, about 730,000 hectares are devoted to wine production, while nearly 70,000 hectares are for human fresh grape consumption (ISTAT, 2009). Even though it is difficult to estimate the amount of surface devoted to vineyards during the Roman Empire or the Renaissance, it is assumed that the expansion reached in the 1950s should be the maximum reached in Italy in the story of viticulture. As a matter of fact, the 1950s and 1960s were two decades during which soil erosion was severe insomuch that the Italian soils lost about 30% of their water holding capacity (Pagliai, 2008). This was not only responsibility of viticulture, but at that time viticulture interested more than 12% of the whole Italian territory (which accounts to about 301,000 km2). In those decades, vineyards were planted even in areas that never had hosted vines, including dormant landslides and hilly soils with a fine texture that were tilled topdown. Further, thanks to the availability of mechanical machines, the vines were planted

Evaluation of Erosion Intensity and Some of Its Consequences in Vineyards from Two Hilly Environments Under Mediterranean Type of Climate, Italy
117
after deep soil breaking up and levelling. Also because of this, many were those who put into relation expansion of viticulture and increase of hydraulic erosion processes (Tropeano, 1984; Costantini et al., 2001; Costantini, 1992; Kosmas et al., 2000; Pisante et al., 2005; Bazzoffi et al., 2006). Recently, to mitigate erosion, vineyards are usually planted with rows along isoipsae and the soil is grass covered, but erosion still persists. In fact, grassing was adopted as an universal cure whose efficiency in contrasting erosion should be assessed in the different pedo-climatic conditions.
1.3 Soil parent materials and soils devoted to viticulture Many researchers with geologic background observed a connection between wine and geology, however pedologists believe that vine health and wine quality are conditioned by soil physical, chemical and mineralogical properties, which are only partly inherited from parent material. In fact, the nature of the parent material thoroughly influences soil characteristics but these latter are not exactly inherited from the substratum. For example, a soil can inherit a sandy texture if developed from granite or sandstone, while the presence of limestone in the parent material will slow the development of soil acidity (Brady & Weil, 2008). It is also true that availability of nutrients (P or N, for example), accumulation of organic matter or formation of soil aggregates depend on the type of pedogenesis and, hence, on the type of climate and vegetation that in time operated on a given parent material. The grape quality and wine composition can be conditioned by soil texture, which determines water availability and related consequences such as drainage, evapotranspiration, nutrient availability. The reduced development of vine foliage caused by a mild water stress may result in a better bunch exposure to light and in a smaller fruit size, usually improving the grape quality too. A study of the soils of Burgundy (France) concluded that vines produce the best wine where the soil contains both clay and pebbles as the first improves water retention and cation exchange capacity, while the second favour the drainage (Huggett, 2006). However, most of the vineyards submitted to a Mediterranean climate occupy fine-textured soils and are often prone to erosion. In these territories, spatial and seasonal climatic variability may result in a wide and unpredictable rainfall fluctuation from year to year and could increase rates of erosion (Nunes & Seixas, 2003; Nearing et al., 2005). This rate is increased by other conditions such as the abandonment of protective agricultural practices and the (ab)use of soils derived from unconsolidated parent materials like marls, limestones, and fluvial and marine sediments (Poesen & Hooke, 1997; Martínez-Casasnovas, 1998). In fact, the nature of the underlying rock and the soil-rock relationships affect rate of water discharge, entity of the runoff and penetration of vine roots to varying degrees (Huggett, 2006). This means that the choice of the soil type where to plant vineyards or other orchards should be fundamental to ensure a long economical life to the plantations and to obtain high quality products. It is hard to list all the parent materials and the related soil types on which vineyard are implanted because of the wide diffusion and the good adaptation of the vine, but a not exhaustive inventory includes the following lithologies from which the most used soils for vineyards originated. Granite is an igneous rock which has a hard and granular texture and an high content of quartz. Soils evolved on this parent material drain and dry out very quickly; for these reasons they frequently have an acid pH and store heat. Soils from granite occur in many wine-producing areas such as Beaujolais and the Rhône (France), Sardinia

Soil Erosion Issues in Agriculture
118
(Italy), northern Portugal and Cape Cod (Massachusetts, USA). Igneous and metamorphic rocks generally result in stony, well-drained, and relatively unfertile soils. Basalt represents a common volcanic rock on which developed soils of many viticultural areas like Canary Islands (Spain), the Azores (Portugal), and Mount Etna (Sicily, Italy). Other regions that host vineyards planted in soils from basalt also are in western India, southern Australia, Oregon's Willamette Valley (USA), south-central France, northern Italy, and Hungary, but the largest one is the Columbia Valley Pacific Northwest, USA. Limestone and marls produce soils rich of plant-accessible calcium in French great wine regions like Champagne, Burgundy, Chablis, the Loire, southern Rhône valleys and Saint-Emilion in Bordeaux. Stony soils derived from limestone produce well drained soils with pockets of clayey or silty-clayey material that are rapidly colonized by vine roots. Chalk and similar soft, bedded limestones provide crumbly soils that are both well drained and have the capacity to retain water in the micropores of soil rock fragments or underlying parent rock. Soils from chalk have low fertility unless mixed with clayey or organic material coming from adjacent formations. Sandstones represent a combination of clay minerals and sand granules compacted together by pressure and time and may originate soils with a good drainage and nutrient status. Schist rocks based soils retain heat well and are rich in magnesium and potassium but they are usually poor in organic matter and nitrogen. In places, soils evolved on schist are preferred over those on granite because of their permeability, which favours penetration of rainfall and roots. Shale is a fine-grained sedimentary rock that gives moderately fertile soils that well retain heat, but have a very low porosity and a slow drainage that make them prone to erosion on impervious morphologies (Huggett, 2006). Alluvial deposits that are characterized by a combination of gravel, sand, silt and clay, formed over time from mineral deposits left by running water and that colonized geological terraces, frequently originate soils interested by viticulture. Speaking about soil orders (according to the USDA classification), all of them are used for viticulture except Gelisols and Histosols. The reasons of this are obvious as Gelisols develop in very cold regions and are affected by cryoturbation and permafrost, while Histosols are organic soils that form in cold regions or/and in humid/perhumid conditions. These climatic conditions are extreme even for a so easy-fitting species like vine. The use of soils belonging to the orders of Vertisols and Mollisols are of particular interest for viticulture as the first ones are those that fracture during summer, while the second ones mostly develop on cold and humid areas. As Vertisols have been reported as harmful for the life of vines, the plantation of vineyard on this type of soils requires irrigation (to avoid fracturation) or the use of rootstock resistant to severe breakings of the roots. The use of Mollisols in viticulture requires protecting vines during winter, when temperature may go several degrees below zero.
1.4 Soil erosion in the vineyards During the last decade the topic of soil water erosion in the vineyard has received much attention, due the great economic value of the viticulture products and the increase of problems caused by the erosion itself. Since 16% of world lands was estimated to be vulnerable to erosion hazard, water erosion is considered one of the major causes of soil degradation (FAO, 2000). In Europe, 12% of the land is estimated to be subject to soil erosion, which is considered to be one of the eight worst soil degradation threats (CEC, 2006a). Because of this, since 2006 the European Commission adopted the Thematic Strategy

Evaluation of Erosion Intensity and Some of Its Consequences in Vineyards from Two Hilly Environments Under Mediterranean Type of Climate, Italy
119
for Soil Protection with the aim to protect soils across the European Union. This strategy consists of i) a communication between the Commission and the other European Institutions (CEC, 2006a), ii) a proposal for a framework Directive (an European law), and iii) an Impact Assessment. The proposal for a framework Directive (CEC, 2006b) sets out common principles for protecting soils and, under this common framework’s guidance, the EU Member States should decide how to use the soil in a sustainable way and how to effectively protect it on their own territory. In Mediterranean regions, the concern of soil water erosion increased during the last decades, as a consequence of both natural and anthropogenic factors (Kosmas et al., 1997; CEC, 2006a). In recent years many efforts have been carried out by the research community in order to assess the soil erosion rates in agricultural or recently abandoned lands in Europe. According to data collected from several study cases by Cerdan et al. (2010), vineyards show the highest soil losses among cultivated lands, being lower only in comparison with bare soils. These authors observed that soil water erosion rates for bare soils, arable land and vineyards resulted unexpectedly lower in the Mediterranean zone than in other European regions. However, in the Mediterranean basin, in comparison with other typical crops, vineyards represent the form of agricultural land use that causes the highest soil loss (Raclot et al., 2009). In addition, in some parts of the Mediterranean area, vineyards represent the largest agro-ecosystem type and constitute the most important crop in terms of income, employment and environmental impact. As Spain, France and Italy are three of the world top ten grape-producing Countries and most of the territory of each one is in the Mediterranean area, many field studies on soil water erosion in vineyard have been carried out in these Countries. Some of them are cited as example here below. In Spain, soil loss in vineyards was investigated at field scale in the wine region of Penedès (Catalonia) by Ramos & Martínez-Casasnovas (2007) and in Navarre by Casalí et al. (2009). In France, the intensity of soil erosion in the vineyards was studied in the Ardeche region by Augustinus & Nieuwenhuyse (1986) and, more recently and using different scales and methodologies, in Burgundy (Brenot et al., 2008) and in Languedoc-Roussilon (Blavet et al., 2009; Raclot et al., 2009; Paroissien et al., 2010). In Italy, Tropeano (1984) measured soil erosion for a two-years period in confined plots located in three vineyard areas in Piedmont (NW Italy). Most of the investigations about soil losses in vineyards are based on experimental plot studies where erosion rates are measured under natural or simulated rainfalls. The runoff from each confined plot is usually collected with a Gerlach box type or discharge gauge and runoff samples are analyzed in order to measure their sediment concentration. Another approach to quantify soil erosion and deposition rates is based on stock unearthing measurements (Brenot et al., 2008). In addition, many authors estimated soil erosion rates using proper models such as the RUSLE, the Revised Universal Soil Loss Equation (Martínez-Casasnovas & Sánchez-Bosch, 2000). However, the considerable amount of studies on erosion is justified by the need to better quantify the risk and to know the role of the various factors that affect soil water erosion, in order to define sustainable management practices. It is well known that the factors primarily influencing soil erosion are climate, topography, soil texture and soil management. In Europe, vineyards are often located on hilly areas subjected to a Mediterranean climate that makes optimum conditions for vine-growing, but also favour a strong erosion. Topography, especially slope gradient, is one of the factors that

Soil Erosion Issues in Agriculture
120
predisposes soil to water erosion. In the past, in order to make manual cultivation easier and also to intercept surface runoff, fields on sloping sides were generally terraced and cultivated with vine-rows oriented perpendicularly to slope. Nowadays, constitution (and maintaining) of a terrace system have often been replaced by land levelling and vine-rows running along the slope (Ramos & Martínez-Casasnovas, 2007). In the Mediterranean basin, rainfall of high intensity and short duration that could occur in summer or autumn are responsible of most of the soil loss (Tropeano, 1984; Ramos & Martínez-Casasnovas, 2007; Raclot et al., 2009). The erosion rate differs in the various Countries, and was estimated to be 2.3 Mg ha-1 year-1 in Italy, 1.5 Mg ha-1 year-1 in France and 1.0 Mg ha-1 year-1 in Spain (Cerdan et al., 2010). Considering the mean value per land-use class, these Authors predicted a value of 17 Mg ha-1 year-1 for vineyards, that represents the highest value among all cultivations. Soil loss rates estimated in vineyard plots with different soil management techniques by Tropeano (1984) ranged from 0.2 to 47 Mg ha-1 year-1, with the highest values obtained for a vineyard that was deeply ploughed just before the period of observation. This annual rate was close to the 44 Mg ha-1 year-1 estimated by Lorenzo et al. (2002) in NE Spain. As a result of a single extreme rainfall event, soil losses up to 34 and 217 Mg ha-1 were measured in SE France (Wainwright, 1996) and in NE Spain (Martínez-Casasnovas et al., 2002), respectively. The intensity of extreme rainfall events, which were increasing over the past 50 years, is projected to become more frequent (EEA-JRC-WHO, 2008) in consequence of global climate change and, consequently, soil erosion in vineyards is expected to increase again. Besides topographic and rainfall characteristics, some soil management practices in vineyards could favour erosion. We have already mentioned here above that conservation measures such as the vine-rows orientation perpendicular to the slope and terracing have been abandoned in order to support field mechanization and increase the land productive potential. Blavet et al. (2009) reported the several changes pointed out by other authors in land use and farming techniques since 1970s in French Mediterranean wine-growing areas. These changes include the mechanization of the vineyard with straight rows of vines on trellises, chemical weeding to save manpower and the enlargement of vineyards to slopes so to obtain high quality wines. These anthropogenic modifications have made the soil more susceptible to water erosion as a high traffic of machinery on sloping vineyards increases bulk density, reduces water penetration and soil water holding capacity (Ferrero et al., 2005), that in turn produce effects even on soil permeability and, therefore, on runoff and soil erosion processes. Since factors like topography and soil texture are difficult to modify, different management techniques could be adopted as measures to reduce soil water erosion. Then, common farming methods like tillage and chemical or mechanical weeding between the rows have been compared with more conservative techniques such as mulching, grassing or rock fragments covering to evaluate the effects on runoff and soil loss (Blavet et al., 2009) and to obtain information about most suitable management practices for land protection. Vineyards affected by degradation are generally subjected to sheet and rill erosion processes; in particular, during high-intensity rainfalls, the concentration of the overflow along preferential pathways could produce rills and ephemeral gullies (Martínez-Casasnovas et al., 2005), which form a provisional discharge network on the field. This causes negative on-site effects like soil and nutrient losses and, in a medium- to long-term, also fertility and organic carbon stock could decrease (Poesen & Hooke, 1997; Ramos &

Evaluation of Erosion Intensity and Some of Its Consequences in Vineyards from Two Hilly Environments Under Mediterranean Type of Climate, Italy
121
Martínez-Casasnovas, 2004). Additional negative effects due to erosion require a direct economic engagement for the restoration of damages. The original soil surface can be restored by normal tillage operations, but the zones interested by ephemeral gullies will remain prone to be eroded during future runoff events. Environmental impact of soil erosion is also due to risk of pollution and inundations or muddy floods (Le Bissonais et al., 2002; Bechmann et al., 2009). Martínez-Casasnovas et al. (2005) evaluated on 5% of the income of the farm involved, the operation costs to redistribute the sediments over the field after an erosive rainfall event that had produced ephemeral gullies in vineyards of the Penedès region (NE Spain). The costs increase up to 7.8% of the income when the replacement of the nitrogen lost associated to soil erosion is taken into account (Martínez-Casasnovas et al., 2006). In Europe, like in countries where wine-growing is emerging, the setting of sustainable management practices to handle land degradation is the primary aim of studies on soil water erosion in vineyards. Researches on that issue are nowadays more and more actual, considering the economic role of grape production and the effects of climate change on factors that control soil erosion processes.
2. Field experiences on the effect of soil managements in Italian vineyards
2.1 Background In the last decades, many winegrowing areas of the Mediterranean region with soils developed from fine-textured parent materials have been subjected to an increase of water erosion that, mainly in hilly environments, has lead to soil degradation (Kosmas et al., 1997; Martínez Casasnovas & Sánchez Bosch, 2000; Dahlgren et al., 2001; Pla Sentís & Nacci Sulbarán, 2002; Martínez Casasnovas et al., 2005). As a matter of fact, nowadays the vineyard represents one of the most erosive land uses in the Mediterranean as well as in humid environments (Tropeano, 1984; Cerdan, 2010), with erosion rates so high to reach an average soil loss of about 1.4 Mg ha-1 yr-1 (Kosmas et al., 1997). This also causes a relevant loss of organic carbon and nutrients from the superficial soil horizons. In areas where the vineyard is the main land use, such a level of soil degradation is a serious agricultural and environmental problem as it causes loss of the fertile topsoil and pollution of the superficial water bodies where the eroded materials sediment (Pieri et al., 2007). In this context, soil productivity and other soil functions risk to decline irreversibly (Biot & Lu, 1995; Bruce et al., 1995) if correct practices to prevent erosion are not taken into account (Hudson, 1995; Morgan, 1995; Agassi, 1996). Because of this, many studies have been run to conceive managing practices able to reduce soil erosion and maintain or increase productivity in the vineyard. Most of these studies have focused on the adoption of permanent grassing (e.g. Schwing, 1978; Messer, 1980; Gril et al., 1989) or straw mulching (e.g. Carsoulle et al., 1986; Gril et al., 1989; Louw & Bennie, 1991). In Italy, where vineyards are mostly implanted on hills, soil erosion has somewhere reached threatening levels (Federici & Rodolfi, 1994a, b; Sorriso-Valvo et al., 1995; Phillips, 1998a, b). In the Italian vineyards the erosion was also exacerbated by farming practices such as enlargement of vineyards, hedgerows removal, cutting of the elms (Ulmus spp.) and mulberries (Morus spp.) trees that supported the vines in the old vineyards (Italian term: alberata), mechanization of vineyards with constitution of straight rows with vines supported by wood or metal stakes, and chemical weeding of the inter-row. All these practices of inappropriate landscape and soil management have produced a rather even

Soil Erosion Issues in Agriculture
122
slope surface without redistribution of ground water circulation, so favouring activation of landslides and flow phenomena in addition to other forms of sheet and rill erosion. In the attempt to solve or reduce the problem, in the last decade many farmers have changed the previous soil management into permanent grassing of the inter-row, but the effects of this management on the soil erosion and properties have been scarcely studied, especially if one considers the variety of the Italian pedo-climatic environments.
2.2 Evaluation of erosion in tilled and grass covered soils in vineyards from north-western Italy 2.2.1 Introduction In Italy, Piedmont is a long established and specialized wine region and produces some of the best-known, top quality Italian wines (e.g. Asti Spumante, Barolo, Barbera) and it is the second largest (after Veneto) Italian exporting region. The region produces 11 DOCG (Denomination of Controlled and Guaranteed Origin) wines, over 38 in all Italy, and 45 DOC (Denomination of Controlled Origin), over 316 in all Italy, which account for almost 80% of the total regional production and represents about 15% of Italian production of appellation wines (Cusmano, 2010). Therefore, in this region the vines growing and oenological industry greatly contribute to the agricultural income. Vineyards in Piedmont cover more than 53,000 hectares, namely around to 7.3% of the Italian wine production area (730,000 hectares). In the Region, fresh grape production is negligible. According to the agricultural statistical database of the Piedmont Regional Administration, almost 90% of the vineyard surface of the region is on hilly area and near 2% on mountain area, and the vineyards are concentrated in the southern part of the region (Figure 4), in the Asti, Cuneo and Alessandria Provinces (Regione Piemonte, 2011a). Geology of the hilly sector of the southern Piedmont is made of Cenozoic deposits of the Tertiary Piedmont Basin, where three tectonic-sedimentary domains have been identified: Turin Hills, Langhe Basin and Monferrato Hills. The nature and structure of the bedrock strongly affect some morphological characteristics of this hilly area such as the asymmetry of the valleys and the intense soil erosion activity (Luino, 2005). More than the 50% of the hilly land of this region is characterized by soils that are considered to have high erodibility as they display values of the RUSLE K-factor (Wischmeier & Smith, 1978; Renard et al., 1997) higher than 0.047 Mg ha h ha-1 MJ-1 mm-1 (Ipla, 2007). In fact, soils with high erodibility are characterized by K-factor values higher than 0.05 Mg ha h ha-1 MJ-1 mm-1 (van der Knijff, 2000). In this paragraph we report a 10-years (2000-2009) dataset of soil loss measurements made in vineyard plots differently managed in a Piedmont vineyard area, in order to analyze the impact of the management on runoff and erosion caused by natural rainfalls.
2.2.2 Materials and methods
Study site
The research was carried out in a vineyard of the Experimental Vine and Wine Centre of Piedmont Regional Administration (Italy) called “Tenuta Cannona”. The vineyard was in the hilly territory of Alto Monferrato belonging to Monferrato Hills geological domain (Figure 4), in the locality Carpeneto (44°40’ N, 8°37’ E), and covered an area with a mean elevation of 290 m, a SE aspect and a mean slope of about 15%. The climate is temperate, with a mean annual air temperature and a mean annual precipitation calculated on the 2000-2009 period of 13°C and 850 mm, respectively. Rainfalls are mainly concentrated in Autumn

Evaluation of Erosion Intensity and Some of Its Consequences in Vineyards from Two Hilly Environments Under Mediterranean Type of Climate, Italy
123
(October and November) and Spring (April and May), while the driest months are June and July (Figure 5). Summer rainfall events are often of high intensity and short duration. The soils derived from reworked Pleistocene alluvium, had a clay to clay-loam texture and were classified as Typic Ustorthents, fine-loamy, mixed, calcareous, mesic (Soil Survey Staff, 2010) or Eutric Cambisols (FAO/ISRIC/ISSS, 1998).
Fig. 4. Map of Italy with magnification of the Piedmont region and indication of the study site. Modified from Regione Piemonte (2011b).
Fig. 5. Annual rainfall distribution in the study area.
Experimental design
The vineyard was planted in 1988 with Barbera vines. The vines were spaced 1.0 m on the row and 2.8 m between the rows. The rows were aligned along the slope. Investigation was carried out in three contiguous experimental plots (Figure 6). Each plot was 74.0 m long and

Soil Erosion Issues in Agriculture
124
16.5 m width, for a total area of 1221 m2 . Each plot included 7 vines rows. In each plot, the soil of the inter-row was managed with different techniques: conventional tillage (CT), reduced tillage (RT) and controlled natural grass covering (GC) with mulching. The inter-row of the CT plot was harrowed with a chisel and then with rotary cultivator at a maximum depth of 0.25 m. This soil management was the one traditionally adopted in the neighbourhood of the Experimental Centre. The inter-row of the RT plot was harrowed with a rotary cultivator at a depth of 0.15 m. Tillage operations in the CT and RT plots were carried out twice a year, usually in Spring and Summer, only occasionally in Autumn. The inter-row of the GC plot was mown twice a year, in Spring and Summer. Weeds under the rows of the three plots were controlled with a single herbicide application (Glyphosate®) in Spring, for a width of about 60 cm across the vine row. Chemical fertilizer was applied in the vineyard until 2004 by distributing once per year (in Spring or Autumn) the equivalent of 30 kg ha-1 of N, 20 kg ha-1 of P and 45 kg ha-1 of K in form of complex fertilizers. During the period of observation, once (in Spring) or twice a year (Spring and Autumn) soil samples were collected from each plot in three transects along the slope. Each transect consisted of three sampling places: the centre of the inter-row and the two tractor tracks; for each place, samples were collected at three depths (2-8, 12-18 and 22- 28 cm) by a soil corer with a known volume of 100 cm3. On these samples, bulk density and soil moisture at field capacity were determined. In 2004, surface soil samples were also collected in duplicates to determine soil texture. The measured soil properties are shown in Table 1.
CT RT GC Soil texture [2] [4] [2] Sand (60-2000 µm)(%) 31.0±0.0 23.7±3.3 18.5±4.9 Silt (6-60 µm) (%) 33.5±0.7 26.0±0.9 25.5±2.1 Clay (0-6 µm) (%) 35.5±0.7 50.2±2.5 56.0±7.0 Bulk density (g cm-3) 1.42±0.07 1.50±0.09 1.39±0.08 Soil moisture at field capacity (%) 24.5±2.2 21.0±3.3 26.7±3.2
Table 1. Soil properties of the three experimental plots (CT=conventional tillage; RT=reduced tillage; GC=controlled grass cover). Values are the average of n replicates, indicated within square brackets (± standard deviation).
Each plot was hydraulically bounded. Runoff and sediments coming from each plot were collected at the bottom by a drain. Each drain was connected to a sedimentation trap and then to a tipping bucket device for the runoff measurement (Figure 7). A portion of the runoff-sediment mixture was addressed to a sampler tank. After each rainfall event that was significant for the amount and the intensity of precipitation and during which sediments were transported in the sampler tank, a 1.5 L sample of runoff-sediment mixture was collected in order to measure the sediment concentration in the runoff. The samples were oven-dried and weighed to determine the sediment concentration. Sediments deposited along drains and in the sedimentation traps were collected and weighed. The total soil loss due to each event was obtained adding the two sediment values. Hourly rainfall measurements was recorded by a rain-gauge station placed at about 200 m from the plots. Rainfall duration, total rainfall and hourly intensity were calculated from the data recorded by the rain-gauge.

Evaluation of Erosion Intensity and Some of Its Consequences in Vineyards from Two Hilly Environments Under Mediterranean Type of Climate, Italy
125
Fig. 6. Scheme of the experimental plots with indicated the position of the runoff collecting system.
Fig. 7. Sedimentation trap and tipping-bucket device for runoff discharge measurements.
2.2.3 Treatment of the data collected We took into account the rainfalls that produced runoff higher than 0.03 L m-2 (equivalent to 0.03 mm) in every plot. During the ten years of observation, 156 rainfall events satisfied this

Soil Erosion Issues in Agriculture
126
condition. The precipitation measured during each event was considered as the rainfall that caused runoff, and the runoff was associated to the precipitations that caused it. In order to analyze the inflow-outflow collected data, rainy (rarely snowy) days were grouped on the basis of seasons and meteorological conditions, as it follows: - for rainfalls of long duration and low intensity and snowfall, which occurred in
Autumn and Winter and rarely in early Spring, the events were made of days with precipitation and the following days with runoff measurements due to drainage flow;
- for rainfalls of short duration, which generally occurred in Spring and Summer and rarely in Autumn, the events were separated by period of 12 (or more) hours without rainfall or with rainfall with hourly intensity below 0.2 mm h-1;
- snowfalls were considered in case they were followed by rain, so to cause snow melting. In such occasions, snow and rain contributed to form runoff and generate soil erosion.
2.2.4 Results and discussion
Runoff
In the 10 years of observation, 8496.6 mm of precipitation were measured at the rain-gauge. The year with the highest precipitation was 2002, with 1257.0 mm of rain water, nearly twice of the amount measured in 2007, the driest year, with only 651.6 mm. In Table 2, the precipitations recorded during the observation period are listed and compared with the rainfalls that produced runoff higher than 0.03 L m-2 and with surface flow. The rainfall events that produced runoff were 156, namely 79% of the total precipitations. The annual distribution of rainfall producing runoff was consistent with the annual distribution of precipitation. In Autumn and Winter, about 80% of the total precipitation (2811.0 and 1609.2 mm, respectively) produced runoff. The proportion of water lost as surface flow was variable in the seasons: the runoff was minimum in Summer, when only 19% of the 760.6 mm of rain producing runoff flowed superficially, and maximum in Winter, with 10-years runoff that reached 70% of the total precipitation. Similar values were reported by Kosmas et al. (1997). As these authors pointed out, in Winter the soil usually has the lowest infiltration rate, due to high moisture content and to the high compaction of the plough layer, so causing high runoff. Differences among runoff in the different plots are evident in each season. The total runoff was highest in the CT plot during Winter and Spring, while in Summer and Autumn the maximum values were registered in the RT plot. The 10-years amount of runoff was lowest in the GC plot in every season. Single-year runoff values recorded in Summer and Autumn have been in many cases highest in the RT plot and lowest in the GC plot. In contrast with this general observation, three times (in 2002, 2006 and 2007) Winter runoff was higher in the GC plot than in the tilled ones, and four times (in 2000, 2001, 2002 and 2004) the Spring runoff was lower in RT plot than in the CT one. The runoff values associated to rainfalls occurred from December to May have been more variable, probably because of the irrelevance of tillage and grass cover. In fact, the first tillage operation is generally made on May and the second during Summer, so the different soil management influenced differently the runoff production during Summer and Autumn. The variability of data collected over 10 years confirmed the relevance of having long-term measurements of runoff and soil erosion under natural conditions. In fact, some of the studies that analyzed soil management effects on erosion in vineyard were based on data

Evaluation of Erosion Intensity and Some of Its Consequences in Vineyards from Two Hilly Environments Under Mediterranean Type of Climate, Italy
127
obtained under rainfall simulations (Blavet et al., 2009), while others compared data of soil erosion related to natural rainfalls considering periods of observation of 2, 3 or 5 years, with a number of measured events from 9 to 20 (Tropeano, 1984; Kosmas et al., 1997; Ramos & Martínez-Casasnovas, 2007; Raclot et al., 2009).
Soil loss
On 156 rainfall events causing runoff, 63 have produced significant soil erosion. The selected events were the most erosive for each observed year. The concentration of sediments obtained from the sample collected after each rainfall event was considered constant during the entire rainfall event. The soil loss caused by the rainfall event was then calculated by the sum of the sediment deposited along channels and in the sedimentation trap plus the product of the sediment concentration per runoff. Runoff events were described with following variables: i) duration of each meteorological perturbation (considered on the basis of the described method), expressed in hours (h); ii) duration of rainfall within each event of precipitation, in hours (h); iii) amount of rain water (R, in mm) measured during the event; iv) maximum rainfall intensity over a 60-min period (I60max, in mm h-1); v) mean rainfall intensity (Im, mm h-1) recorded during the rainfall event. For each plot, other variables were taken into consideration: vi) the measured runoff (RO, in mm); vii) the runoff coefficient (RC, in %), obtained by dividing RO for R; viii) the soil loss (SL, in kg ha-1); ix) the soil loss per mm of rain (SLmm, kg ha-1 mm-1), obtained by dividing SL for R. The selected events (Table 3) covered a wide range of weather conditions. The duration of the rainfall events ranged from 1 hour (8 August 2004) to 428 hours (from 23 November to 9 December 2002), in which the rainfall duration varied between 1 and 121.5 hours. The event with the longest precipitation occurred from 4 to 21 January 2008, when in 17 days (396 hours monitored) snow and rain fell during 136 hours. Rain water varied from 9 mm (14-16 April 2002) to 208.8 mm (12-30 November 2000). Maximum rainfall intensities over a 60-min period (I60max) ranged from 1.2 mm h-1 (17-21 April 2008 event) to 76.2 mm h-1 (06 August 2002). Mean rainfall intensity (Im) varied between 0.5 mm h-1 (17-21 April 2008) and 47.4 mm h-1 (08 August 2004). The lowest amount of runoff was recorded from all plots during the 29-30 May 2003 event, when only 0.05, 0.07 and 0.1 mm flowed respectively from the CT, RT and GC plots. The highest runoff values were recorded during Autumn or Winter events for all plots: 132.99 mm in the CT plot from 23 November to 9 December 2002, 133.07 mm in the RT plot on 1-2 February 2009, and 97.15 mm in the GC plot on 12-30 November 2000. The high variability of the runoff response is remarked by observing the runoff coefficients (RC). The lowest value was 0.3%, recorded in the CT plot during the event of 29-30 May 2003. After each rainfall event with RC lower than 1%, soil losses were measured. The highest RC values were unexpectedly greater than 100%. They were recorded for events occurred during the cold season (18-19 November 2002 and 2-10 February 2009). In these cases, an amount of runoff higher than the amount of rainfall was explained as the consequence of snow melting or the supply from ponds formed during previous precipitation events. Excluding cases with RC greater than 100%, the highest RC was 74.3%, obtained for the CT plot during the event that occurred from 23 November to 9 December 2002. Excluding Winter events, the highest RC (65.8%) was recorded in the RT plot in the period 26 April - 05 May 2009. To best compare different events, the soil loss per mm of rain (SLmm) was considered. For this variable, the lowest value obtained was 0.006 kg ha-1 mm-1 in the CT plot after the 30-31 August 2000 event. In contrast, the highest value was 755.026 kg ha-1 mm-1, considering the soil loss measured during the 13-14 July 2008 event, in the RT plot.

Soil Erosion Issues in Agriculture
128
Wi = Winter (December, January, February); Sp = Spring (March, April, May); Su = Summer (June, July, August); Au = Autumn (September, October, November).
Table 2. Total rainfall, amount of rainfall that produced runoff > 0.03 mm, and runoff measured from the three plots in each season during the period of observation (2000-2009).
Evaluation of Erosion Intensity and Some of Its Consequences in Vineyards from Two Hilly Environments Under Mediterranean Type of Climate, Italy
129
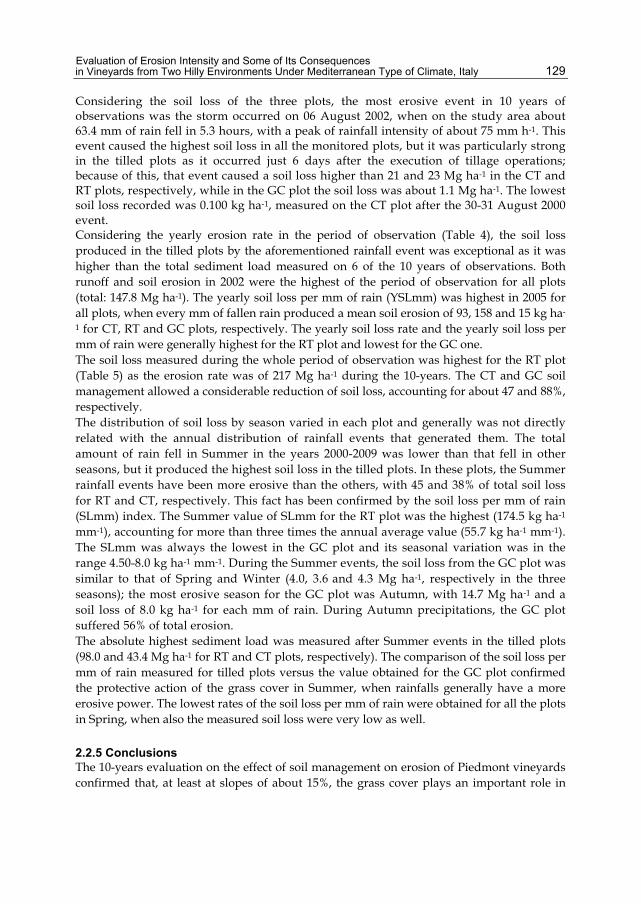
Considering the soil loss of the three plots, the most erosive event in 10 years of observations was the storm occurred on 06 August 2002, when on the study area about 63.4 mm of rain fell in 5.3 hours, with a peak of rainfall intensity of about 75 mm h-1. This event caused the highest soil loss in all the monitored plots, but it was particularly strong in the tilled plots as it occurred just 6 days after the execution of tillage operations; because of this, that event caused a soil loss higher than 21 and 23 Mg ha-1 in the CT and RT plots, respectively, while in the GC plot the soil loss was about 1.1 Mg ha-1. The lowest soil loss recorded was 0.100 kg ha-1, measured on the CT plot after the 30-31 August 2000 event. Considering the yearly erosion rate in the period of observation (Table 4), the soil loss produced in the tilled plots by the aforementioned rainfall event was exceptional as it was higher than the total sediment load measured on 6 of the 10 years of observations. Both runoff and soil erosion in 2002 were the highest of the period of observation for all plots (total: 147.8 Mg ha-1). The yearly soil loss per mm of rain (YSLmm) was highest in 2005 for all plots, when every mm of fallen rain produced a mean soil erosion of 93, 158 and 15 kg ha-
1 for CT, RT and GC plots, respectively. The yearly soil loss rate and the yearly soil loss per mm of rain were generally highest for the RT plot and lowest for the GC one. The soil loss measured during the whole period of observation was highest for the RT plot (Table 5) as the erosion rate was of 217 Mg ha-1 during the 10-years. The CT and GC soil management allowed a considerable reduction of soil loss, accounting for about 47 and 88%, respectively. The distribution of soil loss by season varied in each plot and generally was not directly related with the annual distribution of rainfall events that generated them. The total amount of rain fell in Summer in the years 2000-2009 was lower than that fell in other seasons, but it produced the highest soil loss in the tilled plots. In these plots, the Summer rainfall events have been more erosive than the others, with 45 and 38% of total soil loss for RT and CT, respectively. This fact has been confirmed by the soil loss per mm of rain (SLmm) index. The Summer value of SLmm for the RT plot was the highest (174.5 kg ha-1 mm-1), accounting for more than three times the annual average value (55.7 kg ha-1 mm-1). The SLmm was always the lowest in the GC plot and its seasonal variation was in the range 4.50-8.0 kg ha-1 mm-1. During the Summer events, the soil loss from the GC plot was similar to that of Spring and Winter (4.0, 3.6 and 4.3 Mg ha-1, respectively in the three seasons); the most erosive season for the GC plot was Autumn, with 14.7 Mg ha-1 and a soil loss of 8.0 kg ha-1 for each mm of rain. During Autumn precipitations, the GC plot suffered 56% of total erosion. The absolute highest sediment load was measured after Summer events in the tilled plots (98.0 and 43.4 Mg ha-1 for RT and CT plots, respectively). The comparison of the soil loss per mm of rain measured for tilled plots versus the value obtained for the GC plot confirmed the protective action of the grass cover in Summer, when rainfalls generally have a more erosive power. The lowest rates of the soil loss per mm of rain were obtained for all the plots in Spring, when also the measured soil loss were very low as well.
2.2.5 Conclusions The 10-years evaluation on the effect of soil management on erosion of Piedmont vineyards confirmed that, at least at slopes of about 15%, the grass cover plays an important role in

Soil Erosion Issues in Agriculture
130
reducing water and soil losses, as already reported by Tropeano (1984). In the period of observation, the formation of runoff occurred during 156 rainfall events, and this is an important assessment to consider in evaluating soil water erosion as this latter is a process consisting of two phases: detachment and transport of soil particles. In fact, after detachment, the soil particles may be transported by rain-splash, overland flow (sheet flow) or rills. As the runoff is the responsible for transport by overland flow and rill formation (Morgan, 1995), the measuring of the runoff events is per se an index of the potential soil erosion risk in a certain area. The collected data showed that the adopted soil managements have strongly affected runoff, and that in the Mediterranean area the greatest amounts of runoff usually occur in Winter, as Kosmas et al. (1997) observed in France and Greece. During the observation period the highest runoff was measured in the CT plot, especially during Winter and Spring, while the lowest amount of water lost by surface flow was always in the GC plot. This study demonstrated that, other features (former soil, slope, topography) being equal, the soil management is responsible for the differences in runoff and soil loss and, probably, also for the variability of some soil properties such as soil moisture. In fact, soil moisture, compaction, crusting and evapotranspiration are strongly related to the adopted soil management, while vegetation cover plays an essential role in soil water balance and in determining soil loss (Vahabi & Nikkami, 2008). During the period of observation, the highest soil loss was recorded in the tilled plots during Summer months, although the total rainfall and the related runoff have been lower in this season. Because of this, the tilled vineyards are highly subject to erosion in Summer. In fact, in the Mediterranean area, Summer rainfall events are often characterized by short durations and high intensities, so to induce high soil erosion rates. The relationships between rainfall characteristics (such as intensity, amount of rainfall and duration) and soil loss are not so obvious, considering that also many Autumn or Winter rainfalls may cause considerable soil losses. The most erosive storm recorded during the period of observation was in Summer and caused a soil loss of about 22 Mg ha-1 in both of the two tilled plots, a value 20 times higher than that measured in the GC plot. Among the numerous variables that affect the soil erosion, the cited case demonstrated that tillage operations made few days before the rain precipitation may strongly affect the soil loss, provided that a high intensity rainfall event occurs (Raclot et al., 2009). A comparison among the erodibility of seasonal rainfalls on each plot is possible referring to the soil loss for each mm of rain. The maximum value in the GC plot was 8.0 Mg ha-1 mm-1, related to a 10-years period autumnal rainfall. For the tilled plots, the highest values were 77.1 and 174.5 Mg ha-1 mm-1 (respectively for CT and RT plots), obtained considering Summer events. It is evident that the protective role of the grass is more effective in Summer, when the ground cover is highest and very erosive rainfall events usually occurs. Assuming that the erosion has been homogeneous on the whole area of each plot, and considering the value of soil bulk density (Table 1), the thickness of soil lost in 10 years was computed to be 15.3 mm for the RT plot. The adoption of more conservative soil management techniques allowed a reduction of the removed soil thickness, which accounted for 8.2 and 1.8 mm in the CT and the GC plot, respectively.

Evaluation of Erosion Intensity and Some of Its Consequences in Vineyards from Two Hilly Environments Under Mediterranean Type of Climate, Italy
131

Soil Erosion Issues in Agriculture
132

Evaluation of Erosion Intensity and Some of Its Consequences in Vineyards from Two Hilly Environments Under Mediterranean Type of Climate, Italy
133
R: rainfall (mm); I60max: maximum rainfall intensity over a 60-min period measured during the event (mm h-1); Im: mean rainfall intensity (mm h-1); RO: runoff (mm); RC: runoff coefficient (%); SL: soil loss (kg ha-1); SLmm: soil loss per mm of rain (kg ha-1 mm-1). CT=conventional tilled plot; RT=reduced tilled plot GC=grass cover plot.
Table 3. Rainfall, runoff and soil loss characteristics of the 63 events measured in the period of observation (2000-2009) for the studied plots.

Soil Erosion Issues in Agriculture
134
YR YRO CT
YRO RT
YRO GC
YRO TOT
YRCCT
YRC RT
YRC GC
YSL CT
YSL RT
YSL GC
YSL TOT
YSLmm CT
YSLmm RT
YSLmm GC
mm % Mg ha-1 kg ha-1 mm-1
2000 617.6 173.8 142.6 160.8 477.2 28.13 23.09 26.04 1.2 2.9 1.4 5.5 2 5 2
2001 197.6 15.4 19.7 12.6 47.6 7.79 9.95 6.37 4.1 7.4 1.4 12.9 21 37 7
2002 754.4 296.4 264.1 213.0 773.5 39.29 35.01 28.23 78.4 59.8 9.6 147.8 104 79 13
2003 435.2 86.0 88.7 45.9 220.6 19.75 20.37 10.56 3.3 6.4 0.7 10.4 8 15 2
2004 252.2 25.9 38.0 14.0 77.9 10.29 15.05 5.57 2.9 6.9 0.8 10.5 11 27 3
2005 180.4 40.8 40.0 23.5 104.3 22.63 22.20 13.01 16.7 28.4 2.7 47.9 93 158 15
2006 275.0 29.6 61.4 43.6 134.6 10.77 22.31 15.87 0.6 13.2 3.7 17.4 2 48 13
2007 185.2 8.5 17.3 12.0 37.8 4.61 9.31 6.48 2.9 8.2 0.3 11.3 16 44 1
2008 417.2 43.2 45.5 17.4 106.1 10.34 10.90 4.18 1.3 40.6 0.8 42.7 3 97 2
2009 551.8 223.8 248.4 111.0 583.2 40.57 45.01 20.11 2.4 42.9 5.1 50.4 4 78 9
YR: yearly rainfall that produced runoff; YRO: measured yearly runoff; YRC: yearly runoff coefficient; YSL: measured yearly soil loss; YSLmm: yearly soil loss per mm of rain, obtained dividing YSL by YR.
Table 4. Yearly rainfall, runoff and soil loss characteristics observed in the three plots (CT=conventional tilled, RT=reduced tilled and GC=grass cover) in the period of observation (2000-2009).
Winter Spring Summer Autumn Total
Number of events 7 15 18 23 63
R(RO>0.03) (mm) 699.0 792.8 562.0 1831.6 3885.4
CT RO (mm) 342.4 155.4 66.9 378.9 943.6
CT SL (Mg ha-1) 26.3 9.1 43.4 35.0 113.8
CT SLmm (kg ha-1 mm-1) 37.6 11.5 77.1 19.1 29.3
RT RO (mm) 307.6 153.1 82.2 422.7 965.6
RT SL (Mg ha-1) 30.5 14.7 98.0 73.4 216.6
RT SLmm (kg ha-1 mm-1) 43.6 18.5 174.5 40.1 55.7
GC RO (mm) 215.7 80.2 35.0 323.1 654.0
GC SL (Mg ha-1) 4.3 3.6 4.0 14.7 26.5
GC SLmm (kg ha-1 mm-1) 6.1 4.5 7.1 8.0 6.8
R(RO>0.03): amount of rainfall producing runoff>0.03 mm; RO: runoff ; SL: soil loss; SLmm: soil loss per mm of rain.
Table 5. Total rainfall runoff and soil loss characteristics observed in the three plots (CT=conventional tilled, RT=reduced tilled and GC=grass cover) in the period of observation (2000-2010), subdivided by seasons.

Evaluation of Erosion Intensity and Some of Its Consequences in Vineyards from Two Hilly Environments Under Mediterranean Type of Climate, Italy
135
2.3 Evaluation of erosion in tilled and grass covered soils in vineyards from central Italy 2.3.1 Introduction Among the natural factors that affect erosion, soil properties are considered as one of the most important. More specifically, erosion processes are influenced by soil characteristics such as particle-size distribution, stability of aggregates, organic matter content, soil chemistry and clay mineralogy (Lal, 1994). All these factors regulate rainfall acceptance and resistance of the soil to particle detachment, and their subsequent transport in form of suspension. Among the parent materials originating soils very susceptible to erosion, the plio-pleistocene pelitic (silt clay) marine sediments are the most diffused in Italy. Here, this type of soil substrate constitutes most of the hills and plains, and mantles the Apennines chain till altitudes that in some cases reach more than 1000 m. In the hill and mountain environments the presence of this parent material has given rise to zones where different types of erosion occurred also because, since the 1950s, many hectares of these areas were deforested and reclaimed to expand agriculture. As in many of these cases soils have not carefully managed, as often happened for vineyards (Pieri, 2007), a loss of organic matter and, consequently, structure and water holding capacity occurred (Pagliai, 2008). This has led to a poorly to moderate degree of aggregation with weak aggregates that make the soils evolved from fine-textured marine sediments susceptible to severe erosion processes (Philips & Robinson, 1998). In fact, in this type of soils aggregates are so weak that collapse under the impact of raindrops and soil develops surface seals and crusts that reduce permeability and, in turns, favour runoff with consequent formation of rills and gullies (Robinson & Phillips, 2001). In Italy, Marche region is representative of the morpho-climatic context of the Adriatic sector (Gentili et al., 2006), and about 64% of the total surface (969,450 ha) is made of soils derived from fine-textured and alkaline marine sediments. These fine soils were reclaimed to agriculture centuries ago and, on the basis of the data published by ISTAT (2003), we estimate that nowadays about 60% of them are used for arable crops (cereals, legumes, vegetables), while about 3% are occupied by vineyards. In the last decades the surface occupied by vine has dropped after it had reached highest levels in the 1950-60s. However, till the 1950s the soil management of this vulnerable portion of the territory had a low impact on the soil organic matter content while the attention directed to the surface water circulation was so high that erosion was under control and soil fertility was maintained. In the following 50 years, most of the vineyard soils have become even more subjected to erosion, with the formation of rills and gullies during storm episodes occurring in the warm season (Gentili et al., 2006). Because of this, the control of erosion to preserve soil quality and fertility and to maintain agricultural productivity is one of the most pressing environmental objectives that is worthwhile to pursue from both ecological and economic points of view. In the last decade, in the attempt to control erosion, many vineyard soils have been grass covered, but this was often done with no consideration of the soil properties. The objective of this study was to compare the effects of two different soil managements (harrowing and grass cover) on the water erosion of Inceptisols developed on hilly slopes from fine-textured plio-pleistocene marine sediments under a Mediterranean type of climate.

Soil Erosion Issues in Agriculture
136
2.3.2 Material and methods
Study site
The study was conducted at the Experimental Station of the Agriculture Faculty of Ancona (central Italy), at about 11.4 km from the sea coast (Figure 8) and at an altitude of 203 m, in a vineyard that faces a SSE exposure and has a general slope of 5-6%. The mean annual air temperature is 13.3°C, with July and August as the warmest months and January as the coldest month. The mean annual precipitation is 780 mm, with the maximum rainfalls in April and September. The soil developed from fine-textured plio-pleistocene marine sediments containing carbonates. The vines were implanted in 1993 after decades of cultivation with cereals. The soil was broken up at about 70 cm and the distance between rows was established at 2.80 m. The harrowed plot was ploughed till a depth of 25 cm for the first three years, afterwards only superficial harrowing operations (8-10 cm) were conducted twice per year, in Spring and Summer. The grass cover plot was ploughed till a depth of 25 cm for the first three years and, then, left to the spontaneous colonisation from herbaceous species, which have been mown two/three times per year. The equivalent of 30 kg ha-1 of N in form of ammonium nitrate was distributed only for the first three years. On both harrowed and grass cover plots, for a width of about 60 cm under vine trunks, weeds were chemically eliminated (Glyphosate®).
Fig. 8. Map of Italy with magnification of the Marche region and indication of the study site.
Experimental design
In 2008, in each plot, two soil profiles were dug in the inter-rows, excluding the surface treated with herbicide; because of this, the width of the trenches was around 2 m. The profiles were described and sampled by horizons. From the face of the profile, soil cores were collected by horizons to estimate their bulk density. The volume of the corer was

Evaluation of Erosion Intensity and Some of Its Consequences in Vineyards from Two Hilly Environments Under Mediterranean Type of Climate, Italy
137
251.3 cm3 and each horizon was sampled in double. The soil samples collected by mass were characterized for particle-size analysis after the samples were maintained a night under continuous gentle stirring in deionised water (solid:liquid ratio 1:5) and after dissolution of organic (Lavkulich & Wiens, 1970) and ferric (Mehra & Jackson, 1960) cements; coarse, medium and fine sands (2000-500 µm, 500-250 µm and 250-53 µm, respectively) were recovered by sieving while silt was separated from clay by sedimentation. The soil pH and the electrical conductivity were determined on a suspension with a soil:water ratio of 1:2.5. The available P content was evaluated according to the Olsen method, and the total C and N were determined by a Carlo Erba EA1110 dry combustion analyzer. The humic C content was estimated by the Walkley-Black method without application of heat (Nelson & Sommers, 1996), while the amount of total organic C was determined following Allison (1960). The exchangeable Ca, Mg, K and Na were displaced by a BaCl2 solution and measured with an ICP-OES (Horiba Jobin Yvon Ultima 2). The mineralogical assemblage was determined on powdered specimens by x-ray diffraction with a Philips PW 1830 diffractometer. For the aggregates stability test, standard aggregates (diameter of 1-2 mm) were submitted to three treatments in parallel: i) submersion in water for 20 minutes in quiet; ii) submersion in water for 20 minutes in quiet plus vertical revolving shaker; iii) submersion in a 1M NaOH solution for 20 minutes in quiet plus vertical revolving shaker. For all treatments 20 g of standard aggregates were put in contact with 100 mL of liquid. For the ii) and iii) treatments, each suspension was put in a 500 mL plastic bottle and submitted to 25 vertical revolutions in 1 minute. On the suspensions obtained after the treatments, the particle-size analysis was carried on as described above. One of the profiles in the harrowed soil and one in the grass covered soil were installed with plate lysimeters (Prenart soil disks with a diameter of 70 mm) to sample soil solutions after each storm. Three plate lysimeters were put at three different depths: 10, 20, and 40 cm. Soil solutions were collected the day after the end of the perturbation by applying a vacuum of -700 hPa. At the soil surface, in the inter-row of both harrowed and grass cover plots, three Gerlach systems were installed to collect runoff (solution plus sediments) the day after the end each perturbation. The suspensions collected were filtered through cellulose acetate filters (0.45 µm under N2 pressure) to separate solution from suspended particles. Both filtered solutions coming from Gerlach and collected by lysimeters were analyzed for pH, electrical conductivity, concentration of cations (Ca, Mg, K and Na) by an ICP-OES, Horiba Jobin Yvon Ultima 2 and anions (NO3 and PO4) by an isocratic chromatograph Dionex CD20. The liquid phase of the runoff collected by Gerlach systems was characterised also for the concentration of SO4, Cl, Br and F and for the DOC content, while the suspension of the runoff was analysed for total C and N and mineralogy. Statistical analyses to compare differences among data-sets were performed by the one-way ANOVA with Tukey-Kramer post-test, paired t test, and the linear trend post-test to evaluate tendencies with soil depth (GraphPad Instat 3.1 software).
2.3.3 Results and discussion
Soils
The soil of the two vineyards showed a different thickness of the Ap horizons because of the different soil management (Table 6). In fact, the harrowed profiles showed an Ap

Soil Erosion Issues in Agriculture
138
horizon with an average thickness of 3-5 cm and a yellowish-brown colour, while the grass covered ones displayed Ap horizons 12-14 cm thick with an olive brown to brown colour. Both soils were classified as Vertic Haplustepts, fine-loamy, mixed, mesic (Soil Survey Staff, 2010) or Vertic Cambisols (FAO/ISRIC/ISSS, 1998). Soil structure was rather well developed in all the A and Bw horizons, but it was poorly developed in the BC horizons, those that still maintain morphologies of the parent material also because they were not interested by the breaking up. While in the harrowed soil there were nodules of Fe-Mn oxi-hydroxides at all depths, in the grass covered soil there were precipitations of gypsum below 20-22 cm of depth. In this ustic environment, the presence of gypsum was ascribed to the grass evapotranspiration. The mineralogical assemblage was very similar in both soils, with the most abundant minerals represented by primary minerals such as calcite, plagioclases, and quartz (Table 7). Many phyllosilicates (micas, chlorites, kaolinite, 2:1 clay minerals) were present in small amounts and appeared to have been inherited by the parent material. The BC horizons of both soils showed the same mineralogical composition, indicating that both the soils developed from the same layers of the parent material. The similar mineralogy of the two soils and the absence of any meaningful trend with increasing depth was attributed to the fact that 12 years of distinct soil managements were not able to produce differences in terms of mineralogy. The presence of gypsum in the sub-superficial horizons of the grass covered soil was not detected by the x-ray probably because, even if the concretions were visible, the salt was quantitatively scarce. The particle-size distribution after removal of cements (Table 8) was similar in both soils (P>0.05), confirming again these latter developed from the same parent material. In all the horizons, the silt and clay fraction were the most represented separates. The particle-size analysis without dissolution of cements (Table 8) showed a similar distribution of sand, silt and clay in the two soils (P>0.05). However, considering only the Ap and Bw1 horizons, the fine sand was higher in the harrowed than in the grass covered soil (P<0.008), while the contrary was true for the coarse sand (P<0.002). In the Bw3 horizon of the harrowed soil the high amount of coarse sand was ascribed to an enrichment of carbonates (see inorganic C in Table 10), which have probably improved structure stability (Gee & Bauder, 1986; Dimoyiannis et al., 2002). Observations at an optical microscope revealed that the coarse sand of the Bw3 horizon was partly made of carbonaceous remnants of marine bryozoa and secondary carbonates nodules. Hence, a help in improving the state of aggregation was probably due to the dissolution of the bryozoa remnants with successive re-precipitation of secondary carbonates. As the particle-size distribution after cements dissolution was similar in both soils, the differences obtained without cements dissolution were interpreted as the result of the soil management. In particular, the relatively high amount of coarse sand in the grass covered soils was attributed to a better state of aggregation of these aggregates. However, both soils manifested a relatively good state of aggregation as witnessed by a scarce amount of clay particles obtained by the particle-size analysis without dissolution of cements (Table 8), but also by the presence of a fairly good structure at the surface as well as in the sub-superficial horizons (Table 6). The aggregates stability test indicated that for a similar soil depth, the specimens of the grass covered soil always displayed the coarsest particle-size distribution (Table 9), indicating that the aggregates from this soil were more resistant to

Evaluation of Erosion Intensity and Some of Its Consequences in Vineyards from Two Hilly Environments Under Mediterranean Type of Climate, Italy
139
disaggregation than those of the harrowed soil. The relative resistance of the aggregates from the grass covered soil to the treatments with water and water plus vertical revolving shaker was ascribed to the presence of grasses. In fact, a better state of aggregation can be promoted by the soil shrinkage caused by roots (Materechera et al., 1992), and they were more abundant in the grass cover than in the harrowed soil. Further, according to Traoré et al. (2000), Whalley et al. (2005) and Fageria & Stone (2006), the presence of herbaceous vegetation increases the stability of aggregates thanks to the rhizodeposition of mucilaginous substances, but also to the humification of plant residues (mostly roots). Our observations were similar to those reported by Uren (1993) and Gregory (2006). In the case of the NaOH plus vertical revolving shaker treatment, the higher stability of the aggregates from the grass covered soil was still ascribed to the permanent grass cover, which may favour the formation of inorganic substances (secondary carbonates and/or Fe, Al, Mn oxi- hydroxides) that contribute to cement the particles. The different soil management and state of aggregation did not affect the bulk density (Table 10), which, also in the superficial horizons, did not show any statistical difference (P>0.05). Evidently, for the soils derived from this parent material the bulk density depended more on the particle-size distribution than on the management and aggregation, at least after 15 years from the breaking up. Similar bulk densities and conditions were found in soils cultivated with cereals at about 25 km from our study site (Corti et al., 2006). Along the profile, variations of bulk density were probably inherited from the parent material rather than caused by pedogenesis. In fact, according to many authors (e.g. Bruckert & Bekkary, 1992; Attou & Bruand, 1998; Tuttle et al., 2005), this kind of parent material is often characterized by strata having different texture, fabric and variable density, which were originated by marine ingressions and seismic activity. Both the soils showed similar values of electrical conductivity and similar decreasing trends with increasing depth (Table 10). The high electrical conductivity of the epipedons was ascribed to the arrival of marine salts blown by winds, a phenomenon rather frequent in coastal regions till several km from the seashore (Ruijgrok et al., 1995). In our case, the geographic position of the site, not far from the seacoast, was considered as responsible of these results. This fact acquires a relevant importance for these sloping soils as the amount of Na+ arriving with aerosol can produce dispersion of clay minerals, so increasing vulnerability of soil to erosion (Shaikh et al., 1987; Schmittner & Giresse, 1999). The reaction of both soils was sub-alkaline (Table 10), with a tendency to increase with increasing depth (P<0.0001). At depth, pH values higher than 8.3 were attributed to the presence of Na-carbonate. The combination of high pH values and the presence of Na+ was considered by Chiang et al. (1987) one of the most important factor in reducing aggregates stability and, consequently, increasing soil erosion. As observed in other agricultural soils (Doran, 1987; Janzen et al., 1992; Van Gestel et al., 1992), total N content was high in the superficial horizon of both soils even though no fertilization was applied for more than 10 years (Tables 10). Always at surface, the content of total N was higher in the grass covered than in the harrowed soil because of the higher organic C content. As expected, along both profiles the N tended to decrease with increasing depth (P<0.0001). In both soils, total C assumed different values from one horizons to the other (Table 10). If in the upper part of the profiles these differences are partly due to the decreasing with depth of organic C, in the sub-superficial horizons the differences were mainly due to the inorganic C (Table 10). In

Soil Erosion Issues in Agriculture
140
Table 6. Morphological description of the profiles dug in the harrowed and grass covered soils under vineyard.

Evaluation of Erosion Intensity and Some of Its Consequences in Vineyards from Two Hilly Environments Under Mediterranean Type of Climate, Italy
141
a moist and crushed, according to the Munsell Soil Color Charts, 1992 Edition. b 2=moderate, 3=strong; f=fine, m=medium, c=coarse, vc=very coarse, th=thin, t=thick; cr=crumb, abk=angular blocky, sbk=sub-angular blocky, pl=platy, pr=prismatic; breaking into. c m=moist, fr=friable, vfr=very friable, fi=firm; w=wet, ss=slightly sticky. d w=wet, ps=slightly plastic, p=plastic. e 0=absent, v1=very few, 1=few, 2=plentiful, 3=abundant; mi=micro, vf=very fine, f=fine, m=medium, co=coarse. f a=abrupt, c=clear; w=wavy, s=smooth; b=broken, i=irregular. g skl=skeleton; 1=few, 2=plentiful; cncr=concretions; erthw=earthworms.
particular, where a sudden increase of inorganic C occurred, it was due to the presence of remnants of marine bryozoa. The total organic C and humic C contents, considering the whole profile, did not significantly differ (P>0.05) between the two soils (Tables 10). However, if only the upper 30 cm of soil are considered, the grass covered soil resulted more enriched of total organic C and humic C than the harrowed one (P<0.03, for both). This higher amount of organic matter in the grass covered soil was evidently obtained in the previous 12 years of grassing and was considered one of the factors that contributed to make the aggregates of the grass covered soil more stable than those of the harrowed soil. The higher amount of organic matter at surface was believed to be the reason of the higher amount of available P, even though its content on absolute value was low in both soils (Table 10). Q P Ca D M Ch K 2:1CM A Harrowed Ap +(+) ++ +++ (+) (+) + (+) + - Bw1 +(+) +(+) +++ (+) (+) + (+) +(+) - Bw2 +(+) +(+) +++ (+) (+) + (+) +(+) - Bw3 + ++ +++ tr (+) +(+) (+) + tr BC1 +(+) +(+) +++ + + + (+) (+) tr BC2 +(+) +(+) +++ + + + (+) (+) tr Grass covered Ap1 +(+) +(+) +++(+) (+) (+) (+) (+) +(+) - Ap2 ++ +(+) +++(+) (+) (+) (+) (+) + - Ap3 + +(+) +++(+) (+) + + (+) + - Bw1 +(+) + +++++ tr (+) tr (+) + tr Bw2 +(+) + +++++ tr (+) tr (+) + tr Bw3 +(+) +(+) +++(+) tr (+) (+) (+) +(+) tr BC1 +(+) +(+) +++ + + + (+) (+) tr BC2 +(+) +(+) +++ + + + (+) (+) tr BC3 +(+) + +++(+) (+) + +(+) (+) (+) tr
Q=quartz; P=plagioclases (mostly albitic); Ca=calcite; D=dolomite; M=micas; Ch=primary chlorites; K=kaolinite; 2:1CM=2:1 clay minerals (HIV and HIS at various degree of Al-OH polymerization, smectites, vermiculites, interlayered mica-2:1 clay mineral); A=amphiboles. +=about 10%; (+)=about 5%; tr=about 1-3%.
Table 7. Semi-quantitative estimation of the mineralogical assemblage of the harrowed and grass covered soils under vineyard.

Soil Erosion Issues in Agriculture
142
Table 8. Particle-size distribution after cements dissolution and without cements dissolution for the harrowed and grass covered soils under vineyard. In parentheses the standard errors.

Evaluation of Erosion Intensity and Some of Its Consequences in Vineyards from Two Hilly Environments Under Mediterranean Type of Climate, Italy
143
Sand Silt Clay
Coarse Medium Fine Total
g kg-1
Harrowed
H2O
Bw1 302 (13) 227 (16) 246 (13) 775 (16) 224 (16) 1 (0)
Bw2 360 (17) 207 (14) 211 (13) 778 (18) 205 (16) 17 (2)
H2O+shacker
Bw1 167 (22) 179 (15) 277 (15) 623 (22) 334 (24) 43 (2)
Bw2 176 (22) 218 (18) 246 (16) 640 (24) 327 (21) 33 (3)
NaOH+shacker
Bw1 72 (13) 36 (3) 81 (7) 189 (23) 622 (33) 189 (10)
Bw2 140 (15) 48 (2) 90 (5) 278 (22) 617 (30) 105 (8)
Grass covered
H2O
Ap3 492 (18) 157 (12) 160 (19) 809 (13) 190 (13) 1 (0)
Bw1 559 (16) 125 (13) 167 (16) 851 (13) 140 (12) 9 (1)
Bw2 420 (23) 194 (15) 210 (21) 824 (13) 175 (12) 1 (1)
H2O+shacker
Ap3 315 (20) 190 (16) 229 (20) 734 (16) 247 (18) 19 (2)
Bw1 429 (15) 164 (12) 182 (14) 775 (17) 214 (15) 11 (2)
Bw2 391 (14) 166 (11) 205 (15) 762 (18) 220 (16) 18 (2)
NaOH+shacker
Ap3 122 (14) 37 (5) 123 (10) 282 (29) 601 (35) 117 (6)
Bw1 265 (15) 115 (13) 96 (8) 476 (36) 479 (32) 45 (4)
Bw2 229 (21) 89 (7) 106 (8) 424 (36) 484 (31) 92 (5)
Coarse sand: 2-0.5 mm; Medium sand: 0.5-0.25 mm; Fine sand 0.25-0.05 mm.
Table 9. Particle-size distribution of standard aggregates submitted to stability test. Aggregates came from horizons of harrowed and grass covered soils under vineyard. In parentheses the standard errors.

Soil Erosion Issues in Agriculture
144
Table 10. Values of bulk density, electrical conductivity, pH in water, total N and C, inorganic C, total organic C (TOC), humic C and available P in the harrowed and grass covered soils under vineyard. In parentheses the standard errors.

Evaluation of Erosion Intensity and Some of Its Consequences in Vineyards from Two Hilly Environments Under Mediterranean Type of Climate, Italy
145
Soil solutions and runoff
In Table 11 are shown the amount of the rain fallen during each perturbation and that of the solution collected by the lysimeters ranked into quantity classes. For most of the rainfalls (from March to December, with the exception of the event occurred on 3 June, 2009) water was collected from the harrowed soil only at the depth of 10 cm, while in the grass covered soil the lysimeters intercepted water mainly at 20 and 40 cm of depth. This was ascribed to the different soil management as, in the grass covered soil, the water infiltration is favoured by the presence of plant roots (Cerda, 1999) and by a better aggregate stability (also induced by plants), although in Summer the evapotranspiration tends to dry the topsoil. In contrast, in the harrowed soil water infiltration was low because of the weak structure that, under the impact of raindrops, favours the formation of surface sealing and crust (Robinson & Phillips, 2001), so to reduce permeability and promote water ponding. The different behaviour in terms of water infiltration due to the soil managements made possible to collect water during light rainfall events or after long periods of dryness only in the grass covered soil. A good penetration of water was observed in both soils only after intense events (those of 3 June 2009 and 25 March 2010, when it fell an amount of rain of 141 mm in 5 days and 51 mm in 2 days, respectively). The chemical characteristics of rainfall and solutions collected by lysimeter are reported in Tables 12 and 13. The pH of the soil solutions, although it appeared to be rather dependent on that of the rainfall, did not show a clear trend with depth. It is reasonable that, with respect to the rainfall pH, the increases or decreases of the soil solution pH were controlled by the presence of carbonates in the rain water and by the chemical properties of the soil horizons. The electrical conductivity generally increased from rainfall to the soil solution collected superficially, and this was mostly due to the solubilisation of salts of anthropic origin and blown by wind. When the soil solutions were collected in the deepest lysimeters, the values of electrical conductivity slightly changed with increasing depth. However, both pH and electric conductibility did not significantly differ between the two soil managements. With the exception of some date, rain water contained relevant amounts of Ca, K and Mg, especially in Autumn. This fact indicated that the main source of these cations in the rain was the atmospheric dust coming from Sahara regions (e.g. Camarero et al., 1993; Rodà et al., 1993; Avila et al., 1997) or the mechanical works made in the surroundings (Moreno et al., 1996; Sanusi et al., 1996; Celle-Jeanton et al., 2009), but also the sea spray coming from the relatively close seashore (Lovett & Lindberg, 1984; Keene et al., 1986; Andrè, 2008). For the presence of Na and PO4, the main source was considered the sea spray. The presence of NO3 in the rainfall was rather occasional and probably due to local anthropogenic sources including agriculture (Praveen et al., 2007). When the rain water entered the soil and became soil solution, it started to equilibrate with minerals and plant absorption. Because of this, cations and anions acquired different concentration in function of the equilibria existing along the soil depth. The final result was that, in the grass covered soil solutions not only went deeper than 40 cm of depth more often than in the harrowed soil (Table 11), but on average they were also more concentrated in Ca, K, Mg, Na and PO4. The behaviour of NO3 differed from that of the other ions. In the harrowed soil, few times the solutions went deeper than 40 cm and for three times (1 May, 3 and 24 June 2009) they contained NO3 in high concentration; in contrast, in the grass covered soil at least in five occasions the solution at 40 cm of depth contained NO3 but in concentrations lower than in the corresponding solutions of the harrowed soil. The high

Soil Erosion Issues in Agriculture
146
concentrations of NO3 in the deep solutions of the harrowed soil was ascribed to the mechanical works made at the end of April to eliminate weeds. At the soil conditions of that period, the soil oxygenation induced by harrowing has probably favoured mineralization of organic matter, so producing unbalancing between availability of NO3 and absence of plant absorption; as a result, NO3 were leached. Similar results and conclusions were reported by Roggero et al. (2006) for arable soils close to those here studied. In the grass covered soil, NO3-containing solutions arrived at depth only after mowing, which also induced unbalancing between availability and plant absorption, but the NO3 concentration was low as plants may continue to absorb even after they had been mown. During the rest of the year, permanent grassing have ensured the soil solution may arrive at depth deprived of NO3. If we considered the amounts of runoff collected by the Gerlach systems (Table 14) no significant difference was detected in the amount of water or suspended soil particles between the harrowed and grass covered soils. This means that the grass covered, with respect to the harrowing, had no better effect on the loss of soil material due to erosion. The chemical characteristics of the runoff solutions (Table 15) did not show differences between the two soil managements with the exception of K and Mg, which were more concentrated in the runoff solutions of the grass covered than of the harrowed soil (P<0.01). These higher concentrations of K and Mg were attributed to the fact that the runoff solution, running through the grass cover, at the interface between below- and above-ground biomass, washed the vegetal tissues solubilising K- and Mg-containing compounds. The runoff solution was also characterized for its content of dissolved organic C, but also in this case the results did not significantly differ (P>0.05). Also the amount of total C and N comprising the suspended material of the runoff (Table 16) did not show significant differences between the two soil managements (P>0.05). However, the highest losses of N associated to the soil material transported by the runoff occurred in the two dates of 24 April and 4 June 2009 (P<0.0003), for both soil managements. The mineralogical analysis of the runoff suspended material (Table 17) indicated that the transported particles have a mineral composition similar to that of the topsoil, with a preference of 2:1 clay minerals and calcite, namely the easiest minerals to be floated.
2.3.4 Conclusions The comparison of the response to erosion processes of harrowed and grass covered vineyard soils did not show substantial differences between the two managements, although the grass covered soil showed a better aggregate stability atop the profile. The collection of soil solution by lysimeters at different depths showed that the presence of a grass cover favoured water infiltration in depth, but the chemical quality of the soil solutions was similar in both soils for pH, electric conductivity, cations and phosphate content. The only significant difference occurred for the NO3, which was found in higher concentration in the solutions collected from the harrowed soil after the Spring ploughing. Also the characteristics of the liquid and solid phase of the runoff collected by the Gerlach systems gave no statistically significant difference, with the exception of a higher amount of K and Mg in the solutions collected in the grass covered soil. The results obtained by this study let us to conclude that the vineyard soil managements (at least the two compared in this experiment) in this fine-textured soils characterised by a

Evaluation of Erosion Intensity and Some of Its Consequences in Vineyards from Two Hilly Environments Under Mediterranean Type of Climate, Italy
147
Table 11. Amount of rain-water fallen during each perturbation (in parentheses the number of days the perturbation lasted) and water collected by lysimeters at three depths in the harrowed and grass covered soils under vineyard.

Soil Erosion Issues in Agriculture
148
Table 12. Principal characteristics of the rainfall precipitation and the soil solutions collected by lysimeters at three depths in the harrowed soil under vineyard. Standard errors are not shown to avoid overcrowding of the table. However, the highest proportion between standard error and mean amounted to 9-10% and occurred in few dates for NO3.

Evaluation of Erosion Intensity and Some of Its Consequences in Vineyards from Two Hilly Environments Under Mediterranean Type of Climate, Italy
149
Table 13. Principal characteristics of the rainfall precipitation and the soil solutions collected by lysimeters at three depths in the grass covered soil under vineyard. Standard errors are not shown to avoid overcrowding of the table. However, the highest proportion between standard error and mean amounted to 20-23% and occurred in few dates for Na.

Soil Erosion Issues in Agriculture
150
Date Duration
of the event
Amount of
rainfall
Harrowed Grass covered
Solution Suspended
material Solution
Suspended material
days mm L m-1 g L-1 L m-1 g L-1
4 February, 2009 3 14.4 4.010(0.870)
0.087 (0.012)
2.575 (1.930)
0.007 (0.001)
12 March, 2009 4 10.4 0.875 (0.475)
0.000 (-)
0.930 (0.275)
0.000 (-)
2 April, 2009 5 19.8 0.310 (0.025)
0.086 (0.009)
1.775 (1.435)
0.041 (0.033)
23 April, 2009 3 40.2 0.200 (0.015)
0.014 (0.003)
0.965 (0.770)
0.031 (0.023)
1 May, 2009 5 17.8 0.055 (0.010)
0.000 (-)
0.323 (0.300)
0.004 (0.001)
3 June, 2009 5 141.3 1.380 (0.140)
0.011 (0.003)
0.990 (0.305)
0.260 (0.231)
22 December, 2009 8 11.3 0.240 (0.080)
0.002 (0.001)
4.720 (0.520)
0.385 (0.096)
7 January, 2010 3 26.4 3.830 (0.205)
0.320 (0.029)
3.100 (0.370)
1.345 (0.745)
5 March, 2010 18 36.8 4.970 (0.460)
0.881 (0.241)
3.290 (0.510)
0.193 (0.155)
25 March, 2010 2 51.5 4.780 (0.380)
1.513 (0.250)
4.250 (0.535)
0.329 (0.152)
Table 14. Volume of runoff and amount of suspended material collected by Gerlach from the surface of the harrowed and grass covered soils under vineyard. In parentheses the standard errors.
gentle slope did not seem to strongly affect the quantity and quality of the solutions and sediments running at the topsoil. In this type of soil, evidently, an inclination of about 5-6% appears unable to trigger off considerable erosion phenomena. Another possible reason of the absence of significant differences in terms of water erosion in the harrowed and grass covered soils has been attributed to the ustic soil moisture regime, which indicates a limited amount of water into the soil for great part of the year. In particular, precipitations were scarce and relatively well distributed during the considered study period. Further, the use of localised systems for measuring and collecting the runoff (Gerlach system), together with the spatial variability of the erosion processes, could have not allowed to figure out the real extent of the erosive phenomena in the whole parcels with different soil managements. The presence of NO3 in the soil solution and its consequent leaching appeared associated with agronomic practices, such as ploughing in the harrowed soil and mowing in the grass covered soil, both able to produce unbalancing between availability of NO3-N and plant absorption.
3. General conclusions
With the aim to assess the role of soil managements on soil erosion, we contrasted two soil managements (harrowing and natural grass cover) in vineyards of two areas, one in north-west and the other in central Italy, which represent two typical vine growing areas of the Mediterranean basin. Both study sites had similar features such as a hilly sloping aspect, fine-

Evaluation of Erosion Intensity and Some of Its Consequences in Vineyards from Two Hilly Environments Under Mediterranean Type of Climate, Italy
151
textured soils, and an ustic soil moisture regime; yet, they differed for the gradient, which was around 15% at the north-western site and 5-6% at the central site. For both sites, precipitations were characterized by an annual mean around to 800 mm concentrated in Autumn and Winter. Summer rainfall events are often for a short time but with high intensity.
Table 15. Principal characteristics of the runoff solution collected by Gerlach in the harrowed and grass covered soils under vineyard. In parentheses the standard errors.

Soil Erosion Issues in Agriculture
152
4
February, 2009
24 April, 2009
4 June, 2009
22 December,
2009
7 January,
2010
5 March,
2010
25 March,
2010 g kg-1 Total C
Harrowed 211.7 (65.4)
138.3 (28.5)
259.7 (44.6)
597.3 (6.2)
71.5 (0.1)
35.5 (0.4)
43.8 (0.2)
Grass covered 213.7 (1.3)132.4 (52.5)
206.5 (97.6)
78.2 (0.8)
61.8 (11.1)
54.1 (6.7)
44.75 (1.3)
Total N
Harrowed 11.2 (1.1)
23.7 (3.3)
44.3 (18.2)
21.0 (2.0)
3.9 (0.0)
5.0 (0.0)
4.6 (0.0)
Grass covered 11.5 (0.2)
18.2 (6.9)
46.3 (24.1)
5.9 (0.0)
2.5 (0.2)
6.7 (0.5)
5.5 (0.9)
Table 16. Amounts of total C and N comprising the suspended material of the runoff in the harrowed and grass covered soils under vineyard. In parentheses the standard errors.
Q P Ca D M Ch K 2:1CM A
02 April, 2009 Harrowed ++ (+) +++(+) tr tr (+) (+) ++(+) - Grass covered +(+) + ++++ tr (+) + (+) +(+) - 22 December, 2009 Harrowed nsa ns ns ns ns ns ns ns ns Grass covered ++ + ++++ tr tr (+) (+) +(+) 07 January, 2010 Harrowed ++ (+) ++++ tr tr (+) (+) ++ - Grass covered ++ (+) +++++ tr tr (+) (+) + - 5 March, 2010 Harrowed + (+) ++++ tr tr + (+) ++(+) - Grass covered ++(+) + ++++ tr (+) tr (+) + - 11 March, 2010 Harrowed + (+) +++++ tr tr (+) (+) ++ - Grass covered +(+) (+) +++++ tr (+) (+) + + -
Q=quartz; P=plagioclases (mostly albitic); Ca=calcite; D=dolomite; M=micas; Ch=primary chlorites; K=kaolinite; 2:1CM=2:1 clay minerals (HIV and HIS at various degree of Al-OH polymerization, smectites, vermiculites, interlayered mica-2:1 clay mineral); A=amphiboles. +=about 10%; (+)=about 5%; tr=about 1-3%. ans=not sufficient sample available
Table 17. Semi-quantitative estimation of the mineralogical assemblage of the suspended material forming the runoff of different dates in the harrowed and grass covered soils under vineyard.

Evaluation of Erosion Intensity and Some of Its Consequences in Vineyards from Two Hilly Environments Under Mediterranean Type of Climate, Italy
153
Concerning with the relationship between grass cover and soil loss, the results obtained in the two sites conflicted. Where the slope was about 15%, the grass cover played an important role in reducing water runoff and soil losses. The protective role exerted by the grass cover was more effective in Summer, when very erosive rainfall events usually occur, producing the highest soil losses in the harrowed soil. In contrast, where the slope was about 5-6%, the grass cover reduced runoff, since water penetrated the soil more than in the harrowed soil, but it was ineffective in reducing soil erosion. Such different results might be partly attributed to the absence, for one site, of a long-term monitoring of precipitations, water runoff and soil loss, as soil erosion response can vary greatly from one year to another and is related with amount and pattern of rainfall. Further, part of the discrepancy could be also attributed to the different protocols and devices adopted in measuring the effect of rainfall: an automatic and large runoff sampler in one case, replicated manual Gerlach systems in the other case. However, just because the protocols were different, the results obtained are corroborated by different approaches as well as lab and data analyses. Following this consideration, on the basis of the results obtained we believe that the discrepancy in soil loss can be mostly ascribed to the different slope: at slopes of about 15% (or more), when erosion may be relevant, grass cover is able to reduce soil loss, while at slopes of about 5-6% (or less) the grass cover does not offer any advantage in reducing soil loss. However, the grass cover of the inter-rows of vineyards is recommended for any slope even in a ustic environment for its positive effects. In this study we have shown that grass cover may improve the soil structure, increase the water infiltration, and stock organic N at surface after to have reduced the NO3 concentration in the soil solution. The grass cover also increased the concentration of K and Mg in the runoff solution. However, since the grasses reduce runoff as the water is facilitated in penetrating the soil, this latter negative aspect may be considered as negligible with respect to the positive effects they exert. The study of the influence of the soil management on the erosion processes and, to a larger extent, soil degradation should represent a high-priority issue within the “environmental agenda”. In particular, since viticulture is a cultivation rather diffuse all over the World and, especially in Europe, vineyards are often implanted on soils vulnerable to erosion, the solution of this problem in vineyard soils could greatly contribute to reduce erosion at watershed or regional level.
4. Acknowledgements
We are indebted with the Cariverona Foundation to have partly funded this work by the research project titled “Difesa del suolo da erosione e inquinamento tramite adozione di tecniche agronomiche che favoriscano l’arricchimento di sostanza organica". We thank the Office for Agricultural Development of the Piedmont Regional Administration to have funded the research project titled “Erosione del suolo: confronto tra inerbimento e diverse modalità di lavorazione del terreno, a rittochino e di traverso” and the Tenuta Cannona Experimental Vine and Wine Centre.
5. References
AA.VV. (2010). Wine: Global Industry Guide. Datamonitor Publisher Agassi, M. (1996). Soil Erosion, Conservation, and Rehabilitation. Marcel Dekker, New York

Soil Erosion Issues in Agriculture
154
Allison, L.E. (1965). Organic carbon. In: Black, C.A., Evans, D.D., Ensminger, L.E., White, J.L. Clarck, F.E. (Eds.), Methods of Soil Analysis, Part 2. Agronomy Monograph, 9. American Society of Agronomy, Madison, WI, pp. 1367–1378
André, F., Jonard, M. & Ponette, Q. (2008). Spatial and temporal patterns of throughfall chemistry within a temperate mixed oak–beech stand. Science of the Total Environment, 397, 215–228
Attou, F. & Bruand, A. (1998). Experimental study of "fragipans" formation in soils. Role of both clay dispersion and wetting-drying cycles. Earth & Planetary Science, 326, 545-552
Augustinus, P.G.E.F. & Nieuwenhuyse, P.J. (1986). Soil erosion in vineyards in the Ardeche region. Catena, 13, 295-304
Avila, A., Queralt-Mitjans, I. & Alarcón, M. (1997). Mineralogical composition of African dust delivered by red rains over north-eastern Spain. Journal of Geophysical Research, 102 (D18), 21977–21996
Bazzoffi, P., Abbattista, F., Vanino, S. & Pellegrini, S. (2006). Impact of land levelling for vineyard plantation on soil degradation in Italy. Bollettino della Società Geologica Italiana, Volume speciale n° 6, 191-199
Bechmann, M., Stalnacke, P., Kvaerno, S., Eggestad, H.O. & Oygarden, L. (2009). Integrated tool for risk assessment in agricultural management of soil erosion and losses of phosphorus and nitrogen. Science of The Total Environment, 407, 749-759
Biot, Y. & Lu, X.X. (1995). Loss of yield caused by soil erosion on sandy soils in the UK. Soil Use and Management, 11, 157-162
Blavet, D., De Noni, G., Le Bissonnais, Y., Leonard, M., Maillo, L., Laurent, J.Y., Asseline, J., Leprun, J.C., Arshad, M.A. & Roose, E. (2009). Effect of land use and management on the early stages of soil water erosion in French Mediterranean vineyards. Soil and Tillage Research, 106, 124-136
Brady, N. & Weil, R. (2008). The Nature and Properties of Soils (14th ed.), Prentice Hall, Upper Saddle River, NJ
Brenot, J., Quiquerez, A., Petit, C. & Garcia, J. (2008). Erosion rates and sediment budgets in vineyards at 1-m resolution based on stock unearthing (Burgundy, France). Geomorphology, 100, 345-355
Bruce, R.R., Langdale, G.W., West, L.T. & Miller, W.P. (1995). Surface soil degradation and soil productivity. Soil Science Society of America Journal, 59, 654-660
Bruckert, S. & Bekkary, M. (1992). Formation des horizons diagnostiques argiliques et de fragipan en fonction de la permeabilité des roches. Canadian Journal of Soil Science, 72, 69-88
Bruinsma, J. (Ed.) (2003). World agriculture: towards 2015/2030 - An FAO perspective. FAO, Rome
Camarero, L. & Catalan, J. (1993). Chemistry of bulk precipitation in the central and eastern Pyrenees, Northeast Spain. Atmospheric Environment, 27A, 83-94
Carsoulle, J., Canler J.P. & Gril, J.J. (1986). Influence de quelques techniques culturales sur le ruissellement et l’érosion en vignoble de coteaux (Beaujolais). Proceedings of 2nd International Symposium on No-Tillage in Vines, 26–28 November 1986, Montpellier
Casalí, J., Giménez, R., De Santisteban, L., Álvarez-Mozos, J., Mena, J. & Del Valle de Lersundi, J. (2009). Determination of long-term erosion rates in vineyards of Navarre (Spain) using botanical benchmarks. Catena, 78, 12-19

Evaluation of Erosion Intensity and Some of Its Consequences in Vineyards from Two Hilly Environments Under Mediterranean Type of Climate, Italy
155
CEC (2006a). Communication from the Commission to the Council, the European Parliament, the European economic and social Committee and the Committee of the Regions. Thematic Strategy for Soil Protection. Brussels, 22.9.2006, COM(2006) 231 final
CEC (2006b). Proposal for a directive of the European Parliament and of the Council establishing a framework for the protection of soil and amending Directive 2004/35/EC. Brussels, 22.9.2006, COM(2006) 232 final
Celle-Jeanton, H., Travi, Y., Loӱe-Pilot, M.D., Huneau, F. & Bertrand, G. (2009). Rainwater chemistry at a Mediterranean inland station (Avignon, France): Local contribution versus long-range supply. Atmospheric Research, 91, 118–126
Cerda, A. (1999). Parent material and vegetation affect soil erosion in eastern Spain. Soil Science Society of America Journal, 63, 362-368
Cerdan, O., Govers, G., Le Bissonnais, Y., Van Oost, K., Poesen, J., Saby, N., Gobin, A., Vacca, A., Quinton, J., Auerwald, K., Klik, A., Kwaad, F.J.P.M., Raclot, D., Ionita, I., Rejman, J., Rousseva, S., Muxart, T., Roxo, M.J. & Dostal, T. (2010). Rates and spatial variations of soil erosion in Europe: A study based on erosion plot data. Geomorphology, 122, 167-177
Chiang, S.C., Radcliffe, D.E., Miller, W.P. & Newman, K.D. (1987). Hydraulic conductivity of three southeastern soils as affected by sodium, electrolyte concentration, and pH. Soil Science Society of America Journal, 51, 1293-1299
Corti, G., Agnelli, A., Cuniglio, R., Cocco, S. & Orsini, R. (2006). Studio pedologico di dettaglio di due microbacini della collina interna marchigiana. In: Climagri - Cambiamenti climatici in agricoltura, Esposito S., Epifani C. & Serra C. (Eds.), pp. 129-141, Consiglio per la Ricerca e la Sperimentazione in Agricoltura e Ufficio Centrale di Ecologia Agraria, Roma
Costantini, E.A.C. (1992). Study of the relationships between soil suitability for vine cultivation, wine quality and soil erosion through a territorial approach. Geoökoplus, 3, 1-14
Costantini, E.A.C., Storchi, P., Bazzoffi, P. & Pellegrini, S. (2001). Where is it possible to extend an eco-compatible cultivation of the Sangiovese vine in the Province of Siena? Proceeding of the International Symposium “Il Sangiovese”, Firenze 15-18 febbraio 2000
Cusmano, L., Morrison, A. & Rabellotti, R. (2010). Catching up trajectories in the wine sector: a comparative study of Chile, Italy, and South Africa. World Development, 38, 1588-1602
Dahlgren, R.A., Tate, K.W., Lewis, D.J., Atwill, E.R., Harper, J.M. & Allen-Diaz, B.H. (2001). Watershed research examines rangeland management effects on water quality. California Agriculture, 55, 64–71
Dimoyiannis, D.G., Valmis, S. & Vyrlas, P. (2002). A rainfall simulation study of erosion of some calcareous soils. Global Nest: The International Journal, 3, 179-183
Doran, J.W. (1987). Microbial biomass and mineralizable nitrogen distributions in no-tillage and plowed soils. Biology and Fertility of Soils, 5, 68–75
EEA-JRC-WHO (2008). Impacts of Europe's changing climate — 2008 indicator-based assessment. Joint EEA/JRC/WHO report. EEA (European Environment Agency), Copenhagen
Fageria, N.K. & Stone, L.F. (2006). Physical, chemical, and biological changes in the rhizosphere and nutrient availability. Journal of Plant Nutrition, 9, 1327-1356

Soil Erosion Issues in Agriculture
156
FAO (2011). FAOSTAT, commodities by country. Date of access May 2011, Available from: <http://faostat/fao.org/>
FAO (2000). Global Assessment of Soil Degradation (GLASOD). FAO, Rome FAO/ISRIC/ISSS (1998). World Reference Base for Soil Resources. World Soil Resources Report,
No 84. FAO, Rome Federici, P.R. & Rodolfi, G. (1994a). Processi di erosione naturale e indotta dalle attività
antropiche lungo il litorale della Provincia di Esmeraldas (Ecuador). In: Studi geografici in onore di D. Ruocco Vol. 2, Cittarella, F. (Ed.), pp. 131-140. Loffredo, Napoli
Federici, P.R. & Rodolfi, G. (1994b). I processi naturali ed antropici responsabili della degradazione e mutazione del paesaggio italiano. Atti Accademia dei Georgofili, 41,13-46
Ferrero, A., Usowicz, B. & Lipiec, J. (2005). Effects of tractor traffic on spatial variability of soil strength and water content in grass covered and cultivated sloping vineyard. Soil and Tillage Research, 84, 127-138
Fregoni, M. (1998). Viticoltura di qualità. Edizioni L'informatore Agrario, Verona Gee, G.W. & Bauder, J.W. (1986). Particle-size analysis. In: Methods of Soil Analysis Part 1,
Physical and Mineralogical Methods (2nd ed.), Campbell, G.S., Jackson, R.D., Mortland, M.M., Nielsen D.R. & Klute, A. (Eds.), pp. 383-409, Agronomy Monograph N° 9, ASA e SSSA, Madison, WI
Gentili, B., Pambianchi, G., Aringoli, D. & Materazzi, M. (2006). Impatto della viticoltura sulla dinamica dei versanti nelle Marche (Italia Centrale). Bollettino della Società Geologica Italiana, Volume speciale n° 6, 201-209
Gregory, P.J. (2006). Roots, rhizosphere and soil: the route to a better understanding of soil science? European Journal of Soil Science, 57, 2–12
Gril, J.J., Canler, J.P. & Carsoulle, J. (1989). The benefit of permanent grass and mulching for limiting runoff and erosion in vineyards. Experimentations using rainfall-simulations in the Beaujolais. In: Soil Erosion Protection Measures in Europe, Schwertmann, U., Rickson, R.J. & Auerswald, K. (Eds.), pp. 157–166, Proceedings of the European Community Workshop on Soil Erosion Protection 24–26 May 1988, Freising, Germany, Catena Verlag Publisher, Cremlingen-Destedt
Hudson, N. (1995). Soil Conservation (3rd ed.), Iowa State University Press, Ames Huggett, J.M. (2006). Geology and wine: a review. Proceedings of the Geologists’Association,
117, 239-247 IPLA (2007). Carta dell’erodibilità dei suoli. Date of access: May 2011, Available from:
<http://www.regione.piemonte.it/agri/suoli_terreni/dwd/atla_carto250/piem_erod_250.pdf>
ISTAT (2003). Rapporto annuale. Istituto Nazionale di Statistica - Produzione Libraria e Centro Stampa, Roma
ISTAT (2009). Superficie e produzione: uva da tavola, uva da vino, vino. Dettaglio per regione. Date of access: May 2011, Available from: <http://agri.istat.it>
Janzen, H.H., Campbell, C.A., Brandt, S.A., Lafond, G.P. & Townley-Smith, L. (1992). Light-fraction organic matter in soils from long-term crop rotations. Soil Science Society of America Journal, 56, 1799-1806

Evaluation of Erosion Intensity and Some of Its Consequences in Vineyards from Two Hilly Environments Under Mediterranean Type of Climate, Italy
157
Keene, W.C., Pszenny, A.P., Galloway, J.N. & Hawley, M.E. (1986). Sea salt corrections and interpretation of constituent ratios in marine precipitation. Journal of Geophysical Research, 91, 6647–6658
Kosmas, C., Danalatos, N., Cammeraat, L.H., Chabart, M., Diamantopoulos, J., Farand, R., Gutierrez, L., Jacob, A., Marques, H., Martínez-Fernandez, J., Mizara, A., Moustakas, N., Nicolau, J.M., Oliveros, C., Pinna, G., Puddu, R., Puigdefabregas, J., Roxo, M., Simao, A., Stamou, G., Tomasi, N., Usai, D. & Vacca, A. (1997). The effect of land use on runoff and soil erosion rates under Mediterranean conditions. Catena, 29, 45–59
Kosmas, C., Danalatos, N.G. & Gerontidis, S. (2000). The effect of land parameters on vegetation performance and degree of erosion under Mediterranean conditions. Catena, 40, 3-17
Lal, R. (1994). Soil Erosion Research Methods (3rd ed.). Soil and Water Conservation Society, Ankeny, IA
Lavkulich, L.M. & Wiens, J.H. 1970. Comparison of organic matter destruction by hydrogen peroxide and sodium hypochlorite and its effect on selected mineral constituents. Soil Science Society of America Journal, 34, 755–758
Le Bissonnais, Y., Montier, C., Jamagne, M., Daroussin, J. & King, D. (2002). Mapping erosion risk for cultivated soil in France. Catena, 46, 207-220
Lorenzo, L., Casalí, J., López, J.J. & Del Valle de Lersundi, J. (2002). Long term assessment of soil erosion rates in vineyards, and its application for USLE model evaluation. Proceeding of European Society of Agronomy Conference, Córdoba, 14–19 July
Louw, P.J.E. & Bennie, A.T.P. (1991). Soil surface condition effects on runoff and erosion on selected vineyards soils. In: Cover Crops for Clean Water, Hargrove, W.L. (Ed.), pp. 25–26, Soil and Water Conservation Society, Ankeny, IA
Lovett, G.M. & Lindberg, S.E. (1984). Dry deposition and canopy exchange in a mixed oak forest as determined by analysis of throughfall. Journal of Applied Ecology, 21, 1013–1027
Luino, F. (2005). Sequence of instability processes triggered by heavy rainfall in the northern Italy. Geomorphology, 66, 13-39
Martínez Casasnovas, J.A. & Sánchez Bosch, I. (2000). Impact assessment of changes in land use/conservation practices on soil erosion in the Penedès-Anoia vineyard region (NE Spain). Soil & Tillage Research, 57, 101–106
Martínez Casasnovas, J.A., Ramos, M.C. & Ribes-Dasi, M. (2005). On-site effects of concentrated flow erosion in vineyards fields: some economic implications. Catena, 60, 129–146
Martínez-Casasnovas, J.A. & Ramos, M.C. (2006). The cost of soil erosion in vineyard fields in the Penedès–Anoia Region (NE Spain). Catena, 68, 194–199
Martínez-Casasnovas, J.A. (1998). Soil–landscape–erosion. Gully erosion in the Alt Penedès – Anoia (Catalonia, Spain). A spatial information technology approach: spatial databases, GIS and remote sensing. PhD Thesis, University of Lleida, Lleida
Martínez-Casasnovas, J.A., Ramos, M.C. & Ribes-Dasi, M. (2002). Soil erosion caused by extreme rainfall events: mapping and quantification in agricultural plots from very detailed digital elevation models. Geoderma, 105, 125-140
Materechera, T.J., Dexter, A.R. & Alston, A.M. (1992). Formation of aggregates by plant roots in homogenized soils. Plant and Soil, 142, 69–79

Soil Erosion Issues in Agriculture
158
Mehra, O.P. & Jackson, M.L. (1960). Iron oxide removal from soils and clays by a dithionite–citrate system buffered with sodium bicarbonate. Clays & Clay Minerals, 7, 317–327
Messer, T. (1980). Soil erosion measurements on experimental plots in Alsace vineyards (France). In: Assessment of Erosion, de Boodt, M. & Gabriels, D. (Eds.), pp. 455–462, John Wiley and Sons Ltd., Chichester
Moreno, G., Gallardo, J.F., Ingelmo, F., Cuadrado, S. & Hernández, J. (1996). Soil water budget in four Quercus pyrenaica forests across a rainfall gradient. Arid Soil Research and Rehabilitation, 10, 65–84
Morgan, R.P.C. (1995). Soil Erosion and Conservation (2nd ed.). Longman, Harlow Nearing, M.A., Jetten, V., Baffaut, C., Cerdan, O., Couturier, A., Hernández, M., Le
Bissonnais, Y., Nichols, M.H., Nunes, J.P., Renschler, C.S., Souchère, V. & van Oost, K. (2005). Modelling response of soil erosion, runoff to changes in precipitation, cover. Catena, 61, 131–154
Nelson, D.W. & Sommers, L.E. (1996). Total carbon, organic carbon, and organic matter. In: Methods of Soil Analysis. Part 3. Chemical Methods, Sparks, D.L., Page, A.L., Helmke, P.A., Loeppert, R.H., Soltanpour, P.N., Tabatabai, M.A., Johnston C.T. & Sumner, M.E. (Eds.), pp. 961–1010, Soil Science Society of America and American Society of Agronomy, Madison, WI
Nunes, J.P.C. & Seixas, J. (2003). Impacts of extreme rainfall events on hydrological soil erosion patterns: application to a Mediterranean watershed. World Resource Review, 15, 336–351
OIV 2007. Situation and statistics of the world vitiviniculture sector. Date of access: May 2011, Available from: <http://www.oiv.org/>
Pagliai, M. (2008). La prevenzione della degradazione del suolo per una gestione sostenibile. Proceeding of the Congress "Conservazione e fertilità del suolo, cambiamenti climatici e protezione del paesaggio". Roma, 10-11 December 2008
Paroissien, J., Lagacherie, P. & Le Bissonnais, Y. (2010). A regional-scale study of multi-decennial erosion of vineyard fields using vine-stock unearthing–burying measurements. Catena, 82, 159-168
Phillips, C.P. & Robinson, D.A. (1998). The impact of land use on the erodibility of dispersive clay soils in central and southern Italy. Soil Use and Management, 14, 155-165
Phillips, C.P. (1998a). The badlands of Italy: a vanishing landscape? Applied Geography, 18, 243-257
Phillips, J.D. (1998b). On the relations between complex systems and the factorial model of soil formation (with discussion and response). Geoderma, 86, 1-43
Pieri, L., Bittelli, M., Hanuskova, M., Ventura, F., Vicari, A. & Rossi Pisa, P. (2007). Characteristics of eroded sediments from soil under wheat and maize in the North Italian Apennines. Geoderma, 154, 20-29
Pisante, M., Iori, M., Di Matteo, A., Stagnari, F., & Lane, M. (2005). Soil erosion assessment in vineyards. Integrated soil and water management for orchard development. FAO Land and water bulletin, 10, 131-135
Pla Sentís, I. & Nacci Sulbarán, S. (2002). Traditional compared to new systems for land management in vineyards of Catalonia (Spain). In: Techniques traditionnelles de GCES en milieu méditerranéen, Roose, E. (Ed.), Bulletin Réseau Erosion 21, 213–223

Evaluation of Erosion Intensity and Some of Its Consequences in Vineyards from Two Hilly Environments Under Mediterranean Type of Climate, Italy
159
Poesen, J.W.A. & Hooke, J.M. (1997). Erosion, flooding and channel management in the Mediterranean environments of southern Europe. Progress in Physical Geography, 21, 157–199
Praveen, P.S., Rao, P.S.P., Safai, P.D., Devara, P.C.S., Chate, D.M., Ali, K. & Momin, G.A. (2007). Study of aerosol transport through precipitation chemistry over Arabian Sea during winter and summer monsoons. Atmospheric Environment, 41, 825–836
Raclot, D., Le Bissonnais, Y., Louchart, X., Andrieux, P., Moussa, R. & Voltz, M. (2009). Soil tillage and scale effects on erosion from fields to catchment in a Mediterranean vineyard area. Agriculture, Ecosystems & Environment, 134, 201-210
Ramos, M.C. & Martínez-Casasnovas, J.A. (2004). Nutrient losses from a vineyard soil in Northeastern Spain caused by an extraordinary rainfall event. Catena, 55, 79-90
Ramos, M.C. & Martínez-Casasnovas, J.A. (2007). Soil loss and soil water content affected by land leveling in Penedès vineyards, NE Spain. Catena, 71, 210-217
Regione Piemonte (2011a). Viticultura e Enologia. Date of access: May 2011, Available from: <www.regione.piemonte.it/agri/viticoltura/documentazione/banchedati.htm> Regione Piemonte (2011b). Tavola 21 - IV Censimento generale dell'agricoltura 1990,
Incidenza della superficie a vite sulla superficie agricola utilizzata. Date of access: May 2011, Available from:
<ww.regione.piemonte.it/agri/speciali/ag2000/piano/atlante/tav21.htm> Renard, K.G., Foster, G.R., Weesies, G.A., McCool, D.K. & Yoder, D.C. (Eds.) (1997).
Predicting Soil Erosion by Water: A Guide to Conservation Planning with the Revised Universal Soil Loss Equation. U.S. Department of Agriculture, Agriculture Handbook 703
Robinson, D.A. & Phillips, C.P. (2001). Crust development in relation to vegetation and agricultural practice on erosion susceptible, dispersive clay soils from central and southern Italy. Soil & Tillage Research, 60, 1-9
Rodà, F., Bellot, J., Avila, A., Escarré, A., Piñol, J. & Terradas, J. (1993). Sahara dust and the atmospheric inputs of elements and alkalinity to Mediterranean ecosystems. Water, Air & Soil Pollution, 66, 277–288
Roggero, P.P., Seddaiu, G. & Toderi, M. (2006). Stakeholder analysis for sharing agro-environment issues towards concerted action: a case study on diffuse nitrate pollution. Italian Journal of Agronomy, 4, 727-740
Ruijgrok, W., Davidson, C.I. & Nicholson, K.W. (1995). Dry deposition of particles. Implications and recommendations for mapping of deposition over Europe. Tellus, 47B, 587–601
Sanusi, A., Wortham, H., Millet, M. & Mirabel, P. (1996). Chemical composition of rainwater in eastern France. Atmospheric Environment, 30, 59–71
Schmittner, K.-E. & Giresse, P. (1999). The impact of atmospheric sodium on erodibility of clay in a coastal Mediterranean region. Environmental Geology, 37, 195-206
Schwing, J.F. (1978). Soil erosion in Alsace vineyards. Its importance and development in relation to agricultural practices. Catena, 5, 305–319
Shaikh, A., Ruff, J.F. & Abt, S.R. (1987). Effect of salt on erosion rate of unsaturated compacted montmorillonite clays. Transportation Research Record, 1151, 32-38
Soil Survey Staff (2010). Keys to Soil Taxonomy (11th ed.). United States Department of Agriculture & Natural Resources Conservation Service

Soil Erosion Issues in Agriculture
160
Sorriso-Valvo, M., Bryan, R.B., Yair, A., Iovino, F. & Antronico, L. (1995). Impact of afforestation on hydrological response and sediment production in a small Calabrian catchment. Catena, 25, 89-104
Suetonius Tranquillus, G. (after 121 a.C.). De Vita Caesarum. In: Vita dei Cesari, Castrati F. (Ed.), 2010 Edition, with latin parallel text, Newton Compton Publisher
Tonietto, J. & Carbonneau, A. (2004). A multicriteria climatic classification system for grape-growing regions worldwide. Agricultural and Forest Meteorology, 124, 81–97
Traoré, O., Groleau-Renaud, V., Plantereux, S., Tubeileh, A. & Bœuf-Tremblay, V. (2000). Effect of root mucilage and modelled root exudates on soil structure. European Journal of Soil Science, 51, 575-581
Tropeano, D. (1984). Rate of soil erosion processes on vineyards in central Piedmont (NW Italy). Earth Surface Processes and Landforms, 9, 253-266
Tuttle, M.P., Schweig, E.S. III, Campbell, J., Thomas, P.M., Sims, J.D. & Lafferty, R.H. III (2005). Evidence for New Madrid earthquakes in A.D. 300 and 2350 B.C. Seismological Research Letters, 76, 489-501
Uren, N.C. (1993). Mucilage secretion and its interaction with soil, and contact reduction. Plant and Soil, 155/156, 79–82
Vahabi, J. & Nikkami, D. (2008). Assessing dominant factors affecting soil erosion using a portable rainfall simulator, International Journal of Sediment Research, 23, 376-386
van der Knijff, J.M., Jones, R.J.A. & Montanarella, L. (2000). Soil erosion risk assessment in Italy. European Soil Bureau, Office for Official Publications of the European Communities, Luxemburg. Date of access: May 2011, Available from: <http://eusoils.jrc.ec.europa.eu/ESDB_Archive/serae/grimm/italia/eritaly.pdf>
Van Gestel, M., Ladd, J.N. & Amato, M. (1992). Microbial biomass responses to seasonal change and imposed drying regimes at increasing depths of undisturbed topsoil profiles. Soil Biology & Biochemistry, 24, 103-111
Wainwright, J. (1996). Infiltration, runoff and erosion characteristics of agricultural land in extreme storm events, SE France. Catena, 26, 27-47
Whalley, W.R., Riseley, B., Leeds-Harrison, P.B., Bird, N.R.A., Leech, P.K. & Adderley, W.P. (2005). Structural differences between bulk and rhizosphere soil. European Journal of Soil Science, 56, 353-360
Wischmeier, W.H. & Smith, D.D. (1978). Predicting Rainfall Erosion Losses: A Guide to Conservation Planning. Agriculture Handbook No. 537. USDA/Science and Education Administration, US. Govt. Printing Office, Washington, DC