CICR04_15_Minimizing Infiltration and Internal Erosion in Soil ...
60
-
Upload
khangminh22 -
Category
Documents
-
view
0 -
download
0
Transcript of CICR04_15_Minimizing Infiltration and Internal Erosion in Soil ...


DISCLAIMER
AuthorProf Limin ZHANGThe Hong Kong University of Science and Technology
Published byConstruction Industry Council, Hong Kong SAR
The information given in this report is correct and complete to the best of knowledge of the authors and publisher. All recommendations are made without guarantee on the part of the authors or publisher. The authors and publisher disclaim any liability in connection with the use of the information given in this report.
Enquiries Enquiries on this research may be made to the CIC Secretariat at:
CIC Headquarters 38/F, COS Centre, 56 Tsun Yip Street, Kwun Tong, Kowloon
Tel.: (852) 2100 9000
Fax: (852) 2100 9090
Email: [email protected]
Website: www.cic.hk
© 2018 Construction Industry Council.
The water distribution network of Hong Kong, with the earliest portion laid in earlier 50’s, is massive and complex, measuring some 7,800 km in total length. During their service, pipes may become defective and burst. Pipe bursting not only causes disturbances to the public, but also serious economic and social consequences. The water leakage due to pipe burst accounts for nearly 19% of the annual water consumption in Hong Kong. Pipe burst incidents also cause more than 200 slope failures in Hong Kong in the past. The 1994 Kwun Lung Lau landslide, which led to 5 fatalities, is one of the slope failures triggered by leakage of buried water services.
Hence, the Construction Industry Council (CIC) initiated the research by engaging a research team to improve the practical design of buried water mains and sewage mains in Hong Kong. This project provides the construction industry four new cost-effective mainlaying schemes and guidelines to mitigate possible catastrophic consequences due to leakage from pressurized buried water carrying services, helps reduce the loss of water in the water-supply network due to pipe bursts, improves techniques for identifying locations and timing of leaking points, and enables routing buried pipes closer to slope crest.
The research work described in the report was carried out by a research team led by Prof Limin ZHANG from The Hong Kong University of Science and Technology. The project cannot succeed without the dedicated effort of the research team. I would like to give thanks to all who took part in this valuable work.
Ir Albert CHENGExecutive DirectorConstruction Industry Council
FOREWORD

In 2015, the Department of Civil and Environmental Engineering of the Hong Kong University of Science and Technology (HKUST) embarked on a research project on mitigating catastrophic consequences due to leakage-induced slope instability. The main objective of this research project was to study the infiltration process in a soil slope from a leaking pressurised pipe and its possible catastrophic consequences, as well as to propose mainlaying protection schemes to prevent adverse consequences. Rigorous centrifuge modelling, laboratory tests and numerical simulations were conducted to evaluate the current Hong Kong mainlaying practice, and to verify the performance and effectiveness of the proposed mainlaying schemes. This summary report presents key findings from this research programme, particularly four proposed innovative mainlaying schemes for preventing leakage-induced slope failures, and recommendations for improving the mainlaying practice.
This project was sponsored by the Construction Industry Council (CIC), and undertaken by a research team consisting of Prof Limin Zhang, Mr Zack Chan, Ms Laura Chen and Dr Hong Zhu from the HKUST and Dr Dongsheng Chang from AECOM Asia Co. Ltd. This research project was advised and managed by Ms Carol Du, Ir Lai Kin Pui, Ir Lam Terry, Ir Lee Julien, Ir Siu Eric and Ir Tang Alan from the CIC. Ir. Lo, K.Y. Victor from the Civil Division of the Hong Kong Institution of Engineers, Dr Kwan Julian, Dr Sun H.W. and Ir Lam Wai Kei from the Geotechnical Engineer Office, and Dr Cheuk Johnny from AECOM provided advice and technical comments during the implementation of this project. We are grateful for their advice and support to this project.
Professor Hong K. LOHead of Department of Civil and Environmental EngineeringThe Hong Kong University of Science and Technology
PREFACE

Four innovative mainlaying schemes have been developed in this project for mitigating catastrophic consequences of buried pipe bursting and associated slope failures due to leakage of pressurized buried water-carrying services (BWCS). These schemes include a geotextile enclosure scheme, a geomembrane enclosure scheme, a sheathed pipe scheme, and a sleeved pipe scheme. The design philosophy of these proposed protection schemes is to:
• Mitigate jet erosion and internal erosion in the soil slopes using geosynthetics enclosures and gravel;
• Divert the leaked water longitudinally through a gravel zone around the pipe or a sleeve pipe along the pipe direction to designated discharge points;
• Reduce the amount of leaked water from infiltrating into the soil slope through enclosures or preferential seepage.
The use of these mainlaying schemes significantly reduce the efforts to confirm suspected leakage and enhance the effectiveness of identifying the leak locations, as suspected leakage can be confirmed by simply monitoring and investigating the condition at the discharge points. Preliminary guidelines have been proposed to facilitate the applications of these schemes.
The feasibility and effectiveness of the four proposed mainlaying schemes were verified on the state-of-the-art 400 g-ton geotechnical centrifuge at the HKUST. Seven model packages were designed and tested to verify the current Hong Kong mainlaying practice and the four proposed innovative protection schemes. The pipe pressure, pore-water pressure in the surrounding soil, and the leakage groundwater level were monitored through a high-speed data acquisition system. The soil movements and scour were also monitored throughout the entire centrifuge model testing process using digital cameras and a particle image velocimetry (PIV) system. By analysing the pore pressure responses and the soil movements during the pipe leaking process, the current Hong Kong mainlaying practice was shown to potentially lead to ground surface scour and deep-seated slope failure, while the proposed new schemes could successfully prevent these failures. A separate pressure test was conducted on a 100-mm nominal diameter “sheathed” ductile iron pipe with a 4-mm diameter hole. The pipe was pressurised to 640 kPa, and no leakage was found, showing a satisfactory performance of the sheath scheme.
Pipe leakage induces high hydraulic gradients in the soil around the pipe, which may cause internal erosion and the loss of fine soil particles in the soil matrix. A series of laboratory tests were conducted to investigate soil deformations caused by internal erosion and the influence of the loss of fine particles on the stress-strain behaviour of the soils subjected to internal erosion. With the increasing loss of fine particles, both the soil mass and the soil volume decrease but the net effect is the increase of the void ratio; namely the soil becomes looser. Substantial axial strain, radial strain, and volumetric strain occur during the internal erosion process. During the drained triaxial shearing test, the shear strength decreases with the increasing amount of eroded fine particles. There is a clear trend of rising critical states, reduced dilative tendency and decreased soil stiffness during shearing with increasing amount of erosion.
RESEARCH HIGHLIGHTS
Advanced three-dimensional (3D) unsaturated/saturated seepage analysis was conducted to simulate the infiltration of leaked water from a hole or a slot on a buried pipe into the originally unsaturated soil slope. The advance of the 3D wetting front is simulated and the simulation results are verified using the centrifuge model tests. The 3D model is then used as a tool for refining the proposed mainlaying scheme. Stability charts for a slope with a typical slope angle and slope height in completely decomposed granite soils at two relative degrees of compaction (85% and 95%) are established for different separation distances and infiltration times. A strict safe distance determined from the stability chart irrespective of how long the leakage proceeds is approximately twice the slope height for 95% relative compaction and three times the slope height for 85% relative compaction, which are both larger than the required minimum distance equal to the vertical height of the slope in the existing practice. Within the strict safe distance, whether the slope is safe or not when subject to pipe leakage depends on whether the pipe leakage can be promptly detected and rectified.
The outcomes from this project will help the construction industry to reduce the loss of water in the water-supply network due to pipe bursts, improve maintenance and operations, enable routing buried pipes closer to slope crest, and enhance the understanding of mechanisms and processes of damage caused by pipe leakage.

Four innovative mainlaying schemes have been developed in this project for mitigating catastrophic consequences of buried pipe bursting and associated slope failures due to leakage of pressurized buried water-carrying services (BWCS). These schemes include a geotextile enclosure scheme, a geomembrane enclosure scheme, a sheathed pipe scheme, and a sleeved pipe scheme. The design philosophy of these proposed protection schemes is to:
• Mitigate jet erosion and internal erosion in the soil slopes using geosynthetics enclosures and gravel;
• Divert the leaked water longitudinally through a gravel zone around the pipe or a sleeve pipe along the pipe direction to designated discharge points;
• Reduce the amount of leaked water from infiltrating into the soil slope through enclosures or preferential seepage.
The use of these mainlaying schemes significantly reduce the efforts to confirm suspected leakage and enhance the effectiveness of identifying the leak locations, as suspected leakage can be confirmed by simply monitoring and investigating the condition at the discharge points. Preliminary guidelines have been proposed to facilitate the applications of these schemes.
The feasibility and effectiveness of the four proposed mainlaying schemes were verified on the state-of-the-art 400 g-ton geotechnical centrifuge at the HKUST. Seven model packages were designed and tested to verify the current Hong Kong mainlaying practice and the four proposed innovative protection schemes. The pipe pressure, pore-water pressure in the surrounding soil, and the leakage groundwater level were monitored through a high-speed data acquisition system. The soil movements and scour were also monitored throughout the entire centrifuge model testing process using digital cameras and a particle image velocimetry (PIV) system. By analysing the pore pressure responses and the soil movements during the pipe leaking process, the current Hong Kong mainlaying practice was shown to potentially lead to ground surface scour and deep-seated slope failure, while the proposed new schemes could successfully prevent these failures. A separate pressure test was conducted on a 100-mm nominal diameter “sheathed” ductile iron pipe with a 4-mm diameter hole. The pipe was pressurised to 640 kPa, and no leakage was found, showing a satisfactory performance of the sheath scheme.
Pipe leakage induces high hydraulic gradients in the soil around the pipe, which may cause internal erosion and the loss of fine soil particles in the soil matrix. A series of laboratory tests were conducted to investigate soil deformations caused by internal erosion and the influence of the loss of fine particles on the stress-strain behaviour of the soils subjected to internal erosion. With the increasing loss of fine particles, both the soil mass and the soil volume decrease but the net effect is the increase of the void ratio; namely the soil becomes looser. Substantial axial strain, radial strain, and volumetric strain occur during the internal erosion process. During the drained triaxial shearing test, the shear strength decreases with the increasing amount of eroded fine particles. There is a clear trend of rising critical states, reduced dilative tendency and decreased soil stiffness during shearing with increasing amount of erosion.
Advanced three-dimensional (3D) unsaturated/saturated seepage analysis was conducted to simulate the infiltration of leaked water from a hole or a slot on a buried pipe into the originally unsaturated soil slope. The advance of the 3D wetting front is simulated and the simulation results are verified using the centrifuge model tests. The 3D model is then used as a tool for refining the proposed mainlaying scheme. Stability charts for a slope with a typical slope angle and slope height in completely decomposed granite soils at two relative degrees of compaction (85% and 95%) are established for different separation distances and infiltration times. A strict safe distance determined from the stability chart irrespective of how long the leakage proceeds is approximately twice the slope height for 95% relative compaction and three times the slope height for 85% relative compaction, which are both larger than the required minimum distance equal to the vertical height of the slope in the existing practice. Within the strict safe distance, whether the slope is safe or not when subject to pipe leakage depends on whether the pipe leakage can be promptly detected and rectified.
The outcomes from this project will help the construction industry to reduce the loss of water in the water-supply network due to pipe bursts, improve maintenance and operations, enable routing buried pipes closer to slope crest, and enhance the understanding of mechanisms and processes of damage caused by pipe leakage.

1 INTRODUCTION 1
1.1 Background 1
1.2 Aims and Objectives 1
1.3 Scope 2
2 RESEARCH METHODOLOGY 3
2.1 Proposed Mainlaying Schemes using Centrifuge Model Tests 3
2.2 Laboratory Workmanship Tests 7
2.3 Laboratory Tests for Internal Erosion 8
2.4 Numerical Simulations 9
3 RESEARCH FINDINGS AND DISCUSSION 16
3.1 Results of Centrifuge Model Test 16
3.2 Results of Tests for Laying Geomembrane 25
3.3 Results of Internal Erosion Tests 26
3.4 Results of Three-Dimensional Seepage Analysis 34
3.5 Results of Two-Dimensional Numerical Simulations 38
4 RECOMMENDATIONS 45
4.1 Safety Distance 45
4.2 Proposed Mainlaying Schemes 45
5 REFERENCES 48
CONTENTS

01Innovative Measures for Minimizing Infiltration and Internal Erosion in Soil Slopes due to Leakage from Pressurized Buried Pipes
INTRODUCTION
1.1 BackgroundBuried water mains, sewers and storm water pipes are critical infrastructures in Hong Kong and elsewhere in the world. During their service, pipes may become defective and water may leak from the pipes. The leaked water will infiltrate into the surrounding soils. Since the pipe pressure for fresh water mains can be up to 400-600 kPa, the hydraulic gradients in the soil can be very high (e.g. >50) and hence internal erosion of the soil surrounding the pipe can happen. The removal of the soil will further enhance leakage and water infiltration, and may eventually lead to pipe bursts and catastrophic consequences. Very often, pipes are laid in soil slopes or road embankments. The infiltration of leaked water in the embankment slopes will cause the loss of soil suction and increases in pore water pressure, which in turn causes the decrease of soil shear strength and, in severe cases, the slope failures. Between 1984 and 2004, 206 landslide incidents involving water-carrying services in the vicinity of the slopes of concern were reported to Geotechnical Engineering Office (Hui et al., 2007). The most famous leakage-induced landslide was the 1994 Kwun Lung Lau landslide on 23rd July 1994, which caused 5 fatalities, 3 injuries and severe damage to the buildings on top of the slope (Morgenstern, 2000). The Kwun Lung Lau landslide aroused public awareness and highlighted the seriousness of leakage-induced slope failures and their catastrophic consequences to the society. Only a limited fundamental research (Zhang & Li, 2007) has been performed to study the leaking mechanisms and soil response in the vicinity of leakage of pressurized BWCS. Great effort has to be made to investigate the infiltration process around a leaking pipe and the effects of leakage from pressurized BWCS on slope stability, and to develop designs against leakage-induced slope failures.
1.2 Aims and ObjectivesThe aim of this research project is to improve the practical design of buried water mains and sewage mains in soil slopes in Hong Kong. The specific objectives are:
• Analysis of the water infiltration zone and slope stability due to leakage from pressurized buried water-carrying services, and the safe distance between a leaking pipe and the crest of a soil slope;
• Full-scale evaluation of innovative drainage designs for buried pipes;
• Development of preliminary design guidelines for protecting soil slopes against leakage from buried pipes.
11.3 Scope
The incidents induced by leakage of buried pressurized water mains and their catastrophic consequences in Hong Kong, as well as the current Hong Kong mainlaying practices were reviewed. Four protection measures were invented for minimizing infiltration and internal erosion in soil slopes due to leakage from pressurized buried pipes. These protection measures include (1) a geotextile enclosure scheme; (2) a geomembrane enclosure scheme; (3) a sheathed pipe scheme; and (4) a sleeved pipe scheme. Advanced centrifuge modelling techniques, as well as laboratory 1g model tests, were adopted to evaluate the feasibility, effectiveness and workmanship of the four proposed mainlaying schemes. The performances of the current Hong Kong mainlaying schemes were also evaluated and compared with those of the invented schemes.
In addition to the centrifuge tests, a series of laboratory seepage and triaxial compression tests was also conducted to study the stress-strain behaviour of soils subjected to internal erosion under complex stress conditions. The soil deformation caused by internal erosion was captured by an innovative photographic method.
Three-dimensional numerical simulations were performed to simulate the infiltration of the leaked water through a circular hole or a slot fracture on the pipe. The pore pressure responses and slope instability due to leakage were successfully re-produced. In addition, the safety distance, denoting the horizontal distance between the buried BWCS and the slope crest, has been recommended for slopes compacted at DG relative degrees of compactions of 85% and 95%.

02 Construction Industry Council
1.1 BackgroundBuried water mains, sewers and storm water pipes are critical infrastructures in Hong Kong and elsewhere in the world. During their service, pipes may become defective and water may leak from the pipes. The leaked water will infiltrate into the surrounding soils. Since the pipe pressure for fresh water mains can be up to 400-600 kPa, the hydraulic gradients in the soil can be very high (e.g. >50) and hence internal erosion of the soil surrounding the pipe can happen. The removal of the soil will further enhance leakage and water infiltration, and may eventually lead to pipe bursts and catastrophic consequences. Very often, pipes are laid in soil slopes or road embankments. The infiltration of leaked water in the embankment slopes will cause the loss of soil suction and increases in pore water pressure, which in turn causes the decrease of soil shear strength and, in severe cases, the slope failures. Between 1984 and 2004, 206 landslide incidents involving water-carrying services in the vicinity of the slopes of concern were reported to Geotechnical Engineering Office (Hui et al., 2007). The most famous leakage-induced landslide was the 1994 Kwun Lung Lau landslide on 23rd July 1994, which caused 5 fatalities, 3 injuries and severe damage to the buildings on top of the slope (Morgenstern, 2000). The Kwun Lung Lau landslide aroused public awareness and highlighted the seriousness of leakage-induced slope failures and their catastrophic consequences to the society. Only a limited fundamental research (Zhang & Li, 2007) has been performed to study the leaking mechanisms and soil response in the vicinity of leakage of pressurized BWCS. Great effort has to be made to investigate the infiltration process around a leaking pipe and the effects of leakage from pressurized BWCS on slope stability, and to develop designs against leakage-induced slope failures.
1.2 Aims and ObjectivesThe aim of this research project is to improve the practical design of buried water mains and sewage mains in soil slopes in Hong Kong. The specific objectives are:
• Analysis of the water infiltration zone and slope stability due to leakage from pressurized buried water-carrying services, and the safe distance between a leaking pipe and the crest of a soil slope;
• Full-scale evaluation of innovative drainage designs for buried pipes;
• Development of preliminary design guidelines for protecting soil slopes against leakage from buried pipes.
1.3 ScopeThe incidents induced by leakage of buried pressurized water mains and their catastrophic consequences in Hong Kong, as well as the current Hong Kong mainlaying practices were reviewed. Four protection measures were invented for minimizing infiltration and internal erosion in soil slopes due to leakage from pressurized buried pipes. These protection measures include (1) a geotextile enclosure scheme; (2) a geomembrane enclosure scheme; (3) a sheathed pipe scheme; and (4) a sleeved pipe scheme. Advanced centrifuge modelling techniques, as well as laboratory 1g model tests, were adopted to evaluate the feasibility, effectiveness and workmanship of the four proposed mainlaying schemes. The performances of the current Hong Kong mainlaying schemes were also evaluated and compared with those of the invented schemes.
In addition to the centrifuge tests, a series of laboratory seepage and triaxial compression tests was also conducted to study the stress-strain behaviour of soils subjected to internal erosion under complex stress conditions. The soil deformation caused by internal erosion was captured by an innovative photographic method.
Three-dimensional numerical simulations were performed to simulate the infiltration of the leaked water through a circular hole or a slot fracture on the pipe. The pore pressure responses and slope instability due to leakage were successfully re-produced. In addition, the safety distance, denoting the horizontal distance between the buried BWCS and the slope crest, has been recommended for slopes compacted at DG relative degrees of compactions of 85% and 95%.

03Innovative Measures for Minimizing Infiltration and Internal Erosion in Soil Slopes due to Leakage from Pressurized Buried Pipes
2RESEARCH METHODOLOGY
2.1 Proposed Mainlaying Schemes using Centrifuge Model Tests
Four innovative mainlaying schemes are proposed to mitigate the captioned catastrophic consequence, which include: (a) Geotextile enclosure; (b) Geomembrane enclosure; (c) Sleeved pipeline; (d) Sheathed pipeline. A geotextile enclosure employs highly permeable material (such as gravel) surrounding the buried pipe in order to dissipate the fluid energy and drain leaked water, if any, along the longitudinal direction to discharge locations. Geotextile, which is highly permeable, acts as a filter to prevent erosion of the soils outside the gravel. A geomembrane enclosure is similar to the geotextile enclosure, but the geotextile is replaced by impermeable geomembrane to prevent water infiltration into the surrounding soil. A sleeved pipe is equivalent to a geomembrane enclosure, but there is no gravel around the buried pipe to dissipate fluid energy. The soft geomembrane is also substituted by steel casing, which is much stiffer to protect the buried pipe. A sheathed pipe blocks any leaked water from infiltrating into the ground; no drainage and discharge locations are required. In total, seven centrifuge model packages (Table 1) have been developed to verify the effectiveness of three selected engineering measures for protecting BWCSs (Figure 1), and to evaluate the performance of the current Hong Kong mainlaying practice when subject to leakage of pressurized BWCS (Figure 2).
Table 1 Summary of the centrifuge model packages
Test ID Description
1 Current Hong Kong practice with narrow trench, slot-type fracture oriented horizontally to the sloping surface.
2 Geotextile enclosure scheme, hole-type fracture, oriented upward to the sloping surface.
3 Geomembrane enclosure scheme, hole-type-fracture, oriented upward. The geomembrane was unbounded.
4 Current Hong Kong practice with wide trench, hole-type fracture oriented upward.
5 Sheathed pipe scheme, hole-type fracture, oriented upward.
6 Geomembrane enclosure scheme, hole-type fracture, oriented upward. The geomembrane was bounded.
7 Current Hong Kong practice with narrow trench, hole-type fracture, oriented upward.

04 Construction Industry Council
All the centrifuge models were successfully tested on the HKUST 400g-ton geotechnical centrifuge. The basic principle of centrifuge modelling is to recreate the stress conditions, which would exist in a full-scale construction (prototype), using a model of greatly reduced scale. This is done by subjecting the model components to an enhanced body force, which is provided by a centripetal acceleration n times the gravitational acceleration. Stress replication in an nth scale model is achieved when the imposed "gravitational" acceleration is equal to ng. Centrifuge testing is better than other types of physical modelling tools on this aspect. Figure 3 depicts a typical centrifuge model package with all monitoring instruments and dimensions in model scale. The instrumentation was identical for all of the seven tests, except for the proposed protection measures and the layout of pore-pressure transducers (PPTs). The physical values in this section are in prototype scale unless otherwise specified. The dimensions of the 1/30th-scale slope models were chosen to represent a 15 m high slope in prototype when it was tested at 30g. The slope angle was 35°. Figure 4 depicts the centrifuge model setup with the water-supply system and data acquisition system.
(a) (b)Existing ground surface
CDG at95% RC
Min. 300mm overlap
Geotextile
Buriedpipe
Gravel30030
0<=
2000
750
100
Existing ground surface
CDG at95% RC
Geomembrane seamCompositegeomembrane
Buriedpipe
Gravel30030
0<=
2000
750
100
Figure 1 A typical fully instrumented centrifuge model package in this research.
Dimension: mm

05Innovative Measures for Minimizing Infiltration and Internal Erosion in Soil Slopes due to Leakage from Pressurized Buried Pipes
(c) (d)Existing ground surface
CDG at95% RC
Sleeve pipe
Pipe spacer/centralizer
Buried pipeCDG at 85%
300
<=20
00
750
100
Existing ground surface
CDG at95% RC
Buried pipe
Geomembranesheath
CDG at 85%30030
0<=
2000
750
100
Existing ground surface
1500
1950
1500360
300
300
CDG at95% RC
CDG at85% RC
CDG at 85% RC CDG at 85% RC
CDG at 95% RC CDG at 95% RC
Figure 2 Centrifuge model layouts for evaluating the current Hong Kong mainlaying practice: (a) Test 1 (slot point upward in narrow trench);(b) Test 4 (hole pointing horizontal
in a wide trench); (c) Test 7 (hole pointing upward in a wide trench).
Figure 1 A typical fully instrumented centrifuge model package in this research.
Dimension: mm
Dimension: mm

06 Construction Industry Council
600 10
0
130 70
130 150 150
PPT
PPT
PPT
PPTPPT
PPT
PPT
Video camera
PIV Camera 1
PIV Camera 2
PIV Camera 3Mainlaying scheme
PPT
100265220
100
100
7525
35° Impe
rmea
ble
boun
dary
Impe
rmea
ble
boun
dary
Impermeable boundary
Figure 4 Centrifuge model setup pending to spinning.
Figure 3 A typical fully instrumented centrifuge model package in this research. The dimensions are in model scale and in mm.
Data logging system
Water storage tank
Overflowcollection tank

Innovative Measures for Minimizing Infiltration and Internal Erosion in Soil Slopes due to Leakage from Pressurized Buried Pipes
07
2.2 Laboratory Workmanship TestsSince geomembrane is a major material in two of the proposed mainlaying schemes (i.e. the geomembrane enclosure and sheathed pipe schemes), its durability, water tightness, quality of seaming and maximum sustained pipe pressure are of concern. These parameters were tested rigorously in the laboratory through pressure tests. DN100-K9 ductile iron pipe 1m in length was chosen as the test specimen. The external pipe diameter was 118mm, with a wall thickness of 6.1mm. Both ends of the pipe were sealed with a circular steel plate (see Figure 5). On one end of the pipe, a hole was drilled on the end plate to allow inflow of pressurized water. In order to simulate the leakage process, a 4mm diameter hole was drilled through the pipe wall. Thereafter, a layer of 3mm-thick geomembrane was used to “sheath” the DI pipe. The experimental setup for the pressure test is demonstrated in Figure 6. The DI pipe was filled up with water first. Compressed air was then applied to generate the required pipe pressures. The pipe pressures adopted in the pressure test ranged from 50 to 640kPa, with an interval of 50kPa (the last increment was 40kPa due to the limitation of the laboratory). Each pressure was maintained for 10 minutes to observe if any failure occurs. The pipe pressure was monitored by a pressure indicator.
Figure 6 Experimental setup for the pressure test.
4mm diameterleakage hole
End platewith no hole
End plate with a hole for water inlet
Figure 5 The pipe specimen with both ends sealed with steel plate.1000mm
118mm
Release ofcompressed air
Sheathed DI pipe
Valve to allow entryof compressed air
Pressure indicator
Inflow ofcompressed air
Release ofcompressed air

08 Construction Industry Council
2.3 Laboratory Tests for Internal ErosionAn innovative method was developed to study the internal erosion process. Unlike previous studies, which simulated the internal erosion process by controlling the hydraulic gradient (e.g., Chang and Zhang, 2011), the loss of fine particles was modelled using table salt to replace some soil particles to achieve designated degrees of erosion. Salt is a natural mineral and can be found in soil. It has no or little chemical reactions with soil particles. A prescribed degree of erosion can be achieved using this method through dissolving a designated amount of salt mixed in the soil specimen. The test set up is presented in Figure 7. Various complex stress states can be maintained during the internal erosion process.
Vacuum
Baselpedestal
Top cap
Pressure regulator
Pressure gauge
Triaxialpedestal
Plate I
Vacuum
Water Supply SystemTriaxial SystemWater Collection System
Vacuum
De-airedwater
Plate II
Top mesh
Figure 7 Experimental setup for internal erosion under complex stress states.

09Innovative Measures for Minimizing Infiltration and Internal Erosion in Soil Slopes due to Leakage from Pressurized Buried Pipes
2.4 Numerical Simulations2.4.1. Governing equations for seepage analysis
Detailed numerical analysis was conducted to investigate the infiltration process due to leakage of pressurized BWCS. The analysis consists of two parts. In the first part, a preliminary analysis is carried out to comprehensively study the influence of leakage pressure on the evolution of pore-water pressure distributions and hence the slope stability, the magnitude of hydraulic gradient induced around the leaking hole being given particular attention. The second part of the analysis targets to determine a safe distance between a buried pipe and the soil slope crest. In this part, a two-phrase analysis is employed. The first phrase simulates the infiltration of the leaked water in the ground around a pipe using the finite element analysis method, with the consideration of the unsaturated behaviour of soil. The second phrase evaluates the slope stability under the influence of leaking pipes. The limit equilibrium method is adopted through incorporating the pore water pressure regime from the seepage analysis in phrase one. Based on Darcy’s law and the mass conservation for water flow, the two-dimensional water flow in unsaturated soil can be described by (Fredlund and Rahardjo 1993):
where kx and ky are the coefficients of permeability in the x- and y-direction, respectively; h is the hydraulic head; θw is the volumetric water content; and t is the elapsed time.
In the situation of pipe leakage, water continuously infiltrates into the slope so that the transient seepage analysis mainly involves a wetting process. The wetting SWCC is described by the equation proposed by Fredlund and Xing (1994):
where θw = volumetric water content of the soil; θr = residual volumetric water content of the soil; θs = saturated volumetric water content of the soil; Ψ = negative pore-water pressure; a, n and m = curve fitting parameters (a has units of pressure).
(1)��x
��y
�h�xkx
�h�yky
��z
�θ�t
�h�zkz+ + -=
θ = C(ψ) (2)θs{ln[e+(ψ/a)n]}m

10 Construction Industry Council
Table 2 Summary of soil index and mechanical propertiesPaveTracker Value Unit References
Bulk unit weight, 19 kN m-3
GEO (1977)
Soil index Specific gravity 2.67 -
properties Maximum dry density, ρd,max 1850 kg m-3
Optimal moisture content, wopt 10.5 % Based on test
Mechanical Effective cohesion, c1 1 kPa results
properties Critical-state friction angle, Ф1cs 38 deg
Table 3 Summary of fitting parameters for soil hydraulic propertiesParameter Definition Value
ks (m/s) Saturated permeability of CDG 2x10⁻⁵ for RC=85%, 1x10⁻⁶ for RC=95%q The exponent of the Leong and Rahardjo (1994) 6 permeability function θs Saturated volumetric water content of CDG 0.4 for RC=85%, 0.35 for RC=95%a (kPa-1) Fitting parameters for the Fredlund and 1n Xing (1994) model 2m 1c (kPa) Cohesion of CDG 1Φ(degree) Friction angle of CDG 35 for RC=85%, 38 for RC=95% (kN/m3) Natural unit weight of soil 19
The soils under consideration are CDG compacted at 95% relative compaction degree for the homogeneous soil profile, and coarse sandy gravel for the drainage material in the geotextile enclosure scheme the geomembrane enclosure scheme. The permeability function proposed by Leong and Rahardjo (1997) is adopted. Summary of the index and mechanical properties are presented in Table 2 while the fitting parameters for soil hydraulic properties are shown in Table 3. The fitted permeability function and soil-water characteristic curves (SWCC) are plotted in Figure 8.
Note: Values of the saturated permeability and saturated volumetric water content of the CDG soils at RC=85% and RC=95% are based on GEO (1977) and Yin et al. (2009).

11Innovative Measures for Minimizing Infiltration and Internal Erosion in Soil Slopes due to Leakage from Pressurized Buried Pipes
(b) soil-permeability curveFigure 8 Hydraulic properties of the CDG
(a) soil-water characteristic curve
Hyd
raul
ic c
ondu
ctiv
ity (m
/s)
Matric suction (kPa)00.1
1.00E-10
1.00E-08
1.00E-07
1.00E-06
1.00E-05
1.00E-04
0.1 1 10
1.00E-09
1.00E-11
1.00E-12
1.00E-13
1.00E-14100 1000
vol.
wat
er c
onte
nt
Matric suction (kPa)00.1
0.20
0.30
0.35
0.40
0.45
0.50
0.1 1 10
0.25
0.15
0.10
0.05
0.00100 1000 10000 100000 1000000

12 Construction Industry Council
2.4.2. Three-dimensional seepage analysisA three-dimensional seepage analysis is conducted to reproduce the infiltration process due to leakage of buried pipes when adopting the geotextile enclosure scheme under centrifuge conditions (Test 2). The numerical simulation helps fine tune the proposed mainlaying schemes.
Figure 9 shows the geometry of the slope and the buried pipe, while Figure 10 demonstrates the details of the pipe alignment, the dimensions and locations of the rectangular-shaped leaking hole. The effects of various lengths of leaking hole are investigated. The working pressure of a storm water pipe is generally below 40kPa. As such, various leaking pressures ranging from 1kPa to 40kPa were simulated. Table 4 summarizes three cases that include the effect of pipe water pressure, the length and location of the opening on the flow regime, and Figure 11 demonstrates the pore-pressure distribution for the leaking pressure of 10kPa. Since the model is symmetric around the centre of the pipe, the value of yp is extended only to 5.1m. The section considers a simplified configuration assuming a uniform relative compaction for all the backfill materials.
The location of the leaking hole may not be easily detected using the techniques in current practice as mentioned. To investigate how changes in the location of leaking hole affect pore-water pressure regime, a series of numerical studies was conducted by considering three locations of leaking hole located at yp =0.1m, 2.1m and 5.1m (i.e., at the middle of pipe) with the length of the opening fixed at 0.2m (hole-type fracture).
Figure 9 Geometry of the slope and a close-up view of the vicinity of the pipe
YZ
A
B
F H
E G
IC
J L
DK
35°
18m
3m
6m
3m
21.4m
4m 2m
10.5m
X
2000 75009000
1500 CDG
Note: all units are in mm.
Ground surface
slope surface
openinglocation & shape
300 dia.pipe
Sand gravel

13Innovative Measures for Minimizing Infiltration and Internal Erosion in Soil Slopes due to Leakage from Pressurized Buried Pipes
Figure 10 Details of the pipe alignment and the geometry of the single opening
Figure 11 Pore-water pressure distributions in the 3D domain
(a) due to a slot-type fracture on pipe (b) due to a triangular hole on pipe
(b) Cross-sectional view of the pipe and opening
(a) Plan view of the pipe
0.3mY=10.5m
10.5myp
Y=0m
Likely location
Ground surface
X
X
Em
bedment
depth (D)
200mm
75mmX-X view
75mm
300mm

14 Construction Industry Council
Table 4 Analysis cases for the proposed study
2.4.3. Determination of safety distance
The dimensions of the numerical slope model and the details of the pipe are presented in Figure 12. The distance from the pipe centre to the slope crest is referred to as the separation distance. From the hydraulic responses and the associated changes in the safety factor of the slope, a safe separation distance affected by pipe leakage is determined. We concern buried sewage pipes and storm water pipes. Such pipes are often embedded at a depth of about 2.0m, and the pipe pressure seldom exceeds 40kPa. The pipe has a diameter of 300mm, which is a common size of water pipes.
Figure 12 Geometry of the slope and details of the leaking pipe.
pressure
Two analysis cases are designed for investigating the water infiltration process. One involves entirely impermeable side and bottom boundaries, and a free exit slope surface without ponding. The other includes an additional draining condition at the left end of the model base (point 'B' in Figure 12) besides the non-permeable boundaries, which can exist in a real fill slope. Two relative compactions of 85% and 95% were considered, which correspond to coefficients of saturated permeability of 2x10⁻⁵ m/s and 1x10⁻⁶ m/s, respectively. The Fredlund and Xing (1994) SWCC and the permeability function proposed by Leong and Rahardjo (1997) are adopted to define the unsaturated hydraulic properties of the CDG soil. The fitting parameters are given in Table 3.
The initial groundwater table is located at the bottom of the slope and the maximum initial suction is set constant above 10 kPa. The transient process lasts for three months for the case involving a saturated permeability of 2x10⁻⁵ m/s and three years for the case of a saturated permeability of 1x10⁻⁶ m/s.
Case No. Controlling parameter Values Remarks
1 Pipe water pressure (p: kPa) 1, 5, 40 yp=0.1 m and lp=0.2 m
2 The length of opening (lp: m) 0.2, 1, 5 p=20 kPa
3 The location of opening (yp: m) 0.1, 2.1, 5. p=20 kPa and lp=0.2 m
EmbedmentDepth of 2 m
Slope surface witha free-exit boundary
Buried water pipe,300 mm in diameter
Separation distance, s
Close-up view of the pipe and crack
10m
34.4m
3m
3m
C
DE35°
18m
A F
B

15Innovative Measures for Minimizing Infiltration and Internal Erosion in Soil Slopes due to Leakage from Pressurized Buried Pipes
2.4.3. Determination of safety distance
The dimensions of the numerical slope model and the details of the pipe are presented in Figure 12. The distance from the pipe centre to the slope crest is referred to as the separation distance. From the hydraulic responses and the associated changes in the safety factor of the slope, a safe separation distance affected by pipe leakage is determined. We concern buried sewage pipes and storm water pipes. Such pipes are often embedded at a depth of about 2.0m, and the pipe pressure seldom exceeds 40kPa. The pipe has a diameter of 300mm, which is a common size of water pipes.
Two analysis cases are designed for investigating the water infiltration process. One involves entirely impermeable side and bottom boundaries, and a free exit slope surface without ponding. The other includes an additional draining condition at the left end of the model base (point 'B' in Figure 12) besides the non-permeable boundaries, which can exist in a real fill slope. Two relative compactions of 85% and 95% were considered, which correspond to coefficients of saturated permeability of 2x10⁻⁵ m/s and 1x10⁻⁶ m/s, respectively. The Fredlund and Xing (1994) SWCC and the permeability function proposed by Leong and Rahardjo (1997) are adopted to define the unsaturated hydraulic properties of the CDG soil. The fitting parameters are given in Table 3.
The initial groundwater table is located at the bottom of the slope and the maximum initial suction is set constant above 10 kPa. The transient process lasts for three months for the case involving a saturated permeability of 2x10⁻⁵ m/s and three years for the case of a saturated permeability of 1x10⁻⁶ m/s.

16 Construction Industry Council
RESEARCH FINDINGS AND DISCUSSION
33.1 Results of Centrifuge Model Test
The results of the 7 centrifuge model tests are presented in this section. In this series of centrifuge tests, the geotextile enclosure scheme (Test 2), the geomembrane enclosure scheme (Tests 3 and 6) and the sheathed pipe scheme (Test 5) were tested. Three tests simulating the current Hong Kong pipe-laying practice (Tests 1, 4 and 7) were tested as well. The test results are summarized in Table 5.
Test Surface Deep- Pipe Failure rupture seated slope pressure time and failure at onset of (prototype) erosion failure
Current Hong Kong practice (wide trench, slot, Yes No 100 kPa - pointing upward)
Current Hong Kong practice (narrow trench, Prevented Yes 100 kPa 126 days hole, pointing horizontally)
Current Hong Kong practice (narrow trench, Prevented Yes 100 kPa 109 days hole, pointing upward)
Geotextile enclosure Prevented Yes 35 kPa 18 days
Geomembrane enclosure Prevented Prevented - -
Sheathed pipe Prevented Prevented - -
Sleeved pipe Prevented Prevented - -
Table 5 Summary of the centrifuge test results for the current Hong Kong mainlaying practice
and the four proposed protection measures

17Innovative Measures for Minimizing Infiltration and Internal Erosion in Soil Slopes due to Leakage from Pressurized Buried Pipes
Figure 13 Top view of the slope at the end of Test 1(Current practice: slot fracture pointing upward in a narrow trench)
3.1.1. Performance of the current Hong Kong mainlaying practice
Leakage-induced surface erosion was observed in Tests 1 and 7, whereas deep-seated slope failure was observed in Test 4. The experimental setups for the three tests were similar, but the failure modes varied significantly. An erosion hole emerged at the ground surface and the leaking hole was exposed (Figure 13 and Figure 15). After that, the majority of the leaked water was discharged through this erosion hole, gradually forming an erosion gully. At the end of the experiment, no significant signs of landslide and no deep-seated failure were observed. Nevertheless, in Test 4, the excavation trench was wider, and the fracture was oriented horizontally to the sloping surface, and finally deep-seated failure occurred (Figure 14). Erosion holes were also observed during the test, but the surface discharge was not as much as that in Tests 1 and 7. Most of the leaked water still infiltrated into the slope. This was the main reason for the occurrence of deep-seated failure. In order to differentiate the significance of trench effects and fracture orientation effects on the mode of slope failure, Test 7 was conducted. In Test 7, the trench width (wide trench) and the fracture type (hole-type fracture) remained the same as those in Test 4. The only change was the fracture orientation, which was oriented upward. No deep-seat slope failure was observed in Test 7, but leakage-induced surface erosion and concentrated surface flow occurred (Figure 15). As concentrated flow emerged in Test 1 and Test 7, the vast majority of the leaked water was discharged to the slope surface, leaving relatively small amount of leaked water entering the slope through surface infiltration. Therefore, only Test 4 experienced direct water infiltration into the soil from the leaking pipe.
Pipe exposed Erosion gully

18 Construction Industry Council
Figure 15 Top view of the slope at the end of Test 7.(Current practice: hole fracture pointing upward in a wide trench)
Slip surface
Figure 14 Cross section of the slope at the end of Test 4.(Current practice: hole fracture pointing horizontal in a wide trench)
Erosion gully caused by leakedwater due to Coriolis effect
Pipe exposed

19Innovative Measures for Minimizing Infiltration and Internal Erosion in Soil Slopes due to Leakage from Pressurized Buried Pipes
3.1.2. Applicability of the geotextile enclosure scheme
Erosion failure was not observed in the geotextile enclosure scheme (Test 2), but deep-seated failure was observed. In this test, the leaked water was drained in the longitudinal direction due to higher permeability of gravel. The leaked water was eventually discharged through the discharge pipe installed near the wall-end of the centrifuge model box. However, a large fraction of the leaked water infiltrated through the geotextile into the slope, and the geotextile played a filter role.
Figure 16 Pore pressure response in the geotextile enclosure scheme (Test 2)
Elapsed time (day)
PPT
valu
e (k
Pa)
-20
0
20
60
80
100
140
120
40
0 20 40 60 80 100 120 140
onset of slope failure
35 kPa
100 kPa
50 kPa
P_n PPT_(1)PPT_(3)
PPT_(4)PPT_(2)
PPT_(5)

20 Construction Industry Council
Figure 16 reveals significant increases in pore pressure as leakage proceeds. PPT_(i) (i = 1, 2, 3, …) denote the pore pressure values at different locations of the slope at different elapsed times, while P_n represent the pore pressure at the leaking location. Slope failure eventually occurs when the pore pressures attained their critical values. This implies that a significant amount of the leaked water infiltrated into the slope, leading to the deep-seated failure. Figure 17 presents the relationship between the pipe pressure and the pipe flow rate at different elapsed times, and Figure 18 depicts the displacement field of the slope at the end of each applied pipe pressure. Geotextile together with gravel can indeed reduce the possibility of bursting of water to the ground surface as the pore water pressure in the slope is much smaller than the pipe water pressure. However, it may cause deep-seated failure in the slope. This protection measure is proved to be not suitable for slopes, but is applicable for protecting buried pipes laid in horizontal grounds (e.g. urban area).
Elapsed time (day)
Pipe
pre
ssur
e (k
Pa)
0
20
60
80
100
140
120
40
0 20 40 60 80 100 120 140
Flow
rate
(L/m
in)
0.0
0.2
0.6
0.8
1.0
1.4
1.2
0.4
onset of slope failure
Figure 17 Pipe pressure and flow rate in the geotextile enclosure scheme (Test 2)
P_nQ_n
35 kPa
100 kPa
50 kPa

21Innovative Measures for Minimizing Infiltration and Internal Erosion in Soil Slopes due to Leakage from Pressurized Buried Pipes
0
200
100
400
600
500
300
0 100 200 300 400 500 600 700 800 900 1000
0
200
100
400
600
500
300
0 100 200 300 400 500 600 700 800 900 1000
(a) At the end of 35 kPa
(b) At the onset of slope failure (during 100 kPa)Figure 18 Displacement fields in the geotextile enclosure scheme (Test 2)
at different elapsed times

22 Construction Industry Council
3.1.3. Applicability of the geomembrane enclosure schemeErosion failure was prevented by the geomembrane enclosure (Tests 3 and 6). Deep-seated failure was also prevented in the bounded geomembrane enclosure case (Test 6). In Test 6, the geomembrane enclosure gravel was perfectly sealed, with the drainage pipe installed at the opposite site of the leaking point. Test results indicated that the pore pressure in the slope remained almost constant throughout the centrifuge test (Figure 19). This implies that vast majority of the leaked water was drained through the gravel and discharged at the specified location, leaving an extremely small amount of leaked water infiltrated into the soil slope. This in turn proved the ability of this scheme to prevent soil erosion and slope failure. Nevertheless, in Test 3, geomembrane was placed and overlapped but not sealed, which was similar to the leakage collection system adopted by Water Supply Department (WSD 2012). The purposes of this test setup are to observe if (1) a larger percentage of leaked water can be drained through gravel and discharged by the discharge pipe; (2) slope failure can be postponed; and (3) the scale of landslide can be reduced. The test results indicate that the time to trigger a deep-seated failure is about the same as that in the geotextile enclosure scheme. It infers that a large percentage of the leaked water infiltrated into the soil. This experiment highlights that an ideal geomembrane enclosure should satisfy the following conditions: (1) good water tightness; (2) good durability of the geomembrane lining; and (3) high permeability of the filling materials.
Figure 19 Pore pressure response in the sealed geomembrane enclosure scheme (Test 6).
Elapsed time (day)
PPT
valu
e (k
Pa)
-50
0
100
200
150
50
0 50 100 150 200
Centrifuge spin down67 kPa
185 kPa
88 kPa
P_n
PPT_(3)PPT_(4)
PPT_(2)PPT_(1)
PPT_(5)PPT_(6)PPT_(7)PPT_(8)

23Innovative Measures for Minimizing Infiltration and Internal Erosion in Soil Slopes due to Leakage from Pressurized Buried Pipes
3.1.4. Applicability of the sleeved pipe scheme
The concept of the sleeved pipe is almost identical to that of the geomembrane enclosure scheme, but the set up was quite different. Instead of geomembrane, a steel or other metallic casing is employed as the enclosing material. A steel casing provides mechanical protection to the buried pipe due to its stiffness and strength. It can not only protect the buried pipe from suffering damages due to the surrounding soils (e.g. soil movement, acid attack, temperature changes etc.), but also provide drainage of the leaked water once the pipe leaks. Whether using the geomembrane enclosure scheme or the sleeved pipe scheme as a protection measure depends on the material availability, site conditions and labour availability. This mainlaying scheme was not tested in the centrifuge because the performance of drainage will be identical to the well-sealed geomembrane enclosure. From the test result of the well-sealed geomembrane enclosure, the capability of the sleeved pipe is satisfactory as well.
3.1.5. Applicability of the sheathed pipe scheme
The design philosophy of sheathed pipeline is quite similar to that of the geomembrane enclosure scheme. This approach is even more economical due to the eliminated use of gravel as the drainage material. Instead of draining leaked water through gravel, the sheath directly blocks the leaked water from the very beginning. Figure 20 shows that the changes in pore-water pressure upon leakage for the sheathed pipeline are insignificant. The leaked water was retained near the vicinity of the leak location. If the geomembrane is perfectly sealed and of good durability, there will be no leaked water infiltration into the soil slope. As described in the geomembrane enclosure scheme, good durability and high quality of water tightness of the protection measure are of paramount importance for preventing soil erosion and slope failure. However, this mainlaying scheme requires the geomembrane to be in direct contact with the surrounding soil, leading to high potential of damaging the geomembrane. As a consequence, this mainlaying scheme is recommended to be coupled with the geomembrane enclosure scheme or the sleeved pipe scheme.

24 Construction Industry Council
Elapsed time (day)
PPT
valu
e (k
Pa)
-50
0
100
250
150
200
50
0 50 100 150 200
Centrifuge spin down
35 kPa
182 kPa
70 kPa
P_n
PPT_(3)PPT_(4)
PPT_(2)PPT_(1)
PPT_(5)
Figure 20 Pore pressure response in the sheathed pipe scheme (Test 5).

25Innovative Measures for Minimizing Infiltration and Internal Erosion in Soil Slopes due to Leakage from Pressurized Buried Pipes
Figure 21 A sheathed DI pipe sustaining a leakage pressure of 640 kPa.
3.2 Results of Tests for Laying GeomembraneIn the 1g pressure test for the sheathed geomembrane scheme, the sustained pipe pressure reached 640kPa (the limiting pressure of the air compressor), yet no any sign of leakage from the geomembrane sheath was found. No observable deformation of the geomembrane was recorded either throughout the entire pressure test. The test was not performed beyond 640kPa, limited by the compressed air supply, so that the limiting pressure of the sheathed geomembrane scheme had not been obtained.
This implies that the sheathed geomembrane scheme is able to retain leaked water even when a fracture or hole forms on the wall of the DI pipe. The leaked water has no path into the soil slope, and thus no slope failure will occur. The sheathed geomembrane scheme is therefore shown to be reliable. Figure 21 demonstrates the sheathed DI pipe sustaining a leakage pressure of 640kPa.

26 Construction Industry Council
3.3 Results of Internal Erosion Tests3.3.1. Soil deformation induced by loss of fine particles
The soil fabric changes during internal erosion as some fine particles erode. As Figure 22 shows, the amount of fine particles decreases and the mass fraction of the coarse particles increases. The height and diameter of each soil sample were measured using a digital imaging method, which was used to calculate the axial, radial, and volumetric strains. The relations between the strains and the loss of fine particles are shown in Table 6. In general, the radial strain is larger than the axial strain, which means the remoulded specimens may have initial anisotropic characteristics induced by cycles of loading and unloading during the static compaction. A preferred distribution of inter-particle contacts could form in the horizontal direction. With increasing loss of fine particles, the contacts between the soil particles decreased and the strong force chains might collapse, leading to substantial deformations, particularly in the radial direction.
Figure 22 Grain size distributions of test soils after internal erosion: (a) Group A
Perc
ent p
assi
ng b
y w
eigh
t (%
)
Particle diameter (mm)
(a)
100
20
40
60
80
100
1 0.1 0.01
0% salt10% salt20% salt30% salt

27Innovative Measures for Minimizing Infiltration and Internal Erosion in Soil Slopes due to Leakage from Pressurized Buried Pipes
Figure 22 Grain size distributions of test soils after internal erosion: (b) Group B.
Perc
ent p
assi
ng b
y w
eigh
t (%
)
Particle diameter (mm)
(b)
100
20
40
60
80
100
1 0.1 0.01
0% salt5% salt10% salt15% salt

28 Construction Industry Council
Test ID Salt Mass of Volume of Change in Volume of Change Void ratio Final Final Final Content solid (g) soil solid volume of void in void volume radial axial (%) (cm3) soil solid (cm³) volume strain strain strain (cm³) (cm³) (%) (%) (%) Initial Final Initial Final Initial Final Initial Final A1 0 1120 1120 429.1 429.1 0.0 197.6 197.6 0.0 0.460 0.460 0.00 0.00 0.00
A2 5 1226 1165 469.7 446.3 -23.5 216.3 229.4 13.1 0.461 0.514 1.51 0.26 0.99
A3 10 1255 1129 480.8 432.7 -48.1 221.4 247.8 26.4 0.460 0.573 3.13 1.07 0.99
A4 15 1198 1019 459.2 390.3 -68.9 211.5 251.4 39.9 0.461 0.644 4.39 1.60 1.19
B1 0 1307 1307 500.6 500.6 0.0 188.9 188.9 0.0 0.377 0.377 0.0 0.0 0.0
B2 10 1301 1171 498.5 448.6 -49.8 188.1 213.4 25.3 0.377 0.476 3.62 1.31 1.00
B3 20 1308 1046 501.2 400.9 -100.2 189.1 209.7 20.6 0.377 0.523 12.01 4.60 2.81
B4 30 1308 915 501.0 350.7 -150.3 189.0 207.8 18.8 0.377 0.593 20.38 7.88 4.62
Table 6 Changes in void ratio during internal erosion.
* Negative sign means that the volume of soil decreased during the internal erosion test.
The soil skeleton in soil group B with 35% of fine particles is controlled by its fine content, with the medium-size and coarse particles floating in the fine particles (Chang and Zhang, 2013). Thus, after a certain amount of fine particles loss, a significant change in the soil microstructure occurred. Table 6 illustrates the substantial increase in the volumetric strain in group B samples after 10% of fine particle is lost. The volumetric strain reaches 19% when fine particle loss reaches 30% of the total soil mass. While for the group A samples containing 20% of fine particles, the soil skeleton is formed by both coarse particles and fine particles (Chang and Zhang, 2013). The loss of fine particles will cause the loss of some lateral support to prevent buckling of the strong force chains but will cause a less apparent change in the soil structure. Hence, the volumetric strains of the group A samples are smaller than those of the group B samples given the same amount of fine particles loss. Samples A1 and B1 without salt still experienced some limited wetting deformations, which are much smaller than the maximum erosion induced volumetric strain and axial strain of the group A samples and the group B samples in this research. Therefore, the wetting deformations of the samples could be ignored for simplicity in interpreting the test results. With the salt dissolved, both the soil mass and the soil volume decreased, but the net effect was the increase of the void ratio (Table 6) or the soil became looser as the fine particles erodes.
3.3.2. Stress-strain relationships
The stress-strain relationships of the specimens subjected to loss of fine particles are presented in Figure 23 and Figure 24 for groups A and B, respectively. The soil volume decreases in the initial stage of shearing but increases subsequently due to dilation. The two benchmark tests (A1 and B1) without erosion exhibit an obvious strain softening behaviour. With an increasing percentage of eroded fine particles, the stiffness of the soil becomes smaller, the volume compression before dilation becomes larger, and the dilation tendency becomes weaker. The state parameter can be used to explain the stress-strain behaviour of soil by accounting for both void ratio and stress level. With the loss of fine particles, the void ratio increases, the soil grading changes and the critical state line shifts. Figure 25 shows the changes in void ratio during shearing. The final state parameter (ψnew, after erosion) is a combination of the old state parameter (ψold, no erosion), increment of void ratio (en − e0), and a shift of the critical state line (Δecs). In calculating the critical state void ratio, a slope of the critical state lines of 0.034 was adopted, which was obtained from tests on the same type of completely decomposed granitic soil by Zhao and Zhang (2014). Wood (2007) proposed a grading state index, IG, which is a scalar characteristic of the soil fabric and describes the relationship between changing grading and the critical state line. The symbol, IG, is the ratio of the area of the current particle size distribution and the area of a limiting (fractal) distribution.

29Innovative Measures for Minimizing Infiltration and Internal Erosion in Soil Slopes due to Leakage from Pressurized Buried Pipes
The soil skeleton in soil group B with 35% of fine particles is controlled by its fine content, with the medium-size and coarse particles floating in the fine particles (Chang and Zhang, 2013). Thus, after a certain amount of fine particles loss, a significant change in the soil microstructure occurred. Table 6 illustrates the substantial increase in the volumetric strain in group B samples after 10% of fine particle is lost. The volumetric strain reaches 19% when fine particle loss reaches 30% of the total soil mass. While for the group A samples containing 20% of fine particles, the soil skeleton is formed by both coarse particles and fine particles (Chang and Zhang, 2013). The loss of fine particles will cause the loss of some lateral support to prevent buckling of the strong force chains but will cause a less apparent change in the soil structure. Hence, the volumetric strains of the group A samples are smaller than those of the group B samples given the same amount of fine particles loss. Samples A1 and B1 without salt still experienced some limited wetting deformations, which are much smaller than the maximum erosion induced volumetric strain and axial strain of the group A samples and the group B samples in this research. Therefore, the wetting deformations of the samples could be ignored for simplicity in interpreting the test results. With the salt dissolved, both the soil mass and the soil volume decreased, but the net effect was the increase of the void ratio (Table 6) or the soil became looser as the fine particles erodes.
3.3.2. Stress-strain relationships
The stress-strain relationships of the specimens subjected to loss of fine particles are presented in Figure 23 and Figure 24 for groups A and B, respectively. The soil volume decreases in the initial stage of shearing but increases subsequently due to dilation. The two benchmark tests (A1 and B1) without erosion exhibit an obvious strain softening behaviour. With an increasing percentage of eroded fine particles, the stiffness of the soil becomes smaller, the volume compression before dilation becomes larger, and the dilation tendency becomes weaker. The state parameter can be used to explain the stress-strain behaviour of soil by accounting for both void ratio and stress level. With the loss of fine particles, the void ratio increases, the soil grading changes and the critical state line shifts. Figure 25 shows the changes in void ratio during shearing. The final state parameter (ψnew, after erosion) is a combination of the old state parameter (ψold, no erosion), increment of void ratio (en − e0), and a shift of the critical state line (Δecs). In calculating the critical state void ratio, a slope of the critical state lines of 0.034 was adopted, which was obtained from tests on the same type of completely decomposed granitic soil by Zhao and Zhang (2014). Wood (2007) proposed a grading state index, IG, which is a scalar characteristic of the soil fabric and describes the relationship between changing grading and the critical state line. The symbol, IG, is the ratio of the area of the current particle size distribution and the area of a limiting (fractal) distribution.

30 Construction Industry Council
Figure 23 Stress-strain relationships with the loss of different amounts offine particles in Group A (a) deviatoric stress v.s. axial strain;
(b) volumetric strain v.s. axial strain.
Volu
met
ric s
train
, εv
(%)
Axial strain, (εa%)0
3
1
0
-1
-2
-3
10 20 30
0% loss of fine particles5% loss of fine particles10% loss of fine particles15% loss of fine particles
2
Dev
iato
ric s
tress
, q (k
Pa)
Axial strain, εa (%)0
0
60
90
120
150
180
10 20 30
0% loss of fine particles5% loss of fine particles10% loss of fine particles15% loss of fine particles
30
(a)
(b)

31Innovative Measures for Minimizing Infiltration and Internal Erosion in Soil Slopes due to Leakage from Pressurized Buried Pipes
Figure 24 Stress-strain relationships with the loss of different amounts of fine particles in Group B (a) deviatoric stress v.s. axial strain;
(b) volumetric strain v.s. axial strain.
Dev
iato
ric s
tress
, q (k
Pa)
Axial strain, εa (%)0
0
50
100
150
200
10 20 30
0% loss of fine particles10% loss of fine particles20% loss of fine particles30% loss of fine particles
5 15 25
Volu
met
ric s
train
, εv
(%)
Axial strain, (εa%)0
3
2
1
0
-1
0% loss of fine particles5% loss of fine particles10% loss of fine particles15% loss of fine particles
4305 2510 15 20
(a)
(b)

32 Construction Industry Council
Figure 25 Rising of critical states with loss of fine particles (a) Group A; (b) Group B.
(a)
(b)
Void
ratio
Mean effective stress, p’ (kPa)10
0.35
0.45
0.55
0.65
0.75
100 1000
° Critical state---- Reference critical state lineψ State parameter
Decrease of IG
A4 (15% loss of particles)IG =0.822
A3 (10%), IG =0.881
A2 (5%), IG =0.940
A1 (0%), IG =1
Void
ratio
Mean effective stress, p’ (kPa)10
0.35
0.45
0.55
0.65
0.75
100 1000
° Critical state---- Reference critical state lineψ State parameter
Decrease of IG
B4 (30% loss of particles)IG =0.698
B3 (20%), IG =0.799
B2 (10%), IG =0.899
B1 (0%), IG =1

33Innovative Measures for Minimizing Infiltration and Internal Erosion in Soil Slopes due to Leakage from Pressurized Buried Pipes
3.3.3. Peak friction angle and critical friction angle
The changes in the peak friction angle and the critical-state friction angle with different percentage of fine particle loss are presented in Figure 26. Both the peak friction angle and the critical friction angle decrease with an increasing amount of loss of fine particles. In group A, the peak friction angle goes down from 38.7° (A1) to 34.6° (A4), which decreases by 12%. For group B, the peak friction angle decreases by 10% from 40° (B1) to 36.1° (B4). In general, samples in group A show a more dilative tendency and experience a larger drop of peak shear strength due to internal erosion. Compared with the peak friction angle, the changes in the critical friction angle with the loss of fine particles are rather small. The true critical state might not have been achieved at the end of the tests when the axial strains were 30% and 23% for the soil samples in group A and group B, respectively, as the volumetric strain continued to change in Figure 24 and Figure 25. However, the rate of increase of volumetric strain was small toward the end of the tests. Thus, the critical state was assumed to have been reached. The error caused by this assumption should be noted as the critical state void ratio could be underestimated and the critical friction angle is overestimated.
Fric
tion
angl
e (°
)
Loss of particles by weight (%)0
20
30
35
40
45
10 20 30
Peak friction angle of soil ACritical friction angle of soil APeak friction angle of soil BCritical friction angle of soil B
25
Figure 26 Peak and critical friction angle of the test soils with the different percentage of fine particle loss.

34 Construction Industry Council
3.4 Results of Three-Dimensional Seepage Analysis3.4.1. Verification of the numerical model with centrifuge model tests
The pore pressure distribution at the end of the 37-day infiltration duration is presented in Figure 27(a). The simulated values of the pore-water pressures at the PPT locations are in good agreement with the centrifuge test readings. Taking the results at the end of duration as an example, the centrifuge test values and the simulation values are presented in pair in the bracket. The calculated values agree well with the observed values at moderate heights (PPTs "B" and "D"), with deviations of 7% and 20%, respectively. The maximum difference is observed at the top PPT (location "A"), which may be attributed to the close proximity of this PPT to the bursting point, leading to unstable readings to some extent. The numerical responses at the bottom three PPTs (locations "C", "E", and "F") only deviate 17%, 18% and 14%, respectively, from the actual readings. Figure 27(b) compares the results over the entire test duration. For enhanced clarity, the PPT readings and the simulated results are shown for the three PPTs at the medium height only. The simulated and experimental trends of variation against time for PPTs "B" and "E" are consistent. For PPT "D", within the initial five days, the measured value increases but the simulated value remains at -10 kPa. It is speculated that lateral preferential flow occurred during the test at the height of PPT "D", likely due to the non-uniform compaction of the soil sample. As infiltration proceeds, the trends become similar and the values do not differ too much. As a whole, the simulated results show reasonable agreement with the results of the centrifuge model test. The slight discrepancy of the values may be due to several causes: (1) preparation of the test sample on a layer by layer basis in which perfect consistency among each layer may not be quarantined; (2) unavoidable errors in reading; and (3) imperfect control of test equipment. With the good consistency, the numerical approach is hence deemed appropriate for modelling the leakage process.

35Innovative Measures for Minimizing Infiltration and Internal Erosion in Soil Slopes due to Leakage from Pressurized Buried Pipes
(b) variation of pore-water pressure values over a test duration of 37 days since the onset of leakage.
Figure 27 Comparison of the simulated and measured results
(a) pore-water pressure contour at the end of 37 days
(12.5, 10)
xx(kPa): measuredxx(kPa): calculated
Pore-water pressuretransducer
(40.6, 35)(81.8, 96)
(48.5, 52)
(12.2, 18)
(30.4, 36)F
E
C
B
A
D
x
tu
rs
q
e
b
bc
aeb
b
m
o
kj
ig
0 10 20 30 40-20
-10
0
10
20
30
40
50
60
PPT “B” measured
PPT “E” measured
PPT “E” simulated
PPT “B” simulated
PPT “D” measured
PPT “D” simulated

36 Construction Industry Council
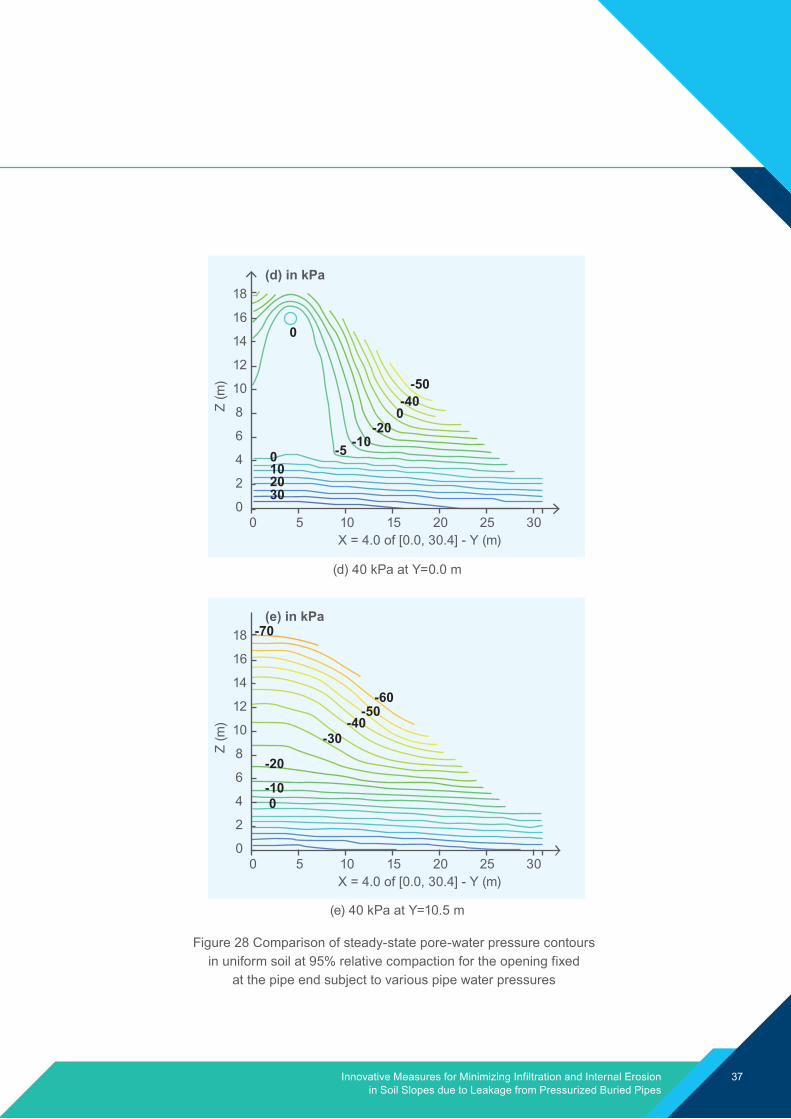
3.4.2. Influence of pipe pressure
Figure 28(a)-(c) show the pore-water pressure distributions along the longitudinal direction for the three pipe pressure cases, while Figure 28(d)-(e) present the contours at a pipe pressure of 40kPa over two slope sections at two pipe ends (i.e., Y=0.0 m and Y=10.5 m). Soil suction decreases as the leaked water infiltrates into the soil. The magnitude of reduction in suction is dependent on the pressure applied to the leaking hole. It is evident that the closer to the leaking hole, the higher the hydraulic gradient can be induced. This observation is shown by the dense contour lines towards the leaking hole in Figure 28. For the applied pipe pressures of 1kPa and 5kPa, the soaked zone, which is fully saturated with positive pore-water pressures, is very small. The elevation of groundwater level is insignificant. It is attributed to the small difference of the pipe pressures within the same order which is not large enough to alter the groundwater table. As pipe pressure is increased to 40kPa, the soaked zone extends downward to about 1m below the pipe, which can be seen from the contour of zero pore-water pressure in both the cross-section of X=4.0 m cut through the pipe (Figure 28(c)) and the section of Y=0.0 m cut over the slope (Figure 28(d)). The greater the pipe pressure is, the more mounded the groundwater table will be.
(a) 1 kPa
Z (m
)
X = 4.0 of [0.0, 30.4] - Y (m)0
0
8
12
16
2
4
(a) in kPa
18
14
10
6
2
4 6 8 10
01020
-75-65
-55-50-45
-40-35
-30-25
-20-15
-10-5
(c) 40 kPa
Z (m
)
X = 4.0 of [0.0, 30.4] - Y (m)0
0
8
12
16
2
4
(c) in kPa
18
14
10
6
2
4 6 8 10
01020
-60-50-45-40-35
-30-25
-20-15
-10-5
40
-70
Z (m
)
X = 4.0 of [0.0, 30.4] - Y (m)0
0
8
12
16
2
4
(b) in kPa
18
14
10
6
2
4 6 8 10
-75-65
01020
-55-50-45
-40-35
-30-25
-20-15
-10-5
(b) 5 kPa
Figure 28 Comparison of steady-state pore-water pressure contours in uniform soil at 95% relative compaction for the opening fixed
at the pipe end subject to various pipe water pressures
37Innovative Measures for Minimizing Infiltration and Internal Erosion in Soil Slopes due to Leakage from Pressurized Buried Pipes
-50-40
20
-20-10-50
10
0
30
0
Z (m
)
X = 4.0 of [0.0, 30.4] - Y (m)0
0
8
12
16
5
4
(d) in kPa18
14
10
6
2
10 15 20 25 30
Figure 28 Comparison of steady-state pore-water pressure contours in uniform soil at 95% relative compaction for the opening fixed
at the pipe end subject to various pipe water pressures
(d) 40 kPa at Y=0.0 m
(e) 40 kPa at Y=10.5 m
Z (m
)
X = 4.0 of [0.0, 30.4] - Y (m)0
0
8
12
16
5
4
(e) in kPa18
14
10
6
2
10 15 20 25
0-10
-20
-70
-30
30
-40-50
-60

38 Construction Industry Council
3.5 Results of Two-Dimensional Numerical Simulations3.5.1. Advance of wetting front affected by separation distance and soil permeability
Figure 29 illustrates the role of separation distance in modifying the wetting front considering ks=2x10⁻⁵ m/s. The advance of the wetting front occurs as a transient process with the continuous supply of leaked water until approaching the steady-state. When the separation distance becomes larger, the wetting front just above the pipe crown tends to reach the top ground surface. The nearer the pipe is installed to the slope, the faster the wetting process advances. At a certain time step, the slope will become unstable, represented by a factor of safety (Fs) less than unity, due to the dissipation of soil suction and the increase of overburden soil weight caused by the leaked water. The observation shows that the slope fails earlier when pipe is placed at a closer distance to the crest. The time lag depends on site-specific conditions such as the boundary conditions, boundary extent, soil hydraulic and mechanical parameters and the pipe pressure. Since the onset of slope instability varies with time, in addition to a separation distance, the time required to detect the leakage is found to be a major factor for minimizing the consequences of slope failure due to pipe leakage. Timely detection and maintenance of the leaking pipe can minimize risks to the nearby residents and facilities. With the same conditions applied to the soil slope at 95% relative compaction (ks=1x10⁻⁶ m/s), the development of the wetting front in Figure 30 is substantially slower than that in the case of 85% relative compaction in Figure 29. The time required to approach the steady-state condition exceeds 90 days. The magnitude of permeability does not affect the steady-state phreatic level but indeed drastically affects the rate of advance of the wetting front. The separation distance does affect the pattern of the pore-water pressure distribution.

39Innovative Measures for Minimizing Infiltration and Internal Erosion in Soil Slopes due to Leakage from Pressurized Buried Pipes
(a) s=2 m
Elev
atio
n (m
)
Distance (m)-4
0
8
12
16
20
-2 0 2
4
18
14
10
6
2
4 6 8 10 12 14 16 18 20 22 24 26 28 30 32
Assumed initial groundwater table
(a)
6h
steady-state12h
4d
8d12d
11d
22d, 12h18h1d
(b) s=4 m
Elev
atio
n (m
)
Distance (m)-4
0
8
12
16
20
-2 0 2
4
18
14
10
6
2
4 6 8 10 12 14 16 18 20 22 24 26 28 30 32
Assumed initial groundwater table
(b)
6hsteady-state12h
4d
8d12d
11d, 6h
22d, 6h18h1d
Phreatic level at failure when Fs falls just below 1.0Figure 29 Advance of wetting front under transient state and the wetting front when
the slope becomes unstable (Fs<1) for soil slopes with ks=2x10⁻⁵ m/s and different pipe separation distances

40 Construction Industry Council
Phreatic level at failure when Fs falls just below 1.0
(c) s=6 m
Elev
atio
n (m
)
Distance (m)-4
0
8
12
16
20
-2 0 2
4
18
14
10
6
2
4 6 8 10 12 14 16 18 20 22 24 26 28 30 32
Assumed initial groundwater table
(c)
6h
steady-state12h
4d
8d12d
11d, 12h
20d18h1d
(d) s=8 m
Elev
atio
n (m
)
Distance (m)-4
0
8
12
16
20
-2 0 2
4
18
14
10
6
2
4 6 8 10 12 14 16 18 20 22 24 26 28 30 32
Assumed initial groundwater table
(d)
6h
steady-state12h
4d
8d12d
19.6h18h1d
Figure 29 Advance of wetting front under transient state and the wetting front when the slope becomes unstable (Fs<1) for soil slopes with ks=2x10⁻⁵ m/s and
different pipe separation distances

41Innovative Measures for Minimizing Infiltration and Internal Erosion in Soil Slopes due to Leakage from Pressurized Buried Pipes
Elev
atio
n (m
)
Distance (m)-4
0
8
12
16
20
-2 0 2
4
18
14
10
6
2
4 6 8 10 12 14 16 18 20 22 24 26 28 30 32
Assumed initial groundwater table
(a)
steady-state
Elev
atio
n (m
)
Distance (m)-4
0
8
12
16
20
-2 0 2
4
18
14
10
6
2
4 6 8 10 12 14 16 18 20 22 24 26 28 30 32
Assumed initial groundwater table
(b)
10d
steady-state
20d
80d
90d60d
60d
Figure 30 Advance of wetting front under transient state for soil slopes with ks=1x10⁻⁶ m/s and different pipe separation distances
10d
20d
80d
90d60d
60d

42 Construction Industry Council
Elev
atio
n (m
)
Distance (m)-4
0
8
12
16
20
-2 0 2
4
18
14
10
6
2
4 6 8 10 12 14 16 18 20 22 24 26 28 30 32
Assumed initial groundwater table
(d)
10d
steady-state
20d
80d
90d
60d
Figure 30 Advance of wetting front under transient state for soil slopes with ks=1x10⁻⁶ m/s and different pipe separation distances
Elev
atio
n (m
)
Distance (m)-4
0
8
12
16
20
-2 0 2
4
18
14
10
6
2
4 6 8 10 12 14 16 18 20 22 24 26 28 30 32
Assumed initial groundwater table
(c)
steady-state10d
20d
80d
90d60d
60d

Innovative Measures for Minimizing Infiltration and Internal Erosion in Soil Slopes due to Leakage from Pressurized Buried Pipes
43
3.5.2. Safe separation distance for soil slope design
The factors of safety of slopes with different separation distances and infiltration times subject to a leakage pressure of 40kPa are shown in Figure 31. The variations of Fs indicate that a pipe routed nearer to the slope crest can rapidly induce slope instability, and Fs is more sensitive to the leakage time. The steady state is obviously the most unfavourable condition, which is associated with the lowest Fs due to the largest degree of saturation within the slope. The slope in the soil at 95% relative compaction shows a much slower advance of the wetting front compared to the 85% relative compaction. For instance, for a separation distance of 40 m, the slope requires approximately two months to approach the steady state for RC=85% while the slope compacted at RC=95% needs approximately 30 months to approach the final steady state. Without any due care given to the pipe leakage under the pressure of 40kPa, the strict safe separation distance is approximately 43 m (2.9H) for RC=85% and 30 m (2.0 H) for RC=95%, beyond which the factor of safety is above 1.0 irrespective of how long the leakage has occurred. Within the strict safe distance, whether the slope is stable or not depends on when the leakage is detected and rectified. If the leakage is detected promptly and the pipe is remediated before the slope becomes unstable, the slope may be considered safe within such a separation distance. For a safe design, a safe separation distance of twice the slope height for RC=95% or nearly three times the slope height for RC=85% is necessary. Depending on available techniques and capabilities of engineers in detecting the pipe leakage, a shorter distance than the strict safe distance may be adopted. As mentioned earlier, a minimal distance not nearer to the slope crest than a distance equal to the vertical slope height is stipulated for pipe laying in accordance with the existing geotechnical practice (GEO 1984). This recommendation is conditional on the ability to timely detect and repair any pipe leakage. It is important to note that Figure 31 is produced for a particular geometry of slope in CDG with typical values of soil properties. The charts may be different when the soil parameters and slope geometry are changed, while similar trends can be worked out with site-specific conditions. Moreover, the slope factor of safety will decrease with increasing pipe pressure and the corresponding strict safe distance will be longer.

44 Construction Industry Council
Slope crest
initial30d60d90d
15d45d75dSteady state
80 60 20 040
Fact
or o
f saf
ety,
Fs
Separation distance, s(m)10100
0.4
0.6
0.8
1.0
1.2
1.4
50 40 20 030 10 6 2
Slope crest
initial6 months12 months36 months
3 months9 months24 monthsSteady state
Fact
or o
f saf
ety,
Fs
Separation distance, s(m)60
0.4
0.6
0.8
1.0
1.2
1.4
(a) slope soil at 85% relative compaction, ks = 2x10⁻⁵ m/s
(b) slope soil at 95% relative compaction, ks = 1x10⁻⁶ m/s.Figure 31 Variations of slope factor of safety with separation distance and
infiltration time when subject to a leakage pressure of 40 kPa:

Innovative Measures for Minimizing Infiltration and Internal Erosion in Soil Slopes due to Leakage from Pressurized Buried Pipes
45
4RECOMMENDATIONS
Through the comprehensive research presented in this report, the performance of four proposed new mainlaying schemes is evaluated via advanced centrifuge model tests, 1g laboratory pressure tests, advanced triaxial internal erosion tests, and numerical modelling. The safety distance for a buried pipe in 95% and 85% RC CDG soil is studied though 3D numerical analysis. Recommendations are given here for the industry to design the routing of buried pipes. If there are difficulties to bury the pipe in accordance with the safety distance, such as tight space, occupation of other structures, and land ownership etc. protection measures should be provided to the buried pipes in order to mitigate the possible leakage-induced catastrophic consequences. Recommendations for the safety distance and new mainlaying protection schemes are suggested.
4.1 Safety DistanceA safe separation distance of twice the slope height for RC=95% or nearly three times the slope height for RC=85% is recommended. Depending on available techniques and capabilities of engineers in detecting the pipe leakage, a shorter distance than the strict safe distance may be adopted. For example, a minimal distance not nearer to the slope crest than a distance equal to the vertical slope height is stipulated for pipe laying in accordance with the existing geotechnical practice (GEO 1984). The use of a shorter separation distance is conditional on the ability to timely detect and repair any pipe leakage. It should be noted that the safety distance here is designed for particular soil conditions, location of the pipe and designated pipe pressure. The actual safety distance can vary when these factors are changed.
4.2 Proposed Mainlaying SchemesIn comparison with the safety distance, applying protection measures to the buried pipe during the mainlaying stage enables higher flexibility of the routing, as well as less susceptibility to the in-situ soil properties. The applicability of the proposed mainlaying schemes are summarized in Table 7. Apart from the geotextile enclosure scheme, the rest of the proposed protection measures (e.g., the geomembrane enclosure scheme; the sheathed pipe scheme; and the sleeved pipe scheme) are capable of reducing the infiltration of leak water into the soil slope. Thus, they can reduce the risk of leakage-induced landslides. Details of the applicability of each protection measure and their recommended working situations are given in this section.

46 Construction Industry Council
Table 7 Summary of suitability of the four suggested new protection measures
Proposed protection measures Flat-ground SlopeCurrent Hong Kong practice X (Frequent surface X (Slope failure(wide trench, slot, pointing rupture/erosion) sometimes)horizontally to the sloping surface)
Current Hong Kong practice X (Frequent surface � (Reduced chance(narrow trench, hole, pointing rupture/erosion) of slope failure)horizontally)
Current Hong Kong practice X (Frequent surface � (Reduced chance(narrow trench, hole, pointing rupture/erosion) of slope failure)upward)
Geotextile enclosure � (Effectively prevent X (Slope failure may surface rupture/erosion) occur)
Geomembrane enclosure � (Effectively prevent � (Effectively prevent surface rupture/erosion) slope failure when sealed properly)
Sheathed pipeline � (Effectively prevent � (Effectively prevent surface rupture/erosion) slope failure when sealed properly)
Sleeved pipeline Equivalent to Equivalent to geomembrane enclosure geomembrane enclosure

Innovative Measures for Minimizing Infiltration and Internal Erosion in Soil Slopes due to Leakage from Pressurized Buried Pipes
47
4.2.1. Geomembrane enclosure scheme
The geomembrane enclosure scheme is recommended for pipes buried in slopes. The geomembrane enclosure can effectively cut off the infiltration of leak water into the surrounding soils. Furthermore, the gravel around the pipes can dissipate the energy of the leak water. The fluid energy can then be decreased such that both the damage to the geomembrane and the amount of leaking rate can be minimised. The construction is simple, only few more steps and materials are required upon the current mainlaying practice. After trenching, a layer of composite geomembrane (geomembrane covered with geotextile on its both sides) is laid on the trench surface. A layer of gravel is placed first at the bottom (on top of the geomembrane) prior to laying the pipe. When the pipe is located, the space between the trench and the pipe will be filled up with gravel again, until the desire level is reached. Finally, the geomembrane should be “closed” by thermal seaming. At suitable spacing, manholes or other water collection systems should be installed for discharging the leak water in the geomembrane enclosure, if any. Thereafter, the trench will be filled up with CDG soil and compacted to 95% relative compaction until the existing ground level is achieved. This protection measure is a flexible and close system. No seepage water can enter the vicinity of the buried pipe from the surrounding soils, and vice versa. It in turn protects the buried pipe from suffering corrosion or chemical attack. Changes in pipe direction are simple. At the point of turning, two sets of geomembrane enclosures with different running directions can be jointed using thermal fusion.
4.2.2. Sleeved pipe scheme
The sleeved pipe scheme is recommended for use in both slopes and urban areas. Sleeved pipe is similar to the geomembrane enclosure scheme in design philosophy. Both of them drain the leak water to some discharge locations while confining the vicinity of the pipe with impermeable materials to minimize water infiltration into the surrounding soils. In contrast to the geomembrane enclosure scheme, a sleeved pipe is a stiff and close system. The steel casing acts as the impermeable confinement to reduce water infiltration into the surrounding soils. In addition to water tightness, the steel casing also serves as a mechanical protection to the pipe since it can take up any stress generated by unexpected soil movements. In urban areas, underground utilities usually undergo severe traffic loads. When the underground space is too small to accommodate gravel, the sleeved pipe scheme becomes more preferable than the geomembrane enclosure scheme. Changing the running direction is also viable by welding two pieces of steel casing at different angles.
4.2.3. Sheathed pipe scheme
Sheathed pipe is applicable in both slopes and urban areas as well. This protection is the simplest among all proposed methods. Its design philosophy is different from the previous two measures. The sheathing cuts off infiltration of the leak water from the beginning. Any leak water will be retained at its original place. No extra work is needed to discharge the leak water, if any. The only additional work is to seal the pipe with a layer of composite geomembrane. This protection measure can also be combined with the geomembrane enclosure or the sleeved pipe to provide more powerful protection, with only few more materials and limited additional work required.
4.2.4. Geotextile enclosure scheme
The geotextile enclosure scheme drains any leaked water in the longitudinal direction through the gravel and prevents the occurrence of pipe bursts when leakage occurs. It is proven to be suitable for pipes buried in horizontal grounds, but not for pipes buried in slope since it does not prevent water infiltration into the slope.

48 Construction Industry Council
4.2.1. Geomembrane enclosure scheme
The geomembrane enclosure scheme is recommended for pipes buried in slopes. The geomembrane enclosure can effectively cut off the infiltration of leak water into the surrounding soils. Furthermore, the gravel around the pipes can dissipate the energy of the leak water. The fluid energy can then be decreased such that both the damage to the geomembrane and the amount of leaking rate can be minimised. The construction is simple, only few more steps and materials are required upon the current mainlaying practice. After trenching, a layer of composite geomembrane (geomembrane covered with geotextile on its both sides) is laid on the trench surface. A layer of gravel is placed first at the bottom (on top of the geomembrane) prior to laying the pipe. When the pipe is located, the space between the trench and the pipe will be filled up with gravel again, until the desire level is reached. Finally, the geomembrane should be “closed” by thermal seaming. At suitable spacing, manholes or other water collection systems should be installed for discharging the leak water in the geomembrane enclosure, if any. Thereafter, the trench will be filled up with CDG soil and compacted to 95% relative compaction until the existing ground level is achieved. This protection measure is a flexible and close system. No seepage water can enter the vicinity of the buried pipe from the surrounding soils, and vice versa. It in turn protects the buried pipe from suffering corrosion or chemical attack. Changes in pipe direction are simple. At the point of turning, two sets of geomembrane enclosures with different running directions can be jointed using thermal fusion.
4.2.2. Sleeved pipe scheme
The sleeved pipe scheme is recommended for use in both slopes and urban areas. Sleeved pipe is similar to the geomembrane enclosure scheme in design philosophy. Both of them drain the leak water to some discharge locations while confining the vicinity of the pipe with impermeable materials to minimize water infiltration into the surrounding soils. In contrast to the geomembrane enclosure scheme, a sleeved pipe is a stiff and close system. The steel casing acts as the impermeable confinement to reduce water infiltration into the surrounding soils. In addition to water tightness, the steel casing also serves as a mechanical protection to the pipe since it can take up any stress generated by unexpected soil movements. In urban areas, underground utilities usually undergo severe traffic loads. When the underground space is too small to accommodate gravel, the sleeved pipe scheme becomes more preferable than the geomembrane enclosure scheme. Changing the running direction is also viable by welding two pieces of steel casing at different angles.
4.2.3. Sheathed pipe scheme
Sheathed pipe is applicable in both slopes and urban areas as well. This protection is the simplest among all proposed methods. Its design philosophy is different from the previous two measures. The sheathing cuts off infiltration of the leak water from the beginning. Any leak water will be retained at its original place. No extra work is needed to discharge the leak water, if any. The only additional work is to seal the pipe with a layer of composite geomembrane. This protection measure can also be combined with the geomembrane enclosure or the sleeved pipe to provide more powerful protection, with only few more materials and limited additional work required.
4.2.4. Geotextile enclosure scheme
The geotextile enclosure scheme drains any leaked water in the longitudinal direction through the gravel and prevents the occurrence of pipe bursts when leakage occurs. It is proven to be suitable for pipes buried in horizontal grounds, but not for pipes buried in slope since it does not prevent water infiltration into the slope.

Innovative Measures for Minimizing Infiltration and Internal Erosion in Soil Slopes due to Leakage from Pressurized Buried Pipes
49
Chang, D.S. and Zhang, L.M. (2011). A stress-controlled erosion apparatus for studying internal erosion in soils. Geotechnical Testing Journal, 34(6): 1–11.
Chang, D.S. and Zhang, L.M. (2013). Extended internal stability criteria for soils under seepage. Soils and Foundations, 53(8): 569-583.
Fredlund, D.G. and Xing, A. (1994). Equations for the soil-water characteristic curve. Canadian Geotechnical Journal, 31(4): 521-532.
Geotechnical Engineering Office (GEO) (1977). Report of the Independent Review Panel on Fill Slopes (GEO Report No. 86). Geotechnical Engineering Office, Hong Kong, 36 p.
Geotechnical Engineering Office (GEO) (1984). Geotechnical Manual for Slopes. Geotechnical Engineering Office, Hong Kong, 302 p.
Hui, T.H.H., Tam, S.M. and Sun, H.W. (2007). Review of Incidents Involving Slopes Affected by Leakage of Water-Carrying Services (GEO Report No. 203). Geotechnical Engineering Office, Hong Kong, 77 p.
Leong, E. C. and Rahardjo, H. (1997). Permeability functions for unsaturated soils. Journal of Geotechnical and Geoenvironmental Engineering, 123(12): 1118-1126.
Morgenstern, N.R. and Geotechnical Engineering Office (GEO) (2000). Report on the Kwun Lung Lau Landslide of 23 July 1994 (GEO Report No. 103). Geotechnical Engineering Office, Hong Kong, 52 p.
Water Supplies Department (WSD) (2012). Manual of Mainlaying Practice. Water Supplies Department, The Government of the Hong Kong SAR.
Wood, D.M. (2007). The magic of sands. Canadian Geotechnical Journal, 44(11): 1329-1350.
5REFERENCES
Yin, J.H. (2009). Influence of relative compaction on the hydraulic conductivity of completely decomposed granite in Hong Kong. Canadian Geotechnical Journal, 46(10): 1229-1235.
Zhang, L.M. and Li, J.H. (2007). Determining the Safe Distance between Ductile Iron Gas Pipes and Sewage Main. Department of Civil and Environmental Engineering, The Hong Kong University of Science and Technology, Hong Kong.
Zhao, H.F. and Zhang, L.M. (2014). Instability of saturated and unsaturated coarse granular soils. Journal of Geotechnical and Geoenvironm


Members of CIC Task Force on ResearchMr. Jimmy TSEProf. Christopher LEUNGIr Joseph MAKProf. James PONGProf. Sze-chun WONGIr Chi-chiu CHANIr Tommy NGMr. Shu-jie PAN
Research TeamProject LeaderProf Limin ZHANGThe Hong Kong University of Science and Technology
Project Team MembersMr Zack CHANMs Laura CHENDr Hong ZHUThe Hong Kong University of Science and Technology
Dr Dongsheng CHANGAECOM Asia Co. Ltd.