Effect of long-duration spaceflight on postural control during self-generated perturbations
Upload
independentCategory
view
0download
0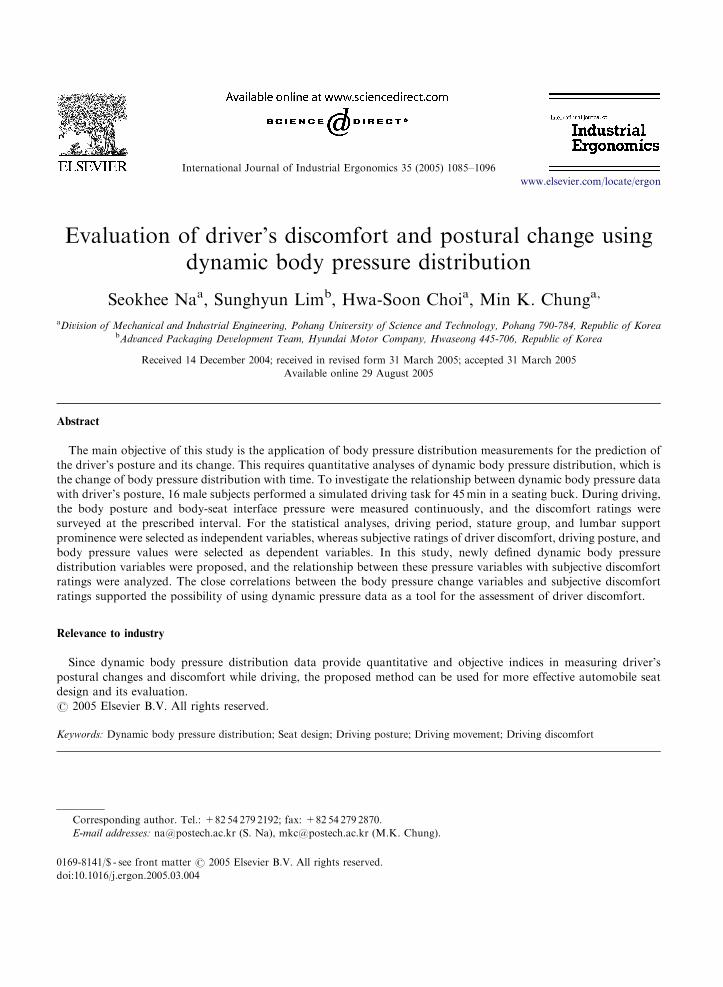
ARTICLE IN PRESS
0169-8141/$ - se
doi:10.1016/j.er
�CorrespondE-mail addr
International Journal of Industrial Ergonomics 35 (2005) 1085–1096
www.elsevier.com/locate/ergon
Evaluation of driver’s discomfort and postural change usingdynamic body pressure distribution
Seokhee Naa, Sunghyun Limb, Hwa-Soon Choia, Min K. Chunga,�
aDivision of Mechanical and Industrial Engineering, Pohang University of Science and Technology, Pohang 790-784, Republic of KoreabAdvanced Packaging Development Team, Hyundai Motor Company, Hwaseong 445-706, Republic of Korea
Received 14 December 2004; received in revised form 31 March 2005; accepted 31 March 2005
Available online 29 August 2005
Abstract
The main objective of this study is the application of body pressure distribution measurements for the prediction of
the driver’s posture and its change. This requires quantitative analyses of dynamic body pressure distribution, which is
the change of body pressure distribution with time. To investigate the relationship between dynamic body pressure data
with driver’s posture, 16 male subjects performed a simulated driving task for 45min in a seating buck. During driving,
the body posture and body-seat interface pressure were measured continuously, and the discomfort ratings were
surveyed at the prescribed interval. For the statistical analyses, driving period, stature group, and lumbar support
prominence were selected as independent variables, whereas subjective ratings of driver discomfort, driving posture, and
body pressure values were selected as dependent variables. In this study, newly defined dynamic body pressure
distribution variables were proposed, and the relationship between these pressure variables with subjective discomfort
ratings were analyzed. The close correlations between the body pressure change variables and subjective discomfort
ratings supported the possibility of using dynamic pressure data as a tool for the assessment of driver discomfort.
Relevance to industry
Since dynamic body pressure distribution data provide quantitative and objective indices in measuring driver’s
postural changes and discomfort while driving, the proposed method can be used for more effective automobile seat
design and its evaluation.
r 2005 Elsevier B.V. All rights reserved.
Keywords: Dynamic body pressure distribution; Seat design; Driving posture; Driving movement; Driving discomfort
e front matter r 2005 Elsevier B.V. All rights reserved.
gon.2005.03.004
ing author. Tel.: +8254 279 2192; fax: +82 54 279 2870.
esses: [email protected] (S. Na), [email protected] (M.K. Chung).

ARTICLE IN PRESS
S. Na et al. / International Journal of Industrial Ergonomics 35 (2005) 1085–10961086
1. Introduction
Drivers’ comfort is as important as the func-tional and aesthetic design of automobiles sinceconsumers are more and more concerned aboutsafety and comfortable driving. Progress in carseat development depends on the ergonomicresearch for seat design and on the assessmentcriteria used to analyze the interactions betweendriver and car (Yamazaki, 1992). One of the mostimportant contributions that ergonomics canprovide to the automobile design process isinformation of the physical size of driver, andhis/her preferred postures (Porter and Gyi, 1998).The objective measures or indices affecting driver’scomfort and related posture are needed toinvestigate (Gyi et al., 1998; Guenaelle, 1995).
Many researchers have been interested indrivers’ preferred postures. Porter and Gyi (1998)conducted an experiment to investigate observedoptimum driving postures and positions andthey developed the guidelines for optimum postur-al comfort. The study of Park et al. (2000)investigated the relationships among Koreandrivers’ body dimensions, their driving posturesand preferred seat adjustments after collect-ing data concerning the preferred driving posturesand adopted seat adjustment levels. Reed et al.(2000) collected data on 68 subjects’ preferreddriving postures in 18 combinations of seatheight, steering wheel position, and seat backangle. Andreoni et al. (2002) used an optoelec-tronic system to capture the driving postures.However, these experiment times were not over15min. It would not be long enough to investigatepostural changes and drivers’ discomfort thathappen often in real driving situations. Hence, inthis study, we investigated drivers’ discomfort andmovement using dynamic body pressure distribu-tions measured for a relatively long time, about45min.
The information of the pressure patterns arevery useful for the design of seats (Andreoni et al.,2002). However, a clear and consistent relation-ship between interface pressure and drivingcomfort was not identified (Gyi and Porter,1999). Lee and Ferraiuolo (1993) evaluated 16car seats with 100 subjects. The author concluded
that the results did not show enough correlationbetween subjective comfort and body pressuredistributions. Andreoni et al. (2002) analyzedsitting posture and interaction of the driver bodypressure with the cushion and the backrest. In thisstudy, postures are measured by motion capturecamera. Koyano et al. (2003) analyzed the staticseating comfort of motorcycle seats using seatedbody pressure distribution data. These studieswere performed in the static situation and used thebody pressure distribution measured only atspecific time. To investigate the pressure patterns,the body pressure distribution at specific timescould provide enough information. However if thebody pressure distributions are analyzed serially, itmight provide more valuable information.Lee et al. (1995) stated that the driver tends to
move more frequently when he/she feels discom-fort in order to adjust the posture and improve thediscomfort situation. Previous studies relating todrivers’ movements used 3D motion cameras andCCTV’s to measure the frequency of posturalchange. However, the application of these methodsin small simulators or real cars is not practical.Therefore Park et al. (2001) limitedly checked themovement of the left leg in a passenger car with theautomatic transmission.The body pressure distribution is sensitive to
movements and is relatively simple to measureeven in a small space. Therefore, this studysuggests the analysis method using serial ordynamic body pressure distribution to investigatethe driver’s movement.The main objectives of this study are (1) to
propose a method for using body pressuredistribution data in order to measure driver’spostural change during driving and (2) to investi-gate the relationships among the dynamic bodypressure distribution and driver’s postural changesand discomfort. For the prediction of drivers’posture and its change using body pressure,dynamic data regarding changes over time in bodypressure distribution and driving posture shouldbe captured and analyzed. In this study, we suggestnew body pressure variables by using the dynamicbody pressure distribution, and investigate therelationship between these variables and changesin driver’s posture.

ARTICLE IN PRESS
S. Na et al. / International Journal of Industrial Ergonomics 35 (2005) 1085–1096 1087
2. Method
2.1. Subjects
Sixteen healthy college students, all paid volun-teers, participated in the experiment. All haddriving experience and none had a history ofmusculoskeletal diseases. All subjects were male tominimize anthropometric differences. Their mean(SD) age, height, weight and driving experiencewere 25.5 (2.6) years, 172.8 (5.4) cm, 72.3 (9.8) kg,and 2.38 (2.4) years, respectively.
2.2. Experimental environment
The experiment was conducted in a seatingbuck. The seat of a mid-size sedan in Koreanautomobile market was used. The actual designparameters of the car’s relationships amongaccelerator heel point(AHP), steering wheel point(SWP) and hip-point (H-Point) were used to makethe seating buck (Fig. 1).
In the seating buck, the well-known high-fidelitygame, Grand Turismo 2 (Polyphony, 1999) wasused on PlayStationtm (Sony, 1998) hardware. Themaximum velocity of the vehicle controlled by thesoftware was 140 km/h. The driving was done on asimulated track course that consisted of twostraight parts and two curved parts.
Fig. 1. Seating buck and driving posture.
The body pressure distribution was measuredusing flexible body pressure mat (FBPM) which iscomposed of two matrices for the seat pan and theseat back (Park et al.,1992). Each matrix contains16� 16 force sensing resistor (FSRs). The bodypressure distributions were measured during theentire driving period and sampled at 32Hz.Before the experiments, a subject took a seat on
which FBPM were fitted, adjusted the seatposition by himself and then practiced driving onthe same track as the main experiment laps formore than 10min. The seat back-angle was fixedbecause the seat back-body pressure was sensitiveto the seat back-angle. The mean trunk–thighangle of Korean male is 115.9 (77.63)1 (Park etal., 2000). The fixed seat back-angel was 1151.In the experiment, subjects drove a simulated
track course consisting of 15 laps of 3min per lap.While driving, the subject’s motions were recordedby the 8mm camcorder (Samsung, SV-L380).
2.3. Independent variables
The independent variables of this experimentwere driving period, stature group, and lumbarsupport prominence. Driving periods had 7 levelsas shown in Table 1: a pre-driving period, 5periods during the driving task, and a post-drivingperiod. The middle of driving period was equiva-lent to the starting time of subjective discomfortratings.Subjects were divided into 2 stature groups at
the 50th percentile of the height data (171.1 cm) ofthe National Anthropometric Survey of Korea(KRISS, 1997) because stature may affect driving
Table 1
Driving period
Period Approximated time (the middle on the
driving period) (min)
Before Before driving
1 1–9 (starting point of 2nd lap)
2 10–18 (starting point of 5th lap)
3 19–27 (starting point of 8th lap)
4 28–36 (starting point of 11th lap)
5 37–45 (starting point of 14th lap)
After After driving

ARTICLE IN PRESS
S. Na et al. / International Journal of Industrial Ergonomics 35 (2005) 1085–10961088
postures. The mean statures were 177.3 cm for thetaller subject group, and 168.3 cm for the shortersubject group.
Lumbar support prominence had 2 levels: 1and3 cm. The driving seat used in the experiment had 4levels of lumber support prominence. The lowestlevel was 1 cm and the highest level was 3 cm.Lumbar support prominence was chosen as anindependent variable to investigate the effect oflumbar support on driving posture and driver’sdiscomfort.
A mixed factor design was adopted for theexperiment. Driving period and lumbar supportprominence were within-subject variables andstature group was a between-subject variable.The experiment was repeated for the sameparticipant for each lumbar support prominencelevel (1 and 3 cm). The lumbar support treatmentwas randomized.
2.4. Dependent variables
Dependent variables were divided into threegroups: subjective discomfort ratings, drivingpostures and body pressure distributions. Subjec-tive discomfort ratings and driving postures weremeasured at each driving period defined in Table 1.At each driving period, subjective discomfortratings were measured on a seven point scale forwhole body discomfort and discomfort of six bodyparts: neck, shoulder, back, lumbar, hip and thigh.
(a) (b
Thoracic Region
Lumbar Region
Seat back
1 12 13 14 25 26 27 28 29 2
10 211 212 213 214 315 316 3
1 2 3 4 5 6 7 8 9 10 11 12 13 14 15 16
Fig. 2. Body press
Reflective markers were attached to acromion,greater trochanter, lateral condyle and lateralmalleolus of each subject for recordings of drivingposture using a camera (Fig. 1). Pictures weretaken right after performing the subject ratings.The camera was located at the right side of theseating buck. Definitions of the postural angles areas follows (See Fig. 1):
�
)
7890123456789012
ure
Knee angle: the angle between the line acrossthe greater trochanter and the lateral condyleand the line across the lateral condyle and thelateral malleolus.
� Hip angle: the angle between the line across theacromion and the greater trochanter and theline across the greater trochanter and the lateralcondyle.
� Trunk angle: the angle between the line acrossthe acromion and the greater trochanter and thevertical line across the greater trochanter.
2.5. The body pressure distribution
The body pressure distributions measured be-fore or after the driving are different from thebody pressure distributions measured during thedriving (Lim et al.,2000). Hence, the body pressuredistribution variables were analyzed only duringdriving (driving period: 1, 2, 3, 4, 5).The 16� 32 body pressure distribution data
matrix was divided as shown in Fig. 2. to define
Buttock Region
Thigh Region
Seat pan
1 2 3 4 5 6 7 8 9 10 11 12 13 14 15 16
division.

ARTICLE IN PRESS
S. Na et al. / International Journal of Industrial Ergonomics 35 (2005) 1085–1096 1089
the body pressure ratio variables. The definitionsof the body pressure ratio variables are shown inTables 2 and 3.
Body pressure change variables came fromdynamic body pressure distribution. The defini-tions of body pressure change variables are shownin Table 4. The difference between the totalpressure of the seat back or the seat pan and thatof the previous measurement was defined as apressure change. Body pressure change variable isthe count of pressure changes that exceeded 15%of the average total pressure of the seat back and5% for the seat pan. These definitions were madefrom the pilot test results that were performed to
Table 2
The variables used in the body pressure ratio variables
Variable Definition
Lum The sum of body pressures in lumbar region
Total The sum of body pressures in seat back and seat pan
Back The sum of body pressures in seat back
Butt The sum of body pressures in buttock region
Pan The sum of body pressures in seat pan
Table 3
Body pressure ratio variables
Ratio variables Defintion
Seat back Lum/total The ratio of Lum to total
Lum/back The ratio of Lum to back
Seat pan Butt/total The ratio of Butt to total
Butt/pan The ratio of Butt to pan
Table 4
Body pressure change variables
Definition
Seat pan The count of pressure changes which
exceeded 15% of the average total pressure
of seat back
Seat back The count of pressure changes which
exceeded 5% of the average total pressure of
seat pan
observe the pressure change when movementsoccurred. Validation of these variables was per-formed with video in this study.Body pressure change variables indicate the
number of subject’s movements. This study con-cerned movement which occurred to preventnumbness or to find a more comfortable position,however, the total body pressures also differed dueto small movements like breathing, moving thesteering wheel or pedal, and so forth. Because ofthis, thresholds were needed. The pilot test wasperformed to determine these thresholds. Thepercentages differ since the body pressure ofthe seat back is more sensitive than that of theseat pan.
3. Results
3.1. Subjective discomfort ratings
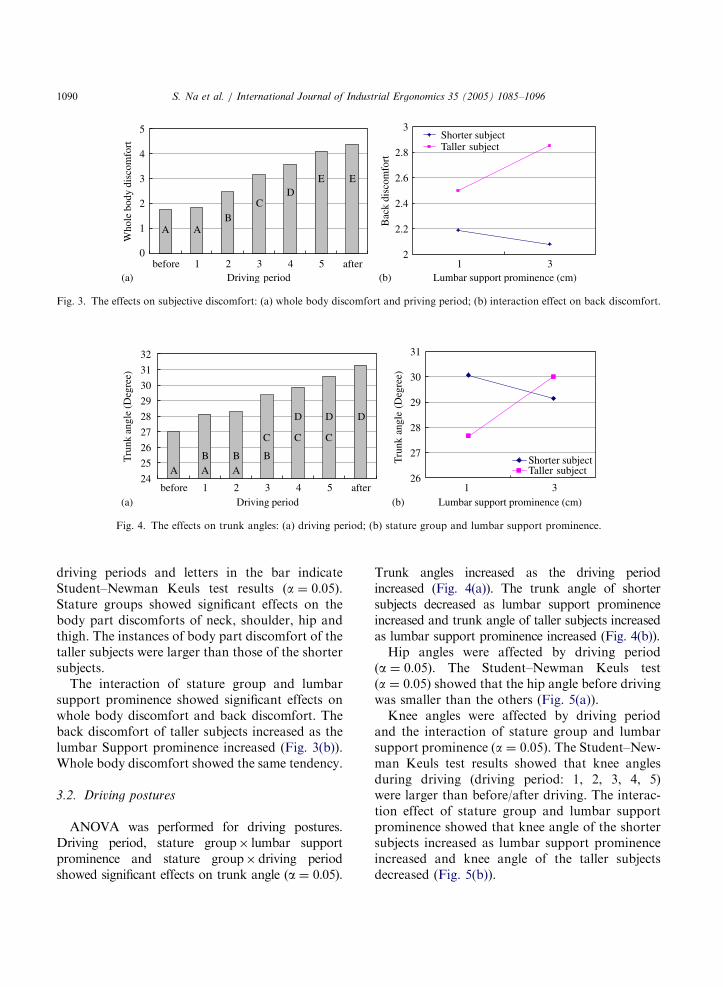
ANOVA analysis was performed for wholebody discomfort and the six body part discom-forts. The summary of ANOVA results aboutsubjective discomfort ratings is shown in Table 5(a ¼ 0:05). Driving period was found to havea systematic effect on all subjective discomforts.All subjective discomfort ratings increased asthe driving period increased. Fig. 3(a) shows thechange of whole body discomfort according to the
Table 5
The summary of ANOVA results about the subjective
discomfort
Subjective
discomfort
Significant effects
Whole body Driving period, stature group� lumbar
support prominence
Neck Driving period, stature group
Shoulder Driving period, stature group
Back Driving period, stature group� lumbar
support prominence
Lumbar Driving period, stature group� driving period
Hip Driving period, stature group, stature
group�driving period
Thigh Driving period, stature group, stature
group�driving period
ARTICLE IN PRESS
0
1
2
3
4
5
before 1 12 3 34 5 afterDriving period
Who
le b
ody
disc
omfo
rt
A AB
CD
E E
2
2.2
2.4
2.6
2.8
3
Lumbar support prominence (cm)
Bac
k di
scom
fort
Shorter subjectTaller subject
(a) (b)
Fig. 3. The effects on subjective discomfort: (a) whole body discomfort and priving period; (b) interaction effect on back discomfort.
1 324
25
26
27
28
29
30
31
32
before 1 2 3 4 5 afterDriving period
Tru
nk a
ngle
(Deg
ree)
AA AB B B
C C C
D D D
26
27
28
29
30
31
Lumbar support prominence (cm)
Tru
nk a
ngle
(D
egre
e)
Shorter subjectTaller subject
(a) (b)
Fig. 4. The effects on trunk angles: (a) driving period; (b) stature group and lumbar support prominence.
S. Na et al. / International Journal of Industrial Ergonomics 35 (2005) 1085–10961090
driving periods and letters in the bar indicateStudent–Newman Keuls test results (a ¼ 0:05).Stature groups showed significant effects on thebody part discomforts of neck, shoulder, hip andthigh. The instances of body part discomfort of thetaller subjects were larger than those of the shortersubjects.
The interaction of stature group and lumbarsupport prominence showed significant effects onwhole body discomfort and back discomfort. Theback discomfort of taller subjects increased as thelumbar Support prominence increased (Fig. 3(b)).Whole body discomfort showed the same tendency.
3.2. Driving postures
ANOVA was performed for driving postures.Driving period, stature group� lumbar supportprominence and stature group� driving periodshowed significant effects on trunk angle (a ¼ 0.05).
Trunk angles increased as the driving periodincreased (Fig. 4(a)). The trunk angle of shortersubjects decreased as lumbar support prominenceincreased and trunk angle of taller subjects increasedas lumbar support prominence increased (Fig. 4(b)).Hip angles were affected by driving period
(a ¼ 0.05). The Student–Newman Keuls test(a ¼ 0:05) showed that the hip angle before drivingwas smaller than the others (Fig. 5(a)).Knee angles were affected by driving period
and the interaction of stature group and lumbarsupport prominence (a ¼ 0:05). The Student–New-man Keuls test results showed that knee anglesduring driving (driving period: 1, 2, 3, 4, 5)were larger than before/after driving. The interac-tion effect of stature group and lumbar supportprominence showed that knee angle of the shortersubjects increased as lumbar support prominenceincreased and knee angle of the taller subjectsdecreased (Fig. 5(b)).

ARTICLE IN PRESS
106107108109110111112113114115
before 1 2 3 4 5 afterDriving period
Hip
Ang
le (
Deg
ree)
A
B BBBBB
116
120
124
128
132
Lumbar support prominence (cm)
Kne
e an
gle
(Deg
ree)
Shorter subjectTaller subject
1 3(a) (b)
Fig. 5. The effects on hip and knee angles: (a) hip angle and driving period; (b) interaction effect on knee angle.
Table 6
The summary of ANOVA results about the body pressure ratio
variables
Body pressure
ratio variables
Significant effects
Lum/total Driving period, lumbar support prominence
Lum/back Driving period, lumbar support prominence,
stature group�driving period
Butt/total Driving period, lumbar support prominence
Butt/pan Driving period, stature group� lumbar
support prominence, stature group�driving
period
S. Na et al. / International Journal of Industrial Ergonomics 35 (2005) 1085–1096 1091
3.3. The body pressure distribution
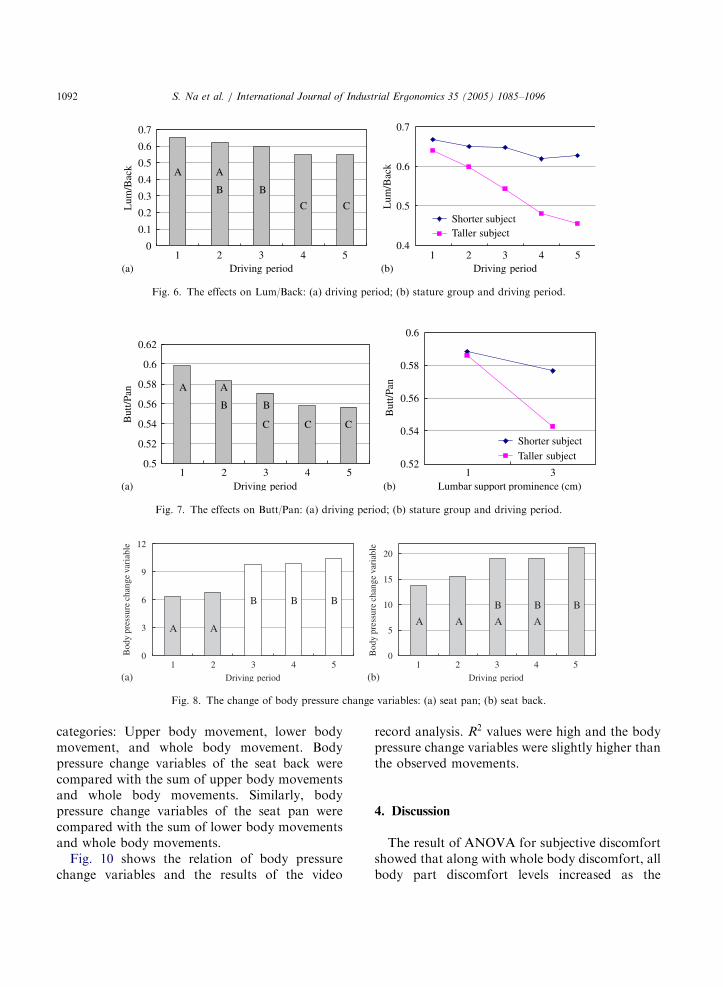
Table 6 shows the summary of ANOVA resultsof the body pressure ratio variables. All bodypressure ratio variables related to the seat backwere affected by driving period and lumbarsupport prominence (a ¼ 0:05). The body pressureof the lumbar region decreased as the drivingperiod increased (Fig. 6(a)). This tendency wascaused by taller subjects rather than shortersubjects (Fig. 6(b)). The body pressure of thelumbar region increased as the lumbar supportprominence increased. The mean body pressureratio of Lum/Back was 0.51 when lumbar supportprominence was 1 cm and 0.63 when lumbarsupport prominence was 3 cm.
All body pressure ratio variables for the seat panwere affected by driving period, and decreased asthe driving period increased (Fig. 7(a)). For tallersubjects, the pressure on the buttock regiondecreased as the lumbar support prominenceincreased (Fig. 7(b)).
The main effects upon the body pressure changevariable on the seat back were found in the drivingperiod and the lumbar support prominence,whereas they did not show any interaction effect(a ¼ 0.05). The Body pressure change variable onthe seat back increased as driving period increased(Fig. 8(a)). When lumbar support prominence was1 cm, the mean of body pressure change variablewas 21.52, while it was 14.01 when lumbar supportprominence was 3 cm.
Driving period and the interaction betweenstature group and lumbar support prominenceshowed significant effects on the body pressure
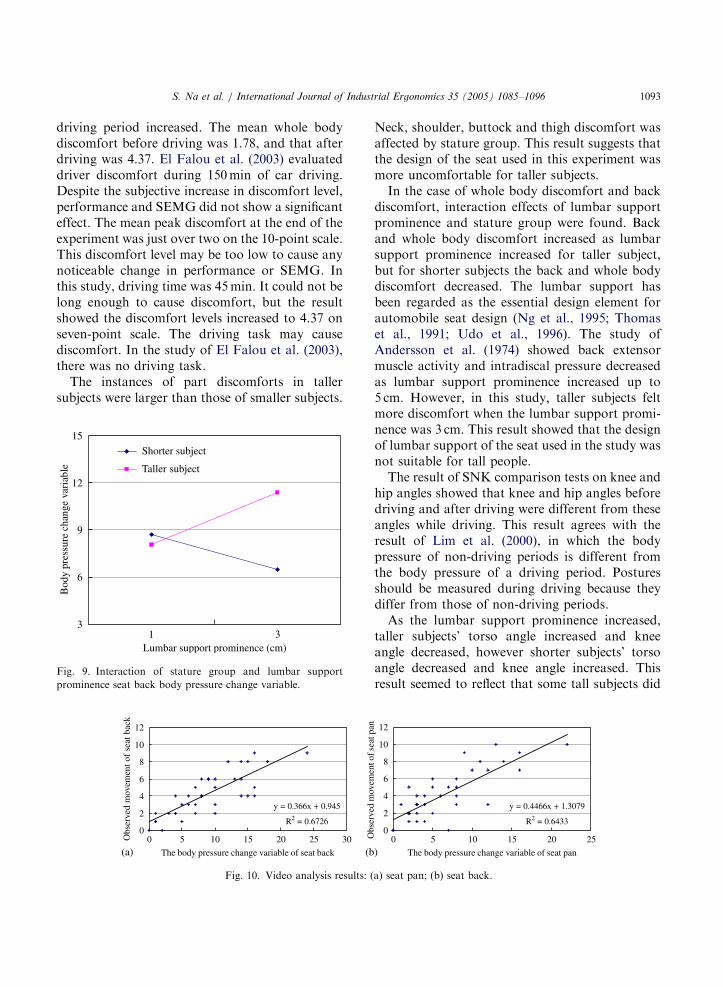
change variable on the seat pan (a ¼ 0:05). As inthe case of the seat back, the body pressure changevariable on the seat pan also increased as drivingperiod increased (Fig. 8(b)). The interaction effectshowed that body pressure change variable in-creased as lumbar support prominence increasedfor the taller subjects. However, the body pressurechange variable for the smaller subjects decreased(Fig. 9).
3.4. Video record analysis
Body pressure change variables are assumed toreflect the subject’s movement. To verify thisassumption, the occurrences of ‘‘recognizablebody movement’’ during driving in the recordedvideo tapes were counted and compared with thebody pressure change variables. Definition of‘‘recognizable movement’’ was a movement thatcould be recognized by human eye through the TVmonitor. The movements were divided in three
ARTICLE IN PRESS
1 2 3 4 5Driving period
1 2 3 4 5Driving period
Shorter subjectTaller subject
0
0.1
0.2
0.3
0.4
0.5
0.6
0.7L
um/B
ack A A
B B
C C
0.4
0.5
0.6
0.7
Lum
/Bac
k
(a) (b)
Fig. 6. The effects on Lum/Back: (a) driving period; (b) stature group and driving period.
0.5
0.62
But
t/Pan A A
B B
C CC
0.52
0.54
0.56
0.58
0.6
0.52
0.54
0.56
0.58
0.6
Lumbar support prominence (cm)
But
t/Pan
Shorter subject
Taller subject
1 2 3 4 5Driving period
1 3(a) (b)
Fig. 7. The effects on Butt/Pan: (a) driving period; (b) stature group and driving period.
0
3
6
9
12
Bod
y pr
essu
re c
hang
e va
riab
le
A A
B BB
0
5
10
15
20
Bod
y pr
essu
re c
hang
e va
riab
le
A AAA
B BB
1 2 3 4 5
Driving period(a)1 2 3 4 5
Driving period(b)
Fig. 8. The change of body pressure change variables: (a) seat pan; (b) seat back.
S. Na et al. / International Journal of Industrial Ergonomics 35 (2005) 1085–10961092
categories: Upper body movement, lower bodymovement, and whole body movement. Bodypressure change variables of the seat back werecompared with the sum of upper body movementsand whole body movements. Similarly, bodypressure change variables of the seat pan werecompared with the sum of lower body movementsand whole body movements.
Fig. 10 shows the relation of body pressurechange variables and the results of the video
record analysis. R2 values were high and the bodypressure change variables were slightly higher thanthe observed movements.
4. Discussion
The result of ANOVA for subjective discomfortshowed that along with whole body discomfort, allbody part discomfort levels increased as the
ARTICLE IN PRESS
S. Na et al. / International Journal of Industrial Ergonomics 35 (2005) 1085–1096 1093
driving period increased. The mean whole bodydiscomfort before driving was 1.78, and that afterdriving was 4.37. El Falou et al. (2003) evaluateddriver discomfort during 150min of car driving.Despite the subjective increase in discomfort level,performance and SEMG did not show a significanteffect. The mean peak discomfort at the end of theexperiment was just over two on the 10-point scale.This discomfort level may be too low to cause anynoticeable change in performance or SEMG. Inthis study, driving time was 45min. It could not belong enough to cause discomfort, but the resultshowed the discomfort levels increased to 4.37 onseven-point scale. The driving task may causediscomfort. In the study of El Falou et al. (2003),there was no driving task.
The instances of part discomforts in tallersubjects were larger than those of smaller subjects.
331
6
9
12
15
Lumbar support prominence (cm)
Bod
y pr
essu
re c
hang
e va
riab
le
Shorter subject
Taller subject
Fig. 9. Interaction of stature group and lumbar support
prominence seat back body pressure change variable.
y = 0.366x + 0.945
R2 = 0.67260
2
4
6
8
10
12
0 5 10 15 20 25 30
The body pressure change variable of seat back
Obs
erve
d m
ovem
ent o
f se
at b
ack
(a) (b
Fig. 10. Video analysis results: (
Neck, shoulder, buttock and thigh discomfort wasaffected by stature group. This result suggests thatthe design of the seat used in this experiment wasmore uncomfortable for taller subjects.In the case of whole body discomfort and back
discomfort, interaction effects of lumbar supportprominence and stature group were found. Backand whole body discomfort increased as lumbarsupport prominence increased for taller subject,but for shorter subjects the back and whole bodydiscomfort decreased. The lumbar support hasbeen regarded as the essential design element forautomobile seat design (Ng et al., 1995; Thomaset al., 1991; Udo et al., 1996). The study ofAndersson et al. (1974) showed back extensormuscle activity and intradiscal pressure decreasedas lumbar support prominence increased up to5 cm. However, in this study, taller subjects feltmore discomfort when the lumbar support promi-nence was 3 cm. This result showed that the designof lumbar support of the seat used in the study wasnot suitable for tall people.The result of SNK comparison tests on knee and
hip angles showed that knee and hip angles beforedriving and after driving were different from theseangles while driving. This result agrees with theresult of Lim et al. (2000), in which the bodypressure of non-driving periods is different fromthe body pressure of a driving period. Posturesshould be measured during driving because theydiffer from those of non-driving periods.As the lumbar support prominence increased,
taller subjects’ torso angle increased and kneeangle decreased, however shorter subjects’ torsoangle decreased and knee angle increased. Thisresult seemed to reflect that some tall subjects did
y = 0.4466x + 1.3079
R2 = 0.64330
2
4
6
8
10
12
0 5 10 15 20 25
The body pressure change variable of seat pan
Obs
erve
d m
ovem
ent o
f sea
t pan
)
a) seat pan; (b) seat back.
ARTICLE IN PRESS
Fig. 12. The change of driving posture: (a) driving period 1; (b)
driving period 3; (c) driving period 5.
51 2 3
10
15
20
25
4 5Driving period
Bod
y pr
essu
re c
hang
e va
riab
le
-1
1
3
5
7
Who
le b
ody
disc
omfo
rtSeat pan
Seat back
Whole body discomfort
Fig. 13. The relation of the body pressure change variables and
whole body discomfort.
S. Na et al. / International Journal of Industrial Ergonomics 35 (2005) 1085–10961094
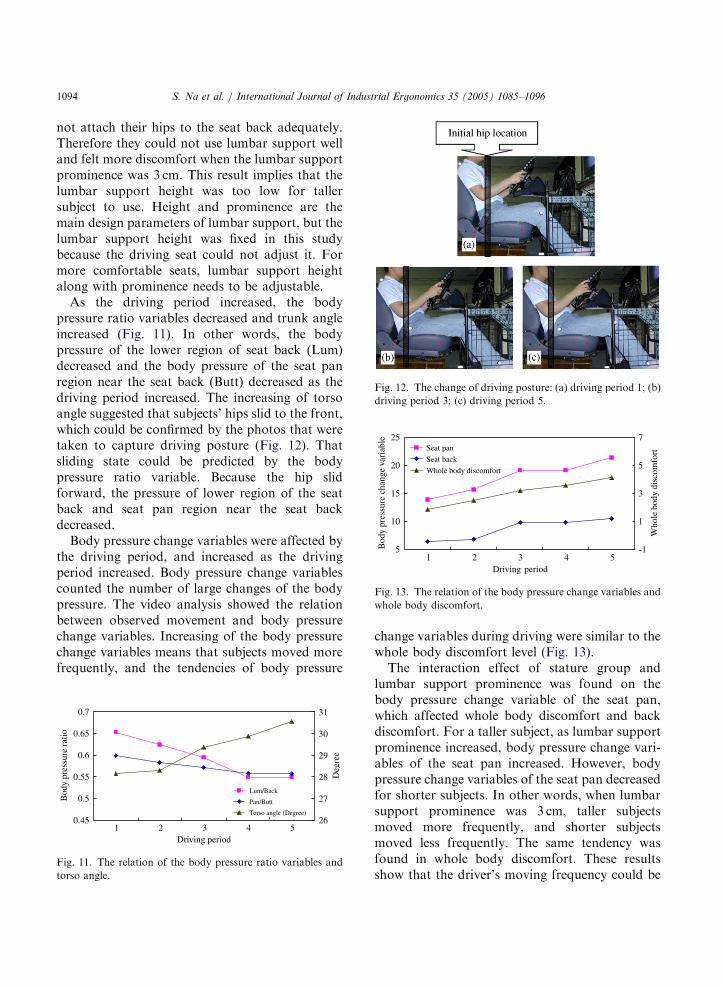
not attach their hips to the seat back adequately.Therefore they could not use lumbar support welland felt more discomfort when the lumbar supportprominence was 3 cm. This result implies that thelumbar support height was too low for tallersubject to use. Height and prominence are themain design parameters of lumbar support, but thelumbar support height was fixed in this studybecause the driving seat could not adjust it. Formore comfortable seats, lumbar support heightalong with prominence needs to be adjustable.
As the driving period increased, the bodypressure ratio variables decreased and trunk angleincreased (Fig. 11). In other words, the bodypressure of the lower region of seat back (Lum)decreased and the body pressure of the seat panregion near the seat back (Butt) decreased as thedriving period increased. The increasing of torsoangle suggested that subjects’ hips slid to the front,which could be confirmed by the photos that weretaken to capture driving posture (Fig. 12). Thatsliding state could be predicted by the bodypressure ratio variable. Because the hip slidforward, the pressure of lower region of the seatback and seat pan region near the seat backdecreased.
Body pressure change variables were affected bythe driving period, and increased as the drivingperiod increased. Body pressure change variablescounted the number of large changes of the bodypressure. The video analysis showed the relationbetween observed movement and body pressurechange variables. Increasing of the body pressurechange variables means that subjects moved morefrequently, and the tendencies of body pressure
0.45
0.5
0.55
0.6
0.65
0.7
1 3 4 5Driving period
Bod
y pr
essu
re r
atio
26
27
28
29
30
31
Deg
ree
Lum/Back
Pan/Butt
Torso angle (Degree)
2
Fig. 11. The relation of the body pressure ratio variables and
torso angle.
change variables during driving were similar to thewhole body discomfort level (Fig. 13).The interaction effect of stature group and
lumbar support prominence was found on thebody pressure change variable of the seat pan,which affected whole body discomfort and backdiscomfort. For a taller subject, as lumbar supportprominence increased, body pressure change vari-ables of the seat pan increased. However, bodypressure change variables of the seat pan decreasedfor shorter subjects. In other words, when lumbarsupport prominence was 3 cm, taller subjectsmoved more frequently, and shorter subjectsmoved less frequently. The same tendency wasfound in whole body discomfort. These resultsshow that the driver’s moving frequency could be

ARTICLE IN PRESS
S. Na et al. / International Journal of Industrial Ergonomics 35 (2005) 1085–1096 1095
used as a quantitative and objective measure toevaluate the driver’s discomfort. Furthermore, thedynamic body pressure distribution could be usedas a tool that predicts the driver’s movementfrequency.
Previously, body pressure distribution has beenrecorded as a static measure. In this study, thedynamic body pressure distribution was definedand analyzed. This study showed the possibility ofusing the body pressure distribution dynamicallyand its utility as a tool that can evaluate driver’sdiscomfort.
The experiment was performed in simulateddriving situations. For a precise and accuratestudy, the experiments should be performed in areal vehicle on real roads. The body pressure ratiovariable may show similar results by measuring theaverage value of several data. However bodypressure change variables could very likely beaffected by vibrations.
5. Conclusion
The objective of this study was the applicationof body pressure distribution data for the predic-tion of the driver’s posture and its change. Wesuggested new body pressure variables, to whichthe dynamic body pressure distribution wasapplied, and investigated their relationship to thedriver’s posture and its change. body pressurechange variables and subjective discomfort ratingswere found to increase as the driving periodincreased. The driver tends to move more fre-quently when he/she feels discomfort. The fre-quency of the movement of subjects could beestimated with the suggested body pressure changevariables. As the driving period increased, wholebody discomfort as well as the body pressurechange variable increased. This study supports theusefulness of body pressure distribution fordiscomfort evaluation.
The body pressure ratio variables were used toevaluate the driving posture. As the driving periodincreased, Lum/Back and Butt/Pan decreased andtorso angle increased. Increasing of torso angleleads to decreasing the pressure on the buttockregion and the lumbar region. The body pressure
ratio variables were influenced by driving postures.Hence, with the body pressure ratio variables, wecould evaluate the driving posture. In a realdriving situation, the evaluation of the drivingposture is difficult with CCTV or motion analysissystems. However body pressure distributioncould be used in actual driving situations.In this study, the change of total body pressure
on the seat pan and seat back were analyzed. Infuture studies, intensive and manifold analyses ofdynamic body pressure distributions are needed inreal driving situations.
References
Andersson, G.B.J., Ortengren, R., Nachemson, A., Elfstrom,
G., 1974. Lumbar disc pressure and myoelectric back
muscle activity during sitting. IV. Studies on a car driver’s
seat. Scandinavian Journal of Rehabilitation Medicine 6 (3),
122–127.
Andreoni, G., Santambrogio, G.C., Rabuffetti, M., Pedotti, A.,
2002. Method for the analysis of posture and interface
pressure of car drivers. Applied Ergonomics 33, 511–522.
El Falou, W., Duchene, J., Grabisch, M., Hewson, D.,
Langeron, Y., Lino, F., 2003. Evaluation of driver
discomfort during long-duration car driving. Applied
Ergonomics 34 (3), 249–255.
Gyi, D.E., Porter, J.M., 1999. Interface pressure and the
prediction of car seat discomfort. Applied Ergonomics 30,
99–107.
Gyi, D.E., Porter, J.M., Robertson, N.K., 1998. Seat pressure
measurement technologies: considerations for their evalua-
tion. Applied Ergonomcis 27, 85–91.
Guenaelle, P., 1995. One methodology to evaluate automotive
seat comfort. In: Proceedings of the Third International
Conference on Vehicle Comfort and Ergonomics, Bologna,
Italy, pp. 231–240.
Korea Research Institute of Standards and Science (KRISS),
1997. National Anthropomentic Survey of Korea 1997,
Report No. KRISS-97-114-IR.
Koyano, M., Kimishima, T., Nakayama, K., 2003. Quantifica-
tion of static seating comfort of motorcycle seats. JSAE
Review 24, 99–104.
Lee, J., Ferraiuolo, P., 1993. Seat comfort. SAE Technical
Paper no. 930105.
Lee, J., Grohs, T., Milosic, M., 1995. Evaluation of Objective
Measurement Techniques for Automotive Seat Comfort.
SAE Technical Paper no. 950142.
Lim, S., Chung, M. K., Jung, J. W., Na, S. H., 2000. The Effect
of Lumbar Support Prominence on Driver’s Comfort and
Body Pressure Distribution. In: Proceedings of the con-
ference of IEA 2000/HFES 2000, July, San Diego, USA.
Ng, D., Cassar, T., Gross, C.M., 1995. Evaluation of an
intelligent seat system. Applied Ergonomics 26, 109–116.
ARTICLE IN PRESS
S. Na et al. / International Journal of Industrial Ergonomics 35 (2005) 1085–10961096
Park, S.J., Lee, N.S., Kim, C.J., Lee, S.Y., 1992. Development
of FBPM for pressure distribution measurement. In:
Proceedings of the 1992 Spring Conference of Ergonomics
Society of Korea, pp. 187–192.
Park, S.J., Min, B.C., Lee, J.K., Kang, E.S., 2001. Development
of the Evaluating System for Ride Comfort and Fatigue in
Vehicle. SAE. Technical Paper no. 2001-01-0388.
Park, S.J., Kim, C., Kim, C.J., Lee, J.W., 2000. Comfortable
driving postures for Koreans. International Journal of
Industrial Ergonomics 26, 489–497.
Polyphony, 1999. Polyphony homepages, [on-line]. Available
http://www.polyphony.co.jp/.
Porter, J.M., Gyi, D.E., 1998. Exploring the optimum posture
for driver comfort. International Journal of Vehicle Design
19 (3), 255–266.
Reed, M.P., Manary, M.A., Flannagan, A.C., Schneider, W.S.,
2000. Effects of vehicle interior geiometry and anthropo-
metric variables on automobile driving posture. Human
Factors 42 (4), 541–552.
SONY, 1998. Sony PlayStation Homepages. [on-line]. Avail-
able http://us.playstation.com/hardware.
Thomas, R.E., Congleton, J.J., Huchingson, R.D., Whiteley,
J.R., Rodrigues, C.C., 1991. An investigation of re-
lationships between driver comfort, performance and
automobile seat type during short term driving
tasks. International Journal of Industrial Ergonomics 8,
103–114.
Udo, H., Tajima, T., Uda, S., Yoshinaga, F., Ishihara, E.,
Yamamoto, Y., Hiura, N., Kataoka, A., Nakai, K., Umino,
H., 1996. Study on low back load of car driver’s seat.
Advanced in Occupational Ergonomics and Safety 2,
852–857.
Yamazaki, N., 1992. Analysis of sitting comfortability of
driver’s seat by contact shape. Ergonomics 35, 677–692.
Copyright © 2022 FDOKUMEN