Effect on Discomfort of Frequency of Wrist Exertions ... - CORE
50
Effect on Discomfort of Frequency of Wrist Exertions Combined with Wrist Articulations and Forearm Rotation ABID ALI KHAN† Tel: +91 571 2700920 ext 1861 Fax: +91 571 2721375 Email: [email protected] †Ergonomics Laboratory, Department of Mechanical Engineering, Aligarh Muslim University, Aligarh, UP, India LEONARD O’SULLIVAN‡* Tel: +353 61 234249 Fax: +353 61 202913 Email: [email protected] TIMOTHY J. GALLWEY‡ Tel and Fax: Same as Leonard O’Sullivan Email: [email protected] ‡Ergonomics Research Centre, Department of Manufacturing & Operations Engineering, University of Limerick, Limerick, Ireland brought to you by CORE View metadata, citation and similar papers at core.ac.uk provided by University of Limerick Institutional Repository
-
Upload
khangminh22 -
Category
Documents
-
view
5 -
download
0
Transcript of Effect on Discomfort of Frequency of Wrist Exertions ... - CORE

Effect on Discomfort of Frequency of Wrist Exertions
Combined with Wrist Articulations and Forearm Rotation
ABID ALI KHAN†
Tel: +91 571 2700920 ext 1861
Fax: +91 571 2721375
Email: [email protected]
†Ergonomics Laboratory, Department of Mechanical Engineering,
Aligarh Muslim University, Aligarh, UP, India
LEONARD O’SULLIVAN‡*
Tel: +353 61 234249
Fax: +353 61 202913
Email: [email protected]
TIMOTHY J. GALLWEY‡
Tel and Fax: Same as Leonard O’Sullivan
Email: [email protected]
‡Ergonomics Research Centre, Department of Manufacturing & Operations Engineering,
University of Limerick, Limerick, Ireland
brought to you by COREView metadata, citation and similar papers at core.ac.uk
provided by University of Limerick Institutional Repository

2
Abstract
This study investigated the combined effects of forearm rotation, radial/ulnar deviation and
flexion/extension on discomfort score for two levels of frequency (10 and 20
exertions/minute) in a repetitive wrist flexion task with a force of 10N. There were three
levels of wrist deviation (neutral, 35% ROM in radial and ulnar), three levels of wrist
flexion/extension (neutral, 35% ROM in flexion and extension) and three levels of forearm
rotation (neutral, 60% ROM in prone and supine). The dependent variable was discomfort
on a Visual Analogue Scale. ANOVA results showed that there were highly significant
effects of all the main factors (p<0.001) on discomfort. The two-way interaction of forearm
rotation with radial/ulnar wrist deviation was highly significant (p=0.001) as was forearm
rotation by participant. Similarly, three of the three-way interactions and one four-way
interaction were high significant (p<0.001 and p<0.01), probably due to having
participants as one of the factors in them. Posture changes from neutral to 35% ROM
increased discomfort by about 20%, but combinations of deviated postures increased
discomfort by up to 70%. The higher frequency increased discomfort by 28%. Some of the
increase in discomfort appears to have been due to reductions in wrist flexion MVC at non-
neutral postures.
Relevance to Industry
The results of the study will be beneficial for the design of work places, hand tools and
task design in repetitive industrial manual work, for example, in assembly work requiring
a light force and a frequency of about 10 to 20 exertions per minute.
Keywords: Wrist and forearm postures; musculoskeltal disorders; discomfort
3
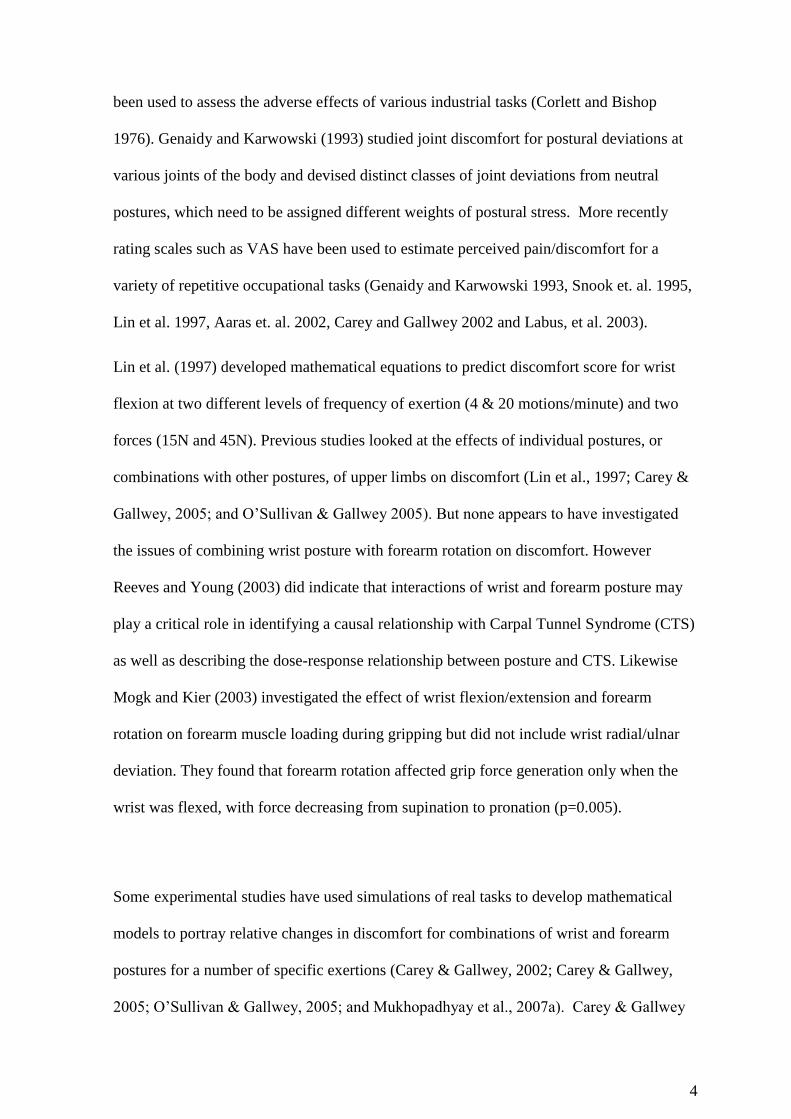
1 Introduction
The dose–response relationships involved in the development of Work-related Musculo-
Skeletal Disorders (WMSDs) are unknown, but the factors responsible for the development
of discomfort are known (Putz-Anderson, 1988). The literature shows unarguably that
certain jobs and certain work-related factors are associated with the manifold risk of
contracting WMSDs compared with other population groups, or groups not exposed to
these risk factors (Silverstein, 1985; Ayoub & Wittels, 1989; via. Hagberg, et al., 1995).
Moore et al. (1991) and Tanaka & McGlothlin (1993) introduced the model that explains
the aetiology of a type of WMSD, Carpal Tunnel Syndrome (CTS), by the frictional load
inside the carpal tunnel and the tendon sheaths. This friction was assumed to be a product
of three biomechanical factors: internal force, repetitiveness and wrist angles. Drury
(1987) developed a method of measuring these factors and their effects on WMSDs and
demonstrated its effectiveness in an industrial task. Putz-Anderson (1988) considered
these factors, combined with duration and recovery characteristics, as the most important
causes of WMSDs. But in-vivo experimentation using objective stress measurements are
often complicated by ethical necessities to not engender injuries, so thus other measures of
postural distress are needed.
Investigators have turned to the psychophysical approach using short-term responses to
physical stress in experimental simulations of industrial tasks (Lin et al. 1997). The Visual
Analogue Scale (VAS) has been shown to be a valid and reliable method to assess the
intensity of discomfort (Hukisson, 1983). Hukisson stated that the VAS tool has
advantages such as its sensitivity, simplicity, reproducibility, and universality e.g.
independent of language. Discomfort is usually a precursor to pain and injury, and has
4
been used to assess the adverse effects of various industrial tasks (Corlett and Bishop
1976). Genaidy and Karwowski (1993) studied joint discomfort for postural deviations at
various joints of the body and devised distinct classes of joint deviations from neutral
postures, which need to be assigned different weights of postural stress. More recently
rating scales such as VAS have been used to estimate perceived pain/discomfort for a
variety of repetitive occupational tasks (Genaidy and Karwowski 1993, Snook et. al. 1995,
Lin et al. 1997, Aaras et. al. 2002, Carey and Gallwey 2002 and Labus, et al. 2003).
Lin et al. (1997) developed mathematical equations to predict discomfort score for wrist
flexion at two different levels of frequency of exertion (4 & 20 motions/minute) and two
forces (15N and 45N). Previous studies looked at the effects of individual postures, or
combinations with other postures, of upper limbs on discomfort (Lin et al., 1997; Carey &
Gallwey, 2005; and O’Sullivan & Gallwey 2005). But none appears to have investigated
the issues of combining wrist posture with forearm rotation on discomfort. However
Reeves and Young (2003) did indicate that interactions of wrist and forearm posture may
play a critical role in identifying a causal relationship with Carpal Tunnel Syndrome (CTS)
as well as describing the dose-response relationship between posture and CTS. Likewise
Mogk and Kier (2003) investigated the effect of wrist flexion/extension and forearm
rotation on forearm muscle loading during gripping but did not include wrist radial/ulnar
deviation. They found that forearm rotation affected grip force generation only when the
wrist was flexed, with force decreasing from supination to pronation (p=0.005).
Some experimental studies have used simulations of real tasks to develop mathematical
models to portray relative changes in discomfort for combinations of wrist and forearm
postures for a number of specific exertions (Carey & Gallwey, 2002; Carey & Gallwey,
2005; O’Sullivan & Gallwey, 2005; and Mukhopadhyay et al., 2007a). Carey & Gallwey

5
(2002) used a pronated forearm combined with wrist articulations of 35% and 55% of the
ROM in each of the four quadrants of radial/ulnar and flexion/extension, with a
downwards non-prehensile force and developed iso-discomfort contours for two levels of
force and frequency. However, in most industrial jobs, the task force and frequency are
fixed and so Carey & Gallwey (2005) developed a mathematical model for wrist
discomfort levels for the same task with combined movements at a constant force of 10N
+/- 1N and at a frequency of 15 times per minute. There were 49 combinations of
flexion/extension and radial/ulnar deviation with the task performed for 5 min at each
combination. Again iso-discomfort contours were developed to show the relative changes
from neutral to extreme postures. However, in no part of either study by Carey and
Gallwey, were the wrist postures combined with forearm rotation.
In contrast O’Sullivan & Gallwey (2005) examined discomfort for five-minute durations of
intermittent isometric torque exertions at 20% MVC in pronation and supination at eleven
forearm angles. They developed regression equations to depict relative discomfort as a
function of forearm angle (in %ROM). Mukhopadhyay et al. (2007a) extended this work
by combining forearm rotation with elbow angle and exertion frequency, at two levels of
pronation torque. In all cases the wrist was at neutral in both flexion/extension and
ulnar/radial deviation so the combined effect of wrist and forearm non-neutral postures was
not examined. Khan et al. (2009a) extended upon other studies in the University to
investigate the effects of combined wrist radial/ulnar deviation and forearm rotation on
discomfort for a wrist flexion task. That study found highly significant effects for both
wrist deviation and forearm rotation on discomfort, and discomfort equations were
developed that predict these effects. In a subsequent experiment Khan et al. (2009b)
studied the effects of wrist flexion/extension and forearm rotation for two levels of relative

6
force (10 and 20% wrist flexion MVC) on discomfort. This research needs to be extended
to study the effects of exertion frequencies combined with wrist deviation and forearm
rotation on discomfort. Also, not all wrist and forearm combinations of postures involved
in industrial work have been studied by these authors and this work needs further research.
The purpose of the present study was to study discomfort for intermittent isometric wrist
flexion exertions, at various levels of prone/supine forearm rotation combined with wrist
flexion/extension and wrist radial/ulnar deviation. The aim was to provide a basis for more
extensive studies and to develop a model of discomfort in wrist flexion tasks, especially to
show the manner in which the discomfort changes as the posture changes towards the
extremes.
2. Method
2.1 Participants
Public calls were made on the university campus for volunteers and each was paid €42 for
their participation. Approval was obtained from the Ethics Committee of the University
before starting the experiment. There were twenty right-handed male participants with a
mean age of 22.5 (SD 3.5), height 178.9cm (SD 6.7) and body mass 73.6kg (SD 10.6).
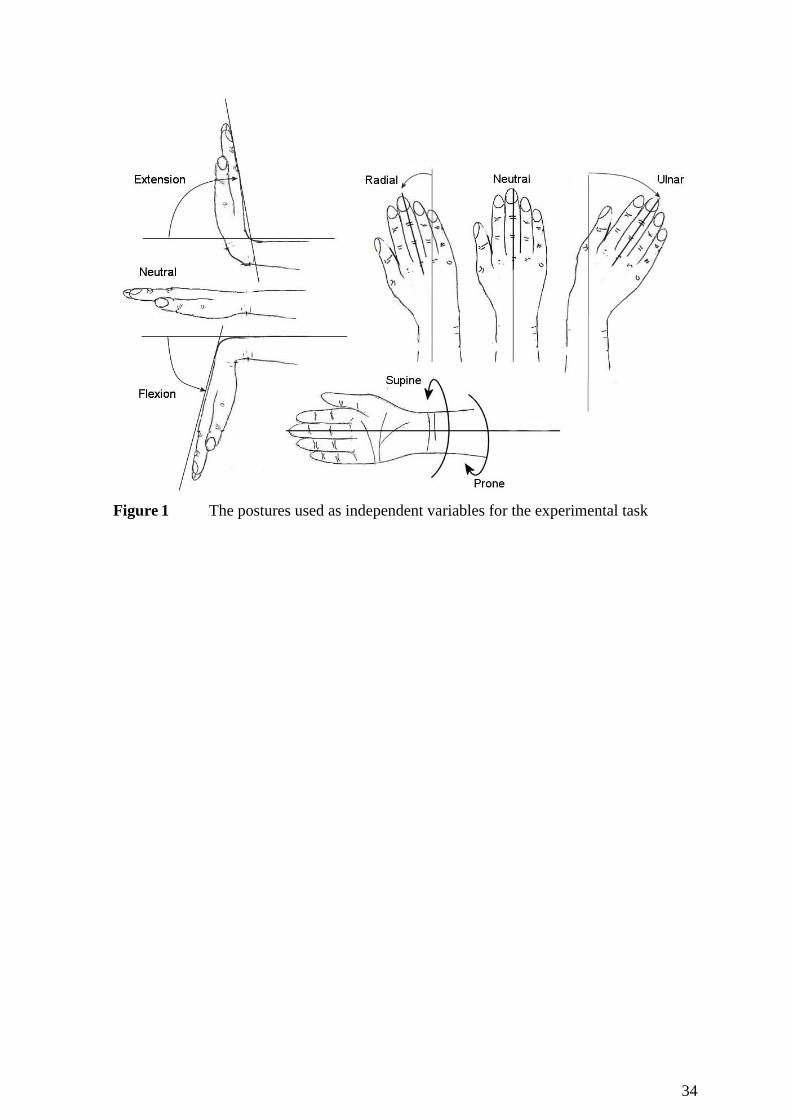
2.2 Postures
Initial trials demonstrated that 55% Range Of Motion (ROM) flexion/extension and 55%
radial/ulnar deviations could not be combined with 60% ROM of forearm rotation, so these
extremes were avoided. Hence there were three levels of wrist flexion/extension (neutral,
35% ROM in flexion and extension), three of radial/ulnar deviation (neutral, 35% ROM in

7
radial and ulnar), and three levels of forearm rotation (neutral, 60% ROM in prone and
supine). These posture descriptions are illustrated in Figure1.
2.3 Apparatus
A rig was designed to provide the wrist and forearm rotation with a fixed posture of the
upper arm and forearm support (Figure 2). A force meter designed in-house was interfaced
with a 333MHz Pentium processor based PC via an RS232 serial port. Penny & Giles
electro-goniometers were also connected to the PC using a National Instruments board
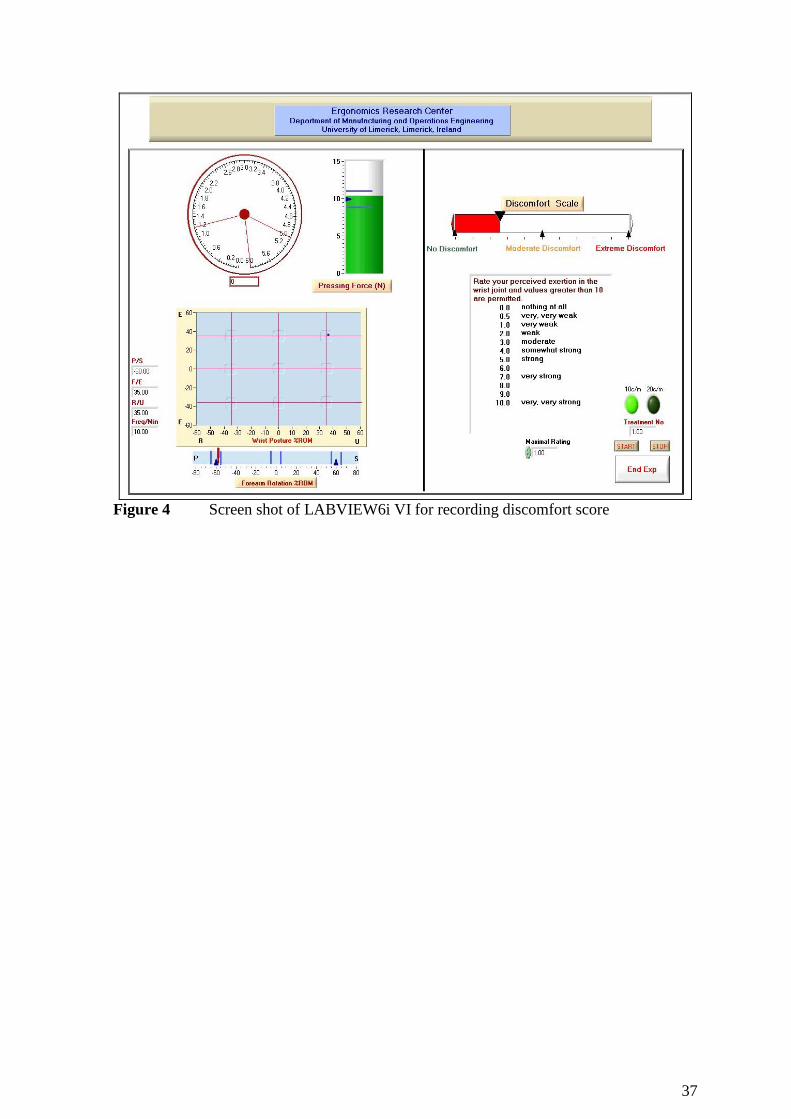
(PCI MIO 16XE-50) for data acquisition and experimental control. LabVIEW6i code was
written to provide Virtual Instruments (VIs) (Figure 2) to monitor and control both the
initial and main experiment (Figure 3 and 4 respectively).
[put Figure 1 about here]
[put Figure 2 about here]
[put Figure 3 about here]
[put Figure 4 about here]
Angular movements of the wrist and forearm were shown in real time on the screen. A
vertical slider bar indicated the flexion force with bands labelled at +1N about the level of
10N. To maintain good control of the task, a buzzer sounded and the vertical bar changed
colour from green to red, if the participant’s force exertion went outside the range. The
screen clock displayed the duration of exertion corresponding to the frequency of 10 or 20
exertions per minute.
2.4 Initial Experiment
8
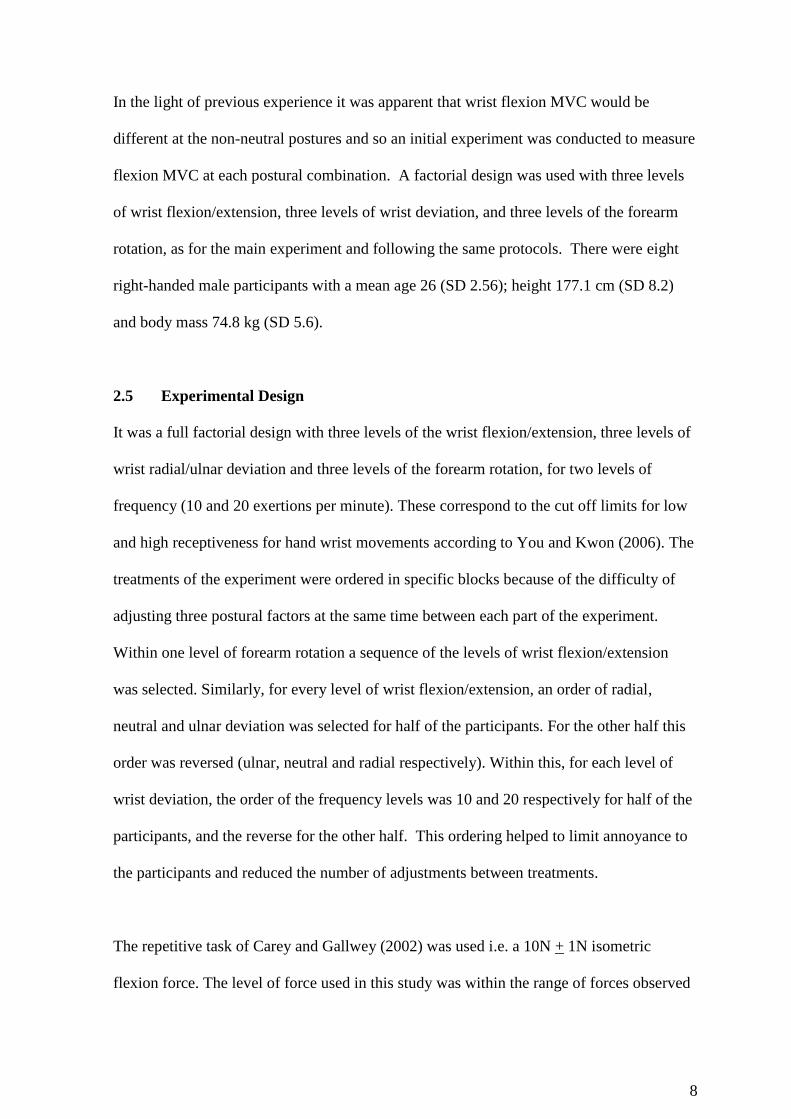
In the light of previous experience it was apparent that wrist flexion MVC would be
different at the non-neutral postures and so an initial experiment was conducted to measure
flexion MVC at each postural combination. A factorial design was used with three levels
of wrist flexion/extension, three levels of wrist deviation, and three levels of the forearm
rotation, as for the main experiment and following the same protocols. There were eight
right-handed male participants with a mean age 26 (SD 2.56); height 177.1 cm (SD 8.2)
and body mass 74.8 kg (SD 5.6).
2.5 Experimental Design
It was a full factorial design with three levels of the wrist flexion/extension, three levels of
wrist radial/ulnar deviation and three levels of the forearm rotation, for two levels of
frequency (10 and 20 exertions per minute). These correspond to the cut off limits for low
and high receptiveness for hand wrist movements according to You and Kwon (2006). The
treatments of the experiment were ordered in specific blocks because of the difficulty of
adjusting three postural factors at the same time between each part of the experiment.
Within one level of forearm rotation a sequence of the levels of wrist flexion/extension
was selected. Similarly, for every level of wrist flexion/extension, an order of radial,
neutral and ulnar deviation was selected for half of the participants. For the other half this
order was reversed (ulnar, neutral and radial respectively). Within this, for each level of
wrist deviation, the order of the frequency levels was 10 and 20 respectively for half of the
participants, and the reverse for the other half. This ordering helped to limit annoyance to
the participants and reduced the number of adjustments between treatments.
The repetitive task of Carey and Gallwey (2002) was used i.e. a 10N + 1N isometric
flexion force. The level of force used in this study was within the range of forces observed

9
as characteristic of many light force repetitive industrial tasks e.g. meat cutting, assembly
tasks and wire tying (Aaras et al., 1988, Li, 2002 and McGorry et al., 2002). There are
probably many tasks where the forces may be higher and where these results may not be
applicable.
2.6 Dependent Variable
Participants used the cursor to indicate their discomfort score on a 100mm Visual
Analogue Scale (VAS) which was adjusted to a scale from 0 to 10 (Figure 4). Participants
were advised that symptoms of discomfort included aching, fatigue, soreness, warmth,
cramping, pulling, numbness, tenderness, pressing or pain (Lin et al., 1997).
2.7 Preliminary Data Collection
Initially the participant was briefed about the experiment and questions were answered
before signing the informed consent form. Then the participant was seated in a fully
adjustable chair.
2.7.1 Ranges of Motion (ROMs)
The Penny and Giles goniometers were fitted to the wrist and forearm in accordance with
the manufacturer’s instructions. Then the elbow was flexed 900, the upper arm was placed
close to the body (00 abduction), and the wrist was at neutral in both planes. Wrist
deviation and flexion/extension ROMs were measured for the fully prone forearm, (Carey
and Gallwey, 2002).

10
2.7.2 Wrist Flexion MVC
The forearm was fully prone with a neutral wrist, and the elbow was flexed at 900 inline
with the postures for the experimental task of Carey & Gallwey (2002) and the same as the
task chosen by Carey and Gallwey (1999). The participant’s hand was positioned so that
the distal metacarpophalangeal joint of the third phalange was over the centre of the force
gauge. A Velcro strap held the forearm on the table to prevent movement during the
experiment. As per the experimental order the rig was adjusted and the participant was
asked to exert the maximum wrist flexion force twice with a gap of 2 minutes, the
maximum of these being recorded as the MVC for that particular posture. After obtaining
each MVC score a gap of 2-minutes was allowed before starting measurement of the next
one.
2.7.3 Endurance Time
Endurance time at 50% MVC was recorded to use as a covariate to control for differences
in discomfort perception and pain tolerance. The endurance test was also used to train the
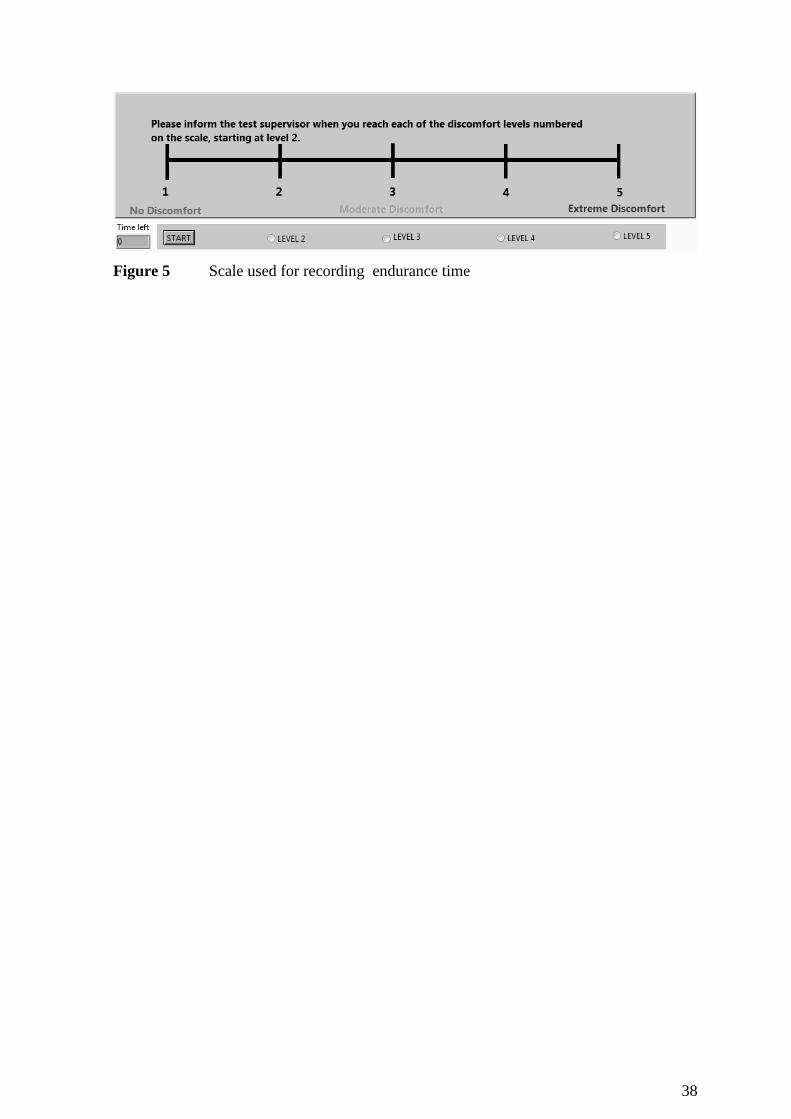
participants in the interpretation of the discomfort scale anchors. A five-point VAS display
with indicators of “No discomfort”, “Medium discomfort”, and “Extreme discomfort”, (as
per Corlett and Manenica, 1980 and the main experiment) was presented to the participants
. During the endurance test they informed the experimenter when their perceived
discomfort reached each of the levels. A special LabVIEW Virtual Interface controlled
this part, as shown in Figure 5.
(put Figure 5 about here)
2.8 Procedure
The participant and rig were positioned at the same settings as for the preliminary data
collection for wrist flexion MVC, except for fixing the forearm and upper arm on the rig so

11
that the elbow was flexed at 900, the forearm was horizontal, and the upper arm was at
approximately 450 in the coronal plane. A Velcro strap held the forearm on the table to
prevent movement during the experiment. The wrist force exertion was maintained for the
last second of the clock cycle shown on the screen shot of LABVIEW 6i VI (Figure 4). At
the end of each five-minute block, the participant rated discomfort on the 100mm VAS and
rested for at least one minute, or until the participant felt no discomfort, to obviate
cumulative fatigue (Carey & Gallwey, 2002). After approximately half of the experiment,
a rest of about 30 minutes was given. The whole experiment took about 8 hours for each
participant.
2.9 Results analysis
All statistical analysis was performed using SPSS software. Full factorial design was used
for univariate repeated measures Analysis of Co-Variance (ANCOVA). This technique
was used to investigate the expected significances of covariates (endurance time and
flexion MVC), independent variables (forearm rotation, flexion/extension, wrist deviation
and frequency) on the dependent variable (i.e. discomfort score: transformed as it was
required). Further post hoc tests were used to test the significance of the different levels of
independent variables.
To reduce the effect of differences in pain tolerances among participants, and to enable
comparisons with the data of previous studies, the data were standardised using the min-
max procedure of Gescheider (1985) to give Standardised Discomfort Score (SDS) values,
as follows,
(raw dataij-min. dataj)
Standardised Discomfort Score (SDS) ij =----------------------------------- x 10

12
(max. dataj-min. dataj)
Where, raw dataij: discomfort score for ith
treatment for jth
participant
min dataj: minimum discomfort value within data of the jth
participant
max dataj maximum discomfort value within data of the jth
participant
3. Results
3.1 Initial Experiment on Wrist Flexion MVC
These data are presented in Table 1. Levene’s test for non-normality was rejected
(p=0.992) and an ANOVA was performed on the MVC data with Participants as a random
factor. The results showed that forearm rotation and participants were highly significant
(p=0.001) while wrist flexion/extension was significant (p=0.018). But wrist radial/ulnar
deviation was not significant (p=0.053). All interaction effects were not significant except
for wrist deviation with participant (p=0.003) and the three-way interaction of forearm
rotation with wrist flexion/extension and participant (p<0.001).
The greatest decrease in the flexion MVC was 35.8% for the extreme combination of 60%
ROM prone with 35%ROM wrist flexion and 35% wrist radial deviation. The mean value
of the wrist flexion MVC for the neutral wrist and forearm was 83.8 N (SD 33.26).
[put Table 1 about here]
3.2 Main Experiment Wrist Flexion MVC and Endurance time
Mean flexion MVC across the twenty participants was 59.6 N (SD 13.2) and the mean
endurance time was 86.7s (SD 34.9).

13
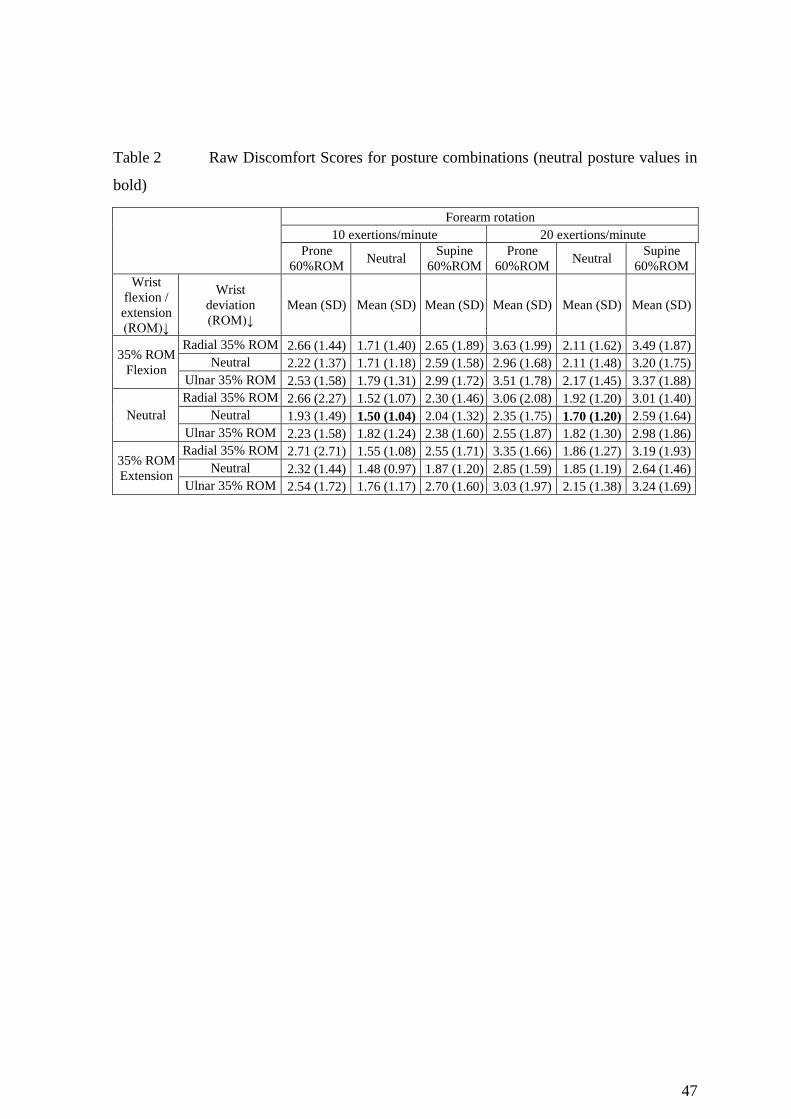
3.3 Discomfort Scores
Raw Discomfort Score (RDS) values, shown in Table 2, gave the lowest discomfort for the
neutral wrist with neutral forearm at the frequency of 10 exertions/minute, with a mean
value of 1.50 (SD 1.04). The increase in RDS for 20 exertions per minute, with a neutral
wrist and neutral forearm, was only 13%. The highest discomfort at 10 exertions per
minute was for 35%ROM ulnar wrist with 35%ROM wrist flexion and 60%ROM supine
forearm. But for 20 exertions/minute the posture of highest discomfort (mean RDS 3.63
with SD=1.99) was at 60%ROM prone forearm with 35%ROM wrist flexion and
35%ROM radial wrist. This value was 2.14 times the RDS value for a neutral wrist with a
neutral forearm at the same frequency.
[put Table 2 about here]
The SDS scores for the main experiment were not normally distributed (Levene’s test:
p=0.001) and a histogram of the RDS scores gave a distribution close to normal but a little
skewed to the right. The Log10 (X+1) transformation of the RDS data achieved normality
(Levene’s test: p>0.05) and these data of Transformed Discomfort Score (TDS) were used
for all statistical analyses. The average SDS values are show in Table 3.
(put Table 3 about here)
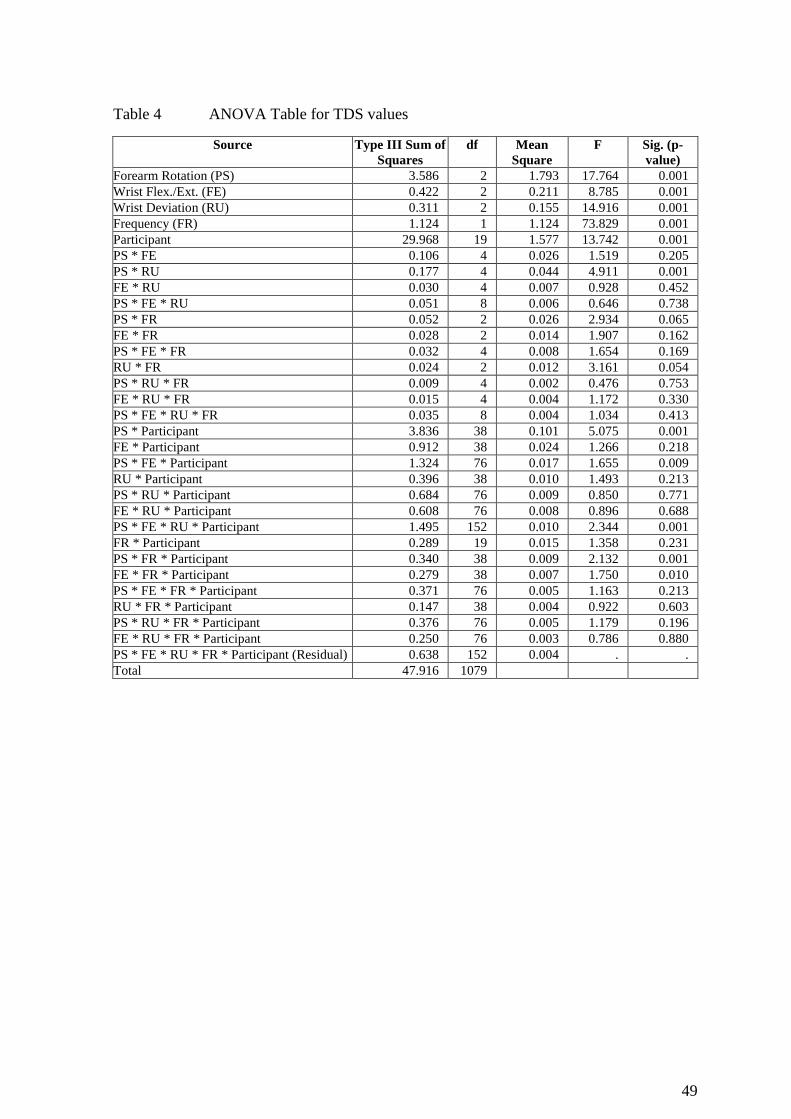
Mauchly’s test was used in a repeated-measures ANCOVA with endurance time as the
covariate. It showed that some of the interactions violated the sphericity requirement and
14
on these the Greenhouse-Geisser correction was employed. Endurance time was not
significant (p = 0.26) and so it could be excluded from further analysis. Then ANOVA was
performed on the transformed data with Participants included as a random factor and using
the five-way interaction as the Residual (Table 4). Forearm rotation, Wrist
flexion/extension, Wrist deviation, Frequency, and Participant were all highly significant
(p<0.001). The two-way interactions of Forearm rotation with Wrist deviation, and
Forearm rotation with Participant, were also highly significant (p<0.001) while four higher
order interactions were highly significant (p=0.001) or significant (p=0.01).
To investigate the effects of the different levels of independent variables on discomfort
score, the Student Newman Keul’s (SNK) test was performed on TDS values. Wrist radial
deviation of 35%ROM was not significantly different from 35%ROM ulnar (p=0.914) but
both were significantly different from neutral (p<0.05). Wrist extension of 35%ROM was
not significantly different from neutral (p=0.103) and also not from 35%ROM wrist
flexion (p=0.115). But 35%ROM wrist flexion was significantly different from neutral
(p<0.05). Interestingly, 60%ROM prone was not significantly different from 60%ROM
supine (p=0.623) but both were significantly different from the neutral forearm (p<0.05).
The experiment treatments were presented in blocks based on forearm rotation due to time
delays and inconvenience to the participant changing that posture. Data from each of the
blocks were compared using a one way ANOVA, and lack of a significant difference
indicated there was not an order effect.
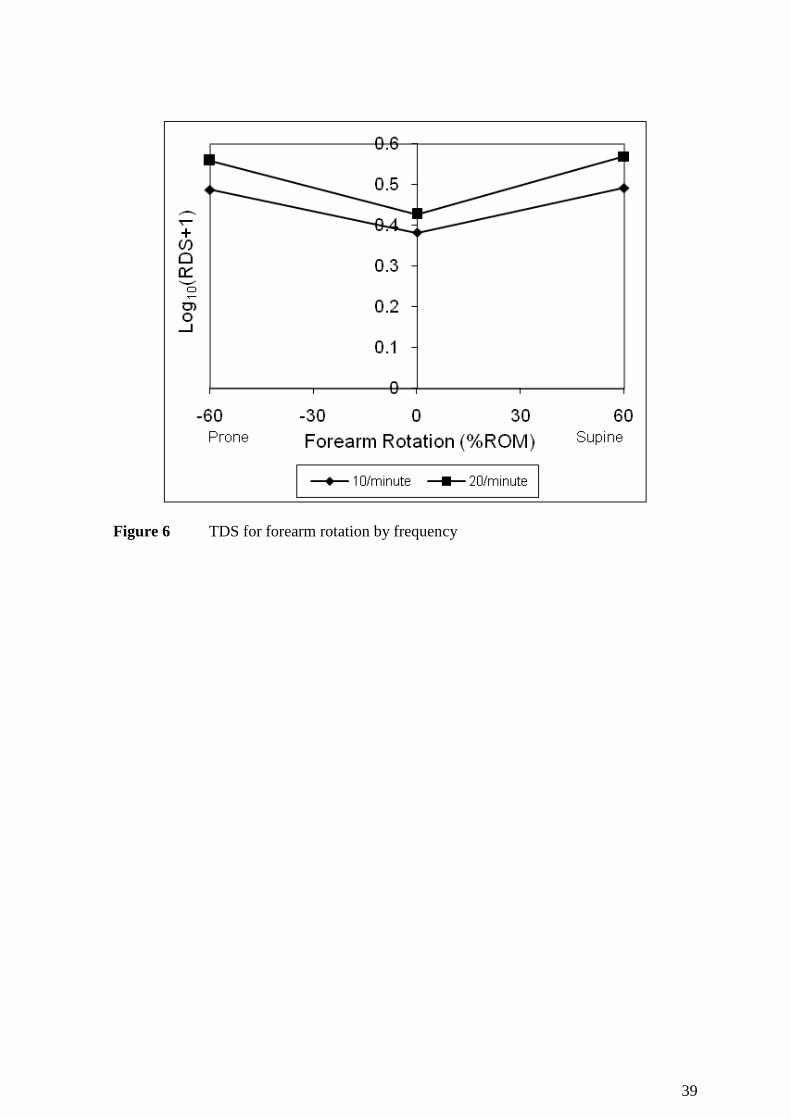
3.4 Forearm rotation

15
Both prone and supine rotations increased discomfort (Figure 4). For a neutral forearm
rotation the difference between a frequency of 10/min and 20/min was 12% (t=3.865,
p=0.001). This difference was greater for 60%ROM prone (14%; t=6.656, p<0.001) and
60%ROM supine (16%; t=7.031, p<0.001) forearm rotation.
[Put Figure 4 about here]
3.5 Wrist flexion/extension
The increase in discomfort between neutral and 35%ROM extension was slight (4%) at
10/min and not significant (t=1.699, p=0.106). But at 20/min it was 6% and significant
(t=3.117, p=0.006) (see Figure 5). Differences in discomfort between the frequencies were
approximately the same for all three levels of wrist flexion/extension, about 10-12%. The
increase in discomfort for 35%ROM wrist flexion compared to neutral was 24% at 10/min
and 11% at 20/min respectively.
[Put Figure 5 about here]
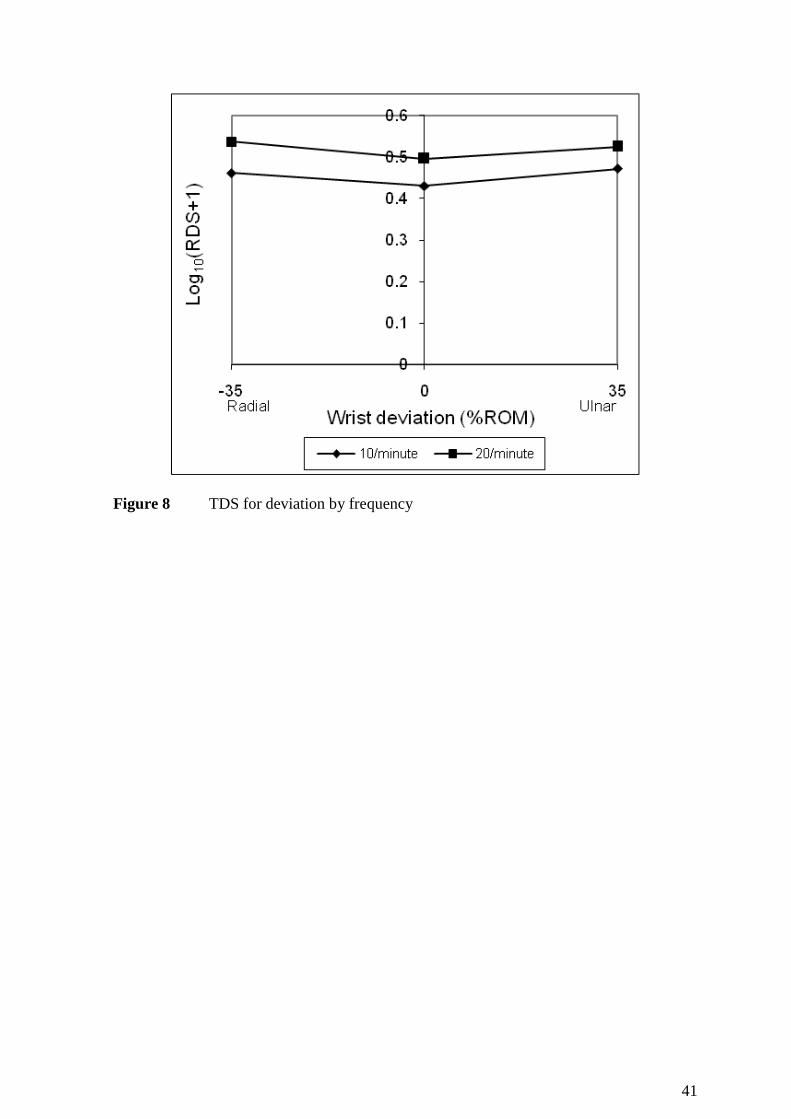
3.6 Wrist deviation
In general discomfort increased with wrist deviation in both radial and ulnar directions at
10/min and 20/min (Figure 6), but by little. For example, for 35%ROM ulnar deviation at
20 exertions/minute, the increase from neutral was about 6% (t=2.999, p=0.007). These
differences were a lot more pronounced at the high combinations of the postures.

16
[Put Figure 6 about here]
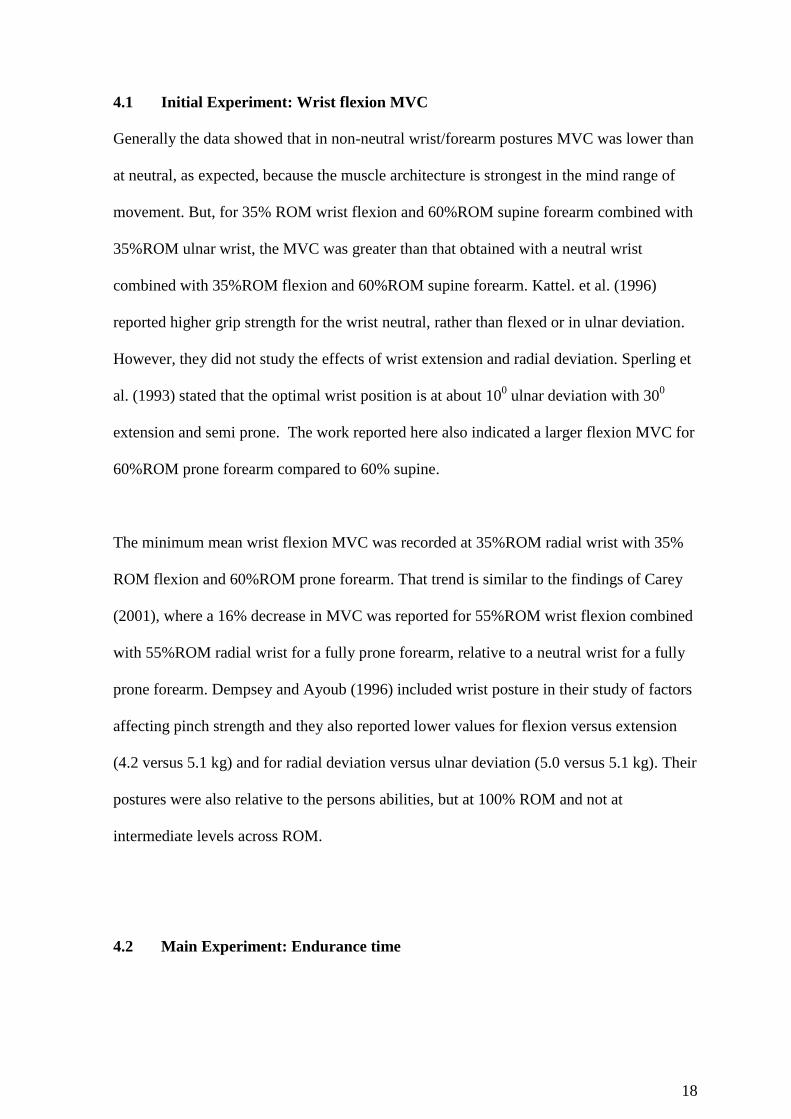
3.7 Participants
To examine differences among Participants, the Endurance Time and Flexion MVC values
were plotted in the increasing order of mean RDS (Figure 7) of the Participants. It can be
seen that Endurance Time and Flexion MVC for most of the participants varied inversely
with RDS (i.e. negative slopes) but R2 values were very low (<0.1).
[put Figure 7 about here]
An SNK test on these data gave eleven groups with discomfort scores significantly
different at p <0.05. Participants 16 and 15 were each in separate groups with the lowest
and second lowest TDS scores while Participants 12 and 11 were grouped together at the
highest score. Most groups consisted of three to five Participants with some overlap
between neighbouring groups. It was also noted that the 10N flexion force used for the
experimental task ranged from about 12% of the flexion MVC (for participant no.7) to
26% (for participant no.4). It is notable that all the significant higher order interactions
included Participants as one of the factors (Table 4).
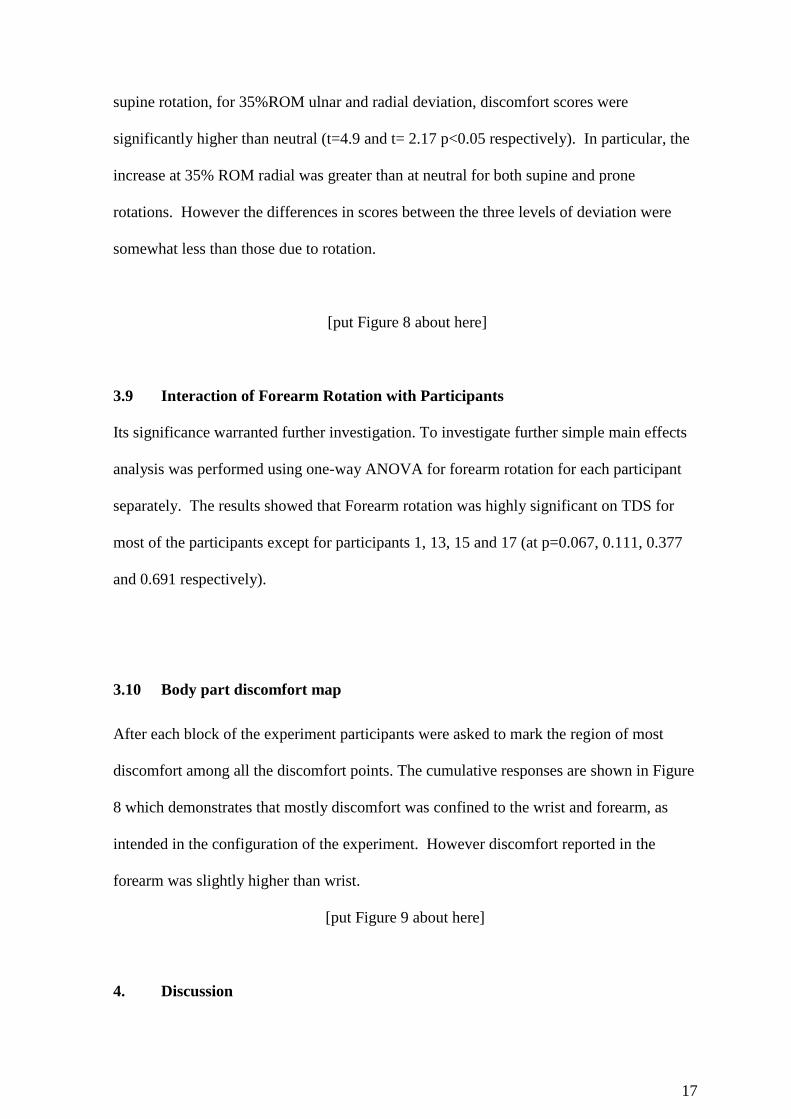
3.8 Interaction of Forearm Rotation with Wrist Deviation
The TDS score increased with both supine and prone rotation compared to neutral, at
neutral deviation and both 35%ROM radial and ulnar deviation (Figure 8). Discomfort at
60%ROM prone forearm, for both 35%ROM ulnar and radial wrist, was significantly
higher than neutral (t=4.16 and t=4.418 p<0.05 respectively). Likewise, at 60%ROM
17
supine rotation, for 35%ROM ulnar and radial deviation, discomfort scores were
significantly higher than neutral (t=4.9 and t= 2.17 p<0.05 respectively). In particular, the
increase at 35% ROM radial was greater than at neutral for both supine and prone
rotations. However the differences in scores between the three levels of deviation were
somewhat less than those due to rotation.
[put Figure 8 about here]
3.9 Interaction of Forearm Rotation with Participants
Its significance warranted further investigation. To investigate further simple main effects
analysis was performed using one-way ANOVA for forearm rotation for each participant
separately. The results showed that Forearm rotation was highly significant on TDS for
most of the participants except for participants 1, 13, 15 and 17 (at p=0.067, 0.111, 0.377
and 0.691 respectively).
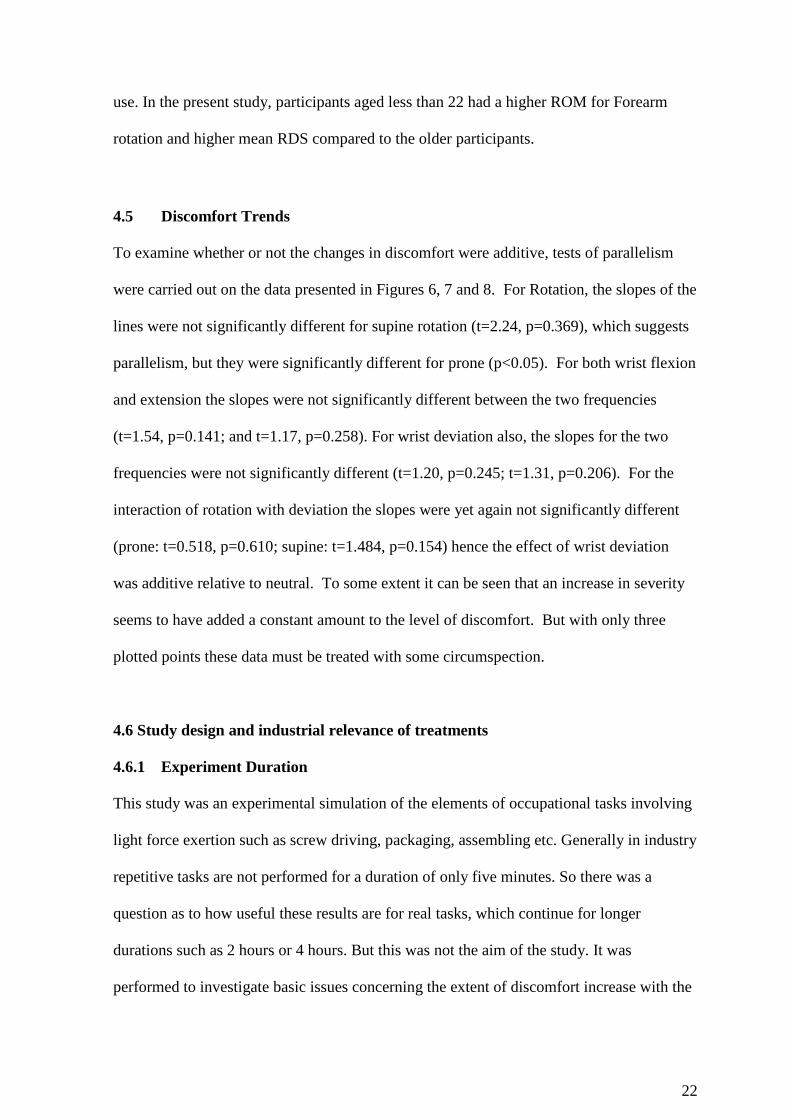
3.10 Body part discomfort map
After each block of the experiment participants were asked to mark the region of most
discomfort among all the discomfort points. The cumulative responses are shown in Figure
8 which demonstrates that mostly discomfort was confined to the wrist and forearm, as
intended in the configuration of the experiment. However discomfort reported in the
forearm was slightly higher than wrist.
[put Figure 9 about here]
4. Discussion
18
4.1 Initial Experiment: Wrist flexion MVC
Generally the data showed that in non-neutral wrist/forearm postures MVC was lower than
at neutral, as expected, because the muscle architecture is strongest in the mind range of
movement. But, for 35% ROM wrist flexion and 60%ROM supine forearm combined with
35%ROM ulnar wrist, the MVC was greater than that obtained with a neutral wrist
combined with 35%ROM flexion and 60%ROM supine forearm. Kattel. et al. (1996)
reported higher grip strength for the wrist neutral, rather than flexed or in ulnar deviation.
However, they did not study the effects of wrist extension and radial deviation. Sperling et
al. (1993) stated that the optimal wrist position is at about 100 ulnar deviation with 30
0
extension and semi prone. The work reported here also indicated a larger flexion MVC for
60%ROM prone forearm compared to 60% supine.
The minimum mean wrist flexion MVC was recorded at 35%ROM radial wrist with 35%
ROM flexion and 60%ROM prone forearm. That trend is similar to the findings of Carey
(2001), where a 16% decrease in MVC was reported for 55%ROM wrist flexion combined
with 55%ROM radial wrist for a fully prone forearm, relative to a neutral wrist for a fully
prone forearm. Dempsey and Ayoub (1996) included wrist posture in their study of factors
affecting pinch strength and they also reported lower values for flexion versus extension
(4.2 versus 5.1 kg) and for radial deviation versus ulnar deviation (5.0 versus 5.1 kg). Their
postures were also relative to the persons abilities, but at 100% ROM and not at
intermediate levels across ROM.
4.2 Main Experiment: Endurance time

19
That this was not a significant covariate and this is against result reported in
Mukhopadhyay et al. (2007b), where a similar test was significant (p<0.001). As in the
work reported here, Mukhopadhyay et al. used an endurance task that closely mimicked
their experimental task, but they used raw discomfort scores i.e. their scores were not
standardised or transformed. But O’Sullivan and Gallwey (2005) used SDS scores and
endurance time also failed to reach significance as a covariate. Maybe this is only
effective if the raw scores are used as standardisation possibly removed the effect.
However the graphical picture here suggests that it is relevant but perhaps nullified by the
large variability of the data.
4.3 Discomfort
The significance of the main factors for wrist postures was in-line with the findings of
Carey & Gallwey (2005). In addition, Wilhelm and Hallbeck (1997) reported higher torque
strength for a neutral wrist compared to a deviated wrist. This supports the lower level of
discomfort found in the present study for the neutral wrist and at 35% extension, compared
to the 35 % flexion and both 35% ulnar and radial deviation. It has been shown that wrist
flexion/extension and radial/ulnar deviation affect Carpal Tunnel Pressure (CTP) (Keir,
2007 and Smith et al., 1977). Hence, these findings on the wrist posture effects are in good
concordance with other studies using objective data as the dependent variable.
Very low level of differences in the RDS values for 35% ROM in radial, ulnar and neutral
wrist was noticed without forearm rotation for 10 exertions per minute. Also the
discomfort was higher for 35% radial compared to 35% ulnar for 60% prone while it was
visa versa for 60% supine rotation of forearm. Further analysis showed that these
differences were not significantly different for supine rotation (t=2.24, p=0.369) but were

20
significantly different for prone rotation (p<0.05). O’Sullivan & Gallwey (2002) and
Mukhopadhyay et al. (2007a) obtained results that support the significant effect of Forearm
rotation on discomfort score. The values could not be compared directly because the tasks
were different in these two experiments. The mean values of the MVC flexion were less
for prone and supine compared to a neutral forearm. This difference was about 16% less
and 20% less for 60% ROM in prone and supine rotation respectively. This reduction in
strength supports the finding of lower discomfort for a neutral forearm compared with
prone/supine.
A laboratory experiment to compare conventional pliers with powered driver-fixture
combinations (Li, 2003) also showed a significant reduction (<0.001) in EMG activity of
the flexor digitorum superficialis muscle, and flexor carpi ulnaris muscle, of the right arm.
This reduction was because the numbers of awkward wrist postures, including extension
and ulnar deviation were significantly decreased when using the powered driver-fixture
combinations. Pashoarelli et al. (2008) presented posture and discomfort data for various
designs of ultrasound devices. Comparison of data from five device designs showed that
the lowest discomfort and highest product acceptability ratings were for new device
designs that involved more neutral wrist flexion/extension, wrist radial ulnar deviation and
forearm rotation postures that two commercial products. Hence the findings of Li (2003)
and Paschoarelli et al. (2008) support the present findings that discomfort increases wrist
and forearm deviations from neutral.
Many products and tasks involve postures similar to those tested here and some have
associations with injury or subjective reports of discomfort. For example, Mirka et al.
(2002) found that a conventional spray gun design use involved up to 470 wrist flexion and

21
up to 170 ulnar deviation. Computer input devices, especially the traditional mouse
typically involves wrist extension and ulnar deviation with the forearm prone (Burgess-
Limerick and Green, 2000). Toomings and Gavhed (2009) reported on the office
ergonomics in sixteen Swedish call centres. Their data show that the wrists were extended
between 150 and 30
0 during 32% of the observations, and between 15
0 and 30
0 ulnar
deviation for 30% of the time. A survey of the participants indicated that 20% experienced
prevalence of pain in the elbows/forearms/ wrists/hands/fingers during the previous week.
The results from the present study would suggest that small amounts of wrist extension do
not appear to result in a marked increase in discomfort, but ulnar deviation, even at low
magnitudes such as 35% ROM does.
For the neutral postures, discomfort increased by 13% (1.5 to 1.7) when pace increased
from 10 to 20 exertions per minute. But for the most difficult posture combination (60%
prone, 35% flexion, 35% radial deviation) the increase was 36% (2.6 to 3.6). This most
likely illustrates some of the significant interaction effects in the ANOVA which included
Frequency. Carey and Gallwey (2002) also found frequency at the same levels as in this
study to be significant when combined with wrist flexion and ulnar deviation.
4.4 Participants and its interactions
Although Participants was highly significant, the endurance time was not a significant
covariate. A possible reason is the individual differences in the range of the perceived
discomfort, since participant was significant in the SNK test. Chapparo et al. (1999) found
that younger participants had higher discomfort in the hand and wrist only, while older
participants reported higher discomfort in the hand, wrist and forearm in computer mouse
22
use. In the present study, participants aged less than 22 had a higher ROM for Forearm
rotation and higher mean RDS compared to the older participants.
4.5 Discomfort Trends
To examine whether or not the changes in discomfort were additive, tests of parallelism
were carried out on the data presented in Figures 6, 7 and 8. For Rotation, the slopes of the
lines were not significantly different for supine rotation (t=2.24, p=0.369), which suggests
parallelism, but they were significantly different for prone (p<0.05). For both wrist flexion
and extension the slopes were not significantly different between the two frequencies
(t=1.54, p=0.141; and t=1.17, p=0.258). For wrist deviation also, the slopes for the two
frequencies were not significantly different (t=1.20, p=0.245; t=1.31, p=0.206). For the
interaction of rotation with deviation the slopes were yet again not significantly different
(prone: t=0.518, p=0.610; supine: t=1.484, p=0.154) hence the effect of wrist deviation
was additive relative to neutral. To some extent it can be seen that an increase in severity
seems to have added a constant amount to the level of discomfort. But with only three
plotted points these data must be treated with some circumspection.
4.6 Study design and industrial relevance of treatments
4.6.1 Experiment Duration
This study was an experimental simulation of the elements of occupational tasks involving
light force exertion such as screw driving, packaging, assembling etc. Generally in industry
repetitive tasks are not performed for a duration of only five minutes. So there was a
question as to how useful these results are for real tasks, which continue for longer
durations such as 2 hours or 4 hours. But this was not the aim of the study. It was
performed to investigate basic issues concerning the extent of discomfort increase with the
23
increase in %ROM of combined wrist and forearm postures. Hence the present findings
help to map the discomfort profile for such activities.
4.6.2 Recovery Time
Although participants could request recovery time between each part of experiment of
more than one minute until they felt comfortable, they very rarely did so. It appears to be a
very short time but other studies have used the same rest period for these kinds of tasks in
simulated experiments (Mogk and Keir, 2003; Carey and Gallwey, 2002). Carey (2001)
reported that there was very little or no accumulation of discomfort at the end of a one-
minute rest period. As a follow-up in the present study, the data were tested for a possible
order effect by breaking it into three parts but it was not significant. This implies that the
one-minute recovery period was sufficient to avoid an accumulation of discomfort on this
task.
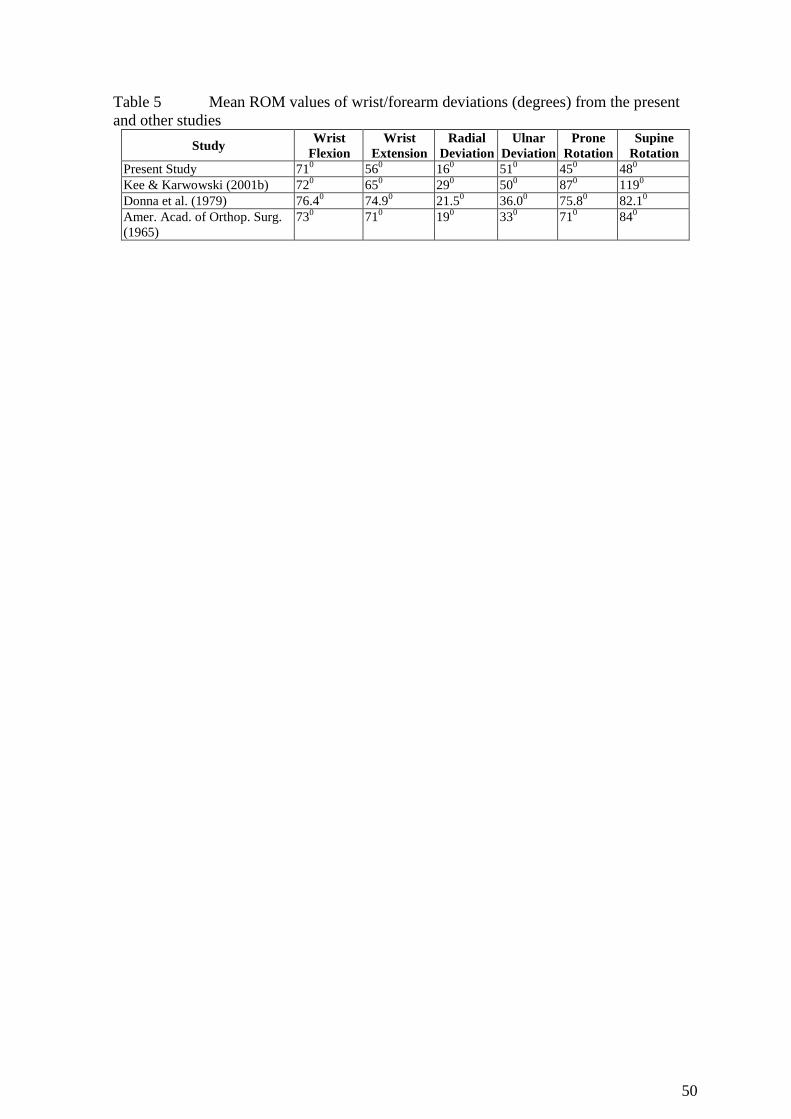
4.6.3 Ranges of Motion
Ranges of motions measured in this experiment were lower (in degree terms) than the
findings reported by other researchers (Table 6). This difference was greater for supine
and prone rotation. One reason might be that ROM was recorded using electro-
goniometers that were attached over the forearm. It was noted that, with rotation of the
forearm, there was a small degree of slippage by the goniometer since it was attached to
the skin, which did not rotate as completely as the movement of the forearm bones.
[put Table 5 about here]
The different ROM values can be explained from the findings of Marshall et al. (1999). In
their study they did 48 pair-wise t-test comparisons for wrist and forearm rotations, and

24
only six indicated no significant difference between the manual method of measurement
and the reading from the electrogoniometer (p<0.05). Buchholz and Wellman (1997)
investigated the effects of forearm rotation on the performance of the Penny & Giles
electrogoniometer and found similar results. As per Gajdosik and Bohannon (1987) muscle
length can also affect goniometer recordings. They concluded that the objective
interpretation of the meaning of ROM measurements in light of the purposes and the
limitations of goniometry should be encouraged.
4.6.4 Gender effect
The present study was limited to male participants only and there might be different effect
if the results were applied to female workers. Treaster and Burr (2004) found that women
have a significantly higher prevalence for many types of upper extremity WMSDs, even
after controlling for the type of data source and confounders such as age or work factors.
With men as the referent, the Odds Ratio (OR) or Prevalence Ratio (PR) for upper limb
WMSD ranged from 0.85 to 10.05 for self-reports. For self-report combined with physical
examination, the OR/PR ranged from 0.66 to 11.4. Hence, if the present results were
applied to the female population there might well be a high prevalence of WMSDs.
Gun (1990) found that the RSI incidence rates varied widely between different occupations
and industries, and suggested that the gender difference is largely due to the different job
tasks assigned to women and men, rather than to any biological difference. Furthermore,
when women and men perform the same task, women may be at higher risk of WMSD
because of a mismatch between the workplace and their anthropometric dimensions. Also,
when performing the same job, women were reported to be at a higher risk of WMDS
(Silverstein, et al., 1986 and Armstrong et al., 1987). In other words, there is a real gender

25
difference in WMSD risk that cannot be explained solely on the basis of differences in job
factors. Independent exposure analysis should be done separately for men and women in
order to be sensitive to gender related differences in anthropometry and work techniques.

26
5. Conclusions
Forearm rotation had a highly significant at p<0.001 on discomfort for repetitive
wrist flexion task. With the forearm at 60% ROM prone and 60% ROM supine, the
cumulative means of the SDS scoures were 85% and 90% more compared to neutral
wrist.
Deviation of the wrist in the vertical plane (flexion/extension) had a significant effect
on discomfort (p=0.001). Post hoc tests revealed that the values for 35%ROM wrist
extension was not significantly different from neutral (p=0.103). There was an
increase in average cumulative SDS of 28% for 35%ROM wrist flexion compared to
neutral.
Wrist radial/ulnar deviation had a highly significant effect (p<0.001) on SDS with an
increase of 22% and 21% for 35%ROM radial and ulnar deviation respectively.
Frequency was also highly significant (p<0.001) with an increase of 28% for 20
exertions/minute compared to 10 exertions/minute for 10N wrist flexion repetitive
exertions.
Acknowledgement
The research in this paper was funded by the MIRTH project of the European Union
“Growth” Programme (Musculoskeletal Injury Reduction Tool for Health and safety,
MIRTH-CT-2001-00574).
27
References
Aaras, A., Dainoff, M.R.O. and Thoresen, M., 2002. Can a more neutral position of the
forearm when operating a computer mouse reduce the pain level for VDU operators?
International Journal of Industrial Ergonomics 30, 307-324.
Aaras, A., Westgaad, R.H. and Stranden, E., 1988, Postural load as an indicator of postural
load and muscular injury in occupational work situations. Ergonomics 31, 915-933.
Annett, J., 2002. Subjective ratings scales in ergonomics: a reply. Ergonomics , 45, 14,
1042-1046.
Armstrong, T.J., Fine, L. J., Goldstein, S. A., Lifshitz, Y. R. and Silvertein, B. A., 1987.
Ergonomics considerations in hand and wrist tendonitis. Journal of Hand Surgery 12A, 5,
830-837.
Ayoub, M.A. and Wittels, N., 1989. Cumulative trauma disorders. International Reviews
of Ergonomics 2, 217-272.
Buchholz, B., and Wellman, H., 1997. Practical operation of a biaxial goniometer at the
wrist joint. Human Factors 39, 119 - 129.
Burgess-Limerick, R. and Green, B., Using multiple case studies in ergonomics: an
example of pointing device use, International Journal of Industrial Ergonomics, 26, 381-
388.
Carey, E., 2001. Effects of Posture, Force and Rate of Exertion at the Wrist on Discomfort
and Fatigue. Ph.D. Thesis. University of Limerick, Limerick, Republic of Ireland.
Carey, E.J. and Gallwey, T.J., Discomfort prediction from postural deviations of the wrist.
In: Hanson, M.A., Lovesey, E.J., Robertson, S.A., editors. Contemporary Ergonomics.
London: Taylor and Francis; 1999. 296-300.
Carey, E. L., and Gallwey, T. J., 2002. Effects of wrist posture, pace and exertion on
discomfort. International Journal of Industrial Ergonomics 29, 85–94.
28
Carey, E. L., and Gallwey, T. J., 2005. Wrist discomfort levels for combined movements at
constant force and repetition rate. Ergonomics 48, 171 – 186.
Chaparro, A., Bohan, M., Fernandez, J., Choi, S. D., and Kattel, B., 1999. The impact of
age on computer input device use: Psychophysical and physiological measures.
International Journal of Industrial Ergonomics 24, 504-513.Corlett, E.N. and Bishop, R.P.,
1976. A technique for assessing postural discomfort. Ergonomics 19, 175 – 182.
Corlett, E.N., and Manenica, I., 1980. The effects of measurement of working postures.
Applied Ergonomics 11, 7-16.
Dempsey, P.G. and Ayoub., M.M., 1996, The influence of gender, grasp type, pinch Width
and wrist position on sustained pinch strength, International Journal of Industrial
Ergonomics, 17, 259-273.
Drury, C.G., 1987. A Biomechanical evaluation of the repetitive motion injury potential of
industrial jbs. Seminar in Occupational Medicine 2, 41-49.
Gajdosik, R.L., and Bohannon, R.W., 1987. Clinical measurement of range of motion:
review of goniometry emphasizing reliability and validity. Physical Therapy 67, 1867-
1872.
Genaidy, A.M. and Karwowski, W., 1993. The effects of neutral posture deviations on
perceived joint discomfort ratings in sitting and standing postures. Ergonomics 36, 785 –
792.
Gescheider, G. A., Psychophysics - Method, Theory, and Application. 2nd
ed. Hillsdale,
NJ: Lawrence Earlbaum: 1985,
Gun, R.T., 1990. The incidence and distribution of RSI in South Australia 1980-81 to
1986-87. Medical Journal of Australia 153, 376-380.

29
Hagberg, M., Silverstein, B., Wells, R., Smith, M., Hendrick, Carayon, P. et al. , Work
Related Musculoskeletal Disorders: A Reference Book of Prevention. London: Taylor &
Francis; 1995
Hukisson, E.C., 1983. Visual Analogue Scale. In: Melzack, R. editor. Pain and
Measurement and Assessment, New York: Raven Press; 33-37.
Kattel, M.P., Fredricks, T.K., Fernedez, J.E. and Lee, D.C., 1996, The effect of upper-
extremity posture on maximum grip strength, International Journal of Industrial
Ergonomics, 18, 423-421.
Keir, P.J., Bach, J.M., Hudes, M. and Rempel, D.M., 2007. Guidelines for Wrist Posture
Based on Carpal Tunnel Pressure Thresholds. Human Factors 49, 88-99.
Khan, A.A., O’Sullivan, L.W. and Gallwey, T.J., 2009a. Effects of combined wrist
deviation and forearm rotation on discomfort score. Ergonomics, 52, 345-361.
Khan, A.A., O’Sullivan, L.W. and Gallwey, T.J., 2009b, Effects of combined wrist
flexion/extension and forearm rotation and two levels of relative force on discomfort,
Ergonomics, 52, 1265–1275.
Labus, J.S., Keefe, F.J., and Jensen, M.P., 2003. Self reports of pain intensity and direct
observations of pain behavior: when are they correlated?. Pain 102, 109-124.
Li, K.W., 2002. Ergonomic design and evaluation of wire tying hand tools. International
Journal of Industrial Ergonomics. 30, 149-161.
Li, K.W., 2003. Ergonomic evaluation of a fixture used for power driven wire-tying hand
tools. International Journal of Industrial Ergonomics 32, 71-79.
Lin, J. H., Radwin, R.G. and Richard, T.G., 1997. Dynamic biomechanical model of the
hand and arm in pistol grip power hand tool usage. Ergonomics 44, 295 – 312.
Marshall, M.M., Mozrall, J.R. and Shealy, J.E., 1999. The effects of complex wrist and
forearm posture on wrist range of motion. Human Factors 41, 205-213.
30
McGorry, R.W., Dempsey, P.G., Dowd, P.C., Assessment of grip forces and cutting
moments associated with red meat packing. In: McCabe, P.T. editor, Contemporary
Ergonomics. London: Taylor and Francis; 2002. 117-121.
Mirka, G.A., Shivers, C., Smith, C. and Taylor, J., 2002, Ergonomics interventions for the
furniture manufacturing industry, Part II-Hand tools, International Journal of Industrial
Ergonomics, 29, 275-287.
Mogk, J.P.M., and Keir, P.J., 2003., The effects of posture on forearm muscle loading
during gripping. Ergonomics 46, 956-975.
Moore, A., Wells, R., and Ranney, D., 1991., Quantifying exposure in occupational
manual tasks with cumulative trauma disorder potential. Ergonomics 34, 1433-1453.
Muckler, F.A. and Seven, S.A., 1992. Selecting performance measures: “Objective” versus
“Subjective” measurement. Human Factors 34, 441-455.
Mukhopadhyay, P., O’Sullivan, L.W., and Gallwey, T. J., 2007a. Estimating upper limb
discomfort level due to intermittent isometric pronation torque with various combinations
of elbow angles, forearm rotation angles, force and frequency with upper arm at 900
abduction. International Journal of Industrial Ergonomics. 37, 313–325.
Mukhopadhyay, P., O’Sullivan, L.W., and Gallwey, T. J., 2007b. Effects of upper arm
articulations on shoulder-arm discomfort profile in a pronation task. Occupational
Ergonomics 7, 169-181.
O’Sullivan, L.W., and Gallwey, T. J., 2005. Forearm torque strengths and discomfort
profiles in pronation and supination. Ergonomics 48, 703 – 721.
Paschoarelli, L.C., Beatriz de Oliveria, A.A. and Gil Coury, H.J.C.G., 2008, Assessment of
the Ergonomics Design of Diagnostic Ultrasound Transducers Through Wrist Movements
and Subjective Evaluation, International Journal of Industrial Ergonomics, 38, 999-1006.

31
Putz-Anderson, V., Cumulative trauma disorders: a manual for musculoskeletal diseases of
the upper limbs. London: Taylor & Francis; 1988.
Revees, K. B. and Young, L. C., 2003. Interaction effects of wrist and forearm posture on
the prediction of carpal tunnel syndrome cases within a fish-processing facility. Human
and Ecological Risk Assessment. 9, 1011-1022.
Silverstein, B.A., 1985. The Prevalence of Upper Extremity Cumulative Trauma Disorders
in industry. Ph.D. thesis. AnnArbor: University of Michigan. University Microfilms
International. Michigan.
Silverstein, B.A., Fine, L.J. and Armstrong, T.J., 1986. Hand wrist cumulative trauma
disorders in industry. British Journal of Industrial Medicine 43, 779-784.
Smith, E.M., Sonstegard, D.A. and Anderson, W.H., 1977. Carpal tunnel syndrome:
contribution of flexor tendons. Archives of Physical Medicine and Rehabilitation 58, 379-
385.
Snook, S. H., Vaillancourt, D. R., Ciriello, V. M., and Webster, B. S., 1995.
Psychophysical studies of repetitive wrist flexion and extension. Ergonomics 38, 1488-
1507.
Sperling, L., Dahlman, S., Wikström, L., Kilbom, Å., Kadefors, R., 1993. A cube model
for the classification of work with hand tools and the formulation of functional
requirements. Applied Ergonomics 24, 212-220.
Tanaka, S. and McGlothlin, D.J., 1993. A conceptual quantitative model for prevention of
work related carpal tunnel syndrome (CTS). International Journal of Industrial Ergonomics
11, 181-193.
Treaster, D.E. and Burr, D., 2004. Gender differences in prevalence of upper extremity
musculoskeletal disorders. Ergonomics 47, 495-526.
32
Toomingas, A. and Gavhed, D., 2008, Workstation layout and work postures at call centers
in Sweden in relation to national law, EU directives and ISO standards, and to operators
comfort and symptoms, International Journal of Industrial Ergonomics, 38, 1051-1061.
Wilhelm, G.A. and Hallbeck, M.S., The effects of gender, wrist angle, exertion direction,
angular velocity, and simultaneous grasp force on isokinetic wrist torque. In:. Seppala, P.
Luopajarvi, T. Nygard C. and Mattila M., editors. Proceedings of the 13th Triennial
Congress of the International Ergonomics Association, Tampere: International Ergonomics
Association; 1997. 126 – 128.
You, H, and Kwon, O., 2005, A survey of repetitiveness assessment methodologies for
hand-intensive tasks, International Journal of Industrial Ergonomics, 35, 353-360.
33
List of Figures
Figure 1 The postures used as independent variables for the experimental task
Figure 2 Experimental rig
Figure 3 Screen Shot of LABVIEW6i VI for recording of wrist flexion MVC
Figure 4 Screen shot of LABVIEW6i VI for recording discomfort score
Figure 5 Scale used for recording endurance time
Figure 6 TDS for forearm rotation by frequency
Figure 7 TDS for flexion/extension by frequency
Figure 8 TDS for deviation by frequency
Figure 9 Endurance time and flexion MVC vs. participant in increasing order of RDS
Figure 10 TDS vs. rotation of forearm by deviation
Figure 11 Discomfort responses for body parts of the wrist and forearm system
34
Figure 1 The postures used as independent variables for the experimental task

35
Figure 2 Experimental Rig

36
Figure 3 Screen Shot of LABVIEW6i VI for recording of wrist flexion MVC
37
Figure 4 Screen shot of LABVIEW6i VI for recording discomfort score
38
Figure 5 Scale used for recording endurance time
39
Figure 6 TDS for forearm rotation by frequency

40
Figure 7 TDS for flexion/extension by frequency
41
Figure 8 TDS for deviation by frequency

42
0
20
40
60
80
100
120
140
160
180
16 15 17 19 9 14 2 6 3 18 13 1 8 20 5 7 10 4 12 11
Participant's Number as per increasing values of mean RDS
EndTime (seconds)
flexion MVC (N)
Figure 9 Endurance time and flexion MVC vs. Participant in increasing order of RDS

43
Figure 10 TDS vs. rotation by deviation

44
0
50
100
150
200
250
300
350
400
450
500
Hand Wrist Forearm Elbow
Subje
ct's r
esponse o
f dis
com
fort
on w
rist
and
fore
arm
syste
m (
No.
of
responses)
Figure 11 The response of discomfort on body parts map of the wrist and forearm
system
45
List of Tables
Table 1 Wrist flexion MVC (N) for posture combinations
Table 2 Raw Discomfort Scores for posture combinations
Table 3 Standardised Discomfort Scores for posture combinations
Table 4 ANOVA Table for TDS values
Table 5 Mean ROM values of wrist/forearm deviations (degrees) from the present
and other studies

46
Table 1 Wrist flexion MVC (N) for posture combinations
Forearm Rotation
Mean
(SD) Prone 60%ROM Neutral Supine 60%ROM
Wrist Flexion /
Extension↓
Wrist
deviation↓ Mean (SD) Mean (SD) Mean (SD)
35% ROM
Flexion
Radial 35% ROM 53.83 (22.77) 66.98 (22.75) 59.55 (24.04) 63.03
(22.4) Neutral 59.05 (25.27) 74.51 (27.29) 60.80 (25.43)
Ulnar 35% ROM 58.29 (22.71) 71.83 (27.69) 62.45 (20.70)
Neutral
Radial 35% ROM 59.27 (27.09) 78.81 (32.99) 55.18 (24.94) 69.01
(25.5) Neutral 66.75 (27.68) 83.80 (33.26) 66.78 (22.92)
Ulnar 35% ROM 66.32 (24.95) 83.27 (29.64) 60.92 (18.21)
35% ROM
Extension
Radial 35% ROM 62.65 (17.46) 67.62 (25.36) 54.43 (19.92) 64.21
(19.9) Neutral 69.39 (20.79) 71.82 (25.75) 61.10 (21.06)
Ulnar 35% ROM 63.10 (19.59) 71.41 (25.19) 56.39 (20.84)
Mean (SD) 62.07 (21.8) 74.45 (26.5) 59.73 (iff)
Wrist deviation
R 35% ROM Neutral U 35% ROM
Mean (SD) 62.04 (22.1) 68.22 (24.4) 66.00 (21.8)
47
Table 2 Raw Discomfort Scores for posture combinations (neutral posture values in
bold)
Forearm rotation
10 exertions/minute 20 exertions/minute
Prone
60%ROM Neutral
Supine
60%ROM
Prone
60%ROM Neutral
Supine
60%ROM
Wrist
flexion /
extension
(ROM)↓
Wrist
deviation
(ROM)↓
Mean (SD) Mean (SD) Mean (SD) Mean (SD) Mean (SD) Mean (SD)
35% ROM
Flexion
Radial 35% ROM 2.66 (1.44) 1.71 (1.40) 2.65 (1.89) 3.63 (1.99) 2.11 (1.62) 3.49 (1.87)
Neutral 2.22 (1.37) 1.71 (1.18) 2.59 (1.58) 2.96 (1.68) 2.11 (1.48) 3.20 (1.75)
Ulnar 35% ROM 2.53 (1.58) 1.79 (1.31) 2.99 (1.72) 3.51 (1.78) 2.17 (1.45) 3.37 (1.88)
Neutral
Radial 35% ROM 2.66 (2.27) 1.52 (1.07) 2.30 (1.46) 3.06 (2.08) 1.92 (1.20) 3.01 (1.40)
Neutral 1.93 (1.49) 1.50 (1.04) 2.04 (1.32) 2.35 (1.75) 1.70 (1.20) 2.59 (1.64)
Ulnar 35% ROM 2.23 (1.58) 1.82 (1.24) 2.38 (1.60) 2.55 (1.87) 1.82 (1.30) 2.98 (1.86)
35% ROM
Extension
Radial 35% ROM 2.71 (2.71) 1.55 (1.08) 2.55 (1.71) 3.35 (1.66) 1.86 (1.27) 3.19 (1.93)
Neutral 2.32 (1.44) 1.48 (0.97) 1.87 (1.20) 2.85 (1.59) 1.85 (1.19) 2.64 (1.46)
Ulnar 35% ROM 2.54 (1.72) 1.76 (1.17) 2.70 (1.60) 3.03 (1.97) 2.15 (1.38) 3.24 (1.69)

48
Table 3 Standardised Discomfort Scores for posture combinations
Forearm rotation
10 exertions/minute 20 exertions/minute
Prone
60%ROM Neutral
Supine
60%ROM
Prone
60%ROM Neutral
Supine
60%ROM
Wrist
Flexion /
Extension
(ROM)↓
Wrist
deviation
(ROM)↓
Mean (SD) Mean (SD) Mean (SD) Mean (SD) Mean (SD) Mean (SD)
35% ROM
Flexion
Radial 35% ROM 4.59 (1.83) 2.14 (1.71) 4.27 (2.72) 6.70 (2.28) 3.09 (2.03) 6.64 (2.51)
Neutral 3.50 (1.86) 2.30 (1.82) 4.36 (2.46) 5.35 (2.74) 3.21 (2.15) 5.80 (2.23)
Ulnar 35% ROM 4.16 (2.18) 2.42 (1.99) 5.53 (2.66) 6.46 (2.38) 3.37 (2.04) 6.30 (2.98)
Neutral
Radial 35% ROM 4.12 (2.80) 1.81 (1.35) 3.62 (2.15) 5.24 (2.41) 2.78 (1.50) 5.56 (2.24)
Neutral 2.72 (2.00) 1.69 (1.87) 3.04 (1.99) 3.76 (2.39) 2.23 (1.93) 4.24 (2.15)
Ulnar 35% ROM 3.40 (2.16) 2.59 (2.42) 3.72 (2.30) 4.33 (2.68) 2.58 (1.68) 5.36 (2.99)
35% ROM
Extension
Radial 35% ROM 4.84 (2.15) 1.93 (1.44) 3.92 (2.46) 6.20 (2.25) 2.63 (1.37) 5.74 (2.58)
Neutral 3.55 (2.08) 1.77 (1.65) 2.55 (2.19) 4.88 (2.34) 2.69 (2.24) 4.54 (2.17)
Ulnar 35% ROM 4.15 (2.14) 2.43 (2.07) 4.34 (2.48) 5.32 (2.66) 3.26 (2.00) 5.76 (2.18)
49
Table 4 ANOVA Table for TDS values
Source Type III Sum of
Squares
df Mean
Square
F Sig. (p-
value)
Forearm Rotation (PS) 3.586 2 1.793 17.764 0.001
Wrist Flex./Ext. (FE) 0.422 2 0.211 8.785 0.001
Wrist Deviation (RU) 0.311 2 0.155 14.916 0.001
Frequency (FR) 1.124 1 1.124 73.829 0.001
Participant 29.968 19 1.577 13.742 0.001
PS * FE 0.106 4 0.026 1.519 0.205
PS * RU 0.177 4 0.044 4.911 0.001
FE * RU 0.030 4 0.007 0.928 0.452
PS * FE * RU 0.051 8 0.006 0.646 0.738
PS * FR 0.052 2 0.026 2.934 0.065
FE * FR 0.028 2 0.014 1.907 0.162
PS * FE * FR 0.032 4 0.008 1.654 0.169
RU * FR 0.024 2 0.012 3.161 0.054
PS * RU * FR 0.009 4 0.002 0.476 0.753
FE * RU * FR 0.015 4 0.004 1.172 0.330
PS * FE * RU * FR 0.035 8 0.004 1.034 0.413
PS * Participant 3.836 38 0.101 5.075 0.001
FE * Participant 0.912 38 0.024 1.266 0.218
PS * FE * Participant 1.324 76 0.017 1.655 0.009
RU * Participant 0.396 38 0.010 1.493 0.213
PS * RU * Participant 0.684 76 0.009 0.850 0.771
FE * RU * Participant 0.608 76 0.008 0.896 0.688
PS * FE * RU * Participant 1.495 152 0.010 2.344 0.001
FR * Participant 0.289 19 0.015 1.358 0.231
PS * FR * Participant 0.340 38 0.009 2.132 0.001
FE * FR * Participant 0.279 38 0.007 1.750 0.010
PS * FE * FR * Participant 0.371 76 0.005 1.163 0.213
RU * FR * Participant 0.147 38 0.004 0.922 0.603
PS * RU * FR * Participant 0.376 76 0.005 1.179 0.196
FE * RU * FR * Participant 0.250 76 0.003 0.786 0.880
PS * FE * RU * FR * Participant (Residual) 0.638 152 0.004 . .
Total 47.916 1079
50
Table 5 Mean ROM values of wrist/forearm deviations (degrees) from the present
and other studies
Study Wrist
Flexion
Wrist
Extension
Radial
Deviation
Ulnar
Deviation
Prone
Rotation
Supine
Rotation
Present Study 710 56
0 16
0 51
0 45
0 48
0
Kee & Karwowski (2001b) 720 65
0 29
0 50
0 87
0 119
0
Donna et al. (1979) 76.40 74.9
0 21.5
0 36.0
0 75.8
0 82.1
0
Amer. Acad. of Orthop. Surg.
(1965)
730 71
0 19
0 33
0 71
0 84
0