Evaluating the influence of different vegetation biomes on the global climate
24
P. K. Snyder Æ C. Delire Æ J. A. Foley Evaluating the influence of different vegetation biomes on the global climate Received: 24 October 2003 / Accepted: 5 March 2004 / Published online: 29 July 2004 ȑ Springer-Verlag 2004 Abstract The participation of different vegetation types within the physical climate system is investigated using a coupled atmosphere-biosphere model, CCM3-IBIS. We analyze the effects that six different vegetation biomes (tropical, boreal, and temperate forests, savanna, grassland and steppe, and shrubland/tundra) have on the climate through their role in modulating the biophysical exchanges of energy, water, and momentum between the land-surface and the atmo- sphere. Using CCM3-IBIS we completely remove the vegetation cover of a particular biome and compare it to a control simulation where the biome is present, thereby isolating the climatic effects of each biome. Results from the tropical and boreal forest removal simulations are in agreement with previous studies while the other simulations provide new evidence as to their contribution in forcing the climate. Removal of the temperate forest vegetation exhibits behavior characteristic of both the tropical and boreal simula- tions with cooling during winter and spring due to an increase in the surface albedo and warming during the summer caused by a reduction in latent cooling. Re- moval of the savanna vegetation exhibits behavior much like the tropical forest simulation while removal of the grassland and steppe vegetation has the largest effect over the central United States with warming and drying of the atmosphere in summer. The largest cli- matic effect of shrubland and tundra vegetation re- moval occurs in DJF in Australia and central Siberia and is due to reduced latent cooling and enhanced cold air advection, respectively. Our results show that re- moval of the boreal forest yields the largest tempera- ture signal globally when either including or excluding the areas of forest removal. Globally, precipitation is most affected by removal of the savanna vegetation when including the areas of vegetation removal, while removal of the tropical forest most influences the global precipitation excluding the areas of vegetation removal. 1 Introduction A rapid increase in human population and develop- ment pressures has put a considerable strain on the Earth’s ecosystems. A large portion of the Earth’s surface has already been modified for urban and industrial development, agriculture, and pastureland. Nearly 35% of the land surface (approximately 55 million km 2 ) has been modified as a direct result of human interaction with the landscape (Ramankutty and Foley 1999). Of the remaining land surface, the tropical rainforests of South America, Africa, and Southeast Asia are among the ecosystems most at risk due to demographic pressure in these regions. Other ecosystems are not spared however; as the population and development pressures increase, the demand for natural resources, forest and agricultural products also increases, putting at risk natural ecosystems across the entire planet. Along with these changes in the Earth’s terrestrial ecosystems, there may also be a corresponding change in the climate. Vegetation and soils exchange water, en- ergy, and momentum with the atmosphere. Given that the atmosphere can be acutely sensitive to changes in the surface fluxes of water, energy, and momentum, a given change in any one of these fluxes can have a significant impact on the thermodynamics and the general circula- tion of the atmosphere. These changes can in turn influence the same regions where the land surface has P. K. Snyder (&) Æ C. Delire Æ J. A. Foley Center for Sustainability and the Global Environment (SAGE), Nelson Institute for Environmental Studies, University of Wisconsin, 1710, University Avenue Madison, WI 53726, USA E-mail: [email protected] P. K. Snyder Æ J. A. Foley Department of Atmospheric and Oceanic Sciences, University of Wisconsin, 1225 West Dayton Street, Madison, WI 53706, USA Climate Dynamics (2004) 23: 279–302 DOI 10.1007/s00382-004-0430-0
Transcript of Evaluating the influence of different vegetation biomes on the global climate
P. K. Snyder Æ C. Delire Æ J. A. Foley
Evaluating the influence of different vegetation biomeson the global climate
Received: 24 October 2003 / Accepted: 5 March 2004 / Published online: 29 July 2004 Springer-Verlag 2004
Abstract The participation of different vegetation typeswithin the physical climate system is investigated usinga coupled atmosphere-biosphere model, CCM3-IBIS.We analyze the effects that six different vegetationbiomes (tropical, boreal, and temperate forests,savanna, grassland and steppe, and shrubland/tundra)have on the climate through their role in modulatingthe biophysical exchanges of energy, water, andmomentum between the land-surface and the atmo-sphere. Using CCM3-IBIS we completely remove thevegetation cover of a particular biome and compare itto a control simulation where the biome is present,thereby isolating the climatic effects of each biome.Results from the tropical and boreal forest removalsimulations are in agreement with previous studieswhile the other simulations provide new evidence as totheir contribution in forcing the climate. Removal ofthe temperate forest vegetation exhibits behaviorcharacteristic of both the tropical and boreal simula-tions with cooling during winter and spring due to anincrease in the surface albedo and warming during thesummer caused by a reduction in latent cooling. Re-moval of the savanna vegetation exhibits behaviormuch like the tropical forest simulation while removalof the grassland and steppe vegetation has the largesteffect over the central United States with warming anddrying of the atmosphere in summer. The largest cli-matic effect of shrubland and tundra vegetation re-moval occurs in DJF in Australia and central Siberiaand is due to reduced latent cooling and enhanced cold
air advection, respectively. Our results show that re-moval of the boreal forest yields the largest tempera-ture signal globally when either including or excludingthe areas of forest removal. Globally, precipitation ismost affected by removal of the savanna vegetationwhen including the areas of vegetation removal, whileremoval of the tropical forest most influences theglobal precipitation excluding the areas of vegetationremoval.
1 Introduction
A rapid increase in human population and develop-ment pressures has put a considerable strain on theEarth’s ecosystems. A large portion of the Earth’ssurface has already been modified for urban andindustrial development, agriculture, and pastureland.Nearly 35% of the land surface (approximately55 million km2) has been modified as a direct result ofhuman interaction with the landscape (Ramankuttyand Foley 1999). Of the remaining land surface, thetropical rainforests of South America, Africa, andSoutheast Asia are among the ecosystems most at riskdue to demographic pressure in these regions. Otherecosystems are not spared however; as the populationand development pressures increase, the demand fornatural resources, forest and agricultural products alsoincreases, putting at risk natural ecosystems across theentire planet.
Along with these changes in the Earth’s terrestrialecosystems, there may also be a corresponding change inthe climate. Vegetation and soils exchange water, en-ergy, and momentum with the atmosphere. Given thatthe atmosphere can be acutely sensitive to changes in thesurface fluxes of water, energy, and momentum, a givenchange in any one of these fluxes can have a significantimpact on the thermodynamics and the general circula-tion of the atmosphere. These changes can in turninfluence the same regions where the land surface has
P. K. Snyder (&) Æ C. Delire Æ J. A. FoleyCenter for Sustainability and the Global Environment (SAGE),Nelson Institute for Environmental Studies,University of Wisconsin, 1710, University Avenue Madison,WI 53726, USAE-mail: [email protected]
P. K. Snyder Æ J. A. FoleyDepartment of Atmospheric and Oceanic Sciences,University of Wisconsin, 1225 West Dayton Street,Madison, WI 53706, USA
Climate Dynamics (2004) 23: 279–302DOI 10.1007/s00382-004-0430-0

been altered or regions far removed from the originalsurface forcing.
Many modeling-based studies have been undertakento determine the influence of particular vegetation typesor biomes on land surface biophysical processes and thephysical climate system. Early work on land use changeand its role in forcing the atmosphere (in particular,focusing on drought mechanisms of the Sahel) wasproposed by Charney (1975), and Charney et al. (1975,1977). Since Charney (1975) introduced the problem ofland use change and its influence on the climate, manyother studies have been undertaken in the last 25 years;most notably in the tropical rainforest biome of SouthAmerica, Africa, and Southeast Asia (Dickinson andHenderson-Sellers 1988; Sud et al. 1988; Lean andWarrilow 1989; Nobre et al. 1991; Dickinson and Ken-nedy 1992; Henderson-Sellers et al. 1993; Eltahir 1996;Sud et al. 1996; Zhang et al. 1996a,b; Lean and Rown-tree 1997; Costa and Foley 2000; Delire et al. 2001).Moreover, Thomas and Rowntree (1992), Bonan et al.(1992), and Foley et al. (1994) explored the role of theboreal forest on the climate and found that feedbacksexist that act to change the climate as a result of changesin the surface albedo between boreal forest and baresnow. Other studies have explored the relationship be-tween historical land use change in North America andtrends in the climate record (Bonan 1997, 1999, 2001). Acomprehensive review of land surface schemes designedfor climate models and a summary of the importantprocesses that need to be modeled is provided by Pitman(2003). Furthermore, a comprehensive review of atmo-sphere-biosphere process for different biomes can befound in Bonan (2002).
Although these studies have improved our under-standing of the effects of particular vegetation types onland surface processes and the atmosphere, no compre-hensive analysis has yet been undertaken to describe theeffect of each biome on the climate system. However,two studies have considered the effects of vegetationextremes on the atmosphere (Fraedrich et al. 1999;Kleidon et al. 2000). In these studies, vegetation ex-tremes were defined as either a global land cover of thickforest or bare desert. The difference between tempera-ture, precipitation, and energy in the two extremes leadsto an improved understanding of the role of the energyand water cycling in maintaining the climate systemas well as identification of geographic regions thatmay be especially sensitive to biosphere-atmosphereinteractions. However, a more recent study of globaldeforestation using a three-dimensional coupled atmo-sphere-sea-ice-ocean-vegetation model has shown that amuch stronger response of the climate system occurswhen interactive sea surface temperatures are used(Renssen et al. 2003).
Nevertheless, there has still been no systematic studythat examines how each of the major vegetation biomesof the planet affects the climate. Here we attempt toaddress these questions in a comprehensive manner byexamining the influence of six major biomes on the cli-
mate using a coupled atmosphere-biosphere model.Using this approach we can identify the vegetation typesand geographic locations that are most important ininfluencing the climate.
To achieve this goal we use a coupled atmosphere-biosphere model consisting of an atmospheric generalcirculation model (AGCM) and a detailed land surfacemodel. A specific vegetation biome is completelyremoved and replaced with desert (bare soil and novegetation). The vegetation biomes included in thisstudy are the tropical, temperate, and boreal forests,savanna, grassland and steppe, and shrubland andtundra. The response of the climate to the simulationwith the vegetation removed is compared to a controlsimulation with potential vegetation. (Potential vege-tation is defined as the vegetation that would exist in alocation in the absence of anthropogenic land usechange). The difference in the climate between the twosimulations is representative of the maximum influencethat particular vegetation type may have on the cli-mate. While completely removing the vegetation of aparticular type may be unrealistic for most regions ofthe world, it does represent a theoretical maximumsignal of the vegetation’s influence on the climatesystem. By approaching the problem in this way thebiophysical and atmospheric mechanisms responsiblefor forcing the climate can be determined as well as thevegetation types and geographic regions that are mostinfluential.
2 Description of the coupled atmosphere-biospheremodel, CCM3-IBIS
We use the coupled atmosphere-biosphere model,CCM3-IBIS (Delire et al. 2002). This model has beenwell tested by Delire et al. (2002) and the simulated cli-mate compares favorably to the observed climate for the1961–1990 period using the CRU05 data set (New et al.1999). The atmospheric component of the coupledmodel is the Community Climate Model (CCM3) ver-sion 3.2 (Kiehl et al. 1998a). CCM3 is a fully dynamicatmospheric model that supports a variety of spatialresolutions, 18 vertical levels, and a 20-min time step.This version of CCM3 more accurately portrays thedynamical processes (Hurrell et al. 1998) and energybudget (Kiehl et al. 1998b) than its predecessor, CCM2.Furthermore, new to CCM3 is a more representativeprecipitation model that includes both shallow and deepconvective schemes as well as large-scale precipitationestimates (Hack et al. 1998). This revised precipitationmodel eliminates the overactive hydrology of the CCM2model and more accurately portrays precipitation andconvective processes.
CCM3 is coupled to the Integrated Biosphere Sim-ulator (IBIS) version 2.1 (Foley et al. 1996; Kuchariket al. 2000). IBIS is a global model of terrestrial eco-system processes that represents the physical, physio-logical, and ecological processes occurring in vegetation
280 Snyder et al.: Evaluating the influence of different vegetation biomes on the global climate

and soils in a coherent and semi-mechanistic way. IBISsimulates land surface processes (energy and waterbalance), vegetation phenology (budburst and senes-cence), and vegetation dynamics (competition betweenvegetation types). IBIS calculates these processes on aspatial and temporal scale consistent with that of theAGCM spatial and temporal resolutions. IBIS repre-sents vegetation as two layers (taller ‘‘trees’’ and short‘‘shrubs’’ and ‘‘grasses’’). In IBIS a grid cell can con-tain one or more plant functional types (PFTs) thattogether comprise a vegetation type (Foley et al. 1996).For instance, the tropical evergreen forest vegetationtype (that is part of the tropical forest biome) isdominated by the tropical evergreen tree PFT but alsocontains the tropical broadleaf deciduous tree PFT aswell as some shrub and grass PFTs. Soil is representedwith six layers in the model and simulates temperature,water, and ice content down to a depth of 4 m. Canopyphotosynthesis is realistically modeled using the C3 andC4 physiology scheme of Farquhar et al. (1980). Can-opy stomatal conductance (Collatz et al. 1991; 1992)and respiration (Amthor 1984) are also calculated toestablish a link between the exchanges of energyand water from the vegetation and the atmosphere.Budburst and senescence are determined by climaticfactors.
We run the model with a fixed vegetation distribu-tion, so that vegetation structure and biogeography arenot allowed to change in response to the climate. IBISuses a prescribed ‘‘potential vegetation’’ distributionrepresenting the vegetation that would exist in theabsence of anthropogenic land use change (Ramankuttyand Foley 1999). The soil texture is defined inIBIS according to the IGBP-DIS global griddedtexture database (International Geosphere-Biosphere
Programme – Data and Information System), (IGBP-DIS 1999).
3 Simulation design
In order to determine the role that different vegetationtypes have on the climate system, we employ a system-atic modeling approach whereby vegetation removalsimulations are performed for six groups of vegetationtypes. Although there are 15 vegetation classes defined inIBIS, computing constraints require the grouping ofphysiologically and geographically similar vegetationclasses. For example, the tropical biome simulation usesan aggregation of the tropical evergreen forest andwoodland class, the tropical deciduous forest andwoodland class, and certain cells of the mixed forest andwoodland class into one tropical forest biome. Table 1lists the suite of simulations presented in this study, theIBIS vegetation types used in each simulation, theapproximate land surface area for which the vegetationwas removed, and the percentage of the total land areaof the Earth for that biome. Figure 1 shows the distri-bution of the biomes as defined in this study.
A total of seven simulations were run: a control runusing potential vegetation (all biomes intact, and in their‘‘natural’’ locations) and six vegetation removal runs(where different biomes are removed, replaced by desert,one at a time). In this context vegetation removal meansthat a cell’s vegetation is completely removed and re-placed with desert (bare soil and no vegetation). Each ofthe simulations was run at a spectral resolution of T31(33.75� · 3.75� latitude/longitude grid). All atmo-spheric and most land surface calculations were run at atemporal resolution of 20-min. In order to isolate the
Table 1 Description of simulations presented in this study. Percentages of area affected represent the portion of the total land area of theearth. 1014 vegetated cells (121 994 300 km2) out of 4608 cells (145 911 370 km2) are used in this study. This does not include deserts or thepolar regions of Greenland and Antarctica
Simulation name Description IBIS vegetation removed Number ofcells changed
Area affected (km2)
Control Potential vegetation No vegetation removed 0 0
Tropical Forest Tropical Forest-Control Tropical evergreen forest/woodland 136 22 728 580 (16%)Tropical deciduous forest/woodlandMixed forest/woodland
Boreal Forest Boreal Forest-Control Boreal evergreen forest/woodland 263 22 429 940 (15%)Boreal deciduous forest/woodlandMixed forest/woodland
Temperate Forest Temperate Forest-Control Temperate evergreen broadleafforest/woodland
173 19 011 680 (13%)
Temperate evergreen coniferforest/woodlandTemperate deciduousforest/woodlandMixed forest/woodland
Savanna Savanna-Control Savanna 121 19 078 920 (13%)Grassland and Steppe Grassland and Steppe-Control Grassland and steppe 112 14 120 550 (10%)Shrubland/Tundra Shrubland/Tundra-Control Dense shrubland 209 24 624 630 (17%)
Open shrublandTundra
Snyder et al.: Evaluating the influence of different vegetation biomes on the global climate 281

effect of the vegetation alone, we ran all simulations withclimatologically prescribed sea-surface temperatures(SSTs) and a fixed atmospheric CO2 concentration of350 ppmv. While we acknowledge that prescribed SSTsare not as physically representative as interactive SSTs,especially in high-latitude regions, it is necessary to limitwhat can change so that we may isolate the climateforcing due to removal of a particular vegetation type.However, there are certainly important feedbacksoperating between the vegetation, atmosphere, ocean,sea-ice, and surface albedo that must be represented fora more detailed modeling of the climate system as awhole (Bonan et al. 1992; Ganopolski et al. 2001;Brovkin et al. 2003).
Each of the seven simulations was run for 25 years.The last 20 years of each run are used for averaging and
all results present in this paper are significant at the 95%confidence level using a Student’s t-test. The statisticalsignificance was computing independently for themonthly, seasonal, and annual results.
4 Effects of tropical forests on climate
An early study by Dickinson and Henderson-Sellers(1988) explored how tropical deforestation could affectthe local and regional climate by using a land-surfacemodel coupled to an AGCM. Dickinson and Hender-son-Sellers (1988) quantified the biophysical changes inthe aerodynamic roughness and the correspondingreduction in the turbulent exchange of water, energy,and momentum between the surface and the PBL as well
Fig. 1 Global distribution of the six potential vegetation biomesdefined in this study at T31 spatial resolution. Each biome includesone or more vegetation types as defined in the IBIS land-surfacemodel. The ‘Temperate and Boreal Forest’ class represents the cells
that are included in both the temperate and the boreal deforestationsimulations since they contain vegetation representative of bothecosystems
282 Snyder et al.: Evaluating the influence of different vegetation biomes on the global climate
as modification to the surface radiation budget and thewater cycle. Dickinson and Henderson-Sellers (1988)concluded that deforestation of the Amazon could resultin a temperature increase of 3–5 �C when forest land wasconverted to grassland. More recent Amazon defores-tation studies have been conducted with a variety ofresults, however all the studies found a warming of thesurface air temperature, a reduction in evapotranspira-tion, and most all found a reduction in precipitation(Lean and Warrilow 1989; Nobre et al. 1991b; Dickin-son and Kennedy 1992; Henderson-Sellers et al. 1993;Lean and Rowntree 1993, 1997; Polcher and Laval 1994;Hahmann and Dickinson 1997; Costa and Foley 2000).A summary of recent AGCM studies in the Amazonbasin is provided by Costa and Foley (2000).
Although many AGCM studies have found a decreasein precipitation from large-scale tropical deforestation,several higher-resolution and well parameterized
modeling studies have shown the opposite effect formore sporadic deforestation. A recent mesoscale mod-eling study has found that sporadic deforestation ofthe tropical rainforests can lead to an increase inprecipitation through changes to the synoptic circulationpatterns that affect the transport of heat and moisture(Baidya Roy and Avissar 2002). Furthermore, a study byDias et al. (2002) has explored the effect that tropicaldeforestation has on cloud formation due to a reductionin cloud condensation nuclei (CCN) from biogenicorigins.
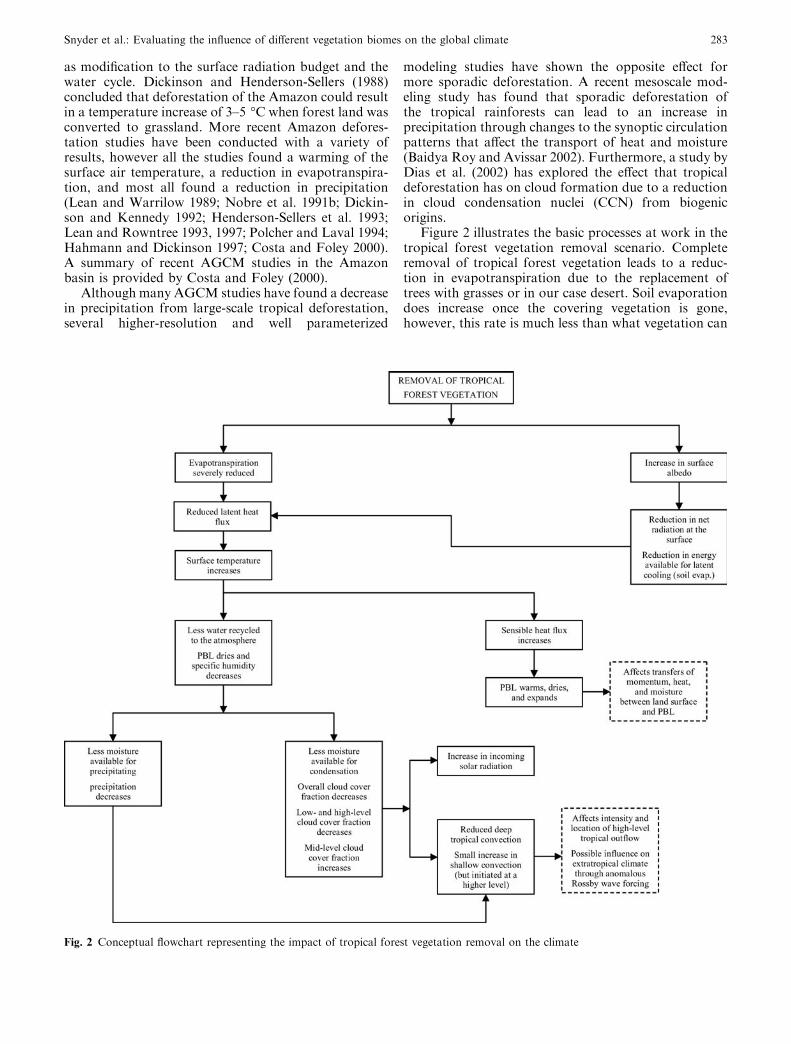
Figure 2 illustrates the basic processes at work in thetropical forest vegetation removal scenario. Completeremoval of tropical forest vegetation leads to a reduc-tion in evapotranspiration due to the replacement oftrees with grasses or in our case desert. Soil evaporationdoes increase once the covering vegetation is gone,however, this rate is much less than what vegetation can
Fig. 2 Conceptual flowchart representing the impact of tropical forest vegetation removal on the climate
Snyder et al.: Evaluating the influence of different vegetation biomes on the global climate 283
transpire for a given time period. An increase in thesurface albedo with vegetation removal reduces the netradiation absorbed at the surface and acts to cool thesurface; however, the effect of reduced evapotranspira-tion is much larger than the albedo effect and the sur-face temperature increases. Lower evapotranspirationrates lead to a drier planetary boundary layer as lesswater is transported to the atmosphere from the sur-face. Moisture convergence can act to partially offsetthe reduction, however the overall result is that theatmosphere dries, less precipitation falls, and waterrecycling is reduced.
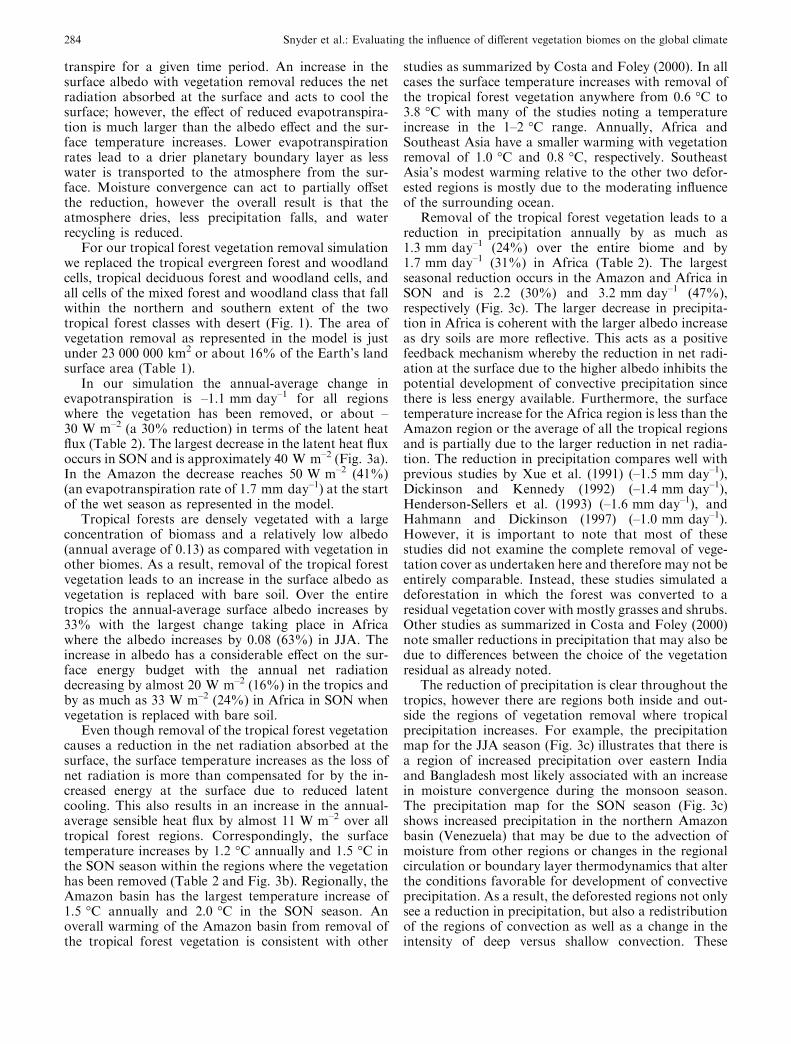
For our tropical forest vegetation removal simulationwe replaced the tropical evergreen forest and woodlandcells, tropical deciduous forest and woodland cells, andall cells of the mixed forest and woodland class that fallwithin the northern and southern extent of the twotropical forest classes with desert (Fig. 1). The area ofvegetation removal as represented in the model is justunder 23 000 000 km2 or about 16% of the Earth’s landsurface area (Table 1).
In our simulation the annual-average change inevapotranspiration is –1.1 mm day–1 for all regionswhere the vegetation has been removed, or about –30 W m–2 (a 30% reduction) in terms of the latent heatflux (Table 2). The largest decrease in the latent heat fluxoccurs in SON and is approximately 40 W m–2 (Fig. 3a).In the Amazon the decrease reaches 50 W m–2 (41%)(an evapotranspiration rate of 1.7 mm day–1) at the startof the wet season as represented in the model.
Tropical forests are densely vegetated with a largeconcentration of biomass and a relatively low albedo(annual average of 0.13) as compared with vegetation inother biomes. As a result, removal of the tropical forestvegetation leads to an increase in the surface albedo asvegetation is replaced with bare soil. Over the entiretropics the annual-average surface albedo increases by33% with the largest change taking place in Africawhere the albedo increases by 0.08 (63%) in JJA. Theincrease in albedo has a considerable effect on the sur-face energy budget with the annual net radiationdecreasing by almost 20 W m–2 (16%) in the tropics andby as much as 33 W m–2 (24%) in Africa in SON whenvegetation is replaced with bare soil.
Even though removal of the tropical forest vegetationcauses a reduction in the net radiation absorbed at thesurface, the surface temperature increases as the loss ofnet radiation is more than compensated for by the in-creased energy at the surface due to reduced latentcooling. This also results in an increase in the annual-average sensible heat flux by almost 11 W m–2 over alltropical forest regions. Correspondingly, the surfacetemperature increases by 1.2 �C annually and 1.5 �C inthe SON season within the regions where the vegetationhas been removed (Table 2 and Fig. 3b). Regionally, theAmazon basin has the largest temperature increase of1.5 �C annually and 2.0 �C in the SON season. Anoverall warming of the Amazon basin from removal ofthe tropical forest vegetation is consistent with other
studies as summarized by Costa and Foley (2000). In allcases the surface temperature increases with removal ofthe tropical forest vegetation anywhere from 0.6 �C to3.8 �C with many of the studies noting a temperatureincrease in the 1–2 �C range. Annually, Africa andSoutheast Asia have a smaller warming with vegetationremoval of 1.0 �C and 0.8 �C, respectively. SoutheastAsia’s modest warming relative to the other two defor-ested regions is mostly due to the moderating influenceof the surrounding ocean.
Removal of the tropical forest vegetation leads to areduction in precipitation annually by as much as1.3 mm day–1 (24%) over the entire biome and by1.7 mm day–1 (31%) in Africa (Table 2). The largestseasonal reduction occurs in the Amazon and Africa inSON and is 2.2 (30%) and 3.2 mm day–1 (47%),respectively (Fig. 3c). The larger decrease in precipita-tion in Africa is coherent with the larger albedo increaseas dry soils are more reflective. This acts as a positivefeedback mechanism whereby the reduction in net radi-ation at the surface due to the higher albedo inhibits thepotential development of convective precipitation sincethere is less energy available. Furthermore, the surfacetemperature increase for the Africa region is less than theAmazon region or the average of all the tropical regionsand is partially due to the larger reduction in net radia-tion. The reduction in precipitation compares well withprevious studies by Xue et al. (1991) (–1.5 mm day–1),Dickinson and Kennedy (1992) (–1.4 mm day–1),Henderson-Sellers et al. (1993) (–1.6 mm day–1), andHahmann and Dickinson (1997) (–1.0 mm day–1).However, it is important to note that most of thesestudies did not examine the complete removal of vege-tation cover as undertaken here and therefore may not beentirely comparable. Instead, these studies simulated adeforestation in which the forest was converted to aresidual vegetation cover with mostly grasses and shrubs.Other studies as summarized in Costa and Foley (2000)note smaller reductions in precipitation that may also bedue to differences between the choice of the vegetationresidual as already noted.
The reduction of precipitation is clear throughout thetropics, however there are regions both inside and out-side the regions of vegetation removal where tropicalprecipitation increases. For example, the precipitationmap for the JJA season (Fig. 3c) illustrates that there isa region of increased precipitation over eastern Indiaand Bangladesh most likely associated with an increasein moisture convergence during the monsoon season.The precipitation map for the SON season (Fig. 3c)shows increased precipitation in the northern Amazonbasin (Venezuela) that may be due to the advection ofmoisture from other regions or changes in the regionalcirculation or boundary layer thermodynamics that alterthe conditions favorable for development of convectiveprecipitation. As a result, the deforested regions not onlysee a reduction in precipitation, but also a redistributionof the regions of convection as well as a change in theintensity of deep versus shallow convection. These
284 Snyder et al.: Evaluating the influence of different vegetation biomes on the global climate
changes in convective activity can have a significantimpact on the climate outside of the tropics as themodified tropical outflow teleconnects to the extratrop-ics by the anomalous forcing of Rossby waves (Chaseet al. 2000).
5 Effects of boreal forests on climate
Land cover change in the boreal forest has a significantinfluence on the climate system mostly through changesto the surface radiative energy budget. Changes in thesurface albedo due to snow versus vegetation cover andthe variability of cloud cover combine to stronglyinfluence the radiative balance at the surface. As a result,modest land use changes in the boreal ecosystem canhave a considerable impact on the Northern Hemisphereclimate.
Early research on the interaction of the boreal forestsand the atmosphere has focused on the role of the al-bedo in modifying the surface radiation budget. Thomasand Roundtree (1992) first examined the influence ofchanging the surface albedo on the climate by simulatinga boreal forest-covered surface and a bare snow-coveredsurface. They found an increase in the surface albedo,reductions in net radiation, surface air temperature, andprecipitation, and changes in the snow cover and per-sistence. Bonan et al. (1992, 1995) also explored the roleof the boreal forest ecosystem in influencing the climate.They found that a redistribution of the boreal forestecosystem due to land use change or global warmingcould instigate important climate feedbacks that mightinfluence regions outside the current boundary of theecosystem.
Figure 4 illustrates the important biophysical pro-cesses occurring after complete removal of the borealforest vegetation. Unlike the tropical forest biome, re-moval of the boreal forest vegetation has a large effecton the surface radiative balance because of the strongsnow/ice/albedo feedback. Replacing the forest vegeta-tion with bare ground that will be snow covered in-creases the albedo considerably. The land surfaceresponds by absorbing less net radiation as moreincoming solar radiation is reflected from the surface.The air temperature at the surface will cool considerablyas there is less energy absorbed at the surface. A reducedsensible heat flux occurs because of the colder landsurface and the latent heat flux is also reduced during thegrowing season because of a reduction in evapotrans-piration due to vegetation removal. While the overallresponse of total boreal vegetation removal is to cool theland surface, the climate response is amplified with theaddition of interactive SSTs and sea-ice through a SST/sea-ice/albedo/thermohaline circulation feedback mech-anism (Bonan et al. 1992; Ganopolski et al. 2001;Brovkin et al. 2003).
For this simulation the boreal forest spans two largeregions of the high latitude northern hemisphere (seeFig. 1) and includes the boreal evergreen forest andT
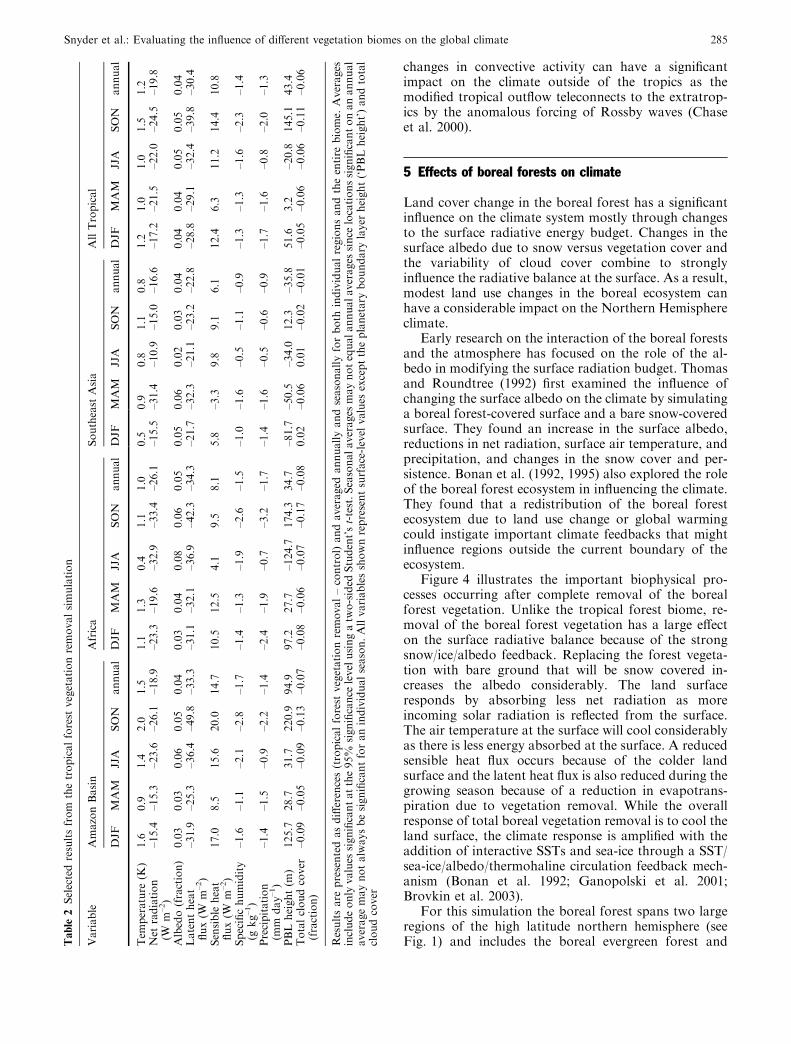
able
2Selectedresultsfrom
thetropicalforest
vegetationremovalsimulation
Variable
AmazonBasin
Africa
Southeast
Asia
AllTropical
DJF
MAM
JJA
SON
annual
DJF
MAM
JJA
SON
annual
DJF
MAM
JJA
SON
annual
DJF
MAM
JJA
SON
annual
Tem
perature
(K)
1.6
0.9
1.4
2.0
1.5
1.1
1.3
0.4
1.1
1.0
0.5
0.9
0.8
1.1
0.8
1.2
1.0
1.0
1.5
1.2
Net
radiation
(Wm
–2)
–15.4
–15.3
–23.6
–26.1
–18.9
–23.3
–19.6
–32.9
–33.4
–26.1
–15.5
–31.4
–10.9
–15.0
–16.6
–17.2
–21.5
–22.0
–24.5
–19.8
Albedo(fraction)
0.03
0.03
0.06
0.05
0.04
0.03
0.04
0.08
0.06
0.05
0.05
0.06
0.02
0.03
0.04
0.04
0.04
0.05
0.05
0.04
Latentheat
flux(W
m–2)
–31.9
–25.3
–36.4
–49.8
–33.3
–31.1
–32.1
–36.9
–42.3
–34.3
–21.7
–32.3
–21.1
–23.2
–22.8
–28.8
–29.1
–32.4
–39.8
–30.4
Sensible
heat
flux(W
m–2)
17.0
8.5
15.6
20.0
14.7
10.5
12.5
4.1
9.5
8.1
5.8
–3.3
9.8
9.1
6.1
12.4
6.3
11.2
14.4
10.8
Specifichumidity
(gkg–1)
–1.6
–1.1
–2.1
–2.8
–1.7
–1.4
–1.3
–1.9
–2.6
–1.5
–1.0
–1.6
–0.5
–1.1
–0.9
–1.3
–1.3
–1.6
–2.3
–1.4
Precipitation
(mm
day–1)
–1.4
–1.5
–0.9
–2.2
–1.4
–2.4
–1.9
–0.7
–3.2
–1.7
–1.4
–1.6
–0.5
–0.6
–0.9
–1.7
–1.6
–0.8
–2.0
–1.3
PBLheight(m
)125.7
28.7
31.7
220.9
94.9
97.2
27.7
–124.7
174.3
34.7
–81.7
–50.5
–34.0
12.3
–35.8
51.6
3.2
–20.8
145.1
43.4
Totalcloudcover
(fraction)
–0.09
–0.05
–0.09
–0.13
–0.07
–0.08
–0.06
–0.07
–0.17
–0.08
0.02
–0.06
0.01
–0.02
–0.01
–0.05
–0.06
–0.06
–0.11
–0.06
Resultsare
presentedasdifferences(tropicalforest
vegetationremoval–control)andaveraged
annuallyandseasonallyforboth
individualregionsandtheentire
biome.
Averages
includeonly
values
significantatthe95%
significance
levelusingatw
o-sided
Student’st-test.Seasonalaverages
maynotequalannualaverages
since
locationssignificantonanannual
averagemaynotalwaysbesignificantforanindividualseason.Allvariablesshownrepresentsurface-level
values
excepttheplanetary
boundary
layer
height(‘PBLheight’)andtotal
cloudcover
Snyder et al.: Evaluating the influence of different vegetation biomes on the global climate 285

Fig. 3 Global distribution of JJA and SON changes in a surfacelatent heat flux (W m–2), b surface temperature (�C), and cprecipitation (mm day–1) due to removal of tropical forestvegetation. Differences (tropical forest vegetation removal–control)are shown only for cells significant at the 95% significance levelusing a two-sided Student’s t-test. d Regions of tropical forestvegetation removal (in black)
286 Snyder et al.: Evaluating the influence of different vegetation biomes on the global climate

woodland class, the boreal deciduous forest and wood-land class, and some cells of the mixed forest andwoodland class. In the model the biome covers over 22000 000 km2 which is about 15% of the land surface ofthe Earth (Table 1).
In our simulation, removal of the boreal forest veg-etation causes a large annual-average increase in thesurface albedo of 0.26 (156%) over the entire biome(Table 3). The albedo change is largest in the winter andspring seasons (0.51 and 0.37) when removal of thevegetation exposes the more reflective snow underneath.However, it only becomes climatically important late inFebruary when the incoming solar radiation becomes afactor.
The large increase in the surface albedo decreases thenet radiation in the deforested regions annually by14 W m–2 (a 27% reduction). The seasonality of the netradiation is more pronounced with a reduction of30 W m–2 (44%) in MAM, a 21 W m–2 (19%) reductionin JJA, and little change in the SON and DJF seasonswhen there is little or no incoming solar radiation to bereflected. The large reduction in net radiation in MAM(and to a lesser extent JJA) acts to keep the surface muchcooler than normal.
As a result of the large changes in the surface energybudget from vegetation removal, our results show thatthe temperature responds quite dramatically throughoutthe entire biome with the annual-average temperature
Table 3 Selected results from the boreal forest vegetation removal simulation. Results are presented as differences (boreal forest vege-tation removal – control). Averaging and statistical significance as in Table 2. All variables shown represent surface-level values exceptPBL height, total cloud cover, and low-level clouds
Variable North America Eurasia All Boreal
DJF MAM JJA SON annual DJF MAM JJA SON annual DJF MAM JJA SON annual
Temperature (K) –1.4 –4.9 –2.5 –1.0 –2.2 –2.6 –6.9 –4.7 –0.7 –3.2 –2.1 –6.2 –3.8 –0.9 –2.8Net radiation (W m–2) –5.9 –27.6 –22.3 –1.0 –13.3 –2.5 –31.3 –20.8 –1.4 –13.6 –3.9 –29.9 –21.3 –1.2 –13.5Albedo (fraction) 0.51 0.32 0.03 0.12 0.25 0.51 0.39 0.03 0.17 0.27 0.51 0.37 0.03 0.15 0.26Latent heat flux (W m–2) –4.6 –4.3 –18.1 –6.7 –8.3 –2.5 –7.8 –16.4 –4.5 –6.9 –3.4 –6.6 –17.0 –5.4 –7.4
Sensible heat flux(W m–2) 1.7 –23.3 –11.2 6.9 –6.8 3.0 –19.5 –15.4 5.3 –6.9 2.5 –21.0 –13.9 6.0 –6.9Specific humidity (g kg–1) 0.0 –0.3 –0.9 –0.2 –0.3 0.0 –0.6 –1.3 0.1 –0.5 0.0 –0.5 –1.1 –0.1 –0.4Precipitation (mm day–1) –0.3 –0.3 –0.6 –0.3 –0.3 –0.1 –0.3 –0.7 –0.4 –0.3 –0.2 –0.3 –0.7 –0.3 –0.3Snow fraction –0.08 –0.01 0.00 –0.01 –0.02 –0.01 0.14 0.04 0.00 0.05 –0.05 0.10 0.02 0.00 0.03PBL height (m) –199.4 –291.5 –162.9 –141.0 –195.7 –155.3 –284.4 –186.9 –136.8 –190.4 –172.1 –287.1 –178.2 –138.4 –192.4Total cloud cover (fraction) 0.01 0.12 0.08 0.04 0.05 0.00 0.12 0.09 0.03 0.06 0.00 0.12 0.09 0.04 0.05Low-level clouds (fraction) 0.01 0.19 0.10 0.06 0.07 –0.01 0.21 0.15 0.05 0.10 0.00 0.20 0.14 0.05 0.09
Fig. 4 Conceptual flowchart representing the impact of boreal forest vegetation removal on the climate
Snyder et al.: Evaluating the influence of different vegetation biomes on the global climate 287
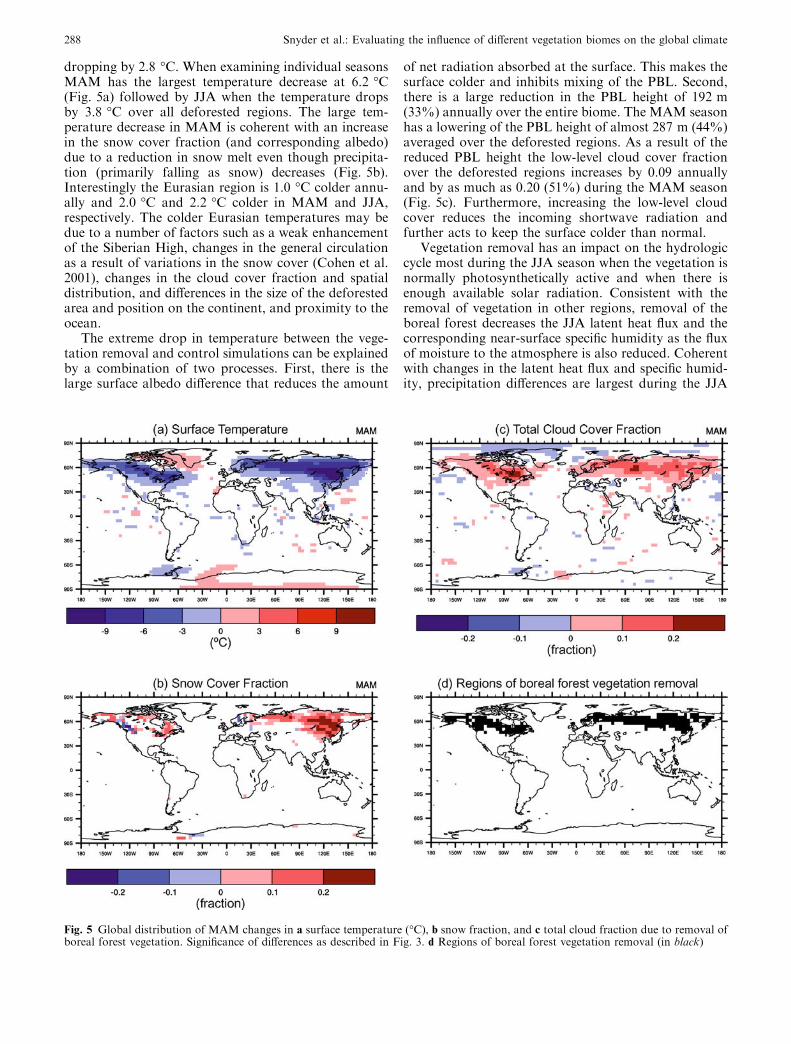
dropping by 2.8 �C. When examining individual seasonsMAM has the largest temperature decrease at 6.2 �C(Fig. 5a) followed by JJA when the temperature dropsby 3.8 �C over all deforested regions. The large tem-perature decrease in MAM is coherent with an increasein the snow cover fraction (and corresponding albedo)due to a reduction in snow melt even though precipita-tion (primarily falling as snow) decreases (Fig. 5b).Interestingly the Eurasian region is 1.0 �C colder annu-ally and 2.0 �C and 2.2 �C colder in MAM and JJA,respectively. The colder Eurasian temperatures may bedue to a number of factors such as a weak enhancementof the Siberian High, changes in the general circulationas a result of variations in the snow cover (Cohen et al.2001), changes in the cloud cover fraction and spatialdistribution, and differences in the size of the deforestedarea and position on the continent, and proximity to theocean.
The extreme drop in temperature between the vege-tation removal and control simulations can be explainedby a combination of two processes. First, there is thelarge surface albedo difference that reduces the amount
of net radiation absorbed at the surface. This makes thesurface colder and inhibits mixing of the PBL. Second,there is a large reduction in the PBL height of 192 m(33%) annually over the entire biome. The MAM seasonhas a lowering of the PBL height of almost 287 m (44%)averaged over the deforested regions. As a result of thereduced PBL height the low-level cloud cover fractionover the deforested regions increases by 0.09 annuallyand by as much as 0.20 (51%) during the MAM season(Fig. 5c). Furthermore, increasing the low-level cloudcover reduces the incoming shortwave radiation andfurther acts to keep the surface colder than normal.
Vegetation removal has an impact on the hydrologiccycle most during the JJA season when the vegetation isnormally photosynthetically active and when there isenough available solar radiation. Consistent with theremoval of vegetation in other regions, removal of theboreal forest decreases the JJA latent heat flux and thecorresponding near-surface specific humidity as the fluxof moisture to the atmosphere is also reduced. Coherentwith changes in the latent heat flux and specific humid-ity, precipitation differences are largest during the JJA
Fig. 5 Global distribution of MAM changes in a surface temperature (�C), b snow fraction, and c total cloud fraction due to removal ofboreal forest vegetation. Significance of differences as described in Fig. 3. d Regions of boreal forest vegetation removal (in black)
288 Snyder et al.: Evaluating the influence of different vegetation biomes on the global climate

season when the moisture flux from the transpiringvegetation would normally be largest. As a result, the airbecomes less humid and the only additional moistureavailable for precipitating must be advected from out-side the deforested regions. Averaged over the entirebiome the annual-average precipitation decrease is0.3 mm day–1 (15%) while over just the JJA season thereduction is 0.7 mm day–1 (25%).
6 Effects of temperate forests on climate
There have been several studies exploring the impact ofland use change in temperate forest regions. Bonan(1997, 1999, 2001), for example, looked at the climaticeffect of replacing much of the native temperate forestsof the Eastern United States with crops. Bonan (1997,1999, 2001) found that the change from natural tomodern vegetation has significantly altered the climatethrough cooling the eastern United States in spring by1.0 �C and the central United States in summer by2.0 �C, warming the western United States in spring by1.0 �C, altering the diurnal temperature range, andincreasing the humidity of the near-surface atmosphere.
The temperate forest biome is unique in that it islocated in a large latitude band between the tropical andboreal forest biomes. As a result of its geographiclocation, removal of the temperate forest vegetationinteracts differently with the atmosphere depending onthe season. In winter and spring removal of the tem-perate forests behaves more like the boreal forest re-moval simulation with lower surface temperatures, moresnow cover due to less snowmelt, a higher surfacealbedo, less net radiation absorbed at the surface, andan increase in low-level cloud cover. In summer, thetemperate forest removal simulation behaves morelike the tropical forest removal simulation with higher
temperatures due to a reduction in latent cooling, anincreased surface albedo, and decreases in net radiationand cloud cover. Therefore, during the summer and fallseasons the important physical mechanisms outlined inFig. 2 are applicable for the temperate forest case.During the winter and spring seasons the physicalmechanisms described in Fig. 4 are more appropriate.
For our simulation, the temperate forest biome isassumed to include temperate evergreen broadleaf for-ests and woodlands, temperate evergreen conifer forestsand woodlands, temperate deciduous forests andwoodlands, and a mixed forest and woodland category(Fig. 1). This biome covers a little over 19 000 000 km2
in the model which is about 13% of the total land coverarea of the Earth (Table 1).
Our temperate forest vegetation removal results showa decrease in the surface temperature of the regionswhere the vegetation has been removed by 1.1 �Cannually with the largest decrease in MAM of 2.4 �C(Table 4; Fig. 6a). In contrast, the temperature increasesslightly in JJA and SON by 0.3 �C and 0.6 �C, respec-tively. The small JJA average change hides the strongwarming in the Eastern United States and China(1.3 �C) and the modest cooling of 0.9 �C in the high-latitude mixed forest region of Asia (Fig. 6a).
There is a considerable warming in the SON seasoncentered over north-central Siberia at 70�E. This regionof warmer surface temperatures is located near thetemperate forest region yet it is directly affected by theremoval of the forests to the south and southwest. Fig-ure 6b shows the control simulation surface temperatureand wind vectors for the region in SON. Figure 6cillustrates the difference in surface temperature and windvectors between the temperate vegetation removal andcontrol simulations. In this case removal of the tem-perate forests reduces the roughness of the surface andincreases the low-level winds. Increased low-level winds
Table 4 Selected results from the temperate forest vegetation removal simulation. Results are presented as differences (temperate forestvegetation removal – control). Averaging and statistical significance as in Table 2. All variables shown represent surface-level valuesexcept PBL height and total cloud cover
Variable High-latitude temperate forests Temperate forests All temperate
DJF MAM JJA SON annual DJF MAM JJA SON annual DJF MAM JJA SON annual
Temperature (K) –1.6 –3.0 –0.9 1.1 –1.3 –1.1 –1.9 1.3 0.2 –0.8 –1.3 –2.4 0.3 0.6 –1.1Net radiation (W m–2) –5.8 –23.5 –18.1 –1.6 –11.9 –3.3 –11.8 –31.0 –9.1 –13.2 –4.4 –17.2 –25.4 –6.0 –12.7Albedo (fraction) 0.52 0.28 0.03 0.12 0.23 0.16 0.06 0.05 0.04 0.08 0.32 0.16 0.04 0.07 0.15Latent heat flux(W m–2)
–3.7 –2.1 –20.5 –6.5 –7.4 –4.7 –3.0 –36.9 –13.1 –14.0 –4.2 –2.6 –31.0 –10.3 –11.3
Sensible heat flux(W m–2)
0.8 –22.5 –6.6 5.8 –6.2 4.0 –11.5 6.3 5.9 0.7 2.5 –17.0 0.2 5.8 –2.5
Specific humidity(g kg–1)
0.0 0.1 –0.9 0.1 –0.3 0.0 –0.3 –1.9 –0.8 –0.7 0.0 –0.1 –1.5 –0.3 –0.5
Precipitation(mm day–1)
–0.1 –0.4 –0.9 –0.4 –0.3 –0.2 –0.7 –1.5 –0.7 –0.6 –0.1 –0.5 –1.3 –0.5 –0.5
Snow fraction –0.04 –0.04 0.00 –0.05 –0.02 –0.11 –0.02 0.01 –0.03 –0.03 –0.08 –0.03 0.00 –0.04 –0.03PBL height (m) –182.4 –277.1 –146.2 –152.9 –179.6 –145.7 –175.7 46.5 –98.1 –96.1 –161.5 –219.2 –39.2 –123.8 –132.8Total cloud cover(fraction)
0.00 0.08 0.02 0.01 0.03 0.08 0.07 –0.10 –0.03 0.01 0.05 0.07 –0.06 –0.02 0.02
Snyder et al.: Evaluating the influence of different vegetation biomes on the global climate 289

290 Snyder et al.: Evaluating the influence of different vegetation biomes on the global climate

enhance the advection of warm air into the region fromthe south and the west. The convergence of warm air inthis region increases the temperature of the boreal andtundra regions by greater than 2 �C. This exampleillustrates how the removal of vegetation in one regioncan affect the climate of regions adjacent to or partiallyremoved from the surface forcing.
With removal of the temperate forest vegetation, theannual-average surface albedo increases by 0.15 and islargest in winter (0.32) where the snow is no longercovered by the forest canopy. The high-latitude mixedforest region of the temperate forest class contributes themost to the large increase in the albedo (0.52 versus 0.16)as this region behaves like the boreal forest removalsimulation. In summer the albedo is still high as the baresoil also has a slightly higher albedo (0.04) than thevegetation. As with the tropical forest removal simula-tion the higher surface albedo reduces the net radiationabsorbed at the surface and reduces the energy availablefor use in convective precipitation during JJA(25.4 W m–2). This positive feedback mechanism is mostimportant in the low-latitude temperate forest regions ofthe eastern United States and China where precipitationis normally at a maximum during the JJA season(Fig. 6d).
How the land surface partitions the net radiation atthe surface into latent and sensible heating is dependenton the season as well as the latitude. The latent heat fluxchanges by –11.3 W m–2 annually and the change islargest in JJA (–31.0 W m–2) when vegetation is nor-mally transpiring the most. Regionally in JJA the lower-latitude temperate forest regions have a larger decreasein the latent heat flux (36.9 W m–2) versus the high-lat-itude mixed forest regions (20.5 W m–2). There is littlechange in the sensible heat flux with a reduction of2.8 W m–2 annually. Seasonally the sensible heat fluxreduction with vegetation removal is largest in MAM(17.0 W m–2) with the high-latitude mixed forest regioncontributing the most (22.5 W m–2). The large reductionin sensible heat flux in MAM is due to the reduced netradiation absorbed at the surface and the colder surfacetemperatures. The latent heat flux is not a factor duringthis time as the land surface is still too cold for muchevapotranspiration to occur.
As was seen with the tropical forest results, removalof the temperate forests reduces the latent heat fluxand the corresponding flux of moisture into theatmosphere as seen by the reduction in the near-sur-face specific humidity (Table 4). The reduction islargest during the growing season (JJA) and contrib-utes to a drying of the atmospheric column and a
decrease in precipitation (Fig. 6d). The annual-averagedecrease in precipitation for the entire biome is0.5 mm day–1 while the JJA season contributes themost to this decrease (1.3 mm day–1). As with thespecific humidity, the lower-level temperate forest re-moval regions have a larger precipitation decreasewhile the higher-latitude mixed forest precipitation rateis slightly less negative.
7 Effects of savanna vegetation on climate
Similar to the tropical forest vegetation removal sce-nario (see Fig. 2), removal of the savanna vegetationleads to a large reduction in precipitation due to boththe reduced moisture flux from the land-surface as wellas weakened moisture convergence into the regions. Thereduced moisture flux from the surface is related to thereduction in the latent heat flux. Correspondingly, theweakened precipitation, of which most is of the con-vective type, translates to fewer clouds and an increase inthe incoming solar radiation. The albedo increasesmodestly and reduces the amount of net radiation ab-sorbed at the surface. Finally, the surface warms with areduction in latent heating due to removal of the vege-tation.
In our simulation the regions comprising the savannabiome are located north and south of the tropical rain-forest centers in South America and Africa, easternAfrica, parts of the north, south, and eastern coasts ofAustralia, the northern Midwest in the United States,and scattered locations in the Northern Hemisphere(Fig. 1). In CCM3/IBIS the savanna biome represents alittle over 19 000 000 km2 or about 13% of the landsurface area in the model (Table 1).
Our model results indicate that the most dramaticeffect of removing the savanna vegetation is the largereduction in precipitation (Fig. 7a; Table 5). Averagedover all savanna regions, the annual precipitationreduction is 1.1 mm day–1 (32%). Seasonally thereduction is largest in SON (1.9 mm day–1) and DJF(2.1 mm day–1); greater than a 50% reduction. The sa-vanna regions of South America and Africa contributemost to the reduction as this is the beginning of the wetseason as determined by the model. There is a smallregion of Australia where the precipitation actually in-creases in JJA and also in Africa in DJF over thenorthern tropical forest boundary, however, the overalleffect is to reduce the precipitation considerably. It isclear that the savanna vegetation plays an importantrole in the precipitation intensity and position and thatclimate-vegetation feedbacks may be very important inthis ecosystem.
The decrease in precipitation is brought on both bychanges in the moisture convergence due to modifica-tion of the regional circulation as well as by changes inthe moisture flux from the land-surface into theatmosphere. In our simulation, removal of the savannavegetation causes a large decrease in the latent heat
Fig. 6 Global distribution of seasonal changes in a surfacetemperature (�C) due to removal of temperate forest vegetation.Significance of differences as described in Fig. 3. b Controlsimulation surface temperature (�C) and winds (m s–1) for SON.c Difference plot of SON surface temperature and winds. d Globaldistribution of seasonal changes in precipitation (mm day–1). eRegions of temperate forest vegetation removal (in black)
b
Snyder et al.: Evaluating the influence of different vegetation biomes on the global climate 291
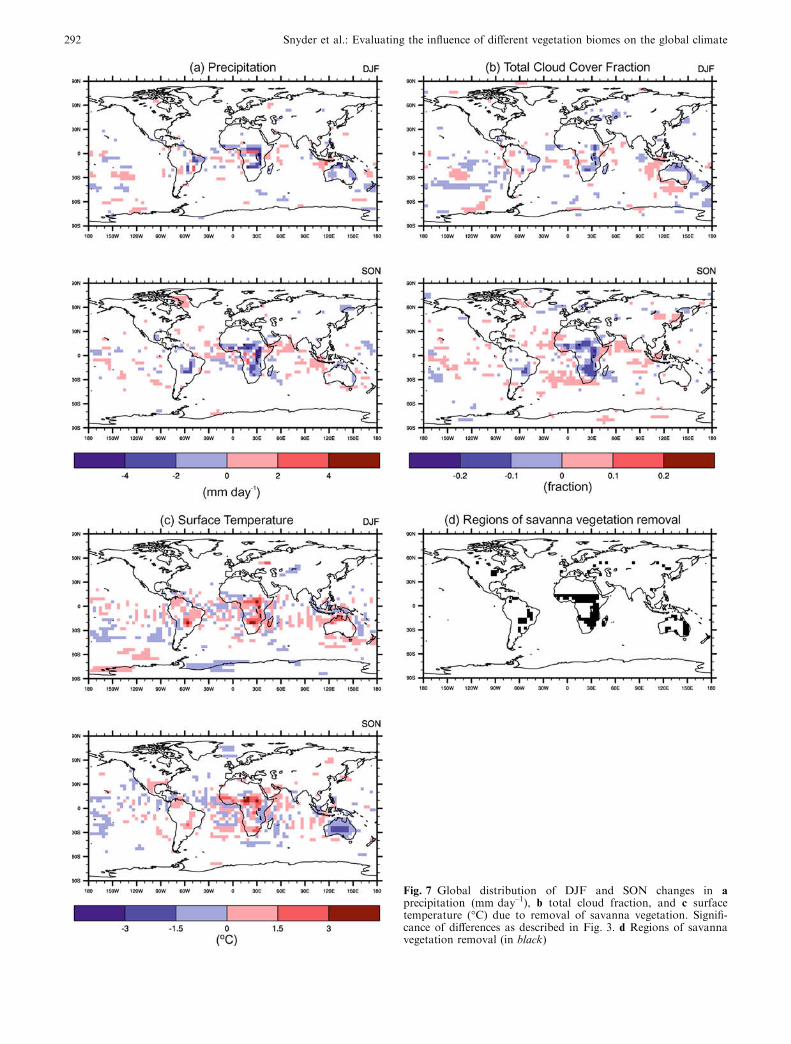
Fig. 7 Global distribution of DJF and SON changes in aprecipitation (mm day–1), b total cloud fraction, and c surfacetemperature (�C) due to removal of savanna vegetation. Signifi-cance of differences as described in Fig. 3. d Regions of savannavegetation removal (in black)
292 Snyder et al.: Evaluating the influence of different vegetation biomes on the global climate

flux by 23.9 W m–2 (32%) annually over all the re-gions. Consistent with the tropical forest removal re-sults, a reduction in the surface latent heat fluxtranslates well to a reduction in the flux of moisture tothe atmosphere. Annually the near-surface specifichumidity is reduced by 1.2 g kg–1 and is largest in theSON and DJF wet seasons as defined in the model(Table 5). As a result of the reduction in precipitationand the moisture flux from the surface, the cloud coverfraction decreases over the areas where the savannavegetation has been removed. The savanna region ofAfrica is most affected and is largest in the SON sea-son (Fig. 7b).
The response of the surface albedo and net radiationto the removal of savanna vegetation is consistent withthe tropical forest removal results and the albedo-pre-cipitation positive feedback mechanism. Removal of thesavanna vegetation increases the annual-average surfacealbedo by almost 40%. This causes a decrease in the netradiation absorbed at the surface and reduces theenergy available for use in driving convective precipi-tation. The albedo and net radiation changes are largestin the tropical wet seasons (SON and DJF) and matchthe reduction in the latent heat flux, near-surface specifichumidity, and precipitation.
Throughout the entire biome there is a modest in-crease in the annual temperature at the surface of0.9 �C, however there is a seasonal variation betweenthe savanna regions that hides some of the magnitude ofthe temperature response (Fig. 7c). When the individualregions are examined separately, the South Americanand African regions show temperature increases of 0.8and 1.2 �C, respectively. Australia shows a net decreasein surface temperature annually of –0.4 �C and can beexplained by the greater seasonal fluctuation in surfaceenergy due to its higher latitude. Overall, the response ofremoving the savanna vegetation is similar to that of thetropical forests where the surface temperature increasesduring the peak growing season when latent cooling isnormally most active.
8 Effects of grassland and steppe vegetation on climate
There have been no specific studies describing theinfluence of grassland/steppe vegetation on the climate.However, there have been several land use changestudies that have examined the climate response fromthe conversion of grasslands to croplands in the centralplains as part of a larger analysis of overall land usechange in the United States (Copeland et al. 1996; Bo-nan 1997, 1999, 2001). Although these studies examinedthe climate response from the conversion between nat-ural vegetation and croplands, the general response ofcompletely removing the natural vegetation can beinferred.
In CCM3-IBIS, grasslands and steppe vegetation arelocated in the dry and seasonally hot climates of theprairie of the United States Great Plains, south of 30�ST
able
5Selectedresultsfrom
thesavannavegetationremovalsimulation.Resultsare
presentedasdifferences(savannavegetationremoval–control).Averagingandstatistical
significance
asin
Table
2.Allvariablesshownrepresentsurface-level
values
exceptPBLheightandtotalcloudcover
Variable
South
America
Africa
Australia
Allsavanna
DJF
MAM
JJA
SON
annual
DJF
MAM
JJA
SON
annual
DJF
MAM
JJA
SON
annual
DJF
MAM
JJA
SON
annual
Tem
perature
(K)
1.4
1.2
0.6
0.8
0.8
1.1
1.3
1.2
1.1
1.2
1.2
0.1
–0.6
–1.0
–0.4
1.2
1.1
0.9
0.7
0.9
Net
radiation
(Wm
–2)
–27.0
–21.9
–23.7
–32.1
–24.8
–34.0
–30.8
–22.4
–37.8
–29.3
–42.1
–24.1
–8.4
–36.1
–27.7
–31.2
–26.4
–22.0
–33.4
–26.8
Albedo(fraction)
0.03
0.04
0.05
0.05
0.04
0.07
0.06
0.05
0.07
0.06
0.07
0.06
0.02
0.08
0.06
0.08
0.06
0.05
0.06
0.06
Latentheatflux
(Wm
–2)
–29.1
–25.3
–16.4
–23.7
–20.1
–33.7
–29.7
–27.2
–37.2
–28.4
–40.0
–34.2
–5.9
–18.1
–18.3
–31.0
–27.5
–24.1
–30.9
–23.9
Sensible
heatflux
(Wm
–2)
–0.6
5.4
–9.3
–17.7
–7.0
–1.9
–2.9
–0.5
–7.0
–2.8
–18.0
–7.2
–8.0
–33.4
–15.5
–3.2
–2.9
–4.6
–11.8
–5.6
Specifichumidity
(gkg–1)
–1.1
–1.2
–0.7
–1.1
–0.9
–1.8
–1.5
–1.5
–1.9
–1.5
–1.5
–1.2
0.5
–0.8
–0.6
–1.6
–1.4
–1.1
–1.7
–1.2
Precipitation
(mm
day–1)
–2.4
–1.0
–1.3
–1.7
–1.0
–2.2
–1.3
–1.3
–2.2
–1.2
–1.8
–1.2
0.1
–0.7
–0.7
–2.1
–1.3
–1.2
–1.9
–1.1
PBLheight(m
)118.4
106.0
68.2
108.1
82.5
141.5
128.8
150.6
182.3
142.1
147.2
28.6
–58.4
–41.0
15.1
112.2
93.4
90.6
117.1
95.5
Totalcloudcover
(fraction)
–0.04
–0.07
–0.03
–0.07
–0.03
–0.07
–0.09
–0.09
–0.10
–0.07
–0.07
n/a
0.07
n/a
–0.01
–0.07
–0.09
–0.07
–0.09
–0.06
Snyder et al.: Evaluating the influence of different vegetation biomes on the global climate 293
in Argentina, the steppes of Central Asia, and part of thesouthern tip of Africa (Fig. 1). The area of this biome isthe smallest of all the vegetation removal simulations inour study and is just over 14 000 000 km2 or close to10% of the Earth’s land area (Table 1).
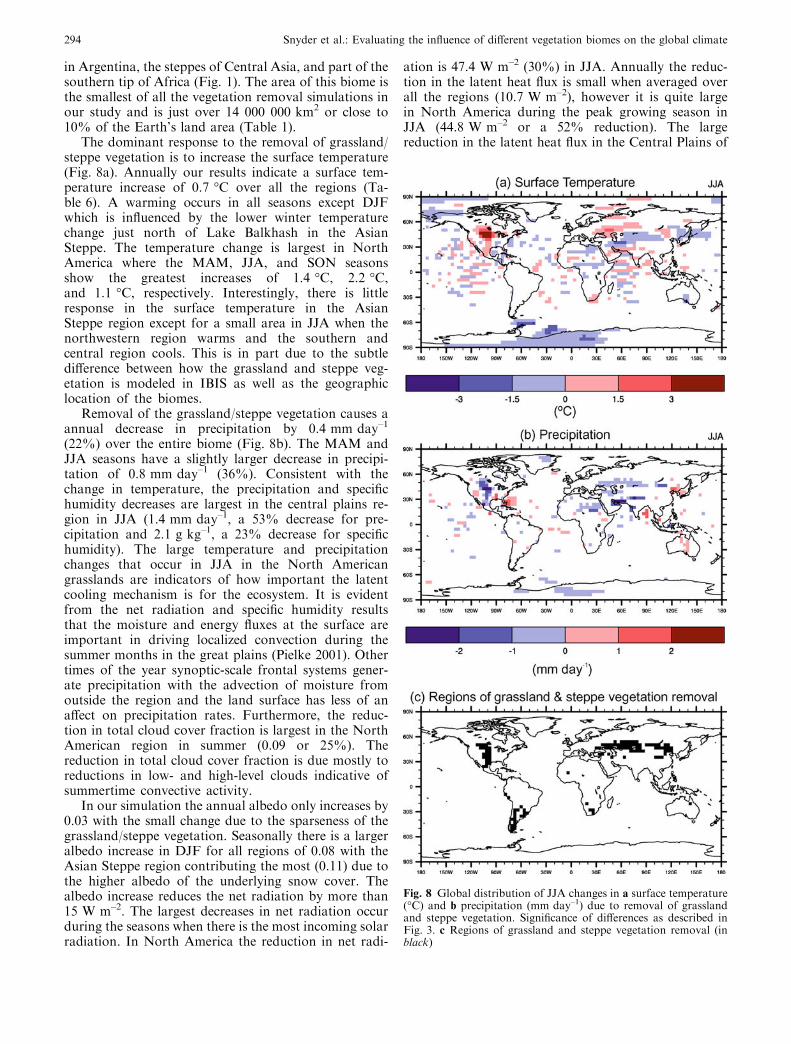
The dominant response to the removal of grassland/steppe vegetation is to increase the surface temperature(Fig. 8a). Annually our results indicate a surface tem-perature increase of 0.7 �C over all the regions (Ta-ble 6). A warming occurs in all seasons except DJFwhich is influenced by the lower winter temperaturechange just north of Lake Balkhash in the AsianSteppe. The temperature change is largest in NorthAmerica where the MAM, JJA, and SON seasonsshow the greatest increases of 1.4 �C, 2.2 �C,and 1.1 �C, respectively. Interestingly, there is littleresponse in the surface temperature in the AsianSteppe region except for a small area in JJA when thenorthwestern region warms and the southern andcentral region cools. This is in part due to the subtledifference between how the grassland and steppe veg-etation is modeled in IBIS as well as the geographiclocation of the biomes.
Removal of the grassland/steppe vegetation causes aannual decrease in precipitation by 0.4 mm day–1
(22%) over the entire biome (Fig. 8b). The MAM andJJA seasons have a slightly larger decrease in precipi-tation of 0.8 mm day–1 (36%). Consistent with thechange in temperature, the precipitation and specifichumidity decreases are largest in the central plains re-gion in JJA (1.4 mm day–1, a 53% decrease for pre-cipitation and 2.1 g kg–1, a 23% decrease for specifichumidity). The large temperature and precipitationchanges that occur in JJA in the North Americangrasslands are indicators of how important the latentcooling mechanism is for the ecosystem. It is evidentfrom the net radiation and specific humidity resultsthat the moisture and energy fluxes at the surface areimportant in driving localized convection during thesummer months in the great plains (Pielke 2001). Othertimes of the year synoptic-scale frontal systems gener-ate precipitation with the advection of moisture fromoutside the region and the land surface has less of anaffect on precipitation rates. Furthermore, the reduc-tion in total cloud cover fraction is largest in the NorthAmerican region in summer (0.09 or 25%). Thereduction in total cloud cover fraction is due mostly toreductions in low- and high-level clouds indicative ofsummertime convective activity.
In our simulation the annual albedo only increases by0.03 with the small change due to the sparseness of thegrassland/steppe vegetation. Seasonally there is a largeralbedo increase in DJF for all regions of 0.08 with theAsian Steppe region contributing the most (0.11) due tothe higher albedo of the underlying snow cover. Thealbedo increase reduces the net radiation by more than15 W m–2. The largest decreases in net radiation occurduring the seasons when there is the most incoming solarradiation. In North America the reduction in net radi-
ation is 47.4 W m–2 (30%) in JJA. Annually the reduc-tion in the latent heat flux is small when averaged overall the regions (10.7 W m–2), however it is quite largein North America during the peak growing season inJJA (44.8 W m–2 or a 52% reduction). The largereduction in the latent heat flux in the Central Plains of
Fig. 8 Global distribution of JJA changes in a surface temperature(�C) and b precipitation (mm day–1) due to removal of grasslandand steppe vegetation. Significance of differences as described inFig. 3. c Regions of grassland and steppe vegetation removal (inblack)
294 Snyder et al.: Evaluating the influence of different vegetation biomes on the global climate
North America during the summer is coherent with thetemperature, specific humidity, and precipitation chan-ges in the region.
9 Effects of shrubland and tundra vegetation on climate
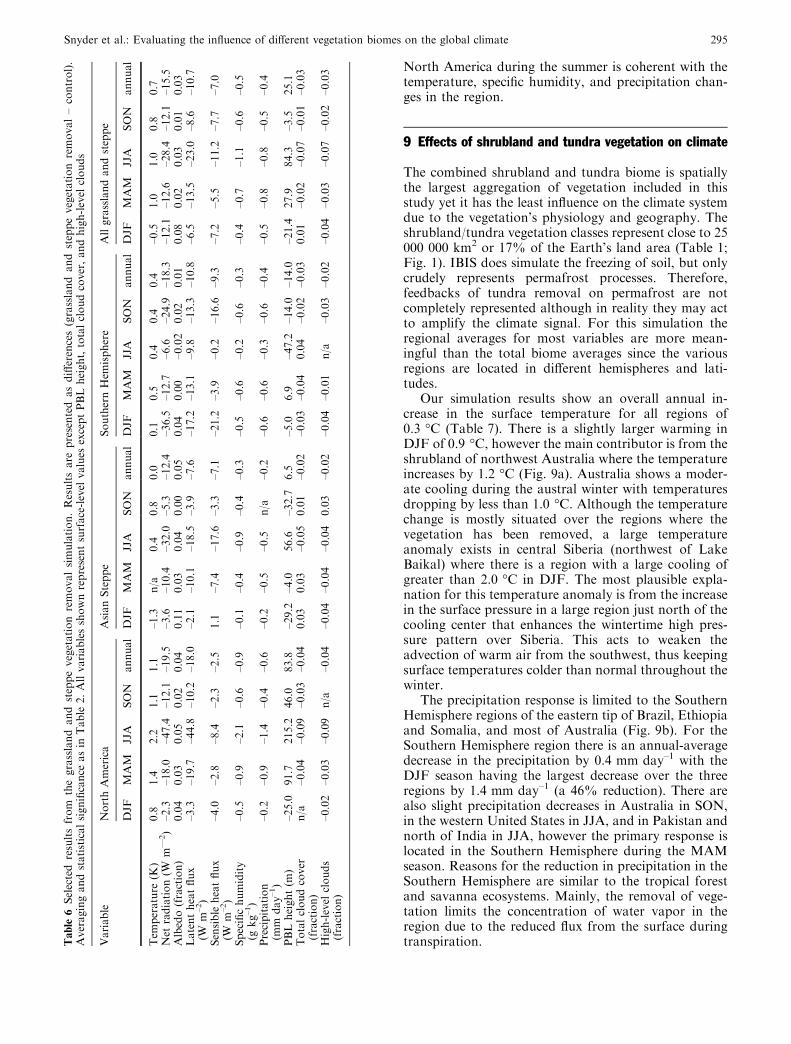
The combined shrubland and tundra biome is spatiallythe largest aggregation of vegetation included in thisstudy yet it has the least influence on the climate systemdue to the vegetation’s physiology and geography. Theshrubland/tundra vegetation classes represent close to 25000 000 km2 or 17% of the Earth’s land area (Table 1;Fig. 1). IBIS does simulate the freezing of soil, but onlycrudely represents permafrost processes. Therefore,feedbacks of tundra removal on permafrost are notcompletely represented although in reality they may actto amplify the climate signal. For this simulation theregional averages for most variables are more mean-ingful than the total biome averages since the variousregions are located in different hemispheres and lati-tudes.
Our simulation results show an overall annual in-crease in the surface temperature for all regions of0.3 �C (Table 7). There is a slightly larger warming inDJF of 0.9 �C, however the main contributor is from theshrubland of northwest Australia where the temperatureincreases by 1.2 �C (Fig. 9a). Australia shows a moder-ate cooling during the austral winter with temperaturesdropping by less than 1.0 �C. Although the temperaturechange is mostly situated over the regions where thevegetation has been removed, a large temperatureanomaly exists in central Siberia (northwest of LakeBaikal) where there is a region with a large cooling ofgreater than 2.0 �C in DJF. The most plausible expla-nation for this temperature anomaly is from the increasein the surface pressure in a large region just north of thecooling center that enhances the wintertime high pres-sure pattern over Siberia. This acts to weaken theadvection of warm air from the southwest, thus keepingsurface temperatures colder than normal throughout thewinter.
The precipitation response is limited to the SouthernHemisphere regions of the eastern tip of Brazil, Ethiopiaand Somalia, and most of Australia (Fig. 9b). For theSouthern Hemisphere region there is an annual-averagedecrease in the precipitation by 0.4 mm day–1 with theDJF season having the largest decrease over the threeregions by 1.4 mm day–1 (a 46% reduction). There arealso slight precipitation decreases in Australia in SON,in the western United States in JJA, and in Pakistan andnorth of India in JJA, however the primary response islocated in the Southern Hemisphere during the MAMseason. Reasons for the reduction in precipitation in theSouthern Hemisphere are similar to the tropical forestand savanna ecosystems. Mainly, the removal of vege-tation limits the concentration of water vapor in theregion due to the reduced flux from the surface duringtranspiration.T
able
6Selectedresultsfrom
thegrasslandandsteppevegetationremovalsimulation.Resultsare
presentedasdifferences(grasslandandsteppevegetationremoval–control).
Averagingandstatisticalsignificance
asin
Table
2.Allvariablesshownrepresentsurface-level
values
exceptPBL
height,totalcloudcover,andhigh-level
clouds
Variable
NorthAmerica
AsianSteppe
SouthernHem
isphere
Allgrasslandandsteppe
DJF
MAM
JJA
SON
annual
DJF
MAM
JJA
SON
annual
DJF
MAM
JJA
SON
annual
DJF
MAM
JJA
SON
annual
Tem
perature
(K)
0.8
1.4
2.2
1.1
1.1
–1.3
n/a
0.4
0.8
0.0
0.1
0.5
0.4
0.4
0.4
–0.5
1.0
1.0
0.8
0.7
Net
radiation(W
m—2)
–2.3
–18.0
–47.4
–12.1
–19.5
–3.6
–10.4
–32.0
–5.3
–12.4
–36.5
–12.7
–6.6
–24.9
–18.3
–12.1
–12.6
–28.4
–12.1
–15.5
Albedo(fraction)
0.04
0.03
0.05
0.02
0.04
0.11
0.03
0.04
0.00
0.05
0.04
0.00
–0.02
0.02
0.01
0.08
0.02
0.03
0.01
0.03
Latentheatflux
(Wm
–2)
–3.3
–19.7
–44.8
–10.2
–18.0
–2.1
–10.1
–18.5
–3.9
–7.6
–17.2
–13.1
–9.8
–13.3
–10.8
–6.5
–13.5
–23.0
–8.6
–10.7
Sensible
heatflux
(Wm
–2)
–4.0
–2.8
–8.4
–2.3
–2.5
1.1
–7.4
–17.6
–3.3
–7.1
–21.2
–3.9
–0.2
–16.6
–9.3
–7.2
–5.5
–11.2
–7.7
–7.0
Specifichumidity
(gkg–1)
–0.5
–0.9
–2.1
–0.6
–0.9
–0.1
–0.4
–0.9
–0.4
–0.3
–0.5
–0.6
–0.2
–0.6
–0.3
–0.4
–0.7
–1.1
–0.6
–0.5
Precipitation
(mm
day–1)
–0.2
–0.9
–1.4
–0.4
–0.6
–0.2
–0.5
–0.5
n/a
–0.2
–0.6
–0.6
–0.3
–0.6
–0.4
–0.5
–0.8
–0.8
–0.5
–0.4
PBLheight(m
)–25.0
91.7
215.2
46.0
83.8
–29.2
–4.0
56.6
–32.7
6.5
–5.0
6.9
–47.2
–14.0
–14.0
–21.4
27.9
84.3
–3.5
25.1
Totalcloudcover
(fraction)
n/a
–0.04
–0.09
–0.03
–0.04
0.03
0.03
–0.05
0.01
–0.02
–0.03
–0.04
0.04
–0.02
–0.03
0.01
–0.02
–0.07
–0.01
–0.03
High-level
clouds
(fraction)
–0.02
–0.03
–0.09
n/a
–0.04
–0.04
–0.04
–0.04
0.03
–0.02
–0.04
–0.01
n/a
–0.03
–0.02
–0.04
–0.03
–0.07
–0.02
–0.03
Snyder et al.: Evaluating the influence of different vegetation biomes on the global climate 295

10 Cross-biome comparisons
In order to compare the relative influence that the dif-ferent biomes have on the climate system, Table 8 liststhe change in temperature and precipitation between
Table
7Selectedresultsfrom
theshrubland/tundra
vegetationremovalsimulation.Resultsare
presentedasdifferences(shrubland/tundra
vegetationremoval–control).Averagingand
statisticalsignificance
asin
Table
2.Allvariablesshownrepresentsurface-level
values
exceptPBL
heightandtotalcloudcover
Variable
AsiaandSouthwestUS
S.AmericaandAustralia
Canada/Siberia
Allshrubland/tundra
DJF
MAM
JJA
SON
annual
DJF
MAM
JJA
SON
annual
DJF
MAM
JJA
SON
annual
DJF
MAM
JJA
SON
annual
Tem
perature
(K)
–0.1
0.6
0.3
0.5
0.3
1.2
0.2
–0.4
–0.7
0.3
–2.1
–1.0
–0.3
1.1
n/a
0.9
0.5
0.1
0.0
0.3
Net
radiation(W
m–2)
–6.1
–13.3
–18.6
–9.4
–11.2
–29.2
–13.6
–6.5
–22.7
–17.9
–1.0
–0.8
–1.2
–1.0
–1.1
–14.4
–12.8
–13.6
–13.1
–12.8
Albedo(fraction)
–0.02
0.01
0.02
0.00
0.00
0.04
0.01
–0.01
0.03
0.02
0.01
–0.01
–0.06
–0.04
–0.02
0.01
0.01
–0.01
0.01
0.01
Latentheatflux
(Wm
–2)
–3.4
–10.7
–12.4
–9.7
–7.0
–27.7
–11.1
–6.0
–9.6
–9.9
–0.4
2.7
–1.2
–1.7
–1.0
–14.3
–10.5
–10.9
–8.1
–7.5
Sensible
heatflux
(Wm
–2)
–4.2
–10.0
–12.0
–6.9
–6.9
–16.4
–8.0
–5.1
–16.7
–9.9
1.9
–1.2
–3.1
3.0
–0.3
–7.4
–8.9
–8.3
–10.7
–7.5
Specifichumidity
(gkg–1)
–0.1
–0.4
–0.7
–0.5
–0.3
–1.7
–0.5
–0.1
–0.5
–0.5
0.1
n/a
–0.3
0.1
–0.1
–1.3
–0.4
–0.6
–0.4
–0.4
Precipitation
(mm
day–1)
–0.2
–0.6
–0.8
–0.5
–0.3
–1.4
–0.5
0.0
–0.5
–0.4
0.1
n/a
–0.2
–0.7
0.0
–1.0
–0.5
–0.7
–0.5
–0.3
PBLheight(m
)83.9
83.2
62.4
65.9
56.2
176.1
61.6
36.9
29.5
75.6
15.1
–12.9
–13.5
6.5
–5.0
136.0
69.0
48.3
50.6
56.4
Totalcloudcover
(fraction)
0.01
–0.04
–0.05
–0.04
–0.02
–0.09
–0.03
0.01
–0.03
–0.03
–0.01
0.03
0.04
–0.05
0.02
–0.07
–0.03
–0.03
–0.04
–0.02
Fig. 9 Global distribution of DJF changes in a surface temperature(�C), and b precipitation (mm day–1) due to removal of shrublandand tundra vegetation. Significance of differences as described inFig. 3. c Regions of shrubland and tundra vegetation removal (inblack)
296 Snyder et al.: Evaluating the influence of different vegetation biomes on the global climate
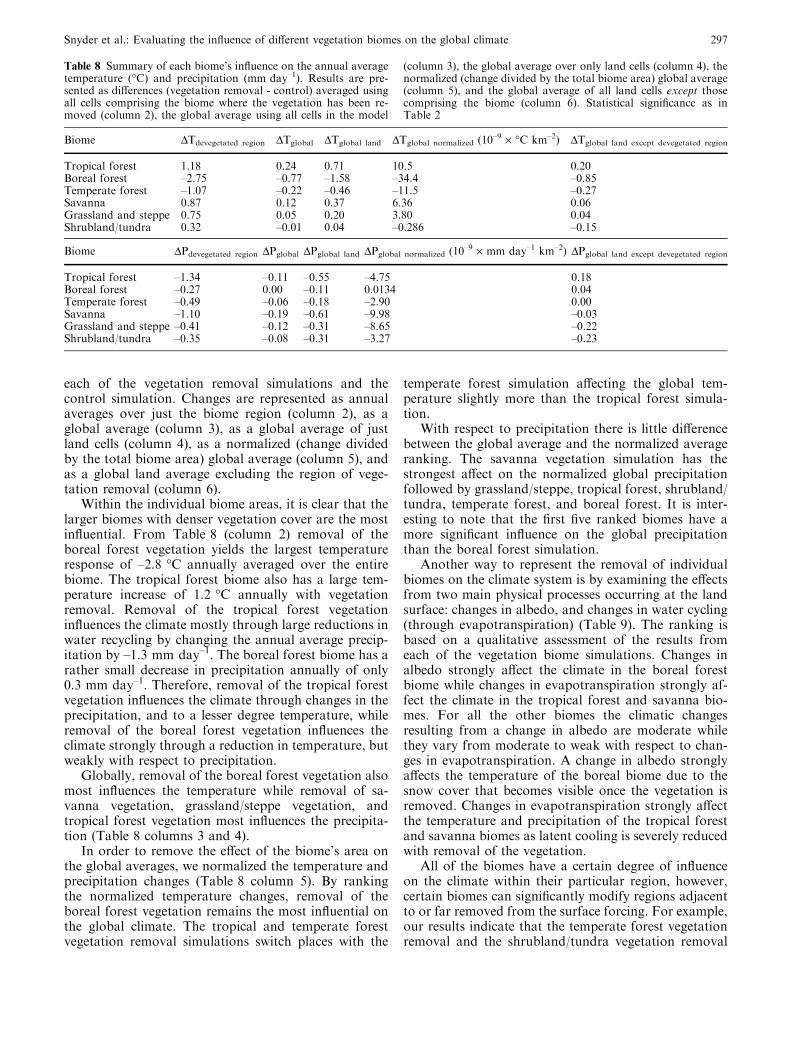
each of the vegetation removal simulations and thecontrol simulation. Changes are represented as annualaverages over just the biome region (column 2), as aglobal average (column 3), as a global average of justland cells (column 4), as a normalized (change dividedby the total biome area) global average (column 5), andas a global land average excluding the region of vege-tation removal (column 6).
Within the individual biome areas, it is clear that thelarger biomes with denser vegetation cover are the mostinfluential. From Table 8 (column 2) removal of theboreal forest vegetation yields the largest temperatureresponse of –2.8 �C annually averaged over the entirebiome. The tropical forest biome also has a large tem-perature increase of 1.2 �C annually with vegetationremoval. Removal of the tropical forest vegetationinfluences the climate mostly through large reductions inwater recycling by changing the annual average precip-itation by –1.3 mm day–1. The boreal forest biome has arather small decrease in precipitation annually of only0.3 mm day–1. Therefore, removal of the tropical forestvegetation influences the climate through changes in theprecipitation, and to a lesser degree temperature, whileremoval of the boreal forest vegetation influences theclimate strongly through a reduction in temperature, butweakly with respect to precipitation.
Globally, removal of the boreal forest vegetation alsomost influences the temperature while removal of sa-vanna vegetation, grassland/steppe vegetation, andtropical forest vegetation most influences the precipita-tion (Table 8 columns 3 and 4).
In order to remove the effect of the biome’s area onthe global averages, we normalized the temperature andprecipitation changes (Table 8 column 5). By rankingthe normalized temperature changes, removal of theboreal forest vegetation remains the most influential onthe global climate. The tropical and temperate forestvegetation removal simulations switch places with the
temperate forest simulation affecting the global tem-perature slightly more than the tropical forest simula-tion.
With respect to precipitation there is little differencebetween the global average and the normalized averageranking. The savanna vegetation simulation has thestrongest affect on the normalized global precipitationfollowed by grassland/steppe, tropical forest, shrubland/tundra, temperate forest, and boreal forest. It is inter-esting to note that the first five ranked biomes have amore significant influence on the global precipitationthan the boreal forest simulation.
Another way to represent the removal of individualbiomes on the climate system is by examining the effectsfrom two main physical processes occurring at the landsurface: changes in albedo, and changes in water cycling(through evapotranspiration) (Table 9). The ranking isbased on a qualitative assessment of the results fromeach of the vegetation biome simulations. Changes inalbedo strongly affect the climate in the boreal forestbiome while changes in evapotranspiration strongly af-fect the climate in the tropical forest and savanna bio-mes. For all the other biomes the climatic changesresulting from a change in albedo are moderate whilethey vary from moderate to weak with respect to chan-ges in evapotranspiration. A change in albedo stronglyaffects the temperature of the boreal biome due to thesnow cover that becomes visible once the vegetation isremoved. Changes in evapotranspiration strongly affectthe temperature and precipitation of the tropical forestand savanna biomes as latent cooling is severely reducedwith removal of the vegetation.
All of the biomes have a certain degree of influenceon the climate within their particular region, however,certain biomes can significantly modify regions adjacentto or far removed from the surface forcing. For example,our results indicate that the temperate forest vegetationremoval and the shrubland/tundra vegetation removal
Table 8 Summary of each biome’s influence on the annual averagetemperature (�C) and precipitation (mm day–1). Results are pre-sented as differences (vegetation removal - control) averaged usingall cells comprising the biome where the vegetation has been re-moved (column 2), the global average using all cells in the model
(column 3), the global average over only land cells (column 4), thenormalized (change divided by the total biome area) global average(column 5), and the global average of all land cells except thosecomprising the biome (column 6). Statistical significance as inTable 2
Biome DTdevegetated region DTglobal DTglobal land DTglobal normalized (10–9 · �C km–2) DTglobal land except devegetated region
Tropical forest 1.18 0.24 0.71 10.5 0.20Boreal forest –2.75 –0.77 –1.58 –34.4 –0.85Temperate forest –1.07 –0.22 –0.46 –11.5 –0.27Savanna 0.87 0.12 0.37 6.36 0.06Grassland and steppe 0.75 0.05 0.20 3.80 0.04Shrubland/tundra 0.32 –0.01 0.04 –0.286 –0.15
Biome DPdevegetated region DPglobal DPglobal land DPglobal normalized (10–9 · mm day–1 km–2) DPglobal land except devegetated region
Tropical forest –1.34 –0.11 –0.55 –4.75 0.18Boreal forest –0.27 0.00 –0.11 0.0134 0.04Temperate forest –0.49 –0.06 –0.18 –2.90 0.00Savanna –1.10 –0.19 –0.61 –9.98 –0.03Grassland and steppe –0.41 –0.12 –0.31 –8.65 –0.22Shrubland/tundra –0.35 –0.08 –0.31 –3.27 –0.23
Snyder et al.: Evaluating the influence of different vegetation biomes on the global climate 297

simulations both influence the temperature of locationsadjacent to, but outside of their respective regions. Workby Eltahir (1996) and others have identified regionalconnections in the tropics due to changes in the low-levelcirculation and moisture convergence.
The result of vegetation removal on the temperatureand precipitation outside the region of vegetation forcingis listed in Table 8 (column 6). The change in tempera-ture averaged annually over the globe (only land cells)excluding the biome’s area shows that removal of theboreal forest vegetation has the largest effect (–0.85 �C)on the global temperature outside the region of vegeta-tion forcing, followed by the temperate (–0.27 �C) andtropical forest (0.20 �C) simulations. The shrubland andtundra annual global temperature signal is also large(–0.15 �C) and is primarily due to the large cooling incentral Siberia in DJF as discussed in Sect. 9 and shownin Fig. 9a.
To better illustrate the magnitude of the vegetationremoval signal on the global climate we compare theeffect of the El Nino Southern Oscillation (ENSO)climate anomaly to the magnitude of global tempera-ture change. By taking a composite of the warm phaseof ENSO for the years from 1950 to 1995 using theCRU05 climate dataset (New et al. 1999) we found that
the global annual temperature over land warms byapproximately 0.08 �C. When compared to the globaltemperature change over land outside of the regions ofvegetation removal in Table 8 (column 6) the tropical,boreal, and temperate forest vegetation removal simu-lations along with the shrubland/tundra vegetationremoval simulation all show a temperature changewhose magnitude is greater than the climatic effectfrom ENSO (although the local and regional effects ofENSO can be quite large). This further illustrates thepotential effects of large-scale vegetation removal onthe climate.
With respect to precipitation (Table 8, column 6), theshrubland/tundra, grassland/steppe, and tropical forestvegetation removal simulations show the largest effectoutside of their regions over land only. The shrubland/tundra and grassland/steppe simulations show a pre-cipitation decrease outside of their regions, perhapsindicative of a reduction in moisture advection, while thetropical forest simulation has an increase outside of theregions of vegetation removal and is consistent withother studies on large-scale tropical deforestation(Henderson-Sellers et al. 1993; Baidya Roy and Avissar2002). There is little change for the temperate and borealforests and the savanna vegetation simulations and may
Table 9 Summary of each biome’s influence on the climate due to albedo and evapotranspiration effects. Ranking is from ‘strong’ to‘moderate’ to ‘weak’ and is qualitatively based on the results from the individual biomes as described in the paper. A brief descriptionhighlights the important mechanisms and climatic effects
Biome Effects ofchangingalbdeo
Effects of changingevapotranspiration
Description
Tropical forest Moderate Strong Moderate surface albedo increase causes a decrease in surface netradiation. Severe reduction in evapotranspiration (ET) alongwith reduction in surface energy limits latent cooling andsurface warms considerably. Near-surface specific humidityand precipitation reduced. Cloud cover decreases.
Boreal forest Strong Weak Large surface albedo increase causes a large decrease in netradiation and the surface cools. Reduction in ET limitsnear-surface moisture and precipitation only during summergrowing season. Surface cooling leads to a reduction in planetaryboundary layer height and a large increase in cloud cover.
Temperate forest Moderate Moderate Increase in albedo decreases net radiation during all seasons. Winterand spring increase causes a cooling while summer and fallincrease causes a warming when combined with a moderate reductionin ET. Decrease in ET reduces near-surface moisture and precipitation(mostly in summer).
Savanna Moderate Strong Moderate surface albedo increase causes a decrease in surface netradiation. Large reduction in ET limits latent cooling and surfacewarms. Near-surface humidity and precipitation severely reduced.Cloud cover decreases.
Grassland and steppe Moderate Moderate Moderate surface albedo increase causes a reduction in net radiation.In winter and spring this cools the surface while in summer it warmsthe surface when combined with a moderate reduction in ET.Grassland region of Central US most affected by ET reduction(warming). Steppe region of Asia most affected by albedo increase(cooling).
Shrubland/tundra Moderate Moderate/weak Moderate surface albedo increase causes a reduction in net radiationover all regions. Albedo increase in tundra regions causes a cooling.Albedo increase in shrubland region of Australia combined with areduction in ET causes a warming during austral summer and acooling in austral winter. Very weak reduction in ET in tundra regions.
298 Snyder et al.: Evaluating the influence of different vegetation biomes on the global climate

indicate that they play a minor role in forcing the larger-scale hydrologic cycle.
Based on the results from all the simulations and theglobal average temperature and precipitation changeslisted in Table 8, Table 10 qualitatively shows theinfluence that a particular biome has on regions adja-cent to (regional connections) and far removed fromthe biome’s region (global teleconnections). Removal ofthe tropical forest vegetation can have a considerableimpact on the global climate and especially the north-ern hemisphere (Chase et al. 1996, 2000; Zhao et al.2001). Boreal and temperate forest vegetation removalcan also have an effect on the northern hemispherecirculation that may translate to changes in the climatein other locations confined to the northern hemisphere(Pielke and Vidale 1995). Regional connections aremore prevalent with the tropical, temperate, and borealforest biomes, however, even the shrubland/tundrabiome can influence the climate in other regions aspreviously shown. Future work is needed to address therole of different teleconnection mechanisms on the re-moval of the vegetation of the tropical, temperate, andboreal forest biomes.
11 Summary and conclusions
Land cover change can have a significant influence onthe climate system through exchanges of water, energy,and momentum. Large portions of the Earth’s surfacehave already been modified for human use and as aresult, noticeable changes in the climate have alreadyoccurred in some places. While it is now understood thatland use change can have an effect on the climate, it isless well known what biomes and regions are mostinfluential to the climate system. Moreover, the exactphysical processes operating on the climate system afterland use and land cover change have not been system-atically illustrated until now.
This study has attempted to comprehensively analyzethe influence of most of the Earth’s biomes on the cli-mate system. We have quantified the changes that haveoccurred with removal of the vegetation and shown theimportance of a particular biome’s contribution to theEarth system. We have identified the biomes and regionsthat affect the climate most strongly through changes indifferent atmospheric variables and we have described
Table 10 Qualitative summary of each biome’s influence on regions removed from the surface forcing (global teleconnections) and regionsadjacent to the surface forcing (regional connections). Ranking is from ‘strong’ to ‘moderate’ to ‘weak’. A brief description highlights theimportant mechanisms and climatic effects
Biome Regional and/or globalteleconnection
Description
Tropical forest Strong Removal of tropical forest vegetation leads to a change in the intensityand location of the high-level tropical outflow from deep tropical convection.This may influence the extratropics through anomalous Rossby wave forcing.Regional-scale connections include changes in the temperature, moisture flux,and precipitation due to changes in the regional circulation and the planetaryboundary layer (PBL).
Boreal forest Strong Removal of boreal forest vegetation can affect the entire northern hemisphereclimate through modification of the general circulation due to changes in thesurface pressure, the PBL, and atmospheric thermodynamics. Regional-scalechanges are primarily due to changes in the land surface properties that affectthe transport of heat, energy, and moisture in the regional circulation.
Temperate forest Moderate Removal of temperate forest vegetation can cause northern hemisphere-scalecirculation changes, however the magnitude of the effect is uncertain and maynot be comparable to the boreal forest vegetation removal case. Temperateforest vegetation removal has a larger effect on the regional climate dueto changes in the advection of heat and moisture between the deforestedregions and adjoining regions.
Savanna Weak The removal of savanna vegetation has no significant influence outsideof the areas of surface forcing. There are no identifiable globalteleconnections, although there are weak regional-scale connectionsthat influence the temperature and precipitation patterns in areasimmediately adjacent to the areas where the savanna vegetation hasbeen removed. Changes in convective precipitation do not appearto influence the extratropics as it does for the tropical forest vegetationremoval simulation.
Grassland and steppe Weak The removal of grassland steppe vegetation does not appear to influencethe global climate through any teleconnection mechanism. Regional-scaleconnections also do not appear to influence the climate very much.
Shrubland/tundra Weak/moderate The removal of shrubland vegetation has no discernable influence on theglobal climate and a very weak influence on the regional climate. The tundravegetation has no apparent influence on the global climate but hasa significant influence on the regional climate through reducing the advectionof heat into a region due to changes in the surface pressure.
Snyder et al.: Evaluating the influence of different vegetation biomes on the global climate 299

the underlying physical processes that are important ineach case. Furthermore, in some cases we have examinedthe influence of different vegetation types on regionsoutside of the areas of surface forcing.
Specifically, this study has quantified the climatic ef-fects of complete vegetation removal for the followingbiomes: tropical forest, boreal forest, temperate forest,savanna, grassland and steppe, and shrubland and tun-dra. There have been numerous studies on the influenceof large-scale tropical and boreal deforestation on theclimate, and our results support these findings. In thecase of tropical forest vegetation removal, our resultsshow a warming and drying of the areas where thevegetation had been removed due to severely reducedlatent cooling. With respect to the boreal forest biomeour results indicate that removal of the boreal forestvegetation leads to cooler surface temperatures due to ahigher surface albedo with snow persisting later into thespring season.
Although studies on the climatic effects of tropicaland boreal deforestation are numerous, this is not thecase for the remaining vegetation biomes analyzed inthis study. Results from the temperate forest vegetationremoval simulation show climate behavior characteristicof both the higher-latitude boreal forest simulation andthe lower-latitude tropical forest simulation. That is,removal of temperate forest vegetation leads to awarming and drying during the summer and fall monthsdue to a reduction in latent cooling with removal of thenormally transpiring vegetation and a cooling in thewinter and spring as the surface albedo of snow is higherthan the vegetation. Furthermore, an important regionalteleconnection in northern Siberia was identified in thetemperate forest vegetation removal case where warmair advection from the southwest was found to increasesurface temperatures upwards of 2 �C during the SONseason (Fig. 6c).
The simulation of savanna vegetation removal hasshown that it behaves similarly to the tropical forestbiome with a large reduction in precipitation and war-mer surface temperatures. A significant difference be-tween removal of the two biomes is in how they affectregions outside of their areas. The tropical forest simu-lation can influence the temperature, and more impor-tantly, the precipitation outside of the areas of surfaceforcing while the savanna simulation shows that thetemperature and precipitation changes are mostly lim-ited to the areas of surface forcing.
The results from the grassland and steppe vegetationremoval simulation were shown to primarily influencethe summertime climate over the central United Stateswith a modest reduction in latent cooling. As with thetropical forest, temperate forest, and savanna simula-tions, this causes an increase in the surface temperatureand a reduction in precipitation due to the weakenedflux of moisture from the land surface.
Removal of the shrubland and tundra vegetation wasshown to have a small influence on the global climate,but a larger signal in particular regions. For instance, it
was found that the removal of shrubland vegetation hasa large effect on the Australian climate with a modestwarming during the austral summer (DJF) and areduction in precipitation from the weakened surfacelatent heat flux. Removal of the tundra vegetation inAsia was shown to cause a large temperature anomaly todevelop northwest of Lake Baikal in central Siberiaduring the DJF season. This regional teleconnection(outside the area where the tundra was removed) is mostlikely due to an increase in the surface pressure justnorth of the cooling anomaly that weakens the advec-tion of warm air from the southwest.
Using a cross-comparison of each of the vegetationbiome removal simulations, we have shown the relativeinfluence that each vegetation biome has on the climateat the regional and global scales. Regionally, our resultsindicate that removal of the boreal forest biome has thelargest influence on the temperature field when averagedwithin the region of vegetation removal, globally (overall cells and only land cells), normalized by the area ofthe biome, and when excluding the region where thevegetation has been removed. With respect to precipi-tation, our results show that the removal of the tropicalforest biome has the largest influence on the precipita-tion field when averaged over the areas of surface forc-ing. However, when normalized by the area of thebiome, the savanna and grassland and steppe vegetationbiomes showed the largest precipitation response. Byexamining the global average excluding the areas wherethe vegetation was removed, the grassland and steppe,shrubland/tundra, and tropical forest simulationsshowed the largest influence on global precipitation.Finally, by comparing the global temperature responseoutside of the areas of surface forcing with the signalfrom a composite of ENSO events we showed that theremoval of many of the vegetation biomes had a tem-perature response that exceeded that of ENSO. This isindicative of the strong influence that the biosphere hason the atmosphere.
Finally, given that the two basic processes modulat-ing the removal of vegetation are the surface albedo andevapotranspiration, we made an informed ranking(based on the results) of each of the vegetation biomes asto how important the processes were with removal of thevegetation. We also qualitatively evaluated the influencethat the different vegetation biomes had on influencingthe regional and global climate through atmosphericteleconnection mechanisms. It was found that the trop-ical and boreal forest biomes have the most potential forinfluencing the climate remotely, however, the temperateforest and shrubland/tundra biomes were also found toexhibit specific regional teleconnection patterns primar-ily due to changes in the advection of air with removal ofthe vegetation.
Although it is unrealistic to assume that such largeareas of biomes may have vegetation removed, it isrealistic to assume that land use change will occur spo-radically throughout biomes and that different vegeta-tion may replace what is removed (e.g., tropical forest
300 Snyder et al.: Evaluating the influence of different vegetation biomes on the global climate

converted to pastureland). These changes can still sig-nificantly influence the climate with repercussions on thenative vegetation. Land use change occurring in somebiomes may alter the climate enough such that thevegetation that remains is subject to climatic conditionsoutside its optimal growing environment (Wang andEltahir 2000a, b, c). This illustrates a positive feedbackwhereby the vegetation helps maintain the climate nec-essary for the vegetation to exist in its environment.Anthropogenic land use change can alter the climate,thus setting the process in motion that causes furtherdestruction of the remaining vegetation. For instance, itis conceivable that a large enough temperature decreasein the boreal forest ecosystem could shift the environ-ment from a boreal biome to a sub-polar biome whereonly tundra could exist (Levis et al. 1999).
While we believe that this study has identified thedominant mechanisms responsible for influencing theclimate in different biomes, there are major limitations ofthis work and many potential avenues for future re-search. First, we acknowledge that wide-scale vegetationremoval is unrealistic for most of the biomes (the tropicalforests may be an exception). Future work will need toaddress more realistic or observed land use changeoccurring within several biomes and key regions. Second,it is important that the ocean dynamics be realisticallyrepresented using a coupled atmosphere-ocean-bio-sphere model as there are many important feedbacksbetween the three systems that act to amplify the climateresponse to vegetation removal (Delire et al. 2001).Finally, there are many questions regarding the role ofdifferent biomes in influencing the climate through tele-connections and regional connections. Future work mustexamine how the removal of vegetation affects the localand regional circulation as well as how certain biomesinfluence the climate through global teleconnections.
References
Amthor JS (1984) The role of maintenance respiration in plantgrowth. Plant, Cell Environment 7: 561–569
Baidya Roy S, Avissar R (2002) Impact of land use/land coverchange on regional hydrometeorology in Amazonia. J GeophysRes-Atmos 107(D20): LBA 4: 1–12
Bonan GB (1997) Effects of land use on the climate of the UnitedStates. Clim Change 37: 449–486
Bonan GB (1999) Frost followed the plow: Impacts of deforesta-tion on the climate of the United States. Ecological Applica-tions 9(4):1305–1315
Bonan GB (2001) Observational evidence for reduction of dailymaximum temperature by croplands in the Midwest UnitedStates. J Clim 14(11): 2430–2442
Bonan GB (2002) Ecological climatology. Cambridge UniversityPress, Cambridge, UK, pp 690
Bonan GB, Pollard D, Thompson SL (1992) Effects of boreal forestvegetation on global climate. Nature 359: 716–718
Bonan GB, Chapin FS III, Thompson SL (1995) Boreal forest andtundra ecosystems as components of the climate system. ClimChange 29: 145–167
Brovkin V, Levis S, Loutre MF, Crucifix M, Claussen M, Gano-polski A, Kubatzki C, Petoukhov V (2003) Stability analysis ofthe climate-vegetation system in the northern high latitudes.Clim Change 57(1–2): 119–138
Charney JG (1975) Dynamics of deserts and droughts in the Sahel.Q J R Meteorol Soc 101: 193–202
Charney JG, Stone PH, Quirk WJ (1975) Drought in the Sahara: abiogeophysical feedback mechanism. Science 187: 434–435
Charney JG, Quirk WJ, Chow S-H, Kornfield J (1977) A com-parative study of the effects of albedo change on drought insemi-arid regions. J Atmos Sci 34: 1366–1385
Chase TN, Pielke RA, Kittel TGF, Nemani R, Running SW (1996)Sensitivity of a general circulation model to global changes inleaf area index. J Geophys Res 101(D3): 7393–7408
Chase TN, Pielke RA, Kittel TGF, Nemani RR, Running SW(2000) Simulated impacts of historical land cover changes onglobal climate in northern winter. Clim Dyn 16(2–3): 93–105
Cohen J, Saito K, Entekhabi D (2001) The role of the Siberian highin Northern Hemisphere climate variability. Geophys Res Lett28(2): 299–302
Collatz GJ, Ribas-Carbo M, Berry JA (1992) Coupled photosyn-thesis-stomatal conductance model for leaves of C4 plants. AustJ Plant Physiol 19: 519–538
Collatz GJ, Ball JT, Grivet C, Berry JA (1991) Physiological andenvironmental regulation of stomatal conductance, photosyn-thesis and transpiration: a model that includes a laminarboundary layer. Agric Forest Meteorol 53: 107–136
Copeland JH, Pielke RA, Kittel TGF (1996) Potential climaticimpacts of vegetation change: a regional modeling study. JGeophys Res-Atmos 101(D3): 7409–7418
Costa MH, Foley JA (2000) Combined effects of deforestation anddoubled atmospheric CO2 concentrations on the climate ofAmazonia. J Clim 13(1): 18–34
Delire C, Behling P, Coe MT, Foley JA, Jacob R, Kutzbach J, LiuZY, Vavrus S (2001) Simulated response of the atmosphere-ocean system to deforestation in the Indonesian Archipelago.Geophys Res Lett 28(10): 2081–2084
Delire C, Levis S, Bonan GB, Foley JA, Coe MT, Vavrus S (2002)Comparison of the climate simulated by the CCM3 coupled totwo different land-surface models. Clim Dyn 19: 657–669
Dias MAFS, Rutledge S, Kabat P, Dias PLS, Nobre C, Fisch G,Dolman AJ, Zipser E, Garstang M, Manzi AO, Fuentes JD,Rocha HR, Marengo J, Plana-Fattori A, Sa LDA, Alvala RCS,AndreaeMO,ArtaxoP,GielowR,Gatti L (2002)Cloud and rainprocesses in a biosphere-atmosphere interaction context in theAmazonRegion. JGeophysRes-Atmos 107(D20): LBA 39: 1–18
Dickinson RE, Henderson-Sellers A (1988) Modelling tropicaldeforestation: a study of GCM land-surface parameterizations.Q J R Meteorol Soc 114: 439–462
Dickinson RE, Kennedy P (1992) Impacts on regional climate ofamazon deforestation. Geophys Res Lett 19(19): 1947–1950
Eltahir EAB (1996) Role of vegetation in sustaining large-scaleatmospheric circulations in the tropics. J Geophys Res 101(D2):4255–4268
Farquhar GD, von Caemmerer S, Berry JA (1980) A biochemicalmodel of photosynthetic CO2 assimilation in leaves of C3 spe-cies. Planta 149: 78–90
Foley JA, Prentice IC, Ramankutty N, Levis S, Pollard D, Sitch S,Haxeltine A (1996) An integrated biosphere model of landsurface processes, terrestrial carbon balance, and vegetationdynamics. Glob Biogeochem Cycle 10(4): 603–628
Fraedrich K, Kleidon A, Lunkeit F (1999) A green planet versus adesert world: Estimating the effect of vegetation extremes on theatmosphere. J Clim 12(10): 3156–3163
Ganopolski A, Petoukhov V, Rahmstorf S, Brovkin V, ClaussenM, Eliseev A, Kubatzki C (2001) CLIMBER-2: a climate sys-tem model of intermediate complexity. Part II: model sensitiv-ity. Clim Dyn 17(10): 735–751
Hack JJ, Kiehl JT, Hurrell JW (1998) The hydrologic and ther-modynamic characteristics of the NCAR CCM3. J Clim 11(6):1179–1206
Hahmann AN, Dickinson RE (1997) RCCM2-BATS model overtropical South America: applications to tropical deforestation. JClim 10: 1944–1964
Henderson-Sellers A, Dickinson RE, Durbridge TB, Kennedy PJ,McGuffie K, Pitman AJ (1993) Tropical deforestation:
Snyder et al.: Evaluating the influence of different vegetation biomes on the global climate 301

modeling local- to regional- scale climate change. J GeophysRes 98(D4): 7289–7315
Hurrell JW, Hack JJ, Boville BA, Williamson DL, Kiehl JT (1998)The dynamical simulation of the NCAR Community ClimateModel version 3 (CCM3). J Clim 11(6): 1207–1236
IGBP-DIS (1999) Global soil data task: spatial database of soilproperties. International Geosphere-Biosphere Programme -Data and Information System, Toulouse, France
Kiehl JT, Hack JJ, Bonan GB, Boville BA, Williamson DL, RaschPJ (1998a) The National Center for Atmospheric ResearchCommunity Climate Model: CCM3. J Clim 11(6): 1131–1149
Kiehl JT, Hack JJ, Hurrell JW (1998b) The energy budget of theNCAR Community Climate Model: CCM3. J Clim 11(6):1151–1178
Kleidon A, Fraedrich K, Heimann M (2000) A green planet versusa desert world: Estimating the maximum effect of vegetation onthe land surface climate. Clim Change 44(4): 471–493
Kucharik CJ, Foley JA, Delire C, Fisher VA, Coe MT, Lenters JD,Young-Molling C, Ramankutty N, Norman JM, Gower ST(2000) Testing the performance of a Dynamic Global Ecosys-tem Model: water balance, carbon balance, and vegetationstructure. Glob Biogeochem Cycle 14(3): 795–825
Lean J, Warrilow DA (1989) Simulation of the regional climaticimpact of amazon deforestation. Nature 342: 411–413
Lean J, Rowntree PR (1993) A GCM simulation of the impact ofamazonian deforestation on climate using an improved canopyrepresentation. Q J R Meteorol Soc 119: 509–530
Lean J, Rowntree PR (1997) Understanding the sensitivity of aGCM simulation of Amazonian deforestation to the specifica-tion of vegetation and soil characteristics. J Clim 10(6): 1216–1235
Levis S, Foley JA, Brovkin V, Pollard D (1999) On the stabilityof the high-latitude climate-vegetation system in a coupledatmosphere-biosphere model. Global Ecol Biogeogr 8(6):489–500
New M, Hulme M, Jones P (1999) Representing twentieth-centuryspace-time climate variability. Part I: development of a 1961–90mean monthly terrestrial climatology. J Clim 12(3): 829–856
Nobre CA, Sellers PJ, Shukla J (1991a) Amazonian deforestationand regional climate change. J Clim 4(10): 957–988
Nobre CA, Sellers PJ, Shukla J (1991b) Amazonian deforestationand regional climate change. J Clim 4: 957–988
Pielke RA (2001) Influence of the spatial distribution of vegetationand soils on the prediction of cumulus convective rainfall. RevGeophys 39(2): 151–177
Pielke RA, Vidale PL (1995) The boreal forest and the polar front.J Geophys Res 100(D12): 25,755–25,758
Pitman AJ (2003) The evolution of, and revolution in, land surfaceschemes designed for climate models. Int J Climatol 23: 479–510
Polcher J, Laval K (1994) The impact of african and amazoniandeforestation on tropical climate. J Hydrol 155: 389–405
Ramankutty N, Foley JA (1999) Estimating historical changes inglobal land cover: Croplands from 1700 to 1992. Glob Bio-geochem Cycle 13(4): 997–1027
Renssen H, Goosse H, Fichefet T (2003) On the non-linear re-sponse of the ocean thermohaline circulation to global defor-estation. Geophys Res Lett 30(2): 33 1–4
Sud YC, Shukla J, Mintz Y (1988) Influence of land surface-roughness on atmospheric circulation and precipitation - asensitivity study with a general- circulation model. J ApplMeteorol 27(9): 1036–1054
Sud YC, Walker GK, Kim JH, Liston GE, Sellers PJ, Lau WKM(1996) Biogeophysical consequences of a tropical deforestationscenario: A GCM simulation study. J Clim 9(12): 3225–3247
Thomas G, Rowntree PR (1992) The boreal forests and climate. QJ R Meteorol Soc 118: 469–497
Wang G, Eltahir EAB (2000a) Ecosystem dynamics and the Saheldrought. Geophys Res Lett 27(6): 795–798
Wang GL, Eltahir EAB (2000b) Biosphere-atmosphere interactionsover West Africa. I: Development and validation of a coupleddynamic model. Q J R Meteorol Soc 126(565): 1239–1260
Wang GL, Eltahir EAB (2000c) Biosphere-atmosphere interactionsover West Africa. II: multiple climate equilibria. Q J R Mete-orol Soc 126(565): 1261–1280
Xue Y, Sellers P, Kinter J, Shukla J (1991) A simplified biospheremodel for global climate studies. J Clim 4(3): 345–364
Zhang H, McGuffie K, HendersonSellers A (1996a) Impacts oftropical deforestation. Part II: the role of large-scale dynamics.J Clim 9(10): 2498–2521
Zhang H, Henderson-Sellers A, McGuffie K (1996b) Impacts oftropical deforestation. Part I: process analysis of local climaticchange. J Clim 9(7): 1497–1517
ZhaoM,PitmanAJ,ChaseT (2001)The impact of land cover changeon the atmospheric circulation. Clim Dyn 17(5–6): 467–477
302 Snyder et al.: Evaluating the influence of different vegetation biomes on the global climate