amity regional high school 25 newton road woodbridge, ct ...
Upload
khangminh22Category
view
0download
0
The WHO RegionalOffi ce for Europe
The World Health Organization (WHO) is a specialized agency of the United Nations created in 1948 with the primary responsibility for international health matters and public health. The WHO Regional Offi ce for Europe is one of six regional offi ces throughout the world, each with its own programme geared to the particular health conditions of the countries it serves.
Member States
AlbaniaAndorraArmeniaAustriaAzerbaijanBelarusBelgiumBosnia and HerzegovinaBulgariaCroatiaCyprusCzechiaDenmarkEstoniaFinlandFranceGeorgiaGermanyGreeceHungaryIcelandIrelandIsraelItalyKazakhstanKyrgyzstanLatviaLithuaniaLuxembourgMaltaMonacoMontenegroNetherlandsNorth MacedoniaNorwayPolandPortugalRepublic of MoldovaRomaniaRussian FederationSan MarinoSerbiaSlovakiaSloveniaSpainSwedenSwitzerlandTajikistanTurkeyTurkmenistanUkraineUnited KingdomUzbekistan
World Health OrganizationRegional Offi ce for Europe
UN City, Marmorvej 51, DK-2100 Copenhagen Ø, DenmarkTel: +45 45 33 70 00 Fax: +45 45 33 70 01Email: [email protected]: www.euro.who.int
European regional status report on road safety 2019The th Global Status Report Study estimated that more than people were killed from road-traffi c injuries in the WHO European Region in , representing % of road-traffi c deaths worldwide. Decreasing by % between and , the WHO European and Western Pacifi c regions are the only WHO regions to show reductions in road-traffi c mortality since the global community adopted the visionary but ambitious United Nations Sustainable Development Goal (SDG) target to “halve the number of road traffi c death and injuries by ”. Reductions in mortality have been achieved despite % growth in the number of registered vehicles. While the European Region has the lowest road-traffi c mortality rate of any WHO region ( . deaths per population compared to . per globally), wide variation continues to persist, with a seven-fold difference between countries with the highest and lowest road-traffi c mortality rates. Should the fall in the number of deaths continue at its current pace, SDG target . will not be met. This report assesses the laws and practices on key risk factors, such as regulating speed appropriate to road type, drink–driving, and use of seat belts, motorcycle helmets and child restraints to reduce the risk of road-traffi c injury.
European regional status report on road safety 2019
EUROPEANREGIONAL STATUS
REPORT ON ROAD SAFETY
2019
EUROPEANREGIONAL STATUS
REPORT ONROAD SAFETY
2019
AbstractThe fourth Global Status Report Study estimated that more than 80 000 people were killed from road-traffi c injuries in the WHO European Region in 2016, representing 6% of road-traffi c deaths worldwide. Decreasing by 13% between 2010 and 2016, the WHO European and Western Pacifi c regions are the only WHO regions to show reductions in road-traffi c mortality since the global community adopted the visionary but ambitious United Nations Sustainable Development Goal (SDG) target to “halve the number of road traffi c death and injuries by 2020”. Reductions in mortality have been achieved despite 14% growth in the number of registered vehicles. While the European Region has the lowest road-traffi c mortality rate of any WHO region (8.8 deaths per 100 000 population compared to 18.2 per 100 000 globally), wide variation continues to persist, with a seven-fold difference between countries with the highest and lowest road-traffi c mortality rates. Should the fall in the number of deaths continue at its current pace, SDG target 3.6 will not be met. This report assesses the laws and practices on key risk factors, such as regulating speed appropriate to road type, drink–driving, and use of seat belts, motorcycle helmets and child restraints to reduce the risk of road-traffi c injury.
Keywords ACCIDENTS, TRAFFIC – STATISTICS AND NUMERICAL DATAACCIDENTS, TRAFFIC – TRENDSWOUNDS AND INJURIES – EPIDEMIOLOGYSAFETYDATA COLLECTION EUROPE
ISBN 9789289054980
Address requests about publications of the WHO Regional Offi ce for Europe to: Publications WHO Regional Offi ce for Europe UN City, Marmorvej 51 DK-2100 Copenhagen Ø, DenmarkAlternatively, complete an online request form for documentation, health information, or for permission to quote or translate, on the Regional Offi ce website (http://www.euro.who.int/pubrequest).
© World Health Organization 2020Some rights reserved. This work is available under the Creative Commons Attribution-NonCommercial-ShareAlike 3.0 IGO licence (CC BY-NC-SA 3.0 IGO; https://creativecommons.org/licenses/by-nc-sa/3.0/igo).
Under the terms of this licence, you may copy, redistribute and adapt the work for noncommercial purposes, provided the work is appropriately cited, as indicated below. In any use of this work, there should be no suggestion that WHO endorses any specifi c organization, products or services. The use of the WHO logo is not permitted. If you adapt the work, then you must license your work under the same or equivalent Creative Commons licence. If you create a translation of this work, you should add the following disclaimer along with the suggested citation: “This translation was not created by the World Health Organization (WHO). WHO is not responsible for the content or accuracy of this translation. The original English edition shall be the binding and authentic edition”.
Any mediation relating to disputes arising under the licence shall be conducted in accordance with the mediation rules of the World Intellectual Property Organization..
Suggested citation. European regional status report on road safety 2019. Copenhagen: WHO Regional Offi ce for Europe; 2020. Licence: CC BY-NC-SA 3.0 IGO.
Cataloguing-in-Publication (CIP) data. CIP data are available at http://apps.who.int/iris.
Sales, rights and licensing. To purchase WHO publications, see http://apps.who.int/bookorders. To submit requests for commercial use and queries on rights and licensing, see http://www.who.int/about/licensing.
Third-party materials. If you wish to reuse material from this work that is attributed to a third party, such as Tables, Figures or images, it is your responsibility to determine whether permission is needed for that reuse and to obtain permission from the copyright holder. The risk of claims resulting from infringement of any third-party-owned component in the work rests solely with the user.
General disclaimers. The designations employed and the presentation of the material in this publication do not imply the expression of any opinion whatsoever on the part of WHO concerning the legal status of any country, territory, city or area or of its authorities, or concerning the delimitation of its frontiers or boundaries. Dotted and dashed lines on maps represent approximate border lines for which there may not yet be full agreement. The mention of specifi c companies or of certain manufacturers’ products does not imply that they are endorsed or recommended by WHO in preference to others of a similar nature that are not mentioned. Errors and omissions excepted, the names of proprietary products are distinguished by initial capital letters.
All reasonable precautions have been taken by WHO to verify the information contained in this publication. However, the published material is being distributed without warranty of any kind, either expressed or implied. The responsibility for the interpretation and use of the material lies with the reader. In no event shall WHO be liable for damages arising from its use.
Text editing: Alex MathiesonDesign: Damian Mullan, soitbegins.co.uk
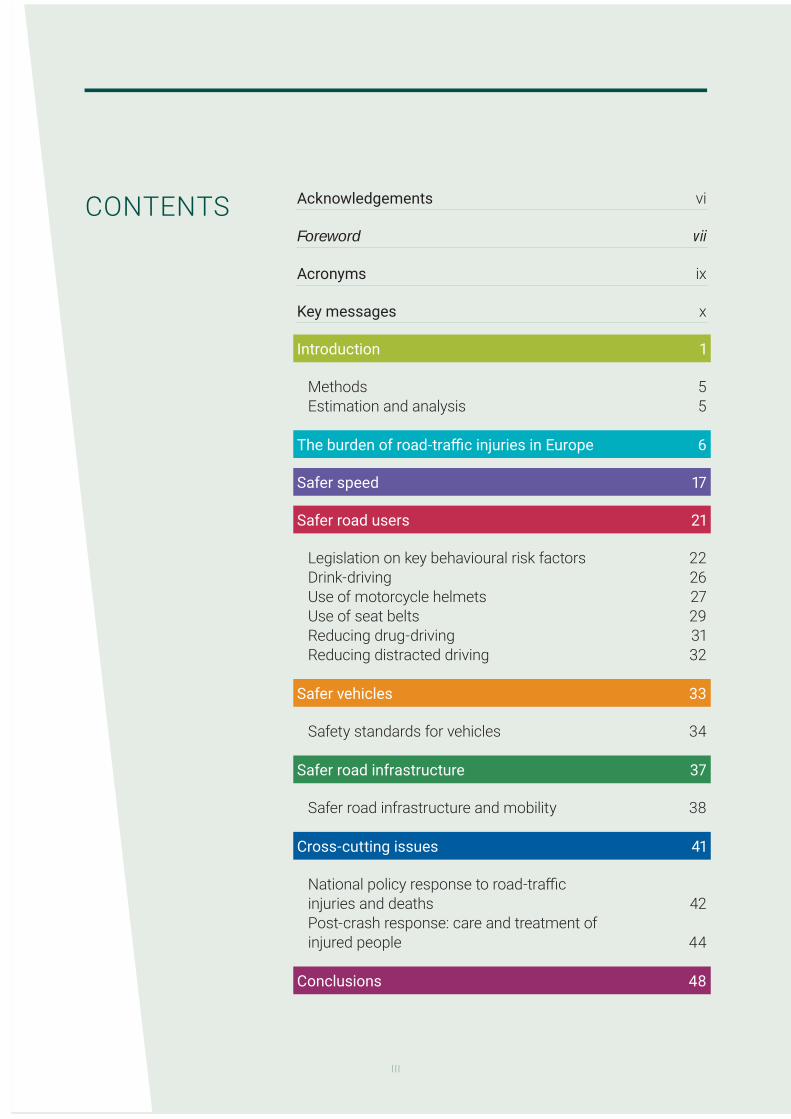
CONTENTS Acknowledgements vi
Foreword vii
Acronyms ix
Key messages x
Introduction
Methods Estimation and analysis
The burden of road-traffi c injuries in Europe
Safer speed
Safer road users
Legislation on key behavioural risk factors Drink-driving Use of motorcycle helmets Use of seat belts Reducing drug-driving Reducing distracted driving
Safer vehicles
Safety standards for vehicles
Safer road infrastructure
Safer road infrastructure and mobility
Cross-cutting issues
National policy response to road-traffi c injuries and deaths Post-crash response: care and treatment of injured people
Conclusions
III
References
Country profi les
Annex
National data coordinators
Annex
Methodology
Annex
Estimation of total road-traffi c deaths
Annex
The Stockholm Declaration
Annex
Statement of the WHO European Healthy Cities Network and the WHO Regions for Health Network
Annex
Global Youth Statement for Road Safety
IV

ACKNOWLEDGEMENTSThis report was written by Jonathon Passmore and Yongjie Yon (WHO Regional Offi ce for Europe). It uses data from the Global status report on road safety 2018. Nhan Tran, Anesh Sukhai, Kacem Iaych and Joelle Auert from WHO headquarters provided support for coordination of the project, data analysis and interpretation of road-safety laws.
The authors are very grateful to ministry of health and other government-appointed national data coordinators for their dedicated hard work in collecting the country information for the survey questionnaire, and government offi cials who cleared the data. Yongjie Yon, as the Regional Data Coordinator, worked with the national data coordinators to coordinate data collection. WHO representatives and staff at country level facilitated the collection of data for this report and their contribution is greatly acknowledged.
Thanks are extended to the interns and volunteers from the Violence and Injury Prevention programme at the WHO Regional Offi ce for Europe, who supported validation of the data and development of the report: Anda Llanaj (University of Melbourne, Australia), Akash Makhija (Boston University, United States of America), Dmytro Metilka (New University of Lisbon, Portugal), Gabriella Sutton (University of Malta), Gianluca Di Giacomo (Catholic University of the Sacred Heart, Italy), Julia Mutevelli (University of Bonn, Germany), Maria Ramiro Gonzalez (General University Hospital Gregorio Maranon, Spain) and Marijn van Waardenburg (Maastricht University, the Netherlands).
Generous fi nancial support from Bloomberg Philanthropies made this analysis and publication possible.
A paper to accompany this report has been published by the Lancet Public Health
VI
FOREWORDEach year, over 80 000 lives are tragically lost on our roads. Whether the victims are young or older, passenger, driver or pedestrian, each person whose life is suddenly cut short is someone’s child, parent, partner or friend. Every day, family and friends relive those moments when their loved ones were suddenly robbed of their lives.
Yet the truth is that every one of these deaths could have been prevented. Road-traffi c crashes are not mere accidents or random acts. They are highly predictable, and therefore preventable.
This report shows that over 221 people are killed on roads every day in the WHO European Region. Thousands more are injured or disabled, with long-lasting effects. The number of deaths and severe injuries from road crashes depends on where we live. People from the eastern part of our Region bear the highest burden of road-traffi c mortality and morbidity. But regardless of where these tragedies occur, the grief and anguish are all too similar for families, with communities and wider society enduring the immense burden of economic and productivity loss.
Perhaps one of the most distressing facts in this report is that road-traffi c crashes are the leading cause of all death for young children aged between 5 and 14 years. No child should die or be seriously injured on our roads while they walk, cycle or play.
Although our Region is one of only two that have seen a reduction in road-traffi c fatality, progress has not occurred at a pace fast enough to achieve the global target of halving road-traffi c deaths by 2020. There are many reasons for this modest progress: rapid urbanization and motorization, poor safety standards and infrastructure, lack of strong enforcement, drivers being distracted or under the influence of drugs or alcohol, speeding and a failure to wear seat belts or helmets, and lack of access to timely post-crash care.
The United Nations Sustainable Development Goals towards 2030, together with the 12 voluntary global performance targets for road safety, provide renewed actions for halving road-traffi c deaths. WHO’s extensive catalogue of normative and technical guidance for strengthening road safety is based on the recommended safe-systems approach to road safety. This approach recognizes that the human body is highly vulnerable to injury and that humans make mistakes, but that a set of complementary interventions, to create safer roads, safer vehicles, safer speeds and safer behaviour by road users, work together to accommodate error.
This European regional status report on road safety describes the progress made by governments in the Region. The report is based on a detailed survey of status reports on road safety completed by government-appointed national data coordinators in 51 of 53 Member States of the Region.
VII
We at the WHO Regional Offi ce for Europe hope this report will provide policy-makers, practitioners and activists with the information and guidance needed to continue momentum for the safe-system approach for road safety and ensure that families are spared from the unimaginable suffering of losing a loved one or living with the trauma and disability caused by these devastating and life-altering events.
Jonathon PassmoreProgramme Manager, Violence and Injury PreventionDivision of Noncommunicable Diseases and Promoting Health through the Life-course WHO Regional Offi ce for Europe
VIII
ACRONYMSAAF alcohol-attributable fraction ABS anti-lock braking systemsAIS Abbreviated Injury Scales BAC blood alcohol concentration CIS Commonwealth of Independent StatesEU European UnionEuroSafe European Association for Injury Prevention and Safety Promotion GDP gross domestic product GNI gross national incomeHICs high-income countriesiRAP International Road Assessment Programme LMICs low- and middle-income countries MAIS Maximum Abbreviated Injury ScoreSDGs Sustainable Development GoalsUNECE United Nations Economic Commission for Europe
IX
KEY MESSAGES WHO estimates that 80 559 people were killed in road-traffi c crashes in the WHO European
Region in 2016, representing 6% of global road-traffi c deaths. The WHO European Region has the lowest road-traffi c mortality rate of any WHO region at 8.8
per 100 000 population, compared to the global rate of 18.2 per 100 000. Between 2010 and 2016, road-traffi c injury deaths in the European Region decreased by 13%,
despite an overall increase of 14% in registered motor vehicles. Road crashes are the leading cause of death for children aged 5–14 years. Over 40% of those killed on the roads are pedestrians (25%), cyclists (5%) and
motorcyclists (11%). The risk of dying from road crashes varies widely across the Region, with a higher risk of dying
among men (74%), young adults (aged 15–29, at 24%) and older people (aged 70+, at 15%), as well as populations living in low- and middle-income countries (70%).
Mortality due to road-traffi c injury is almost seven times higher in the country with the highest rate than in that with the lowest rate.
Forty-six of 51 countries report having national road-safety strategies, but full funding for implementation is present only in nine countries, with partial funding in a further 36.
Only fi ve countries have road-safety legislation in line with WHO good practice recommendations for all fi ve behavioural risk factors (speed, alcohol, motorcycle helmets, seat belts and child restraints).
Forty-fi ve countries have road-traffi c legislation that meets best practice with at least one risk factor, but only fi ve have changed laws to bring them in line with best practice on all fi ve key risk factors: speed, drink–driving, motorcycle helmet use, seat-belt use and child restraints.
Forty-nine countries have full or partial safety reviews for the design and planning of new road infrastructure.
Thirty-one countries, representing over 520 million people, have implemented all eight priority United Nations vehicle-safety standards.
Every country in the Region has a single emergency care access number, with full national coverage.
The Sustainable Development Goal target 3.6 to halve road deaths and injuries by 2020 will not be met without drastic action.
X
111111111
INTRODUCTION
2
EUROPEAN REGIONAL STATUS REPORT ON ROAD SAFETY 2019
INTRODUCTIONRoad-traffi c injuries are a leading killer of young people aged 5–29 years in the WHO European Region (1). In 2010, the United Nations General Assembly adopted the Decade of Action for Road Safety 2011–2020 to reduce the global toll of road-traffi c injuries by 2020 (2). As a baseline for measuring progress, WHO published the Global status report on road safety 2013: supporting a decade of action (3), together with European facts and Global status report on road safety 2013 (4). In 2015, the historic Sustainable Development Goals (SDGs) were adopted by the United Nations General Assembly. Refl ective of its importance to international development agendas, the SDGs include two specifi c targets on road safety: goal 3.6 seeks to halve the number of global deaths and injuries from road-traffi c crashes by 2020, while goal 11.2 aims to provide access to safe and sustainable transport systems (5). Road safety is also recognized as a priority area in the Health 2020 European policy framework for health and well-being (6). The European Union (EU) road-safety policy framework 2011–2020 has a target of a 50% reduction in fatalities by 2020 (7).
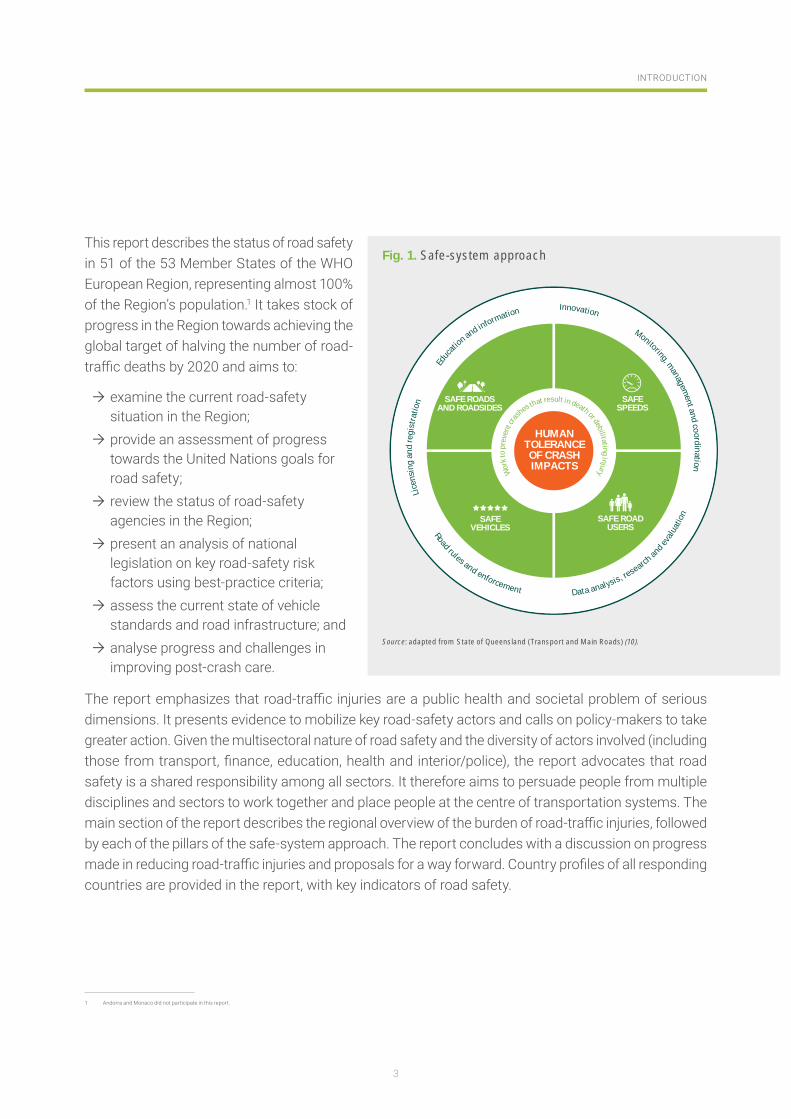
WHO’s technical recommendations for strengthening road safety are based on the safe-systems approach. Safe systems recognize that humans are both fallible and fragile. The human body is highly vulnerable to injury and humans make mistakes, but a set of complementary interventions to create safer roads, safer vehicles, safer speeds and safer behaviour by road users work together to accommodate the consequences of error and prevent inevitable crashes from resulting in death and serious injuries. Safe-systems, or so-called vision-zero, approaches to road safety gradually are gaining political traction, but the approaches require technical fail-safes to ensure implementation according to these principles rather than incorrect use as a label for road-safety actions that are neither data-driven nor evidence-based. The safe-systems approach provides a holistic framework to examine the risk factors and interventions of road-traffi c injuries (Fig. 1) (8–10).
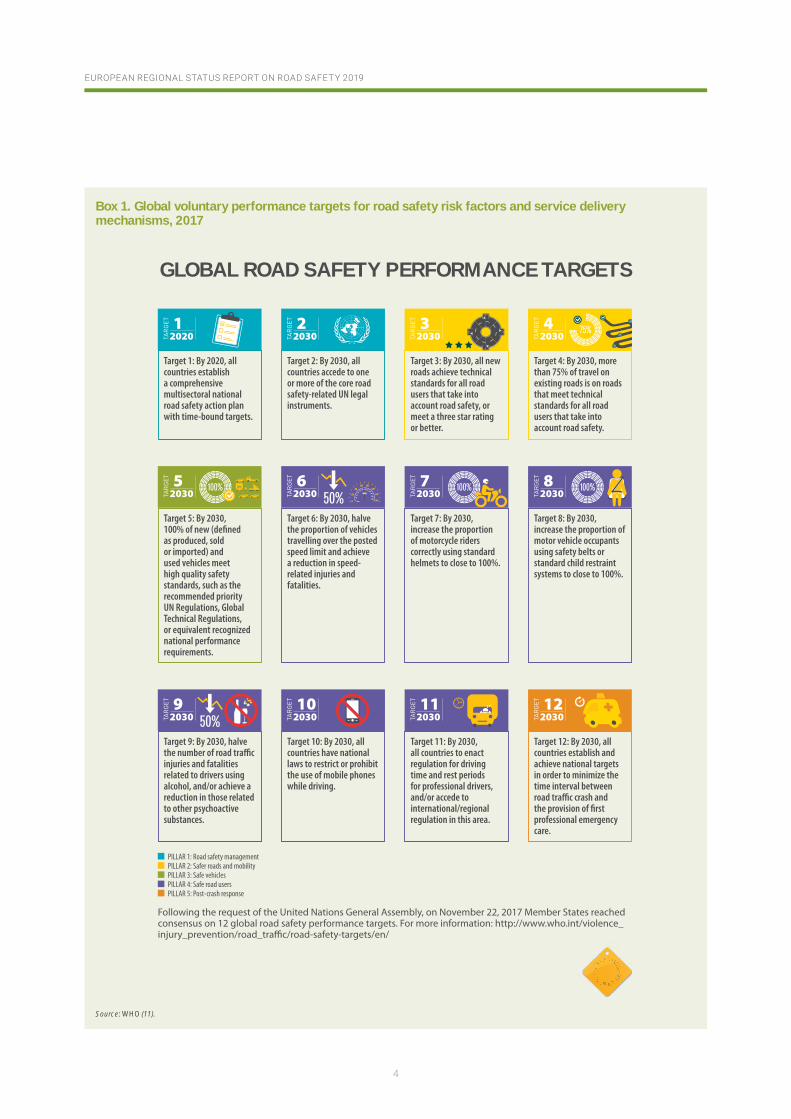
Against this backdrop of international actions on road safety, a notable global development has emerged to assist countries to renew their focus on road-safety management initiatives. In 2017, Member States, with the support of WHO, the United Nations Economic Commission for Europe (UNECE), the United Nations Children’s Fund, the World Bank and other agencies reached consensus on a set of 12 voluntary global performance targets for road-safety risk factors and service-delivery mechanisms (Box 1) (11). These voluntary targets provide a framework to guide and monitor implementation of legislation and the establishment of standards and other interventions to prevent crashes, injuries and deaths that are highlighted in this report.
This fourth European report is a supplement to the Global status report on road safety 2018 (12). The 2019 edition is the latest in a series of regional road-safety reports published by the WHO Regional Offi ce for Europe (with previous reports in 2009, 2013 and 2015). Data were collected in 2017–2018 and results refl ect the latest years of available data for mortality (2016), legislation (2017), road infrastructure assessment (2017) and vehicle-safety standards (2018).
3
INTRODUCTION
Wor
k to
prev
ent c
ra
shes that result in death or debilitating injury
HUMANTOLERANCEOF CRASHIMPACTS
SAFESPEEDS
SAFE ROADSAND ROADSIDES
SAFE ROADUSERS
SAFEVEHICLES
Innovation
Data analysis, research and ev
alua
tion
Road rules and enforcement
Lice
nsin
g an
d re
gist
ratio
n
Educ
ation and information
Monitoring, managem
ent and coor di nation
Fig. 1. Safe-system approach
Source: adapted from State of Queensland (Transport and Main Roads) (10).
This report describes the status of road safety in 51 of the 53 Member States of the WHO European Region, representing almost 100% of the Region’s population.1 It takes stock of progress in the Region towards achieving the global target of halving the number of road-traffi c deaths by 2020 and aims to:
examine the current road-safety situation in the Region;
provide an assessment of progress towards the United Nations goals for road safety;
review the status of road-safety agencies in the Region;
present an analysis of national legislation on key road-safety risk factors using best-practice criteria;
assess the current state of vehicle standards and road infrastructure; and
analyse progress and challenges in improving post-crash care.
The report emphasizes that road-traffi c injuries are a public health and societal problem of serious dimensions. It presents evidence to mobilize key road-safety actors and calls on policy-makers to take greater action. Given the multisectoral nature of road safety and the diversity of actors involved (including those from transport, fi nance, education, health and interior/police), the report advocates that road safety is a shared responsibility among all sectors. It therefore aims to persuade people from multiple disciplines and sectors to work together and place people at the centre of transportation systems. The main section of the report describes the regional overview of the burden of road-traffi c injuries, followed by each of the pillars of the safe-system approach. The report concludes with a discussion on progress made in reducing road-traffi c injuries and proposals for a way forward. Country profi les of all responding countries are provided in the report, with key indicators of road safety.
1 Andorra and Monaco did not participate in this report.
4
EUROPEAN REGIONAL STATUS REPORT ON ROAD SAFETY 2019
GLOBAL ROAD SAFETY PERFORMANCE TARGETS
20201
Target 1: By 2020, all countries establish a comprehensive multisectoral national road safety action plan with time-bound targets.
Target 2: By 2030, all countries accede to one or more of the core road safety-related UN legal instruments.
20302
Target 3: By 2030, all new roads achieve technical standards for all road users that take into account road safety, or meet a three star rating or better.
20303
Target 4: By 2030, more than 75% of travel on existing roads is on roads that meet technical standards for all road users that take into account road safety.
20304
Target 5: By 2030, 100% of new (defined as produced, sold or imported) and used vehicles meet high quality safety standards, such as the recommended priority UN Regulations, Global Technical Regulations, or equivalent recognized national performance requirements.
20305
Target 6: By 2030, halve the proportion of vehicles travelling over the posted speed limit and achieve a reduction in speed-related injuries and fatalities.
20306
Target 7: By 2030, increase the proportion of motorcycle riders correctly using standard helmets to close to 100%.
20307
Target 8: By 2030, increase the proportion of motor vehicle occupants using safety belts or standard child restraint systems to close to 100%.
20308
Target 9: By 2030, halve the number of road traffic injuries and fatalities related to drivers using alcohol, and/or achieve a reduction in those related to other psychoactive substances.
20309
Target 10: By 2030, all countries have national laws to restrict or prohibit the use of mobile phones while driving.
203010
Target 11: By 2030, all countries to enact regulation for driving time and rest periods for professional drivers, and/or accede to international/regional regulation in this area.
203011
Target 12: By 2030, all countries establish and achieve national targets in order to minimize the time interval between road traffic crash and the provision of first professional emergency care.
203012
Following the request of the United Nations General Assembly, on November 22, 2017 Member States reached consensus on 12 global road safety performance targets. For more information: http://www.who.int/violence_
PILLAR 1: Road safety managementPILLAR 2: Safer roads and mobilityPILLAR 3: Safe vehiclesPILLAR 4: Safe road usersPILLAR 5: Post-crash response
Box 1. Global voluntary performance targets for road safety risk factors and service deliverymechanisms, 2017
Source: WHO (11).
5
INTRODUCTION
METHODSData were collected through a standardized and self-administered questionnaire between 2017 and 2018. The questionnaire was administered by the Regional Offi ce with national data coordinators appointed by governments to coordinate country submissions (12) (Annex 1). The national data coordinatorsand experts from several sectors in each country reached consensus to complete the questionnaire. Using this method, data were collected on: (i) road-traffi c fatality for 2016; (ii) key policy indicators; (iii) legislation on the established behavioural risk factors of speed, drink–driving and non-use of motorcycle helmets, seat belts and child car restraints, as well as the emerging risk factors of mobile phone use and drug–driving; and (iv) road safety audits and mobility. Additional information, including road inspection data from the International Road Assessment Programme (iRAP) and vehicle standards from the UNECE database, were collected. All data were validated by national and WHO experts. A more detailed description of the methodology on data collection is provided in the Global status report on road safety 2018 (12) 8 and Annex 2. A detailed description of the methodology used to generate WHO estimates on road traffi c deaths for 2016 for all Member States is provided in the Global status report on road safety 2018 (12) 8 and Annex 3.
ESTIMATION AND ANALYSISBased on data collected from individual countries on the reported number of road-traffi c fatalities and source data, adjustments were made by WHO to account for potential underreporting due to differences in defi nitions and limitations in civil registration and vital statistics in some countries. This was followed by a country consultation to allow Member States to validate the data and respond to any changes that resulted from the process. Both the reported number of road-traffi c fatalities collected from the country and the WHO estimates are presented in the country profi les.
Since the last global and regional reports published in 2015 (13,14), criteria to assess best practices forlegislation on key road-safety risk factors have further been updated. Using the updated criteria, individual items of laws on behavioural risk factors from the previous report were analysed retrospectively and compared with the analysis of legislation for this report.
THE BURDEN OF ROAD-TRAFFIC INJURIES IN EUROPETHE BURDEN OFROAD-TRAFFIC INJURIESIN EUROPE
7
THE BURDEN OF ROAD-TRAFFIC INJURIES IN EUROPE
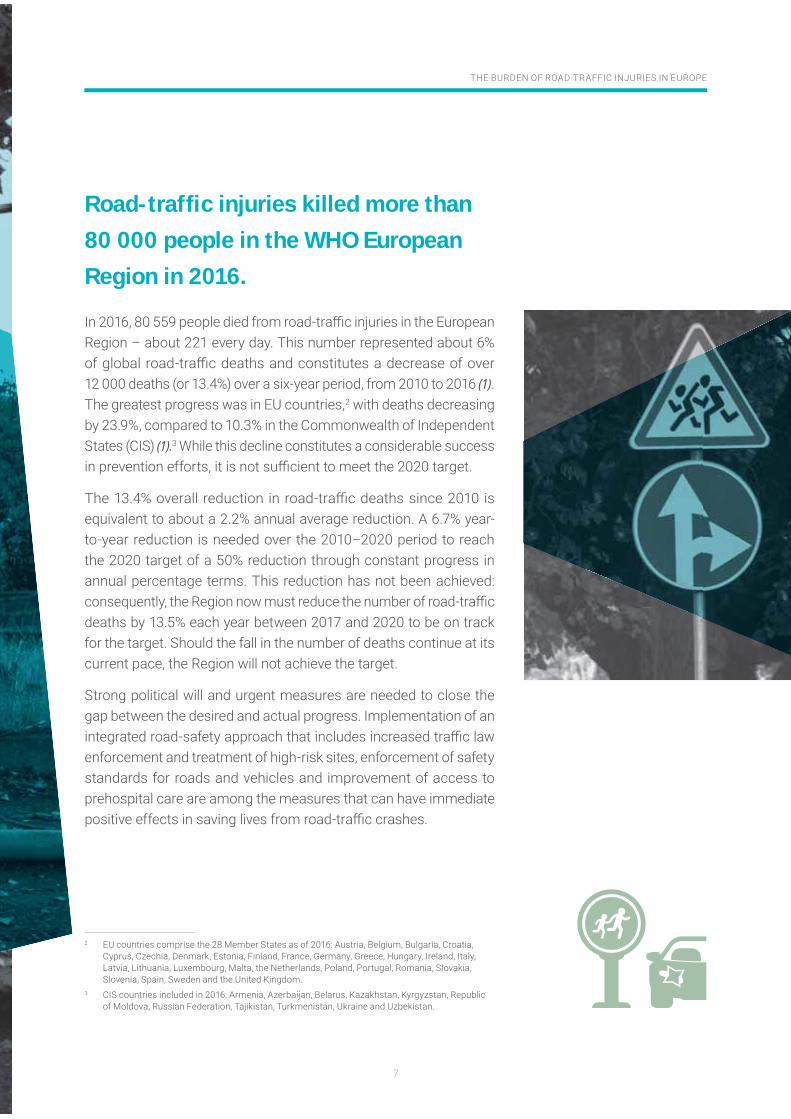
Road-traffi c injuries killed more than 80 000 people in the WHO European Region in 2016.
In 2016, 80 559 people died from road-traffi c injuries in the European Region – about 221 every day. This number represented about 6% of global road-traffi c deaths and constitutes a decrease of over 12 000 deaths (or 13.4%) over a six-year period, from 2010 to 2016 (1). The greatest progress was in EU countries,2 with deaths decreasing by 23.9%, compared to 10.3% in the Commonwealth of Independent States (CIS) (1).3 While this decline constitutes a considerable success in prevention efforts, it is not suffi cient to meet the 2020 target.
The 13.4% overall reduction in road-traffi c deaths since 2010 is equivalent to about a 2.2% annual average reduction. A 6.7% year-to-year reduction is needed over the 2010–2020 period to reach the 2020 target of a 50% reduction through constant progress in annual percentage terms. This reduction has not been achieved: consequently, the Region now must reduce the number of road-traffi c deaths by 13.5% each year between 2017 and 2020 to be on track for the target. Should the fall in the number of deaths continue at its current pace, the Region will not achieve the target.
Strong political will and urgent measures are needed to close the gap between the desired and actual progress. Implementation of an integrated road-safety approach that includes increased traffi c law enforcement and treatment of high-risk sites, enforcement of safety standards for roads and vehicles and improvement of access to prehospital care are among the measures that can have immediate positive effects in saving lives from road-traffi c crashes.
2 EU countries comprise the 28 Member States as of 2016: Austria, Belgium, Bulgaria, Croatia, Cyprus, Czechia, Denmark, Estonia, Finland, France, Germany, Greece, Hungary, Ireland, Italy, Latvia, Lithuania, Luxembourg, Malta, the Netherlands, Poland, Portugal, Romania, Slovakia, Slovenia, Spain, Sweden and the United Kingdom.
3 CIS countries included in 2016: Armenia, Azerbaijan, Belarus, Kazakhstan, Kyrgyzstan, Republic of Moldova, Russian Federation, Tajikistan, Turkmenistan, Ukraine and Uzbekistan.
8
EUROPEAN REGIONAL STATUS REPORT ON ROAD SAFETY 2019
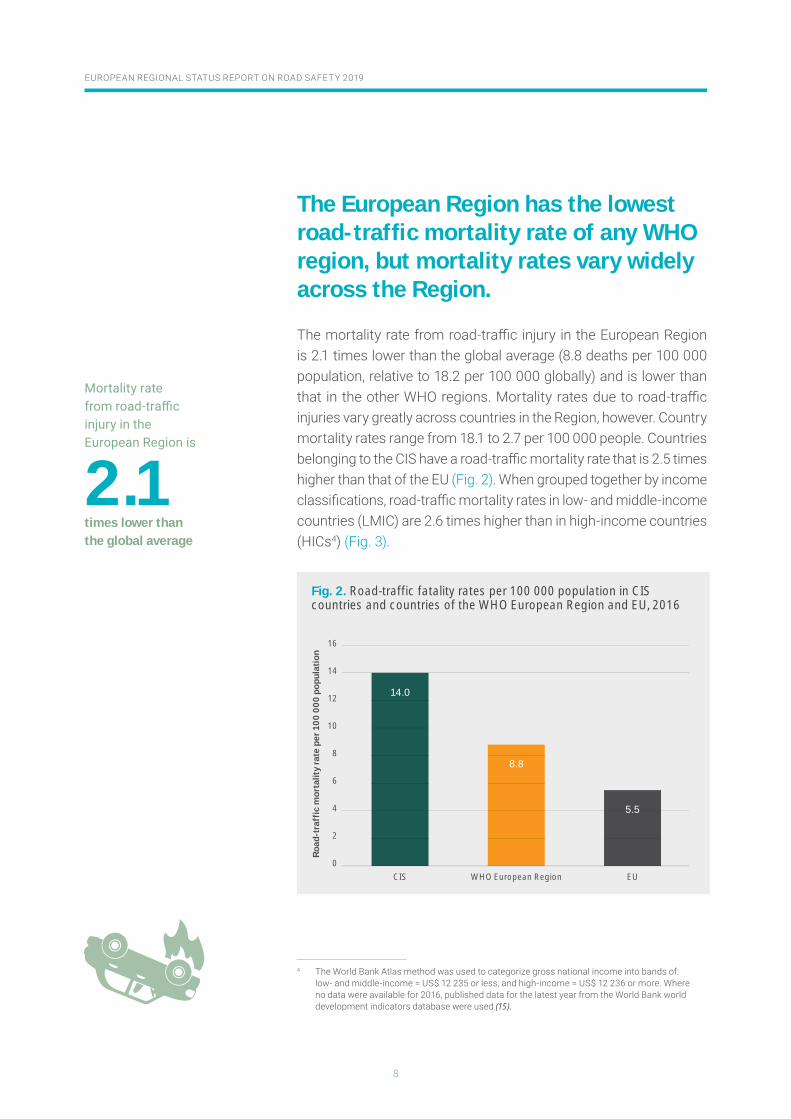
The European Region has the lowest road-traffi c mortality rate of any WHOregion, but mortality rates vary widelyacross the Region.
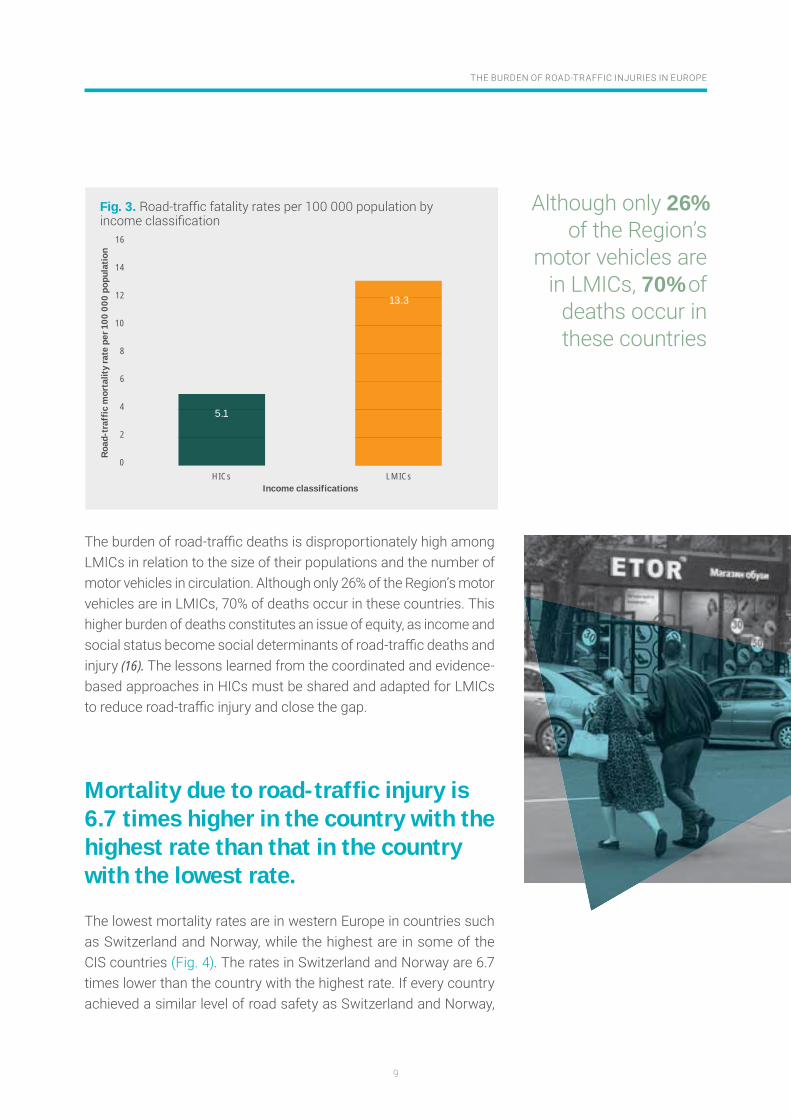
The mortality rate from road-traffi c injury in the European Region is 2.1 times lower than the global average (8.8 deaths per 100 000 population, relative to 18.2 per 100 000 globally) and is lower than that in the other WHO regions. Mortality rates due to road-traffi c injuries vary greatly across countries in the Region, however. Country mortality rates range from 18.1 to 2.7 per 100 000 people. Countries belonging to the CIS have a road-traffi c mortality rate that is 2.5 times higher than that of the EU (Fig. 2). When grouped together by income classifi cations, road-traffi c mortality rates in low- and middle-income countries (LMIC) are 2.6 times higher than in high-income countries (HICs4) (Fig. 3).
4 The World Bank Atlas method was used to categorize gross national income into bands of: low- and middle-income = US$ 12 235 or less; and high-income = US$ 12 236 or more. Where no data were available for 2016, published data for the latest year from the World Bank world development indicators database were used (15).
WHO European RegionCIS EU0
4
6
8
10
12
16
2
14
8.8
5.5
14.0
Road
-tra
ffic
mor
talit
y ra
te p
er 1
00 0
00 p
opul
atio
n
Fig. 2. Road-traffic fatality rates per 100 000 population in CIScountries and countries of the WHO European Region and EU, 2016
Mortality rate from road-traffi c injury in the European Region is
2.1times lower thanthe global average
9
THE BURDEN OF ROAD-TRAFFIC INJURIES IN EUROPE
Although only 26% of the Region’s
motor vehicles are in LMICs, 70% of
deaths occur in these countries
The burden of road-traffi c deaths is disproportionately high among LMICs in relation to the size of their populations and the number of motor vehicles in circulation. Although only 26% of the Region’s motor vehicles are in LMICs, 70% of deaths occur in these countries. This higher burden of deaths constitutes an issue of equity, as income and social status become social determinants of road-traffi c deaths and injury (16). The lessons learned from the coordinated and evidence-based approaches in HICs must be shared and adapted for LMICs to reduce road-traffi c injury and close the gap.
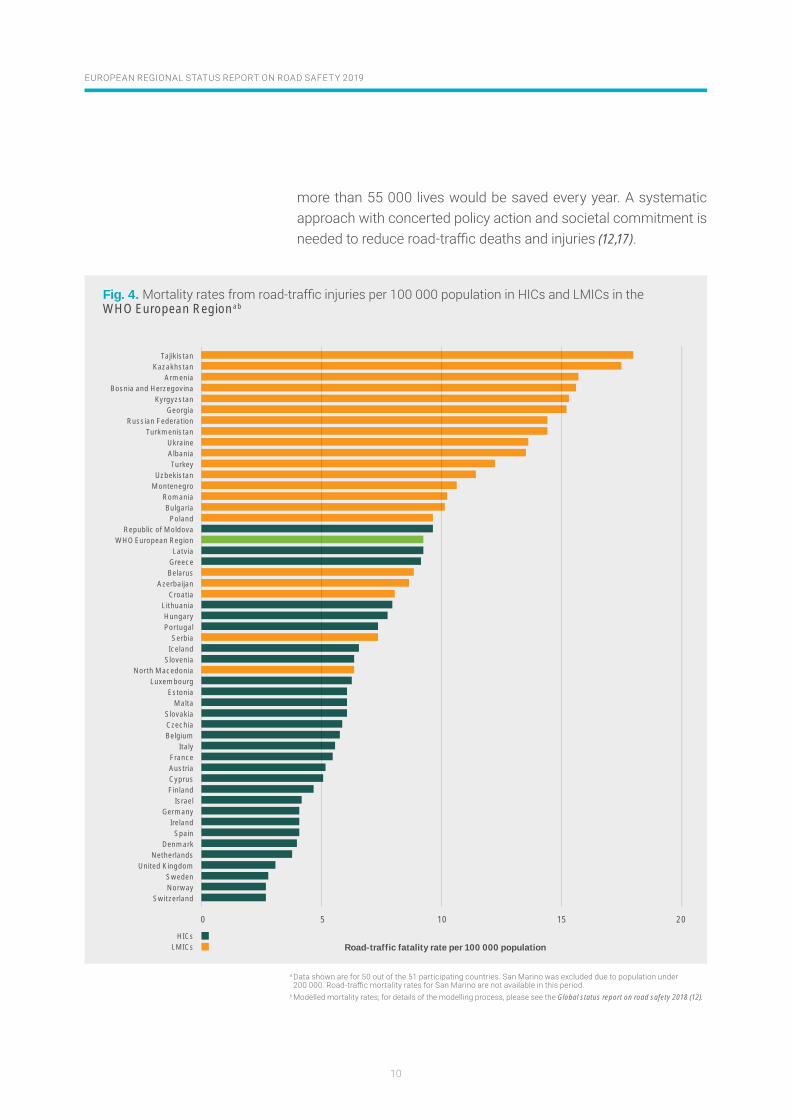
Mortality due to road-traffi c injury is 6.7 times higher in the country with the highest rate than that in the country with the lowest rate.
The lowest mortality rates are in western Europe in countries such as Switzerland and Norway, while the highest are in some of the CIS countries (Fig. 4). The rates in Switzerland and Norway are 6.7 times lower than the country with the highest rate. If every country achieved a similar level of road safety as Switzerland and Norway,
HICsIncome classifications
Roa
d-tr
affi
c m
orta
lity
rate
per
100
000
pop
ulat
ion
LMICs0
4
6
8
10
12
16
2
14
13.3
5.1
Fig. 3.
10
EUROPEAN REGIONAL STATUS REPORT ON ROAD SAFETY 2019
50 10 15 20
TajikistanKazakhstan
ArmeniaBosnia and Herzegovina
KyrgyzstanGeorgia
Russian FederationTurkmenistan
UkraineAlbaniaTurkey
UzbekistanMontenegro
RomaniaBulgaria
PolandRepublic of Moldova
WHO European RegionLatvia
GreeceBelarus
AzerbaijanCroatia
LithuaniaHungaryPortugal
SerbiaIceland
SloveniaNorth Macedonia
LuxembourgEstonia
MaltaSlovakiaCzechiaBelgium
ItalyFranceAustriaCyprusFinland
IsraelGermany
IrelandSpain
DenmarkNetherlands
United KingdomSwedenNorway
Switzerland
Road-traffic fatality rate per 100 000 populationHICs
LMICs
Fig. 4. WHO European Regionab
more than 55 000 lives would be saved every year. A systematic approach with concerted policy action and societal commitment is needed to reduce road-traffi c deaths and injuries (12,17).
a Data shown are for 50 out of the 51 participating countries. San Marino was excluded due to population under 200 000. Road-traffi c mortality rates for San Marino are not available in this period.
b Modelled mortality rates; for details of the modelling process, please see the Global status report on road safety 2018 (12).
11
THE BURDEN OF ROAD-TRAFFIC INJURIES IN EUROPE
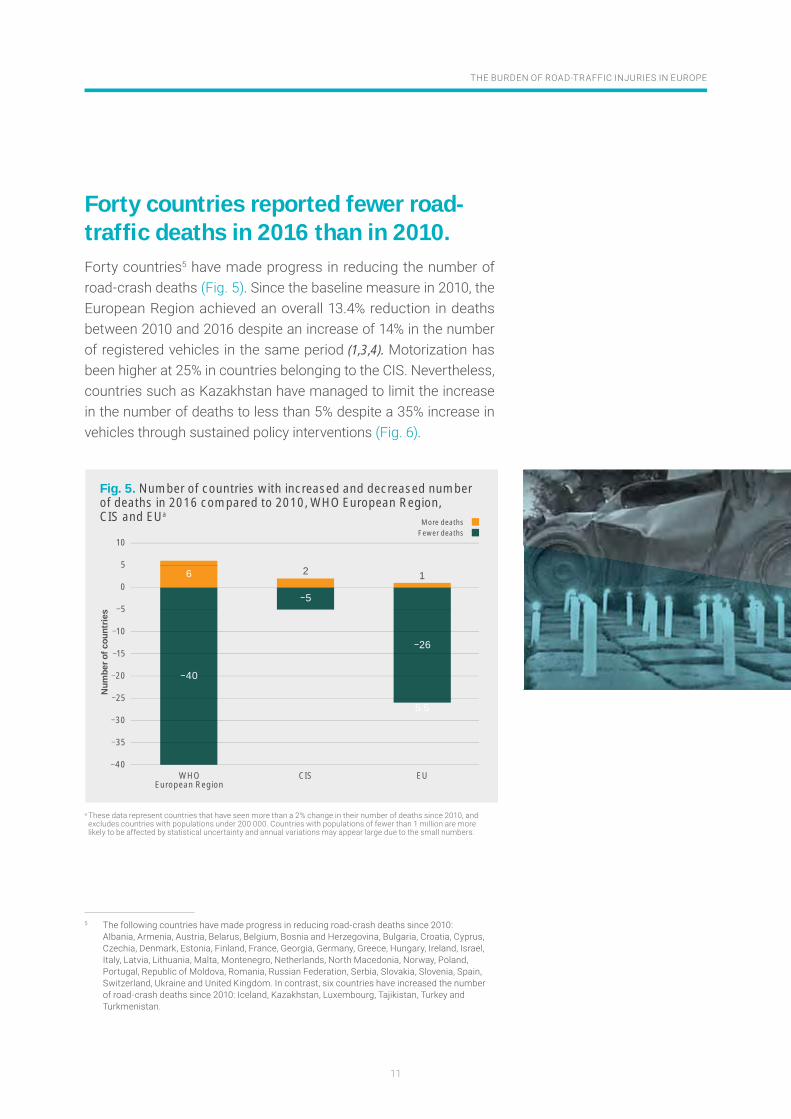
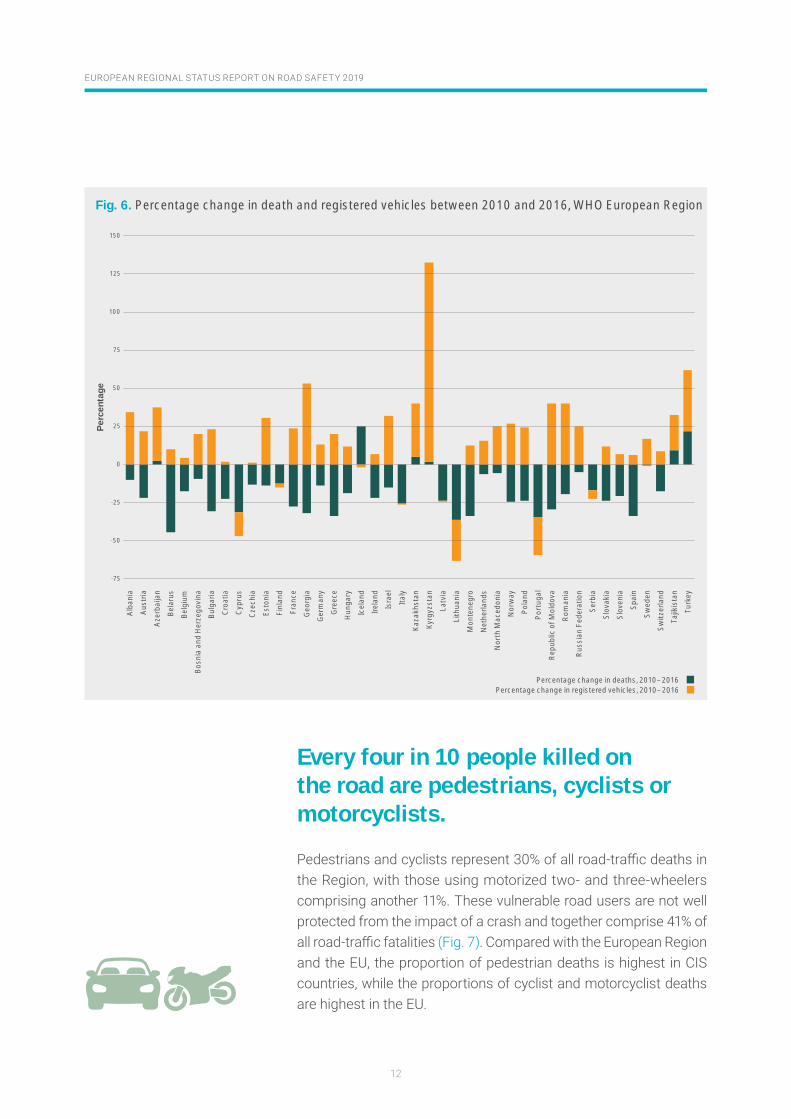
Forty countries reported fewer road-traffi c deaths in 2016 than in 2010.Forty countries5 have made progress in reducing the number of road-crash deaths (Fig. 5). Since the baseline measure in 2010, the European Region achieved an overall 13.4% reduction in deaths between 2010 and 2016 despite an increase of 14% in the number of registered vehicles in the same period (1,3,4). Motorization has been higher at 25% in countries belonging to the CIS. Nevertheless, countries such as Kazakhstan have managed to limit the increase in the number of deaths to less than 5% despite a 35% increase in vehicles through sustained policy interventions (Fig. 6).
5 The following countries have made progress in reducing road-crash deaths since 2010: Albania, Armenia, Austria, Belarus, Belgium, Bosnia and Herzegovina, Bulgaria, Croatia, Cyprus, Czechia, Denmark, Estonia, Finland, France, Georgia, Germany, Greece, Hungary, Ireland, Israel, Italy, Latvia, Lithuania, Malta, Montenegro, Netherlands, North Macedonia, Norway, Poland, Portugal, Republic of Moldova, Romania, Russian Federation, Serbia, Slovakia, Slovenia, Spain, Switzerland, Ukraine and United Kingdom. In contrast, six countries have increased the number of road-crash deaths since 2010: Iceland, Kazakhstan, Luxembourg, Tajikistan, Turkey and Turkmenistan.
WHOEuropean Region
CIS EU
5
10
15
20
25
30
35
40
0
10
5 2
5.5
6
40
26
5
1
Num
ber o
f cou
ntrie
s
Fig. 5. Number of countries with increased and decreased numberof deaths in 2016 compared to 2010, WHO European Region, CIS and EUa
More deathsFewer deaths
a These data represent countries that have seen more than a 2% change in their number of deaths since 2010, and excludes countries with populations under 200 000. Countries with populations of fewer than 1 million are more likely to be affected by statistical uncertainty and annual variations may appear large due to the small numbers.
12
EUROPEAN REGIONAL STATUS REPORT ON ROAD SAFETY 2019
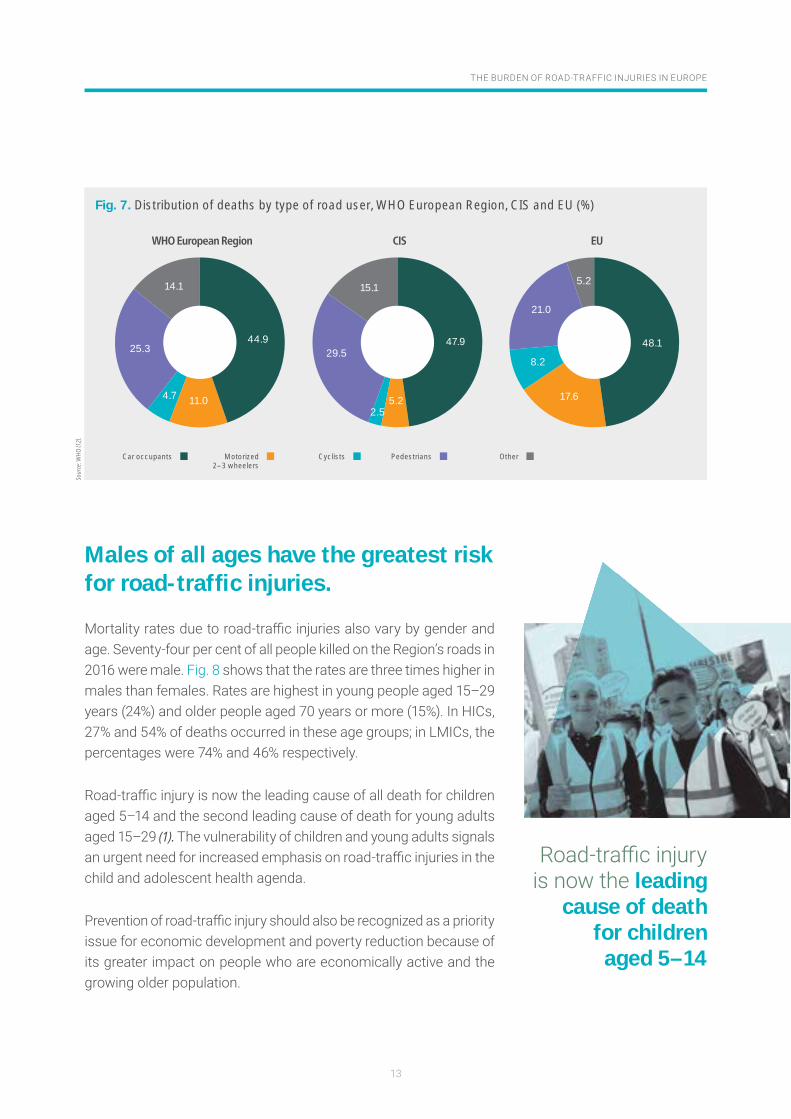
Every four in 10 people killed on the road are pedestrians, cyclists or motorcyclists.
Pedestrians and cyclists represent 30% of all road-traffi c deaths in the Region, with those using motorized two- and three-wheelers comprising another 11%. These vulnerable road users are not well protected from the impact of a crash and together comprise 41% of all road-traffi c fatalities (Fig. 7). Compared with the European Region and the EU, the proportion of pedestrian deaths is highest in CIS countries, while the proportions of cyclist and motorcyclist deaths are highest in the EU.
Percentage change in registered vehicles, 2010–2016Percentage change in deaths, 2010–2016
Perc
enta
ge
0
50
25
75
25
50
75
100
150
125
Alba
nia
Aust
ria
Aze
rbai
jan
Bela
rus
Belg
ium
Bosn
ia a
nd H
erze
govi
na
Bulg
aria
Croa
tia
Cyp
rus
Czec
hia
Esto
nia
Finl
and
Fran
ce
Geo
rgia
Ger
man
y
Gre
ece
Hun
gary
Icel
and
Irela
nd
Isra
el
Italy
Kaza
khst
an
Kyrg
yzst
an
Latv
ia
Lith
uani
a
Mon
tene
gro
Net
herla
nds
Nor
th M
aced
onia
Nor
way
Pola
nd
Port
ugal
Rep
ublic
of M
oldo
va
Rom
ania
Russ
ian
Fede
ratio
n
Serb
ia
Slov
akia
Slov
enia
Spai
n
Swed
en
Switz
erla
nd
Tajik
ista
n
Turk
ey
Fig. 6. Percentage change in death and registered vehicles between 2010 and 2016, WHO European Region
13
THE BURDEN OF ROAD-TRAFFIC INJURIES IN EUROPE
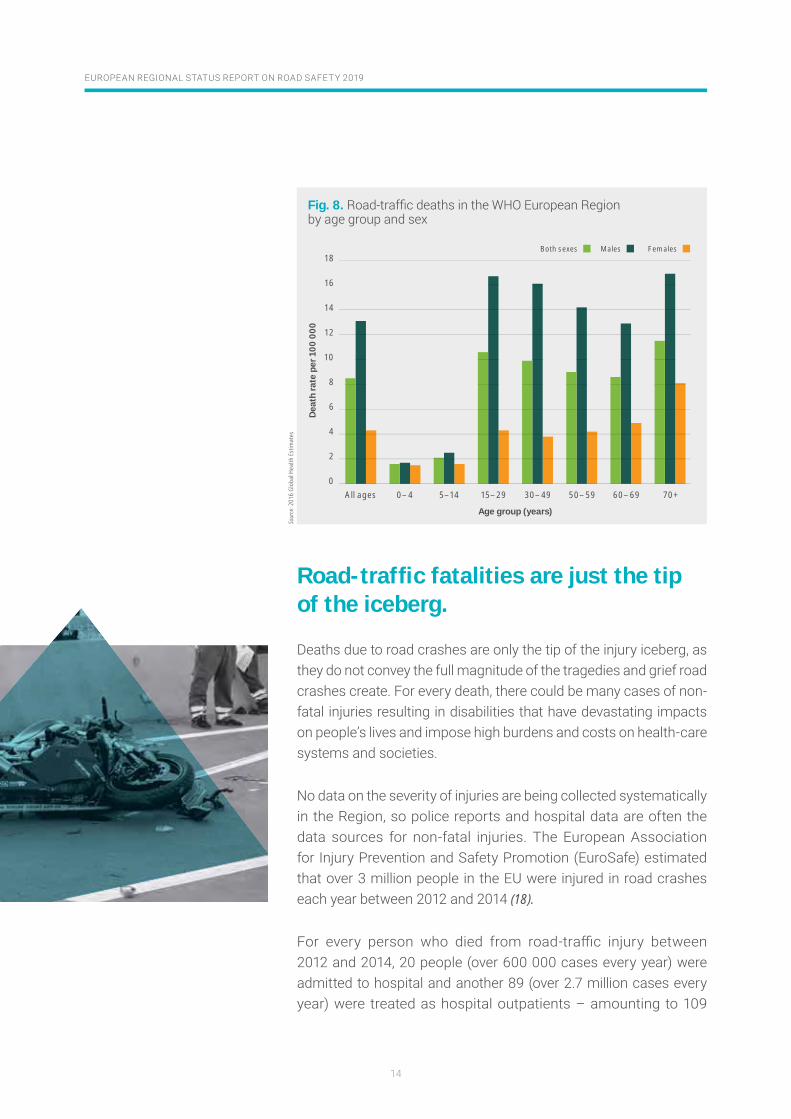
Males of all ages have the greatest risk for road-traffi c injuries.
Mortality rates due to road-traffi c injuries also vary by gender and age. Seventy-four per cent of all people killed on the Region’s roads in 2016 were male. Fig. 8 shows that the rates are three times higher in males than females. Rates are highest in young people aged 15–29 years (24%) and older people aged 70 years or more (15%). In HICs, 27% and 54% of deaths occurred in these age groups; in LMICs, the percentages were 74% and 46% respectively.
Road-traffi c injury is now the leading cause of all death for children aged 5–14 and the second leading cause of death for young adults aged 15–29 (1). The vulnerability of children and young adults signals an urgent need for increased emphasis on road-traffi c injuries in the child and adolescent health agenda.
Prevention of road-traffi c injury should also be recognized as a priority issue for economic development and poverty reduction because of its greater impact on people who are economically active and the growing older population.
Road-traffi c injury is now the leading
cause of death for children
aged 5–14
Sour
ce: W
HO
(12)
.
44.9
11.04.7
25.3
14.1
47.9
5.22.5
29.5
15.1
48.1
17.6
8.2
21.0
5.2
Car occupants Motorized2–3 wheelers
Cyclists Pedestrians Other
WHO European Region CIS EU
Fig. 7. Distribution of deaths by type of road user, WHO European Region, CIS and EU (%)
14
EUROPEAN REGIONAL STATUS REPORT ON ROAD SAFETY 2019
Road-traffi c fatalities are just the tip of the iceberg.
Deaths due to road crashes are only the tip of the injury iceberg, as they do not convey the full magnitude of the tragedies and grief road crashes create. For every death, there could be many cases of non-fatal injuries resulting in disabilities that have devastating impacts on people’s lives and impose high burdens and costs on health-care systems and societies.
No data on the severity of injuries are being collected systematically in the Region, so police reports and hospital data are often the data sources for non-fatal injuries. The European Association for Injury Prevention and Safety Promotion (EuroSafe) estimated that over 3 million people in the EU were injured in road crashes each year between 2012 and 2014 (18).
For every person who died from road-traffi c injury between 2012 and 2014, 20 people (over 600 000 cases every year) were admitted to hospital and another 89 (over 2.7 million cases every year) were treated as hospital outpatients – amounting to 109
Sour
ce: 2
016
Glo
bal H
ealth
Est
imat
es
0–4 5–14 15–29 30–49 50–59 60–69 70+All ages0
4
6
8
10
12
18
16
2
14D
eath
rate
per
100
000
Age group (years)
Both sexes Males Females
Fig. 8.
15
THE BURDEN OF ROAD-TRAFFIC INJURIES IN EUROPE
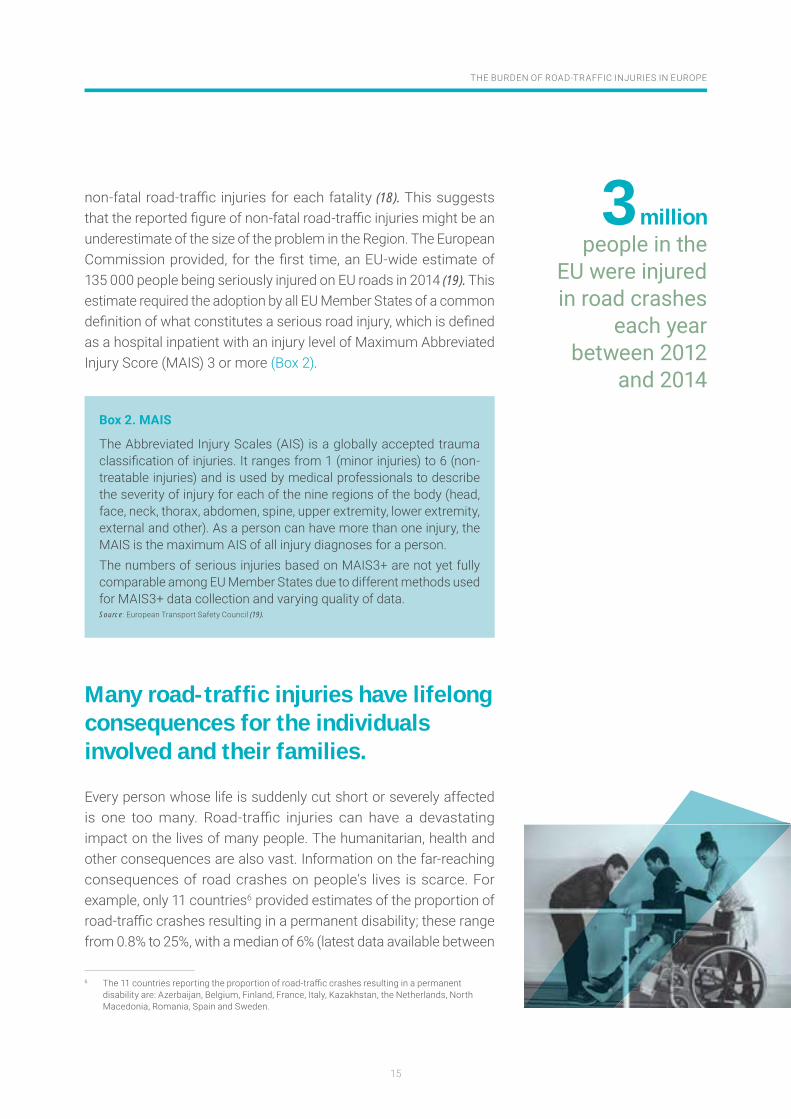
non-fatal road-traffi c injuries for each fatality (18). This suggests that the reported fi gure of non-fatal road-traffi c injuries might be an underestimate of the size of the problem in the Region. The European Commission provided, for the fi rst time, an EU-wide estimate of 135 000 people being seriously injured on EU roads in 2014 (19). This estimate required the adoption by all EU Member States of a common defi nition of what constitutes a serious road injury, which is defi ned as a hospital inpatient with an injury level of Maximum Abbreviated Injury Score (MAIS) 3 or more (Box 2).
Many road-traffi c injuries have lifelong consequences for the individuals involved and their families.
Every person whose life is suddenly cut short or severely affected is one too many. Road-traffi c injuries can have a devastating impact on the lives of many people. The humanitarian, health and other consequences are also vast. Information on the far-reaching consequences of road crashes on people’s lives is scarce. For example, only 11 countries6 provided estimates of the proportion of road-traffi c crashes resulting in a permanent disability; these range from 0.8% to 25%, with a median of 6% (latest data available between
6 The 11 countries reporting the proportion of road-traffi c crashes resulting in a permanent disability are: Azerbaijan, Belgium, Finland, France, Italy, Kazakhstan, the Netherlands, North Macedonia, Romania, Spain and Sweden.
Box 2. MAIS
The Abbreviated Injury Scales (AIS) is a globally accepted trauma classifi cation of injuries. It ranges from 1 (minor injuries) to 6 (non-treatable injuries) and is used by medical professionals to describe the severity of injury for each of the nine regions of the body (head, face, neck, thorax, abdomen, spine, upper extremity, lower extremity, external and other). As a person can have more than one injury, the MAIS is the maximum AIS of all injury diagnoses for a person.The numbers of serious injuries based on MAIS3+ are not yet fully comparable among EU Member States due to different methods used for MAIS3+ data collection and varying quality of data.Source: European Transport Safety Council (19).
3millionpeople in the
EU were injured in road crashes
each year between 2012
and 2014
16
EUROPEAN REGIONAL STATUS REPORT ON ROAD SAFETY 2019
2008 and 2016). These data are likely to underestimate the scale of the problem and better information on the severity of injuries leading to disability is needed.
The economic burden to society warrants increased action across all sectors in countries.
Twenty-eight countries have conducted studies to calculate the economic costs of road crashes as a proportion of their gross domestic product (GDP). Reported societal costs due to road crashes range from 0.4–4.1% of GDP. More estimates are needed, using a standardized methodology to assess GDP loss. Analysis of the progress on road safety of EU countries has shown that more than 30 000 road deaths were prevented between 2011 and 2017; the total value of reductions in this period is about €70 billion. As is the case across the European Region, had the EU been able to reduce road-traffi c deaths at a constant rate of 6.7%, close to 20 000 more lives could have been saved, with an additional value of €40 billion savings in human costs. In other words, the total value of the benefi t to society would have increased to about €110 billion (19). The high value of societal costs avoided (and those that could have been avoided) provide a clear investment case for policy-makers across sectors on road safety.
Reportedsocietalcosts due toroad crashesrange from 0.4–4.1%of GDP
17
SAFER SPEED
18
EUROPEAN REGIONAL STATUS REPORT ON ROAD SAFETY 2019
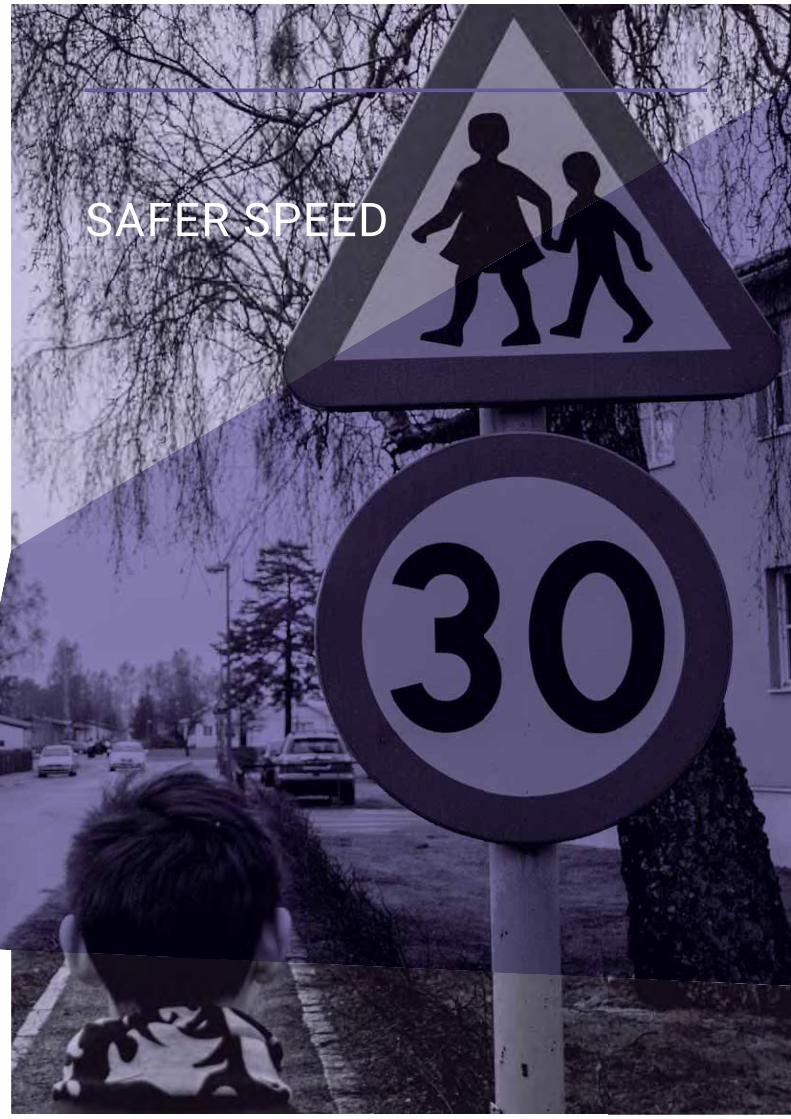
Reducing urban speed limits is essential to protecting and saving the lives of pedestrians and cyclists.
The likelihood of a crash increases exponentially as speed increases, resulting in serious injury and death (20). For every 1% increase in mean speed, there is a 4% increase in fatal-crash risk and a 3% increase in serious-crash risk (21).
Despite the dangers of speed, its practice is ubiquitous. A study among Organisation for Economic Co-operation and Development countries showed that up to 80% of drivers admitted to driving above the posted speed limits, and a similar proportion of excessive speed has also been found in LMICs (22,23). The severity of injury is particularly critical for vulnerable road users, including pedestrians, cyclists and motorcyclists, as well as young and older adults. With travelling speed being directly associated with human survivability in the event of a crash, legal speed limits must be determined based on safe-systems principles. A growing number of countries have formal guidelines on the process by which speed limits are established based on the type and function of road infrastructure. For countries belonging to the EU, Intelligent Speed Assistance, a technology that supports drivers in keeping to posted speed limits, will become mandatory on all new vehicles from 2022 (24).
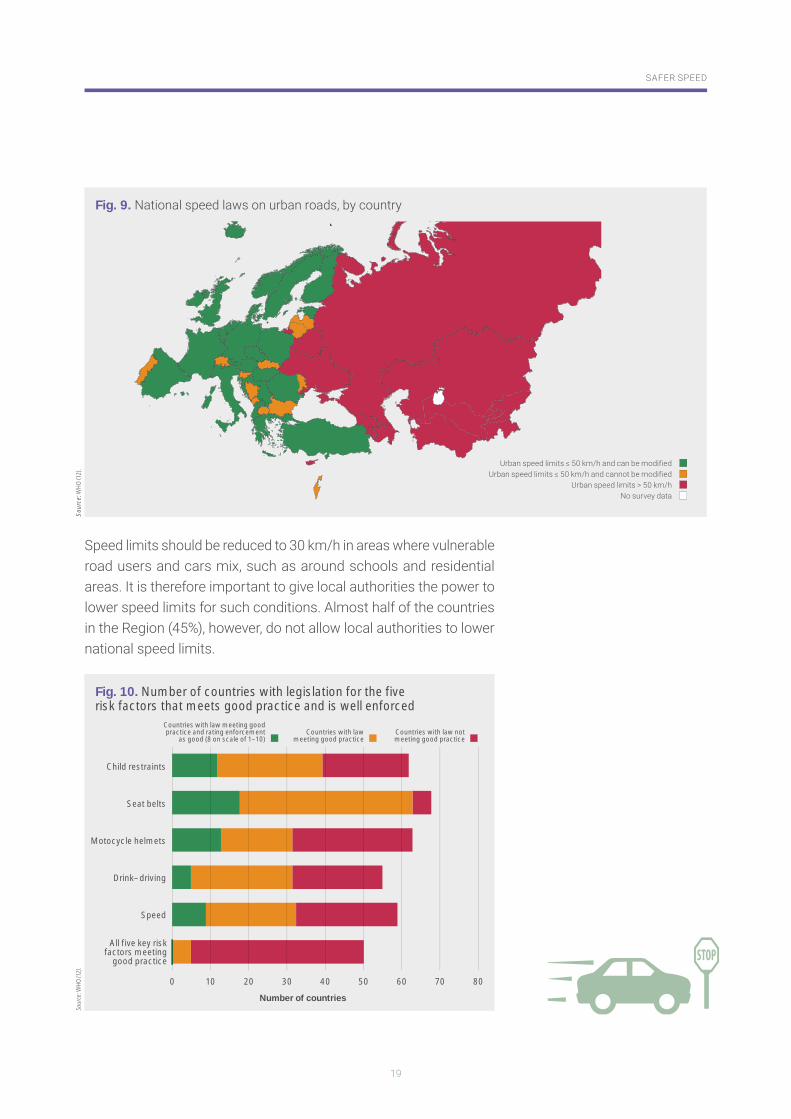
Speed limits in urban areas, where motorized traffi c meets pedestrians, cyclists and motorcycle riders, need to take account of the safety of all road users (12,25,26). Forty-seven per cent of countries (24 of 51) have comprehensive speed regulations that consist of a national urban speed limit of 50 km/h or less, with local authorities having permission to lower the limits. This covers 63% of the population of the European Region, as shown in Fig. 9. Enforcement, however, needs to be improved (Fig. 10). While 38 countries out of 51 (74%) have urban speed limits of 50 km/h or less, 13 countries still have an urban speed limit exceeding 50 km/h.
19
SAFER SPEED
Speed limits should be reduced to 30 km/h in areas where vulnerable road users and cars mix, such as around schools and residential areas. It is therefore important to give local authorities the power to lower speed limits for such conditions. Almost half of the countries in the Region (45%), however, do not allow local authorities to lower national speed limits.
Sour
ce: W
HO
(12)
.
Fig. 9.
Sour
ce: W
HO
(12)
.
10 20 30 40 50 60 70 800
All five key riskfactors meeting
good practice
Drink–driving
Motocycle helmets
Seat belts
Child restraints
Speed
Number of countries
Countries with law meeting goodpractice and rating enforcement
as good (8 on scale of 1–10)Countries with law
meeting good practiceCountries with law notmeeting good practice
Fig. 10. Number of countries with legislation for the fiverisk factors that meets good practice and is well enforced
20
EUROPEAN REGIONAL STATUS REPORT ON ROAD SAFETY 2019
Enforcement of existing speed limits needs to be improved.People who violate speed regulations face fi nes, licence withdrawal or demerit points in all the responding countries. Only 15 countries report that enforcement of their respective speed laws is effective (8 on a scale of 1–10); eight are HICs and seven LMICs. Social marketing campaigns can help to support enforcement and ensure respect for, and compliance with, speed limits (27). A combination of manual and automated enforcement methods can increase the probability of detecting violations (27). Almost all the participating countries (n = 50) reported conducting speed-enforcement activities, with many (n = 45) having a combination of manual and automated enforcement. While manual enforcement remains the dominant method of enforcement (49 countries), 46 countries indicated that they employ automated speed enforcement. Automatic enforcement (such as fi xed-camera and mobile in-vehicle fi tted devices) systems are highly cost–effective and can be adapted effectively to low-resource settings (28).
80%of drivers admittedto driving above the posted speed limits

SAFERROAD USERS
22
EUROPEAN REGIONAL STATUS REPORT ON ROAD SAFETY 2019
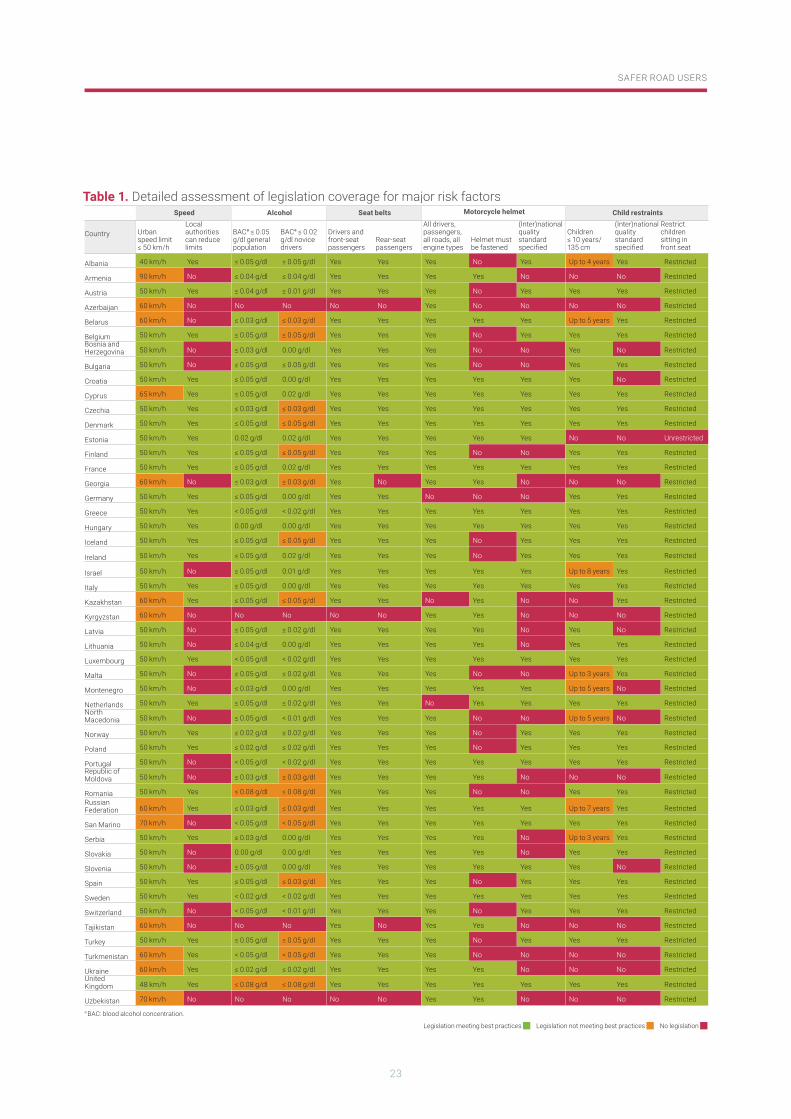
LEGISLATION ON KEY BEHAVIOURAL RISK FACTORSEnacting and enforcing comprehensive laws is an important way of improving road-user behaviour and is a critical component of safe systems to enhance safety on roads. There is a strong evidence base showing that laws addressing the key risk factors of speeding, drink–driving, and non-use of motorcycle helmets, seat belts and child restraints can reduce road-traffi c deaths and injuries (12,17,26,29). To be effective, such laws need to be in line with best practice, stringently enforced and, together with standards and compliance regimes for the licensing and disqualifi cation of drivers and riders, align with media campaigns (30). Detailed assessment of legislation coverage for major risk factors is provided in Table 1.
In addition to strategies with specifi c measurable targets, governments and parliaments have important roles in protecting road users by enacting and enforcing legislation on road safety. Forty countries with lead agencies on road safety report having periodic reviews of legislation, rules and standards against best practice and provide recommendations for improvement. The lead agencies in 39 countries have the ability to develop and/or revise legislation. Working defi nitions
23
SAFER ROAD USERS
Speed Alcohol Seat belts Motorcycle helmet Child restraints
Country Urban speed limit ≤ 50 km/h
Local authorities can reduce limits
BACa ≤ 0.05 g/dl general population
BACa ≤ 0.02 g/dl novice drivers
Drivers and front-seat passengers
Rear-seat passengers
All drivers, passengers, all roads, all engine types
Helmet must be fastened
(Inter)national quality standard specifi ed
Children ≤ 10 years/ 135 cm
(Inter)national quality standard specifi ed
Restrict children sitting in front seat
Albania 40 km/h Yes ≤ 0.05 g/dl ≤ 0.05 g/dl Yes Yes Yes No Yes Up to 4 years Yes Restricted
Armenia 90 km/h No ≤ 0.04 g/dl ≤ 0.04 g/dl Yes Yes Yes Yes No No No Restricted
Austria 50 km/h Yes ≤ 0.04 g/dl ≤ 0.01 g/dl Yes Yes Yes No Yes Yes Yes Restricted
Azerbaijan 60 km/h No No No No No Yes No No No No Restricted
Belarus 60 km/h No ≤ 0.03 g/dl ≤ 0.03 g/dl Yes Yes Yes Yes Yes Up to 5 years Yes Restricted
Belgium 50 km/h Yes ≤ 0.05 g/dl ≤ 0.05 g/dl Yes Yes Yes No Yes Yes Yes RestrictedBosnia and Herzegovina 50 km/h No ≤ 0.03 g/dl 0.00 g/dl Yes Yes Yes No No Yes No Restricted
Bulgaria 50 km/h No ≤ 0.05 g/dl ≤ 0.05 g/dl Yes Yes Yes No No Yes Yes Restricted
Croatia 50 km/h Yes ≤ 0.05 g/dl 0.00 g/dl Yes Yes Yes Yes Yes Yes No Restricted
Cyprus 65 km/h Yes ≤ 0.05 g/dl 0.02 g/dl Yes Yes Yes Yes Yes Yes Yes Restricted
Czechia 50 km/h Yes ≤ 0.03 g/dl ≤ 0.03 g/dl Yes Yes Yes Yes Yes Yes Yes Restricted
Denmark 50 km/h Yes ≤ 0.05 g/dl ≤ 0.05 g/dl Yes Yes Yes Yes Yes Yes Yes Restricted
Estonia 50 km/h Yes 0.02 g/dl 0.02 g/dl Yes Yes Yes Yes Yes No No Unrestricted
Finland 50 km/h Yes ≤ 0.05 g/dl ≤ 0.05 g/dl Yes Yes Yes No No Yes Yes Restricted
France 50 km/h Yes ≤ 0.05 g/dl 0.02 g/dl Yes Yes Yes Yes Yes Yes Yes Restricted
Georgia 60 km/h No ≤ 0.03 g/dl ≤ 0.03 g/dl Yes No Yes Yes No No No Restricted
Germany 50 km/h Yes ≤ 0.05 g/dl 0.00 g/dl Yes Yes No No No Yes Yes Restricted
Greece 50 km/h Yes < 0.05 g/dl < 0.02 g/dl Yes Yes Yes Yes Yes Yes Yes Restricted
Hungary 50 km/h Yes 0.00 g/dl 0.00 g/dl Yes Yes Yes Yes Yes Yes Yes Restricted
Iceland 50 km/h Yes ≤ 0.05 g/dl ≤ 0.05 g/dl Yes Yes Yes No Yes Yes Yes Restricted
Ireland 50 km/h Yes ≤ 0.05 g/dl 0.02 g/dl Yes Yes Yes No Yes Yes Yes Restricted
Israel 50 km/h No ≤ 0.05 g/dl 0.01 g/dl Yes Yes Yes Yes Yes Up to 8 years Yes Restricted
Italy 50 km/h Yes ≤ 0.05 g/dl 0.00 g/dl Yes Yes Yes Yes Yes Yes Yes Restricted
Kazakhstan 60 km/h Yes ≤ 0.05 g/dl ≤ 0.05 g/dl Yes Yes No Yes No No Yes Restricted
Kyrgyzstan 60 km/h No No No No No Yes Yes No No No Restricted
Latvia 50 km/h No ≤ 0.05 g/dl ≤ 0.02 g/dl Yes Yes Yes Yes No Yes No Restricted
Lithuania 50 km/h No ≤ 0.04 g/dl 0.00 g/dl Yes Yes Yes Yes No Yes Yes Restricted
Luxembourg 50 km/h Yes < 0.05 g/dl < 0.02 g/dl Yes Yes Yes Yes Yes Yes Yes Restricted
Malta 50 km/h No ≤ 0.05 g/dl ≤ 0.02 g/dl Yes Yes Yes No No Up to 3 years Yes Restricted
Montenegro 50 km/h No ≤ 0.03 g/dl 0.00 g/dl Yes Yes Yes Yes Yes Up to 5 years No Restricted
Netherlands 50 km/h Yes ≤ 0.05 g/dl ≤ 0.02 g/dl Yes Yes No Yes Yes Yes Yes RestrictedNorth Macedonia 50 km/h No ≤ 0.05 g/dl < 0.01 g/dl Yes Yes Yes No No Up to 5 years No Restricted
Norway 50 km/h Yes ≤ 0.02 g/dl ≤ 0.02 g/dl Yes Yes Yes No Yes Yes Yes Restricted
Poland 50 km/h Yes ≤ 0.02 g/dl ≤ 0.02 g/dl Yes Yes Yes No Yes Yes Yes Restricted
Portugal 50 km/h No < 0.05 g/dl < 0.02 g/dl Yes Yes Yes Yes Yes Yes Yes RestrictedRepublic of Moldova 50 km/h No ≤ 0.03 g/dl ≤ 0.03 g/dl Yes Yes Yes Yes No No No Restricted
Romania 50 km/h Yes ≤ 0.08 g/dl ≤ 0.08 g/dl Yes Yes Yes No No Yes Yes Restricted Russian Federation 60 km/h Yes ≤ 0.03 g/dl ≤ 0.03 g/dl Yes Yes Yes Yes Yes Up to 7 years Yes Restricted
San Marino 70 km/h No < 0.05 g/dl < 0.05 g/dl Yes Yes Yes Yes Yes Yes Yes Restricted
Serbia 50 km/h Yes ≤ 0.03 g/dl 0.00 g/dl Yes Yes Yes Yes No Up to 3 years Yes Restricted
Slovakia 50 km/h No 0.00 g/dl 0.00 g/dl Yes Yes Yes Yes No Yes Yes Restricted
Slovenia 50 km/h No ≤ 0.05 g/dl 0.00 g/dl Yes Yes Yes Yes Yes Yes No Restricted
Spain 50 km/h Yes ≤ 0.05 g/dl ≤ 0.03 g/dl Yes Yes Yes No Yes Yes Yes Restricted
Sweden 50 km/h Yes < 0.02 g/dl < 0.02 g/dl Yes Yes Yes Yes Yes Yes Yes Restricted
Switzerland 50 km/h No < 0.05 g/dl < 0.01 g/dl Yes Yes Yes No Yes Yes Yes Restricted
Tajikistan 60 km/h No No No Yes No Yes Yes No No No Restricted
Turkey 50 km/h Yes ≤ 0.05 g/dl ≤ 0.05 g/dl Yes Yes Yes No Yes Yes Yes Restricted
Turkmenistan 60 km/h Yes < 0.05 g/dl < 0.05 g/dl Yes Yes Yes No No No No Restricted
Ukraine 60 km/h Yes ≤ 0.02 g/dl ≤ 0.02 g/dl Yes Yes Yes Yes No No No RestrictedUnited Kingdom 48 km/h Yes ≤ 0.08 g/dl ≤ 0.08 g/dl Yes Yes Yes Yes Yes Yes Yes Restricted
Uzbekistan 70 km/h No No No No No Yes Yes No No No Restricted a BAC: blood alcohol concentration.
Table 1. Detailed assessment of legislation coverage for major risk factors
Legislation meeting best practices Legislation not meeting best practices No legislation
24
EUROPEAN REGIONAL STATUS REPORT ON ROAD SAFETY 2019
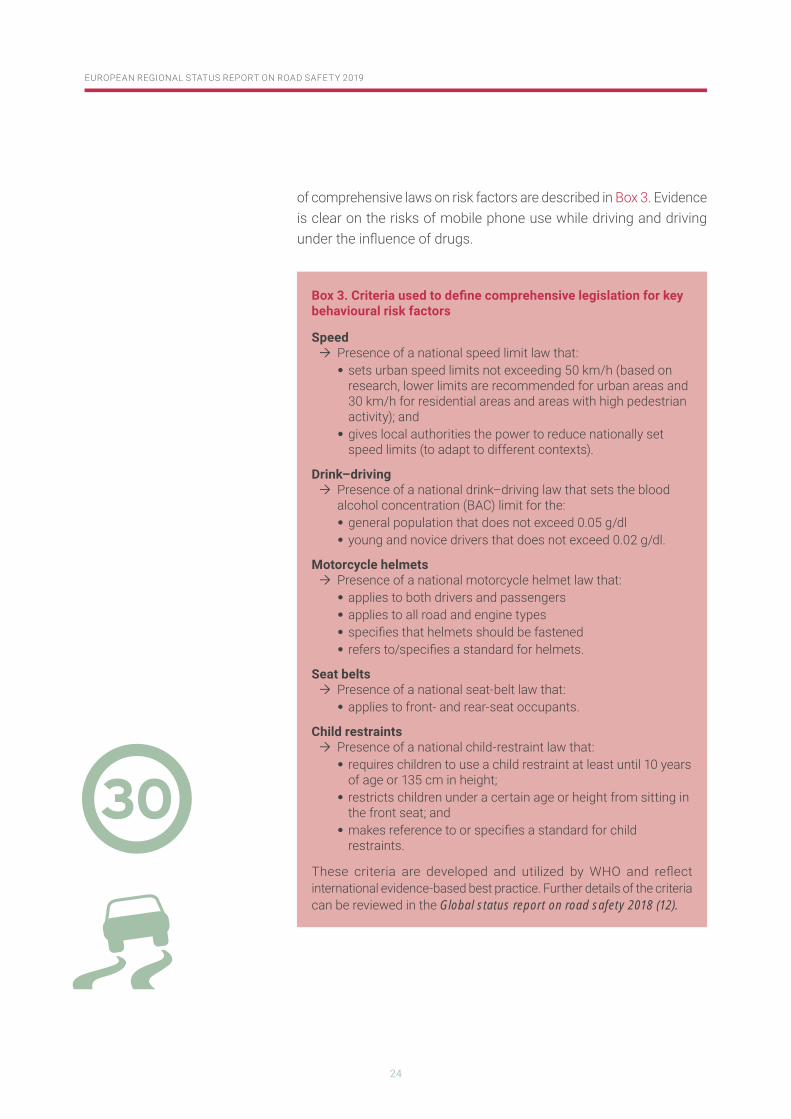
of comprehensive laws on risk factors are described in Box 3. Evidence is clear on the risks of mobile phone use while driving and driving under the infl uence of drugs.
Box 3. Criteria used to defi ne comprehensive legislation for key behavioural risk factors
Speed Presence of a national speed limit law that:
• sets urban speed limits not exceeding 50 km/h (based on research, lower limits are recommended for urban areas and 30 km/h for residential areas and areas with high pedestrian activity); and
• gives local authorities the power to reduce nationally set speed limits (to adapt to different contexts).
Drink–driving Presence of a national drink–driving law that sets the blood
alcohol concentration (BAC) limit for the:• general population that does not exceed 0.05 g/dl • young and novice drivers that does not exceed 0.02 g/dl.
Motorcycle helmets Presence of a national motorcycle helmet law that:
• applies to both drivers and passengers• applies to all road and engine types• specifi es that helmets should be fastened• refers to/specifi es a standard for helmets.
Seat belts Presence of a national seat-belt law that:
• applies to front- and rear-seat occupants.
Child restraints Presence of a national child-restraint law that:
• requires children to use a child restraint at least until 10 years of age or 135 cm in height;
• restricts children under a certain age or height from sitting in the front seat; and
• makes reference to or specifi es a standard for child restraints.
These criteria are developed and utilized by WHO and refl ect international evidence-based best practice. Further details of the criteria can be reviewed in the Global status report on road safety 2018 (12).
25
SAFER ROAD USERS
Only fi ve countries in the Region have road-safety legislation that meets good practice. Enforcement of laws is essential to changing risk behaviours and needs to be improved.Currently, 46 countries, representing over 850 million people, have laws that meet best practice for at least one of the fi ve key behavioural risk factors. Across the Region, however, only fi ve countries (France, Hungary, Italy, Luxembourg and Sweden) have good-practice legislation covering all fi ve main risk factors: speed, drink–driving, motorcycle helmet use, seat-belt use and child restraints. This is a slight improvement from four countries in baseline in 2010 (3,4).
Globally, the Region has the highest number of countries with good-practice legislation covering many risk factors, yet with only 10% of countries currently having comprehensive road-safety legislation, the Region falls short of the objective of the Decade of Action for Road Safety, which aims for 50% of countries having comprehensive legislation for all fi ve risk factors by 2020.
Despite the increasing enactment of laws relevant to road safety in the Region, reported enforcement is suboptimal. Enforcement of existing laws varies widely in the Region. Fig. 10 shows the number of countries with legislation for the fi ve risk factors that meets good practice and is well enforced (that is, has a score of 8 or more on a scale of 1–10).
The ongoing Decade of Action for Road Safety and the voluntary targets provide important opportunities to prioritize the revision and enforcement of critical road-safety legislation. Laws enforced by traffi c police should result in the administration of penalties commensurate with the severity of the offence. These range from driving license demerit or penalty points, to administrative fi nes, licence withdrawal, vehicle impoundment and even imprisonment. Risk behaviour is best modifi ed if enforcement is coordinated with social marketing campaigns (17). Of the 45 countries with lead agencies to coordinate all road-safety activities, 32 also coordinate national mass media campaigns.
Only fi ve countries
have good-practice legislation covering
all fi ve main risk factors
26
EUROPEAN REGIONAL STATUS REPORT ON ROAD SAFETY 2019
DRINK–DRIVING
Although all countries in the European Region have national laws to regulate drink–driving, only 28 are in line with best practice.Alcohol is a major risk factor for road-traffi c crashes. The risk for crashes starts to increase exponentially at a BAC of 0.04 g/dl (8). WHO recommends setting and enforcing national legislation with a drink–driving law based on a maximum BAC of 0.05 g/dl for the general population and 0.02 g/dl or less for novice and probationary drivers. Since the last legislative review for the third global status report on road safety, nine countries have changed their drink–driving laws to be in line with criteria for best practice, but seven have regressed from best practice (13,14). Nineteen countries do not have a lower limit for novice drivers, and four do not base their law on objective measures (such as BAC).
To be effective, enforcement of drink–driving laws needs to be supported by BAC testing, strict penalties and social marketing campaigns. Only 13 countries reported a high level of enforcement for drink–driving. More countries in LMICs (n = 8) rated effective enforcement than HICs (n = 5). Enforcement that incorporates random breath-testing strategies is more effective than targeting during certain times and in certain areas to increase the probability of being caught and to deter drinking and driving (31). Sixty-fi ve per cent (n = 33) of countries in the WHO European Region use all-year-round random breath testing to enforce the laws, and 20% (n = 10) use breath testing in specifi c locations (such as pubs) or at specifi c times.
National estimates of the proportion of road-traffi c deaths that are attributable to alcohol use are collected in 44 countries and range from less than 1% to 39%. The alcohol-attributable fraction (AAF) denotes the proportion of road-traffi c deaths caused by alcohol. Data collected for the 2018 global status report on alcohol and health found that the prevalence of AAF on road-traffi c deaths for the Region is 37.7% (32). Only 31 countries give police the authority to test BAC in drivers involved in fatal-injury crashes, though this may
27
SAFER ROAD USERS
not be practised routinely. Better and more complete data on BAC testing are needed in countries to estimate the potential of preventing drink–driving and reducing alcohol-related harm.
USE OF MOTORCYCLE HELMETS
Progress has been made in protecting motorcyclists, but many countries still have laws that do not meet best practice.For every vehicle mile travelled in 2016, motorcyclists were nearly 28 times more likely to be killed in a crash than people in passenger cars (33). Standard-quality motorcycle helmets, when of good design and worn correctly, have been shown to reduce the risk of serious head injuries by 69% and risk of death by 40% (34). The proportion of motorcycle deaths of all traffi c deaths in the WHO European Region decreased slightly from 11.6% to 11.1% between 2010 and 2016. All countries in the Region have laws in place that make helmet use compulsory for motorized two-wheelers, but only 19 have laws that
28
EUROPEAN REGIONAL STATUS REPORT ON ROAD SAFETY 2019
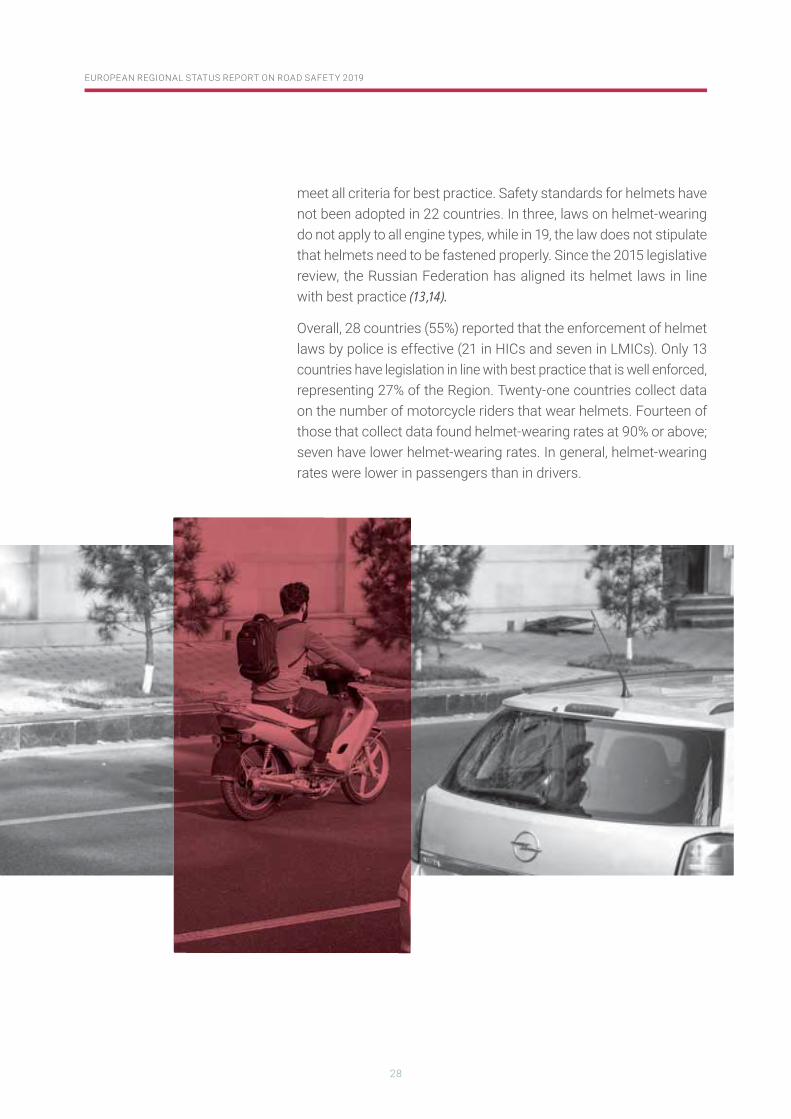
meet all criteria for best practice. Safety standards for helmets have not been adopted in 22 countries. In three, laws on helmet-wearing do not apply to all engine types, while in 19, the law does not stipulate that helmets need to be fastened properly. Since the 2015 legislative review, the Russian Federation has aligned its helmet laws in line with best practice (13,14).
Overall, 28 countries (55%) reported that the enforcement of helmet laws by police is effective (21 in HICs and seven in LMICs). Only 13 countries have legislation in line with best practice that is well enforced, representing 27% of the Region. Twenty-one countries collect data on the number of motorcycle riders that wear helmets. Fourteen of those that collect data found helmet-wearing rates at 90% or above; seven have lower helmet-wearing rates. In general, helmet-wearing rates were lower in passengers than in drivers.
29
SAFER ROAD USERS
USE OF SEAT BELTS
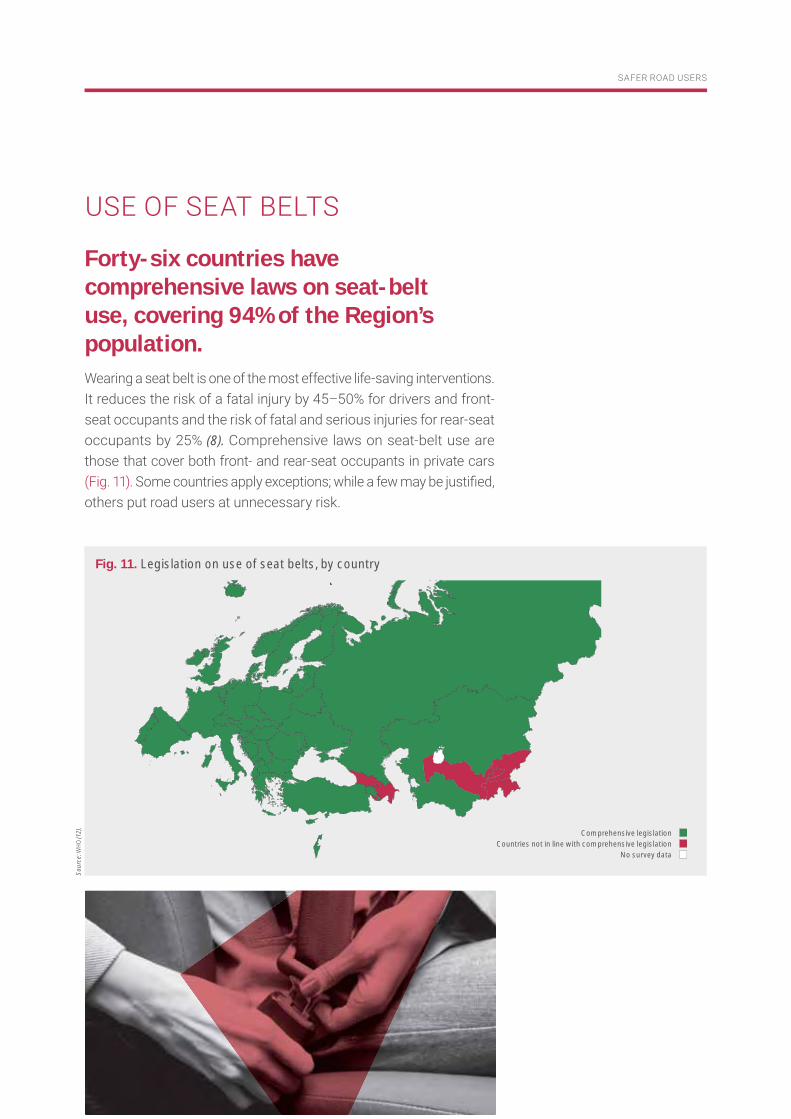
Forty-six countries have comprehensive laws on seat-belt use, covering 94% of the Region’s population.Wearing a seat belt is one of the most effective life-saving interventions. It reduces the risk of a fatal injury by 45–50% for drivers and front-seat occupants and the risk of fatal and serious injuries for rear-seat occupants by 25% (8). Comprehensive laws on seat-belt use are those that cover both front- and rear-seat occupants in private cars (Fig. 11). Some countries apply exceptions; while a few may be justifi ed, others put road users at unnecessary risk.
Sour
ce: W
HO
(12)
.
Comprehensive legislationCountries not in line with comprehensive legislation
No survey data
Fig. 11. Legislation on use of seat belts, by country
30
EUROPEAN REGIONAL STATUS REPORT ON ROAD SAFETY 2019
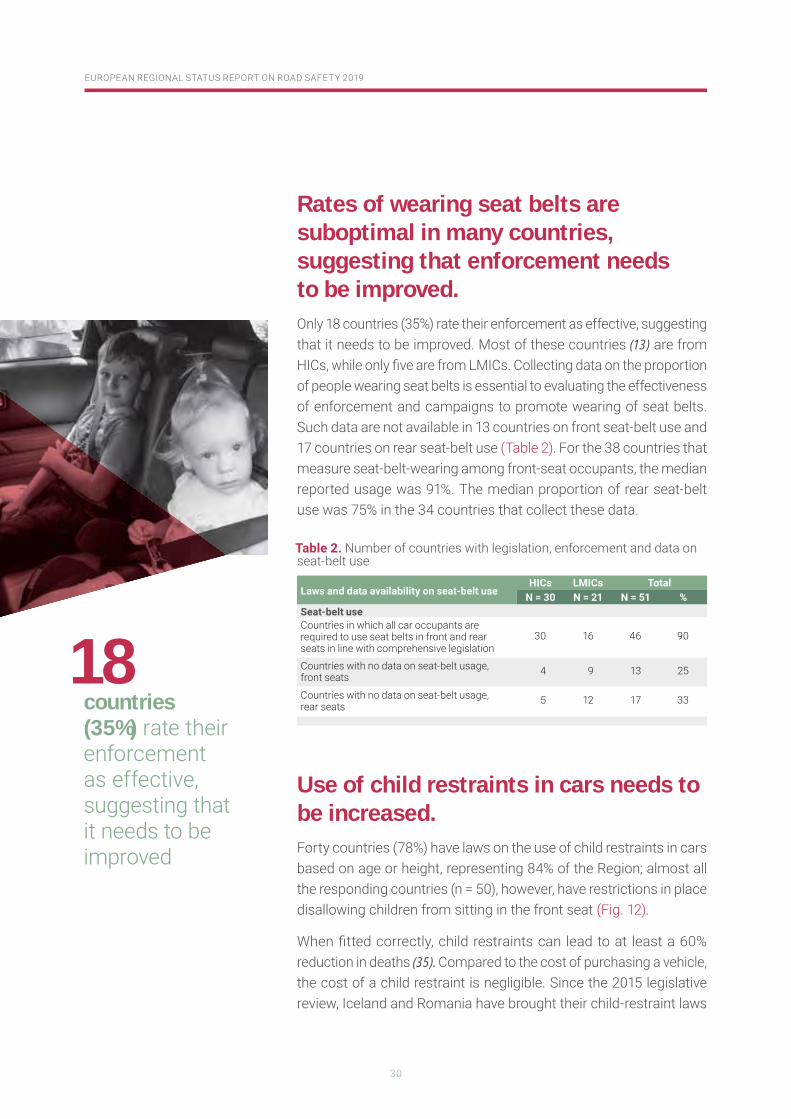
Rates of wearing seat belts are suboptimal in many countries, suggesting that enforcement needs to be improved.Only 18 countries (35%) rate their enforcement as effective, suggesting that it needs to be improved. Most of these countries (13) are from HICs, while only fi ve are from LMICs. Collecting data on the proportion of people wearing seat belts is essential to evaluating the effectiveness of enforcement and campaigns to promote wearing of seat belts. Such data are not available in 13 countries on front seat-belt use and 17 countries on rear seat-belt use (Table 2). For the 38 countries that measure seat-belt-wearing among front-seat occupants, the median reported usage was 91%. The median proportion of rear seat-belt use was 75% in the 34 countries that collect these data.
Use of child restraints in cars needs to be increased.Forty countries (78%) have laws on the use of child restraints in cars based on age or height, representing 84% of the Region; almost all the responding countries (n = 50), however, have restrictions in place disallowing children from sitting in the front seat (Fig. 12).
When fi tted correctly, child restraints can lead to at least a 60% reduction in deaths (35). Compared to the cost of purchasing a vehicle, the cost of a child restraint is negligible. Since the 2015 legislative review, Iceland and Romania have brought their child-restraint laws
Laws and data availability on seat-belt useHICs LMICs Total
N = 30 N = 21 N = 51 %Seat-belt useCountries in which all car occupants are required to use seat belts in front and rear seats in line with comprehensive legislation
30 16 46 90
Countries with no data on seat-belt usage, front seats 4 9 13 25
Countries with no data on seat-belt usage, rear seats 5 12 17 33
Table 2. Number of countries with legislation, enforcement and data on seat-belt use
18 countries (35%) rate their enforcement as effective, suggesting that it needs to be improved
31
SAFER ROAD USERS
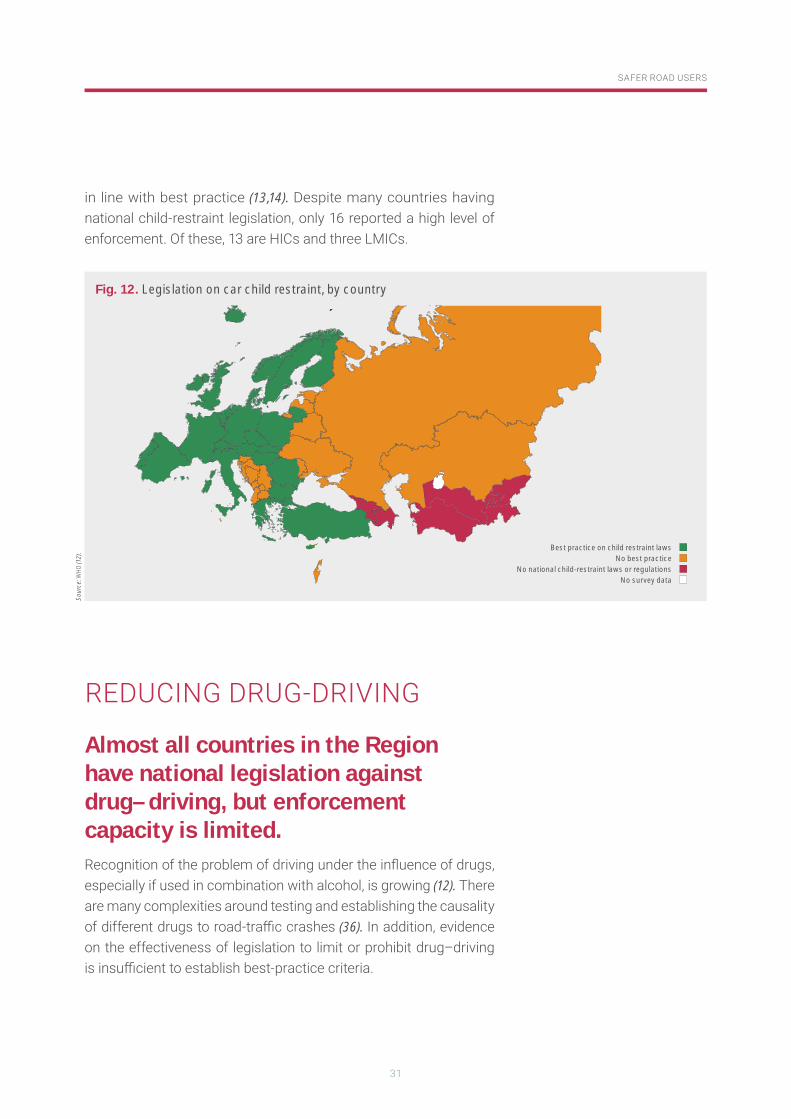
in line with best practice (13,14). Despite many countries having national child-restraint legislation, only 16 reported a high level of enforcement. Of these, 13 are HICs and three LMICs.
REDUCING DRUG-DRIVING
Almost all countries in the Region have national legislation against drug–driving, but enforcement capacity is limited.Recognition of the problem of driving under the infl uence of drugs, especially if used in combination with alcohol, is growing (12). There are many complexities around testing and establishing the causality of different drugs to road-traffi c crashes (36). In addition, evidence on the effectiveness of legislation to limit or prohibit drug–driving is insuffi cient to establish best-practice criteria.
Sour
ce: W
HO
(12)
. Best practice on child restraint lawsNo best practice
No national child-restraint laws or regulationsNo survey data
Fig. 12. Legislation on car child restraint, by country
32
EUROPEAN REGIONAL STATUS REPORT ON ROAD SAFETY 2019
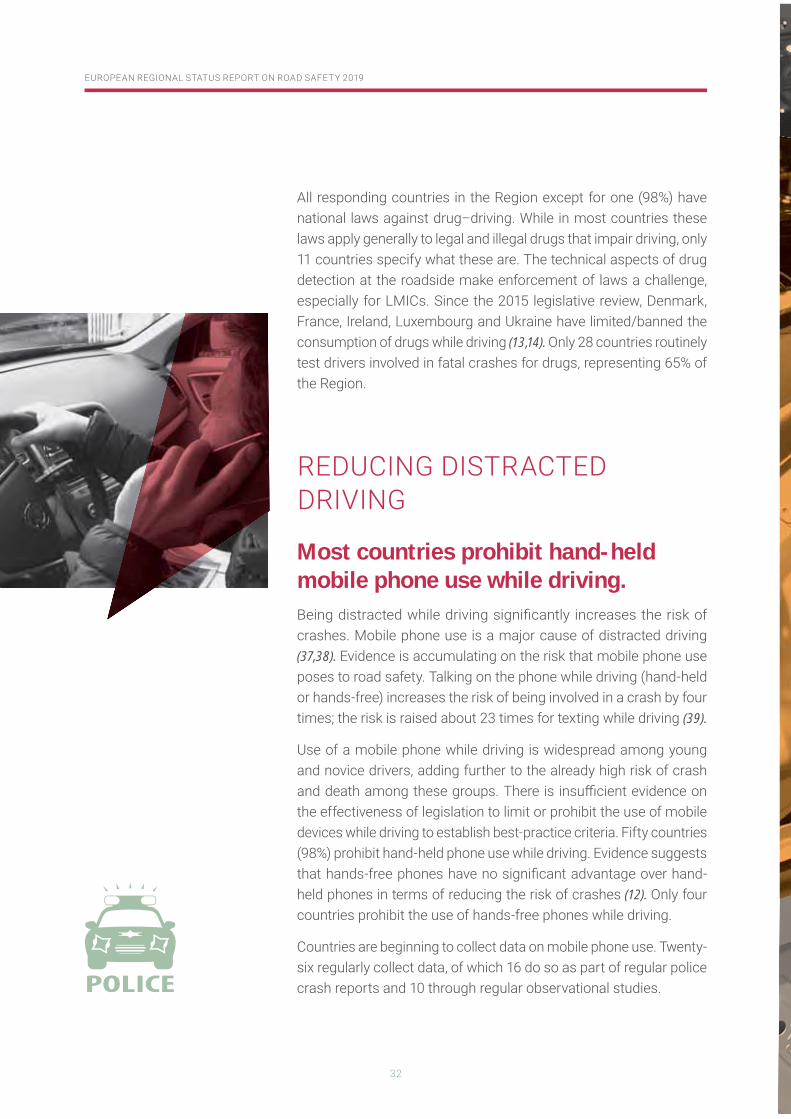
All responding countries in the Region except for one (98%) have national laws against drug–driving. While in most countries these laws apply generally to legal and illegal drugs that impair driving, only 11 countries specify what these are. The technical aspects of drug detection at the roadside make enforcement of laws a challenge, especially for LMICs. Since the 2015 legislative review, Denmark, France, Ireland, Luxembourg and Ukraine have limited/banned the consumption of drugs while driving (13,14). Only 28 countries routinely test drivers involved in fatal crashes for drugs, representing 65% of the Region.
REDUCING DISTRACTED DRIVING
Most countries prohibit hand-held mobile phone use while driving.Being distracted while driving signifi cantly increases the risk of crashes. Mobile phone use is a major cause of distracted driving (37,38). Evidence is accumulating on the risk that mobile phone use poses to road safety. Talking on the phone while driving (hand-held or hands-free) increases the risk of being involved in a crash by four times; the risk is raised about 23 times for texting while driving (39).
Use of a mobile phone while driving is widespread among young and novice drivers, adding further to the already high risk of crash and death among these groups. There is insuffi cient evidence on the effectiveness of legislation to limit or prohibit the use of mobile devices while driving to establish best-practice criteria. Fifty countries (98%) prohibit hand-held phone use while driving. Evidence suggests that hands-free phones have no signifi cant advantage over hand-held phones in terms of reducing the risk of crashes (12). Only four countries prohibit the use of hands-free phones while driving.
Countries are beginning to collect data on mobile phone use. Twenty-six regularly collect data, of which 16 do so as part of regular police crash reports and 10 through regular observational studies.
SAFERVEHICLES
34
EUROPEAN REGIONAL STATUS REPORT ON ROAD SAFETY 2019
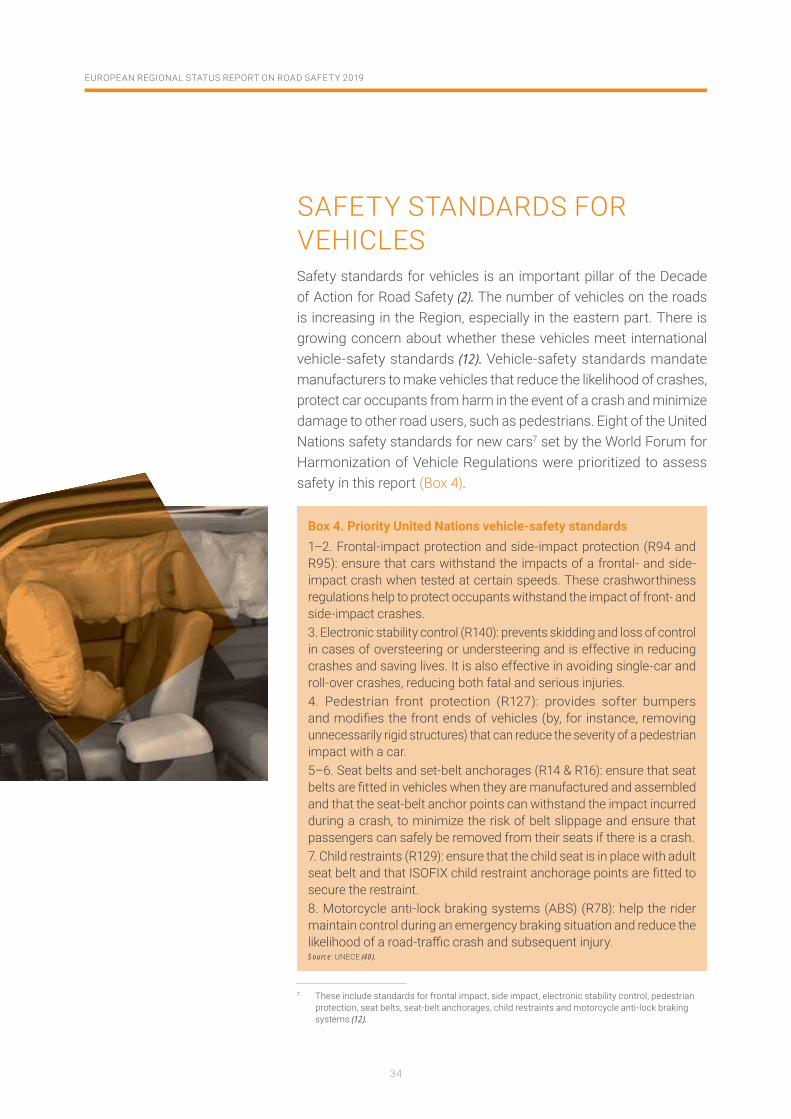
SAFETY STANDARDS FOR VEHICLESSafety standards for vehicles is an important pillar of the Decade of Action for Road Safety (2). The number of vehicles on the roads is increasing in the Region, especially in the eastern part. There is growing concern about whether these vehicles meet international vehicle-safety standards (12). Vehicle-safety standards mandate manufacturers to make vehicles that reduce the likelihood of crashes, protect car occupants from harm in the event of a crash and minimize damage to other road users, such as pedestrians. Eight of the United Nations safety standards for new cars7 set by the World Forum for Harmonization of Vehicle Regulations were prioritized to assess safety in this report (Box 4).
7 These include standards for frontal impact, side impact, electronic stability control, pedestrian protection, seat belts, seat-belt anchorages, child restraints and motorcycle anti-lock braking systems (12).
Box 4. Priority United Nations vehicle-safety standards 1–2. Frontal-impact protection and side-impact protection (R94 and R95): ensure that cars withstand the impacts of a frontal- and side-impact crash when tested at certain speeds. These crashworthiness regulations help to protect occupants withstand the impact of front- and side-impact crashes.3. Electronic stability control (R140): prevents skidding and loss of control in cases of oversteering or understeering and is effective in reducing crashes and saving lives. It is also effective in avoiding single-car and roll-over crashes, reducing both fatal and serious injuries. 4. Pedestrian front protection (R127): provides softer bumpers and modifi es the front ends of vehicles (by, for instance, removing unnecessarily rigid structures) that can reduce the severity of a pedestrian impact with a car. 5–6. Seat belts and set-belt anchorages (R14 & R16): ensure that seat belts are fi tted in vehicles when they are manufactured and assembled and that the seat-belt anchor points can withstand the impact incurred during a crash, to minimize the risk of belt slippage and ensure that passengers can safely be removed from their seats if there is a crash. 7. Child restraints (R129): ensure that the child seat is in place with adult seat belt and that ISOFIX child restraint anchorage points are fi tted to secure the restraint. 8. Motorcycle anti-lock braking systems (ABS) (R78): help the rider maintain control during an emergency braking situation and reduce the likelihood of a road-traffi c crash and subsequent injury.Source: UNECE (40).
35
SAFER VEHICLES
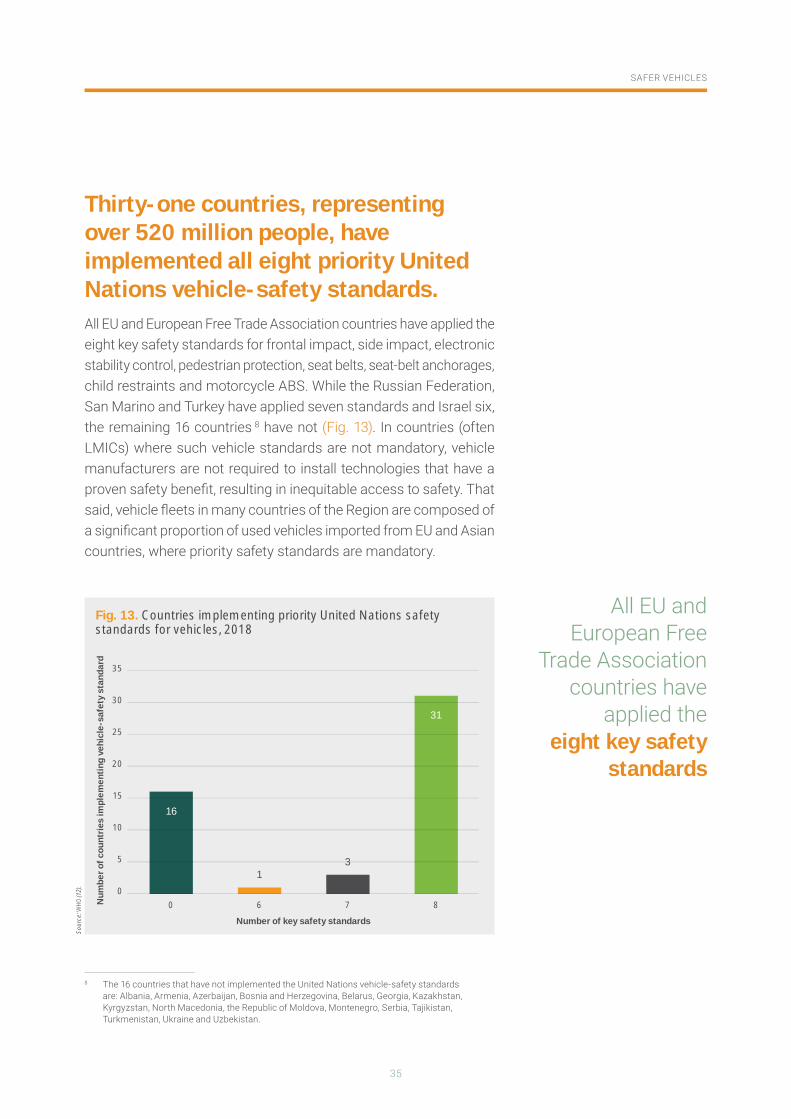
Thirty-one countries, representing over 520 million people, have implemented all eight priority United Nations vehicle-safety standards.All EU and European Free Trade Association countries have applied the eight key safety standards for frontal impact, side impact, electronic stability control, pedestrian protection, seat belts, seat-belt anchorages, child restraints and motorcycle ABS. While the Russian Federation, San Marino and Turkey have applied seven standards and Israel six, the remaining 16 countries 8 have not (Fig. 13). In countries (often LMICs) where such vehicle standards are not mandatory, vehicle manufacturers are not required to install technologies that have a proven safety benefi t, resulting in inequitable access to safety. That said, vehicle fl eets in many countries of the Region are composed of a signifi cant proportion of used vehicles imported from EU and Asian countries, where priority safety standards are mandatory.
8 The 16 countries that have not implemented the United Nations vehicle-safety standards are: Albania, Armenia, Azerbaijan, Bosnia and Herzegovina, Belarus, Georgia, Kazakhstan, Kyrgyzstan, North Macedonia, the Republic of Moldova, Montenegro, Serbia, Tajikistan, Turkmenistan, Ukraine and Uzbekistan.
Sour
ce: W
HO
(12)
.
60 7 80
5
10
15
20
25
35
30
16
31
31
Num
ber o
f cou
ntrie
s im
plem
entin
g ve
hicl
e-sa
fety
sta
ndar
d
Number of key safety standards
Fig. 13. Countries implementing priority United Nations safetystandards for vehicles, 2018
All EU and European Free
Trade Association countries have
applied the eight key safety
standards
36
EUROPEAN REGIONAL STATUS REPORT ON ROAD SAFETY 2019
While vehicle standards have been developed for car occupants, many are not widely implemented in vehicles sold in LMICs. Since the last review in 2015 for the third global status report on road safety (13,14), 35 countries have applied standards for frontal impact, side impact, electronic stability control, seat belts, seat-belt anchorages and child restraints. Thirty-four have implemented pedestrian protection and 31 countries have implemented motorcycle ABS.
To further improve car safety, the United Nations General Assembly recommends that Member States implement a new car assessment programme. These crash-testing programmes develop standardized star ratings for consumer information on crashworthiness and crash avoidance, as well as promoting vehicle-safety technologies for the protection of car occupants and external road users (41,42).
SAFER ROADINFRASTRUCTURE
38
EUROPEAN REGIONAL STATUS REPORT ON ROAD SAFETY 2019
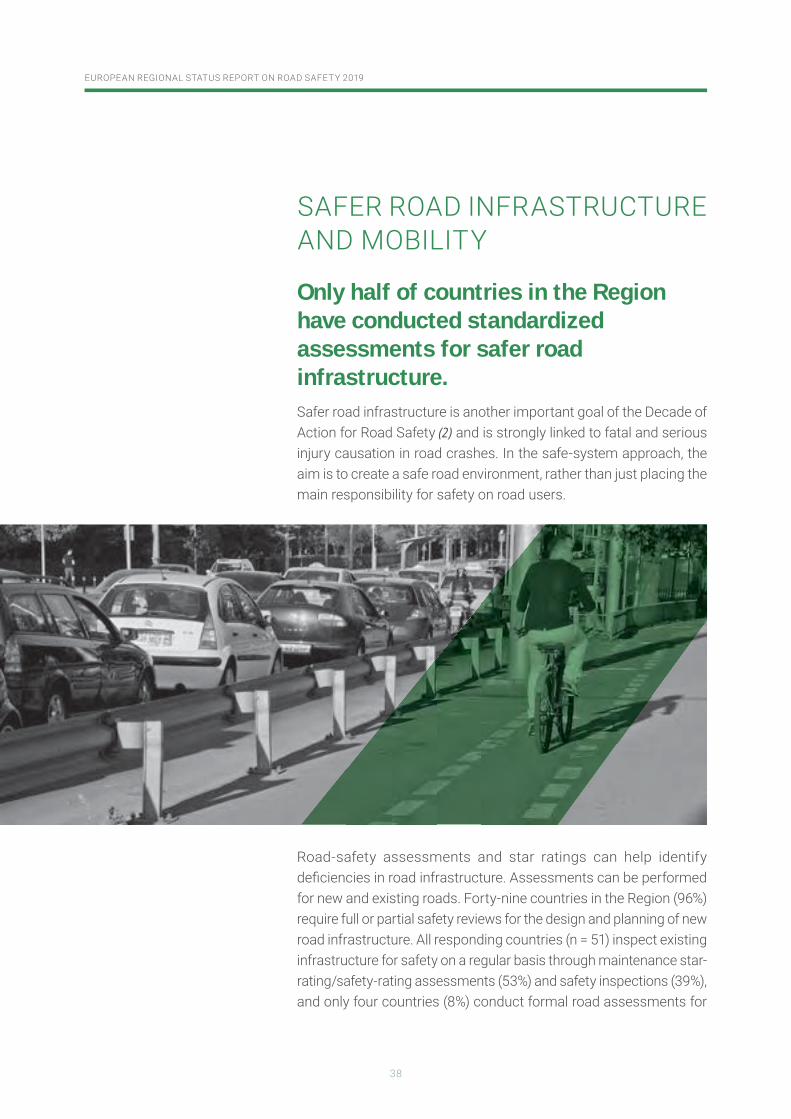
SAFER ROAD INFRASTRUCTURE AND MOBILITY
Only half of countries in the Region have conducted standardized assessments for safer road infrastructure.Safer road infrastructure is another important goal of the Decade of Action for Road Safety (2) and is strongly linked to fatal and serious injury causation in road crashes. In the safe-system approach, the aim is to create a safe road environment, rather than just placing the main responsibility for safety on road users.
Road-safety assessments and star ratings can help identify defi ciencies in road infrastructure. Assessments can be performed for new and existing roads. Forty-nine countries in the Region (96%) require full or partial safety reviews for the design and planning of new road infrastructure. All responding countries (n = 51) inspect existing infrastructure for safety on a regular basis through maintenance star-rating/safety-rating assessments (53%) and safety inspections (39%), and only four countries (8%) conduct formal road assessments for
39
SAFER ROAD INFRASTRUCTURE
safety. Forty-one countries (80%) also have systematic programmes to target investment and upgrade high-risk locations, such as performing black-spot or black-length programme analyses (33 countries) and safe-system investment (18 countries) to make roads safer. Of these countries, 16 have programmes for both black-spot analyses and safe-system investment.
Assessments can be carried out through national or international road-assessment programmes such as the iRAP (8); iRAP evaluates and assesses the level of protection against risk of death and serious injury in collisions on the roads using a star-rating system from one star (least safe roads) to fi ve stars (safest roads).
Inclusive and active transport is a win–win strategy by making roads safer for vulnerable road users and the population healthier.The health and development benefi ts of linkages between sustainable transport and road safety have been emphasized through theSDGs (5). Physically active forms of transport such as walking and cycling have health benefi ts, as they counteract the likelihood of developing obesity and noncommunicable diseases (43). Regular physical activity is also associated with reduced risk of heart disease and stroke and improved mental health and quality of life.
Dependence on motor-vehicle transport causes environmental damage due to air pollution, noise pollution and climate change. Motorized transport contributes to a range of gaseous air pollutants and suspended particulate matter. Exhaust emissions from motorized transport account for up to 30% of fi ne particles (44). These fi ne particles and other air pollutants contribute to health-damaging effects such as respiratory illness, cardiovascular disease, cancer and decreased mental well-being, and increase the dangers of extreme weather events (26,45).
Thirty per cent of all road-traffi c deaths in the Region occur among pedestrians and cyclists. Thirty-three countries in the Region have national policies that encourage walking and cycling, and a further seven have these at subnational level. Physically active transport
Forty-nine countries (96%)
in the Region require full or partial safety
reviews for the design and planning of
new road infrastructure
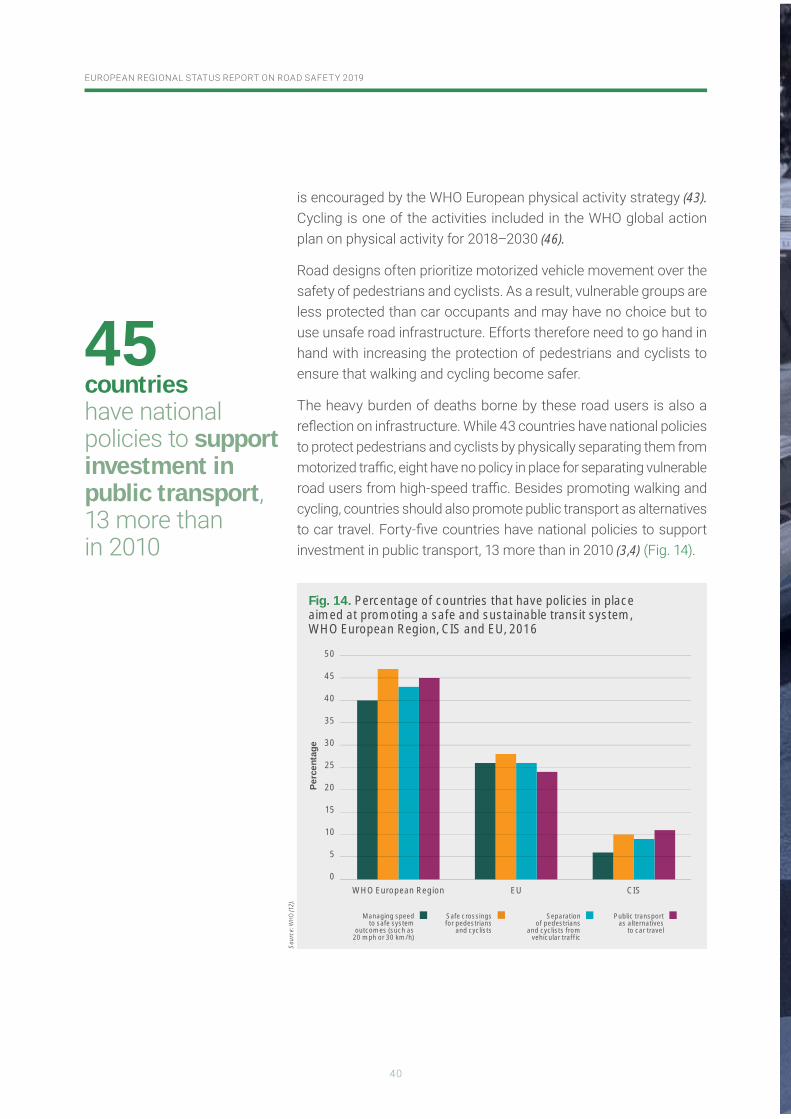
40
EUROPEAN REGIONAL STATUS REPORT ON ROAD SAFETY 2019
is encouraged by the WHO European physical activity strategy (43). Cycling is one of the activities included in the WHO global action plan on physical activity for 2018–2030 (46).
Road designs often prioritize motorized vehicle movement over the safety of pedestrians and cyclists. As a result, vulnerable groups are less protected than car occupants and may have no choice but to use unsafe road infrastructure. Efforts therefore need to go hand in hand with increasing the protection of pedestrians and cyclists to ensure that walking and cycling become safer.
The heavy burden of deaths borne by these road users is also a refl ection on infrastructure. While 43 countries have national policies to protect pedestrians and cyclists by physically separating them from motorized traffi c, eight have no policy in place for separating vulnerable road users from high-speed traffi c. Besides promoting walking and cycling, countries should also promote public transport as alternatives to car travel. Forty-fi ve countries have national policies to support investment in public transport, 13 more than in 2010 (3,4) (Fig. 14).
Sour
ce: W
HO
(12)
.
Managing speedto safe system
outcomes (such as20 mph or 30 km/h)
Safe crossingsfor pedestrians
and cyclists
Separationof pedestrians
and cyclists fromvehicular traffic
Public transportas alternatives
to car travel
EUWHO European Region CIS0
20
25
30
35
40
50
15
10
5
45
Perc
enta
ge
Fig. 14. Percentage of countries that have policies in place aimed at promoting a safe and sustainable transit system,WHO European Region, CIS and EU, 2016
45 countrieshave national policies to support investment in public transport, 13 more thanin 2010
CROSS-CUTTINGISSUES
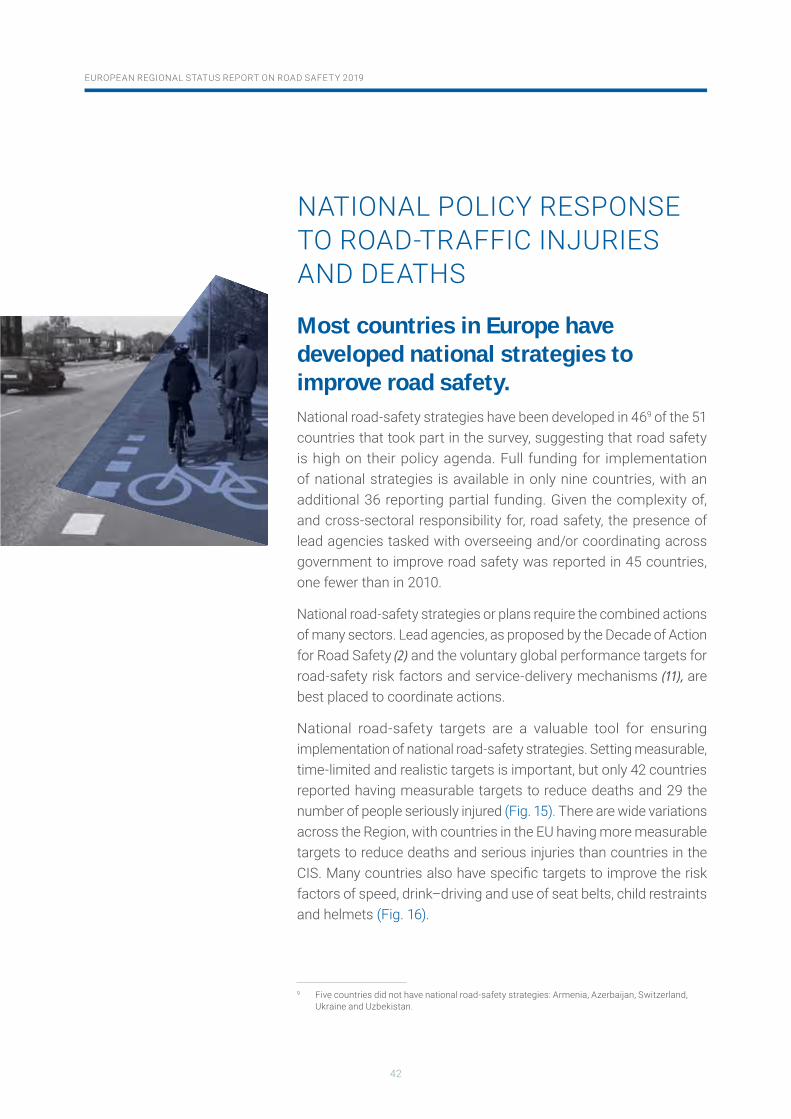
42
EUROPEAN REGIONAL STATUS REPORT ON ROAD SAFETY 2019
NATIONAL POLICY RESPONSE TO ROAD-TRAFFIC INJURIES AND DEATHS
Most countries in Europe have developed national strategies to improve road safety.National road-safety strategies have been developed in 469 of the 51 countries that took part in the survey, suggesting that road safety is high on their policy agenda. Full funding for implementation of national strategies is available in only nine countries, with an additional 36 reporting partial funding. Given the complexity of, and cross-sectoral responsibility for, road safety, the presence of lead agencies tasked with overseeing and/or coordinating across government to improve road safety was reported in 45 countries, one fewer than in 2010.
National road-safety strategies or plans require the combined actions of many sectors. Lead agencies, as proposed by the Decade of Action for Road Safety (2) and the voluntary global performance targets for road-safety risk factors and service-delivery mechanisms (11), are best placed to coordinate actions.
National road-safety targets are a valuable tool for ensuring implementation of national road-safety strategies. Setting measurable, time-limited and realistic targets is important, but only 42 countries reported having measurable targets to reduce deaths and 29 the number of people seriously injured (Fig. 15). There are wide variations across the Region, with countries in the EU having more measurable targets to reduce deaths and serious injuries than countries in the CIS. Many countries also have specifi c targets to improve the risk factors of speed, drink–driving and use of seat belts, child restraints and helmets (Fig. 16).
9 Five countries did not have national road-safety strategies: Armenia, Azerbaijan, Switzerland, Ukraine and Uzbekistan.
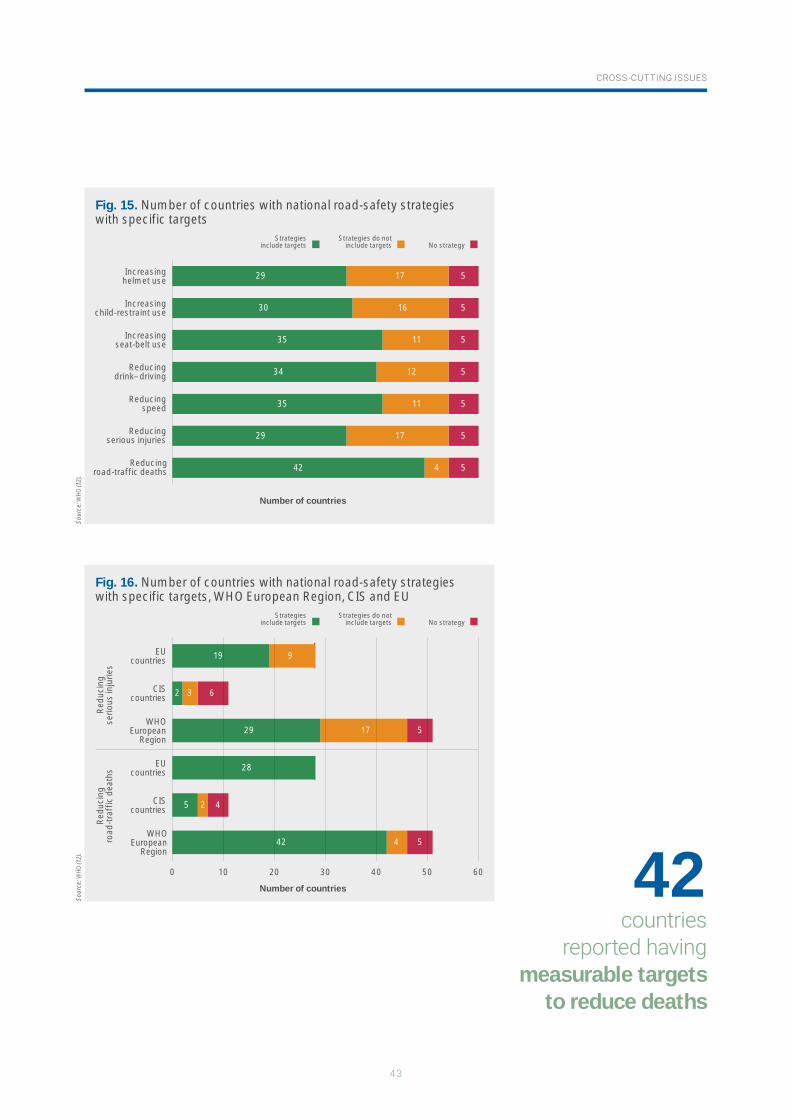
43
CROSS-CUTTING ISSUESSo
urce
: WH
O (1
2).
Reducingroad-traffic deaths
Reducingspeed
Increasingseat-belt use
Reducingdrink–driving
Increasingchild-restraint use
Increasinghelmet use
Reducingserious injuries
Number of countries
34 12 5
35 11 5
29 17 5
42 4 5
35 11 5
30 16 5
29 17 5
Strategiesinclude targets
Strategies do notinclude targets No strategy
Fig. 15. Number of countries with national road-safety strategieswith specific targets
Sour
ce: W
HO
(12)
.
10 20 30 40 50 600
WHOEuropean
Region
EUcountries
WHOEuropean
Region
CIScountries
Redu
cing
road
-traf
fic d
eath
sRe
duci
ngse
rious
inju
ries
EUcountries
CIScountries
Number of countries
2 3 6
5 2 4
29
28
17 5
42 4 5
19 9
Strategiesinclude targets
Strategies do notinclude targets No strategy
Fig. 16. Number of countries with national road-safety strategieswith specific targets, WHO European Region, CIS and EU
42countries
reported havingmeasurable targets
to reduce deaths
44
EUROPEAN REGIONAL STATUS REPORT ON ROAD SAFETY 2019
POST-CRASH RESPONSE: CARE AND TREATMENT OF INJURED PEOPLE
Post-crash response can save lives – many countries need to improve their emergency trauma services.Effi cient and high-quality emergency services can improve outcomes and survival after a crash (47). Some of the disparity in mortality rates in the Region may be attributable to better-quality post-crash response and emergency care in some countries resulting in improved survival, as has been reported from HICs (48,49). Rapid access to such care is critical. A Swedish study into survivability of fatal road-traffi c crashes indicated that up to 32% of victims could have survived if there had been timely access to prehospital and emergency care (50). The European emergency number of 112 has been adopted in all 28 EU Member States, other European countries and elsewhere. Every country in the Region has a national emergency number. Thirty-eight have a universal nationwide emergency number of 112, while 13 have other numbers.
Health systems’ capacity in emergency trauma care needs to be strengthened.Effi cient emergency trauma care requires specially trained staff (49). Emergency medicine is recognized as a specialty for medical doctors in 43 countries – a slight improvement from 41 in 2010. Thirty-nine countries have postgraduate specialization courses for nurses in emergency care or trauma, three more than in 2010. The WHO basic emergency care course and trauma care checklist provide training for systematic approaches to management of acute and life-threatening conditions to frontline prehospital and facility-based providers (51,52).
Routine assessment of prehospital and facility-based emergency care systems is important to strengthen and build greater capacity to respond to emergencies (49). Seventeen countries had conducted
32%of victims could have survivedif there had been timely access to prehospital and emergency care
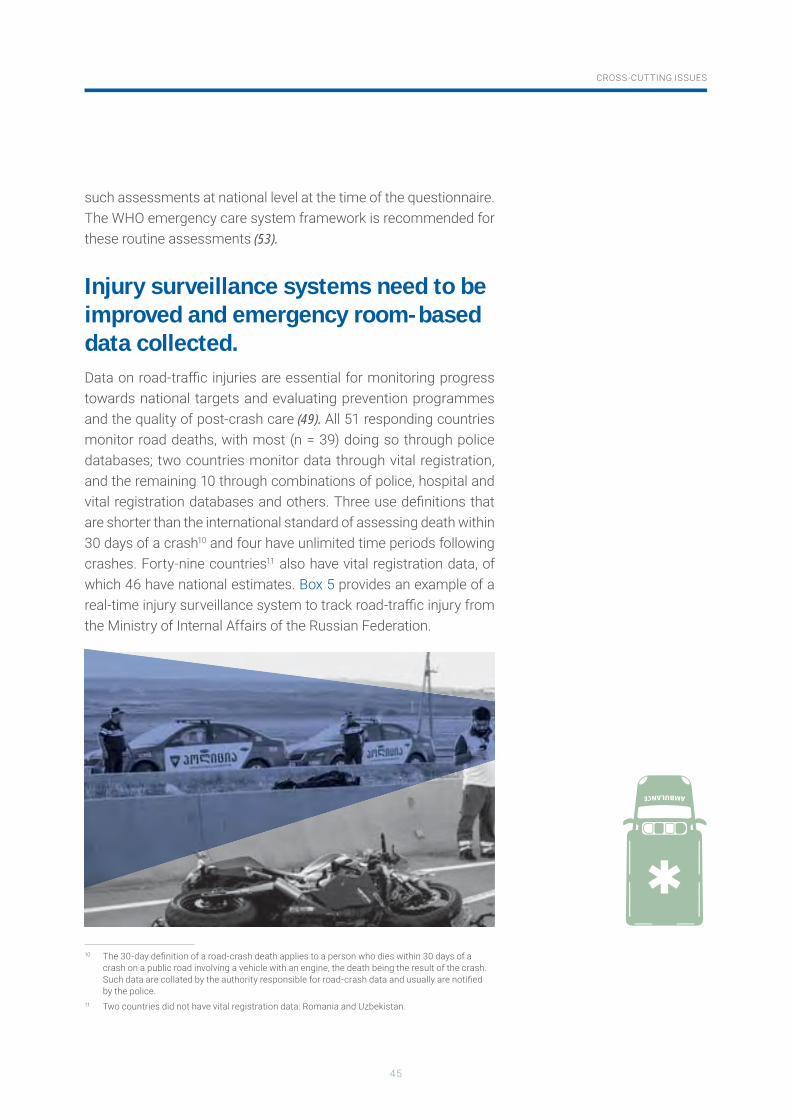
45
CROSS-CUTTING ISSUES
such assessments at national level at the time of the questionnaire. The WHO emergency care system framework is recommended for these routine assessments (53).
Injury surveillance systems need to be improved and emergency room-based data collected.Data on road-traffi c injuries are essential for monitoring progress towards national targets and evaluating prevention programmes and the quality of post-crash care (49). All 51 responding countries monitor road deaths, with most (n = 39) doing so through police databases; two countries monitor data through vital registration, and the remaining 10 through combinations of police, hospital and vital registration databases and others. Three use defi nitions that are shorter than the international standard of assessing death within 30 days of a crash10 and four have unlimited time periods following crashes. Forty-nine countries11 also have vital registration data, of which 46 have national estimates. Box 5 provides an example of a real-time injury surveillance system to track road-traffi c injury from the Ministry of Internal Affairs of the Russian Federation.
10 The 30-day defi nition of a road-crash death applies to a person who dies within 30 days of a crash on a public road involving a vehicle with an engine, the death being the result of the crash. Such data are collated by the authority responsible for road-crash data and usually are notifi ed by the police.
11 Two countries did not have vital registration data: Romania and Uzbekistan.
46
EUROPEAN REGIONAL STATUS REPORT ON ROAD SAFETY 2019
WHO has developed guidelines for community- and facility-based injury surveillance and a standardized data set to facilitate clinical quality improvement and prevention activities (54).
Box 5. Case study from the Russian Federation: Real time road crash information system to monitor road-traffi c injury and enhance road safety
In 2012, the Ministry of Internal Affairs of the Russian Federation established an automated electronic system for registration and analysis of data on all road-traffi c crashes, injuries and deaths occurring from district level up to federal level.
The system ensures the availability of real-time information on more than 300 indicators for each road-traffi c event. It is based on two key modules: the Road-traffi c Accident Log is for entering all details about a road-traffi c event; and an analysis module is used to perform all statistical computations relating to rates of crashes, injuries and deaths.
Primary information about each crash event are entered into the system within three hours of police attendance at the scene of the crash. The system largely is automated through links to the national databases of registered vehicles and licensed drivers. It records variables related to drivers and vehicles involved in a crash, including details of driving history and record of administrative sanctions.
The system uses an electronic map of the country, displaying the place of the crash event, black-spot and black-length road sections, and other information necessary to support crash investigations and appropriate management decision-making. Photographs from crash sites are also available. Information is shared with other government agencies to support similar actions related to the prevention of deaths and injuries.
Pre-populating the crash event record with autonomous variables helps to reduce the time of fi lling in the cards and increase the reliability and subsequent comparability of the processed data. The system maintains full user oversight of the completeness and reliability of the information entered both from regional and federal levels.
Variables on the number of crashes with killed/injured and the number of persons killed/injured in the crash are reported to the Federal State Statistics Service monthly. Internal police statistics also include other variables such as the total number of crashes, including those without any injuries.
Information on road-traffi c crash events, as well as enforcement-related activities, is published monthly on the offi cial website of the State Traffi c Inspectorate. Online public users can browse summary indicators and crash registration, displaying de-identifi ed information about the crash and causes and conditions that contributed to them. The online system can also inform the public if a second-hand vehicle they may be considering to purchase has previously been involved in a crash.
35% reduction in road-traffi c crashes resulting in death or injury was seen in the Russian Federation between 2012 and 2018 (from 27 991 to 18 214), saving almost 10 000 lives
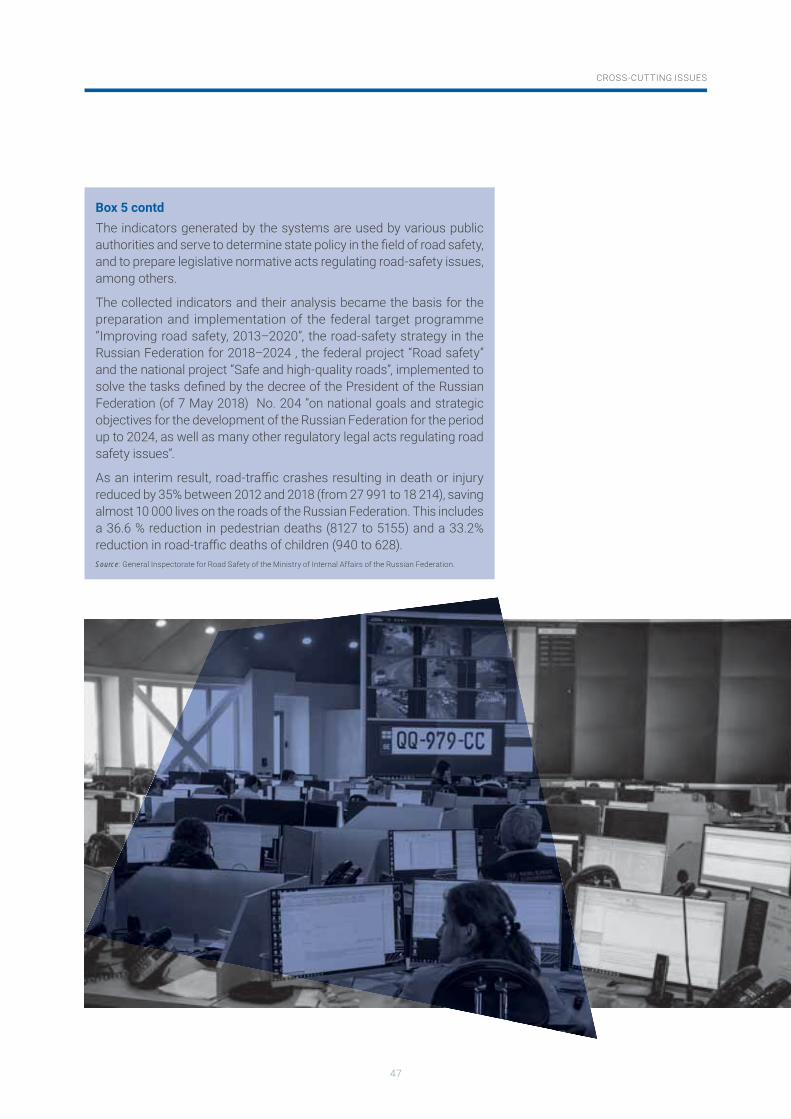
47
CROSS-CUTTING ISSUES
Box 5 contd The indicators generated by the systems are used by various public authorities and serve to determine state policy in the fi eld of road safety, and to prepare legislative normative acts regulating road-safety issues, among others.
The collected indicators and their analysis became the basis for the preparation and implementation of the federal target programme “Improving road safety, 2013–2020”, the road-safety strategy in the Russian Federation for 2018–2024 , the federal project “Road safety” and the national project “Safe and high-quality roads”, implemented to solve the tasks defi ned by the decree of the President of the Russian Federation (of 7 May 2018) No. 204 “on national goals and strategic objectives for the development of the Russian Federation for the period up to 2024, as well as many other regulatory legal acts regulating road safety issues”.
As an interim result, road-traffi c crashes resulting in death or injury reduced by 35% between 2012 and 2018 (from 27 991 to 18 214), saving almost 10 000 lives on the roads of the Russian Federation. This includes a 36.6 % reduction in pedestrian deaths (8127 to 5155) and a 33.2% reduction in road-traffi c deaths of children (940 to 628).Source: General Inspectorate for Road Safety of the Ministry of Internal Affairs of the Russian Federation.
CONCLUSIONS
49
CONCLUSIONS
Every day, 221 people are killed due to road-traffi c crashes, and many more are seriously injured. Road-traffi c crashes are a major cause of injury and death in the WHO European Region and are the leading cause of death for children and young adults. They resulted in over 80 000 deaths in 2016.
While there has been a 13.4% reduction in deaths in the Region since the baseline measure in 2010 (1), this progress has not occurred at a suffi ciently fast pace to compensate for rapid motorization. LMICs account for only 26% of the Region’s vehicles, but 70% of road-traffi c deaths occur in these countries. Every four in 10 people killed on the road are pedestrians, cyclists or motorcyclists.
Should the fall in the number of deaths continue at its current pace, the SDG target to halve road-traffi c deaths by 2020 will not be met. Yet the review of key risk factors shows promising progress being made across all fi ve pillars of the safe-system approach on road-safety management, improving key road-safety laws, infrastructure, adoption of vehicle standards and improving access to post-crash care.
Compared to 2010, 40 countries have made progress in reducing the number of road-crash deaths, but six have seen an increase. While some countries in the Region have the lowest rates of road-traffi c deaths in the world, large inequalities persist in the Region, ranging from 18.1 to 2.7 per 100 000 population. The commendable reductions in road-traffi c fatalities have been the result of sustained efforts over a period of 50 years through implementation of the safe-system approach. Good practices and lessons learned from such an approach can be applied elsewhere in the Region (12,26). If every country achieved the same lowest rate, more than 55 000 lives would be saved every year.
With road safety already identifi ed as a priority by national governments and multilateral bodies, the focus must move beyond convincing decision-makers on the need to act. The key to achieving the goals of the Decade of Action for Road Safety 2011–2020 (2) and the SDGs (5) is whole-of-government implementation of data-driven and evidence-based strategies that have been shown to prevent road-traffi c injuries and deaths, such as Save LIVES (55).
More than just token words are required. What is needed in countries is the political and technical commitment to implement the principles
Should the fall in the number of deaths continue
at its current pace, the SDG target to halve road-traffi c
deaths by 2020 will not be met
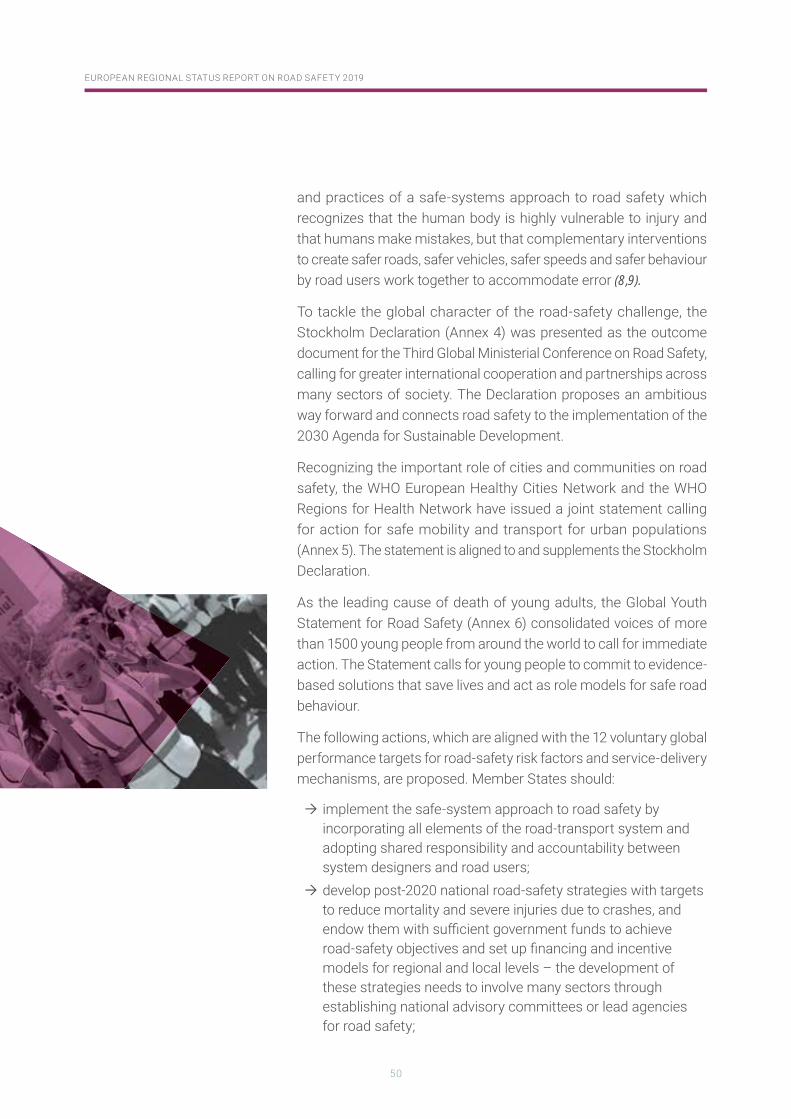
50
EUROPEAN REGIONAL STATUS REPORT ON ROAD SAFETY 2019
and practices of a safe-systems approach to road safety which recognizes that the human body is highly vulnerable to injury and that humans make mistakes, but that complementary interventions to create safer roads, safer vehicles, safer speeds and safer behaviour by road users work together to accommodate error (8,9).
To tackle the global character of the road-safety challenge, the Stockholm Declaration (Annex 4) was presented as the outcome document for the Third Global Ministerial Conference on Road Safety, calling for greater international cooperation and partnerships across many sectors of society. The Declaration proposes an ambitious way forward and connects road safety to the implementation of the 2030 Agenda for Sustainable Development.
Recognizing the important role of cities and communities on road safety, the WHO European Healthy Cities Network and the WHO Regions for Health Network have issued a joint statement calling for action for safe mobility and transport for urban populations (Annex 5). The statement is aligned to and supplements the Stockholm Declaration.
As the leading cause of death of young adults, the Global Youth Statement for Road Safety (Annex 6) consolidated voices of more than 1500 young people from around the world to call for immediate action. The Statement calls for young people to commit to evidence-based solutions that save lives and act as role models for safe road behaviour.
The following actions, which are aligned with the 12 voluntary global performance targets for road-safety risk factors and service-delivery mechanisms, are proposed. Member States should:
implement the safe-system approach to road safety by incorporating all elements of the road-transport system and adopting shared responsibility and accountability between system designers and road users;
develop post-2020 national road-safety strategies with targets to reduce mortality and severe injuries due to crashes, and endow them with suffi cient government funds to achieve road-safety objectives and set up fi nancing and incentive models for regional and local levels – the development of these strategies needs to involve many sectors through establishing national advisory committees or lead agencies for road safety;
51
CONCLUSIONS
improve and integrate injury-surveillance systems between hospital and police agencies to monitor progress towards reduction of fatal and non-fatal injuries, with better collection of injury data according to the MAIS+3 defi nition for severe road injury and standardization to allow for comparisons;
change road-user risky behaviours using measures based on sound evaluation studies and, where applicable, consider cost–effectiveness;
enact and enforce laws to change risky behaviours: while most countries (90%) have such laws, they need to be strengthened in many countries to bring them in line with best practice;
increase the exchange of best practices in enforcement practices; social marketing campaigns would support better enforcement and acceptance of laws by the public;
encourage participation of legislators in the global network for road-safety legislators and establish a regional network to share best practices and successful experiences in the Region as a strategy for stimulating the development and enforcement of effective road-safety legislation;
52
EUROPEAN REGIONAL STATUS REPORT ON ROAD SAFETY 2019
strengthen protection for pedestrians, cyclists and motorcyclists by making walking and cycling safer and providing public transport to encourage physically active and sustainable forms of transport;
support the adoption of international vehicle-safety standards to make cars safer on the roads: only 35 countries in the Region meet the priority safety standards assessed, and more need to implement the standards to prevent harm to all road users from crashes;
conduct formal road-safety assessments, especially in high-risk roads and around school and residential zones; and
provide greater investment to streamline the emergency response chain and improve the quality of trauma management within the health system to mitigate collision consequences.
The WHO Regional Offi ce for Europe stands ready to support Member States in the implementation of Save LIVES and the above proposed actions.
REFERENCES
54
EUROPEAN REGIONAL STATUS REPORT ON ROAD SAFETY 2019
REFERENCES 12
12 All weblinks accessed 20 February 2020.
1. Disease burden and mortality estimates. In: World Health Organization [website]. Geneva: World Health Organization; 2019 (https://www.who.int/healthinfo/global_burden_disease/estimates/en/index1.html).
2. United Nations Road Safety Collaboration. The global plan for a decade of action for road safety 2011–2020. New York (NY): United Nations Road Safety Collaboration; 2010 (https://www.who.int/roadsafety/decade_of_action/plan/en/).
3. Global status report on road safety 2013: supporting a decade of action. Geneva: World Health Organization; 2013 (https://www.who.int/violence_injury_prevention/road_safety_status/2013/en/).
4. European facts and Global status report on road safety 2013. Copenhagen: WHO Regional Offi ce for Europe; 2013 (http://www.euro.who.int/en/publications/abstracts/european-facts-and-global-status-report-on-road-safety-2013).
5. Resolution A/RES/70/1. Transforming our world: the 2030 agenda for sustainable development. Resolution adopted by the General Assembly on 25 September 2015. New York (NY): United Nations; 2015 (Document A/RES/70/1; https://sustainabledevelopment.un.org/index.php?page=view&type=111&nr=8496&menu=35).
6. Health 2020: a European policy framework supporting action across government and society for health and well-being. Copenhagen: WHO Regional Offi ce for Europe; 2012 (EUR/ RC62/9; http://www.euro.who.int/en/publications/abstracts/health-2020-a-european-policy-framework-supporting-action-across-government-and-society-for-health-and-well-being).
7. Road safety study for the interim evaluation of Policy Orientations on Road Safety 2011–2020. Brussels: European Commission; 2015 (https://ec.europa.eu/transport/road_safety/sites/roadsafety/fi les/pdf/study_fi nal_report_february_2015_fi nal.pdf).
8. Elvik R, Høye A, Vaa T, Sørensen M. The handbook of road safety measures, 2nd edition. Bingley: Emerald Publishing; 2009 (https://www.emerald.com/insight/publication/doi/10.1108/9781848552517).
9. International Transport Forum. Zero road deaths and serious injuries: leading a paradigm shift to a safe system. Research report. Paris: Organisation for Economic Co-operation and Development; 2016 (https://www.oecd.org/publications/zero-road-deaths-and-serious-injuries-9789282108055-en.htm).
10. Safer roads, safer Queensland: Queensland’s road safety strategy 2015–21. Brisbane: State of Queensland (Transport and Main Roads); 2015 (https://www.tmr.qld.gov.au/Safety/Road-safety/Strategy-and-action-plans.aspx).
11. Developing global targets for road safety risk factors and service delivery mechanisms. In: World Health Organization [website]. Geneva: World Health Organization; 2017 (https://www.who.int/violence_injury_prevention/road_traffi c/road-safety-targets/en/).
12. Global status report on road safety 2018. Geneva: World Health Organization; 2018 (https://www.who.int/violence_injury_prevention/road_safety_status/2018/en/).
13. Global status report on road safety 2015. Geneva: World Health Organization; 2015 (https://apps.who.int/iris/handle/10665/189242).
14. Jackisch J, Sethi D, Mitis F, Szymañski T, Arra I. European facts and the Global status report on road safety 2015. Copenhagen: WHO Regional Offi ce for Europe; 2015 (http://www.euro.who.int/en/health-topics/disease-prevention/violence-and-injuries/publications/2015/european-facts-and-the-global-status-report-on-road-safety-2015).
15. World Bank country and lending groups. In: World Bank [website]. Washington (DC): World Bank; 2019 (https://datahelpdesk.worldbank.org/knowledgebase/articles/906519-world-bank-country-and-lending-groups).
16. Borowy I. Road traffi c injuries: social change and development. Med Hist. 2013:57(1):108–38.
17. Peden M, Scurfi eld R, Sleet D, Mohan D, Hyder AA, Jarawan E et al., editors. World report on road traffi c injury prevention. Geneva: World Health Organization; 2004 (https://www.who.int/violence_injury_prevention/publications/road_traffi c/world_report/en/).
18. Injuries in the European Union: summary of injury statistics for the years 2012–2014, 6th edition. Amsterdam: European Association for Injury Prevention and Safety Promotion; 2016 (http://www.eurosafe.eu.com/uploads/inline-fi les/EuropeSafe_Master_Web_02112016%20%282%29.pdf).
19. Ranking EU progress on road safety. 12th road safety performance index report. Brussels: European Transport Safety Council; 2018 (https://etsc.eu/wp-content/uploads/PIN_AR_2018_fi nal.pdf).
20. Martin J-L, Wu D. Pedestrian fatality and impact speed squared: Cloglog modeling from French national data. Traffi c Inj Prev. 2018;19(1):94–101.
21. Finch DJ, Kompfner P, Lockwood CR, Maycock G. Speed, speed limits and accidents (Project Report 58). Crowthorne: Transport Research Laboratory; 1994 (https://trid.trb.org/view.aspx?id=409371).
22. Scientifi c expert group on the safety of vulnerable road users (RS7). Safety of vulnerable road users. Paris: Organisation for Economic Co-operation and Development; 1998 (DSTI/DOT/RTR/RS7(98)1/FINAL; https://safety.fhwa.dot.gov/ped_bike/docs/oecd_safety.pdf).
23. Managing speed. Geneva: World Health Organization; 2017 (WHO/NMH/NVI/17.7; https://www.who.int/violence_injury_prevention/publications/road_traffi c/managing-speed/en/).
24. Commission staff working document. EU road safety policy framework 2021–2030 – next steps towards “Vision Zero”. Brussels: European Commission; 2019 (SWD(2019) 283 fi nal; https://ec.europa.eu/transport/sites/transport/fi les/legislation/swd20190283-roadsafety-vision-zero.pdf).
55
REFERENCES
25. High-level group on road safety consultation on the development of the injuries strategy: next steps in the development of the injuries strategy. 2nd working document. Brussels: European Commission; 2012 (https://ec.europa.eu/transport/road_safety/sites/roadsafety/fi les/pdf/injury_next_steps.pdf).
26. Racioppi F, Eriksson L, Tingvall C, Villaveces A. Preventing road traffi c injury: a public health perspective for Europe. Copenhagen: WHO Regional Offi ce for Europe; 2004 (http://www.euro.who.int/en/publications/abstracts/preventing-road-traffi c-injury-a-public-health-perspective-for-europe-2004).
27. Wali B, Ahmed A, Iqbal S, Hussain A. Effectiveness of enforcement levels of speed limit and drink driving laws and associated factors – exploratory empirical analysis using a bivariate ordered probit model. J Traffi c Transp Eng Ed. 2017;4(3):272–79.
28. Rahim SA, Jamil HM, Musa M, Isah N, Voon WS. Impact studies of automated enforcement system implementation. Kajang, Malaysia; Malaysian Institute of Road Safety Research; 2014 (https://www.miros.gov.my/xs/dl.php?fi lename=MRR_AES%20Evaluation%20Report.pdf).
29. Global status report on road safety: time for action. Geneva: World Health Organization; 2009 (https://apps.who.int/iris/handle/10665/44122).
30. Strengthening road safety legislation: a practice and resource manual for countries. Geneva: World Health Organization; 2013 (https://www.who.int/violence_injury_prevention/road_traffi c/countrywork/legislation_manual/en/).
31. Shults RA, Elder RW, Sleet DA, Nichols JL, Alao MO, Carande-kulis VG et al. Reviews of evidence regarding interventions to reduce alcohol-impaired driving. Am J Prev Med. 2001;21(4 Suppl.):66–88.
32. Global information system on alcohol and health (GISAH). In: World Health Organization [website]. Geneva: World Health Organization; 2019 (http://apps.who.int/gho/data/node.gisah.GISAHhome?showonly=GISAH).
33. National Highway Traffi c Safety Administration. Traffi c safety facts 2016 data. Motorcycles. Washington (DC): U.S. Department of Transportation; 2016. (DOT HS 812 492; https://crashstats.nhtsa.dot.gov/Api/Public/ViewPublication/812492).
34. Liu BC, Ivers R, Norton R, Boufous S, Blows S, Lo SK. Helmets for preventing injury in motorcycle riders. Cochrane Database Syst Rev. 2008;(1):CD004333.
35. Jakobsson L, Isaksson-Hellman I, Lundell B. Safety for the growing child – experiences from Swedish accident data. Gothenburg: Volvo Car Corporation; 2005 (http://citeseerx.ist.psu.edu/viewdoc/download?doi=10.1.1.541.3024&rep=rep1&type=pdf).
36. Brown T, Milavetz G, Murry DJ. Alcohol, drugs and driving: implications for evaluating driver impairment. Ann Adv Automot Med. 2013;57:23–32.
37. Lipovac K, Đerić M, Tešić M, Andrić Z, Marić B. Mobile phone use while driving literary review. Transp Res Part F-Traf. 2017;47:132–42.
38. Horrey WJ, Wickens CD. Examining the impact of cell phone conversations on driving using metanalytic techniques. Hum Factors 2006;48(1):196–205.
39. Farmer CM, Braitman KA, Lund AK. Cell phone use while driving and attributable crash risk. Traffi c Inj Prev. 2010;11(5):466–70.
40. Vehicle regulations. In: United Nations Economic Commission for Europe [website]. Geneva: United Nations Economic Commission for Europe; 2019 (http://www.unece.org/trans/main/welcwp29.html).
41. Resolution A/RES/66/260. Improving global road safety. Resolution adopted by the General Assembly on 19 April 2012. New York (NY): United Nations; 2012 (Document A/RES/66/260; https://www.who.int/roadsafety/about/resolutions/download/en/).
42. Global new car assessment programme. In: Global NCAP [website]. London: Global NCAP; 2019 (http://www.globalncap.org/about/).
43. Physical activity strategy for the WHO European Region 2016–2025. Copenhagen: WHO Regional Offi ce for Europe; 2015 (EUR/RC65/9; http://www.euro.who.int/en/publications/abstracts/physical-activity-strategy-for-the-who-european-region-20162025).
44. Krzyzanowski M, Kuna-Dibbert B, Schneider J. Health effects of transport-related air pollution. Copenhagen: WHO Regional Offi ce for Europe; 2005 (http://www.euro.who.int/en/publications/abstracts/health-effects-of-transport-related-air-pollution).
45. Noncommunicable diseases and air pollution. WHO European high-level conference on noncommunicable diseases. Copenhagen: WHO Regional Offi ce for Europe; 2019 (http://www.euro.who.int/en/health-topics/environment-and-health/air-quality/publications/2019/noncommunicable-diseases-and-air-pollution-2019).
46. Global action plan on physical activity 2018–2030: more active people for a healthier world. Geneva: World Health Organization; 2018 (https://www.who.int/ncds/prevention/physical-activity/global-action-plan-2018-2030/en/).
47. European Road Safety Observatory. Post-impact care 2018. Brussels: European Commission; 2018 (https://ec.europa.eu/transport/road_safety/sites/roadsafety/fi les/pdf/ersosynthesis2018-postimpactcare.pdf).
48. Mock C, Lormand JD, Goosen J, Joshipura M, Peden M. Guidelines for essential trauma care. Geneva: World Health Organization; 2004 (https://www.who.int/violence_injury_prevention/publications/services/guidelines_traumacare/en/).
49. Post-crash response: supporting those affected by road traffi c crashes. Geneva: World Health Organization; 2016 (https://www.who.int/violence_injury_prevention/publications/road_traffi c/post-crash-response/en/).
56
EUROPEAN REGIONAL STATUS REPORT ON ROAD SAFETY 2019
50. Henriksson EM, Öström M, Eriksson A. Preventability of vehicle-related fatalities. Accident Anal Prev. 2001;33:467–75.
51. Basic emergency care: approach to the acutely ill and injured. Geneva: World Health Organization; 2018 (https://www.who.int/emergencycare/publications/Basic-Emergency-Care/en/).
52. Trauma care checklist. In: World Health Organization [website]. Geneva: World Health Organization; 2016 (https://www.who.int/publications-detail/trauma-care-checklist).
53. WHO emergency care system framework infographic. In: World Health Organization [website]. Geneva: World Health Organization; 2019 (https://www.who.int/emergencycare/emergencycare_infographic/en/).
54. Fatal injury surveillance in mortuaries and hospitals: a manual for practitioners. Geneva: World Health Organization; 2012 (https://www.who.int/violence_injury_prevention/publications/surveillance/fatal_injury_surveillance/en/).
55. Save LIVES: a road safety technical package. Geneva: World Health Organization; 2017 (https://www.who.int/violence_injury_prevention/publications/road_traffi c/save-lives-package/en/).
COUNTRYPROFILES
58
EUROPEAN REGIONAL STATUS REPORT ON ROAD SAFETY 2019
58
EUROPEAN REGIONAL STATUS REPORT ON ROAD SAFETY 2019
COUNTRY PROFILESThe following 51 country profi les provide a national summary of key indicators for road safety. Most have been approved by ministries of health.
Data reported for population were extracted from the United Nations Population Division database (1), while gross national income (GNI) per capita for 2016 came from World Bank estimates (2).
The Bank Atlas method was used to categorize GNI into bands:
low income = US$ 1005 or less middle income = US$ 1006–12 235 high income = US$ 12 236 or more.
References
1. World population prospects: the 2017 revision, DVD edition. New York (NY): United Nations; 2018 (https://www.un.org/development/desa/publications/world-population-prospects-the-2017-revision.html, accessed 20 February 2020).
2. World development indicators database [online database]. In: World Bank [website]. Washington (DC): World Bank; 2018 (https://datahelpdesk.worldbank.org/knowledgebase/articles/906519-world-bank-country-and-lending-groups, accessed 20 February 2020).
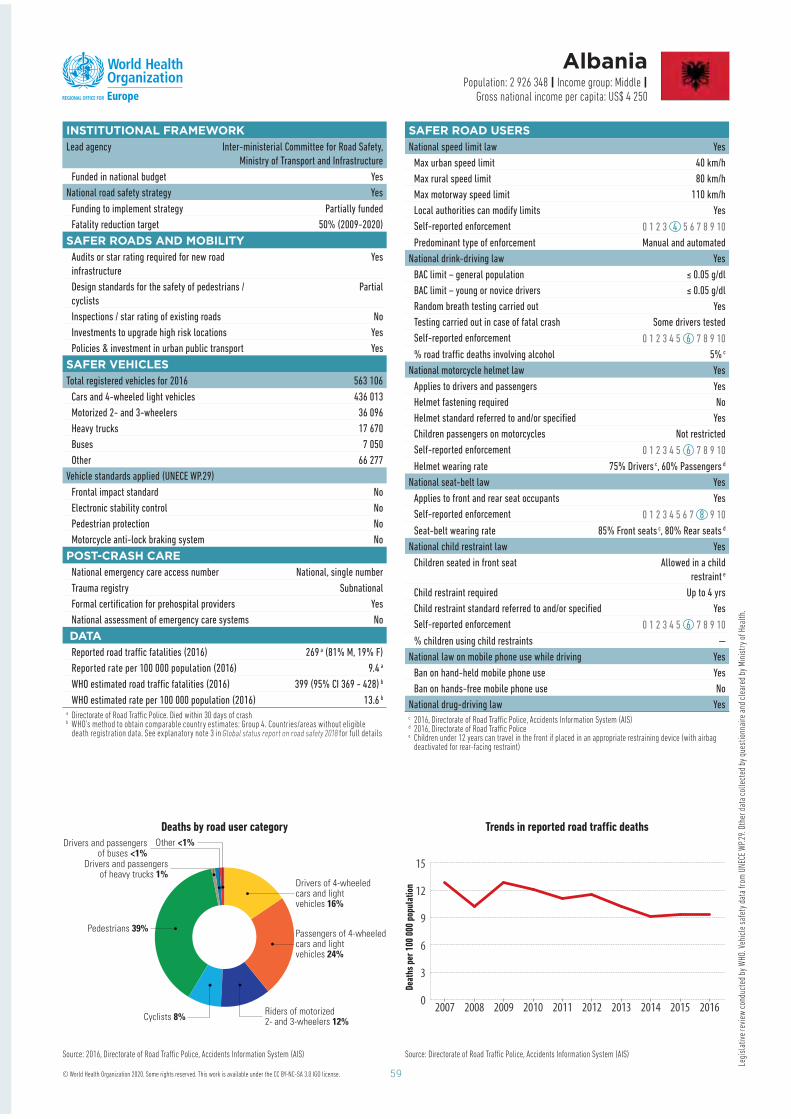
59
INSTITUTIONAL FRAMEWORKLead agency Inter-ministerial Committee for Road Safety,
Ministry of Transport and Infrastructure
Funded in national budget Yes
National road safety strategy Yes
Funding to implement strategy Partially funded
Fatality reduction target 50% (2009-2020)
SAFER ROADS AND MOBILITY Audits or star rating required for new road
infrastructure
Yes
Design standards for the safety of pedestrians /
cyclists
Partial
Inspections / star rating of existing roads No
Investments to upgrade high risk locations Yes
Policies & investment in urban public transport Yes
SAFER VEHICLES Total registered vehicles for 2016 563 106
Cars and 4-wheeled light vehicles 436 013
Motorized 2- and 3-wheelers 36 096
Heavy trucks 17 670
Buses 7 050
Other 66 277
Vehicle standards applied (UNECE WP.29)
Frontal impact standard No
Electronic stability control No
Pedestrian protection No
Motorcycle anti-lock braking system No
POST-CRASH CARENational emergency care access number National, single number
Trauma registry Subnational
Formal certifi cation for prehospital providers Yes
National assessment of emergency care systems No
DATAReported road traffi c fatalities (2016) 269 a ( 81 % M, 19 % F)
Reported rate per 100 000 population (2016) 9.4 a
WHO estimated road traffi c fatalities (2016) 399 (95% CI 369 - 428 ) b
WHO estimated rate per 100 000 population (2016) 13.6 b
a Directorate of Road Traffi c Police. Died within 30 days of crashb WHO’s method to obtain comparable country estimates: Group 4. Countries/areas without eligible
death registration data. See explanatory note 3 in Global status report on road safety 2018 for full details
Albania Population: 2 926 348 | Income group: Middle |
Gross national income per capita: US$ 4 250
Deaths by road user category
Drivers of 4-wheeledcars and lightvehicles 16%
Passengers of 4-wheeledcars and lightvehicles 24%
Riders of motorized2- and 3-wheelers 12%Cyclists 8%
Pedestrians 39%
Drivers and passengersof heavy trucks 1%
Drivers and passengersof buses <1%
Other <1%
Source: 2016, Directorate of Road Traffi c Police, Accidents Information System (AIS) Source: Directorate of Road Traffi c Police, Accidents Information System (AIS)
0
3
6
9
12
15
2016201520142013201220112010200920082007
SAFER ROAD USERSNational speed limit law Yes
Max urban speed limit 40 km/h
Max rural speed limit 80 km/h
Max motorway speed limit 110 km/h
Local authorities can modify limits Yes
Self-reported enforcement 0 1 2 3 4 5 6 7 8 9 10
Predominant type of enforcement Manual and automated
National drink-driving law Yes
BAC limit – general population ≤ 0.05 g/dl
BAC limit – young or novice drivers ≤ 0.05 g/dl
Random breath testing carried out Yes
Testing carried out in case of fatal crash Some drivers tested
Self-reported enforcement 0 1 2 3 4 5 6 7 8 9 10
% road traffi c deaths involving alcohol 5% c
National motorcycle helmet law Yes
Applies to drivers and passengers Yes
Helmet fastening required No
Helmet standard referred to and/or specifi ed Yes
Children passengers on motorcycles Not restricted
Self-reported enforcement 0 1 2 3 4 5 6 7 8 9 10
Helmet wearing rate 75% Drivers c , 60% Passengers d
National seat-belt law Yes
Applies to front and rear seat occupants Yes
Self-reported enforcement 0 1 2 3 4 5 6 7 8 9 10
Seat-belt wearing rate 85% Front seats c , 80% Rear seats d
National child restraint law Yes
Children seated in front seat Allowed in a child
restraint e
Child restraint required Up to 4 yrs
Child restraint standard referred to and/or specifi ed Yes
Self-reported enforcement 0 1 2 3 4 5 6 7 8 9 10
% children using child restraints —
National law on mobile phone use while driving Yes
Ban on hand-held mobile phone use Yes
Ban on hands-free mobile phone use No
National drug-driving law Yes c 2016, Directorate of Road Traffi c Police, Accidents Information System (AIS)d 2016, Directorate of Road Traffi c Policee Children under 12 years can travel in the front if placed in an appropriate restraining device (with airbag
deactivated for rear-facing restraint)
Trends in reported road traffi c deaths
Deat
hs p
er 1
00 0
00 p
opul
atio
n
Legi
slat
ive
revi
ew c
ondu
cted
by
WHO
. Veh
icle
saf
ety
data
from
UNE
CE W
P.29
. Oth
er d
ata
colle
cted
by
ques
tionn
aire
and
cle
ared
by
Min
istr
y of
Hea
lth.
© World Health Organization 2020. Some rights reserved. This work is available under the CC BY-NC-SA 3.0 IGO license.
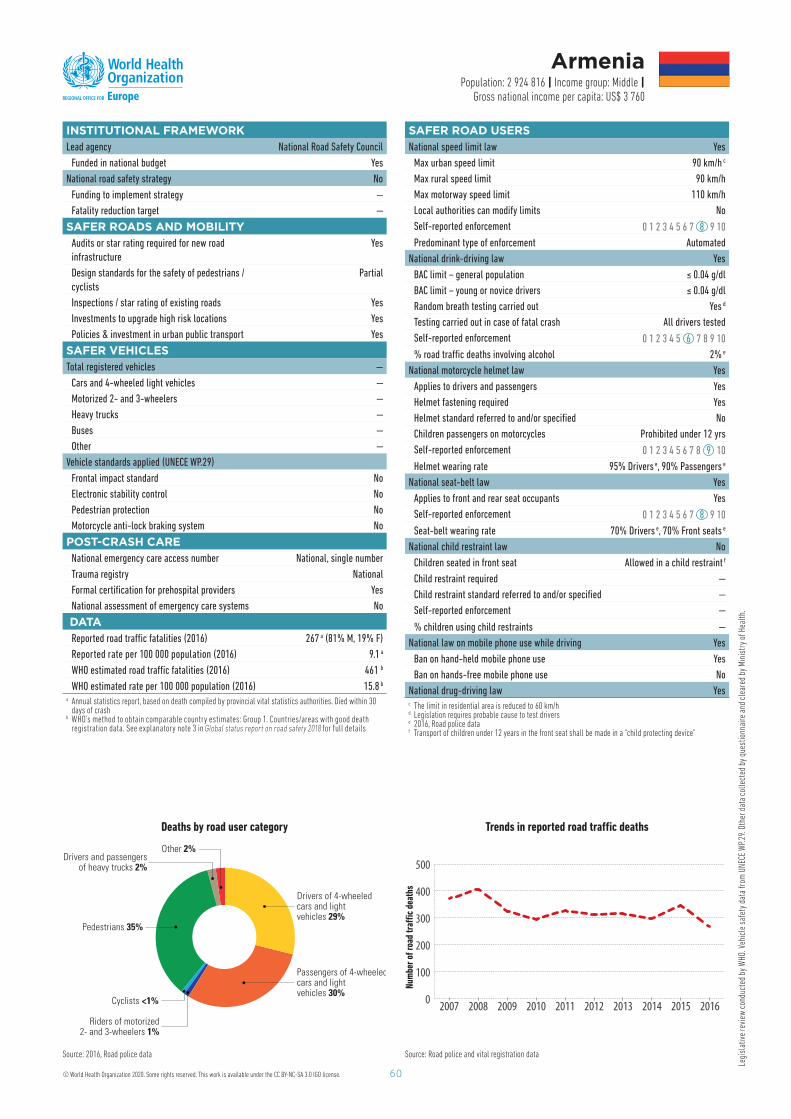
60
INSTITUTIONAL FRAMEWORKLead agency National Road Safety Council
Funded in national budget Yes
National road safety strategy No
Funding to implement strategy —
Fatality reduction target —
SAFER ROADS AND MOBILITY Audits or star rating required for new road
infrastructure
Yes
Design standards for the safety of pedestrians /
cyclists
Partial
Inspections / star rating of existing roads Yes
Investments to upgrade high risk locations Yes
Policies & investment in urban public transport Yes
SAFER VEHICLES Total registered vehicles —
Cars and 4-wheeled light vehicles —
Motorized 2- and 3-wheelers —
Heavy trucks —
Buses —
Other —
Vehicle standards applied (UNECE WP.29)
Frontal impact standard No
Electronic stability control No
Pedestrian protection No
Motorcycle anti-lock braking system No
POST-CRASH CARENational emergency care access number National, single number
Trauma registry National
Formal certifi cation for prehospital providers Yes
National assessment of emergency care systems No
DATAReported road traffi c fatalities (2016) 267 a ( 81 % M, 19 % F)
Reported rate per 100 000 population (2016) 9.1 a
WHO estimated road traffi c fatalities (2016) 461 b
WHO estimated rate per 100 000 population (2016) 15.8 b
a Annual statistics report, based on death compiled by provincial vital statistics authorities. Died within 30 days of crash
b WHO’s method to obtain comparable country estimates: Group 1. Countries/areas with good death registration data. See explanatory note 3 in Global status report on road safety 2018 for full details
Armenia Population: 2 924 816 | Income group: Middle |
Gross national income per capita: US$ 3 760
Deaths by road user category
Drivers of 4-wheeledcars and lightvehicles 29%
Passengers of 4-wheeledcars and lightvehicles 30%
Cyclists <1%
Pedestrians 35%
Drivers and passengersof heavy trucks 2%
Other 2%
Riders of motorized2- and 3-wheelers 1%
Source: 2016, Road police data Source: Road police and vital registration data
0
100
200
300
400
500
2016201520142013201220112010200920082007
SAFER ROAD USERSNational speed limit law Yes
Max urban speed limit 90 km/h c
Max rural speed limit 90 km/h
Max motorway speed limit 110 km/h
Local authorities can modify limits No
Self-reported enforcement 0 1 2 3 4 5 6 7 8 9 10
Predominant type of enforcement Automated
National drink-driving law Yes
BAC limit – general population ≤ 0.04 g/dl
BAC limit – young or novice drivers ≤ 0.04 g/dl
Random breath testing carried out Yes d
Testing carried out in case of fatal crash All drivers tested
Self-reported enforcement 0 1 2 3 4 5 6 7 8 9 10
% road traffi c deaths involving alcohol 2% e
National motorcycle helmet law Yes
Applies to drivers and passengers Yes
Helmet fastening required Yes
Helmet standard referred to and/or specifi ed No
Children passengers on motorcycles Prohibited under 12 yrs
Self-reported enforcement 0 1 2 3 4 5 6 7 8 9 10
Helmet wearing rate 95% Drivers e , 90% Passengers e
National seat-belt law Yes
Applies to front and rear seat occupants Yes
Self-reported enforcement 0 1 2 3 4 5 6 7 8 9 10
Seat-belt wearing rate 70% Drivers e , 70% Front seats e
National child restraint law No
Children seated in front seat Allowed in a child restraint f
Child restraint required —
Child restraint standard referred to and/or specifi ed —
Self-reported enforcement —
% children using child restraints —
National law on mobile phone use while driving Yes
Ban on hand-held mobile phone use Yes
Ban on hands-free mobile phone use No
National drug-driving law Yes c The limit in residential area is reduced to 60 km/hd Legislation requires probable cause to test driverse 2016, Road police dataf Transport of children under 12 years in the front seat shall be made in a "child protecting device"
Trends in reported road traffi c deaths
Num
ber
of r
oad
traffi
c
deat
hs
Legi
slat
ive
revi
ew c
ondu
cted
by
WHO
. Veh
icle
saf
ety
data
from
UNE
CE W
P.29
. Oth
er d
ata
colle
cted
by
ques
tionn
aire
and
cle
ared
by
Min
istr
y of
Hea
lth.
© World Health Organization 2020. Some rights reserved. This work is available under the CC BY-NC-SA 3.0 IGO license.
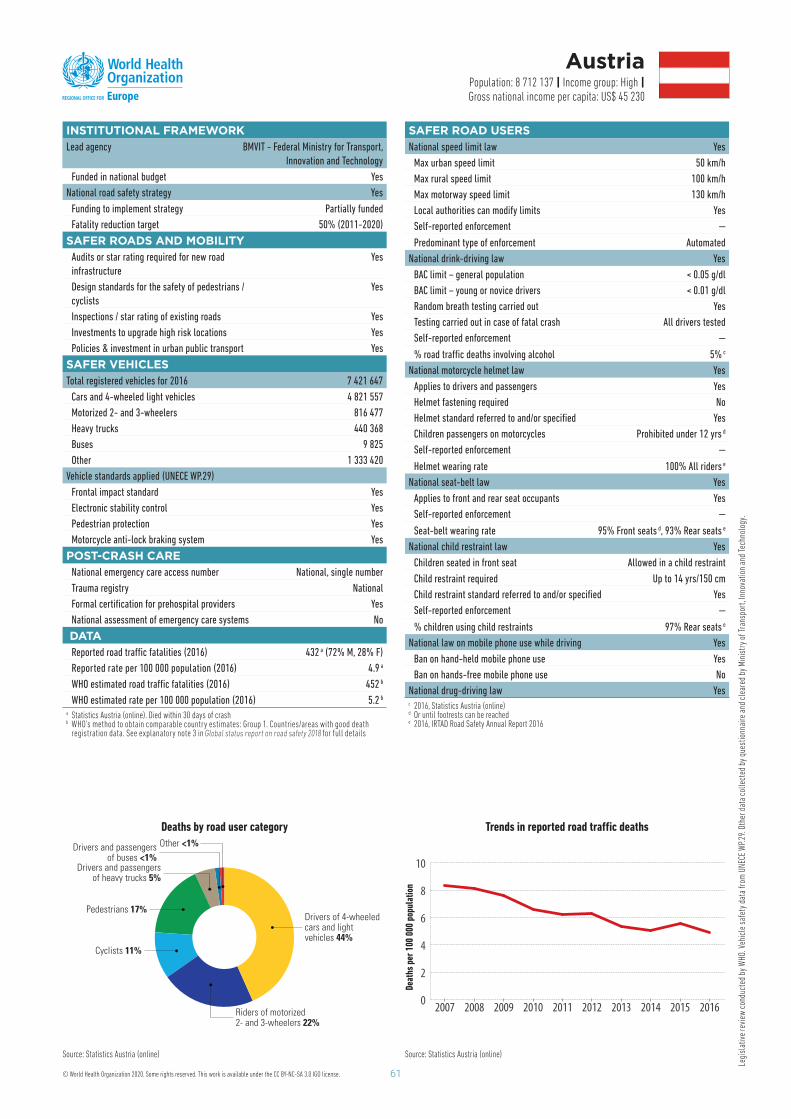
61
Legi
slat
ive
revi
ew c
ondu
cted
by
WHO
. Veh
icle
saf
ety
data
from
UNE
CE W
P.29
. Oth
er d
ata
colle
cted
by
ques
tionn
aire
and
cle
ared
by
Min
istr
y of
Tra
nspo
rt, I
nnov
atio
n an
d Te
chno
logy
.
INSTITUTIONAL FRAMEWORKLead agency BMVIT - Federal Ministry for Transport,
Innovation and Technology
Funded in national budget Yes
National road safety strategy Yes
Funding to implement strategy Partially funded
Fatality reduction target 50% (2011-2020)
SAFER ROADS AND MOBILITY Audits or star rating required for new road
infrastructure
Yes
Design standards for the safety of pedestrians /
cyclists
Yes
Inspections / star rating of existing roads Yes
Investments to upgrade high risk locations Yes
Policies & investment in urban public transport Yes
SAFER VEHICLES Total registered vehicles for 2016 7 421 647
Cars and 4-wheeled light vehicles 4 821 557
Motorized 2- and 3-wheelers 816 477
Heavy trucks 440 368
Buses 9 825
Other 1 333 420
Vehicle standards applied (UNECE WP.29)
Frontal impact standard Yes
Electronic stability control Yes
Pedestrian protection Yes
Motorcycle anti-lock braking system Yes
POST-CRASH CARENational emergency care access number National, single number
Trauma registry National
Formal certifi cation for prehospital providers Yes
National assessment of emergency care systems No
DATAReported road traffi c fatalities (2016) 432 a ( 72 % M, 28 % F)
Reported rate per 100 000 population (2016) 4.9 a
WHO estimated road traffi c fatalities (2016) 452 b
WHO estimated rate per 100 000 population (2016) 5.2 b
a Statistics Austria (online) . Died within 30 days of crashb WHO’s method to obtain comparable country estimates: Group 1. Countries/areas with good death
registration data. See explanatory note 3 in Global status report on road safety 2018 for full details
Austria Population: 8 712 137 | Income group: High |Gross national income per capita: US$ 45 230
Deaths by road user category
Drivers of 4-wheeledcars and lightvehicles 44%
Riders of motorized2- and 3-wheelers 22%
Cyclists 11%
Pedestrians 17%
Drivers and passengersof heavy trucks 5%
Drivers and passengersof buses <1%
Other <1%
Source: Statistics Austria (online) Source: Statistics Austria (online)
0
2
4
6
8
10
2016201520142013201220112010200920082007
SAFER ROAD USERSNational speed limit law Yes
Max urban speed limit 50 km/h
Max rural speed limit 100 km/h
Max motorway speed limit 130 km/h
Local authorities can modify limits Yes
Self-reported enforcement —
Predominant type of enforcement Automated
National drink-driving law Yes
BAC limit – general population < 0.05 g/dl
BAC limit – young or novice drivers < 0.01 g/dl
Random breath testing carried out Yes
Testing carried out in case of fatal crash All drivers tested
Self-reported enforcement —
% road traffi c deaths involving alcohol 5% c
National motorcycle helmet law Yes
Applies to drivers and passengers Yes
Helmet fastening required No
Helmet standard referred to and/or specifi ed Yes
Children passengers on motorcycles Prohibited under 12 yrs d
Self-reported enforcement —
Helmet wearing rate 100% All riders e
National seat-belt law Yes
Applies to front and rear seat occupants Yes
Self-reported enforcement —
Seat-belt wearing rate 95% Front seats d , 93% Rear seats e
National child restraint law Yes
Children seated in front seat Allowed in a child restraint
Child restraint required Up to 14 yrs /150 cm
Child restraint standard referred to and/or specifi ed Yes
Self-reported enforcement —
% children using child restraints 97% Rear seats e
National law on mobile phone use while driving Yes
Ban on hand-held mobile phone use Yes
Ban on hands-free mobile phone use No
National drug-driving law Yes c 2016, Statistics Austria (online)d Or until footrests can be reachede 2016, IRTAD Road Safety Annual Report 2016
Trends in reported road traffi c deaths
Deat
hs p
er 1
00 0
00 p
opul
atio
n
© World Health Organization 2020. Some rights reserved. This work is available under the CC BY-NC-SA 3.0 IGO license.

62
Legi
slat
ive
revi
ew c
ondu
cted
by
WHO
. Veh
icle
saf
ety
data
from
UNE
CE W
P.29
. Oth
er d
ata
colle
cted
by
ques
tionn
aire
and
cle
ared
by
Min
istr
y of
Hea
lth.
INSTITUTIONAL FRAMEWORKLead agency State Road Police
Funded in national budget Yes
National road safety strategy No
Funding to implement strategy —
Fatality reduction target —
SAFER ROADS AND MOBILITY Audits or star rating required for new road
infrastructure
Partial
Design standards for the safety of pedestrians /
cyclists
Partial
Inspections / star rating of existing roads Yes
Investments to upgrade high risk locations No
Policies & investment in urban public transport Yes
SAFER VEHICLES Total registered vehicles for 2016 1 330 551
Cars and 4-wheeled light vehicles 1 136 983
Motorized 2- and 3-wheelers 3 290
Heavy trucks 141 525
Buses 30 958
Other 17 795
Vehicle standards applied (UNECE WP.29)
Frontal impact standard No
Electronic stability control No
Pedestrian protection No
Motorcycle anti-lock braking system No
POST-CRASH CARENational emergency care access number National, single number
Trauma registry National
Formal certifi cation for prehospital providers No
National assessment of emergency care systems No
DATAReported road traffi c fatalities (2016) 759 a ( 77 % M, 23 % F)
Reported rate per 100 000 population (2016) 7.8 a
WHO estimated road traffi c fatalities (2016) 845 b
WHO estimated rate per 100 000 population (2016) 8.7 b
a State Statistical Committee and State Road Police. Died within 7 days of crashb WHO’s method to obtain comparable country estimates: Group 1. Countries/areas with good death
registration data. See explanatory note 3 in Global status report on road safety 2018 for full details
Azerbaijan Population: 9 725 376 | Income group: Middle |
Gross national income per capita: US$ 4 760
Deaths by road user category
Drivers of 4-wheeledcars and lightvehicles 26%
Passengers of 4-wheeledcars and lightvehicles 25%
Riders of motorized2- and 3-wheelers <1%
Cyclists <1%
Pedestrians 42%
Drivers and passengersof heavy trucks 4%
Source: 2016, Internal statistical data of State Road Police Source: Azerbaijan national statistics (online)
0
3
6
9
12
15
2016201520142013201220112010200920082007
SAFER ROAD USERSNational speed limit law Yes
Max urban speed limit 60 km/h
Max rural speed limit 90km/h
Max motorway speed limit 110 km/h
Local authorities can modify limits No
Self-reported enforcement 0 1 2 3 4 5 6 7 8 9 10
Predominant type of enforcement Automated
National drink-driving law Yes c
BAC limit – general population —
BAC limit – young or novice drivers —
Random breath testing carried out Yes
Testing carried out in case of fatal crash All drivers tested
Self-reported enforcement 0 1 2 3 4 5 6 7 8 9 10
% road traffi c deaths involving alcohol 15% d
National motorcycle helmet law Yes
Applies to drivers and passengers Yes
Helmet fastening required No
Helmet standard referred to and/or specifi ed No
Children passengers on motorcycles Prohibited under 12 yrs
Self-reported enforcement 0 1 2 3 4 5 6 7 8 9 10
Helmet wearing rate —
National seat-belt law Yes
Applies to front and rear seat occupants No e
Self-reported enforcement 0 1 2 3 4 5 6 7 8 9 10
Seat-belt wearing rate 40% Front seats d , 20% Rear seats d
National child restraint law No e
Children seated in front seat Allowed in a child restraint f
Child restraint required —
Child restraint standard referred to and/or specifi ed —
Self-reported enforcement —
% children using child restraints —
National law on mobile phone use while driving Yes
Ban on hand-held mobile phone use Yes
Ban on hands-free mobile phone use No
National drug-driving law Yes c Law not based on BAC/BrACd 2016, Internal statistical data of State Road Policee The obligation to use seat belt does not apply in residential areas nor for children under 12 yearsf Child restraint systems are only required for children under 12 years seated in the front
Trends in reported road traffi c deaths
Deat
hs p
er 1
00 0
00 p
opul
atio
n
© World Health Organization 2020. Some rights reserved. This work is available under the CC BY-NC-SA 3.0 IGO license.
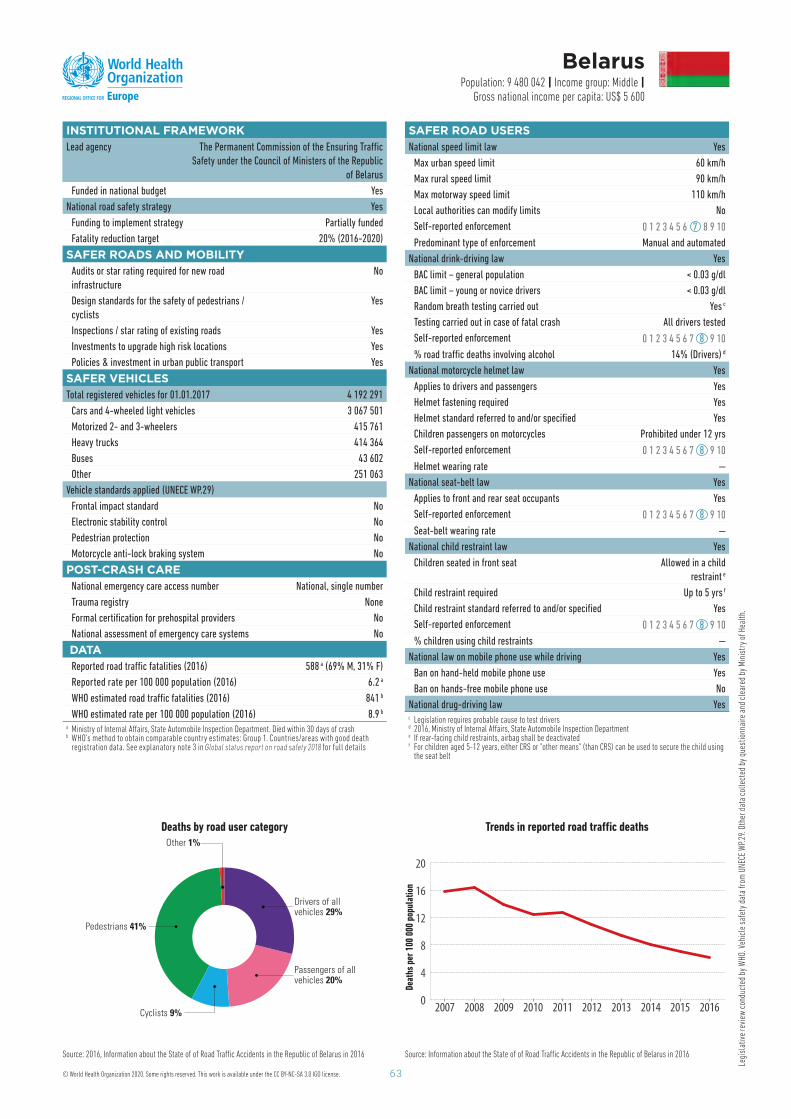
63
Legi
slat
ive
revi
ew c
ondu
cted
by
WHO
. Veh
icle
saf
ety
data
from
UNE
CE W
P.29
. Oth
er d
ata
colle
cted
by
ques
tionn
aire
and
cle
ared
by
Min
istr
y of
Hea
lth.
INSTITUTIONAL FRAMEWORKLead agency The Permanent Commission of the Ensuring Traffi c
Safety under the Council of Ministers of the Republic
of Belarus
Funded in national budget Yes
National road safety strategy Yes
Funding to implement strategy Partially funded
Fatality reduction target 20% (2016-2020)
SAFER ROADS AND MOBILITY Audits or star rating required for new road
infrastructure
No
Design standards for the safety of pedestrians /
cyclists
Yes
Inspections / star rating of existing roads Yes
Investments to upgrade high risk locations Yes
Policies & investment in urban public transport Yes
SAFER VEHICLES Total registered vehicles for 01.01.2017 4 192 291
Cars and 4-wheeled light vehicles 3 067 501
Motorized 2- and 3-wheelers 415 761
Heavy trucks 414 364
Buses 43 602
Other 251 063
Vehicle standards applied (UNECE WP.29)
Frontal impact standard No
Electronic stability control No
Pedestrian protection No
Motorcycle anti-lock braking system No
POST-CRASH CARENational emergency care access number National, single number
Trauma registry None
Formal certifi cation for prehospital providers No
National assessment of emergency care systems No
DATAReported road traffi c fatalities (2016) 588 a ( 69 % M, 31 % F)
Reported rate per 100 000 population (2016) 6.2 a
WHO estimated road traffi c fatalities (2016) 841 b
WHO estimated rate per 100 000 population (2016) 8.9 b
a Ministry of Internal Aff airs, State Automobile Inspection Department. Died within 30 days of crash b WHO’s method to obtain comparable country estimates: Group 1. Countries/areas with good death
registration data. See explanatory note 3 in Global status report on road safety 2018 for full details
Belarus Population: 9 480 042 | Income group: Middle |
Gross national income per capita: US$ 5 600
Deaths by road user category
Source: Information about the State of of Road Traffi c Accidents in the Republic of Belarus in 2016
0
4
8
12
16
20
2016201520142013201220112010200920082007
SAFER ROAD USERSNational speed limit law Yes
Max urban speed limit 60 km/h
Max rural speed limit 90 km/h
Max motorway speed limit 110 km/h
Local authorities can modify limits No
Self-reported enforcement 0 1 2 3 4 5 6 7 8 9 10
Predominant type of enforcement Manual and automated
National drink-driving law Yes
BAC limit – general population < 0.03 g/dl
BAC limit – young or novice drivers < 0.03 g/dl
Random breath testing carried out Yes c
Testing carried out in case of fatal crash All drivers tested
Self-reported enforcement 0 1 2 3 4 5 6 7 8 9 10
% road traffi c deaths involving alcohol 14% (Drivers ) d
National motorcycle helmet law Yes
Applies to drivers and passengers Yes
Helmet fastening required Yes
Helmet standard referred to and/or specifi ed Yes
Children passengers on motorcycles Prohibited under 12 yrs
Self-reported enforcement 0 1 2 3 4 5 6 7 8 9 10
Helmet wearing rate —
National seat-belt law Yes
Applies to front and rear seat occupants Yes
Self-reported enforcement 0 1 2 3 4 5 6 7 8 9 10
Seat-belt wearing rate —
National child restraint law Yes
Children seated in front seat Allowed in a child
restraint e
Child restraint required Up to 5 yrs f
Child restraint standard referred to and/or specifi ed Yes
Self-reported enforcement 0 1 2 3 4 5 6 7 8 9 10
% children using child restraints —
National law on mobile phone use while driving Yes
Ban on hand-held mobile phone use Yes
Ban on hands-free mobile phone use No
National drug-driving law Yes c Legislation requires probable cause to test driversd 2016, Ministry of Internal Aff airs, State Automobile Inspection Departmente If rear-facing child restraints, airbag shall be deactivatedf For children aged 5-12 years, either CRS or "other means" (than CRS) can be used to secure the child using
the seat belt
Drivers of allvehicles 29%
Passengers of allvehicles 20%
Cyclists 9%
Pedestrians 41%
Other 1%
Source: 2016, Information about the State of of Road Traffi c Accidents in the Republic of Belarus in 2016
Trends in reported road traffi c deaths
Deat
hs p
er 1
00 0
00 p
opul
atio
n
© World Health Organization 2020. Some rights reserved. This work is available under the CC BY-NC-SA 3.0 IGO license.
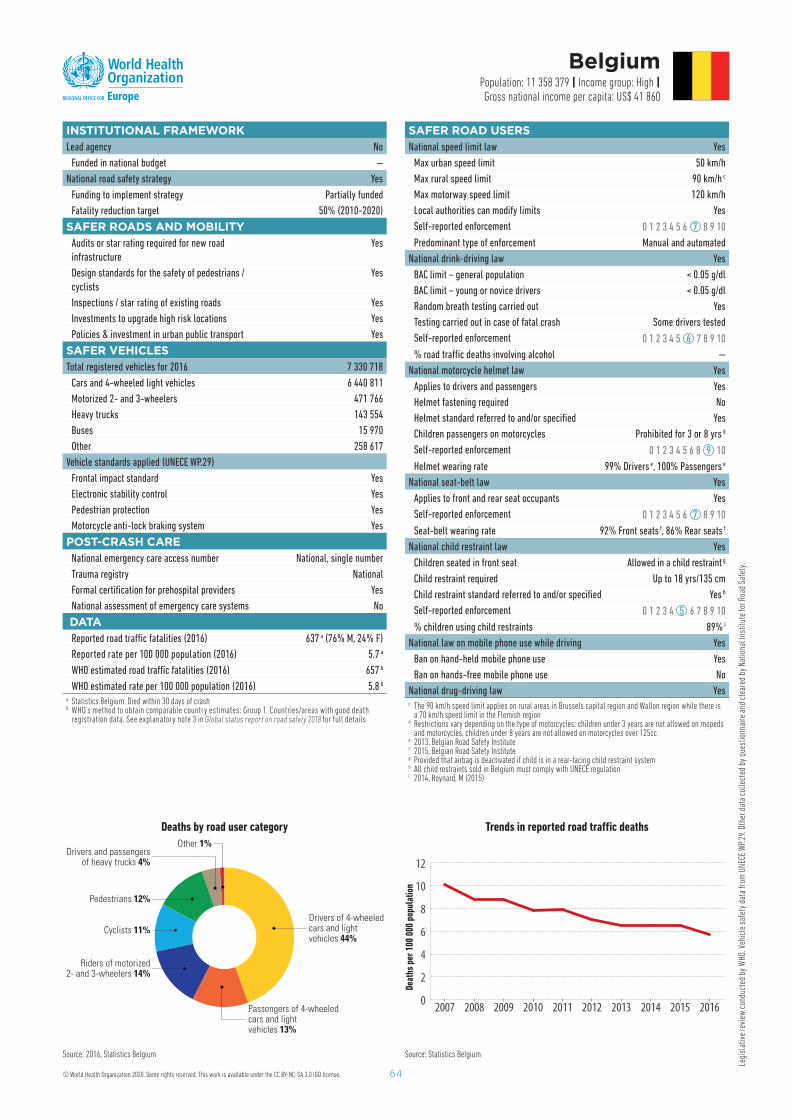
64
Legi
slat
ive
revi
ew c
ondu
cted
by
WHO
. Veh
icle
saf
ety
data
from
UNE
CE W
P.29
. Oth
er d
ata
colle
cted
by
ques
tionn
aire
and
cle
ared
by
Natio
nal I
nstit
ute
for R
oad
Safe
ty.
INSTITUTIONAL FRAMEWORKLead agency No
Funded in national budget —
National road safety strategy Yes
Funding to implement strategy Partially funded
Fatality reduction target 50% (2010-2020)
SAFER ROADS AND MOBILITY Audits or star rating required for new road
infrastructure
Yes
Design standards for the safety of pedestrians /
cyclists
Yes
Inspections / star rating of existing roads Yes
Investments to upgrade high risk locations Yes
Policies & investment in urban public transport Yes
SAFER VEHICLES Total registered vehicles for 2016 7 330 718
Cars and 4-wheeled light vehicles 6 440 811
Motorized 2- and 3-wheelers 471 766
Heavy trucks 143 554
Buses 15 970
Other 258 617
Vehicle standards applied (UNECE WP.29)
Frontal impact standard Yes
Electronic stability control Yes
Pedestrian protection Yes
Motorcycle anti-lock braking system Yes
POST-CRASH CARENational emergency care access number National, single number
Trauma registry National
Formal certifi cation for prehospital providers Yes
National assessment of emergency care systems No
DATAReported road traffi c fatalities (2016) 637 a ( 76 % M, 24 % F)
Reported rate per 100 000 population (2016) 5.7 a
WHO estimated road traffi c fatalities (2016) 657 b
WHO estimated rate per 100 000 population (2016) 5.8 b
a Statistics Belgium. Died within 30 days of crash b WHO’s method to obtain comparable country estimates: Group 1. Countries/areas with good death
registration data. See explanatory note 3 in Global status report on road safety 2018 for full details
Belgium Population: 11 358 379 | Income group: High |Gross national income per capita: US$ 41 860
Deaths by road user category
Drivers of 4-wheeledcars and lightvehicles 44%
Passengers of 4-wheeledcars and lightvehicles 13%
Cyclists 11%
Pedestrians 12%
Drivers and passengersof heavy trucks 4%
Other 1%
Riders of motorized2- and 3-wheelers 14%
Source: 2016, Statistics Belgium Source: Statistics Belgium
0
2
4
6
8
10
12
2016201520142013201220112010200920082007
SAFER ROAD USERSNational speed limit law Yes
Max urban speed limit 50 km/h
Max rural speed limit 90 km/h c
Max motorway speed limit 120 km/h
Local authorities can modify limits Yes
Self-reported enforcement 0 1 2 3 4 5 6 7 8 9 10
Predominant type of enforcement Manual and automated
National drink-driving law Yes
BAC limit – general population < 0.05 g/dl
BAC limit – young or novice drivers < 0.05 g/dl
Random breath testing carried out Yes
Testing carried out in case of fatal crash Some drivers tested
Self-reported enforcement 0 1 2 3 4 5 6 7 8 9 10
% road traffi c deaths involving alcohol —
National motorcycle helmet law Yes
Applies to drivers and passengers Yes
Helmet fastening required No
Helmet standard referred to and/or specifi ed Yes
Children passengers on motorcycles Prohibited for 3 or 8 yrs d
Self-reported enforcement 0 1 2 3 4 5 6 8 9 10
Helmet wearing rate 99% Drivers e , 100% Passengers e
National seat-belt law Yes
Applies to front and rear seat occupants Yes
Self-reported enforcement 0 1 2 3 4 5 6 7 8 9 10
Seat-belt wearing rate 92% Front seats f , 86% Rear seats f
National child restraint law Yes
Children seated in front seat Allowed in a child restraint g
Child restraint required Up to 18 yrs /135 cm
Child restraint standard referred to and/or specifi ed Yes h
Self-reported enforcement 0 1 2 3 4 5 6 7 8 9 10
% children using child restraints 89% i
National law on mobile phone use while driving Yes
Ban on hand-held mobile phone use Yes
Ban on hands-free mobile phone use No
National drug-driving law Yes c The 90 km/h speed limit applies on rural areas in Brussels capital region and Wallon region while there is
a 70 km/h speed limit in the Flemish regiond Restrictions vary depending on the type of motorcycles: children under 3 years are not allowed on mopeds
and motorcycles, children under 8 years are not allowed on motorcycles over 125cce 2013, Belgian Road Safety Institutef 2015, Belgian Road Safety Instituteg Provided that airbag is deactivated if child is in a rear-facing child restraint systemh All child restraints sold in Belgium must comply with UNECE regulationi 2014, Roynard, M (2015)
Trends in reported road traffi c deaths
Deat
hs p
er 1
00 0
00 p
opul
atio
n
© World Health Organization 2020. Some rights reserved. This work is available under the CC BY-NC-SA 3.0 IGO license.
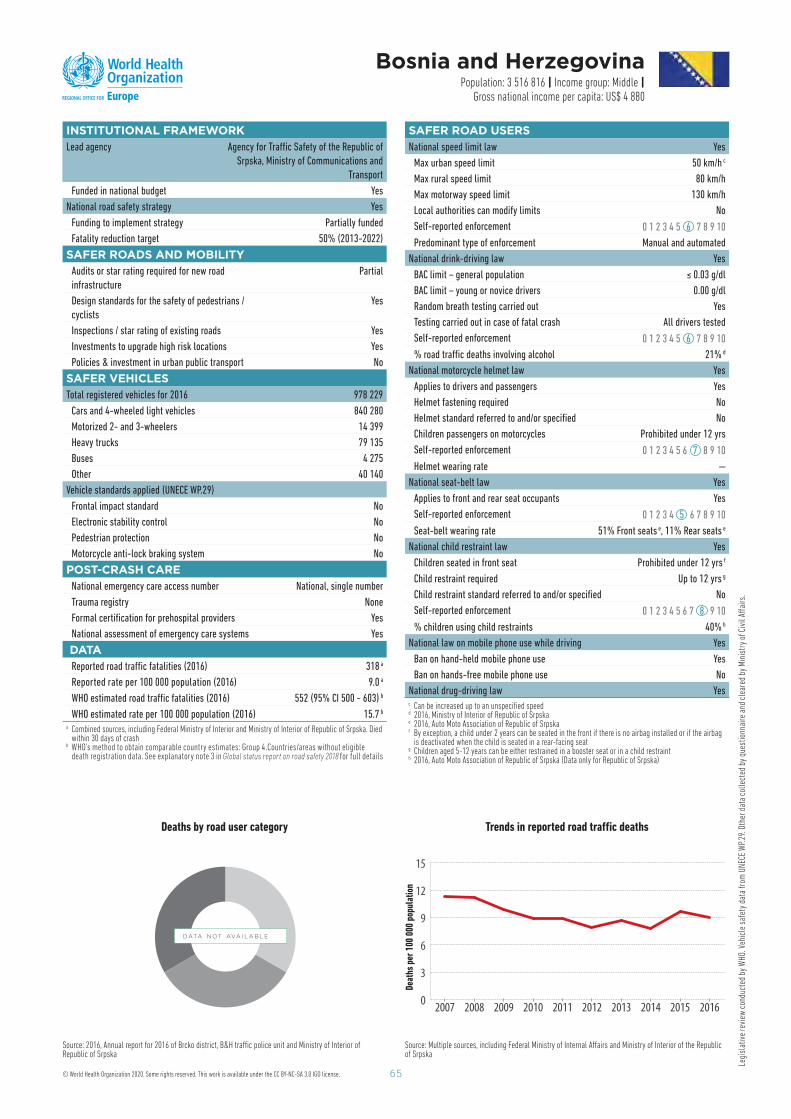
65
Legi
slat
ive
revi
ew c
ondu
cted
by
WHO
. Veh
icle
saf
ety
data
from
UNE
CE W
P.29
. Oth
er d
ata
colle
cted
by
ques
tionn
aire
and
cle
ared
by
Min
istr
y of
Civ
il Aff
airs
.
INSTITUTIONAL FRAMEWORKLead agency Agency for Traffi c Safety of the Republic of
Srpska, Ministry of Communications and
Transport
Funded in national budget Yes
National road safety strategy Yes
Funding to implement strategy Partially funded
Fatality reduction target 50% (2013-2022)
SAFER ROADS AND MOBILITY Audits or star rating required for new road
infrastructure
Partial
Design standards for the safety of pedestrians /
cyclists
Yes
Inspections / star rating of existing roads Yes
Investments to upgrade high risk locations Yes
Policies & investment in urban public transport No
SAFER VEHICLES Total registered vehicles for 2016 978 229
Cars and 4-wheeled light vehicles 840 280
Motorized 2- and 3-wheelers 14 399
Heavy trucks 79 135
Buses 4 275
Other 40 140
Vehicle standards applied (UNECE WP.29)
Frontal impact standard No
Electronic stability control No
Pedestrian protection No
Motorcycle anti-lock braking system No
POST-CRASH CARENational emergency care access number National, single number
Trauma registry None
Formal certifi cation for prehospital providers Yes
National assessment of emergency care systems Yes
DATAReported road traffi c fatalities (2016) 318 a
Reported rate per 100 000 population (2016) 9.0 a
WHO estimated road traffi c fatalities (2016) 552 (95% CI 500 - 603 ) b
WHO estimated rate per 100 000 population (2016) 15.7 b
a Combined sources, including Federal Ministry of Interior and Ministry of Interior of Republic of Srpska. Died within 30 days of crash
b WHO’s method to obtain comparable country estimates: Group 4.Countries/areas without eligible death registration data. See explanatory note 3 in Global status report on road safety 2018 for full details
Bosnia and Herzegovina Population: 3 516 816 | Income group: Middle |
Gross national income per capita: US$ 4 880
Deaths by road user category
Source: Multiple sources, including Federal Ministry of Internal Aff airs and Ministry of Interior of the Republic of Srpska
0
3
6
9
12
15
2016201520142013201220112010200920082007
SAFER ROAD USERSNational speed limit law Yes
Max urban speed limit 50 km/h c
Max rural speed limit 80 km/h
Max motorway speed limit 130 km/h
Local authorities can modify limits No
Self-reported enforcement 0 1 2 3 4 5 6 7 8 9 10
Predominant type of enforcement Manual and automated
National drink-driving law Yes
BAC limit – general population ≤ 0.03 g/dl
BAC limit – young or novice drivers 0.00 g/dl
Random breath testing carried out Yes
Testing carried out in case of fatal crash All drivers tested
Self-reported enforcement 0 1 2 3 4 5 6 7 8 9 10
% road traffi c deaths involving alcohol 21% d
National motorcycle helmet law Yes
Applies to drivers and passengers Yes
Helmet fastening required No
Helmet standard referred to and/or specifi ed No
Children passengers on motorcycles Prohibited under 12 yrs
Self-reported enforcement 0 1 2 3 4 5 6 7 8 9 10
Helmet wearing rate —
National seat-belt law Yes
Applies to front and rear seat occupants Yes
Self-reported enforcement 0 1 2 3 4 5 6 7 8 9 10
Seat-belt wearing rate 51% Front seats e , 11% Rear seats e
National child restraint law Yes
Children seated in front seat Prohibited under 12 yrs f
Child restraint required Up to 12 yrs g
Child restraint standard referred to and/or specifi ed No
Self-reported enforcement 0 1 2 3 4 5 6 7 8 9 10
% children using child restraints 40% h
National law on mobile phone use while driving Yes
Ban on hand-held mobile phone use Yes
Ban on hands-free mobile phone use No
National drug-driving law Yes c Can be increased up to an unspecifi ed speedd 2016, Ministry of Interior of Republic of Srpskae 2016, Auto Moto Association of Republic of Srpskaf By exception, a child under 2 years can be seated in the front if there is no airbag installed or if the airbag
is deactivated when the child is seated in a rear-facing seat g Children aged 5-12 years can be either restrained in a booster seat or in a child restrainth 2016, Auto Moto Association of Republic of Srpska (Data only for Republic of Srpska)
Source: 2016, Annual report for 2016 of Brcko district, B&H traffi c police unit and Ministry of Interior of Republic of Srpska
Trends in reported road traffi c deaths
Deat
hs p
er 1
00 0
00 p
opul
atio
n
DATA N OT AVA I L A B L E
© World Health Organization 2020. Some rights reserved. This work is available under the CC BY-NC-SA 3.0 IGO license.
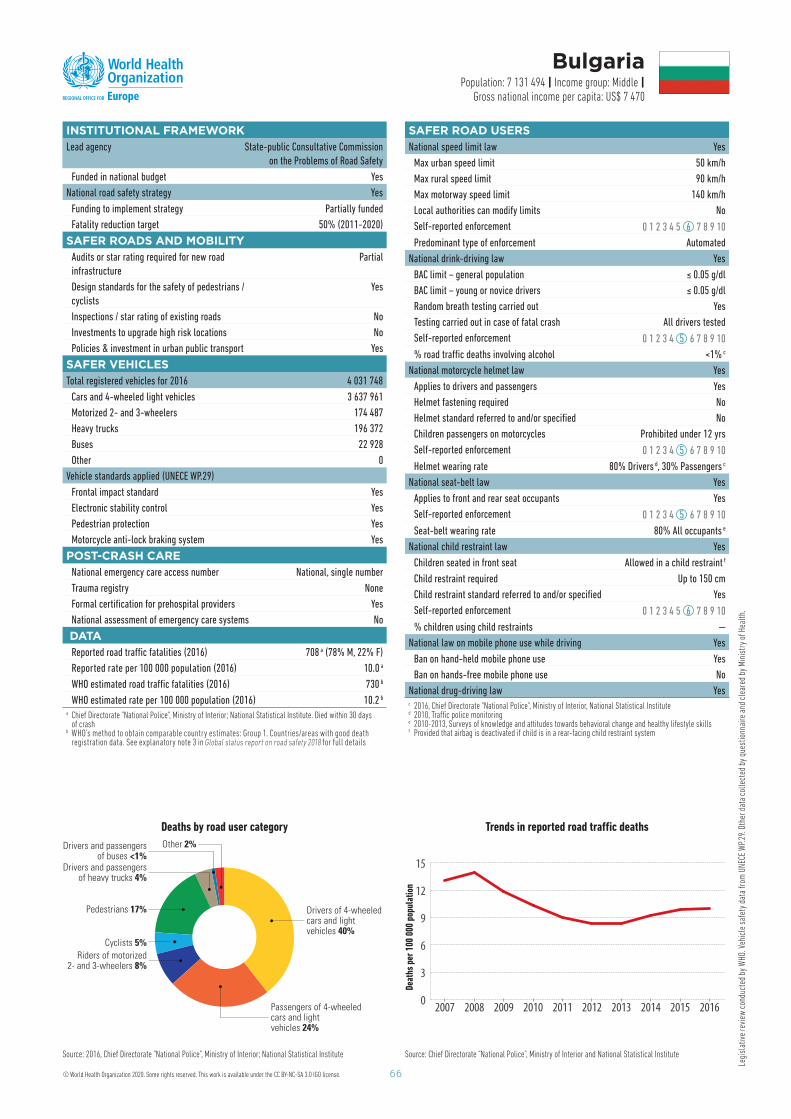
66
Legi
slat
ive
revi
ew c
ondu
cted
by
WHO
. Veh
icle
saf
ety
data
from
UNE
CE W
P.29
. Oth
er d
ata
colle
cted
by
ques
tionn
aire
and
cle
ared
by
Min
istr
y of
Hea
lth.
INSTITUTIONAL FRAMEWORKLead agency State-public Consultative Commission
on the Problems of Road Safety
Funded in national budget Yes
National road safety strategy Yes
Funding to implement strategy Partially funded
Fatality reduction target 50% (2011-2020)
SAFER ROADS AND MOBILITY Audits or star rating required for new road
infrastructure
Partial
Design standards for the safety of pedestrians /
cyclists
Yes
Inspections / star rating of existing roads No
Investments to upgrade high risk locations No
Policies & investment in urban public transport Yes
SAFER VEHICLES Total registered vehicles for 2016 4 031 748
Cars and 4-wheeled light vehicles 3 637 961
Motorized 2- and 3-wheelers 174 487
Heavy trucks 196 372
Buses 22 928
Other 0
Vehicle standards applied (UNECE WP.29)
Frontal impact standard Yes
Electronic stability control Yes
Pedestrian protection Yes
Motorcycle anti-lock braking system Yes
POST-CRASH CARENational emergency care access number National, single number
Trauma registry None
Formal certifi cation for prehospital providers Yes
National assessment of emergency care systems No
DATAReported road traffi c fatalities (2016) 708 a ( 78 % M, 22 % F)
Reported rate per 100 000 population (2016) 10.0 a
WHO estimated road traffi c fatalities (2016) 730 b
WHO estimated rate per 100 000 population (2016) 10.2 b
a Chief Directorate "National Police", Ministry of Interior; National Statistical Institute. Died within 30 days of crash
b WHO’s method to obtain comparable country estimates: Group 1. Countries/areas with good death registration data. See explanatory note 3 in Global status report on road safety 2018 for full details
Bulgaria Population: 7 131 494 | Income group: Middle |
Gross national income per capita: US$ 7 470
Deaths by road user category
Drivers of 4-wheeledcars and lightvehicles 40%
Passengers of 4-wheeledcars and lightvehicles 24%
Cyclists 5%
Pedestrians 17%
Drivers and passengersof heavy trucks 4%
Drivers and passengersof buses <1%
Other 2%
Riders of motorized2- and 3-wheelers 8%
Source: 2016, Chief Directorate "National Police", Ministry of Interior; National Statistical Institute Source: Chief Directorate "National Police", Ministry of Interior and National Statistical Institute
0
3
6
9
12
15
2016201520142013201220112010200920082007
SAFER ROAD USERSNational speed limit law Yes
Max urban speed limit 50 km/h
Max rural speed limit 90 km/h
Max motorway speed limit 140 km/h
Local authorities can modify limits No
Self-reported enforcement 0 1 2 3 4 5 6 7 8 9 10
Predominant type of enforcement Automated
National drink-driving law Yes
BAC limit – general population ≤ 0.05 g/dl
BAC limit – young or novice drivers ≤ 0.05 g/dl
Random breath testing carried out Yes
Testing carried out in case of fatal crash All drivers tested
Self-reported enforcement 0 1 2 3 4 5 6 7 8 9 10
% road traffi c deaths involving alcohol <1% c
National motorcycle helmet law Yes
Applies to drivers and passengers Yes
Helmet fastening required No
Helmet standard referred to and/or specifi ed No
Children passengers on motorcycles Prohibited under 12 yrs
Self-reported enforcement 0 1 2 3 4 5 6 7 8 9 10
Helmet wearing rate 80% Drivers d , 30% Passengers c
National seat-belt law Yes
Applies to front and rear seat occupants Yes
Self-reported enforcement 0 1 2 3 4 5 6 7 8 9 10
Seat-belt wearing rate 80% All occupants e
National child restraint law Yes
Children seated in front seat Allowed in a child restraint f
Child restraint required U p to 150 cm
Child restraint standard referred to and/or specifi ed Yes
Self-reported enforcement 0 1 2 3 4 5 6 7 8 9 10
% children using child restraints —
National law on mobile phone use while driving Yes
Ban on hand-held mobile phone use Yes
Ban on hands-free mobile phone use No
National drug-driving law Yes c 2016, Chief Directorate "National Police", Ministry of Interior, National Statistical Instituted 2010, Traffi c police monitoringe 2010-2013, Surveys of knowledge and attitudes towards behavioral change and healthy lifestyle skillsf Provided that airbag is deactivated if child is in a rear-facing child restraint system
Trends in reported road traffi c deaths
Deat
hs p
er 1
00 0
00 p
opul
atio
n
© World Health Organization 2020. Some rights reserved. This work is available under the CC BY-NC-SA 3.0 IGO license.

67
Legi
slat
ive
revi
ew c
ondu
cted
by
WHO
. Veh
icle
saf
ety
data
from
UNE
CE W
P.29
. Oth
er d
ata
colle
cted
by
ques
tionn
aire
and
cle
ared
by
Min
istr
y of
Hea
lth.
INSTITUTIONAL FRAMEWORKLead agency No
Funded in national budget —
National road safety strategy Yes
Funding to implement strategy Fully funded
Fatality reduction target 50% (2011-2020)
SAFER ROADS AND MOBILITY Audits or star rating required for new road
infrastructure
Partial
Design standards for the safety of pedestrians /
cyclists
Yes
Inspections / star rating of existing roads Yes
Investments to upgrade high risk locations Yes
Policies & investment in urban public transport Yes
SAFER VEHICLES Total registered vehicles for 2016 1 996 056
Cars and 4-wheeled light vehicles 1 551 819
Motorized 2- and 3-wheelers 150 478
Heavy trucks 159 542
Buses 5 514
Other 128 703
Vehicle standards applied (UNECE WP.29)
Frontal impact standard Yes
Electronic stability control Yes
Pedestrian protection Yes
Motorcycle anti-lock braking system Yes
POST-CRASH CARENational emergency care access number National, single number
Trauma registry None
Formal certifi cation for prehospital providers Yes
National assessment of emergency care systems No
DATAReported road traffi c fatalities (2016) 307 a ( 79 % M, 21 % F)
Reported rate per 100 000 population (2016) 7.3 a
WHO estimated road traffi c fatalities (2016) 340 b
WHO estimated rate per 100 000 population (2016) 8.1 b
a Ministry of Interior. Died within 30 days of crashb WHO’s method to obtain comparable country estimates: Group 1. Countries/areas with good death
registration data. See explanatory note 3 in Global status report on road safety 2018 for full details
Croatia Population: 4 213 265 | Income group: Middle |
Gross national income per capita: US$ 12 110
Deaths by road user category
Source: Ministry of Interior
0
4
8
12
16
20
2016201520142013201220112010200920082007
SAFER ROAD USERSNational speed limit law Yes
Max urban speed limit 50 km/h c
Max rural speed limit 90 km/h
Max motorway speed limit 130 km/h
Local authorities can modify limits Yes
Self-reported enforcement 0 1 2 3 4 5 6 7 8 9 10
Predominant type of enforcement Manual and automated
National drink-driving law Yes
BAC limit – general population ≤ 0.05 g/dl
BAC limit – young or novice drivers 0.00 g/dl
Random breath testing carried out Yes
Testing carried out in case of fatal crash Some drivers tested
Self-reported enforcement 0 1 2 3 4 5 6 7 8 9 10
% road traffi c deaths involving alcohol 24% d
National motorcycle helmet law Yes
Applies to drivers and passengers Yes
Helmet fastening required Yes
Helmet standard referred to and/or specifi ed Yes
Children passengers on motorcycles Prohibited under 12 yrs
Self-reported enforcement 0 1 2 3 4 5 6 7 8 9 10
Helmet wearing rate 95% Drivers e , 95% Passengers e
National seat-belt law Yes
Applies to front and rear seat occupants Yes
Self-reported enforcement 0 1 2 3 4 5 6 7 8 9 10
Seat-belt wearing rate 62% Front seats e , 14% Rear seats e
National child restraint law Yes
Children seated in front seat Prohibited under 150 cm
Child restraint required Up to 135/150 cm f
Child restraint standard referred to and/or specifi ed No
Self-reported enforcement 0 1 2 3 4 5 6 7 8 9 10
% children using child restraints —
National law on mobile phone use while driving Yes
Ban on hand-held mobile phone use Yes
Ban on hands-free mobile phone use No
National drug-driving law Yes c Can be increased up to 80 km/hd 2016, Ministry of Interiore 2015, Faculty of Transort and Traffi c Sciences, University of Zagrebf A child of height 135-150 cm can be restrained with an adult seat belt only provided that this child sits in
the rear of the car
Source: 2016, Ministry of Interior
Drivers of 4-wheeledcars and lightvehicles 35%
Passengers of 4-wheeledcars and lightvehicles 14%
Cyclists 9%
Pedestrians 22%
Riders of motorized2- and 3-wheelers 16%
Drivers and passengersof buses <1%
Other 2%
Drivers and passengersof heavy trucks 3%
Trends in reported road traffi c deaths
Deat
hs p
er 1
00 0
00 p
opul
atio
n
© World Health Organization 2020. Some rights reserved. This work is available under the CC BY-NC-SA 3.0 IGO license.
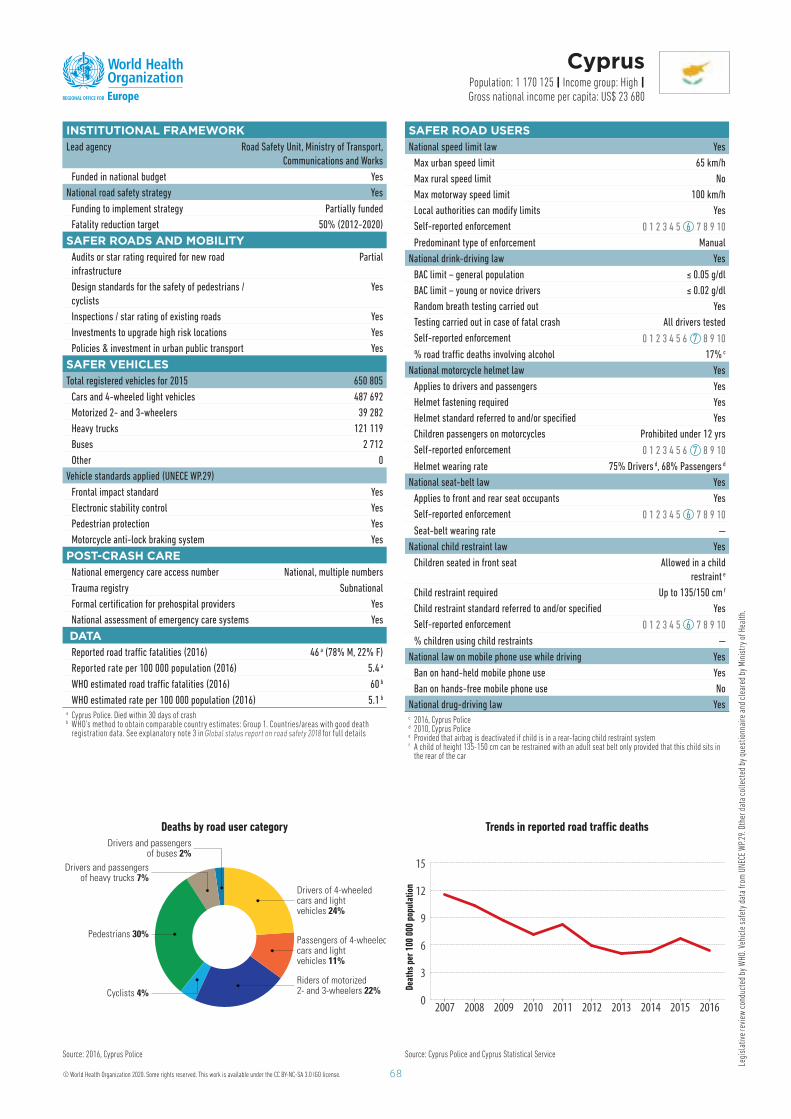
68
Legi
slat
ive
revi
ew c
ondu
cted
by
WHO
. Veh
icle
saf
ety
data
from
UNE
CE W
P.29
. Oth
er d
ata
colle
cted
by
ques
tionn
aire
and
cle
ared
by
Min
istr
y of
Hea
lth.
INSTITUTIONAL FRAMEWORK Lead agency Road Safety Unit, Ministry of Transport,
Communications and Works
Funded in national budget Yes
National road safety strategy Yes
Funding to implement strategy Partially funded
Fatality reduction target 50% (2012-2020)
SAFER ROADS AND MOBILITY Audits or star rating required for new road
infrastructure
Partial
Design standards for the safety of pedestrians /
cyclists
Yes
Inspections / star rating of existing roads Yes
Investments to upgrade high risk locations Yes
Policies & investment in urban public transport Yes
SAFER VEHICLES Total registered vehicles for 2015 650 805
Cars and 4-wheeled light vehicles 487 692
Motorized 2- and 3-wheelers 39 282
Heavy trucks 121 119
Buses 2 712
Other 0
Vehicle standards applied (UNECE WP.29)
Frontal impact standard Yes
Electronic stability control Yes
Pedestrian protection Yes
Motorcycle anti-lock braking system Yes
POST-CRASH CARENational emergency care access number National, multiple numbers
Trauma registry Subnational
Formal certifi cation for prehospital providers Yes
National assessment of emergency care systems Yes
DATAReported road traffi c fatalities (2016) 46 a ( 78 % M, 22 % F)
Reported rate per 100 000 population (2016) 5.4 a
WHO estimated road traffi c fatalities (2016) 60 b
WHO estimated rate per 100 000 population (2016) 5.1 b a Cyprus Police. Died within 30 days of crash b WHO’s method to obtain comparable country estimates: Group 1. Countries/areas with good death
registration data. See explanatory note 3 in Global status report on road safety 2018 for full details
Cyprus Population: 1 170 125 | Income group: High | Gross national income per capita: US$ 23 680
Deaths by road user category
Drivers of 4-wheeledcars and lightvehicles 24%
Passengers of 4-wheeledcars and lightvehicles 11%
Riders of motorized2- and 3-wheelers 22%Cyclists 4%
Pedestrians 30%
Drivers and passengersof heavy trucks 7%
Drivers and passengersof buses 2%
Source: 2016, Cyprus Police Source: Cyprus Police and Cyprus Statistical Service
0
3
6
9
12
15
2016201520142013201220112010200920082007
SAFER ROAD USERS National speed limit law Yes
Max urban speed limit 65 km/h
Max rural speed limit No
Max motorway speed limit 100 km/h
Local authorities can modify limits Yes
Self-reported enforcement 0 1 2 3 4 5 6 7 8 9 10
Predominant type of enforcement Manual
National drink-driving law Yes
BAC limit – general population ≤ 0.05 g/dl
BAC limit – young or novice drivers ≤ 0.02 g/dl
Random breath testing carried out Yes
Testing carried out in case of fatal crash All drivers tested
Self-reported enforcement 0 1 2 3 4 5 6 7 8 9 10
% road traffi c deaths involving alcohol 17% c
National motorcycle helmet law Yes
Applies to drivers and passengers Yes
Helmet fastening required Yes
Helmet standard referred to and/or specifi ed Yes
Children passengers on motorcycles Prohibited under 12 yrs
Self-reported enforcement 0 1 2 3 4 5 6 7 8 9 10
Helmet wearing rate 75% Drivers d , 68% Passengers d
National seat-belt law Yes
Applies to front and rear seat occupants Yes
Self-reported enforcement 0 1 2 3 4 5 6 7 8 9 10
Seat-belt wearing rate —
National child restraint law Yes
Children seated in front seat Allowed in a child
restraint e
Child restraint required Up to 135/150 cm f
Child restraint standard referred to and/or specifi ed Yes
Self-reported enforcement 0 1 2 3 4 5 6 7 8 9 10
% children using child restraints —
National law on mobile phone use while driving Yes
Ban on hand-held mobile phone use Yes
Ban on hands-free mobile phone use No
National drug-driving law Yes
c 2016, Cyprus Policed 2010, Cyprus Policee Provided that airbag is deactivated if child is in a rear-facing child restraint systemf A child of height 135-150 cm can be restrained with an adult seat belt only provided that this child sits in
the rear of the car
Trends in reported road traffi c deaths
Deat
hs p
er 1
00 0
00 p
opul
atio
n
© World Health Organization 2020. Some rights reserved. This work is available under the CC BY-NC-SA 3.0 IGO license.

69
Legi
slat
ive
revi
ew c
ondu
cted
by
WHO
. Veh
icle
saf
ety
data
from
UNE
CE W
P.29
. Oth
er d
ata
colle
cted
by
ques
tionn
aire
and
cle
ared
by
Min
istr
y of
Hea
lth.
INSTITUTIONAL FRAMEWORKLead agency The Council of the Government of
the Czech Republic for Road Safety
Funded in national budget Yes
National road safety strategy Yes
Funding to implement strategy Partially funded
Fatality reduction target 60% (2011-2020)
SAFER ROADS AND MOBILITY Audits or star rating required for new road
infrastructure
Partial
Design standards for the safety of pedestrians /
cyclists
Yes
Inspections / star rating of existing roads Yes
Investments to upgrade high risk locations No
Policies & investment in urban public transport Yes
SAFER VEHICLES Total registered vehicles for 2015 7 325 789
Cars and 4-wheeled light vehicles 5 115 316
Motorized 2- and 3-wheelers 1 046 467
Heavy trucks 646 792
Buses 19 950
Other 497 264
Vehicle standards applied (UNECE WP.29)
Frontal impact standard Yes
Electronic stability control Yes
Pedestrian protection Yes
Motorcycle anti-lock braking system Yes
POST-CRASH CARENational emergency care access number National, single number
Trauma registry National
Formal certifi cation for prehospital providers Yes
National assessment of emergency care systems Yes
DATAReported road traffi c fatalities (2016) 611 a ( 76 % M, 24 % F)
Reported rate per 100 000 population (2016) 5.9 a
WHO estimated road traffi c fatalities (2016) 630 b
WHO estimated rate per 100 000 population (2016) 5.9 b
a Ranking EU Progress on Road Safety. Died within 30 days of crash b WHO’s method to obtain comparable country estimates: Group 1. Countries/areas with good death
registration data. See explanatory note 3 in Global status report on road safety 2018 for full details
Czechia Population: 10 610 947 | Income group: High |Gross national income per capita: US$ 17 570
Deaths by road user category
Drivers of 4-wheeledcars and lightvehicles 37%
Passengers of 4-wheeledcars and lightvehicles 17%
Cyclists 9%
Pedestrians 21%
Drivers and passengersof heavy trucks 6%
Drivers and passengersof buses <1%
Riders of motorized2- and 3-wheelers 10%
Source: 2016, Directorate of Traffi c Police Service, Traffi c accident statistics Source: Directorate of Traffi c Police Service, Traffi c accident statistics
0
3
6
9
12
15
2016201520142013201220112010200920082007
SAFER ROAD USERSNational speed limit law Yes
Max urban speed limit 50 km/h c
Max rural speed limit 90 km/h
Max motorway speed limit 130 km/h
Local authorities can modify limits Yes
Self-reported enforcement 0 1 2 3 4 5 6 7 8 9 10
Predominant type of enforcement Manual
National drink-driving law Yes
BAC limit – general population ≤ 0.03 g/dl
BAC limit – young or novice drivers ≤ 0.03 g/dl
Random breath testing carried out Yes
Testing carried out in case of fatal crash All drivers tested
Self-reported enforcement 0 1 2 3 4 5 6 7 8 9 10
% road traffi c deaths involving alcohol 10% d
National motorcycle helmet law Yes
Applies to drivers and passengers Yes
Helmet fastening required Yes
Helmet standard referred to and/or specifi ed Yes
Children passengers on motorcycles Prohibited under 12 yrs
Self-reported enforcement 0 1 2 3 4 5 6 7 8 9 10
Helmet wearing rate —
National seat-belt law Yes
Applies to front and rear seat occupants Yes
Self-reported enforcement 0 1 2 3 4 5 6 7 8 9 10
Seat-belt wearing rate 98% Front seats e , 72% Rear seats e
National child restraint law Yes
Children seated in front seat Allowed in a child restraint f
Child restraint required Up to 36 kg /150 cm
Child restraint standard referred to and/or specifi ed Yes
Self-reported enforcement 0 1 2 3 4 5 6 7 8 9 10
% children using child restraints —
National law on mobile phone use while driving Yes
Ban on hand-held mobile phone use Yes
Ban on hands-free mobile phone use No
National drug-driving law Yes c Can be increased up to 80 km/hd 2016, Directorate of Traffi c Police Service, Traffi c accident statisticse 2016, Center for Transport Research, Public Research Institutef Provided that airbag is deactivated if child is in a rear-facing child restraint system
Trends in reported road traffi c deaths
Deat
hs p
er 1
00 0
00 p
opul
atio
n
© World Health Organization 2020. Some rights reserved. This work is available under the CC BY-NC-SA 3.0 IGO license.
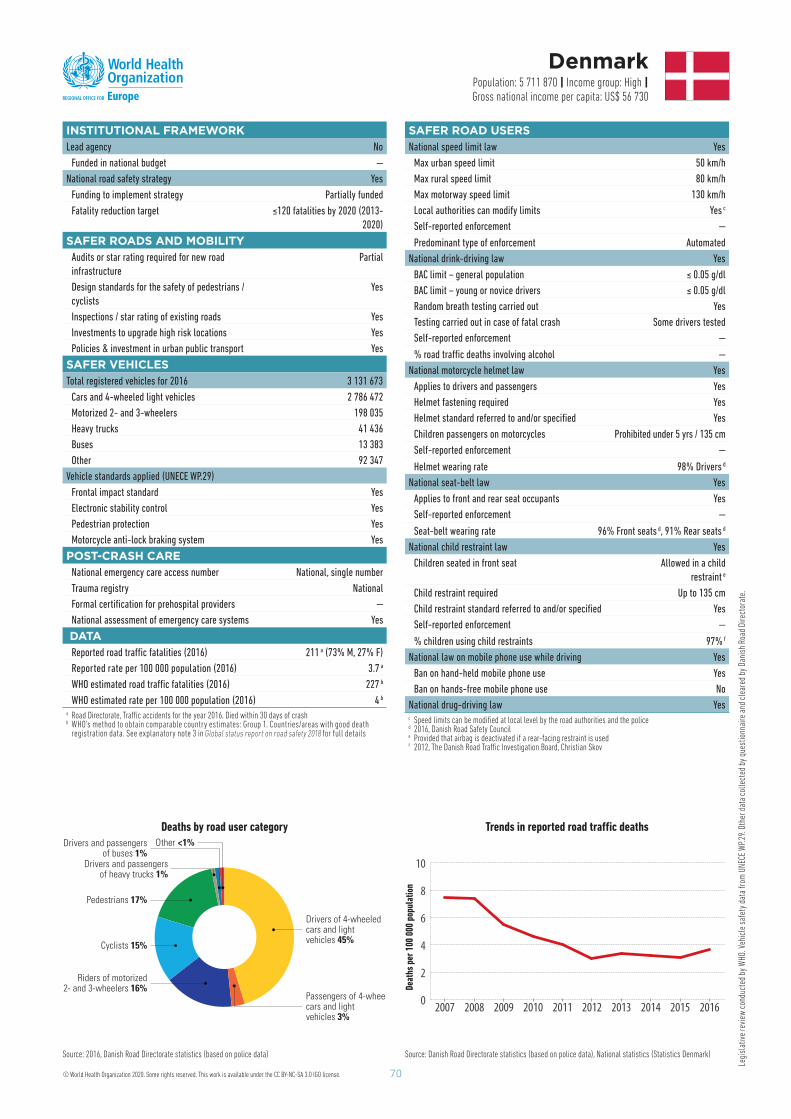
70
Legi
slat
ive
revi
ew c
ondu
cted
by
WHO
. Veh
icle
saf
ety
data
from
UNE
CE W
P.29
. Oth
er d
ata
colle
cted
by
ques
tionn
aire
and
cle
ared
by
Dani
sh R
oad
Dire
ctor
ate.
INSTITUTIONAL FRAMEWORKLead agency No
Funded in national budget —
National road safety strategy Yes
Funding to implement strategy Partially funded
Fatality reduction target ≤120 fatalities by 2020 (2013-
2020)
SAFER ROADS AND MOBILITY Audits or star rating required for new road
infrastructure
Partial
Design standards for the safety of pedestrians /
cyclists
Yes
Inspections / star rating of existing roads Yes
Investments to upgrade high risk locations Yes
Policies & investment in urban public transport Yes
SAFER VEHICLES Total registered vehicles for 2016 3 131 673
Cars and 4-wheeled light vehicles 2 786 472
Motorized 2- and 3-wheelers 198 035
Heavy trucks 41 436
Buses 13 383
Other 92 347
Vehicle standards applied (UNECE WP.29)
Frontal impact standard Yes
Electronic stability control Yes
Pedestrian protection Yes
Motorcycle anti-lock braking system Yes
POST-CRASH CARENational emergency care access number National, single number
Trauma registry National
Formal certifi cation for prehospital providers —
National assessment of emergency care systems Yes
DATAReported road traffi c fatalities (2016) 211 a ( 73 % M, 27 % F)
Reported rate per 100 000 population (2016) 3.7 a
WHO estimated road traffi c fatalities (2016) 227 b
WHO estimated rate per 100 000 population (2016) 4 b
a Road Directorate, Traffi c accidents for the year 2016. Died within 30 days of crash b WHO’s method to obtain comparable country estimates: Group 1. Countries/areas with good death
registration data. See explanatory note 3 in Global status report on road safety 2018 for full details
Denmark Population: 5 711 870 | Income group: High |Gross national income per capita: US$ 56 730
Deaths by road user category
Drivers of 4-wheeledcars and lightvehicles 45%
Passengers of 4-wheelcars and lightvehicles 3%
Cyclists 15%
Pedestrians 17%
Riders of motorized2- and 3-wheelers 16%
Drivers and passengersof buses 1%
Other <1%
Drivers and passengersof heavy trucks 1%
Source: 2016, Danish Road Directorate statistics (based on police data) Source: Danish Road Directorate statistics (based on police data), National statistics (Statistics Denmark)
0
2
4
6
8
10
2016201520142013201220112010200920082007
SAFER ROAD USERSNational speed limit law Yes
Max urban speed limit 50 km/h
Max rural speed limit 80 km/h
Max motorway speed limit 130 km/h
Local authorities can modify limits Yes c
Self-reported enforcement —
Predominant type of enforcement Automated
National drink-driving law Yes
BAC limit – general population ≤ 0.05 g/dl
BAC limit – young or novice drivers ≤ 0.05 g/dl
Random breath testing carried out Yes
Testing carried out in case of fatal crash Some drivers tested
Self-reported enforcement —
% road traffi c deaths involving alcohol —
National motorcycle helmet law Yes
Applies to drivers and passengers Yes
Helmet fastening required Yes
Helmet standard referred to and/or specifi ed Yes
Children passengers on motorcycles Prohibited under 5 yrs / 135 cm
Self-reported enforcement —
Helmet wearing rate 98% Drivers d
National seat-belt law Yes
Applies to front and rear seat occupants Yes
Self-reported enforcement —
Seat-belt wearing rate 96% Front seats d , 91% Rear seats d
National child restraint law Yes
Children seated in front seat Allowed in a child
restraint e
Child restraint required Up to 135 cm
Child restraint standard referred to and/or specifi ed Yes
Self-reported enforcement —
% children using child restraints 97% f
National law on mobile phone use while driving Yes
Ban on hand-held mobile phone use Yes
Ban on hands-free mobile phone use No
National drug-driving law Yes c Speed limits can be modifi ed at local level by the road authorities and the policed 2016, Danish Road Safety Councile Provided that airbag is deactivated if a rear-facing restraint is usedf 2012, The Danish Road Traffi c Investigation Board, Christian Skov
Trends in reported road traffi c deaths
Deat
hs p
er 1
00 0
00 p
opul
atio
n
© World Health Organization 2020. Some rights reserved. This work is available under the CC BY-NC-SA 3.0 IGO license.
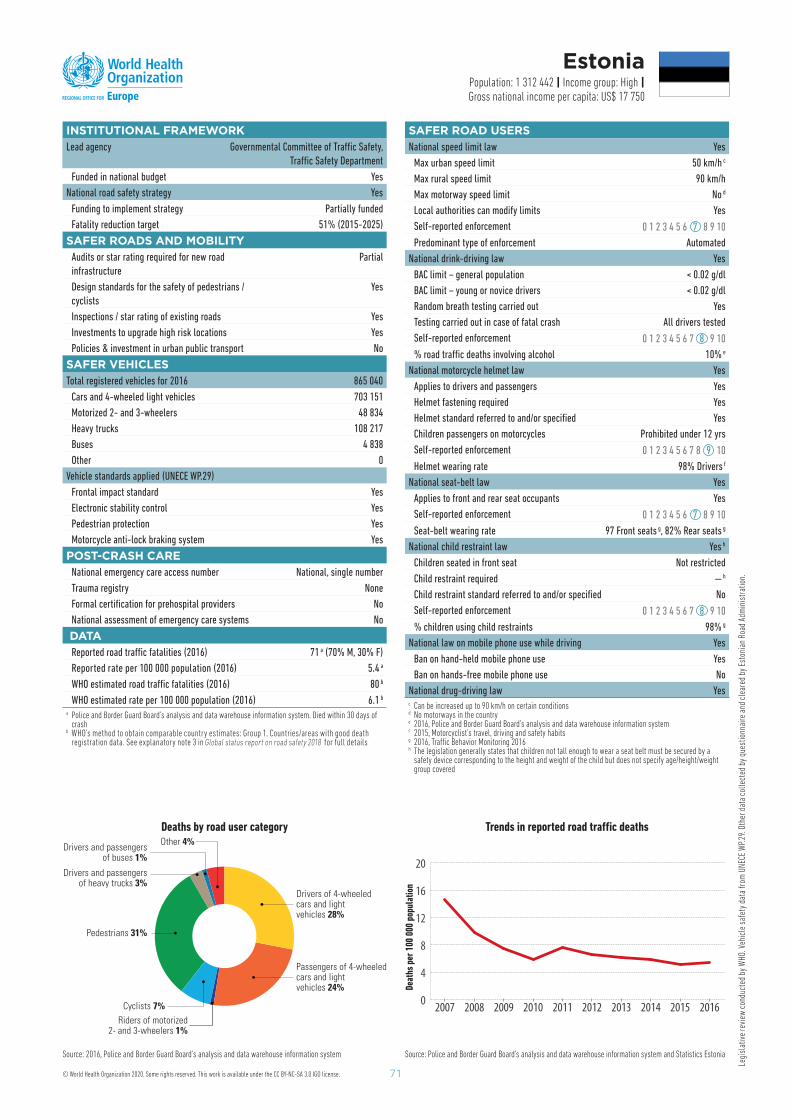
71
Legi
slat
ive
revi
ew c
ondu
cted
by
WHO
. Veh
icle
saf
ety
data
from
UNE
CE W
P.29
. Oth
er d
ata
colle
cted
by
ques
tionn
aire
and
cle
ared
by
Esto
nian
Roa
d Ad
min
istr
atio
n.
INSTITUTIONAL FRAMEWORKLead agency Governmental Committee of Traffi c Safety,
Traffi c Safety Department
Funded in national budget Yes
National road safety strategy Yes
Funding to implement strategy Partially funded
Fatality reduction target 51% (2015-2025)
SAFER ROADS AND MOBILITY Audits or star rating required for new road
infrastructure
Partial
Design standards for the safety of pedestrians /
cyclists
Yes
Inspections / star rating of existing roads Yes
Investments to upgrade high risk locations Yes
Policies & investment in urban public transport No
SAFER VEHICLES Total registered vehicles for 2016 865 040
Cars and 4-wheeled light vehicles 703 151
Motorized 2- and 3-wheelers 48 834
Heavy trucks 108 217
Buses 4 838
Other 0
Vehicle standards applied (UNECE WP.29)
Frontal impact standard Yes
Electronic stability control Yes
Pedestrian protection Yes
Motorcycle anti-lock braking system Yes
POST-CRASH CARENational emergency care access number National, single number
Trauma registry None
Formal certifi cation for prehospital providers No
National assessment of emergency care systems No
DATAReported road traffi c fatalities (2016) 71 a ( 70 % M, 30 % F)
Reported rate per 100 000 population (2016) 5.4 a
WHO estimated road traffi c fatalities (2016) 80 b
WHO estimated rate per 100 000 population (2016) 6.1 b
a Police and Border Guard Board’s analysis and data warehouse information system. Died within 30 days of crash
b WHO’s method to obtain comparable country estimates: Group 1. Countries/areas with good death registration data. See explanatory note 3 in Global status report on road safety 2018 for full details
Estonia Population: 1 312 442 | Income group: High |Gross national income per capita: US$ 17 750
Deaths by road user category
Drivers of 4-wheeledcars and lightvehicles 28%
Passengers of 4-wheeledcars and lightvehicles 24%
Cyclists 7%
Pedestrians 31%
Riders of motorized2- and 3-wheelers 1%
Drivers and passengersof buses 1%
Other 4%
Drivers and passengersof heavy trucks 3%
Source: 2016, Police and Border Guard Board’s analysis and data warehouse information system Source: Police and Border Guard Board’s analysis and data warehouse information system and Statistics Estonia
0
4
8
12
16
20
2016201520142013201220112010200920082007
SAFER ROAD USERSNational speed limit law Yes
Max urban speed limit 50 km/h c
Max rural speed limit 90 km/h
Max motorway speed limit No d
Local authorities can modify limits Yes
Self-reported enforcement 0 1 2 3 4 5 6 7 8 9 10
Predominant type of enforcement Automated
National drink-driving law Yes
BAC limit – general population < 0.02 g/dl
BAC limit – young or novice drivers < 0.02 g/dl
Random breath testing carried out Yes
Testing carried out in case of fatal crash All drivers tested
Self-reported enforcement 0 1 2 3 4 5 6 7 8 9 10
% road traffi c deaths involving alcohol 10% e
National motorcycle helmet law Yes
Applies to drivers and passengers Yes
Helmet fastening required Yes
Helmet standard referred to and/or specifi ed Yes
Children passengers on motorcycles Prohibited under 12 yrs
Self-reported enforcement 0 1 2 3 4 5 6 7 8 9 10
Helmet wearing rate 98% Drivers f
National seat-belt law Yes
Applies to front and rear seat occupants Yes
Self-reported enforcement 0 1 2 3 4 5 6 7 8 9 10
Seat-belt wearing rate 97 Front seats g , 82% Rear seats g
National child restraint law Yes h
Children seated in front seat Not restricted
Child restraint required — h
Child restraint standard referred to and/or specifi ed No
Self-reported enforcement 0 1 2 3 4 5 6 7 8 9 10
% children using child restraints 98% g
National law on mobile phone use while driving Yes
Ban on hand-held mobile phone use Yes
Ban on hands-free mobile phone use No
National drug-driving law Yes c Can be increased up to 90 km/h on certain conditionsd No motorways in the countrye 2016, Police and Border Guard Board’s analysis and data warehouse information systemf 2015, Motorcyclist’s travel, driving and safety habitsg 2016, Traffi c Behavior Monitoring 2016h The legislation generally states that children not tall enough to wear a seat belt must be secured by a
safety device corresponding to the height and weight of the child but does not specify age/height/weight group covered
Trends in reported road traffi c deaths
Deat
hs p
er 1
00 0
00 p
opul
atio
n
© World Health Organization 2020. Some rights reserved. This work is available under the CC BY-NC-SA 3.0 IGO license.
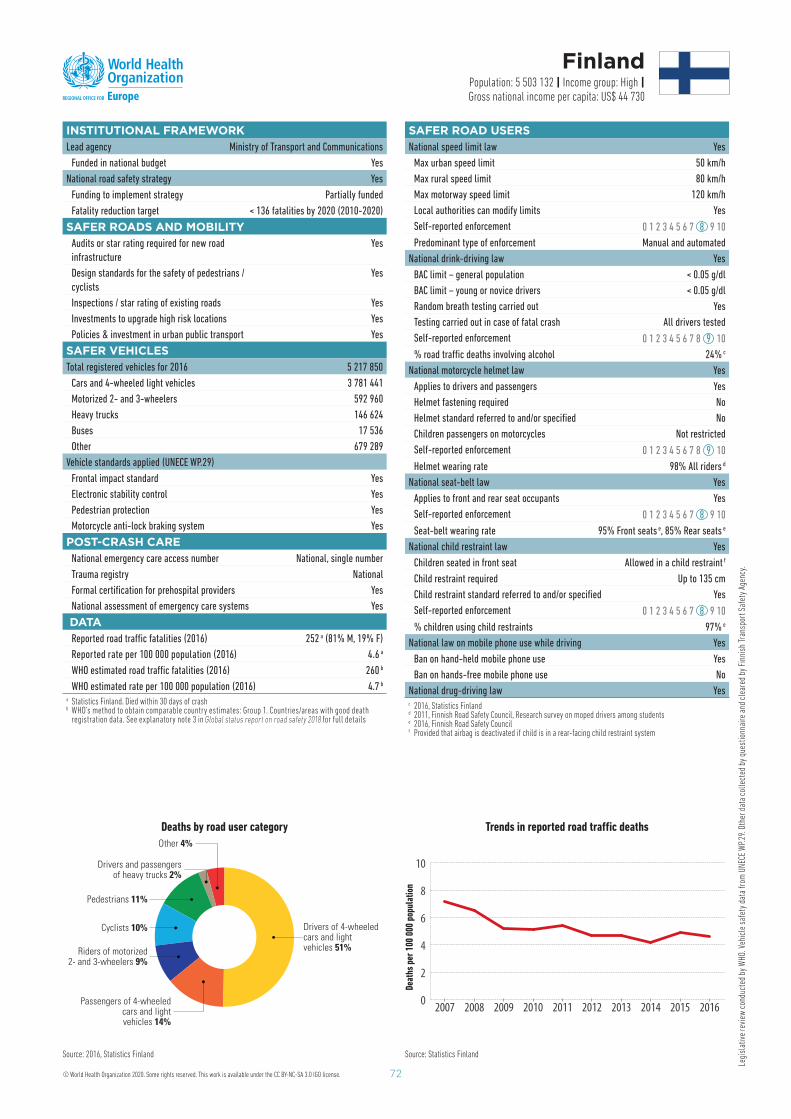
72
Legi
slat
ive
revi
ew c
ondu
cted
by
WHO
. Veh
icle
saf
ety
data
from
UNE
CE W
P.29
. Oth
er d
ata
colle
cted
by
ques
tionn
aire
and
cle
ared
by
Finn
ish
Tran
spor
t Saf
ety
Agen
cy.
INSTITUTIONAL FRAMEWORKLead agency Ministry of Transport and Communications
Funded in national budget Yes
National road safety strategy Yes
Funding to implement strategy Partially funded
Fatality reduction target < 136 fatalities by 2020 (2010-2020)
SAFER ROADS AND MOBILITY Audits or star rating required for new road
infrastructure
Yes
Design standards for the safety of pedestrians /
cyclists
Yes
Inspections / star rating of existing roads Yes
Investments to upgrade high risk locations Yes
Policies & investment in urban public transport Yes
SAFER VEHICLES Total registered vehicles for 2016 5 217 850
Cars and 4-wheeled light vehicles 3 781 441
Motorized 2- and 3-wheelers 592 960
Heavy trucks 146 624
Buses 17 536
Other 679 289
Vehicle standards applied (UNECE WP.29)
Frontal impact standard Yes
Electronic stability control Yes
Pedestrian protection Yes
Motorcycle anti-lock braking system Yes
POST-CRASH CARENational emergency care access number National, single number
Trauma registry National
Formal certifi cation for prehospital providers Yes
National assessment of emergency care systems Yes
DATAReported road traffi c fatalities (2016) 252 a ( 81 % M, 19 % F)
Reported rate per 100 000 population (2016) 4.6 a
WHO estimated road traffi c fatalities (2016) 260 b
WHO estimated rate per 100 000 population (2016) 4.7 b
a Statistics Finland. Died within 30 days of crash b WHO’s method to obtain comparable country estimates: Group 1. Countries/areas with good death
registration data. See explanatory note 3 in Global status report on road safety 2018 for full details
Finland Population: 5 503 132 | Income group: High |Gross national income per capita: US$ 44 730
Deaths by road user category
Drivers of 4-wheeledcars and lightvehicles 51%
Passengers of 4-wheeledcars and lightvehicles 14%
Cyclists 10%
Pedestrians 11%
Drivers and passengersof heavy trucks 2%
Other 4%
Riders of motorized2- and 3-wheelers 9%
Source: 2016, Statistics Finland Source: Statistics Finland
0
2
4
6
8
10
2016201520142013201220112010200920082007
SAFER ROAD USERSNational speed limit law Yes
Max urban speed limit 50 km/h
Max rural speed limit 80 km/h
Max motorway speed limit 120 km/h
Local authorities can modify limits Yes
Self-reported enforcement 0 1 2 3 4 5 6 7 8 9 10
Predominant type of enforcement Manual and automated
National drink-driving law Yes
BAC limit – general population < 0.05 g/dl
BAC limit – young or novice drivers < 0.05 g/dl
Random breath testing carried out Yes
Testing carried out in case of fatal crash All drivers tested
Self-reported enforcement 0 1 2 3 4 5 6 7 8 9 10
% road traffi c deaths involving alcohol 24% c
National motorcycle helmet law Yes
Applies to drivers and passengers Yes
Helmet fastening required No
Helmet standard referred to and/or specifi ed No
Children passengers on motorcycles Not restricted
Self-reported enforcement 0 1 2 3 4 5 6 7 8 9 10
Helmet wearing rate 98% All riders d
National seat-belt law Yes
Applies to front and rear seat occupants Yes
Self-reported enforcement 0 1 2 3 4 5 6 7 8 9 10
Seat-belt wearing rate 95% Front seats e , 85% Rear seats e
National child restraint law Yes
Children seated in front seat Allowed in a child restraint f
Child restraint required U p to 135 cm
Child restraint standard referred to and/or specifi ed Yes
Self-reported enforcement 0 1 2 3 4 5 6 7 8 9 10
% children using child restraints 97% e
National law on mobile phone use while driving Yes
Ban on hand-held mobile phone use Yes
Ban on hands-free mobile phone use No
National drug-driving law Yes c 2016, Statistics Finlandd 2011, Finnish Road Safety Council, Research survey on moped drivers among students e 2016, Finnish Road Safety Councilf Provided that airbag is deactivated if child is in a rear-facing child restraint system
Trends in reported road traffi c deaths
Deat
hs p
er 1
00 0
00 p
opul
atio
n
© World Health Organization 2020. Some rights reserved. This work is available under the CC BY-NC-SA 3.0 IGO license.

73
Legi
slat
ive
revi
ew c
ondu
cted
by
WHO
. Veh
icle
saf
ety
data
from
UNE
CE W
P.29
. Oth
er d
ata
colle
cted
by
ques
tionn
aire
and
cle
ared
by
Min
istr
y of
the
Inte
rior.
INSTITUTIONAL FRAMEWORKLead agency Inter-ministerial Delegation for Road Safety,
Ministry of Interior
Funded in national budget Yes
National road safety strategy Yes
Funding to implement strategy Fully funded
Fatality reduction target 50% (2010-2020)
SAFER ROADS AND MOBILITY Audits or star rating required for new road
infrastructure
Partial
Design standards for the safety of pedestrians /
cyclists
Yes
Inspections / star rating of existing roads Yes
Investments to upgrade high risk locations Yes
Policies & investment in urban public transport Yes
SAFER VEHICLES Total registered vehicles for 2015 42 363 000
Cars and 4-wheeled light vehicles 37 920 000
Motorized 2- and 3-wheelers 3 800 000
Heavy trucks 550 000
Buses 93 000
Other 0
Vehicle standards applied (UNECE WP.29)
Frontal impact standard Yes
Electronic stability control Yes
Pedestrian protection Yes
Motorcycle anti-lock braking system Yes
POST-CRASH CARENational emergency care access number National, single number
Trauma registry Subnational
Formal certifi cation for prehospital providers —
National assessment of emergency care systems No
DATAReported road traffi c fatalities (2016) 3 477 a ( 76 % M, 24 % F)
Reported rate per 100 000 population (2016) 5.4 a
WHO estimated road traffi c fatalities (2016) 3 585 b
WHO estimated rate per 100 000 population (2016) 5.5 b
a National Interdepartmental Observatory of Road Safety (ONISR). Died within 30 days of crash b WHO’s method to obtain comparable country estimates: Group 1. Countries/areas with good death
registration data. See explanatory note 3 in Global status report on road safety 2018 for full details
France Population: 64 720 688 | Income group: High |Gross national income per capita: US$ 38 950
Deaths by road user category
Drivers of 4-wheeledcars and lightvehicles 40%
Passengers of 4-wheeledcars and lightvehicles 14%
Cyclists 5%
Pedestrians 16%
Riders of motorized2- and 3-wheelers 21%
Drivers and passengersof buses <1%
Other 2%
Drivers and passengersof heavy trucks 2%
Source: 2016, National Interdepartmental Observatory of Road Safety (ONISR) Source: National Interdepartmental Observatory of Road Safety (ONISR, fatality data)
0
2
4
6
8
10
2016201520142013201220112010200920082007
SAFER ROAD USERSNational speed limit law Yes
Max urban speed limit 50 km/h
Max rural speed limit 90 km/h
Max motorway speed limit 130 km/h
Local authorities can modify limits Yes
Self-reported enforcement 0 1 2 3 4 5 6 7 8 9 10
Predominant type of enforcement Automated
National drink-driving law Yes
BAC limit – general population < 0.05 g/dl
BAC limit – young or novice drivers < 0.02 g/dl
Random breath testing carried out Yes
Testing carried out in case of fatal crash All drivers tested
Self-reported enforcement 0 1 2 3 4 5 6 7 8 9 10
% road traffi c deaths involving alcohol 29% c
National motorcycle helmet law Yes
Applies to drivers and passengers Yes
Helmet fastening required Yes
Helmet standard referred to and/or specifi ed Yes
Children passengers on motorcycles Not restricted
Self-reported enforcement 0 1 2 3 4 5 6 7 8 9 10
Helmet wearing rate 98% All riders c
National seat-belt law Yes
Applies to front and rear seat occupants Yes
Self-reported enforcement 0 1 2 3 4 5 6 7 8 9 10
Seat-belt wearing rate 98% Front seats c , 88% Rear seats c
National child restraint law Yes
Children seated in front seat Prohibited under 10 yrs d
Child restraint required U p to 10 yrs
Child restraint standard referred to and/or specifi ed Yes
Self-reported enforcement 0 1 2 3 4 5 6 7 8 9 10
% children using child restraints —
National law on mobile phone use while driving Yes
Ban on hand-held mobile phone use Yes
Ban on hands-free mobile phone use No
National drug-driving law Yes c 2016, National Interdepartmental Observatory of Road Safety (ONISR).d By exception, children under 10 years can sit in the front if placed in a rear-facing child restraint (if front
airbag is deactivated) or if there are no available rear seats
Trends in reported road traffi c deaths
Deat
hs p
er 1
00 0
00 p
opul
atio
n
© World Health Organization 2020. Some rights reserved. This work is available under the CC BY-NC-SA 3.0 IGO license.

74
Legi
slat
ive
revi
ew c
ondu
cted
by
WHO
. Veh
icle
saf
ety
data
from
UNE
CE W
P.29
. Oth
er d
ata
colle
cted
by
ques
tionn
aire
and
cle
ared
by
Natio
nal C
ente
r for
Dis
ease
Con
trol
and
Pub
lic H
ealth
.
INSTITUTIONAL FRAMEWORKLead agency Ministry of Economy and Sustainable Development of Georgia
Funded in national budget Yes
National road safety strategy Yes
Funding to implement strategy Partially funded
Fatality reduction target 25% (2016-2020)
SAFER ROADS AND MOBILITY Audits or star rating required for new road
infrastructure
Yes
Design standards for the safety of pedestrians /
cyclists
Partial
Inspections / star rating of existing roads No
Investments to upgrade high risk locations Yes
Policies & investment in urban public transport Yes
SAFER VEHICLES Total registered vehicles for 2016 1 126 470
Cars and 4-wheeled light vehicles 919 199
Motorized 2- and 3-wheelers 63 083
Heavy trucks 93 497
Buses 50 691
Other 0
Vehicle standards applied (UNECE WP.29)
Frontal impact standard No
Electronic stability control No
Pedestrian protection No
Motorcycle anti-lock braking system No
POST-CRASH CARENational emergency care access number National, single number
Trauma registry None
Formal certifi cation for prehospital providers Yes
National assessment of emergency care systems No
DATAReported road traffi c fatalities (2016) 581 a ( 54 % M, 20% F)
Reported rate per 100 000 population (2016) 15.6 a
WHO estimated road traffi c fatalities (2016) 599 b
WHO estimated rate per 100 000 population (2016) 15.3 b
a Ministry of Interior Aff airs. Died within 30 days of crash b WHO’s method to obtain comparable country estimates: Group 1. Countries/areas with good death
registration data. See explanatory note 3 in Global status report on road safety 2018 for full details
Georgia Population: 3 925 405 | Income group: Middle |
Gross national income per capita: US$ 3 810
Deaths by road user category
Drivers of 4-wheeledcars and lightvehicles 20%
Passengers of 4-wheeledcars and lightvehicles 24%
Riders of motorized2- and 3-wheelers <1%
Pedestrians 27%
Other 27%
Cyclists <1%
Source: 2016, Patrol police of the Ministry of Interior Aff airs Source: Ministry of Interior Aff airs of Georgia
0
5
10
15
20
25
2016201520142013201220112010200920082007
SAFER ROAD USERSNational speed limit law Yes
Max urban speed limit 60 km/h
Max rural speed limit 90 km/h
Max motorway speed limit 110 km/h
Local authorities can modify limits No
Self-reported enforcement 0 1 2 3 4 5 6 7 8 9 10
Predominant type of enforcement Automated
National drink-driving law Yes
BAC limit – general population ≤ 0.03 g/dl
BAC limit – young or novice drivers ≤ 0.03 g/dl
Random breath testing carried out Yes c
Testing carried out in case of fatal crash All drivers tested
Self-reported enforcement 0 1 2 3 4 5 6 7 8 9 10
% road traffi c deaths involving alcohol 9% d
National motorcycle helmet law Yes
Applies to drivers and passengers Yes
Helmet fastening required Yes
Helmet standard referred to and/or specifi ed No
Children passengers on motorcycles Prohibited under 12 yrs
Self-reported enforcement 0 1 2 3 4 5 6 7 8 9 10
Helmet wearing rate —
National seat-belt law Yes
Applies to front and rear seat occupants No
Self-reported enforcement 0 1 2 3 4 5 6 7 8 9 10
Seat-belt wearing rate 70% Drivers e, 60% Front seats e
National child restraint law No
Children seated in front seat Prohibited under 12 yrs
Child restraint required —
Child restraint standard referred to and/or specifi ed —
Self-reported enforcement —
% children using child restraints —
National law on mobile phone use while driving Yes
Ban on hand-held mobile phone use Yes
Ban on hands-free mobile phone use No
National drug-driving law Yes c Legislation requires probable cause to test driversd 2016, Ministry of Interior Aff airs (Patrol police)e 2006, World Bank Survey on Seat Belt in Tbilisi
Trends in reported road traffi c deaths
Deat
hs p
er 1
00 0
00 p
opul
atio
n
© World Health Organization 2020. Some rights reserved. This work is available under the CC BY-NC-SA 3.0 IGO license.

75
Legi
slat
ive
revi
ew c
ondu
cted
by
WHO
. Veh
icle
saf
ety
data
from
UNE
CE W
P.29
. Oth
er d
ata
colle
cted
by
ques
tionn
aire
and
cle
ared
by
Fede
ral H
ighw
ay R
esea
rch
Inst
itute
(BAS
t).
INSTITUTIONAL FRAMEWORKLead agency Federal Ministry of Transport and Digital Infrastructure (BMVI)
Funded in national budget Yes
National road safety strategy Yes
Funding to implement strategy Partially funded
Fatality reduction target 40% (2011-2020)
SAFER ROADS AND MOBILITY Audits or star rating required for new road
infrastructure
Yes
Design standards for the safety of pedestrians /
cyclists
Yes
Inspections / star rating of existing roads Yes
Investments to upgrade high risk locations Yes
Policies & investment in urban public transport No
SAFER VEHICLES Total registered vehicles for 2016 56 622 000
Cars and 4-wheeled light vehicles 45 071 000
Motorized 2- and 3-wheelers 6 248 000
Heavy trucks 4 942 000
Buses 78 000
Other 283 000
Vehicle standards applied (UNECE WP.29)
Frontal impact standard Yes
Electronic stability control Yes
Pedestrian protection Yes
Motorcycle anti-lock braking system Yes
POST-CRASH CARENational emergency care access number National, single number
Trauma registry Some facilities
Formal certifi cation for prehospital providers Yes
National assessment of emergency care systems Yes
DATAReported road traffi c fatalities (2016) 3 206 a ( 73 % M, 27 % F)
Reported rate per 100 000 population (2016) 3.9 a
WHO estimated road traffi c fatalities (2016) 3 327 b
WHO estimated rate per 100 000 population (2016) 4.1 b
a Federal Statistical Offi ce. Died within 30 days of crash b WHO’s method to obtain comparable country estimates: Group 1. Countries/areas with good death
registration data. See explanatory note 3 in Global status report on road safety 2018 for full details
Germany Population: 81 914 672 | Income group: High |Gross national income per capita: US$ 43 660
Deaths by road user category
Drivers of 4-wheeledcars and lightvehicles 36%
Passengers of 4-wheeledcars and lightvehicles 12%
Cyclists 12%
Pedestrians 15%
Riders of motorized2- and 3-wheelers 19%
Drivers and passengersof buses <1%
Other <1%
Drivers and passengersof heavy trucks 5%
Source: 2016, Federal Statistical Offi ce Source: Federal Statistical Offi ce
0
2
4
6
8
2016201520142013201220112010200920082007
SAFER ROAD USERSNational speed limit law Yes
Max urban speed limit 50 km/h
Max rural speed limit 100 km/h
Max motorway speed limit No c
Local authorities can modify limits Yes
Self-reported enforcement —
Predominant type of enforcement —
National drink-driving law Yes
BAC limit – general population < 0.05 g/dl
BAC limit – young or novice drivers 0.00 g/dl
Random breath testing carried out Yes
Testing carried out in case of fatal crash Some drivers tested
Self-reported enforcement —
% road traffi c deaths involving alcohol 7% d
National motorcycle helmet law Yes
Applies to drivers and passengers Yes
Helmet fastening required No
Helmet standard referred to and/or specifi ed No
Children passengers on motorcycles Not restricted
Self-reported enforcement —
Helmet wearing rate 99% Drivers e, 100% Passengers e
National seat-belt law Yes
Applies to front and rear seat occupants Yes
Self-reported enforcement —
Seat-belt wearing rate 98% Front seats e, 99% Rear seats e
National child restraint law Yes
Children seated in front seat Allowed in a child restraint
Child restraint required Up to 12 yrs /150 cm
Child restraint standard referred to and/or specifi ed Yes
Self-reported enforcement —
% children using child restraints 97-99% e
National law on mobile phone use while driving Yes
Ban on hand-held mobile phone use Yes
Ban on hands-free mobile phone use No
National drug-driving law Yes c There is no maximum speed limit on motorwaysd 2016, Federal Statistical Offi cee 2015, Federal Highway Research Institute (BASt)
Trends in reported road traffi c deaths
Deat
hs p
er 1
00 0
00 p
opul
atio
n
© World Health Organization 2020. Some rights reserved. This work is available under the CC BY-NC-SA 3.0 IGO license.
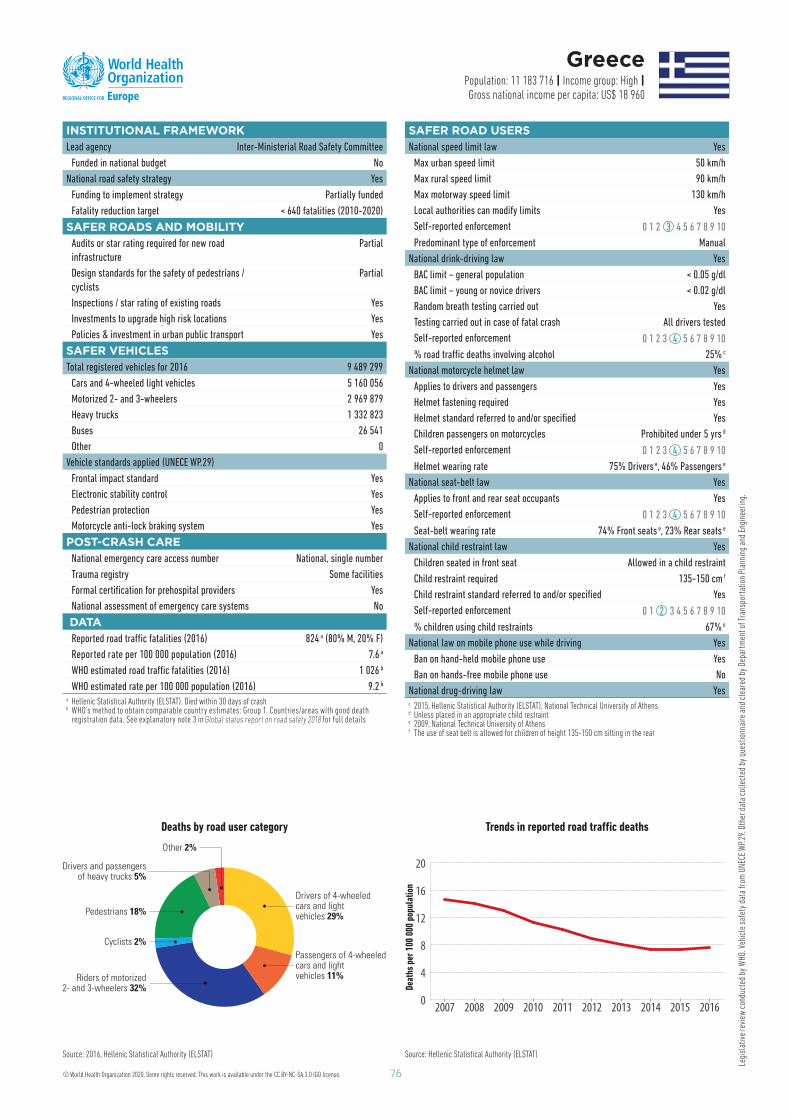
76
Legi
slat
ive
revi
ew c
ondu
cted
by
WHO
. Veh
icle
saf
ety
data
from
UNE
CE W
P.29
. Oth
er d
ata
colle
cted
by
ques
tionn
aire
and
cle
ared
by
Depa
rtm
ent o
f Tra
nspo
rtat
ion
Plan
ning
and
Eng
inee
ring.
INSTITUTIONAL FRAMEWORKLead agency Inter-Ministerial Road Safety Committee
Funded in national budget No
National road safety strategy Yes
Funding to implement strategy Partially funded
Fatality reduction target < 640 fatalities (2010-2020)
SAFER ROADS AND MOBILITY Audits or star rating required for new road
infrastructure
Partial
Design standards for the safety of pedestrians /
cyclists
Partial
Inspections / star rating of existing roads Yes
Investments to upgrade high risk locations Yes
Policies & investment in urban public transport Yes
SAFER VEHICLES Total registered vehicles for 2016 9 489 299
Cars and 4-wheeled light vehicles 5 160 056
Motorized 2- and 3-wheelers 2 969 879
Heavy trucks 1 332 823
Buses 26 541
Other 0
Vehicle standards applied (UNECE WP.29)
Frontal impact standard Yes
Electronic stability control Yes
Pedestrian protection Yes
Motorcycle anti-lock braking system Yes
POST-CRASH CARENational emergency care access number National, single number
Trauma registry Some facilities
Formal certifi cation for prehospital providers Yes
National assessment of emergency care systems No
DATAReported road traffi c fatalities (2016) 824 a ( 80 % M, 20 % F)
Reported rate per 100 000 population (2016) 7.6 a
WHO estimated road traffi c fatalities (2016) 1 026 b
WHO estimated rate per 100 000 population (2016) 9.2 b
a Hellenic Statistical Authority (ELSTAT). Died within 30 days of crash b WHO’s method to obtain comparable country estimates: Group 1. Countries/areas with good death
registration data. See explanatory note 3 in Global status report on road safety 2018 for full details
Greece Population: 11 183 716 | Income group: High |Gross national income per capita: US$ 18 960
Deaths by road user category
Drivers of 4-wheeledcars and lightvehicles 29%
Passengers of 4-wheeledcars and lightvehicles 11%
Cyclists 2%
Pedestrians 18%
Drivers and passengersof heavy trucks 5%
Other 2%
Riders of motorized2- and 3-wheelers 32%
Source: 2016, Hellenic Statistical Authority (ELSTAT) Source: Hellenic Statistical Authority (ELSTAT)
0
4
8
12
16
20
2016201520142013201220112010200920082007
SAFER ROAD USERSNational speed limit law Yes
Max urban speed limit 50 km/h
Max rural speed limit 90 km/h
Max motorway speed limit 130 km/h
Local authorities can modify limits Yes
Self-reported enforcement 0 1 2 3 4 5 6 7 8 9 10
Predominant type of enforcement Manual
National drink-driving law Yes
BAC limit – general population < 0.05 g/dl
BAC limit – young or novice drivers < 0.02 g/dl
Random breath testing carried out Yes
Testing carried out in case of fatal crash All drivers tested
Self-reported enforcement 0 1 2 3 4 5 6 7 8 9 10
% road traffi c deaths involving alcohol 25% c
National motorcycle helmet law Yes
Applies to drivers and passengers Yes
Helmet fastening required Yes
Helmet standard referred to and/or specifi ed Yes
Children passengers on motorcycles Prohibited under 5 yrs d
Self-reported enforcement 0 1 2 3 4 5 6 7 8 9 10
Helmet wearing rate 75% Drivers e , 46% Passengers e
National seat-belt law Yes
Applies to front and rear seat occupants Yes
Self-reported enforcement 0 1 2 3 4 5 6 7 8 9 10
Seat-belt wearing rate 74% Front seats e, 23% Rear seats e
National child restraint law Yes
Children seated in front seat Allowed in a child restraint
Child restraint required 135-150 cm f
Child restraint standard referred to and/or specifi ed Yes
Self-reported enforcement 0 1 2 3 4 5 6 7 8 9 10
% children using child restraints 67% e
National law on mobile phone use while driving Yes
Ban on hand-held mobile phone use Yes
Ban on hands-free mobile phone use No
National drug-driving law Yes c 2015, Hellenic Statistical Authority (ELSTAT), National Technical University of Athensd Unless placed in an appropriate child restraint e 2009, National Technical University of Athensf The use of seat belt is allowed for children of height 135-150 cm sitting in the rear
Trends in reported road traffi c deaths
Deat
hs p
er 1
00 0
00 p
opul
atio
n
© World Health Organization 2020. Some rights reserved. This work is available under the CC BY-NC-SA 3.0 IGO license.
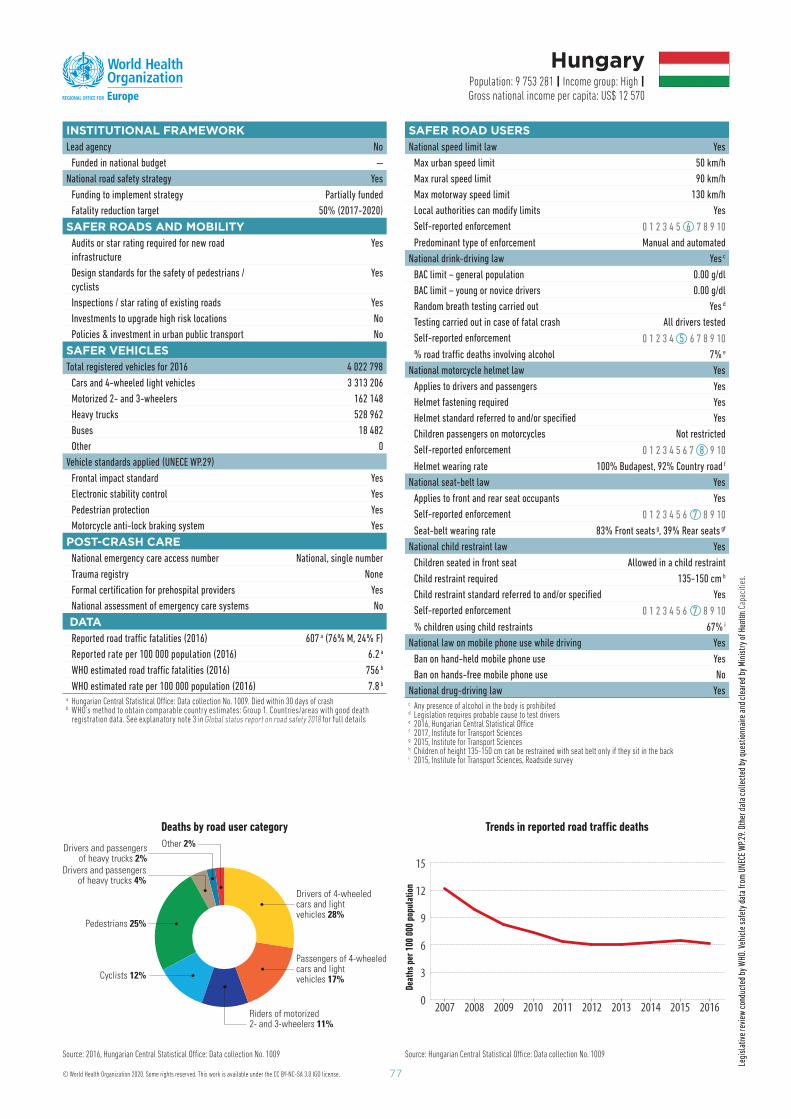
77
Legi
slat
ive
revi
ew c
ondu
cted
by
WHO
. Veh
icle
saf
ety
data
from
UNE
CE W
P.29
. Oth
er d
ata
colle
cted
by
ques
tionn
aire
and
cle
ared
by
Min
istr
y of
Hea
lth.
Legi
slat
ive
revi
ew c
ondu
cted
by
WHO
. Veh
icle
saf
ety
data
from
UNE
CE W
P.29
. Oth
er d
ata
colle
cted
by
ques
tionn
aire
and
cle
ared
by
Min
istr
y of
Hum
an C
apac
ities
.
INSTITUTIONAL FRAMEWORKLead agency No
Funded in national budget —
National road safety strategy Yes
Funding to implement strategy Partially funded
Fatality reduction target 50% (2017-2020)
SAFER ROADS AND MOBILITY Audits or star rating required for new road
infrastructure
Yes
Design standards for the safety of pedestrians /
cyclists
Yes
Inspections / star rating of existing roads Yes
Investments to upgrade high risk locations No
Policies & investment in urban public transport No
SAFER VEHICLES Total registered vehicles for 2016 4 022 798
Cars and 4-wheeled light vehicles 3 313 206
Motorized 2- and 3-wheelers 162 148
Heavy trucks 528 962
Buses 18 482
Other 0
Vehicle standards applied (UNECE WP.29)
Frontal impact standard Yes
Electronic stability control Yes
Pedestrian protection Yes
Motorcycle anti-lock braking system Yes
POST-CRASH CARENational emergency care access number National, single number
Trauma registry None
Formal certifi cation for prehospital providers Yes
National assessment of emergency care systems No
DATAReported road traffi c fatalities (2016) 607 a ( 76 % M, 24 % F)
Reported rate per 100 000 population (2016) 6.2 a
WHO estimated road traffi c fatalities (2016) 756 b
WHO estimated rate per 100 000 population (2016) 7.8 b
a Hungarian Central Statistical Offi ce: Data collection No. 1009. Died within 30 days of crash b WHO’s method to obtain comparable country estimates: Group 1. Countries/areas with good death
registration data. See explanatory note 3 in Global status report on road safety 2018 for full details
Hungary Population: 9 753 281 | Income group: High |Gross national income per capita: US$ 12 570
Deaths by road user category
Drivers of 4-wheeledcars and lightvehicles 28%
Passengers of 4-wheeledcars and lightvehicles 17%
Riders of motorized2- and 3-wheelers 11%
Cyclists 12%
Pedestrians 25%
Drivers and passengersof heavy trucks 4%
Drivers and passengersof heavy trucks 2%
Other 2%
Source: 2016, Hungarian Central Statistical Offi ce: Data collection No. 1009 Source: Hungarian Central Statistical Offi ce: Data collection No. 1009
0
3
6
9
12
15
2016201520142013201220112010200920082007
SAFER ROAD USERSNational speed limit law Yes
Max urban speed limit 50 km/h
Max rural speed limit 90 km/h
Max motorway speed limit 130 km/h
Local authorities can modify limits Yes
Self-reported enforcement 0 1 2 3 4 5 6 7 8 9 10
Predominant type of enforcement Manual and automated
National drink-driving law Yes c
BAC limit – general population 0.00 g/dl
BAC limit – young or novice drivers 0.00 g/dl
Random breath testing carried out Yes d
Testing carried out in case of fatal crash All drivers tested
Self-reported enforcement 0 1 2 3 4 5 6 7 8 9 10
% road traffi c deaths involving alcohol 7% e
National motorcycle helmet law Yes
Applies to drivers and passengers Yes
Helmet fastening required Yes
Helmet standard referred to and/or specifi ed Yes
Children passengers on motorcycles Not restricted
Self-reported enforcement 0 1 2 3 4 5 6 7 8 9 10
Helmet wearing rate 100% Budapest, 92% Country road f
National seat-belt law Yes
Applies to front and rear seat occupants Yes
Self-reported enforcement 0 1 2 3 4 5 6 7 8 9 10
Seat-belt wearing rate 83% Front seats g , 39% Rear seats gf
National child restraint law Yes
Children seated in front seat Allowed in a child restraint
Child restraint required 135-150 cm h
Child restraint standard referred to and/or specifi ed Yes
Self-reported enforcement 0 1 2 3 4 5 6 7 8 9 10
% children using child restraints 67% i
National law on mobile phone use while driving Yes
Ban on hand-held mobile phone use Yes
Ban on hands-free mobile phone use No
National drug-driving law Yes c Any presence of alcohol in the body is prohibitedd Legislation requires probable cause to test driverse 2016, Hungarian Central Statistical Offi cef 2017, Institute for Transport Sciencesg 2015, Institute for Transport Sciencesh Children of height 135-150 cm can be restrained with seat belt only if they sit in the backi 2015, Institute for Transport Sciences, Roadside survey
Trends in reported road traffi c deaths
Deat
hs p
er 1
00 0
00 p
opul
atio
n
© World Health Organization 2020. Some rights reserved. This work is available under the CC BY-NC-SA 3.0 IGO license.
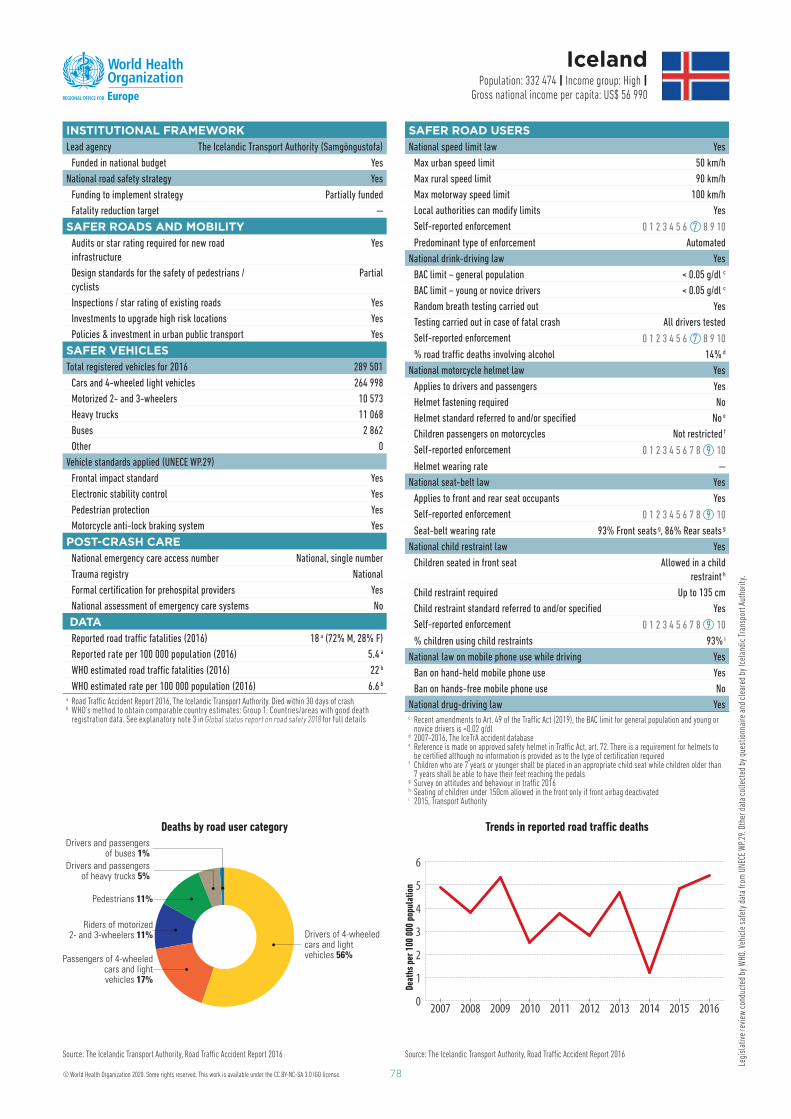
78
Legi
slat
ive
revi
ew c
ondu
cted
by
WHO
. Veh
icle
saf
ety
data
from
UNE
CE W
P.29
. Oth
er d
ata
colle
cted
by
ques
tionn
aire
and
cle
ared
by
Icel
andi
c Tr
ansp
ort A
utho
rity
.
INSTITUTIONAL FRAMEWORKLead agency The Icelandic Transport Authority (Samgöngustofa)
Funded in national budget Yes
National road safety strategy Yes
Funding to implement strategy Partially funded
Fatality reduction target —
SAFER ROADS AND MOBILITY Audits or star rating required for new road
infrastructure
Yes
Design standards for the safety of pedestrians /
cyclists
Partial
Inspections / star rating of existing roads Yes
Investments to upgrade high risk locations Yes
Policies & investment in urban public transport Yes
SAFER VEHICLES Total registered vehicles for 2016 289 501
Cars and 4-wheeled light vehicles 264 998
Motorized 2- and 3-wheelers 10 573
Heavy trucks 11 068
Buses 2 862
Other 0
Vehicle standards applied (UNECE WP.29)
Frontal impact standard Yes
Electronic stability control Yes
Pedestrian protection Yes
Motorcycle anti-lock braking system Yes
POST-CRASH CARENational emergency care access number National, single number
Trauma registry National
Formal certifi cation for prehospital providers Yes
National assessment of emergency care systems No
DATAReported road traffi c fatalities (2016) 18 a ( 72 % M, 28 % F)
Reported rate per 100 000 population (2016) 5.4 a
WHO estimated road traffi c fatalities (2016) 22 b
WHO estimated rate per 100 000 population (2016) 6.6 b
a Road Traffi c Accident Report 2016, The Icelandic Transport Authority. Died within 30 days of crash b WHO’s method to obtain comparable country estimates: Group 1. Countries/areas with good death
registration data. See explanatory note 3 in Global status report on road safety 2018 for full details
Iceland Population: 332 474 | Income group: High |
Gross national income per capita: US$ 56 990
Source: The Icelandic Transport Authority, Road Traffi c Accident Report 2016
0
1
2
3
4
5
6
2016201520142013201220112010200920082007
SAFER ROAD USERSNational speed limit law Yes
Max urban speed limit 50 km/h
Max rural speed limit 90 km/h
Max motorway speed limit 100 km/h
Local authorities can modify limits Yes
Self-reported enforcement 0 1 2 3 4 5 6 7 8 9 10
Predominant type of enforcement Automated
National drink-driving law Yes
BAC limit – general population < 0.05 g/dl c
BAC limit – young or novice drivers < 0.05 g/dl c
Random breath testing carried out Yes
Testing carried out in case of fatal crash All drivers tested
Self-reported enforcement 0 1 2 3 4 5 6 7 8 9 10
% road traffi c deaths involving alcohol 14% d
National motorcycle helmet law Yes
Applies to drivers and passengers Yes
Helmet fastening required No
Helmet standard referred to and/or specifi ed No e
Children passengers on motorcycles Not restricted f
Self-reported enforcement 0 1 2 3 4 5 6 7 8 9 10
Helmet wearing rate —
National seat-belt law Yes
Applies to front and rear seat occupants Yes
Self-reported enforcement 0 1 2 3 4 5 6 7 8 9 10
Seat-belt wearing rate 93% Front seats g, 86% Rear seats g
National child restraint law Yes
Children seated in front seat Allowed in a child
restraint h
Child restraint required U p to 135 cm
Child restraint standard referred to and/or specifi ed Yes
Self-reported enforcement 0 1 2 3 4 5 6 7 8 9 10
% children using child restraints 93% i
National law on mobile phone use while driving Yes
Ban on hand-held mobile phone use Yes
Ban on hands-free mobile phone use No
National drug-driving law Yes c Recent amendments to Art. 49 of the Traffi c Act (2019), the BAC limit for general population and young or
novice drivers is <0.02 g/dld 2007-2016, The IceTrA accident databasee Reference is made on approved safety helmet in Traffi c Act, art. 72. There is a requirement for helmets to
be certifi ed although no information is provided as to the type of certifi cation requiredf Children who are 7 years or younger shall be placed in an appropriate child seat while children older than
7 years shall be able to have their feet reaching the pedalsg Survey on attitudes and behaviour in traffi c 2016h Seating of children under 150cm allowed in the front only if front airbag deactivatedi 2015, Transport Authority
Deaths by road user category
Drivers of 4-wheeledcars and lightvehicles 56%
Pedestrians 11%
Drivers and passengersof heavy trucks 5%
Riders of motorized2- and 3-wheelers 11%
Passengers of 4-wheeledcars and lightvehicles 17%
Drivers and passengersof buses 1%
Source: The Icelandic Transport Authority, Road Traffi c Accident Report 2016
Trends in reported road traffi c deaths
Deat
hs p
er 1
00 0
00 p
opul
atio
n
© World Health Organization 2020. Some rights reserved. This work is available under the CC BY-NC-SA 3.0 IGO license.
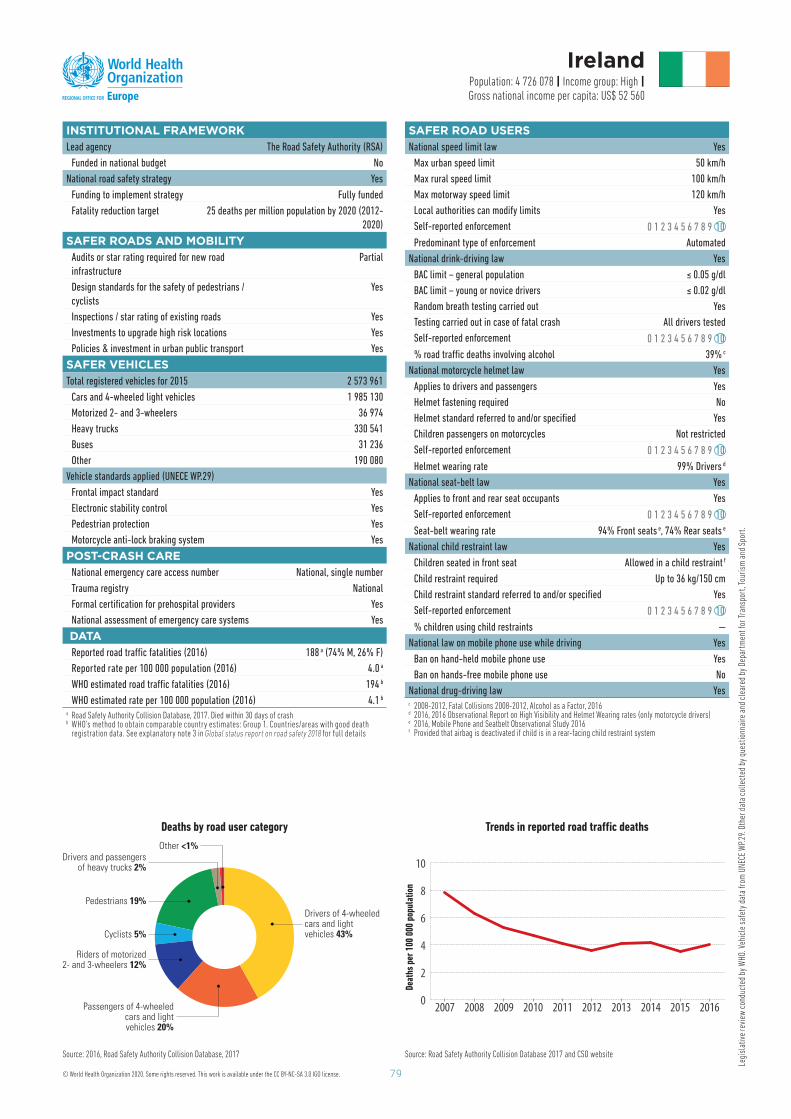
79
Legi
slat
ive
revi
ew c
ondu
cted
by
WHO
. Veh
icle
saf
ety
data
from
UNE
CE W
P.29
. Oth
er d
ata
colle
cted
by
ques
tionn
aire
and
cle
ared
by
Depa
rtm
ent f
or T
rans
port
, Tou
rism
and
Spo
rt.
INSTITUTIONAL FRAMEWORKLead agency The Road Safety Authority (RSA)
Funded in national budget No
National road safety strategy Yes
Funding to implement strategy Fully funded
Fatality reduction target 25 deaths per million population by 2020 (2012-
2020)
SAFER ROADS AND MOBILITY Audits or star rating required for new road
infrastructure
Partial
Design standards for the safety of pedestrians /
cyclists
Yes
Inspections / star rating of existing roads Yes
Investments to upgrade high risk locations Yes
Policies & investment in urban public transport Yes
SAFER VEHICLES Total registered vehicles for 2015 2 573 961
Cars and 4-wheeled light vehicles 1 985 130
Motorized 2- and 3-wheelers 36 974
Heavy trucks 330 541
Buses 31 236
Other 190 080
Vehicle standards applied (UNECE WP.29)
Frontal impact standard Yes
Electronic stability control Yes
Pedestrian protection Yes
Motorcycle anti-lock braking system Yes
POST-CRASH CARENational emergency care access number National, single number
Trauma registry National
Formal certifi cation for prehospital providers Yes
National assessment of emergency care systems Yes
DATAReported road traffi c fatalities (2016) 188 a ( 74 % M, 26 % F)
Reported rate per 100 000 population (2016) 4.0 a
WHO estimated road traffi c fatalities (2016) 194 b
WHO estimated rate per 100 000 population (2016) 4.1 b
a Road Safety Authority Collision Database, 2017. Died within 30 days of crash b WHO’s method to obtain comparable country estimates: Group 1. Countries/areas with good death
registration data. See explanatory note 3 in Global status report on road safety 2018 for full details
Ireland Population: 4 726 078 | Income group: High |Gross national income per capita: US$ 52 560
Deaths by road user category
Drivers of 4-wheeledcars and lightvehicles 43%
Passengers of 4-wheeledcars and lightvehicles 20%
Cyclists 5%
Pedestrians 19%
Drivers and passengersof heavy trucks 2%
Other <1%
Riders of motorized2- and 3-wheelers 12%
Source: 2016, Road Safety Authority Collision Database, 2017 Source: Road Safety Authority Collision Database 2017 and CSO website
0
2
4
6
8
10
2016201520142013201220112010200920082007
SAFER ROAD USERSNational speed limit law Yes
Max urban speed limit 50 km/h
Max rural speed limit 100 km/h
Max motorway speed limit 120 km/h
Local authorities can modify limits Yes
Self-reported enforcement 0 1 2 3 4 5 6 7 8 9 10
Predominant type of enforcement Automated
National drink-driving law Yes
BAC limit – general population ≤ 0.05 g/dl
BAC limit – young or novice drivers ≤ 0.02 g/dl
Random breath testing carried out Yes
Testing carried out in case of fatal crash All drivers tested
Self-reported enforcement 0 1 2 3 4 5 6 7 8 9 10
% road traffi c deaths involving alcohol 39% c
National motorcycle helmet law Yes
Applies to drivers and passengers Yes
Helmet fastening required No
Helmet standard referred to and/or specifi ed Yes
Children passengers on motorcycles Not restricted
Self-reported enforcement 0 1 2 3 4 5 6 7 8 9 10
Helmet wearing rate 99% Drivers d
National seat-belt law Yes
Applies to front and rear seat occupants Yes
Self-reported enforcement 0 1 2 3 4 5 6 7 8 9 10
Seat-belt wearing rate 94% Front seats e, 74% Rear seats e
National child restraint law Yes
Children seated in front seat Allowed in a child restraint f
Child restraint required U p to 36 kg /150 cm
Child restraint standard referred to and/or specifi ed Yes
Self-reported enforcement 0 1 2 3 4 5 6 7 8 9 10
% children using child restraints —
National law on mobile phone use while driving Yes
Ban on hand-held mobile phone use Yes
Ban on hands-free mobile phone use No
National drug-driving law Yes c 2008-2012, Fatal Collisions 2008-2012, Alcohol as a Factor, 2016d 2016, 2016 Observational Report on High Visibility and Helmet Wearing rates (only motorcycle drivers)e 2016, Mobile Phone and Seatbelt Observational Study 2016f Provided that airbag is deactivated if child is in a rear-facing child restraint system
Trends in reported road traffi c deaths
Deat
hs p
er 1
00 0
00 p
opul
atio
n
© World Health Organization 2020. Some rights reserved. This work is available under the CC BY-NC-SA 3.0 IGO license.
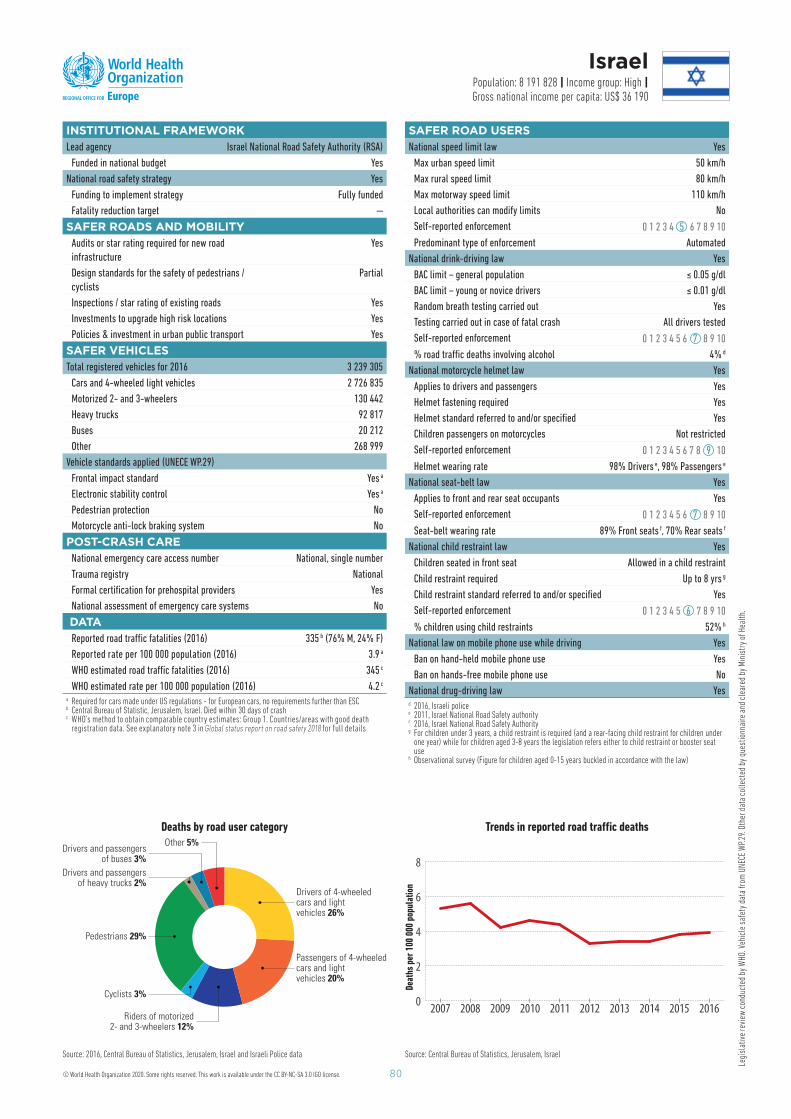
80
Legi
slat
ive
revi
ew c
ondu
cted
by
WHO
. Veh
icle
saf
ety
data
from
UNE
CE W
P.29
. Oth
er d
ata
colle
cted
by
ques
tionn
aire
and
cle
ared
by
Min
istr
y of
Hea
lth.
INSTITUTIONAL FRAMEWORKLead agency Israel National Road Safety Authority (RSA)
Funded in national budget Yes
National road safety strategy Yes
Funding to implement strategy Fully funded
Fatality reduction target —
SAFER ROADS AND MOBILITY Audits or star rating required for new road
infrastructure
Yes
Design standards for the safety of pedestrians /
cyclists
Partial
Inspections / star rating of existing roads Yes
Investments to upgrade high risk locations Yes
Policies & investment in urban public transport Yes
SAFER VEHICLES Total registered vehicles for 2016 3 239 305
Cars and 4-wheeled light vehicles 2 726 835
Motorized 2- and 3-wheelers 130 442
Heavy trucks 92 817
Buses 20 212
Other 268 999
Vehicle standards applied (UNECE WP.29)
Frontal impact standard Yes a
Electronic stability control Yes a
Pedestrian protection No
Motorcycle anti-lock braking system No
POST-CRASH CARENational emergency care access number National, single number
Trauma registry National
Formal certifi cation for prehospital providers Yes
National assessment of emergency care systems No
DATAReported road traffi c fatalities (2016) 335 b ( 76 % M, 24 % F)
Reported rate per 100 000 population (2016) 3.9 a
WHO estimated road traffi c fatalities (2016) 345 c
WHO estimated rate per 100 000 population (2016) 4.2 c
a Required for cars made under US regulations - for European cars, no requirements further than ESCb Central Bureau of Statistic, Jerusalem, Israel. Died within 30 days of crash c WHO’s method to obtain comparable country estimates: Group 1. Countries/areas with good death
registration data. See explanatory note 3 in Global status report on road safety 2018 for full details
Israel Population: 8 191 828 | Income group: High |Gross national income per capita: US$ 36 190
Deaths by road user category
Drivers of 4-wheeledcars and lightvehicles 26%
Passengers of 4-wheeledcars and lightvehicles 20%
Cyclists 3%
Pedestrians 29%
Drivers and passengersof heavy trucks 2%
Drivers and passengersof buses 3%
Other 5%
Riders of motorized2- and 3-wheelers 12%
Source: 2016, Central Bureau of Statistics, Jerusalem, Israel and Israeli Police data Source: Central Bureau of Statistics, Jerusalem, Israel
0
2
4
6
8
2016201520142013201220112010200920082007
SAFER ROAD USERSNational speed limit law Yes
Max urban speed limit 50 km/h
Max rural speed limit 80 km/h
Max motorway speed limit 110 km/h
Local authorities can modify limits No
Self-reported enforcement 0 1 2 3 4 5 6 7 8 9 10
Predominant type of enforcement Automated
National drink-driving law Yes
BAC limit – general population ≤ 0.05 g/dl
BAC limit – young or novice drivers ≤ 0.01 g/dl
Random breath testing carried out Yes
Testing carried out in case of fatal crash All drivers tested
Self-reported enforcement 0 1 2 3 4 5 6 7 8 9 10
% road traffi c deaths involving alcohol 4% d
National motorcycle helmet law Yes
Applies to drivers and passengers Yes
Helmet fastening required Yes
Helmet standard referred to and/or specifi ed Yes
Children passengers on motorcycles Not restricted
Self-reported enforcement 0 1 2 3 4 5 6 7 8 9 10
Helmet wearing rate 98% Drivers e , 98% Passengers e
National seat-belt law Yes
Applies to front and rear seat occupants Yes
Self-reported enforcement 0 1 2 3 4 5 6 7 8 9 10
Seat-belt wearing rate 89% Front seats f , 70% Rear seats f
National child restraint law Yes
Children seated in front seat Allowed in a child restraint
Child restraint required U p to 8 yrs g
Child restraint standard referred to and/or specifi ed Yes
Self-reported enforcement 0 1 2 3 4 5 6 7 8 9 10
% children using child restraints 52% h
National law on mobile phone use while driving Yes
Ban on hand-held mobile phone use Yes
Ban on hands-free mobile phone use No
National drug-driving law Yes d 2016, Israeli policee 2011, Israel National Road Safety authorityf 2016, Israel National Road Safety Authorityg For children under 3 years, a child restraint is required (and a rear-facing child restraint for children under
one year) while for children aged 3-8 years the legislation refers either to child restraint or booster seat use
h Observational survey (Figure for children aged 0-15 years buckled in accordance with the law)
Trends in reported road traffi c deaths
Deat
hs p
er 1
00 0
00 p
opul
atio
n
© World Health Organization 2020. Some rights reserved. This work is available under the CC BY-NC-SA 3.0 IGO license.
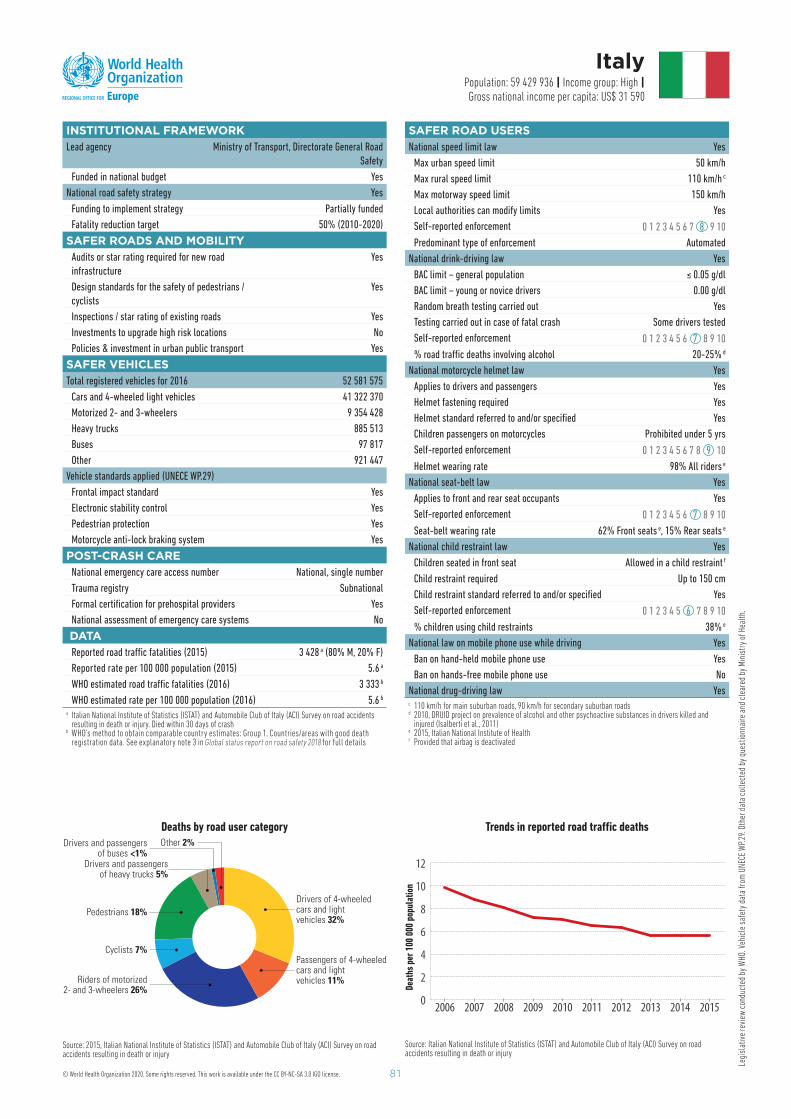
81
Legi
slat
ive
revi
ew c
ondu
cted
by
WHO
. Veh
icle
saf
ety
data
from
UNE
CE W
P.29
. Oth
er d
ata
colle
cted
by
ques
tionn
aire
and
cle
ared
by
Min
istr
y of
Hea
lth.
INSTITUTIONAL FRAMEWORKLead agency Ministry of Transport, Directorate General Road
Safety
Funded in national budget Yes
National road safety strategy Yes
Funding to implement strategy Partially funded
Fatality reduction target 50% (2010-2020)
SAFER ROADS AND MOBILITY Audits or star rating required for new road
infrastructure
Yes
Design standards for the safety of pedestrians /
cyclists
Yes
Inspections / star rating of existing roads Yes
Investments to upgrade high risk locations No
Policies & investment in urban public transport Yes
SAFER VEHICLES Total registered vehicles for 2016 52 581 575
Cars and 4-wheeled light vehicles 41 322 370
Motorized 2- and 3-wheelers 9 354 428
Heavy trucks 885 513
Buses 97 817
Other 921 447
Vehicle standards applied (UNECE WP.29)
Frontal impact standard Yes
Electronic stability control Yes
Pedestrian protection Yes
Motorcycle anti-lock braking system Yes
POST-CRASH CARENational emergency care access number National, single number
Trauma registry Subnational
Formal certifi cation for prehospital providers Yes
National assessment of emergency care systems No
DATAReported road traffi c fatalities (2015) 3 428 a ( 80 % M, 20 % F)
Reported rate per 100 000 population (2015) 5.6 a
WHO estimated road traffi c fatalities (2016) 3 333 b
WHO estimated rate per 100 000 population (2016) 5.6 b
a Italian National Institute of Statistics (ISTAT) and Automobile Club of Italy (ACI) Survey on road accidents resulting in death or injury. Died within 30 days of crash
b WHO’s method to obtain comparable country estimates: Group 1. Countries/areas with good death registration data. See explanatory note 3 in Global status report on road safety 2018 for full details
Italy Population: 59 429 936 | Income group: High |Gross national income per capita: US$ 31 590
Deaths by road user category
Drivers of 4-wheeledcars and lightvehicles 32%
Passengers of 4-wheeledcars and lightvehicles 11%
Cyclists 7%
Pedestrians 18%
Riders of motorized2- and 3-wheelers 26%
Drivers and passengersof buses <1%
Other 2%
Drivers and passengersof heavy trucks 5%
Source: 2015, Italian National Institute of Statistics (ISTAT) and Automobile Club of Italy (ACI) Survey on road accidents resulting in death or injury
Source: Italian National Institute of Statistics (ISTAT) and Automobile Club of Italy (ACI) Survey on road accidents resulting in death or injury
0
2
4
6
8
10
12
2015201420132012201120102009200820072006
SAFER ROAD USERSNational speed limit law Yes
Max urban speed limit 50 km/h
Max rural speed limit 110 km/h c
Max motorway speed limit 150 km/h
Local authorities can modify limits Yes
Self-reported enforcement 0 1 2 3 4 5 6 7 8 9 10
Predominant type of enforcement Automated
National drink-driving law Yes
BAC limit – general population ≤ 0.05 g/dl
BAC limit – young or novice drivers 0.00 g/dl
Random breath testing carried out Yes
Testing carried out in case of fatal crash Some drivers tested
Self-reported enforcement 0 1 2 3 4 5 6 7 8 9 10
% road traffi c deaths involving alcohol 20-25% d
National motorcycle helmet law Yes
Applies to drivers and passengers Yes
Helmet fastening required Yes
Helmet standard referred to and/or specifi ed Yes
Children passengers on motorcycles Prohibited under 5 yrs
Self-reported enforcement 0 1 2 3 4 5 6 7 8 9 10
Helmet wearing rate 98% All riders e
National seat-belt law Yes
Applies to front and rear seat occupants Yes
Self-reported enforcement 0 1 2 3 4 5 6 7 8 9 10
Seat-belt wearing rate 62% Front seats e, 15% Rear seats e
National child restraint law Yes
Children seated in front seat Allowed in a child restraint f
Child restraint required U p to 150 cm
Child restraint standard referred to and/or specifi ed Yes
Self-reported enforcement 0 1 2 3 4 5 6 7 8 9 10
% children using child restraints 38% e
National law on mobile phone use while driving Yes
Ban on hand-held mobile phone use Yes
Ban on hands-free mobile phone use No
National drug-driving law Yes c 110 km/h for main suburban roads, 90 km/h for secondary suburban roadsd 2010, DRUID project on prevalence of alcohol and other psychoactive substances in drivers killed and
injured (Isalberti et al., 2011)e 2015, Italian National Institute of Health f Provided that airbag is deactivated
Trends in reported road traffi c deaths
Deat
hs p
er 1
00 0
00 p
opul
atio
n
© World Health Organization 2020. Some rights reserved. This work is available under the CC BY-NC-SA 3.0 IGO license.
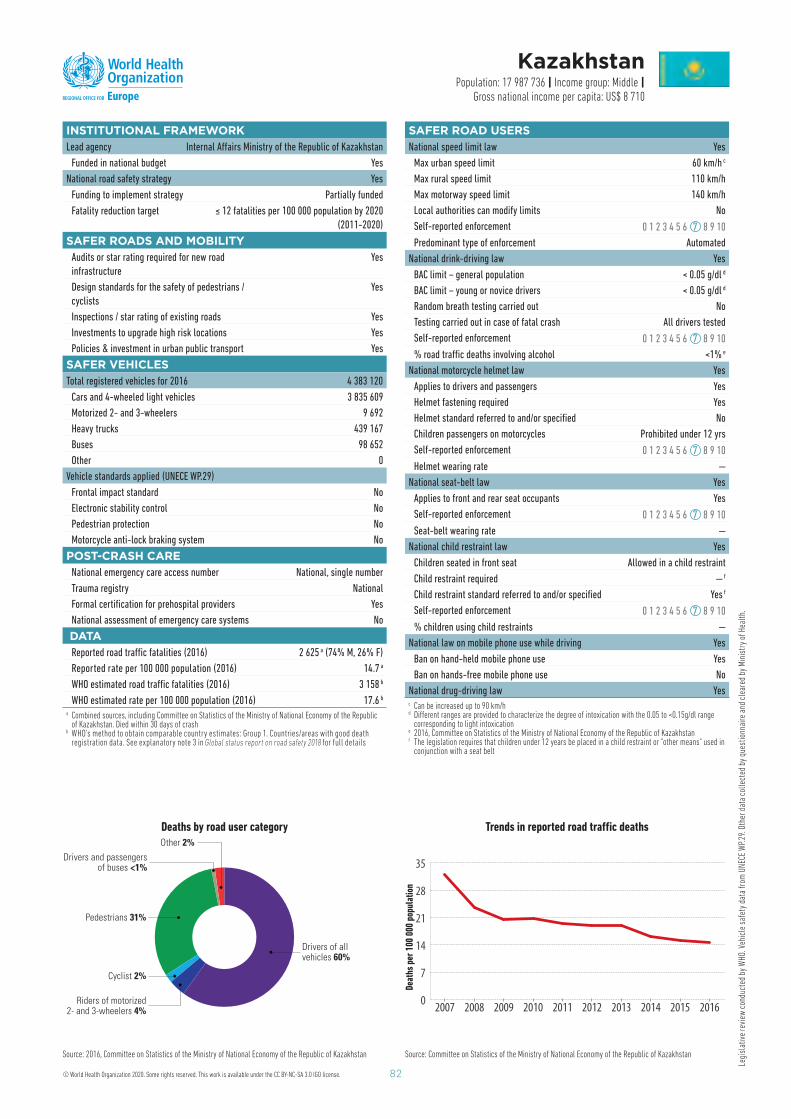
82
Legi
slat
ive
revi
ew c
ondu
cted
by
WHO
. Veh
icle
saf
ety
data
from
UNE
CE W
P.29
. Oth
er d
ata
colle
cted
by
ques
tionn
aire
and
cle
ared
by
Min
istr
y of
Hea
lth.
INSTITUTIONAL FRAMEWORKLead agency Internal Aff airs Ministry of the Republic of Kazakhstan
Funded in national budget Yes
National road safety strategy Yes
Funding to implement strategy Partially funded
Fatality reduction target ≤ 12 fatalities per 100 000 population by 2020
(2011-2020)
SAFER ROADS AND MOBILITY Audits or star rating required for new road
infrastructure
Yes
Design standards for the safety of pedestrians /
cyclists
Yes
Inspections / star rating of existing roads Yes
Investments to upgrade high risk locations Yes
Policies & investment in urban public transport Yes
SAFER VEHICLES Total registered vehicles for 2016 4 383 120
Cars and 4-wheeled light vehicles 3 835 609
Motorized 2- and 3-wheelers 9 692
Heavy trucks 439 167
Buses 98 652
Other 0
Vehicle standards applied (UNECE WP.29)
Frontal impact standard No
Electronic stability control No
Pedestrian protection No
Motorcycle anti-lock braking system No
POST-CRASH CARENational emergency care access number National, single number
Trauma registry National
Formal certifi cation for prehospital providers Yes
National assessment of emergency care systems No
DATAReported road traffi c fatalities (2016) 2 625 a (74% M, 26 % F)
Reported rate per 100 000 population (2016) 14.7 a
WHO estimated road traffi c fatalities (2016) 3 158 b
WHO estimated rate per 100 000 population (2016) 17.6 b
a Combined sources, including Committee on Statistics of the Ministry of National Economy of the Republic of Kazakhstan. Died within 30 days of crash
b WHO’s method to obtain comparable country estimates: Group 1. Countries/areas with good death registration data. See explanatory note 3 in Global status report on road safety 2018 for full details
Kazakhstan Population: 17 987 736 | Income group: Middle |
Gross national income per capita: US$ 8 710
Deaths by road user category
Cyclist 2%
Riders of motorized2- and 3-wheelers 4%
Drivers and passengersof buses <1%
Other 2%
Drivers of allvehicles 60%
Pedestrians 31%
Source: 2016, Committee on Statistics of the Ministry of National Economy of the Republic of Kazakhstan Source: Committee on Statistics of the Ministry of National Economy of the Republic of Kazakhstan
0
7
14
21
28
35
2016201520142013201220112010200920082007
SAFER ROAD USERSNational speed limit law Yes
Max urban speed limit 60 km/h c
Max rural speed limit 110 km/h
Max motorway speed limit 140 km/h
Local authorities can modify limits No
Self-reported enforcement 0 1 2 3 4 5 6 7 8 9 10
Predominant type of enforcement Automated
National drink-driving law Yes
BAC limit – general population < 0.05 g/dl d
BAC limit – young or novice drivers < 0.05 g/dl d
Random breath testing carried out No
Testing carried out in case of fatal crash All drivers tested
Self-reported enforcement 0 1 2 3 4 5 6 7 8 9 10
% road traffi c deaths involving alcohol < 1% e
National motorcycle helmet law Yes
Applies to drivers and passengers Yes
Helmet fastening required Yes
Helmet standard referred to and/or specifi ed No
Children passengers on motorcycles Prohibited under 12 yrs
Self-reported enforcement 0 1 2 3 4 5 6 7 8 9 10
Helmet wearing rate —
National seat-belt law Yes
Applies to front and rear seat occupants Yes
Self-reported enforcement 0 1 2 3 4 5 6 7 8 9 10
Seat-belt wearing rate —
National child restraint law Yes
Children seated in front seat Allowed in a child restraint
Child restraint required — f
Child restraint standard referred to and/or specifi ed Yes f
Self-reported enforcement 0 1 2 3 4 5 6 7 8 9 10
% children using child restraints —
National law on mobile phone use while driving Yes
Ban on hand-held mobile phone use Yes
Ban on hands-free mobile phone use No
National drug-driving law Yes c Can be increased up to 90 km/hd Diff erent ranges are provided to characterize the degree of intoxication with the 0.05 to <0.15g/dl range
corresponding to light intoxicatione 2016, Committee on Statistics of the Ministry of National Economy of the Republic of Kazakhstanf The legislation requires that children under 12 years be placed in a child restraint or "other means" used in
conjunction with a seat belt
Trends in reported road traffi c deaths
Deat
hs p
er 1
00 0
00 p
opul
atio
n
© World Health Organization 2020. Some rights reserved. This work is available under the CC BY-NC-SA 3.0 IGO license.
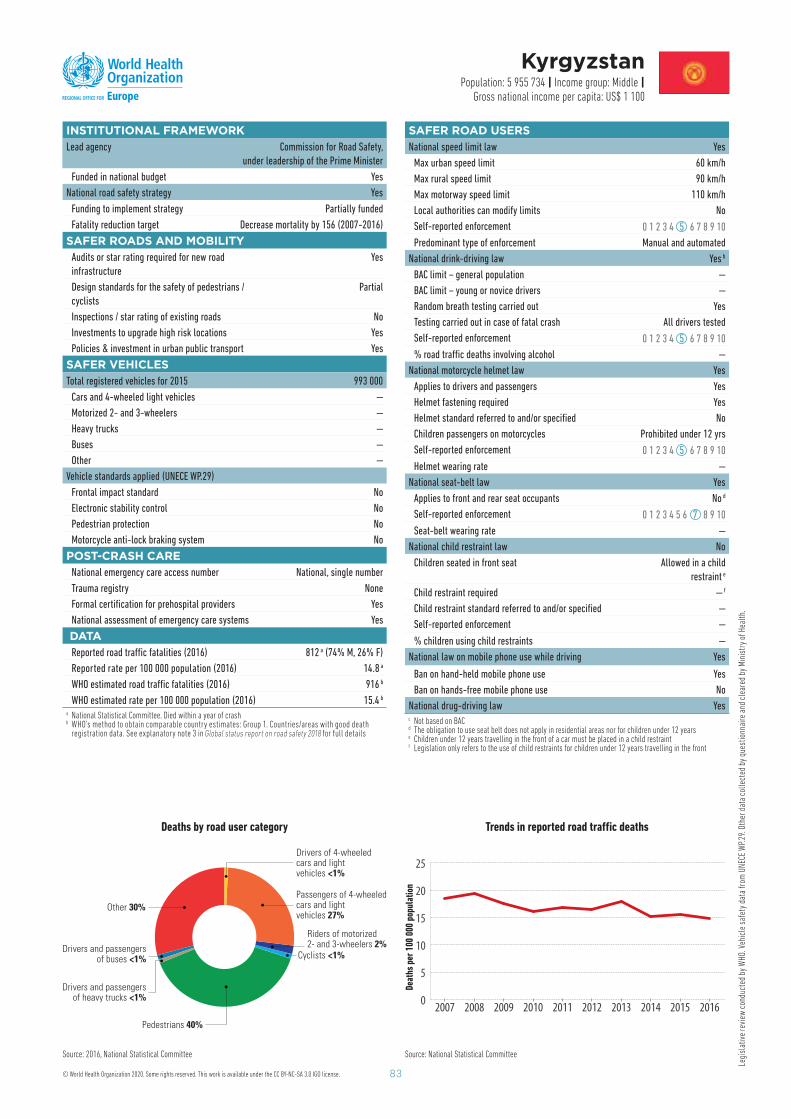
83
Legi
slat
ive
revi
ew c
ondu
cted
by
WHO
. Veh
icle
saf
ety
data
from
UNE
CE W
P.29
. Oth
er d
ata
colle
cted
by
ques
tionn
aire
and
cle
ared
by
Min
istr
y of
Hea
lth.
INSTITUTIONAL FRAMEWORKLead agency Commission for Road Safety,
under leadership of the Prime Minister
Funded in national budget Yes
National road safety strategy Yes
Funding to implement strategy Partially funded
Fatality reduction target Decrease mortality by 156 (2007-2016)
SAFER ROADS AND MOBILITY Audits or star rating required for new road
infrastructure
Yes
Design standards for the safety of pedestrians /
cyclists
Partial
Inspections / star rating of existing roads No
Investments to upgrade high risk locations Yes
Policies & investment in urban public transport Yes
SAFER VEHICLES Total registered vehicles for 2015 993 000
Cars and 4-wheeled light vehicles —
Motorized 2- and 3-wheelers —
Heavy trucks —
Buses —
Other —
Vehicle standards applied (UNECE WP.29)
Frontal impact standard No
Electronic stability control No
Pedestrian protection No
Motorcycle anti-lock braking system No
POST-CRASH CARENational emergency care access number National, single number
Trauma registry None
Formal certifi cation for prehospital providers Yes
National assessment of emergency care systems Yes
DATAReported road traffi c fatalities (2016) 812 a ( 74 % M, 26 % F)
Reported rate per 100 000 population (2016) 14.8 a
WHO estimated road traffi c fatalities (2016) 916 b
WHO estimated rate per 100 000 population (2016) 15.4 b
a National Statistical Committee. Died within a year of crash b WHO’s method to obtain comparable country estimates: Group 1. Countries/areas with good death
registration data. See explanatory note 3 in Global status report on road safety 2018 for full details
Kyrgyzstan Population: 5 955 734 | Income group: Middle |
Gross national income per capita: US$ 1 100
Deaths by road user category
Drivers of 4-wheeledcars and lightvehicles <1%
Passengers of 4-wheeledcars and lightvehicles 27%
Riders of motorized2- and 3-wheelers 2%
Pedestrians 40%
Drivers and passengersof heavy trucks <1%
Drivers and passengersof buses <1%
Other 30%
Cyclists <1%
Source: 2016, National Statistical Committee Source: National Statistical Committee
0
5
10
15
20
25
2016201520142013201220112010200920082007
SAFER ROAD USERSNational speed limit law Yes
Max urban speed limit 60 km/h
Max rural speed limit 90 km/h
Max motorway speed limit 110 km/h
Local authorities can modify limits No
Self-reported enforcement 0 1 2 3 4 5 6 7 8 9 10
Predominant type of enforcement Manual and automated
National drink-driving law Yes b
BAC limit – general population —
BAC limit – young or novice drivers —
Random breath testing carried out Yes
Testing carried out in case of fatal crash All drivers tested
Self-reported enforcement 0 1 2 3 4 5 6 7 8 9 10
% road traffi c deaths involving alcohol —
National motorcycle helmet law Yes
Applies to drivers and passengers Yes
Helmet fastening required Yes
Helmet standard referred to and/or specifi ed No
Children passengers on motorcycles Prohibited under 12 yrs
Self-reported enforcement 0 1 2 3 4 5 6 7 8 9 10
Helmet wearing rate —
National seat-belt law Yes
Applies to front and rear seat occupants No d
Self-reported enforcement 0 1 2 3 4 5 6 7 8 9 10
Seat-belt wearing rate —
National child restraint law No
Children seated in front seat Allowed in a child
restraint e
Child restraint required — f
Child restraint standard referred to and/or specifi ed —
Self-reported enforcement —
% children using child restraints —
National law on mobile phone use while driving Yes
Ban on hand-held mobile phone use Yes
Ban on hands-free mobile phone use No
National drug-driving law Yes c Not based on BACd The obligation to use seat belt does not apply in residential areas nor for children under 12 yearse Children under 12 years travelling in the front of a car must be placed in a child restraintf Legislation only refers to the use of child restraints for children under 12 years travelling in the front
Trends in reported road traffi c deaths
Deat
hs p
er 1
00 0
00 p
opul
atio
n
© World Health Organization 2020. Some rights reserved. This work is available under the CC BY-NC-SA 3.0 IGO license.
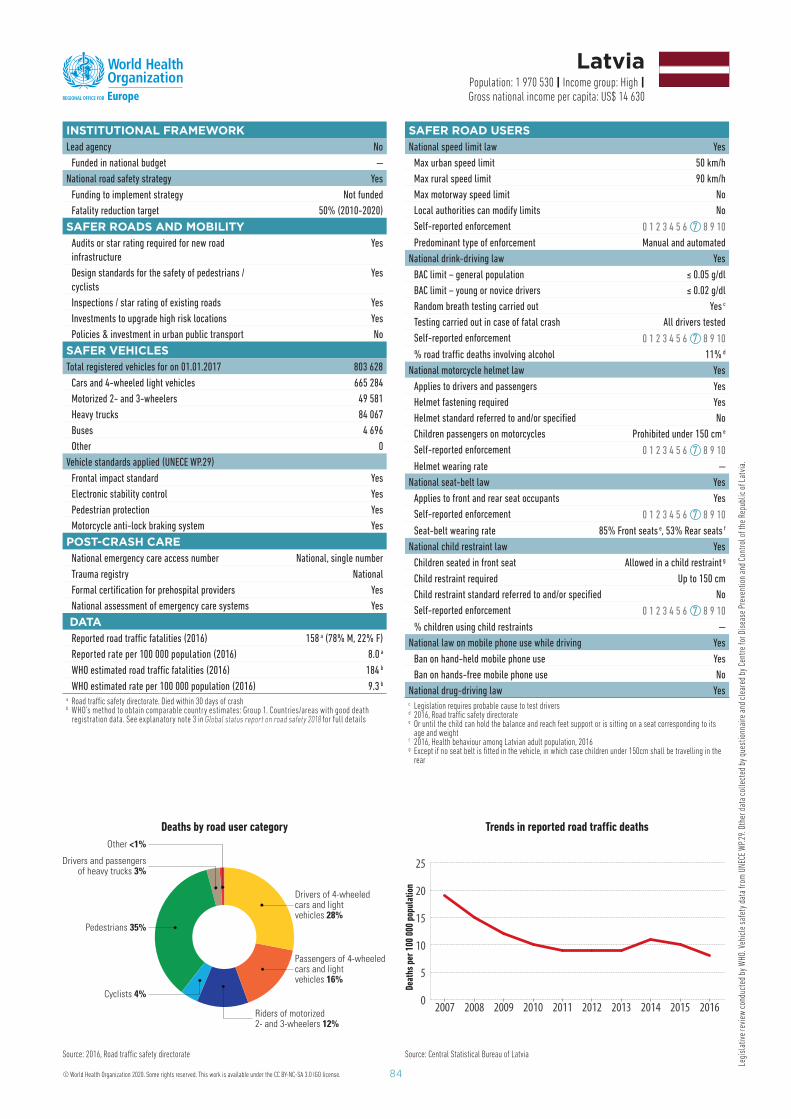
84
Legi
slat
ive
revi
ew c
ondu
cted
by
WHO
. Veh
icle
saf
ety
data
from
UNE
CE W
P.29
. Oth
er d
ata
colle
cted
by
ques
tionn
aire
and
cle
ared
by
Cent
re fo
r Dis
ease
Pre
vent
ion
and
Cont
rol o
f the
Rep
ublic
of L
atvi
a.
INSTITUTIONAL FRAMEWORKLead agency No
Funded in national budget —
National road safety strategy Yes
Funding to implement strategy Not funded
Fatality reduction target 50% (2010-2020)
SAFER ROADS AND MOBILITY Audits or star rating required for new road
infrastructure
Yes
Design standards for the safety of pedestrians /
cyclists
Yes
Inspections / star rating of existing roads Yes
Investments to upgrade high risk locations Yes
Policies & investment in urban public transport No
SAFER VEHICLES Total registered vehicles for on 01.01.2017 803 628
Cars and 4-wheeled light vehicles 665 284
Motorized 2- and 3-wheelers 49 581
Heavy trucks 84 067
Buses 4 696
Other 0
Vehicle standards applied (UNECE WP.29)
Frontal impact standard Yes
Electronic stability control Yes
Pedestrian protection Yes
Motorcycle anti-lock braking system Yes
POST-CRASH CARENational emergency care access number National, single number
Trauma registry National
Formal certifi cation for prehospital providers Yes
National assessment of emergency care systems Yes
DATAReported road traffi c fatalities (2016) 158 a ( 78 % M, 22 % F)
Reported rate per 100 000 population (2016) 8.0 a
WHO estimated road traffi c fatalities (2016) 184 b
WHO estimated rate per 100 000 population (2016) 9.3 b
a Road traffi c safety directorate. Died within 30 days of crash b WHO’s method to obtain comparable country estimates: Group 1. Countries/areas with good death
registration data. See explanatory note 3 in Global status report on road safety 2018 for full details
Latvia Population: 1 970 530 | Income group: High |Gross national income per capita: US$ 14 630
Deaths by road user category
Drivers of 4-wheeledcars and lightvehicles 28%
Passengers of 4-wheeledcars and lightvehicles 16%
Riders of motorized2- and 3-wheelers 12%
Cyclists 4%
Pedestrians 35%
Drivers and passengersof heavy trucks 3%
Other <1%
Source: 2016, Road traffi c safety directorate Source: Central Statistical Bureau of Latvia
0
5
10
15
20
25
2016201520142013201220112010200920082007
SAFER ROAD USERSNational speed limit law Yes
Max urban speed limit 50 km/h
Max rural speed limit 90 km/h
Max motorway speed limit No
Local authorities can modify limits No
Self-reported enforcement 0 1 2 3 4 5 6 7 8 9 10
Predominant type of enforcement Manual and automated
National drink-driving law Yes
BAC limit – general population ≤ 0.05 g/dl
BAC limit – young or novice drivers ≤ 0.02 g/dl
Random breath testing carried out Yes c
Testing carried out in case of fatal crash All drivers tested
Self-reported enforcement 0 1 2 3 4 5 6 7 8 9 10
% road traffi c deaths involving alcohol 11% d
National motorcycle helmet law Yes
Applies to drivers and passengers Yes
Helmet fastening required Yes
Helmet standard referred to and/or specifi ed No
Children passengers on motorcycles Prohibited under 150 cm e
Self-reported enforcement 0 1 2 3 4 5 6 7 8 9 10
Helmet wearing rate —
National seat-belt law Yes
Applies to front and rear seat occupants Yes
Self-reported enforcement 0 1 2 3 4 5 6 7 8 9 10
Seat-belt wearing rate 85% Front seats e , 53% Rear seats f
National child restraint law Yes
Children seated in front seat Allowed in a child restraint g
Child restraint required Up to 150 cm
Child restraint standard referred to and/or specifi ed No
Self-reported enforcement 0 1 2 3 4 5 6 7 8 9 10
% children using child restraints —
National law on mobile phone use while driving Yes
Ban on hand-held mobile phone use Yes
Ban on hands-free mobile phone use No
National drug-driving law Yes c Legislation requires probable cause to test drivers d 2016, Road traffi c safety directoratee Or until the child can hold the balance and reach feet support or is sitting on a seat corresponding to its
age and weightf 2016, Health behaviour among Latvian adult population, 2016g Except if no seat belt is fi tted in the vehicle, in which case children under 150cm shall be travelling in the
rear
Trends in reported road traffi c deaths
Deat
hs p
er 1
00 0
00 p
opul
atio
n
© World Health Organization 2020. Some rights reserved. This work is available under the CC BY-NC-SA 3.0 IGO license.
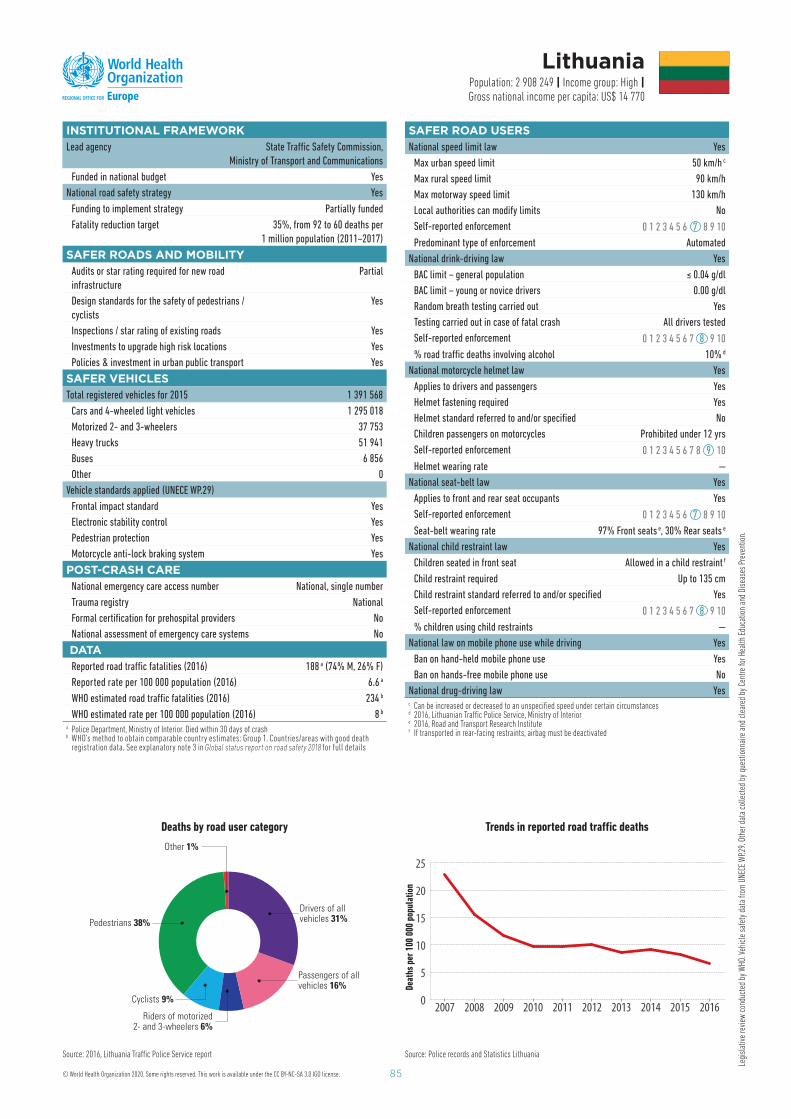
85
Legi
slat
ive
revi
ew c
ondu
cted
by
WHO
. Veh
icle
saf
ety
data
from
UNE
CE W
P.29.
Oth
er d
ata
colle
cted
by
ques
tionn
aire
and
cle
ared
by
Cent
re fo
r Hea
lth E
duca
tion
and
Dise
ases
Pre
vent
ion.
INSTITUTIONAL FRAMEWORKLead agency State Traffi c Safety Commission,
Ministry of Transport and Communications
Funded in national budget Yes
National road safety strategy Yes
Funding to implement strategy Partially funded
Fatality reduction target 35%, from 92 to 60 deaths per
1 million population (2011–2017)
SAFER ROADS AND MOBILITY Audits or star rating required for new road
infrastructure
Partial
Design standards for the safety of pedestrians /
cyclists
Yes
Inspections / star rating of existing roads Yes
Investments to upgrade high risk locations Yes
Policies & investment in urban public transport Yes
SAFER VEHICLES Total registered vehicles for 2015 1 391 568
Cars and 4-wheeled light vehicles 1 295 018
Motorized 2- and 3-wheelers 37 753
Heavy trucks 51 941
Buses 6 856
Other 0
Vehicle standards applied (UNECE WP.29)
Frontal impact standard Yes
Electronic stability control Yes
Pedestrian protection Yes
Motorcycle anti-lock braking system Yes
POST-CRASH CARENational emergency care access number National, single number
Trauma registry National
Formal certifi cation for prehospital providers No
National assessment of emergency care systems No
DATAReported road traffi c fatalities (2016) 188 a ( 74 % M, 26 % F)
Reported rate per 100 000 population (2016) 6.6 a
WHO estimated road traffi c fatalities (2016) 234 b
WHO estimated rate per 100 000 population (2016) 8 b
a Police Department, Ministry of Interior. Died within 30 days of crash b WHO’s method to obtain comparable country estimates: Group 1. Countries/areas with good death
registration data. See explanatory note 3 in Global status report on road safety 2018 for full details
Lithuania Population: 2 908 249 | Income group: High |Gross national income per capita: US$ 14 770
Deaths by road user category
Passengers of allvehicles 16%
Cyclists 9%
Riders of motorized2- and 3-wheelers 6%
Pedestrians 38%Drivers of allvehicles 31%
Other 1%
Source: 2016, Lithuania Traffi c Police Service report Source: Police records and Statistics Lithuania
0
5
10
15
20
25
2016201520142013201220112010200920082007
SAFER ROAD USERSNational speed limit law Yes
Max urban speed limit 50 km/h c
Max rural speed limit 90 km/h
Max motorway speed limit 130 km/h
Local authorities can modify limits No
Self-reported enforcement 0 1 2 3 4 5 6 7 8 9 10
Predominant type of enforcement Automated
National drink-driving law Yes
BAC limit – general population ≤ 0.04 g/dl
BAC limit – young or novice drivers 0.00 g/dl
Random breath testing carried out Yes
Testing carried out in case of fatal crash All drivers tested
Self-reported enforcement 0 1 2 3 4 5 6 7 8 9 10
% road traffi c deaths involving alcohol 10% d
National motorcycle helmet law Yes
Applies to drivers and passengers Yes
Helmet fastening required Yes
Helmet standard referred to and/or specifi ed No
Children passengers on motorcycles Prohibited under 12 yrs
Self-reported enforcement 0 1 2 3 4 5 6 7 8 9 10
Helmet wearing rate —
National seat-belt law Yes
Applies to front and rear seat occupants Yes
Self-reported enforcement 0 1 2 3 4 5 6 7 8 9 10
Seat-belt wearing rate 97% Front seats e , 30% Rear seats e
National child restraint law Yes
Children seated in front seat Allowed in a child restraint f
Child restraint required U p to 135 cm
Child restraint standard referred to and/or specifi ed Yes
Self-reported enforcement 0 1 2 3 4 5 6 7 8 9 10
% children using child restraints —
National law on mobile phone use while driving Yes
Ban on hand-held mobile phone use Yes
Ban on hands-free mobile phone use No
National drug-driving law Yes c Can be increased or decreased to an unspecifi ed speed under certain circumstancesd 2016, Lithuanian Traffi c Police Service, Ministry of Interiore 2016, Road and Transport Research Institutef If transported in rear-facing restraints, airbag must be deactivated
Trends in reported road traffi c deaths
Deat
hs p
er 1
00 0
00 p
opul
atio
n
© World Health Organization 2020. Some rights reserved. This work is available under the CC BY-NC-SA 3.0 IGO license.

86
Legi
slat
ive
revi
ew c
ondu
cted
by
WHO
. Veh
icle
saf
ety
data
from
UNE
CE W
P.29
. Oth
er d
ata
colle
cted
by
ques
tionn
aire
and
cle
ared
by
Min
sitr
y of
Hea
lth.
INSTITUTIONAL FRAMEWORKLead agency Ministry of Sustainable Development and Infrastructure,
Department of Transport
Funded in national budget Yes
National road safety strategy Yes
Funding to implement strategy Partially funded
Fatality reduction target 50% (2011-2020)
SAFER ROADS AND MOBILITY Audits or star rating required for new road
infrastructure
Partial
Design standards for the safety of pedestrians /
cyclists
Yes
Inspections / star rating of existing roads Yes
Investments to upgrade high risk locations Yes
Policies & investment in urban public transport Yes
SAFER VEHICLES Total registered vehicles for 01.01.2017 466 472
Cars and 4-wheeled light vehicles 422 073
Motorized 2- and 3-wheelers 29 253
Heavy trucks 13 242
Buses 1 904
Other 0
Vehicle standards applied (UNECE WP.29)
Frontal impact standard Yes
Electronic stability control Yes
Pedestrian protection Yes
Motorcycle anti-lock braking system Yes
POST-CRASH CARENational emergency care access number National, single number
Trauma registry Some facilities
Formal certifi cation for prehospital providers No
National assessment of emergency care systems No
DATAReported road traffi c fatalities (2016) 32 a ( 66 % M, 34 % F)
Reported rate per 100 000 population (2016) 5.4 a
WHO estimated road traffi c fatalities (2016) 36 b
WHO estimated rate per 100 000 population (2016) 6.3 b
a National Institute of Statistics and Economic Studies (STATEC), Police Grand-Ducale. Died within 30 days of crash
b WHO’s method to obtain comparable country estimates: Group 1. Countries/areas with good death registration data. See explanatory note 3 in Global status report on road safety 2018 for full details
Luxembourg Population: 575 747 | Income group: High |
Gross national income per capita: US$ 76 660
Deaths by road user category
Drivers of 4-wheeledcars and lightvehicles 41%
Passengers of 4-wheeledcars and lightvehicles 22%
Cyclists 3%
Pedestrians 25%
Riders of motorized2- and 3-wheelers 9%
Source: 2016, National Institute of Statistics and Economic Studies (STATEC), Police Grand-Ducale Source: National Institute of Statistics and Economic Studies (STATEC), Police Grand-Ducale
0
2
4
6
8
10
12
2016201520142013201220112010200920082007
SAFER ROAD USERSNational speed limit law Yes
Max urban speed limit 50 km/h
Max rural speed limit 90 km/h
Max motorway speed limit 130 km/h
Local authorities can modify limits Yes
Self-reported enforcement 0 1 2 3 4 5 6 7 8 9 10
Predominant type of enforcement Automated
National drink-driving law Yes
BAC limit – general population < 0.05 g/dl
BAC limit – young or novice drivers < 0.02 g/dl
Random breath testing carried out Yes
Testing carried out in case of fatal crash All drivers tested
Self-reported enforcement 0 1 2 3 4 5 6 7 8 9 10
% road traffi c deaths involving alcohol 14% c
National motorcycle helmet law Yes
Applies to drivers and passengers Yes
Helmet fastening required Yes
Helmet standard referred to and/or specifi ed Yes
Children passengers on motorcycles Prohibited under 12 yrs d
Self-reported enforcement 0 1 2 3 4 5 6 7 8 9 10
Helmet wearing rate —
National seat-belt law Yes
Applies to front and rear seat occupants Yes
Self-reported enforcement 0 1 2 3 4 5 6 7 8 9 10
Seat-belt wearing rate 90% Front seats e , 76% Rear seats e
National child restraint law Yes
Children seated in front seat Allowed in a child restraint f
Child restraint required Up to 17 yrs /150 cm
Child restraint standard referred to and/or specifi ed Yes
Self-reported enforcement 0 1 2 3 4 5 6 7 8 9 10
% children using child restraints —
National law on mobile phone use while driving Yes
Ban on hand-held mobile phone use Yes
Ban on hands-free mobile phone use No
National drug-driving law Yes c 2016, National Institute of Statistics and Economic Studies (STATEC), Police Grand-Ducaled And until the child is tall enough to adequately use the foot pegse 2015, TNS ILRES/MDDIf Provided that airbag is deactivated if child is in a rear-facing child restraint system
Trends in reported road traffi c deaths
Deat
hs p
er 1
00 0
00 p
opul
atio
n
© World Health Organization 2020. Some rights reserved. This work is available under the CC BY-NC-SA 3.0 IGO license.
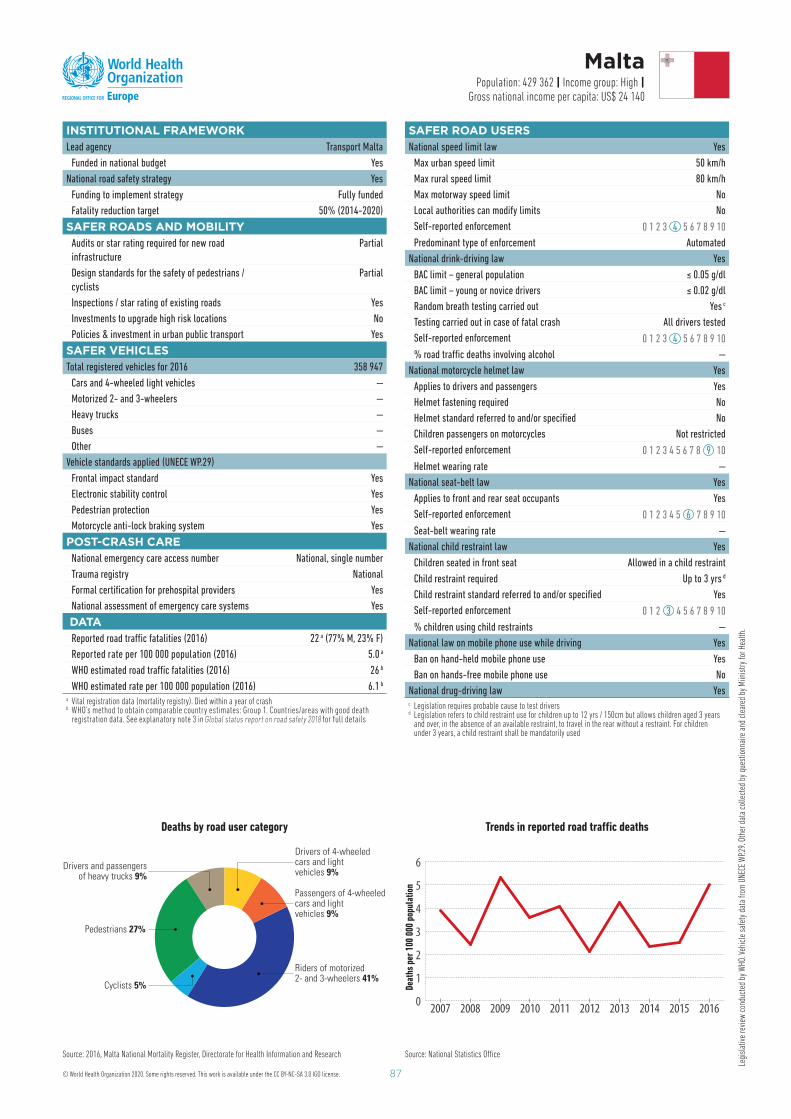
87
Legi
slat
ive
revi
ew c
ondu
cted
by
WHO
. Veh
icle
saf
ety
data
from
UNE
CE W
P.29.
Oth
er d
ata
colle
cted
by
ques
tionn
aire
and
cle
ared
by
Miin
istry
for H
ealth
.
INSTITUTIONAL FRAMEWORKLead agency Transport Malta
Funded in national budget Yes
National road safety strategy Yes
Funding to implement strategy Fully funded
Fatality reduction target 50% (2014-2020)
SAFER ROADS AND MOBILITY Audits or star rating required for new road
infrastructure
Partial
Design standards for the safety of pedestrians /
cyclists
Partial
Inspections / star rating of existing roads Yes
Investments to upgrade high risk locations No
Policies & investment in urban public transport Yes
SAFER VEHICLES Total registered vehicles for 2016 358 947
Cars and 4-wheeled light vehicles —
Motorized 2- and 3-wheelers —
Heavy trucks —
Buses —
Other —
Vehicle standards applied (UNECE WP.29)
Frontal impact standard Yes
Electronic stability control Yes
Pedestrian protection Yes
Motorcycle anti-lock braking system Yes
POST-CRASH CARENational emergency care access number National, single number
Trauma registry National
Formal certifi cation for prehospital providers Yes
National assessment of emergency care systems Yes
DATAReported road traffi c fatalities (2016) 22 a ( 77 % M, 23 % F)
Reported rate per 100 000 population (2016) 5.0 a
WHO estimated road traffi c fatalities (2016) 26 b
WHO estimated rate per 100 000 population (2016) 6.1 b
a Vital registration data (mortality registry). Died within a year of crash b WHO’s method to obtain comparable country estimates: Group 1. Countries/areas with good death
registration data. See explanatory note 3 in Global status report on road safety 2018 for full details
Malta Population: 429 362 | Income group: High |
Gross national income per capita: US$ 24 140
Deaths by road user category
Drivers of 4-wheeledcars and lightvehicles 9%
Passengers of 4-wheeledcars and lightvehicles 9%
Riders of motorized2- and 3-wheelers 41%
Cyclists 5%
Pedestrians 27%
Drivers and passengersof heavy trucks 9%
Source: 2016, Malta National Mortality Register, Directorate for Health Information and Research Source: National Statistics Offi ce
0
1
2
3
4
5
6
2016201520142013201220112010200920082007
SAFER ROAD USERSNational speed limit law Yes
Max urban speed limit 50 km/h
Max rural speed limit 80 km/h
Max motorway speed limit No
Local authorities can modify limits No
Self-reported enforcement 0 1 2 3 4 5 6 7 8 9 10
Predominant type of enforcement Automated
National drink-driving law Yes
BAC limit – general population ≤ 0.05 g/dl
BAC limit – young or novice drivers ≤ 0.02 g/dl
Random breath testing carried out Yes c
Testing carried out in case of fatal crash All drivers tested
Self-reported enforcement 0 1 2 3 4 5 6 7 8 9 10
% road traffi c deaths involving alcohol —
National motorcycle helmet law Yes
Applies to drivers and passengers Yes
Helmet fastening required No
Helmet standard referred to and/or specifi ed No
Children passengers on motorcycles Not restricted
Self-reported enforcement 0 1 2 3 4 5 6 7 8 9 10
Helmet wearing rate —
National seat-belt law Yes
Applies to front and rear seat occupants Yes
Self-reported enforcement 0 1 2 3 4 5 6 7 8 9 10
Seat-belt wearing rate —
National child restraint law Yes
Children seated in front seat Allowed in a child restraint
Child restraint required Up to 3 yrs d
Child restraint standard referred to and/or specifi ed Yes
Self-reported enforcement 0 1 2 3 4 5 6 7 8 9 10
% children using child restraints —
National law on mobile phone use while driving Yes
Ban on hand-held mobile phone use Yes
Ban on hands-free mobile phone use No
National drug-driving law Yes c Legislation requires probable cause to test drivers d Legislation refers to child restraint use for children up to 12 yrs / 150cm but allows children aged 3 years
and over, in the absence of an available restraint, to travel in the rear without a restraint. For children under 3 years, a child restraint shall be mandatorily used
Trends in reported road traffi c deaths
Deat
hs p
er 1
00 0
00 p
opul
atio
n
© World Health Organization 2020. Some rights reserved. This work is available under the CC BY-NC-SA 3.0 IGO license.
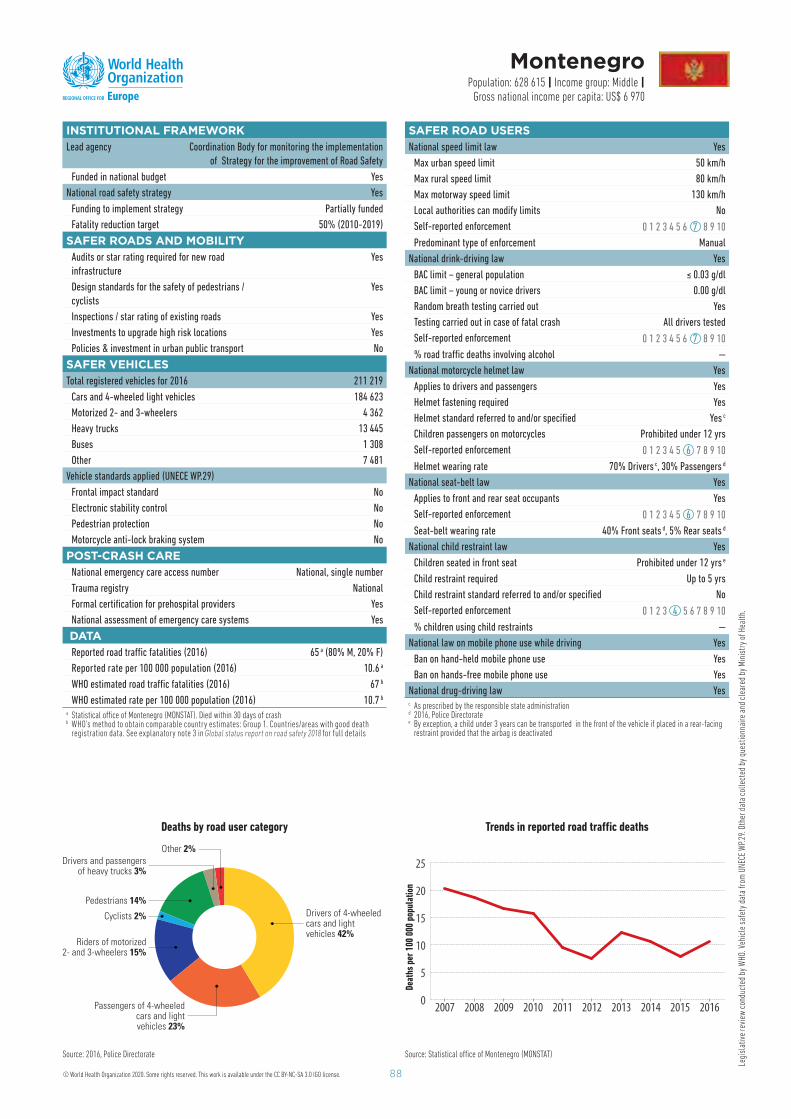
88
Legi
slat
ive
revi
ew c
ondu
cted
by
WHO
. Veh
icle
saf
ety
data
from
UNE
CE W
P.29
. Oth
er d
ata
colle
cted
by
ques
tionn
aire
and
cle
ared
by
Min
istr
y of
Hea
lth.
INSTITUTIONAL FRAMEWORKLead agency Coordination Body for monitoring the implementation
of Strategy for the improvement of Road Safety
Funded in national budget Yes
National road safety strategy Yes
Funding to implement strategy Partially funded
Fatality reduction target 50% (2010-2019)
SAFER ROADS AND MOBILITY Audits or star rating required for new road
infrastructure
Yes
Design standards for the safety of pedestrians /
cyclists
Yes
Inspections / star rating of existing roads Yes
Investments to upgrade high risk locations Yes
Policies & investment in urban public transport No
SAFER VEHICLES Total registered vehicles for 2016 211 219
Cars and 4-wheeled light vehicles 184 623
Motorized 2- and 3-wheelers 4 362
Heavy trucks 13 445
Buses 1 308
Other 7 481
Vehicle standards applied (UNECE WP.29)
Frontal impact standard No
Electronic stability control No
Pedestrian protection No
Motorcycle anti-lock braking system No
POST-CRASH CARENational emergency care access number National, single number
Trauma registry National
Formal certifi cation for prehospital providers Yes
National assessment of emergency care systems Yes
DATAReported road traffi c fatalities (2016) 65 a ( 80 % M, 20 % F)
Reported rate per 100 000 population (2016) 10.6 a
WHO estimated road traffi c fatalities (2016) 67 b
WHO estimated rate per 100 000 population (2016) 10.7 b
a Statistical offi ce of Montenegro (MONSTAT). Died within 30 days of crash b WHO’s method to obtain comparable country estimates: Group 1. Countries/areas with good death
registration data. See explanatory note 3 in Global status report on road safety 2018 for full details
Montenegro Population: 628 615 | Income group: Middle |
Gross national income per capita: US$ 6 970
Deaths by road user category
Drivers of 4-wheeledcars and lightvehicles 42%
Passengers of 4-wheeledcars and lightvehicles 23%
Cyclists 2%
Pedestrians 14%
Riders of motorized2- and 3-wheelers 15%
Drivers and passengersof heavy trucks 3%
Other 2%
Source: 2016, Police Directorate Source: Statistical offi ce of Montenegro (MONSTAT)
0
5
10
15
20
25
2016201520142013201220112010200920082007
SAFER ROAD USERSNational speed limit law Yes
Max urban speed limit 50 km/h
Max rural speed limit 80 km/h
Max motorway speed limit 130 km/h
Local authorities can modify limits No
Self-reported enforcement 0 1 2 3 4 5 6 7 8 9 10
Predominant type of enforcement Manual
National drink-driving law Yes
BAC limit – general population ≤ 0.03 g/dl
BAC limit – young or novice drivers 0.00 g/dl
Random breath testing carried out Yes
Testing carried out in case of fatal crash All drivers tested
Self-reported enforcement 0 1 2 3 4 5 6 7 8 9 10
% road traffi c deaths involving alcohol —
National motorcycle helmet law Yes
Applies to drivers and passengers Yes
Helmet fastening required Yes
Helmet standard referred to and/or specifi ed Yes c
Children passengers on motorcycles Prohibited under 12 yrs
Self-reported enforcement 0 1 2 3 4 5 6 7 8 9 10
Helmet wearing rate 70% Drivers c , 30% Passengers d
National seat-belt law Yes
Applies to front and rear seat occupants Yes
Self-reported enforcement 0 1 2 3 4 5 6 7 8 9 10
Seat-belt wearing rate 40% Front seats d , 5% Rear seats d
National child restraint law Yes
Children seated in front seat Prohibited under 12 yrs e
Child restraint required Up to 5 yrs
Child restraint standard referred to and/or specifi ed No
Self-reported enforcement 0 1 2 3 4 5 6 7 8 9 10
% children using child restraints —
National law on mobile phone use while driving Yes
Ban on hand-held mobile phone use Yes
Ban on hands-free mobile phone use Yes
National drug-driving law Yes c As prescribed by the responsible state administrationd 2016, Police Directoratee By exception, a child under 3 years can be transported in the front of the vehicle if placed in a rear-facing
restraint provided that the airbag is deactivated
Trends in reported road traffi c deaths
Deat
hs p
er 1
00 0
00 p
opul
atio
n
© World Health Organization 2020. Some rights reserved. This work is available under the CC BY-NC-SA 3.0 IGO license.
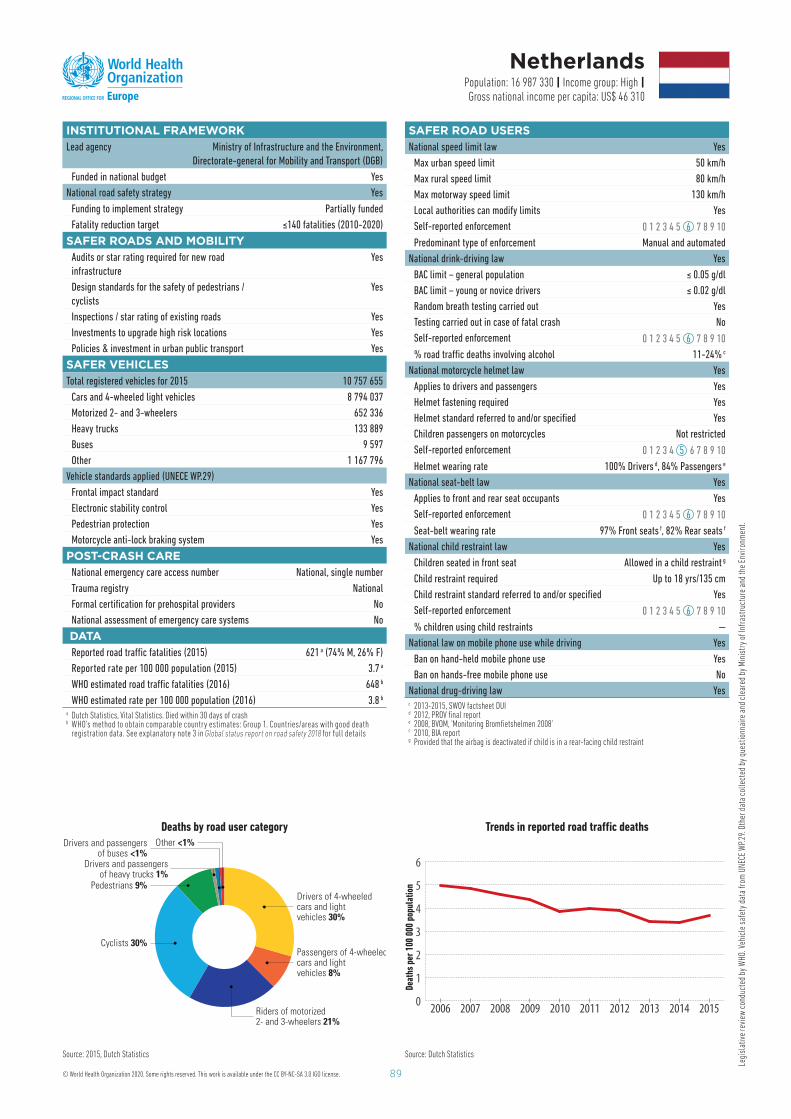
89
Legi
slat
ive
revi
ew c
ondu
cted
by
WHO
. Veh
icle
saf
ety
data
from
UNE
CE W
P.29
. Oth
er d
ata
colle
cted
by
ques
tionn
aire
and
cle
ared
by
Min
istr
y of
Infr
astr
uctu
re a
nd th
e En
viro
nmen
t.
INSTITUTIONAL FRAMEWORKLead agency Ministry of Infrastructure and the Environment,
Directorate-general for Mobility and Transport (DGB)
Funded in national budget Yes
National road safety strategy Yes
Funding to implement strategy Partially funded
Fatality reduction target ≤140 fatalities (2010-2020)
SAFER ROADS AND MOBILITY Audits or star rating required for new road
infrastructure
Yes
Design standards for the safety of pedestrians /
cyclists
Yes
Inspections / star rating of existing roads Yes
Investments to upgrade high risk locations Yes
Policies & investment in urban public transport Yes
SAFER VEHICLES Total registered vehicles for 2015 10 757 655
Cars and 4-wheeled light vehicles 8 794 037
Motorized 2- and 3-wheelers 652 336
Heavy trucks 133 889
Buses 9 597
Other 1 167 796
Vehicle standards applied (UNECE WP.29)
Frontal impact standard Yes
Electronic stability control Yes
Pedestrian protection Yes
Motorcycle anti-lock braking system Yes
POST-CRASH CARENational emergency care access number National, single number
Trauma registry National
Formal certifi cation for prehospital providers No
National assessment of emergency care systems No
DATAReported road traffi c fatalities (2015) 621 a ( 74 % M, 26 % F)
Reported rate per 100 000 population (2015) 3.7 a
WHO estimated road traffi c fatalities (2016) 648 b
WHO estimated rate per 100 000 population (2016) 3.8 b
a Dutch Statistics, Vital Statistics. Died within 30 days of crash b WHO’s method to obtain comparable country estimates: Group 1. Countries/areas with good death
registration data. See explanatory note 3 in Global status report on road safety 2018 for full details
Netherlands Population: 16 987 330 | Income group: High |Gross national income per capita: US$ 46 310
Deaths by road user category
Drivers of 4-wheeledcars and lightvehicles 30%
Passengers of 4-wheeledcars and lightvehicles 8%
Riders of motorized2- and 3-wheelers 21%
Cyclists 30%
Pedestrians 9%
Drivers and passengersof heavy trucks 1%
Drivers and passengersof buses <1%
Other <1%
Source: 2015, Dutch Statistics Source: Dutch Statistics
0
1
2
3
4
5
6
2015201420132012201120102009200820072006
SAFER ROAD USERSNational speed limit law Yes
Max urban speed limit 50 km/h
Max rural speed limit 80 km/h
Max motorway speed limit 130 km/h
Local authorities can modify limits Yes
Self-reported enforcement 0 1 2 3 4 5 6 7 8 9 10
Predominant type of enforcement Manual and automated
National drink-driving law Yes
BAC limit – general population ≤ 0.05 g/dl
BAC limit – young or novice drivers ≤ 0.02 g/dl
Random breath testing carried out Yes
Testing carried out in case of fatal crash No
Self-reported enforcement 0 1 2 3 4 5 6 7 8 9 10
% road traffi c deaths involving alcohol 11-24% c
National motorcycle helmet law Yes
Applies to drivers and passengers Yes
Helmet fastening required Yes
Helmet standard referred to and/or specifi ed Yes
Children passengers on motorcycles Not restricted
Self-reported enforcement 0 1 2 3 4 5 6 7 8 9 10
Helmet wearing rate 100% Drivers d , 84% Passengers e
National seat-belt law Yes
Applies to front and rear seat occupants Yes
Self-reported enforcement 0 1 2 3 4 5 6 7 8 9 10
Seat-belt wearing rate 97% Front seats f , 82% Rear seats f
National child restraint law Yes
Children seated in front seat Allowed in a child restraint g
Child restraint required U p to 18 yrs /135 cm
Child restraint standard referred to and/or specifi ed Yes
Self-reported enforcement 0 1 2 3 4 5 6 7 8 9 10
% children using child restraints —
National law on mobile phone use while driving Yes
Ban on hand-held mobile phone use Yes
Ban on hands-free mobile phone use No
National drug-driving law Yes c 2013-2015, SWOV factsheet DUId 2012, PROV fi nal reporte 2008, BVOM, ‘Monitoring Bromfi etshelmen 2008’ f 2010, BIA reportg Provided that the airbag is deactivated if child is in a rear-facing child restraint
Trends in reported road traffi c deaths
Deat
hs p
er 1
00 0
00 p
opul
atio
n
© World Health Organization 2020. Some rights reserved. This work is available under the CC BY-NC-SA 3.0 IGO license.
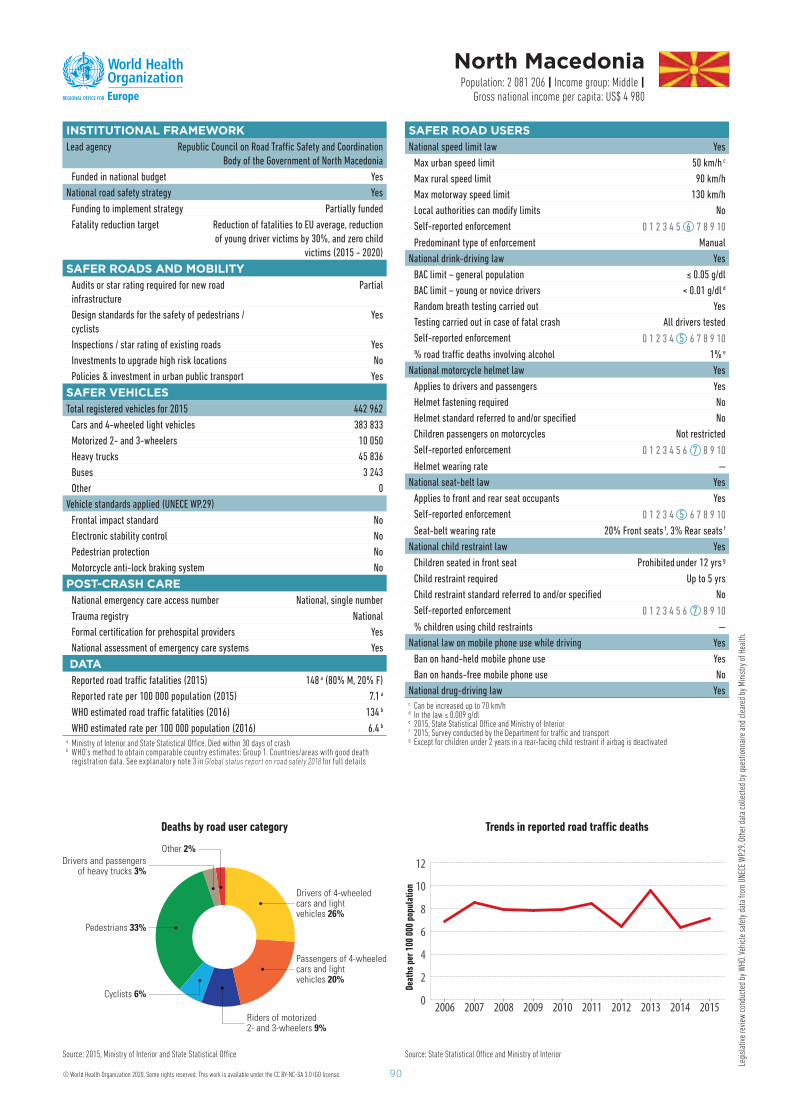
90
Legi
slat
ive
revi
ew c
ondu
cted
by
WHO
. Veh
icle
saf
ety
data
from
UNE
CE W
P.29.
Oth
er d
ata
colle
cted
by
ques
tionn
aire
and
cle
ared
by
Min
istry
of H
ealth
.
INSTITUTIONAL FRAMEWORKLead agency Republic Council on Road Traffi c Safety and Coordination
Body of the Government of North Macedonia
Funded in national budget Yes
National road safety strategy Yes
Funding to implement strategy Partially funded
Fatality reduction target Reduction of fatalities to EU average, reduction
of young driver victims by 30%, and zero child
victims (2015 - 2020)
SAFER ROADS AND MOBILITY Audits or star rating required for new road
infrastructure
Partial
Design standards for the safety of pedestrians /
cyclists
Yes
Inspections / star rating of existing roads Yes
Investments to upgrade high risk locations No
Policies & investment in urban public transport Yes
SAFER VEHICLES Total registered vehicles for 2015 442 962
Cars and 4-wheeled light vehicles 383 833
Motorized 2- and 3-wheelers 10 050
Heavy trucks 45 836
Buses 3 243
Other 0
Vehicle standards applied (UNECE WP.29)
Frontal impact standard No
Electronic stability control No
Pedestrian protection No
Motorcycle anti-lock braking system No
POST-CRASH CARENational emergency care access number National, single number
Trauma registry National
Formal certifi cation for prehospital providers Yes
National assessment of emergency care systems Yes
DATAReported road traffi c fatalities (2015) 148 a ( 80 % M, 20 % F)
Reported rate per 100 000 population (2015) 7.1 a
WHO estimated road traffi c fatalities (2016) 134 b
WHO estimated rate per 100 000 population (2016) 6.4 b
a Ministry of Interior and State Statistical Offi ce. Died within 30 days of crash b WHO’s method to obtain comparable country estimates: Group 1. Countries/areas with good death
registration data. See explanatory note 3 in Global status report on road safety 2018 for full details
North Macedonia Population: 2 081 206 | Income group: Middle |
Gross national income per capita: US$ 4 980
Deaths by road user category
Drivers of 4-wheeledcars and lightvehicles 26%
Passengers of 4-wheeledcars and lightvehicles 20%
Riders of motorized2- and 3-wheelers 9%
Cyclists 6%
Pedestrians 33%
Drivers and passengersof heavy trucks 3%
Other 2%
Source: 2015, Ministry of Interior and State Statistical Offi ce Source: State Statistical Offi ce and Ministry of Interior
0
2
4
6
8
10
12
2015201420132012201120102009200820072006
SAFER ROAD USERSNational speed limit law Yes
Max urban speed limit 50 km/h c
Max rural speed limit 90 km/h
Max motorway speed limit 130 km/h
Local authorities can modify limits No
Self-reported enforcement 0 1 2 3 4 5 6 7 8 9 10
Predominant type of enforcement Manual
National drink-driving law Yes
BAC limit – general population ≤ 0.05 g/dl
BAC limit – young or novice drivers < 0.01 g/dl d
Random breath testing carried out Yes
Testing carried out in case of fatal crash All drivers tested
Self-reported enforcement 0 1 2 3 4 5 6 7 8 9 10
% road traffi c deaths involving alcohol 1% e
National motorcycle helmet law Yes
Applies to drivers and passengers Yes
Helmet fastening required No
Helmet standard referred to and/or specifi ed No
Children passengers on motorcycles Not restricted
Self-reported enforcement 0 1 2 3 4 5 6 7 8 9 10
Helmet wearing rate —
National seat-belt law Yes
Applies to front and rear seat occupants Yes
Self-reported enforcement 0 1 2 3 4 5 6 7 8 9 10
Seat-belt wearing rate 20% Front seats f , 3% Rear seats f
National child restraint law Yes
Children seated in front seat Prohibited under 12 yrs g
Child restraint required U p to 5 yrs
Child restraint standard referred to and/or specifi ed No
Self-reported enforcement 0 1 2 3 4 5 6 7 8 9 10
% children using child restraints —
National law on mobile phone use while driving Yes
Ban on hand-held mobile phone use Yes
Ban on hands-free mobile phone use No
National drug-driving law Yes c Can be increased up to 70 km/hd In the law ≤ 0.009 g/dle 2015, State Statistical Offi ce and Ministry of Interiorf 2015, Survey conducted by the Department for traffi c and transportg Except for children under 2 years in a rear-facing child restraint if airbag is deactivated
Trends in reported road traffi c deaths
Deat
hs p
er 1
00 0
00 p
opul
atio
n
© World Health Organization 2020. Some rights reserved. This work is available under the CC BY-NC-SA 3.0 IGO license.

91
Legi
slat
ive
revi
ew c
ondu
cted
by
WHO
. Veh
icle
saf
ety
data
from
UNE
CE W
P.29
. Oth
er d
ata
colle
cted
by
ques
tionn
aire
and
cle
ared
by
Norw
egia
n Pu
blic
Roa
d Ad
min
istr
atio
n.
INSTITUTIONAL FRAMEWORKLead agency The Norwegian Public Road Administration
Funded in national budget Yes
National road safety strategy Yes
Funding to implement strategy F ully funded
Fatality reduction target Deaths and serious injuries ≤500
(2014-2023)
SAFER ROADS AND MOBILITY Audits or star rating required for new road
infrastructure
Yes
Design standards for the safety of pedestrians /
cyclists
Partial
Inspections / star rating of existing roads Yes
Investments to upgrade high risk locations Yes
Policies & investment in urban public transport Yes
SAFER VEHICLES Total registered vehicles for 2016 3 969 612
Cars and 4-wheeled light vehicles 3 147 101
Motorized 2- and 3-wheelers 305 265
Heavy trucks 74 622
Buses 16 258
Other 426 366
Vehicle standards applied (UNECE WP.29)
Frontal impact standard Yes
Electronic stability control Yes
Pedestrian protection Yes
Motorcycle anti-lock braking system Yes
POST-CRASH CARENational emergency care access number National, single number
Trauma registry National
Formal certifi cation for prehospital providers Yes
National assessment of emergency care systems Yes
DATAReported road traffi c fatalities (2016) 135 a ( 82 % M, 18 % F)
Reported rate per 100 000 population (2016) 2.6 a
WHO estimated road traffi c fatalities (2016) 143 b
WHO estimated rate per 100 000 population (2016) 2.7 b
a Statistics Norway . Died within 30 days of crashb WHO’s method to obtain comparable country estimates: Group 1. Countries/areas with good death
registration data. See explanatory note 3 in Global status report on road safety 2018 for full details
Norway Population: 5 254 694 | Income group: High |Gross national income per capita: US$ 82 330
Deaths by road user category
Drivers of 4-wheeledcars and lightvehicles 39%
Passengers of 4-wheeledcars and lightvehicles 11%
Riders of motorized2- and 3-wheelers 17%
Cyclists 9%
Drivers and passengersof heavy trucks 4%
Drivers and passengersof buses <1%
Other 8%
Pedestrians 12%
Source: 2016, Norwegian Public Roads database (STRAKS) Source: Statistics Norway
0
1
2
3
4
5
6
2016201520142013201220112010200920082007
SAFER ROAD USERSNational speed limit law Yes
Max urban speed limit 50 km/h
Max rural speed limit 80 km/h
Max motorway speed limit 100 km/h
Local authorities can modify limits Yes
Self-reported enforcement 0 1 2 3 4 5 6 7 8 9 10
Predominant type of enforcement Manual and automated
National drink-driving law Yes
BAC limit – general population ≤ 0.02 g/dl
BAC limit – young or novice drivers ≤ 0.02 g/dl
Random breath testing carried out Yes
Testing carried out in case of fatal crash Some drivers tested
Self-reported enforcement 0 1 2 3 4 5 6 7 8 9 10
% road traffi c deaths involving alcohol 13% c
National motorcycle helmet law Yes
Applies to drivers and passengers Yes
Helmet fastening required No
Helmet standard referred to and/or specifi ed Yes
Children passengers on motorcycles Not restricted
Self-reported enforcement 0 1 2 3 4 5 6 7 8 9 10
Helmet wearing rate 99% Drivers d , 99% Passengers d
National seat-belt law Yes
Applies to front and rear seat occupants Yes
Self-reported enforcement 0 1 2 3 4 5 6 7 8 9 10
Seat-belt wearing rate 96-98% Drivers e , 95-96% Front seats e
National child restraint law Yes
Children seated in front seat Allowed in a child restraint f
Child restraint required 135-150 cm g
Child restraint standard referred to and/or specifi ed Yes
Self-reported enforcement 0 1 2 3 4 5 6 7 8 9 10
% children using child restraints —
National law on mobile phone use while driving Yes
Ban on hand-held mobile phone use Yes
Ban on hands-free mobile phone use No
National drug-driving law Yes c 2015, Road safety, environmental and technology department, 2015 state of road safety reportd 2010, Statistics Norwaye 2016, The Norwegian Public Road Administration (Percentages refl ect "urban" and "outside urban" areas,
respectively) f Provided that the airbag is deactivated if child is in a rear-facing child restraintg Child restraints are required for children under 150 cm. By exception, children of height 135-150 cm can be
restrained with a seat belt only if sitting in the rear
Trends in reported road traffi c deaths
Deat
hs p
er 1
00 0
00 p
opul
atio
n
© World Health Organization 2020. Some rights reserved. This work is available under the CC BY-NC-SA 3.0 IGO license.

92
Legi
slat
ive
revi
ew c
ondu
cted
by
WHO
. Veh
icle
saf
ety
data
from
UNE
CE W
P.29
. Oth
er d
ata
colle
cted
by
ques
tionn
aire
and
cle
ared
by
Min
istr
y of
Infr
astr
uctu
re.
INSTITUTIONAL FRAMEWORKLead agency National Road Safety Council
Funded in national budget Yes
National road safety strategy Yes
Funding to implement strategy Partially funded
Fatality reduction target 50% (2013-2020)
SAFER ROADS AND MOBILITY Audits or star rating required for new road
infrastructure
Partial
Design standards for the safety of pedestrians /
cyclists
Yes
Inspections / star rating of existing roads Yes
Investments to upgrade high risk locations Yes
Policies & investment in urban public transport Yes
SAFER VEHICLES Total registered vehicles for 2015 27 409 106
Cars and 4-wheeled light vehicles 20 723 423
Motorized 2- and 3-wheelers 2 531 520
Heavy trucks 3 098 376
Buses 109 844
Other 945 943
Vehicle standards applied (UNECE WP.29)
Frontal impact standard Yes
Electronic stability control Yes
Pedestrian protection Yes
Motorcycle anti-lock braking system Yes
POST-CRASH CARENational emergency care access number National, single number
Trauma registry None
Formal certifi cation for prehospital providers No
National assessment of emergency care systems No
DATAReported road traffi c fatalities (2016) 3 026 a ( 75 % M, 25 % F)
Reported rate per 100 000 population (2016) 7.9 a
WHO estimated road traffi c fatalities (2016) 3 698 b
WHO estimated rate per 100 000 population (2016) 9.7 b
a SEWiK Police Database (Traffi c accidents and collisions reporting system). Died within 30 days of crashb WHO’s method to obtain comparable country estimates: Group 1. Countries/areas with good death
registration data. See explanatory note 3 in Global status report on road safety 2018 for full details
Poland Population: 38 224 408 | Income group: High |Gross national income per capita: US$ 12 680
Deaths by road user category
Drivers of 4-wheeledcars and lightvehicles 29%
Passengers of 4-wheeledcars and lightvehicles 18%
Riders of motorized2- and 3-wheelers 11%
Cyclists 9%
Pedestrians 29%
Drivers and passengersof heavy trucks 3%
Drivers and passengersof buses <1%
Other 1%
Source: 2016, SEWiK Police Database (Traffi c accidents and collisions reporting system) Source: SEWiK Police Database (Traffi c accidents and collisions reporting system)
0
4
8
12
16
20
2016201520142013201220112010200920082007
SAFER ROAD USERSNational speed limit law Yes
Max urban speed limit 50 km/h c
Max rural speed limit 90 km/h
Max motorway speed limit 140 km/h
Local authorities can modify limits Yes
Self-reported enforcement 0 1 2 3 4 5 6 7 8 9 10
Predominant type of enforcement Manual
National drink-driving law Yes
BAC limit – general population < 0.02 g/dl
BAC limit – young or novice drivers < 0.02 g/dl
Random breath testing carried out Yes
Testing carried out in case of fatal crash All drivers tested
Self-reported enforcement 0 1 2 3 4 5 6 7 8 9 10
% road traffi c deaths involving alcohol 13% d
National motorcycle helmet law Yes
Applies to drivers and passengers Yes
Helmet fastening required No
Helmet standard referred to and/or specifi ed Yes
Children passengers on motorcycles Not restricted e
Self-reported enforcement 0 1 2 3 4 5 6 7 8 9 10
Helmet wearing rate 99% Drivers f , 100% Passengers f
National seat-belt law Yes
Applies to front and rear seat occupants Yes
Self-reported enforcement 0 1 2 3 4 5 6 7 8 9 10
Seat-belt wearing rate 96% Front seats g , 76% Rear seats g
National child restraint law Yes
Children seated in front seat Allowed in a child restraint h
Child restraint required 135-150 cm i
Child restraint standard referred to and/or specifi ed Yes
Self-reported enforcement 0 1 2 3 4 5 6 7 8 9 10
% children using child restraints 93% j
National law on mobile phone use while driving Yes
Ban on hand-held mobile phone use Yes
Ban on hands-free mobile phone use No
National drug-driving law Yes c 60 km/h from 23:00 - 05:00d 2016, SEWiK Police Database (Traffi c accidents and collisions reporting system)e Speed limit for motorcycles transporting a child under 7 years is limited to 40 km/hf 2015, Ministry of Infrastructure and Development, Using of motorcycle helmet in Poland 2015g 2015, Ministry of Infrastructure and Development, Using of seat belts in Poland 2015h Provided that airbag is deactivated if child is in a rear-facing restrainti Child restraints are required for children under 150 cm. By exception, children of height 135-150 cm can be
restrained with a seat belt only if sitting in the rearj 2015, Ministry of Infrastructure and Development, Using of child restraints device in Poland 2015a
Trends in reported road traffi c deaths
Deat
hs p
er 1
00 0
00 p
opul
atio
n
© World Health Organization 2020. Some rights reserved. This work is available under the CC BY-NC-SA 3.0 IGO license.
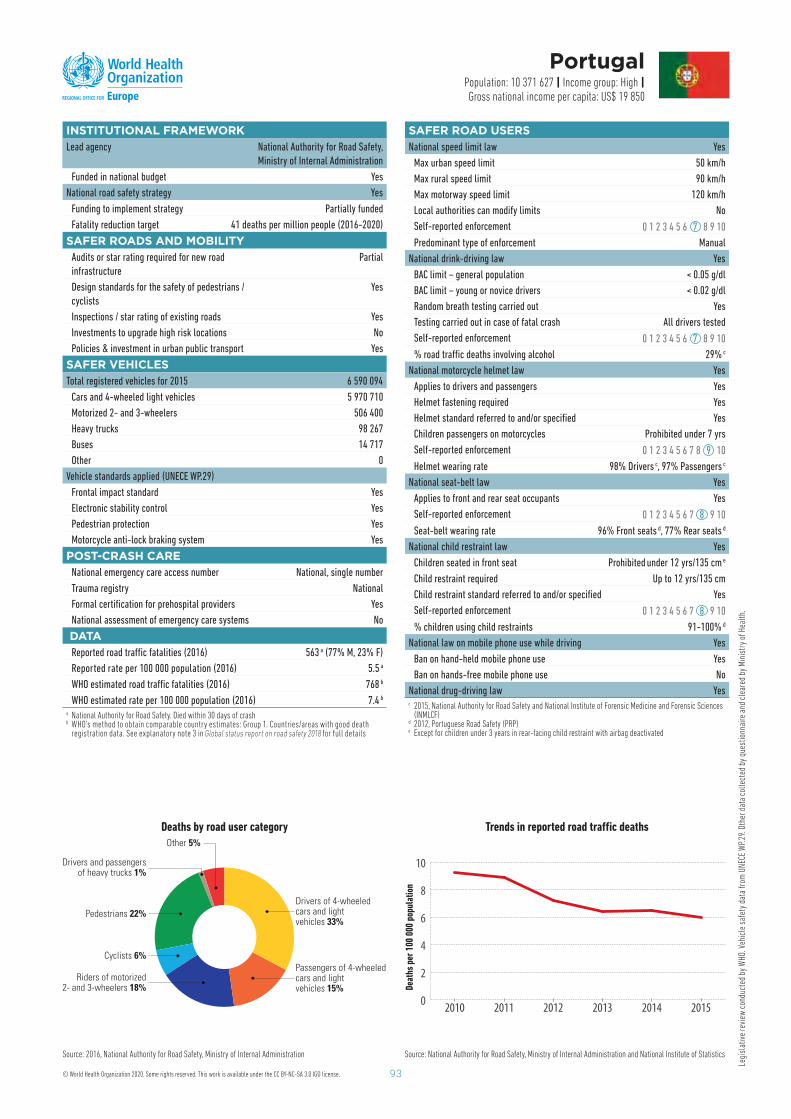
93
Legi
slat
ive
revi
ew c
ondu
cted
by
WHO
. Veh
icle
saf
ety
data
from
UNE
CE W
P.29
. Oth
er d
ata
colle
cted
by
ques
tionn
aire
and
cle
ared
by
Min
istr
y of
Hea
lth.
INSTITUTIONAL FRAMEWORKLead agency National Authority for Road Safety,
Ministry of Internal Administration
Funded in national budget Yes
National road safety strategy Yes
Funding to implement strategy Partially funded
Fatality reduction target 41 deaths per million people ( 2016-2020)
SAFER ROADS AND MOBILITY Audits or star rating required for new road
infrastructure
Partial
Design standards for the safety of pedestrians /
cyclists
Yes
Inspections / star rating of existing roads Yes
Investments to upgrade high risk locations No
Policies & investment in urban public transport Yes
SAFER VEHICLES Total registered vehicles for 2015 6 590 094
Cars and 4-wheeled light vehicles 5 970 710
Motorized 2- and 3-wheelers 506 400
Heavy trucks 98 267
Buses 14 717
Other 0
Vehicle standards applied (UNECE WP.29)
Frontal impact standard Yes
Electronic stability control Yes
Pedestrian protection Yes
Motorcycle anti-lock braking system Yes
POST-CRASH CARENational emergency care access number National, single number
Trauma registry National
Formal certifi cation for prehospital providers Yes
National assessment of emergency care systems No
DATAReported road traffi c fatalities (2016) 563 a (77% M, 23% F)
Reported rate per 100 000 population (2016) 5.5 a
WHO estimated road traffi c fatalities (2016) 768 b
WHO estimated rate per 100 000 population (2016) 7.4 b
a National Authority for Road Safety. Died within 30 days of crash b WHO’s method to obtain comparable country estimates: Group 1. Countries/areas with good death
registration data. See explanatory note 3 in Global status report on road safety 2018 for full details
Portugal Population: 10 371 627 | Income group: High |Gross national income per capita: US$ 19 850
Deaths by road user category
Drivers of 4-wheeledcars and lightvehicles 33%
Passengers of 4-wheeledcars and lightvehicles 15%
Cyclists 6%
Pedestrians 22%
Drivers and passengersof heavy trucks 1%
Riders of motorized2- and 3-wheelers 18%
Other 5%
Source: 2016, National Authority for Road Safety, Ministry of Internal Administration Source: National Authority for Road Safety, Ministry of Internal Administration and National Institute of Statistics
0
2
4
6
8
10
201520142013201220112010
SAFER ROAD USERSNational speed limit law Yes
Max urban speed limit 50 km/h
Max rural speed limit 90 km/h
Max motorway speed limit 120 km/h
Local authorities can modify limits No
Self-reported enforcement 0 1 2 3 4 5 6 7 8 9 10
Predominant type of enforcement Manual
National drink-driving law Yes
BAC limit – general population < 0.05 g/dl
BAC limit – young or novice drivers < 0.02 g/dl
Random breath testing carried out Yes
Testing carried out in case of fatal crash All drivers tested
Self-reported enforcement 0 1 2 3 4 5 6 7 8 9 10
% road traffi c deaths involving alcohol 29% c
National motorcycle helmet law Yes
Applies to drivers and passengers Yes
Helmet fastening required Yes
Helmet standard referred to and/or specifi ed Yes
Children passengers on motorcycles Prohibited under 7 yrs
Self-reported enforcement 0 1 2 3 4 5 6 7 8 9 10
Helmet wearing rate 98% Drivers c , 97% Passengers c
National seat-belt law Yes
Applies to front and rear seat occupants Yes
Self-reported enforcement 0 1 2 3 4 5 6 7 8 9 10
Seat-belt wearing rate 96% Front seats d , 77% Rear seats d
National child restraint law Yes
Children seated in front seat Prohibited under 12 yrs/135 cm e
Child restraint required Up to 12 yrs /135 cm
Child restraint standard referred to and/or specifi ed Yes
Self-reported enforcement 0 1 2 3 4 5 6 7 8 9 10
% children using child restraints 91-100% d
National law on mobile phone use while driving Yes
Ban on hand-held mobile phone use Yes
Ban on hands-free mobile phone use No
National drug-driving law Yes c 2015, National Authority for Road Safety and National Institute of Forensic Medicine and Forensic Sciences
(INMLCF)d 2012, Portuguese Road Safety (PRP) e Except for children under 3 years in rear-facing child restraint with airbag deactivated
Trends in reported road traffi c deaths
Deat
hs p
er 1
00 0
00 p
opul
atio
n
© World Health Organization 2020. Some rights reserved. This work is available under the CC BY-NC-SA 3.0 IGO license.
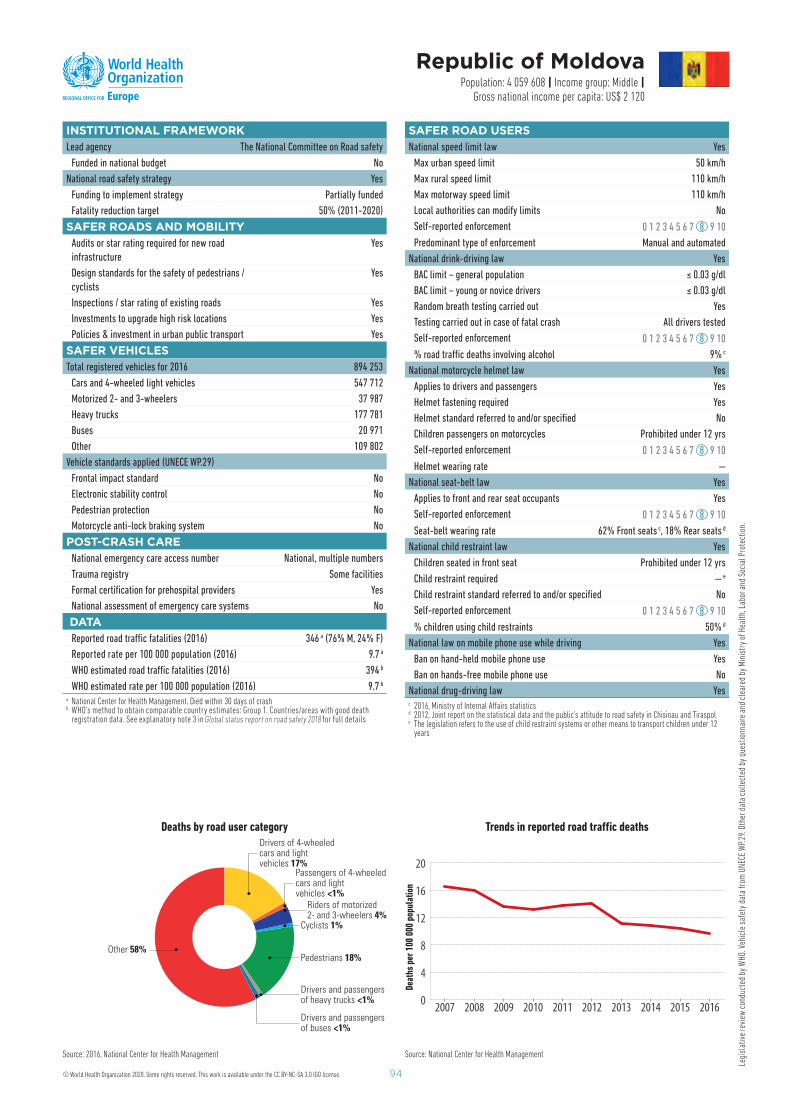
94
Legi
slat
ive
revi
ew c
ondu
cted
by
WHO
. Veh
icle
saf
ety
data
from
UNE
CE W
P.29
. Oth
er d
ata
colle
cted
by
ques
tionn
aire
and
cle
ared
by
Min
istr
y of
Hea
lth, L
abor
and
Soc
ial P
rote
ctio
n.
INSTITUTIONAL FRAMEWORKLead agency The National Committee on Road safety
Funded in national budget No
National road safety strategy Yes
Funding to implement strategy Partially funded
Fatality reduction target 50% (2011-2020)
SAFER ROADS AND MOBILITY Audits or star rating required for new road
infrastructure
Yes
Design standards for the safety of pedestrians /
cyclists
Yes
Inspections / star rating of existing roads Yes
Investments to upgrade high risk locations Yes
Policies & investment in urban public transport Yes
SAFER VEHICLES Total registered vehicles for 2016 894 253
Cars and 4-wheeled light vehicles 547 712
Motorized 2- and 3-wheelers 37 987
Heavy trucks 177 781
Buses 20 971
Other 109 802
Vehicle standards applied (UNECE WP.29)
Frontal impact standard No
Electronic stability control No
Pedestrian protection No
Motorcycle anti-lock braking system No
POST-CRASH CARENational emergency care access number National, multiple numbers
Trauma registry Some facilities
Formal certifi cation for prehospital providers Yes
National assessment of emergency care systems No
DATAReported road traffi c fatalities (2016) 346 a ( 76 % M, 24 % F)
Reported rate per 100 000 population (2016) 9.7 a
WHO estimated road traffi c fatalities (2016) 394 b
WHO estimated rate per 100 000 population (2016) 9.7 b
a National Center for Health Management. Died within 30 days of crashb WHO’s method to obtain comparable country estimates: Group 1. Countries/areas with good death
registration data. See explanatory note 3 in Global status report on road safety 2018 for full details
Republic of Moldova Population: 4 059 608 | Income group: Middle |
Gross national income per capita: US$ 2 120
Deaths by road user categoryDrivers of 4-wheeledcars and lightvehicles 17%
Passengers of 4-wheeledcars and lightvehicles <1%
Riders of motorized2- and 3-wheelers 4%
Drivers and passengersof heavy trucks <1%
Drivers and passengersof buses <1%
Other 58%
Cyclists 1%
Pedestrians 18%
Source: 2016, National Center for Health Management Source: National Center for Health Management
0
4
8
12
16
20
2016201520142013201220112010200920082007
SAFER ROAD USERSNational speed limit law Yes
Max urban speed limit 50 km/h
Max rural speed limit 110 km/h
Max motorway speed limit 110 km/h
Local authorities can modify limits No
Self-reported enforcement 0 1 2 3 4 5 6 7 8 9 10
Predominant type of enforcement Manual and automated
National drink-driving law Yes
BAC limit – general population ≤ 0.03 g/dl
BAC limit – young or novice drivers ≤ 0.03 g/dl
Random breath testing carried out Yes
Testing carried out in case of fatal crash All drivers tested
Self-reported enforcement 0 1 2 3 4 5 6 7 8 9 10
% road traffi c deaths involving alcohol 9% c
National motorcycle helmet law Yes
Applies to drivers and passengers Yes
Helmet fastening required Yes
Helmet standard referred to and/or specifi ed No
Children passengers on motorcycles Prohibited under 12 yrs
Self-reported enforcement 0 1 2 3 4 5 6 7 8 9 10
Helmet wearing rate —
National seat-belt law Yes
Applies to front and rear seat occupants Yes
Self-reported enforcement 0 1 2 3 4 5 6 7 8 9 10
Seat-belt wearing rate 62% Front seats c , 18% Rear seats d
National child restraint law Yes
Children seated in front seat Prohibited under 12 yrs
Child restraint required — e
Child restraint standard referred to and/or specifi ed No
Self-reported enforcement 0 1 2 3 4 5 6 7 8 9 10
% children using child restraints 50% d
National law on mobile phone use while driving Yes
Ban on hand-held mobile phone use Yes
Ban on hands-free mobile phone use No
National drug-driving law Yes c 2016, Ministry of Internal Aff airs statisticsd 2012, Joint report on the statistical data and the public's attitude to road safety in Chisinau and Tiraspole The legislation refers to the use of child restraint systems or other means to transport children under 12
years
Trends in reported road traffi c deaths
Deat
hs p
er 1
00 0
00 p
opul
atio
n
© World Health Organization 2020. Some rights reserved. This work is available under the CC BY-NC-SA 3.0 IGO license.
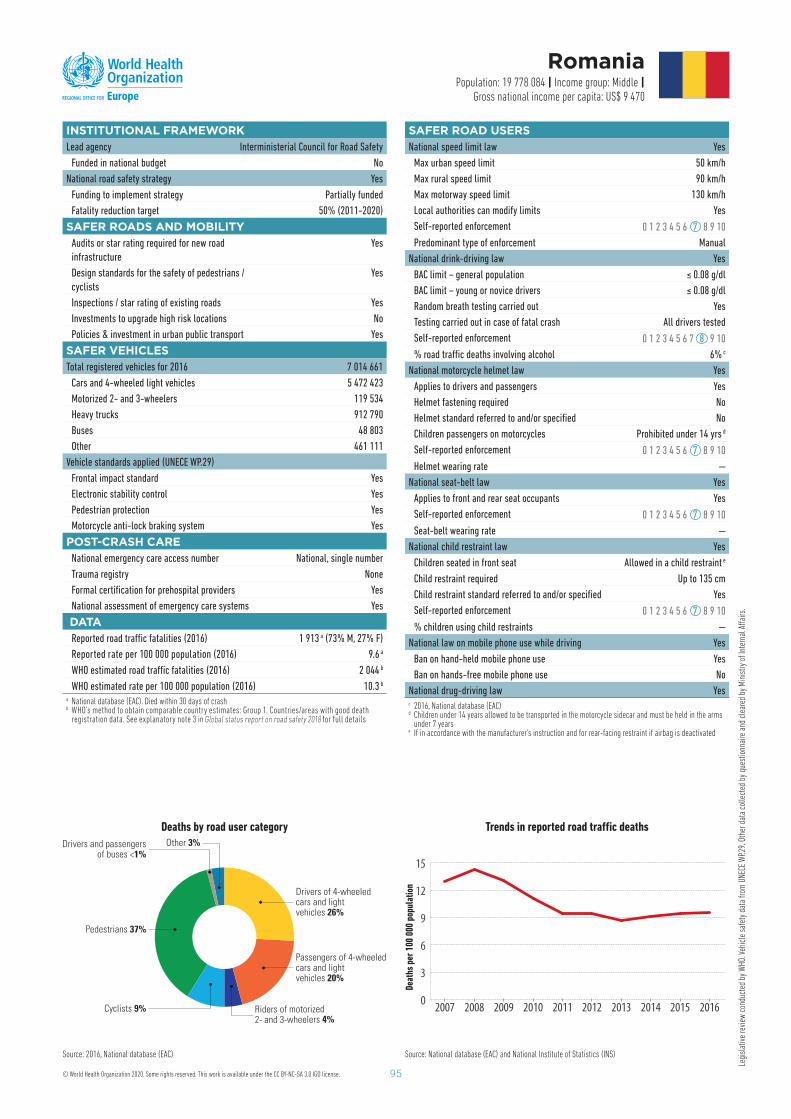
95
Legi
slat
ive
revi
ew c
ondu
cted
by
WHO
. Veh
icle
saf
ety
data
from
UNE
CE W
P.29.
Oth
er d
ata
colle
cted
by
ques
tionn
aire
and
cle
ared
by
Min
istry
of I
nter
nal A
ff airs
.
INSTITUTIONAL FRAMEWORKLead agency Interministerial Council for Road Safety
Funded in national budget No
National road safety strategy Yes
Funding to implement strategy Partially funded
Fatality reduction target 50% (2011-2020)
SAFER ROADS AND MOBILITY Audits or star rating required for new road
infrastructure
Yes
Design standards for the safety of pedestrians /
cyclists
Yes
Inspections / star rating of existing roads Yes
Investments to upgrade high risk locations No
Policies & investment in urban public transport Yes
SAFER VEHICLES Total registered vehicles for 2016 7 014 661
Cars and 4-wheeled light vehicles 5 472 423
Motorized 2- and 3-wheelers 119 534
Heavy trucks 912 790
Buses 48 803
Other 461 111
Vehicle standards applied (UNECE WP.29)
Frontal impact standard Yes
Electronic stability control Yes
Pedestrian protection Yes
Motorcycle anti-lock braking system Yes
POST-CRASH CARENational emergency care access number National, single number
Trauma registry None
Formal certifi cation for prehospital providers Yes
National assessment of emergency care systems Yes
DATAReported road traffi c fatalities (2016) 1 913 a ( 73 % M, 27 % F)
Reported rate per 100 000 population (2016) 9.6 a
WHO estimated road traffi c fatalities (2016) 2 044 b
WHO estimated rate per 100 000 population (2016) 10.3 b
a National database (EAC). Died within 30 days of crashb WHO’s method to obtain comparable country estimates: Group 1. Countries/areas with good death
registration data. See explanatory note 3 in Global status report on road safety 2018 for full details
Romania Population: 19 778 084 | Income group: Middle |
Gross national income per capita: US$ 9 470
Deaths by road user category
Drivers of 4-wheeledcars and lightvehicles 26%
Passengers of 4-wheeledcars and lightvehicles 20%
Riders of motorized2- and 3-wheelers 4%
Cyclists 9%
Pedestrians 37%
Drivers and passengersof buses <1%
Other 3%
Source: 2016, National database (EAC) Source: National database (EAC) and National Institute of Statistics (INS)
0
3
6
9
12
15
2016201520142013201220112010200920082007
SAFER ROAD USERSNational speed limit law Yes
Max urban speed limit 50 km/h
Max rural speed limit 90 km/h
Max motorway speed limit 130 km/h
Local authorities can modify limits Yes
Self-reported enforcement 0 1 2 3 4 5 6 7 8 9 10
Predominant type of enforcement Manual
National drink-driving law Yes
BAC limit – general population ≤ 0.08 g/dl
BAC limit – young or novice drivers ≤ 0.08 g/dl
Random breath testing carried out Yes
Testing carried out in case of fatal crash All drivers tested
Self-reported enforcement 0 1 2 3 4 5 6 7 8 9 10
% road traffi c deaths involving alcohol 6% c
National motorcycle helmet law Yes
Applies to drivers and passengers Yes
Helmet fastening required No
Helmet standard referred to and/or specifi ed No
Children passengers on motorcycles Prohibited under 14 yrs d
Self-reported enforcement 0 1 2 3 4 5 6 7 8 9 10
Helmet wearing rate —
National seat-belt law Yes
Applies to front and rear seat occupants Yes
Self-reported enforcement 0 1 2 3 4 5 6 7 8 9 10
Seat-belt wearing rate —
National child restraint law Yes
Children seated in front seat Allowed in a child restraint e
Child restraint required U p to 135 cm
Child restraint standard referred to and/or specifi ed Yes
Self-reported enforcement 0 1 2 3 4 5 6 7 8 9 10
% children using child restraints —
National law on mobile phone use while driving Yes
Ban on hand-held mobile phone use Yes
Ban on hands-free mobile phone use No
National drug-driving law Yes c 2016, National database (EAC)d Children under 14 years allowed to be transported in the motorcycle sidecar and must be held in the arms
under 7 yearse If in accordance with the manufacturer's instruction and for rear-facing restraint if airbag is deactivated
Trends in reported road traffi c deaths
Deat
hs p
er 1
00 0
00 p
opul
atio
n
© World Health Organization 2020. Some rights reserved. This work is available under the CC BY-NC-SA 3.0 IGO license.
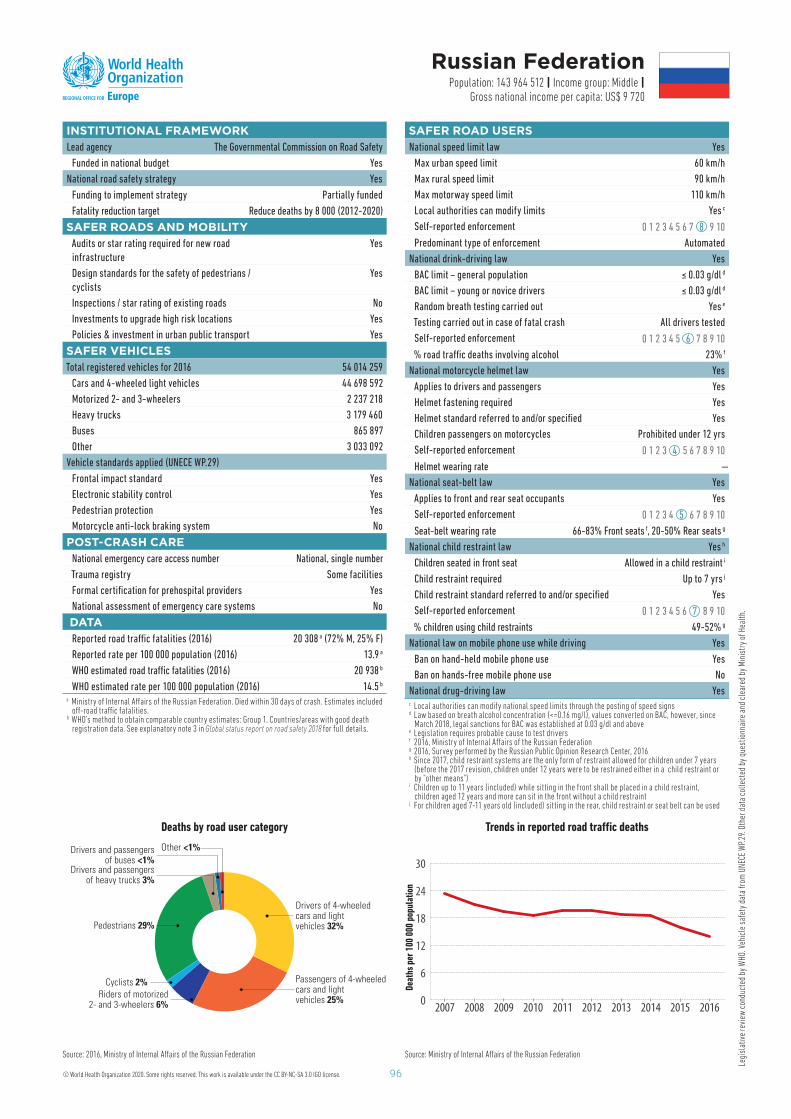
96
Legi
slat
ive
revi
ew c
ondu
cted
by
WHO
. Veh
icle
saf
ety
data
from
UNE
CE W
P.29
. Oth
er d
ata
colle
cted
by
ques
tionn
aire
and
cle
ared
by
Min
istr
y of
Hea
lth.
INSTITUTIONAL FRAMEWORKLead agency The Governmental Commission on Road Safety
Funded in national budget Yes
National road safety strategy Yes
Funding to implement strategy Partially funded
Fatality reduction target Reduce deaths by 8 000 (2012-2020)
SAFER ROADS AND MOBILITY Audits or star rating required for new road
infrastructure
Yes
Design standards for the safety of pedestrians /
cyclists
Yes
Inspections / star rating of existing roads No
Investments to upgrade high risk locations Yes
Policies & investment in urban public transport Yes
SAFER VEHICLES Total registered vehicles for 2016 54 014 259
Cars and 4-wheeled light vehicles 44 698 592
Motorized 2- and 3-wheelers 2 237 218
Heavy trucks 3 179 460
Buses 865 897
Other 3 033 092
Vehicle standards applied (UNECE WP.29)
Frontal impact standard Yes
Electronic stability control Yes
Pedestrian protection Yes
Motorcycle anti-lock braking system No
POST-CRASH CARENational emergency care access number National, single number
Trauma registry Some facilities
Formal certifi cation for prehospital providers Yes
National assessment of emergency care systems No
DATAReported road traffi c fatalities (2016) 20 308 a ( 72 % M, 25 % F)
Reported rate per 100 000 population (2016) 13.9 a
WHO estimated road traffi c fatalities (2016) 20 938 b
WHO estimated rate per 100 000 population (2016) 14.5 b
a Ministry of Internal Aff airs of the Russian Federation. Died within 30 days of crash. Estimates included off -road traffi c fatalities.
b WHO’s method to obtain comparable country estimates: Group 1. Countries/areas with good death registration data. See explanatory note 3 in Global status report on road safety 2018 for full details.
Russian Federation Population: 143 964 512 | Income group: Middle |
Gross national income per capita: US$ 9 720
Deaths by road user category
Drivers of 4-wheeledcars and lightvehicles 32%
Passengers of 4-wheeledcars and lightvehicles 25%
Cyclists 2%
Pedestrians 29%
Riders of motorized2- and 3-wheelers 6%
Drivers and passengersof heavy trucks 3%
Drivers and passengersof buses <1%
Other <1%
Source: 2016, Ministry of Internal Aff airs of the Russian Federation Source: Ministry of Internal Aff airs of the Russian Federation
0
6
12
18
24
30
2016201520142013201220112010200920082007
SAFER ROAD USERSNational speed limit law Yes
Max urban speed limit 60 km/h
Max rural speed limit 90 km/h
Max motorway speed limit 110 km/h
Local authorities can modify limits Yes c
Self-reported enforcement 0 1 2 3 4 5 6 7 8 9 10
Predominant type of enforcement Automated
National drink-driving law Yes
BAC limit – general population ≤ 0.03 g/dl d
BAC limit – young or novice drivers ≤ 0.03 g/dl d
Random breath testing carried out Yes e
Testing carried out in case of fatal crash All drivers tested
Self-reported enforcement 0 1 2 3 4 5 6 7 8 9 10
% road traffi c deaths involving alcohol 23% f
National motorcycle helmet law Yes
Applies to drivers and passengers Yes
Helmet fastening required Yes
Helmet standard referred to and/or specifi ed Yes
Children passengers on motorcycles Prohibited under 12 yrs
Self-reported enforcement 0 1 2 3 4 5 6 7 8 9 10
Helmet wearing rate —
National seat-belt law Yes
Applies to front and rear seat occupants Yes
Self-reported enforcement 0 1 2 3 4 5 6 7 8 9 10
Seat-belt wearing rate 66-83% Front seats f , 20-50% Rear seats g
National child restraint law Yes h
Children seated in front seat Allowed in a child restraint i
Child restraint required Up to 7 yrs j
Child restraint standard referred to and/or specifi ed Yes
Self-reported enforcement 0 1 2 3 4 5 6 7 8 9 10
% children using child restraints 49-52% g
National law on mobile phone use while driving Yes
Ban on hand-held mobile phone use Yes
Ban on hands-free mobile phone use No
National drug-driving law Yes c Local authorities can modify national speed limits through the posting of speed signsd Law based on breath alcohol concentration (<=0.16 mg/l), values converted on BAC, however, since
March 2018, legal sanctions for BAC was established at 0.03 g/dl and abovee Legislation requires probable cause to test driversf 2016, Ministry of Internal Aff airs of the Russian Federationg 2016, Survey performed by the Russian Public Opinion Research Center, 2016h Since 2017, child restraint systems are the only form of restraint allowed for children under 7 years
(before the 2017 revision, children under 12 years were to be restrained either in a child restraint or by "other means")
i Children up to 11 years (included) while sitting in the front shall be placed in a child restraint, children aged 12 years and more can sit in the front without a child restraint
j For children aged 7-11 years old (included) sitting in the rear, child restraint or seat belt can be used
Trends in reported road traffi c deaths
Deat
hs p
er 1
00 0
00 p
opul
atio
n
© World Health Organization 2020. Some rights reserved. This work is available under the CC BY-NC-SA 3.0 IGO license.
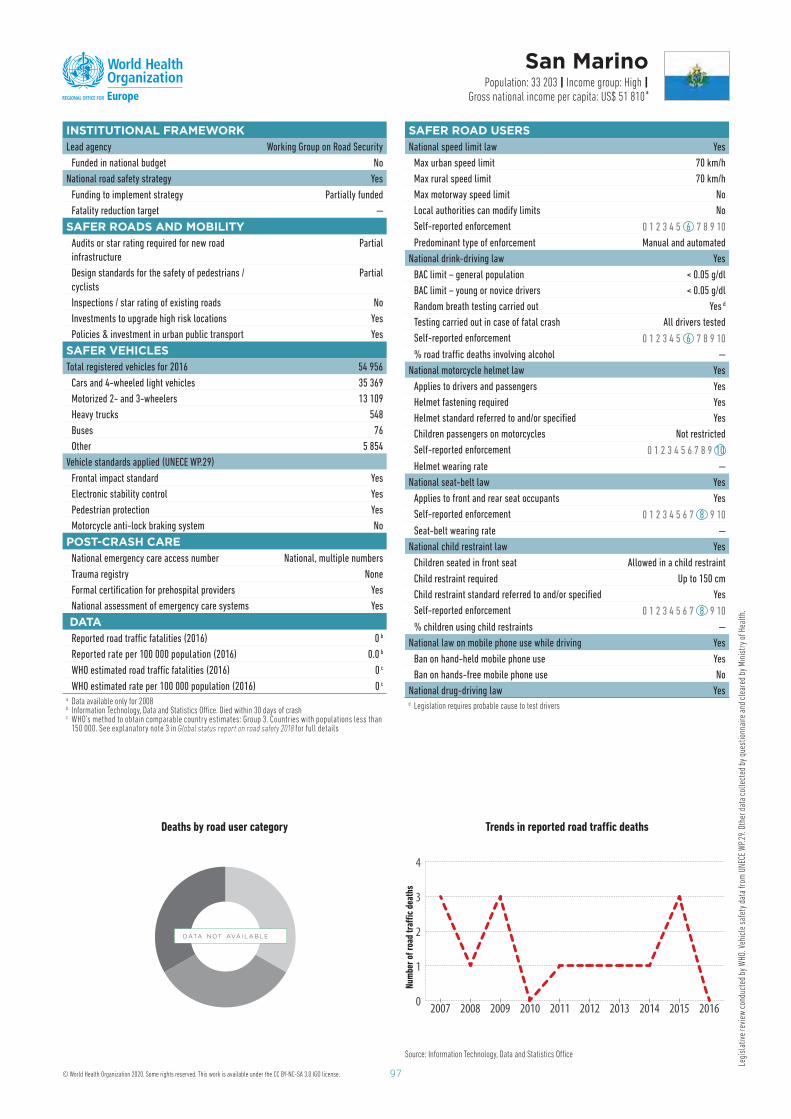
97
Legi
slat
ive
revi
ew c
ondu
cted
by
WHO
. Veh
icle
saf
ety
data
from
UNE
CE W
P.29
. Oth
er d
ata
colle
cted
by
ques
tionn
aire
and
cle
ared
by
Min
istr
y of
Hea
lth.
INSTITUTIONAL FRAMEWORKLead agency Working Group on Road Security
Funded in national budget No
National road safety strategy Yes
Funding to implement strategy Partially funded
Fatality reduction target —
SAFER ROADS AND MOBILITY Audits or star rating required for new road
infrastructure
Partial
Design standards for the safety of pedestrians /
cyclists
Partial
Inspections / star rating of existing roads No
Investments to upgrade high risk locations Yes
Policies & investment in urban public transport Yes
SAFER VEHICLES Total registered vehicles for 2016 54 956
Cars and 4-wheeled light vehicles 35 369
Motorized 2- and 3-wheelers 13 109
Heavy trucks 548
Buses 76
Other 5 854
Vehicle standards applied (UNECE WP.29)
Frontal impact standard Yes
Electronic stability control Yes
Pedestrian protection Yes
Motorcycle anti-lock braking system No
POST-CRASH CARENational emergency care access number National, multiple numbers
Trauma registry None
Formal certifi cation for prehospital providers Yes
National assessment of emergency care systems Yes
DATAReported road traffi c fatalities (2016) 0 b
Reported rate per 100 000 population (2016) 0.0 b
WHO estimated road traffi c fatalities (2016) 0 c
WHO estimated rate per 100 000 population (2016) 0 c
a Data available only for 2008 b Information Technology, Data and Statistics Offi ce. Died within 30 days of crashc WHO’s method to obtain comparable country estimates: Group 3. Countries with populations less than
150 000. See explanatory note 3 in Global status report on road safety 2018 for full details
San Marino Population: 33 203 | Income group: High |
Gross national income per capita: US$ 51 810 a
Deaths by road user category
Source: Information Technology, Data and Statistics Offi ce
0
1
2
3
4
2016201520142013201220112010200920082007
SAFER ROAD USERSNational speed limit law Yes
Max urban speed limit 70 km/h
Max rural speed limit 70 km/h
Max motorway speed limit No
Local authorities can modify limits No
Self-reported enforcement 0 1 2 3 4 5 6 7 8 9 10
Predominant type of enforcement Manual and automated
National drink-driving law Yes
BAC limit – general population < 0.05 g/dl
BAC limit – young or novice drivers < 0.05 g/dl
Random breath testing carried out Yes d
Testing carried out in case of fatal crash All drivers tested
Self-reported enforcement 0 1 2 3 4 5 6 7 8 9 10
% road traffi c deaths involving alcohol —
National motorcycle helmet law Yes
Applies to drivers and passengers Yes
Helmet fastening required Yes
Helmet standard referred to and/or specifi ed Yes
Children passengers on motorcycles Not restricted
Self-reported enforcement 0 1 2 3 4 5 6 7 8 9 10
Helmet wearing rate —
National seat-belt law Yes
Applies to front and rear seat occupants Yes
Self-reported enforcement 0 1 2 3 4 5 6 7 8 9 10
Seat-belt wearing rate —
National child restraint law Yes
Children seated in front seat Allowed in a child restraint
Child restraint required Up to 150 cm
Child restraint standard referred to and/or specifi ed Yes
Self-reported enforcement 0 1 2 3 4 5 6 7 8 9 10
% children using child restraints —
National law on mobile phone use while driving Yes
Ban on hand-held mobile phone use Yes
Ban on hands-free mobile phone use No
National drug-driving law Yes d Legislation requires probable cause to test drivers
Trends in reported road traffi c deaths
DATA N OT AVA I L A B L E
Num
ber
of r
oad
traffi
c
deat
hs
© World Health Organization 2020. Some rights reserved. This work is available under the CC BY-NC-SA 3.0 IGO license.
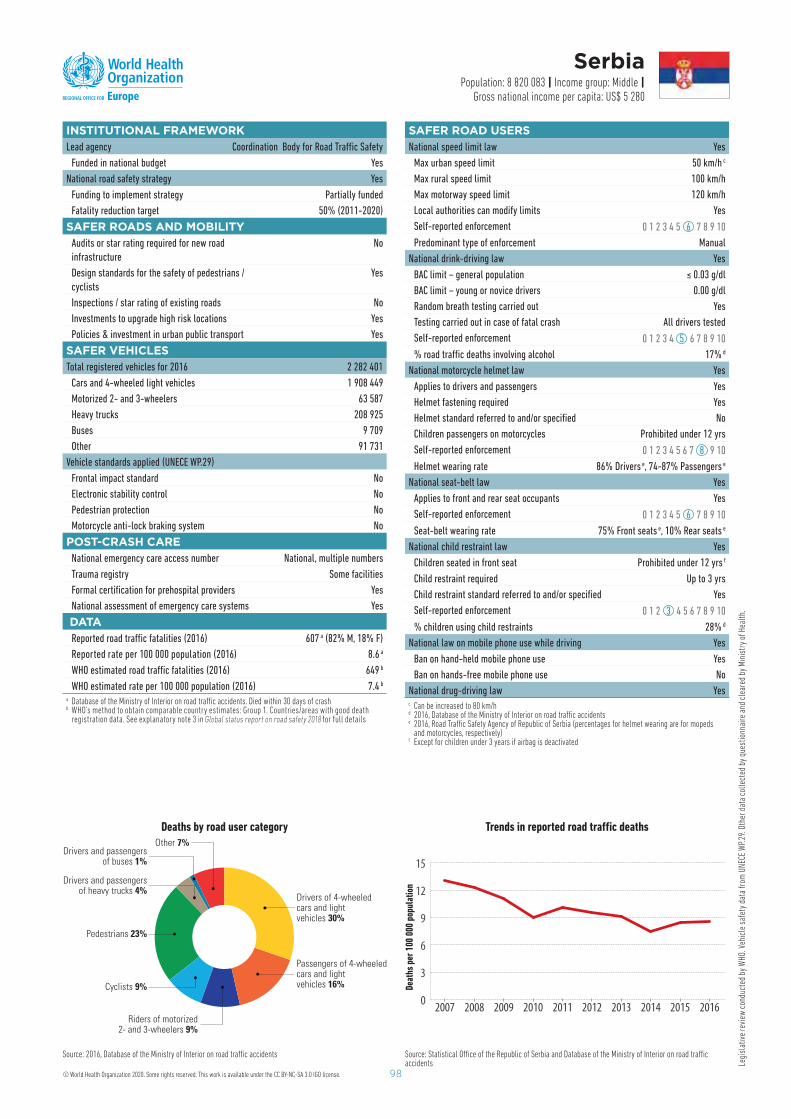
98
Legi
slat
ive
revi
ew c
ondu
cted
by
WHO
. Veh
icle
saf
ety
data
from
UNE
CE W
P.29
. Oth
er d
ata
colle
cted
by
ques
tionn
aire
and
cle
ared
by
Min
istr
y of
Hea
lth.
INSTITUTIONAL FRAMEWORKLead agency Coordination Body for Road Traffi c Safety
Funded in national budget Yes
National road safety strategy Yes
Funding to implement strategy Partially funded
Fatality reduction target 50% (2011-2020)
SAFER ROADS AND MOBILITY Audits or star rating required for new road
infrastructure
No
Design standards for the safety of pedestrians /
cyclists
Yes
Inspections / star rating of existing roads No
Investments to upgrade high risk locations Yes
Policies & investment in urban public transport Yes
SAFER VEHICLES Total registered vehicles for 2016 2 282 401
Cars and 4-wheeled light vehicles 1 908 449
Motorized 2- and 3-wheelers 63 587
Heavy trucks 208 925
Buses 9 709
Other 91 731
Vehicle standards applied (UNECE WP.29)
Frontal impact standard No
Electronic stability control No
Pedestrian protection No
Motorcycle anti-lock braking system No
POST-CRASH CARENational emergency care access number National, multiple numbers
Trauma registry Some facilities
Formal certifi cation for prehospital providers Yes
National assessment of emergency care systems Yes
DATAReported road traffi c fatalities (2016) 607 a ( 82 % M, 18 % F)
Reported rate per 100 000 population (2016) 8.6 a
WHO estimated road traffi c fatalities (2016) 649 b
WHO estimated rate per 100 000 population (2016) 7.4 b
a Database of the Ministry of Interior on road traffi c accidents. Died within 30 days of crashb WHO’s method to obtain comparable country estimates: Group 1. Countries/areas with good death
registration data. See explanatory note 3 in Global status report on road safety 2018 for full details
Serbia Population: 8 820 083 | Income group: Middle |
Gross national income per capita: US$ 5 280
Deaths by road user category
Source: Statistical Offi ce of the Republic of Serbia and Database of the Ministry of Interior on road traffi c accidents
0
3
6
9
12
15
2016201520142013201220112010200920082007
SAFER ROAD USERSNational speed limit law Yes
Max urban speed limit 50 km/h c
Max rural speed limit 100 km/h
Max motorway speed limit 120 km/h
Local authorities can modify limits Yes
Self-reported enforcement 0 1 2 3 4 5 6 7 8 9 10
Predominant type of enforcement Manual
National drink-driving law Yes
BAC limit – general population ≤ 0.03 g/dl
BAC limit – young or novice drivers 0.00 g/dl
Random breath testing carried out Yes
Testing carried out in case of fatal crash All drivers tested
Self-reported enforcement 0 1 2 3 4 5 6 7 8 9 10
% road traffi c deaths involving alcohol 17% d
National motorcycle helmet law Yes
Applies to drivers and passengers Yes
Helmet fastening required Yes
Helmet standard referred to and/or specifi ed No
Children passengers on motorcycles Prohibited under 12 yrs
Self-reported enforcement 0 1 2 3 4 5 6 7 8 9 10
Helmet wearing rate 86% Drivers e, 74-87% Passengers e
National seat-belt law Yes
Applies to front and rear seat occupants Yes
Self-reported enforcement 0 1 2 3 4 5 6 7 8 9 10
Seat-belt wearing rate 75% Front seats e , 10% Rear seats e
National child restraint law Yes
Children seated in front seat Prohibited under 12 yrs f
Child restraint required Up to 3 yrs
Child restraint standard referred to and/or specifi ed Yes
Self-reported enforcement 0 1 2 3 4 5 6 7 8 9 10
% children using child restraints 28% d
National law on mobile phone use while driving Yes
Ban on hand-held mobile phone use Yes
Ban on hands-free mobile phone use No
National drug-driving law Yes c Can be increased to 80 km/hd 2016, Database of the Ministry of Interior on road traffi c accidentse 2016, Road Traffi c Safety Agency of Republic of Serbia (percentages for helmet wearing are for mopeds
and motorcycles, respectively)f Except for children under 3 years if airbag is deactivated
Drivers of 4-wheeledcars and lightvehicles 30%
Passengers of 4-wheeledcars and lightvehicles 16%Cyclists 9%
Pedestrians 23%
Drivers and passengersof heavy trucks 4%
Riders of motorized2- and 3-wheelers 9%
Drivers and passengersof buses 1%
Other 7%
Source: 2016, Database of the Ministry of Interior on road traffi c accidents
Trends in reported road traffi c deaths
Deat
hs p
er 1
00 0
00 p
opul
atio
n
© World Health Organization 2020. Some rights reserved. This work is available under the CC BY-NC-SA 3.0 IGO license.

99
Legi
slat
ive
revi
ew c
ondu
cted
by
WHO
. Veh
icle
saf
ety
data
from
UNE
CE W
P.29
. Oth
er d
ata
colle
cted
by
ques
tionn
aire
and
cle
ared
by
Min
istr
y of
Hea
lth.
INSTITUTIONAL FRAMEWORKLead agency Ministry of transport of the Slovak Republic
Funded in national budget Yes
National road safety strategy Yes
Funding to implement strategy Partially funded
Fatality reduction target 50% (2011-2020)
SAFER ROADS AND MOBILITY Audits or star rating required for new road
infrastructure
Partial
Design standards for the safety of pedestrians /
cyclists
Yes
Inspections / star rating of existing roads Yes
Investments to upgrade high risk locations Yes
Policies & investment in urban public transport Yes
SAFER VEHICLES Total registered vehicles for 2016 2 606 412
Cars and 4-wheeled light vehicles 2 388 415
Motorized 2- and 3-wheelers 126 630
Heavy trucks 82 563
Buses 8 804
Other 0
Vehicle standards applied (UNECE WP.29)
Frontal impact standard Yes
Electronic stability control Yes
Pedestrian protection Yes
Motorcycle anti-lock braking system Yes
POST-CRASH CARENational emergency care access number National, single number
Trauma registry None
Formal certifi cation for prehospital providers Yes
National assessment of emergency care systems No
DATAReported road traffi c fatalities (2016) 275 a ( 78 % M, 22 % F)
Reported rate per 100 000 population (2016) 5.1 a
WHO estimated road traffi c fatalities (2016) 330 b
WHO estimated rate per 100 000 population (2016) 6.1 b
a Road Accident Database (ISDN). Died within 30 days of crash b WHO’s method to obtain comparable country estimates: Group 1. Countries/areas with good death
registration data. See explanatory note 3 in Global status report on road safety 2018 for full details
Slovakia Population: 5 444 218 | Income group: High |
Gross national income per capita: US$ 16 810
Deaths by road user category
Drivers of 4-wheeledcars and lightvehicles 33%
Passengers of 4-wheeledcars and lightvehicles 17%
Cyclists 8%
Pedestrians 29%
Riders of motorized2- and 3-wheelers 9%
Drivers and passengersof buses 1%
Other 3%
Source: 2016, Road Accident Database (ISDN) Source: Road Accident Database (SEDN) for 2007-2009; Road Accident Database (ISDN) for 2010-2016; and Statistical Bureau of Slovak Republic
0
3
6
9
12
15
2016201520142013201220112010200920082007
SAFER ROAD USERSNational speed limit law Yes
Max urban speed limit 50 km/h
Max rural speed limit 90 km/h
Max motorway speed limit 130 km/h
Local authorities can modify limits No
Self-reported enforcement 0 1 2 3 4 5 6 7 8 9 10
Predominant type of enforcement Manual
National drink-driving law Yes c
BAC limit – general population 0.00 g/dl c
BAC limit – young or novice drivers 0.00 g/dl c
Random breath testing carried out Yes
Testing carried out in case of fatal crash All drivers tested
Self-reported enforcement 0 1 2 3 4 5 6 7 8 9 10
% road traffi c deaths involving alcohol 6% d
National motorcycle helmet law Yes
Applies to drivers and passengers Yes
Helmet fastening required Yes
Helmet standard referred to and/or specifi ed No
Children passengers on motorcycles Prohibited under 12 yrs
Self-reported enforcement 0 1 2 3 4 5 6 7 8 9 10
Helmet wearing rate —
National seat-belt law Yes
Applies to front and rear seat occupants Yes
Self-reported enforcement 0 1 2 3 4 5 6 7 8 9 10
Seat-belt wearing rate —
National child restraint law Yes
Children seated in front seat Allowed in a child restraint e
Child restraint required U p to 150 cm
Child restraint standard referred to and/or specifi ed Yes
Self-reported enforcement 0 1 2 3 4 5 6 7 8 9 10
% children using child restraints —
National law on mobile phone use while driving Yes
Ban on hand-held mobile phone use Yes
Ban on hands-free mobile phone use No
National drug-driving law Yes c Driving with presence of any alcohol in the body is prohibitedd 2016, Road Accident Database (ISDN)e Provided that airbag is deactivated if child is in a rear-facing child restraint system
Trends in reported road traffi c deaths
Deat
hs p
er 1
00 0
00 p
opul
atio
n
© World Health Organization 2020. Some rights reserved. This work is available under the CC BY-NC-SA 3.0 IGO license.

100
Legi
slat
ive
revi
ew c
ondu
cted
by
WHO
. Veh
icle
saf
ety
data
from
UNE
CE W
P.29
. Oth
er d
ata
colle
cted
by
ques
tionn
aire
and
cle
ared
by
Slov
enia
n Tr
affi c
Saf
ety
Agen
cy.
INSTITUTIONAL FRAMEWORKLead agency Slovenian Traffi c Safety Agency
Funded in national budget Yes
National road safety strategy Yes
Funding to implement strategy Partially funded
Fatality reduction target 50% (2013-2022)
SAFER ROADS AND MOBILITY Audits or star rating required for new road
infrastructure
Partial
Design standards for the safety of pedestrians /
cyclists
Yes
Inspections / star rating of existing roads Yes
Investments to upgrade high risk locations Yes
Policies & investment in urban public transport Yes
SAFER VEHICLES Total registered vehicles for 2016 1 468 439
Cars and 4-wheeled light vehicles 1 183 476
Motorized 2- and 3-wheelers 97 418
Heavy trucks 31 374
Buses 2 690
Other 153 481
Vehicle standards applied (UNECE WP.29)
Frontal impact standard Yes
Electronic stability control Yes
Pedestrian protection Yes
Motorcycle anti-lock braking system Yes
POST-CRASH CARENational emergency care access number National, single number
Trauma registry National
Formal certifi cation for prehospital providers Yes
National assessment of emergency care systems No
DATAReported road traffi c fatalities (2016) 130 a ( 78 % M, 22 % F)
Reported rate per 100 000 population (2016) 6.3 a
WHO estimated road traffi c fatalities (2016) 134 b
WHO estimated rate per 100 000 population (2016) 6.4 b
a Police records. Died within 30 days of crash b WHO’s method to obtain comparable country estimates: Group 1. Countries/areas with good death
registration data. See explanatory note 3 in Global status report on road safety 2018 for full details
Slovenia Population: 2 077 862 | Income group: High |Gross national income per capita: US$ 21 660
Deaths by road user category
Drivers of 4-wheeledcars and lightvehicles 35%
Passengers of 4-wheeledcars and lightvehicles 12%
Cyclists 10%
Pedestrians 17%
Riders of motorized2- and 3-wheelers 19%
Other 5%
Drivers and passengersof heavy trucks 2%
Source: 2016, Police database Source: Slovenian Traffi c Safety Agency
0
4
8
12
16
20
2016201520142013201220112010200920082007
SAFER ROAD USERSNational speed limit law Yes
Max urban speed limit 50 km/h c
Max rural speed limit 90 km/h
Max motorway speed limit 130 km/h
Local authorities can modify limits No
Self-reported enforcement 0 1 2 3 4 5 6 7 8 9 10
Predominant type of enforcement Manual
National drink-driving law Yes
BAC limit – general population ≤ 0.05 g/dl
BAC limit – young or novice drivers 0.00 g/dl
Random breath testing carried out Yes
Testing carried out in case of fatal crash All drivers tested
Self-reported enforcement 0 1 2 3 4 5 6 7 8 9 10
% road traffi c deaths involving alcohol 32% d
National motorcycle helmet law Yes
Applies to drivers and passengers Yes
Helmet fastening required Yes
Helmet standard referred to and/or specifi ed Yes
Children passengers on motorcycles Prohibited under 12 yrs e
Self-reported enforcement 0 1 2 3 4 5 6 7 8 9 10
Helmet wearing rate —
National seat-belt law Yes
Applies to front and rear seat occupants Yes
Self-reported enforcement 0 1 2 3 4 5 6 7 8 9 10
Seat-belt wearing rate 92% Front seats f , 69% Rear seats f
National child restraint law Yes
Children seated in front seat Allowed in a child
restraint g
Child restraint required Up to 150 cm
Child restraint standard referred to and/or specifi ed No
Self-reported enforcement 0 1 2 3 4 5 6 7 8 9 10
% children using child restraints —
National law on mobile phone use while driving Yes
Ban on hand-held mobile phone use Yes
Ban on hands-free mobile phone use No
National drug-driving law Yes c Can be increased up to 70 km/hd 2016, Police recordse Only children older than 12 years are allowed to ride as passengers on motorcyclesf 2016, Slovenian Traffi c Safety Agencyg Provided that airbag is deactivated if child is in a rear-facing child restraint system
Trends in reported road traffi c deaths
Deat
hs p
er 1
00 0
00 p
opul
atio
n
© World Health Organization 2020. Some rights reserved. This work is available under the CC BY-NC-SA 3.0 IGO license.
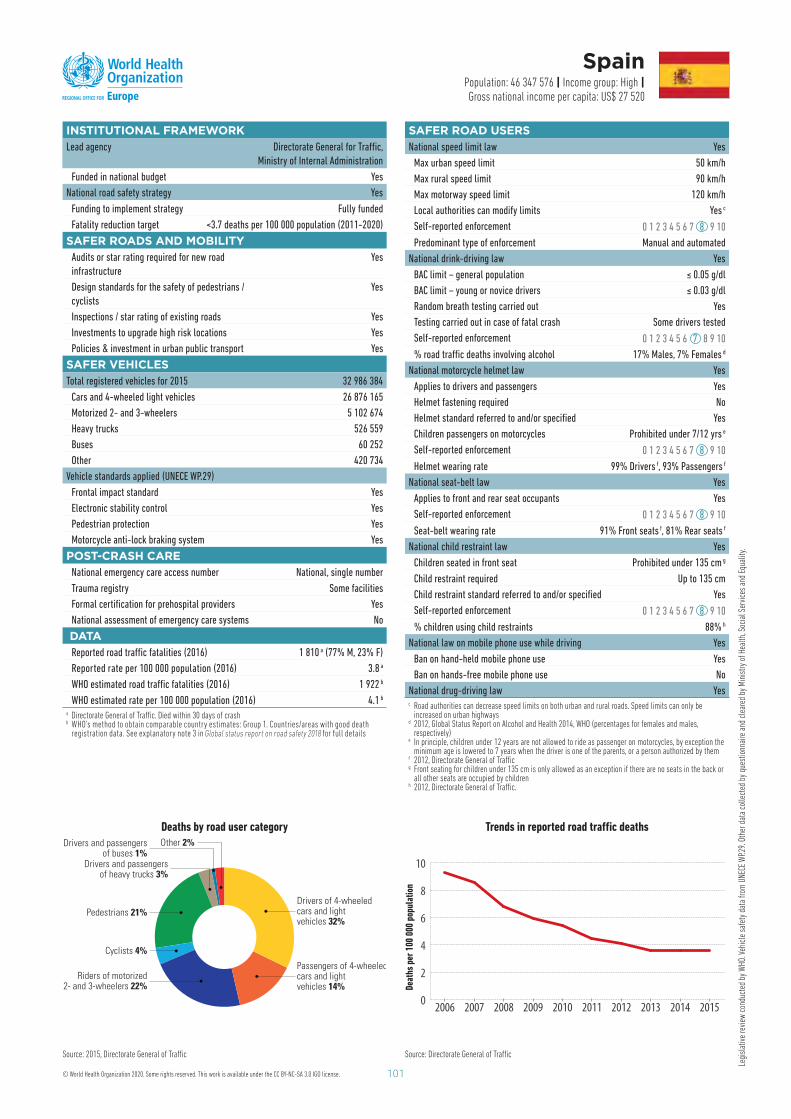
101
Legi
slat
ive
revi
ew c
ondu
cted
by
WHO
. Veh
icle
saf
ety
data
from
UNE
CE W
P.29.
Oth
er d
ata
colle
cted
by
ques
tionn
aire
and
cle
ared
by
Min
istry
of H
ealth
, Soc
ial S
ervi
ces
and
Equa
lity.
INSTITUTIONAL FRAMEWORKLead agency Directorate General for Traffi c,
Ministry of Internal Administration
Funded in national budget Yes
National road safety strategy Yes
Funding to implement strategy F ully funded
Fatality reduction target <3.7 deaths per 100 000 population (2011-2020)
SAFER ROADS AND MOBILITY Audits or star rating required for new road
infrastructure
Yes
Design standards for the safety of pedestrians /
cyclists
Yes
Inspections / star rating of existing roads Yes
Investments to upgrade high risk locations Yes
Policies & investment in urban public transport Yes
SAFER VEHICLES Total registered vehicles for 2015 32 986 384
Cars and 4-wheeled light vehicles 26 876 165
Motorized 2- and 3-wheelers 5 102 674
Heavy trucks 526 559
Buses 60 252
Other 420 734
Vehicle standards applied (UNECE WP.29)
Frontal impact standard Yes
Electronic stability control Yes
Pedestrian protection Yes
Motorcycle anti-lock braking system Yes
POST-CRASH CARENational emergency care access number National, single number
Trauma registry Some facilities
Formal certifi cation for prehospital providers Yes
National assessment of emergency care systems No
DATAReported road traffi c fatalities (2016) 1 810 a (77% M, 23 % F)
Reported rate per 100 000 population (2016) 3.8 a
WHO estimated road traffi c fatalities (2016) 1 922 b
WHO estimated rate per 100 000 population (2016) 4 .1 b
a Directorate General of Traffi c. Died within 30 days of crash b WHO’s method to obtain comparable country estimates: Group 1. Countries/areas with good death
registration data. See explanatory note 3 in Global status report on road safety 2018 for full details
Spain Population: 46 347 576 | Income group: High |Gross national income per capita: US$ 27 520
Deaths by road user category
Drivers of 4-wheeledcars and lightvehicles 32%
Passengers of 4-wheeledcars and lightvehicles 14%
Cyclists 4%
Pedestrians 21%
Riders of motorized2- and 3-wheelers 22%
Drivers and passengersof buses 1%
Other 2%
Drivers and passengersof heavy trucks 3%
Source: 2015, Directorate General of Traffi c Source: Directorate General of Traffi c
0
2
4
6
8
10
2015201420132012201120102009200820072006
SAFER ROAD USERSNational speed limit law Yes
Max urban speed limit 50 km/h
Max rural speed limit 90 km/h
Max motorway speed limit 120 km/h
Local authorities can modify limits Yes c
Self-reported enforcement 0 1 2 3 4 5 6 7 8 9 10
Predominant type of enforcement Manual and automated
National drink-driving law Yes
BAC limit – general population ≤ 0.05 g/dl
BAC limit – young or novice drivers ≤ 0.03 g/dl
Random breath testing carried out Yes
Testing carried out in case of fatal crash Some drivers tested
Self-reported enforcement 0 1 2 3 4 5 6 7 8 9 10
% road traffi c deaths involving alcohol 17 % Males, 7% Females d
National motorcycle helmet law Yes
Applies to drivers and passengers Yes
Helmet fastening required No
Helmet standard referred to and/or specifi ed Yes
Children passengers on motorcycles Prohibited under 7/12 yrs e
Self-reported enforcement 0 1 2 3 4 5 6 7 8 9 10
Helmet wearing rate 99% Drivers f , 93% Passengers f
National seat-belt law Yes
Applies to front and rear seat occupants Yes
Self-reported enforcement 0 1 2 3 4 5 6 7 8 9 10
Seat-belt wearing rate 91% Front seats f , 81% Rear seats f
National child restraint law Yes
Children seated in front seat Prohibited under 135 cm g
Child restraint required Up to 135 cm
Child restraint standard referred to and/or specifi ed Yes
Self-reported enforcement 0 1 2 3 4 5 6 7 8 9 10
% children using child restraints 88% h
National law on mobile phone use while driving Yes
Ban on hand-held mobile phone use Yes
Ban on hands-free mobile phone use No
National drug-driving law Yes c Road authorities can decrease speed limits on both urban and rural roads. Speed limits can only be
increased on urban highwaysd 2012, Global Status Report on Alcohol and Health 2014, WHO (percentages for females and males,
respectively)e In principle, children under 12 years are not allowed to ride as passenger on motorcycles, by exception the
minimum age is lowered to 7 years when the driver is one of the parents, or a person authorized by themf 2012, Directorate General of Traffi cg Front seating for children under 135 cm is only allowed as an exception if there are no seats in the back or
all other seats are occupied by childrenh 2012, Directorate General of Traffi c.
Trends in reported road traffi c deaths
Deat
hs p
er 1
00 0
00 p
opul
atio
n
© World Health Organization 2020. Some rights reserved. This work is available under the CC BY-NC-SA 3.0 IGO license.
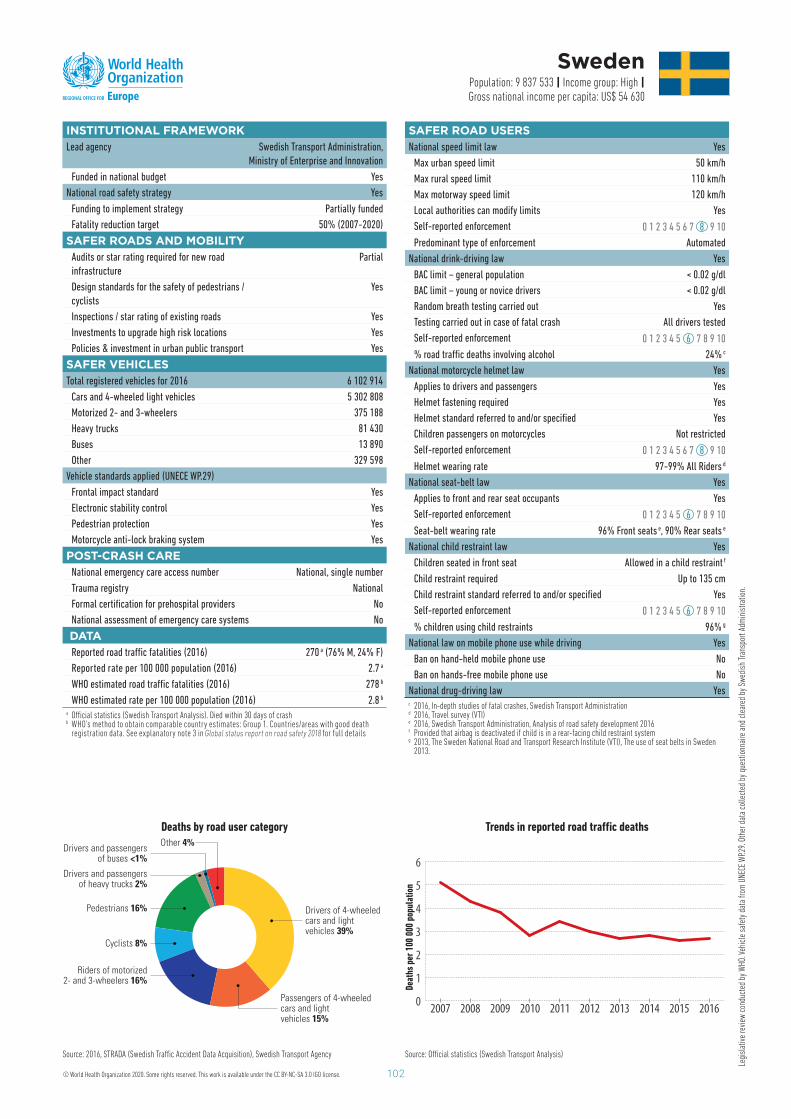
102
Legi
slat
ive
revi
ew c
ondu
cted
by
WHO
. Veh
icle
saf
ety
data
from
UNE
CE W
P.29.
Oth
er d
ata
colle
cted
by
ques
tionn
aire
and
cle
ared
by
Swed
ish
Tran
spor
t Adm
inis
tratio
n.
INSTITUTIONAL FRAMEWORKLead agency Swedish Transport Administration,
Ministry of Enterprise and Innovation
Funded in national budget Yes
National road safety strategy Yes
Funding to implement strategy Partially funded
Fatality reduction target 50% (2007-2020)
SAFER ROADS AND MOBILITY Audits or star rating required for new road
infrastructure
Partial
Design standards for the safety of pedestrians /
cyclists
Yes
Inspections / star rating of existing roads Yes
Investments to upgrade high risk locations Yes
Policies & investment in urban public transport Yes
SAFER VEHICLES Total registered vehicles for 2016 6 102 914
Cars and 4-wheeled light vehicles 5 302 808
Motorized 2- and 3-wheelers 375 188
Heavy trucks 81 430
Buses 13 890
Other 329 598
Vehicle standards applied (UNECE WP.29)
Frontal impact standard Yes
Electronic stability control Yes
Pedestrian protection Yes
Motorcycle anti-lock braking system Yes
POST-CRASH CARENational emergency care access number National, single number
Trauma registry National
Formal certifi cation for prehospital providers No
National assessment of emergency care systems No
DATAReported road traffi c fatalities (2016) 270 a ( 76 % M, 24 % F)
Reported rate per 100 000 population (2016) 2.7 a
WHO estimated road traffi c fatalities (2016) 278 b
WHO estimated rate per 100 000 population (2016) 2.8 b
a Offi cial statistics (Swedish Transport Analysis). Died within 30 days of crash b WHO’s method to obtain comparable country estimates: Group 1. Countries/areas with good death
registration data. See explanatory note 3 in Global status report on road safety 2018 for full details
Sweden Population: 9 837 533 | Income group: High |Gross national income per capita: US$ 54 630
Deaths by road user category
Drivers of 4-wheeledcars and lightvehicles 39%
Passengers of 4-wheeledcars and lightvehicles 15%
Cyclists 8%
Pedestrians 16%
Riders of motorized2- and 3-wheelers 16%
Drivers and passengersof buses <1%
Other 4%
Drivers and passengersof heavy trucks 2%
Source: 2016, STRADA (Swedish Traffi c Accident Data Acquisition), Swedish Transport Agency Source: Offi cial statistics (Swedish Transport Analysis)
0
1
2
3
4
5
6
2016201520142013201220112010200920082007
SAFER ROAD USERSNational speed limit law Yes
Max urban speed limit 50 km/h
Max rural speed limit 110 km/h
Max motorway speed limit 120 km/h
Local authorities can modify limits Yes
Self-reported enforcement 0 1 2 3 4 5 6 7 8 9 10
Predominant type of enforcement Automated
National drink-driving law Yes
BAC limit – general population < 0.02 g/dl
BAC limit – young or novice drivers < 0.02 g/dl
Random breath testing carried out Yes
Testing carried out in case of fatal crash All drivers tested
Self-reported enforcement 0 1 2 3 4 5 6 7 8 9 10
% road traffi c deaths involving alcohol 24% c
National motorcycle helmet law Yes
Applies to drivers and passengers Yes
Helmet fastening required Yes
Helmet standard referred to and/or specifi ed Yes
Children passengers on motorcycles Not restricted
Self-reported enforcement 0 1 2 3 4 5 6 7 8 9 10
Helmet wearing rate 97-99% All Riders d
National seat-belt law Yes
Applies to front and rear seat occupants Yes
Self-reported enforcement 0 1 2 3 4 5 6 7 8 9 10
Seat-belt wearing rate 96% Front seats e , 90% Rear seats e
National child restraint law Yes
Children seated in front seat Allowed in a child restraint f
Child restraint required Up to 135 cm
Child restraint standard referred to and/or specifi ed Yes
Self-reported enforcement 0 1 2 3 4 5 6 7 8 9 10
% children using child restraints 96% g
National law on mobile phone use while driving Yes
Ban on hand-held mobile phone use No
Ban on hands-free mobile phone use No
National drug-driving law Yes c 2016, In-depth studies of fatal crashes, Swedish Transport Administrationd 2016, Travel survey (VTI)e 2016, Swedish Transport Administration, Analysis of road safety development 2016f Provided that airbag is deactivated if child is in a rear-facing child restraint systemg 2013, The Sweden National Road and Transport Research Institute (VTI), The use of seat belts in Sweden
2013.
Trends in reported road traffi c deaths
Deat
hs p
er 1
00 0
00 p
opul
atio
n
© World Health Organization 2020. Some rights reserved. This work is available under the CC BY-NC-SA 3.0 IGO license.
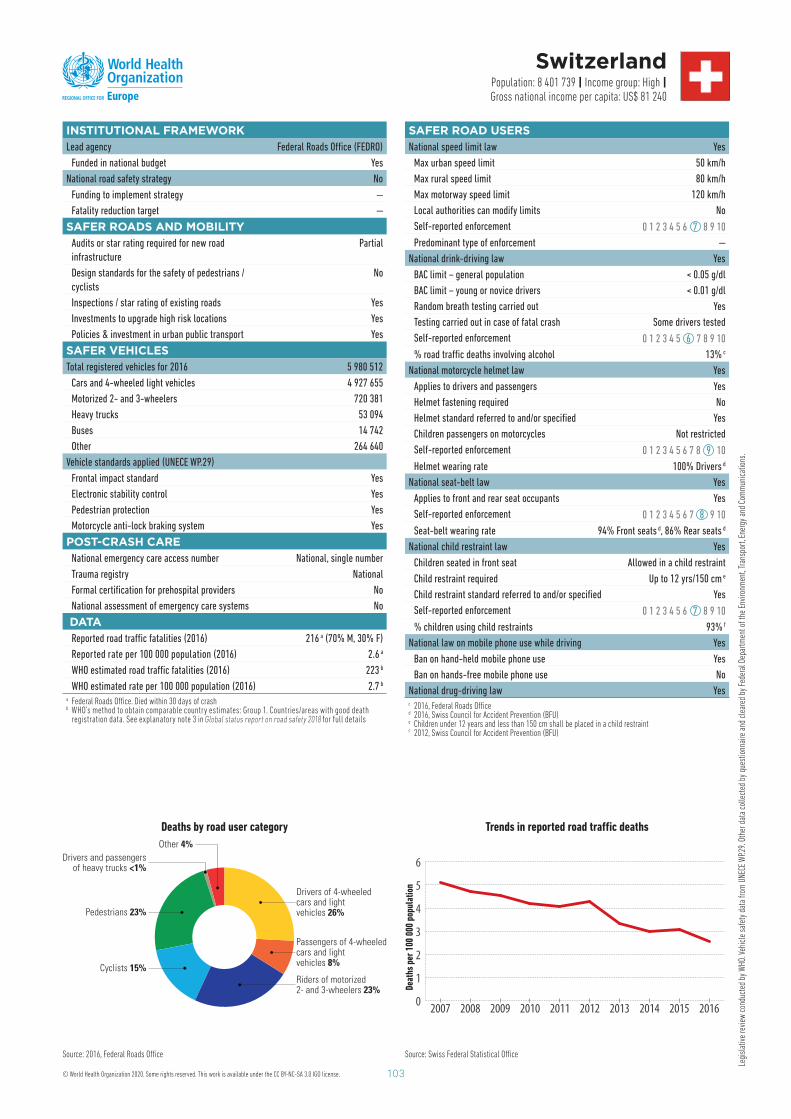
103
Legi
slat
ive
revi
ew c
ondu
cted
by
WHO
. Veh
icle
saf
ety
data
from
UNE
CE W
P.29.
Oth
er d
ata
colle
cted
by
ques
tionn
aire
and
cle
ared
by
Fede
ral D
epar
tmen
t of t
he E
nviro
nmen
t, Tr
ansp
ort,
Ener
gy a
nd C
omm
unic
atio
ns.
INSTITUTIONAL FRAMEWORKLead agency Federal Roads Offi ce (FEDRO)
Funded in national budget Yes
National road safety strategy No
Funding to implement strategy —
Fatality reduction target —
SAFER ROADS AND MOBILITY Audits or star rating required for new road
infrastructure
Partial
Design standards for the safety of pedestrians /
cyclists
No
Inspections / star rating of existing roads Yes
Investments to upgrade high risk locations Yes
Policies & investment in urban public transport Yes
SAFER VEHICLES Total registered vehicles for 2016 5 980 512
Cars and 4-wheeled light vehicles 4 927 655
Motorized 2- and 3-wheelers 720 381
Heavy trucks 53 094
Buses 14 742
Other 264 640
Vehicle standards applied (UNECE WP.29)
Frontal impact standard Yes
Electronic stability control Yes
Pedestrian protection Yes
Motorcycle anti-lock braking system Yes
POST-CRASH CARENational emergency care access number National, single number
Trauma registry National
Formal certifi cation for prehospital providers No
National assessment of emergency care systems No
DATAReported road traffi c fatalities (2016) 216 a ( 70 % M, 30 % F)
Reported rate per 100 000 population (2016) 2.6 a
WHO estimated road traffi c fatalities (2016) 223 b
WHO estimated rate per 100 000 population (2016) 2.7 b
a Federal Roads Offi ce. Died within 30 days of crashb WHO’s method to obtain comparable country estimates: Group 1. Countries/areas with good death
registration data. See explanatory note 3 in Global status report on road safety 2018 for full details
Switzerland Population: 8 401 739 | Income group: High |
Gross national income per capita: US$ 81 240
Deaths by road user category
Drivers of 4-wheeledcars and lightvehicles 26%
Passengers of 4-wheeledcars and lightvehicles 8%
Riders of motorized2- and 3-wheelers 23%
Cyclists 15%
Pedestrians 23%
Drivers and passengersof heavy trucks <1%
Other 4%
Source: 2016, Federal Roads Offi ce Source: Swiss Federal Statistical Offi ce
0
1
2
3
4
5
6
2016201520142013201220112010200920082007
SAFER ROAD USERSNational speed limit law Yes
Max urban speed limit 50 km/h
Max rural speed limit 80 km/h
Max motorway speed limit 120 km/h
Local authorities can modify limits No
Self-reported enforcement 0 1 2 3 4 5 6 7 8 9 10
Predominant type of enforcement —
National drink-driving law Yes
BAC limit – general population < 0.05 g/dl
BAC limit – young or novice drivers < 0.01 g/dl
Random breath testing carried out Yes
Testing carried out in case of fatal crash Some drivers tested
Self-reported enforcement 0 1 2 3 4 5 6 7 8 9 10
% road traffi c deaths involving alcohol 13% c
National motorcycle helmet law Yes
Applies to drivers and passengers Yes
Helmet fastening required No
Helmet standard referred to and/or specifi ed Yes
Children passengers on motorcycles Not restricted
Self-reported enforcement 0 1 2 3 4 5 6 7 8 9 10
Helmet wearing rate 100% Drivers d
National seat-belt law Yes
Applies to front and rear seat occupants Yes
Self-reported enforcement 0 1 2 3 4 5 6 7 8 9 10
Seat-belt wearing rate 94% Front seats d , 86% Rear seats d
National child restraint law Yes
Children seated in front seat Allowed in a child restraint
Child restraint required U p to 12 yrs /150 cm e
Child restraint standard referred to and/or specifi ed Yes
Self-reported enforcement 0 1 2 3 4 5 6 7 8 9 10
% children using child restraints 93% f
National law on mobile phone use while driving Yes
Ban on hand-held mobile phone use Yes
Ban on hands-free mobile phone use No
National drug-driving law Yes c 2016, Federal Roads Offi ced 2016, Swiss Council for Accident Prevention (BFU) e Children under 12 years and less than 150 cm shall be placed in a child restraintf 2012, Swiss Council for Accident Prevention (BFU)
Trends in reported road traffi c deaths
Deat
hs p
er 1
00 0
00 p
opul
atio
n
© World Health Organization 2020. Some rights reserved. This work is available under the CC BY-NC-SA 3.0 IGO license.
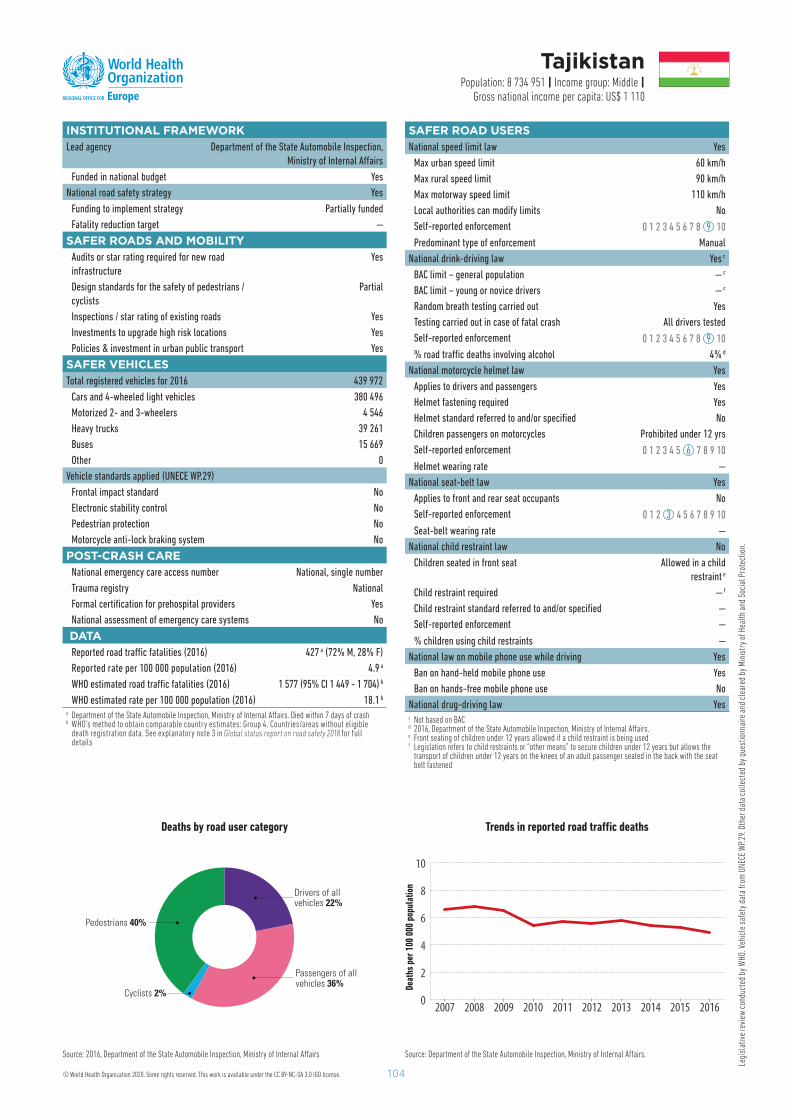
104
Legi
slat
ive
revi
ew c
ondu
cted
by
WHO
. Veh
icle
saf
ety
data
from
UNE
CE W
P.29
. Oth
er d
ata
colle
cted
by
ques
tionn
aire
and
cle
ared
by
Min
istr
y of
Hea
lth a
nd S
ocia
l Pro
tect
ion.
INSTITUTIONAL FRAMEWORKLead agency Department of the State Automobile Inspection,
Ministry of Internal Aff airs
Funded in national budget Yes
National road safety strategy Yes
Funding to implement strategy Partially funded
Fatality reduction target —
SAFER ROADS AND MOBILITY Audits or star rating required for new road
infrastructure
Yes
Design standards for the safety of pedestrians /
cyclists
Partial
Inspections / star rating of existing roads Yes
Investments to upgrade high risk locations Yes
Policies & investment in urban public transport Yes
SAFER VEHICLES Total registered vehicles for 2016 439 972
Cars and 4-wheeled light vehicles 380 496
Motorized 2- and 3-wheelers 4 546
Heavy trucks 39 261
Buses 15 669
Other 0
Vehicle standards applied (UNECE WP.29)
Frontal impact standard No
Electronic stability control No
Pedestrian protection No
Motorcycle anti-lock braking system No
POST-CRASH CARENational emergency care access number National, single number
Trauma registry National
Formal certifi cation for prehospital providers Yes
National assessment of emergency care systems No
DATAReported road traffi c fatalities (2016) 427 a ( 72 % M, 28 % F)
Reported rate per 100 000 population (2016) 4.9 a
WHO estimated road traffi c fatalities (2016) 1 577 (95% CI 1 449 - 1 704 ) b
WHO estimated rate per 100 000 population (2016) 18.1 b
a Department of the State Automobile Inspection, Ministry of Internal Aff airs. Died within 7 days of crash b WHO’s method to obtain comparable country estimates: Group 4. Countries/areas without eligible
death registration data. See explanatory note 3 in Global status report on road safety 2018 for full details
Tajikistan Population: 8 734 951 | Income group: Middle |
Gross national income per capita: US$ 1 110
Deaths by road user category
Drivers of allvehicles 22%
Passengers of allvehicles 36%
Pedestrians 40%
Cyclists 2%
Source: Department of the State Automobile Inspection, Ministry of Internal Aff airs.
0
2
4
6
8
10
2016201520142013201220112010200920082007
SAFER ROAD USERSNational speed limit law Yes
Max urban speed limit 60 km/h
Max rural speed limit 90 km/h
Max motorway speed limit 110 km/h
Local authorities can modify limits No
Self-reported enforcement 0 1 2 3 4 5 6 7 8 9 10
Predominant type of enforcement Manual
National drink-driving law Yes c
BAC limit – general population — c
BAC limit – young or novice drivers — c
Random breath testing carried out Yes
Testing carried out in case of fatal crash All drivers tested
Self-reported enforcement 0 1 2 3 4 5 6 7 8 9 10
% road traffi c deaths involving alcohol 4% d
National motorcycle helmet law Yes
Applies to drivers and passengers Yes
Helmet fastening required Yes
Helmet standard referred to and/or specifi ed No
Children passengers on motorcycles Prohibited under 12 yrs
Self-reported enforcement 0 1 2 3 4 5 6 7 8 9 10
Helmet wearing rate —
National seat-belt law Yes
Applies to front and rear seat occupants No
Self-reported enforcement 0 1 2 3 4 5 6 7 8 9 10
Seat-belt wearing rate —
National child restraint law No
Children seated in front seat Allowed in a child
restraint e
Child restraint required — f
Child restraint standard referred to and/or specifi ed —
Self-reported enforcement —
% children using child restraints —
National law on mobile phone use while driving Yes
Ban on hand-held mobile phone use Yes
Ban on hands-free mobile phone use No
National drug-driving law Yes c Not based on BACd 2016, Department of the State Automobile Inspection, Ministry of Internal Aff airs. e Front seating of children under 12 years allowed if a child restraint is being used f Legislation refers to child restraints or “other means” to secure children under 12 years but allows the
transport of children under 12 years on the knees of an adult passenger seated in the back with the seat belt fastened
Trends in reported road traffi c deaths
Source: 2016, Department of the State Automobile Inspection, Ministry of Internal Aff airs
Deat
hs p
er 1
00 0
00 p
opul
atio
n
© World Health Organization 2020. Some rights reserved. This work is available under the CC BY-NC-SA 3.0 IGO license.
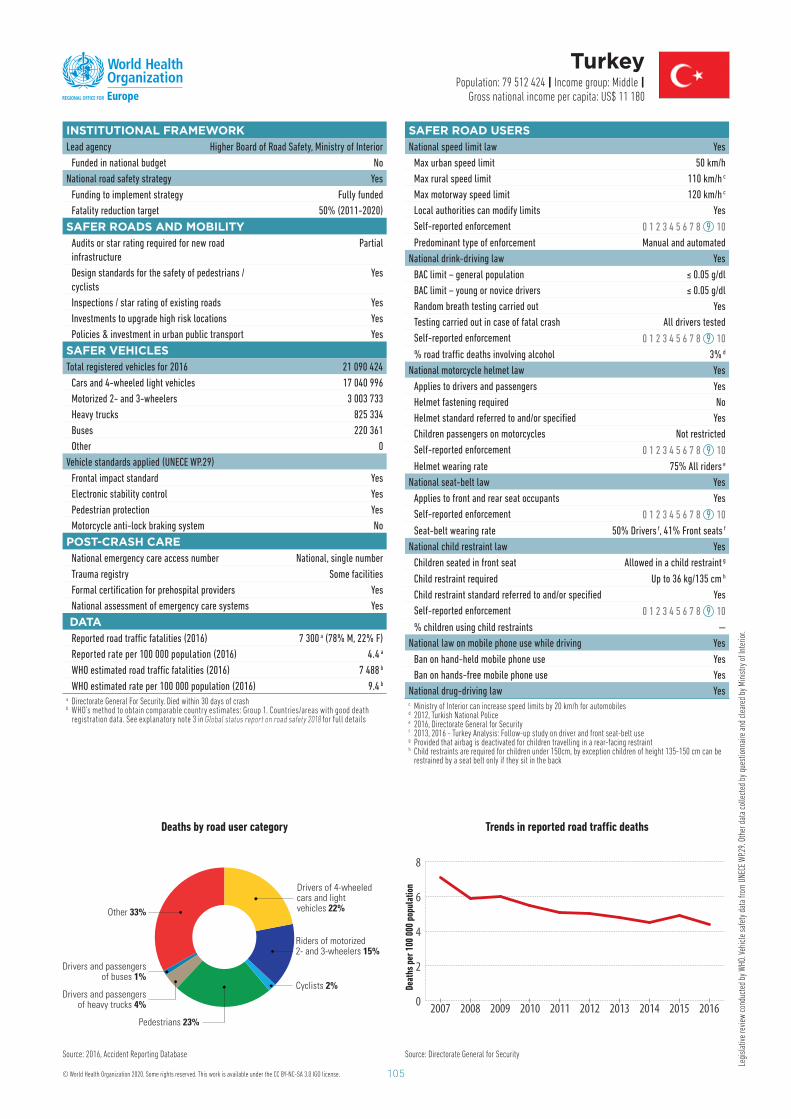
105
Legi
slat
ive
revi
ew c
ondu
cted
by
WHO
. Veh
icle
saf
ety
data
from
UNE
CE W
P.29.
Oth
er d
ata
colle
cted
by
ques
tionn
aire
and
cle
ared
by
Min
istry
of I
nter
ior.
INSTITUTIONAL FRAMEWORKLead agency Higher Board of Road Safety, Ministry of Interior
Funded in national budget No
National road safety strategy Yes
Funding to implement strategy Fully funded
Fatality reduction target 50% (2011-2020)
SAFER ROADS AND MOBILITY Audits or star rating required for new road
infrastructure
Partial
Design standards for the safety of pedestrians /
cyclists
Yes
Inspections / star rating of existing roads Yes
Investments to upgrade high risk locations Yes
Policies & investment in urban public transport Yes
SAFER VEHICLES Total registered vehicles for 2016 21 090 424
Cars and 4-wheeled light vehicles 17 040 996
Motorized 2- and 3-wheelers 3 003 733
Heavy trucks 825 334
Buses 220 361
Other 0
Vehicle standards applied (UNECE WP.29)
Frontal impact standard Yes
Electronic stability control Yes
Pedestrian protection Yes
Motorcycle anti-lock braking system No
POST-CRASH CARENational emergency care access number National, single number
Trauma registry Some facilities
Formal certifi cation for prehospital providers Yes
National assessment of emergency care systems Yes
DATAReported road traffi c fatalities (2016) 7 300 a ( 78 % M, 22 % F)
Reported rate per 100 000 population (2016) 4.4 a
WHO estimated road traffi c fatalities (2016) 7 488 b
WHO estimated rate per 100 000 population (2016) 9.4 b
a Directorate General For Security. Died within 30 days of crashb WHO’s method to obtain comparable country estimates: Group 1. Countries/areas with good death
registration data. See explanatory note 3 in Global status report on road safety 2018 for full details
Turkey Population: 79 512 424 | Income group: Middle |
Gross national income per capita: US$ 11 180
Deaths by road user category
Drivers of 4-wheeledcars and lightvehicles 22%
Riders of motorized2- and 3-wheelers 15%
Pedestrians 23%
Drivers and passengersof heavy trucks 4%
Drivers and passengersof buses 1%
Other 33%
Cyclists 2%
Source: 2016, Accident Reporting Database Source: Directorate General for Security
0
2
4
6
8
2016201520142013201220112010200920082007
SAFER ROAD USERSNational speed limit law Yes
Max urban speed limit 50 km/h
Max rural speed limit 110 km/h c
Max motorway speed limit 120 km/h c
Local authorities can modify limits Yes
Self-reported enforcement 0 1 2 3 4 5 6 7 8 9 10
Predominant type of enforcement Manual and automated
National drink-driving law Yes
BAC limit – general population ≤ 0.05 g/dl
BAC limit – young or novice drivers ≤ 0.05 g/dl
Random breath testing carried out Yes
Testing carried out in case of fatal crash All drivers tested
Self-reported enforcement 0 1 2 3 4 5 6 7 8 9 10
% road traffi c deaths involving alcohol 3% d
National motorcycle helmet law Yes
Applies to drivers and passengers Yes
Helmet fastening required No
Helmet standard referred to and/or specifi ed Yes
Children passengers on motorcycles Not restricted
Self-reported enforcement 0 1 2 3 4 5 6 7 8 9 10
Helmet wearing rate 75% All riders e
National seat-belt law Yes
Applies to front and rear seat occupants Yes
Self-reported enforcement 0 1 2 3 4 5 6 7 8 9 10
Seat-belt wearing rate 50% Drivers f, 41% Front seats f
National child restraint law Yes
Children seated in front seat Allowed in a child restraint g
Child restraint required Up to 36 kg /135 cm h
Child restraint standard referred to and/or specifi ed Yes
Self-reported enforcement 0 1 2 3 4 5 6 7 8 9 10
% children using child restraints —
National law on mobile phone use while driving Yes
Ban on hand-held mobile phone use Yes
Ban on hands-free mobile phone use Yes
National drug-driving law Yes c Ministry of Interior can increase speed limits by 20 km/h for automobilesd 2012, Turkish National Policee 2016, Directorate General for Securityf 2013, 2016 - Turkey Analysis: Follow-up study on driver and front seat-belt use g Provided that airbag is deactivated for children travelling in a rear-facing restrainth Child restraints are required for children under 150cm, by exception children of height 135-150 cm can be
restrained by a seat belt only if they sit in the back
Trends in reported road traffi c deaths
Deat
hs p
er 1
00 0
00 p
opul
atio
n
© World Health Organization 2020. Some rights reserved. This work is available under the CC BY-NC-SA 3.0 IGO license.
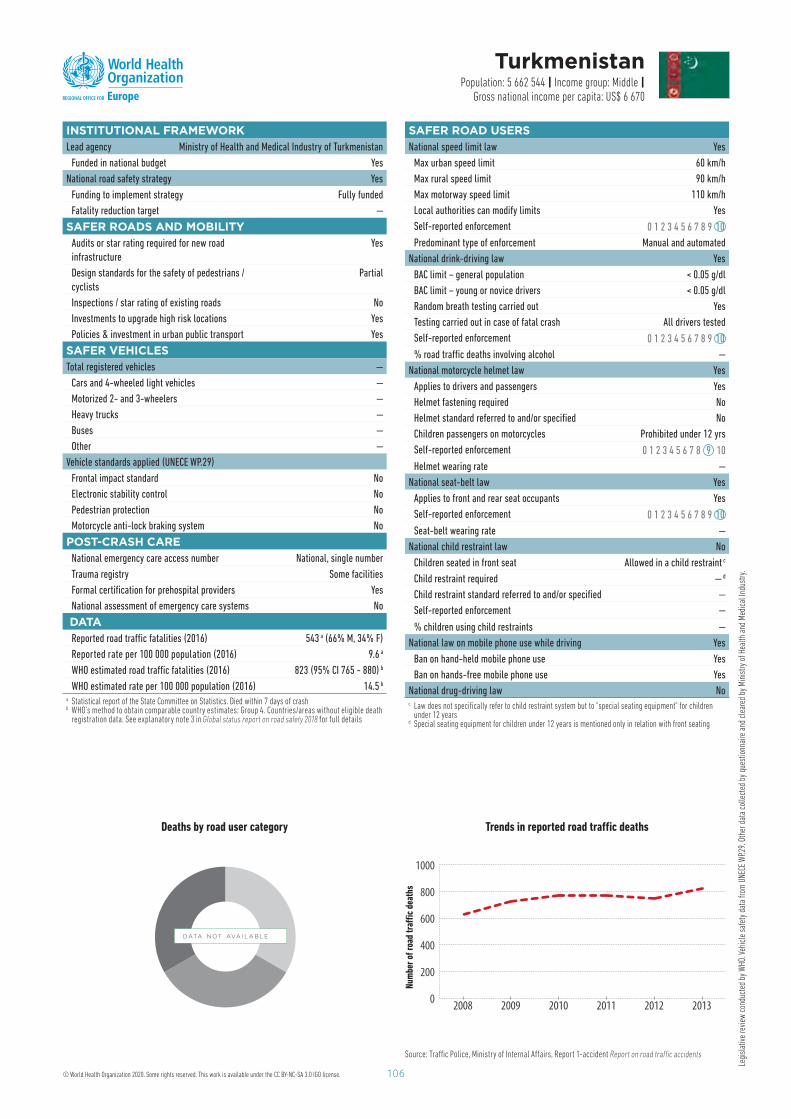
106
Legi
slat
ive
revi
ew c
ondu
cted
by
WHO
. Veh
icle
saf
ety
data
from
UNE
CE W
P.29.
Oth
er d
ata
colle
cted
by
ques
tionn
aire
and
cle
ared
by
Min
istry
of H
ealth
and
Med
ical
Indu
stry
.
INSTITUTIONAL FRAMEWORKLead agency Ministry of Health and Medical Industry of Turkmenistan
Funded in national budget Yes
National road safety strategy Yes
Funding to implement strategy Fully funded
Fatality reduction target —
SAFER ROADS AND MOBILITY Audits or star rating required for new road
infrastructure
Yes
Design standards for the safety of pedestrians /
cyclists
Partial
Inspections / star rating of existing roads No
Investments to upgrade high risk locations Yes
Policies & investment in urban public transport Yes
SAFER VEHICLES Total registered vehicles —
Cars and 4-wheeled light vehicles —
Motorized 2- and 3-wheelers —
Heavy trucks —
Buses —
Other —
Vehicle standards applied (UNECE WP.29)
Frontal impact standard No
Electronic stability control No
Pedestrian protection No
Motorcycle anti-lock braking system No
POST-CRASH CARENational emergency care access number National, single number
Trauma registry Some facilities
Formal certifi cation for prehospital providers Yes
National assessment of emergency care systems No
DATAReported road traffi c fatalities (2016) 543 a ( 66 % M, 34 % F)
Reported rate per 100 000 population (2016) 9.6 a
WHO estimated road traffi c fatalities (2016) 823 (95% CI 765 - 880 ) b
WHO estimated rate per 100 000 population (2016) 14.5 b
a Statistical report of the State Committee on Statistics. Died within 7 days of crash b WHO’s method to obtain comparable country estimates: Group 4. Countries/areas without eligible death
registration data. See explanatory note 3 in Global status report on road safety 2018 for full details
Turkmenistan Population: 5 662 544 | Income group: Middle |
Gross national income per capita: US$ 6 670
Deaths by road user category
0
200
400
600
800
1000
201320122011201020092008
SAFER ROAD USERSNational speed limit law Yes
Max urban speed limit 60 km/h
Max rural speed limit 90 km/h
Max motorway speed limit 110 km/h
Local authorities can modify limits Yes
Self-reported enforcement 0 1 2 3 4 5 6 7 8 9 10
Predominant type of enforcement Manual and automated
National drink-driving law Yes
BAC limit – general population < 0.05 g/dl
BAC limit – young or novice drivers < 0.05 g/dl
Random breath testing carried out Yes
Testing carried out in case of fatal crash All drivers tested
Self-reported enforcement 0 1 2 3 4 5 6 7 8 9 10
% road traffi c deaths involving alcohol —
National motorcycle helmet law Yes
Applies to drivers and passengers Yes
Helmet fastening required No
Helmet standard referred to and/or specifi ed No
Children passengers on motorcycles Prohibited under 12 yrs
Self-reported enforcement 0 1 2 3 4 5 6 7 8 9 10
Helmet wearing rate —
National seat-belt law Yes
Applies to front and rear seat occupants Yes
Self-reported enforcement 0 1 2 3 4 5 6 7 8 9 10
Seat-belt wearing rate —
National child restraint law No
Children seated in front seat Allowed in a child restraint c
Child restraint required — d
Child restraint standard referred to and/or specifi ed —
Self-reported enforcement —
% children using child restraints —
National law on mobile phone use while driving Yes
Ban on hand-held mobile phone use Yes
Ban on hands-free mobile phone use Yes
National drug-driving law No c Law does not specifi cally refer to child restraint system but to "special seating equipment" for children
under 12 yearsd Special seating equipment for children under 12 years is mentioned only in relation with front seating
Trends in reported road traffi c deaths
DATA N OT AVA I L A B L E
Num
ber
of r
oad
traffi
c
deat
hs
Source: Traffi c Police, Ministry of Internal Aff airs, Report 1-accident Report on road traffic accidents
© World Health Organization 2020. Some rights reserved. This work is available under the CC BY-NC-SA 3.0 IGO license.
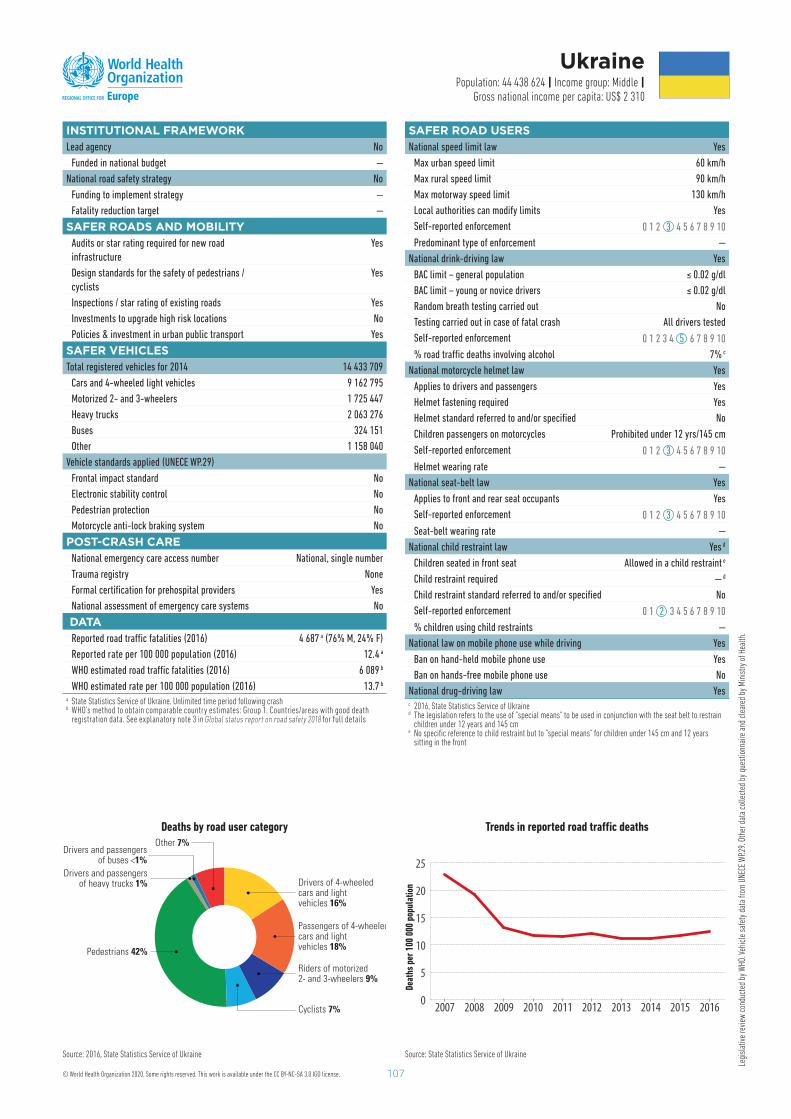
107
Legi
slat
ive
revi
ew c
ondu
cted
by
WHO
. Veh
icle
saf
ety
data
from
UNE
CE W
P.29.
Oth
er d
ata
colle
cted
by
ques
tionn
aire
and
cle
ared
by
Min
istry
of H
ealth
.
INSTITUTIONAL FRAMEWORKLead agency No
Funded in national budget —
National road safety strategy No
Funding to implement strategy —
Fatality reduction target —
SAFER ROADS AND MOBILITY Audits or star rating required for new road
infrastructure
Yes
Design standards for the safety of pedestrians /
cyclists
Yes
Inspections / star rating of existing roads Yes
Investments to upgrade high risk locations No
Policies & investment in urban public transport Yes
SAFER VEHICLES Total registered vehicles for 2014 14 433 709
Cars and 4-wheeled light vehicles 9 162 795
Motorized 2- and 3-wheelers 1 725 447
Heavy trucks 2 063 276
Buses 324 151
Other 1 158 040
Vehicle standards applied (UNECE WP.29)
Frontal impact standard No
Electronic stability control No
Pedestrian protection No
Motorcycle anti-lock braking system No
POST-CRASH CARENational emergency care access number National, single number
Trauma registry None
Formal certifi cation for prehospital providers Yes
National assessment of emergency care systems No
DATAReported road traffi c fatalities (2016) 4 687 a ( 76 % M, 24 % F)
Reported rate per 100 000 population (2016) 12.4 a
WHO estimated road traffi c fatalities (2016) 6 089 b
WHO estimated rate per 100 000 population (2016) 13.7 b
a State Statistics Service of Ukraine. Unlimited time period following crash b WHO’s method to obtain comparable country estimates: Group 1. Countries/areas with good death
registration data. See explanatory note 3 in Global status report on road safety 2018 for full details
Ukraine Population: 44 438 624 | Income group: Middle |
Gross national income per capita: US$ 2 310
Deaths by road user category
Drivers of 4-wheeledcars and lightvehicles 16%
Passengers of 4-wheeledcars and lightvehicles 18%
Riders of motorized2- and 3-wheelers 9%
Pedestrians 42%
Drivers and passengersof heavy trucks 1%
Cyclists 7%
Drivers and passengersof buses <1%
Other 7%
Source: 2016, State Statistics Service of Ukraine Source: State Statistics Service of Ukraine
0
5
10
15
20
25
2016201520142013201220112010200920082007
SAFER ROAD USERSNational speed limit law Yes
Max urban speed limit 60 km/h
Max rural speed limit 90 km/h
Max motorway speed limit 130 km/h
Local authorities can modify limits Yes
Self-reported enforcement 0 1 2 3 4 5 6 7 8 9 10
Predominant type of enforcement —
National drink-driving law Yes
BAC limit – general population ≤ 0.02 g/dl
BAC limit – young or novice drivers ≤ 0.02 g/dl
Random breath testing carried out No
Testing carried out in case of fatal crash All drivers tested
Self-reported enforcement 0 1 2 3 4 5 6 7 8 9 10
% road traffi c deaths involving alcohol 7% c
National motorcycle helmet law Yes
Applies to drivers and passengers Yes
Helmet fastening required Yes
Helmet standard referred to and/or specifi ed No
Children passengers on motorcycles Prohibited under 12 yrs /145 cm
Self-reported enforcement 0 1 2 3 4 5 6 7 8 9 10
Helmet wearing rate —
National seat-belt law Yes
Applies to front and rear seat occupants Yes
Self-reported enforcement 0 1 2 3 4 5 6 7 8 9 10
Seat-belt wearing rate —
National child restraint law Yes d
Children seated in front seat Allowed in a child restraint e
Child restraint required — d
Child restraint standard referred to and/or specifi ed No
Self-reported enforcement 0 1 2 3 4 5 6 7 8 9 10
% children using child restraints —
National law on mobile phone use while driving Yes
Ban on hand-held mobile phone use Yes
Ban on hands-free mobile phone use No
National drug-driving law Yes c 2016, State Statistics Service of Ukrained The legislation refers to the use of "special means" to be used in conjunction with the seat belt to restrain
children under 12 years and 145 cme No specifi c reference to child restraint but to "special means" for children under 145 cm and 12 years
sitting in the front
Trends in reported road traffi c deaths
Deat
hs p
er 1
00 0
00 p
opul
atio
n
© World Health Organization 2020. Some rights reserved. This work is available under the CC BY-NC-SA 3.0 IGO license.
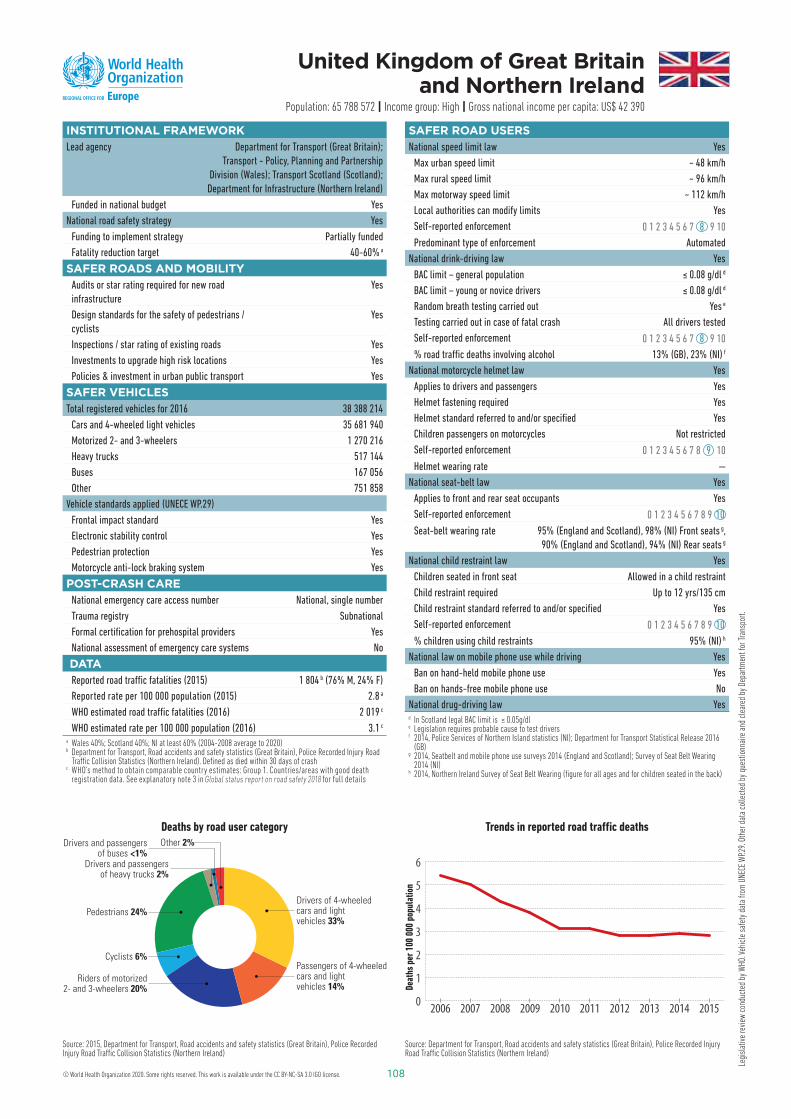
108108
Legi
slat
ive
revi
ew c
ondu
cted
by
WHO
. Veh
icle
saf
ety
data
from
UNE
CE W
P.29.
Oth
er d
ata
colle
cted
by
ques
tionn
aire
and
cle
ared
by
Depa
rtmen
t for
Tra
nspo
rt.
INSTITUTIONAL FRAMEWORKLead agency Department for Transport (Great Britain);
Transport - Policy, Planning and Partnership
Division (Wales); Transport Scotland (Scotland);
Department for Infrastructure (Northern Ireland)
Funded in national budget Yes
National road safety strategy Yes
Funding to implement strategy Partially funded
Fatality reduction target 40-60% a
SAFER ROADS AND MOBILITY Audits or star rating required for new road
infrastructure
Yes
Design standards for the safety of pedestrians /
cyclists
Yes
Inspections / star rating of existing roads Yes
Investments to upgrade high risk locations Yes
Policies & investment in urban public transport Yes
SAFER VEHICLES Total registered vehicles for 2016 38 388 214
Cars and 4-wheeled light vehicles 35 681 940
Motorized 2- and 3-wheelers 1 270 216
Heavy trucks 517 144
Buses 167 056
Other 751 858
Vehicle standards applied (UNECE WP.29)
Frontal impact standard Yes
Electronic stability control Yes
Pedestrian protection Yes
Motorcycle anti-lock braking system Yes
POST-CRASH CARENational emergency care access number National, single number
Trauma registry Subnational
Formal certifi cation for prehospital providers Yes
National assessment of emergency care systems No
DATAReported road traffi c fatalities (2015) 1 804 b ( 76 % M, 24 % F)
Reported rate per 100 000 population (2015) 2.8 a
WHO estimated road traffi c fatalities (2016) 2 019 c
WHO estimated rate per 100 000 population (2016) 3.1 c
a Wales 40%; Scotland 40%; NI at least 60% (2004-2008 average to 2020)b Department for Transport, Road accidents and safety statistics (Great Britain), Police Recorded Injury Road
Traffi c Collision Statistics (Northern Ireland). Defi ned as died within 30 days of crashc WHO’s method to obtain comparable country estimates: Group 1. Countries/areas with good death
registration data. See explanatory note 3 in Global status report on road safety 2018 for full details
United Kingdom of Great Britain and Northern Ireland
Population: 65 788 572 | Income group: High | Gross national income per capita: US$ 42 390
Deaths by road user category
Drivers of 4-wheeledcars and lightvehicles 33%
Passengers of 4-wheeledcars and lightvehicles 14%
Cyclists 6%
Pedestrians 24%
Riders of motorized2- and 3-wheelers 20%
Drivers and passengersof buses <1%
Other 2%
Drivers and passengersof heavy trucks 2%
Source: 2015, Department for Transport, Road accidents and safety statistics (Great Britain), Police Recorded Injury Road Traffi c Collision Statistics (Northern Ireland)
Source: Department for Transport, Road accidents and safety statistics (Great Britain), Police Recorded Injury Road Traffi c Collision Statistics (Northern Ireland)
0
1
2
3
4
5
6
2015201420132012201120102009200820072006
SAFER ROAD USERSNational speed limit law Yes
Max urban speed limit ~ 48 km/h
Max rural speed limit ~ 96 km/h
Max motorway speed limit ~ 112 km/h
Local authorities can modify limits Yes
Self-reported enforcement 0 1 2 3 4 5 6 7 8 9 10
Predominant type of enforcement Automated
National drink-driving law Yes
BAC limit – general population ≤ 0.08 g/dl d
BAC limit – young or novice drivers ≤ 0.08 g/dl d
Random breath testing carried out Yes e
Testing carried out in case of fatal crash All drivers tested
Self-reported enforcement 0 1 2 3 4 5 6 7 8 9 10
% road traffi c deaths involving alcohol 13% (GB), 23% (NI) f
National motorcycle helmet law Yes
Applies to drivers and passengers Yes
Helmet fastening required Yes
Helmet standard referred to and/or specifi ed Yes
Children passengers on motorcycles Not restricted
Self-reported enforcement 0 1 2 3 4 5 6 7 8 9 10
Helmet wearing rate —
National seat-belt law Yes
Applies to front and rear seat occupants Yes
Self-reported enforcement 0 1 2 3 4 5 6 7 8 9 10
Seat-belt wearing rate 95% (England and Scotland), 98% (NI) Front seats g ,
90% (England and Scotland), 94% (NI) Rear seats g
National child restraint law Yes
Children seated in front seat Allowed in a child restraint
Child restraint required U p to 12 yrs /135 cm
Child restraint standard referred to and/or specifi ed Yes
Self-reported enforcement 0 1 2 3 4 5 6 7 8 9 10
% children using child restraints 95% (NI) h
National law on mobile phone use while driving Yes
Ban on hand-held mobile phone use Yes
Ban on hands-free mobile phone use No
National drug-driving law Yes d In Scotland legal BAC limit is ≤ 0.05g/dle Legislation requires probable cause to test driversf 2014, Police Services of Northern Island statistics (NI); Department for Transport Statistical Release 2016
(GB)g 2014, Seatbelt and mobile phone use surveys 2014 (England and Scotland); Survey of Seat Belt Wearing
2014 (NI)h 2014, Northern Ireland Survey of Seat Belt Wearing (fi gure for all ages and for children seated in the back)
Trends in reported road traffi c deaths
Deat
hs p
er 1
00 0
00 p
opul
atio
n
© World Health Organization 2020. Some rights reserved. This work is available under the CC BY-NC-SA 3.0 IGO license.
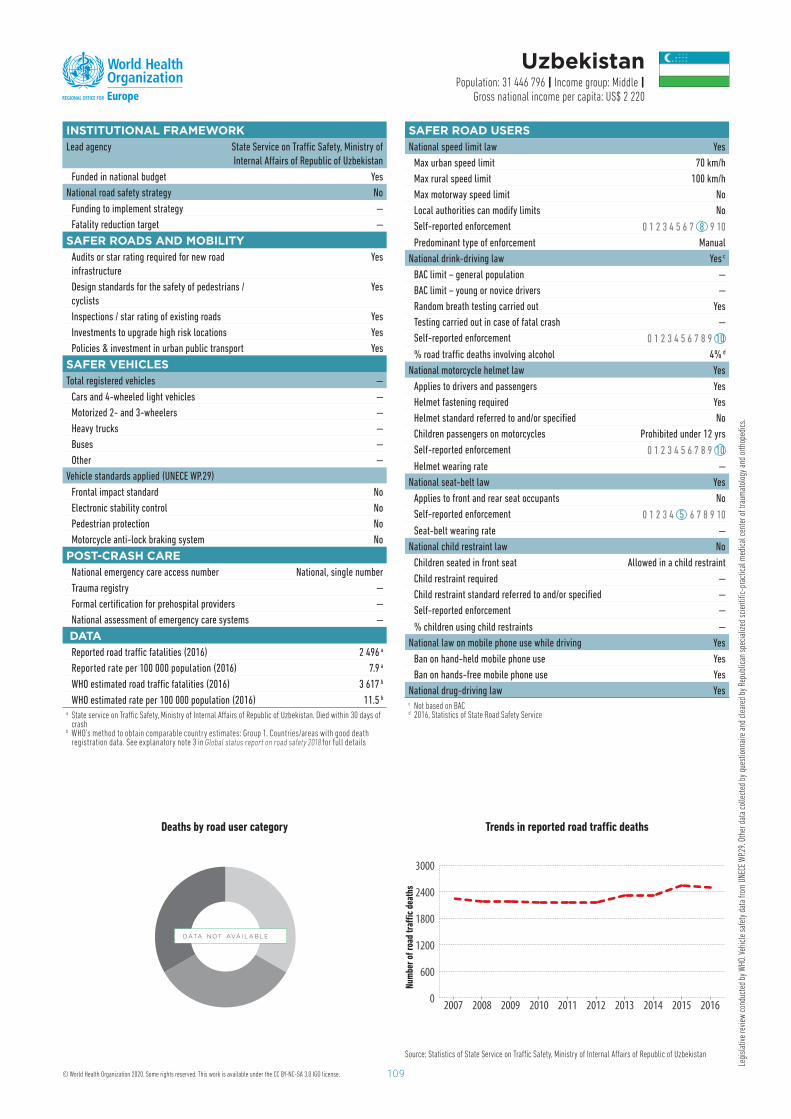
109
Legi
slat
ive
revi
ew c
ondu
cted
by
WHO
. Veh
icle
saf
ety
data
from
UNE
CE W
P.29.
Oth
er d
ata
colle
cted
by
ques
tionn
aire
and
cle
ared
by
Repu
blic
an s
peci
aliz
ed s
cien
tifi c
-pra
ctic
al m
edic
al c
ente
r of t
raum
atol
ogy
and
orth
oped
ics.
INSTITUTIONAL FRAMEWORKLead agency State Service on Traffi c Safety, Ministry of
Internal Aff airs of Republic of Uzbekistan
Funded in national budget Yes
National road safety strategy No
Funding to implement strategy —
Fatality reduction target —
SAFER ROADS AND MOBILITY Audits or star rating required for new road
infrastructure
Yes
Design standards for the safety of pedestrians /
cyclists
Yes
Inspections / star rating of existing roads Yes
Investments to upgrade high risk locations Yes
Policies & investment in urban public transport Yes
SAFER VEHICLES Total registered vehicles —
Cars and 4-wheeled light vehicles —
Motorized 2- and 3-wheelers —
Heavy trucks —
Buses —
Other —
Vehicle standards applied (UNECE WP.29)
Frontal impact standard No
Electronic stability control No
Pedestrian protection No
Motorcycle anti-lock braking system No
POST-CRASH CARENational emergency care access number National, single number
Trauma registry —
Formal certifi cation for prehospital providers —
National assessment of emergency care systems —
DATAReported road traffi c fatalities (2016) 2 496 a
Reported rate per 100 000 population (2016) 7.9 a
WHO estimated road traffi c fatalities (2016) 3 617 b
WHO estimated rate per 100 000 population (2016) 11.5 b
a State service on Traffi c Safety, Ministry of Internal Aff airs of Republic of Uzbekistan. Died within 30 days of crash
b WHO’s method to obtain comparable country estimates: Group 1. Countries/areas with good death registration data. See explanatory note 3 in Global status report on road safety 2018 for full details
Uzbekistan Population: 31 446 796 | Income group: Middle |
Gross national income per capita: US$ 2 220
Deaths by road user category
Source: Statistics of State Service on Traffi c Safety, Ministry of Internal Aff airs of Republic of Uzbekistan
0
600
1200
1800
2400
3000
2016201520142013201220112010200920082007
SAFER ROAD USERSNational speed limit law Yes
Max urban speed limit 70 km/h
Max rural speed limit 100 km/h
Max motorway speed limit No
Local authorities can modify limits No
Self-reported enforcement 0 1 2 3 4 5 6 7 8 9 10
Predominant type of enforcement Manual
National drink-driving law Yes c
BAC limit – general population —
BAC limit – young or novice drivers —
Random breath testing carried out Yes
Testing carried out in case of fatal crash —
Self-reported enforcement 0 1 2 3 4 5 6 7 8 9 10
% road traffi c deaths involving alcohol 4% d
National motorcycle helmet law Yes
Applies to drivers and passengers Yes
Helmet fastening required Yes
Helmet standard referred to and/or specifi ed No
Children passengers on motorcycles Prohibited under 12 yrs
Self-reported enforcement 0 1 2 3 4 5 6 7 8 9 10
Helmet wearing rate —
National seat-belt law Yes
Applies to front and rear seat occupants No
Self-reported enforcement 0 1 2 3 4 5 6 7 8 9 10
Seat-belt wearing rate —
National child restraint law No
Children seated in front seat Allowed in a child restraint
Child restraint required —
Child restraint standard referred to and/or specifi ed —
Self-reported enforcement —
% children using child restraints —
National law on mobile phone use while driving Yes
Ban on hand-held mobile phone use Yes
Ban on hands-free mobile phone use Yes
National drug-driving law Yes c Not based on BACd 2016, Statistics of State Road Safety Service
Trends in reported road traffi c deaths
DATA N OT AVA I L A B L E
Num
ber
of r
oad
traffi
c
deat
hs
© World Health Organization 2020. Some rights reserved. This work is available under the CC BY-NC-SA 3.0 IGO license.

111
ANNEXES
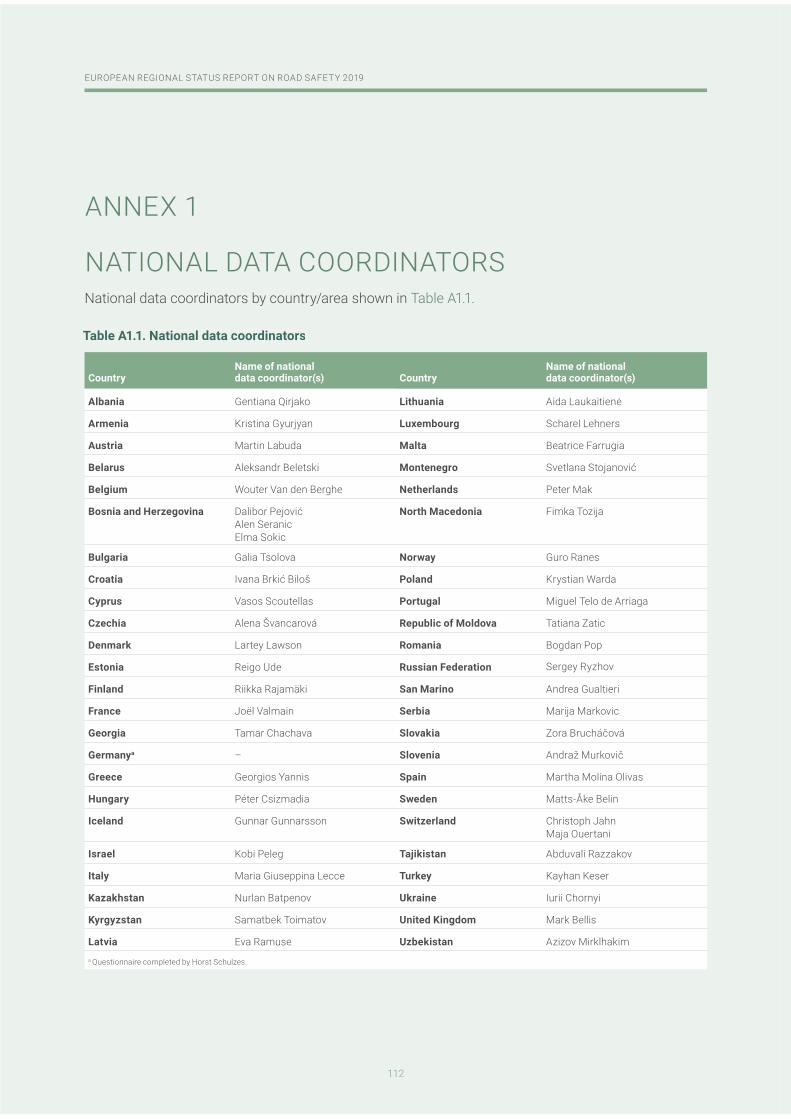
112
EUROPEAN REGIONAL STATUS REPORT ON ROAD SAFETY 2019
112
EUROPEAN REGIONAL STATUS REPORT ON ROAD SAFETY 2019
ANNEX 1
NATIONAL DATA COORDINATORSNational data coordinators by country/area shown in Table A1.1.
CountryName of national data coordinator(s) Country
Name of national data coordinator(s)
Albania Gentiana Qirjako Lithuania Aida Laukaitienė
Armenia Kristina Gyurjyan Luxembourg Scharel Lehners
Austria Martin Labuda Malta Beatrice Farrugia
Belarus Aleksandr Beletski Montenegro Svetlana Stojanović
Belgium Wouter Van den Berghe Netherlands Peter Mak
Bosnia and Herzegovina Dalibor PejovićAlen SeranicElma Sokic
North Macedonia Fimka Tozija
Bulgaria Galia Tsolova Norway Guro Ranes
Croatia Ivana Brkić Biloš Poland Krystian Warda
Cyprus Vasos Scoutellas Portugal Miguel Telo de Arriaga
Czechia Alena Švancarová Republic of Moldova Tatiana Zatic
Denmark Lartey Lawson Romania Bogdan Pop
Estonia Reigo Ude Russian Federation Sergey Ryzhov
Finland Riikka Rajamäki San Marino Andrea Gualtieri
France Joël Valmain Serbia Marija Markovic
Georgia Tamar Chachava Slovakia Zora Brucháčová
Germanya – Slovenia Andraž Murkovič
Greece Georgios Yannis Spain Martha Molina Olivas
Hungary Péter Csizmadia Sweden Matts-Åke Belin
Iceland Gunnar Gunnarsson Switzerland Christoph JahnMaja Ouertani
Israel Kobi Peleg Tajikistan Abduvali Razzakov
Italy Maria Giuseppina Lecce Turkey Kayhan Keser
Kazakhstan Nurlan Batpenov Ukraine Iurii Chornyi
Kyrgyzstan Samatbek Toimatov United Kingdom Mark Bellis
Latvia Eva Ramuse Uzbekistan Azizov Mirklhakima Questionnaire completed by Horst Schulzes.
Table A1.1. National data coordinators
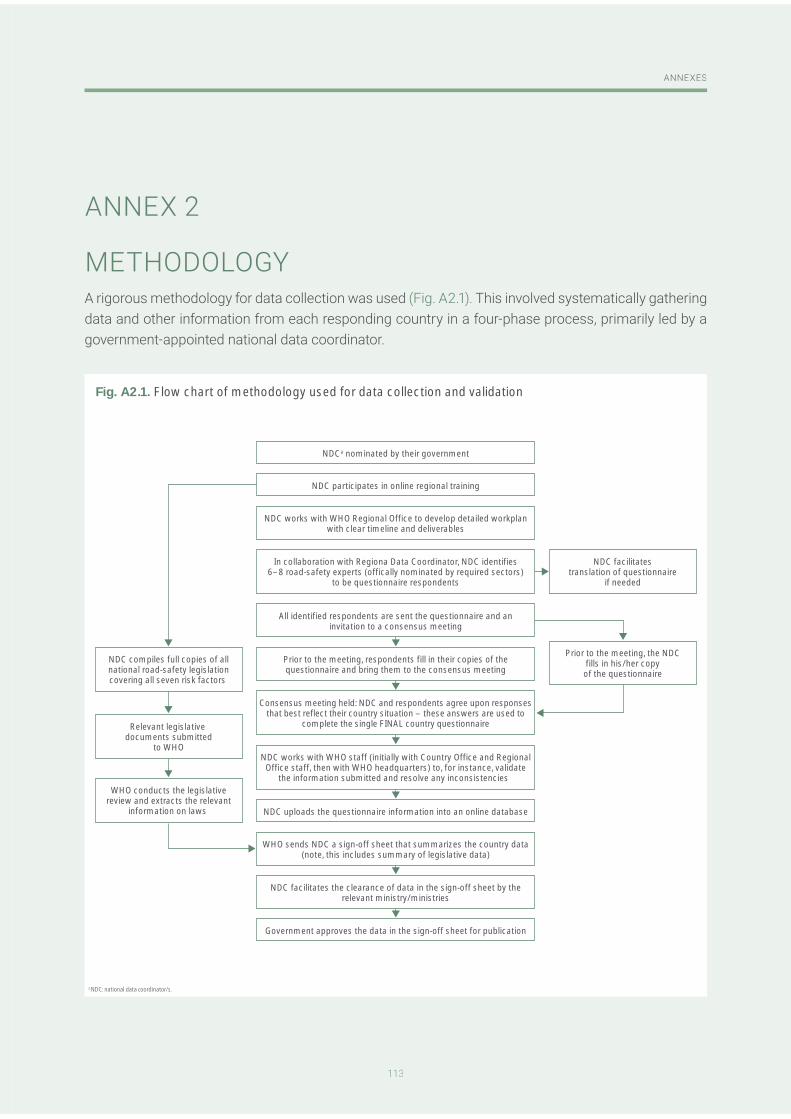
113
ANNEXES
113
ANNEXES
a NDC: national data coordinator/s.
NDC facilitatestranslation of questionnaire
if needed
NDCa nominated by their government
NDC participates in online regional training
NDC works with WHO Regional Office to develop detailed workplanwith clear timeline and deliverables
All identified respondents are sent the questionnaire and aninvitation to a consensus meeting
Prior to the meeting, respondents fill in their copies of thequestionnaire and bring them to the consensus meeting
NDC compiles full copies of allnational road-safety legislationcovering all seven risk factors
WHO conducts the legislativereview and extracts the relevant
information on laws
Relevant legislative documents submitted
to WHO
Prior to the meeting, the NDCfills in his/her copy
of the questionnaire
WHO sends NDC a sign-off sheet that summarizes the country data(note, this includes summary of legislative data)
NDC facilitates the clearance of data in the sign-off sheet by therelevant ministry/ministries
NDC uploads the questionnaire information into an online database
Government approves the data in the sign-off sheet for publication
Consensus meeting held: NDC and respondents agree upon responsesthat best reflect their country situation – these answers are used to
complete the single FINAL country questionnaire
In collaboration with Regiona Data Coordinator, NDC identifies6–8 road-safety experts (offically nominated by required sectors)
to be questionnaire respondents
NDC works with WHO staff (initially with Country Office and RegionalOffice staff, then with WHO headquarters) to, for instance, validate
the information submitted and resolve any inconsistencies
Fig. A2.1. Flow chart of methodology used for data collection and validation
ANNEX 2
METHODOLOGYA rigorous methodology for data collection was used (Fig. A2.1). This involved systematically gathering data and other information from each responding country in a four-phase process, primarily led by a government-appointed national data coordinator.
114
EUROPEAN REGIONAL STATUS REPORT ON ROAD SAFETY 2019
First, a self-administered questionnaire was completed in each country by respondents from ministries including health, transport, police, national highway agency, emergency care, education, interior, national statistics offi ce and, where relevant, nongovernmental organizations. Secondly, respondents were encouraged to hold a consensus meeting and agree on the data that best represented their country. Thirdly, WHO headquarters and regional technical staff validated the fi nal data submitted for each responding country by checking them against independent databases and other sources. Lastly, approval to include the fi nal data in this report was obtained from the national data coordinator and/or government offi cials.
Some data presented in this report were obtained from the WHO Global Health Estimates (1): this is clearly stated where applicable.
The questionnaire covered the following areas, which included indicators such as:
the existence of a lead agency for road safety; national strategies and targets relating to reductions in road-traffi c deaths; data on the magnitude of the road-traffi c injury problem; policy and practices on infrastructure; legislation and enforcement on a number of key risk factors – speed, drink–driving
and seat-belt and helmet use; and services to address the post-crash situation.
This report presents data from 51 countries that participated in the survey out of a total of 53 countries of the WHO European Region. National counterparts from Andorra and Monaco were not able to participate in the survey. Subanalyses by country income and subregional grouping are offered to identify inequalities in the Region. Analyses by income level include 30 high-income countries and 21 low- and middle-income countries, as defi ned by the World Bank (2). Analyses by subregion include 28 European Union countries and the 11 countries comprising the Commonwealth of Independent States. Together, these countries represent almost 100% of the Region’s 916 million people. Progress in the Region is also analysed against results from 48 Member States in the base survey conducted in 2013.
REFERENCES
1. WHO global health estimates 2016 summary tables: deaths by cause, age and sex, by WHO region, 2000–2016. In: World Health Organization [website]. Geneva: World Health Organization; 2016 (https://www.who.int/healthinfo/global_burden_disease/estimates/en/index1.html, accessed 20 February 2020).
2. World Bank open data [online database]. In: World Bank [website]. Washington (DC): World Bank; 2019 (https://data.worldbank.org, accessed 20 February 2020).
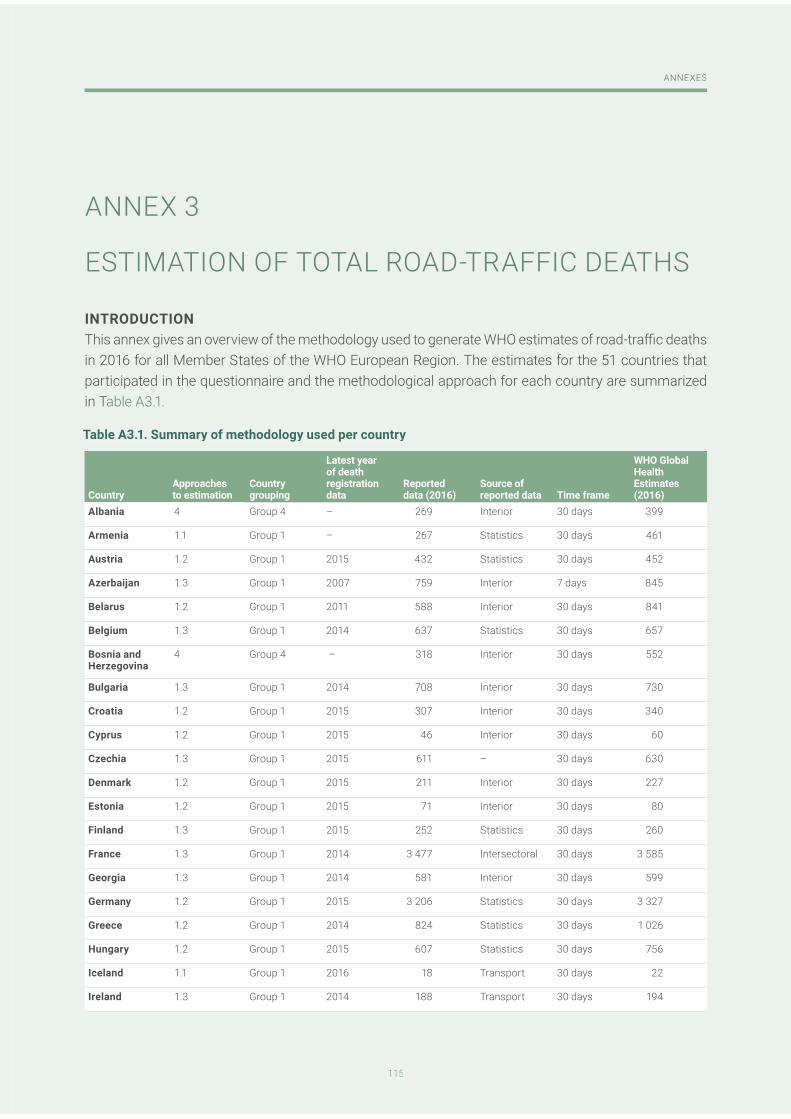
115
ANNEXES
115
ANNEXES
ANNEX 3
ESTIMATION OF TOTAL ROAD-TRAFFIC DEATHS
INTRODUCTIONThis annex gives an overview of the methodology used to generate WHO estimates of road-traffi c deaths in 2016 for all Member States of the WHO European Region. The estimates for the 51 countries that participated in the questionnaire and the methodological approach for each country are summarized in Table A3.1.
CountryApproaches to estimation
Country grouping
Latest yearof death registration data
Reported data (2016)
Source of reported data Time frame
WHO GlobalHealth Estimates (2016)
Albania 4 Group 4 – .269 Interior 30 days .399
Armenia 1.1 Group 1 – .267 Statistics 30 days .461
Austria 1.2 Group 1 2015 .432 Statistics 30 days .452
Azerbaijan 1.3 Group 1 2007 .759 Interior 7 days .845
Belarus 1.2 Group 1 2011 .588 Interior 30 days .841
Belgium 1.3 Group 1 2014 ..637 Statistics 30 days .657
Bosnia and Herzegovina
4 Group 4 – .318 Interior 30 days .552
Bulgaria 1.3 Group 1 2014 .708 Interior 30 days .730
Croatia 1.2 Group 1 2015 .307 Interior 30 days .340
Cyprus 1.2 Group 1 2015 .46 Interior 30 days .60
Czechia 1.3 Group 1 2015 .611 – 30 days .630
Denmark 1.2 Group 1 2015 .211 Interior 30 days .227
Estonia 1.2 Group 1 2015 .71 Interior 30 days .80
Finland 1.3 Group 1 2015 .252 Statistics 30 days .260
France 1.3 Group 1 2014 3.477 Intersectoral 30 days 3.585
Georgia 1.3 Group 1 2014 .581 Interior 30 days .599
Germany 1.2 Group 1 2015 3.206 Statistics 30 days 3.327
Greece 1.2 Group 1 2014 .824 Statistics 30 days 1.026
Hungary 1.2 Group 1 2015 .607 Statistics 30 days .756
Iceland 1.1 Group 1 2016 .18 Transport 30 days .22
Ireland 1.3 Group 1 2014 .188 Transport 30 days .194
Table A3.1. Summary of methodology used per country
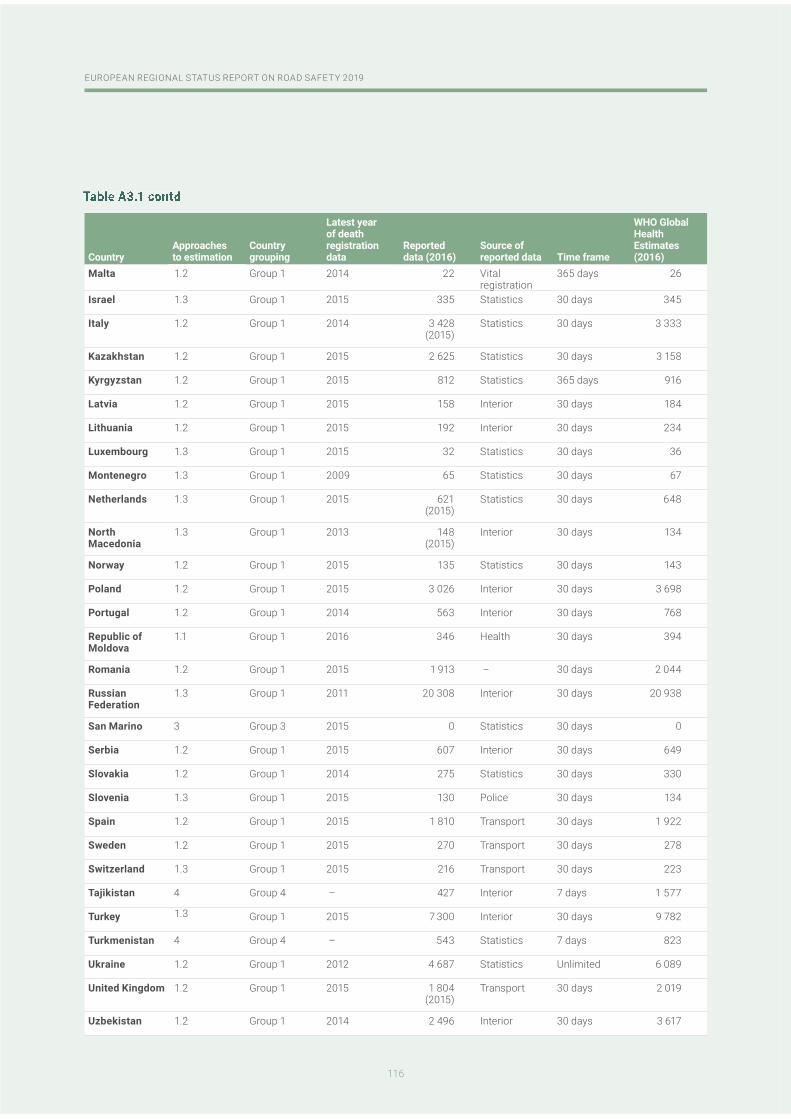
116
EUROPEAN REGIONAL STATUS REPORT ON ROAD SAFETY 2019
CountryApproaches to estimation
Country grouping
Latest yearof death registration data
Reported data (2016)
Source of reported data Time frame
WHO GlobalHealth Estimates (2016)
Malta 1.2 Group 1 2014 .22 Vital registration
365 days 26
Israel 1.3 Group 1 2015 .335 Statistics 30 days 345
Italy 1.2 Group 1 2014 3.428.(2015)
Statistics 30 days 3 333
Kazakhstan 1.2 Group 1 2015 2.625 Statistics 30 days 3 158
Kyrgyzstan 1.2 Group 1 2015 .812 Statistics 365 days 916
Latvia 1.2 Group 1 2015 .158 Interior 30 days 184
Lithuania 1.2 Group 1 2015 .192 Interior 30 days 234
Luxembourg 1.3 Group 1 2015 .32 Statistics 30 days 36
Montenegro 1.3 Group 1 2009 .65 Statistics 30 days 67
Netherlands 1.3 Group 1 2015 .621.(2015)
Statistics 30 days 648
North Macedonia
1.3 Group 1 2013 .148.(2015)
Interior 30 days 134
Norway 1.2 Group 1 2015 .135 Statistics 30 days 143
Poland 1.2 Group 1 2015 3.026 Interior 30 days 3 698
Portugal 1.2 Group 1 2014 .563 Interior 30 days 768
Republic of Moldova
1.1 Group 1 2016 .346 Health 30 days 394
Romania 1.2 Group 1 2015 1.913 – 30 days 2 044
Russian Federation
1.3 Group 1 2011 20.308 Interior 30 days 20 938
San Marino 3. Group 3 2015 .0 Statistics 30 days 0
Serbia 1.2 Group 1 2015 .607 Interior 30 days 649
Slovakia 1.2 Group 1 2014 .275 Statistics 30 days 330
Slovenia 1.3 Group 1 2015 .130 Police 30 days 134
Spain 1.2 Group 1 2015 1.810 Transport 30 days 1 922
Sweden 1.2 Group 1 2015 .270 Transport 30 days 278
Switzerland 1.3 Group 1 2015 .216 Transport 30 days 223
Tajikistan 4. Group 4 – .427 Interior 7 days 1 577
Turkey 1.3 Group 1 2015 7.300 Interior 30 days 9 782
Turkmenistan 4. Group 4 – .543 Statistics 7 days 823
Ukraine 1.2 Group 1 2012 4.687 Statistics Unlimited 6 089
United Kingdom 1.2 Group 1 2015 1.804.(2015)
Transport 30 days 2 019
Uzbekistan 1.2 Group 1 2014 2.496 Interior 30 days 3 617
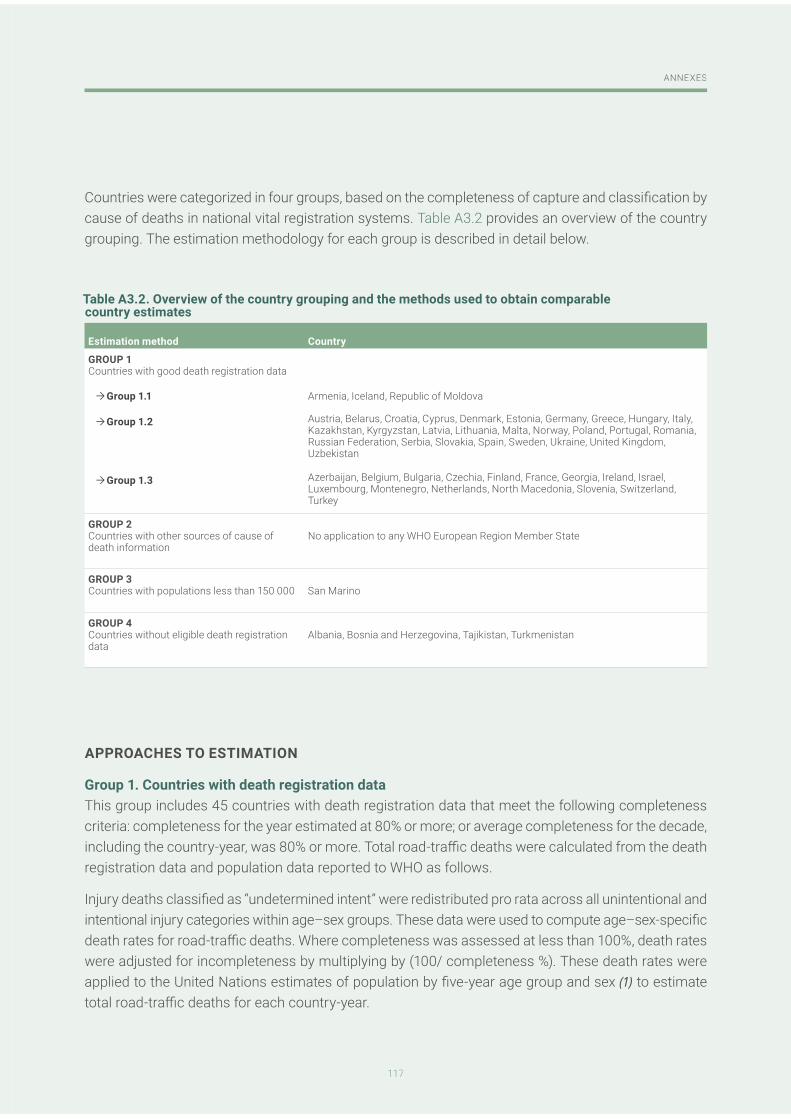
117
ANNEXES
117
ANNEXES
Countries were categorized in four groups, based on the completeness of capture and classifi cation by cause of deaths in national vital registration systems. Table A3.2 provides an overview of the country grouping. The estimation methodology for each group is described in detail below.
APPROACHES TO ESTIMATION
Group 1. Countries with death registration dataThis group includes 45 countries with death registration data that meet the following completeness criteria: completeness for the year estimated at 80% or more; or average completeness for the decade, including the country-year, was 80% or more. Total road-traffi c deaths were calculated from the death registration data and population data reported to WHO as follows.
Injury deaths classifi ed as “undetermined intent” were redistributed pro rata across all unintentional and intentional injury categories within age–sex groups. These data were used to compute age–sex-specifi c death rates for road-traffi c deaths. Where completeness was assessed at less than 100%, death rates were adjusted for incompleteness by multiplying by (100/ completeness %). These death rates were applied to the United Nations estimates of population by fi ve-year age group and sex (1) to estimate total road-traffi c deaths for each country-year.
Estimation method Country
GROUP 1Countries with good death registration data
Group 1.1 Armenia, Iceland, Republic of Moldova
Group 1.2 Austria, Belarus, Croatia, Cyprus, Denmark, Estonia, Germany, Greece, Hungary, Italy, Kazakhstan, Kyrgyzstan, Latvia, Lithuania, Malta, Norway, Poland, Portugal, Romania, Russian Federation, Serbia, Slovakia, Spain, Sweden, Ukraine, United Kingdom, Uzbekistan
Group 1.3 Azerbaijan, Belgium, Bulgaria, Czechia, Finland, France, Georgia, Ireland, Israel, Luxembourg, Montenegro, Netherlands, North Macedonia, Slovenia, Switzerland, Turkey
GROUP 2Countries with other sources of cause of death information
No application to any WHO European Region Member State
GROUP 3Countries with populations less than 150 000 San Marino
GROUP 4Countries without eligible death registration data
Albania, Bosnia and Herzegovina, Tajikistan, Turkmenistan
Table A3.2. Overview of the country grouping and the methods used to obtain comparable country estimates
118
EUROPEAN REGIONAL STATUS REPORT ON ROAD SAFETY 2019
These countries fall into three further categories.
1.1 Countries with death registration data for year 2016 where the estimated road-traffi c deaths for 2016 exceeded the number reported from the surveillance system. The death registration-based estimate is used. This category contains three countries (Armenia, Iceland and the Republic of Moldova).
1.2 Countries where the latest death registration data submitted to WHO are earlier than 2015 but not earlier than 2007. Deaths in year 2016 were estimated based on a projection of the most recent death registration data using the trends in reported surveillance data: this category contains 28 countries (Austria, Belarus, Croatia, Cyprus, Denmark, Estonia, Germany, Greece, Hungary, Italy, Kazakhstan, Kyrgyzstan, Latvia, Lithuania, Malta, Norway, Poland, Portugal, Romania, the Russian Federation, Serbia, Slovakia, Spain, Sweden, Ukraine, the United Kingdom and Uzbekistan).
1.3 Countries where the reported number of road-traffi c deaths adjusted to unlimited time for 2016 exceeded the estimate based on death registration data. For 15 countries, the reported road-traffi c deaths were used for year 2016 (Azerbaijan, Belgium, Bulgaria, Czechia, Finland, France, Georgia, Ireland, Israel, Luxembourg, Montenegro, the Netherlands, North Macedonia, Slovenia, Switzerlandand Turkey).
Group 2. Countries with other sources of information on causes of deathIn the WHO European Region, no countries fall under this grouping. For countries in other WHO regions that fall into this group, the regression method described below was used to project forward from the most recent year for which an estimate of total road-traffi c deaths was available.
Group 3. Countries with populations less than 150 000Regression estimates were not used for countries with populations less than 150 000 and which did not have eligible death registration data. The reported deaths were used directly without adjustment. This category contains one country (San Marino).
Group 4. Countries without eligible death registration dataFor four countries (Albania, Bosnia and Herzegovina, Tajikistan and Ukraine) without death registration data at least 80% complete and with populations greater than 150 000, a regression model was used to estimate total road-traffi c deaths. As for the fi rst report, a negative binomial regression model, appropriate for modeling non-negative integer count data (number of road-traffi c deaths) (2,3), was used. A likelihood ratio test was used to assess that the negative binomial model provided a better fi t to the data than a Poisson model (where the variance of the data is constrained to equal the mean):
(1) lnN = C + β1X1 + β2X2 + ... + βnXn + lnPop + ε
where N is the total road-traffi c deaths (for a country-year), C is a constant term, Xi are a set of explanatory covariates, Pop is the population for the country-year, and ε is the negative binomial error term. Population was used as exposure, making it possible to interpret the coeffi cients (βi) for the independent variables as effects on rates rather than a count. In a previous study, this type of model was used to represent
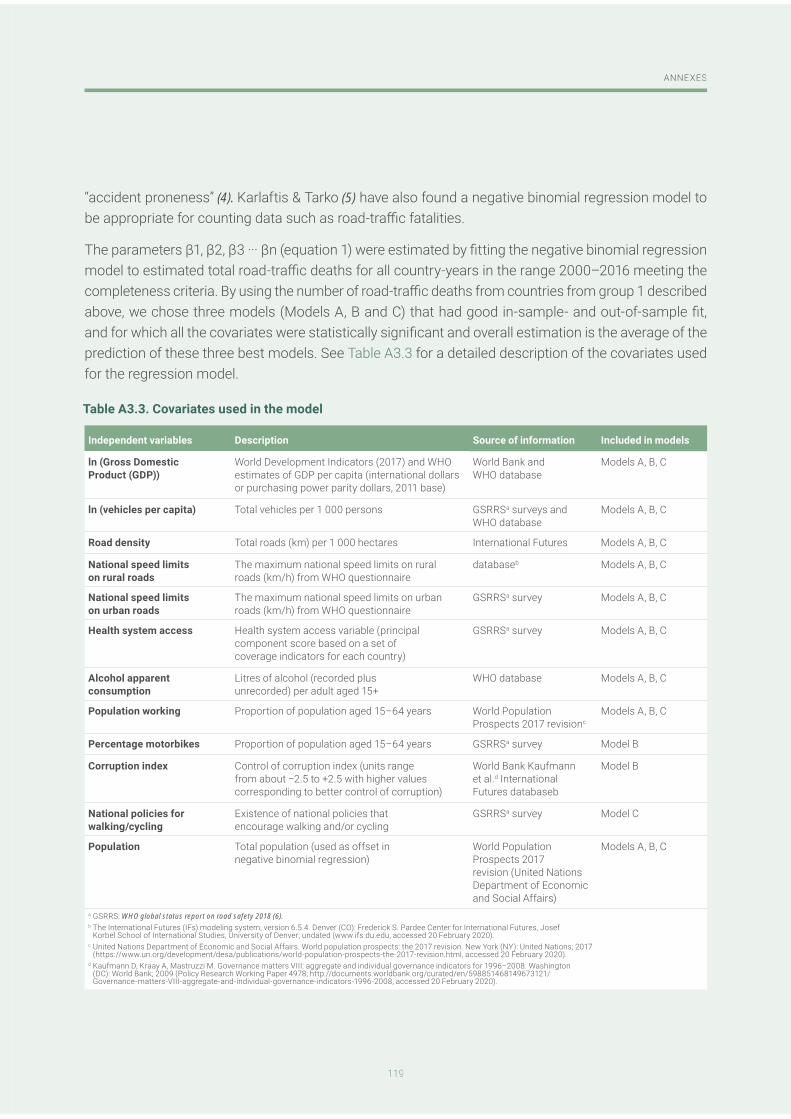
119
ANNEXES
119
ANNEXES
“accident proneness” (4). Karlaftis & Tarko (5) have also found a negative binomial regression model to be appropriate for counting data such as road-traffi c fatalities.
The parameters β1, β2, β3 ··· βn (equation 1) were estimated by fi tting the negative binomial regression model to estimated total road-traffi c deaths for all country-years in the range 2000–2016 meeting the completeness criteria. By using the number of road-traffi c deaths from countries from group 1 described above, we chose three models (Models A, B and C) that had good in-sample- and out-of-sample fi t, and for which all the covariates were statistically signifi cant and overall estimation is the average of the prediction of these three best models. See Table A3.3 for a detailed description of the covariates used for the regression model.
Independent variables Description Source of information Included in models
ln (Gross Domestic Product (GDP))
World Development Indicators (2017) and WHO estimates of GDP per capita (international dollars or purchasing power parity dollars, 2011 base)
World Bank and WHO database
Models A, B, C
ln (vehicles per capita) Total vehicles per 1 000 persons GSRRSa surveys and WHO database
Models A, B, C
Road density Total roads (km) per 1 000 hectares International Futures Models A, B, C
National speed limits on rural roads
The maximum national speed limits on rural roads (km/h) from WHO questionnaire
databaseb Models A, B, C
National speed limits on urban roads
The maximum national speed limits on urban roads (km/h) from WHO questionnaire
GSRRSa survey Models A, B, C
Health system access Health system access variable (principal component score based on a set of coverage indicators for each country)
GSRRSa survey Models A, B, C
Alcohol apparent consumption
Litres of alcohol (recorded plus unrecorded) per adult aged 15+
WHO database Models A, B, C
Population working Proportion of population aged 15–64 years World Population Prospects 2017 revisionc
Models A, B, C
Percentage motorbikes Proportion of population aged 15–64 years GSRRSa survey Model B
Corruption index Control of corruption index (units range from about −2.5 to +2.5 with higher values corresponding to better control of corruption)
World Bank Kaufmann et al.d International Futures databaseb
Model B
National policies for walking/cycling
Existence of national policies that encourage walking and/or cycling
GSRRSa survey Model C
Population Total population (used as offset in negative binomial regression)
World Population Prospects 2017 revision (United Nations Department of Economic and Social Affairs)
Models A, B, C
a GSRRS: WHO global status report on road safety 2018 (6). b The International Futures (IFs) modeling system, version 6.5.4. Denver (CO): Frederick S. Pardee Center for International Futures, Josef
Korbel School of International Studies, University of Denver; undated (www.ifs.du.edu, accessed 20 February 2020).c United Nations Department of Economic and Social Affairs. World population prospects: the 2017 revision. New York (NY): United Nations; 2017
(https://www.un.org/development/desa/publications/world-population-prospects-the-2017-revision.html, accessed 20 February 2020).d Kaufmann D, Kraay A, Mastruzzi M. Governance matters VIII: aggregate and individual governance indicators for 1996–2008. Washington
(DC): World Bank; 2009 (Policy Research Working Paper 4978; http://documents.worldbank.org/curated/en/598851468149673121/Governance-matters-VIII-aggregate-and-individual-governance-indicators-1996-2008, accessed 20 February 2020).
Table A3.3. Covariates used in the model
120
EUROPEAN REGIONAL STATUS REPORT ON ROAD SAFETY 2019
REFERENCES
1. Population Division of the Department of Economic and Social Affairs of the United Nations Secretariat. World population prospects: the 2012 revision, highlights. New York (NY): United Nations; 2013 (https://population.un.org/wpp/Publications/Files/WPP2012_HIGHLIGHTS.pdf, accessed 20 February 2020).
2. Law TH. The effects of political governance, policy measures and economic growth on the Kuznets relationship in motor vehicle crash deaths. London: Imperial College London; 2009.
3. Hilbe JM. Negative binomial regression. Cambridge: Cambridge University Press; 2007.
4. Greenwood M, Yule GU. An enquiry into the nature of frequency distributions representative of multiple happenings with particular reference to the occurrence of multiple attacks of disease or of repeated accidents. J R Stat Soc Ser A Stat Soc. 1920;83:255–79.
5. Karlaftis MG, Tarko AP. Heterogeneity considerations in accident modeling. Accid Anal Prev. 1998;30:425–33.
6. Global status report on road safety 2018. Geneva: World Health Organization; 2018 (https://www.who.int/violence_injury_prevention/road_safety_status/2018/en/, accessed 20 February 2020).

121
ANNEXES
121
ANNEXES
ANNEX 4
THE STOCKHOLM DECLARATION
122
EUROPEAN REGIONAL STATUS REPORT ON ROAD SAFETY 2019
Stockholm Declaration Third Global Ministerial Conference on Road Safety: Achieving Global Goals 2030
Stockholm, 19–20 February 2020
We, Ministers and Heads of Delegations as well as representatives of international, regional and sub-regional governmental and nongovernmental organizations and the private sector gathered in Stockholm, Sweden, on 19 and 20 February 2020 for the Third Global Ministerial Conference on Road Safety;
Acknowledge the leadership of the Government of Sweden in preparing and hosting this Third Global Ministerial Conference on Road Safety;
Commend the Government of the Russian Federation for hosting the First Global Ministerial Conference on Road Safety in 2009, which culminated in the Moscow Declaration, and the Government of Brazil for hosting the Second Global High-level Conference on Road Safety in 2015, which culminated in the Brasilia Declaration;
Acknowledge the role of the Governments of the Russian Federation and the Sultanate of Oman in leading the process for adoption of related United Nations General Assembly resolutions;
Recognize the right of every individual to the enjoyment of the highest attainable standard of health;
the importance of intensifying international cooperation and multilateralism in achieving health-related Sustainable Development Goals, with particular focus on achieving global road safety targets;
Welcome United Nations General Assembly resolution 70/1 of 25 September 2015, entitled “Transforming our world: the 2030 Agenda for Sustainable Development”, and the Sustainable Development Goals (SDGs) as a framework to integrate road safety in other policy areas, especially policy areas relating to SDG targets for Climate Action, Gender Equality, Health and Well-Being, Quality Education, Reduced Inequalities, Sustainable Cities and Communities,
Welcome the adoption on 10 October 2019 of the United Nations High-level Political Forum on Sustainable Development’s political declaration and its pledge in September 2019, to make the coming decade one of action and delivery, and the continued commitment to maintain the integrity of the 2030 Agenda, including by “ensuring ambitious and continuous action on the targets of the SDGs with a 2020 timeline1”, including target 3.6 of reducing
Welcome the adoption of sub-national, national and regional road safety strategies, targets and action plans such as those already adopted by the Central Asia Regional Economic Cooperation (CAREC) and the European Union (EU) to meet the target to halve road deaths and serious injuries by 2030; and recognize the importance of regional initiatives to mobilize multi-sector road safety partnerships;
Welcome and encourage monitoring and reporting of progress towards the achievement of Road Safety goals, such as the Voluntary Global Road Safety Performance Targets agreed by United Nations Member States;
Welcome key achievements to date of the Decade of Action for Road Safety 2011–2020, including enhanced global coordination through the World Health Organization, the United Nations Regional Commissions and the United Nations Road Safety Collaboration, increased accession and implementation of the United Nations legal instruments on road safety, greater civil society engagement, production and dissemination of information resources on road
1 https://undocs.org/en/A/HLPF/2019/l.1
123
ANNEXES
123
ANNEXES
SDGs, the establishment of the United Nations Road Safety Fund by support of the United Nations Secretary-General, the appointment and efforts of the United Nations Secretary-General’s Special Envoy for Road Safety in effectively mobilizing sustained high-level commitment to road safety, the increased commitment of the World Bank and other MDBs to road safety, increased focus and resources for road safety by many governments and the private sector including through donations to the Global Road Safety Facility and the Global Road Safety Partnership;
Acknowledge the lessons learnt from the Decade of Action for Road Safety 2011–2020 such as the need to promote an integrated approach to road safety such as a safe system approach and Vision Zero, pursue long-term and sustainable safety solutions, and strengthen national inter-sectoral collaboration including engagement with NGOs and civil society
Commend the progress made but emphasize that all countries
Recognize and work together to share experiences on adoption and enforcement of legislation on behavioral risks such as speeding, drinking and driving and failing to use seat-belts, child restraints and motorcycle helmets and implementation of proven measures to mitigate such risks, which could save hundreds of thousands of lives annually, but are still not being addressed in most countries;
casualties occurring in low- and middle-income countries, that these collisions are the leading cause of death for children
commitment, leadership and greater action at all levels in the next decade;
Acknowledgetaking into account their needs and those of other vulnerable populations including older people and persons with disabilities;
Call attention to the damaging impact of road crashes and related deaths and injuries on long-term national economic growth, the unequal progress across regions and income levels and express concern over the fact that no low-income
between development and road safety;
Acknowledge major development and public health problem that has broad social and economic consequences which, if unaddressed, will affect progress towards the achievement of the SDGs;
Recognize the distinct and divergent challenges posed for road safety and sustainability in both urban and rural areas and note in particular the growing safety threat for vulnerable road users in cities;
the centrality to effective, evidence-based policymaking of gathering quality data, including at the regional level, notably on deaths and serious injuries;
Recognize that advanced vehicle safety technologies are among the most effective of all automotive safety devices;
Recognize our shared responsibility between system designers and road users to move towards a world free from
among the public and private sectors, academia, professional organizations, nongovernmental organizations and the media;
124
EUROPEAN REGIONAL STATUS REPORT ON ROAD SAFETY 2019
Recognize that SDG target 3.6 will not be met by 2020 stronger national leadership, global cooperation, implementation of evidence-based strategies and engagement with all relevant actors including the private sector, as well as additional innovative approaches.
Reiterating our strong commitment to achieving global goals by 2030 and emphasizing our shared responsibility, we hereby resolve to;
1. our commitment to the full implementation of the 2030 Agenda, recognizing the synergies between the
2. the connections between road safety, mental and physical health, development, education, equity, gender equality, sustainable cities, environment and climate change, as well as the social determinants of safety and the interdependence between the different SDGs, recalling that the SDGs and targets are integrated and indivisible;
3. Call with the United Nations High-Level Political Forum on Sustainable Development’s pledge to continue action on the road safety related SDG targets, including 3.6 after 2020, and to set targets to reduce fatalities and serious injuries, in line with this commitment, for all groups of road users and especially vulnerable road users such as pedestrians, cyclists and motorcyclists and users of public transport;
4. Callon children and young people as a priority, increasing political commitment, by ensuring that the Global Strategy for Women’s, Children’s and Adolescents’ Health delivers necessary action on road safety;
5. political commitment and responsibility at the highest level and establish regional, national and sub-national strategies and action plans for road safety and contributions from different governmental agencies as well as multi-sectoral partnerships to deliver the scale of efforts required at regional, national and sub-national levels to achieve SDG targets, and that these strategies and efforts are transparent and public;
6. Member States that have not yet done so to consider becoming contracting parties to the United Nations legal instruments on road safety as well as applying, implementing and promoting their provisions or safety regulations, and ensure that legislation and standards for road design and construction, vehicles, and road use are consistent with safe system principles and are enforced;
7. road safety and a safe system approach as an integral element of land use, street design, transport system planning and governance, especially for vulnerable road users and in urban areas, by strengthening institutional capacity with regard to road safety laws and law enforcement, vehicle safety, infrastructure improvements, public transport, post-crash care, and data;
8. higher levels of physical activity such as walking and cycling as well as integrating these modes with the use of public transport to achieve sustainability;
9. the development, application and deployment of existing and future technologies and other innovations to improve accessibility and all aspects of road safety from crash prevention to emergency response and trauma care, with special attention given to the safety needs of those road users who are the most vulnerable including pedestrians, cyclists, motorcyclists and users of public transport;
125
ANNEXES
125
ANNEXES
10. timely access to high quality emergency and long-term health care services for the injured and recognize that an effective post-crash response includes also mental, social and legal support for victims, survivors and families;
11. on speed management, including the strengthening of law enforcement to prevent speeding and mandate a maximum road travel speed of 30 km/h in areas where vulnerable road users and vehicles mix in a frequent and planned manner, except where strong evidence exists that higher speeds are safe, noting that efforts to reduce speed
deaths and injuries;
12. that all vehicles produced and sold for every market by 2030 are equipped with appropriate levels of safety performance, and that incentives for use of vehicles with enhanced safety performance are provided where possible;
13. that an integrated road safety approach and minimum safety performance standards for all road users are a key requirement in road infrastructure improvements and investments;
14. businesses and industries of all sizes and sectors to contribute to the attainment of the road safety related SDGs by applying safe system principles to their entire value chain including internal practices throughout their procurement, production and distribution process, and to include reporting of safety performance in their sustainability reports;
15. public organisations at all levels to procure safe and sustainable transport services and vehicles and
16. increased investment in road safety, recognizing the high rates of return of road injury prevention projects and programs and the necessity of scaling up activities to meet the road safety related SDGs;
17. the importance of monitoring and reporting progress towards the achievement of our common goals and, as appropriate, the Voluntary Global Road Safety Performance Targets agreed by Member States, and call upon the World Health Organization to continue to collect, publish and disseminate data through the series of Global Status Reports on Road Safety, leveraging as appropriate existing efforts including those of regional road safety observatories to harmonize and make road safety data available and comparable;
18. the World Health Organization to prepare an inventory of proven strategies and initiatives from a wide variety of member countries that have successfully reduced fatalities in member countries. A report should be readied for publication in 2024.
of State and government to mobilize adequate national leadership and advance international and multisectoral
next decade on our way to Vision Zero by 2050; and
the United Nations General Assembly to endorse the content of this declaration.
126
EUROPEAN REGIONAL STATUS REPORT ON ROAD SAFETY 2019
ANNEX 5
STATEMENT OF THE WHO EUROPEAN HEALTHY CITIES NETWORK AND THE WHO REGIONS FOR HEALTH NETWORK
127
ANNEXES
127
ANNEXES
2
Statement of the WHO European Healthy Cities Network and WHO Regions for Health Network agreed at a meeting on urban road safety,
satellite to the 3rd Global Ministerial Conference on Road Safety –Achieving Global Goals 2030
1. We, the cities and national networks of the WHO European Healthy Cities Network, and theregions of the WHO Regions for Health Network, fully support the Stockholm Declarationon Road Safety and recognize the vital role that cities play in creating safe urban environments and in remaining at the forefront of global, regional and local agendasaffecting well-being for future generations.
2. We recognize that 75% of the 900 million people living in the WHO European Region livein cities, municipalities and urban centres.
3. We note that 70% of the people dying from road crashes on urban roads in the European Union are pedestrians, cyclists and motorcyclists, the most vulnerable road users.
4. We believe that safety is required for us to be healthy on our roads and in our communities,schools and homes.
5. We recognize that injuries and deaths from road crashes are not “accidents”. Scaling up our efforts to save lives requires that our language reflect the fact that injuries and deaths from road crashes can be prevented.
6. We therefore define road safety as a public health issue but also a key challenge for anddeterminant of sustainable mobility, transport, justice and social and economic development.
7. We believe that road safety can unlock the human potential of our urban streets, makingthem a resource for active mobility, further promoting public health and well-being.
8. We believe that through their urban planning, cities and municipalities should ensure that how they plan for motorized transport does not compromise the safety and active mobility of their residents.
9. We understand that focusing both political and technical attention on road safety is critical now, as is taking action to address the underlying social, cultural, economic and environmental factors that influence the road safety of urban populations.
128
EUROPEAN REGIONAL STATUS REPORT ON ROAD SAFETY 2019
10. We stress, as the levels of government closest to people and communities, that we are key actors in supporting the implementation of global and regional frameworks, and we areobligated to accelerate progress to improve road safety through participatory approachesthroughout our policy and strategy planning.
11. We believe that achieving road safety requires engaging our populations in the decisions that affect them and that our close relationships with local communities put us at the forefront of implementation.
12. We recognize that progress in road safety varies highly within and between countries, regionsand cities and that, by striving for progress in road safety locally, we will contribute to broader national and international efforts to create a safer WHO European Region and, by extensionthrough collaboration and sharing experiences, a safer world.
13. We emphasize the leading roles of municipalities, cities and regions as advocates for public health, ensuring that the focus on evidence-informed and data-driven action withstandsfluctuating social, cultural and political changes.
14. We recognize that the complexity behind the causes of injuries and deaths from road crashes requires a multidisciplinary and intersectoral response and makes victim blaming especially cruel to grieving loved ones and an ineffective and unacceptable approach.
15. We note that WHO and other road safety organizations recommend adopting the Safe SystemApproach to road safety. A safe system recognizes that the human body is highly vulnerableto injury and that people make mistakes but that complementary interventions to create safer roads, safer vehicles, safer speeds and safer behaviour by road users can work together to compensate for the mistakes and prevent inevitable crashes from resulting in injuries or death.
16. We reiterate that the recommended safe system approach to road safety is not under the jurisdiction of a single entity but that successful road safety outcomes require coordinated, collaborative and multilevel governance, political will, leadership and action.
17. We reiterate, that although global and regional frameworks and agendas provide the policy context and framing for improving road safety, we can work at the regional, municipal and city levels to ensure that no individuals are left behind regardless of their sex, race, religious beliefsff ,migration status, ethnicity, sexual orientation, age, political orientation, disability or socioeconomic circumstances.
18. We stress the importance of ensuring that road safety be considered throughout the policy process in cities and regions, from planning through implementation; otherwise actions in one
129
ANNEXES
129
ANNEXES
area can worsen road safety or increase challenges to it in other areas. This is especially pertinent in such areas as urban roads and infrastructure, open green space, public transport,active transport and modal shift in transport.
19. We commit to leading by example in implementing evidence-informed and data-driven strategies, including those for example recommended by WHO’s Save LIVES technicalpackage, by POLIS and EUROCITIES in their New Paradigm for Safe City Streets and by theWorld Resources Institute.
20. We recognize that reducing speed in urban areas, both by enforced limits and by infrastructuredesign, is the most rapid and effective way to reduce deaths and injuries from road crashes.
21. We acknowledge that making urban streets safe requires significant investment, much more than can be sourced from city budgets. We need financial and technical support from our national governments.
22. We are fully aware that monitoring is key to accelerating progress towards improving road safety in the European Region. We commit to strengthening our local observatory andmonitoring capacity, to showing progress towards and identifying challenges to achieving Sustainable Development Goal target 3.6 and to sharing information with all relevant stakeholders to ensure that findings are acted on.
23. We know that building safe, sustainable and resilient communities needs to be at the heart of strategies for accelerating progress towards public health and prosperity for all. We also know that action is required at the regional and city levels to achieve safe and resilient communities. We commit to being key partners in this process.
24. We commit to using and building on existing partnerships at the regional and city levels to accelerate progress towards improving road safety and commit to using the WHO EuropeanHealthy Cities Network and the Regions for Health Network as platforms for networking andpartnering with relevant actors across society and multilevel government, ensuring anintersectoral approach to promoting public health diplomacy and policy coherence.
25. We commit to building capacity across all sectors of local government to equip them with theskills, tools and knowledge to develop policy that provides the framework for national, regionaland local action to prevent deaths and injuries from road crashes and to develop appropriateindicators that measure progress.
130
EUROPEAN REGIONAL STATUS REPORT ON ROAD SAFETY 2019
26. We recognize and commit to achieving road safety in our local communities. We also call on our national governments, WHO, United Nations partners and the global community to simultaneously take urgent action on this global problem.
27. We, the WHO European Healthy Cities Network and the WHO Regions for Health Network,adopt this Declaration. We commit to taking forward this agenda in the spirit of the 3rd GlobalMinisterial Conference on Road Safety, held on 19–20 February 2020 in Stockholm, Sweden,and for it to serve as an impetus for enhancing and sustaining further engagement, collaboration and action on road safety in all our regions, cities and countries.
Now is the time to act. We cannot afford to fail.
131
ANNEXES
131
ANNEXES
ANNEX 6
GLOBAL YOUTH STATEMENT FOR ROAD SAFETY
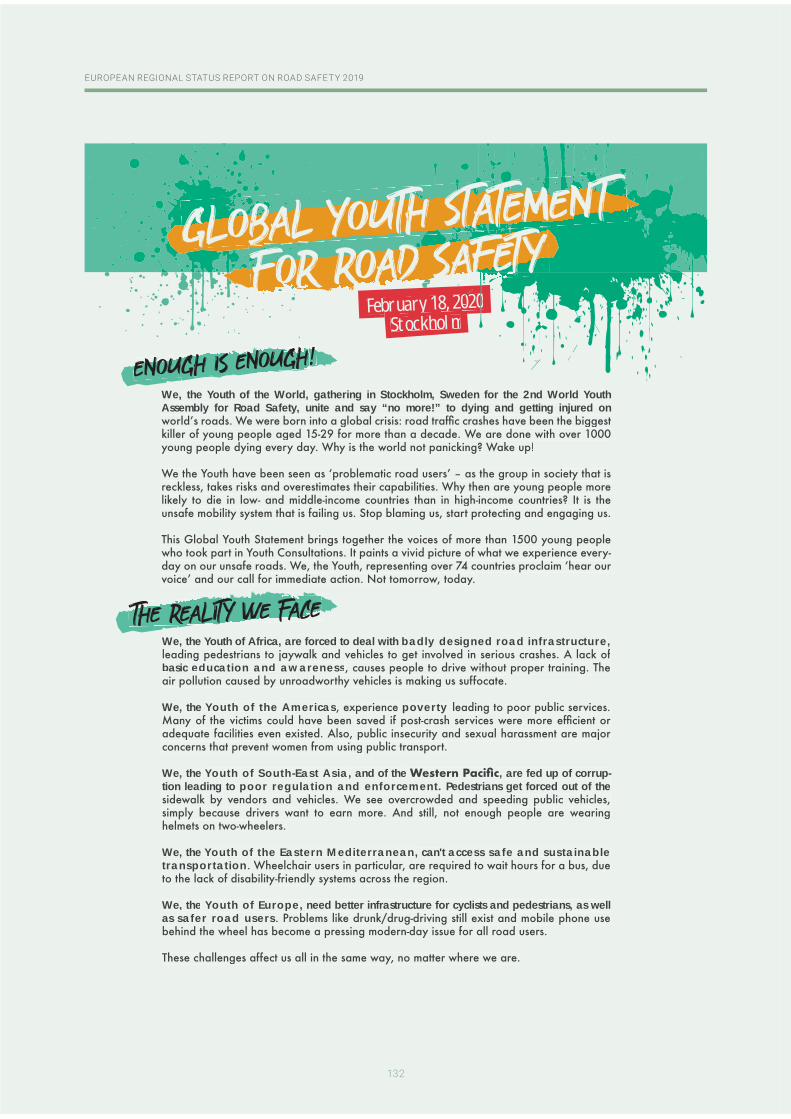
132
EUROPEAN REGIONAL STATUS REPORT ON ROAD SAFETY 2019
February 18, 2020bruary 18, 20 0Stockholm
We, the Youth of the World, gathering in Stockholm, Sweden for the 2nd World Youth Assembly for Road Safety, unite and say “no more!” to dying and getting injured on
We, the Youth of Africa, are forced to deal with badly designed road infrastructure,
basic education and awareness
We, the Youth of the Americas poverty
We, the Youth of South-East Asia, and of the , are fed up of corrup-tion leading to poor regulation and enforcement. Pedestrians get forced out of the
We, the Youth of the Eastern Mediterranean, can't access safe and sustainable transportation
We, the Youth of Europe, need better infrastructure for cyclists and pedestrians, as well as safer road users
!!!
002
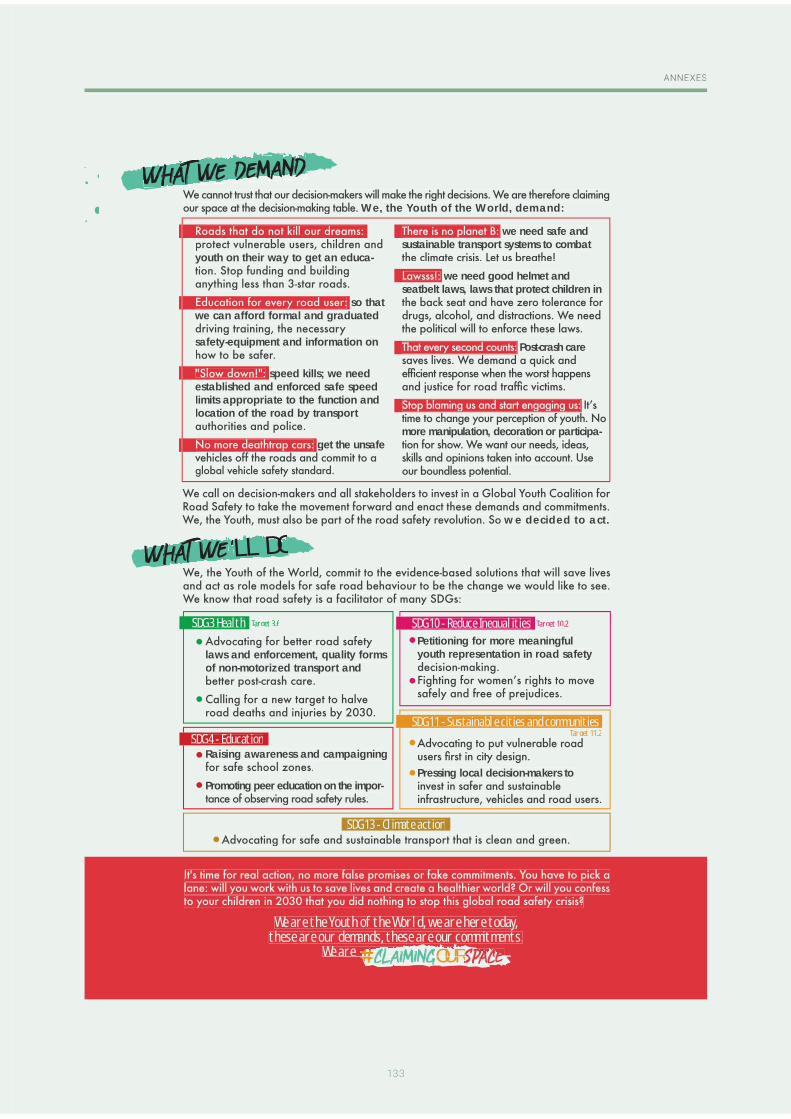
133
ANNEXES
133
ANNEXES
We, the Youth of the World, demand:
laws and enforcement, quality forms of non-motorized transport and
Raising awareness and campaigning
Promoting peer education on the impor-
Petitioning for more meaningfulyouth representation in road safety
Pressing local decision-makers to
'LL DODLL DOO'
youth on their way to get an educa-
so thatwe can afford formal and graduated
safety-equipment and information on
speed kills; we needestablished and enforced safe speed limits appropriate to the function and location of the road by transport
get the unsafe
we need safe and sustainable transport systems to combat
we need good helmet andseatbelt laws, laws that protect children in
Post-crash care
more manipulation, decoration or participa-
we decided to act.
SDG 3 Health Target 3.6
SDG 4 - Education
SDG 10 - Reduce Inequalities
SDG 11 - Sustainable cities and communities
Target 10.2
Target 11.2
SDG 13 - Climate action
OURRR
We are the Youth of the World, we are here today,these are our demands, these are our commitments.
We are OURRR

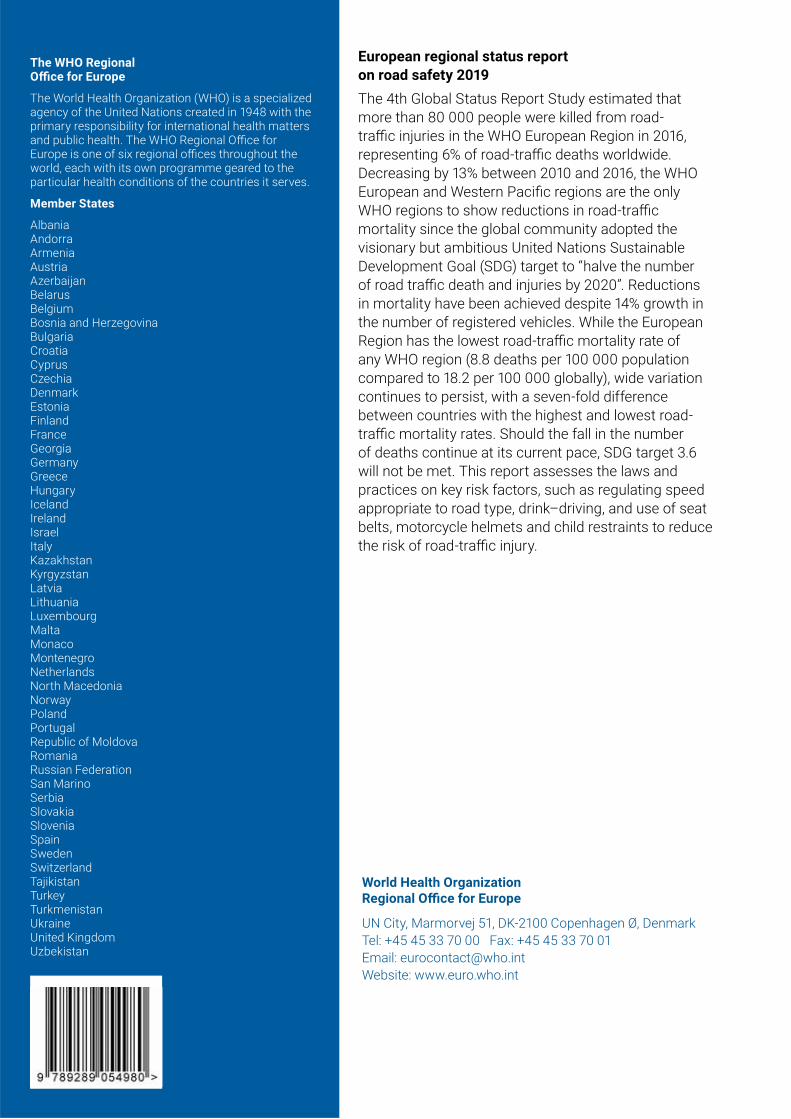
The WHO RegionalOffi ce for Europe
The World Health Organization (WHO) is a specialized agency of the United Nations created in 1948 with the primary responsibility for international health matters and public health. The WHO Regional Offi ce for Europe is one of six regional offi ces throughout the world, each with its own programme geared to the particular health conditions of the countries it serves.
Member States
AlbaniaAndorraArmeniaAustriaAzerbaijanBelarusBelgiumBosnia and HerzegovinaBulgariaCroatiaCyprusCzechiaDenmarkEstoniaFinlandFranceGeorgiaGermanyGreeceHungaryIcelandIrelandIsraelItalyKazakhstanKyrgyzstanLatviaLithuaniaLuxembourgMaltaMonacoMontenegroNetherlandsNorth MacedoniaNorwayPolandPortugalRepublic of MoldovaRomaniaRussian FederationSan MarinoSerbiaSlovakiaSloveniaSpainSwedenSwitzerlandTajikistanTurkeyTurkmenistanUkraineUnited KingdomUzbekistan
World Health OrganizationRegional Offi ce for Europe
UN City, Marmorvej 51, DK-2100 Copenhagen Ø, DenmarkTel: +45 45 33 70 00 Fax: +45 45 33 70 01Email: [email protected]: www.euro.who.int
European regional status report on road safety 2019The th Global Status Report Study estimated that more than people were killed from road-traffi c injuries in the WHO European Region in , representing % of road-traffi c deaths worldwide. Decreasing by % between and , the WHO European and Western Pacifi c regions are the only WHO regions to show reductions in road-traffi c mortality since the global community adopted the visionary but ambitious United Nations Sustainable Development Goal (SDG) target to “halve the number of road traffi c death and injuries by ”. Reductions in mortality have been achieved despite % growth in the number of registered vehicles. While the European Region has the lowest road-traffi c mortality rate of any WHO region ( . deaths per population compared to . per globally), wide variation continues to persist, with a seven-fold difference between countries with the highest and lowest road-traffi c mortality rates. Should the fall in the number of deaths continue at its current pace, SDG target . will not be met. This report assesses the laws and practices on key risk factors, such as regulating speed appropriate to road type, drink–driving, and use of seat belts, motorcycle helmets and child restraints to reduce the risk of road-traffi c injury.
European regional status report on road safety 2019
EUROPEANREGIONAL STATUS
REPORT ON ROAD SAFETY
2019
Copyright © 2022 FDOKUMEN