
Value for Money Industry Report - Financial Markets Authority
Upload
independentCategory
view
0download
0
European Financial Markets After EMU: A First Assessment
Jean-Pierre Danthine*, Francesco Giavazzi**, and Ernst-Ludwig von Thadden*
This version: May 15, 2000
*DEEP, Université de Lausanne and CEPR** Università Bocconi, Milan, and CEPR
This study has been prepared within the UNU/WIDER project on EMU: Impact on Europeand the World, which is directed by Charles Wyplosz and financially supported by the YrjöJahnsson Foundation and by the Ministry for Foreign Affairs of Finland. We are grateful toHenri Bernard, Gabriele Galati, Philip Hubbart (Consensus Economics), Thorsten Lang(Moody’s Deutschland), Claire Pask (Standard and Poor’s), Hannah Scobie (EuropeanEconomics and Financial Centre) for the provision or explanation of data, to Kpate Adjaoute,Alessandra Casella, Philipp Hartmann, Marco Pagano, Richard Portes, and Charles Wyploszfor helpful discussions, and to Eddy Ngoy, Elliot Romano, and Agim Xhasa for researchassistance.

1
Abstract:
This paper reviews the first evidence on the impact of European Monetary Union on Europeancapital markets, one year after the launch of the single currency. Our assessment of thisevidence is very favourable. On almost all counts EMU has either changed the Europeanfinancial landscape already drastically or has the potential to do so in the future. We argue thatthis is less due to the well-known direct effects of EMU, such as the elimination of intra-European currency risk, than to a number of indirect consequences through feedbackmechanisms that seem to have been triggered by EMU.
JEL Classification: E44, F21, F36, G15
Key Words: European Monetary Union, European Capital Markets,

2
1. Introduction
European Monetary Union has certainly been the single most important event for international
financial markets since the collapse of the Bretton-Woods system of fixed exchange rates. It
represents a challenge to the dollar as the world’s dominant currency. It also opens the
possibility for the creation of the world’s largest domestic financial market in Europe. While a
single currency is a necessary condition for the emergence of pan-European capital markets, it
is not a sufficient one, however. Several additional conditions have to be met and the
evolution of world finance after EMU is likely to be characterized by multiple equilibria. Our
goal in this paper is to review the first evidence on this question, after one year of EMU. Our
assessment of this evidence is very favourable. On almost all counts EMU has either changed
the European financial landscape already drastically or has the potential to do so in the future.
As we argue in this paper, this is less due to the well-known direct effects of EMU, such as
the elimination of intra-European currency risk, than to a number of indirect consequences
through feedback mechanisms that seem to have been triggered, or at least reinforced, by
EMU.
Among the innumerable outlooks on this issue prior to the introduction of the euro, two
papers, in particular, by Schinasi and Prati (1997) and by McCauley and White (1997), have
defined the framework for the discussion of most relevant questions. Both were written before
many important decisions about EMU had been made, such as EMU membership, the design
of the ECB, and government debt management. Here we complement the institutional and
empirical descriptions of these two papers three years later, and extend some of the conceptual
discussions initiated by them. For this, we use and build on the extensive technical
information provided there, and review it only where it needs to be updated.
We organize the discussion as follows. First, we review (in section 3) the direct, sometimes
purely mechanical, effects of EMU on capital markets. The list comprises standardization and
transparency in pricing, the shrinking of the foreign exchange market, the elimination of
currency risk, the elimination of currency related investment regulations as well as the
homogenization of bank refinancing procedures. These effects are usually uncontroversial;
because they arise mechanically, much of the evidence on them is already available. This does
not mean that they are quantitatively unimportant, much to the contrary, although their

3
empirical estimation is not always easy.1 These direct effects typically induce additional
indirect effects, which are often more difficult to assess. Price standardization, for example, is
directly beneficial in the sense that consumers save the time needed to convert prices from one
unit to another, producers save the time and resources to post prices in different units, and
purchasing decisions are better informed. Depending on the theory of market demand and
business adjustment, standardization then often has the additional indirect effect of increasing
competition and lowering prices, but this adjustment is more difficult to assess.
The more difficult task of investigating the indirect effects of EMU, which most likely will
‘make or break’ the pan-European financial markets, is the subject of sections 4 and 5. These
effects have been much speculated on prior to EMU, often because the relevant causal links
are not well understood or because the effects involve feedback mechanisms that are difficult
to predict beforehand. Not surprisingly, the verdict on these indirect effects is not in yet,
although market developments that occurred during the first year of EMU have been
significant and enable us to be clearer in our assessment and more informed in our use of
theory than was possible before the start of EMU. The process is still at work, however, and
our task will be more to point out what is to be monitored and what will be the key factors
than to provide final assessments.
To facilitate the discussion of the indirect effects, we break it in four parts. First, we focus on
the impact of EMU on the cost of cross-country transactions within the EMU area. Second,
we address the key issue of the depth or liquidity of European financial markets. Third, we
turn to the question of market breadth, i. e. the question to what extent the euro improves
diversification opportunities available to European investors and how they are seizing these
opportunities. These three issues make up Section 4. Finally, Section 5 focuses on the
institutional changes that are stimulated by EMU and on how they affect and are affected by
the banking sector. Of course, these four issues do not cover all aspects of the euro’s impact
on financial markets. Other important issues concern monetary policy and the role of the
European Central Bank, and the more ‘monetary’ implications of the euro, in particular those
associated with its role as an international transaction and reserve currency. They are treated
in other chapters of this volume.
1 Some effort towards estimation has been made in the famous report by the European Commission (1990) on« One Market, One Money ».

4
Two conceptual issues should be raised at the outset. First, at the theoretical and the empirical
level it is often difficult to decide whether EMU or the broader process of European
unification is responsible for certain observations. Both are of course inextricably linked and
usually have similar consequences. The Single European Act of 1986 and its translation into
EU-wide regulation between the late 80s and the mid 90s precede European monetary union,
but both have been part of the same greater political process that has shaped the financial
industry in several ways. It is, for example, not obvious conceptually whether the
consolidation in the European banking industry in the last two years has been a belated
consequence of regulatory changes, such as the Second Banking or the Financial Services
Directive of the early 90s, or whether they reflect the anticipation of EMU and the
accompanying increase in competitive pressure. We shall argue in Section 5 that the recent
dramatic changes in the industry are likely to have been triggered by the introduction of the
euro, but the precise role of EMU is difficult to quantify. On the other hand, many of the
likely effects of EMU are of little relevance without the context of financial market
liberalization on the EU level following the Single European Act.
The next conceptual problem is purely empirical. The data for 1999 that we can use in this
article certainly also reflect short-term events that have nothing to do with EMU. In particular,
the double crisis of the Russian sovereign default and LTCM in the fall of 1998 have
influenced investor behaviour in 1999 in ways that are sometimes difficult to evaluate.
Similarly, the fear of possible Y2K problems has distorted some market activity towards the
end of 1999 for reasons entirely unrelated to the euro. Another example of a short-term effect
that impacts the data is the one-off positioning effect of new securities issues in the euro
market, that led some investors to issue early in 1999 simply to create a benchmark for their
paper. And last, but not least, the decline of the euro against the dollar during most of 1999
represented a unique framework for the operation of European financial markets. It is difficult
to speculate how the process described in this paper would have played out under a different
exchange rate scenario, although the relative restraint shown by the European Central Bank
and the excellent performance of the markets despite this restraint in 1999 suggest that the
exchange rate has played a minor role in the evolution of the European markets. Be this as it
may, all these considerations suggest that we must treat the early data available for this survey
with caution.
5
We close this introduction with a final remark on the short-term effects of the euro. Clearly,
one of the most immediate consequences of the introduction of the single currency has been
the cost of business adjustment. These costs are difficult to measure and their estimation
varies greatly from one source to another. The most detailed and comprehensive study of these
costs for the financial services industry we know of (Scobie, 1997) estimates them at
surprisingly low levels, on average at less then 0.1 % per cent of total operating costs.
Depending on how costs such as staff retraining or note-handling costs are budgeted, the true
costs may be slightly higher, but they clearly have not been disruptive.2
2. Some facts: pre-euro global financial markets
We start by reviewing a few facts about global financial markets prior to EMU. Confirming
what we said in the introduction, Table 2.1 shows that the combined value of equities, bonds
and bank assets outstanding in the 11 EMU countries in 1995 was $21, 084 billion, compared
to $22, 865 billion in the U.S. Adding to the EMU figures the $5, 457 billion of the likely
early followers Sweden and Great Britain and some optimism gives a market larger than that
of the U.S. plus Canada, and significantly larger than that of Japan (see again Table 2.1).
Table 2.1
Table 2.2 provides more recent data on the international bond market at the onset of EMU and
corrects two sometimes held misconceptions concerning European and U.S. bond markets.3
First, the bond market in the euro area is far from being the largest domestic market in the
world, as euro optimists sometimes have seemed to imply: in 1998, with 56 per cent of the
U.S. size, the bond market of Euroland was still significantly smaller than that of the U.S., and
this was true for the private and the public bond market alike. In fact, government bonds
accounted for 60 per cent of all bonds outstanding in the U.S., and for 55 per cent of those in
2 It comes as no surprise that studies by industry participants or consultants arrive at vastly higher estimates.However, according to industry experts, these estimates seem to be less comprehensive and accurate than thoseof Scobie (1997).3We note in passing that, depending on sources and definitions, data on respective market sizes may differ. Forinstance, Bishop (1999) reports that the domestic euro government bond market is already larger than thedomestic US government bond market (note, however, that the discrepancy of Bishop’s data with those of Table2.2 is relatively small, as the public bond markets in Table 2.2 comprise domestic agencies and foreigngovernments and agencies).

6
Euroland, an interesting similarity in the structure of the two markets. Yet, the present trend of
budget surpluses in the U.S. and deficits in the EU is likely to boost EU public bond markets
relative to the U.S. Second, neither is the European bond market underdeveloped or
negligible, as pessimists on the other end of the spectrum sometimes have asserted. Table 2.2
shows that in 1998 the public as well as the private bond markets of the euro zone taken
together accounted for 25 per cent of the world total and were significantly bigger than the
respective Japanese markets, which in 1998 were the second largest single market in the
world.
Table 2.2
As Table 2.1 shows, before EMU, U.S. stock market capitalization has dwarfed all other
markets and was almost double that of Euroland plus the U.K. On the institutional side, this
huge market capitalization has been supported by the largest and most active stock exchanges
in the world. Table 2.3 shows that in 1996 the New York Stock Exchange alone had a higher
turnover than all stock exchanges in the European Union taken together.
Table 2.3
A similar picture holds true for derivative exchanges. Figure 2.1 shows that in the mid 90s
turnover of short-term as well as long-term contracts on the Chicago-based exchanges
(Chicago Mercantile Exchange and Chicago Board of Trade) was by far larger than in any
other exchange, with London (for short-term contracts) and Paris (for long-term contracts)
taking distant second places.
Figure 2.1
3. Direct effects on international finance and banking
To begin with the most basic and possibly most persuasive effect of monetary union, as in
most non-financial markets of Euroland, the introduction of a single unit of account has
standardized the expression of prices of financial products and vastly simplified financial
transactions. All prices and financial flows that had been previously expressed in any of the 10

7
legacy currencies are now denominated in euros. As has often been noted, with respect to
financial and non-financial markets alike, this standardization yields important economies in
transactions costs, because it makes financial markets more transparent, and it constitutes an
obvious pre-requisite to the constitution of a single European capital markets. These direct
gains – we discuss the potentially large indirect gains of transparency in the following sections
– consist mostly of the time saved comparing or posting prices in several currencies and the
value lost in suboptimal transactions by imperfectly informed participants. While it is clear
that these gains are important, we know of no reliable estimate of their size.
Table 3.1
Among all financial markets, the foreign exchange market has been affected most directly by
the introduction of the euro, with implications for the cost of currency conversions and for the
risk of cross-country positions. We first focus on the cost issue, with its mirror image, the loss
of currency exchange and arbitrage revenues between EMU legacy currencies for banks and
dealers. Interestingly, the loss in currency exchange volume is bigger than what a simple
comparison of pre-January 1999 and post-January 1999 trade figures would suggest. As Table
3.1 documents, average daily foreign exchange transactions between EMU legacy currencies
were worth approximately $125 bn in 1998, around 6.3 per cent of total global transactions.
This trading volume simply disappeared between December 31, 1998, and January 1, 1999.
However, Table 3.1 also shows that between 1995 and 1998 intra-EMU currency transactions
fell from $201 bn to $ 125 bn, which in the context of rising global volumes means a drop
from 12.8 per cent of total transactions to the 6.3 per cent mentioned above. In other words,
between 1995 and 1998 an important part of European currency trading disappeared already,4
presumably because the euro eliminated speculative or hedging motives. When assessing the
loss of currency trading directly attributable to EMU, it is therefore reasonable (though, of
course, still imprecise) to refer to the 1995 numbers. However, even these numbers are likely
to be biased downwards, because some intra-European currency trading has traditionally used
the dollar as a vehicle currency (see Hartmann, 1998). As these trades have disappeared, too,
the direct loss of currency trading is probably considerably higher than the intra-EMU trade
reported in Table 3.1.

8
For banks and other traders, this fall in trading volume is matched by a corresponding
decrease in revenues. Given the numbers in Table 3.1, on average this loss has been around 12
per cent of total foreign exchange revenue, and factoring in the vehicle trades using the dollar,
probably between 13 and 15 per cent. This loss is higher, sometimes significantly, for many
European banks, given their role in financing intra-European trade. Similar losses have been
caused by the end of foreign currency deposit accounts in EMU legacy currencies. An
estimate by McKinsey, the consultancy, puts the total direct loss of all foreign exchange fee
revenue caused by the euro at approximately $25 bn per year.5 On a similar note, the euro has
reduced arbitrage profits from trading bonds and other securities. Scobie (1997) reports that
market participants have estimated losing up to 60 per cent of their European bond business
and up to 30 per cent of their swap business due to the elimination of the 10 different local
currencies.
But, of course, while the elimination of forex and securities trading revenue constitutes a loss
for banks and brokers, it represents an overall economic gain.6 In the case of the forex market,
the real resources that were used up in currency conversions are now free for more productive
uses. In the bond and derivatives arbitrage business the same argument applies with respect to
the service of establishing the “law of one price”, which this business had provided; this
service is no longer necessary, and the resources used up in the process can be invested
alternatively.
Going hand in hand with the decrease in intra-European currency conversion costs is the
elimination of intra-European currency risk. Although the anticipation of EMU had reduced
exchange rate volatility among a few EMS member states in the second half of the 1990s to
very low levels, exchange rate risk had traditionally been an important component of intra-
European market risk, in particular for longer-term contracts. It is useful to recall, for
example, that as recently as in summer 1996 the French franc fell and rose by more than 1
4 Unfortunately, the numbers presented in Table 3.1 are only available triennially, as they are collected in a ratherextensive market survey by central banks. They are collected in April, which means that the 1998 figures reflectfull certainty about the composition of EMU countries.5 The estimate is quoted in The Economist (1999a). The data of Table 3.1 do not provide much guidance to judgethis number. We have not been able to confirm the estimate at McKinsey in Zürich.6 Part of which is described in the famous study of the Commission of the European Communities (1990) thatpaved the way for EMU.

9
percent against the German mark in less than three months, and the Italian lira fluctuated by
almost 6 percent over a slightly longer period. The implied volatilities (based on one-month
option contracts) exceeded 2 per cent for the franc and 5 per cent for the lira during these
periods.7 Hence, even during the direct run up for EMU, and long after the turbulence of 1992,
forex risk in the participating countries appeared non-negligible.
Actually assessing the importance of this source of risk for international investors
quantitatively is a delicate task. Some elements of an answer to this question have been
provided by De Santis, Gérard and Hillion (1999). These authors show that, in the 1990’s,
EMU countries’ currency risk was a significant risk factor for investors, although it has
declined in the course of the decade. They show furthermore that investors were indeed
compensated for their exposure to this source of risk. They find, however, that non-EMU
currency risk (in particular the risk associated with the US dollar) was quantitatively much
larger; a finding that leads them to suggest that the disappearance of EMU-currency risk might
have only a limited impact on portfolio investors.
Table 3.2
Turning to a further direct effect of EMU, we note that, formally, the European Commission’s
Second Banking Directive and Investment Services Directive should have created a single
European market in financial services by the end of the 1990’s. Yet, in practice several
obstacles beyond those raised by the now eliminated issues of currency conversions and
currency risk have remained.8 One of these obstacles are national regulations bearing on the
portfolios of pension funds and life insurance companies that restrict their holdings of foreign
assets or those denominated in other currencies. Given the importance of the asset base of
these institutions prior to the introduction of the euro, documented in Table 3.2, these
regulations in principle impose a substantial restriction on intra-European capital flows. A
direct implication of the euro is the de facto elimination of at least one of these restrictions,
the so-called 80 per cent matching rule, which requires pension funds and insurance
companies in most EU member states to hold at least 80 per cent of their assets in the same
currency as their liabilities (see Table 3.2), which is usually the home currency (the Third Life
7 See BIS (1998, ch. VI) for more on this.8 For a more detailed discussion, see Danthine, Giavazzi, Vives, and von Thadden (1999).

10
Insurance Directive explicitly permits this restriction). Interestingly, however, the available
evidence in Table 3.2 shows that, in the mid 90s, the 80 per cent rule was usually not a
binding restriction, which suggests that the introduction of the euro would not automatically
trigger a reallocation of institutional investment.9
The last but not least direct implication of the euro is that with its inception the authority over
monetary policy for EMU member countries is transferred from national central banks to the
European Central Bank. This institutional change is likely to have important further
consequences that are still the subject of some debate. But the change has also had direct
practical implications for market participants in Europe. In particular, the decision to conduct
the bulk of the ECB’s market interventions through weekly reverse transactions (executed by
the national central banks on the basis of standard tenders)10 unifies banks’ refinancing
possibilities on an unprecedented scale and in a way that is more or less new to all market
participants. In fact, the implementation of the ECB’s monetary policy constitutes a
significant change for several Euroland countries, such as Germany, where the focus on
repurchase agreements and the accelerated rhythm of central bank activity in this market (the
Bundesbank intervened bi-weekly) has represented a shift towards more market based
refinancing policies. On the other hand, this shift to more market refinancing in Germany
meant that France, which had the most liquid and advanced repo market in Europe, was
risking loosing its dominant role in the European long-term derivatives market to the Bund-
based Eurex contracts.11
Concomitant with the convergence of refinancing opportunities, EMU has brought with it
several other centralized capital market institutions, such as the TARGET payment system for
large cross-border transactions, and Euribor, the new pan-European reference rate for floating-
rate interest instruments. On the other hand, differently from the management of monetary
policy, the authority to oversee and, within the bounds of the European Union directives,
regulate financial institutions has remained at the national level. The euro, therefore, has
9 Note that in many European countries, additional and sometimes stricter regulations on cross-border investmenthave existed, in particular for pension funds and life insurances. The euro has a similar impact on theseregulations whenever they are expressed in terms of the home currency.10 For details, see European Central Bank (1998).11 This vague expectation in the run-up phase to the euro was more than borne out by the explosive evolution ofEurex after 1997 (see Figure 2.1).

11
brought about some, but by far not full, centralization of the public institutions governing
financial markets.
4. Indirect effects on European financial markets
In this section, we highlight several channels through which the euro is likely to change the
structure of European financial markets. We will discuss them in turn, making the theoretical
case and reviewing the available preliminary evidence. While the general argument usually
applies to all segments of the financial market, we will mostly, due to space limitations,
confine attention to bond and equity markets.
Much of the discussion will turn around the issue of increased market size and its potential
feedback effects on risk and the cost of transacting. As reviewed in Section 2, an important
argument of euro optimists has been that the euro zone will be a huge financial market with
the potential to rival that of the United States. Indeed, as Table 2.1 has shown, the combined
value of equities, bonds and bank assets outstanding in the 11 EMU countries in 1995 was
$21, 084 billion, compared to $22, 865 billion in the U.S. Similarly, Table 2.2 highlighted the
size of the combined bond markets in Europe, which will become relatively more important
given the projected budget surpluses in the U.S. However, these comparisons are superficial,
because European bond markets have been fragmented by national regulations, conventions
and habits, and because the cost of cross-border transactions by far exceed the cost of
transacting nationally, facts that are ignored in the aggregate numbers in Table 2.2. In order to
assess the prospects of these markets it is, therefore, important to evaluate the likely future
importance of these barriers.
The theoretical argument underlying the optimistic assessment of increased size has two
dimensions, which relate to fundamental risk and liquidity risk.12 Fundamental risk (usually
called credit risk in the bond market) is the risk that the quality of the asset underlying a given
financial asset changes; conceptually, this risk is completely independent of market trading.
Liquidity risk, on the other hand, refers to trading: it is the risk that investors who need to sell
must do so at discounts, because their trades cannot be absorbed easily by the market.

12
Fundamental risk is minimized by diversification, hence calls for the consideration of many
assets,13 liquidity risk is the smaller the larger the volume of trade in the given asset, hence
can be analyzed with reference to one asset only.
If assets are not strongly correlated, typically diversification possibilities are best in a market
with many (possibly less actively traded) assets (“breadth”), whereas for liquidity risk a
market with (possibly few) heavily traded assets is preferable (“depth”). The depth of a market
can be measured by factors such as the participation rate of investors in that market (a demand
side criterion), the outstanding stock of the asset (a supply side criterion), and the availability
of close trading substitutes for this asset. The breadth of a market (or of a set of markets), on
the other hand, is typically measured by supply-side criteria such as the number of assets
traded or the institutional barriers to trade different assets. But also demand-side aspects are
important, such as the investors’ willingness to trade assets with different characteristics.
Interestingly, while breadth and depth generally are important issues in all types of asset
markets, in the discussion of the performance and the potential of the EMU capital market, the
former criterion has mostly been applied to equity markets and the latter to bond markets.
Indeed, with respect to the bond market, the hope of creating “the largest financial market in
the world” has usually referred to the possibility of bond issues of size sufficiently large to
rival those of the American treasury or large U.S. corporates, whereas for the equity market
the emergence of stock markets with large numbers of listed firms and many active stocks has
been viewed as important.
Conceptually, the issues of market breadth and market depth are closely related to transaction
costs. They are the main reason why investors, on the demand or the supply side, do not enter
markets and thereby improve risk sharing. Before discussing liquidity and fundamental risk in
subsections 4.4 and 4.5 below, we shall therefore examine the costs of cross-country investing
in Europe in more detail in subsection 4.2. Subsection 4.3 will review the impact of EMU on a
related, equally important prerequisite for asset market development, namely the workings of
12 After the elimination of currency risk, these two are presumably the most important risks in the Europeanmarket. For a deeper discussion, see, for example, Biais, Foucault, and Hillion (1997) and Pagano and Roell(1990).13 At least if investors are small. For large investors, fundamental risk in private asset markets can, of course,partially be influenced by active monitoring. But in this case, typically a tradeoff between liquidity risk andcorporate control arises (see Bolton and von Thadden (1998)).

13
the money and interbank markets in Euroland. But to begin with, we briefly turn to a more
basic consequence of the effects listed in the last section.
4.1. A unified yield curve
A direct implication of transparency and of the elimination of foreign exchange risk is the
emergence of a single European yield curve at least for the private debt market.
Figure 4.1
As Figure 4.1 shows, private interest rates across Belgium, France, Germany, and the
Netherlands had already converged almost completely for the long end of the yield curve by
mid-June 1996, and for the full spectrum of the curve by mid-February 1997.14 Since the only
systematic wedge between national yield curves is created by exchange rate risk, any
reduction of this risk makes yield curves more similar, as is evidenced in Figure 4.1.
Table 4.1
Consistent with this figure, Table 4.1 shows that in early 1997 financial markets had already
perfectly anticipated the entry of Belgium, France, Germany, and the Netherlands into EMU,
whereas significant uncertainty remained for Denmark, Italy, Portugal, and Spain. In January
1998, however, the markets were almost certain. In the final consequence, after the
announcement of the irrevocable exchange rates among the 10 EMU member currencies in
May 1998, the almost identical country-specific yield curves collapsed de facto into one, and
since January 1999 the ECB formally documents a private euro yield curve, derived from
interest rate swaps. Figure 4.2 shows the first such curve (of January 6, 1999), and the
evolution of its “informal” predecessors.
An euro-wide yield curve constitutes an important benchmark for the whole European market,
in particular if it is regularly documented by the ECB. In addition to the transparency it
provides, it facilitates the development of more liquid securities and interbank markets, as we
discuss below. In view of the more problematic outlook for an euro yield curve for public

14
debt, earlier observers have even argued that the private yield curve might obtain an overall
benchmark status in Europe (Adler, 1996, Huteau, 1997). But as we argue below, the
European public debt market is on the right track for a public yield curve to emerge.
Figure 4.2
Figure 4.2 also provides some interesting information about the changing macroeconomic
outlook of financial markets with the introduction of the euro. Clearly, the yield curve in
Euroland consistently and significantly shifted downward during the second half of 1998,
when the European Central Bank began to become operational. Furthermore, the longer-term
rates fell more quickly than the short-term ones, reflecting probably the turmoil in financial
markets following September 1998. Whether the downward shift of the yield curve represents
mainly the markets’ reaction to the euro (as some publications by the ECB suggest), or
whether other macroeconomic developments contributed as well, it seems indisputable that
the advent of the euro has helped to improve monetary policy expectations in the market.
4.2 The cost of intra-European investing
While the euro directly implies a decrease in explicit and implicit transaction costs (such as
the cost of currency conversion and of currency risk) as reviewed in section 3, this does not
automatically signify that the cost of cross-border investment in Europe falls to the level of
within country investment. In fact, as documented in Danthine, Giavazzi, Vives and von
Thadden (1999) and Danthine, Adjaouté, et al. (1999), several important obstacles for intra-
European capital flows remain which are at the heart of the uncertainty about the effectiveness
and extent of the single European capital market.
The main problem is that, within Europe, cross-border payments and securities settlement are
substantially more expensive and complicated than domestic ones. As observed recently by
Padoa-Schioppa (1999) “…the euro area (still split in 11 countries) has 18 large-value
systems, 23 securities settlement systems and 13 retail payments systems. The United States
has 2 large payments systems, 3 securities settlement systems and 3 retail payments systems.”
A recent study by the European Central Bank shows that fees charged to customers for
14 Except for shorter maturities, where interbank offered rates are used, such national private yield curves areconstructed from the best rates on the fixed sides of interest swap contracts offered by banks in the country under

15
domestic credit transfer rarely exceed ( 0.10 to 0.15, while for cross-border transactions
inside the euro-area these fees vary between ( 3.5 to 26 for small amounts and between ( 31
and 400 for higher amounts. “In addition to these fees, bank in some countries add extra
charges (e.g. balance of payments reporting, currency conversion, SWIFT, postage and other
communication charges), which may be substantial compared with basic fees” (European
Central Bank, 1999c). The ECB study also shows that cross-border payments need 4.8
working days on average to reach their destination, with substantial differences between
countries, and that 15% of the transactions needed more than a week to be executed. By
contrast, domestic payments arrive usually in one to three days.
Danthine, Adjaouté et al. (1999) observe that while the processing of domestic trades has
become highly standardised, cross-border processing is still structured and organized in a
complicated and often inefficient way in almost all European countries. Settlement risk is
increased by the lack of Delivery vs. Payment (DVP) mechanisms and the longer time
between trade execution and completion, while custody risk is increased because of the
number of intermediaries and jurisdictions involved. Overall, they estimate that cross-border
transactions cost ten to twenty times more than domestic ones: from $1 to $5 for domestic
transactions as opposed to $10 to $50 for cross-border trades between European markets.
Taxation can also be a significant barrier to cross-border investment within the euro area. One
example of many for this is that, while taxes paid to foreign governments can usually be
credited against domestic tax liabilities, the offset is not always perfect; in addition it may be
costly and time consuming to actually obtain the tax credit. Another example concerns the
legal status of some mutual funds that are not covered by double taxation agreements between
European countries.
These and several other considerations, varying accounting and reporting standards in
particular, imply that the euro zone cannot be viewed as a homogenous investment area
comparable to the United States.15 The explicit and implicit transactions costs in Euroland
consideration (see Svensson, 1994).15 The amount of stupidity that stands in the way of improvements in financial markets can be seen from thefollowing excerpt: « Political agreement on the proposal for a Take Over Bids Directive, which would make thefinal adoption of this proposal possible, has still not been achieved in the Council. The main stumbling block is tofind a mutually acceptable solution for Spain and the United Kingdom over the status of Gibraltar » (EuropeanCommission, 1999b).

16
keep being much higher. Such considerations are relevant when performing the comparisons
suggested by Table 2.1.
An important indirect effect of the euro has been to expose these heterogeneities and barriers
within Europe and to put pressure on politicians and market participants to adopt measures
and institutional reforms fostering a greater degree of harmonization and efficiency in
financial market transactions. Concerning payment systems in general, EMU has certainly
brought some progress; the establishment of TARGET and EURO1, the settlement systems
for large transactions of the European System of Central Banks and the European Banking
Association, respectively, and the implementation (in August 1999) of the EU Directive
97/5/EC of January 1997 on cross-border credit transfers are some of the most visible
improvements in the wake of EMU.
On the other hand, there have been limits to what transparency and public pressure can
achieve. The most important case in point are the costs of cross-border retail payments, which
have become, because of their broad visibility even to non-professionals, almost a marketing
problem for European banks. Several steps have been taken, such as an initiative to
standardize payment definitions and routings by the European Commission for Banking
Standards, but until early 2000 at least, the wish, repeatedly expressed by the European
Central Bank, that the industry “make a considerable improvement in this field [cross-border
payments] very soon” (ECB, 1999d) has not been fulfilled.
4.3 Payment flows and inter-bank markets in Euroland
In theory, the unification of Central Bank refinancing possibilities for banks after EMU should
help, as an indirect effect, to provide a level playing field for financial institutions and to
equalize their costs of capital across Europe. In practice, however, access to refinancing
facilities has remained uneven and liquidity redistribution through secondary markets
imperfect. This issue is important because the distribution of liquidity through the auctions of
the European System of Central Banks is necessarily imperfect, an imperfection that is

17
exacerbated by the decentralized operational procedure of the system that is based on the old
national monetary infrastructures.
Although overnight interbank bid-ask spreads in 1999 tended to be higher than in 1998 in
most EMU countries (for reasons that are not entirely clear), the unsecured money market
across Euroland seems to have worked well from the start of EMU on (also because of the
relative success of TARGET). One indicator for this has been the de facto convergence of the
national unsecured overnight rates and EONIA (the pan-European Euro Over-Night Index
Average) during the first months of 1999. The smooth functioning of the unsecured money
market is all the more important as this market, in early 2000, accounts for roughly 70 per cent
of the total euro interbank market (ECB, 2000).
Any difficulties in the distribution of liquidity across Europe seem rather due to imperfections
in the cross-border repo market. On the one hand, overnight repo rates in Euroland have
almost fully converged during the course of 1999, suggesting that the system is working well
enough to arbitrage away price differentials. On the other hand, a number of impediments to
repo transactions have continued to exist in 2000, which hamper the development of this
market. Apart from the main structural problem - the absence of an efficient system of links
between national securities settlement mechanisms – differing documentation requirements
and supervisory procedures across EMU member countries and a certain lack of experience of
participating banks seem to be the important impediments in these transactions.
The Eurosystem’s pragmatic temporary solution to the main structural problem, the
Correspondent Central Banking Model (CCBM), is not likely to be easily upgradeable,
because it is neither automated nor real-time, nor direct. On the other hand, the emergence of
competing centralized systems or the upgrading of links between partial systems may give rise
to coordination problems.
Table 4.2
Turning to a first quantitative assessment of intra-European money market flows, Table 4.2
shows change, but also how slow this change is. Clearly, European banking markets even in
early 2000 have still been highly fragmented along national lines, with the share of domestic

18
interbank claims in total interbank claims standing at roughly 64 per cent and that of domestic
loans in total loans at roughly 80 per cent. Interestingly, euro area cross-border interbank
claims are proportionally substantially higher than cross-border lending or borrowing with
non-banks, showing that the interbank market constitutes an effective link between national
banking markets. Furthermore, the share of euro area business has increased markedly over
the three years in all categories reported in Table 4.2. A final observation concerning Table
4.2 is that this table presents aggregate values. As most banks in Euroland are concentrated on
their national markets, the share of euro area cross-border business for the bigger banks, who
provide the bulk of these transactions, is probably substantially higher than what Table 4.2
indicates (see ECB 2000).
Despite the still existing significant segmentation of national lending and borrowing markets,
it is clear from the data in Table 4.2 that cross-border lending and borrowing as well as
interbank transactions in the euro area have expanded considerably in the period 1998-1999. It
is difficult not to attribute this effect to the euro.
4.4 Market depth and liquidity
Having discussed the euro’s effect on transactions costs and cross-border finance flows, we
can now turn to its impact on the workings of the European asset markets more broadly. By
eliminating currency risk EMU has put traders in foreign euro-denominated assets on an equal
risk base with domestic traders. This together with the increase in transparency resulting from
the single currency has greatly reduced the barriers to trading such assets. In this sense, EMU
has potentially increased the demand side of the market for each asset traded in the euro
zone.16 In the sense of our definition given at the beginning of this section, the markets at
least for some assets in the euro zone can, therefore, become deeper or more liquid. This
effect will be reinforced, if the supply of such assets increases or assets that were previously
considered different become closer and closer substitutes for investor portfolios. Although this
is true for bonds, commercial paper, equity, and all other types of financial assets alike, we
will for the sake of brevity focus our discussion of liquidity risk on the bond market, turning
to the equity market in the next subsection.
16 In addition, McCauley and White (1997) as well as Portes and Rey (1998b) have predicted that the totaldemand for euro denominated assets by non-euro investors would increase, a prediction borne out by theevolution in 1999. On the other hand, the analysis of De Santis, Gérard and Hillion (1999) leads them to predictthat, in the future, Europeans are more likely to diversify into non-European equities.

19
To the extent that the expanded markets indeed give rise to increased trading, the single
currency therefore has reduced liquidity risk. However, an important theoretical feature of
markets with transactions costs and liquidity risk is the possibility of multiple equilibria. As
has been shown, in particular, by Pagano (1989), in such markets depth is endogenous, and
“virtuous circles” of high trading activity and low liquidity risk are as much possible as
“vicious circles” of low trading and high liquidity risk. When assessing the impact of the euro
on liquidity it is, therefore, important to not only add up the different pre-euro domestic
markets (as in Section 2), but also to evaluate the relationship between market prices, trading
volume, the number and type of participants, and transaction costs in the market after EMU.
Unfortunately, this type of full model is beyond the scope of the present article. We therefore
limit ourselves to the “adding up approach” with occasional more general outlooks, which
already provides a number of interesting insights.
We first direct our attention to the public bond market. Although supply in each national
market is not likely to grow much in the foreseeable future because of the limitations on
government debt imposed by the 1996 “Stability and Growth Pact”, the European market may
make up for the lack of growth by homogenization. In fact, an important indirect effect of
EMU has been its impact on the supply side of the European public bond market.
In 1995, EU governments had decided that as of January 1999 all new fungible public debt by
EMU member states should be issued in euro. This was a logical direct consequence of the
introduction of the euro and in itself would have already created relatively large euro markets
for longer-term public debt. Yet, several questions remained open that had important
implications for the development of the public debt market. Most importantly, governments
were undecided at the time whether to redenominate their outstanding debt into euros with the
inception of EMU. Redenomination would not only have added large volumes to the long end
of the yield curve, but also created euro markets for shorter maturities. This potentially
beneficial effect needed to be balanced against the costs and technical difficulties of such a
switch. The French and the Belgian governments opted very early in favour of
redenomination, whereas the German government for a long time seemed to be undecided.
However, mostly due to pressure by the parts of the national financial sector who feared a loss
of competitiveness of the Frankfurt bond market, the German “Euro Introduction Law” of

20
June 1998 stipulated the full conversion of existing German fungible federal debt by January
1, 1999 (the Länder followed suit soon afterwards).17 In the wake of these decisions, the same
has been decided by all other EMU countries.18
Largely driving the debate on the question of debt conversion has been the concern about the
benchmark status of national debt, if possible across the whole spectrum of the yield curve. As
in the private debt market, benchmark status confers substantial benefits on the country that
enjoys it, but a large market size obviously is a key requirement for this status. Therefore, the
“race to the benchmark yield curve” has probably been the most important factor in the
decisions of national governments to redenominate their outstanding public debt. Other
important questions for the evolution of the European public debt markets raised by the euro
were issues such as the homogeneization of bond conventions, the harmonization of issuing
practices, and more generally the substitutability of bonds by different countries, to which we
turn now.
Once the debt conversion decision was made, governments decided to go one step further and
to homogenise bond conventions for their debt, in particular the day-count and business day
conventions. All member countries have switched the day-count of their outstanding and new
Treasury Bills to “actual/360” and of their outstanding and new bonds to “actual/actual” (for
existing issues usually with a grace period), and most member countries switched to using the
operating days of TARGET as official business days for the service of their public debt.
Private bond issuers often have adapted similar reconventioning plans.19 These changes have
made public bonds more easily comparable and substitutable. While they are not logical
consequences of the introduction of the euro, they constitute an example of how unification in
one area brought about by the euro – the redenomination of bonds – has entailed a further
element of unification – the reconventioning.
It is interesting to note that this phenomenon has even spilled over into the non-euro area: for
example, the Bank of England has issued euro-denominated Treasury Bills already from 1999
17 Except for some short-term obligations, which comprise less than 3 per cent of the fungible federal debt.18 With some minor exceptions such as Austria that has redenominated only those 34 percent of its tradable debtwhich is sufficiently liquid. The only open issue on January 1, 1999, was whether some countries such as Finlandwould redenominate their public debt issued in foreign EMU currencies (an issue which is not relevant for Franceand Germany).19 For details, see Bank of England (1998).

21
on. It is equally interesting to note that a number of even farther reaching decisions have
begun to be debated recently. These concern, in particular, the harmonization of issuing
practices by Euroland governments and include the coordination of issuing dates, the optimal
choice of issuing formats, and similar questions.20
Yet, despite the homogeneization and although the yield curves have converged considerably,
euro-zone government bonds are still not perfect substitutes, as is evidenced in the evolution
of government bond yields given in Table 4.3.
Table 4.3
Table 4.3 provides information on the evolution of the yield curves of the major EMU
countries from before the financial crisis of autumn 1998 (represented by the August 1, 1998
values) until early 2000. The table shows that some important features of the public bond
markets in the euro zone have evolved similarly, such as the dramatic steepening of the yield
curves of all EMU countries between October 1998 and June 1999. But it also documents that
non-negligible differences in yield levels across countries have remained and that there has
been little of a clear-cut trend over the period in these differentials.21
Following the flight to quality in the fall of 1998, yield differentials bottomed out in February
1999 and have increased thereafter, only to decrease again towards the end of the year. In
particular, the traditionally small yield differential of Dutch over German bonds at the long
end of the spectrum doubled from less than 9 basis points in August 1998 to almost 18 basis
points in October 1999, with some important fluctuations in between, and decreased again to
11 basis points in December. At the short end of the yield curve, the yield differentials of
Belgian, French and Spanish bonds over the German ones even became negative in summer
1999. In general, developments on the short end of the yield curve in 1999 were more volatile
and less predictable than on the long end, where the German Bund bolstered its already
dominant position. Much of this movement seems to have been due to learning and
20 For a discussion, see Favero, Missale, and Piga (2000).21 Historically, however, even the largest European yield differentials for 1999 presented in Table 4.1 areextremely low, as can already be glanced from Figure 4.1. Also in international comparison they resemble moreintra-national differences than international ones. For example, yields and credit ratings among U.S. states aremore heterogeneous than those inside Euroland (see Figure 4.3 below).

22
experimentation by investors. As a result of this, in the fall of 1999 market participants began
to shift their allocation from small markets to German paper, because the small markets were
increasingly perceived as risky.22
Presumably, part of the yield differentials shown in Table 4.3 are due to the differences in
fundamental risk. Table 4.4 recalls that half a year after the launch of the euro, 51 per cent of
the volume of government bonds outstanding had the univocal top rating by the two leading
rating agencies, with the other sovereign debt ratings being one, two or even three grades
lower. As Table 4.4 also shows, there has been some convergence of sovereign debt ratings in
1997 and 1998 towards the highest level, reflecting the budgetary and fiscal efforts by the
countries concerned. This process of convergence is, however, limited by the “no-bail-out”
clause in Article 104b of the Maastricht Treaty, which rules out, in as stark terms as possible,
any liability of EMU member governments for each other’s debt. The ratings in Table 4.4
suggest the markets have tended to believe this commitment.
Table 4.4
But Table 4.3 shows that, even within the group of top rated countries, some yield
differentials exist and even fluctuate differently across the yield curve (the ‘min-max1’ line of
Table 4.3 reports the maximum differential across AAA-rated countries: at the long end of the
yield curve it peaked at above 28 basis points in August 1999, declined to around 22 basis
points in the last quarter of 1999 and increased again thereafter). One of the reasons for these
differentials is that German government bonds are served by very liquid futures contracts in
the longer end of the yield curve, which allows for better hedging. However, since mid-1999
this latter point does not even seem to have been much of a competitive factor anymore. At
the longer end of the yield curve, the Bund futures by then had clearly acquired benchmark
status and seem to have taken on the role of serving the other core countries as well (compare
the evolution of the French MATIF contract documented in Figure 2.1).23
22 The Wall Street Journal Europe, for example, reported that “after having tested the waters of Europe’s smallerbond markets, institutional investors are deciding they’ve had enough – at least for now” (Nov 3, 1999). Yet, partof the shift away from the smaller markets may have been due to Y2K fears.23 See BIS (1999c) for further discussion.
23
What, then, explains the yield differentials documented in Table 4.3? It is implausible that
fundamental risk can be much of an explaining factor for spreads of more than 20 basis points
within the group of AAA countries. Ignoring the fluctuations associated with short-term
events that we have discussed in Section 1, the most reasonable explanation rather are
liquidity considerations. In fact, markets have traditionally attached a higher liquidity risk to
non-German public bonds than to German ones, with the exception of some shorter
maturities, where French and sometimes Italian issues have had a traditionally liquid market.24
Figure 4.3
In this respect it is illuminating to compare Euroland to the U.S. Figure 4.3 provides a static
comparison of 10 year government bond yields for Euroland and 16 selected U.S. states,
covering the whole rating spectrum.25 The figure shows that Euroland yield differentials in
early 2000, apart from being historically extremely low, resembled intra-national rather than
international data. The maximum yield differential in Euroland was 31 basis points compared
to 24 in the U.S., and if we delete the two extreme values in each sample, to capture the yield
differentials of the «bulk of the data», the maximum differentials are 12 for Euroland and 14
for the U.S.
Given the elimination of currency risk and the identical fundamental risk for the top issuers,
the European government bond market seems to exhibit the type of equilibrium behaviour that
we have discussed earlier in this section: since yields across different sovereigns are different,
the markets for these issues are, by definition, segmented, which implies that the liquidity risk
in the smaller segments is higher, which translates into differentiated yields, closing the
vicious circle. The effect of this circle is most noteworthy for the case of France and Germany,
the two biggest economies in the euro zone, with identical fundamental risk, whose 10-year
24 In particular, the French BTAN has had a deeper and better organised market than the GermanBundesschatzbriefe and Bundesobligationen. It is possible that the negative yield spread of French over Germanbonds in the 2-year range in summer 1999, documented in Table 4.3, points to a shift towards the French paperas the benchmark in this range. On the other hand, the numbers may also just reflect the fact that German shorter-term issuing activity was very low in the first half of 1999. The changing data for early 2000 suggest that thebenchmark status in this range is still an open issue.25 The selected date is February 7, 2000. Other dates in the first quarter of 2000 yield the same picture. At thattime there were 9 states rated Aaa, 6 with Aa1, 10 with Aa2, 10 with Aa3, 3 with A1, and 2 with A2 (the otherstates had no general obligation debt). The absolute level of yields is uncomparable between Europe and the U.S.because of tax reasons.

24
bonds traded at a differential of around 20 basis points. In comparison, Figure 4.3 shows that
the maximum yield differential among top rated U.S. was a mere 5 basis points.
But, at least conceptually, such a segmented market also has equilibrium with full integration,
that is, a constellation in which the participants’ beliefs about integration are self-fulfilling.
The underlying logic is the following. If market participants traded the different issues
interchangeably on one single market, their liquidity would be identical (and higher), therefore
their yields would be identical (and lower), and there would indeed only be one single market.
What is important is that in both cases, in the segmented equilibrium and in the integrated
equilibrium, liquidity and its price (represented by the yield differentials) must be determined
simultaneously, and this can lead to multiple equilibria. Furthermore, the equilibrium with a
unified market is Pareto superior to the fragmented equilibrium underlying the data in Table
4.3, because yields (and transaction costs) are lower in the former.
In view of this reasoning it is possible that the public bond markets of Germany, France, the
Netherlands, Austria, and Luxembourg will in the future shift from one equilibrium to another
to become one fully integrated single market, without a further change in exogenous
parameters, simply due to changing market perceptions, and that following this event the
unified yield curve will shift down.26 As shown in Table 4.4, these five markets alone have a
combined value of $1811.6 billion.27 As a result, the present segmentation in the euro public
bond market due to fundamental and liquidity risk may be reduced to two large sub-markets of
similar size, the first composed of Austria, France, Germany, Luxembourg, and the
Netherlands, and the second of the lesser ranked Belgium, Italy, Spain, and Portugal, with
Finland and Ireland somewhere in between.
This shift towards a good, high liquidity equilibrium is just a possibility, however. On the one
hand, the narrowing of the yield spreads at least on the long end in November and December
1999 may be a first sign of a market consolidation associated with a high liquidity
equilibrium. On the other hand, the disappointment of investors with smaller public bond
markets towards the end of 1999 point to a continuing segmentation in the near future. For
26 It may be argued that the continued downward shift of the yield curve in early 1999, after the financial crisis ofautumn 98, was at least partially due to this kind of market consolidation.27 If the two other countries ranked top by Moody’s (but not by Standard and Poor’s), Finland and Ireland, jointhis market, this adds another $115.7.

25
instance, the Wall Street Journal article cited earlier suggests that the European public bond
market is evolving towards a structure where “Germany is a super-tier, in a class of its own.
France and Italy are a sort of second tier – albeit a highly regarded one – and all the other ones
are pushed into the third tier” (Nov 3, 1999). It is interesting that this scenario puts the worst
rated country, Italy, in the same tier as AAA-rated France and, therefore, completely
disregards fundamental risk.
While it is still too early for far-reaching conclusions, our theoretical argument clearly shows
a very positive perspective for the public bond market. How ever its developments will play
out in the short run, there is a high liquidity equilibrium for at least a part of the market, and it
is clear that further positive exogenous shocks on market fundamentals, such as transaction
costs, demand, or exchange rates, have the potential to move the new EMU public bond
market towards this high liquidity equilibrium. In this perspective, the changes in issuing
practices considered by several governments in 1999, such as concentration of issue sizes or
coordination of issuing dates, may have effects far larger than the marginal effect of reduced
transactions costs.
We now turn to the private bond market. Clearly, the demand side effect of EMU discussed
for the public bond market also is relevant for the private bond market, as it is for all other
markets. But as in the case of public bonds, the interesting question is whether this broadening
of potential demand has indeed translated into increased participation. Here the available data
for 1999 indeed point to a fundamental switch of market behaviour. While until 1998 bond
distribution in the euro zone for all but the very few largest firms was almost exclusively
domestic, the larger bond issues of 1999 were sold on a truly European scale that even
surprised most market participants. We do not yet have aggregate data on European bond
distribution; therefore two typical cases must suffice to illustrate this market switch. In the ( 1
billion issue of Alcatel, the French telecom firm, in February 1999, 28 per cent of the paper
was placed with Italian and more than 20 per cent with German investors - Alcatel’s surprised
CFO remarked: «That a French corporate can sell its bonds primarily to Italy is something
new». Shortly afterwards, the head of syndicate at CSFB for the European bond issue by

26
Principal Life, a U.S. insurer, noted that «we sold 30 per cent of this deal in France. In the past
we might have sold 3 per cent there».28
Furthermore, and differently from the public bond market, the European private bond market
is becoming more liquid also because of pure growth on the supply side. The starting point is
again described by Table 2.2. As the table shows, the private bond market of the euro zone
before the introduction of the euro was around 42 per cent the size of the U.S. market. But
much of the European activity is accounted for by financial institutions; if one considers the
non-financial corporate bond market, outstanding corporate bonds in Europe amounted to less
than a third of the approximately $2, 240 bn worth of U.S. bonds.
Table 4.5
The main reason for this discrepancy is the different role of bank lending in Europe and the
U.S. While in the U.S. bank loans play a negligible role in the financing of large companies
and face strong competition from the bond market even for medium-size companies, they
have been traditionally the by far dominant source of debt financing for almost all European
companies. Table 4.5 illustrates this fact and shows that even for the largest European firms in
1996 bank loans have been of primordial importance.
This feature of European corporate finance has begun to erode in the second half of the 1990s.
But while the corporate bond market grew only slowly prior to EMU, its growth in 1999 has
been spectacular, and this along several dimensions. First, aggregate volumes have increased
dramatically. Table 4.6 provides an overall view of this phenomenon. It shows, in particular,
that global net issuing activity in euros in 1999 exceeded the dollar volume by 11 per cent,
after it had been only per cent of the dollar total in 1998 and even less before. The table also
shows that this explosion of the euro (compared to the euro legacy currencies) was mostly due
to the more than 100 per cent increase in issuing activity in Europe.
Table 4.6
28 See Euromoney, August and September 1999.

27
Second, the size of the largest issues has increased substantially. While in 1998, there were
just three bond issues in euro legacy currencies above the equivalent of ( 1 billion, the three
issues by Tecnost, the financing vehicle for Olivetti’s takeover of Telecom Italia, in June and
July 1999 alone raised ( 15.65 billion. Although the Tecnost issues were widely perceived as
exceptional, issue sizes in general have increased significantly in 1999, with issues above ( 1
billion becoming more and more frequent.
All indicators, therefore, point to a fundamental change of the European private bond market
following the introduction of the euro, with a substantial increase in liquidity.29 To be sure, it
is also clear that the preliminary data reflect at least some exceptional and short-term features,
such as the financial crisis of autumn 1998 and the desire to set benchmarks with euro issues.
The former resulted in a catch-up effect for issuing activity in early 1999, and the second
produced some issues which otherwise might have taken place later. Furthermore, the boom in
Mergers and Acquisitions in Europe, fuelled by the liberalisation of several important
industries in different countries, has played an important role. Yet, the qualitative change of
the market from a low liquidity towards a high liquidity equilibrium seems undeniable.
But the changes in the European bond markets did not only affect market liquidity, but also
breadth. In particular, whole new market segments in the European bond markets have begun
to emerge, which allow for much better intra-European diversification than before EMU. An
indicator for this development is that the average credit rating of companies issuing bonds has
fallen significantly since EMU. While European bond markets used to be dominated by AAA
and AA issues, 46% of all corporate bonds issued in the first three quarters of 1999 had a
single A credit rating (Danthine, Adjaouté et al. 1999). Further down the spectrum, even the
first signs of a European junk bond market could be noted, although this segment still remains
to be developed.30 We now turn to the issue of market depth more systematically. In order to
diversify the analysis, we focus on the stock market in this context.
4.5 Market breadth and diversification
29 Although, as pointed out in Danthine, Adjaouté et al. (1999), the market for certain segments, such as the highyield segment, in Europe is very much sector specific with half of the issues thus far stemming from the cable andtelecommunications sector. In addition, the growth in new corporate bond issues has been disproportionatelyconcentrated on Germany, France, Spain and Italy.30 For an early discussion, see Altmann (1998).

28
The second main benefit of increased market size resides in better diversification possibilities.
As described in Section 3, EMU has reduced the risk and information costs of European
cross-border investment for all type of investors and has eliminated some formal barriers for
institutional investors. In theory, this allows investors to better spread the fundamental risk of
their asset holdings and to rebalance portfolios towards assets that previously were too costly
in terms of the risk–return tradeoff of standard portfolio theory, typically towards foreign
ones.
Yet, as far as international diversification in equities is concerned, this theory has long been
known to be flawed. As documented repeatedly in the 1980s and early 90s (see, in particular,
Adler and Dumas (1983) and Tesar and Werner (1995)), for all countries studied, the share of
international equity in total equity holdings by domestic investors has traditionally been too
small to be compatible with the standard portfolio model, even taking exchange rate risk,
transactions costs, and inflation differentials into account (see, e.g., French and Poterba, 1991,
Cooper and Kaplanis, 1994). The logical consequence is that other reasons than currency must
have kept equity investors from investing abroad; if this is correct, the unification of
currencies will not change investors’ behavior, pecuniary and non-pecuniary transaction costs
as discussed in Section 4.2 will be more important.
Figure 4.4
To some extent, however, the picture seems to have changed during the past few years. Recent
data provided by Portes and Rey (1998a) show that between 1991 and 1996 new equity
investments (M&A and portfolio investments) by European (EMU 15) investors in the U.S.
have more than tripled and those of U. S. investors in Europe almost quintupled. Clearly,
these numbers partly just reflect stock market growth in Europe and the U.S. during this
period. But still, the change in investor behavior seems to be significant.31 Similarly, Figure
4.4 records a visible upward trend, for all European countries, in the share of foreign to total
financial assets. Table 4.6 provides additional evidence for such a change, by focusing on
German investment funds. While in 1990, foreign equity investment by German funds still
shows the strong domestic bias reported in the literature, this bias has shrunk considerably

29
during the 90s, to the point that foreign equity holdings have outweighed domestic holdings in
1998.
Table 4.7
If this empirical picture is correct - a strong equity home bias until the early 90s and an
erosion of the bias during the 90s - the challenge to explain it theoretically is even greater than
in the early 90s (where the challenge just was to explain the home bias). Yet, even for this
more complicated picture the earlier literature provides some interesting suggestions. The
most plausible story seems to be asymmetric information and learning. As has been argued by
Gehrig (1993) in a capital market model à la Admati (1985),32 the equity home bias as
observed until the early 1990s may be better explained by informational problems faced by
domestic investors when valuing foreign securities.33 Extending his argument, the lack of
transparency and trading opportunities in continental European firms, as well as the weakly
developed equity culture of European investors would then explain the paucity of equity flows
into and out of Europe until the 90s, while the change in both these features in the course of
the 90s would explain the observed increases of equity flows.
A priori, this view of European equity markets attributes little importance to EMU. If
investors indeed diversify their portfolios across frontiers, though imperfectly, but need time
and the right institutions to learn about foreign investment opportunities, and if such learning
has taken place in the 90s, then the elimination of currency risk will help the process, but is no
major factor. In fact, recent research on European equity markets shows that the economic
unification of Europe through the Single Market Program and EMU has reduced country
specific risk in Euroland dramatically: according to one measure by Hardouvelis,
Malliaropoulos, and Priestley (1999), the percentage of average expected stock returns due to
country-specific risk across Euroland and the U.K. fell from 77 per cent in the period of 1991-
95 to 34 per cent in the period 1996-98. Taken to the extreme, such findings may suggest that
31 Along similar lines, Rowland (1999), using data by Bohn and Tesar, reports an increase of international equityholdings by U. S. investors between early 1991 and end-1994 from 4.3 to almost 8 percent. More recently,Bottazi and Hamaui (2000), provide data on Europe that show a substantial erosion of the home bias.32 See also Gordon and Bovenberg (1996) and Brennan and Cao (1997).33 This approach is supported by the empirical work of Tesar and Werner (1995), Portes and Rey (1999b) andHau (1999) who explicitly introduce variables such as geographical distance and language barriers into assetpricing models in order to proxy informational frictions.

30
home biases in portfolio investment have become unimportant, and as a consequence, that the
elimination of currency risk has little effect on portfolio investment within the euro area.
But while it seems indeed to be true that cross-country correlations of stock returns across
most sectors in Euroland have increased substantially during the 90s,34 home biased
investment is still suboptimal. As shown by Adjaoute and Danthine (1999), optimal portfolio
diversification across sectors and countries during the second half of the 90s still outperforms
home-centered or pure country-allocation investment strategies in terms of risk and risk-return
performance (Sharpe ratio). This suggests that it is profitable to reorient traditional
international asset allocation methods from a country basis to a pan-European industry basis.
And in fact, although asset allocation strategies do not seem to have adjusted fully in 1999,
there is strong evidence that such a change is under way in Europe. The Goldman
Sachs/Watson Wyatt survey of fund managers, for example, has found that 70 percent of the
managers interviewed intended to reconsider their asset allocation after the introduction of the
euro, and 64 percent of the respondents stated that the new allocation would be based on
sectors instead of countries (Goldman Sachs, 1998).
If these changes materialize, the euro will have had another important indirect effect. Through
the reorganization of the workings of the asset management industry in Europe, data on firms
and sectors will become increasingly better comparable, information will flow more
efficiently inside financial firms and across firms, and ultimately there will be more and better
information. In the framework of the informational theory of the home-bias problem outlined
above this implies that cross-border investments will increase and hence that the European
financial markets will become more integrated. It is worth repeating that this prediction is not
based on the traditional presumption of currency-induced barriers to international investment.
To the contrary, as currency risk is considered to play a minor role for the home bias, its
abolition, too, is relatively uninteresting. What matters is the convergence of fundamentals
across the euro zone, which makes country-based investment strategies relatively less
interesting, therefore increases the value of pan-European strategies and improves
international information flows.
34 See, e.g., Frankel (1997), Hardouvelis, Malliaropoulos, and Priestley (1999), and Adjaoute and Danthine(1999).

31
Note that, as in our argument about liquidity risk, this theory heavily relies on transactions
costs. Because the reduction of country-specific risk factors also makes home-country
centered investment strategies relatively less risky (compared to a first-best international
allocation), high transactions costs for international investment will work against the
internationalization effect described above. Hence, as long as these transaction costs remain
high, only few firms will change their portfolio strategies, and only if these costs come down
will we expect a major shift. But as in our analysis of liquidity risk, a major shift in
investment behavior following EMU is possible, and even likely, the more international
transaction costs will be exposed and eroded.
We do not yet have the data to test these theoretical reasonings. The data of Table 3.2,
imperfect as they are, suggest that in 1994 at least, most institutional investors in Euroland,
with the exception of the Benelux countries and Ireland, were still heavily home biased - so
much biased, in fact, that they were not even constrained by regulation such as the 80 percent
matching rule. We would expect most of these investors to adjust their structures and then
their portfolios. This is what early data confirm.
Euro area mutual funds (for which data are available more easily than for other investor
categories), fore example, held a relatively constant share of ca. 50 per cent of their equity in
foreign titles between 1996 and the second quarter of 1998. Between June 1998 and June
1999, however, this share increased to 62 per cent (still suboptimal in standard portfolio
allocation theories).35 For pension funds, the figures have traditionally been lower (around 40
per cent of all equity foreign), and the increase in 1999 seems to have been positive, but
slower.
This broadening of the investor base has gone hand in hand with a strongly increasing demand
for equities in Europe in 1999. In fact, 1999 has been a record year in turnover on European
primary and secondary equity markets.36 Whether and to what extent this evolution can be
attributed to EMU is difficult to say (in particular, as U.S. markets boomed similarly), but it
certainly is consistent with our optimistic theoretical assessment.
35 Source: Morgan Stanley Dean Witter.36 According to Capital Data Bondware, international equity issues in Europe increased by 66 per cent, and datafrom Thomson Financial in the Financial Times (Jan. 28, 2000) show that trading on European stock exchangesrose by 42 per cent in 1999.

32
It is worth repeating that the discussion of this subsection applies to equity and fixed income
markets alike. A broader market, in which single investors can choose from a bigger pool of
issuers, is always better in terms of diversification possibilities. The broadening of the
European corporate bond market mentioned in subsection 4.4 above, in particular the
emergence of lower quality segments, therefore strengthen the optimistic conclusions of the
above analysis. The emergence of Euro MTS, the Euro-wide trading platform for public
bonds, has been a similarly positive event. However, as already stressed by McCauley and
White (1997) and Prati and Schinasi (1997), it is equally important to remember that EMU
also has reduced European diversification possibilities by homogenising the public bond
market. In this context the results of De Santis, Gérard and Hillion (1999) reported in Section
3 bear repeating, as they suggest that the reduced diversification potential inside Euroland will
increase the attractiveness of non-European equities for European investors.
5. Banking and Financial Market Institutions
The introduction of the euro is an institutional change that has been accompanied by a number
of further important changes in European financial institutions. Since the mid 90s, existing
markets have changed their structure, new markets have emerged, market participants have
changed their focus, and public institutions have been transformed. In this section, we discuss
some of these changes, concentrating mainly on the most important players in the European
financial market, the banks. Other institutional developments have been important in recent
years, too, such as the attempted and probably now botched alliance between the London and
Frankfurt stock exchanges, the surprising rise of Eurex to become the world’s leading
derivative exchange (see Figure 2.1), or the beginnings of private pension structures in several
European countries, but we do not have the space to cover these. We will also mostly ignore
public institutions and policy, which are discussed elsewhere in this volume.37
As we have asked repeatedly in this article, an important empirical question is to what extent
the recent changes in Europe’s financial markets can and should be attributed to EMU. Other
37 See also Danthine, Giavazzi, Vives, and von Thadden (1999).

33
developments, mainly in regulation and technology, have clearly had an important impact, and
it is often difficult to disentangle the relative contributions.
On the regulatory front, changes in Europe have been substantial since the introduction of the
Single European Act in 1986. On the national level, all Western European countries had
abolished important domestic capital market restrictions such as controls on capital flows and
interest rates by the early 90s. At the European level, a whole set of Community directives in
the early 90s have aimed at opening up, homogenizing, and often deregulating the fragmented
national financial markets of EU member states; they are based on two main principles: the
principle of mutual recognition and that of home-country control.38 On the technological front,
the explosion of information technology in the 1990s on the one hand has fundamentally
changed the way individual businesses and whole markets are operated (from check
processing in banking to Electronic Communication Networks as an alternative to stock
exchanges). On the other hand, the revolution in financial theory that began with Black,
Merton and Scholes in 1973 has provided the financial technology that has allowed to price
and market assets in the 1990s to an extent that had been unthinkable less than 20 years
earlier. In this perspective, the introduction of the euro has been just one more challenge in the
transformation of the European financial industry.
Several approaches are possible to identify the impact of EMU against that of the overall pace
of change. First, it is possible to compare the changes in the European financial market in the
late 90s to those of the early 90s: if the responses are different, it is likely that the impulses are
different. The problem with this approach is that many of the fundamental changes in the late
80s and early 90s mentioned above probably have operated with significant lags. Another
approach is to compare the European experience with that of the US in the 90s, which has
been marked by important institutional changes, too, but no change in the currency. The
problem with this approach is that the structure of US financial markets is quite different from
that of Europe and that the changes in the US (such as the dismantling of interstate banking
prohibitions) often have also been different from those in Europe.39 Yet another approach is to
38 The most important directives in the creation of the «single European passport in financial services» were theSecond Banking Directive of 1989 (amended in 1992 and 1995), the Investment Services Directive of 1993, andthe Capital Adequacy Directive of 1993 (amended in 1995, 1996, and 1998). They were complemented by anumber of other directives concerning large exposures, branch networks, insurance activities, etc.39 See Danthine, Giavazzi, Vives, and von Thadden (1999) for a broader discussion of the US experience.

34
identify theoretically the importance of the different direct and indirect effects discussed
earlier for different market participants and to examine whether observed reactions differ. The
problem with this approach is that we often do not have precise enough data to differentiate
sufficiently. In the remainder of this section we shall use all of these approaches selectively
and very much incompletely.
As banks in Europe are important in most financial market activities – from mutual funds over
venture capital to the organization of stock exchanges – they are a natural focal point for an
analysis of market institutions, but they are also affected by EMU in different ways. In
particular, while the changes in capital market activity discussed in Section 4 tend to hurt the
traditional deposit and lending business of commercial banks (by producing a “shift from
banks to markets”), they benefit the more market based asset management and investment
banking activities.
Yet, the interaction between banks and markets is more complex. Even in the U.S., where
until recently banking has been more narrowly confined to commercial banking, the often-
noted decline of banks since the 1970s is more of a measurement problem than a real issue.
Boyd and Gertler (1994) have argued that, if one corrects the raw data on bank assets for off-
balance sheet activities and other measurement problems, the decline in the relative
importance of banks among financial institutions since the mid 70s is transformed into a
moderate increase, which, given the rapid growth of the financial industry, yields a substantial
increase in the importance of banks in overall economic activity between the mid 70s and the
early 90s. In fact, by securitising assets, banks at the same time contribute to the development
of new sectors of the capital market and profit from it. As Figure 5.1 shows, after its early
success in the 80s and early 90s, mostly based on mortgages and auto loans, securitization has
continued to grow strongly in the second half of the 90s in the U.S. and seems to gain
importance in Europe.
Figure 5.1
In the same vein, the tendency to replace bank loans by traded debt in the financing of large
firms will not make banks redundant. As documented in Table 4.5, this process has already
reduced bank lending to large firms in the U.S. to very low levels, and the evidence presented

35
in Section 4 suggests that EMU has triggered a similar process for European firms. But
commercial banks still have an important role in this changed environment, not only because
of the increasing importance of syndicated loans,40 but also as a provider of liquidity through
lines of credit. As has recently been documented by Saidenberg and Strahan (1999), in the
aftermath of the Russian default and the LTCM crisis, yields in the U.S. commercial paper
market increased sharply and outstanding paper dropped by more than $ 16 billion between
mid-September and December 1998. Deprived of their main source of short-term funding,
large corporations then turned to their banks’ lines of credit. In fact, between September and
early November alone, commercial and industrial lending by large commercial banks grew by
more than $ 20 billion, more than double the rate in the first half of the year.
This and other evidence points to the continuing importance of banks in an environment of
deepening and broadening capital markets. This is all the more true for Europe where banks
through their private banking activities have traditionally had a strong base in asset
management, and where investment banking has been part of the universal banking tradition.
Furthermore, European banks are controlling important market segments that are dominated
by non-banks in the U.S., such as investment funds.41
However, in order to realise the potentials of the Single European Market and EMU, banks
have had to adjust significantly in the past few years and will probably have to adjust even
more in the future. This adjustment involves refocusing, cost-cutting, and technological and
organizational innovation and has been sometimes painful and often slow. It is widely agreed
that at the beginning of the 1990s Europe was overbanked with many inefficient firms (see,
for example, Gual and Neven (1993) and Economic Research Europe (1997)); the situation in
the U.S. was similar. Since then banks in the U.S. have improved strongly, and there has been
some progress in Europe, but the picture in the late 90s appears to be mixed and not always
satisfactory. Table 5.1 provides a summary comparison of the evolution of the profitability of
major banks in different countries during the mid 90s.42
40 Chase Manhattan, for exemple, one of the leaders in the field, is sometimes said to no longer need a partner ininvestment banking, because it already provides the most important financial product to corporate clients.41 The share of the mutual fund market controlled by banks is above 80 % in many EU countries and around 8 %in the U.S. (ECB, 1999b, Walter, 1998).42 The database covers the largest banks in each of the countries, ranging from 3 in Germany to 13 in the U.S.The picture for the much larger sample of the OECD’s Bank Profitability database is not much different, with the

36
Table 5.1
Table 5.1 has several striking features. The first is that returns on assets, interest margins, and
operating costs are substantially higher in the U.S. than in all other countries. Three
observations are key to understanding this difference. On the one hand, European banks have
a very different lending pattern from American ones, with significant exposure to the
interbank market and large firms, which both are low cost and low margin activities.43 On the
other hand, U.S. banks have increased their fee-based activities at the expense of the interest-
rate-difference business and have been able to achieve high non-interest margins in the 90s.
And finally, as is apparent in Figure 5.1, U.S. banks have successfully shifted some of their
lending activities off the balance sheet, thus boosting returns on assets.
The second interesting feature of Table 5.1 are the differences among countries within the
euro zone. Out of the four countries presented, large banks in Spain are the only ones to show
a clear upward trend in returns on assets and interest margins (and also in operating costs, thus
following the U.S. example), whereas banks in France and Germany show little variation in
returns on assets and a strong downward trend in interest margins and operating costs.
These overall measures are, of course, very coarse. A more reasonable approach to
understanding profitability and cost efficiency is to control for input prices, opportunity costs,
bank size, and other variables, and to then estimate the performance differentials of banks
with a structural model (the so-called “frontier approach”). In a comprehensive and careful
recent study alone these lines, Schure and Wagenvoort (1999) find considerable variation in
cost efficiency of European banks, with little evidence for size inefficiencies among
commercial banks and large average managerial inefficiencies (deviations from industry best
practice), which are, however, declining between 1993 and 1997. In another notable recent
study, Altunbas, Gardener, Molyneux, and Moore (1999), obtain similar results with respect
to managerial inefficiencies, but also find that large banks tend to benefit most from scale
economies and technological progress.
exception that the larger sample has slightly higher interest margins in the US and lower operating costs inEurope.43 The OECD data show that still in the mid-90s European banks had more than 20 percent of their assets in theinterbank market, around ten times the percentage of US banks.

37
The picture that emerges from these and other data is that European commercial banks have
become more profitable and cost efficient during the 90s, but that they still do worse than U.S.
banks and that progress is uneven. Some of this progress can certainly be attributed to the
prospects of competitive pressures brought about by the Single Market directives of the early
90s. But until the late 90s, the strong national segmentation of European banking markets, the
lack of regulatory harmonization, non-regulatory barriers such as taxation and corporate law,
but also past heritage and public protection have muted competitive conditions considerably
(see White (1998) for more data and some discussion).
The existence of different currencies has been an important factor in European segmentation,
playing in some sense the role of interstate banking restrictions in the United States. And just
as the repeal of these restrictions through the 1994 Riegle-Neal Act has vastly intensified the
reorganization of the U.S. banking market in the 90s,44 it seems that EMU has provided an
important, perhaps decisive, push towards the emergence of a more competitive and
ultimately more integrated European banking market. This trend is already clearly visible in
wholesale and investment banking and becomes notable in retail banking.45
Table 5.2
One of the indicators is the evolution of bank mergers in Europe during the 90s, presented in
Table 5.2. While there has been a steady stream of mergers in European banking throughout
the 90s, declining from a peak in absolute numbers in the early 90s, the value of transactions
has grown by over 500 % in 1997/98 compared to the previous periods. While it is, of course,
possible to argue that these numbers reflect a lagged response to regulatory changes in the
early and mid 90s, it is more plausible – and more in line with the view of market participants
– that the strong increase in merger activity in the early 90s correctly reflects the impact of the
Single Market Program, and the explosion in value in the late 90s the shift in banking focus in
response to the euro.
44 For a fuller picture see, for example, Berger, Kashyap and Scalise (1995) or Berger, Demsetz and Strahan(1999).45 Recall Table 4.2 for the recent evolution of cross-border bank balance sheet data.

38
This shift in focus has meant first and foremost the creation of larger banks, and second a
beginning cross-border expansion. Compared to other sectors, bank mergers throughout the
90s have been largely domestic; still in 1997/98, 70 % of all bank mergers in the European
community were domestic, compared to 51 % for all mergers. Yet, the number for 1997/98 is
down from 78 % over the period 1989-95, and preliminary data suggest that the downward
trend has continued in 1999.46 In fact, the recent evolution of bank mergers shows a kind of
“pecking order”, in which banks first merge nationally, then across borders inside restricted
geographic regions (such as the Benelux, the Scandinavian, or the Mediterranean countries),
and finally reach out across all of Europe.
The first of these three stages has been observed for several years now, the second seems to be
well on its way, and third shows its first signs.47 It is clear why a European bank’s first bids
for growth by acquisitions would naturally be made nationally, where mergers are easier in
terms of culture and regulation, and where they may also bring local market power - a
welcome relief from increasing competitive pressures. Yet, there is also a less obvious reason
for the prominence of domestic mergers, in that, maybe counter-intuitively, diversification
possibilities in Europe are almost as good within countries as they are across countries.48 This
is in contrast with the United States where states are more homogeneous, and diversification
benefits must be sought across state borders. In Europe, the benefits from consolidation that
have driven the U.S. merger wave can partly be obtained by merging within a country.
Asset management and investment banking are the areas of European banking most affected
by the euro. Both activities involve economies of scale that are likely to become more
important with the introduction of the single currency. These scale economies induce two
types of mergers: first, acquisitions with the purpose of buying human capital (teams) and
technology, and second acquisitions with the goal of enlarging and changing the stock of
assets under management. The first kind of merger, acquisitions designed to build expertise in
the technology and process of asset management, tend to be cross-border, often directed
towards U.S. and U.K.-based investment banks. The second type of merger does not need to
46 For these and other data see European Commission (1999a).47 With Deutsche Bank branching out in Italy and Spain among others, the Dexia model integrating smallerinstitutions in many European countries, and large merger talks such as Dresdner – BNP opening up morepossibilities.48 See Fatas (1997), Forni and Reichlin (1997), and Danthine, Giavazzi, Vives, and von Thadden (1999).

39
be cross-border, domestic acquisitions are good enough to build up volume. But the
international aspect is important for asset allocation: if investment and trading strategies shift
from a country allocation approach to a cross-country sectoral approach, as discussed in
Section 4.3, then international presence and expertise will be crucial for successful fund
management.
The same holds true for mergers and acquisitions. According to early data, 1999 has been a
record year in this business globally, and Europe an important contributor to the overall boom.
Given the pan-European consolidation across all sectors in the wake of EMU, investment
banks have no choice but to follow suit.
Until now there is disagreement on whether the transformation of European banking will
better be done in terms of universal or specialised banking. Economies of scope between
investment and commercial banking provide an organizational advantage to universal banks.
So despite the fact that early attempts at integrating commercial and investment banking
cultures have not been successful, the incentives of commercial banks will change. Relying on
the experience of past failures at building universal banks may not be a good way to think
about future developments.49
Few European banks will make it to the status of universal banks. But those that make it will
try to exploit the economies of scale across EMU fighting the battle with US universal banks
and specialized investment banks. The outcome is uncertain. European universal banks will be
boosted by the advantage of incumbency in most of the areas in which they are active. The
difficulty of integrating investment and commercial banking cultures is the strongest point in
favour of U.S. specialized institutions - and the biggest challenge for the new European
universal banks.
6. Conclusion
Within two years, between the end of 1997 and the end of 1999, the European financial
market has undergone a remarkable transformation. Part of it could have been expected as the
49 In a large study of European banks in 1995-96, Vander Vennet (1998) indeed finds that cost and profitefficiency has been higher in universal than specialised banks.

40
consequence of what we have termed the direct effects of the euro. The less immediate
potential consequences of the euro could not have been counted on, however. After one year
of the single currency, these indirect effects are collectively producing an outcome that
astonishes every observer and industry participant. This development is all the more
astonishing as the new European capital market suffered from a more than 15 per cent
depreciation of the euro against the dollar, a rather surprising event that is difficult to square
with fundamentals (see, for example, Portes, 1999).
Caution still needs to be exercised: further developments are needed, and are expected, in
order to produce a truly homogenized European capital market. But the reasons for optimism
abound. A corporate euro bond market has emerged whose issuing activity in 1999 has even
exceeded that of the dollar market. Issues in European equity have reached record highs, with
whole new markets becoming prominent internationally, such as the Neue Markt in Frankfurt
or Italy’s Nuovo Mercato. Europe-wide indices have been established. Portfolios begin to be
allocated along pan-European sectoral lines rather than on a country basis. Eurex, the German-
Swiss exchange founded in 1998, has not only caught up with other large exchanges, but by
the end of 1999 had overtaken the Chicago Board of Trade by a clear margin to become the
world’s largest derivative exchange. Banks all over Europe have merged or formed alliances
on an unprecedented scale, drastically changing the national banking environments and
beginning to create international firms and networks. Cross-border mergers in all industries
have increased strongly, giving rise to record volumes in the European M&A industry.
Of course, these developments have important precursors in the 90s as responses to the
process of European economic unification and the ongoing IT ‘revolution’. Yet, it is difficult
not to see the euro as the major drive behind the recent changes in the European financial
markets, accounting for their sometimes explosive growth. In this paper we have argued that
at least some of these changes may best be explained by a change of equilibrium, triggered by
the direct effects of EMU, but largely going beyond them. If the continuing fall of the euro on
the forex market does not discourage investors, and if these changes are compounded by an at
least partial shift from the dollar to the euro as lead currency on the international monetary
scene, EMU may well be considered as the single most important event in post-war monetary
history.

41
References
Adjaoute, Kpate and Jean-Pierre Danthine (1999), «The Euro and International DiversificationBenefits», mimeo, Université de Lausanne.
Adler, Michael and Bernard Dumas (1983), “International Portfolio Choice and CorporateFinance: A Synthesis”, Journal of Finance 38, 925-984.
Adler, Oliver (1996), “EMU and Banking”, Paper presented at the ICMB conference, GenevaNovember 1996.
Admati, Anat (1985), « A Noisy Rational Expectations Equilibrium for Multi-Asset SecurityMarkets », Econometrica 53, 629-657.
Altmann, Edward I. (1998), “The Anatomy of the High Yield Bond Market: After TwoDecades of Activity – Implications for Europe”, manuscript, New York University.
Altunbas, Y., E. Gardener, P. Molyneux, and B. Moore (1999), “Efficiency in EuropeanBanking”, Working Paper, University of Wales, Bangor.
Bank for International Settlements (1998): 68th Annual Report, Basel: BIS.
Bank for International Settlements (1999a): 69th Annual Report, Basel: BIS.
Bank for International Settlements (1999b): Central Bank Survey of Foreign Exchange andDerivatives Market Activity 1998, Basel: BIS, May 1999.
Bank for International Settlements (1999c): International Banking and Financial MarketDevelopments, Basel: BIS, August 1999.
Bank of England (1998), Practical Issues Arising from the Introduction of the Euro, variousissues.
Bergsten, Fred (1997), “The Impact of the Euro on Exchange Rates and International PolicyCoordination”, in P.R. Masson, T.H. Krueger, and B.G. Turtleboom (eds.), EMU and theInternational Monetary System, Washington, D.C.: International Monetary Fund.
Biais, Bruno, Thierry Foucault, and Pierre Hillion (1997), Microstructure des marchésfinanciers: institutions, modèles et tests, Presses Universitaires de France: Paris.
Bishop, Graham (1999), “New capital market opportunities in Euroland”. EuropeanInvestment Bank Papers, vol. 4 no. 1, 35-46.
Bolton, Patrick and Ernst-Ludwig von Thadden (1998), “Blocks, Liquidity, and CorporateControl”, Journal of Finance 53, 1-26.
Bottazi, Laura and Roni Hamaui (2000), “Is there a Home Bias Puzzle? Evidence from theEuropean Countries”, mimeo.

42
Boyd, John and Mark Gertler (1994), “Are Banks Dead? Or are the Reports GreatlyExaggerated?”, Federal Reserve of Minneapolis Quarterly Review 18, 3.
Brennan, Michael and Cao, Henry (1997), “International Portfolio Investment Flows”, Journalof Finance 52, 1851-1880.
Bundesbank (1999), Statistische Beihefte, Serie 2.
Cooper, Ian and Evis Kaplanis (1994), “Home Bias in Equity Portfolios, Inflation Hedging,and International Capital Markets Equilibrium”, Review of Financial Studies 7, 45-60.
Danthine, Jean-Pierre, Francesco Giavazzi, Xavier Vives, and Ernst-Ludwig von Thadden(1999), The Future of European Banking, CEPR: London.
Danthine, Jean-Pierre, Kpate Adjaouté, Laura Bottazzi, Andreas Fischer, Rony Hamaui,Richard Portes, and Mike Wickens (1999), “EMU and portfolio adjustment”, CEPR DraftFinal Paper EC contract II/10541.
Davis, Philip (1998), “Pension Fund Reform and European Financial Markets”, Paperpresented at the CEPR/ESI conference, Brussels September 1998.
De Santis, Giorgio, Bruno Gerard, and Pierre Hillion (1999), “The European single currencyand world equity markets”, in P. Hillion et al. (eds.), European Capital Markets with a SingleCurrency, Oxford University Press.
Economic Research Europe (1997): “A Study of the Effectiveness and Impact of InternalMarket Integration on the Banking and Credit Sector”, Brussels: European Commission.
The Economist (1999a), “A Survey of International Banking”, April 17, 1999.
The Economist (1999b), “Much Indebted to EU”, September 18, 1999.
European Central Bank (1998), The Monetary Policy in Stage 3, Frankfurt a.M.: ECB.
European Central Bank (1999a), Monthly Bulletin, January 1999, Frankfurt a.M.: ECB.
European Central Bank (1999b), “Possible Effects of EMU on the EU Banking System in theMedium to Long Term”, Frankfurt a.M.: ECB.
European Central Bank (1999c), “Improving Cross-Border Retail Payment Services in theEuro Area – the Eurosystem’s View”, Frankfurt a.M.: ECB.
European Central Bank (1999d), Monthly Bulletin, June 1999, Frankfurt a.M.: ECB.
European Central Bank (2000), Monthly Bulletin, April 2000, Frankfurt a.M.: ECB.
European Commission (1990), “One Europe, One Money”, European Economy 44.

43
European Commission (1997), Green Paper on Supplementary Pensions in the Single Market,Brussels: EC.
European Commission (1999a), “Mergers and Acquisitions”, European Economy,Supplement A, February.
European Commission (1999b), Financial Services Action Plan – Progress Report, Brussels:EC.
Fatas, Antonio (1997), “EMU: Countries or Regions? Lessons from the EMS Experience”,European Economic Review 41, 743-51.
Favero, Carlo, Alessandro Missale, and Gustavo Piga (2000), “EMU and Public DebtManagement: One Money, One Debt?”, CEPR Policy Paper 3, London.
Folkerts-Landau, David and Peter Garber (1992), “The European Central Bank: A Bank or aMonetary Policy Rule”, NBER Working Paper 4016.
Forni, M. and L. Reichlin (1997), “National Policies and Local Economies; Europe and theUnited States”, CEPR Discussion Paper 1632.
Frankel, Jeffrey (1996), “Exchange Rates and the Single Currency”, in: B. Steil (ed.), TheEuropean Equity Markets: The State of the Union and an Agenda for the Millenium,Copenhague: European Capital Markets Institute.
French, Kenneth and James Poterba (1991), “Investor Diversification and International EquityMarkets”, American Economic Review 81, 222-226.
Gehrig, Thomas (1993), « An Information Based Explanation of the Domestic Bias inInternational Equity Investment », Scandinavian Journal of Economics 95, 97-109.
Goldman Sachs (1998), The Goldman Sachs/Watson Wyatt EMU Survey – Summary ofResults”, Goldman Sachs Equity Derivatives Research, June 1998.
Gordon, Roger and Lans Bovenberg (1996), “Why is Capital so Immobile Internationally?Possible Explanations and Implications for Capital Income Taxation”, American EconomicReview 86, 1057-1075.
Gual, Jordi and Damien J. Neven (1993), “Deregulation of the European Banking Industry1980-91”, European Economy, Social Europe 3.
Hardouvelis, Gikas, Dimitrios Malliaropoulos and Richard Priestley, “EMU and EuropeanStock Market Integration”, CEPR Discussion Paper 2124.
Hartmann, Philipp (1998), Currency Competition and Foreign Exchange Markets, CambridgeUniversity Press, Cambridge (UK).
Hau, Harald (1999), “Information and Geography:Evidence from the German Stock Market”,CEPR Discussion Paper 2297.

44
Huteau, Guillaume (1997), “A Benchmark Swap Curve: The Full Convergence of Post-EMUSwap Curves”, Zürich: Crédit Suisse First Boston.
International Monetary Fund (1997), International Capital Markets, Washington, D.C.: IMF
Lohmann, Susanne (1998), “The Dark Side of European Monetary Union”, in Ellen Meade(ed.): The European Central Bank: How Decentralized? How Accountable? Lessons from theBundesbank and the Federal Reserve System, American Institute for Contemporary GermanStudies, Washington, D.C.
McCauley, Robert (1997), “The Euro and the Dollar”, Working Paper, Bank for InternationalSettlements.
McCauley, Robert and William White (1997), “The Euro and European Financial Markets”,in P.R. Masson, T.H. Krueger, and B.G. Turtleboom (eds.), EMU and the InternationalMonetary System, Washington, D.C.: International Monetary Fund.
Padoa-Schioppa, Tommaso (1999), “PSSS in EMU”, Speech, ECB.
Pagano, Marco (1989), “Trading Volume and Asset Liquidity”, Quarterly Journal ofEconomics 104, 255-274.
Pagano, Marco and Ailsa Roell (1990), “Trading Systems in European Stock Exchanges:Current Performance and Policy Options”, Economic Policy 5, 63-115.
Persaud, Avinash (1996), “The EMU Calculator”, Foreign Exchange Research, JP Morgan,London, October.
Portes, Richard (1999), “Global Financial Markets and Financial Stability: Europe’s Role”,manuscript, London Business School.
Portes, Richard and Hélène Rey (1998a), «The Euro and International Equity Flows», Journalof the Japanese and International Economies 12, 406-423.
Portes, Richard, and Hélène Rey (1998b), “The emergence of the euro as an internationalcurrency”, Economic Policy, 26, April, 1998, pp.307-343.
Ricerche e Studi (1998), International Financial Aggregates: 239 Companies, Milan.
Rowland, Patrick (1999), “Transactions Costs and International Portfolio Diversification”,Journal of International Economics 49, 145-170.
Saidenberg, Marc and Philipp Strahan (1999), “Are Banks still Important for Financing LargeBusinesses?”, Current Issues in Economics and Finance 5, 12, Federal Reserve Bank of NewYork.
Schinasi, Garry and Alessandro Prati (1997), “European Monetary Union and InternationalCapital Markets: Structural Implications and Risks”, in P.R. Masson, T.H. Krueger, and B.G.

45
Turtleboom (eds.), EMU and the International Monetary System, Washington, D.C.:International Monetary Fund.
Schure, Paul and Rien Wagenvoort (1999), “Economies of Scale and Efficiency in EuropeanBanking: New Evidence”, Report 99/01, European Investment Bank.
Scobie, Hannah (1997), The Cost and Timescale for the Switchover to the European SingleCurrency for the International Securities Market, London: European Economics and FinancialCentre.
Scobie, Hannah, G. Cagliesi, C. Valeur (1999), The Euro Bond Market, London: EuropeanEconomics and Financial Centre.
Svensson, Lars (1994), “Estimating and Interpreting Forward Interest Rates: Sweden 1992-94”, IMF Working Paper 94/114.
Tesar, Linda and Ingrid Werner (1995), “Home Bias and High Turnover”, Journal ofInternational Money and Finance 14, 467- 492.
Vander Vennet, Rudi (1998), “Cost and Profit Dynamics in Financial Conglomerates andUniversal Banks in Europe”, manuscript University of Ghent.
Walter, Ingo (1998), “The Global Asset Management Industry: Competitive Structure,Conduct and Performance”, Working Paper, INSEAD.
White, William (1998), “The Coming Transformation of the European Banking Industry”,Discussion Paper, BIS.

46
Figures and Tables
Table 2.1: Comparison of international capital markets, 1995 ($billion)
GDP Stock MarketCapitalisation
Bank Assets Debt SecuritiesPrivate Public Total
TotalAssets*
EU 11 6,804 2,119 11,972 3,084 3,910 6,993 21,084Denmark 173 56 156 188 142 330 542
Sweden 229 178 203 186 233 419 800Great Britain 1,106 1,408 2,424 396 430 826 4,658
United States 7,254 6,858 5,000 4,295 6,712 11,008 22,865Canada 566 366 516 93 589 682 1,565
Japan 5,114 3,667 7,382 1,876 3,450 5,326 16,375
Note: Total Assets = Stock Market Capitalisation + Bank Assets + Debt SecuritiesSource: Schinasi and Prati (1997)
Table 2.2: Size of international bond markets
Total bonds outstanding* Of which: government bondsU.S. 11, 656.45 7, 031.77Euro zone 6, 526.42 3, 577.49Japan 3, 958.94 2, 824.40Rest of the world 4, 369.43 2, 229.01World total 26, 511.24 15, 662.67
*Note: by country of origin of issuer, in $ billion, end of third quarter 1998Source: Scobie, Cagliesi, and Valeur (1999), based on unpublished BIS data

47
Table 2.3: Turnover of major stock exchanges (1996, ECUs million)
Domestic Foreign TotalLondon 335, 644 580, 777 916, 421Paris 220, 608 4, 828 225, 436Germany 621, 454 18, 778 640, 231
EU total 1, 669, 560 614, 006 2, 283, 566
New York 3, 014, 383 190, 392 3, 204, 775Nasdaq 2, 505, 177 98, 767 2, 603, 944Tokyo 738, 711 1, 214 739, 925
Source: Schinasi and Prati (1997)

48
Figure 2.1: Turnover of major interest rate derivatives
Source: BIS
0
2
4
6
8
10
93 94 95 96 97 98 99
Bund Eurex
Euro notionnel MATIF
Long gilt LIFFE
US T-bond CBOT
Long-term contracts
0
15
30
45
60
75
93 94 95 96 97 98 99
Three-month Sterling LIFFE
Euro Libor/Euribor LIFFE
Pibor/Euribor MATIF
Eurodollar CME
Short-term

49
Table 3.1: Foreign exchange markets and EMU
Average daily turnover in 1995($billions)
Average daily turnover in 1998($billions)
total Vs. US $ vs. EMUcurrencies
total vs. US $ vs. EMUcurrencies
US dollar 1,313.4 - 1,741.0 -EMU currencies 869.8 551.4 201.1 968.4 709.1 125.1
ECU 36.2 25.2 10.9 28.2 22.7 5.6Japanese yen 371.4 329.9 407.2 363.3British pound 139.7 102.8 211.9 159.4Total 1,571.8 1,313.4 1,981.6 1,741.0
Source: BISNote: The table is based on the triennial Central Bank Survey of Foreign Exchange andDerivatives Market Activity. It reports the average daily turnover (net of inter-dealer double-counting) in which a given currency appears on one side of a transaction, hence, each currencyis counted twice. The total (which also includes other currencies) is divided by two. Figuresinvolving EMU currencies (in italics) are estimated on the basis of exact data for Deutschemark, French franc, British pound, all other EMS, and ECU, using data on local currencytrading.

50
Table 3.2: Size, cross-border activity, and regulation of Europeanpension funds and life insurers
3.2a: Pension Funds
Country Assets in bnECU (1993)
Assets as % ofGDP (1993)
Foreign assets as% of total (1994)
Currencymatching rule
Austria n.a. n.a. 12 50 %Belgium 7 3.4 37 NoFinland n.a. n.a. n.a. 80 %France 41 3.4 4 NoGermany 106 5.8 6 80 %Ireland 18 40.1 39 n.a.Italy 12 1.2 5 33.3 %Luxembourg n.a. n.a. n.a. n.a.Netherlands 261 88.5 23 NoPortugal n.a. n.a. 6 NoSpain 10 2.2 3 NoMemo: UK 717 79.4 27 No
3.2b: Life Insurance
Country Assets in bnECU (1995)
Assets as % ofGDP (1995)
Foreign assets as% of total (1994)
Currencymatching rule
Austria 5 1.7 n.a. 80 %Belgium 6 2.9 n.a. 80 %Finland 6 6.3 n.a. 80 %France 317 30.0 0 NoGermany 379 20.5 n.a. 80 %Ireland n.a. n.a. n.a. n.a.Italy 31 3.7 10 80 %Luxembourg 5 37.6 n.a. n.a.Netherlands 138 45.6 6 80 %Portugal 3 3.9 n.a. 80 %Spain 18 4.2 n.a. 80 %Memo: UK 565 67.1 15 No
Sources: European Commission (1997), IMF (1997), OECD Insurance Statistics Yearbook,Davis (1998)

51
Table 4.1: Expected participation in EMU 1996 - 1998
Country Poll taken inJanuary
1996August1996
January 1997 August1997
January 1998
GermanyFranceNetherlandsBelgiumAustriaIrelandSpainFinlandPortugalItalyDenmarkSwedenUnited KingdomGreece
10097767979607
3602
507
220
1001001009593827
4843
421380
100100100100978831763219251340
10010010010096969091846716411
1001001001001001001009497997
1100
The polls of over 200 financial and economic forecasters indicate the percentage ofrespondents predicting that countries will join monetary union at the outset. Respondents’assumptions regarding the likely starting date differed. Luxembourg was not included in allpolls.
Sources: McCauley (1997), Consensus Economics

52
Table 4.2: International composition of euro area bank balance sheets
End 1997 End 1998 End 1999 Growth97-99 (%)
Total interbank claims(EUR bn)
4, 673 4, 964 5, 366
of whichDomestic (%) 63.2 64.5 64.5 17.2
Within euro area (%) 14.7 16.3 17.6 37.5
Total loans (EUR bn) 9, 758 10, 350 11, 070 of which
Domestic (%) 79.2 79.8 79.8 14.3Within euro area (%) 7.4 8.1 8.7 33.4
Total deposits (EUR bn) 9, 147 9, 780 10, 510 of which
Domestic (%) 75.4 74.4 72.8 10.9Within euro area (%) 9.6 10.2 10.3 23.3
Notes: Sample comprises all resident banking institutions in the euro area, defined as“Monetary Financial Institutions other than central banks” by the ECB. “Domestic” and“Within euro area” do not add up to 100, because business with the rest of the world isomitted.
Source: European Central Bank

53
Table 4.3: Government bond benchmark yields 1998-99, selected countries
Table 4.3a: 2 year bonds
01.08.98 01.10.98 01.12.98 01.02.99 01.04.99 01.06.99 01.08.99 01.10.99 01.12.99 01.02.00 01.04.00
Germany 3.887 3.297 3.257 2.886 2.845 2.841 3.479 3.765 3.986 4.368 4.441Austria 4.077 3.483 3.479 3.041 2.957 2.984 3.675 3.737 4.3 4.57 4.606Belgium 4.017 3.436 3.351 2.955 2.944 2.851 3.408 3.607 3.947 4.606 4.564France 3.997 3.405 3.306 2.934 2.857 2.928 3.466 3.747 4.113 4.376 4.363Ireland 4.508 3.563 3.355 2.959 2.884 3.009 3.52 3.911 3.979 4.324 4.35Italy 4.342 3.753 3.463 3.011 3.007 2.971 3.711 3.913 4.127 4.458 4.597Netherld. 3.97 3.477 3.37 2.95 2.951 2.925 3.483 3.904 4.192 4.472 4.477Spain 4.127 3.525 3.304 2.899 2.86 2.806 3.364 3.507 4.2 4.565 4.599max-min 0.621 0.456 0.222 0.155 0.162 0.178 0.347 0.406 0.353 0.282 0.256Max-min1 0.19 0.186 0.222 0.155 0.112 0.143 0.109 0.167 0.314 0.202 0.243
U.K. 6.697 5.442 5.213 4.784 4.807 5.191 5.786 6.227 6.219 6.444 6.33U.S. 5.464 4.146 4.429 4.642 4.988 5.514 5.605 5.705 6.018 6.566 6.427

54
Table 4.3b: 10 year bonds
01.08.98 01.10.98 01.12.98 01.02.99 01.04.99 01.06.99 01.08.99 01.10.99 01.12.99 01.02.00 01.04.00
Germany 4.617 3.791 3.94 3.644 3.982 4.173 4.939 5.14 5.136 5.505 5.219Austria 4.768 4.088 4.154 3.826 4.147 4.355 5.144 5.357 5.351 5.746 5.486Belgium 4.831 4.096 4.191 3.9 4.228 4.462 5.212 5.453 5.389 5.774 5.481France 4.724 3.968 4 3.747 4.101 4.333 4.864 5.225 5.304 5.677 5.368Ireland 4.862 4.1 4.122 3.844 4.053 4.284 4.986 5.388 5.269 5.627 5.353Italy 4.927 4.304 4.18 3.901 4.235 4.505 5.187 5.408 5.351 5.756 5.503Netherld. 4.704 3.942 4.022 3.785 4.118 4.375 5.02 5.316 5.245 5.592 5.339Spain 4.892 4.246 4.212 3.911 4.287 4.478 5.175 5.371 5.355 5.741 5.441Max-min 0.31 0.513 0.272 0.267 0.305 0.332 0.348 0.313 0.253 0.269 0.262Max-min1 0.151 0.297 0.214 0.182 0.165 0.202 0.28 0.217 0.215 0.241 0.262
U.K. 5.7 4.623 4.64 4.184 4.522 4.895 5.271 5.741 5.227 5.586 5.195U.S. 5.447 4.299 4.661 4.746 5.281 5.764 5.909 5.988 6.205 6.431 5.829
Notes: Figures in bold = maximum; left-centered and in italics = minimum. Max-min = difference between highest and lowest yield;max-min1: same when comparison is restricted to AAA rated countries (Germany, Austria, France and the Netherlands).
Source: Datastream

Table 4.4: Sovereign debt ratings and size of public bond markets
Table 4.4a: Country ratings
S & P’srating onJuly 1,1999
Moody’srating onJuly 1,1999
Moody’s last rating changes Governmentbonds outstan-ding, Sept. 98,in $ billion
on From on From
Germany 1 1 855.5France 1 1 660.4Netherlands 1 1 192.6Austria 1 1 102.0Luxembourg 1 1 1.1
Finland 3 1 4.5. 98 2 15.1. 97 3 84.3Ireland 2 1 4.5. 98 2 13.2. 97 3 31.4Belgium 2 2 225.1Spain 2 3 274.2Portugal 3 3 4.5. 98 3-4 10.2. 97 5 48.9Italy 3 4 3.7. 96 5 5.5. 93 4 1101.0
U.S. 1 1 7031.8
Note: For Moody’s, the ratings presented in the table are identical for all types of debt,except for Ireland in mid 90’s and Finland in 1997, where they refer to foreign currencydebt. For Standard & Poor’s, the ratings in 1999 are foreign currency ratings as of May 6,1998 (whenever foreign currency debt existed), except for Portugal (upgraded on15/12/98) and Spain (upgraded on 31/12/99).
Table 4.4b: Scale comparison of Moody’s and Standard & Poor’s investment grade ratings
Scale of 1 – 10 1 2 3 4 5 6 7 8 9 10S & P’s AAA AA+ AA AA- A+ A A- BBB+ BBB BBB-Moody’s Aaa Aa1 Aa2 Aa3 A1 A2 A3 Baa1 Baa2 Baa3
Source: Moody’s, Standard & Poor’s, Bank for International Settlements, Scobie, Cagliesi andValeur (1999)

56
Table 4.5: Bank debt of non-financial firms in different countries
all non-financialfirms 1993
239 largest manu-facturing firms 1996
Benelux 83.2 48.1France 80.2 44.3Germany 85.1 63.2Italy 94.6 73.9Spain 77.3 -
United Kingdom 49.4 34.1United States 32.4 9.4Japan - 56.4
Note: Numbers present shares of bank debt in total debt liabilitiesSource: Ricerche e Studi (1998)
Table 4.6 : Asset allocation and international diversification ofGerman investment funds 1990-1998
Year 1990 1991 1992 1993 1994 1995 1996 1997 1998Total assetsunder mana-gement (DMbillion)
220 262 279 370 399 462 572 785 1004
Equity (%) 20.2 20.7 21.9 27.7 27.8 27.0 30.3 37.9 41.9of whichdomestic
equity
80.8 77.7 77.1 73.8 71.3 72.7 68.9 63.2 48.7
Bonds (%) 67.0 69.3 68.6 63.6 63.5 64.5 61.8 54.4 50.3of whichdomestic
bonds
52.9 57.8 64.2 67.2 70.4 75.5 76.7 73.8 73.4
Other (%) 12.8 10.0 9.5 8.7 8.7 8.5 7.9 7.7 7.8
Source: Bundesbank (1999)

57
Table 4.7 : Net issuance of international debt securities by currency and residence region
1998 1999
Europe US dollar 68.6 32.8Euro 156.5 425.8Total 254.0 536.1
North America US dollar 257.2 383.8Euro 24.8 34.8Total 296.9 425.8
Others US dollar 83.7 53.5Euro 39.9 61.8Total 127.6 123.5
Total US dollar 409.4 470.1Euro 221.3 522.3All currencies 678.5 1085.4
Note: In billions of US dollars. Flow data for international bonds; for money marketinstruments and notes, changes in amount outstanding.
Source: BIS
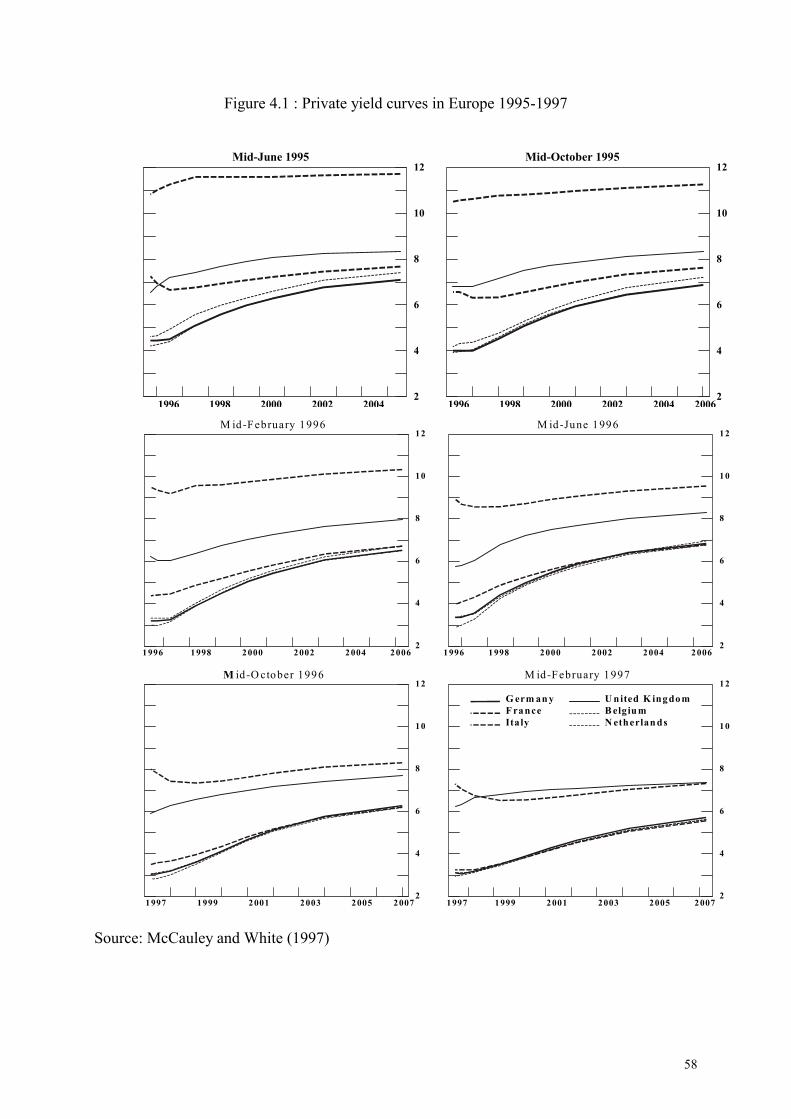
58
Figure 4.1 : Private yield curves in Europe 1995-1997
Source: McCauley and White (1997)
2
4
6
8
1 0
1 2
1996 1998 2000 2002 2004 2006
M id-February 1996
2
4
6
8
10
12
1996 1998 2000 2002 2004 2006
M id-June 1996
2
4
6
8
1 0
1 2
1 997 1999 2001 2003 2005 2007
M id -O ctober 1996
2
4
6
8
10
12
1997 1999 2001 2003 2005 2007
M id-February 1997
G erm an yF ranceItaly
U nited K ingdomB elgiu mN etherlan ds
2
4
6
8
10
12
1996 1998 2000 2002 2004
Mid-June 1995
2
4
6
8
10
12
1996 1998 2000 2002 2004 2006
Mid-October 1995

59
Figure 4.2: Implied euro area private yield curves 1998/99
Note: The curve represents implied forward overnight interest rates (percentages per annum)based on daily data.
Source: European Central Bank

60
Figure 4.3: Government Bond Yield Comparison Euroland – U.S.
Source: Bloomberg, Moody’s, Datastream.
U.S. States
Risk Ranking
76543210
10
-ye
ar
Go
vern
me
nt
Bo
nd
Yie
ld
5.40
5.30
5.20
5.10
5.00
VA/MN
NC
MD
GA MI/NJ
OH
FL
WI
TX
CA
CT
PA
MANY
=Aaa =Aa1 =Aa2 =Aa3 =A1 =A2
Euroland Countries
Risk Ranking
76543210
10-y
ear
Gove
rnm
ent B
ond Y
ield
5.80
5.70
5.60
5.50
5.40
GE
NL
FR
AU
BE
SP
IT
FIIR
=Aaa =Aa1 =Aa2 =Aa3 =A1 =A2

61
Figure 4.4: Share of foreign financial assets in total financial assets
0%
5%
10%
15%
20%
25%
1980 1981 1982 1983 1984 1985 1986 1987 1988 1989 1990 1991 1992 1993 1994 1995 1996 1997 1998 1999
UK
NETHERLANDS
GERMANY
FRANCE
ITALY
JAPAN
USA
SPAIN
Sources: Central Banks, OECD, U.S.Department of Commerce
Note: Annual data; 1999 data refer tojune 1999. 1998 and 1999 preliminary

62
Figure 5.1: Global Securitization Issuance
Source: Moody’s Investors Service
����������������������������
���������������������������������������������������������������
������������
������������
���������������������������������������
���������������������
��������������������������������
146
5 0.1 3
������������������������������������������
�����������������������������������������������������������������������������
��������������
����������
��������������������������������� ����
�������������������������������������
������������
��������������������������
155
90.3 6
����������������������������������������
������������������������������������������������������������������������������������������
������������
���������������������
������������������������
�����������������������
������������������������������������ �����
��������������������������������������
234
30
514
������������������������������������������������������������������������������
��������������������������������������������������������������������������������������������������������
����������
���������������
������������������������������
���������������������
�������������������������������������
����������������������������������
313
46
186
������������������������������������������������������������������������
������������������������������������������������������������������������������������������������������������������������������������������������������������������������������������
������������
���������
���������������������������
�����������������������
�������������������������� �����
��������������������������������������
454
47
2010
������������������������������������������������������������������������������������������������������������������������������
������������������������������������������������������������������������������������������������������������������������������������������������������������������������
����������
��������������������
��������������������������������������������
�������������������������
������������������������������
������������������
�����������������������������
526
6243
10
$0
$100
$200
$300
$400
$500
$600
1994 1995 1996 1997 1998 1999 (Est.)
����������
North America����������Europe����������Asia/Australia�����
Latin America
(US$ Billions)

63
Table 5.1: Profitability of Major Banks 1994-1998 1
Table 5.1a
Return on assets 2 Loan loss provisions
1994 1995 1996 1997 1998 1994 1995 1996 1997 1998France 0.17 0.27 0.32 0.37 0.27 0.63 0.39 0.20 0.30 0.23Germany 0.52 0.56 0.51 0.36 0.56 0.35 0.23 0.21 0.27 0.24Netherlands 0.69 0.72 0.80 0.81 0.60 n.a. n.a. 0.27 0.18 0.26Spain 0.70 0.79 0.84 0.99 1.07 0.52 0.45 0.42 0.36 0.38
Sweden 0.55 1.23 1.32 0.81 0.93 1.09 0.59 0.26 0.11 0.12Switzerland 0.63 0.52 -0.06 -0.11 0.46 0.30 0.33 0.72 0.29 0.15United Kingdom 1.22 1.27 1.22 0.99 1.19 0.31 0.34 0.21 0.21 0.25
United States 1.81 1.87 1.83 1.77 1.42 0.33 0.31 0.35 0.39 0.44
Japan 3 -0.21 -0.75 -0.54 0.00 -0.74 0.88 2.03 1.82 0.92 1.90
Table 5.1b
Net interest margin Operating costs
1994 1995 1996 1997 1998 1994 1995 1996 1997 1998France 1.60 1.54 1.09 1.07 0.63 2.04 2.00 1.40 1.43 0.95Germany 1.82 1.57 1.37 1.23 0.98 2.06 1.98 1.80 1.71 1.65Netherlands 2.27 2.18 2.20 2.06 1.90 2.17 2.26 2.38 2.40 2.32Spain 2.47 2.46 2.57 2.66 2.76 2.45 2.62 2.51 2.68 2.82
Sweden 2.34 2.39 1.99 1.83 1.46 1.76 1.81 1.55 1.61 1.57Switzerland 1.17 1.07 0.91 0.85 0.80 2.17 2.18 2.04 2.06 1.92United Kingdom 2.45 2.44 2.24 2.16 2.18 3.02 2.98 2.72 2.64 2.41
United States 3.57 3.35 3.44 3.19 3.03 3.80 3.49 3.85 3.62 3.93
Japan 3 0.90 1.01 1.16 1.28 1.07 0.74 0.74 0.93 1.13 1.00
Notes: 1 As a percentage of average total assets 2 Pre-tax profit 3 Fiscal years.
Source: BIS, IBCA

64
Table 5.2: Mergers and acquisitions in the banking sector 1
Value of transactionsNumber of transactions
in billions of US dollars as a % of all sectors 2
1991-92
1993-94
1995-96
1997-
983
1991-92
1993-94
1995-96
1997-98
1991-92
1993-94
1995-96
1997-98
U.S. 1,354 1,477 1,803 1,052 56.8 55.3 114.9 362.4 18.7 9.0 10.6 18.2Japan 22 8 14 28 0.0 2.2 34.0 1.1 0.3 18.8 21.6 4.1
Euro area4 495 350 241 203 17.5 14.6 19.1 100.4 8.3 9.3 11.2 27.1
Belgium 22 18 20 21 1.0 0.6 0.5 32.5 14.1 7.0 4.9 34.8 Finland 51 16 7 7 0.9 1.0 1.2 4.3 22.3 21.7 7.4 77.5 France 133 71 50 36 2.4 0.5 6.5 4.0 4.3 1.0 9.8 4.1 Germany 71 83 36 45 3.5 1.9 1.0 23.2 6.5 7.6 3.7 45.5 Italy 122 105 93 55 5.3 6.1 5.3 30.1 15.6 17.7 24.9 63.3 Netherlands 20 13 8 9 0.1 0.1 2.2 0.4 0.2 0.5 17.5 0.8 Spain 76 44 27 30 4.3 4.5 2.3 5.9 13.5 21.5 14.1 26.6
Sweden 38 23 8 8 1.1 0.4 0.1 2.1 3.8 2.0 0.3 7.1Switzerland 47 59 28 22 0.4 3.9 1.0 24.3 9.5 43.4 2.4 78.3U.K. 71 40 25 17 7.5 3.3 22.6 11.0 6.5 3.4 10.4 4.0
Total banks 2,098 2,032 2,162 1,360 84.7 83.2 200.8 534.2 11.7 8.5 11.0 18.9Memo item:Total non-banksfinancial
2,723 3,267 3,973 5,156 63.7 122.2 189.9 534.2 8.8 12.5 10.4 19.4
Notes: 1 Classified by the industry of the target; only completed or pending deals;announcement date volumes. 2 Of mergers and acquisitions in all industries. 3 As at 30October 1998. 4 Excluding Austria, Ireland, Luxembourg and Portugal.
Source: BIS
Copyright © 2022 FDOKUMEN