Financial Integration in the United Arab Emirates Stock Markets
19
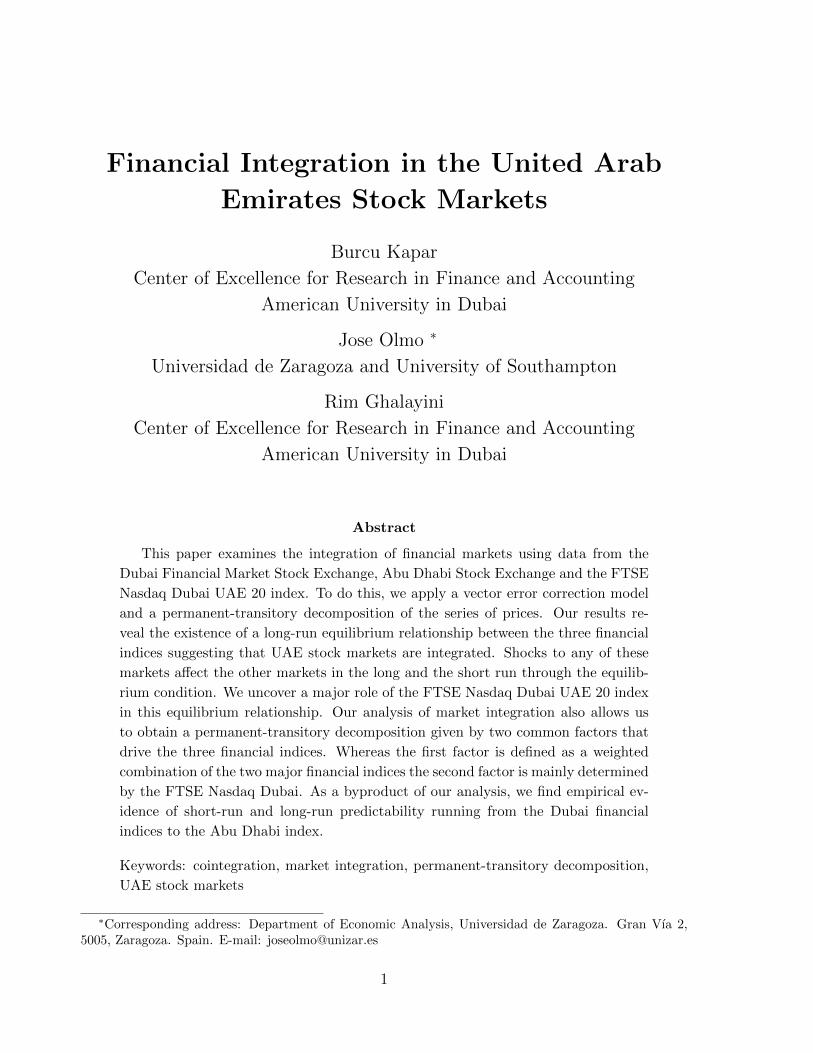
Financial Integration in the United Arab Emirates Stock Markets Burcu Kapar Center of Excellence for Research in Finance and Accounting American University in Dubai Jose Olmo * Universidad de Zaragoza and University of Southampton Rim Ghalayini Center of Excellence for Research in Finance and Accounting American University in Dubai Abstract This paper examines the integration of financial markets using data from the Dubai Financial Market Stock Exchange, Abu Dhabi Stock Exchange and the FTSE Nasdaq Dubai UAE 20 index. To do this, we apply a vector error correction model and a permanent-transitory decomposition of the series of prices. Our results re- veal the existence of a long-run equilibrium relationship between the three financial indices suggesting that UAE stock markets are integrated. Shocks to any of these markets affect the other markets in the long and the short run through the equilib- rium condition. We uncover a major role of the FTSE Nasdaq Dubai UAE 20 index in this equilibrium relationship. Our analysis of market integration also allows us to obtain a permanent-transitory decomposition given by two common factors that drive the three financial indices. Whereas the first factor is defined as a weighted combination of the two major financial indices the second factor is mainly determined by the FTSE Nasdaq Dubai. As a byproduct of our analysis, we find empirical ev- idence of short-run and long-run predictability running from the Dubai financial indices to the Abu Dhabi index. Keywords: cointegration, market integration, permanent-transitory decomposition, UAE stock markets * Corresponding address: Department of Economic Analysis, Universidad de Zaragoza. Gran V´ ıa 2, 5005, Zaragoza. Spain. E-mail: [email protected] 1
-
Upload
khangminh22 -
Category
Documents
-
view
0 -
download
0
Transcript of Financial Integration in the United Arab Emirates Stock Markets
Financial Integration in the United Arab
Emirates Stock Markets
Burcu Kapar
Center of Excellence for Research in Finance and Accounting
American University in Dubai
Jose Olmo ∗
Universidad de Zaragoza and University of Southampton
Rim Ghalayini
Center of Excellence for Research in Finance and Accounting
American University in Dubai
Abstract
This paper examines the integration of financial markets using data from the
Dubai Financial Market Stock Exchange, Abu Dhabi Stock Exchange and the FTSE
Nasdaq Dubai UAE 20 index. To do this, we apply a vector error correction model
and a permanent-transitory decomposition of the series of prices. Our results re-
veal the existence of a long-run equilibrium relationship between the three financial
indices suggesting that UAE stock markets are integrated. Shocks to any of these
markets affect the other markets in the long and the short run through the equilib-
rium condition. We uncover a major role of the FTSE Nasdaq Dubai UAE 20 index
in this equilibrium relationship. Our analysis of market integration also allows us
to obtain a permanent-transitory decomposition given by two common factors that
drive the three financial indices. Whereas the first factor is defined as a weighted
combination of the two major financial indices the second factor is mainly determined
by the FTSE Nasdaq Dubai. As a byproduct of our analysis, we find empirical ev-
idence of short-run and long-run predictability running from the Dubai financial
indices to the Abu Dhabi index.
Keywords: cointegration, market integration, permanent-transitory decomposition,
UAE stock markets
∗Corresponding address: Department of Economic Analysis, Universidad de Zaragoza. Gran Vı́a 2,5005, Zaragoza. Spain. E-mail: [email protected]
1
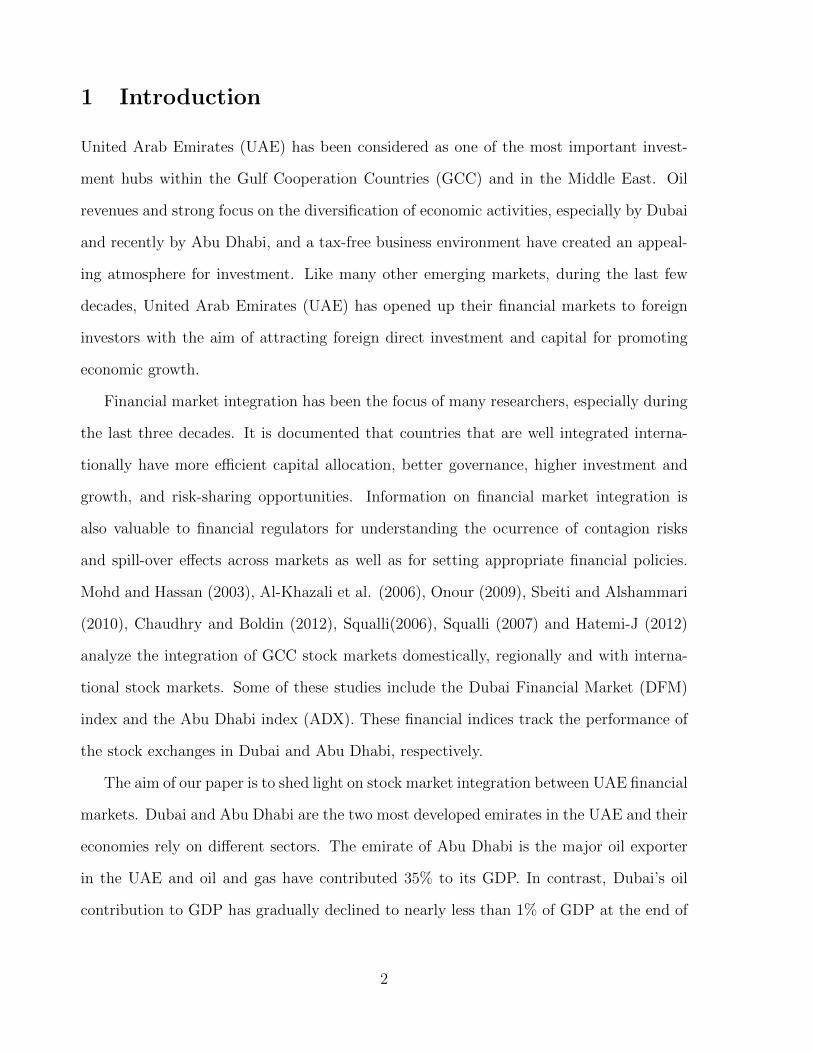
1 Introduction
United Arab Emirates (UAE) has been considered as one of the most important invest-
ment hubs within the Gulf Cooperation Countries (GCC) and in the Middle East. Oil
revenues and strong focus on the diversification of economic activities, especially by Dubai
and recently by Abu Dhabi, and a tax-free business environment have created an appeal-
ing atmosphere for investment. Like many other emerging markets, during the last few
decades, United Arab Emirates (UAE) has opened up their financial markets to foreign
investors with the aim of attracting foreign direct investment and capital for promoting
economic growth.
Financial market integration has been the focus of many researchers, especially during
the last three decades. It is documented that countries that are well integrated interna-
tionally have more efficient capital allocation, better governance, higher investment and
growth, and risk-sharing opportunities. Information on financial market integration is
also valuable to financial regulators for understanding the ocurrence of contagion risks
and spill-over effects across markets as well as for setting appropriate financial policies.
Mohd and Hassan (2003), Al-Khazali et al. (2006), Onour (2009), Sbeiti and Alshammari
(2010), Chaudhry and Boldin (2012), Squalli(2006), Squalli (2007) and Hatemi-J (2012)
analyze the integration of GCC stock markets domestically, regionally and with interna-
tional stock markets. Some of these studies include the Dubai Financial Market (DFM)
index and the Abu Dhabi index (ADX). These financial indices track the performance of
the stock exchanges in Dubai and Abu Dhabi, respectively.
The aim of our paper is to shed light on stock market integration between UAE financial
markets. Dubai and Abu Dhabi are the two most developed emirates in the UAE and their
economies rely on different sectors. The emirate of Abu Dhabi is the major oil exporter
in the UAE and oil and gas have contributed 35% to its GDP. In contrast, Dubai’s oil
contribution to GDP has gradually declined to nearly less than 1% of GDP at the end of
2
2018. Currently, the main revenues of Dubai are generated from tourism, real estate, trade
and financial services. Thus, the stock exchanges that are considered in this study operate
under very different economic conditions and business environments. These economies
are also separated geographically in different trading locations, and different listed stocks
coming from different industries. Hence, the disparity in the economic structures of these
emirates and the different regulations governing their financial markets imply that the
financial integration between these markets is far from obvious and needs to be formally
assessed. Our interest in this study is to assess this empirically and determine the common
drivers across markets.
To do this we analyse three financial indices that broadly represent the three main stock
exchanges based in the UAE: the Abu Dhabi stock exchange whose performance is tracked
by the ADX, the Dubai main stock exchange whose performance is tracked by the DFM
index, and Nasdaq Dubai stock exchange. We should note that unlike for the ADX and
DFM, there is no financial index that tracks the performance of the companies listed on the
Nasdaq Dubai Exchange. We proxy the performance of this stock exchange by the FTSE
Nasdaq Dubai UAE 20 index (FND). This financial index comprises 20 stocks admitted
for trading on Nasdaq Dubai, the Dubai Financial Market and the Abu Dhabi Securities
Exchange. The choice of this index implies that our analysis captures a combination of
market integration between the stock exchanges and information spillovers from the FND
to the ADX and DFM indices. We identify the existence of market integration with the
presence of a long-run equilibrium relationship between the time series of prices of the
different financial indices. The existence of a long-run equilibrium relationship between
these indices also entails a permanent-transitory (P-T) decomposition of the price process.
We focus on Gonzalo and Granger (1995)’s P-T decomposition. In this scenario, there is a
set of common factors following independent unit root processes that drive the permanent
component in each and every of the financial markets under investigation.
The findings of our empirical analysis with weekly data from April 2007 to October
3
2018 are threefold. First, our analysis of cointegration shows that the Abu Dhabi and
Dubai markets share a long-run equilibrium condition. In particular, we find a long-run
positive relationship between the DFM and the FND indices and a negative relationship
between the ADX and the DFM index. Second, the application of the Gonzalo-Granger
P-T decomposition uncovers two common factors that drive the dynamics of the three
prices. The first factor is a weighted combination of the ADX and DFM indexes and
the second factor is mainly determined by the dynamics of the FND index. The P-T
decomposition also allows us to find a permanent component that drives the long-run
dynamics of each price series. In particular, we find that the permanent component of the
ADX index is an equally weighted combination of the two common factors. The permanent
component of the DFM index depends more heavily on the second factor, suggesting a
strong contribution of the Nasdaq Dubai index in the long-run dynamics of the main Dubai
stock index. The permanent component of the FND index is mainly driven by the second
factor, highlighting the exogenous character of this financial index. Third, the presence of
market integration also allows us to find evidence of short-run predictability running from
the stock markets in Dubai (DFM and FND financial indices) towards the ADX index.
However, we do not find evidence of predictive ability of the ADX index on any of the two
Dubai financial indices.
The rest of the paper is organized as follows: In Section II we discuss the data and fit a
cointegrated error correction model for testing for the presence of market integration and
the presence of long-run causality between the UAE equity markets. Section III derives
the permanent-transitory decomposition of the series of prices, and analyzes the common
factors driving the permanent component of each series of prices. Section IV concludes
the paper and offers some policy implications.
4
2 Model description
2.1 Dataset
The sample considered for this study consists of weekly prices of the DFM, ADX and
FND financial indices. ADX, the largest of the three, was first established in November
2000. As of November 2018, there are 70 companies listed from ten industries with market
capitalization of $134.84 billion. The DFM started operating in March 2000 with securities
trading before expanding to a formal stock exchange. As of November 2018, there are 67
companies from ten industries listed with market capitalization of $101.05 billion. Nasdaq
Dubai, the smallest of the three, began operations in September 2005. It is an international
stock exchange open to domestic and foreign investors. As of November 2018, there are
nine listed companies coming from five different industries with market capitalization of
$4.23 billion. The dataset is obtained from Thomson Reuters Eikon for the period from
19 April, 2007 to 18 October, 2018. Figure 1 illustrates the dynamics of the three stock
market indices over this period. The charts report very similar patterns across the entire
period with only small differences in the last year.
[INSERT FIGURE 1 ABOUT HERE]
2.2 Vector error correction model
The following vector error correction model (VECM) allows us to gauge the existence of
convergence between the different financial indices representing the stock markets in Abu
Dhabi and Dubai. A typical representation of the VECM is
∆Yt = αZt−1 +
p∑i=1
Γi∆Yt−i + εt, (1)
where Y = (pADX , pDFM , pFND)′ with p denoting the log-price of Abu Dhabi Stock Ex-
change Index, the log price of Dubai Financial Market Index and the log price of FTSE
5
Nasdaq Dubai 20 UAE, respectively. We interpret integration between the three mar-
kets as the existence of an equilibrium condition between the price of the three financial
indices. In model (1) this is reflected in the error correction variable Zt = β′Yt with β
denoting the cointegrating vector and α the vector of loadings that measures the speed
of convergence of individual prices to the equilibrium condition establishing market inte-
gration. The quantity ∆Yt represents the variables in first differences (financial returns).
The matrices Γi capture the short-run Granger-casual relationships between the variables
in first differences. The random vector εt denotes the error term of the cointegrated VAR
model (1).
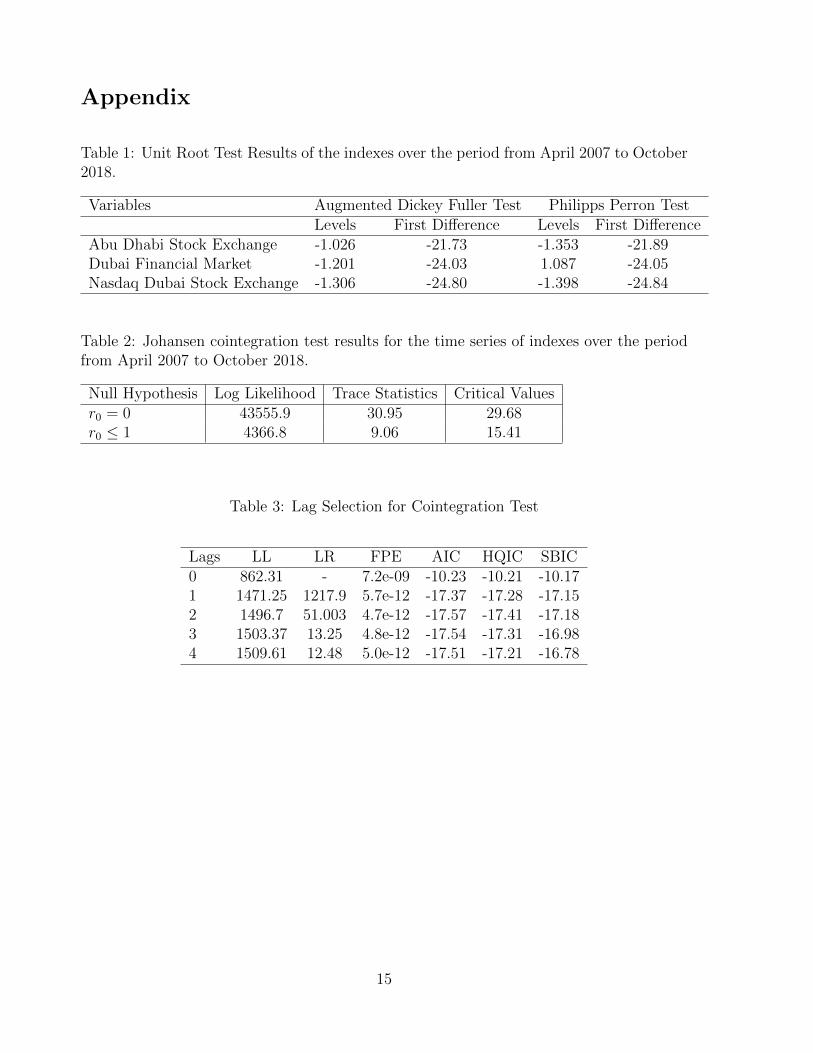
Table 1 presents the results of unit root tests (Augmented Dickey Fuller (ADF) and
Phillips and Perron (P-P)) for the sample under study. Both tests provide statistical
evidence for not rejecting the null hypothesis of non-stationarity and accepting, in turn,
the unit root hypothesis for all series. Tables 2 and 3 present different statistics based on
the cointegration methodology introduced in Johansen (1988, 1991). The results provide
evidence of a single cointegration relationship between the variables in the system with the
optimal number of lags equal to two, which is decided according to the Akaike Information
Criteria (AIC) and Akaike’s Final Prediction Error Criterion (FPE). This is reported in
Tables 2 and 3, respectively. Table 4 presents the estimation of the model parameters.
[INSERT TABLES 1 TO 4 ABOUT HERE]
The cointegration vector β characterizes the following variable Zt that is stationary by
construction:
Zt ≡ pDFM + 2.57(0.72)
pADX − 3.00(0.49)
pFND − 5.39. (2)
Market integration entails equilibrium between the different financial indices such that
Zt = 0. In this case the above condition implies that the long-term relationship between
prices is
pDFM = −2.57(0.72)
pADX + 3.00(0.49)
pFND + 5.39. (3)
6
Expression (3) shows that the DFM index is given by a linear combination of the FND
index and the ADX index. This analysis uncovers a long-run positive relationship between
the DFX and the FND indices and a negative relationship between the ADX and the DFM
index. The FND index seems to be positively related to both major financial indices.
An interesting implication of the vector error correction model is the possibility of
testing for long-run causality from the equilibrium condition Zt−1 to the series. More
formally, a statistically significant parameter α suggests that departures of Zt from zero
have predictive ability for the dynamics of the return process ∆Yt+1. That is, a negative
value of the parameter α entails mean reversion to the equilibrium condition (3). The
magnitude of the parameter α measures the speed of convergence of the process to restore
equilibrium in the system. The vector of α coefficients corresponding to the above VECM
with one lag is
α =
(−0.014(0.006)
,−0.010(0.004)
,−0.003(0.007)
)
)′. (4)
These results suggest that positive values of Zt, for example due to an abnormal increase
in the price of DFM not corresponded by the rest of variables in the system, yield a
negative correction of the price of DFM (α1 = −0.014), ADX (α2 = −0.010) and FND
(α3 = −0.003, but not significant) in the next period. According to these estimates, we
can say that the FTSE Nasdaq Dubai 20 UAE is an exogenous index with dynamics not
affected by departures from the equilibrium condition (3).
We also check whether the three series considered in the study Granger-cause each
other or not in the VECM setting. Granger-causality analyses the existence of predictive
ability of past returns on the ADX, DFM and FND financial returns. Under the efficient
market hypothesis, we should not expect statistical significance of past returns on current
returns. However, the results in Table 5 partly contradict these theoretical insights since
we find that both DFM and FND Granger-cause ADX and both DFM and ADX Granger-
cause FND. The ADX index, on the other hand, has no effect on the returns on the DFM
7
index although ADX has more listed companies in the index, trading volume is higher and
market capitalization stronger than for the other financial indices. Compared to ADX,
DFM has higher liquidity and the index is more open to foreigners. These two facts
could be determining the leadership of the DFM market. These findings are in line with
the existing empirical literature. Thus, examining return and volatility spillover effects
between DFM and ADX, Maghyereh and Awartan (2012) suggest that there is a significant
lead-lag relationship between the UAE national markets in which the DFM is playing the
dominant role in transmitting information.
[INSERT TABLE 5 ABOUT HERE]
An alternative view on the practical importance of these empirical findings is from the
point of view of an international investor. The presence of cointegration between these
markets entails the existence of a long-run relationship and, more specifically, implies
that the three markets are driven in the long run by the same shocks. This implies
that whereas each market can be driven in the short-run by idiosyncratic shocks, in the
long-run the three markets will move together according to the long-run relationships
found above. These joint dynamics have negative implications on portfolio diversification
for international investors aiming to invest in the stock markets in the region. This is so
because the three markets move together in the long run and, hence, the potential benefits
of diversification are drastically reduced if one plans to develop investment portfolios that
are fully invested on the DFM, FND and ADX financial indices.
To undersdand the effect of these shocks we have estimated the impulse response
functions corresponding to the VECM estimated above. This is obtained by calculating
the impulse response functions (IRFs) of the corresponding VECM. We should note that
unlike for stationary VAR models, the IRFs of VECM do not always die out. This is
because the non-stationary unit root variables modelled in a cointegrating VECM are not
mean-reverting. In this model, shocks to VECM can give rise to two different scenarios.
8
When the effect of a shock dies out over time, the shock is said to be transitory. When
the effect of a shock does not die out over time, the shock is said to be permanent.
Interestingly, the IRFs reported in Figure 2 are calculated for orthogonalized shocks and
present an scenario in which all shocks to the different variables are permanent. In most
cases, the shocks have a positive permanent effect that slightly increases over time. Shocks
to the ADX market are more complex to analyze. The effect of an orthogonalized shock
to the ADX index has a negative permanent effect. In contrast, the same shock has a
positive and decreasing effect on the FND index suggesting that the shock is transitory.
[INSERT FIGURE 2 ABOUT HERE]
3 Permanent-transitory decomposition
The above cointegration model can be further exploited to disentangle the permanent and
transitory components of the different financial indices and also for assessing empirically
the advantages of market integration for forecasting ability. This can be done by applying
under minimal restrictions the P-T decomposition of Gonzalo and Granger (1995). In this
decomposition the transitory component is a linear combination of the error-correction
term Zt in (1) whereas the permanent component is characterized by a set of common
factors ft that exhibit unit root behavior and drive the long-term dynamics of prices of
the financial indices characterizing the stock markets in the UAE.
3.1 Permanent-transitory decomposition
We follow Gonzalo and Granger (1995) P-T decomposition to identify the common factors
that define the permanent component. This is achieved by imposing the following two
conditions: i) the factors are linear combinations of the original variables Yt and ii) the
transitory component does not have predictive ability on the common factors. Under
these two conditions the only linear combinations of the original variables such that the
9
transitory component has no long-run impact on them are
ft = α′⊥Yt, (5)
with α⊥ defined in our application by a 3 × 2 matrix satisfying α′⊥α = 0. This represen-
tation indicates that there are two common factors that drive the dynamics of the three
financial indices. Once the common factors ft are identified the P-T decomposition of Yt
is obtained as a linear combination of the factors ft with loadings A1 and a transitory
component given by the cointegrating vector Zt with loadings A2. More formally, for the
vector Yt the corresponding P-T decomposition is
Yt = Y ∗t + A2Zt, (6)
with Y ∗t = A1ft the vector of efficient prices that capture the permanent component of each
of the three financial indices. In this decomposition the matrix A1 contains the sensitivity
of each price to the common factors such that A1 = β⊥(α′⊥β⊥)−1 with β⊥ a 3 × 2 vector
satisfying that β′⊥β = 0. Similarly, the matrix A2 is defined as A2 = α(β′α)−1. The factors
ft contain the linear combinations of ∆Yt that have the common feature of not containing
the levels of the error correction term Zt in them. For more details on the method the
interested reader is referred to Gonzalo and Granger (1995).
Table 6 reports the parameter estimates of the above decomposition. More specifically,
the left panel of Table 6 reports the coefficients of the matrix α⊥ defining the common fac-
tors and the right panel reports the coefficients of the factor loadings A1 characterizing the
permanent component of Yt. The reported parameter values are constructed using the esti-
mates of the vector error correction model specification fitted in the previous section. The
results show that there are two common factors driving the dynamics of the three series.
The common factors are driven by a linear combination of the three variables. The first
factor, determined by the vector (−0.57, 0.81,−0.05), gives a prominent role to the ADX
10
and the DFM such that the factor can be characterized as f1t ≈ −0.57ADXt+0.81DFMt.
Similarly, the second factor that is determined by the vector (−0.18,−0.05, 0.98) gives a
much more prominent role to the FND index such that we can approximate the dynamics
of the factor by f2t ≈ −0.18ADXt + 0.98FNDt. Thus, whereas the first factor is mainly
driven by the dynamics of the major UAE indices, the second factor is driven to a large
extent by the smaller and more specialized FTSE Nasdaq Dubai index.
[INSERT TABLE 6 ABOUT HERE]
These findings can be applied to disentangle the dynamics of the efficient price vector
Y ∗t , characterized by the estimated matrix A1 and the common factors ft. The right panel
of Table 6 shows that the permanent component of the ADX index is an equally weighted
combination of the two common factors. Interestingly, this combination assigns a major
role to the dynamics of the FTSE Nasdaq Dubai 20 UAE index for its dynamics are a
major determinant of the second factor. In contrast, the permanent component driving
the dynamics of the DFM index depend more heavily on the second factor than on the
first factor. This finding provides further evidence on the importance of the FTSE Nasdaq
Dubai index for understanding the dynamics of the UAE stock exchanges.
Figure 3 illustrates the good approximation of the common factors to each of the
financial indices. The difference between the actual price series Yt and the permanent
decomposition Y ∗t defines the stationary component of each financial index.
[INSERT FIGURE 3 ABOUT HERE]
4 Conclusions
This paper examines the integration of financial markets using data from the main three
UAE financial indices. The results reveal the existence of a long-run equilibrium rela-
tionship between the three financial indices suggesting that UAE stock markets are inte-
grated. Shocks to any of these markets affect the other markets in the long and the short
11
run through the equilibrium condition. In the short-run, we also find empirical evidence
of predictability running from the Dubai financial indices (Dubai Financial Market and
FTSE Nasdaq Dubai UAE 20) to the Abu Dhabi ADX index. Information is first incor-
porated into stock prices of the DFM and FND indices and then into stocks of the ADX
index. In the long-run, we also find a superior predictive ability of the forecasting method
that exploits the presence of cointegration between the series of log-prices compared to
forecasts only relying on the history of prices of each financial index.
Our analysis of cointegration also allows us to uncover the existence of two common
factors that drive the three financial indices. In particular, the first factor is determined
by a weighted combination of the ADX and DFM index and the second factor is mainly
determined by the FND index. Interestingly, the FND index is exogenous to the system of
prices suggesting that the short-run dynamics of its returns are not statistically affected
by departures from the equilibrium condition.
This study also allows us to draw implications for investment in UAE financial markets
and policy. For the former, the presence of a long-run equilibrium condition between
the different financial indexes suggests that portfolio diversification in the context of the
UAE stock markets should bring little or no benefits to investors with long-term horizons.
In contrast, the existence of Granger-causality suggests that short-term gains remain a
possibility. For the latter, a major implication for policy is to increase the participation
of foreign investors as well as to limit the effect of government stock ownership. This will
lessen the direct government intervention in the stock market, lead to greater liberalization
of trade and hence higher levels of market efficiency. Knowing the degree of financial
integration within the stock markets in UAE is also important for investors and regulators.
For investors, it is important to understand the implications in portfolio diversification
activities. For regulators, it is important in order to assess the presence of contagion risk
and spill-over effects across markets as well as in terms of setting appropriate financial
regulations and policies.
12
We only focus on UAE markets, however, our approach can be extended to assess the
long-run relationship of these markets with major economies such as US, Europe or China.
In this study we have found a linear long-run relationship between the financial indices,
however, for other countries in which the economic and financial links with the UAE are
not immediate, we may need to resort to nonlinear techniques that uncover regime-specific
causality relationships, see for example Hatemi-J (2012).
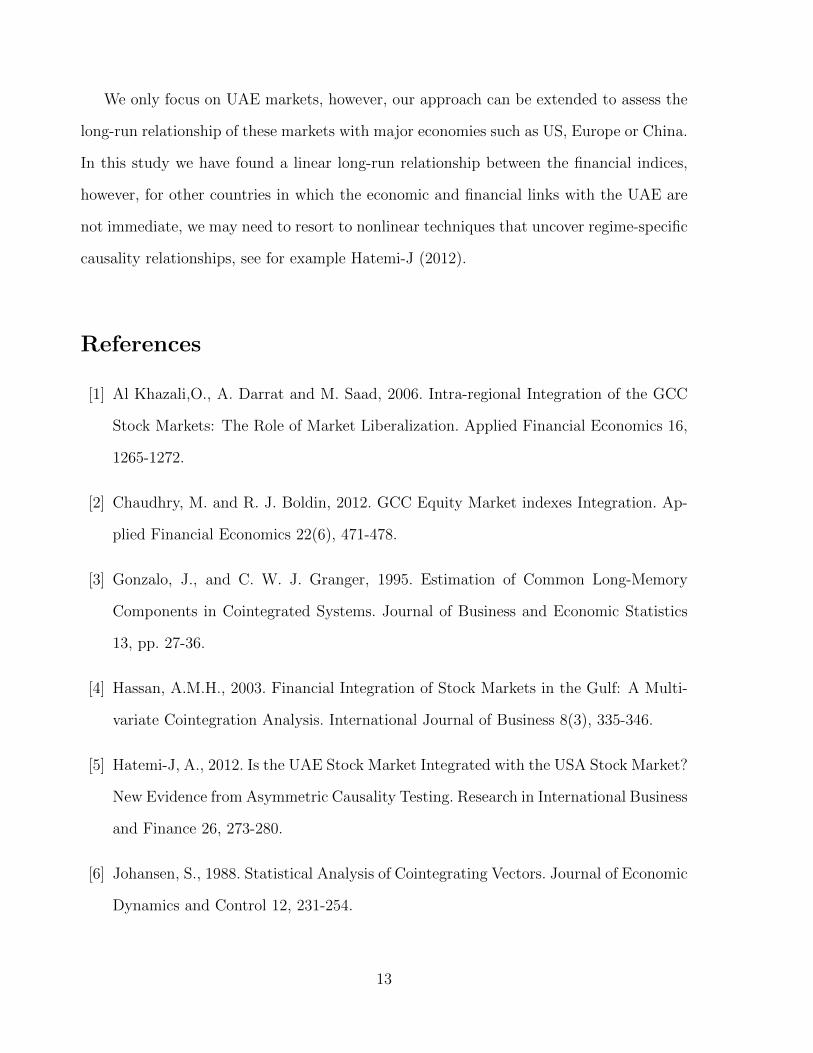
References
[1] Al Khazali,O., A. Darrat and M. Saad, 2006. Intra-regional Integration of the GCC
Stock Markets: The Role of Market Liberalization. Applied Financial Economics 16,
1265-1272.
[2] Chaudhry, M. and R. J. Boldin, 2012. GCC Equity Market indexes Integration. Ap-
plied Financial Economics 22(6), 471-478.
[3] Gonzalo, J., and C. W. J. Granger, 1995. Estimation of Common Long-Memory
Components in Cointegrated Systems. Journal of Business and Economic Statistics
13, pp. 27-36.
[4] Hassan, A.M.H., 2003. Financial Integration of Stock Markets in the Gulf: A Multi-
variate Cointegration Analysis. International Journal of Business 8(3), 335-346.
[5] Hatemi-J, A., 2012. Is the UAE Stock Market Integrated with the USA Stock Market?
New Evidence from Asymmetric Causality Testing. Research in International Business
and Finance 26, 273-280.
[6] Johansen, S., 1988. Statistical Analysis of Cointegrating Vectors. Journal of Economic
Dynamics and Control 12, 231-254.
13

[7] Johansen, S., 1991. Estimation and Hypothesis Testing of Cointegration Vectors in
Gaussian Vector Autoregressive Models. Econometrica 59, 1551-1580.
[8] Maghyereh, A. and B. Awartan , 2012. Return and Volatility Spillovers between Dubai
Financial Market and Abu Dhabi Stock Exchange in the UAE, Applied Financial
Economics Letters 22, 837-848.
[9] Mohd, A. and H. Hassan, 2003. Financial Integration of Stock Markets in the Gulf:
A Multivariate Cointegration Analysis. International Journal of Business 8(3).
[10] Onour, I. A., 2009. Financial Integration of GCC Capital Markets: Evidence of Non-
Linear Cointegration. Afro-Asian Journal of Finance and Accounting 1(3), 251-265.
[11] Sbeiti, W. and T. Alshammari, 2010. Integration of Stock Markets in the GCC Coun-
tries: An Application of the ARDL Bounds Testing Model. Euopean Journal of Eco-
nomics, Finance and Administrative Sciences 20.
[12] Squalli, J., 2006. A Non-parametric Assessment of Weak-Form Efficiency in the UAE
Financial Markets. Applied Financial Economics 16, 1365-1373.
[13] Squalli, J., 2007. Sectoral Integration and Causality Analyses of the UAE Financial
Markets. Applied Financial Economics Letters 3, 327-334.
14
Appendix
Table 1: Unit Root Test Results of the indexes over the period from April 2007 to October2018.
Variables Augmented Dickey Fuller Test Philipps Perron TestLevels First Difference Levels First Difference
Abu Dhabi Stock Exchange -1.026 -21.73 -1.353 -21.89Dubai Financial Market -1.201 -24.03 1.087 -24.05Nasdaq Dubai Stock Exchange -1.306 -24.80 -1.398 -24.84
Table 2: Johansen cointegration test results for the time series of indexes over the periodfrom April 2007 to October 2018.
Null Hypothesis Log Likelihood Trace Statistics Critical Valuesr0 = 0 43555.9 30.95 29.68r0 ≤ 1 4366.8 9.06 15.41
Table 3: Lag Selection for Cointegration Test
Lags LL LR FPE AIC HQIC SBIC0 862.31 - 7.2e-09 -10.23 -10.21 -10.171 1471.25 1217.9 5.7e-12 -17.37 -17.28 -17.152 1496.7 51.003 4.7e-12 -17.57 -17.41 -17.183 1503.37 13.25 4.8e-12 -17.54 -17.31 -16.984 1509.61 12.48 5.0e-12 -17.51 -17.21 -16.78
15
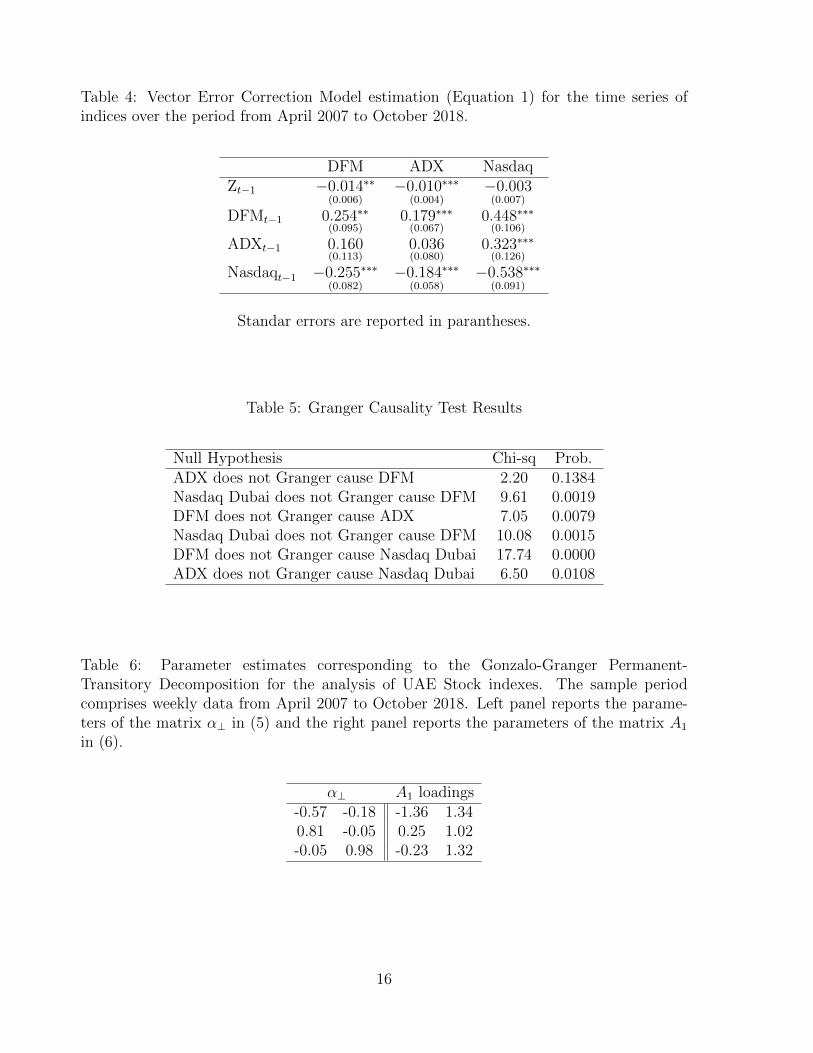
Table 4: Vector Error Correction Model estimation (Equation 1) for the time series ofindices over the period from April 2007 to October 2018.
DFM ADX NasdaqZt−1 −0.014∗∗
(0.006)−0.010∗∗∗
(0.004)−0.003(0.007)
DFMt−1 0.254∗∗(0.095)
0.179∗∗∗(0.067)
0.448∗∗∗(0.106)
ADXt−1 0.160(0.113)
0.036(0.080)
0.323∗∗∗(0.126)
Nasdaqt−1 −0.255∗∗∗(0.082)
−0.184∗∗∗(0.058)
−0.538∗∗∗(0.091)
Standar errors are reported in parantheses.
Table 5: Granger Causality Test Results
Null Hypothesis Chi-sq Prob.ADX does not Granger cause DFM 2.20 0.1384Nasdaq Dubai does not Granger cause DFM 9.61 0.0019DFM does not Granger cause ADX 7.05 0.0079Nasdaq Dubai does not Granger cause DFM 10.08 0.0015DFM does not Granger cause Nasdaq Dubai 17.74 0.0000ADX does not Granger cause Nasdaq Dubai 6.50 0.0108
Table 6: Parameter estimates corresponding to the Gonzalo-Granger Permanent-Transitory Decomposition for the analysis of UAE Stock indexes. The sample periodcomprises weekly data from April 2007 to October 2018. Left panel reports the parame-ters of the matrix α⊥ in (5) and the right panel reports the parameters of the matrix A1
in (6).
α⊥ A1 loadings-0.57 -0.18 -1.36 1.340.81 -0.05 0.25 1.02-0.05 0.98 -0.23 1.32
16
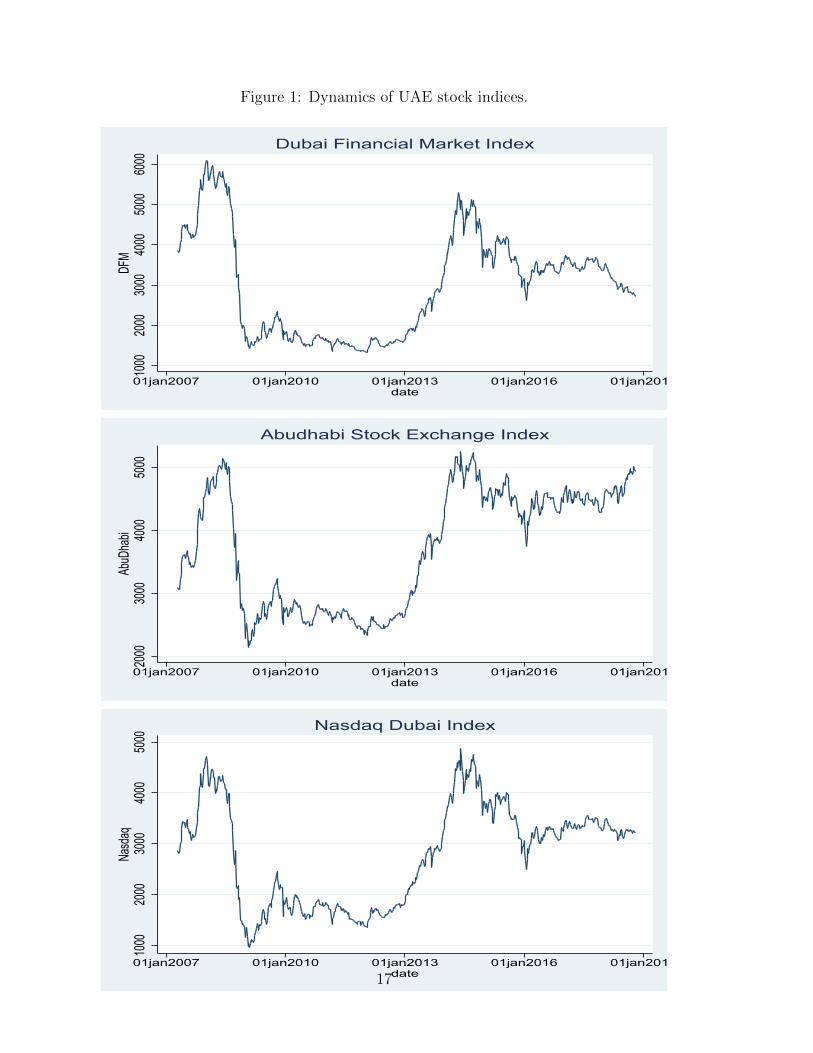
Figure 1: Dynamics of UAE stock indices.
1000
2000
3000
4000
5000
6000
DFM
01jan2007 01jan2010 01jan2013 01jan2016 01jan2019date
Dubai Financial Market Index20
0030
0040
0050
00Ab
uDha
bi
01jan2007 01jan2010 01jan2013 01jan2016 01jan2019date
Abudhabi Stock Exchange Index
1000
2000
3000
4000
5000
Nasd
aq
01jan2007 01jan2010 01jan2013 01jan2016 01jan2019date
Nasdaq Dubai Index
17
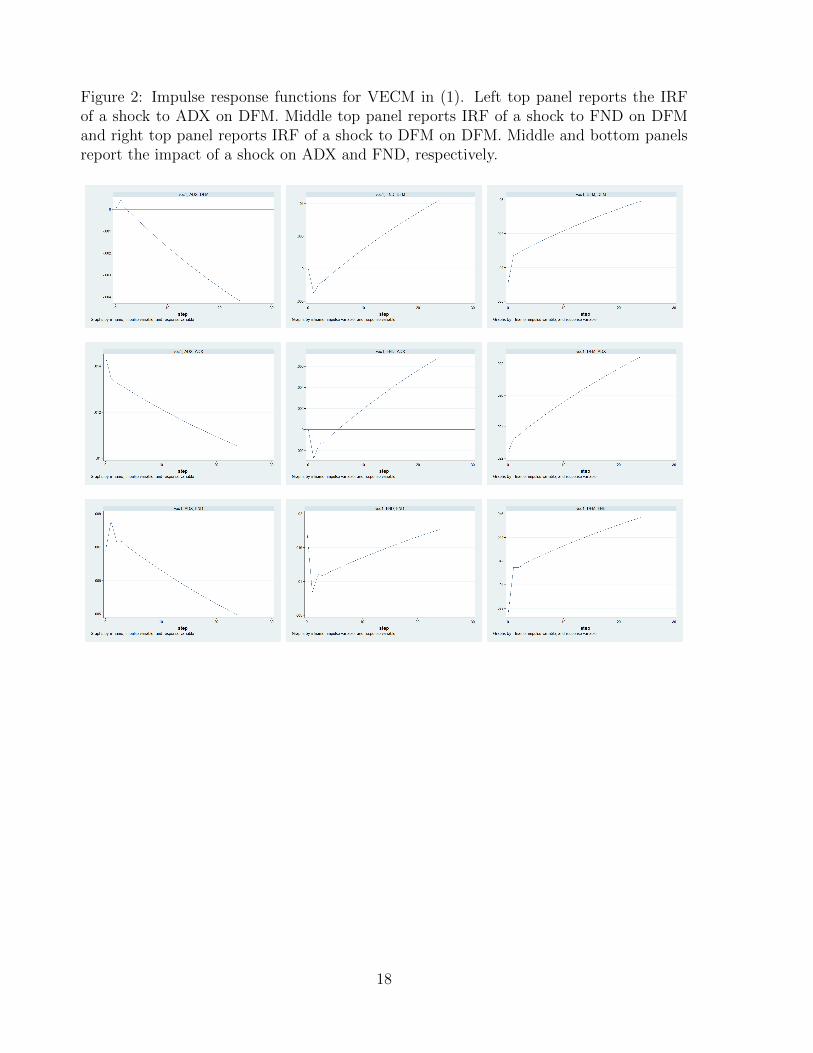
Figure 2: Impulse response functions for VECM in (1). Left top panel reports the IRFof a shock to ADX on DFM. Middle top panel reports IRF of a shock to FND on DFMand right top panel reports IRF of a shock to DFM on DFM. Middle and bottom panelsreport the impact of a shock on ADX and FND, respectively.
18
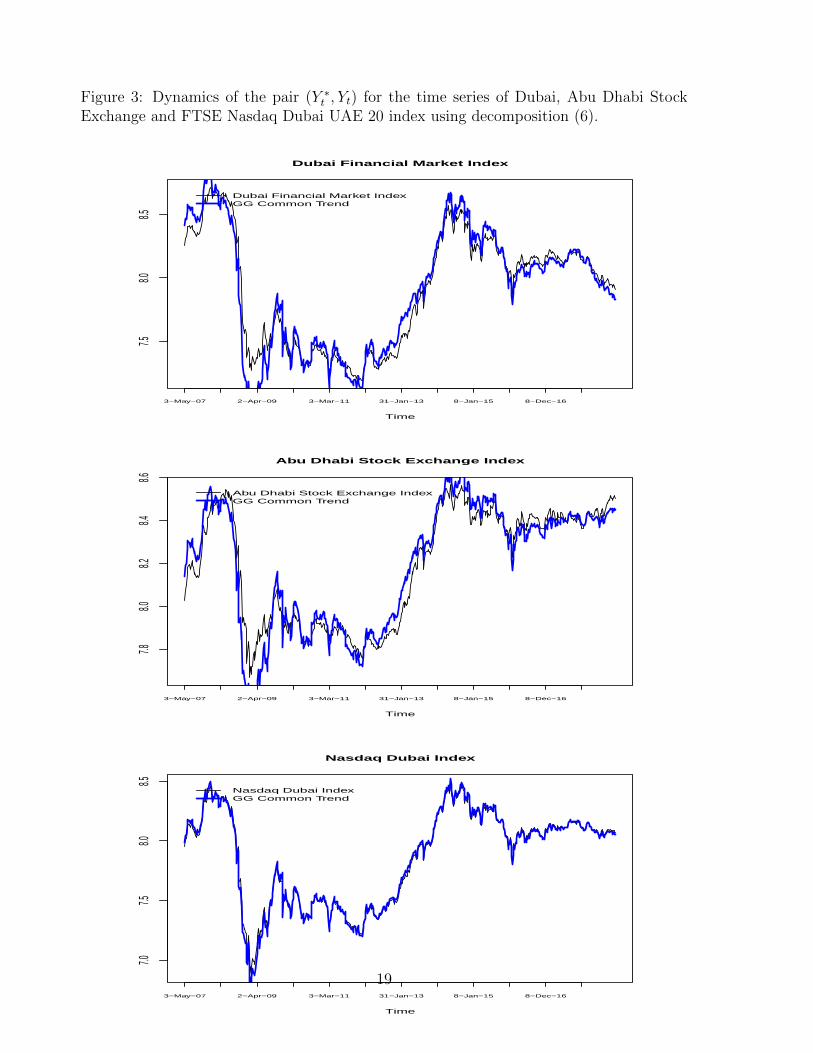
Figure 3: Dynamics of the pair (Y ∗t , Yt) for the time series of Dubai, Abu Dhabi StockExchange and FTSE Nasdaq Dubai UAE 20 index using decomposition (6).
Time
3−May−07 2−Apr−09 3−Mar−11 31−Jan−13 8−Jan−15 8−Dec−16
7.58.0
8.5Dubai Financial Market Index
Dubai Financial Market IndexGG Common Trend
Time
3−May−07 2−Apr−09 3−Mar−11 31−Jan−13 8−Jan−15 8−Dec−16
7.88.0
8.28.4
8.6
Abu Dhabi Stock Exchange Index
Abu Dhabi Stock Exchange IndexGG Common Trend
Time
3−May−07 2−Apr−09 3−Mar−11 31−Jan−13 8−Jan−15 8−Dec−16
7.07.5
8.08.5
Nasdaq Dubai Index
Nasdaq Dubai IndexGG Common Trend
19