
Developing Insurance Markets Use of Financial Health and ...
188
Developing Insurance Markets Use of Financial Health and Stability Indicators in Insurance Supervision March 2020 Michael Hafeman Public Disclosure Authorized Public Disclosure Authorized Public Disclosure Authorized Public Disclosure Authorized
-
Upload
khangminh22 -
Category
Documents
-
view
1 -
download
0
Transcript of Developing Insurance Markets Use of Financial Health and ...

Developing Insurance Markets
Use of Financial Health and Stability Indicators
in Insurance Supervision
March 2020
Michael Hafeman
Pub
lic D
iscl
osur
e A
utho
rized
Pub
lic D
iscl
osur
e A
utho
rized
Pub
lic D
iscl
osur
e A
utho
rized
Pub
lic D
iscl
osur
e A
utho
rized

Insurance is an important part of the financial sector. It supports broader economic and general
well‐being in developed economies in a way that is so entrenched and accepted that it is not
widely recognized. In less developed markets, insurance can remain nascent for many years and
then pick up through a dynamic development phase and reach a more mature phase. As would
be expected, many actors contribute to this development. This report is part of a larger effort
to understand the key drivers of development in insurance sectors in a range of jurisdictions
especially including the role of policy and project interventions.
This report contributes to two of the identified imperatives for development in particular.
Development has been found to be supported by more effective policy leadership, which needs
adequate and effective metrics, and by a better implemented risk‐based rather than rules‐
based approach to supervision.
The report preparation was led by Michael Hafeman, a consultant working jointly with the
Finance, Competitiveness, and Innovation (FCI) Global Practice at the World Bank and the
Monetary and Capital Markets Department at the International Monetary Fund. The author is
grateful for the active engagement of all who were involved in the discussions and in support of
the work.
The author is grateful for guidance and comments throughout the process from Jennifer Elliott
and Peter Windsor of the IMF and Fiona Stewart, Craig Thorburn, and Tetsutaro Shindo of the
World Bank. Ultimately, of course, the resulting report remains the work of the author and
does not reflect all the views of reviewers.
This material has been funded in part by the UK aid from the UK government, however the
views expressed do not necessarily reflect the UK government’s official policies. The report has
been prepared as part of a broader program of the Centre for Global Disaster Protection. For
more information on the ongoing work that is part of this project, readers may contact Craig
Thorburn at [email protected] .

Table of Contents
A. BACKGROUND ........................................................................................................................................... 1
B. SUMMARY OF KEY FINDINGS ..................................................................................................................... 4
C. ANALYSIS OF SURVEY RESULTS ................................................................................................................... 7
INSTITUTIONAL INFORMATION .......................................................................................................................................... 7 USE AND COMMUNICATION OF FHSIS .............................................................................................................................. 11 LOOKING TO THE FUTURE ............................................................................................................................................... 19 INPUT ON SPECIFIC FHSIS BY TOPIC ................................................................................................................................. 22
ANNEX 1 RESPONDENTS BY JURISDICTION ................................................................................................... 33
ANNEX 2 DETAILED RESULTS BY QUESTION .................................................................................................. 34
1. CAPITAL ............................................................................................................................................................. 44 2. ASSETS .............................................................................................................................................................. 49 3. REINSURANCE ..................................................................................................................................................... 57 4. ACTUARIAL ......................................................................................................................................................... 61 5. MANAGEMENT ................................................................................................................................................... 66 6. EARNINGS .......................................................................................................................................................... 71 7. LIQUIDITY ........................................................................................................................................................... 78 8. SUBSIDIARIES ...................................................................................................................................................... 82 9. INDUSTRY‐WIDE .................................................................................................................................................. 86
ANNEX 3 DETAILED RESULTS BY TOPIC ......................................................................................................... 90
A. USE OF FHSIS ..................................................................................................................................................... 90 B. USEFULNESS OF FHSIS ......................................................................................................................................... 93 C. GUIDANCE ON FHSIS ........................................................................................................................................... 96 D. MAPPING OF FHSIS ............................................................................................................................................. 99 E. USE OF BENCHMARKS ........................................................................................................................................ 102 F. BENCHMARKS USED ........................................................................................................................................... 105
ANNEX 4 MAPPING OF FHSIS ..................................................................................................................... 113
ANNEX 5 GUIDANCE ON FHSIS ................................................................................................................... 118
DETAILED TABLE OF CONTENTS ..................................................................................................................................... 118 1. CAPITAL ........................................................................................................................................................... 121 2. ASSETS ............................................................................................................................................................ 128 3. REINSURANCE ................................................................................................................................................... 138 4. ACTUARIAL ....................................................................................................................................................... 141 5. MANAGEMENT ................................................................................................................................................. 149 6. EARNINGS ........................................................................................................................................................ 157 7. LIQUIDITY AND ALM .......................................................................................................................................... 169 8. SUBSIDIARIES AND RELATED PARTIES ..................................................................................................................... 175 9. INDUSTRY‐WIDE ................................................................................................................................................ 180

Glossary
CU Used to describe generic “Currency Units” FHSI Financial Health and Stability Indicator FSAP Financial Sector Assessment Program IAIS International Association of Insurance Supervisors ICPs Insurance Core Principles IFRS International Financial Reporting Standards IMF International Monetary Fund RBC Risk‐Based Capital TA Technical Assistance WBG World Bank Group

Page 1
A. Background
Off‐site monitoring is an essential tool of financial sector supervision. For example, as
highlighted by Standard 9.7 of the Insurance Core Principles (ICPs) of the International
Association of Insurance Supervisors (IAIS), “The supervisor monitors and supervises insurers on
an on‐going basis, based on regular communication with the insurer, information obtained
through supervisory reporting and analysis of market and other relevant information.”
Off‐site monitoring involves both qualitative and quantitative analyses, including the calculation
of ratios and other financial health and stability indicators (FHSIs)1. Analysis of quantitative
indicators can play an important role in many aspects of supervision, including:
Market analysis for policy development;
Macroprudential risk assessment;
Microprudential risk assessment; and
Market conduct supervision.
Unfortunately, not all supervisors are using such analyses as fully and effectively as they might.
The reasons for this vary among jurisdictions, but often include one or more of the following:
Use of a less‐than‐ideal set of indicators, for example, with gaps or multiple
indicators that give the same information;
Lack of guidance on the interpretation of the indicators, including the
development and application of benchmarks;
Infrequent and inconsistent calculation of the indicators;
Gaps in the data needed to calculate some indicators; and
Insufficient capabilities among supervisory staff.
The International Monetary Fund (IMF) and World Bank Group (WBG) have collaborated on a
project to help remedy this situation. Many of their technical assistance (TA) projects over the
years have provided training and other assistance to help supervisors deal with these problems.
In the course of this work, informal tools and resources related to FHSIs have been developed.
The current project has drawn on this work. It seeks to enhance the resources through wider
input, and to make them widely available to supervisors through this report and related
documents. The project was carried out by a consultant, Michael Hafeman, in collaboration
1 The FHSIs discussed in this report include the six insurance‐related Financial Soundness Indicators (FSIs) used by the IMF in its monitoring of the soundness of the system‐wide financial sector, from a macroprudential vantage point. See 2019 Financial Soundness Indicators Compilation Guide, IMF, 2019. https://www.imf.org/en/Data/Statistics/fsi‐guide

Page 2
with the IMF and WBG and the assistance of the IAIS. The main steps of the project are outlined
below.
Preparing to seek input. Draft guidance was prepared on the interpretation of many FHSIs used
by insurance supervisors2. The FHSIs have been organized by the CARAMELS3 categories to
which they are primarily related. A separate document was prepared that mapped the FHSIs to
other risk‐assessment categories where they can be useful in informing the assessment4. A
survey questionnaire was developed, to seek input on issues such as:
The purposes for which FHSIs are being used;
Which FHSIs are currently being used;
Whether any changes to the FHSIs are being contemplated, for example, in
response to the implementation of IFRS 9 and IFRS 17;
The mapping of FHSIs to risk‐assessment categories;
Supervisory benchmarks for the FHSIs and how they were established;
How some common data and methodology issues are being dealt with; and
Suggestions for improvements to the draft interpretation guidance.
Obtaining input from insurance supervisors and others. The IAIS graciously agreed to assist in
facilitating input from the supervisory community. It sent the survey questionnaire and the
draft interpretation guidance and mapping to its members, along with a request for input. The
IMF provided an overview of the project to the IAIS Implementation and Assessment
Committee and requested its members to provide input on behalf of their own authorities, via
both the survey and the Supervisory Forum, and to encourage others to do so. The IAIS
Secretariat set up the questionnaire on its survey platform and compiled the responses. The
IMF and WBG distributed the materials to staff and external technical assistance experts and
requested their input.
Analyzing the input and preparing a paper and updated resources. The consultant analyzed
the results of the survey and prepared this paper, which reports on the results of the survey
and briefly discusses the use of FHSIs. The paper also includes resource materials, which were
updated to reflect the input obtained. They include a mapping of the FHSIs to risk assessment
categories, supervisory benchmarks (ranges being used by supervisors, not prescriptions), and
interpretation guidance. IMF and WBG staff served as peer reviewers.
2 See Interpretation of FHSIs‐2019 02 26. Earlier versions of the draft benefitted from reviews by Michael Grist (WBG, retired) and supervisors in the Eastern Caribbean (in connection with a Caribbean Regional Technical Assistance Center (CARTAC) project). 3 CARAMELS is a risk‐assessment framework used by many insurance supervisors, with the following categories: Capital; Assets; Reinsurance; Actuarial Provisions; Management; Earnings; Liquidity; and Subsidiaries (including related parties and groups). 4 See Mapping of FHSIs‐2019 02 24.

Page 3
Publishing the paper and making the resources available. The paper is being published as a
working paper by both the IMF and WBG. The paper and related resources are accessible on
both organizations’ websites.
This paper has a few main sections and several detailed annexes. Section B presents a
summary of key findings, including recommendations. Section C provides an analysis of the
survey results. It begins with a breakdown of the institutional information on the survey
respondents. This is followed by analysis of how respondents are using FHSIs and how they are
communicating with various stakeholders regarding FHSIs. Then it looks to the future, including
the progress of respondents in adapting their use of FHSIs to new financial reporting standards
and their needs for additional guidance and other resources to facilitate the use of FHSIs.
Section C concludes with an analysis of the input of respondents regarding specific FHSIs, which
has been organized by topic (rather than by CARAMELS category).
Annex 1 lists the IAIS members who responded to the survey, including breakdowns by nature
of the jurisdiction (FSB members, other OECD jurisdictions, or other) and geographic region.
Annex 2 provides the detailed results of the survey, by question. Hence, it is organized by
CARAMELS category. Annex 3 provides the same detailed results but has been organized by
topic for ease of reference. It also includes rankings of some responses not only within
CARAMELS categories but also across all FHSIs.
Annex 4 is a mapping of the FHSIs to CARAMELS and other risk assessment categories. It is an
updated version of the draft mapping provided with the survey questionnaire, which takes
account of the input provided by respondents.
Annex 5 provides guidance on the calculation and interpretation of each of the FHSIs. It reflects
input provided by respondents and includes guidance on three additional FHSIs. The guidance is
organized by CARAMELS category and Annex 5 begins with a detailed table of contents.

Page 4
B. Summary of Key Findings
IAIS members from 33 jurisdictions responded to the survey. The respondents were well‐
distributed by nature of the jurisdiction and IAIS region, except that there were no responses
from the Middle East and North Africa region. More than 80 percent of the respondents were
from high or upper middle income countries.
Respondents use FHSIs most regularly and consistently in the supervision of conventional
insurance, particularly with respect to prudential supervision. There is scope for many
authorities to make more use of FHSIs across the full range of insurance activities they
supervise and in the various aspects of supervision for which they are responsible.
Respondents typically indicated that instructions for calculating FHSIs have been documented.
However, written guidance and training on the use and interpretation of FHSIs – both in general
and in relation to specific FHSIs – is lacking at many authorities.
Overall, the extent to which respondents communicate with insurers and the general public
regarding FHSIs is limited. This includes communication regarding how FHSIs are being used,
which FHSIs are being used, and the results of calculations – both for individual insurers and
industry aggregates.
Most respondents use between 25 and 74 FHSIs in total, although several use 100 or more.
Most respondents are still early in the process of revising the FHSIs to take account of
anticipated changes in financial reporting and regulatory requirements related to IFRS 9
Financial Instruments and IFRS 17 Insurance Contracts.
The survey asked several questions regarding each of nearly 100 FHSIs. Their responses indicate
that
Supervisors are using a wide variety of FHSIs, although some are used much more
frequently than others.
The FHSIs most used by supervisors, and those considered most useful, were identified.
Many respondents identified FHSIs that were surveyed that they thought would be
useful, but which they were not currently using.
The draft guidance seems largely to have achieved a good balance between being
concise but still sufficiently clear and detailed. The guidance was revised to reflect the
input provided.
Respondents were largely satisfied with the proposed mappings of the FHSIs to risk‐
assessment categories, but some additions were made in response to suggestions.

Page 5
Supervisors would be very interested in a database of benchmarks or more guidance on
the development of benchmarks. Unfortunately, very few authorities provided
quantitative responses regarding their current benchmarks for most of the FHSIs.
It is recommended that supervisors consider taking the following actions, if they are not already
doing so:
Use FHSIs to inform their analyses across the full range of insurance activities they
supervise and in the various aspects of supervision for which they are responsible.
Implement robust tools to facilitate the use of FHSIs, including databases, calculation
and reporting systems, and written guidance and training on the use and interpretation
of FHSIs – both in general and in relation to specific FHSIs.
Communicate with both insurers and the general public regarding how FHSIs are used as
part of supervisory assessments.
Communicate with both insurers and the general public, with appropriate levels of
granularity and transparency, regarding the results for specific insurers and peer groups.
Use a sufficient number of FHSIs in each risk‐assessment category to adequately inform
the risk assessments, considering the results of this survey regarding the usefulness of
specific FHSIs.
Revise the FHSIs, where necessary, to take account of anticipated changes in financial
reporting and regulatory requirements related to IFRS 9 and IFRS 17.

Page 6
Box 1 provides examples of specific steps that might be taken by supervisors in response to
these recommendations.
It is recommended that the IMF and WBG consider taking the following actions, to build on the
results of this project and help to enhance the use of FHSIs by supervisors:
Develop training programs and resources, such as regional seminars and interactive
webinars, on the use of FHSIs. This might be done in collaboration with other
organizations.
Develop and maintain a database of FHSIs being used and benchmarks established by
supervisors, starting from the information in this report. Encourage more supervisors to
provide input, particularly regarding the benchmarks.
Develop an Excel workbook to facilitate the calculation and comparison of FHSIs and
make it widely available to supervisors. Such a tool would probably be especially useful
to supervisors in developing and emerging markets.
Box 1. Examples of Specific Steps that Might be Taken
Recommendation Examples of Specific Steps
Use FHSIs to inform their analyses across the full range of insurance activities they supervise and in the various aspects of supervision for which they are responsible.
Use FHSIs in analyzing non‐conventional insurance activities, such as microinsurance and takaful.
Use FHSIs beyond prudential supervision, such as in market conduct supervision and market development.
Implement robust tools to facilitate the use of FHSIs, including databases, calculation and reporting systems, and written guidance and training on the use and interpretation of FHSIs – both in general and in relation to specific FHSIs.
Develop reporting systems that facilitate comparisons across peer groups.
Map all of the FHSIs being used to each of the relevant categories in the risk‐assessment framework.
Communicate with both insurers and the general public regarding how FHSIs are used as part of supervisory assessments.
Include on the supervisor’s website an explanation of its supervisory methodology, including how FHSIs are used, along with some examples.
Communicate with both insurers and the general public, with appropriate levels of granularity and transparency, regarding the results for specific insurers and peer groups.
Communicate to each insurer the results of key FHSIs and how such results compare with those of their peers.
Use a sufficient number of FHSIs in each risk‐assessment category to adequately inform the risk assessments, considering the results of this survey regarding the usefulness of specific FHSIs.
Select at least three FHSIs for use in each risk‐assessment category, including the 27 FHSIs considered most useful by respondents (or arithmetic transformations of them).
Revise the FHSIs, where necessary, to take account of anticipated changes in financial reporting and regulatory requirements related to IFRS 9 and IFRS 17.
Revise the FHSIs and benchmarks in response to changes in capital adequacy requirements.

Page 7
C. Analysis of Survey Results
This section provides a brief overview of the findings for each of the first 14 survey questions
separately. The findings for the remaining questions, which deal with various topics in relation
to each FHSI, are presented by topic.
The complete set of questions and corresponding data are included in Annex 2, while the
compilation of the same results by topic are included in Annex 3. Many of the tables in Annexes
2 and 3 include an index, the weights for which are shown at the top of the table; in some
cases, the index values are shown in the charts in this section. The index values can be used to
rank the items in the table, which helps in reaching conclusions. The tables in Annex 3 show
rankings both within the respective CARAMELS categories and overall.
Institutional Information
Authorities from thirty‐three jurisdictions responded to the survey. The respondents were well‐
distributed by nature of the jurisdiction and IAIS region, except that there were no responses
from the Middle East and North Africa region. Most respondents were from high (19) or upper
middle income (8) countries, although several were from low (1) or lower middle income (5)
countries. Annex 1 provides a list of the jurisdictions from which responses were received.
7
7
202
8
4
3
Respondents by IAIS Region
Asia and Oceania
Central, Eastern Europe andTranscaucasia
Latin America
Middle East and North Africa
North America
Offshore and CaribbeanIslands
Sub‐Sahara Africa
Western Europe

Page 8
Question 1. What is the institutional nature of YOUR AUTHORITY?
The institutional nature of most of the respondents (19 out of the 33) is an autonomous public
authority, with most of the others being departments in central banks or monetary authorities
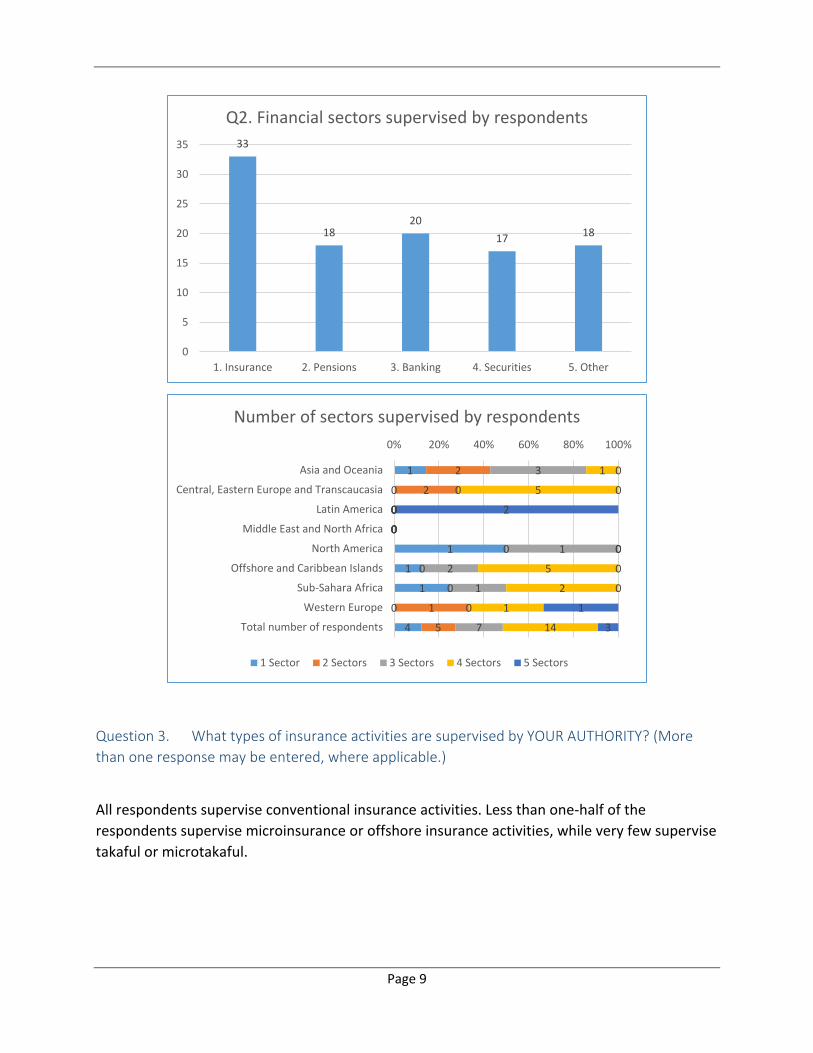
Question 2. Which financial sectors are supervised by YOUR AUTHORITY? (More than one
response may be entered, where applicable.)
Very few respondents (4 out of the 33) supervise only the insurance sector. Most also supervise
other sectors, with a fairly even distribution among pensions, banking, securities and other. On
average, the respondents supervise three sectors. The average is significantly lower for the
jurisdictions that are members of the Financial Stability Board (FSB) than for the other
jurisdictions. It is lowest for jurisdictions in the North America and Asia and Oceana regions, and
highest for jurisdictions in Latin America5.
5 See Annex 2, table 2.1 for details.
10
4
19
Q1. Institutional nature of respondents
1. Department within centralbank or monetary authority
2. Department withingovernment ministry (forexample, Ministry of Finance)
3. Autonomous publicauthority
Page 9
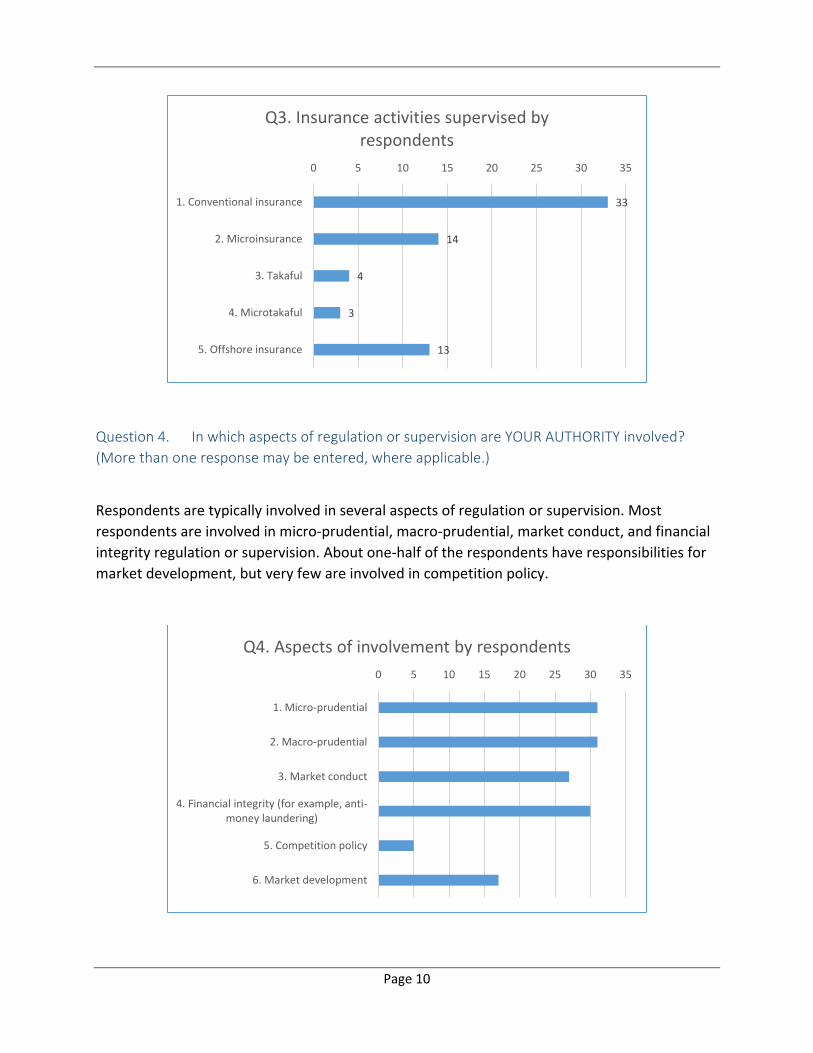
Question 3. What types of insurance activities are supervised by YOUR AUTHORITY? (More
than one response may be entered, where applicable.)
All respondents supervise conventional insurance activities. Less than one‐half of the
respondents supervise microinsurance or offshore insurance activities, while very few supervise
takaful or microtakaful.
33
1820
17 18
0
5
10
15
20
25
30
35
1. Insurance 2. Pensions 3. Banking 4. Securities 5. Other
Q2. Financial sectors supervised by respondents
1
0
0
0
1
1
1
0
4
2
2
0
0
0
0
0
1
5
3
0
0
0
1
2
1
0
7
1
5
0
0
0
5
2
1
14
0
0
2
0
0
0
0
1
3
0% 20% 40% 60% 80% 100%
Asia and Oceania
Central, Eastern Europe and Transcaucasia
Latin America
Middle East and North Africa
North America
Offshore and Caribbean Islands
Sub‐Sahara Africa
Western Europe
Total number of respondents
Number of sectors supervised by respondents
1 Sector 2 Sectors 3 Sectors 4 Sectors 5 Sectors
Page 10
Question 4. In which aspects of regulation or supervision are YOUR AUTHORITY involved?
(More than one response may be entered, where applicable.)
Respondents are typically involved in several aspects of regulation or supervision. Most
respondents are involved in micro‐prudential, macro‐prudential, market conduct, and financial
integrity regulation or supervision. About one‐half of the respondents have responsibilities for
market development, but very few are involved in competition policy.
33
14
4
3
13
0 5 10 15 20 25 30 35
1. Conventional insurance
2. Microinsurance
3. Takaful
4. Microtakaful
5. Offshore insurance
Q3. Insurance activities supervised by respondents
0 5 10 15 20 25 30 35
1. Micro‐prudential
2. Macro‐prudential
3. Market conduct
4. Financial integrity (for example, anti‐money laundering)
5. Competition policy
6. Market development
Q4. Aspects of involvement by respondents

Page 11
Use and Communication of FHSIs
Question 5. To what extent does YOUR AUTHORITY use FHSIs in supervising each of the
following types of insurance activities?
Respondents use FHSIs most regularly and consistently in the supervision of conventional
insurance, with an index of 9.5 out of 106. Among those who supervise other insurance
activities, FHSIs are used fairly regularly in the supervision of microinsurance and microtakaful,
but less so for offshore insurance or takaful. There is scope for many authorities to make more
use of FHSIs across the full range of insurance activities they supervise.
Question 6. To what extent does YOUR AUTHORITY use FHSIs in each of the following aspects
of regulation or supervision?
Respondents use FHSIs most regularly and consistently in micro‐prudential supervision, with an
index of 9.4 out of 10, followed by macro‐prudential supervision. Among those responsible for
other aspects of regulation or supervision, FHSIs are used most regularly in the supervision of
financial integrity and least in regulation of competition. There is scope for many authorities to
6 The index for this question was calculated by applying weights of 10, 7, 4, and 1 to responses 1 through 4, respectively. For this question, and all others where a “not applicable” response was available, “not applicable” responses were omitted from the calculation of the index.
9.5
7.4
5.8 7.0 6.6
0%10%20%30%40%50%60%70%80%90%100%
Q5. Use of FHSIs by insurance activity supervised
4. Seldom if ever used
3. Used sometimes
2. Used often but notalways consistently
1. Used regularly andconsistently
Index

Page 12
make more use of FHSIs in relation to all aspects of aspects of regulation and supervision for
which they are responsible, especially those other than prudential supervision.
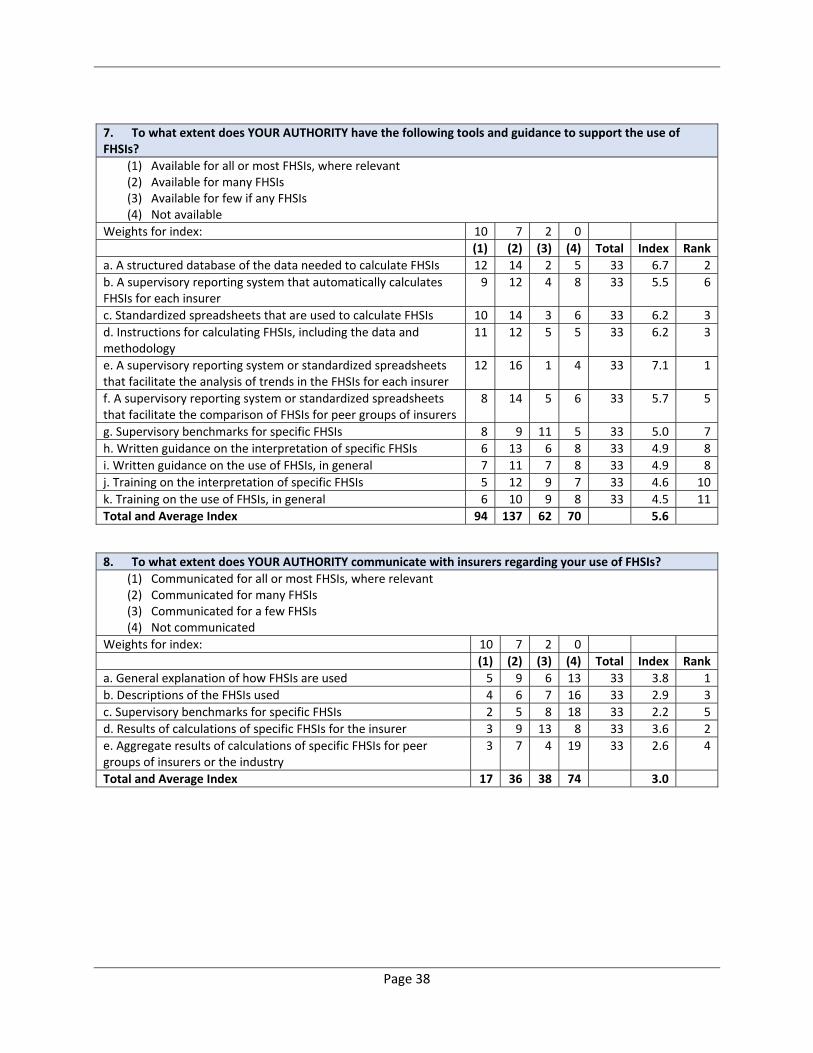
Question 7. To what extent does YOUR AUTHORITY have the following tools and guidance to
support the use of FHSIs?
Most respondents have tools to support their use of FHSIs, including databases, calculation
tools, and reporting systems7. However, in many cases these tools do not extend to the full
range of FHSIs being used by the authorities. The tools more frequently facilitate analysis of
trends in the FHSIs of each insurer than the comparison of FHSIs for peer groups.
Instructions for calculating FHSIs are typically documented, but written guidance and training
on the use and interpretation of FHSIs – both in general and in relation to specific FHSIs – is
lacking at many authorities.
7 For full text of the items on the horizontal axis please refer to the tables for the respective questions in Annex 2.

Page 13
a. A structured database of the data needed to calculate FHSIs
b. A supervisory reporting system that automatically calculates FHSIs for each insurer
c. Standardized spreadsheets that are used to calculate FHSIs
d. Instructions for calculating FHSIs, including the data and methodology
e. A supervisory reporting system or standardized spreadsheets that facilitate the analysis
of trends in the FHSIs for each insurer
f. A supervisory reporting system or standardized spreadsheets that facilitate the
comparison of FHSIs for peer groups of insurers
g. Supervisory benchmarks for specific FHSIs
h. Written guidance on the interpretation of specific FHSIs
i. Written guidance on the use of FHSIs, in general
j. Training on the interpretation of specific FHSIs
k. Training on the use of FHSIs, in general
Question 8. To what extent does YOUR AUTHORITY communicate with insurers regarding your
use of FHSIs?
Overall, the extent to which respondents communicate with insurers regarding FHSIs is limited,
with an average index of 3.0. Where information is communicated, it most commonly includes
a general explanation of how the authority uses FHSIs and the results of some FHSIs for the
specific insurer. However, on each of the aspects regarding the use of FHSIs queried, at least
some respondents do communicate extensively with insurers. This suggests that many
authorities could go further in communicating how FHSIs are used as part of their supervisory
assessments, the results for a specific insurer, and how such results compare with those of its
peers.
6.7
5.5
6.2 6.2
7.1
5.7
5.0 4.9 4.9 4.6 4.5
0%
10%
20%
30%
40%
50%
60%
70%
80%
90%
100%
a. b. c. d. e. f. g. h. i. j. k.
Q7. Availability of tools and guidance
4. Not available
3. Available for few if any FHSIs
2. Available for many FHSIs
1. Available for all or most FHSIs,where relevant
Index

Page 14
Question 9. To what extent does YOUR AUTHORITY communicate with the general public
regarding your use of FHSIs?
As might be expected, the extent to which respondents communicate with the general public
regarding FHSIs is even more limited than their communication with insurers, with an average
index of 1.8. Where information is communicated, it most commonly includes a general
explanation of how the authority uses FHSIs, descriptions of some FHSIs, and the aggregate
results of some FHSIs for peer groups of insurers or the industry. However, on each of the
aspects regarding the use of FHSIs queried, at least some respondents do communicate
extensively with the general public. This suggests that most authorities could go further in
communicating how FHSIs are used as part of their supervisory assessments and the results for
specific insurers and peer groups.

Page 15
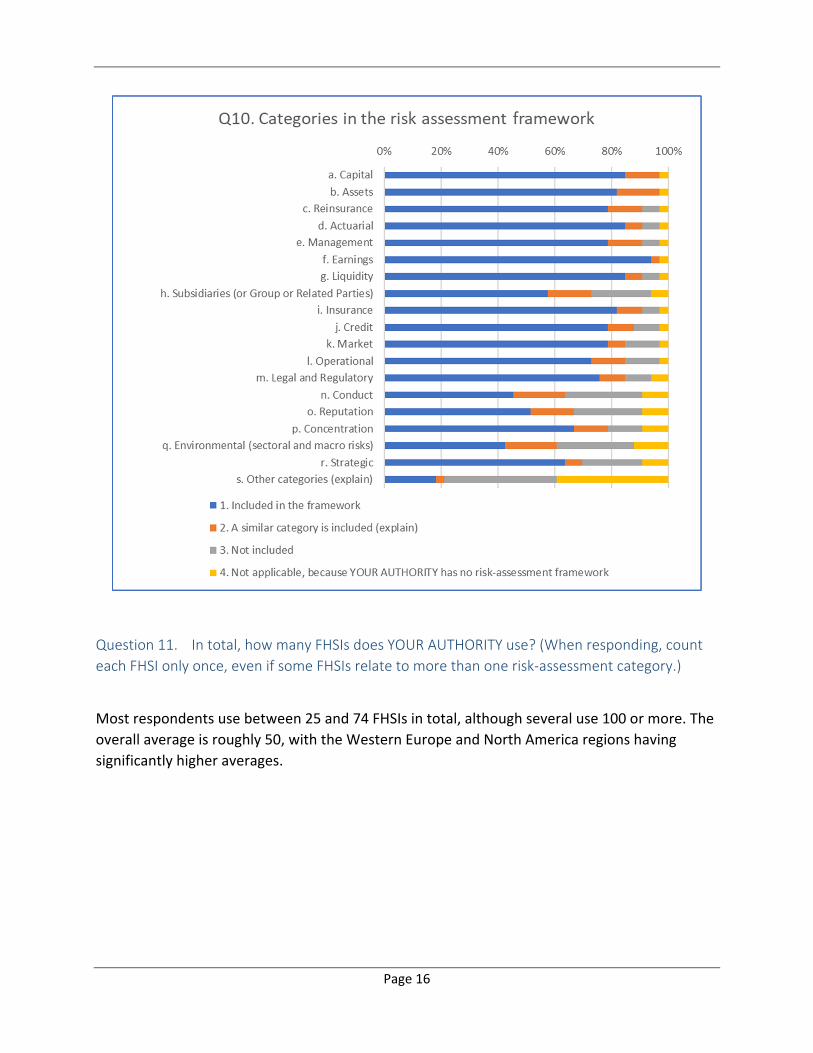
Question 10. Which of the following categories are included in the risk‐assessment framework
used by YOUR AUTHORITY?
Almost all respondents (32 of 33) reported having a risk‐assessment framework with various
categories within which risks are assessed. The categories most commonly used are those that
are typically part of the CARAMELS framework, with the exception of the Subsidiaries category.
However, many respondents also indicate that they are using categories that are typically part
of risk‐based supervision frameworks, such as Insurance, Credit, and Market risks. This suggests
that some authorities might be applying more than one framework simultaneously (examples
of which have been seen in some TA projects) or that they might have responded affirmatively
to more categories than actually exist in their assessment frameworks (on the basis that the
other categories are “similar”). “Other” categories used by some authorities include Anti‐
Money Laundering and Combatting the Financing of Terrorism Risk, Outsourcing Risk,
Enforcement Issues, Contagion Risk, Emerging Risks, Policies and Procedures, and Shariah Non‐
compliance Risk.
Page 16
Question 11. In total, how many FHSIs does YOUR AUTHORITY use? (When responding, count
each FHSI only once, even if some FHSIs relate to more than one risk‐assessment category.)
Most respondents use between 25 and 74 FHSIs in total, although several use 100 or more. The
overall average is roughly 50, with the Western Europe and North America regions having
significantly higher averages.

Page 17
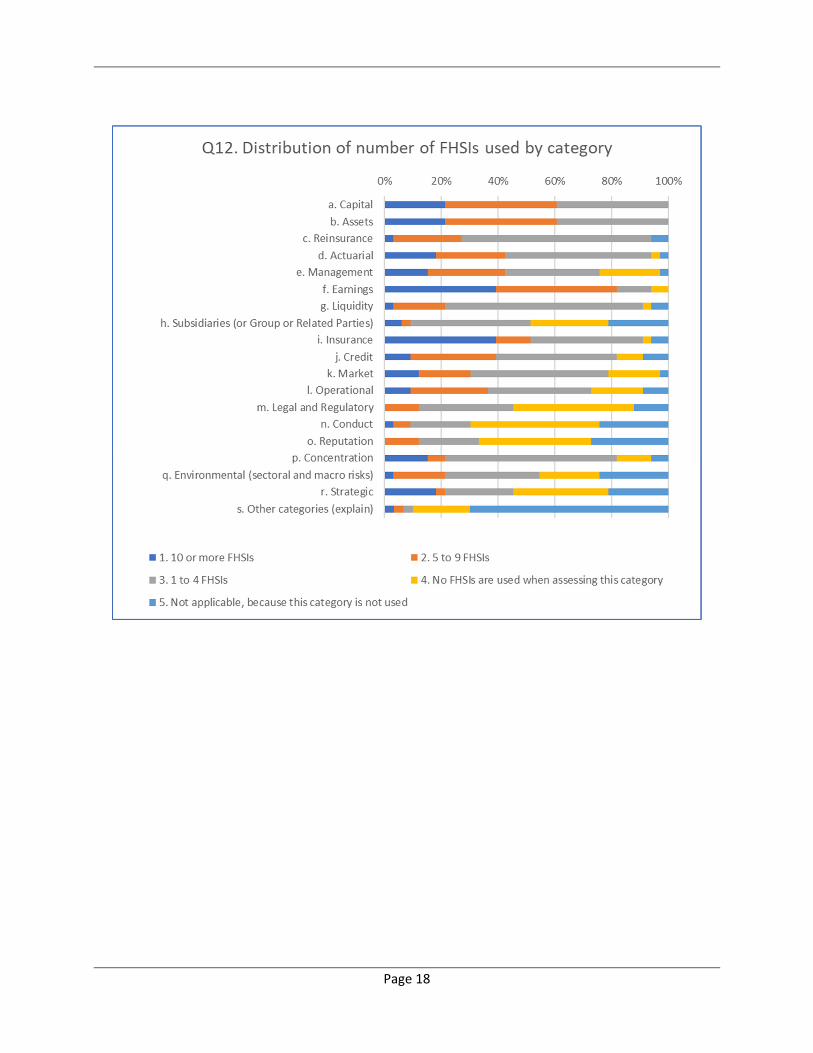
Question 12. How many FHSIs does YOUR AUTHORITY use when assessing each of the
categories in your risk‐assessment framework? (When responding, count all FHSIs mapped to
the risk‐assessment category, even if they have also been mapped other categories.)
The average number of FHSIs used by respondents when assessing the various risk‐assessment
categories varies significantly by category, around an overall average of 4.6 per category.
Unsurprisingly, the categories where the greatest numbers of FHSIs are being used are financial
in nature (Earnings, Capital, and Assets), together with Insurance Risk. Although relatively few
FHSIs are being used in assessing the more governance‐related categories, the average for
almost every category is at least two FHSIs.
0
2
4
6
8
10
12
14
16
100 or more 75 to 99 50 to 74 25 to 49 15 to 24 10 to 14 9 or fewer
Q11. Total number of FHSIs used by respondents
Number of respondents
33.6 45.7
35.0
‐
72.5
41.9 53.8
93.3
48.5
‐ 10.0 20.0 30.0 40.0 50.0 60.0 70.0 80.0 90.0 100.0
0%10%20%30%40%50%60%70%80%90%100%
Distribution of total number of FHSIs used
9 or fewer
10 to 14
15 to 24
25 to 49
50 to 74
75 to 99
100 or more
Average
Page 18

Page 19
Looking to the Future
Question 13. To what extent has YOUR AUTHORITY progressed in revising the FHSIs it uses to
take account of anticipated changes in financial reporting and regulatory requirements related to
IFRS 9 and IFRS 17?
The implementation of two key International Financial Reporting Standards (IFRSs), IFRS 9
Financial Instruments and IFRS 17 Insurance Contracts, in many jurisdictions is widely expected
to result in the need to make changes in financial reporting and regulatory requirements, such
as capital adequacy requirements. Most respondents are still early in the process of revising the
FHSIs to take account of anticipated changes in financial reporting and regulatory requirements
related to IFRS 9 and IFRS 17. Nearly one‐half have yet to consider the need for revisions to
FHSIs and most of those who have considered the need for revisions have yet to make them.
The responses do not vary significantly by risk‐assessment category.

Page 20
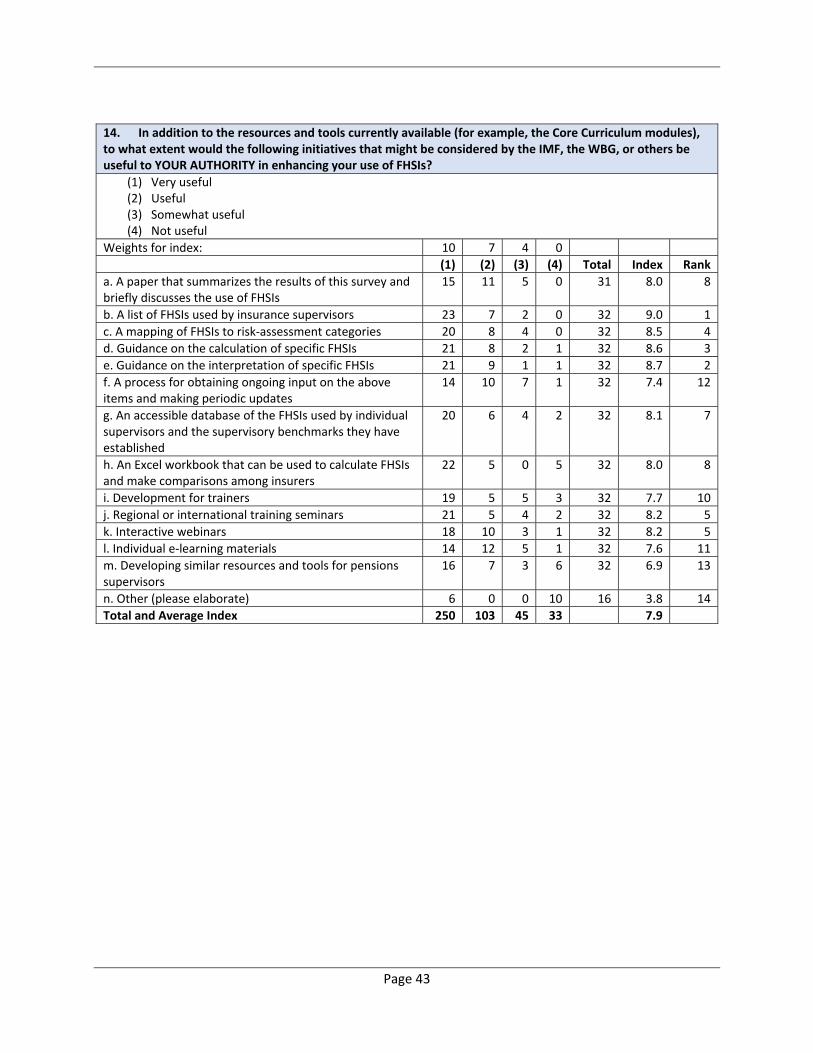
Question 14. In addition to the resources and tools currently available (for example, the Core
Curriculum modules), to what extent would the following initiatives that might be considered by
the IMF, the WBG, or others be useful to YOUR AUTHORITY in enhancing your use of FHSIs?
Overall, respondents indicated that each of the suggested initiatives would be useful in
enhancing the use of FHSIs. The four initiatives ranked most highly (items b, c, d, and e), along
with item a, are being dealt with by this project. Also ranked highly were several training‐
related items (items j and k), a database of FHSIs being used and benchmarks established by
supervisors, and an Excel workbook to facilitate the calculation and comparison of FHSIs.

Page 21

Page 22
Input on Specific FHSIs by Topic
A. Does YOUR AUTHORITY use the following FHSIs?8
(1) Yes, as described
(2) An arithmetic transformation is used
(3) No
The survey questionnaire asked about 95 FHSIs. The responses indicate that a wide variety of
FHSIs are being used by supervisors. In aggregate, for the 95 FHSIs queried, only 37 percent of
the responses indicated that FHSIs as described were being used, with another 5 percent
indicating that arithmetic transformations were being used. This leaves 58 percent of the
responses indicating that the FHSIs were not being used. In fact, several of the FHSIs are being
used by few, if any, of the respondents.
The table below lists the 27 FHSIs queried that are most frequently used by respondents. It
includes those FHSIs whose indices9 ranked either in the top two within the respective
CARAMELS category or in the top 20 overall.
8 Survey questions 15, 21, 27, 33, 39, 45, 51, 57, and 63. 9 The index for this question was calculated by applying weights of 10, 8, and 0 to responses 1 through 3, respectively.

Page 23
FHSIs Most Frequently Used by Respondents Index
1.06 : Cover of solvency margin 8.7
1.07 : Risk‐based capital adequacy ratios 6.5
1.08 : Growth in capital 8.6
2.02 : Real estate / total assets 5.8
2.17 : Investments: distribution by type 7.4
3.01 : Risk retention ratio 9.1
3.03 : Maximum exposure to single risk / capital 3.1
4.04 : Claims development 6.2
4.05 : Underwritten business: distribution by class of business 7.9
5.03 : Operating expenses / gross written premium 7.8
5.05 : Growth in gross written premium 9.0
5.06 : Growth in net written premium 8.4
5.07 : Growth in total assets 8.4
6.01 : Claims ratio 9.5
6.02 : Gross claims ratio 7.7
6.03 : Expense ratio 9.2
6.04 : Combined ratio [FSI Non‐Life] 9.2
6.05 : Investment income ratio 6.8
6.07 : Profitability ratio 6.7
6.12 : Return on equity (ROE) [FSI] 8.7
6.14 : Return on assets (ROA) [FSI Life] 6.8
7.01 : Liquid assets / current liabilities 6.2
7.03 : Liquid assets / total assets 7.0
8.02 : Related party receivables / total assets 3.9
8.04 : (Investments in related parties + related party receivables) / total assets 3.4
9.03 : Penetration 7.5
9.04 : Density 6.0
B. What are the views of YOUR AUTHORITY about the usefulness of the following FHSIs (or
arithmetic transformations of them)?10
(1) We use it, and find it useful
(2) We use it, but do not find it very useful
(3) We do not use it, because we use other FHSIs that provide similar information
(4) We do not use it, but it seems like it might be useful
(5) We do not use it, and it does not seem like it would be very useful
The responses regarding the usefulness of the FHSIs queried were considerably more positive,
with an average index of 7.1, than those regarding use, where the average index was only 4.1.
10 Survey questions 16, 22, 28, 34, 40, 46, 52, 58, and 64.
Page 24
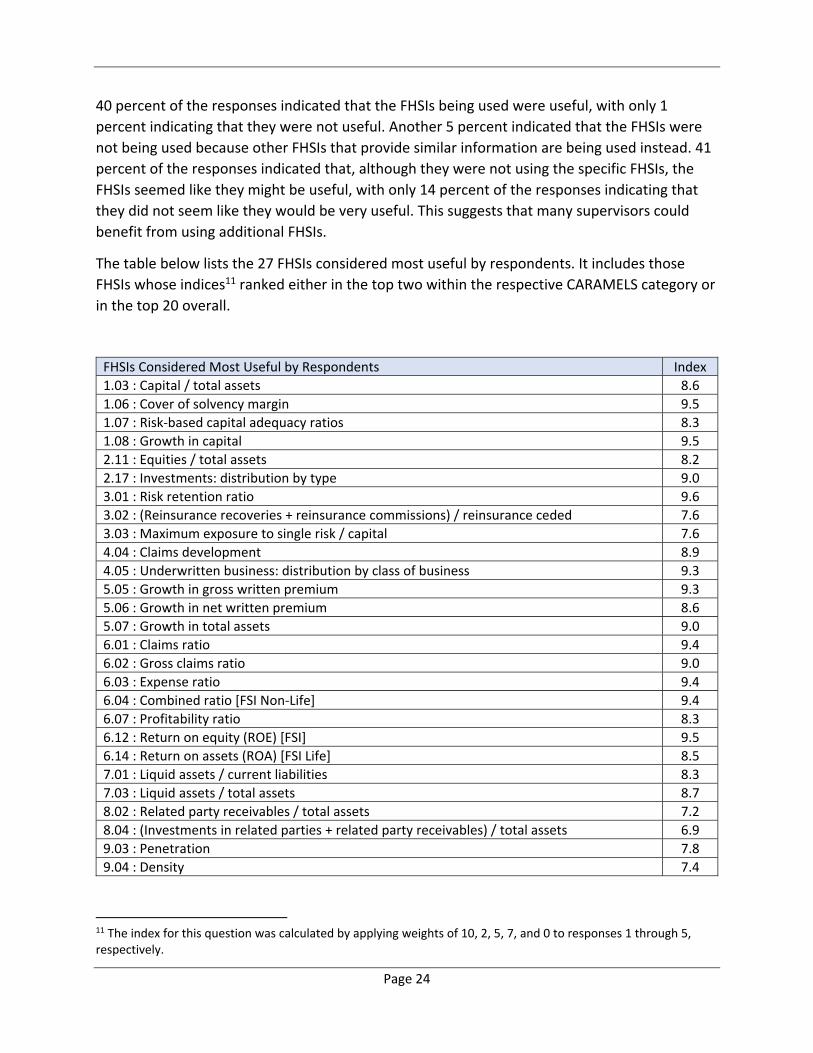
40 percent of the responses indicated that the FHSIs being used were useful, with only 1
percent indicating that they were not useful. Another 5 percent indicated that the FHSIs were
not being used because other FHSIs that provide similar information are being used instead. 41
percent of the responses indicated that, although they were not using the specific FHSIs, the
FHSIs seemed like they might be useful, with only 14 percent of the responses indicating that
they did not seem like they would be very useful. This suggests that many supervisors could
benefit from using additional FHSIs.
The table below lists the 27 FHSIs considered most useful by respondents. It includes those
FHSIs whose indices11 ranked either in the top two within the respective CARAMELS category or
in the top 20 overall.
FHSIs Considered Most Useful by Respondents Index
1.03 : Capital / total assets 8.6
1.06 : Cover of solvency margin 9.5
1.07 : Risk‐based capital adequacy ratios 8.3
1.08 : Growth in capital 9.5
2.11 : Equities / total assets 8.2
2.17 : Investments: distribution by type 9.0
3.01 : Risk retention ratio 9.6
3.02 : (Reinsurance recoveries + reinsurance commissions) / reinsurance ceded 7.6
3.03 : Maximum exposure to single risk / capital 7.6
4.04 : Claims development 8.9
4.05 : Underwritten business: distribution by class of business 9.3
5.05 : Growth in gross written premium 9.3
5.06 : Growth in net written premium 8.6
5.07 : Growth in total assets 9.0
6.01 : Claims ratio 9.4
6.02 : Gross claims ratio 9.0
6.03 : Expense ratio 9.4
6.04 : Combined ratio [FSI Non‐Life] 9.4
6.07 : Profitability ratio 8.3
6.12 : Return on equity (ROE) [FSI] 9.5
6.14 : Return on assets (ROA) [FSI Life] 8.5
7.01 : Liquid assets / current liabilities 8.3
7.03 : Liquid assets / total assets 8.7
8.02 : Related party receivables / total assets 7.2
8.04 : (Investments in related parties + related party receivables) / total assets 6.9
9.03 : Penetration 7.8
9.04 : Density 7.4
11 The index for this question was calculated by applying weights of 10, 2, 5, 7, and 0 to responses 1 through 5, respectively.

Page 25
C. What are the views of YOUR AUTHORITY about the draft guidance that has been prepared
for the following FHSIs?12
(1) The guidance is sufficiently clear and detailed
(2) The guidance is unclear
(3) More detail on calculating the FHSI would be useful
(4) More guidance on interpreting the results would be useful
The draft guidance seems largely to have achieved a good balance between being concise but
still sufficiently clear and detailed, with response 1 accounting for 86 percent of the responses
and response 2 for only 1 percent. However, respondents were able to enter more than one
response; some did so, for example, combining response 1 with response 3 or 4. Response 3
accounted for 6 percent of the responses and response 4 for 8 percent. A few respondents
offered explicit suggestions for improving the guidance, which were particularly appreciated.
The responses to this question have been carefully considered in the preparation of the
guidance included in Annex 5.
D. What are the views of YOUR AUTHORITY about the draft mapping to risk‐assessment
categories that has been prepared for the following FHSIs?13
(1) The mapping seems appropriate
(2) The mapping includes categories for which this FHSI is not relevant
(3) The mapping omits some categories for which this FHSI is relevant
Respondents were largely satisfied with the draft guidance mappings of the FHSIs to risk‐
assessment categories, with response 1 accounting for 96 percent of the responses.
Respondents were able to enter more than one response, and some did so. Response 2
accounted for only 1 percent of the responses and response 3 for 4 percent. The responses to
this question have been carefully considered in the preparation of the mapping included in
Annex 5. Although none of the mappings in the draft guidance were deleted, most of the
additions suggested by respondents have been included. Also, the comments inspired further
consideration of the mappings, which resulted in some additions that were not explicitly
suggested by respondents.
12 Survey questions 17, 23, 29, 35, 41, 47, 53, 59, and 65. 13 Survey questions 18, 24, 30, 36, 42, 48, 54, 60, and 66.

Page 26
E. Which the following best describes the use of supervisory benchmarks by YOUR AUTHORITY
for the following FHSIs (or arithmetic transformations of them)?14
(1) Benchmarks have been established, which reflect requirements of legislation
(2) Benchmarks have been established, which are largely based on experience in YOUR
JURISDICTION
(3) Benchmarks have been established, which are largely based on those used by other
supervisors
(4) No benchmarks are used, but it seems like they might be useful
(5) No benchmarks are used, and it does not seem like they would be very useful
(6) Not applicable, because YOUR AUTHORITY does not use this FHSI
In TA projects, supervisors often express interest in having benchmarks against which to assess
the FHSIs of their insurers. However, as noted by some respondents, many FHSIs do not lend
themselves to fixed, internationally applicable benchmarks. In some cases, benchmarks are
appropriate, but will need to vary to reflect factors such as conditions in the local insurance
market or the economy. In some other cases, FHSIs are used primarily to help achieve a better
understanding of an insurer’s business and how it is changing over time, so it might be
inappropriate to establish benchmarks for “good” or “bad” levels of an FHSI.
The chart below shows the distribution of responses, from those authorities using the queried
FHSIs, regarding their use of benchmarks and the sources of the benchmarks that are being
used. The questions also sought views on the potential usefulness of benchmarks for those
FHSIs for which benchmarks are not currently being used. The results confirm the above
observation regarding the level of interest in having benchmarks, with only 14 percent of the
responses relating to cases where benchmarks would not be considered useful. However, only
35 percent of the responses indicated cases where benchmarks are currently in place. The
results suggest that supervisors would be very interested in a database of benchmarks or more
guidance on the development of benchmarks, which is consistent with the response to item g
of question 14.
14 Survey questions 19, 25, 31, 37, 43, 49, 55, 61, and 67.

Page 27
The table below lists the 32 FHSIs for which benchmarks might be most useful. It includes those
FHSIs whose indices15 ranked either in the top two within the respective CARAMELS category or
in the top 20 overall.
15 The index for this question was calculated by applying weights of 10, 10, 7, 5, and 0 to responses 1 through 5, respectively. Those who responded 6 were omitted from the calculation.

Page 28
FHSIs for Which Benchmarks Might Be Most Useful Index
1.01 : Gross written premium / capital 7.0
1.02 : Net written premium / capital 7.4
1.03 : Capital / total assets 7.1
1.04 : Capital / invested assets [FSI] 7.1
1.06 : Cover of solvency margin 9.0
1.07 : Risk‐based capital adequacy ratios 8.7
1.08 : Growth in capital 6.9
1.10 : Statutory deposit / required deposit 8.2
2.01 : (Real estate + unquoted equities + receivables) / total assets 7.3
2.04 : (Real estate + mortgages) / total assets 7.1
2.05 : Maximum deposits in a single bank / total assets 7.2
2.08 : Receivables / capital 7.2
2.10 : Receivables over 90 days / total receivables 7.6
2.13 : Maximum investment in a single counterparty / total assets 7.1
2.14 : Maximum receivable from a single counterparty / total assets 7.3
2.17 : Investments: distribution by type 7.0
3.01 : Risk retention ratio 6.3
3.03 : Maximum exposure to single risk / capital 6.3
3.05 : Maximum premium ceded to a single reinsurer / gross written premium 6.3
4.01 : Net claims provisions / average of net claims paid in last three years 5.9
4.08 : Actuarial assumption: short‐term interest rate 5.9
4.09 : Actuarial assumption: long‐term interest rate 6.3
5.03 : Operating expenses / gross written premium 7.0
5.12 : Board composition 7.2
6.03 : Expense ratio 6.8
6.04 : Combined ratio [FSI Non‐Life] 7.4
7.01 : Liquid assets / current liabilities 7.5
7.03 : Liquid assets / total assets 6.2
8.02 : Related party receivables / total assets 5.9
8.03 : Due to related parties / total assets 5.3
9.03 : Penetration 5.1
9.06 : Concentration ratio 5.2

Page 29
F. If YOUR AUTHORITY has established benchmarks for the following FHSIs, what benchmarks
are used for conventional insurance activities?16
1. Minimum for non‐life insurance
2. Maximum for non‐life insurance
3. Minimum for life insurance
4. Maximum for life insurance
Authorities were asked to provide the benchmarks being used for the FHSIs for which they had
established benchmarks. Unfortunately, very few authorities provided quantitative responses
for most of the FHSIs. For 41 of the 95 FHSIs queried, none of the respondents provided
benchmarks. Among the FHSIs that attracted few or no quantitative responses would be those
that do not lend themselves to the use of benchmarks. However, this still leaves considerable
scope for gathering more data on the benchmarks being used by supervisors.17
The table below lists the 18 FHSIs for which at least 4 authorities provided quantitative
responses.
16 Survey questions 20, 26, 32, 38, 44, 50, 56, 62, and 68. 17 The survey questionnaire allowed free‐form entry of responses regarding the benchmarks used. Perhaps, a more structured format, such as the entry of specific percentages or selection from ranges of percentages, would elicit more quantitative data.

Page 30
FHSIs for Which at Least 4 Authorities Provided Benchmarks
1.02 : Net written premium / capital
1.06 : Cover of solvency margin
1.07 : Risk‐based capital adequacy ratios
1.08 : Growth in capital
2.02 : Real estate / total assets
2.11 : Equities / total assets
2.13 : Maximum investment in a single counterparty / total assets
3.01 : Risk retention ratio
5.03 : Operating expenses / gross written premium
5.05 : Growth in gross written premium
5.06 : Growth in net written premium
5.12 : Board composition
6.01 : Claims ratio
6.03 : Expense ratio
6.04 : Combined ratio [FSI Non‐Life]
6.12 : Return on equity (ROE) [FSI]
6.14 : Return on assets (ROA) [FSI Life]
7.01 : Liquid assets / current liabilities
G. If YOUR AUTHORITY uses FHSIs other than those listed anywhere in the draft guidance,
please provide the following information for each of them, to the extent it is available.18
a. Short name of the FHSI
b. Guidance on calculating the FHSI
c. Guidance on interpreting the results
d. Risk‐assessment categories to which this FHSI relates (refer to the draft mapping, as well
as any other categories in the risk‐assessment framework of YOUR AUTHORITY)
e. Comments on the use of benchmarks for this FHSI (use, usefulness, and basis)
f. Benchmarks used, if any (minimums and maximums for non‐life and life insurance)
Thirteen authorities responded to the request for information about the use of FHSIs other
than those included in the survey questionnaire. Several provided general comments and
approximately 30 additional FHSIs were mentioned. Also, one of the authorities provided
information about extensive guidance on the use of FHSIs available on its website.19
18 Survey questions 69 and thereafter. 19 The National Association of Insurance Commissioners (NAIC) in the United States has many publications freely available on its website; see https://www.naic.org/prod_serv_publications.htm They include the Financial Analysis Handbook, which contains many FHSIs, and the Insurance Regulatory Information Systems (IRIS) Ratios Manual, which focuses on FHSIs that are used for financial condition screening purposes. Each of these publications includes both guidance and benchmarks.

Page 31
Some of the FHSIs mentioned by respondents were the same as those queried but employed
different terminology. Some of the others would facilitate more detailed analyses by focusing
on the composition of various elements of financial results, such as the composition of available
or required capital, or particular types of expenses or claims. Still others were suggestions of
information that could be analyzed, but were not themselves FHSIs, such as exceedance
probability curves.
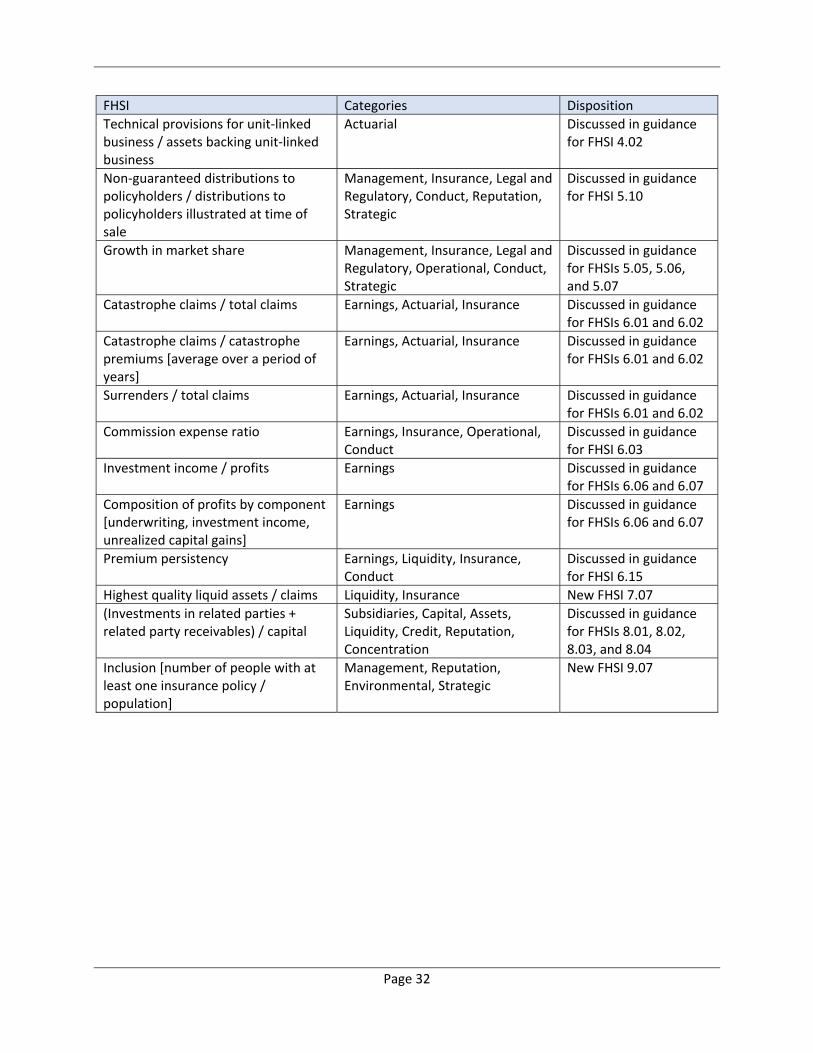
The responses were greatly appreciated, and the information provided has been used in various
ways, as summarized in the following table. This includes the addition of three new FHSIs to the
guidance: capital in excess of minimum required / average annual loss (“burn rate”), highest
quality liquid assets / claims, and inclusion.
FHSI Categories Disposition
Composition of available capital by tier
Capital Discussed in guidance for FHSIs 1.06 and 1.07
Retained earnings or accumulated losses / paid‐up capital
Capital Discussed in guidance for FHSIs 1.06 and 1.07
Impact of long‐term guarantee measures20
Capital Jurisdiction‐specific
Composition of required capital by risk category
Capital Discussed in guidance for FHSIs 1.06 and 1.07
Capital in excess of minimum required / average annual loss
Capital, Legal and Regulatory New FHSI 1.11
Structured finance investments / total investments
Assets Discussed in guidance for FHSIs 2.01 and 2.17
Assets with counterparty risk / total assets
Assets Discussed in guidance for FHSIs 2.13, 2,14 and 2.17
Debt securities / total assets Assets Discussed in guidance for FHSIs 2.13, 2,14 and 2.17
Growth in claims paid Actuarial Discussed in guidance for FHSI 4.01
Growth in technical provisions Actuarial, Management, Insurance, Legal and Regulatory, Operational, Conduct, Strategic
Discussed in guidance for FHSIs 4.02 and 5.07
Surrender values / technical provisions [for relevant life classes of business]
Actuarial Discussed in guidance for FHSI 4.02
20 The long‐term guarantees measures were introduced in the Solvency II Directive to ensure an appropriate treatment of insurance products that include long‐term guarantees. The long‐term guarantees measures are the following: the extrapolation of risk‐free interest rates; the matching adjustment; the volatility adjustment; the extension recovery period in case of non‐compliance with the Solvency Capital Requirement; the transitional measure on the risk‐free interest rates; the transitional measure on technical provisions.
Page 32
FHSI Categories Disposition
Technical provisions for unit‐linked business / assets backing unit‐linked business
Actuarial Discussed in guidance for FHSI 4.02
Non‐guaranteed distributions to policyholders / distributions to policyholders illustrated at time of sale
Management, Insurance, Legal and Regulatory, Conduct, Reputation, Strategic
Discussed in guidance for FHSI 5.10
Growth in market share Management, Insurance, Legal and Regulatory, Operational, Conduct, Strategic
Discussed in guidance for FHSIs 5.05, 5.06, and 5.07
Catastrophe claims / total claims Earnings, Actuarial, Insurance Discussed in guidance for FHSIs 6.01 and 6.02
Catastrophe claims / catastrophe premiums [average over a period of years]
Earnings, Actuarial, Insurance Discussed in guidance for FHSIs 6.01 and 6.02
Surrenders / total claims Earnings, Actuarial, Insurance Discussed in guidance for FHSIs 6.01 and 6.02
Commission expense ratio Earnings, Insurance, Operational, Conduct
Discussed in guidance for FHSI 6.03
Investment income / profits Earnings Discussed in guidance for FHSIs 6.06 and 6.07
Composition of profits by component [underwriting, investment income, unrealized capital gains]
Earnings Discussed in guidance for FHSIs 6.06 and 6.07
Premium persistency Earnings, Liquidity, Insurance, Conduct
Discussed in guidance for FHSI 6.15
Highest quality liquid assets / claims Liquidity, Insurance New FHSI 7.07
(Investments in related parties + related party receivables) / capital
Subsidiaries, Capital, Assets, Liquidity, Credit, Reputation, Concentration
Discussed in guidance for FHSIs 8.01, 8.02, 8.03, and 8.04
Inclusion [number of people with at least one insurance policy / population]
Management, Reputation, Environmental, Strategic
New FHSI 9.07

Page 33
Annex 1 Respondents by Jurisdiction
Nature of Jurisdiction Income Level21 IAIS Region
IAIS Member
FSB
Other OEC
D
Other
Low In
come
Lower M
iddle
Income
Upper M
iddle
Income
High In
come
Asia an
d Ocean
ia
Central, Eastern
European
d
Latin America
Middle East an
d
NorthAfrica
North America
Offshore and
CaribbeanIslands
Sub‐Sah
ara Africa
Western Europe
Albania x x x
Austria x x x
Bahamas x x x
Belgium x x x
Belize x x x
Bermuda x x x
British Virgin Islands x x x
Canada ‐ OSFI x x x
Cayman Islands, BWI x x x
China, Hong Kong x x x
Chinese Taipei x x x
Colombia x x x
Croatia (Republic of ) x x x
Gibraltar x x x
Hungary x x x
India x x x
Lithuania x x x
Malaysia x x x
Maldives (Republic of ) x x x
Namibia x x x
Nigeria x x x
Pakistan x x x
Philippines x x x
Portugal x x x
Rwanda x x x
Slovakia x x x
Slovenia x x x
South Africa x x x
Turkey x x x
Turks & Caicos BWI x x x
Uruguay x x x
USA, NAIC x x x
Vanuatu x x x
Jurisdictions of respondents by category 6 6 21 1 5 8 19 7 7 2 0 2 8 4 3
Total number of respondents 33
21 World Bank classification

Page 34
Annex 2 Detailed Results by Question
0. Distribution of respondents by nature of jurisdiction and IAIS region
FSB jurisdictions
Other OECD jurisdictions
Other jurisdictions
Total
Asia and Oceania 2 0 5 7
Central, Eastern Europe and Transcaucasia 1 3 3 7
Latin America 0 0 2 2
Middle East and North Africa 0 0 0 0
North America 2 0 0 2
Offshore and Caribbean Islands 0 0 8 8
Sub‐Sahara Africa 1 0 3 4
Western Europe 0 3 0 3
Total number of respondents 6 6 21 33
1. What is the institutional nature of YOUR AUTHORITY?
(1) Department within central bank or monetary authority (2) Department within government ministry (for example, Ministry of Finance) (3) Autonomous public authority (for example, Financial Services Authority)
(1) (2) (3) Total
Results by Nature of Jurisdiction
FSB jurisdictions 1 1 4 6
Other OECD jurisdictions 3 0 3 6
Other jurisdictions 6 3 12 21
Total number of respondents 10 4 19 33
Results by IAIS Region
Asia and Oceania 2 2 3 7
Central, Eastern Europe and Transcaucasia 3 1 3 7
Latin America 1 0 1 2
Middle East and North Africa 0 0 0 0
North America 0 0 2 2
Offshore and Caribbean Islands 1 1 6 8
Sub‐Sahara Africa 2 0 2 4
Western Europe 1 0 2 3
Total number of respondents 10 4 19 33

Page 35
2. Which financial sectors are supervised by YOUR AUTHORITY? (More than one response may be entered, where applicable.)
(1) Insurance (2) Pensions (3) Banking (4) Securities (5) Other
(1) (2) (3) (4) (5) Total
Results by Nature of Jurisdiction
FSB jurisdictions 6 3 2 0 1 6
Other OECD jurisdictions 6 5 4 4 2 6
Other jurisdictions 21 10 14 13 15 21
Total number of respondents 33 18 20 17 18 33
Results by IAIS Region
Asia and Oceania 7 2 3 2 4 7
Central, Eastern Europe and Transcaucasia 7 7 3 5 2 7
Latin America 2 2 2 2 2 2
Middle East and North Africa 0 0 0 0 0 0
North America 2 1 1 0 0 2
Offshore and Caribbean Islands 8 2 7 5 5 8
Sub‐Sahara Africa 4 2 2 1 3 4
Western Europe 3 2 2 2 2 3
Total number of respondents 33 18 20 17 18 33
2.1 Number of financial sectors supervised.
1 2 3 4 5 Total Average number supervised
Results by Nature of Jurisdiction
FSB jurisdictions 2 2 2 0 0 6 2.00
Other OECD jurisdictions 0 2 0 3 1 6 3.50
Other jurisdictions 2 1 5 11 2 21 3.48
Total number of respondents 4 5 7 14 3 33 3.21
Results by IAIS Region
Asia and Oceania 1 2 3 1 0 7 2.57
Central, Eastern Europe and Transcaucasia 0 2 0 5 0 7 3.43
Latin America 0 0 0 0 2 2 5.00
Middle East and North Africa 0 0 0 0 0 0 ‐
North America 1 0 1 0 0 2 2.00
Offshore and Caribbean Islands 1 0 2 5 0 8 3.38
Sub‐Sahara Africa 1 0 1 2 0 4 3.00
Western Europe 0 1 0 1 1 3 3.67
Total number of respondents 4 5 7 14 3 33 3.21

Page 36
3. What types of insurance activities are supervised by YOUR AUTHORITY? (More than one response may be entered, where applicable.)
(1) Conventional insurance (2) Microinsurance (3) Takaful (4) Microtakaful (5) Offshore insurance
(1) (2) (3) (4) (5) Total
Results by Nature of Jurisdiction
FSB jurisdictions 6 2 0 0 1 6
Other OECD jurisdictions 6 1 0 0 1 6
Other jurisdictions 21 11 4 3 11 21
Total number of respondents 33 14 4 3 13 33
Results by IAIS Region
Asia and Oceania 7 6 3 3 3 7
Central, Eastern Europe and Transcaucasia 7 0 0 0 0 7
Latin America 2 1 0 0 1 2
Middle East and North Africa 0 0 0 0 0 0
North America 2 0 0 0 0 2
Offshore and Caribbean Islands 8 2 0 0 7 8
Sub‐Sahara Africa 4 4 1 0 1 4
Western Europe 3 1 0 0 1 3
Total number of respondents 33 14 4 3 13 33
4. In which aspects of regulation or supervision are YOUR AUTHORITY involved? (More than one response may be entered, where applicable.)
(1) Micro‐prudential (2) Macro‐prudential (3) Market conduct (4) Financial integrity (for example, anti‐money laundering) (5) Competition policy (6) Market development
(1) (2) (3) (4) (5) (6) Total
Results by Nature of Jurisdiction
FSB jurisdictions 5 5 4 4 0 3 6
Other OECD jurisdictions 6 6 5 6 0 1 6
Other jurisdictions 20 20 18 20 5 13 21
Total number of respondents 31 31 27 30 5 17 33
Results by IAIS Region
Asia and Oceania 6 6 6 7 1 6 7
Central, Eastern Europe and Transcaucasia 6 7 7 7 1 2 7
Latin America 2 2 2 2 0 1 2
Middle East and North Africa 0 0 0 0 0 0 0
North America 2 1 1 0 0 0 2
Offshore and Caribbean Islands 8 8 6 7 1 4 8
Sub‐Sahara Africa 4 4 3 4 2 3 4
Western Europe 3 3 2 3 0 1 3
Total number of respondents 31 31 27 30 5 17 33

Page 37
5. To what extent does YOUR AUTHORITY use FHSIs in supervising each of the following types of insurance activities?
(1) Used regularly and consistently (2) Used often but not always consistently (3) Used sometimes (4) Seldom if ever used (5) Not applicable, because YOUR AUTHORITY has no responsibility for this type of insurance activity
Weights for index: 10 7 4 1 omit
(1) (2) (3) (4) (5) Total Index Rank
a. Conventional insurance 28 5 0 0 0 33 9.5 1
b. Microinsurance 9 1 1 3 19 33 7.4 2
c. Takaful 2 1 0 2 28 33 5.8 5
d. Microtakaful 2 0 0 1 30 33 7.0 3
e. Offshore insurance 6 4 2 3 18 33 6.6 4
Total and Average Index 47 11 3 9 95 8.1
6. To what extent does YOUR AUTHORITY use FHSIs in each of the following aspects of regulation or supervision?
(1) Used regularly and consistently (2) Used often but not always consistently (3) Used sometimes (4) Seldom if ever used (5) Not applicable, because YOUR AUTHORITY has no responsibility for this aspect of regulation or
supervision
Weights for index: 10 7 4 1 omit
(1) (2) (3) (4) (5) Total Index Rank
a. Micro‐prudential 28 3 0 1 1 33 9.4 1
b. Macro‐prudential 22 7 2 2 0 33 8.5 2
c. Market conduct 15 6 5 4 3 33 7.2 4
d. Financial integrity 19 7 1 4 2 33 8.0 3
e. Competition policy 2 1 2 4 24 33 4.3 6
f. Market development 9 5 5 3 11 33 6.7 5
Total and Average Index 95 29 15 18 41 7.8
Page 38
7. To what extent does YOUR AUTHORITY have the following tools and guidance to support the use of FHSIs?
(1) Available for all or most FHSIs, where relevant (2) Available for many FHSIs (3) Available for few if any FHSIs (4) Not available
Weights for index: 10 7 2 0
(1) (2) (3) (4) Total Index Rank
a. A structured database of the data needed to calculate FHSIs 12 14 2 5 33 6.7 2
b. A supervisory reporting system that automatically calculates FHSIs for each insurer
9 12 4 8 33 5.5 6
c. Standardized spreadsheets that are used to calculate FHSIs 10 14 3 6 33 6.2 3
d. Instructions for calculating FHSIs, including the data and methodology
11 12 5 5 33 6.2 3
e. A supervisory reporting system or standardized spreadsheets that facilitate the analysis of trends in the FHSIs for each insurer
12 16 1 4 33 7.1 1
f. A supervisory reporting system or standardized spreadsheets that facilitate the comparison of FHSIs for peer groups of insurers
8 14 5 6 33 5.7 5
g. Supervisory benchmarks for specific FHSIs 8 9 11 5 33 5.0 7
h. Written guidance on the interpretation of specific FHSIs 6 13 6 8 33 4.9 8
i. Written guidance on the use of FHSIs, in general 7 11 7 8 33 4.9 8
j. Training on the interpretation of specific FHSIs 5 12 9 7 33 4.6 10
k. Training on the use of FHSIs, in general 6 10 9 8 33 4.5 11
Total and Average Index 94 137 62 70 5.6
8. To what extent does YOUR AUTHORITY communicate with insurers regarding your use of FHSIs?
(1) Communicated for all or most FHSIs, where relevant (2) Communicated for many FHSIs (3) Communicated for a few FHSIs (4) Not communicated
Weights for index: 10 7 2 0
(1) (2) (3) (4) Total Index Rank
a. General explanation of how FHSIs are used 5 9 6 13 33 3.8 1
b. Descriptions of the FHSIs used 4 6 7 16 33 2.9 3
c. Supervisory benchmarks for specific FHSIs 2 5 8 18 33 2.2 5
d. Results of calculations of specific FHSIs for the insurer 3 9 13 8 33 3.6 2
e. Aggregate results of calculations of specific FHSIs for peer groups of insurers or the industry
3 7 4 19 33 2.6 4
Total and Average Index 17 36 38 74 3.0

Page 39
9. To what extent does YOUR AUTHORITY communicate with the general public regarding your use of FHSIs?
(1) Communicated for all or most FHSIs, where relevant (2) Communicated for many FHSIs (3) Communicated for a few FHSIs (4) Not communicated
Weights for index: 10 7 2 0
(1) (2) (3) (4) Total Index Rank
a. General explanation of how FHSIs are used 4 5 4 20 33 2.5 1
b. Descriptions of the FHSIs used 4 4 5 20 33 2.4 2
c. Supervisory benchmarks for specific FHSIs 2 3 5 23 33 1.5 4
d. Results of calculations of specific FHSIs for specific insurers, with the insurers identified
1 3 4 25 33 1.2 5
e. Results of calculations of specific FHSIs for specific insurers, but with the insurers not identified
0 2 5 26 33 0.7 6
f. Aggregate results of calculations of specific FHSIs for peer groups of insurers or the industry
2 6 9 16 33 2.4 2
Total and Average Index 13 23 32 130 1.8
10. Which of the following categories are included in the risk‐assessment framework used by YOUR AUTHORITY?
(1) Included in the framework (2) A similar category is included (explain) (3) Not included (4) Not applicable, because YOUR AUTHORITY has no risk‐assessment framework
Weights for index: 10 7 0 omit
(1) (2) (3) (4) Total Index Rank
a. Capital 28 4 0 1 33 9.6 2
b. Assets 27 5 0 1 33 9.5 3
c. Reinsurance 26 4 2 1 33 9.0 7
d. Actuarial 28 2 2 1 33 9.2 4
e. Management 26 4 2 1 33 9.0 7
f. Earnings 31 1 0 1 33 9.9 1
g. Liquidity 28 2 2 1 33 9.2 4
h. Subsidiaries (or Group or Related Parties) 19 5 7 2 33 7.3 15
i. Insurance 27 3 2 1 33 9.1 6
j. Credit 26 3 3 1 33 8.8 9
k. Market 26 2 4 1 33 8.6 11
l. Operational 24 4 4 1 33 8.4 12
m. Legal and Regulatory 25 3 3 2 33 8.7 10
n. Conduct 15 6 9 3 33 6.4 17
o. Reputation 17 5 8 3 33 6.8 16
p. Concentration 22 4 4 3 33 8.3 13
q. Environmental (sectoral and macro risks) 14 6 9 4 33 6.3 18
r. Strategic 21 2 7 3 33 7.5 14
s. Other categories (explain) 6 1 13 13 33 3.4 19
Total and Average Index 436 66 81 44 8.3

Page 40
11. In total, how many FHSIs does YOUR AUTHORITY use? (When responding, count each FHSI only once, even if some FHSIs relate to more than one risk‐assessment category.)
(1) 100 or more (2) 75 to 99 (3) 50 to 74 (4) 25 to 49 (5) 15 to 24 (6) 10 to 14 (7) 9 or fewer
Weights for index:22 110 85 60 35 20 12 5
(1) (2) (3) (4) (5) (6) (7) Total Index Rank
Results by Nature of Jurisdiction
FSB jurisdictions 1 0 2 2 1 0 0 6 53.3 2
Other OECD jurisdictions 3 0 1 2 0 0 0 6 76.7 1
Other jurisdictions 0 1 5 10 4 0 1 21 39.0 3
Total number of respondents 4 1 8 14 5 0 1 33 48.5
Results by IAIS Region
Asia and Oceania 0 0 2 2 2 0 1 7 33.6 7
Central, Eastern Europe and Transcaucasia
1 0 0 6 0 0 0 7 45.7 4
Latin America 0 0 0 2 0 0 0 2 35.0 6
Middle East and North Africa 0 0 0 0 0 0 0 0 N/A N/A
North America 1 0 0 1 0 0 0 2 72.5 2
Offshore and Caribbean Islands 0 1 2 2 3 0 0 8 41.9 5
Sub‐Sahara Africa 0 0 3 1 0 0 0 4 53.8 3
Western Europe 2 0 1 0 0 0 0 3 93.3 1
Total number of respondents 4 1 8 14 5 0 1 33 48.5
22 The weights are not necessarily the midpoints of the respective ranges. An assumption was made that the average within a range might be lower than the midpoint.

Page 41
12. How many FHSIs does YOUR AUTHORITY use when assessing each of the categories in your risk‐assessment framework? (When responding, count all FHSIs mapped to the risk‐assessment category, even if they have also been mapped other categories.)
(1) 10 or more FHSIs (2) 5 to 9 FHSIs (3) 1 to 4 FHSIs (4) No FHSIs are used when assessing this category (5) Not applicable, because this category is not used
Weights for index:23 12 7 3 0 omit
(1) (2) (3) (4) (5) Total Index Rank
a. Capital 7 13 13 0 0 33 6.5 3
b. Assets 7 13 13 0 0 33 6.5 3
c. Reinsurance 1 8 22 0 2 33 4.3 9
d. Actuarial 6 8 17 1 1 33 5.6 5
e. Management 5 9 11 7 1 33 4.9 6
f. Earnings 13 14 4 2 0 33 8.1 1
g. Liquidity 1 6 23 1 2 33 4.0 12
h. Subsidiaries (or Group or Related Parties)
2 1 14 9 7 33 2.8 15
i. Insurance 13 4 13 1 2 33 7.2 2
j. Credit 3 10 14 3 3 33 4.9 6
k. Market 4 6 16 6 1 33 4.3 9
l. Operational 3 9 12 6 3 33 4.5 8
m. Legal and Regulatory 0 4 11 14 4 33 2.1 17
n. Conduct 1 2 7 15 8 33 1.9 19
o. Reputation 0 4 7 13 9 33 2.0 18
p. Concentration 5 2 20 4 2 33 4.3 9
q. Environmental (sectoral and macro risks)
1 6 11 7 8 33 3.5 14
r. Strategic 6 1 8 11 7 33 4.0 12
s. Other categories (explain) 1 1 1 6 21 30 2.4 16
Total and Average Index 79 121 237 106 81 4.6
23 The weights are not necessarily the midpoints of the respective ranges. An assumption was made that the average in the “1 to 4” category might be higher than the midpoint, because the use of only a single indicator for a category is not often seen in practice.

Page 42
13. To what extent has YOUR AUTHORITY progressed in revising the FHSIs it uses to take account of anticipated changes in financial reporting and regulatory requirements related to IFRS 9 and IFRS 17?
(1) Revisions were needed and have already been made (2) No revisions were considered necessary (3) Revisions will be needed, but have not yet been made (4) The need for revisions has not yet been considered (5) Not applicable, because this category is not used (6) Not applicable, because IFRS is not used by insurers in YOUR JURISDICTION
Weights for index: 10 9 5 0 omit omit
(1) (2) (3) (4) (5) (6) Total Index Rank
a. Capital 3 2 12 12 0 0 29 3.7 2
b. Assets 3 3 11 12 0 0 29 3.9 1
c. Reinsurance 3 2 9 15 0 0 29 3.2 11
d. Actuarial 4 1 10 14 0 0 29 3.4 6
e. Management 1 3 10 15 0 0 29 3.0 12
f. Earnings 3 2 10 14 0 0 29 3.4 6
g. Liquidity 2 2 11 13 1 0 29 3.3 9
h. Subsidiaries (or Group or Related Parties)
1 0 12 12 3 0 28 2.8 16
i. Insurance 4 1 11 12 0 0 28 3.7 2
j. Credit 1 3 11 12 1 0 28 3.4 6
k. Market 1 2 10 14 0 0 27 2.9 13
l. Operational 1 4 9 12 1 0 27 3.5 4
m. Legal and Regulatory 2 3 9 14 0 0 28 3.3 9
n. Conduct 2 3 8 12 3 0 28 3.5 4
o. Reputation 1 2 9 14 2 0 28 2.8 16
p. Concentration 1 2 10 15 0 0 28 2.8 16
q. Environmental (sectoral and macro risks)
1 1 10 12 4 0 28 2.9 13
r. Strategic 1 2 10 14 1 0 28 2.9 13
s. Other categories (explain) 0 0 3 5 9 0 17 1.9 19
Total and Average Index 35 38 185 243 25 0 3.2
Page 43
14. In addition to the resources and tools currently available (for example, the Core Curriculum modules), to what extent would the following initiatives that might be considered by the IMF, the WBG, or others be useful to YOUR AUTHORITY in enhancing your use of FHSIs?
(1) Very useful (2) Useful (3) Somewhat useful (4) Not useful
Weights for index: 10 7 4 0
(1) (2) (3) (4) Total Index Rank
a. A paper that summarizes the results of this survey and briefly discusses the use of FHSIs
15 11 5 0 31 8.0 8
b. A list of FHSIs used by insurance supervisors 23 7 2 0 32 9.0 1
c. A mapping of FHSIs to risk‐assessment categories 20 8 4 0 32 8.5 4
d. Guidance on the calculation of specific FHSIs 21 8 2 1 32 8.6 3
e. Guidance on the interpretation of specific FHSIs 21 9 1 1 32 8.7 2
f. A process for obtaining ongoing input on the above items and making periodic updates
14 10 7 1 32 7.4 12
g. An accessible database of the FHSIs used by individual supervisors and the supervisory benchmarks they have established
20 6 4 2 32 8.1 7
h. An Excel workbook that can be used to calculate FHSIs and make comparisons among insurers
22 5 0 5 32 8.0 8
i. Development for trainers 19 5 5 3 32 7.7 10
j. Regional or international training seminars 21 5 4 2 32 8.2 5
k. Interactive webinars 18 10 3 1 32 8.2 5
l. Individual e‐learning materials 14 12 5 1 32 7.6 11
m. Developing similar resources and tools for pensions supervisors
16 7 3 6 32 6.9 13
n. Other (please elaborate) 6 0 0 10 16 3.8 14
Total and Average Index 250 103 45 33 7.9

Page 44
1. Capital
15. Does YOUR AUTHORITY use the following FHSIs?
(1) Yes, as described (2) An arithmetic transformation is used (3) No
Weights for index: 10 8 0
(1) (2) (3) Total Index Rank
1.01 : Gross written premium / capital 13 1 18 32 4.3 6
1.02 : Net written premium / capital 17 0 15 32 5.3 5
1.03 : Capital / total assets 15 4 13 32 5.7 4
1.04 : Capital / invested assets [FSI] 6 1 24 31 2.2 10
1.05 : Capital / technical provisions 10 4 18 32 4.1 7
1.06 : Cover of solvency margin 27 1 4 32 8.7 1
1.07 : Risk‐based capital adequacy ratios 20 1 11 32 6.5 3
1.08 : Growth in capital 26 2 4 32 8.6 2
1.09 : Net growth in capital 10 2 20 32 3.6 8
1.10 : Statutory deposit / required deposit 11 0 21 32 3.4 9
Total and Average Index 155 16 148 5.3
16. What are the views of YOUR AUTHORITY about the usefulness of the following FHSIs (or arithmetic transformations of them)?
(1) We use it, and find it useful (2) We use it, but do not find it very useful (3) We do not use it, because we use other FHSIs that provide similar information (4) We do not use it, but it seems like it might be useful (5) We do not use it, and it does not seem like it would be very useful
Weights for index: 10 2 5 7 0
(1) (2) (3) (4) (5) Total Index Rank
1.01 : Gross written premium / capital 13 0 4 10 4 31 7.1 7
1.02 : Net written premium / capital 17 0 1 9 4 31 7.7 5
1.03 : Capital / total assets 18 0 2 11 0 31 8.6 3
1.04 : Capital / invested assets [FSI] 6 0 5 14 6 31 5.9 9
1.05 : Capital / technical provisions 11 0 4 14 2 31 7.4 6
1.06 : Cover of solvency margin 28 0 0 2 1 31 9.5 1
1.07 : Risk‐based capital adequacy ratios 20 1 1 7 2 31 8.3 4
1.08 : Growth in capital 28 0 0 2 1 31 9.5 1
1.09 : Net growth in capital 12 0 4 11 4 31 7.0 8
1.10 : Statutory deposit / required deposit 9 1 1 5 15 31 4.3 10
Total and Average Index 162 2 22 85 39 7.5
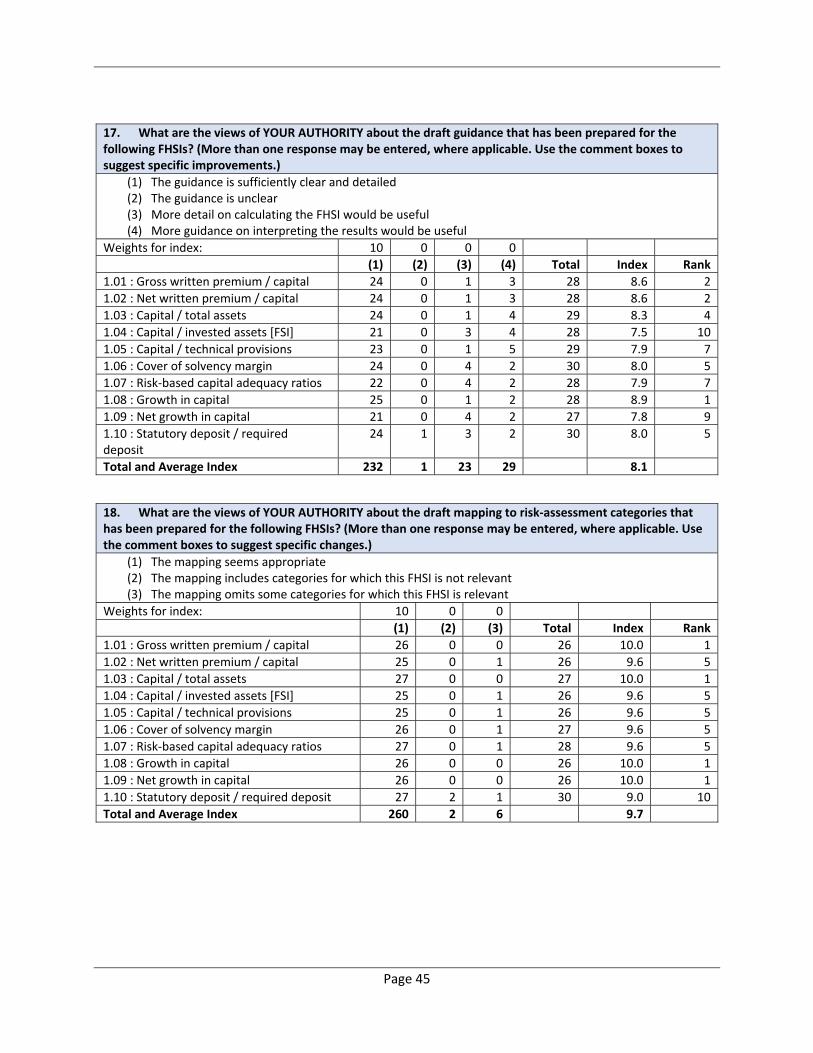
Page 45
17. What are the views of YOUR AUTHORITY about the draft guidance that has been prepared for the following FHSIs? (More than one response may be entered, where applicable. Use the comment boxes to suggest specific improvements.)
(1) The guidance is sufficiently clear and detailed (2) The guidance is unclear (3) More detail on calculating the FHSI would be useful (4) More guidance on interpreting the results would be useful
Weights for index: 10 0 0 0
(1) (2) (3) (4) Total Index Rank
1.01 : Gross written premium / capital 24 0 1 3 28 8.6 2
1.02 : Net written premium / capital 24 0 1 3 28 8.6 2
1.03 : Capital / total assets 24 0 1 4 29 8.3 4
1.04 : Capital / invested assets [FSI] 21 0 3 4 28 7.5 10
1.05 : Capital / technical provisions 23 0 1 5 29 7.9 7
1.06 : Cover of solvency margin 24 0 4 2 30 8.0 5
1.07 : Risk‐based capital adequacy ratios 22 0 4 2 28 7.9 7
1.08 : Growth in capital 25 0 1 2 28 8.9 1
1.09 : Net growth in capital 21 0 4 2 27 7.8 9
1.10 : Statutory deposit / required deposit
24 1 3 2 30 8.0 5
Total and Average Index 232 1 23 29 8.1
18. What are the views of YOUR AUTHORITY about the draft mapping to risk‐assessment categories that has been prepared for the following FHSIs? (More than one response may be entered, where applicable. Use the comment boxes to suggest specific changes.)
(1) The mapping seems appropriate (2) The mapping includes categories for which this FHSI is not relevant (3) The mapping omits some categories for which this FHSI is relevant
Weights for index: 10 0 0
(1) (2) (3) Total Index Rank
1.01 : Gross written premium / capital 26 0 0 26 10.0 1
1.02 : Net written premium / capital 25 0 1 26 9.6 5
1.03 : Capital / total assets 27 0 0 27 10.0 1
1.04 : Capital / invested assets [FSI] 25 0 1 26 9.6 5
1.05 : Capital / technical provisions 25 0 1 26 9.6 5
1.06 : Cover of solvency margin 26 0 1 27 9.6 5
1.07 : Risk‐based capital adequacy ratios 27 0 1 28 9.6 5
1.08 : Growth in capital 26 0 0 26 10.0 1
1.09 : Net growth in capital 26 0 0 26 10.0 1
1.10 : Statutory deposit / required deposit 27 2 1 30 9.0 10
Total and Average Index 260 2 6 9.7

Page 46
19. Which the following best describes the use of supervisory benchmarks by YOUR AUTHORITY for the following FHSIs (or arithmetic transformations of them)?
(1) Benchmarks have been established, which reflect requirements of legislation (2) Benchmarks have been established, which are largely based on experience in YOUR JURISDICTION (3) Benchmarks have been established, which are largely based on those used by other supervisors (4) No benchmarks are used, but it seems like they might be useful (5) No benchmarks are used, and it does not seem like they would be very useful (6) Not applicable, because YOUR AUTHORITY does not use this FHSI
Weights for index: 10 10 7 5 0 omit
(1) (2) (3) (4) (5) (6) Total Index Rank
1.01 : Gross written premium / capital
2 6 2 5 2 14 31 7.0 7
1.02 : Net written premium / capital 3 6 4 6 1 11 31 7.4 4
1.03 : Capital / total assets 3 6 2 9 1 9 30 7.1 5
1.04 : Capital / invested assets [FSI] 3 3 1 5 1 18 31 7.1 5
1.05 : Capital / technical provisions 2 5 3 4 4 13 31 6.2 10
1.06 : Cover of solvency margin 17 6 1 3 1 3 31 9.0 1
1.07 : Risk‐based capital adequacy ratios
14 3 1 3 1 8 30 8.7 2
1.08 : Growth in capital 3 8 4 11 2 3 31 6.9 8
1.09 : Net growth in capital 2 3 2 6 2 15 30 6.3 9
1.10 : Statutory deposit / required deposit
6 3 1 2 1 18 31 8.2 3
Total and Average Index 55 49 21 54 16 112 7.5

Page 47
20. If YOUR AUTHORITY has established benchmarks for the following FHSIs, what benchmarks are used for conventional insurance activities? (If the FHSI is not used by YOUR AUTHORITY or no benchmark has been established, please leave the relevant cell blank.)
(1) Minimum for non‐life insurance (2) Maximum for non‐life insurance (3) Minimum for life insurance (4) Maximum for life insurance
First row : number of quantitative responses (1) (2) (3) (4)
1.01 : Gross written premium / capital 2 3 1 1
Lowest 100 400 100 900
Average 200 667 100 900
Highest 300 900 100 900
1.02 : Net written premium / capital 3 5 3 3
Lowest 0 300 0 300
Average 133 460 33 933
Highest 300 1000 100 2000
1.03 : Capital / total assets 1 0 0 0
Lowest 100 N/A N/A N/A
Average 100 N/A N/A N/A
Highest 100 N/A N/A N/A
1.04 : Capital / invested assets [FSI] 1 1 1 1
Lowest 70 100 30 100
Average 70 100 30 100
Highest 70 100 30 100
1.05 : Capital / technical provisions 3 2 1 1
Lowest 0 100 50 100
Average 50 175 50 100
Highest 100 250 50 100
1.06 : Cover of solvency margin 12 1 11 1
Lowest 100 150 100 200
Average 109 150 116 200
Highest 150 150 150 200
1.07 : Risk‐based capital adequacy ratios 7 1 6 1
Lowest 100 130 100 130
Average 126 130 122 130
Highest 200 130 150 130
1.08 : Growth in capital 4 2 3 1
Lowest 5 50 0 50
Average 11 50 10 50
Highest 20 50 20 50
1.09 : Net growth in capital 0 0 0 0
Lowest N/A N/A N/A N/A
Average N/A N/A N/A N/A
Highest N/A N/A N/A N/A
1.10 : Statutory deposit / required deposit 1 0 0 0
Lowest 100 N/A N/A N/A
Average 100 N/A N/A N/A
Highest 100 N/A N/A N/A

Page 48
Notes:
1.06: Cover of solvency margin: One supervisor reports benchmarks that differ by size. One supervisor
reports three levels of benchmarks (middle level included in table).
1.07: Risk‐based capital adequacy ratios: One supervisor reports three levels of benchmarks (middle level
included in table).
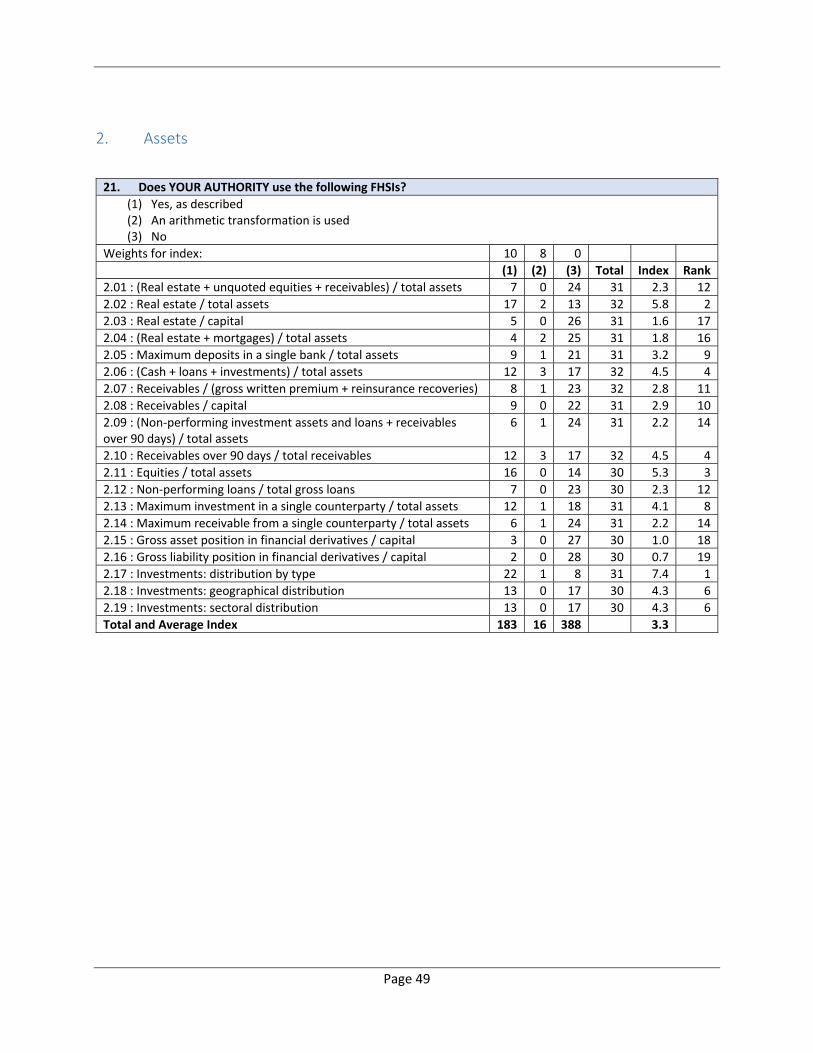
Page 49
2. Assets
21. Does YOUR AUTHORITY use the following FHSIs?
(1) Yes, as described (2) An arithmetic transformation is used (3) No
Weights for index: 10 8 0
(1) (2) (3) Total Index Rank
2.01 : (Real estate + unquoted equities + receivables) / total assets 7 0 24 31 2.3 12
2.02 : Real estate / total assets 17 2 13 32 5.8 2
2.03 : Real estate / capital 5 0 26 31 1.6 17
2.04 : (Real estate + mortgages) / total assets 4 2 25 31 1.8 16
2.05 : Maximum deposits in a single bank / total assets 9 1 21 31 3.2 9
2.06 : (Cash + loans + investments) / total assets 12 3 17 32 4.5 4
2.07 : Receivables / (gross written premium + reinsurance recoveries) 8 1 23 32 2.8 11
2.08 : Receivables / capital 9 0 22 31 2.9 10
2.09 : (Non‐performing investment assets and loans + receivables over 90 days) / total assets
6 1 24 31 2.2 14
2.10 : Receivables over 90 days / total receivables 12 3 17 32 4.5 4
2.11 : Equities / total assets 16 0 14 30 5.3 3
2.12 : Non‐performing loans / total gross loans 7 0 23 30 2.3 12
2.13 : Maximum investment in a single counterparty / total assets 12 1 18 31 4.1 8
2.14 : Maximum receivable from a single counterparty / total assets 6 1 24 31 2.2 14
2.15 : Gross asset position in financial derivatives / capital 3 0 27 30 1.0 18
2.16 : Gross liability position in financial derivatives / capital 2 0 28 30 0.7 19
2.17 : Investments: distribution by type 22 1 8 31 7.4 1
2.18 : Investments: geographical distribution 13 0 17 30 4.3 6
2.19 : Investments: sectoral distribution 13 0 17 30 4.3 6
Total and Average Index 183 16 388 3.3

Page 50
22. What are the views of YOUR AUTHORITY about the usefulness of the following FHSIs (or arithmetic transformations of them)?
(1) We use it, and find it useful (2) We use it, but do not find it very useful (3) We do not use it, because we use other FHSIs that provide similar information (4) We do not use it, but it seems like it might be useful (5) We do not use it, and it does not seem like it would be very useful
Weights for index: 10 2 5 7 0
(1) (2) (3) (4) (5) Total Index Rank
2.01 : (Real estate + unquoted equities + receivables) / total assets
7 0 3 14 7 31 5.9 14
2.02 : Real estate / total assets 19 0 1 7 4 31 7.9 3
2.03 : Real estate / capital 5 0 2 16 8 31 5.5 16
2.04 : (Real estate + mortgages) / total assets 6 0 4 16 5 31 6.2 12
2.05 : Maximum deposits in a single bank / total assets 9 0 3 16 4 32 6.8 9
2.06 : (Cash + loans + investments) / total assets 13 0 3 11 5 32 6.9 8
2.07 : Receivables / (gross written premium + reinsurance recoveries)
9 0 1 14 8 32 6.0 13
2.08 : Receivables / capital 8 0 2 18 4 32 6.8 9
2.09 : (Non‐performing investment assets and loans + receivables over 90 days) / total assets
6 0 1 16 8 31 5.7 15
2.10 : Receivables over 90 days / total receivables 14 0 2 11 5 32 7.1 7
2.11 : Equities / total assets 18 0 1 10 2 31 8.2 2
2.12 : Non‐performing loans / total gross loans 7 0 0 15 10 32 5.5 16
2.13 : Maximum investment in a single counterparty / total assets
12 0 3 15 2 32 7.5 4
2.14 : Maximum receivable from a single counterparty / total assets
6 0 2 21 3 32 6.8 9
2.15 : Gross asset position in financial derivatives / capital 3 0 2 14 12 31 4.5 19
2.16 : Gross liability position in financial derivatives / capital
2 0 2 16 11 31 4.6 18
2.17 : Investments: distribution by type 24 0 0 7 1 32 9.0 1
2.18 : Investments: geographical distribution 14 0 2 12 3 31 7.5 4
2.19 : Investments: sectoral distribution 14 0 1 11 5 31 7.2 6
Total and Average Index 196 0 35 260 107 6.6

Page 51
23. What are the views of YOUR AUTHORITY about the draft guidance that has been prepared for the following FHSIs? (More than one response may be entered, where applicable. Use the comment boxes to suggest specific improvements.)
(1) The guidance is sufficiently clear and detailed (2) The guidance is unclear (3) More detail on calculating the FHSI would be useful (4) More guidance on interpreting the results would be useful
Weights for index: 10 0 0 0
(1) (2) (3) (4) Total Index Rank
2.01 : (Real estate + unquoted equities + receivables) / total assets
25 0 5 3 33 7.6 16
2.02 : Real estate / total assets 27 0 3 3 33 8.2 9
2.03 : Real estate / capital 26 0 3 4 33 7.9 13
2.04 : (Real estate + mortgages) / total assets 26 0 2 4 32 8.1 10
2.05 : Maximum deposits in a single bank / total assets 26 1 2 3 32 8.1 10
2.06 : (Cash + loans + investments) / total assets 28 0 2 3 33 8.5 3
2.07 : Receivables / (gross written premium + reinsurance recoveries)
24 1 3 4 32 7.5 17
2.08 : Receivables / capital 28 0 2 3 33 8.5 3
2.09 : (Non‐performing investment assets and loans + receivables over 90 days) / total assets
24 0 3 4 31 7.7 15
2.10 : Receivables over 90 days / total receivables 28 0 2 2 32 8.8 2
2.11 : Equities / total assets 27 0 1 2 30 9.0 1
2.12 : Non‐performing loans / total gross loans 25 0 2 4 31 8.1 10
2.13 : Maximum investment in a single counterparty / total assets
26 0 2 3 31 8.4 5
2.14 : Maximum receivable from a single counterparty / total assets
26 0 2 3 31 8.4 5
2.15 : Gross asset position in financial derivatives / capital
23 0 2 6 31 7.4 18
2.16 : Gross liability position in financial derivatives / capital
23 0 2 6 31 7.4 18
2.17 : Investments: distribution by type 26 0 3 2 31 8.4 5
2.18 : Investments: geographical distribution 27 0 3 2 32 8.4 5
2.19 : Investments: sectoral distribution 27 2 3 2 34 7.9 13
Total and Average Index 492 4 47 63 8.1

Page 52
24. What are the views of YOUR AUTHORITY about the draft mapping to risk‐assessment categories that has been prepared for the following FHSIs? (More than one response may be entered, where applicable. Use the comment boxes to suggest specific changes.)
(1) The mapping seems appropriate (2) The mapping includes categories for which this FHSI is not relevant (3) The mapping omits some categories for which this FHSI is relevant
Weights for index: 10 0 0
(1) (2) (3) Total Index Rank
2.01 : (Real estate + unquoted equities + receivables) / total assets
27 0 1 28 9.6 11
2.02 : Real estate / total assets 28 0 0 28 10.0 1
2.03 : Real estate / capital 28 0 0 28 10.0 1
2.04 : (Real estate + mortgages) / total assets 28 0 0 28 10.0 1
2.05 : Maximum deposits in a single bank / total assets 27 1 0 28 9.6 11
2.06 : (Cash + loans + investments) / total assets 26 0 2 28 9.3 16
2.07 : Receivables / (gross written premium + reinsurance recoveries)
27 0 1 28 9.6 11
2.08 : Receivables / capital 29 0 0 29 10.0 1
2.09 : (Non‐performing investment assets and loans + receivables over 90 days) / total assets
26 1 1 28 9.3 16
2.10 : Receivables over 90 days / total receivables 29 0 0 29 10.0 1
2.11 : Equities / total assets 27 0 1 28 9.6 11
2.12 : Non‐performing loans / total gross loans 27 1 0 28 9.6 11
2.13 : Maximum investment in a single counterparty / total assets
28 0 0 28 10.0 1
2.14 : Maximum receivable from a single counterparty / total assets
28 0 0 28 10.0 1
2.15 : Gross asset position in financial derivatives / capital 28 0 0 28 10.0 1
2.16 : Gross liability position in financial derivatives / capital 28 0 0 28 10.0 1
2.17 : Investments: distribution by type 29 0 0 29 10.0 1
2.18 : Investments: geographical distribution 27 1 1 29 9.3 16
2.19 : Investments: sectoral distribution 26 3 2 31 8.4 19
Total and Average Index 523 7 9 9.7

Page 53
25. Which the following best describes the use of supervisory benchmarks by YOUR AUTHORITY for the following FHSIs (or arithmetic transformations of them)?
(1) Benchmarks have been established, which reflect requirements of legislation (2) Benchmarks have been established, which are largely based on experience in YOUR JURISDICTION (3) Benchmarks have been established, which are largely based on those used by other supervisors (4) No benchmarks are used, but it seems like they might be useful (5) No benchmarks are used, and it does not seem like they would be very useful (6) Not applicable, because YOUR AUTHORITY does not use this FHSI
Weights for index:
(1) (2) (3) (4) (5) (6) Total Index Rank
2.01 : (Real estate + unquoted equities + receivables) / total assets
1 5 0 7 0 16 29 7.3 2
2.02 : Real estate / total assets 3 6 2 11 2 5 29 6.6 10
2.03 : Real estate / capital 1 3 0 8 0 17 29 6.7 9
2.04 : (Real estate + mortgages) / total assets 1 4 1 7 0 16 29 7.1 6
2.05 : Maximum deposits in a single bank / total assets
3 5 0 7 1 13 29 7.2 4
2.06 : (Cash + loans + investments) / total assets 1 7 0 8 3 11 30 6.3 13
2.07 : Receivables / (gross written premium + reinsurance recoveries)
0 3 0 11 1 14 29 5.7 15
2.08 : Receivables / capital 3 4 1 9 0 14 31 7.2 4
2.09 : (Non‐performing investment assets and loans + receivables over 90 days) / total assets
0 2 0 10 1 16 29 5.4 17
2.10 : Receivables over 90 days / total receivables 3 6 0 8 0 13 30 7.6 1
2.11 : Equities / total assets 6 3 1 9 3 7 29 6.5 11
2.12 : Non‐performing loans / total gross loans 1 4 0 7 1 16 29 6.5 11
2.13 : Maximum investment in a single counterparty / total assets
5 4 0 9 1 10 29 7.1 6
2.14 : Maximum receivable from a single counterparty / total assets
5 2 0 8 0 14 29 7.3 2
2.15 : Gross asset position in financial derivatives / capital
1 1 0 11 1 15 29 5.4 17
2.16 : Gross liability position in financial derivatives / capital
0 1 0 11 1 16 29 5.0 19
2.17 : Investments: distribution by type 6 5 2 10 2 5 30 7.0 8
2.18 : Investments: geographical distribution 4 3 0 14 3 6 30 5.8 14
2.19 : Investments: sectoral distribution 2 3 0 12 3 10 30 5.5 16
Total and Average Index 46 71 7 177 23 234 6.5

Page 54
26. If YOUR AUTHORITY has established benchmarks for the following FHSIs, what benchmarks are used for conventional insurance activities? (If the FHSI is not used by YOUR AUTHORITY or no benchmark has been established, please leave the relevant cell blank.)
(1) Minimum for non‐life insurance (2) Maximum for non‐life insurance (3) Minimum for life insurance (4) Maximum for life insurance
First row : number of quantitative responses (1) (2) (3) (4)
2.01 : (Real estate + unquoted equities + receivables) / total assets 0 0 0 0
Lowest N/A N/A N/A N/A
Average N/A N/A N/A N/A
Highest N/A N/A N/A N/A
2.02 : Real estate / total assets 0 4 0 3
Lowest N/A 10 N/A 10
Average N/A 13 N/A 18
Highest N/A 20 N/A 30
2.03 : Real estate / capital 0 0 0 0
Lowest N/A N/A N/A N/A
Average N/A N/A N/A N/A
Highest N/A N/A N/A N/A
2.04 : (Real estate + mortgages) / total assets 0 2 0 2
Lowest N/A 20 N/A 0
Average N/A 25 N/A 10
Highest N/A 30 N/A 20
2.05 : Maximum deposits in a single bank / total assets 0 3 0 2
Lowest N/A 5 N/A 15
Average N/A 15 N/A 20
Highest N/A 25 N/A 25
2.06 : (Cash + loans + investments) / total assets 1 0 1 0
Lowest 70 N/A 90 N/A
Average 70 N/A 90 N/A
Highest 70 N/A 90 N/A
2.07 : Receivables / (gross written premium + reinsurance recoveries) 0 0 0 0
Lowest N/A N/A N/A N/A
Average N/A N/A N/A N/A
Highest N/A N/A N/A N/A
2.08 : Receivables / capital 0 2 0 1
Lowest N/A 10 N/A 100
Average N/A 55 N/A 100
Highest N/A 100 N/A 100
2.09 : (Non‐performing investment assets and loans + receivables over 90 days) / total assets
0 0 0 0
Lowest N/A N/A N/A N/A
Average N/A N/A N/A N/A
Highest N/A N/A N/A N/A
2.10 : Receivables over 90 days / total receivables 0 2 0 1
Lowest N/A 0 N/A 0
Average N/A 25 N/A 0
Highest N/A 50 N/A 0
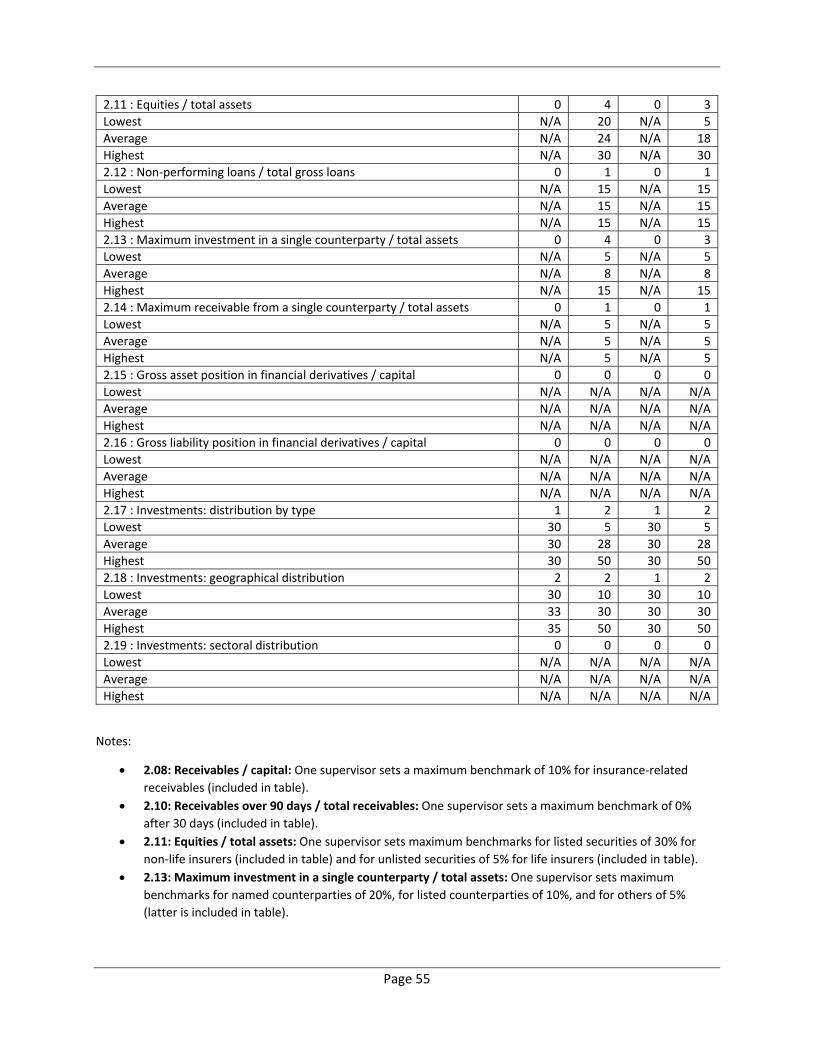
Page 55
2.11 : Equities / total assets 0 4 0 3
Lowest N/A 20 N/A 5
Average N/A 24 N/A 18
Highest N/A 30 N/A 30
2.12 : Non‐performing loans / total gross loans 0 1 0 1
Lowest N/A 15 N/A 15
Average N/A 15 N/A 15
Highest N/A 15 N/A 15
2.13 : Maximum investment in a single counterparty / total assets 0 4 0 3
Lowest N/A 5 N/A 5
Average N/A 8 N/A 8
Highest N/A 15 N/A 15
2.14 : Maximum receivable from a single counterparty / total assets 0 1 0 1
Lowest N/A 5 N/A 5
Average N/A 5 N/A 5
Highest N/A 5 N/A 5
2.15 : Gross asset position in financial derivatives / capital 0 0 0 0
Lowest N/A N/A N/A N/A
Average N/A N/A N/A N/A
Highest N/A N/A N/A N/A
2.16 : Gross liability position in financial derivatives / capital 0 0 0 0
Lowest N/A N/A N/A N/A
Average N/A N/A N/A N/A
Highest N/A N/A N/A N/A
2.17 : Investments: distribution by type 1 2 1 2
Lowest 30 5 30 5
Average 30 28 30 28
Highest 30 50 30 50
2.18 : Investments: geographical distribution 2 2 1 2
Lowest 30 10 30 10
Average 33 30 30 30
Highest 35 50 30 50
2.19 : Investments: sectoral distribution 0 0 0 0
Lowest N/A N/A N/A N/A
Average N/A N/A N/A N/A
Highest N/A N/A N/A N/A
Notes:
2.08: Receivables / capital: One supervisor sets a maximum benchmark of 10% for insurance‐related
receivables (included in table).
2.10: Receivables over 90 days / total receivables: One supervisor sets a maximum benchmark of 0%
after 30 days (included in table).
2.11: Equities / total assets: One supervisor sets maximum benchmarks for listed securities of 30% for
non‐life insurers (included in table) and for unlisted securities of 5% for life insurers (included in table).
2.13: Maximum investment in a single counterparty / total assets: One supervisor sets maximum
benchmarks for named counterparties of 20%, for listed counterparties of 10%, and for others of 5%
(latter is included in table).

Page 56
2.17: Investments: distribution by type: Some supervisors set benchmarks that vary by type of
investment. Some supervisors benchmark against market average distributions (for example, in the
European Union).
2.18: Investments: geographical distribution: The supervisors that provided benchmarks did not specify
whether they related to local investments or foreign investments.

Page 57
3. Reinsurance
27. Does YOUR AUTHORITY use the following FHSIs?
(1) Yes, as described (2) An arithmetic transformation is used (3) No
Weights for index: 10 8 0
(1) (2) (3) Total Index Rank
3.01 : Risk retention ratio 29 0 3 32 9.1 1
3.02 : (Reinsurance recoveries + reinsurance commissions) / reinsurance ceded
7 3 22 32 2.9 3
3.03 : Maximum exposure to single risk / capital 9 1 22 32 3.1 2
3.04 : Maximum exposure to single event / capital 6 1 25 32 2.1 4
3.05 : Maximum premium ceded to a single reinsurer / gross written premium
5 1 26 32 1.8 5
Total and Average Index 56 6 98 3.8
28. What are the views of YOUR AUTHORITY about the usefulness of the following FHSIs (or arithmetic transformations of them)?
(1) We use it, and find it useful (2) We use it, but do not find it very useful (3) We do not use it, because we use other FHSIs that provide similar information (4) We do not use it, but it seems like it might be useful (5) We do not use it, and it does not seem like it would be very useful
Weights for index: 10 2 5 7 0
(1) (2) (3) (4) (5) Total Index Rank
3.01 : Risk retention ratio 29 1 0 2 0 32 9.6 1
3.02 : (Reinsurance recoveries + reinsurance commissions) / reinsurance ceded
9 0 1 19 1 30 7.6 2
3.03 : Maximum exposure to single risk / capital 9 0 0 22 1 32 7.6 2
3.04 : Maximum exposure to single event / capital 7 0 0 23 1 31 7.5 4
3.05 : Maximum premium ceded to a single reinsurer / gross written premium
5 1 1 22 2 31 6.8 5
Total and Average Index 59 2 2 88 5 7.8

Page 58
29. What are the views of YOUR AUTHORITY about the draft guidance that has been prepared for the following FHSIs? (More than one response may be entered, where applicable. Use the comment boxes to suggest specific improvements.)
(1) The guidance is sufficiently clear and detailed (2) The guidance is unclear (3) More detail on calculating the FHSI would be useful (4) More guidance on interpreting the results would be useful
Weights for index: 10 0 0 0
(1) (2) (3) (4) Total Index Rank
3.01 : Risk retention ratio 30 0 0 0 30 10.0 1
3.02 : (Reinsurance recoveries + reinsurance commissions) / reinsurance ceded
27 0 0 1 28 9.6 2
3.03 : Maximum exposure to single risk / capital 27 0 3 1 31 8.7 4
3.04 : Maximum exposure to single event / capital 27 0 2 0 29 9.3 3
3.05 : Maximum premium ceded to a single reinsurer / gross written premium
27 2 1 1 31 8.7 4
Total and Average Index 138 2 6 3 9.3
30. What are the views of YOUR AUTHORITY about the draft mapping to risk‐assessment categories that has been prepared for the following FHSIs? (More than one response may be entered, where applicable. Use the comment boxes to suggest specific changes.)
(1) The mapping seems appropriate (2) The mapping includes categories for which this FHSI is not relevant (3) The mapping omits some categories for which this FHSI is relevant
Weights for index: 10 0 0
(1) (2) (3) Total Index Rank
3.01 : Risk retention ratio 28 1 0 29 9.7 4
3.02 : (Reinsurance recoveries + reinsurance commissions) / reinsurance ceded
28 0 0 28 10.0 1
3.03 : Maximum exposure to single risk / capital 29 0 0 29 10.0 1
3.04 : Maximum exposure to single event / capital 28 0 0 28 10.0 1
3.05 : Maximum premium ceded to a single reinsurer / gross written premium
28 1 2 31 9.0 5
Total and Average Index 141 2 2 9.7

Page 59
31. Which the following best describes the use of supervisory benchmarks by YOUR AUTHORITY for the following FHSIs (or arithmetic transformations of them)?
(1) Benchmarks have been established, which reflect requirements of legislation (2) Benchmarks have been established, which are largely based on experience in YOUR JURISDICTION (3) Benchmarks have been established, which are largely based on those used by other supervisors (4) No benchmarks are used, but it seems like they might be useful (5) No benchmarks are used, and it does not seem like they would be very useful (6) Not applicable, because YOUR AUTHORITY does not use this FHSI
Weights for index: 10 10 7 5 0 omit
(1) (2) (3) (4) (5) (6) Total Index Rank
3.01 : Risk retention ratio 2 10 2 12 5 1 32 6.3 1
3.02 : (Reinsurance recoveries + reinsurance commissions) / reinsurance ceded
0 4 2 11 2 10 29 5.7 4
3.03 : Maximum exposure to single risk / capital 3 2 2 10 1 13 31 6.3 1
3.04 : Maximum exposure to single event / capital
3 0 2 9 2 14 30 5.6 5
3.05 : Maximum premium ceded to a single reinsurer / gross written premium
4 1 1 10 1 13 30 6.3 1
Total and Average Index 12 17 9 52 11 51 6.1
32. If YOUR AUTHORITY has established benchmarks for the following FHSIs, what benchmarks are used for conventional insurance activities? (If the FHSI is not used by YOUR AUTHORITY or no benchmark has been established, please leave the relevant cell blank.)
(1) Minimum for non‐life insurance (2) Maximum for non‐life insurance (3) Minimum for life insurance (4) Maximum for life insurance
(1) (2) (3) (4)
3.01 : Risk retention ratio 6 5 2 2
Lowest 20 70 40 80
Average 40 80 58 90
Highest 70 99.5 75 99
3.02 : (Reinsurance recoveries + reinsurance commissions) / reinsurance ceded
1 2 2 2
Lowest 90 30 5 25
Average 90 70 48 68
Highest 90 110 90 110
3.03 : Maximum exposure to single risk / capital 0 2 0 1
Lowest N/A 5 N/A 10
Average N/A 8 N/A 10
Highest N/A 10 N/A 10
3.04 : Maximum exposure to single event / capital 0 2 0 1
Lowest N/A 10 N/A 10
Average N/A 10 N/A 10
Highest N/A 10 N/A 10
3.05 : Maximum premium ceded to a single reinsurer / gross written premium
1 3 2 3
Lowest 30 25 5 25
Average 30 48 18 33
Highest 30 70 30 50

Page 60
Notes:
3.01: Risk retention ratio: One supervisor sets a maximum benchmark of 25% if only one reinsurer is
being used.
3.05: Maximum premium ceded to a single reinsurer / gross written premium: One supervisor sets a
lower maximum benchmark of 10% for reinsurers rated less than BBB, versus 25% for higher‐rated
reinsurers (included in table).

Page 61
4. Actuarial
33. Does YOUR AUTHORITY use the following FHSIs?
(1) Yes, as described (2) An arithmetic transformation is used (3) No
Weights for index: 10 8 0
(1) (2) (3) Total Index Rank
4.01 : Net claims provisions / average of net claims paid in last three years
4 5 23 32 2.5 7
4.02 : Net technical provisions / average of net written premium in last three years
4 3 25 32 2.0 8
4.03 : Net claims provisions / capital 7 3 22 32 2.9 6
4.04 : Claims development 16 4 11 31 6.2 2
4.05 : Underwritten business: distribution by class of business 22 4 6 32 7.9 1
4.06 : Underwritten business: geographical distribution 12 1 19 32 4.0 4
4.07 : Underwritten business: sectoral distribution 4 0 28 32 1.3 9
4.08 : Actuarial assumption: short‐term interest rate 12 0 20 32 3.8 5
4.09 : Actuarial assumption: long‐term interest rate 14 0 18 32 4.4 3
Total and Average Index 95 20 172 3.9
34. What are the views of YOUR AUTHORITY about the usefulness of the following FHSIs (or arithmetic transformations of them)?
(1) We use it, and find it useful (2) We use it, but do not find it very useful (3) We do not use it, because we use other FHSIs that provide similar information (4) We do not use it, but it seems like it might be useful (5) We do not use it, and it does not seem like it would be very useful
Weights for index: 10 2 5 7 0
(1) (2) (3) (4) (5) Total Index Rank
4.01 : Net claims provisions / average of net claims paid in last three years
8 0 2 19 2 31 7.2 7
4.02 : Net technical provisions / average of net written premium in last three years
5 0 1 22 3 31 6.7 8
4.03 : Net claims provisions / capital 10 0 3 18 1 32 7.5 4
4.04 : Claims development 20 0 1 10 0 31 8.9 2
4.05 : Underwritten business: distribution by class of business
26 0 0 4 1 31 9.3 1
4.06 : Underwritten business: geographical distribution
13 0 0 17 1 31 8.0 3
4.07 : Underwritten business: sectoral distribution
6 0 0 19 6 31 6.2 9
4.08 : Actuarial assumption: short‐term interest rate
12 0 0 15 4 31 7.3 6
4.09 : Actuarial assumption: long‐term interest rate
14 0 0 13 4 31 7.5 4
Total and Average Index 114 0 7 137 22 7.6

Page 62
35. What are the views of YOUR AUTHORITY about the draft guidance that has been prepared for the following FHSIs? (More than one response may be entered, where applicable. Use the comment boxes to suggest specific improvements.)
(1) The guidance is sufficiently clear and detailed (2) The guidance is unclear (3) More detail on calculating the FHSI would be useful (4) More guidance on interpreting the results would be useful
Weights for index: 10 0 0
(1) (2) (3) (4) Total Index Rank
4.01 : Net claims provisions / average of net claims paid in last three years
25 0 2 4 31 8.1 6
4.02 : Net technical provisions / average of net written premium in last three years
25 1 2 3 31 8.1 6
4.03 : Net claims provisions / capital 26 0 2 3 31 8.4 5
4.04 : Claims development 27 0 0 2 29 9.3 1
4.05 : Underwritten business: distribution by class of business
27 0 0 2 29 9.3 1
4.06 : Underwritten business: geographical distribution 24 0 1 3 28 8.6 3
4.07 : Underwritten business: sectoral distribution 24 1 1 2 28 8.6 3
4.08 : Actuarial assumption: short‐term interest rate 25 0 3 3 31 8.1 6
4.09 : Actuarial assumption: long‐term interest rate 25 1 3 3 32 7.8 9
Total and Average Index 228 3 14 25 8.4
36. What are the views of YOUR AUTHORITY about the draft mapping to risk‐assessment categories that has been prepared for the following FHSIs? (More than one response may be entered, where applicable. Use the comment boxes to suggest specific changes.)
(1) The mapping seems appropriate (2) The mapping includes categories for which this FHSI is not relevant (3) The mapping omits some categories for which this FHSI is relevant
Weights for index: 10 0 0
(1) (2) (3) Total Index Rank
4.01 : Net claims provisions / average of net claims paid in last three years
27 0 0 27 10.0 1
4.02 : Net technical provisions / average of net written premium in last three years
26 0 1 27 9.6 2
4.03 : Net claims provisions / capital 26 0 1 27 9.6 2
4.04 : Claims development 25 0 3 28 8.9 7
4.05 : Underwritten business: distribution by class of business
28 0 2 30 9.3 5
4.06 : Underwritten business: geographical distribution 26 0 2 28 9.3 5
4.07 : Underwritten business: sectoral distribution 27 0 1 28 9.6 2
4.08 : Actuarial assumption: short‐term interest rate 24 0 3 27 8.9 7
4.09 : Actuarial assumption: long‐term interest rate 24 1 4 29 8.3 9
Total and Average Index 233 1 17 9.3

Page 63
37. Which the following best describes the use of supervisory benchmarks by YOUR AUTHORITY for the following FHSIs (or arithmetic transformations of them)?
(1) Benchmarks have been established, which reflect requirements of legislation (2) Benchmarks have been established, which are largely based on experience in YOUR JURISDICTION (3) Benchmarks have been established, which are largely based on those used by other supervisors (4) No benchmarks are used, but it seems like they might be useful (5) No benchmarks are used, and it does not seem like they would be very useful (6) Not applicable, because YOUR AUTHORITY does not use this FHSI
Weights for index: 10 10 7 5 0 omit
(1) (2) (3) (4) (5) (6) Total Index Rank
4.01 : Net claims provisions / average of net claims paid in last three years
1 3 1 14 1 11 31 5.9 2
4.02 : Net technical provisions / average of net written premium in last three years
0 2 0 16 1 12 31 5.3 6
4.03 : Net claims provisions / capital 0 4 1 15 1 11 32 5.8 4
4.04 : Claims development 2 4 1 15 4 5 31 5.5 5
4.05 : Underwritten business: distribution by class of business
3 0 1 15 8 4 31 4.1 7
4.06 : Underwritten business: geographical distribution
0 0 0 13 7 11 31 3.3 9
4.07 : Underwritten business: sectoral distribution
0 0 0 12 5 14 31 3.5 8
4.08 : Actuarial assumption: short‐term interest rate
4 2 1 10 3 11 31 5.9 2
4.09 : Actuarial assumption: long‐term interest rate
5 3 1 9 3 10 31 6.3 1
Total and Average Index 15 18 6 119 33 89 5.1

Page 64
38. If YOUR AUTHORITY has established benchmarks for the following FHSIs, what benchmarks are used for conventional insurance activities? (If the FHSI is not used by YOUR AUTHORITY or no benchmark has been established, please leave the relevant cell blank.)
(1) Minimum for non‐life insurance (2) Maximum for non‐life insurance (3) Minimum for life insurance (4) Maximum for life insurance
First row : number of quantitative responses (1) (2) (3) (4)
4.01 : Net claims provisions / average of net claims paid in last three years
1 1 1 1
Lowest 75 125 75 125
Average 75 125 75 125
Highest 75 125 75 125
4.02 : Net technical provisions / average of net written premium in last three years
0 0 0 0
Lowest N/A N/A N/A N/A
Average N/A N/A N/A N/A
Highest N/A N/A N/A N/A
4.03 : Net claims provisions / capital 0 2 0 0
Lowest N/A 250 N/A N/A
Average N/A 250 N/A N/A
Highest N/A 250 N/A N/A
4.04 : Claims development 1 1 0 0
Lowest 20 20 N/A N/A
Average 20 20 N/A N/A
Highest 20 20 N/A N/A
4.05 : Underwritten business: distribution by class of business 0 1 0 1
Lowest N/A 5 N/A 5
Average N/A 5 N/A 5
Highest N/A 5 N/A 5
4.06 : Underwritten business: geographical distribution 0 0 0 0
Lowest N/A N/A N/A N/A
Average N/A N/A N/A N/A
Highest N/A N/A N/A N/A
4.07 : Underwritten business: sectoral distribution 0 0 0 0
Lowest N/A N/A N/A N/A
Average N/A N/A N/A N/A
Highest N/A N/A N/A N/A
4.08 : Actuarial assumption: short‐term interest rate 0 0 0 0
Lowest N/A N/A N/A N/A
Average N/A N/A N/A N/A
Highest N/A N/A N/A N/A
4.09 : Actuarial assumption: long‐term interest rate 0 0 0 0
Lowest N/A N/A N/A N/A
Average N/A N/A N/A N/A
Highest N/A N/A N/A N/A

Page 65
Notes:
4.08: Actuarial assumption: short‐term interest rate: Some supervisors set maximum benchmarks that
vary with market conditions: one uses 60% of the 5‐year government bond rate; another uses the zero‐
coupon spot yield for matching durations.
4.09: Actuarial assumption: long‐term interest rate: Some supervisors set maximum benchmarks that
vary with market conditions: one uses 60% of the 5‐year government bond rate; another uses the zero‐
coupon spot yield for a 15‐year duration.

Page 66
5. Management
39. Does YOUR AUTHORITY use the following FHSIs?
(1) Yes, as described (2) An arithmetic transformation is used (3) No
Weights for index: 10 8 0
(1) (2) (3) Total Index Rank
5.01 : Gross written premium per employee 5 1 27 33 1.8 10
5.02 : Assets per employee 4 1 28 33 1.5 11
5.03 : Operating expenses / gross written premium 20 6 6 32 7.8 4
5.04 : Personnel expenses / gross written premium 7 4 22 33 3.1 7
5.05 : Growth in gross written premium 29 1 3 33 9.0 1
5.06 : Growth in net written premium 26 2 5 33 8.4 2
5.07 : Growth in total assets 27 1 5 33 8.4 2
5.08 : Gross written premium / sum insured 4 0 29 33 1.2 12
5.09 : Gross written premium / number of policies 8 2 23 33 2.9 8
5.10 : Complaint index 7 3 23 33 2.8 9
5.11 : Pay‐out ratio 11 4 18 33 4.3 6
5.12 : Board composition 16 2 15 33 5.3 5
Total and Average Index 164 27 204 4.7
40. What are the views of YOUR AUTHORITY about the usefulness of the following FHSIs (or arithmetic transformations of them)?
(1) We use it, and find it useful (2) We use it, but do not find it very useful (3) We do not use it, because we use other FHSIs that provide similar information (4) We do not use it, but it seems like it might be useful (5) We do not use it, and it does not seem like it would be very useful
Weights for index: 10 2 5 7 0
(1) (2) (3) (4) (5) Total Index Rank
5.01 : Gross written premium per employee 7 0 0 13 11 31 5.2 11
5.02 : Assets per employee 5 0 0 12 14 31 4.3 12
5.03 : Operating expenses / gross written premium
21 0 2 5 3 31 8.2 4
5.04 : Personnel expenses / gross written premium
8 0 4 9 10 31 5.3 10
5.05 : Growth in gross written premium 28 0 1 2 1 32 9.3 1
5.06 : Growth in net written premium 24 0 4 2 2 32 8.6 3
5.07 : Growth in total assets 26 0 0 4 2 32 9.0 2
5.08 : Gross written premium / sum insured 4 0 0 20 7 31 5.8 9
5.09 : Gross written premium / number of policies
8 1 1 16 5 31 6.4 8
5.10 : Complaint index 7 1 2 17 4 31 6.5 7
5.11 : Pay‐out ratio 10 0 2 16 3 31 7.2 5
5.12 : Board composition 17 0 0 8 7 32 7.1 6
Total and Average Index 165 2 16 124 69 6.9

Page 67
41. What are the views of YOUR AUTHORITY about the draft guidance that has been prepared for the following FHSIs? (More than one response may be entered, where applicable. Use the comment boxes to suggest specific improvements.)
(1) The guidance is sufficiently clear and detailed (2) The guidance is unclear (3) More detail on calculating the FHSI would be useful (4) More guidance on interpreting the results would be useful
Weights for index: 10 0 0 0
(1) (2) (3) (4) Total Index Rank
5.01 : Gross written premium per employee 26 0 1 3 30 8.7 8
5.02 : Assets per employee 26 0 1 3 30 8.7 8
5.03 : Operating expenses / gross written premium
26 0 2 2 30 8.7 8
5.04 : Personnel expenses / gross written premium
26 0 1 2 29 9.0 3
5.05 : Growth in gross written premium 29 0 1 1 31 9.4 1
5.06 : Growth in net written premium 29 0 1 1 31 9.4 1
5.07 : Growth in total assets 28 0 1 2 31 9.0 3
5.08 : Gross written premium / sum insured 26 0 1 3 30 8.7 8
5.09 : Gross written premium / number of policies
27 0 1 2 30 9.0 3
5.10 : Complaint index 27 0 2 1 30 9.0 3
5.11 : Pay‐out ratio 26 0 2 1 29 9.0 3
5.12 : Board composition 24 1 3 3 31 7.7 12
Total and Average Index 320 1 17 24 8.8
42. What are the views of YOUR AUTHORITY about the draft mapping to risk‐assessment categories that has been prepared for the following FHSIs? (More than one response may be entered, where applicable. Use the comment boxes to suggest specific changes.)
(1) The mapping seems appropriate (2) The mapping includes categories for which this FHSI is not relevant (3) The mapping omits some categories for which this FHSI is relevant
Weights for index: 10 0 0
(1) (2) (3) Total Index Rank
5.01 : Gross written premium per employee 28 0 1 29 9.7 2
5.02 : Assets per employee 28 0 0 28 10.0 1
5.03 : Operating expenses / gross written premium
28 0 2 30 9.3 6
5.04 : Personnel expenses / gross written premium
27 0 2 29 9.3 6
5.05 : Growth in gross written premium 28 0 2 30 9.3 6
5.06 : Growth in net written premium 28 0 2 30 9.3 6
5.07 : Growth in total assets 28 0 2 30 9.3 6
5.08 : Gross written premium / sum insured 27 0 2 29 9.3 6
5.09 : Gross written premium / number of policies 28 0 1 29 9.7 2
5.10 : Complaint index 28 0 2 30 9.3 6
5.11 : Pay‐out ratio 28 0 1 29 9.7 2
5.12 : Board composition 29 1 1 31 9.4 5
Total and Average Index 335 1 18 9.5

Page 68
43. Which the following best describes the use of supervisory benchmarks by YOUR AUTHORITY for the following FHSIs (or arithmetic transformations of them)?
(1) Benchmarks have been established, which reflect requirements of legislation (2) Benchmarks have been established, which are largely based on experience in YOUR JURISDICTION (3) Benchmarks have been established, which are largely based on those used by other supervisors (4) No benchmarks are used, but it seems like they might be useful (5) No benchmarks are used, and it does not seem like they would be very useful (6) Not applicable, because YOUR AUTHORITY does not use this FHSI
Weights for index: 10 10 7 5 0 omit
(1) (2) (3) (4) (5) (6) Total Index Rank
5.01 : Gross written premium per employee
0 2 0 9 3 16 30 4.6 10
5.02 : Assets per employee 0 2 0 9 3 16 30 4.6 10
5.03 : Operating expenses / gross written premium
3 8 1 13 1 5 31 7.0 2
5.04 : Personnel expenses / gross written premium
0 5 0 9 1 15 30 6.3 3
5.05 : Growth in gross written premium 3 9 3 10 6 1 32 6.2 4
5.06 : Growth in net written premium 2 8 4 8 6 4 32 6.0 5
5.07 : Growth in total assets 2 6 2 13 6 3 32 5.5 6
5.08 : Gross written premium / sum insured
0 0 1 10 2 17 30 4.4 12
5.09 : Gross written premium / number of policies
1 1 1 12 3 12 30 4.8 9
5.10 : Complaint index 0 2 0 15 2 12 31 5.0 8
5.11 : Pay‐out ratio 1 2 1 14 3 9 30 5.1 7
5.12 : Board composition 5 4 2 8 1 12 32 7.2 1
Total and Average Index 17 49 15 130 37 122 5.7

Page 69
44. If YOUR AUTHORITY has established benchmarks for the following FHSIs, what benchmarks are used for conventional insurance activities? (If the FHSI is not used by YOUR AUTHORITY or no benchmark has been established, please leave the relevant cell blank.)
(1) Minimum for non‐life insurance (2) Maximum for non‐life insurance (3) Minimum for life insurance (4) Maximum for life insurance
First row : number of quantitative responses (1) (2) (3) (4)
5.01 : Gross written premium per employee 0 0 0 0
Lowest N/A N/A N/A N/A
Average N/A N/A N/A N/A
Highest N/A N/A N/A N/A
5.02 : Assets per employee 0 0 0 0
Lowest N/A N/A N/A N/A
Average N/A N/A N/A N/A
Highest N/A N/A N/A N/A
5.03 : Operating expenses / gross written premium 2 5 2 4
Lowest 25 30 25 30
Average 28 40 28 41
Highest 30 50 30 50
5.04 : Personnel expenses / gross written premium 0 2 0 2
Lowest N/A 25 N/A 25
Average N/A 38 N/A 38
Highest N/A 50 N/A 50
5.05 : Growth in gross written premium 5 4 4 4
Lowest 1.5 25 5 15
Average 17 29 20 26
Highest 33 33 33 33
5.06 : Growth in net written premium 3 4 2 3
Lowest 33 25 0 30
Average 33 31 17 38
Highest 33 33 33 50
5.07 : Growth in total assets 1 0 2 1
Lowest 2 N/A 3 20
Average 2 N/A 3 20
Highest 2 N/A 3 20
5.08 : Gross written premium / sum insured 0 0 0 0
Lowest N/A N/A N/A N/A
Average N/A N/A N/A N/A
Highest N/A N/A N/A N/A
5.09 : Gross written premium / number of policies 0 0 0 0
Lowest N/A N/A N/A N/A
Average N/A N/A N/A N/A
Highest N/A N/A N/A N/A
5.10 : Complaint index 0 0 0 0
Lowest N/A N/A N/A N/A
Average N/A N/A N/A N/A
Highest N/A N/A N/A N/A
5.11 : Pay‐out ratio 0 0 0 0
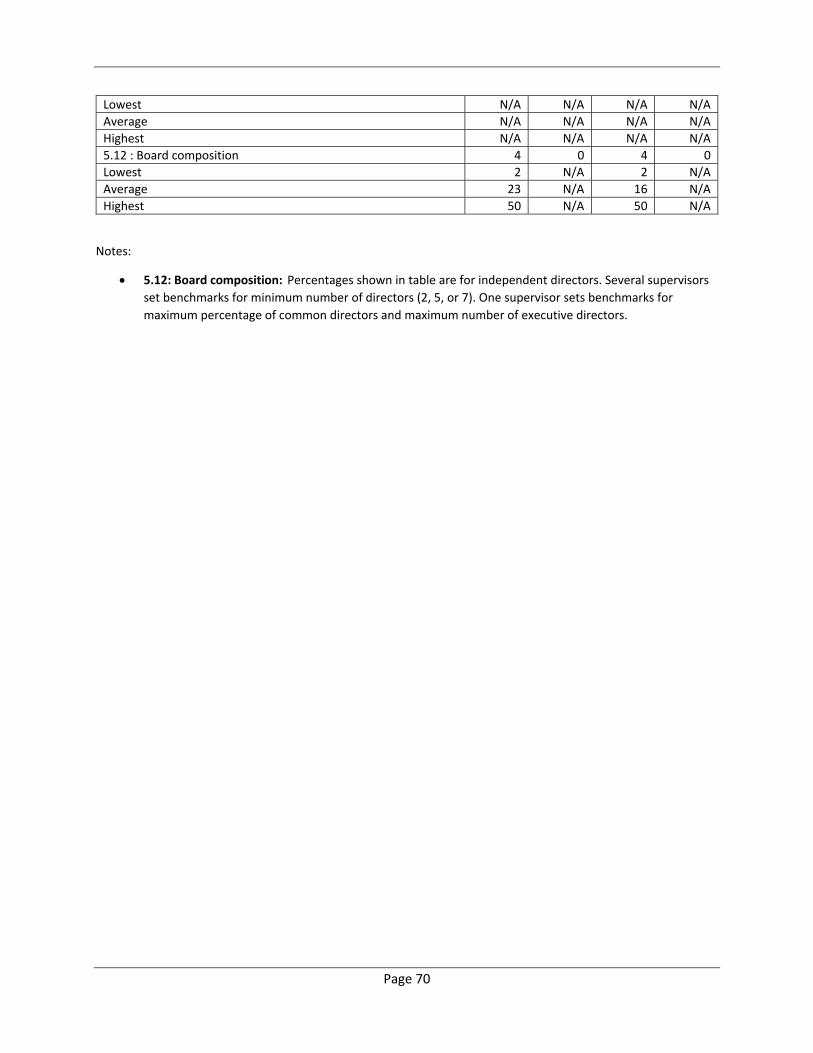
Page 70
Lowest N/A N/A N/A N/A
Average N/A N/A N/A N/A
Highest N/A N/A N/A N/A
5.12 : Board composition 4 0 4 0
Lowest 2 N/A 2 N/A
Average 23 N/A 16 N/A
Highest 50 N/A 50 N/A
Notes:
5.12: Board composition: Percentages shown in table are for independent directors. Several supervisors
set benchmarks for minimum number of directors (2, 5, or 7). One supervisor sets benchmarks for
maximum percentage of common directors and maximum number of executive directors.
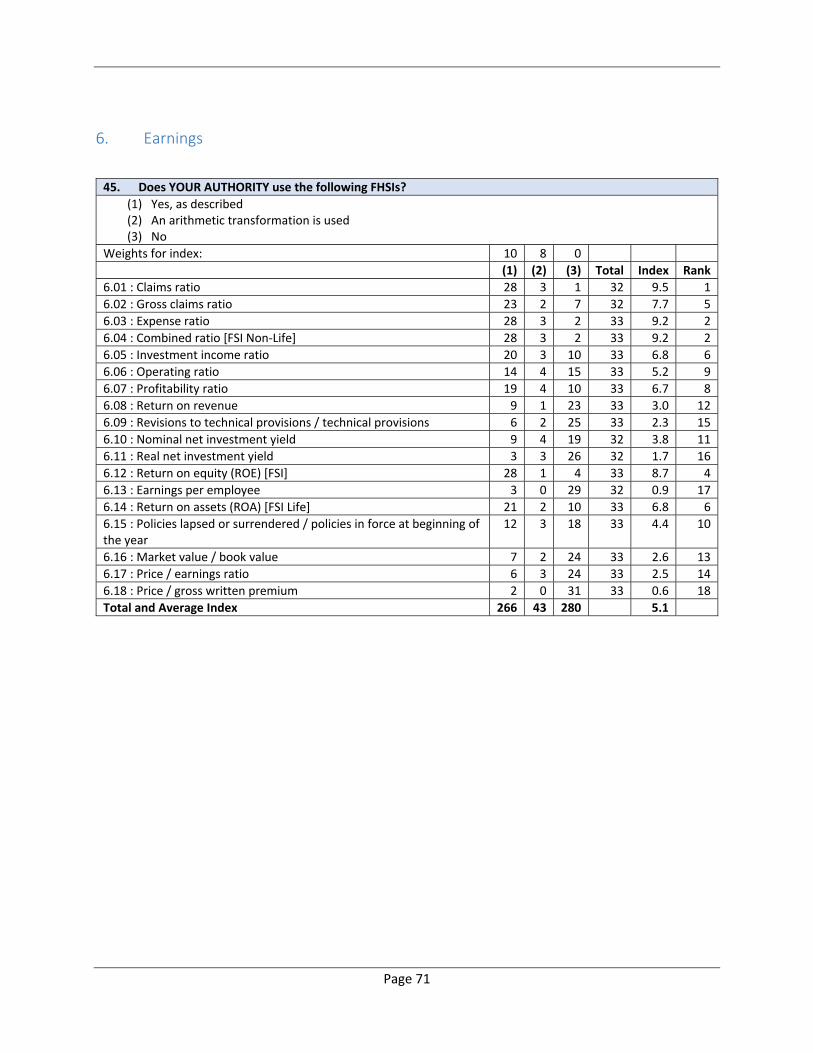
Page 71
6. Earnings
45. Does YOUR AUTHORITY use the following FHSIs?
(1) Yes, as described (2) An arithmetic transformation is used (3) No
Weights for index: 10 8 0
(1) (2) (3) Total Index Rank
6.01 : Claims ratio 28 3 1 32 9.5 1
6.02 : Gross claims ratio 23 2 7 32 7.7 5
6.03 : Expense ratio 28 3 2 33 9.2 2
6.04 : Combined ratio [FSI Non‐Life] 28 3 2 33 9.2 2
6.05 : Investment income ratio 20 3 10 33 6.8 6
6.06 : Operating ratio 14 4 15 33 5.2 9
6.07 : Profitability ratio 19 4 10 33 6.7 8
6.08 : Return on revenue 9 1 23 33 3.0 12
6.09 : Revisions to technical provisions / technical provisions 6 2 25 33 2.3 15
6.10 : Nominal net investment yield 9 4 19 32 3.8 11
6.11 : Real net investment yield 3 3 26 32 1.7 16
6.12 : Return on equity (ROE) [FSI] 28 1 4 33 8.7 4
6.13 : Earnings per employee 3 0 29 32 0.9 17
6.14 : Return on assets (ROA) [FSI Life] 21 2 10 33 6.8 6
6.15 : Policies lapsed or surrendered / policies in force at beginning of the year
12 3 18 33 4.4 10
6.16 : Market value / book value 7 2 24 33 2.6 13
6.17 : Price / earnings ratio 6 3 24 33 2.5 14
6.18 : Price / gross written premium 2 0 31 33 0.6 18
Total and Average Index 266 43 280 5.1

Page 72
46. What are the views of YOUR AUTHORITY about the usefulness of the following FHSIs (or arithmetic transformations of them)?
(1) We use it, and find it useful (2) We use it, but do not find it very useful (3) We do not use it, because we use other FHSIs that provide similar information (4) We do not use it, but it seems like it might be useful (5) We do not use it, and it does not seem like it would be very useful
Weights for index: 10 2 5 7 0
(1) (2) (3) (4) (5) Total Index Rank
6.01 : Claims ratio 29 0 1 1 1 32 9.4 2
6.02 : Gross claims ratio 24 0 1 5 1 31 9.0 5
6.03 : Expense ratio 29 0 1 1 1 32 9.4 2
6.04 : Combined ratio [FSI Non‐Life] 29 0 1 1 1 32 9.4 2
6.05 : Investment income ratio 20 0 1 7 3 31 8.2 8
6.06 : Operating ratio 14 0 4 10 3 31 7.4 10
6.07 : Profitability ratio 20 0 3 7 2 32 8.3 7
6.08 : Return on revenue 11 0 2 15 3 31 7.3 11
6.09 : Revisions to technical provisions / technical provisions
8 0 1 18 4 31 6.8 13
6.10 : Nominal net investment yield 11 0 2 15 3 31 7.3 11
6.11 : Real net investment yield 4 0 2 20 5 31 6.1 16
6.12 : Return on equity (ROE) [FSI] 27 0 0 5 0 32 9.5 1
6.13 : Earnings per employee 3 0 0 16 12 31 4.6 18
6.14 : Return on assets (ROA) [FSI Life] 20 0 0 9 2 31 8.5 6
6.15 : Policies lapsed or surrendered / policies in force at beginning of the year
14 0 0 14 3 31 7.7 9
6.16 : Market value / book value 6 0 1 18 6 31 6.2 15
6.17 : Price / earnings ratio 7 0 1 17 6 31 6.3 14
6.18 : Price / gross written premium 3 0 0 22 6 31 5.9 17
Total and Average Index 279 0 21 201 62 7.6

Page 73
47. What are the views of YOUR AUTHORITY about the draft guidance that has been prepared for the following FHSIs? (More than one response may be entered, where applicable. Use the comment boxes to suggest specific improvements.)
(1) The guidance is sufficiently clear and detailed (2) The guidance is unclear (3) More detail on calculating the FHSI would be useful (4) More guidance on interpreting the results would be useful
Weights for index: 10 0 0 0
(1) (2) (3) (4) Total Index Rank
6.01 : Claims ratio 28 0 1 2 31 9.0 7
6.02 : Gross claims ratio 26 0 1 3 30 8.7 12
6.03 : Expense ratio 28 0 1 2 31 9.0 7
6.04 : Combined ratio [FSI Non‐Life] 29 0 1 1 31 9.4 1
6.05 : Investment income ratio 26 0 2 2 30 8.7 12
6.06 : Operating ratio 26 0 2 2 30 8.7 12
6.07 : Profitability ratio 29 0 1 1 31 9.4 1
6.08 : Return on revenue 26 0 1 3 30 8.7 12
6.09 : Revisions to technical provisions / technical provisions
23 0 5 3 31 7.4 18
6.10 : Nominal net investment yield 26 0 1 2 29 9.0 7
6.11 : Real net investment yield 26 0 1 2 29 9.0 7
6.12 : Return on equity (ROE) [FSI] 28 0 1 1 30 9.3 3
6.13 : Earnings per employee 27 0 1 1 29 9.3 3
6.14 : Return on assets (ROA) [FSI Life] 28 0 1 1 30 9.3 3
6.15 : Policies lapsed or surrendered / policies in force at beginning of the year
28 0 1 1 30 9.3 3
6.16 : Market value / book value 27 0 2 1 30 9.0 7
6.17 : Price / earnings ratio 26 0 3 2 31 8.4 16
6.18 : Price / gross written premium 26 1 3 3 33 7.9 17
Total and Average Index 483 1 29 33 8.8

Page 74
48. What are the views of YOUR AUTHORITY about the draft mapping to risk‐assessment categories that has been prepared for the following FHSIs? (More than one response may be entered, where applicable. Use the comment boxes to suggest specific changes.)
(1) The mapping seems appropriate (2) The mapping includes categories for which this FHSI is not relevant (3) The mapping omits some categories for which this FHSI is relevant
Weights for index: 10 0 0
(1) (2) (3) Total Index Rank
6.01 : Claims ratio 29 0 1 30 9.7 6
6.02 : Gross claims ratio 28 0 1 29 9.7 6
6.03 : Expense ratio 26 0 3 29 9.0 13
6.04 : Combined ratio [FSI Non‐Life] 27 0 3 30 9.0 13
6.05 : Investment income ratio 28 0 1 29 9.7 6
6.06 : Operating ratio 26 0 3 29 9.0 13
6.07 : Profitability ratio 27 0 3 30 9.0 13
6.08 : Return on revenue 26 0 3 29 9.0 13
6.09 : Revisions to technical provisions / technical provisions
27 0 2 29 9.3 12
6.10 : Nominal net investment yield 28 0 0 28 10.0 1
6.11 : Real net investment yield 28 0 0 28 10.0 1
6.12 : Return on equity (ROE) [FSI] 29 0 0 29 10.0 1
6.13 : Earnings per employee 28 0 0 28 10.0 1
6.14 : Return on assets (ROA) [FSI Life] 29 0 0 29 10.0 1
6.15 : Policies lapsed or surrendered / policies in force at beginning of the year
28 0 1 29 9.7 6
6.16 : Market value / book value 28 0 1 29 9.7 6
6.17 : Price / earnings ratio 28 0 1 29 9.7 6
6.18 : Price / gross written premium 28 1 3 32 8.8 18
Total and Average Index 498 1 26 9.5

Page 75
49. Which the following best describes the use of supervisory benchmarks by YOUR AUTHORITY for the following FHSIs (or arithmetic transformations of them)?
(1) Benchmarks have been established, which reflect requirements of legislation (2) Benchmarks have been established, which are largely based on experience in YOUR JURISDICTION (3) Benchmarks have been established, which are largely based on those used by other supervisors (4) No benchmarks are used, but it seems like they might be useful (5) No benchmarks are used, and it does not seem like they would be very useful (6) Not applicable, because YOUR AUTHORITY does not use this FHSI
Weights for index: 10 10 7 5 0 omit
(1) (2) (3) (4) (5) (6) Total Index Rank
6.01 : Claims ratio 4 9 4 11 4 0 32 6.7 3
6.02 : Gross claims ratio 2 10 1 11 4 2 30 6.5 6
6.03 : Expense ratio 5 9 3 11 4 0 32 6.8 2
6.04 : Combined ratio [FSI Non‐Life] 5 12 4 8 3 0 32 7.4 1
6.05 : Investment income ratio 3 5 3 11 4 6 32 6.0 8
6.06 : Operating ratio 2 6 2 8 5 7 30 5.8 9
6.07 : Profitability ratio 2 8 3 11 3 5 32 6.5 6
6.08 : Return on revenue 1 3 1 10 6 9 30 4.6 12
6.09 : Revisions to technical provisions / technical provisions
0 4 1 8 6 11 30 4.6 12
6.10 : Nominal net investment yield 0 5 1 13 5 6 30 5.1 11
6.11 : Real net investment yield 0 3 1 8 6 12 30 4.3 15
6.12 : Return on equity (ROE) [FSI] 3 10 5 10 4 0 32 6.7 3
6.13 : Earnings per employee 0 1 0 9 6 14 30 3.4 17
6.14 : Return on assets (ROA) [FSI Life] 2 9 1 12 3 4 31 6.6 5
6.15 : Policies lapsed or surrendered / policies in force at beginning of the year
1 6 1 12 4 7 31 5.7 10
6.16 : Market value / book value 0 2 0 9 7 12 30 3.6 16
6.17 : Price / earnings ratio 0 3 1 9 5 12 30 4.6 12
6.18 : Price / gross written premium 0 0 1 8 5 16 30 3.4 17
Total and Average Index 30 105 33 179 84 123 5.7

Page 76
50. If YOUR AUTHORITY has established benchmarks for the following FHSIs, what benchmarks are used for conventional insurance activities? (If the FHSI is not used by YOUR AUTHORITY or no benchmark has been established, please leave the relevant cell blank.)
(1) Minimum for non‐life insurance (2) Maximum for non‐life insurance (3) Minimum for life insurance (4) Maximum for life insurance
First row : number of quantitative responses (1) (2) (3) (4)
6.01 : Claims ratio 4 5 3 4
Lowest 30 60 20 50
Average 45 80 33 66
Highest 50 105 50 80
6.02 : Gross claims ratio 2 3 1 2
Lowest 50 75 20 50
Average 50 92 20 63
Highest 50 120 20 75
6.03 : Expense ratio 4 6 3 5
Lowest 10 30 15 30
Average 18 43 20 50
Highest 25 70 25 90
6.04 : Combined ratio [FSI Non‐Life] 5 9 4 6
Lowest 0 65 0 50
Average 59 96 54 92
Highest 85 109 85 109
6.05 : Investment income ratio 3 3 2 1
Lowest 2.5 10 3 10
Average 5 38 5 10
Highest 7 95 6 10
6.06 : Operating ratio 2 1 1 1
Lowest 20 100 80 100
Average 50 100 80 100
Highest 80 100 80 100
6.07 : Profitability ratio 3 0 2 0
Lowest 5 N/A 3 N/A
Average 9 N/A 4 N/A
Highest 15 N/A 5 N/A
6.08 : Return on revenue 0 0 0 0
Lowest N/A N/A N/A N/A
Average N/A N/A N/A N/A
Highest N/A N/A N/A N/A
6.09 : Revisions to technical provisions / technical provisions 0 0 0 0
Lowest N/A N/A N/A N/A
Average N/A N/A N/A N/A
Highest N/A N/A N/A N/A
6.10 : Nominal net investment yield 1 1 1 1
Lowest 2.5 7.5 3.5 12.5
Average 2.5 7.5 3.5 12.5
Highest 2.5 7.5 3.5 12.5
6.11 : Real net investment yield 0 0 0 0

Page 77
Lowest N/A N/A N/A N/A
Average N/A N/A N/A N/A
Highest N/A N/A N/A N/A
6.12 : Return on equity (ROE) [FSI] 5 4 4 3
Lowest 0 15 0 15
Average 10 26 7 18
Highest 20 50 16 20
6.13 : Earnings per employee 0 0 0 0
Lowest N/A N/A N/A N/A
Average N/A N/A N/A N/A
Highest N/A N/A N/A N/A
6.14 : Return on assets (ROA) [FSI Life] 3 1 4 2
Lowest 1 10 0.5 3
Average 3 10 2 7.8
Highest 4 10 4 12.5
6.15 : Policies lapsed or surrendered / policies in force at beginning of the year
0 0 0 1
Lowest N/A N/A N/A 20
Average N/A N/A N/A 20
Highest N/A N/A N/A 20
6.16 : Market value / book value 0 0 0 0
Lowest N/A N/A N/A N/A
Average N/A N/A N/A N/A
Highest N/A N/A N/A N/A
6.17 : Price / earnings ratio 0 0 0 0
Lowest N/A N/A N/A N/A
Average N/A N/A N/A N/A
Highest N/A N/A N/A N/A
6.18 : Price / gross written premium 0 0 0 0
Lowest N/A N/A N/A N/A
Average N/A N/A N/A N/A
Highest N/A N/A N/A N/A
Notes:
6.05: Investment income ratio: One supervisor sets a maximum benchmark equal to the government 6‐
month treasury bill rate.
6.12: Return on equity (ROE) [FSI]: One supervisor sets a maximum benchmark equal to the industry
average for the previous year.
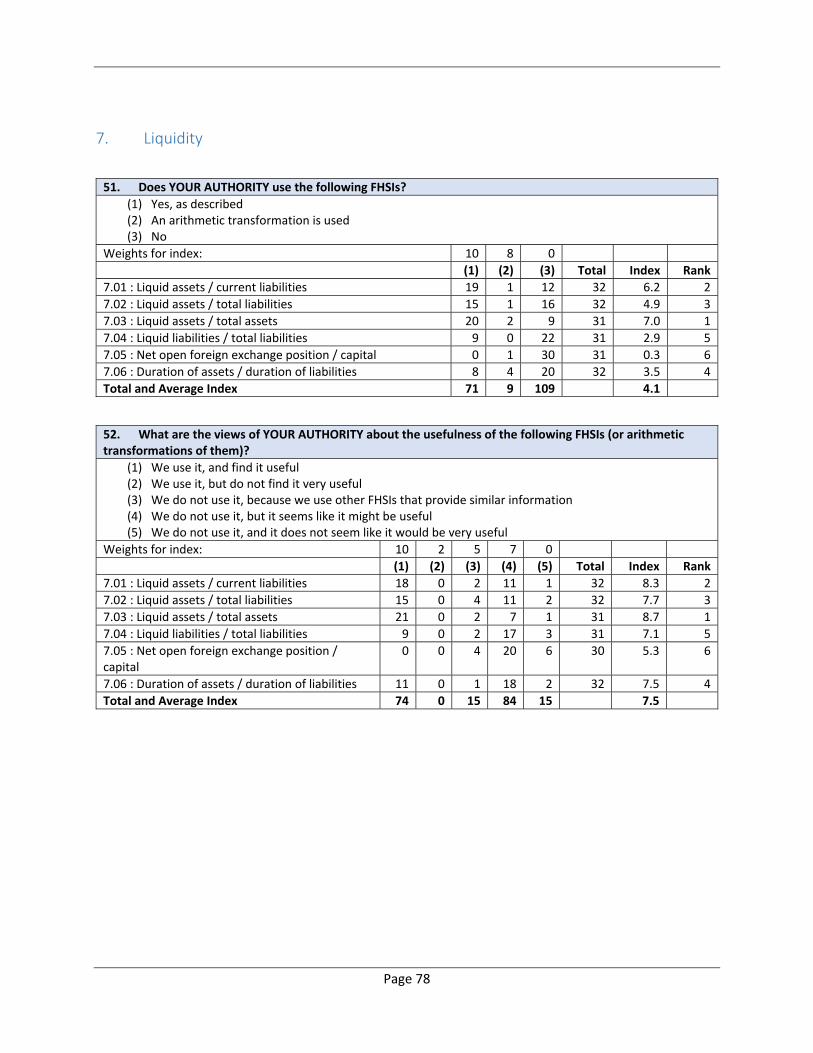
Page 78
7. Liquidity
51. Does YOUR AUTHORITY use the following FHSIs?
(1) Yes, as described (2) An arithmetic transformation is used (3) No
Weights for index: 10 8 0
(1) (2) (3) Total Index Rank
7.01 : Liquid assets / current liabilities 19 1 12 32 6.2 2
7.02 : Liquid assets / total liabilities 15 1 16 32 4.9 3
7.03 : Liquid assets / total assets 20 2 9 31 7.0 1
7.04 : Liquid liabilities / total liabilities 9 0 22 31 2.9 5
7.05 : Net open foreign exchange position / capital 0 1 30 31 0.3 6
7.06 : Duration of assets / duration of liabilities 8 4 20 32 3.5 4
Total and Average Index 71 9 109 4.1
52. What are the views of YOUR AUTHORITY about the usefulness of the following FHSIs (or arithmetic transformations of them)?
(1) We use it, and find it useful (2) We use it, but do not find it very useful (3) We do not use it, because we use other FHSIs that provide similar information (4) We do not use it, but it seems like it might be useful (5) We do not use it, and it does not seem like it would be very useful
Weights for index: 10 2 5 7 0
(1) (2) (3) (4) (5) Total Index Rank
7.01 : Liquid assets / current liabilities 18 0 2 11 1 32 8.3 2
7.02 : Liquid assets / total liabilities 15 0 4 11 2 32 7.7 3
7.03 : Liquid assets / total assets 21 0 2 7 1 31 8.7 1
7.04 : Liquid liabilities / total liabilities 9 0 2 17 3 31 7.1 5
7.05 : Net open foreign exchange position / capital
0 0 4 20 6 30 5.3 6
7.06 : Duration of assets / duration of liabilities 11 0 1 18 2 32 7.5 4
Total and Average Index 74 0 15 84 15 7.5

Page 79
53. What are the views of YOUR AUTHORITY about the draft guidance that has been prepared for the following FHSIs? (More than one response may be entered, where applicable. Use the comment boxes to suggest specific improvements.)
(1) The guidance is sufficiently clear and detailed (2) The guidance is unclear (3) More detail on calculating the FHSI would be useful (4) More guidance on interpreting the results would be useful
Weights for index: 10 0 0 0
(1) (2) (3) (4) Total Index Rank
7.01 : Liquid assets / current liabilities 28 0 1 1 30 9.3 2
7.02 : Liquid assets / total liabilities 29 0 1 1 31 9.4 1
7.03 : Liquid assets / total assets 27 0 1 1 29 9.3 2
7.04 : Liquid liabilities / total liabilities 27 0 1 1 29 9.3 2
7.05 : Net open foreign exchange position / capital
26 0 3 2 31 8.4 5
7.06 : Duration of assets / duration of liabilities
27 1 3 2 33 8.2 6
Total and Average Index 164 1 10 8 9.0
54. What are the views of YOUR AUTHORITY about the draft mapping to risk‐assessment categories that has been prepared for the following FHSIs? (More than one response may be entered, where applicable. Use the comment boxes to suggest specific changes.)
(1) The mapping seems appropriate (2) The mapping includes categories for which this FHSI is not relevant (3) The mapping omits some categories for which this FHSI is relevant
Weights for index: 10 0 0
(1) (2) (3) Total Index Rank
7.01 : Liquid assets / current liabilities 27 0 3 30 9.0 4
7.02 : Liquid assets / total liabilities 27 0 3 30 9.0 4
7.03 : Liquid assets / total assets 25 0 4 29 8.6 6
7.04 : Liquid liabilities / total liabilities 27 0 2 29 9.3 3
7.05 : Net open foreign exchange position / capital
28 0 0 28 10.0 1
7.06 : Duration of assets / duration of liabilities 29 1 1 31 9.4 2
Total and Average Index 163 1 13 9.2

Page 80
55. Which the following best describes the use of supervisory benchmarks by YOUR AUTHORITY for the following FHSIs (or arithmetic transformations of them)?
(1) Benchmarks have been established, which reflect requirements of legislation (2) Benchmarks have been established, which are largely based on experience in YOUR JURISDICTION (3) Benchmarks have been established, which are largely based on those used by other supervisors (4) No benchmarks are used, but it seems like they might be useful (5) No benchmarks are used, and it does not seem like they would be very useful (6) Not applicable, because YOUR AUTHORITY does not use this FHSI
Weights for index: 10 10 7 5 0 omit
(1) (2) (3) (4) (5) (6) Total Index Rank
7.01 : Liquid assets / current liabilities 4 8 1 9 1 8 31 7.5 1
7.02 : Liquid assets / total liabilities 2 4 1 12 2 10 31 6.0 3
7.03 : Liquid assets / total assets 1 6 3 14 2 5 31 6.2 2
7.04 : Liquid liabilities / total liabilities 0 3 1 9 2 15 30 5.5 4
7.05 : Net open foreign exchange position / capital
0 0 0 10 3 17 30 3.8 6
7.06 : Duration of assets / duration of liabilities
1 2 0 13 7 8 31 4.1 5
Total and Average Index 8 23 6 67 17 63 5.7

Page 81
56. If YOUR AUTHORITY has established benchmarks for the following FHSIs, what benchmarks are used for conventional insurance activities? (If the FHSI is not used by YOUR AUTHORITY or no benchmark has been established, please leave the relevant cell blank.)
(1) Minimum for non‐life insurance (2) Maximum for non‐life insurance (3) Minimum for life insurance (4) Maximum for life insurance
First row : number of quantitative responses (1) (2) (3) (4)
7.01 : Liquid assets / current liabilities 5 0 3 0
Lowest 100 N/A 100 N/A
Average 120 N/A 117 N/A
Highest 150 N/A 150 N/A
7.02 : Liquid assets / total liabilities 1 0 1 0
Lowest 100 N/A 100 N/A
Average 100 N/A 100 N/A
Highest 100 N/A 100 N/A
7.03 : Liquid assets / total assets 2 1 1 1
Lowest 10 95 30 60
Average 20 95 30 60
Highest 30 95 30 60
7.04 : Liquid liabilities / total liabilities 0 0 0 0
Lowest N/A N/A N/A N/A
Average N/A N/A N/A N/A
Highest N/A N/A N/A N/A
7.05 : Net open foreign exchange position / capital 0 0 0 0
Lowest N/A N/A N/A N/A
Average N/A N/A N/A N/A
Highest N/A N/A N/A N/A
7.06 : Duration of assets / duration of liabilities 0 0 0 0
Lowest N/A N/A N/A N/A
Average N/A N/A N/A N/A
Highest N/A N/A N/A N/A

Page 82
8. Subsidiaries
57. Does YOUR AUTHORITY use the following FHSIs?
(1) Yes, as described (2) An arithmetic transformation is used (3) No
Weights for index: 10 8 0
(1) (2) (3) Total Index Rank
8.01 : Group debtors / total assets 3 2 26 31 1.5 4
8.02 : Related party receivables / total assets 10 3 19 32 3.9 1
8.03 : Due to related parties / total assets 6 2 22 30 2.5 3
8.04 : (Investments in related parties + related party receivables) / total assets
10 1 21 32 3.4 2
8.05 : (Investments by related parties + due to related parties) / total assets
3 1 27 31 1.2 5
8.06 : (Revenues from related parties + expenditures to related parties) / (total revenues + total expenditures)
0 0 31 31 ‐ 8
8.07 : Group (gross written premium + paid claims) / total (gross written premium + paid claims)
1 1 29 31 0.6 7
8.08 : Related party (gross written premium + paid claims) / total (gross written premium + paid claims)
2 1 28 31 0.9 6
Total and Average Index 35 11 203 1.8
58. What are the views of YOUR AUTHORITY about the usefulness of the following FHSIs (or arithmetic transformations of them)?
(1) We use it, and find it useful (2) We use it, but do not find it very useful (3) We do not use it, because we use other FHSIs that provide similar information (4) We do not use it, but it seems like it might be useful (5) We do not use it, and it does not seem like it would be very useful
Weights for index: 10 2 5 7 0
(1) (2) (3) (4) (5) Total Index Rank
8.01 : Group debtors / total assets 4 0 1 21 5 31 6.2 4
8.02 : Related party receivables / total assets 13 0 2 13 4 32 7.2 1
8.03 : Due to related parties / total assets 9 0 2 14 6 31 6.4 3
8.04 : (Investments in related parties + related party receivables) / total assets
12 0 2 13 5 32 6.9 2
8.05 : (Investments by related parties + due to related parties) / total assets
5 0 2 18 6 31 6.0 5
8.06 : (Revenues from related parties + expenditures to related parties) / (total revenues + total expenditures)
1 0 1 22 7 31 5.5 7
8.07 : Group (gross written premium + paid claims) / total (gross written premium + paid claims)
1 0 1 22 7 31 5.5 7
8.08 : Related party (gross written premium + paid claims) / total (gross written premium + paid claims)
3 0 1 20 7 31 5.6 6
Total and Average Index 48 0 12 143 47 6.2

Page 83
59. What are the views of YOUR AUTHORITY about the draft guidance that has been prepared for the following FHSIs? (More than one response may be entered, where applicable. Use the comment boxes to suggest specific improvements.)
(1) The guidance is sufficiently clear and detailed (2) The guidance is unclear (3) More detail on calculating the FHSI would be useful (4) More guidance on interpreting the results would be useful
Weights for index: 10 0 0 0
(1) (2) (3) (4) Total Index Rank
8.01 : Group debtors / total assets 27 0 1 1 29 9.3 3
8.02 : Related party receivables / total assets 29 0 1 1 31 9.4 1
8.03 : Due to related parties / total assets 25 0 2 3 30 8.3 8
8.04 : (Investments in related parties + related party receivables) / total assets
29 0 1 1 31 9.4 1
8.05 : (Investments by related parties + due to related parties) / total assets
27 0 1 1 29 9.3 3
8.06 : (Revenues from related parties + expenditures to related parties) / (total revenues + total expenditures)
27 0 1 1 29 9.3 3
8.07 : Group (gross written premium + paid claims) / total (gross written premium + paid claims)
27 0 1 1 29 9.3 3
8.08 : Related party (gross written premium + paid claims) / total (gross written premium + paid claims)
27 1 1 1 30 9.0 7
Total and Average Index 218 1 9 10 9.2
60. What are the views of YOUR AUTHORITY about the draft mapping to risk‐assessment categories that has been prepared for the following FHSIs? (More than one response may be entered, where applicable. Use the comment boxes to suggest specific changes.)
(1) The mapping seems appropriate (2) The mapping includes categories for which this FHSI is not relevant (3) The mapping omits some categories for which this FHSI is relevant
Weights for index: 10 0 0
(1) (2) (3) Total Index Rank
8.01 : Group debtors / total assets 28 0 1 29 9.7 2
8.02 : Related party receivables / total assets 29 0 1 30 9.7 2
8.03 : Due to related parties / total assets 28 0 1 29 9.7 2
8.04 : (Investments in related parties + related party receivables) / total assets
29 0 0 29 10.0 1
8.05 : (Investments by related parties + due to related parties) / total assets
28 0 1 29 9.7 2
8.06 : (Revenues from related parties + expenditures to related parties) / (total revenues + total expenditures)
28 0 1 29 9.7 2
8.07 : Group (gross written premium + paid claims) / total (gross written premium + paid claims)
28 0 1 29 9.7 2
8.08 : Related party (gross written premium + paid claims) / total (gross written premium + paid claims)
28 1 1 30 9.3 8
Total and Average Index 226 1 7 9.7

Page 84
61. Which the following best describes the use of supervisory benchmarks by YOUR AUTHORITY for the following FHSIs (or arithmetic transformations of them)?
(1) Benchmarks have been established, which reflect requirements of legislation (2) Benchmarks have been established, which are largely based on experience in YOUR JURISDICTION (3) Benchmarks have been established, which are largely based on those used by other supervisors (4) No benchmarks are used, but it seems like they might be useful (5) No benchmarks are used, and it does not seem like they would be very useful (6) Not applicable, because YOUR AUTHORITY does not use this FHSI
Weights for index: 10 10 7 5 0 omit
(1) (2) (3) (4) (5) (6) Total Index Rank
8.01 : Group debtors / total assets 0 1 0 11 2 15 29 4.6 4
8.02 : Related party receivables / total assets 1 4 1 10 2 13 31 5.9 1
8.03 : Due to related parties / total assets 0 2 2 7 2 16 29 5.3 2
8.04 : (Investments in related parties + related party receivables) / total assets
1 2 2 11 3 12 31 5.2 3
8.05 : (Investments by related parties + due to related parties) / total assets
0 1 1 10 3 15 30 4.5 5
8.06 : (Revenues from related parties + expenditures to related parties) / (total revenues + total expenditures)
0 0 1 10 2 16 29 4.4 6
8.07 : Group (gross written premium + paid claims) / total (gross written premium + paid claims)
0 0 0 10 3 16 29 3.8 8
8.08 : Related party (gross written premium + paid claims) / total (gross written premium + paid claims)
0 1 0 11 3 14 29 4.3 7
Total and Average Index 2 11 7 80 20 117 4.8

Page 85
62. If YOUR AUTHORITY has established benchmarks for the following FHSIs, what benchmarks are used for conventional insurance activities? (If the FHSI is not used by YOUR AUTHORITY or no benchmark has been established, please leave the relevant cell blank.)
(1) Minimum for non‐life insurance (2) Maximum for non‐life insurance (3) Minimum for life insurance (4) Maximum for life insurance
First row : number of quantitative responses (1) (2) (3) (4)
8.01 : Group debtors / total assets 0 0 0 0
Lowest N/A N/A N/A N/A
Average N/A N/A N/A N/A
Highest N/A N/A N/A N/A
8.02 : Related party receivables / total assets 0 1 0 0
Lowest N/A 5 N/A N/A
Average N/A 5 N/A N/A
Highest N/A 5 N/A N/A
8.03 : Due to related parties / total assets 0 1 0 1
Lowest N/A 10 N/A 10
Average N/A 10 N/A 10
Highest N/A 10 N/A 10
8.04 : (Investments in related parties + related party receivables) / total assets
1 3 1 2
Lowest 0 0 0 0
Average 0 12 0 5
Highest 0 25 0 10
8.05 : (Investments by related parties + due to related parties) / total assets 0 0 0 0
Lowest N/A N/A N/A N/A
Average N/A N/A N/A N/A
Highest N/A N/A N/A N/A
8.06 : (Revenues from related parties + expenditures to related parties) / (total revenues + total expenditures)
0 0 0 0
Lowest N/A N/A N/A N/A
Average N/A N/A N/A N/A
Highest N/A N/A N/A N/A
8.07 : Group (gross written premium + paid claims) / total (gross written premium + paid claims)
0 0 0 0
Lowest N/A N/A N/A N/A
Average N/A N/A N/A N/A
Highest N/A N/A N/A N/A
8.08 : Related party (gross written premium + paid claims) / total (gross written premium + paid claims)
0 0 0 0
Lowest N/A N/A N/A N/A
Average N/A N/A N/A N/A
Highest N/A N/A N/A N/A
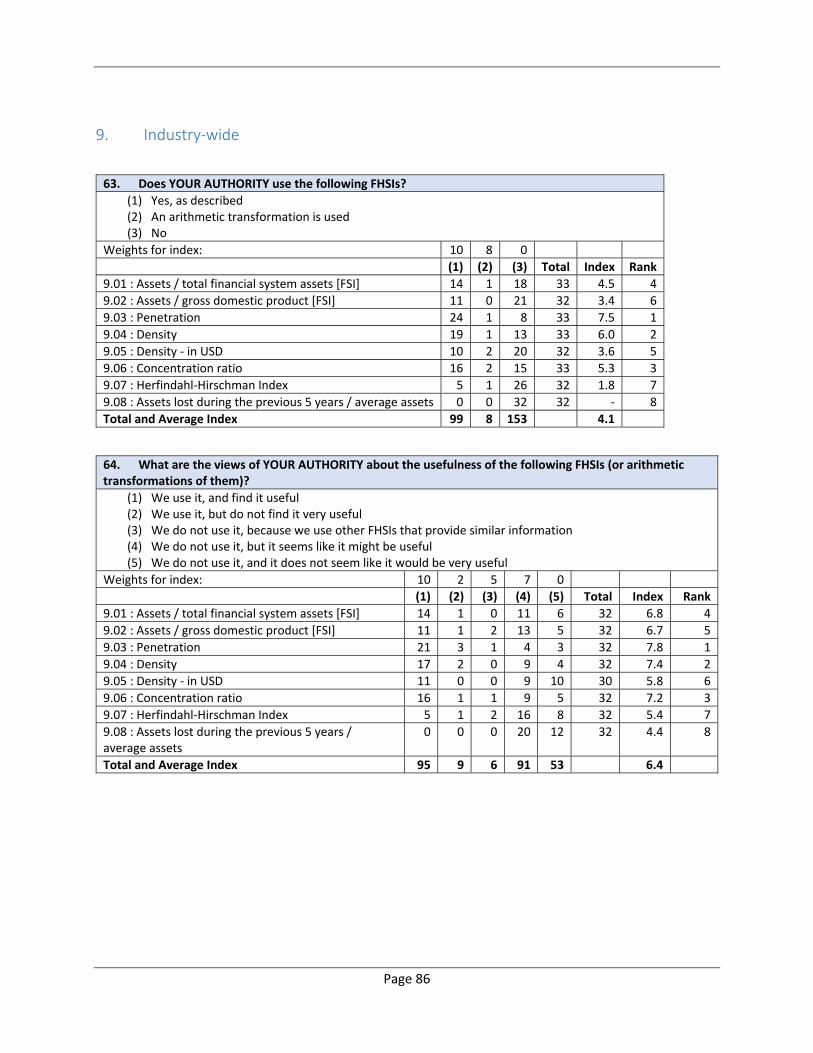
Page 86
9. Industry‐wide
63. Does YOUR AUTHORITY use the following FHSIs?
(1) Yes, as described (2) An arithmetic transformation is used (3) No
Weights for index: 10 8 0
(1) (2) (3) Total Index Rank
9.01 : Assets / total financial system assets [FSI] 14 1 18 33 4.5 4
9.02 : Assets / gross domestic product [FSI] 11 0 21 32 3.4 6
9.03 : Penetration 24 1 8 33 7.5 1
9.04 : Density 19 1 13 33 6.0 2
9.05 : Density ‐ in USD 10 2 20 32 3.6 5
9.06 : Concentration ratio 16 2 15 33 5.3 3
9.07 : Herfindahl‐Hirschman Index 5 1 26 32 1.8 7
9.08 : Assets lost during the previous 5 years / average assets 0 0 32 32 ‐ 8
Total and Average Index 99 8 153 4.1
64. What are the views of YOUR AUTHORITY about the usefulness of the following FHSIs (or arithmetic transformations of them)?
(1) We use it, and find it useful (2) We use it, but do not find it very useful (3) We do not use it, because we use other FHSIs that provide similar information (4) We do not use it, but it seems like it might be useful (5) We do not use it, and it does not seem like it would be very useful
Weights for index: 10 2 5 7 0
(1) (2) (3) (4) (5) Total Index Rank
9.01 : Assets / total financial system assets [FSI] 14 1 0 11 6 32 6.8 4
9.02 : Assets / gross domestic product [FSI] 11 1 2 13 5 32 6.7 5
9.03 : Penetration 21 3 1 4 3 32 7.8 1
9.04 : Density 17 2 0 9 4 32 7.4 2
9.05 : Density ‐ in USD 11 0 0 9 10 30 5.8 6
9.06 : Concentration ratio 16 1 1 9 5 32 7.2 3
9.07 : Herfindahl‐Hirschman Index 5 1 2 16 8 32 5.4 7
9.08 : Assets lost during the previous 5 years / average assets
0 0 0 20 12 32 4.4 8
Total and Average Index 95 9 6 91 53 6.4

Page 87
65. What are the views of YOUR AUTHORITY about the draft guidance that has been prepared for the following FHSIs? (More than one response may be entered, where applicable. Use the comment boxes to suggest specific improvements.)
(1) The guidance is sufficiently clear and detailed (2) The guidance is unclear (3) More detail on calculating the FHSI would be useful (4) More guidance on interpreting the results would be useful
Weights for index: 10 0 0 0
(1) (2) (3) (4) Total Index Rank
9.01 : Assets / total financial system assets [FSI] 28 0 1 2 31 9.0 3
9.02 : Assets / gross domestic product [FSI] 28 0 2 2 32 8.8 4
9.03 : Penetration 27 0 2 2 31 8.7 5
9.04 : Density 27 0 1 1 29 9.3 1
9.05 : Density ‐ in USD 28 0 1 1 30 9.3 1
9.06 : Concentration ratio 26 0 3 2 31 8.4 6
9.07 : Herfindahl‐Hirschman Index 26 1 3 3 33 7.9 7
9.08 : Assets lost during the previous 5 years / average assets
28 0 1 27 56 5.0 8
Total and Average Index 218 1 14 40 8.0
66. What are the views of YOUR AUTHORITY about the draft mapping to risk‐assessment categories that has been prepared for the following FHSIs? (More than one response may be entered, where applicable. Use the comment boxes to suggest specific changes.)
(1) The mapping seems appropriate (2) The mapping includes categories for which this FHSI is not relevant (3) The mapping omits some categories for which this FHSI is relevant
Weights for index: 10 0 0
(1) (2) (3) Total Index Rank
9.01 : Assets / total financial system assets [FSI] 28 0 1 29 9.7 4
9.02 : Assets / gross domestic product [FSI] 27 0 0 27 10.0 1
9.03 : Penetration 28 0 1 29 9.7 4
9.04 : Density 28 0 1 29 9.7 4
9.05 : Density ‐ in USD 27 0 1 28 9.6 7
9.06 : Concentration ratio 29 0 0 29 10.0 1
9.07 : Herfindahl‐Hirschman Index 27 0 0 27 10.0 1
9.08 : Assets lost during the previous 5 years / average assets
25 2 1 28 8.9 8
Total and Average Index 219 2 5 9.7

Page 88
67. Which the following best describes the use of supervisory benchmarks by YOUR AUTHORITY for the following FHSIs (or arithmetic transformations of them)?
(1) Benchmarks have been established, which reflect requirements of legislation (2) Benchmarks have been established, which are largely based on experience in YOUR JURISDICTION (3) Benchmarks have been established, which are largely based on those used by other supervisors (4) No benchmarks are used, but it seems like they might be useful (5) No benchmarks are used, and it does not seem like they would be very useful (6) Not applicable, because YOUR AUTHORITY does not use this FHSI
Weights for index: 10 10 7 5 0 omit
(1) (2) (3) (4) (5) (6) Total Index Rank
9.01 : Assets / total financial system assets [FSI]
1 3 0 14 4 10 32 5.0 3
9.02 : Assets / gross domestic product [FSI] 1 2 0 14 4 10 31 4.8 4
9.03 : Penetration 1 5 2 13 6 4 31 5.1 2
9.04 : Density 0 3 2 15 6 5 31 4.6 6
9.05 : Density ‐ in USD 0 2 1 13 4 10 30 4.6 6
9.06 : Concentration ratio 1 3 3 14 4 6 31 5.2 1
9.07 : Herfindahl‐Hirschman Index 0 1 2 12 3 12 30 4.7 5
9.08 : Assets lost during the previous 5 years / average assets
0 0 0 10 4 16 30 3.6 8
Total and Average Index 4 19 10 105 35 73 4.8

Page 89
68. If YOUR AUTHORITY has established benchmarks for the following FHSIs, what benchmarks are used for conventional insurance activities? (If the FHSI is not used by YOUR AUTHORITY or no benchmark has been established, please leave the relevant cell blank.)
(1) Minimum for non‐life insurance (2) Maximum for non‐life insurance (3) Minimum for life insurance (4) Maximum for life insurance
First row : number of quantitative responses (1) (2) (3) (4)
9.01 : Assets / total financial system assets [FSI] 0 0 0 0
Lowest N/A N/A N/A N/A
Average N/A N/A N/A N/A
Highest N/A N/A N/A N/A
9.02 : Assets / gross domestic product [FSI] 0 1 0 1
Lowest N/A 120 N/A 120
Average N/A 120 N/A 120
Highest N/A 120 N/A 120
9.03 : Penetration 0 0 0 0
Lowest N/A N/A N/A N/A
Average N/A N/A N/A N/A
Highest N/A N/A N/A N/A
9.04 : Density 0 0 0 0
Lowest N/A N/A N/A N/A
Average N/A N/A N/A N/A
Highest N/A N/A N/A N/A
9.05 : Density ‐ in USD 0 0 0 0
Lowest N/A N/A N/A N/A
Average N/A N/A N/A N/A
Highest N/A N/A N/A N/A
9.06 : Concentration ratio 0 0 0 0
Lowest N/A N/A N/A N/A
Average N/A N/A N/A N/A
Highest N/A N/A N/A N/A
9.07 : Herfindahl‐Hirschman Index 0 0 0 0
Lowest N/A N/A N/A N/A
Average N/A N/A N/A N/A
Highest N/A N/A N/A N/A
9.08 : Assets lost during the previous 5 years / average assets 0 0 0 0
Lowest N/A N/A N/A N/A
Average N/A N/A N/A N/A
Highest N/A N/A N/A N/A
Notes:
9.02: Assets / gross domestic product [FSI]: Benchmark (included in table) is for the total of non‐life and
life insurance.

Page 90
Annex 3 Detailed Results by Topic
A. Use of FHSIs
A. Does YOUR AUTHORITY use the following FHSIs?
(1) Yes, as described (2) An arithmetic transformation is used (3) No
Weights for index: 10 8 0
Response: (1) (2) (3) Total Index Category Rank
Overall Rank
1.01 : Gross written premium / capital 13 1 18 32 4.3 6 37
1.02 : Net written premium / capital 17 0 15 32 5.3 5 26
1.03 : Capital / total assets 15 4 13 32 5.7 4 25
1.04 : Capital / invested assets [FSI] 6 1 24 31 2.2 10 71
1.05 : Capital / technical provisions 10 4 18 32 4.1 7 41
1.06 : Cover of solvency margin 27 1 4 32 8.7 1 6
1.07 : Risk‐based capital adequacy ratios 20 1 11 32 6.5 3 20
1.08 : Growth in capital 26 2 4 32 8.6 2 8
1.09 : Net growth in capital 10 2 20 32 3.6 8 47
1.10 : Statutory deposit / required deposit 11 0 21 32 3.4 9 50
2.01 : (Real estate + unquoted equities + receivables) / total assets
7 0 24 31 2.3 12 68
2.02 : Real estate / total assets 17 2 13 32 5.8 2 24
2.03 : Real estate / capital 5 0 26 31 1.6 17 81
2.04 : (Real estate + mortgages) / total assets 4 2 25 31 1.8 16 76
2.05 : Maximum deposits in a single bank / total assets 9 1 21 31 3.2 9 53
2.06 : (Cash + loans + investments) / total assets 12 3 17 32 4.5 4 32
2.07 : Receivables / (gross written premium + reinsurance recoveries)
8 1 23 32 2.8 11 62
2.08 : Receivables / capital 9 0 22 31 2.9 10 57
2.09 : (Non‐performing investment assets and loans + receivables over 90 days) / total assets
6 1 24 31 2.2 14 71
2.10 : Receivables over 90 days / total receivables 12 3 17 32 4.5 4 32
2.11 : Equities / total assets 16 0 14 30 5.3 3 26
2.12 : Non‐performing loans / total gross loans 7 0 23 30 2.3 12 68
2.13 : Maximum investment in a single counterparty / total assets
12 1 18 31 4.1 8 41
2.14 : Maximum receivable from a single counterparty / total assets
6 1 24 31 2.2 14 71
2.15 : Gross asset position in financial derivatives / capital 3 0 27 30 1 18 87
2.16 : Gross liability position in financial derivatives / capital 2 0 28 30 0.7 19 90
2.17 : Investments: distribution by type 22 1 8 31 7.4 1 15
2.18 : Investments: geographical distribution 13 0 17 30 4.3 6 37
2.19 : Investments: sectoral distribution 13 0 17 30 4.3 6 37
3.01 : Risk retention ratio [FSI] 29 0 3 32 9.1 1 4
3.02 : (Reinsurance recoveries + reinsurance commissions) / reinsurance ceded
7 3 22 32 2.9 3 57
3.03 : Maximum exposure to single risk / capital 9 1 22 32 3.1 2 54
3.04 : Maximum exposure to single event / capital 6 1 25 32 2.1 4 74
3.05 : Maximum premium ceded to a single reinsurer / gross written premium
5 1 26 32 1.8 5 76
4.01 : Net claims provisions / average of net claims paid in last three years
4 5 23 32 2.5 7 65

Page 91
A. Does YOUR AUTHORITY use the following FHSIs?
(1) Yes, as described (2) An arithmetic transformation is used (3) No
Weights for index: 10 8 0
Response: (1) (2) (3) Total Index Category Rank
Overall Rank
4.02 : Net technical provisions / average of net written premium in last three years
4 3 25 32 2 8 75
4.03 : Net claims provisions / capital 7 3 22 32 2.9 6 57
4.04 : Claims development 16 4 11 31 6.2 2 21
4.05 : Underwritten business: distribution by class of business 22 4 6 32 7.9 1 11
4.06 : Underwritten business: geographical distribution 12 1 19 32 4 4 43
4.07 : Underwritten business: sectoral distribution 4 0 28 32 1.3 9 84
4.08 : Actuarial assumption: short‐term interest rate 12 0 20 32 3.8 5 45
4.09 : Actuarial assumption: long‐term interest rate 14 0 18 32 4.4 3 35
5.01 : Gross written premium per employee 5 1 27 33 1.8 10 76
5.02 : Assets per employee 4 1 28 33 1.5 11 82
5.03 : Operating expenses / gross written premium 20 6 6 32 7.8 4 12
5.04 : Personnel expenses / gross written premium 7 4 22 33 3.1 7 54
5.05 : Growth in gross written premium 29 1 3 33 9 1 5
5.06 : Growth in net written premium 26 2 5 33 8.4 2 9
5.07 : Growth in total assets 27 1 5 33 8.4 2 9
5.08 : Gross written premium / sum insured 4 0 29 33 1.2 12 85
5.09 : Gross written premium / number of policies 8 2 23 33 2.9 8 57
5.10 : Complaint index 7 3 23 33 2.8 9 62
5.11 : Pay‐out ratio 11 4 18 33 4.3 6 37
5.12 : Board composition 16 2 15 33 5.3 5 26
6.01 : Claims ratio 28 3 1 32 9.5 1 1
6.02 : Gross claims ratio 23 2 7 32 7.7 5 13
6.03 : Expense ratio 28 3 2 33 9.2 2 2
6.04 : Combined ratio [FSI Non‐Life] 28 3 2 33 9.2 2 2
6.05 : Investment income ratio 20 3 10 33 6.8 6 17
6.06 : Operating ratio 14 4 15 33 5.2 9 30
6.07 : Profitability ratio 19 4 10 33 6.7 8 19
6.08 : Return on revenue 9 1 23 33 3 12 56
6.09 : Revisions to technical provisions / technical provisions 6 2 25 33 2.3 15 68
6.10 : Nominal net investment yield 9 4 19 32 3.8 11 45
6.11 : Real net investment yield 3 3 26 32 1.7 16 80
6.12 : Return on equity (ROE) [FSI] 28 1 4 33 8.7 4 6
6.13 : Earnings per employee 3 0 29 32 0.9 17 88
6.14 : Return on assets (ROA) [FSI Life] 21 2 10 33 6.8 6 17
6.15 : Policies lapsed or surrendered / policies in force at beginning of the year
12 3 18 33 4.4 10 35
6.16 : Market value / book value 7 2 24 33 2.6 13 64
6.17 : Price / earnings ratio 6 3 24 33 2.5 14 65
6.18 : Price / gross written premium 2 0 31 33 0.6 18 91
7.01 : Liquid assets / current liabilities 19 1 12 32 6.2 2 21
7.02 : Liquid assets / total liabilities 15 1 16 32 4.9 3 31
7.03 : Liquid assets / total assets 20 2 9 31 7 1 16
7.04 : Liquid liabilities / total liabilities 9 0 22 31 2.9 5 57
7.05 : Net open foreign exchange position / capital 0 1 30 31 0.3 6 93
7.06 : Duration of assets / duration of liabilities 8 4 20 32 3.5 4 49
8.01 : Group debtors / total assets 3 2 26 31 1.5 4 82
8.02 : Related party receivables / total assets 10 3 19 32 3.9 1 44
8.03 : Due to related parties / total assets 6 2 22 30 2.5 3 65
8.04 : (Investments in related parties + related party receivables) / total assets
10 1 21 32 3.4 2 50
8.05 : (Investments by related parties + due to related parties) / total assets
3 1 27 31 1.2 5 85
8.06 : (Revenues from related parties + expenditures to related parties) / (total revenues + total expenditures)
0 0 31 31 0 8 94

Page 92
A. Does YOUR AUTHORITY use the following FHSIs?
(1) Yes, as described (2) An arithmetic transformation is used (3) No
Weights for index: 10 8 0
Response: (1) (2) (3) Total Index Category Rank
Overall Rank
8.07 : Group (gross written premium + paid claims) / total (gross written premium + paid claims)
1 1 29 31 0.6 7 91
8.08 : Related party (gross written premium + paid claims) / total (gross written premium + paid claims)
2 1 28 31 0.9 6 88
9.01 : Assets / total financial system assets [FSI] 14 1 18 33 4.5 4 32
9.02 : Assets / gross domestic product [FSI] 11 0 21 32 3.4 6 50
9.03 : Penetration 24 1 8 33 7.5 1 14
9.04 : Density 19 1 13 33 6 2 23
9.05 : Density ‐ in USD 10 2 20 32 3.6 5 47
9.06 : Concentration ratio 16 2 15 33 5.3 3 26
9.07 : Herfindahl‐Hirschman Index 5 1 26 32 1.8 7 76
9.08 : Assets lost during the previous 5 years / average assets 0 0 32 32 0 8 94
1124 156 1755 3035 Average Index
Distribution of Responses 37% 5% 58% 100% 4.1
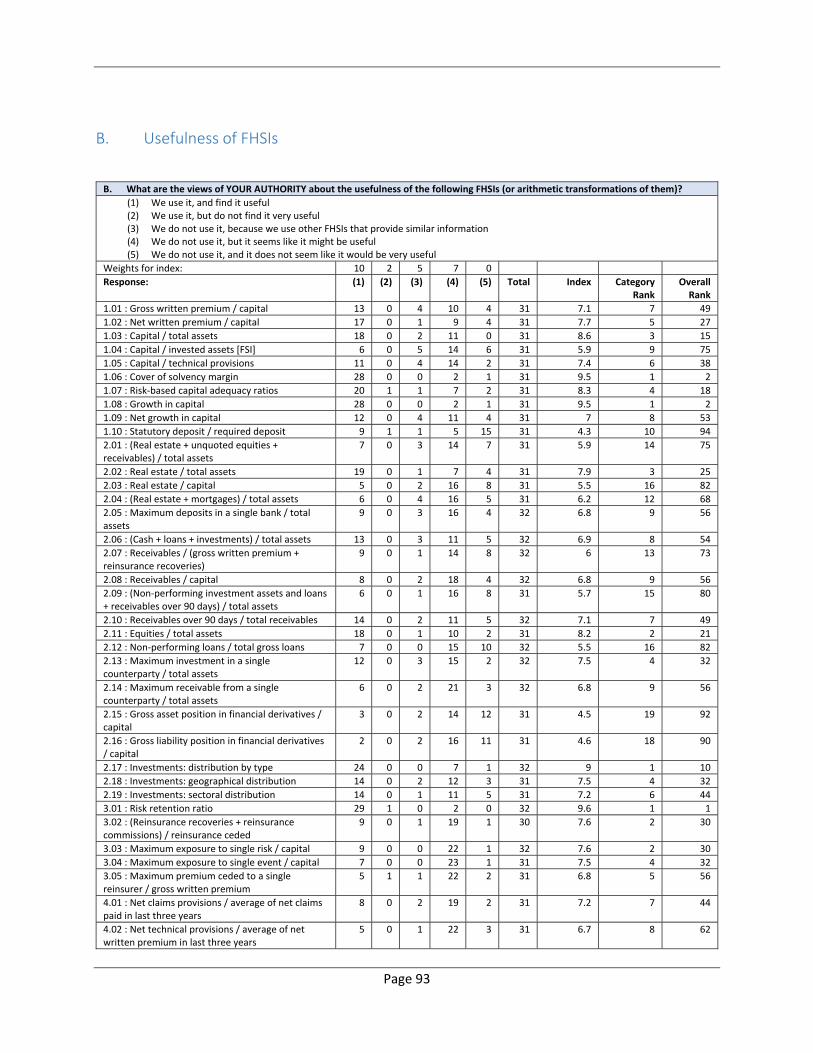
Page 93
B. Usefulness of FHSIs
B. What are the views of YOUR AUTHORITY about the usefulness of the following FHSIs (or arithmetic transformations of them)?
(1) We use it, and find it useful (2) We use it, but do not find it very useful (3) We do not use it, because we use other FHSIs that provide similar information (4) We do not use it, but it seems like it might be useful (5) We do not use it, and it does not seem like it would be very useful
Weights for index: 10 2 5 7 0
Response: (1) (2) (3) (4) (5) Total Index Category Rank
Overall Rank
1.01 : Gross written premium / capital 13 0 4 10 4 31 7.1 7 49
1.02 : Net written premium / capital 17 0 1 9 4 31 7.7 5 27
1.03 : Capital / total assets 18 0 2 11 0 31 8.6 3 15
1.04 : Capital / invested assets [FSI] 6 0 5 14 6 31 5.9 9 75
1.05 : Capital / technical provisions 11 0 4 14 2 31 7.4 6 38
1.06 : Cover of solvency margin 28 0 0 2 1 31 9.5 1 2
1.07 : Risk‐based capital adequacy ratios 20 1 1 7 2 31 8.3 4 18
1.08 : Growth in capital 28 0 0 2 1 31 9.5 1 2
1.09 : Net growth in capital 12 0 4 11 4 31 7 8 53
1.10 : Statutory deposit / required deposit 9 1 1 5 15 31 4.3 10 94
2.01 : (Real estate + unquoted equities + receivables) / total assets
7 0 3 14 7 31 5.9 14 75
2.02 : Real estate / total assets 19 0 1 7 4 31 7.9 3 25
2.03 : Real estate / capital 5 0 2 16 8 31 5.5 16 82
2.04 : (Real estate + mortgages) / total assets 6 0 4 16 5 31 6.2 12 68
2.05 : Maximum deposits in a single bank / total assets
9 0 3 16 4 32 6.8 9 56
2.06 : (Cash + loans + investments) / total assets 13 0 3 11 5 32 6.9 8 54
2.07 : Receivables / (gross written premium + reinsurance recoveries)
9 0 1 14 8 32 6 13 73
2.08 : Receivables / capital 8 0 2 18 4 32 6.8 9 56
2.09 : (Non‐performing investment assets and loans + receivables over 90 days) / total assets
6 0 1 16 8 31 5.7 15 80
2.10 : Receivables over 90 days / total receivables 14 0 2 11 5 32 7.1 7 49
2.11 : Equities / total assets 18 0 1 10 2 31 8.2 2 21
2.12 : Non‐performing loans / total gross loans 7 0 0 15 10 32 5.5 16 82
2.13 : Maximum investment in a single counterparty / total assets
12 0 3 15 2 32 7.5 4 32
2.14 : Maximum receivable from a single counterparty / total assets
6 0 2 21 3 32 6.8 9 56
2.15 : Gross asset position in financial derivatives / capital
3 0 2 14 12 31 4.5 19 92
2.16 : Gross liability position in financial derivatives / capital
2 0 2 16 11 31 4.6 18 90
2.17 : Investments: distribution by type 24 0 0 7 1 32 9 1 10
2.18 : Investments: geographical distribution 14 0 2 12 3 31 7.5 4 32
2.19 : Investments: sectoral distribution 14 0 1 11 5 31 7.2 6 44
3.01 : Risk retention ratio 29 1 0 2 0 32 9.6 1 1
3.02 : (Reinsurance recoveries + reinsurance commissions) / reinsurance ceded
9 0 1 19 1 30 7.6 2 30
3.03 : Maximum exposure to single risk / capital 9 0 0 22 1 32 7.6 2 30
3.04 : Maximum exposure to single event / capital 7 0 0 23 1 31 7.5 4 32
3.05 : Maximum premium ceded to a single reinsurer / gross written premium
5 1 1 22 2 31 6.8 5 56
4.01 : Net claims provisions / average of net claims paid in last three years
8 0 2 19 2 31 7.2 7 44
4.02 : Net technical provisions / average of net written premium in last three years
5 0 1 22 3 31 6.7 8 62
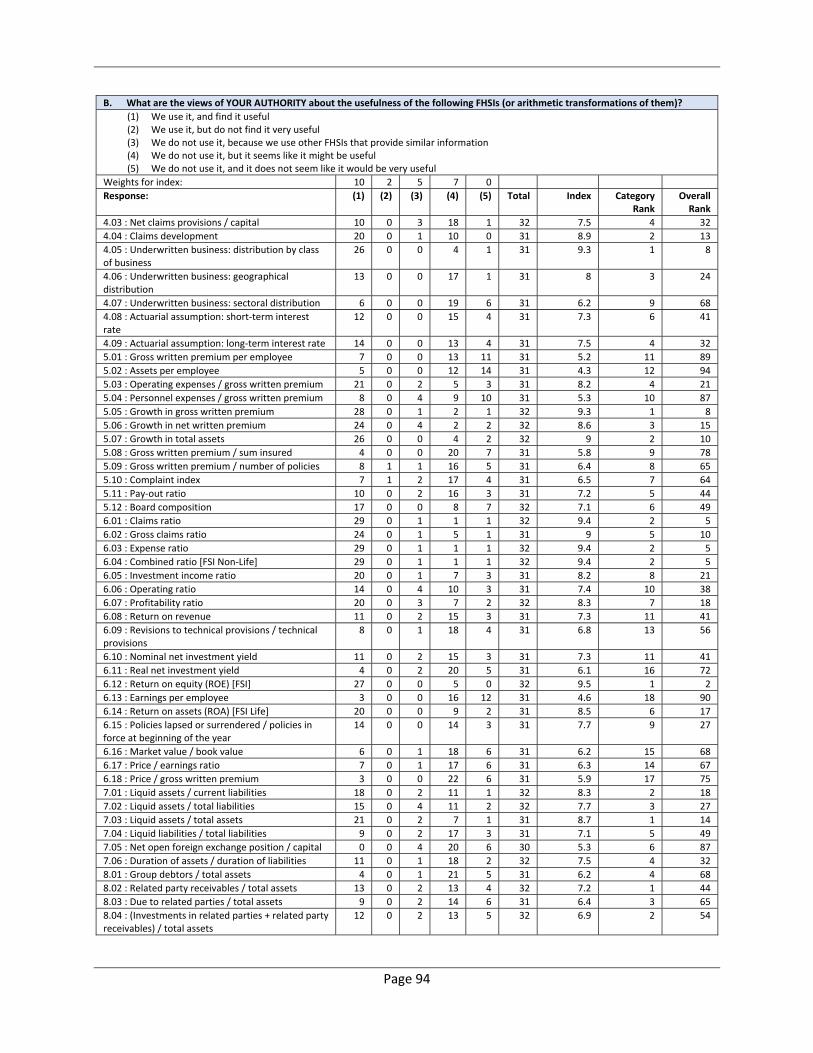
Page 94
B. What are the views of YOUR AUTHORITY about the usefulness of the following FHSIs (or arithmetic transformations of them)?
(1) We use it, and find it useful (2) We use it, but do not find it very useful (3) We do not use it, because we use other FHSIs that provide similar information (4) We do not use it, but it seems like it might be useful (5) We do not use it, and it does not seem like it would be very useful
Weights for index: 10 2 5 7 0
Response: (1) (2) (3) (4) (5) Total Index Category Rank
Overall Rank
4.03 : Net claims provisions / capital 10 0 3 18 1 32 7.5 4 32
4.04 : Claims development 20 0 1 10 0 31 8.9 2 13
4.05 : Underwritten business: distribution by class of business
26 0 0 4 1 31 9.3 1 8
4.06 : Underwritten business: geographical distribution
13 0 0 17 1 31 8 3 24
4.07 : Underwritten business: sectoral distribution 6 0 0 19 6 31 6.2 9 68
4.08 : Actuarial assumption: short‐term interest rate
12 0 0 15 4 31 7.3 6 41
4.09 : Actuarial assumption: long‐term interest rate 14 0 0 13 4 31 7.5 4 32
5.01 : Gross written premium per employee 7 0 0 13 11 31 5.2 11 89
5.02 : Assets per employee 5 0 0 12 14 31 4.3 12 94
5.03 : Operating expenses / gross written premium 21 0 2 5 3 31 8.2 4 21
5.04 : Personnel expenses / gross written premium 8 0 4 9 10 31 5.3 10 87
5.05 : Growth in gross written premium 28 0 1 2 1 32 9.3 1 8
5.06 : Growth in net written premium 24 0 4 2 2 32 8.6 3 15
5.07 : Growth in total assets 26 0 0 4 2 32 9 2 10
5.08 : Gross written premium / sum insured 4 0 0 20 7 31 5.8 9 78
5.09 : Gross written premium / number of policies 8 1 1 16 5 31 6.4 8 65
5.10 : Complaint index 7 1 2 17 4 31 6.5 7 64
5.11 : Pay‐out ratio 10 0 2 16 3 31 7.2 5 44
5.12 : Board composition 17 0 0 8 7 32 7.1 6 49
6.01 : Claims ratio 29 0 1 1 1 32 9.4 2 5
6.02 : Gross claims ratio 24 0 1 5 1 31 9 5 10
6.03 : Expense ratio 29 0 1 1 1 32 9.4 2 5
6.04 : Combined ratio [FSI Non‐Life] 29 0 1 1 1 32 9.4 2 5
6.05 : Investment income ratio 20 0 1 7 3 31 8.2 8 21
6.06 : Operating ratio 14 0 4 10 3 31 7.4 10 38
6.07 : Profitability ratio 20 0 3 7 2 32 8.3 7 18
6.08 : Return on revenue 11 0 2 15 3 31 7.3 11 41
6.09 : Revisions to technical provisions / technical provisions
8 0 1 18 4 31 6.8 13 56
6.10 : Nominal net investment yield 11 0 2 15 3 31 7.3 11 41
6.11 : Real net investment yield 4 0 2 20 5 31 6.1 16 72
6.12 : Return on equity (ROE) [FSI] 27 0 0 5 0 32 9.5 1 2
6.13 : Earnings per employee 3 0 0 16 12 31 4.6 18 90
6.14 : Return on assets (ROA) [FSI Life] 20 0 0 9 2 31 8.5 6 17
6.15 : Policies lapsed or surrendered / policies in force at beginning of the year
14 0 0 14 3 31 7.7 9 27
6.16 : Market value / book value 6 0 1 18 6 31 6.2 15 68
6.17 : Price / earnings ratio 7 0 1 17 6 31 6.3 14 67
6.18 : Price / gross written premium 3 0 0 22 6 31 5.9 17 75
7.01 : Liquid assets / current liabilities 18 0 2 11 1 32 8.3 2 18
7.02 : Liquid assets / total liabilities 15 0 4 11 2 32 7.7 3 27
7.03 : Liquid assets / total assets 21 0 2 7 1 31 8.7 1 14
7.04 : Liquid liabilities / total liabilities 9 0 2 17 3 31 7.1 5 49
7.05 : Net open foreign exchange position / capital 0 0 4 20 6 30 5.3 6 87
7.06 : Duration of assets / duration of liabilities 11 0 1 18 2 32 7.5 4 32
8.01 : Group debtors / total assets 4 0 1 21 5 31 6.2 4 68
8.02 : Related party receivables / total assets 13 0 2 13 4 32 7.2 1 44
8.03 : Due to related parties / total assets 9 0 2 14 6 31 6.4 3 65
8.04 : (Investments in related parties + related party receivables) / total assets
12 0 2 13 5 32 6.9 2 54
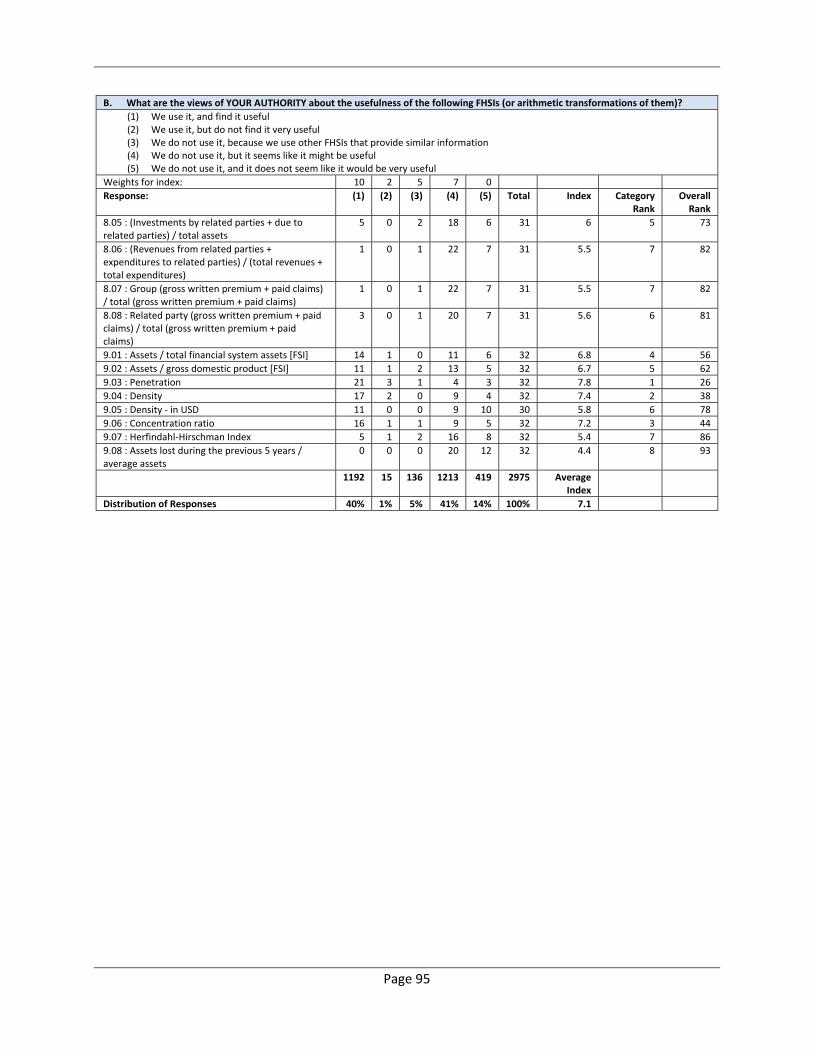
Page 95
B. What are the views of YOUR AUTHORITY about the usefulness of the following FHSIs (or arithmetic transformations of them)?
(1) We use it, and find it useful (2) We use it, but do not find it very useful (3) We do not use it, because we use other FHSIs that provide similar information (4) We do not use it, but it seems like it might be useful (5) We do not use it, and it does not seem like it would be very useful
Weights for index: 10 2 5 7 0
Response: (1) (2) (3) (4) (5) Total Index Category Rank
Overall Rank
8.05 : (Investments by related parties + due to related parties) / total assets
5 0 2 18 6 31 6 5 73
8.06 : (Revenues from related parties + expenditures to related parties) / (total revenues + total expenditures)
1 0 1 22 7 31 5.5 7 82
8.07 : Group (gross written premium + paid claims) / total (gross written premium + paid claims)
1 0 1 22 7 31 5.5 7 82
8.08 : Related party (gross written premium + paid claims) / total (gross written premium + paid claims)
3 0 1 20 7 31 5.6 6 81
9.01 : Assets / total financial system assets [FSI] 14 1 0 11 6 32 6.8 4 56
9.02 : Assets / gross domestic product [FSI] 11 1 2 13 5 32 6.7 5 62
9.03 : Penetration 21 3 1 4 3 32 7.8 1 26
9.04 : Density 17 2 0 9 4 32 7.4 2 38
9.05 : Density ‐ in USD 11 0 0 9 10 30 5.8 6 78
9.06 : Concentration ratio 16 1 1 9 5 32 7.2 3 44
9.07 : Herfindahl‐Hirschman Index 5 1 2 16 8 32 5.4 7 86
9.08 : Assets lost during the previous 5 years / average assets
0 0 0 20 12 32 4.4 8 93
1192 15 136 1213 419 2975 Average Index
Distribution of Responses 40% 1% 5% 41% 14% 100% 7.1

Page 96
C. Guidance on FHSIs
C. What are the views of YOUR AUTHORITY about the draft guidance that has been prepared for the following FHSIs?
(1) The guidance is sufficiently clear and detailed (2) The guidance is unclear (3) More detail on calculating the FHSI would be useful (4) More guidance on interpreting the results would be useful
Weights for index: 10 0 0 0
Response: (1) (2) (3) (4) Total Index Category Rank
Overall Rank
1.01 : Gross written premium / capital 24 0 1 3 28 8.6 2 53
1.02 : Net written premium / capital 24 0 1 3 28 8.6 2 53
1.03 : Capital / total assets 24 0 1 4 29 8.3 4 67
1.04 : Capital / invested assets [FSI] 21 0 3 4 28 7.5 10 90
1.05 : Capital / technical provisions 23 0 1 5 29 7.9 7 79
1.06 : Cover of solvency margin 24 0 4 2 30 8 5 77
1.07 : Risk‐based capital adequacy ratios 22 0 4 2 28 7.9 7 79
1.08 : Growth in capital 25 0 1 2 28 8.9 1 39
1.09 : Net growth in capital 21 0 4 2 27 7.8 9 85
1.10 : Statutory deposit / required deposit 24 1 3 2 30 8 5 77
2.01 : (Real estate + unquoted equities + receivables) / total assets
25 0 5 3 33 7.6 16 89
2.02 : Real estate / total assets 27 0 3 3 33 8.2 9 69
2.03 : Real estate / capital 26 0 3 4 33 7.9 13 79
2.04 : (Real estate + mortgages) / total assets 26 0 2 4 32 8.1 10 71
2.05 : Maximum deposits in a single bank / total assets 26 1 2 3 32 8.1 10 71
2.06 : (Cash + loans + investments) / total assets 28 0 2 3 33 8.5 3 57
2.07 : Receivables / (gross written premium + reinsurance recoveries)
24 1 3 4 32 7.5 17 90
2.08 : Receivables / capital 28 0 2 3 33 8.5 3 57
2.09 : (Non‐performing investment assets and loans + receivables over 90 days) / total assets
24 0 3 4 31 7.7 15 87
2.10 : Receivables over 90 days / total receivables 28 0 2 2 32 8.8 2 40
2.11 : Equities / total assets 27 0 1 2 30 9 1 26
2.12 : Non‐performing loans / total gross loans 25 0 2 4 31 8.1 10 71
2.13 : Maximum investment in a single counterparty / total assets
26 0 2 3 31 8.4 5 59
2.14 : Maximum receivable from a single counterparty / total assets
26 0 2 3 31 8.4 5 59
2.15 : Gross asset position in financial derivatives / capital 23 0 2 6 31 7.4 18 92
2.16 : Gross liability position in financial derivatives / capital
23 0 2 6 31 7.4 18 92
2.17 : Investments: distribution by type 26 0 3 2 31 8.4 5 59
2.18 : Investments: geographical distribution 27 0 3 2 32 8.4 5 59
2.19 : Investments: sectoral distribution 27 2 3 2 34 7.9 13 79
3.01 : Risk retention ratio 30 0 0 0 30 10 1 1
3.02 : (Reinsurance recoveries + reinsurance commissions) / reinsurance ceded
27 0 0 1 28 9.6 2 2
3.03 : Maximum exposure to single risk / capital 27 0 3 1 31 8.7 4 42
3.04 : Maximum exposure to single event / capital 27 0 2 0 29 9.3 3 10
3.05 : Maximum premium ceded to a single reinsurer / gross written premium
27 2 1 1 31 8.7 4 42
4.01 : Net claims provisions / average of net claims paid in last three years
25 0 2 4 31 8.1 6 71
4.02 : Net technical provisions / average of net written premium in last three years
25 1 2 3 31 8.1 6 71
4.03 : Net claims provisions / capital 26 0 2 3 31 8.4 5 59
4.04 : Claims development 27 0 0 2 29 9.3 1 10

Page 97
C. What are the views of YOUR AUTHORITY about the draft guidance that has been prepared for the following FHSIs?
(1) The guidance is sufficiently clear and detailed (2) The guidance is unclear (3) More detail on calculating the FHSI would be useful (4) More guidance on interpreting the results would be useful
Weights for index: 10 0 0 0
Response: (1) (2) (3) (4) Total Index Category Rank
Overall Rank
4.05 : Underwritten business: distribution by class of business
27 0 0 2 29 9.3 1 10
4.06 : Underwritten business: geographical distribution 24 0 1 3 28 8.6 3 53
4.07 : Underwritten business: sectoral distribution 24 1 1 2 28 8.6 3 53
4.08 : Actuarial assumption: short‐term interest rate 25 0 3 3 31 8.1 6 71
4.09 : Actuarial assumption: long‐term interest rate 25 1 3 3 32 7.8 9 85
5.01 : Gross written premium per employee 26 0 1 3 30 8.7 8 42
5.02 : Assets per employee 26 0 1 3 30 8.7 8 42
5.03 : Operating expenses / gross written premium 26 0 2 2 30 8.7 8 42
5.04 : Personnel expenses / gross written premium 26 0 1 2 29 9 3 26
5.05 : Growth in gross written premium 29 0 1 1 31 9.4 1 3
5.06 : Growth in net written premium 29 0 1 1 31 9.4 1 3
5.07 : Growth in total assets 28 0 1 2 31 9 3 26
5.08 : Gross written premium / sum insured 26 0 1 3 30 8.7 8 42
5.09 : Gross written premium / number of policies 27 0 1 2 30 9 3 26
5.10 : Complaint index 27 0 2 1 30 9 3 26
5.11 : Pay‐out ratio 26 0 2 1 29 9 3 26
5.12 : Board composition 24 1 3 3 31 7.7 12 87
6.01 : Claims ratio 28 0 1 2 31 9 7 26
6.02 : Gross claims ratio 26 0 1 3 30 8.7 12 42
6.03 : Expense ratio 28 0 1 2 31 9 7 26
6.04 : Combined ratio [FSI Non‐Life] 29 0 1 1 31 9.4 1 3
6.05 : Investment income ratio 26 0 2 2 30 8.7 12 42
6.06 : Operating ratio 26 0 2 2 30 8.7 12 42
6.07 : Profitability ratio 29 0 1 1 31 9.4 1 3
6.08 : Return on revenue 26 0 1 3 30 8.7 12 42
6.09 : Revisions to technical provisions / technical provisions
23 0 5 3 31 7.4 18 92
6.10 : Nominal net investment yield 26 0 1 2 29 9 7 26
6.11 : Real net investment yield 26 0 1 2 29 9 7 26
6.12 : Return on equity (ROE) [FSI] 28 0 1 1 30 9.3 3 10
6.13 : Earnings per employee 27 0 1 1 29 9.3 3 10
6.14 : Return on assets (ROA) [FSI Life] 28 0 1 1 30 9.3 3 10
6.15 : Policies lapsed or surrendered / policies in force at beginning of the year
28 0 1 1 30 9.3 3 10
6.16 : Market value / book value 27 0 2 1 30 9 7 26
6.17 : Price / earnings ratio 26 0 3 2 31 8.4 16 59
6.18 : Price / gross written premium 26 1 3 3 33 7.9 17 79
7.01 : Liquid assets / current liabilities 28 0 1 1 30 9.3 2 10
7.02 : Liquid assets / total liabilities 29 0 1 1 31 9.4 1 3
7.03 : Liquid assets / total assets 27 0 1 1 29 9.3 2 10
7.04 : Liquid liabilities / total liabilities 27 0 1 1 29 9.3 2 10
7.05 : Net open foreign exchange position / capital 26 0 3 2 31 8.4 5 59
7.06 : Duration of assets / duration of liabilities 27 1 3 2 33 8.2 6 69
8.01 : Group debtors / total assets 27 0 1 1 29 9.3 3 10
8.02 : Related party receivables / total assets 29 0 1 1 31 9.4 1 3
8.03 : Due to related parties / total assets 25 0 2 3 30 8.3 8 67
8.04 : (Investments in related parties + related party receivables) / total assets
29 0 1 1 31 9.4 1 3
8.05 : (Investments by related parties + due to related parties) / total assets
27 0 1 1 29 9.3 3 10
8.06 : (Revenues from related parties + expenditures to related parties) / (total revenues + total expenditures)
27 0 1 1 29 9.3 3 10
8.07 : Group (gross written premium + paid claims) / total (gross written premium + paid claims)
27 0 1 1 29 9.3 3 10
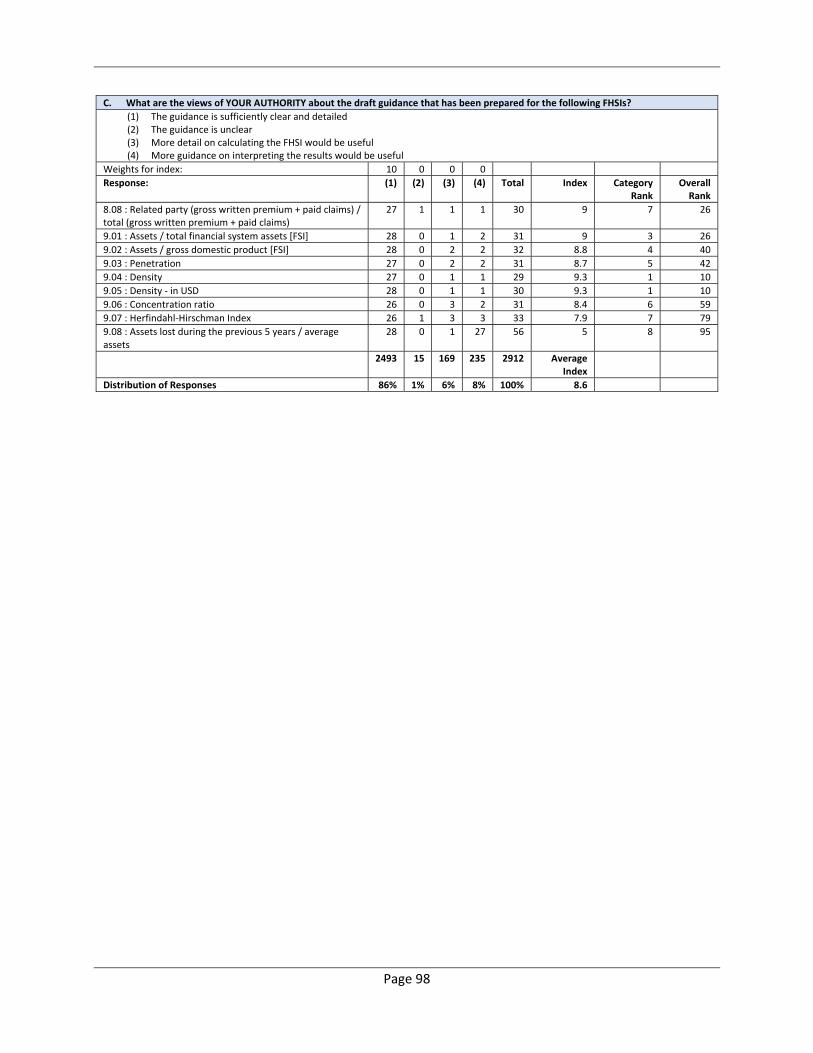
Page 98
C. What are the views of YOUR AUTHORITY about the draft guidance that has been prepared for the following FHSIs?
(1) The guidance is sufficiently clear and detailed (2) The guidance is unclear (3) More detail on calculating the FHSI would be useful (4) More guidance on interpreting the results would be useful
Weights for index: 10 0 0 0
Response: (1) (2) (3) (4) Total Index Category Rank
Overall Rank
8.08 : Related party (gross written premium + paid claims) / total (gross written premium + paid claims)
27 1 1 1 30 9 7 26
9.01 : Assets / total financial system assets [FSI] 28 0 1 2 31 9 3 26
9.02 : Assets / gross domestic product [FSI] 28 0 2 2 32 8.8 4 40
9.03 : Penetration 27 0 2 2 31 8.7 5 42
9.04 : Density 27 0 1 1 29 9.3 1 10
9.05 : Density ‐ in USD 28 0 1 1 30 9.3 1 10
9.06 : Concentration ratio 26 0 3 2 31 8.4 6 59
9.07 : Herfindahl‐Hirschman Index 26 1 3 3 33 7.9 7 79
9.08 : Assets lost during the previous 5 years / average assets
28 0 1 27 56 5 8 95
2493 15 169 235 2912 Average Index
Distribution of Responses 86% 1% 6% 8% 100% 8.6

Page 99
D. Mapping of FHSIs
D. What are the views of YOUR AUTHORITY about the draft mapping to risk‐assessment categories that has been prepared for the following FHSIs?
(1) The mapping seems appropriate (2) The mapping includes categories for which this FHSI is not relevant (3) The mapping omits some categories for which this FHSI is relevant
Weights for index: 10 0 0
Response: (1) (2) (3) Total Index Category Rank
Overall Rank
1.01 : Gross written premium / capital 26 0 0 26 10 1 1
1.02 : Net written premium / capital 25 0 1 26 9.6 5 49
1.03 : Capital / total assets 27 0 0 27 10 1 1
1.04 : Capital / invested assets [FSI] 25 0 1 26 9.6 5 49
1.05 : Capital / technical provisions 25 0 1 26 9.6 5 49
1.06 : Cover of solvency margin 26 0 1 27 9.6 5 49
1.07 : Risk‐based capital adequacy ratios 27 0 1 28 9.6 5 49
1.08 : Growth in capital 26 0 0 26 10 1 1
1.09 : Net growth in capital 26 0 0 26 10 1 1
1.10 : Statutory deposit / required deposit 27 2 1 30 9 10 80
2.01 : (Real estate + unquoted equities + receivables) / total assets
27 0 1 28 9.6 11 49
2.02 : Real estate / total assets 28 0 0 28 10 1 1
2.03 : Real estate / capital 28 0 0 28 10 1 1
2.04 : (Real estate + mortgages) / total assets 28 0 0 28 10 1 1
2.05 : Maximum deposits in a single bank / total assets 27 1 0 28 9.6 11 49
2.06 : (Cash + loans + investments) / total assets 26 0 2 28 9.3 16 65
2.07 : Receivables / (gross written premium + reinsurance recoveries)
27 0 1 28 9.6 11 49
2.08 : Receivables / capital 29 0 0 29 10 1 1
2.09 : (Non‐performing investment assets and loans + receivables over 90 days) / total assets
26 1 1 28 9.3 16 65
2.10 : Receivables over 90 days / total receivables 29 0 0 29 10 1 1
2.11 : Equities / total assets 27 0 1 28 9.6 11 49
2.12 : Non‐performing loans / total gross loans 27 1 0 28 9.6 11 49
2.13 : Maximum investment in a single counterparty / total assets
28 0 0 28 10 1 1
2.14 : Maximum receivable from a single counterparty / total assets
28 0 0 28 10 1 1
2.15 : Gross asset position in financial derivatives / capital 28 0 0 28 10 1 1
2.16 : Gross liability position in financial derivatives / capital 28 0 0 28 10 1 1
2.17 : Investments: distribution by type 29 0 0 29 10 1 1
2.18 : Investments: geographical distribution 27 1 1 29 9.3 16 65
2.19 : Investments: sectoral distribution 26 3 2 31 8.4 19 94
3.01 : Risk retention ratio 28 1 0 29 9.7 4 30
3.02 : (Reinsurance recoveries + reinsurance commissions) / reinsurance ceded
28 0 0 28 10 1 1
3.03 : Maximum exposure to single risk / capital 29 0 0 29 10 1 1
3.04 : Maximum exposure to single event / capital 28 0 0 28 10 1 1
3.05 : Maximum premium ceded to a single reinsurer / gross written premium
28 1 2 31 9 5 80
4.01 : Net claims provisions / average of net claims paid in last three years
27 0 0 27 10 1 1
4.02 : Net technical provisions / average of net written premium in last three years
26 0 1 27 9.6 2 49
4.03 : Net claims provisions / capital 26 0 1 27 9.6 2 49
4.04 : Claims development 25 0 3 28 8.9 7 89
4.05 : Underwritten business: distribution by class of business 28 0 2 30 9.3 5 65
4.06 : Underwritten business: geographical distribution 26 0 2 28 9.3 5 65
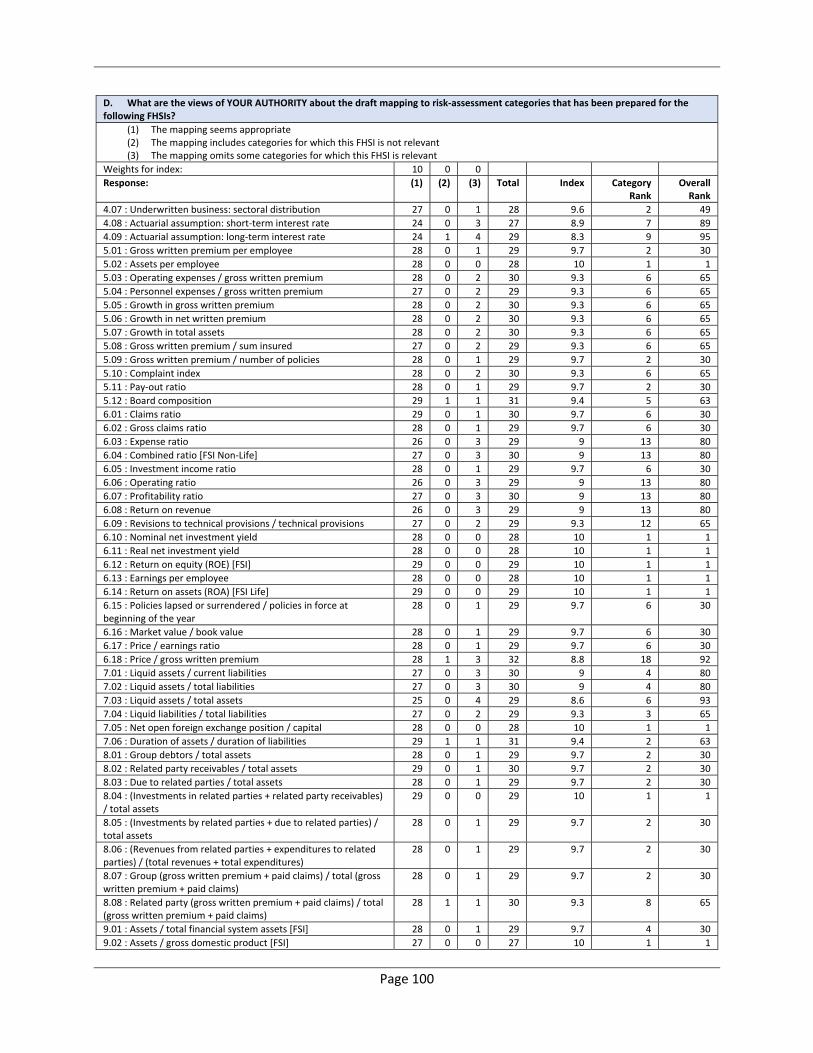
Page 100
D. What are the views of YOUR AUTHORITY about the draft mapping to risk‐assessment categories that has been prepared for the following FHSIs?
(1) The mapping seems appropriate (2) The mapping includes categories for which this FHSI is not relevant (3) The mapping omits some categories for which this FHSI is relevant
Weights for index: 10 0 0
Response: (1) (2) (3) Total Index Category Rank
Overall Rank
4.07 : Underwritten business: sectoral distribution 27 0 1 28 9.6 2 49
4.08 : Actuarial assumption: short‐term interest rate 24 0 3 27 8.9 7 89
4.09 : Actuarial assumption: long‐term interest rate 24 1 4 29 8.3 9 95
5.01 : Gross written premium per employee 28 0 1 29 9.7 2 30
5.02 : Assets per employee 28 0 0 28 10 1 1
5.03 : Operating expenses / gross written premium 28 0 2 30 9.3 6 65
5.04 : Personnel expenses / gross written premium 27 0 2 29 9.3 6 65
5.05 : Growth in gross written premium 28 0 2 30 9.3 6 65
5.06 : Growth in net written premium 28 0 2 30 9.3 6 65
5.07 : Growth in total assets 28 0 2 30 9.3 6 65
5.08 : Gross written premium / sum insured 27 0 2 29 9.3 6 65
5.09 : Gross written premium / number of policies 28 0 1 29 9.7 2 30
5.10 : Complaint index 28 0 2 30 9.3 6 65
5.11 : Pay‐out ratio 28 0 1 29 9.7 2 30
5.12 : Board composition 29 1 1 31 9.4 5 63
6.01 : Claims ratio 29 0 1 30 9.7 6 30
6.02 : Gross claims ratio 28 0 1 29 9.7 6 30
6.03 : Expense ratio 26 0 3 29 9 13 80
6.04 : Combined ratio [FSI Non‐Life] 27 0 3 30 9 13 80
6.05 : Investment income ratio 28 0 1 29 9.7 6 30
6.06 : Operating ratio 26 0 3 29 9 13 80
6.07 : Profitability ratio 27 0 3 30 9 13 80
6.08 : Return on revenue 26 0 3 29 9 13 80
6.09 : Revisions to technical provisions / technical provisions 27 0 2 29 9.3 12 65
6.10 : Nominal net investment yield 28 0 0 28 10 1 1
6.11 : Real net investment yield 28 0 0 28 10 1 1
6.12 : Return on equity (ROE) [FSI] 29 0 0 29 10 1 1
6.13 : Earnings per employee 28 0 0 28 10 1 1
6.14 : Return on assets (ROA) [FSI Life] 29 0 0 29 10 1 1
6.15 : Policies lapsed or surrendered / policies in force at beginning of the year
28 0 1 29 9.7 6 30
6.16 : Market value / book value 28 0 1 29 9.7 6 30
6.17 : Price / earnings ratio 28 0 1 29 9.7 6 30
6.18 : Price / gross written premium 28 1 3 32 8.8 18 92
7.01 : Liquid assets / current liabilities 27 0 3 30 9 4 80
7.02 : Liquid assets / total liabilities 27 0 3 30 9 4 80
7.03 : Liquid assets / total assets 25 0 4 29 8.6 6 93
7.04 : Liquid liabilities / total liabilities 27 0 2 29 9.3 3 65
7.05 : Net open foreign exchange position / capital 28 0 0 28 10 1 1
7.06 : Duration of assets / duration of liabilities 29 1 1 31 9.4 2 63
8.01 : Group debtors / total assets 28 0 1 29 9.7 2 30
8.02 : Related party receivables / total assets 29 0 1 30 9.7 2 30
8.03 : Due to related parties / total assets 28 0 1 29 9.7 2 30
8.04 : (Investments in related parties + related party receivables) / total assets
29 0 0 29 10 1 1
8.05 : (Investments by related parties + due to related parties) / total assets
28 0 1 29 9.7 2 30
8.06 : (Revenues from related parties + expenditures to related parties) / (total revenues + total expenditures)
28 0 1 29 9.7 2 30
8.07 : Group (gross written premium + paid claims) / total (gross written premium + paid claims)
28 0 1 29 9.7 2 30
8.08 : Related party (gross written premium + paid claims) / total (gross written premium + paid claims)
28 1 1 30 9.3 8 65
9.01 : Assets / total financial system assets [FSI] 28 0 1 29 9.7 4 30
9.02 : Assets / gross domestic product [FSI] 27 0 0 27 10 1 1

Page 101
D. What are the views of YOUR AUTHORITY about the draft mapping to risk‐assessment categories that has been prepared for the following FHSIs?
(1) The mapping seems appropriate (2) The mapping includes categories for which this FHSI is not relevant (3) The mapping omits some categories for which this FHSI is relevant
Weights for index: 10 0 0
Response: (1) (2) (3) Total Index Category Rank
Overall Rank
9.03 : Penetration 28 0 1 29 9.7 4 30
9.04 : Density 28 0 1 29 9.7 4 30
9.05 : Density ‐ in USD 27 0 1 28 9.6 7 49
9.06 : Concentration ratio 29 0 0 29 10 1 1
9.07 : Herfindahl‐Hirschman Index 27 0 0 27 10 1 1
9.08 : Assets lost during the previous 5 years / average assets 25 2 1 28 8.9 8 89
2598 18 103 2719 Average Index
Distribution of Responses 96% 1% 4% 100% 9.6

Page 102
E. Use of Benchmarks
E. Which the following best describes the use of supervisory benchmarks by YOUR AUTHORITY for the following FHSIs (or arithmetic transformations of them)?
(1) Benchmarks have been established, which reflect requirements of legislation (2) Benchmarks have been established, which are largely based on experience in YOUR JURISDICTION (3) Benchmarks have been established, which are largely based on those used by other supervisors (4) No benchmarks are used, but it seems like they might be useful (5) No benchmarks are used, and it does not seem like they would be very useful (6) Not applicable, because YOUR AUTHORITY does not use this FHSI
Weights for index: 10 10 7 5 0 Omit
Response: (1) (2) (3) (4) (5) (6) Total Index Category Rank
Overall Rank
1.01 : Gross written premium / capital 2 6 2 5 2 14 31 7 7 17
1.02 : Net written premium / capital 3 6 4 6 1 11 31 7.4 4 6
1.03 : Capital / total assets 3 6 2 9 1 9 30 7.1 5 13
1.04 : Capital / invested assets [FSI] 3 3 1 5 1 18 31 7.1 5 13
1.05 : Capital / technical provisions 2 5 3 4 4 13 31 6.2 10 38
1.06 : Cover of solvency margin 17 6 1 3 1 3 31 9 1 1
1.07 : Risk‐based capital adequacy ratios 14 3 1 3 1 8 30 8.7 2 2
1.08 : Growth in capital 3 8 4 11 2 3 31 6.9 8 20
1.09 : Net growth in capital 2 3 2 6 2 15 30 6.3 9 31
1.10 : Statutory deposit / required deposit 6 3 1 2 1 18 31 8.2 3 3
2.01 : (Real estate + unquoted equities + receivables) / total assets
1 5 0 7 0 16 29 7.3 2 8
2.02 : Real estate / total assets 3 6 2 11 2 5 29 6.6 10 25
2.03 : Real estate / capital 1 3 0 8 0 17 29 6.7 9 22
2.04 : (Real estate + mortgages) / total assets 1 4 1 7 0 16 29 7.1 6 13
2.05 : Maximum deposits in a single bank / total assets
3 5 0 7 1 13 29 7.2 4 10
2.06 : (Cash + loans + investments) / total assets
1 7 0 8 3 11 30 6.3 13 31
2.07 : Receivables / (gross written premium + reinsurance recoveries)
0 3 0 11 1 14 29 5.7 15 50
2.08 : Receivables / capital 3 4 1 9 0 14 31 7.2 4 10
2.09 : (Non‐performing investment assets and loans + receivables over 90 days) / total assets
0 2 0 10 1 16 29 5.4 17 58
2.10 : Receivables over 90 days / total receivables
3 6 0 8 0 13 30 7.6 1 4
2.11 : Equities / total assets 6 3 1 9 3 7 29 6.5 11 27
2.12 : Non‐performing loans / total gross loans
1 4 0 7 1 16 29 6.5 11 27
2.13 : Maximum investment in a single counterparty / total assets
5 4 0 9 1 10 29 7.1 6 13
2.14 : Maximum receivable from a single counterparty / total assets
5 2 0 8 0 14 29 7.3 2 8
2.15 : Gross asset position in financial derivatives / capital
1 1 0 11 1 15 29 5.4 17 58
2.16 : Gross liability position in financial derivatives / capital
0 1 0 11 1 16 29 5 19 67
2.17 : Investments: distribution by type 6 5 2 10 2 5 30 7 8 17
2.18 : Investments: geographical distribution 4 3 0 14 3 6 30 5.8 14 47
2.19 : Investments: sectoral distribution 2 3 0 12 3 10 30 5.5 16 54
3.01 : Risk retention ratio 2 10 2 12 5 1 32 6.3 1 31
3.02 : (Reinsurance recoveries + reinsurance commissions) / reinsurance ceded
0 4 2 11 2 10 29 5.7 4 50
3.03 : Maximum exposure to single risk / capital
3 2 2 10 1 13 31 6.3 1 31

Page 103
E. Which the following best describes the use of supervisory benchmarks by YOUR AUTHORITY for the following FHSIs (or arithmetic transformations of them)?
(1) Benchmarks have been established, which reflect requirements of legislation (2) Benchmarks have been established, which are largely based on experience in YOUR JURISDICTION (3) Benchmarks have been established, which are largely based on those used by other supervisors (4) No benchmarks are used, but it seems like they might be useful (5) No benchmarks are used, and it does not seem like they would be very useful (6) Not applicable, because YOUR AUTHORITY does not use this FHSI
Weights for index: 10 10 7 5 0 Omit
Response: (1) (2) (3) (4) (5) (6) Total Index Category Rank
Overall Rank
3.04 : Maximum exposure to single event / capital
3 0 2 9 2 14 30 5.6 5 53
3.05 : Maximum premium ceded to a single reinsurer / gross written premium
4 1 1 10 1 13 30 6.3 1 31
4.01 : Net claims provisions / average of net claims paid in last three years
1 3 1 14 1 11 31 5.9 2 44
4.02 : Net technical provisions / average of net written premium in last three years
0 2 0 16 1 12 31 5.3 6 60
4.03 : Net claims provisions / capital 0 4 1 15 1 11 32 5.8 4 47
4.04 : Claims development 2 4 1 15 4 5 31 5.5 5 54
4.05 : Underwritten business: distribution by class of business
3 0 1 15 8 4 31 4.1 7 86
4.06 : Underwritten business: geographical distribution
0 0 0 13 7 11 31 3.3 9 95
4.07 : Underwritten business: sectoral distribution
0 0 0 12 5 14 31 3.5 8 92
4.08 : Actuarial assumption: short‐term interest rate
4 2 1 10 3 11 31 5.9 2 44
4.09 : Actuarial assumption: long‐term interest rate
5 3 1 9 3 10 31 6.3 1 31
5.01 : Gross written premium per employee 0 2 0 9 3 16 30 4.6 10 73
5.02 : Assets per employee 0 2 0 9 3 16 30 4.6 10 73
5.03 : Operating expenses / gross written premium
3 8 1 13 1 5 31 7 2 17
5.04 : Personnel expenses / gross written premium
0 5 0 9 1 15 30 6.3 3 31
5.05 : Growth in gross written premium 3 9 3 10 6 1 32 6.2 4 38
5.06 : Growth in net written premium 2 8 4 8 6 4 32 6 5 41
5.07 : Growth in total assets 2 6 2 13 6 3 32 5.5 6 54
5.08 : Gross written premium / sum insured 0 0 1 10 2 17 30 4.4 12 82
5.09 : Gross written premium / number of policies
1 1 1 12 3 12 30 4.8 9 70
5.10 : Complaint index 0 2 0 15 2 12 31 5 8 67
5.11 : Pay‐out ratio 1 2 1 14 3 9 30 5.1 7 64
5.12 : Board composition 5 4 2 8 1 12 32 7.2 1 10
6.01 : Claims ratio 4 9 4 11 4 0 32 6.7 3 22
6.02 : Gross claims ratio 2 10 1 11 4 2 30 6.5 6 27
6.03 : Expense ratio 5 9 3 11 4 0 32 6.8 2 21
6.04 : Combined ratio [FSI Non‐Life] 5 12 4 8 3 0 32 7.4 1 6
6.05 : Investment income ratio 3 5 3 11 4 6 32 6 8 41
6.06 : Operating ratio 2 6 2 8 5 7 30 5.8 9 47
6.07 : Profitability ratio 2 8 3 11 3 5 32 6.5 6 27
6.08 : Return on revenue 1 3 1 10 6 9 30 4.6 12 73
6.09 : Revisions to technical provisions / technical provisions
0 4 1 8 6 11 30 4.6 12 73
6.10 : Nominal net investment yield 0 5 1 13 5 6 30 5.1 11 64
6.11 : Real net investment yield 0 3 1 8 6 12 30 4.3 15 84
6.12 : Return on equity (ROE) [FSI] 3 10 5 10 4 0 32 6.7 3 22
6.13 : Earnings per employee 0 1 0 9 6 14 30 3.4 17 93
6.14 : Return on assets (ROA) [FSI Life] 2 9 1 12 3 4 31 6.6 5 25
6.15 : Policies lapsed or surrendered / policies in force at beginning of the year
1 6 1 12 4 7 31 5.7 10 50
6.16 : Market value / book value 0 2 0 9 7 12 30 3.6 16 90
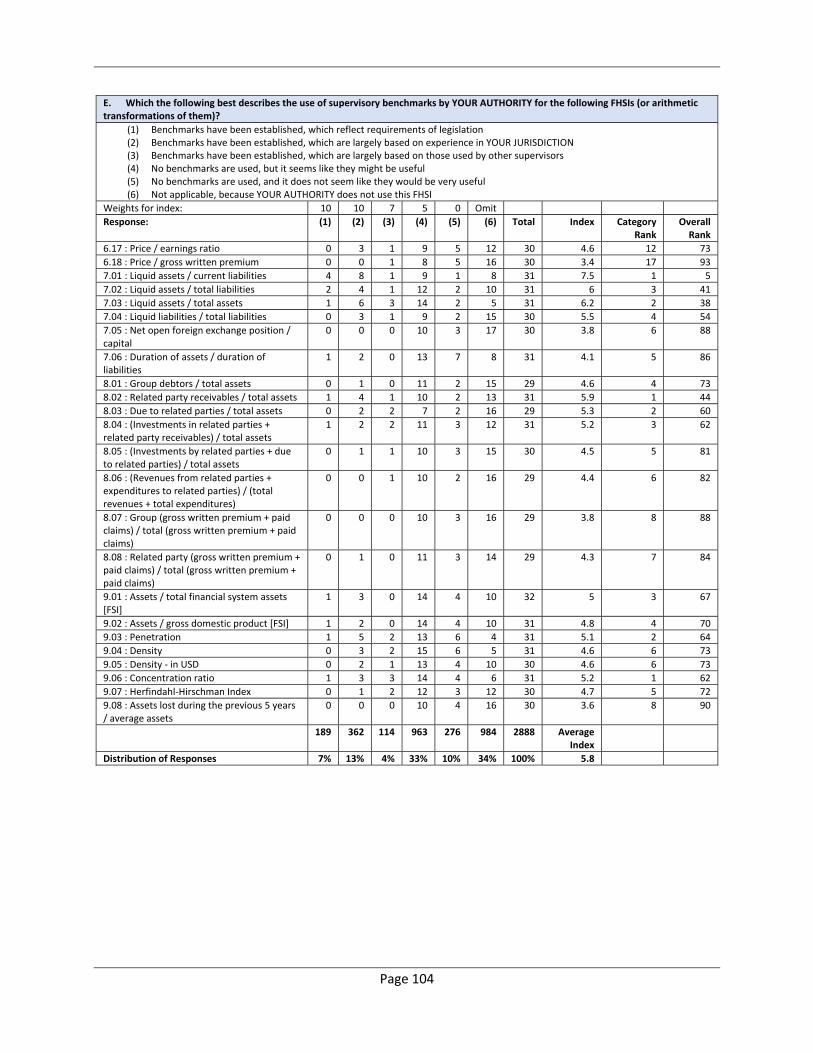
Page 104
E. Which the following best describes the use of supervisory benchmarks by YOUR AUTHORITY for the following FHSIs (or arithmetic transformations of them)?
(1) Benchmarks have been established, which reflect requirements of legislation (2) Benchmarks have been established, which are largely based on experience in YOUR JURISDICTION (3) Benchmarks have been established, which are largely based on those used by other supervisors (4) No benchmarks are used, but it seems like they might be useful (5) No benchmarks are used, and it does not seem like they would be very useful (6) Not applicable, because YOUR AUTHORITY does not use this FHSI
Weights for index: 10 10 7 5 0 Omit
Response: (1) (2) (3) (4) (5) (6) Total Index Category Rank
Overall Rank
6.17 : Price / earnings ratio 0 3 1 9 5 12 30 4.6 12 73
6.18 : Price / gross written premium 0 0 1 8 5 16 30 3.4 17 93
7.01 : Liquid assets / current liabilities 4 8 1 9 1 8 31 7.5 1 5
7.02 : Liquid assets / total liabilities 2 4 1 12 2 10 31 6 3 41
7.03 : Liquid assets / total assets 1 6 3 14 2 5 31 6.2 2 38
7.04 : Liquid liabilities / total liabilities 0 3 1 9 2 15 30 5.5 4 54
7.05 : Net open foreign exchange position / capital
0 0 0 10 3 17 30 3.8 6 88
7.06 : Duration of assets / duration of liabilities
1 2 0 13 7 8 31 4.1 5 86
8.01 : Group debtors / total assets 0 1 0 11 2 15 29 4.6 4 73
8.02 : Related party receivables / total assets 1 4 1 10 2 13 31 5.9 1 44
8.03 : Due to related parties / total assets 0 2 2 7 2 16 29 5.3 2 60
8.04 : (Investments in related parties + related party receivables) / total assets
1 2 2 11 3 12 31 5.2 3 62
8.05 : (Investments by related parties + due to related parties) / total assets
0 1 1 10 3 15 30 4.5 5 81
8.06 : (Revenues from related parties + expenditures to related parties) / (total revenues + total expenditures)
0 0 1 10 2 16 29 4.4 6 82
8.07 : Group (gross written premium + paid claims) / total (gross written premium + paid claims)
0 0 0 10 3 16 29 3.8 8 88
8.08 : Related party (gross written premium + paid claims) / total (gross written premium + paid claims)
0 1 0 11 3 14 29 4.3 7 84
9.01 : Assets / total financial system assets [FSI]
1 3 0 14 4 10 32 5 3 67
9.02 : Assets / gross domestic product [FSI] 1 2 0 14 4 10 31 4.8 4 70
9.03 : Penetration 1 5 2 13 6 4 31 5.1 2 64
9.04 : Density 0 3 2 15 6 5 31 4.6 6 73
9.05 : Density ‐ in USD 0 2 1 13 4 10 30 4.6 6 73
9.06 : Concentration ratio 1 3 3 14 4 6 31 5.2 1 62
9.07 : Herfindahl‐Hirschman Index 0 1 2 12 3 12 30 4.7 5 72
9.08 : Assets lost during the previous 5 years / average assets
0 0 0 10 4 16 30 3.6 8 90
189 362 114 963 276 984 2888 Average Index
Distribution of Responses 7% 13% 4% 33% 10% 34% 100% 5.8

Page 105
F. Benchmarks Used
F. If YOUR AUTHORITY has established benchmarks for the following FHSIs, what benchmarks are used for conventional insurance activities?
First row : number of quantitative responses 1. Minimum for non‐life insurance
2. Maximum for non‐life insurance
3. Minimum for life insurance
4. Maximum for life insurance
1.01 : Gross written premium / capital 2 3 1 1
Lowest 100 400 100 900
Average 200 667 100 900
Highest 300 900 100 900
1.02 : Net written premium / capital 3 5 3 3
Lowest 0 300 0 300
Average 133 460 33 933
Highest 300 1000 100 2000
1.03 : Capital / total assets 1 0 0 0
Lowest 100 N/A N/A N/A
Average 100 N/A N/A N/A
Highest 100 N/A N/A N/A
1.04 : Capital / invested assets [FSI] 1 1 1 1
Lowest 70 100 30 100
Average 70 100 30 100
Highest 70 100 30 100
1.05 : Capital / technical provisions 3 2 1 1
Lowest 0 100 50 100
Average 50 175 50 100
Highest 100 250 50 100
1.06 : Cover of solvency margin 12 1 11 1
Lowest 100 150 100 200
Average 109 150 116 200
Highest 150 150 150 200
1.07 : Risk‐based capital adequacy ratios 7 1 6 1
Lowest 100 130 100 130
Average 126 130 122 130
Highest 200 130 150 130
1.08 : Growth in capital 4 2 3 1
Lowest 5 50 0 50
Average 11 50 10 50
Highest 20 50 20 50
1.09 : Net growth in capital 0 0 0 0
Lowest N/A N/A N/A N/A
Average N/A N/A N/A N/A
Highest N/A N/A N/A N/A
1.10 : Statutory deposit / required deposit 1 0 0 0
Lowest 100 N/A N/A N/A
Average 100 N/A N/A N/A
Highest 100 N/A N/A N/A
2.01 : (Real estate + unquoted equities + receivables) / total assets
0 0 0 0
Lowest N/A N/A N/A N/A
Average N/A N/A N/A N/A
Highest N/A N/A N/A N/A
2.02 : Real estate / total assets 0 4 0 3
Lowest N/A 10 N/A 10
Average N/A 13 N/A 18
Highest N/A 20 N/A 30
2.03 : Real estate / capital 0 0 0 0
Lowest N/A N/A N/A N/A
Average N/A N/A N/A N/A
Highest N/A N/A N/A N/A
2.04 : (Real estate + mortgages) / total assets 0 2 0 2
Lowest N/A 20 N/A 0

Page 106
F. If YOUR AUTHORITY has established benchmarks for the following FHSIs, what benchmarks are used for conventional insurance activities?
First row : number of quantitative responses 1. Minimum for non‐life insurance
2. Maximum for non‐life insurance
3. Minimum for life insurance
4. Maximum for life insurance
Average N/A 25 N/A 10
Highest N/A 30 N/A 20
2.05 : Maximum deposits in a single bank / total assets
0 3 0 2
Lowest N/A 5 N/A 15
Average N/A 15 N/A 20
Highest N/A 25 N/A 25
2.06 : (Cash + loans + investments) / total assets 1 0 1 0
Lowest 70 N/A 90 N/A
Average 70 N/A 90 N/A
Highest 70 N/A 90 N/A
2.07 : Receivables / (gross written premium + reinsurance recoveries)
0 0 0 0
Lowest N/A N/A N/A N/A
Average N/A N/A N/A N/A
Highest N/A N/A N/A N/A
2.08 : Receivables / capital 0 2 0 1
Lowest N/A 10 N/A 100
Average N/A 55 N/A 100
Highest N/A 100 N/A 100
2.09 : (Non‐performing investment assets and loans + receivables over 90 days) / total assets
0 0 0 0
Lowest N/A N/A N/A N/A
Average N/A N/A N/A N/A
Highest N/A N/A N/A N/A
2.10 : Receivables over 90 days / total receivables 0 2 0 1
Lowest N/A 0 N/A 0
Average N/A 25 N/A 0
Highest N/A 50 N/A 0
2.11 : Equities / total assets 0 4 0 3
Lowest N/A 20 N/A 5
Average N/A 24 N/A 18
Highest N/A 30 N/A 30
2.12 : Non‐performing loans / total gross loans 0 1 0 1
Lowest N/A 15 N/A 15
Average N/A 15 N/A 15
Highest N/A 15 N/A 15
2.13 : Maximum investment in a single counterparty / total assets
0 4 0 3
Lowest N/A 5 N/A 5
Average N/A 8 N/A 8
Highest N/A 15 N/A 15
2.14 : Maximum receivable from a single counterparty / total assets
0 1 0 1
Lowest N/A 5 N/A 5
Average N/A 5 N/A 5
Highest N/A 5 N/A 5
2.15 : Gross asset position in financial derivatives / capital
0 0 0 0
Lowest N/A N/A N/A N/A
Average N/A N/A N/A N/A
Highest N/A N/A N/A N/A
2.16 : Gross liability position in financial derivatives / capital
0 0 0 0
Lowest N/A N/A N/A N/A
Average N/A N/A N/A N/A
Highest N/A N/A N/A N/A
2.17 : Investments: distribution by type 1 2 1 2
Lowest 30 5 30 5

Page 107
F. If YOUR AUTHORITY has established benchmarks for the following FHSIs, what benchmarks are used for conventional insurance activities?
First row : number of quantitative responses 1. Minimum for non‐life insurance
2. Maximum for non‐life insurance
3. Minimum for life insurance
4. Maximum for life insurance
Average 30 28 30 28
Highest 30 50 30 50
2.18 : Investments: geographical distribution 2 2 1 2
Lowest 30 10 30 10
Average 33 30 30 30
Highest 35 50 30 50
2.19 : Investments: sectoral distribution 0 0 0 0
Lowest N/A N/A N/A N/A
Average N/A N/A N/A N/A
Highest N/A N/A N/A N/A
3.01 : Risk retention ratio 6 5 2 2
Lowest 20 70 40 80
Average 40 80 58 90
Highest 70 99.5 75 99
3.02 : (Reinsurance recoveries + reinsurance commissions) / reinsurance ceded
1 2 2 2
Lowest 90 30 5 25
Average 90 70 48 68
Highest 90 110 90 110
3.03 : Maximum exposure to single risk / capital 0 2 0 1
Lowest N/A 5 N/A 10
Average N/A 8 N/A 10
Highest N/A 10 N/A 10
3.04 : Maximum exposure to single event / capital 0 2 0 1
Lowest N/A 10 N/A 10
Average N/A 10 N/A 10
Highest N/A 10 N/A 10
3.05 : Maximum premium ceded to a single reinsurer / gross written premium
1 3 2 3
Lowest 30 25 5 25
Average 30 48 18 33
Highest 30 70 30 50
4.01 : Net claims provisions / average of net claims paid in last three years
1 1 1 1
Lowest 75 125 75 125
Average 75 125 75 125
Highest 75 125 75 125
4.02 : Net technical provisions / average of net written premium in last three years
0 0 0 0
Lowest N/A N/A N/A N/A
Average N/A N/A N/A N/A
Highest N/A N/A N/A N/A
4.03 : Net claims provisions / capital 0 2 0 0
Lowest N/A 250 N/A N/A
Average N/A 250 N/A N/A
Highest N/A 250 N/A N/A
4.04 : Claims development 1 1 0 0
Lowest 20 20 N/A N/A
Average 20 20 N/A N/A
Highest 20 20 N/A N/A
4.05 : Underwritten business: distribution by class of business
0 1 0 1
Lowest N/A 5 N/A 5
Average N/A 5 N/A 5
Highest N/A 5 N/A 5
4.06 : Underwritten business: geographical distribution
0 0 0 0
Lowest N/A N/A N/A N/A
Average N/A N/A N/A N/A

Page 108
F. If YOUR AUTHORITY has established benchmarks for the following FHSIs, what benchmarks are used for conventional insurance activities?
First row : number of quantitative responses 1. Minimum for non‐life insurance
2. Maximum for non‐life insurance
3. Minimum for life insurance
4. Maximum for life insurance
Highest N/A N/A N/A N/A
4.07 : Underwritten business: sectoral distribution 0 0 0 0
Lowest N/A N/A N/A N/A
Average N/A N/A N/A N/A
Highest N/A N/A N/A N/A
4.08 : Actuarial assumption: short‐term interest rate
0 0 0 0
Lowest N/A N/A N/A N/A
Average N/A N/A N/A N/A
Highest N/A N/A N/A N/A
4.09 : Actuarial assumption: long‐term interest rate
0 0 0 0
Lowest N/A N/A N/A N/A
Average N/A N/A N/A N/A
Highest N/A N/A N/A N/A
5.01 : Gross written premium per employee 0 0 0 0
Lowest N/A N/A N/A N/A
Average N/A N/A N/A N/A
Highest N/A N/A N/A N/A
5.02 : Assets per employee 0 0 0 0
Lowest N/A N/A N/A N/A
Average N/A N/A N/A N/A
Highest N/A N/A N/A N/A
5.03 : Operating expenses / gross written premium 2 5 2 4
Lowest 25 30 25 30
Average 28 40 28 41
Highest 30 50 30 50
5.04 : Personnel expenses / gross written premium 0 2 0 2
Lowest N/A 25 N/A 25
Average N/A 38 N/A 38
Highest N/A 50 N/A 50
5.05 : Growth in gross written premium 5 4 4 4
Lowest 1.5 25 5 15
Average 17 29 20 26
Highest 33 33 33 33
5.06 : Growth in net written premium 3 4 2 3
Lowest 33 25 0 30
Average 33 31 17 38
Highest 33 33 33 50
5.07 : Growth in total assets 1 0 2 1
Lowest 2 N/A 3 20
Average 2 N/A 3 20
Highest 2 N/A 3 20
5.08 : Gross written premium / sum insured 0 0 0 0
Lowest N/A N/A N/A N/A
Average N/A N/A N/A N/A
Highest N/A N/A N/A N/A
5.09 : Gross written premium / number of policies 0 0 0 0
Lowest N/A N/A N/A N/A
Average N/A N/A N/A N/A
Highest N/A N/A N/A N/A
5.10 : Complaint index 0 0 0 0
Lowest N/A N/A N/A N/A
Average N/A N/A N/A N/A
Highest N/A N/A N/A N/A
5.11 : Pay‐out ratio 0 0 0 0
Lowest N/A N/A N/A N/A
Average N/A N/A N/A N/A
Highest N/A N/A N/A N/A

Page 109
F. If YOUR AUTHORITY has established benchmarks for the following FHSIs, what benchmarks are used for conventional insurance activities?
First row : number of quantitative responses 1. Minimum for non‐life insurance
2. Maximum for non‐life insurance
3. Minimum for life insurance
4. Maximum for life insurance
5.12 : Board composition 4 0 4 0
Lowest 2 N/A 2 N/A
Average 23 N/A 16 N/A
Highest 50 N/A 50 N/A
6.01 : Claims ratio 4 5 3 4
Lowest 30 60 20 50
Average 45 80 33 66
Highest 50 105 50 80
6.02 : Gross claims ratio 2 3 1 2
Lowest 50 75 20 50
Average 50 92 20 63
Highest 50 120 20 75
6.03 : Expense ratio 4 6 3 5
Lowest 10 30 15 30
Average 18 43 20 50
Highest 25 70 25 90
6.04 : Combined ratio [FSI Non‐Life] 5 9 4 6
Lowest 0 65 0 50
Average 59 96 54 92
Highest 85 109 85 109
6.05 : Investment income ratio 3 3 2 1
Lowest 2.5 10 3 10
Average 5 38 5 10
Highest 7 95 6 10
6.06 : Operating ratio 2 1 1 1
Lowest 20 100 80 100
Average 50 100 80 100
Highest 80 100 80 100
6.07 : Profitability ratio 3 0 2 0
Lowest 5 N/A 3 N/A
Average 9 N/A 4 N/A
Highest 15 N/A 5 N/A
6.08 : Return on revenue 0 0 0 0
Lowest N/A N/A N/A N/A
Average N/A N/A N/A N/A
Highest N/A N/A N/A N/A
6.09 : Revisions to technical provisions / technical provisions
0 0 0 0
Lowest N/A N/A N/A N/A
Average N/A N/A N/A N/A
Highest N/A N/A N/A N/A
6.10 : Nominal net investment yield 1 1 1 1
Lowest 2.5 7.5 3.5 12.5
Average 2.5 7.5 3.5 12.5
Highest 2.5 7.5 3.5 12.5
6.11 : Real net investment yield 0 0 0 0
Lowest N/A N/A N/A N/A
Average N/A N/A N/A N/A
Highest N/A N/A N/A N/A
6.12 : Return on equity (ROE) [FSI] 5 4 4 3
Lowest 0 15 0 15
Average 10 26 7 18
Highest 20 50 16 20
6.13 : Earnings per employee 0 0 0 0
Lowest N/A N/A N/A N/A
Average N/A N/A N/A N/A
Highest N/A N/A N/A N/A
6.14 : Return on assets (ROA) [FSI Life] 3 1 4 2
Lowest 1 10 0.5 3

Page 110
F. If YOUR AUTHORITY has established benchmarks for the following FHSIs, what benchmarks are used for conventional insurance activities?
First row : number of quantitative responses 1. Minimum for non‐life insurance
2. Maximum for non‐life insurance
3. Minimum for life insurance
4. Maximum for life insurance
Average 3 10 2 7.8
Highest 4 10 4 12.5
6.15 : Policies lapsed or surrendered / policies in force at beginning of the year
0 0 0 1
Lowest N/A N/A N/A 20
Average N/A N/A N/A 20
Highest N/A N/A N/A 20
6.16 : Market value / book value 0 0 0 0
Lowest N/A N/A N/A N/A
Average N/A N/A N/A N/A
Highest N/A N/A N/A N/A
6.17 : Price / earnings ratio 0 0 0 0
Lowest N/A N/A N/A N/A
Average N/A N/A N/A N/A
Highest N/A N/A N/A N/A
6.18 : Price / gross written premium 0 0 0 0
Lowest N/A N/A N/A N/A
Average N/A N/A N/A N/A
Highest N/A N/A N/A N/A
7.01 : Liquid assets / current liabilities 5 0 3 0
Lowest 100 N/A 100 N/A
Average 120 N/A 117 N/A
Highest 150 N/A 150 N/A
7.02 : Liquid assets / total liabilities 1 0 1 0
Lowest 100 N/A 100 N/A
Average 100 N/A 100 N/A
Highest 100 N/A 100 N/A
7.03 : Liquid assets / total assets 2 1 1 1
Lowest 10 95 30 60
Average 20 95 30 60
Highest 30 95 30 60
7.04 : Liquid liabilities / total liabilities 0 0 0 0
Lowest N/A N/A N/A N/A
Average N/A N/A N/A N/A
Highest N/A N/A N/A N/A
7.05 : Net open foreign exchange position / capital 0 0 0 0
Lowest N/A N/A N/A N/A
Average N/A N/A N/A N/A
Highest N/A N/A N/A N/A
7.06 : Duration of assets / duration of liabilities 0 0 0 0
Lowest N/A N/A N/A N/A
Average N/A N/A N/A N/A
Highest N/A N/A N/A N/A
8.01 : Group debtors / total assets 0 0 0 0
Lowest N/A N/A N/A N/A
Average N/A N/A N/A N/A
Highest N/A N/A N/A N/A
8.02 : Related party receivables / total assets 0 1 0 0
Lowest N/A 5 N/A N/A
Average N/A 5 N/A N/A
Highest N/A 5 N/A N/A
8.03 : Due to related parties / total assets 0 1 0 1
Lowest N/A 10 N/A 10
Average N/A 10 N/A 10
Highest N/A 10 N/A 10
8.04 : (Investments in related parties + related party receivables) / total assets
1 3 1 2
Lowest 0 0 0 0
Average 0 12 0 5

Page 111
F. If YOUR AUTHORITY has established benchmarks for the following FHSIs, what benchmarks are used for conventional insurance activities?
First row : number of quantitative responses 1. Minimum for non‐life insurance
2. Maximum for non‐life insurance
3. Minimum for life insurance
4. Maximum for life insurance
Highest 0 25 0 10
8.05 : (Investments by related parties + due to related parties) / total assets
0 0 0 0
Lowest N/A N/A N/A N/A
Average N/A N/A N/A N/A
Highest N/A N/A N/A N/A
8.06 : (Revenues from related parties + expenditures to related parties) / (total revenues + total expenditures)
0 0 0 0
Lowest N/A N/A N/A N/A
Average N/A N/A N/A N/A
Highest N/A N/A N/A N/A
8.07 : Group (gross written premium + paid claims) / total (gross written premium + paid claims)
0 0 0 0
Lowest N/A N/A N/A N/A
Average N/A N/A N/A N/A
Highest N/A N/A N/A N/A
8.08 : Related party (gross written premium + paid claims) / total (gross written premium + paid claims)
0 0 0 0
Lowest N/A N/A N/A N/A
Average N/A N/A N/A N/A
Highest N/A N/A N/A N/A
9.01 : Assets / total financial system assets [FSI] 0 0 0 0
Lowest N/A N/A N/A N/A
Average N/A N/A N/A N/A
Highest N/A N/A N/A N/A
9.02 : Assets / gross domestic product [FSI] 0 1 0 1
Lowest N/A 120 N/A 120
Average N/A 120 N/A 120
Highest N/A 120 N/A 120
9.03 : Penetration 0 0 0 0
Lowest N/A N/A N/A N/A
Average N/A N/A N/A N/A
Highest N/A N/A N/A N/A
9.04 : Density 0 0 0 0
Lowest N/A N/A N/A N/A
Average N/A N/A N/A N/A
Highest N/A N/A N/A N/A
9.05 : Density ‐ in USD 0 0 0 0
Lowest N/A N/A N/A N/A
Average N/A N/A N/A N/A
Highest N/A N/A N/A N/A
9.06 : Concentration ratio 0 0 0 0
Lowest N/A N/A N/A N/A
Average N/A N/A N/A N/A
Highest N/A N/A N/A N/A
9.07 : Herfindahl‐Hirschman Index 0 0 0 0
Lowest N/A N/A N/A N/A
Average N/A N/A N/A N/A
Highest N/A N/A N/A N/A
9.08 : Assets lost during the previous 5 years / average assets
0 0 0 0
Lowest N/A N/A N/A N/A
Average N/A N/A N/A N/A
Highest N/A N/A N/A N/A

Page 112
Notes on benchmarks:
1.06: Cover of solvency margin: One supervisor reports benchmarks that differ by size. One supervisor
reports three levels of benchmarks (middle level included in table).
1.07: Risk‐based capital adequacy ratios: One supervisor reports three levels of benchmarks (middle level
included in table).
2.08: Receivables / capital: One supervisor sets a maximum benchmark of 10% for insurance‐related
receivables (included in table).
2.10: Receivables over 90 days / total receivables: One supervisor sets a maximum benchmark of 0%
after 30 days (included in table).
2.11: Equities / total assets: One supervisor sets maximum benchmarks for listed securities of 30% for
non‐life insurers (included in table) and for unlisted securities of 5% for life insurers (included in table).
2.13: Maximum investment in a single counterparty / total assets: One supervisor sets maximum
benchmarks for named counterparties of 20%, for listed counterparties of 10%, and for others of 5%
(latter is included in table).
2.17: Investments: distribution by type: Some supervisors set benchmarks that vary by type of
investment. Some supervisors benchmark against market average distributions (for example, in the
European Union).
2.18: Investments: geographical distribution: The supervisors that provided benchmarks did not specify
whether they related to local investments or foreign investments.
3.01: Risk retention ratio: One supervisor sets a maximum benchmark of 25% if only one reinsurer is
being used.
3.05: Maximum premium ceded to a single reinsurer / gross written premium: One supervisor sets a
lower maximum benchmark of 10% for reinsurers rated less than BBB, versus 25% for higher‐rated
reinsurers (included in table).
4.08: Actuarial assumption: short‐term interest rate: Some supervisors set maximum benchmarks that
vary with market conditions: one uses 60% of the 5‐year government bond rate; another uses the zero‐
coupon spot yield for matching durations.
4.09: Actuarial assumption: long‐term interest rate: Some supervisors set maximum benchmarks that
vary with market conditions: one uses 60% of the 5‐year government bond rate; another uses the zero‐
coupon spot yield for a 15‐year duration.
5.12: Board composition: Percentages shown in table are for independent directors. Several supervisors
set benchmarks for minimum number of directors (2, 5, or 7). One supervisor sets benchmarks for
maximum percentage of common directors and maximum number of executive directors.
6.05: Investment income ratio: One supervisor sets a maximum benchmark equal to the government 6‐
month treasury bill rate.
6.12: Return on equity (ROE) [FSI]: One supervisor sets a maximum benchmark equal to the industry
average for the previous year.
9.02: Assets / gross domestic product [FSI]: Benchmark (included in table) is for the total of non‐life and
life insurance.

Page 113
Annex 4 Mapping of FHSIs
IMF 2003 CARAMELS Categories Risk‐Based Supervision Categories
Core
Non‐Life
Life
Capital
Assets
Reinsurance
Actuarial
Managem
ent
Earnings
Liquidity
Subsidiaries
Insurance
Credit
Market
Operational
Legal &
Reg
Conduct
Rep
utation
Concentration
Environmen
tal
Strategic
1.01 : Gross written premium / capital
X
1.02 : Net written premium / capital
X X X
1.03 : Capital / total assets
X X X X
1.04 : Capital / invested assets [FSI]
X X X X
1.05 : Capital / technical provisions
X X X
1.06 : Cover of solvency margin
X X X X X
1.07 : Risk‐based capital adequacy ratios
X X X X X
1.08 : Growth in capital
X X X
1.09 : Net growth in capital
X X X
1.10 : Statutory deposit / required deposit
X X
1.11 : Capital in excess of minimum required / average annual loss
X X X
2.01 : (Real estate + unquoted equities + receivables) / total assets
X X X X X X X X
2.02 : Real estate / total assets
X X X X X
2.03 : Real estate / capital
X X X X
2.04 : (Real estate + mortgages) / total assets
X X X X X
2.05 : Maximum deposits in a single bank / total assets
X X X X
2.06 : (Cash + loans + investments) / total assets
X X
2.07 : Receivables / (gross written premium + reinsurance recoveries)
X X X X X X
2.08 : Receivables / capital
X X X X X
2.09 : (Non‐performing investment assets and loans + receivables over 90 days) / total assets
X X

Page 114
IMF 2003 CARAMELS Categories Risk‐Based Supervision Categories Core
Non‐Life
Life
Capital
Assets
Reinsurance
Actuarial
Managem
ent
Earnings
Liquidity
Subsidiaries
Insurance
Credit
Market
Operational
Legal &
Reg
Conduct
Rep
utation
Concentration
Environmen
tal
Strategic
2.10 : Receivables over 90 days / total receivables
X X X X
2.11 : Equities / total assets
X X X X X X X
2.12 : Non‐performing loans / total gross loans
X X X X X
2.13 : Maximum investment in a single counterparty / total assets
X X X
2.14 : Maximum receivable from a single counterparty / total assets
X X X
2.15 : Gross asset position in financial derivatives / capital
X X X X X
2.16 : Gross liability position in financial derivatives / capital
X X X X X
2.17 : Investments: distribution by type
X X X X X X
2.18 : Investments: geographical distribution
X X X X X X X X
2.19 : Investments: sectoral distribution
X X X X X X X X
3.01 : Risk retention ratio
X X X X X X X X
3.02 : (Reinsurance recoveries + reinsurance commissions) / reinsurance ceded
X X X X
3.03 : Maximum exposure to single risk / capital
X X X
3.04 : Maximum exposure to single event / capital
X X X
3.05 : Maximum premium ceded to a single reinsurer / gross written premium
X X X X X
4.01 : Net claims provisions / average of net claims paid in last three years
X X X X
4.02 : Net technical provisions / average of net written premium in last three years
X X X X
4.03 : Net claims provisions / capital
X X X

Page 115
IMF 2003 CARAMELS Categories Risk‐Based Supervision Categories Core
Non‐Life
Life
Capital
Assets
Reinsurance
Actuarial
Managem
ent
Earnings
Liquidity
Subsidiaries
Insurance
Credit
Market
Operational
Legal &
Reg
Conduct
Rep
utation
Concentration
Environmen
tal
Strategic
4.04 : Claims development
X X
4.05 : Underwritten business: distribution by class of business
X X X X X X X X
4.06 : Underwritten business: geographical distribution
X X X X X X X X
4.07 : Underwritten business: sectoral distribution
X X X X X X X
4.08 : Actuarial assumption: short‐term interest rate
X
4.09 : Actuarial assumption: long‐term interest rate
X
5.01 : Gross written premium per employee
X X X X X X X X
5.02 : Assets per employee
X X X X X X X
5.03 : Operating expenses / gross written premium
X X X X X
5.04 : Personnel expenses / gross written premium
X X X X X
5.05 : Growth in gross written premium
X X X X X
5.06 : Growth in net written premium
X X X X X
5.07 : Growth in total assets
X X X X X X X
5.08 : Gross written premium / sum insured
X X X X X
5.09 : Gross written premium / number of policies
X X X X X
5.10 : Complaint index
X X X X
5.11 : Pay‐out ratio
X X X X X X
5.12 : Board composition
X X
6.01 : Claims ratio
X X X X X X
6.02 : Gross claims ratio
X X X X
6.03 : Expense ratio
X X X X X X X
6.04 : Combined ratio [FSI Non‐Life]
X X X X X X
6.05 : Investment income ratio
X X X
6.06 : Operating ratio
X
6.07 : Profitability ratio
X
6.08 : Return on revenue
X X
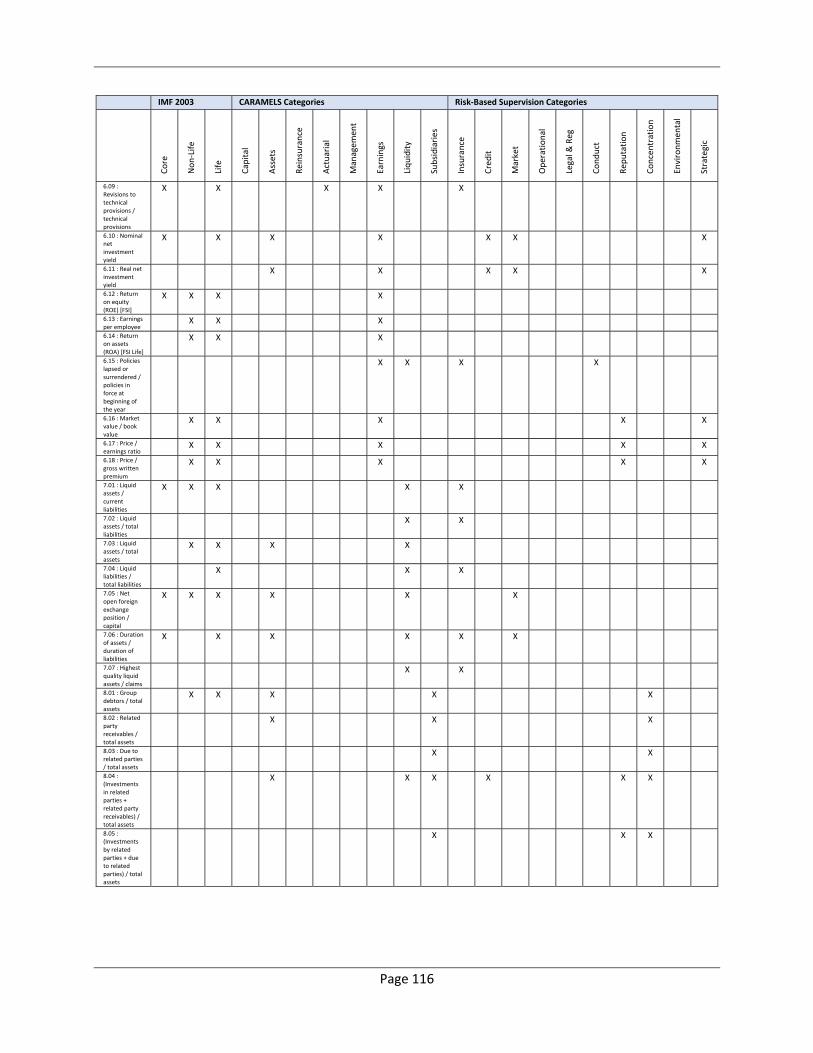
Page 116
IMF 2003 CARAMELS Categories Risk‐Based Supervision Categories Core
Non‐Life
Life
Capital
Assets
Reinsurance
Actuarial
Managem
ent
Earnings
Liquidity
Subsidiaries
Insurance
Credit
Market
Operational
Legal &
Reg
Conduct
Rep
utation
Concentration
Environmen
tal
Strategic
6.09 : Revisions to technical provisions / technical provisions
X X X X X
6.10 : Nominal net investment yield
X X X X X X X
6.11 : Real net investment yield
X X X X X
6.12 : Return on equity (ROE) [FSI]
X X X X
6.13 : Earnings per employee
X X X
6.14 : Return on assets (ROA) [FSI Life]
X X X
6.15 : Policies lapsed or surrendered / policies in force at beginning of the year
X X X X
6.16 : Market value / book value
X X X X X
6.17 : Price / earnings ratio
X X X X X
6.18 : Price / gross written premium
X X X X X
7.01 : Liquid assets / current liabilities
X X X X X
7.02 : Liquid assets / total liabilities
X X
7.03 : Liquid assets / total assets
X X X X
7.04 : Liquid liabilities / total liabilities
X X X
7.05 : Net open foreign exchange position / capital
X X X X X X
7.06 : Duration of assets / duration of liabilities
X X X X X X
7.07 : Highest quality liquid assets / claims
X X
8.01 : Group debtors / total assets
X X X X X
8.02 : Related party receivables / total assets
X X X
8.03 : Due to related parties / total assets
X X
8.04 : (Investments in related parties + related party receivables) / total assets
X X X X X X
8.05 : (Investments by related parties + due to related parties) / total assets
X X X

Page 117
IMF 2003 CARAMELS Categories Risk‐Based Supervision Categories Core
Non‐Life
Life
Capital
Assets
Reinsurance
Actuarial
Managem
ent
Earnings
Liquidity
Subsidiaries
Insurance
Credit
Market
Operational
Legal &
Reg
Conduct
Rep
utation
Concentration
Environmen
tal
Strategic
8.06 : (Revenues from related parties + expenditures to related parties) / (total revenues + total expenditures)
X X X X X
8.07 : Group (gross written premium + paid claims) / total (gross written premium + paid claims)
X X X X X X X
8.08 : Related party (gross written premium + paid claims) / total (gross written premium + paid claims)
X X X X X
9.01 : Assets / total financial system assets [FSI]
X X X X X X X X
9.02 : Assets / gross domestic product [FSI]
X X X X X X X X
9.03 : Penetration
X X X X X X
9.04 : Density X X X X X X 9.05 : Density ‐ in USD
X X X X X X
9.06 : Concentration ratio
X X X X X X X
9.07 : Herfindahl‐Hirschman Index
X X X X X X X
9.08 : Assets lost during the previous 5 years / average assets
X X X X X
9.09 : Inclusion
X X X X

Page 118
Annex 5 Guidance on FHSIs
This guidance on the calculation and interpretation of financial health and stability indicators
(FHSIs) for insurance has been prepared as part of a project jointly sponsored by the
International Monetary Fund (IMF) and the World Bank Group (WBG). However, it is not an
official document of either organization.
The FHSIs have been organized in accordance with the CARAMELS categories to which they are
primarily related. Annex 4 provides a mapping of the FHSIs to other risk assessment categories
where they can be useful in informing the assessment.
Unless otherwise indicated, the results of FHSIs that are calculated as ratios are typically
expressed as percentages. When FHSIs involving items from the income statement are
calculated for periods of less than one year the results are typically annualized.
FHSIs denoted as [FSI] have been adopted by the IMF as Financial Soundness Indicators for the
insurance sector.
The calculation of FHSIs might differ among jurisdictions because of differences in financial
reporting standards. This might affect the terminology used, how various items are measured,
the level of the FHSI, and supervisory benchmarks. Supervisors should consider such differences
when making comparisons with other jurisdictions.
Detailed Table of Contents
1. CAPITAL ........................................................................................................................................................... 121 1.01 Gross written premium / capital .......................................................................................................... 121 1.02 Net written premium / capital ............................................................................................................. 121 1.03 Capital / total assets ............................................................................................................................ 122 1.04 Capital / invested assets [FSI] .............................................................................................................. 122 1.05 Capital / technical provisions ............................................................................................................... 123 1.06 Cover of solvency margin ..................................................................................................................... 123 1.07 Risk‐based capital adequacy ratios ...................................................................................................... 124 1.08 Growth in capital ................................................................................................................................. 125 1.09 Net growth in capital ........................................................................................................................... 126 1.10 Statutory deposit / required deposit .................................................................................................... 127 1.11 Capital in excess of minimum required / average annual loss ............................................................. 127
2. ASSETS ............................................................................................................................................................ 128 2.01 (Real estate + unquoted equities + receivables) / total assets ............................................................. 128 2.02 Real estate / total assets ..................................................................................................................... 129 2.03 Real estate / capital ............................................................................................................................. 129 2.04 (Real estate + mortgages) / total assets .............................................................................................. 129 2.05 Maximum deposits in a single bank / total assets ............................................................................... 130

Page 119
2.06 (Cash + loans + investments) / total assets .......................................................................................... 130 2.07 Receivables / (gross written premium + reinsurance recoveries) ........................................................ 131 2.08 Receivables / capital ............................................................................................................................ 131 2.09 (Non‐performing investment assets and loans + receivables over 90 days) / total assets .................. 132 2.10 Receivables over 90 days / total receivables ....................................................................................... 133 2.11 Equities / total assets ........................................................................................................................... 133 2.12 Non‐performing loans / total gross loans ............................................................................................ 134 2.13 Maximum investment in a single counterparty / total assets ............................................................. 134 2.14 Maximum receivable from a single counterparty / total assets .......................................................... 135 2.15 Gross asset position in financial derivatives / capital .......................................................................... 135 2.16 Gross liability position in financial derivatives / capital ....................................................................... 136 2.17 Investments: distribution by type ........................................................................................................ 136 2.18 Investments: geographical distribution ............................................................................................... 137 2.19 Investments: sectoral distribution ....................................................................................................... 138
3. REINSURANCE ................................................................................................................................................... 138 3.01 Risk retention ratio .............................................................................................................................. 138 3.02 (Reinsurance recoveries + reinsurance commissions) / reinsurance ceded ......................................... 139 3.03 Maximum exposure to single risk / capital .......................................................................................... 140 3.04 Maximum exposure to single event / capital ....................................................................................... 140 3.05 Maximum premium ceded to a single reinsurer / gross written premium .......................................... 141
4. ACTUARIAL ....................................................................................................................................................... 141 4.01 Net claims provisions / average of net claims paid in last three years ................................................ 141 4.02 Net technical provisions / average of net written premium in last three years ................................... 143 4.03 Net claims provisions / capital ............................................................................................................. 144 4.04 Claims development ............................................................................................................................. 145 4.05 Underwritten business: distribution by class of business ..................................................................... 146 4.06 Underwritten business: geographical distribution ............................................................................... 147 4.07 Underwritten business: sectoral distribution ....................................................................................... 148 4.08 Actuarial assumption: short‐term interest rate ................................................................................... 148 4.09 Actuarial assumption: long‐term interest rate .................................................................................... 149
5. MANAGEMENT ................................................................................................................................................. 149 5.01 Gross written premium per employee ................................................................................................. 149 5.02 Assets per employee ............................................................................................................................ 150 5.03 Operating expenses / gross written premium...................................................................................... 151 5.04 Personnel expenses / gross written premium ...................................................................................... 151 5.05 Growth in gross written premium ........................................................................................................ 152 5.06 Growth in net written premium ........................................................................................................... 153 5.07 Growth in total assets .......................................................................................................................... 154 5.08 Gross written premium / sum insured ................................................................................................. 155 5.09 Gross written premium / number of policies ....................................................................................... 155 5.10 Complaint index ................................................................................................................................... 156 5.11 Pay‐out ratio ........................................................................................................................................ 156 5.12 Board composition ............................................................................................................................... 157
6. EARNINGS ........................................................................................................................................................ 157 6.01 Claims ratio .......................................................................................................................................... 157 6.02 Gross claims ratio ................................................................................................................................ 158 6.03 Expense ratio ....................................................................................................................................... 160 6.04 Combined ratio [FSI Non‐Life] .............................................................................................................. 161 6.05 Investment income ratio ...................................................................................................................... 161

Page 120
6.06 Operating ratio .................................................................................................................................... 162 6.07 Profitability ratio .................................................................................................................................. 163 6.08 Return on revenue................................................................................................................................ 163 6.09 Revisions to technical provisions / technical provisions ....................................................................... 163 6.10 Nominal net investment yield .............................................................................................................. 164 6.11 Real net investment yield ..................................................................................................................... 165 6.12 Return on equity (ROE) [FSI] ................................................................................................................ 166 6.13 Earnings per employee......................................................................................................................... 166 6.14 Return on assets (ROA) [FSI Life] .......................................................................................................... 167 6.15 Policies lapsed or surrendered / policies in force at beginning of the year .......................................... 167 6.16 Market value / book value ................................................................................................................... 168 6.17 Price / earnings ratio ........................................................................................................................... 168 6.18 Price / gross written premium ............................................................................................................. 169
7. LIQUIDITY AND ALM .......................................................................................................................................... 169 7.01 Liquid assets / current liabilities .......................................................................................................... 169 7.02 Liquid assets / total liabilities............................................................................................................... 170 7.03 Liquid assets / total assets ................................................................................................................... 171 7.04 Liquid liabilities / total liabilities .......................................................................................................... 172 7.05 Net open foreign exchange position / capital ...................................................................................... 172 7.06 Duration of assets / duration of liabilities............................................................................................ 173 7.07 Highest quality liquid assets / claims ................................................................................................... 175
8. SUBSIDIARIES AND RELATED PARTIES ..................................................................................................................... 175 8.01 Group debtors / total assets ................................................................................................................ 175 8.02 Related party receivables / total assets ............................................................................................... 176 8.03 Due to related parties / total assets .................................................................................................... 176 8.04 (Investments in related parties + related party receivables) / total assets .......................................... 177 8.05 (Investments by related parties + due to related parties) / total assets .............................................. 178 8.06 (Revenues from related parties + expenditures to related parties) / (total revenues + total
expenditures) .................................................................................................................................................... 178 8.07 Group (gross written premium + paid claims) / total (gross written premium + paid claims) ............. 179 8.08 Related party (gross written premium + paid claims) / total (gross written premium + paid claims) . 179
9. INDUSTRY‐WIDE ................................................................................................................................................ 180 9.01 Assets / total financial system assets [FSI] .......................................................................................... 180 9.02 Assets / gross domestic product [FSI] .................................................................................................. 180 9.03 Penetration .......................................................................................................................................... 180 9.04 Density ................................................................................................................................................. 181 9.05 Density ‐ in USD.................................................................................................................................... 181 9.06 Concentration ratio .............................................................................................................................. 182 9.07 Herfindahl‐Hirschman Index ................................................................................................................ 183 9.08 Assets lost during the previous 5 years / average assets ..................................................................... 184 9.09 Inclusion ............................................................................................................................................... 184

Page 121
1. Capital
1.01 Gross written premium / capital
This indicator is calculated as the ratio of gross written premium to capital. Capital can be
determined as total assets minus total liabilities.
Capital provides a cushion for absorbing losses. Gross written premium is a rough proxy for the
extent of an insurer’s exposure to losses from underwriting insurance. This indicator measures
the adequacy of the cushion without considering the effect of reinsurance. The ratio of net
written premium to capital can also be of interest.
The higher the ratio, the more risk the insurer bears in relation to capital. Thresholds of
supervisory concern typically vary between 500% and 900%. Thresholds for non‐life insurers are
often lower than those for life insurers.
The distribution of premium by class of business should be considered when analyzing this
ratio. Insurers with a larger portion of premium from riskier and longer‐tail classes of business
should generally maintain a lower ratio because their results can be more variable. Insurers
with stable profits and adequate reinsurance coverage are better able to sustain a higher ratio
than those with losses, unstable profits, inadequate reinsurance, or reinsurance with weak
reinsurers.
1.02 Net written premium / capital
This indicator is calculated as the ratio of net written premium to capital. Capital can be
determined as total assets minus total liabilities.
Capital provides a cushion for absorbing losses. Net written premium is a rough proxy for the
extent of an insurer’s retained exposure to losses from underwriting insurance. This indicator
measures the adequacy of the cushion after considering the effect of reinsurance. For life
insurers, the ratio of capital to technical provisions should also be considered, because written
premium is a less useful proxy of exposure to losses for insurers with longer term business. The
ratio of gross written premium to capital can also be of interest.
The higher the ratio, the more risk the insurer bears in relation to capital. Thresholds of
supervisory concern typically vary between 300% and 500% or more. Thresholds for non‐life
insurers are often lower than those for life insurers.
The distribution of premium by class of business should be considered when analyzing this
ratio. Insurers with a larger portion of premium from riskier and longer‐tail classes of business

Page 122
should generally maintain a lower ratio because their results can be more variable. Insurers
with stable profits and adequate reinsurance coverage are better able to sustain a higher ratio
than those with losses, unstable profits, inadequate reinsurance, or reinsurance with weak
reinsurers.
Ultimately, the solvency level of an insurer is critical in providing the protection that is sought
by the supervisor for the policyholders. One of the first “rules of thumb” elaborated was the so
called “Kenney rules”. These relate to premiums and capital. As a useful measure, they are yet
to be surpassed for their simplicity—relating the size of the business to the capital available to
support it. More scientific approaches have been developed, but these rules, as general
guidance to conservative and proper management, still have a sense of reality and insurers that
venture far from these basics do so at their peril.
Consider the example of an insurer that writes CU 500 (CU means currency units) of premiums
and has CU 100 of capital. The indicator is therefore 500%. If this insurer has a combined ratio
of 120%, it will experience a loss of CU 100 on the CU 500 of premiums written. This loss will
render the insurer insolvent. The example illustrates why insurers need to place prudent limits
on their business volumes.
1.03 Capital / total assets
This indicator is calculated as the ratio of capital to total assets. Capital can be determined as
total assets minus total liabilities. Assets are not risk weighted.
This indicator measures the extent to which capital can bear asset risks. For example, some real
estate investments might lose value because of market declines or some receivables might be
uncollectible, either of which would adversely affect capital. This indicator complements the
capital adequacy ratios calculated based on the methodology required by regulation. Also, it
measures financial leverage and is sometimes called the leverage ratio.
The higher the ratio, the more cushion against losses the insurer has in relation to its assets.
Since the life insurance business is generally longer‐term and more asset intensive, thresholds
for supervisory concern might be higher for life insurers than for non‐life insurers.
1.04 Capital / invested assets [FSI]
This indicator is calculated as the ratio of capital to invested assets. Capital can be determined
as total assets minus total liabilities. Invested assets are not risk weighted.

Page 123
This indicator measures the extent to which capital can bear asset risks related to investments.
For example, some real estate investments might lose value because of market declines or
some issuers of bonds in which the insurer has invested might default on their obligations,
either of which would adversely affect capital.
The higher the ratio, the more cushion against losses the insurer has in relation to its
investments. Since the life insurance business is generally longer‐term and more asset
intensive, thresholds for supervisory concern might be higher for life insurers than for non‐life
insurers. Thresholds might also be higher for insurers that invest in riskier assets than for those
that invest more conservatively.
1.05 Capital / technical provisions
This indicator is calculated as the ratio of capital to technical provisions. Capital can be
determined as total assets minus total liabilities. Technical provisions are the insurer’s liabilities,
of all types, under insurance contracts, net of reinsurance ceded.
This indicator measures the extent to which the capital of an insurer can bear liability risks. For
example, a non‐life insurer’s claims provisions might turn out to have been inadequate
estimates of the ultimate claims costs or a life insurer might experience unexpectedly high
claims because of an epidemic, either of which would adversely affect capital.
This indicator is particularly useful for life insurers. In the case of long‐term life insurance
business, premiums received in the year are not as reliable a proxy for the risk assumed as for
non‐life insurers. Technical provisions might provide a more reliable proxy for the risk, making
this indicator more useful than the ratio of net written premiums to capital.
The higher the ratio, the more cushion against losses the insurer has in relation to its technical
provisions. Thresholds for supervisory concern might be higher for insurers whose technical
provisions are more volatile or difficult to estimate.
1.06 Cover of solvency margin
This indicator is calculated as the ratio of available solvency to required solvency. Both available
solvency and required solvency should be determined in accordance with the solvency margin
requirement of the jurisdiction.
This indicator measures the extent to which an insurer is meeting the solvency margin
requirement. The higher the ratio, the more likely it is that an insurer will be able to meet its

Page 124
obligations, even if it faces adverse conditions. It can also be useful to examine the composition
of available solvency, for example, the percentage accounted for by high quality liquid assets.
Given that the “required” solvency is a legal obligation on the insurer, then a ratio that is less
than 100% indicates a breach. In many jurisdictions, a higher value is considered as appropriate
and so a figure below a control level, such as 200%, may be a trigger for supervisory
intervention.
Caution must be exercised in comparing solvency ratios across jurisdictions, because there can
be significant differences in the form and details of the requirements. One major form of
solvency requirement is an index‐based method, where the required margin is defined in terms
of the greater of several calculations, such as a fixed amount, a percentage of premiums, and a
percentage of claims provisions. A more complex approach can apply different premiums and
claims factors to different classes of business based on the perceived risk. The second major
form of solvency requirement is a risk‐based capital adequacy requirement (see the guidance
on risk‐based capital adequacy ratios).
Available solvency can be determined fundamentally as total assets minus total non‐capital
liabilities. However, the requirements of a jurisdiction will typically specify details regarding the
inclusion, exclusion, or adjustment of various items. Non‐capital liabilities include technical
provisions and liabilities such as accounts payable, but not liabilities arising from the issuance of
a capital instrument, such as preferred shares, by the insurer. Available solvency might be
reduced by excluding some assets considered less readily available to meet liabilities, such as
furniture and equipment and goodwill, or by increasing some liabilities that might be
considered less likely to be sufficient to absorb losses. The effects of such adjustments need to
be considered when interpreting the results.
1.07 Risk‐based capital adequacy ratios
This indicator is calculated as the ratio of available capital to required capital. Both available
capital and required capital should be determined in accordance with the risk‐based capital
adequacy requirement of the jurisdiction.
This indicator measures the extent to which an insurer is meeting the risk‐based capital
adequacy requirement. The higher the ratio, the more likely it is that an insurer will be able to
meet its obligations, even if it faces adverse conditions. Risk‐based capital adequacy
requirements generally provide a more accurate measure of an insurer’s exposure to risks than
do simpler solvency margin requirements (see the guidance on cover of solvency margin).
Available capital is sometimes classified into various “tiers” of quality, in which case indicators
would be calculated not only using total available capital but also using only the highest tier(s).

Page 125
It can also be useful to examine the composition of required capital by risk category or
subcategory, to obtain insight on the relative exposure of an insurer to various types of risks.
Given that the “required” capital is a legal obligation on the insurer, then a ratio that is less
than 100% indicates a breach. In many jurisdictions, a higher value is considered as appropriate
and so a figure below a control level, such as 200%, may be a trigger for supervisory
intervention.
Caution must be exercised in comparing risk‐based capital adequacy ratios across jurisdictions,
because there can be significant differences in the form and details of the requirements. For
example, available capital might be classified into various tiers and required capital might be
determined by applying factors or stress scenarios.
Available capital can be determined fundamentally as total assets minus total non‐capital
liabilities. However, the requirements of a jurisdiction will typically specify details regarding the
inclusion, exclusion, or adjustment of various items. Non‐capital liabilities include technical
provisions and liabilities such as accounts payable, but not liabilities arising from the issuance of
a capital instrument, such as preferred shares, by the insurer. Available capital might be
reduced by excluding some assets considered less readily available to meet liabilities, such as
furniture and equipment and goodwill. In jurisdictions where available capital is classified into
various tiers of quality, paid‐up ordinary share capital and retained earnings would be in the
highest tier, but capital arising from the issuance of preferred shares might be in a lower tier.
The effects of such adjustments need to be considered when interpreting the results.
The calculation of required capital can also take various forms. One major form is a factor‐
based method, where the required capital is calculated by applying risk weights to various
parameters, such as premiums, technical provisions, and assets, with the risk weights varying
according to the relative risks of adverse changes in the parameters. Risk‐based capital
adequacy requirements might also apply factors to various values but might combine these
“capital charges” following the statistical theory by squaring the values before adding them and
then taking the square root of the result. In some jurisdictions, insurers are required to apply
stress scenarios to calculate the requirements.
1.08 Growth in capital
This indicator is calculated as the ratio of the change in capital during the measurement period
to capital at the end of the previous measurement period. Capital can be determined as total
assets minus total liabilities.
Capital provides a cushion for absorbing losses. This indicator measures the improvement or
deterioration of the size of this cushion. It might also be calculated using available solvency or

Page 126
available capital (in total and by tiers), determined in accordance with the regulatory
requirements of the jurisdiction.
The higher the ratio, the more rapidly the cushion for absorbing losses is growing. However, not
only deterioration or slow growth, but also very rapid growth can be of supervisory concern.
Thresholds for supervisory concern can vary considerably, depending on market conditions in
the jurisdiction. Lower limits range from ‐10% to 20%, while an upper limit of 50% is not
unusual.
A lower limit is used because a decrease in capital, or even slow growth in capital, is a cause for
concern. If the indicator falls below this limit, the reasons for the change should be determined,
as well as whether these factors will be repeated in future years. Reasons might include
investment losses, underwriting losses, earnings strain from rapid growth of the business, and
high dividends to shareholders.
An upper limit is used because experience has shown that some insurers have reported
dramatic increases in capital prior to their failure. Large increases in capital may indicate
instability, the shifting of capital from other companies within a group, significant growth, or
mergers and acquisitions.
1.09 Net growth in capital
This indicator is calculated as the ratio of the change in capital during the measurement period,
net of capital contributed during such period, to capital at the end of the previous
measurement period. Capital can be determined as total assets minus total liabilities.
Capital provides a cushion for absorbing losses. This indicator measures the improvement or
deterioration of the size of this cushion based on operational results. Changes in surplus notes,
capital contributions, and adjustments to capital are removed to highlight the insurer’s
operations. It might also be calculated using available solvency or available capital (in total and
by tiers), determined in accordance with the regulatory requirements of the jurisdiction, after
making the same adjustments.
The higher the ratio, the more rapidly the cushion for absorbing losses is growing because of
operational results. However, not only deterioration or slow growth, but also very rapid growth
can be of supervisory concern. Thresholds for supervisory concern can vary considerably,
depending on market conditions in the jurisdiction. Lower limits range from ‐10% to 20%, while
an upper limit of 50% is not unusual.
A lower limit is used because a decrease in capital, or even slow growth in capital, is a cause for
concern. If the indicator falls below this limit, the reasons for the change should be determined,
as well as whether these factors will be repeated in future years. Reasons might include

Page 127
investment losses, underwriting losses, earnings strain from rapid growth of the business, and
high dividends to shareholders.
An upper limit is used because experience has shown that some insurers have reported
dramatic increases in capital prior to their failure. Large increases in capital may indicate
instability, significant growth, or mergers and acquisitions.
1.10 Statutory deposit / required deposit
This indicator is calculated as the ratio of the actual statutory deposit of an insurer at the
reporting date to the required deposit. The required deposit should be determined in
accordance with the statutory deposit requirement of the jurisdiction.
This indicator measures whether an insurer is meeting the statutory deposit requirement. In
some jurisdictions, insurers are required by law to deposit cash or high‐quality fixed‐income
securities, such as government bonds, with the supervisor or in a trust account. The
requirement might be a fixed amount, a percentage of premiums, a percentage of the
minimum required capital, or the highest of two or more of these amounts. The deposits
provide liquid assets that are readily accessible in the event an insurer fails.
A ratio of less than 100% indicates a breach of the requirement. Insurers seldom deposit any
more assets than are required.
1.11 Capital in excess of minimum required / average annual loss
This indicator is calculated as the ratio of the amount by which an insurer’s capital exceeds the
minimum required capital to the average annual pre‐tax loss of the insurer over the past two
years. The result is typically expressed in years. The capital and the minimum required capital
should be determined in accordance with the regulatory requirements of the jurisdiction, for
example, risk‐based capital adequacy requirements or solvency margin requirements. This
indicator is sometimes referred to as the burn rate. It is relevant only for insurers that are
suffering losses.
This indicator provides an estimate of how long an insurer that is suffering losses can continue
to operate before it will breach the minimum capital requirements.
For example, consider an insurer with capital of 1,500 compared to a minimum requirement of
1,000. The insurer suffered losses of 200 and 400 in the two most recent years. The indicator is
calculated as the ratio of 500 (which is 1,500 minus 1,000) to 300 (the average of 200 and 400).

Page 128
The result of 1.67 means that the insurer is likely to breach the minimum capital requirement in
less than two years.
Thresholds for supervisory intervention vary. For example, one supervisor takes action if the
indicator is less than 3 and another if it is less than 1.
2. Assets
2.01 (Real estate + unquoted equities + receivables) / total assets
This indicator is calculated as the ratio of the sum of real estate assets, unquoted equities, and
receivables to total assets. Quoted equities should also be included in jurisdictions where they
are illiquid or not regularly traded, as should other assets that may have similar characteristics,
such as private equity funds. The values of the assets used in the calculation should be those
determined for regulatory reporting purposes.
This indicator is a measure of asset quality, focused on asset classes that have the largest
probability of being impaired. Both real estate and unquoted equities are illiquid assets, with
real estate often being difficult to value in many jurisdictions. Receivables may expose the
insurer to a considerable credit risk and overstate assets if there are insufficient provisions for
uncollectible debts.
The lower the ratio the less exposure an insurer has to these potentially problematic assets.
Some supervisors would consider a ratio of 40% or more to be of concern.
Assets can be categorized as:
investments of the insurer;
amounts owing to the insurer from third parties, including premiums that have yet to be
received from policyholders and intermediaries;
other operating assets such as equipment; and
amounts owing from reinsurers.
Ultimately, the supervisor is interested in the quality of the asset portfolio, its appropriateness
reflecting the nature of the business mix on the liability side of the balance sheet, any potential
source of concentration of counterparty risk, and the liquidity of the assets compared to the
needs of the insurer to meet its obligations to policyholders as they fall due.
Page 129
2.02 Real estate / total assets
This indicator is calculated as the ratio of real estate assets to total assets. The values of the
assets used in the calculation should be those determined for regulatory reporting purposes.
This indicator is a measure of asset quality. Real estate can have a high probability of being
impaired. It is an illiquid asset, which is often difficult to value in many jurisdictions.
The lower the ratio the less exposure an insurer has to real estate assets. Thresholds for
supervisory concern typically range from 10% to 20%. However, in jurisdictions where
investment markets are not well developed, supervisors might be prepared to accept larger
shares of investment in real estate.
2.03 Real estate / capital
This indicator is calculated as the ratio of the real estate assets to capital. The values of the
assets used in the calculation should be those determined for regulatory reporting purposes.
Capital can be determined as total assets minus total liabilities.
This indicator measures the extent to which an insurer’s capital might be adversely affected by
problems with its real estate assets. Real estate can have a high probability of being impaired. It
is an illiquid asset, which is often difficult to value in many jurisdictions.
The lower the ratio the less an insurer’s capital is exposed to the potential deterioration
because of problems with its real estate assets. If the ratio is high, then a relatively small
deterioration in the value of real estate could have a large effect on capital.
Consider the example of an insurer that has CU 500 (CU means currency units) of assets,
including CU 200 of real estate, and CU 100 of capital. The indicator is therefore 200%. If real
estate values decline by 30% the insurer’s capital will decrease by more than one‐half, to CU 40.
2.04 (Real estate + mortgages) / total assets
This indicator is calculated as the ratio of the sum of real estate assets and mortgages to total
assets. The values of the assets used in the calculation should be those determined for
regulatory reporting purposes.
This indicator is a measure of asset quality, focused on asset classes exposed to risks in the real
estate market. Real estate can have a high probability of being impaired. It is an illiquid asset,
which is often difficult to value in many jurisdictions. In some jurisdictions, insurers are exposed

Page 130
to risks in the real estate market not only through investments in real estate but also through
mortgage lending. Mortgage lending subjects an insurer to counterparty credit risk. Also,
mortgage loans are secured by real estate, the valuation and liquidity of which can be of
concern in the event of default. Real estate and mortgage loans may be overstated. Excessive
investment in real estate and mortgage loans, investment in non‐income producing real estate,
and overdue or restructured mortgage loans are relatively common sources of financial
difficulty.
The lower the ratio the less exposure an insurer has to risks in the real estate market.
Thresholds for supervisory concern typically range from 10% to 30%. However, in jurisdictions
where investment markets are not well developed, or for life insurers that are using mortgages
to match long‐term liabilities such as annuities, supervisors might be prepared to accept higher
ratios.
2.05 Maximum deposits in a single bank / total assets
This indicator is calculated by first calculating the ratio, with respect to each bank in which an
insurer has deposits, of the outstanding total deposits by the insurer in the bank to the total
assets of the insurer. The indicator is the maximum of these ratios. The values of the assets
used in the calculation should be those determined for regulatory reporting purposes.
This indicator is a measure of asset concentration risk. In virtually all jurisdictions, banks are
regulated financial institutions, and are typically high‐quality counterparties. However, large
deposits in a single bank expose an insurer to the risk of significant loss if the bank was to fail.
Such concentrations can also create significant cross‐sectoral exposures, potentially creating
systemic risk. Furthermore, although bank deposits are typically liquid, they seldom generate
sufficient rates of return to contribute significantly to the profitability of the insurer.
The lower the indicator, the less exposure an insurer has to potential losses in the event of a
bank failure. Thresholds for supervisory concern typically range from 5% to 25%. However, in
jurisdictions where investment markets are not well developed, supervisors might be prepared
to accept higher ratios.
2.06 (Cash + loans + investments) / total assets
This indicator is calculated as the ratio of the sum of cash, loans, and investments to total
assets. The values of the assets used in the calculation should be those determined for
regulatory reporting purposes.

Page 131
This indicator is a measure of the extent to which assets are available for or being used as
investments.
A higher ratio is more desirable than a lower ratio, because it indicates the insurer has a high
proportion of tangible assets, which can be invested to earn income or sold to meet obligations.
Thresholds for supervisory concern might depend on the extent to which an insurer engages in
investment activities versus other activities. For example, some supervisors use higher
thresholds for life insurers than for non‐life insurers. Some supervisors would consider a ratio of
less than 60% to be of concern, but thresholds as high as 90% are being used.
2.07 Receivables / (gross written premium + reinsurance recoveries)
This indicator is calculated as the ratio of receivables to the sum of gross written premium and
reinsurance recoveries. All types of receivables should be included, including premiums
receivable and reinsurance recoverables. The values of the receivables used in the calculation
should be those determined for regulatory reporting purposes, which might be net of
provisions for unrecoverable amounts. “Reinsurance recoveries” means the amounts recovered
during the measurement period, not the amounts recoverable at the end of the period.
This indicator measures the level of credit control exercised by an insurer. Debtors are often
either policyholders or intermediaries in the case of premium income, and reinsurers in the
case of reinsurance recoverables. Receivables may expose the insurer to a considerable credit
risk and overstate assets if there are insufficient provisions for collection problems.
A low ratio is desirable. A high ratio suggests that the credit policy and collection practices of
the insurer are weak, which would be of particular concern if receivables are a relatively large
proportion of assets.
Both the credit worthiness of the counterparties and concentrations of credit risk should be
examined. The aging of receivables should also be analyzed. Long‐outstanding receivables
should account for a small portion of total receivables. If there is a likelihood of not being able
to collect receivables, adequate provision should be made.
2.08 Receivables / capital
This indicator is calculated as the ratio of receivables to capital. All types of receivables should
be included, including premiums receivable and reinsurance recoverables. The values of the
receivables used in the calculation should be those determined for regulatory reporting
purposes, which might be net of provisions for unrecoverable amounts. Capital can be
determined as total assets minus total liabilities.

Page 132
This indicator measures the extent to which an insurer’s capital might be adversely affected if
its receivables cannot be collected.
The lower the ratio the less an insurer’s capital is exposed to the potential deterioration
because of problems with its receivables. If receivables are high, the insurer’s capital might be
significantly eroded if the receivables cannot be collected. Thresholds for supervisory concern
from 10% to as high as 100% are being used, although maximum ratios toward the middle of
that range might be more typical.
Receivables from policyholders and intermediaries as a percentage of capital is a particularly
useful indicator of potential problems.
Reinsurance recoverables (amounts owing from reinsurers or amounts that are expected to be
claimed — the difference between gross and net (of reinsurance) technical provisions) can
represent a large part of the insurer’s balance sheet. Reinsurance recoverables may be high
because reinsurance ceded is high, the insurer has had some large claims, or its reinsurers are
slow in paying. If this exposure is high, the supervisor should seek some assurance as to the
underlying credit risk represented.
Both the credit worthiness of the counterparties and concentrations of credit risk should be
examined. The aging of receivables should also be analyzed. Long‐outstanding receivables
should account for a small portion of total receivables. If there is a likelihood of not being able
to collect receivables, adequate provision should be made.
2.09 (Non‐performing investment assets and loans + receivables over 90 days) / total assets
This indicator is calculated by taking the value of non‐performing investment assets and loans,
as well as receivables over 90 days, minus the value of specific provisions (to the extent they
have not already been deducted in calculating the reported asset values) as the numerator of
the ratio and total assets as the denominator. Non‐performing investment assets and loans are
those on which the counterparty is late on making payments or is in danger of missing
payments. Loans where the borrower is 90 days late on payments are considered non‐
performing, but any loan in default or near default may also be called non‐performing.
This indicator is a measure of credit quality. Non‐performing assets and long‐outstanding
receivables may expose an insurer to a considerable credit risk and overstate assets if there are
insufficient provisions for collection problems.
Low‐quality assets such as these should account for a small portion of total assets. Some
supervisors would consider a ratio of 3% or more to be of concern, while others would accept
up to 10%.

Page 133
Other indicators that relate to more general credit quality can also be borrowed from the
banking analysis. These would address assets that may be defined as “non‐performing” or the
general structure of ageing of debts.
2.10 Receivables over 90 days / total receivables
This indicator is calculated as the ratio of receivables over 90 days to total receivables.
This indicator measures the level of credit control exercised by an insurer. A high ratio suggests
that the credit policy and collection practices of the insurer are weak, which would be of
particular concern if receivables are a relatively large proportion of assets.
Debtors are often either policyholders or intermediaries in the case of premium income, and
reinsurers in the case of reinsurance recoverables. Receivables may expose the insurer to a
considerable credit risk and overstate assets if there are insufficient provisions for collection
problems.
A low ratio is desirable. Some supervisors would consider a ratio of more than 0% to be of
concern, while others would accept up to 50%, depending on the situation in the jurisdiction.
Both the credit worthiness of the counterparties and concentrations of credit risk should be
examined. If there is a likelihood of not being able to collect receivables, adequate provision
should be made.
2.11 Equities / total assets
This indicator is calculated as the ratio of equities to total assets. Other investments that are
like equities, such as mutual funds and hedge funds, should be included in the numerator.
However, equity investments that are on the balance sheet of the insurer but in fact are part of
risk pass‐through products, such as unit‐linked life insurance, should be excluded from both the
numerator and denominator. The values used in the calculation should be those determined for
regulatory reporting purposes.
This indicator measures the extent of an insurer's exposure to stock market risk and
fluctuations of the economy.
The lower the ratio the less exposure an insurer has to equity risks. Thresholds for supervisory
concern from 5% to as high as 30% are being used, although maximum ratios of 20% to 25%
might be more typical.

Page 134
If the proportion of equities in total assets is significant, further examination of the portfolio
composition is necessary, with special emphasis on the possible correlation of exposure on the
asset and liability sides of the balance sheet. In fact, the need to consider both sides of the
balance sheet simultaneously is more general. While the indicators of asset quality are the
same for both life and non‐life insurers, they need to be evaluated in the context of the nature
of an insurer’s business. For instance, it would be reasonable for a life insurer or a non‐life
insurer with long‐tail liabilities to have a relatively larger proportion of assets invested in riskier
(e.g., equities) or less‐liquid (e.g., real estate) assets than a non‐life insurer with short‐term
business, as the yield on these assets can be expected to better match the future obligations.
Also, some risk management tools and hedging strategies, including the use of derivatives,
might lower the aggregate (matched) risk, even though they may appear to add risk if analyzed
separately.
2.12 Non‐performing loans / total gross loans
This indicator is calculated as the ratio of the value of non‐performing loans to the total value of
the loan portfolio (including non‐performing loans, and before the deduction of specific loan
loss provisions). Both mortgages and other types of loans should be included, except for policy
loans that are fully secured by the cash values of the insurance policies.
This indicator helps to identify problems with asset quality in the loan portfolio.
Some insurers include banking activities on the asset side of their balance sheet by direct
lending to financial and nonfinancial companies. Loans other than mortgages form a substantial
part of investments by life insurers in some countries, and this type of asset has been one of
the key problems in insurance failures in these countries.
A low ratio is desirable. The thresholds for supervisory concern should be consistent with those
used by the banking supervisor in the jurisdiction, with respect to loan portfolios of similar
composition.
2.13 Maximum investment in a single counterparty / total assets
This indicator is calculated as the ratio of the maximum investment by an insurer in a single
counterparty to the total assets of the insurer. The numerator should include all investments in
and loans to the counterparty and persons related to the counterparty, such as companies
within a group. The values used in the calculation should be those determined for regulatory
reporting purposes.

Page 135
An insurer’s investments should be diversified. This indicator provides a measure of the extent
to which an insurer’s investments lack diversification with respect to counterparties.
Concentration in a single counterparty not only exposes an insurer to credit risk but also,
depending on the relationship with the counterparty, might affect the insurer’s ability to take
other decisions. For example, an insurer might invest in a company in order to sell insurance
coverage to it, which could affect the insurer’s decisions on underwriting and claims matters.
A low ratio is desirable. Thresholds for supervisory concern from 5% to 15% are being used.
2.14 Maximum receivable from a single counterparty / total assets
This indicator is calculated as the ratio of the maximum receivable from a single counterparty to
the total assets of the insurer. The numerator should include all amounts receivable from the
counterparty and persons related to the counterparty, such as companies within a group. The
values used in the calculation should be those determined for regulatory reporting purposes.
An insurer should not be unduly exposed to any one debtor. This ratio provides an indication of
the extent to which receivables lack diversification with respect to counterparties.
Concentration of receivables in a single counterparty not only exposes an insurer to credit risk
but also, depending on the relationship with the counterparty, might affect the insurer’s ability
to take other decisions. For example, an insurer might extend credit to a policyholder or
intermediary with respect to the payment of premiums in order to sell insurance, which could
affect the insurer’s decisions on underwriting and claims matters.
A low ratio is desirable. Some supervisors would consider a ratio of 5% or more to be of
concern.
2.15 Gross asset position in financial derivatives / capital
This indicator is calculated by using the market value of financial derivative assets as the
numerator and capital as the denominator. Capital can be determined as total assets minus
total liabilities.
This indicator measures the extent to which an insurer’s capital might be adversely affected if
its financial derivative asset positions decrease in value.
It should be used in conjunction with the indicator on the gross liability position in financial
derivatives. Together, they can provide some insight on the insurer’s risk management strategy.
For example, if both ratios are low, the insurer is making little use of financial derivatives. If
either ratio is high, the insurer is making significant use of financial derivatives. If both ratios

Page 136
are high, the market conditions that would cause adverse changes in the values of the asset and
liability positions in financial derivatives should be examined, to ensure that both would not be
adversely affected by the same market conditions.
2.16 Gross liability position in financial derivatives / capital
This indicator is calculated by using the market value of financial derivative liabilities as the
numerator and capital as the denominator. Capital can be determined as total assets minus
total liabilities.
This indicator measures the extent to which an insurer’s capital might be adversely affected if
its financial derivative liability positions increase in value.
It should be used in conjunction with the indicator on the gross asset position in financial
derivatives. Together, they can provide some insight on the insurer’s risk management strategy.
For example, if both ratios are low, the insurer is making little use of financial derivatives. If
either ratio is high, the insurer is making significant use of financial derivatives. If both ratios
are high, the market conditions that would cause adverse changes in the values of the asset and
liability positions in financial derivatives should be examined, to ensure that both would not be
adversely affected by the same market conditions.
2.17 Investments: distribution by type
The distribution of investments by type is not a single ratio. There are many ways that the asset
mix can be determined, depending on how assets are classified for regulatory reporting. It
would be normal, in the case of examining the assets that are part of the investment
operations, to express the investments of each type as a percentage of the total investments.
The distribution indicates the extent to which investments are diversified amongst different
types of investment. It is a measure of concentration risk of an insurer.
Insurers normally consider the market value of the investments when conducting their
investment operations regardless of whether this is the basis of the values used for regulatory
reporting in the jurisdiction. It is useful for the supervisor to have access to the market values,
so that asset mix ratios can be calculated both on this basis and with the values used for
regulatory reporting.
The distribution of investments should be assessed with reference to both regulatory
requirements for diversification and the insurer’s investment policy. Reasons for any significant
changes in the distribution of investments should be investigated. For example, changes in the

Page 137
investment mix might be triggered by changes in ownership and management or changes in the
business focus of the insurer.
Some supervisors would consider a change of 10% or more in the share of any type of
investment to be of potential concern. Other supervisors set a threshold based on the average
change in the distribution. For example, supervisors in the USA calculate an indicator as the
average of the absolute value of percentage changes in the shares of each of 16 types of asset,
with 5% as the threshold. Some supervisors set benchmarks that vary by type of investment.
Other supervisors benchmark against market average distributions (for example, in the
European Union).
2.18 Investments: geographical distribution
The geographical distribution of investments is not a single ratio. In examining this distribution,
the total investments in each geographical region would be expressed as a percentage of the
total investments.
The distribution indicates the extent to which investments are diversified amongst different
geographical regions. It facilitates the assessment of credit and market risk arising from
exposures to particular countries and helps to assess the impact of adverse events in these
countries on an insurer and the domestic financial system. It is a measure of concentration risk
of an insurer.
Investment in foreign assets might enable an insurer to diversify its investment risks and to take
advantage of types of investments not available in the local market. However, currency
movements can affect the values of foreign assets, so exposure to foreign exchange risks should
be examined. This is particularly important when liabilities are in the local currency.
The geographical distribution of investments should be assessed with reference to regulatory
requirements, the insurer’s investment policy, and the insurer’s exposure to foreign currency
liabilities. For example, a large or increasing level of foreign exchange exposure may need to be
investigated by finding out the policy toward and extent of hedging used by the insurer.
In jurisdictions that cover a large and diverse area, supervisors might also assess the
distribution of investments among relevant geographical areas within the jurisdiction. For
example, an insurer with a concentration of investments in one region of the country might be
exposed to the risk of significant losses in the event of an economic downturn or natural
catastrophe in that region.

Page 138
2.19 Investments: sectoral distribution
The sectoral distribution of investments is not a single ratio. In examining this distribution, the
total investments in each economic sector would be expressed as a percentage of the total
investments.
The investments of an insurer should be diversified among various sectors of the economy, to
mitigate the risk of exposure to significant losses in the event of problems that affect a
particular sector. The distribution indicates the extent to which investments are diversified
amongst different economic sectors. It is a measure of concentration risk of an insurer.
Banking supervisors typically review the sectoral distribution of loans; insurance supervisors
might use the same sectoral breakdown. This would facilitate the sharing of information among
supervisors for both group‐wide supervision and macroprudential risk assessment.
3. Reinsurance
3.01 Risk retention ratio
The risk retention ratio is calculated as the ratio of net written premium to gross written
premium, where gross written premium is the sum of written premium on policies issued by
the insurer and reinsurance assumed. Net written premium is gross written premium minus
written premium on reinsurance ceded. The risk retention ratio might also be calculated using
earned premium.
It provides an indication of the extent to which an insurer is willing to retain the insurance risk
on the business that it writes. Some supervisors have established benchmarks for the risk
retention ratio of an insurer as a whole. For example, a non‐life insurer with a ratio of less than
40% or more than 80%, or a life insurer with a ratio of less than 60% or more than 90% might
trigger further analysis. Many factors can affect the risk retention ratio, so such overall ratios
should be used with caution.
The risk retention ratio can vary significantly, for example, depending on the type of business
written by the insurer. Therefore, it should be calculated not only for an insurer as a whole, but
also by class of business. For example, the risk retention ratio for short‐tail business with high
claims frequency, such as comprehensive motor, may appropriately be high (>80%), whereas
the risk retention ratio for fire, engineering or liability business may appropriately be low (<
20%). If the risk retention ratio is high, the adequacy of the insurer’s capital to withstand
adverse claims experience should be assessed, considering its maximum exposure to a single
risk and to a single event.

Page 139
Risk retention ratios will not be the same in all countries but will vary based on market
circumstances in each jurisdiction. However, where risk retention ratios are low relative to the
industry then this may suggest that the insurer is either purchasing far more reinsurance than
its peers or that it is paying more than would be expected for its reinsurance cover. If the
insurer purchases more than the usual level of reinsurance then it is possible that it may
believe, implicitly or explicitly, that it does not have the capital available to allocate to the risk
as much as other insurers.
If the use of reinsurance is particularly high, a practice known as “fronting”, then an insurer may
consider itself to be largely immune to the underlying risk. In some cases, for example, an
insurer may be presented with a risk that it would not normally accept but it is also presented
with a corresponding reinsurance contract that means that the insurer would appear to bear
little of the insurance risk. In such cases, the insurer may decide to write the policy and take out
the reinsurance contract, simply to make a profit from the reinsurance commissions it will
receive. Fronting poses dangers to the insurer and does not represent best practice. First, if the
reinsurer fails to deliver on the reinsurance contract, then the insurer will be on risk in full.
Second, from a public policy perspective, fronting might be used to avoid the requirement to be
licensed in the domicile. It is a practice that, in effect, amounts to the insurer renting its license
to conduct insurance business. If fronting appears to be happening, the supervisor should
carefully check the reinsurance arrangements to ensure the insurer has reinsured its business
adequately, including its inward reinsurance, and that its reinsurers are good credit risks.
In some circumstances, the pricing cycle in the reinsurance market will affect an insurer’s
attitude toward ceding risk. If reinsurance is relatively cheap, then a cost‐benefit analysis will
make reinsurance relatively more attractive and it may make sense for an insurer to increase
the amount of risk that it cedes to take advantage of the lower costs. As a result, changes in
reinsurance retention rates need to be interpreted in the context of costs and prices in the
reinsurance markets more generally. Understanding an insurer’s retention ratios will be
informed by an understanding of the behavior of the market and the reaction of other insurers
to the same changes to the pricing of reinsurance.
Where the use of reinsurance changes over time, either decreasing or increasing, it suggests
that an insurer is changing its reinsurance policy and practice. A supervisor should be interested
in knowing the reasons for the changes with some certainty. Does the insurer believe that its
exposure to risk has increased? Does the insurer believe that its capital position is, in some way,
less secure and should be less exposed?
3.02 (Reinsurance recoveries + reinsurance commissions) / reinsurance ceded
This indicator is calculated as the ratio of the sum of reinsurance recoveries and reinsurance
commissions to reinsurance premiums ceded.

Page 140
It measures how much an insurer receives back from its reinsurers in terms of claims recoveries
and commissions compared to the reinsurance premiums it has paid. The indicator should be
examined over time and by class of business. Particularly for classes of insurance with
infrequent but severe claims, it can also be useful to calculate the ratio based on an aggregation
of several years’ experience.
A high ratio might indicate that an insurer has experienced adverse claims or has successfully
negotiated favorable terms for its reinsurance. Over time, it is unlikely that the ratio would be
more than 100%, because this would indicate that reinsurers are losing money on their
relationships with the insurer.
A low ratio might indicate that an insurer is having a good period of claims experience.
However, it might also indicate that the insurer is paying a high price for its reinsurance. Where
an insurer is paying more than its peers for reinsurance protection, then this might indicate that
the reinsurers feel that the portfolio of the insurer is poor. It might also indicate that the insurer
is less capable than its peers in designing or negotiating the terms and conditions of its
reinsurance program. Other things being equal, smaller insurers and those in developing
markets are likely to have lower ratios than larger insurers and those in developed markets,
because of differences in their bargaining power.
3.03 Maximum exposure to single risk / capital
This indicator is calculated as the ratio of the maximum exposure of an insurer to a single risk
(sometimes referred to as the per‐risk retention limit) to capital.
It indicates the extent to which the solvency of the insurer is exposed to a large claim. The
indicator may differ by class of business.
Acceptable maximum ratios established by supervisors typically vary between 2% and 10%.
3.04 Maximum exposure to single event / capital
Increasingly, with the use of more complex risk management and measurement techniques,
insurers have sought to determine a maximum that they will have to pay out in the case of a
single catastrophic event (the Maximum Event Retention or “MER”), or the maximum total
claims that they may have to pay in the event of a probable but very unlikely event (sometimes
referred to as the Probable Maximum Loss / Claim or “PML”). These events can be described in
terms of their low probability, or “return period” where an event with a probability of 0.5% in a
year would have a “return period” of 200 years or be described as a “one‐in‐200 year” PML
event.

Page 141
A supervisor is unlikely to receive sufficient information from an insurer to calculate the MER or
PML, but some supervisors require insurers to report the figures that they have determined in
the regulatory returns. It can also be interesting to know the event that would lead to the MER
or PML. Some supervisors also obtain and analyze exceedance probability (EP) curves.
The MER can be compared with the capital available. This can indicate whether the insurer
would still be commercially solvent if the event occurred, or how many such events the insurer
could withstand before it would have an asset deficiency. Acceptable maximum ratios
established by supervisors typically vary between 5% and 10%.
3.05 Maximum premium ceded to a single reinsurer / gross written premium
This indicator is calculated by first calculating the ratio, with respect to each reinsurer to which
an insurer has ceded premiums, of the premium ceded by the insurer to the total gross written
premium of the insurer. The indicator is the maximum of these ratios.
This indicator is a measure of counterparty concentration risk. Large cessions of reinsurance to
a single reinsurer expose an insurer to counterparty concentration risk, should the reinsurer
become unwilling or unable to meet its obligations. The concentration might be a related‐party
risk, if the insurer and reinsurer are members of the same group. Reinsurance concentrations
might also create systemic risk, if several insurers are significantly exposed to the same
reinsurer.
The lower the indicator, the less exposure an insurer has to potential losses in the event of the
failure of its largest reinsurer. Thresholds for supervisory concern vary significantly, ranging
from 5% to as high as 70%. Supervisors in jurisdictions where insurance and reinsurance
markets are not well developed might be prepared to accept higher ratios than those in more
developed markets.
4. Actuarial
4.01 Net claims provisions / average of net claims paid in last three years
This indicator is calculated as the ratio of net claims provisions to the average of net claims paid
in the last three years. Net claims provisions are those at the end of the measurement period,
net of claims provisions in respect of reinsurance ceded. If data on the net claims paid in the
last three years is unavailable, then a similar indicator could be calculated using the average of

Page 142
the last two years or just the net claims paid in the most recent year, but the results are likely
to be less stable from year to year.
It provides an indication of whether an insurer’s claims provisions are strengthening or
weakening over time. Many factors can affect the indicator, so overall ratios should be used
with caution. The indicator can vary significantly, for example, depending on the type of
business written by the insurer. Therefore, it should be calculated not only for an insurer as a
whole, but also by class of business. This indicator is generally more relevant for non‐life
insurers than for life insurers, because the claims provisions for life insurance business are
usually less subject to the need for estimation.
Benchmarks might be established by class of business. Differences in this indicator amongst
insurers with similar portfolios of insurance business can provide insight on the relative
conservatism of their claims provisioning. Changes over time for a particular insurer might
indicate changes in its claims handling or provisioning practices. In general, an insurer with a
lower ratio than its peers for a given class of business, or whose ratio for a class of business is
decreasing over time would be of potential supervisory concern. Deficiencies in provisions are
of the greatest concern to the supervisor.
For example, consider a jurisdiction in which the ratio for a particular class of business has been
stable over recent years, at 40%. However, Insurer A had a ratio of 38% two years ago, 36% one
year ago, and 34% at the end of the most recent measurement period. Insurer A’s ratio has
been weakening both over time and in relation to its peers. The reasons for these trends should
be investigated.
Claims provisions will vary in their method of estimation, the extent that they involve human
judgment, and the extent to which information is available for the assessment of the claim.
Claims that are in the final stages of settlement may well have a clearly defined outstanding
amount that can represent the provision. More generally, however, the ultimate cost of the
claim is an estimate. In addition, the insurer will have claims that have been incurred but not
reported (IBNR), so will have no information about these except experience. But the fact that it
is certain that some claims will be reported later, and the need to ensure that the insurer
correctly represents its liabilities, means that it should have these provisions.
Given the subjective nature of establishing claims provisions, close examination is needed to
assess whether the provisions established can be viewed as adequate. Insurers may understate
their claims provisions for reasons that can vary from errors or omissions to deliberate
attempts to inflate profits (or to avoid presenting a loss). In between these extremes, there is
the potential for misplaced optimism or the use of a method that is inappropriate.
Alternatively, the actual experience may change, or the insurer may be able to, because of
careful study and improved procedures, adopt a more accurate estimate than they were able to
do in the past. Claims‐based ratios will also be influenced by the insurer’s claims handling
procedures and administrative processes that can alter the timing of claims settlement and

Page 143
influence the ratios. It can also be useful to consider the rate at which an insurer’s net claims
paid have been changing.
Where the ratio of claims provisions to claims paid shows a decreasing trend then this may
indicate a weakening of the provisions and should be investigated. It may also indicate that the
insurer has been speeding up the claims settlement administration or that there have been
some large cases that distorted the trend – but such alternative explanations should be
supported by some other evidence before they are accepted by the supervisor. Hopefully,
management would have already investigated such a trend and be able to substantiate the
reason.
4.02 Net technical provisions / average of net written premium in last three years
This indicator is calculated as the ratio of net technical provisions to the average of net written
premium in the last three years. Net technical provisions are those at the end of the
measurement period, net of technical provisions in respect of reinsurance ceded. If data on the
net written premium in the last three years is unavailable, then a similar indicator could be
calculated using the average of the last two years or just the net written premium in the most
recent year, but the results are likely to be less stable from year to year.
It provides an indication of whether an insurer’s technical provisions are strengthening or
weakening over time. Many factors can affect the indicator, so overall ratios should be used
with caution. The indicator can vary significantly, for example, depending on the type of
business written by the insurer. Therefore, it should be calculated not only for an insurer as a
whole, but also by class of business. This indicator is equally relevant for both non‐life insurers
and life insurers, although the nature of their technical provisions can differ.
Benchmarks might be established by class of business. Differences in this indicator amongst
insurers with similar portfolios of insurance business can provide insight on the relative
conservatism of their provisioning. Changes over time for a particular insurer might indicate
changes in its provisioning practices. In general, an insurer with a lower ratio than its peers for a
given class of business, or whose ratio for a class of business is decreasing over time would be
of potential supervisory concern. Deficiencies in provisions are of the greatest concern to the
supervisor.
For example, consider a jurisdiction in which the ratio for a particular class of business has been
stable over recent years, at 40%. However, Insurer A had a ratio of 38% two years ago, 36% one
year ago, and 34% at the end of the most recent measurement period. Insurer A’s ratio has
been weakening both over time and in relation to its peers. The reasons for these trends should
be investigated.

Page 144
Technical provisions for non‐life insurers include unearned premium provisions, unexpired risk
provisions, and claims provisions. Technical provisions for life insurers are typically dominated
by actuarial (mathematical) provisions, with claims provisions accounting for a relatively small
part of technical provisions.
The mechanism for recognizing the premium as being “earned” is perhaps the least judgmental
of all the provisions, so the ratio should be of lower supervisory interest. However, it is still
important to check it because movements in the ratio can result from either errors in the data
submitted by the insurer (that would need to be corrected to ensure a robust analysis of other
items) or deliberate misstatement (that would be a cause for supervisory intervention).
As unearned premium is a function of the premium rates themselves, then the unearned
premium provisions will underestimate the actual resources needed to cover future risks if the
premium rates are not adequate. Where this is the case, then it is pertinent to consider
whether an additional provision for unexpired risk should be made and, if such a provision has
been made, whether it is sufficient.
Claims provisions have already been discussed; see 4.01.
Actuarial provisions are calculated using various methods and assumptions about the future
cash flows under the insurance policies. Their amounts can be very sensitive to the
assumptions, such as the rates of interest used to discount the future cash flows. For example,
an increase of 1 per cent in the discount rate would decrease the actuarial provisions by 15 per
cent for a class of insurance with a 15‐year duration of future liability cash flows, which would
not be unusual for long‐term products such as whole life insurance. It can also be useful to
consider the rate at which an insurer’s technical provisions have been changing and how this
compares to the actual and assumed rates of interest.
When the ratio of technical provisions to premiums is decreasing, it could indicate a weakening
of one or more of the types of provisions, which should be investigated.
4.03 Net claims provisions / capital
This indicator is calculated as the ratio of net claims provisions to capital. Net claims provisions
are those at the end of the measurement period, net of claims provisions in respect of
reinsurance ceded. Claims recoverable from reinsurers are deducted from gross claims
provisions on the assumption that an adverse deviation in claims provisions will in part be
funded by reinsurers. Capital can be determined as total assets minus total liabilities.
Like the ratio of capital to technical provisions, this indicator provides a measure of the extent
to which the capital of an insurer can bear liability risks. However, it focuses on claims
provisions, so it is generally more relevant for non‐life insurers than for life insurers, because

Page 145
the claims provisions for life insurance business are usually less subject to the need for
estimation.
The higher the ratio, the less cushion the capital of the insurer provides against adverse
developments in its claims provisions. Thresholds for supervisory concern might be lower for
insurers whose claims provisions are more volatile or difficult to estimate. Some supervisors
consider a ratio of 250% or more to be of concern.
A simplified example shows the usefulness of this indicator. Consider an insurer with no
reinsurance and no liabilities except 1,000 in claims provisions. Assume the insurer’s ratio of net
claims provisions to capital is 1,000%. This implies that the assets of the insurer are 1,100 and
its capital is 100. Now, assume that the actuary re‐estimates the claims provisions and discovers
an adverse deviation of 10%. Claims provisions increase by 100 to 1,100, assets stay the same at
1,100 and capital thus decreases to 0, leaving the insurer insolvent.
4.04 Claims development
This indicator calculated as the ratio of the sum of claims and claims adjustment expenses paid
during the last five years, plus the current provisions, to the initial provisions for unpaid claims
and claims adjustment expenses that were established for those claims. For purposes of this
calculation, the claims provision at the beginning of the five‐year period is considered the
“initial provision” for claims incurred more than five years ago. Note that this ratio needs to be
interpreted being aware that claims provisions should correctly include an allowance for
expenses related to claims payments (claims adjustment expenses), whereas the actual
amounts of such expenses might be reported separately from the claims paid.
This indicator measures how the development of claims and claims adjustment expenses
compares to the initial provisions established for those claims. Some supervisors consider a
ratio of 120% or more to be of concern, while others take a more conservative approach and
would investigate any situation where the ratio exceeds 100%.
If the ratio is materially greater than 100%, then this suggests that the claims experience might
have deteriorated or that claims provisions were intentionally understated, and future claims
provisions should also show a corresponding increase. Again, the counter position is that claims
may simply be being settled more quickly—an argument that the total claims outcome remains
largely unchanged and that future payment expectations might be reduced. Interpreting this
ratio, and the action that may be appropriate, would also be informed by understanding the
method used by the insurer in setting these provisions. Some methods, such as a target overall
claim ratio, will automatically take credit for claims being paid earlier, whether this is actually
the case. Other methods, such as the chain ladder methods, will more gradually reflect both
changed experience that is either positive or negative.

Page 146
The results should be interpreted with care. It is best to calculate the ratios by class of business
because different classes can be expected to show different behaviors and business volume and
mix changes will influence the aggregate results.
Particularly for long‐tail business, insurers may report their expected future claim payments
from the existing business as well as their past claim payments based on both the year of the
occurrence of the claim event and the year (or expected year) of the claim payments. If such
information is available, it may also be informative to calculate the ratio separately for each
year of claim event. If this is done, then it is possible to examine the claims paid in the latest
accounting period compared to those expected when the provisions were determined the
previous year, and to make such comparisons over several years.
4.05 Underwritten business: distribution by class of business
The distribution of underwritten business by class of business is not a single ratio. In examining
this distribution, the written premiums in each class of business would be expressed as a
percentage of the total written premiums.
The distribution indicates the extent to which the business of the insurer is diversified amongst
different classes of business. Such diversification can help to mitigate the risk of exposure to
significant losses in the event of problems that affect a particular class of business. However,
insurers should not diversify beyond their capacity to understand and manage the risks in the
classes of business that they underwrite. Accordingly, both a high concentration in a particular
class of business and a significant increase in the share of a class of business in an insurer’s mix
might be of concern.
The starting point is to summarize the business mix in terms of the proportion of premium for
the insurer which comes from each main class of business and to reflect on how this compares
with previous years. Reasons for any significant changes in the distribution of business should
be investigated. Changes in business mix can reflect positive management action. Alternatively,
they can reflect “accidental” increase in exposure to less profitable segments through
inadequate pricing. The business mix and the trends in the mix will inform the analysis of other
ratios.
A large increase in volume in a class of business may signal a sudden change whereby the
insurer has entered a new product area, distribution niche, or sales territory. It would be a
concern if an insurer did so without recognizing that it will have limited experience regarding
the risk in this new area. There have been cases where insurers have viewed such growth
positively up until they start to see the claims emerge to such an extent that they realize that
they were, in fact, writing a disproportionate share of the poorer quality risks.
Page 147
The level of an insurer’s concentration by class of business could be measured using the
Herfindahl‐Hirschman Index; see 9.07. The results could be compared over time and in relation
to peers. Alternatively, some supervisors set a threshold based on the average change in the
distribution. For example, supervisors in the USA calculate an indicator as the average of the
absolute value of percentage changes in the shares of each of 9 main classes of life insurance
business, with 5% as the threshold.
4.06 Underwritten business: geographical distribution
The geographical distribution of underwritten business is not a single ratio. In examining this
distribution, the written premiums in each geographical region would be expressed as a
percentage of the total written premiums.
The distribution indicates the extent to which the business of the insurer is diversified amongst
different geographical regions. The distribution of business that is typically examined is local
business versus business in foreign jurisdictions, either separately or in aggregate. In
jurisdictions that cover a large and diverse area, supervisors might also assess the distribution
of business among relevant geographical areas within the jurisdiction.
Underwriting business in foreign jurisdictions might enable an insurer to diversify its insurance
risks. Such diversification can help to mitigate the risk of exposure to significant losses in the
event of problems that affect a region. However, insurers should not diversify beyond their
capacity to understand and manage the risks in the markets in which they underwrite business.
Given the potential for foreign operations to create problems for an insurer, it is usual to
examine the exposure to foreign business.
In jurisdictions that cover a large and diverse area, supervisors might also assess the
distribution of business among relevant geographical areas within the jurisdiction. For example,
an insurer with a concentration of business in one region of the country might be exposed to
the risk of significant losses in the event of an economic downturn or natural catastrophe in
that region.
The geographical distribution of insurance business should be assessed with reference to
regulatory requirements, the insurer’s business plans, and the insurer’s management
capabilities. For example, a large or increasing level of foreign business may need to be
investigated by finding out the source of this business and how it is being managed by the
insurer.
The level of an insurer’s concentration by geographical region could be measured using the
Herfindahl‐Hirschman Index; see 9.07. The results could be compared over time and in relation
to peers.

Page 148
4.07 Underwritten business: sectoral distribution
The sectoral distribution of underwritten business is not a single ratio. In examining this
distribution, the written premiums in each economic sector would be expressed as a
percentage of the total written premiums. To enable the calculation of this distribution,
insurers would need to record the economic sector in which each non‐personal customer
operates and provide a corresponding breakdown of written premiums. Various classification
systems are used around the world, which typically provide for several levels of grouping.
Banking supervisors typically review the sectoral distribution of loans, so an insurance
supervisor might use the same sectoral classification system and level of grouping as their
banking counterpart in the jurisdiction. This would facilitate the sharing of information among
supervisors for both group‐wide supervision and macroprudential risk assessment.
The distribution indicates the extent to which the business of the insurer is diversified amongst
different economic sectors. The business of an insurer should be diversified among various
sectors of the economy, to mitigate the risk of exposure to significant losses or decreases in
premiums in the event of problems that affect a particular sector. However, insurers should not
diversify beyond their capacity to understand and manage the risks in the markets in which
they underwrite business. Accordingly, both a high concentration by economic sector and a
significant increase in the share of business from a particular economic sector in an insurer’s
mix might be of concern.
4.08 Actuarial assumption: short‐term interest rate
When calculating actuarial technical provisions and premium rates, the actuary discounts
expected future cash flows using assumed rates of interest. Actuaries often use discount rates
that vary over time, for example, following a yield curve or grading from an initial rate to an
ultimate rate. This indicator is the interest rate used for discounting the shortest‐term cash
flows.
The higher the assumed rate of interest the lower the resulting present value of the cash flows
being discounted. The results can be very sensitive to the assumed rates of interest used to
discount the future cash flows. For example, an increase of 1 per cent in the discount rate
would decrease the actuarial provisions by 15 per cent for a class of insurance with a 15‐year
duration of future liability cash flows, which would not be unusual for long‐term products such
as whole life insurance. The short‐term interest rate would affect the present values of both
short‐ and long‐duration cash flows.

Page 149
Although interest rate assumptions often differ amongst actuaries, supervisors should assess
the reasonableness of the assumptions in light of market conditions. Supervisors should seek
explanations of significant changes from one valuation to the next that are not consistent with
changes in market conditions and for outliers amongst the assumptions used for different
insurers.
4.09 Actuarial assumption: long‐term interest rate
When calculating actuarial technical provisions and premium rates, the actuary discounts
expected future cash flows using assumed rates of interest. Actuaries often use discount rates
that vary over time, for example, following a yield curve or grading from an initial rate to an
ultimate rate. This indicator is the interest rate used for discounting the longest‐term cash
flows.
The higher the assumed rate of interest the lower the resulting present value of the cash flows
being discounted. The results can be very sensitive to the assumed rates of interest used to
discount the future cash flows. For example, an increase of 1 per cent in the discount rate
would decrease the actuarial provisions by 15 per cent for a class of insurance with a 15‐year
duration of future liability cash flows, which would not be unusual for long‐term products such
as whole life insurance. Unlike the short‐term interest rate, the long‐term interest rate would
affect the present values of only long‐duration cash flows.
Although interest rate assumptions often differ amongst actuaries, supervisors should assess
the reasonableness of the assumptions in light of market conditions. Supervisors should seek
explanations of significant changes from one valuation to the next that are not consistent with
changes in market conditions and for outliers amongst the assumptions used for different
insurers.
5. Management
5.01 Gross written premium per employee
This indicator is calculated as the ratio of gross written premium to the number of employees.
The number of employees included in the denominator should be appropriately matched to the
premium included in the numerator; for example, if the gross written premium relates only to
business within the local jurisdiction then only employees whose activities relate to that
business should be included.
Page 150
This indicator is a measure of operational efficiency, which is likely to be correlated with
general management soundness. Unsound efficiency indicators could flag potential problems in
key areas, including the management of insurance and investment risks.
The same indicator can be calculated for both life and non‐life insurers, but the benchmarks will
be different because the life insurance business typically includes products with a savings
component and its distribution costs are usually front‐loaded into the initial policy years. A
significant change in the indicator for a particular insurer might indicate a significant change in
its business model, which would warrant further analysis and enquiry.
Gross written premium is used as a proxy for the overall volume of business activity. The
analysis needs to reflect the difference in results that single premium versus annual premium
business will have on this indicator.
It also needs to be considered that insurers may use different distribution channels to sell their
products and sometimes may spin off their distribution into subsidiaries or other companies in
a group. This can affect the number of employees; for example, employees of the insurer
working in its branch offices or agencies would be included in the denominator, while
employees of a related bank that are selling bancassurance would not be. In general, internet
and call‐center distribution are cheaper than using brokers or agents, and these factors should
be considered when interpreting the results.
5.02 Assets per employee
This indicator is calculated as the ratio of assets to the number of employees. The number of
employees included in the denominator should be appropriately matched to the assets
included in the numerator; for example, if the assets relate only to business within the local
jurisdiction then only employees whose activities relate to that business should be included.
This indicator is a measure of operational efficiency, which is likely to be correlated with
general management soundness. Unsound efficiency indicators could flag potential problems in
key areas, including the management of insurance and investment risks.
The same indicator can be calculated for both life and non‐life insurers, but the benchmarks will
be different because the life insurance business is more asset intensive. This indicator might
also be compared to the ratios of other financial institutions, such as banks, in the jurisdiction.
A significant change in the indicator for a particular insurer might indicate a significant change
in its business model, which would warrant further analysis and enquiry.

Page 151
5.03 Operating expenses / gross written premium
This indicator is calculated as the ratio of operating expenses to gross written premium.
Operating expenses would exclude commissions. The operating expenses included in the
numerator should be appropriately matched to the premium included in the numerator; for
example, if the gross written premium relates only to business within the local jurisdiction then
only operating expenses related to that business should be included.
This indicator is a measure of operational efficiency, which is likely to be correlated with
general management soundness. Unsound efficiency indicators could flag potential problems in
key areas, including the management of insurance and investment risks.
The same indicator can be calculated for both life and non‐life insurers, but the benchmarks will
be different because the life insurance business typically includes products with a savings
component. A significant change in the indicator for a particular insurer might indicate a
significant change in its business model, which would warrant further analysis and enquiry.
A higher ratio is typically of more concern to supervisors. Thresholds can vary significantly
according to market conditions in the jurisdiction, for example, from 30% to 50%. Some
supervisors also establish thresholds below which they would seek explanation from an insurer.
Gross written premium is used as a proxy for the overall volume of business activity. The
analysis needs to reflect the difference in results that single premium versus annual premium
business will have on this indicator; this might be done by weighting single premiums at 10% to
reduce the distortion that might be caused by single premium business, which sometimes
fluctuates significantly in response to changes in the interest‐rate environment.
This indicator is similar to and should be considered in conjunction with the insurer’s expense
ratio.
5.04 Personnel expenses / gross written premium
This indicator is calculated as the ratio of personnel expenses to gross written premium. The
personnel expenses included in the numerator should be appropriately matched to the
premium included in the numerator; for example, if the gross written premium relates only to
business within the local jurisdiction then only personnel expenses related to that business
should be included.
This indicator is a measure of operational efficiency, which is likely to be correlated with
general management soundness. Unsound efficiency indicators could flag potential problems in
key areas, including the management of insurance and investment risks.

Page 152
The same indicator can be calculated for both life and non‐life insurers, but the benchmarks will
be different because the life insurance business typically includes products with a savings
component. A significant change in the indicator for a particular insurer might indicate a
significant change in its business model, which would warrant further analysis and enquiry.
Gross written premium is used as a proxy for the overall volume of business activity. The
analysis needs to reflect the difference in results that single premium versus annual premium
business will have on this indicator; this might be done by weighting single premiums at 10% to
reduce the distortion that might be caused by single premium business, which sometimes
fluctuates significantly in response to changes in the interest‐rate environment.
It also needs to be considered that insurers may use different distribution channels to sell their
products and sometimes may spin off their distribution into subsidiaries or other companies in
a group. Such factors should be considered when interpreting the results. For example,
although Internet and call‐center distribution might be cheaper than using intermediaries, they
might result in higher personnel expenses and lower commission expenses, which will affect
the indicator. Accordingly, this indicator should be considered in conjunction with the insurer’s
expense ratio.
5.05 Growth in gross written premium
This indicator is calculated as the ratio of the change in gross written premium from that of the
previous year to the gross written premium of the previous year. In both the numerator and the
denominator, single premiums should be weighted at 10% to reduce the distortion that might
be caused by single premium business, which sometimes fluctuates significantly in response to
changes in the interest‐rate environment.
This indicator is a measure of an insurer’s ability to grow its business.
Both very low and very high rates of premium growth can be of supervisory concern.
Thresholds for supervisory concern will depend on the rates of growth of the economy and of
the insurance market overall. Some supervisors establish absolute thresholds, such as growth
rates below ‐10% or above 25%. Alternatively, relative thresholds might be used, such as
growth rates more than 10% below the average growth rate in the insurance market overall or
more than 10% above the average growth rate in the market.
If an insurer is growing its written premium quickly, this may indicate that the insurer is
underpricing its products or that underwriting standards are being relaxed. Alternatively, it may
indicate that the insurer has simply increased its effectiveness in the market or that it is
successfully increasing premium rates. If growth rates show a marked decline, it may be that an
insurer has lost its ability to be competitive in the marketplace.
Page 153
If written premium is growing quickly, there is a risk that the insurer’s infrastructure may not be
adequate to properly manage the increased volumes of business. In the extreme, an insurer
may attempt to write more business to increase cash flow to meet current claim payments. This
is a particularly concerning situation. Furthermore, rapid premium growth raises the question
of whether the insurer has sufficient financial resources for the level of risk that it is carrying
and, if such growth were to continue, whether it will need to raise capital in the future.
To interpret premium‐based growth rates, it is important to consider industry‐wide levels for
the equivalent ratios. More general factors, such as the performance of the economy, levels of
inflation, unemployment, growth rates and the level of growth relative to the general growth in
the economy (usually the level of written premium relative to GDP can be considered) will be
reflected in insurance markets. It is also necessary to be aware of wider developments such as
the privatization of a class of business, changes in the taxation basis that may make a class of
business more or less attractive, and changes in the regulatory environment that may lead to
volume changes.
5.06 Growth in net written premium
This indicator is calculated as the ratio of the change in net written premium from that of the
previous year to the net written premium of the previous year. In both the numerator and the
denominator, single premiums should be weighted at 10% to reduce the distortion that might
be caused by single premium business, which sometimes fluctuates significantly in response to
changes in the interest‐rate environment.
This indicator is a measure of an insurer’s ability to grow its business. The same factors are
relevant to the interpretation of this indicator as for the growth in gross written premium.
However, capital needs are more closely related to the amount of risk retained by an insurer
than the gross amount of business written. Accordingly, the level and pattern of this indicator
are particularly relevant to assessing the effects of growth on capital adequacy.
Both very low and very high rates of premium growth can be of supervisory concern.
Thresholds for supervisory concern will depend on the rates of growth of the economy and of
the insurance market overall. Some supervisors establish absolute thresholds, such as growth
rates below ‐10% or above 25%. Alternatively, relative thresholds might be used, such as
growth rates more than 10% below the average growth rate in the insurance market overall or
more than 10% above the average growth rate in the market.
If an insurer is growing its written premium quickly, this may indicate that the insurer is
underpricing its products or that underwriting standards are being relaxed. Alternatively, it may
indicate that the insurer has simply increased its effectiveness in the market or that it is
Page 154
successfully increasing premium rates. If growth rates show a marked decline, it may be that an
insurer has lost its ability to be competitive in the marketplace.
If written premium is growing quickly, there is a risk that the insurer’s infrastructure may not be
adequate to properly manage the increased volumes of business. In the extreme, an insurer
may attempt to write more business to increase cash flow to meet current claim payments. This
is a particularly concerning situation. Furthermore, rapid premium growth raises the question
of whether the insurer has sufficient financial resources for the level of risk that it is carrying
and, if such growth were to continue, whether it will need to raise capital in the future.
To interpret premium‐based growth rates, it is important to consider industry‐wide levels for
the equivalent ratios. More general factors, such as the performance of the economy, levels of
inflation, unemployment, growth rates and the level of growth relative to the general growth in
the economy (usually the level of written premium relative to GDP can be considered) will be
reflected in insurance markets. It is also necessary to be aware of wider developments such as
the privatization of a class of business, changes in the taxation basis that may make a class of
business more or less attractive, and changes in the regulatory environment that may lead to
volume changes.
5.07 Growth in total assets
This indicator is calculated as the ratio of the change in total assets from the end of the
previous year to the total assets at the end of the previous year.
It provides an indicator of an insurer’s ability to increase its assets through its underwriting,
marketing, and investment operations.
Both very low and very high rates of asset growth can be of supervisory concern. Benchmarks
for supervisory concern will depend on the rates of growth of the economy and of the
insurance market overall, along with the rates of return available on investments. A typical
range for the ratio is between ‐5% and 20%.
Low or negative rates of growth in total assets might arise because of poor claims results, high
levels of surrenders or withdrawals from savings products, loss of business to competitors, high
expenses, poor investment results, or large dividend payments to shareholders.
High rates of growth in total assets might be generated by high levels of sales, particularly of
savings products, exceptional underwriting results, or favorable investment results. They might
also arise from delays in the payment of claims (perhaps accompanied by under‐provisioning),
revaluation of assets such as real estate, or the raising of capital by the insurer. Accordingly, the
underlying causes of unexpected levels of growth in total assets, whether positive or negative,
should be investigated.
Page 155
5.08 Gross written premium / sum insured
This indicator is calculated as the gross written premium divided by the sum insured. It is
expressed as a multiple of the local currency units (CU), for example, X CU per 1,000 CU of sum
insured, rather than in percentage terms.
The premium as a proportion of total sums insured may give an indication of the average policy
charge and, all other things being equal, will rise as prices increase. The ratio will vary
significantly with the type of business written by the insurer, so it should be calculated by class
of business. It is likely to be less reliable for small portfolios or more customized business lines
such as commercial business or reinsurance.
Price levels can be subject to cycles that reflect periods when there is more or less pressure to
compete to maintain and grow premium volumes. Costs of insurance can also change in
response to such widely varying factors as weather conditions, crime rates, the nature of safety
or security equipment in general use, or the extent to which laws are enforced. Market analysis
can provide insight on such factors.
Lower price levels will impact profitability to the extent that the insurer is not able to reduce
costs, particularly through the effect of fixed costs. An insurer may have simply found that it has
had to reduce prices to remain competitive, which will result in profitability being adversely
impacted. However, an insurer may be able to reduce its prices by reducing risk that it holds,
for example, by increasing the excess or deductibles on claims that it incorporates in its policies.
5.09 Gross written premium / number of policies
This indicator is calculated as the gross written premium divided by the number of policies. It is
expressed in the local currency units (CU), for example, X CU per policy, rather than in
percentage terms.
The average premium per policy may give an indication of the market segment targeted by an
insurer. For example, a high ratio for individual life insurance might indicate that the insurer is
targeting high‐income consumers and a low ratio that it is focused on microinsurance. All other
things being equal, the ratio will rise as prices increase. The ratio will vary significantly with the
type of business written by the insurer, so it should be calculated by class of business. It is likely
to be less reliable for small portfolios or more customized business lines such as commercial
business or reinsurance.
One situation where this indicator is particularly useful is when the policy terms and conditions
and coverage are largely defined and uniform. Such a situation may exist with respect to

Page 156
compulsory third‐party liability insurance for motor accidents where the policy benefits may be
set out in the law. As such, each policy provides identical cover, so the basic cost is somewhat
generic.
5.10 Complaint index
This indicator is calculated as the ratio of an insurer’s market share with respect to complaints
to its market share with respect to gross written premium. The market share with respect to
complaints is the ratio of the number of complaints against the insurer, as recorded by the
supervisor or an ombudsman (or both), to the total number of complaints against all insurers.
For example, if there have been 10 complaints against an insurer and 100 complaints against all
insurers, then the numerator is 10%. If the insurer’s market share with respect to gross written
premium is 20%, then the complaint index is 50%.
The complaint index provides an indicator of the extent to which an insurer treats its customers
fairly. The lower the ratio the less an insurer’s customers have complained about how they
have been treated. Ratios materially higher than 100% should generally trigger investigation by
the supervisor.
Some classes of business are more likely than others to result in complaints. Therefore, the mix
of an insurer’s business should be considered in interpreting the results. If data is available and
there are sufficient complaints to make the data credible, it can be useful to calculate this
indicator by class of business.
5.11 Pay‐out ratio
This indicator is calculated as the ratio of an insurer’s dividends to its shareholders (or in the
case of an insurer operating on a branch basis, transfers to its head office) to the net income of
the insurer after tax.
It shows how much of the insurer’s net income is being distributed to shareholders instead
being added to retained earnings within the insurer (or retained as assets within the branch)
and building its capital. Some supervisors would consider a pay‐out ratio of 40% or more to be
of concern.
A high ratio may indicate that the level of dividends might not be supported by profits or might
be unsustainable in the future. It may indicate that the board is being pressured by
shareholders (or branch management is being pressured by the head office) to make high
payouts, which could compromise the financial strength of the insurer.

Page 157
A low ratio may cause shareholders to be concerned that they are not being sufficiently
rewarded and to wonder whether retained capital is being put to effective use.
This indicator should be considered along with the current and prospective adequacy of the
insurer’s capital, the trend and stability of its net income, and the sources of its net income. For
example, if much of the net income of an insurer has been earned from non‐cash items such as
unrealized gains on investments and changes in actuarial assumptions, a high pay‐out ratio
would be inappropriate. If an insurer has accumulated losses (in other words, negative retained
earnings) or does not meet capital adequacy requirements, a pay‐out ratio of more than 0%
would usually be considered inappropriate (if not illegal).
5.12 Board composition
This indicator is calculated as the ratio of the number of unaffiliated board members to the
total number of board members. Unaffiliated board members are those who are not members
of senior management of the insurer or entities related to the insurer, such as other companies
in a group of which it is a member. If the legislation of a jurisdiction prescribes composition
requirements, such as the need for some independent directors, the criteria set out in
legislation should be applied.
Board composition should be diverse in many respects, such as expertise and gender, to help
ensure robust oversight. This indicator measures just one aspect of diversity, the balance
between members whose interests might be more aligned with those of management and
those who might bring a more independent perspective.
A higher ratio indicates a more diverse board, in terms of affiliation. Thresholds for supervisory
concern might be established based on the composition requirements prescribed by legislation,
if any, or the practices prevailing in the financial sector of the jurisdiction more generally.
However, a ratio of 50% or more would generally be considered desirable.
6. Earnings
6.01 Claims ratio
This indicator is calculated as the ratio of net incurred claims to net earned premium. In both
the numerator and the denominator, amounts include both business underwritten directly by
the insurer and reinsurance assumed from other insurers, reduced by premiums ceded to and
claims recovered from reinsurers, respectively. The ratio can vary significantly with the type of

Page 158
business written by the insurer, so it should be calculated by class of business. The claims ratio
is a more reliable indicator for non‐life insurers than for life insurers, because the claims on
non‐life insurance products are typically more directly related to the premiums earned in a year
than are those on long‐term life insurance products. For classes where the amount of business
is small, it is reasonable to expect that the result will be more volatile or extreme.
The claims ratio (or loss ratio) is a longstanding indicator of profitability and underwriting
quality. Claims costs have a significant influence on the profitability of the business that an
insurer has written. Claims costs are influenced by both the number and the size of claims and
the extent that they are less (or more) than was anticipated in the premiums charged.
Both very low and high claims ratios can be of supervisory concern. Thresholds for supervisory
concern will depend on the class of business and the competitiveness of the insurance market.
Thresholds can vary considerably, with lower thresholds ranging from 20% to 50% and upper
thresholds from 50% to more than 100%.
Where the ratio is high, this indicates that premium rates are too low for the level of risk or that
the claims experience has deteriorated. Either way, the insurer’s profitability will be
endangered.
Even where the ratio is low, this may be of supervisory interest. If an insurer writes particularly
profitable business, then there may be a question as to whether it can do so indefinitely. In
some cases, it is reasonable to expect that it will, due to a specialization in the way that the
insurer markets or manages the product. In other situations, management might need to
develop strategies to respond to increased competition or guard against loss of advantage.
Supervisors might ask the insurer about the strategies it has to maintain its favorable situation
and what actions it will consider should the profitability of this business come under market
pressure.
From a market conduct perspective, a low claims ratio raises the possibility that an insurer’s
products have been priced too high to provide reasonable value to its policyholders, or that
claims are being unfairly adjudicated.
As both the incurred claims and the earned premium values are functions of provisions (for
claims and unearned premiums respectively), then any change in the manner that provisioning
is determined will also influence the ratio.
6.02 Gross claims ratio
This indicator is calculated as the ratio of gross incurred claims to gross earned premium. In
both the numerator and the denominator, amounts include both business underwritten directly
by the insurer and reinsurance assumed from other insurers. The ratio can vary significantly

Page 159
with the type of business written by the insurer, so it should be calculated by class of business.
The claims ratio is a more reliable indicator for non‐life insurers than for life insurers, because
the claims on non‐life insurance products are typically more directly related to the premiums
earned in a year than are those on long‐term life insurance products.
The same factors are relevant to the interpretation of this indicator as for the net claims ratio.
However, because this indicator ignores the effects of reinsurance ceded, it helps in assessing
the underlying profitability of the business underwritten directly by the insurer or assumed
from other insurers. Even more so than for the net claims ratio, where reinsurance helps to
smooth the claims experience, for classes where the amount of business is small, it is
reasonable to expect that the result will be more volatile or extreme.
The claims ratio (or loss ratio) is a longstanding indicator of profitability and underwriting
quality. Claims costs have a significant influence on the profitability of the business that an
insurer has written. Claims costs are influenced by both the number and the size of claims and
the extent that they are less (or more) than was anticipated in the premiums charged.
Both very low and high claims ratios can be of supervisory concern. Thresholds for supervisory
concern will depend on the class of business and the competitiveness of the insurance market.
Thresholds can vary considerably, with lower thresholds ranging from 20% to 50% and upper
thresholds from 50% to more than 100%.
Where the ratio is high, this indicates that premium rates are too low for the level of risk or that
the claims experience has deteriorated. Either way, the insurer’s profitability will be
endangered.
Even where the ratio is low, this may be of supervisory interest. If an insurer writes particularly
profitable business, then there may be a question as to whether it can do so indefinitely. In
some cases, it is reasonable to expect that it will, due to a specialization in the way that the
insurer markets or manages the product. In other situations, management might need to
develop strategies to respond to increased competition or guard against loss of advantage.
Supervisors might ask the insurer about the strategies it has to maintain its favorable situation
and what actions it will consider should the profitability of this business come under market
pressure.
From a market conduct perspective, a low claims ratio raises the possibility that an insurer’s
products have been priced too high to provide reasonable value to its policyholders, or that
claims are being unfairly adjudicated.
As both the incurred claims and the earned premium values are functions of provisions (for
claims and unearned premiums respectively), then any change in the manner that provisioning
is determined will also influence the ratio.

Page 160
6.03 Expense ratio
This indicator is calculated as the ratio of expenses to net earned premium. The expenses
should be reduced by reinsurance commissions, which are often shown as an item of income in
the financial statement. The expense ratio is a more reliable indicator for non‐life insurers than
for life insurers, because the expenses on non‐life insurance products are typically more directly
related to the premiums earned in a year than are those on long‐term life insurance products,
on which expenses are sometimes heavily weighted to the early policy years. The expense ratio
can also be calculated based on gross earned premium, in which case the expenses would not
be reduced by reinsurance commissions.
A significant influence on profit performance of an insurer is the level of expenses associated
with the administration of its business. The conventional approach to measure the level of
expenses has been the expense ratio.
Both very low and high expense ratios can be of supervisory concern. Thresholds for
supervisory concern will depend on the class of business and the competitiveness of the
insurance market. Thresholds can vary considerably, with lower thresholds ranging from 10% to
25% and upper thresholds as high as 90%.
Higher ratios indicate that the business is cost‐intensive or that the insurer is less efficient. Life
insurers that are growing rapidly and selling products with heavy expenses in the early years
might also show higher expense ratios.
Larger insurers and smaller insurers can be expected to show different ratios due to economies
of scale and the influence of fixed costs. However, this is not always the case, as the ratio also
reflects management’s ability to manage costs effectively. In general, where an insurer is
growing, it should have a progressively declining expense ratio. This will not always be
observed, and an indication of poor expense management ultimately raises concerns.
For a particular insurer, the expense ratio might differ by class of business. There may be a valid
reason for this, but it is reasonable to check the allocation of expenses by examining the more
detailed breakdown of expenses that may be provided in the supporting accounts. A very low
expense ratio might indicate an inappropriate allocation of expenses or insufficient expenditure
to enable proper administration of the business.
From a market conduct perspective, a high expense ratio raises the possibility that the insurer’s
products do not provide reasonable value to the policyholders, or that the insurer is competing
for business through the payment of high commissions to intermediaries.

Page 161
6.04 Combined ratio [FSI Non‐Life]
This indicator is calculated as the sum of the claims ratio and the expense ratio. Although the
combined ratio can be calculated for life insurers, the calculation might not produce useful
results. This is because the life insurance claims (and increases in technical provisions) for long‐
term policies do not relate closely to the current year’s premiums, while acquisition expenses
are often higher in the early policy years. As the claims ratio and the expense ratio can be
calculated on a basis that is either net or gross of reinsurance, the combined ratio can also be
calculated on a net and gross basis.
Both very low and high combined ratios can be of supervisory concern. Thresholds for
supervisory concern will depend on the class of business and the competitiveness of the
insurance market. Thresholds can vary considerably, with lower thresholds ranging from 55% to
85% and upper thresholds as high as 110%.
Traditionally, the business philosophy of non‐life insurers had been to take on risk through the
writing of policies, lay off some of this risk through reinsurance, and then try to ensure that the
remaining retained premium is sufficient to cover claims, expenses, and make a profit. With
such a philosophy, investment returns were treated as somewhat fortuitous rather than a part
of the core operation. It is still most likely that the largest source of risk, and hence the focus of
management attention, will be on the “underwriting side” of the business. This approach gave
rise to the combined ratio, which indicates that an insurer is making underwriting losses where
the combined ratio is more than 100%. But it should not be making losses overall at this level,
because investments should be contributing to its earnings. Consequently, in a competitive
market, it is not unusual for the combined ratios to be slightly above 100%. However, there is
cause for supervisory concern where combined ratios exceed 100% by a substantial margin.
Prolonged triple‐digit combined ratios, in an environment of low or volatile investment yields,
signal a drain on capital and the prospect of solvency problems.
From a market conduct perspective, a very low combined ratio raises the possibility that the
insurer’s products do not provide reasonable value to the policyholders. It might also indicate
an inappropriate allocation of expenses or insufficient expenditure to enable proper
administration of the business.
6.05 Investment income ratio
This indicator is calculated as the ratio of investment income (net of investment expenses but
gross of tax) to net earned premium. It should not be confused with the net yield on
investments, which uses average invested assets in the denominator. Although the investment
income ratio can be calculated for life insurers, the calculation might not produce useful results.
Page 162
This is because the assets accumulated under long‐term policies, and the investment income
that they generate, do not relate closely to the net earned premium of a particular year.
This indicator measures the contribution of investments to profitability in a manner comparable
to the combined ratio used to measure the contribution of underwriting operations. The return
that the insurer is able to extract from the investment of funds is often a significant element of
profit performance. For non‐life insurance, the investment income ratio typically ranges from
2% to 10%.
It can be important to investigate both the actual result from the investments as well as the
components of this result.
In unusual cases, the assets relating to some or all of the reinsurance may be invested by the
ceding insurer, and the treatment of the investment income and the assets in these situations
should be understood.
In many cases, investment income is not allocated to classes of business within an insurer’s
portfolio, so the inclusion of investment income in the analysis is more common at the level of
the insurer in total. For more globally calculated ratios, the addition of allowances for tax and
other items as well as expenses and other income that are not attributable to a particular class
of business is also more relevant.
6.06 Operating ratio
The operating ratio is calculated as the combined ratio minus the investment income ratio. To
reduce the potential effects of year‐to‐year volatility on the analysis, some supervisors,
including those in the USA, use a two‐year overall operating ratio.
The operating ratio is used in recognition of the fact that investment income can make an
insurer profitable even if the combined ratio is above 100%. The usual range for the operating
ratio includes results less than 100%. An operating ratio below 100% indicates an operating
profit and a ratio result above 100% indicates an operating loss.
More generally, various profit ratios are directed at the same overall assessment of
profitability. The profit ratios reflect a measure of “reward” relative to the size of the business
in general terms. Profit ratios will, in fact, be a mixture of the performance of the business
written on gross terms and the margin given away or earned through the terms of any
reinsurance. Accordingly, it may be useful to separate these influences to determine the extent
that the insurer earns margins from the business it writes separately from the effect of its
reinsurance program on these margins.

Page 163
6.07 Profitability ratio
The profitability ratio is calculated using the sum of underwriting income, investment income,
and other income, minus other expenses, as the numerator and net earned premium as the
denominator. “Underwriting income” means net earned premium minus net incurred claims
minus expenses.
The profitability ratio is like the complement of the operating ratio (100% minus the operating
ratio), but the numerator includes the net of other income and other expenses. Where such
items have not been reflected in underwriting income or investment income, it provides a more
complete measure of profitability than the operating ratio. The profitability ratio can be
interpreted as a profit margin, or a form of margin‐on‐sales ratio.
The usual range for the profitability ratio includes results more than 0%.
6.08 Return on revenue
The return on revenue ratio is calculated using profits (the sum of underwriting income,
investment income, and other income, minus other expenses) as the numerator and total
revenue (the sum of net earned premium, investment income, and other income) as the
denominator.
The return on revenue is similar to the profitability ratio, but the denominator includes
investment income and other income. It can be interpreted as a profit margin on all of the
revenue an insurer is able to generate.
6.09 Revisions to technical provisions / technical provisions
For life insurers with long‐term products, the claims ratio can provide misleading information
regarding profitability. A more reliable indicator might be the revisions to the prior year’s
technical provisions divided by the current year’s technical provisions. This is effectively a
charge to current profits due to deviations of recent experience and current expectations of the
future from previous actuarial assumptions. This indicator is also relevant for non‐life insurers,
whose technical provisions might also be revised.
Information regarding the amount of and reasons for revisions to the prior year’s technical
provisions would typically be available in the actuary’s report.
Page 164
A low ratio, whether negative or positive, would generally not be cause for supervisory concern.
However, if a low ratio reflects large but offsetting revisions, this might indicate manipulation
of the provisioning, perhaps in response to pressure by management.
A large negative ratio indicates a weakening of technical provisions, the justification for which
should be investigated.
A large positive ratio indicates a strengthening of technical provisions. Reasons for such
strengthening might include the correction of errors, the deterioration of experience, or the
revision of previous assumptions to less optimistic levels.
6.10 Nominal net investment yield
The nominal net investment yield indicator is annual income of an insurer on its investment
portfolio, net of investment expenses, as a percentage of the average amount of invested
assets. The investment yield is calculated net of investment expenses but gross of tax, using
book values of invested assets. If the book values are not based on marking assets to market,
care should be taken when making comparisons with market rates of return.
Investment yield is calculated as net investment income earned divided by average cash and
invested assets, or 200 * [G / (A + B + C + D – E – F – G)], where:
A = total cash and invested assets, current year
B = total cash and invested assets, prior year
C = investment income due and accrued, current year
D = investment income due and accrued, prior year
E = borrowed money, current year
F = borrowed money, prior year
G = net investment income earned
The net investment income earned will have several components. These will be investment
income (such as interest and dividends), the contribution from realized gains or losses, and (in
the case of assets marked to market) the contribution from unrealized gains or losses. In a book
value accounting environment, the realization of investment gains adds to profit in the
accounting period that the assets are sold. In a market value environment, both realized and
unrealized gains come into the profit result. The result is reduced by investment expenses.
In either case, it is useful to determine how much of the investment yield has come from each
source, in order to examine the trends and consider the likely prospects for their contribution

Page 165
to the future investment yields of the insurer. Accordingly, it can also be useful to calculate the
rate of return on a net (of tax) basis and using market values, with the investment income
element defined to include or separate investment income and realized and unrealized gains, as
is relevant, and using total assets.
It is useful to calculate averages of this indicator over periods of five and ten years, to help
assess longer‐term performance of the insurer in managing its investments.
Low yields might be caused by large investments in bank deposits, speculative investments,
investments in related parties, investments in real estate for the insurer’s own use, significant
interest payments on borrowed money, or high investment expenses.
High yields might be caused by investments in high‐risk instruments or extraordinary dividend
payments from subsidiaries.
Benchmarks for supervisory concern will depend on the conditions in the investment markets
and the economy more generally. In general, insurers should be able to generate investment
yields higher than the rates paid by banks on deposits and higher than the rate of inflation,
even after investment expenses. Insurers that are unable to regularly generate investment
yields higher than the discount rates assumed when calculating their technical provisions could
suffer significant losses.
6.11 Real net investment yield
The real net investment yield is calculated by subtracting the inflation rate from the nominal
net investment yield. It provides the percentage of annual income on an investment portfolio,
net of both investment expenses and the inflation rate.
It is useful to calculate averages of this indicator over periods of five and ten years, to help
assess longer‐term performance of the insurer in managing its investments.
Benchmarks for supervisory concern will depend on the conditions in the investment markets
and the economy more generally. In general, insurers should be able to generate investment
yields higher than the rates paid by banks on deposits and higher than the rate of inflation,
even after investment expenses. This indicator shows the extent to which the net investment
yield exceeded the rate of inflation.

Page 166
6.12 Return on equity (ROE) [FSI]
Return on equity is calculated as the ratio of net income after tax to the average value of capital
over the same period. In calculating the ratio, care needs to be taken that the average
(weighted) capital is used in the calculation. This is particularly the case where there have been
capital movements during the year. Capital can be determined as total assets minus total
liabilities. It can also be useful to calculate an indicator using available capital determined in
accordance with the risk‐based capital adequacy requirement of the jurisdiction.
Return on equity is a profitability indicator that is intended to measure an insurer’s efficiency in
using its capital. The return on equity reflects the level of capital that the shareholders have
subscribed, and the return directed at them. As a result, profit is usually taken as net income
after tax.
The same indicator can be calculated for both life and non‐life insurers, and the results might
also be compared to the ratios of other financial institutions, such as banks, in the jurisdiction.
(Note: for banks, the IMF has specified the use of pre‐tax income.) A significant change in the
indicator for a particular insurer might indicate a significant change in its business model, which
would warrant further analysis and enquiry.
Both very low and very high returns on equity can be of supervisory concern. Very low returns
indicate an insurer’s inability to use its financial resources to generate reasonable profits. Very
high returns might indicate that an insurer’s profits are unsustainable or result from abuse of
market power, such as monopoly pricing. Thresholds for supervisory concern will depend on
the competitiveness of the insurance market. Thresholds can vary considerably, with lower
thresholds ranging from 0% to 20% and upper thresholds from 15% to as much as 50%.
6.13 Earnings per employee
This indicator is calculated as the ratio of the net income after tax to the number of employees.
The result is expressed in local currency units. The number of employees included in the
denominator should be appropriately matched to the earnings included in the numerator; for
example, if the earnings relate only to business within the local jurisdiction then only
employees whose activities relate to that business should be included.
This profitability indicator is a measure of an insurer’s efficiency in using its staff to generate
earnings, which is likely to be correlated with general management soundness. A low ratio
could flag potential problems in key areas, including the management of insurance and
investment risks and the management of expenses.

Page 167
The same indicator can be calculated for both life and non‐life insurers, and the results might
also be compared to the ratios of other financial institutions, such as banks, in the jurisdiction.
A significant change in the indicator for a particular insurer might indicate a significant change
in its business model, which would warrant further analysis and enquiry.
6.14 Return on assets (ROA) [FSI Life]
Return on assets is calculated as the ratio of net income after tax to the average value of total
assets over the same period. In calculating the ratio, care needs to be taken that the average
value of assets is used in the calculation. This is particularly the case where there have been
significant changes in the assets during the year.
This profitability indicator is a measure of an insurer’s efficiency in using its assets to generate
earnings. A low ratio could flag potential problems in key areas, including the management of
insurance and investment risks and the management of expenses.
The same indicator can be calculated for both life and non‐life insurers, and the results might
also be compared to the ratios of other financial institutions, such as banks, in the jurisdiction.
(Note: for banks, the IMF has specified the use of pre‐tax income.) A significant change in the
indicator for a particular insurer might indicate a significant change in its business model, which
would warrant further analysis and enquiry.
Both very low and very high returns on assets can be of supervisory concern. Very low returns
indicate an insurer’s inability to use its financial resources to generate reasonable profits. Very
high returns might indicate that an insurer’s profits are unsustainable or result from abuse of
market power, such as monopoly pricing. Thresholds for supervisory concern will depend on
the competitiveness of the insurance market. Thresholds can vary considerably, with lower
thresholds ranging from 0.5% to 4% and upper thresholds from 3% to as much as 12.5%.
6.15 Policies lapsed or surrendered / policies in force at beginning of the year
This indicator is calculated as the ratio of the number of policies lapsed or surrendered during a
year to the number of policies in force at the beginning of the year. There are many other ways
to calculate lapse rates, such as focusing on lapses of policies in their first one or two years or
calculating separate indicators for lapses and for surrenders. These indicators might also be
calculated based on premiums or amounts of insurance lapsed, if the necessary data is
available.
A policy lapses when it is forfeited by the policyholder without receiving any payment from the
insurer in respect of the premiums already paid to the company in respect of the period the

Page 168
policy was in force. It is different from a life insurance policy surrender, which the insurer treats
as a claim by the policyholder for which it pays the surrender value. In either case, the policy
will no longer be in force. (As an exception, some life insurance products allow for partial
surrenders, in which case the policy could continue in force at a lower level.)
Although there may be good reasons for some lapses, a lapse often means poor‐quality new
business was written. High lapse and surrender rates are a concern for the insurer because they
result in lower profits, as it will often be unable to fully recover the expenses, including
commission, it incurred in acquiring the policy. They also depress the growth of the insurer’s
premiums and assets.
High lapse rates are also of concern for the industry, because they indicate a negative public
attitude toward insurance, and for the supervisor, because they indicate a lack of proper
operational controls by the insurer.
6.16 Market value / book value
This indicator is calculated as the ratio of the total market value of an insurer’s shares to the
total book value of its shares. It is typically expressed as a ratio rather than as a percentage.
Market value is calculated by first multiplying current market price per share for each class of
shares by the number of such shares outstanding, then summing the results over all classes of
shares. It is relevant only for insurers whose shares are traded in the market. The book value of
the insurer is its net worth according to the financial statements.
This indicator is used by investors and analysts to help evaluate whether a company’s shares
are over‐ or under‐valued. An insurer whose prospects are viewed positively by the market will
tend to have a higher ratio than one whose prospects are viewed negatively. For example, if the
ratio is 2.0 then this indicates that the market believes the book value understates the value of
the insurer in light of its prospects for profitable growth. Conversely, if the ratio is less than 1.0
then this indicates that the market believes the insurer’s prospects are poor and even the book
value might deteriorate in the future. Changes in the ratio from period to period can signal
changes in the market’s assessment of an insurer’s prospects.
6.17 Price / earnings ratio
This indicator is calculated as the ratio of the total market value of an insurer’s shares to its
earnings. It is typically expressed as a ratio rather than as a percentage. Market value is
calculated by first multiplying current market price per share for each class of shares by the
number of such shares outstanding, then summing the results over all classes of shares. It is

Page 169
relevant only for insurers whose shares are traded in the market. The earnings of the insurer
are its earnings after tax, according to the financial statements.
This indicator is used by investors and analysts to help evaluate whether a company’s shares
are over‐ or under‐valued. An insurer whose prospects are viewed positively by the market will
tend to have a higher ratio than one whose prospects are viewed negatively. For example, if the
ratio for one insurer is 30.0 and that for another insurer in the same market is 10.0 then this
indicates that the market believes the prospects for profitable growth (and higher future
dividends and share prices) are much better for the first insurer than the second. Changes in
the ratio from period to period can signal changes in the market’s assessment of an insurer’s
prospects.
6.18 Price / gross written premium
This indicator is calculated as the ratio of the total market value of an insurer’s shares to gross
written premium. It is typically expressed as a ratio rather than as a percentage. Market value is
calculated by first multiplying current market price per share for each class of shares by the
number of such shares outstanding, then summing the results over all classes of shares. It is
relevant only for insurers whose shares are traded in the market.
This indicator is used by investors and analysts to help evaluate whether a company’s shares
are over‐ or under‐valued. An insurer whose prospects are viewed positively by the market will
tend to have a higher ratio than one whose prospects are viewed negatively. For example, if the
ratio for one insurer is 3.0 and that for another insurer in the same market is 1.0 then this
indicates that the market believes the prospects for profitable growth (and higher future
dividends and share prices) are much better for the first insurer than the second. This might be
because the first insurer is considered to be likely to achieve higher profit margins on its
premiums or more rapid premium growth (or both) than the second insurer. Changes in the
ratio from period to period can signal changes in the market’s assessment of an insurer’s
prospects.
7. Liquidity and ALM
7.01 Liquid assets / current liabilities
This indicator is calculated as the ratio of liquid assets to current liabilities.

Page 170
Assets that are considered liquid can vary by jurisdiction. Liquid assets should include only
those that the supervisor is particularly confident are and will remain liquid. They include cash,
demand deposits, and term deposits maturing in less than one year. Government securities are
also included, unless there are concerns about their liquidity. Some supervisors include
accounts receivable that have been outstanding for less than three months. Some supervisors
include common and preferred equities, if the markets in their jurisdiction are liquid.
Intermediaries’ balances deferred and not yet due is not a liquid asset.
Current liabilities are defined to include those liabilities that are already due or might become
due within the next year. They include accounts payable, overdrafts, and bank loans, except for
amounts payable after one year or more. Liabilities are adjusted to remove the amount of
liabilities equal to deferred intermediaries’ balances; since this is not a liquid asset, the
adjustment is made to remove the corresponding liability. Total insurance liabilities are reduced
by any liabilities that will not be payable within the next year, if data is available to enable them
to be identified. For example, such liabilities might include the portion of life insurance
technical provisions related to annuity payments due after one year or more.
This indicator is a measure of the insurer’s ability to meet short‐term obligations. It also
provides a rough indication of the possible implications for policyholders if liquidation becomes
necessary.
Low ratios are of supervisory concern. Thresholds for supervisory concern vary from ratios
below 100% to those below 150%. Too little liquidity might mean claims payments need to be
deferred.
However, too much liquidity might adversely affect investment returns. During an onsite
inspection, it may be appropriate to check the cashflow forecasting and liquidity management
practices of the insurer.
Analysis has shown that many insurers who become insolvent report decreasing liquidity ratios
in their final years. Therefore, it is important to consider the trend of this indicator, as well as
the current year result. Further analysis of an insurer with a low liquidity ratio should focus on
the adequacy of technical provisions and on proper valuation, mix, and liquidity of assets to
determine whether the insurer will be able to meet its obligations to policyholders.
7.02 Liquid assets / total liabilities
This indicator is calculated as the ratio of liquid assets to total liabilities.
Assets that are considered liquid can vary by jurisdiction. Liquid assets should include only
those that the supervisor is particularly confident are and will remain liquid. They include cash,
demand deposits, and term deposits maturing in less than one year. Government securities are
Page 171
also included, unless there are concerns about their liquidity. Some supervisors include
accounts receivable that have been outstanding for less than three months. Some supervisors
include common and preferred equities, if the markets in their jurisdiction are liquid.
Intermediaries’ balances deferred and not yet due is not a liquid asset.
Total liabilities are defined to include technical provisions and other liabilities of the insurer.
This indicator is a measure of the insurer’s ability to meet its obligations, including those that
are not expected to be payable in the short‐term.
Low ratios are of supervisory concern. Thresholds for supervisory concern are typically ratios
below 95% for non‐life insurers and below 60% for life insurers. Too little liquidity might mean
claims payments need to be deferred.
However, too much liquidity might adversely affect investment returns. During an onsite
inspection, it may be appropriate to check the cashflow forecasting and liquidity management
practices of the insurer.
Analysis has shown that many insurers who become insolvent report decreasing liquidity ratios
in their final years. Therefore, it is important to consider the trend of this indicator, as well as
the current year result. Further analysis of an insurer with a low liquidity ratio should focus on
the adequacy of technical provisions and on proper valuation, mix, and liquidity of assets to
determine whether the insurer will be able to meet its obligations to policyholders.
7.03 Liquid assets / total assets
This indicator is calculated as the ratio of liquid assets to total assets.
Assets that are considered liquid can vary by jurisdiction. Liquid assets should include only
those that the supervisor is particularly confident are and will remain liquid. They include cash,
demand deposits, and term deposits maturing in less than one year. Government securities are
also included, unless there are concerns about their liquidity. Some supervisors include
accounts receivable that have been outstanding for less than three months. Some supervisors
include common and preferred equities, if the markets in their jurisdiction are liquid.
Intermediaries’ balances deferred and not yet due is not a liquid asset.
Total assets are defined to include cash, investments, and all other assets of the insurer.
This indicator provides a measure of the extent to which the assets of an insurer are liquid and
available to meet obligations to policyholders that might come due.
Low ratios are of supervisory concern. Thresholds for supervisory concern vary, for example,
ratios below 10% to 30%. Too little liquidity might mean claims payments need to be deferred.

Page 172
However, too much liquidity might adversely affect investment returns. For example, in some
jurisdictions, bank deposits are a large share of assets, but such assets are unlikely to generate
high investment returns. During an onsite inspection, it may be appropriate to check the
cashflow forecasting and liquidity management practices of the insurer.
7.04 Liquid liabilities / total liabilities
This indicator is calculated as the ratio of liquid liabilities to total liabilities.
Liquid liabilities are defined to include those liabilities that are already due or might become
due within the next year. They include accounts payable, overdrafts, and bank loans, except for
amounts payable after one year or more. They do not include the amount of liabilities equal to
deferred intermediaries’ balances. Liquid liabilities are reduced by any liabilities that will not be
payable within the next year, if data is available to enable them to be identified. For example,
such liabilities might include the portion of life insurance technical provisions related to annuity
payments due after one year or more.
Total liabilities are defined to include technical provisions and other liabilities of the insurer.
This indicator provides a measure of the extent to which the liabilities of an insurer are already
due or might become due in the near future.
Another measure of the timing of future liabilities is their duration, which can be compared to
the duration of the assets; see indicator 7.06.
7.05 Net open foreign exchange position / capital
This indicator is calculated as the ratio of the net open foreign exchange position to capital. The
net open foreign exchange position is calculated by first converting the values of all assets and
liabilities denominated in foreign currencies to local currency units, then subtracting the total of
the converted liabilities from the total of the converted assets. Capital can be determined as
total assets minus total liabilities. It is also useful to calculate the indicator separately for each
foreign currency in which an insurer has a material level of assets or liabilities.
This indicator provides a measure of an insurer’s exposure to foreign exchange risks. It uses any
mismatch of foreign currency asset and liability positions to assess the vulnerability of the
insurer to exchange rate movements.

Page 173
In many of the jurisdictions where insurers may issue policies denominated in a foreign
currency, they are required to have assets denominated in a particular foreign currency not less
than the policyholder liabilities in that same currency.
If some of the foreign currency exposures relate to the same counterparty, the nature of the
exposures should be examined to consider whether netting is appropriate in assessing the
foreign exchange risk. For example, if an insurer has a claim recoverable from a foreign
reinsurer, but the claim is disputed, it might not be appropriate to net the receivable against
reinsurance premiums payable to that reinsurer.
Some supervisors would consider a ratio of 100% or more to be of potential concern. However,
the volatilities of the relevant foreign exchange rates should be considered when assessing the
level of concern.
A simplified example shows the usefulness of this indicator. Consider an insurer that has assets
denominated in United States dollars (USD) of 1,000 and liabilities in USD of 2,000. Assume that
the current exchange rate is 1 USD to 10 local currency units (CU). The net open position is thus
negative 1,000 USD or negative 10,000 CU. Further assume that the insurer’s capital is 20,000
CU, which means that the indicator is negative 50%. If the local currency depreciates by 30%
versus the USD, the insurer’s capital will decrease by 15% (50% times 30%). This would
adversely affect the insurer’s ability to meet capital adequacy requirements.
7.06 Duration of assets / duration of liabilities
This indicator is calculated as the ratio of the duration of an insurer’s assets to the duration of
its liabilities. In some jurisdictions, insurers are required to report the durations of their assets
and liabilities in the regulatory returns. In some other jurisdictions, insurers are required to
report projected asset and liability cash flows in the return forms, which the supervisor can use
to calculate (or approximate) the durations.
Duration can be measured in various ways. One measurement is modified duration, which is
defined as the percentage change in the value of a series of cash flows for a 100‐basis point
change in interest rates. The formula assumes that the cash flows do not change as interest
rates change, which might not be the case.
𝑀𝑜𝑑𝑖𝑓𝑖𝑒𝑑 𝐷𝑢𝑟𝑎𝑡𝑖𝑜𝑛 ∑ 𝑡 𝐶
1 𝑖
∑ 𝐶1 𝑖
1
1 𝑖𝑘
Page 174
where:
t = time at which a cash flow occurs
n = number of cash flows
Ct = cash flow at time t
i = annual interest rate
k = frequency of cash flows in a year; for example, k = 2 for semi‐annual bond coupons
This indicator measures the exposure of an insurer to losses arising from movements in interest
rates. If the ratio is less than 100%, an insurer is likely to be negatively affected by a decrease in
interest rates. If the ratio is greater than 100%, an insurer is likely to be negatively affected by
an increase in interest rates.
If the indicator is less than 100% and interest rates increase, the value of fixed income assets
will decline at a lower rate than the rate at which the value of liabilities will decline. The insurer
is therefore more likely to be positively affected by an increase in interest rates, at least in the
short‐term. Conversely, the insurer is more likely to be negatively affected by a decrease in
interest rates. For example, assume that an insurer has assets of 1,000 in local currency units
(CU), with a duration of 5 years, and liabilities of 800 CU, with a duration of 10 years. The
indicator is thus 50%. If interest rates decrease by 1%, the value of assets will increase by 5%, or
50 CU, while the value of liabilities will increase by 10%, or 80 CU. The insurer’s capital will,
therefore, decrease by 30 CU.
If the indicator is greater than 100% and interest rates increase, the value of fixed income
assets will decline at a more rapid rate than the rate at which the value of liabilities will decline.
The insurer is therefore more likely to be negatively affected by an increase in interest rates, at
least in the short‐term. Conversely, the insurer is more likely to be positively affected by a
decrease in interest rates.
It is important when reviewing the distribution of an insurer’s assets to consider the possibility
of cash outflow, as determined by the nature of the insurer’s business, and the ability of the
insurer to withstand such a cash demand without undue deterioration of the asset portfolio.
The distribution of bank deposits and bonds by maturity and cash flow projections of the
insurer are helpful in reviewing the insurer’s short‐term liquidity and longer‐term matching of
expected asset and liability cash flows.
Life insurers often issue long‐term policies with savings features and, in many cases, long‐term
interest rate guarantees. In such cases, it is particularly important that they invest for the long
term, so that they can meet their obligations to policyholders and reduce their exposure to
market risk related to changes in interest rates. Many life insurers attempt to match the
duration of their assets to the duration of their liabilities. Such matching is often done at the
level of each internally segmented fund or statutory fund. Accordingly, in addition to calculating

Page 175
this indicator at the company level, it can also be useful to do so by fund. Even if there is little
duration mismatch at the company level, significant mismatches at the fund level could be of
supervisory concern.
7.07 Highest quality liquid assets / claims
This indicator is calculated as the ratio of the highest quality liquid assets to claims incurred.
Highest quality liquid assets should include only those that the supervisor is particularly
confident are and will remain liquid. They include cash, demand deposits, and term deposits
maturing in less than one year. Highly rated government and corporate fixed‐income securities
should also be included, unless there are concerns regarding their liquidity. Some supervisors
include only AAA‐rated fixed‐income securities, but others might include those with slightly
lower ratings. Accounts receivable, common and preferred equities, and intermediaries’
balances deferred and not yet due should not be included.
This indicator is a measure of the extent to which an insurer has assets readily available to pay
its claims.
Low ratios are of supervisory concern. Too little liquidity might mean claims payments need to
be deferred.
However, too much liquidity, particularly if it is achieved by investing in very low risk securities,
might adversely affect investment returns. During an onsite inspection, it may be appropriate
to check the cashflow forecasting and liquidity management practices of the insurer.
8. Subsidiaries and Related Parties
8.01 Group debtors / total assets
This indicator is calculated as the ratio of the total of amounts owed to the insurer by other
companies in the group of which it is a member to total assets.
This indicator is a measure of the extent to which assets are tied up in subsidiaries and other
companies in the group of which an insurer is a member. Collection of such debts might be
difficult to enforce because of the relationship. If the ratio is high, an insurer may experience
liquidity or solvency problems.
Some supervisors would consider a ratio of 5% or more to be of concern.

Page 176
Supervisors should determine whether the intra‐group exposure of an insurer is consistent with
protecting the interests of policyholders. In particular, consider the nature of these amounts,
whether they are supported by contracts, and the risk implications. Transactions with
companies in the group can distort the financial position of an insurer. Problems may include
double‐ or multiple‐gearing of capital, opaque risk transfers between companies or excessive
concentration of insurance risk. Membership of a group generally alters, often considerably, an
insurer’s risk profile, its financial position, the role of its management, and its business strategy.
8.02 Related party receivables / total assets
This indicator is calculated as the ratio of the total of amounts receivable from related parties
to total assets. Related parties might include subsidiaries, other companies in a group of which
an insurer is a member, and directors and senior managers of the insurer (or members of their
families).
This indicator is a measure of the extent to which assets are tied up in receivables from related
parties. Collection of such debts might be difficult to enforce because of the relationship. If the
ratio is high, an insurer may experience liquidity or solvency problems.
Some supervisors would consider a ratio of 5% or more to be of concern.
Supervisors should determine whether the amounts due from related parties are consistent
with protecting the interests of policyholders. In particular, consider the nature of these
amounts, whether they are supported by contracts, and the risk implications.
In many jurisdictions, insurers are often a part of an insurance group, a financial group, or a
conglomerate. In such cases, group exposures might account for a large share of related party
exposures. Transactions with companies in the group can distort the financial position of an
insurer. Problems may include double‐ or multiple‐gearing of capital, opaque risk transfers
between companies or excessive concentration of underwriting to one client. Membership of a
group generally alters, often considerably, an insurer’s risk profile, its financial position, the role
of its management, and its business strategy.
8.03 Due to related parties / total assets
This indicator is calculated as the ratio of the total of amounts due to related parties to total
assets.

Page 177
This indicator is a measure of the extent to which an insurer is trading with related parties and
the claim that such parties have against the assets of the insurer. A high ratio might indicate
that the insurer is having difficulty in paying its debts when they fall due.
Some supervisors would consider a ratio of 10% or more to be of concern.
8.04 (Investments in related parties + related party receivables) / total assets
This indicator is calculated as the ratio of the total of amounts invested in or receivable from
related parties to total assets. Related parties might include subsidiaries, other companies in a
group of which an insurer is a member, and directors and senior managers of the insurer (or
members of their families).
This indicator is a measure of the extent to which assets are tied up in investments in related
parties and receivables from related parties. Investments in related parties might not be liquid
or available to meet policyholder obligations. Collection of related party receivables might be
difficult to enforce because of the relationship. If the ratio is high, an insurer may experience
liquidity or solvency problems, or a low investment yield.
Some supervisors would consider a ratio of 5% or more to be of concern. However, in
jurisdictions where many insurers are members of groups and investment alternatives are
limited, supervisors might be prepared to accept higher ratios (for example, 10%).
Supervisors should determine whether the amounts invested in or due from related parties are
consistent with protecting the interests of policyholders. In particular, consider the nature of
these amounts, whether they are supported by contracts, and the risk implications. For
example, large investments in related insurers might increase the overall risk to which an
insurer is subject.
In many jurisdictions, insurers are often a part of an insurance group, a financial group, or a
conglomerate. In such cases, group exposures might account for a large share of related party
exposures. Transactions with companies in the group can distort the financial position of an
insurer. Problems may include double‐ or multiple‐gearing of capital, opaque risk transfers
between companies or excessive concentration of underwriting to one client. Membership of a
group generally alters, often considerably, an insurer’s risk profile, its financial position, the role
of its management, and its business strategy.

Page 178
8.05 (Investments by related parties + due to related parties) / total assets
This indicator is calculated as the ratio of the total of amounts invested in the insurer by related
parties and amounts due to related parties to total assets. Related parties might include
subsidiaries, other companies in a group of which an insurer is a member, and directors and
senior managers of the insurer (or members of their families).
This indicator is a measure of the extent to which an insurer is trading with related parties and
the current or potential claim that such parties have against the assets of the insurer. A high
ratio might indicate that the insurer is having difficulty in paying its debts when they fall due. If
the ratio is high, the insurer might face pressure from related parties to make repayments or to
pay interest or dividends on the debts and amounts such parties have invested, which could
compromise its ability to meet obligations to policyholders.
Some supervisors would consider a ratio of 10% or more to be of concern.
8.06 (Revenues from related parties + expenditures to related parties) / (total revenues + total
expenditures)
This indicator is calculated as the ratio of the total of an insurer’s revenues from and
expenditures to related parties to its total revenues from and expenditures to all parties.
This indicator is a measure of the extent to which an insurer’s business activities relate to
transactions with related parties. The purpose of combining income and expense items is to
minimize the potential distortion of transactions with related parties on preferential or
detrimental terms and conditions.
Some supervisors would consider a ratio of 20% or more to be of concern.
In many jurisdictions, insurers are often a part of an insurance group, a financial group, or a
conglomerate. In such cases, intra‐group transactions might account for a large share of related
party transactions. Transactions with companies in the group can distort the financial position
of an insurer. Problems may include double‐ or multiple‐gearing of capital, opaque risk
transfers between companies or excessive concentration of underwriting to one client.
Membership of a group generally alters, often considerably, an insurer’s risk profile, its financial
position, the role of its management, and its business strategy.

Page 179
8.07 Group (gross written premium + paid claims) / total (gross written premium + paid
claims)
This indicator is calculated as the ratio of an insurer’s gross written premium from and claims
paid to group companies, compared to its total gross written premium from and claims paid to
all parties.
This indicator is a measure of the extent to which an insurer’s insurance activities relate to
business written on other companies in its group. The purpose of combining income and
expense items is to minimize the potential distortion of underwriting insurance on group
companies on preferential or detrimental terms and conditions.
Some supervisors would consider a ratio of 20% or more to be of concern.
In many jurisdictions, insurers are often a part of an insurance group, a financial group, or a
conglomerate. Insurance business with companies in the group can distort the financial position
of an insurer. Problems may include opaque risk transfers between companies or excessive
concentration of underwriting to one client. Membership of a group generally alters, often
considerably, an insurer’s risk profile, its financial position, the role of its management, and its
business strategy.
8.08 Related party (gross written premium + paid claims) / total (gross written premium + paid
claims)
This indicator is calculated as the ratio of an insurer’s gross written premium from and claims
paid to related parties, compared to its total gross written premium from and claims paid to all
parties.
This indicator is a measure of the extent to which an insurer’s insurance activities relate to
business written on related parties. The purpose of combining income and expense items is to
minimize the potential distortion of underwriting insurance on related parties on preferential
or detrimental terms and conditions.
Some supervisors would consider a ratio of 20% or more to be of concern.
In many jurisdictions, insurers are often a part of an insurance group, a financial group, or a
conglomerate. In such cases, intra‐group insurance business might account for a large share of
related party insurance business. Insurance business with related parties can distort the
financial position of an insurer. Problems may include opaque risk transfers or excessive
concentration of underwriting to one client. Membership of a group generally alters, often
considerably, an insurer’s risk profile, its financial position, the role of its management, and its
business strategy.

Page 180
9. Industry‐wide
9.01 Assets / total financial system assets [FSI]
This indicator is calculated as the ratio of the total assets of insurers to the total assets of the
financial system. The latter is the total of financial assets owned by deposit‐taking institutions,
other financial corporations, nonfinancial corporations, households, the government, and the
central bank. Many jurisdictions report data on total financial system assets to the IMF, which is
available at www.data.imf.org .
This indicator provides a measure of the relative importance of insurers within the domestic
financial system.
9.02 Assets / gross domestic product [FSI]
This indicator is calculated as the ratio of the total assets of insurers to gross domestic product.
It measures the importance of insurers compared to the size of the economy. Many
jurisdictions report data on gross domestic product to the IMF, which is available at
www.data.imf.org .
This indicator provides a measure of the relative importance of insurers compared to the size of
the economy.
9.03 Penetration
Penetration is calculated as the ratio of gross written premiums in the insurance market to
gross domestic product. Insurance penetration is usually calculated separately for the life and
non‐life sectors. Comparative information for many countries and regions is published annually
by Swiss Re Sigma, which is available at https://www.swissre.com/institute/research/sigma‐
research.html . In the Sigma statistics, health insurance is treated as non‐life insurance. Many
jurisdictions report data on gross domestic product to the IMF, which is available at
www.data.imf.org .
This indicator provides a measure of market development. In general, the higher the insurance
penetration ratio, the more developed the market.

Page 181
Differences in the value of this indicator between the most and least developed markets are
striking. The values range from less than 1% for some African and Asian countries to more than
10% (South Africa, Switzerland, and the United Kingdom, among other countries).
Penetration ratios can also differ because of market characteristics other than simply the level
of development. For example, in jurisdictions where pensions are funded through life
insurance, penetration may be higher than in other jurisdictions with similar levels of market
development and wealth where this is not the case. The relative penetration of life insurance
and non‐life insurance can also differ significantly, reflecting cultural preferences and the
existence of mandatory coverages, such as motor third‐party liability insurance, among other
things.
9.04 Density
Density is calculated as the ratio of gross written premiums in the insurance market to
population. It represents the annual per capita amount spent on purchasing insurance,
expressed in local currency units. Insurance density is usually calculated separately for the life
and non‐life sectors.
This indicator provides a measure of market development and growth. In general, the higher
the insurance density, the more developed the market.
Its value, however, does not purely reflect the levels of income and wealth but can also be
impacted by local jurisdictional and market conditions. For example, in jurisdictions where
pensions are funded through life insurance, density may be higher than in other jurisdictions
with similar levels of market development and wealth where this is not the case. The relative
density of life insurance and non‐life insurance can also differ significantly, reflecting cultural
preferences and the existence of mandatory coverages, such as motor third‐party liability
insurance, among other things.
9.05 Density ‐ in USD
This indicator is calculated as the ratio of gross written premiums in the insurance market,
converted to United States dollars (USD), to population. It represents the annual per capita
amount spent on purchasing insurance, expressed in USD. Insurance density is usually
calculated separately for the life and non‐life sectors. Comparative information for many
countries and regions is published annually by Swiss Re Sigma, which is available at
https://www.swissre.com/institute/research/sigma‐research.html . In the Sigma statistics,
health insurance is treated as non‐life insurance.

Page 182
This indicator enables a relatively reliable and fair comparison of individual markets. Its
calculation needs only broadly available information (insurance market premium volume, the
exchange rate between local currency and USD, and numbers of inhabitants); therefore, it is
easily accessible. In general, the higher the insurance density, the more developed the market.
Its value, however, does not purely reflect the levels of income and wealth but can also be
impacted by local jurisdictional and market conditions. For example, in jurisdictions where
pensions are funded through life insurance, density may be higher than in other jurisdictions
with similar levels of market development and wealth where this is not the case. The relative
density of life insurance and non‐life insurance can also differ significantly, reflecting cultural
preferences and the existence of mandatory coverages, such as motor third‐party liability
insurance, among other things. Also, comparisons from year to year should take account of any
significant changes in the exchange rate between local currency and USD.
9.06 Concentration ratio
The concentration ratio is calculated as the percentage of market share owned by the largest X
companies, where X is a specified number of companies. The number chosen is often 4 or 8, but
it might be smaller if there are few insurers operating in a jurisdiction or larger if there are
many insurers. Market shares can be based on gross premium written or assets, with the
former being more commonly used for non‐life insurers and the latter for life insurers. The
concentration ratio is usually calculated separately for the life and non‐life sectors. In
jurisdictions where insurers are members of groups, it can be useful to examine the
concentration ratio on a group‐wide basis (adding the market shares of the insurers in each
group).
The concentration ratio provides a simple indicator of the extent of competition in the market.
The lower the concentration ratio, the more widespread–and usually, the better–the
competition in the market. The extent of competition might be considered using four
categories, defined as:
Perfect competition – very low concentration ratio
Monopolistic competition – concentration ratio below 40% for the 4‐firm
measurement
Oligopoly – concentration ratio above 40% for the 4‐firm measurement
Monopoly – near to 100% concentration ratio for the 4‐firm measurement.
It can also be useful to analyze the underlying market share information over time. This enables
supervisors to identify insurers that are expanding or contracting. Reasons for significant
changes should be investigated and an assessment made of whether the insurer can deal
effectively with the growth or loss in business.

Page 183
9.07 Herfindahl‐Hirschman Index
The Herfindahl‐Hirschman Index (HHI) is calculated by first calculating the market share of each
insurer, expressed as a percentage. Then each of the market shares is squared, to place more
weight on the larger insurers, and the results are summed. If there are n insurers in the market,
the HHI can be expressed as:
𝐻𝐻𝐼 𝑠 𝑠 ⋯ 𝑠
where si = market share of the ith insurer, expressed as a percentage.
For example, consider a jurisdiction in which there are 10 life insurers, with respective market
shares of 35%, 25%, 10%, 10%, 5%, 5%, 5%, 2%, 2%, and 1%. Squaring the respective market
shares gives results of 1225, 625, 100, 100, 25, 25, 25, 4, 4, and 1, the sum of which is 2134. In
the same jurisdiction there are 10 non‐life insurers, with respective market shares of 20%, 20%,
20%, 9%, 9%, 7%, 7%, 3%, 3%, and 2%. Squaring the respective market shares gives results of
400, 400, 400, 81, 81, 49, 49, 9, 9, and 4, the sum of which is 1482. The life insurance sector is
significantly more concentrated than the non‐life insurance sector.
Market shares can be based on gross premium written or assets, with the former being more
commonly used for non‐life insurers and the latter for life insurers. The HHI is usually calculated
separately for the life and non‐life sectors. In jurisdictions where insurers are members of
groups, it can be useful to examine the HHI on a group‐wide basis (adding the market shares of
the insurers in each group before squaring the result). The HHI might also be examined with
respect to the market share by class of business or even by product.
The HHI provides a more complete picture of market concentration than does the
concentration ratio. Unlike the concentration ratio, the HHI will change if there is a shift in
market share among the larger insurers.
The HHI can be used to determine whether mergers are equitable to society and thus also
influence supervisory decisions. As the market concentration increases, competition and
efficiency may decrease, and the opportunities for collusion and monopoly increase. In the
United States, increases of over 100 points generally provoke scrutiny, although it may vary
case to case. The Department of Justice considers markets with indices below 1500 to be
unconcentrated, between 1500 and 2500 to be moderately concentrated, and above 2500 to
be concentrated. Applying these benchmarks to the example given above, the HHI of 2134
would indicate a moderately concentrated life insurance sector and the HHI of 1482 an
unconcentrated non‐life insurance sector.
Analysis of the HHI for the insurance sectors of many countries has shown that concentration is
typically higher for the life insurance sector (a “natural level” of 2,250) than for the non‐life

Page 184
insurance sector (1,525) (see the World Bank Policy Research Paper 4578, Insurers: Too Many,
Too Few, or “Just Right”?, 2008, by Craig Thorburn
http://documents.worldbank.org/curated/en/566861468137732315/pdf/wps4578.pdf).
9.08 Assets lost during the previous 5 years / average assets
This indicator is calculated as the ratio of the total losses to consumers arising from the
insolvency of insurers or intermediaries, fraud, theft or government appropriation during the
previous five years to the average assets of insurers during that same five‐year period. Data on
losses might be compiled from variety of sources, including the records of the supervisor, the
records of policyholder protection schemes, court documents, estimates prepared by insurers
or industry associations, and reports in the media.
This indicator enables analysis of the overall security of the insurance sector for consumers. It
also provides an indication of the extent to which insurance costs might be increased by the
need for insurers to recover losses arising from fraud. Its progress over time should be
examined and comparisons might also be made with the assets lost in other financial sectors in
the jurisdiction.
9.09 Inclusion
Inclusion is calculated as the ratio of the number of people who have one or more insurance
policies to population. The number of people who have one or more insurance policies might
be determined through surveys. It might also be determined using the detailed records of the
insurers, although care would have to be taken to avoid double‐counting individuals who have
more than one insurance policy. The inclusion ratio might be calculated separately for the life
and non‐life sectors.
This indicator provides a measure of market development and accessibility. In general, the
higher the inclusion ratio, the more developed the market and the more readily insurance
services can be accessed by consumers.
The inclusion ratio might also be compared with the percentage of people who have bank
accounts or who are using formal financial services of any type.