Overall-Mouth Disinfection by Photodynamic Therapy Using ...
Upload
independentCategory
view
4download
0
�������� ����� ��
Estimation of the overall kinetic parameters of enzyme inactivation using anisoconversional method
D. Oancea, Alexandrina Stuparu, Madalina Nita, Mihaela Puiu, AdinaRaducan
PII: S0301-4622(08)00176-2DOI: doi: 10.1016/j.bpc.2008.09.003Reference: BIOCHE 5155
To appear in: Biophysical Chemistry
Received date: 17 August 2008Revised date: 2 September 2008Accepted date: 3 September 2008
Please cite this article as: D. Oancea, Alexandrina Stuparu, Madalina Nita, Mi-haela Puiu, Adina Raducan, Estimation of the overall kinetic parameters of en-zyme inactivation using an isoconversional method, Biophysical Chemistry (2008), doi:10.1016/j.bpc.2008.09.003
This is a PDF file of an unedited manuscript that has been accepted for publication.As a service to our customers we are providing this early version of the manuscript.The manuscript will undergo copyediting, typesetting, and review of the resulting proofbefore it is published in its final form. Please note that during the production processerrors may be discovered which could affect the content, and all legal disclaimers thatapply to the journal pertain.
peer
-005
0171
8, v
ersi
on 1
- 12
Jul
201
0Author manuscript, published in "Biophysical Chemistry 138, 1-2 (2008) 50"
DOI : 10.1016/j.bpc.2008.09.003
ACC
EPTE
D M
ANU
SCR
IPT
ACCEPTED MANUSCRIPT
Adina Raducan
Department of Physical Chemistry, Faculty of Chemistry, University of Bucharest
Bd. Elisabeta 4-12, 030018, Bucharest, Romania
Tel/Fax: 0040213275116
Mobile: 0040722624585
Email: [email protected]
peer
-005
0171
8, v
ersi
on 1
- 12
Jul
201
0
ACC
EPTE
D M
ANU
SCR
IPT
ACCEPTED MANUSCRIPT
2
Estimation of the overall kinetic parameters of enzyme inactivation using an
isoconversional method
D. Oancea, Alexandrina Stuparu, Madalina Nita, Mihaela Puiu, Adina Raducana
Department of Physical Chemistry, Faculty of Chemistry, University of Bucharest
Bd. Elisabeta 4-12, 030018, Bucharest, Romania
ABSTRACT
An isoconversional method is proposed in order to calculate the kinetic parameters of enzyme
inactivation. The method provides an efficient and low-cost procedure to describe both operational and thermal
inactivation. Unlike the ordinary kinetic assays performed at constant enzyme concentration and at various
substrate concentrations, the isoconversional method requires several extended kinetic curves for constant initial
substrate concentration and different enzyme concentrations. The procedure was tested and validated using
simulated data obtained for several kinetic models frequently discussed in the literature. After the validation, the
isoconversional method was used for the investigation of the thermoinactivation of urease during urea hydrolysis
in self buffered medium and the operational inactivation (destructive oxidation by excess peroxide) of catalase at
high concentration of hydrogen peroxide. The results showed that the isoconversional method gives good results
of global inactivation constant for both simple and more complex models.
Keywords: enzyme inactivation; kinetic models; isoconversional method
INTRODUCTION Enzyme stability is one of the limiting factor in most bioprocesses, biocatalyst stabilization being then a central
issue of biotechnology [1]. Beside the production of intrinsically stable biocatalysts, enzyme stabilization
involves studies regarding strategies for operational stabilization and mathematical modelling of the biocatalyst
inactivation during operation. The application of enzymes to synthesis of desired products, in analysis, or in
peer
-005
0171
8, v
ersi
on 1
- 12
Jul
201
0
ACC
EPTE
D M
ANU
SCR
IPT
ACCEPTED MANUSCRIPT
3
manufacturing of sensors requires stable, well-characterized activity. Being relatively fragile structures, enzymes
display a short catalytic lifetime due to their inactivation by side reactions or at increased temperatures [2]. The
enzyme inactivation is most commonly due to structural rearrangements or modification of reactive groups [1].
Less widely recognized is the instability of enzymes in vivo, where they are continuously broken down and
reused. The study of inactivation kinetics of the enzyme systems in vitro represents a useful tool in
understanding the dynamic behaviour of in vivo enzyme systems.
There are plenty examples in the literature of enzyme inactivation in different experimental conditions: various
substrates, temperature, pH and ionic strength [3]. Thus, there was a need to develop efficient and low-cost
methods to set off the enzyme inactivation during a technological process.
There are few methods to describe enzyme inactivation; some of them are qualitative, like the Selwyn test [4],
which uses the extended progress curves of the product concentration vs. the product of initial enzyme
concentration and time. Other methods are based either on the presumption that the kinetics obeys the Michaelis-
Menten model [5], the inactivation parameters being obtained from the values of Michaelis constant, or by using
specific[2, 6] or phenomenological models [7] that leads to certain definite kinetic equations.
In this paper, an isoconversional method is described and applied to the thermal/operational inactivation of
enzymes. Isoconversional methods used in chemical kinetics imply that, for a definite number of kinetic runs, the
measurements are performed at the same concentration of reactants. If the initial substrate concentration is kept
constant during all runs, the isoconversional restriction becomes simpler: the measurements are performed at the
same unreacted substrate concentration or at the same product concentration. The procedure ensures a constant
composition of the reaction mixture leading to a substantial simplification of the kinetic equation. The method is
used to estimate the overall kinetic inactivation constant for several literature models, emphasizing on the
experimental conditions required for the best estimates. After validation for several models, the method is also
applied for two real systems: the thermal inactivation of urease in the hydrolysis of urea and the suicide
inactivation of catalase by the substrate in the reaction of decomposition of the hydrogen peroxide.
peer
-005
0171
8, v
ersi
on 1
- 12
Jul
201
0

ACC
EPTE
D M
ANU
SCR
IPT
ACCEPTED MANUSCRIPT
4
Catalase is a component of the antioxidative defence system acting in human and animal tissues against
hydrogen peroxide, which is a potentially deleterious reactive species that destroys (oxidizes) cellular molecules.
The mechanism of the catalytic decomposition of H2O2 is not entirely elucidated so far. Several compounds,
including its natural substrate, H2O2, at concentrations exceeding 0.1 M. [8], reduce the activity of catalase. In
the catalase - H2O2 system the activity of catalase is strongly dependent on the initial concentration of the
substrate [S]0. Thus for [S]0 up to 0.1 M, H2O2 undergoes decomposition till total conversion. For concentration
[S]0 exceeding 0.1 M the conversions are not total, proving an inactivation effect (irreversible inhibition) of the
enzyme by H2O2, the effect increasing with the concentration of substrate. [9].
Urease catalyzes the hydrolysis of urea, the final step of organic nitrogen mineralization. Many pathologies
are associated with the activity of ureolytic bacteria, and the efficiency of soil nitrogen fertilization with urea is
severely decreased by urease activity. Therefore, the development of urease inhibitors would lead to a reduction
of environmental pollution, to an enhanced efficiency of nitrogen uptake by plants [10], and to improved
therapeutic strategies for treatment of infections due to ureolytic bacteria [11]. The thermostability of ureases of
different origin either in free or immobilized forms has often been a subject of investigation. There are several
studies for jack been urease where the inactivation curve was measured at high temperatures [12, 13].
EXPERIMENTAL
Materials
Catalase from bovine liver (EC 1.11.1.6, 312000U/mL) was purchased from Flucka (Switzerland) and sword
bean urease (E.C. 3.5.1.5, lyophilized 5 U/mg), from Merck (Darmstadt, Germany). All other chemicals were of
analytical grade and were products of Merck - the hydrogen peroxide and Chimopar (Bucharest, Romania) -
urea.
Catalase assay
The solution of H2O2 with concentration 0.5 M in
distilled water was prepared from a bulk solution and the concentration was determined by titration with
permanganate. The experiments were carried out for catalase concentrations ranging within 1.8·10-7 M and
peer
-005
0171
8, v
ersi
on 1
- 12
Jul
201
0

ACC
EPTE
D M
ANU
SCR
IPT
ACCEPTED MANUSCRIPT
5
7.2·10-7 M. The decomposition of the H2O2 in presence of catalase was studied using a gas-volumetric
displacement method, in isobaric-isothermal conditions (p0=1 atm; T=298 K), by measuring the volume of
oxygen evolved in the reaction.
Urease assay
The hydrolysis of urea in the presence of sword bean urease was followed in a self-buffered system. The
experiments were carried out in a batch reactor, at initial concentration of urea [S]0=4·10-2 M and several initial
concentrations of urease (in protein) ranging within 1·10-7 M and 7.5·10-7 M. For each kinetic run, the
conductance (C) of solution was monitored until its change became negligible; the products concentrations were
calculated according to a calibration curve obtained from a stock solution by several dilutions. The stock solution
was obtained through total hydrolysis of an urea solution of known concentration in a sealed vessel. The thermal
inactivation of urease was studied at 343K.
RESULTS AND DISCUSSION
Theoretical considerations of isoconversional method:
As long as the enzyme concentration is much lower than the substrate concentration, a quasi-steady state is
attained and the time evolution of the system can be described by a single reaction rate. Consequently, an
analytical solution can be obtained for the overall reaction rate. The corresponding kinetic equation, based on the
quasi-steady state or quasi-equilibrium assumptions, coupled with the enzyme conservation equation takes the
general form:
( )pH,J,]M[,T],P[,]S[f]E[dt
]P[d000 ⋅= (1)
where [E]0 is the total initial concentration of present active enzyme, [S]0 is the initial substrate concentration,
[M]0 concentration of any modulator present, [P] is the concentration of product at time t, T is the temperature
and J the ionic strength. Provided that in a series of assays [S]0, T and [M]0 are kept constant and other
variables like J and pH reach the same level, the rate equation can be written in the simpler form:
peer
-005
0171
8, v
ersi
on 1
- 12
Jul
201
0
ACC
EPTE
D M
ANU
SCR
IPT
ACCEPTED MANUSCRIPT
6
( )]P[f]E[dt
]P[d0 ⋅=
(2)
This product form in the right-hand term suggests the use of an isoconversional procedure to detect the
changes of enzyme concentration for a chosen conversion and various initial enzyme concentrations, when f([P])
remains constant.. Such “model free” methods have been extensively used for numerous kinetic analysis of
reactions involving solids, where the reaction rate is also given by a product between a temperature and a
conversion factor [14,15,16,17,18,19,20]. The proposed procedure belongs to a group of kinetic methods, like
“constant velocity plot” [21] and “competition plot” [22] where the judicious restrictions imposed to kinetic
measurements result in a safer analysis of experimental data.
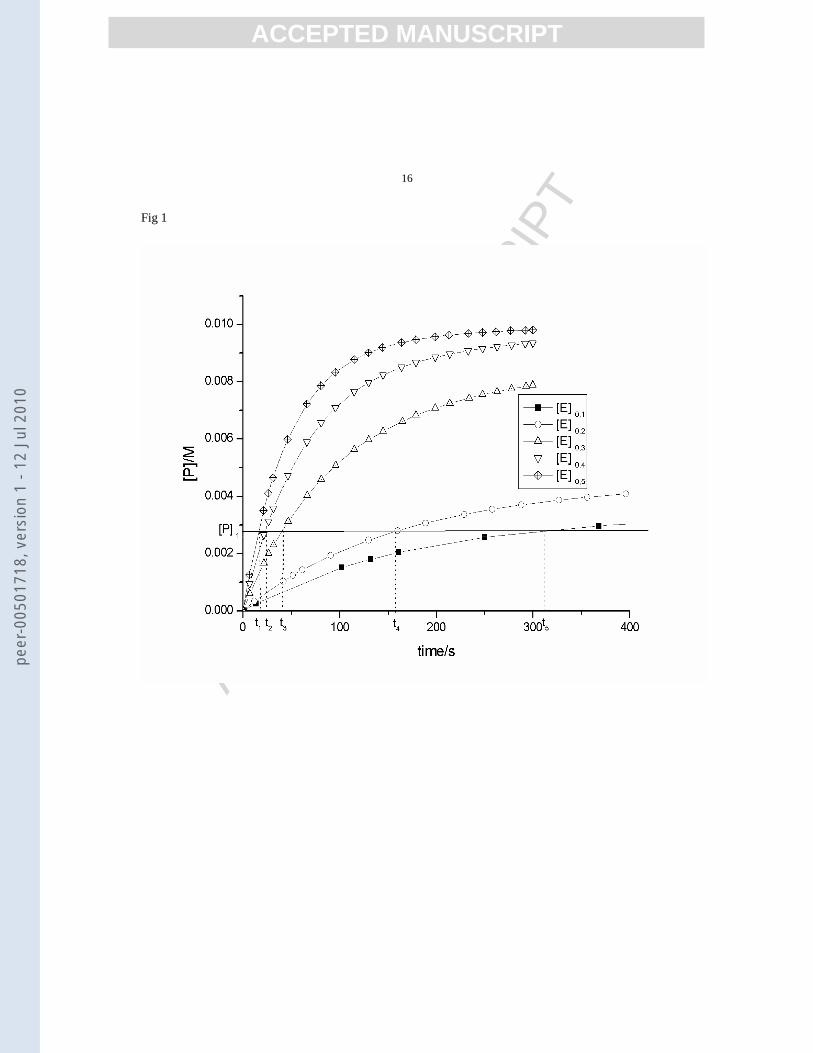
The time values (t1, t2, t3 etc.) corresponding to a settled conversion of substrate (a certain concentration of
reaction product [P]) can be estimated from the kinetic curves [P] = f(t) at different enzyme initial
concentrations [E]0 as shown in figure 1:
Figure 1.
The first derivative with respect to time in each point of product concentration ( )11 dt]P[d , ( )21 dt]P[d
etc. can be estimated by numerical methods in the points t1, t2, etc., after fitting a proper function, selected for the
best fit, on the extended kinetic curves.
Since [P]1 is constant due to the isoconversional conditions, results that f([P]1)) = constant and equation (2)
can be written as:
*i,01
i
1 ]E[)]P([fdt
]P[d⋅=⎟
⎠⎞
⎜⎝⎛
(3)
where *,0][ iE is the total enzyme concentration for run i, active at time ti. For a first order inactivation it is given
by:
peer
-005
0171
8, v
ersi
on 1
- 12
Jul
201
0
ACC
EPTE
D M
ANU
SCR
IPT
ACCEPTED MANUSCRIPT
7
tki,0
*i,0
ine]E[]E[ −⋅=
(4)
The first derivatives ( )i1 dt]P[d for a certain value of [P]1 depend then on the corresponding
isoconversional times ti according to the following equation:
iin tki,01
i
1 e]E[)]P([fdt
]P[d ⋅−⋅⋅=⎟⎠⎞
⎜⎝⎛
(5)
From equation (5), the overall inactivation constant kin can be calculated either from several pairs of i and j:
( )ji
i,0j,0*
j,0*
i,0ijin tt
]E[]E[]E[]E[lnk
−⋅
=
(6)
where *j,0
*i,0 ]E[]E[ can be calculated as ( ) ( )j1i1 dt]P[ddt]P[d , or from the linear regression
( ) iin1i,0i
1 tk]P[fln]E[1
dt]P[dln ⋅−=⎟
⎟⎠
⎞⎜⎜⎝
⎛⎟⎠⎞
⎜⎝⎛
(7)
, when the slope is equal to the overall inactivation constant.
For more than three experiments, the last procedure is more suitable, since the estimated slope includes also the
experimental errors [3].
It is obvious that the same procedure can be applied for other values of [P]. If the inactivation does not obey a
first order kinetic, the results for the inactivation constants at different values of [P] should be different. Small
differences between low and high conversions can be atributed to changes in composition during reaction.
Since the first order inactivation is more frequently encountered [2], it was tested for simulated data, including
both thermal and operational inactivation. A similar procedure will be hereafter applied to different orders of
peer
-005
0171
8, v
ersi
on 1
- 12
Jul
201
0
ACC
EPTE
D M
ANU
SCR
IPT
ACCEPTED MANUSCRIPT
8
inactivation. The kinetic models used for testing this method are based on the simple Michaelis-Menten model,
with different steps of inactivation. The models were chosen to see if the isoconversional method with first order
inactivation can be used to obtain a global inactivation parameter for more complex kinetic models.
Kinetic simulation of data
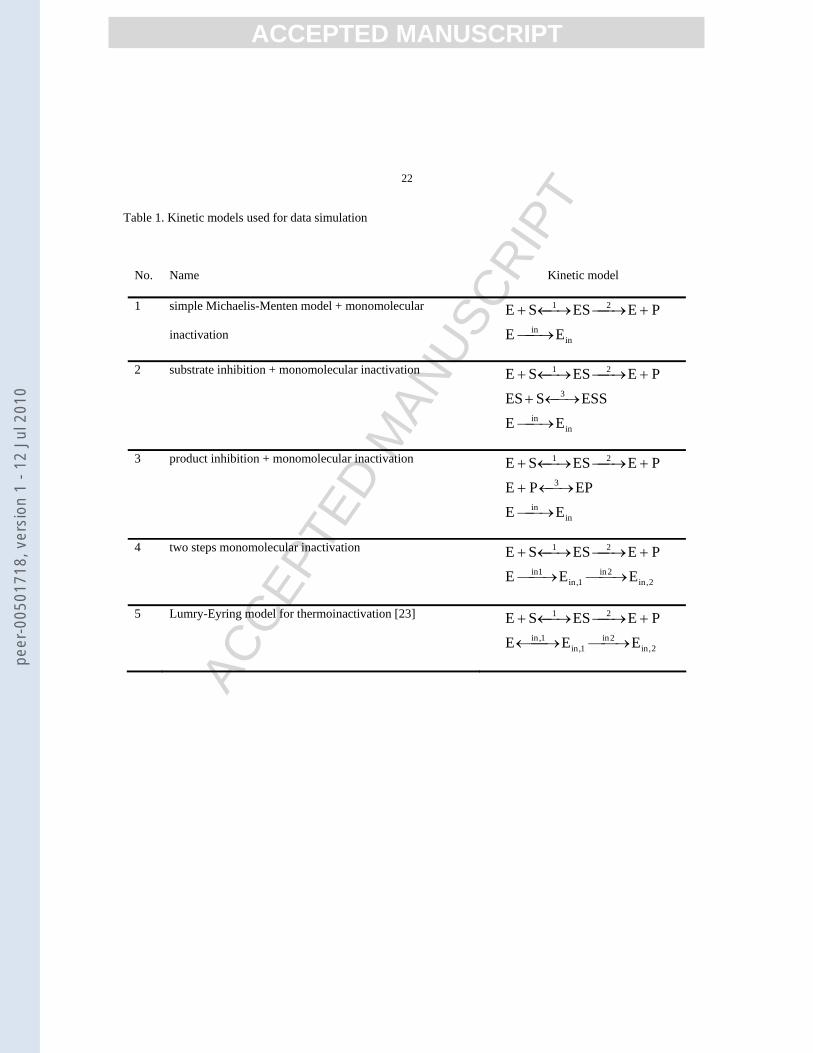
Several kinetic models, based on simple Michaelis – Menten model, were used; the models are presented in
Table 1.
Model number 1 is the “reference model” since it includes only one step for the enzyme inactivation. This model
was used for verifying the isoconversional methods and for determining the best experimental conditions for
estimating the inactivation constant. Models 2 and 3 include also a step for inhibition by substrate or products;
they were used to investigate if the calculated inactivation constant is the same as in model 1, or if the inhibition
step gives a false result. Models 4 and 5 are more difficult models and were used in order to see if the
isoconversional method can be applied for the estimation of a global parameter for inactivation.
To simulate the extended progress curves, the differential kinetic equation was derived for each model and
several sets of parameters were chosen. The equation was solved numerically obtaining the time variation of
product concentration. The simulated data, having negligible errors, were provided with random errors
corresponding to a Gaussian distribution and an imposed standard deviation [24]. The final results were used as
real extended curves. The kinetic models outlined in Table 1 were used to simulate the experimental data,
starting from the following parameters: [S]0 = 0.01 M, [E]0 varying from 10-7 to 9.10-7 M, KM = 0.025M, K3 = 0.1
M, kin = 0.005 s-1. For models 4 and 5 the values of kin were fixed around 0.005 s-1. The kinetic simulations were
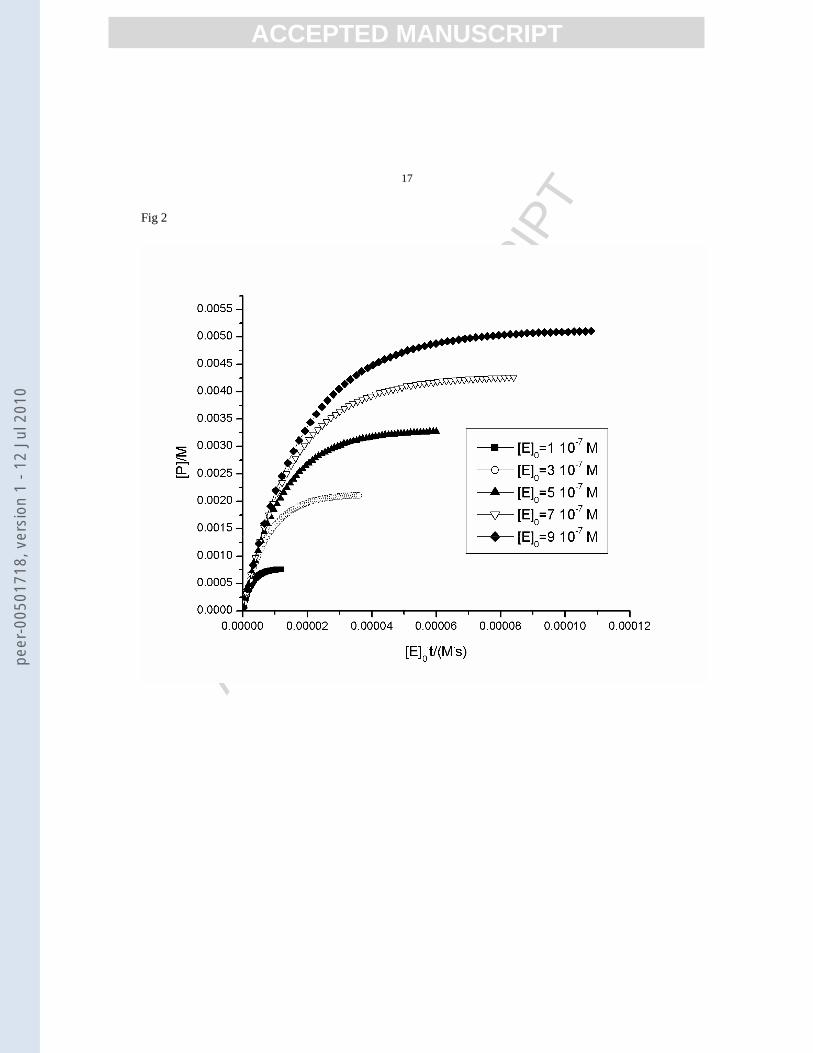
performed with KINTECUS [25]. To confirm the existence of an inactivation process a qualitative Selwyn test is
necessary as a first step. For one of the presented models, this is illustrated in figure 2:
Figure2.
Application of the isoconversional method for calculating the overall inactivation parameters:
In order to estimate the inactivation constant, first model 1 was taken into account, since it is the most simple
model which includes an inactivation step. From the simulated plots [P] = f(t) at constant substrate concentration
and 5 different enzyme concentrations, the time values for several conversions and the corresponding derivatives
peer
-005
0171
8, v
ersi
on 1
- 12
Jul
201
0
ACC
EPTE
D M
ANU
SCR
IPT
ACCEPTED MANUSCRIPT
9
( )idtPd 1][ were estimated by fitting a Chebyshev polynomial of 20th degree and evaluating the roots at certain
points and their first derivatives. The obtained values were used to estimate the inactivation constant from the
)t(f]E[1
dt]P[dln i
i,0i
1 =⎟⎟⎠
⎞⎜⎜⎝
⎛⎟⎠⎞
⎜⎝⎛
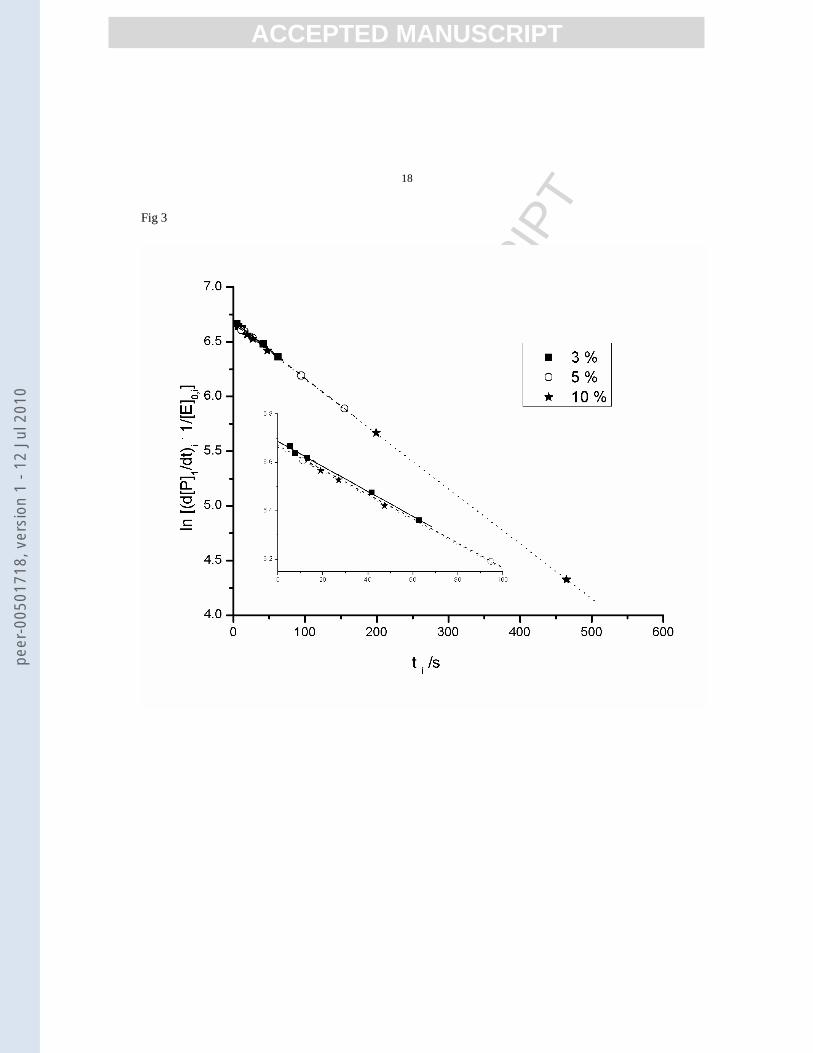
plot. The results for 3 different conversions are shown in figure 3.
Figure 3.
As it can be seen in figure 3, for all conversions the
plots are linear and the points are superposed; this is an indication of the fact that the isoconnversional method is
very precise, since the correlation coefficients are very good and the slope values are very close to the used
inactivation constant in the simulation.
The method was verified for different initial substrate concentrations and initial enzyme ranges of
concentrations. The estimated values for inactivation constant are presented in Table 2, together with the
standard deviations and errors, calculated as std.dev/estimate.100.
Table 2
The best estimates for inactivation constant are obtained for substrate concentrations closed to Michaelis
constant (0.025M in this kinetic model) and for conversions that exceed 5%. Since the absolute errors are
superimposed over the simulated kinetic curves, the estimated parameters have larger errors for lower
conversions.
Studies regarding the influence of experimental errors showed that the errors in inactivation constants do not
exceed 14%, even when the experimental errors were 20%. The range of initial enzyme concentrations used does
not influence the value or precision of the estimates. However the extension of enzyme concentration range over
a decade has some experimental limitations: the time required for a selected conversion is very long for lower
enzyme concentrations or becomes very short for higher concentrations.
The same procedure was applied in order to estimate an overall inactivation constant for more complex
models (2 to 4 from Table 1). The time values for the selected conversion and the derivatives ( )i1 dt]P[d were
peer
-005
0171
8, v
ersi
on 1
- 12
Jul
201
0
ACC
EPTE
D M
ANU
SCR
IPT
ACCEPTED MANUSCRIPT
10
estimated from the plots [P] = f(t) for each kinetic model from table 1; the rate constants of inactivation were
calculated as the slope of the )t(f]E[1
dt]P[dln i
i,0i
1 =⎟⎟⎠
⎞⎜⎜⎝
⎛⎟⎠⎞
⎜⎝⎛ line, assuming that inactivation follows a first order
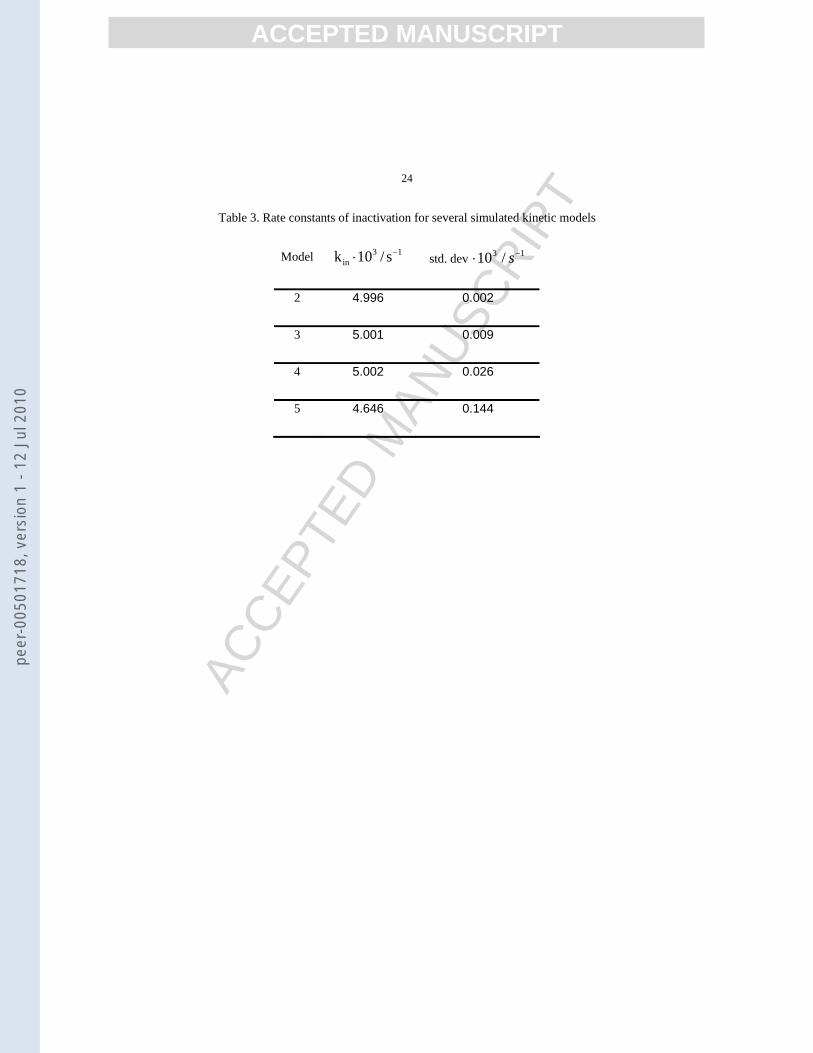
kinetics. The results, with their standard deviations are given in Table 3.
Table 3.
The results showed that the value obtained for inactivation constant for models 2 and 3, that includes also an
inhibition step is the same as the one used in simulation, so the isoconversional method does not give false
results due to inhibition by substrate or products. The values obtained for model 4 and 5, which includes two
steps of inactivation are also very good, indicating that this method can be applied for estimation of the rate
constant for the first inactivation step. The proposed method, based on the monitoring of the active enzyme, is
not able to describe the subsequent transformations of the enzyme.
The results proved that the isoconversional method is suitable for calculating the inactivation parameters,
since the estimated rate constant was the same, within the limits of experimental errors, as the used one; the rate
constant can be estimated with a reasonable precision even in the case of more complex mechanisms involving
reversible inhibition steps or several steps of inactivation.
Application of isoconversional method to real systems
The isoconversional method was applied for two different types of inactivation: thermal inactivation of
urease and substrate inactivation of catalase. The experimental conditions were chosen in such a way that the
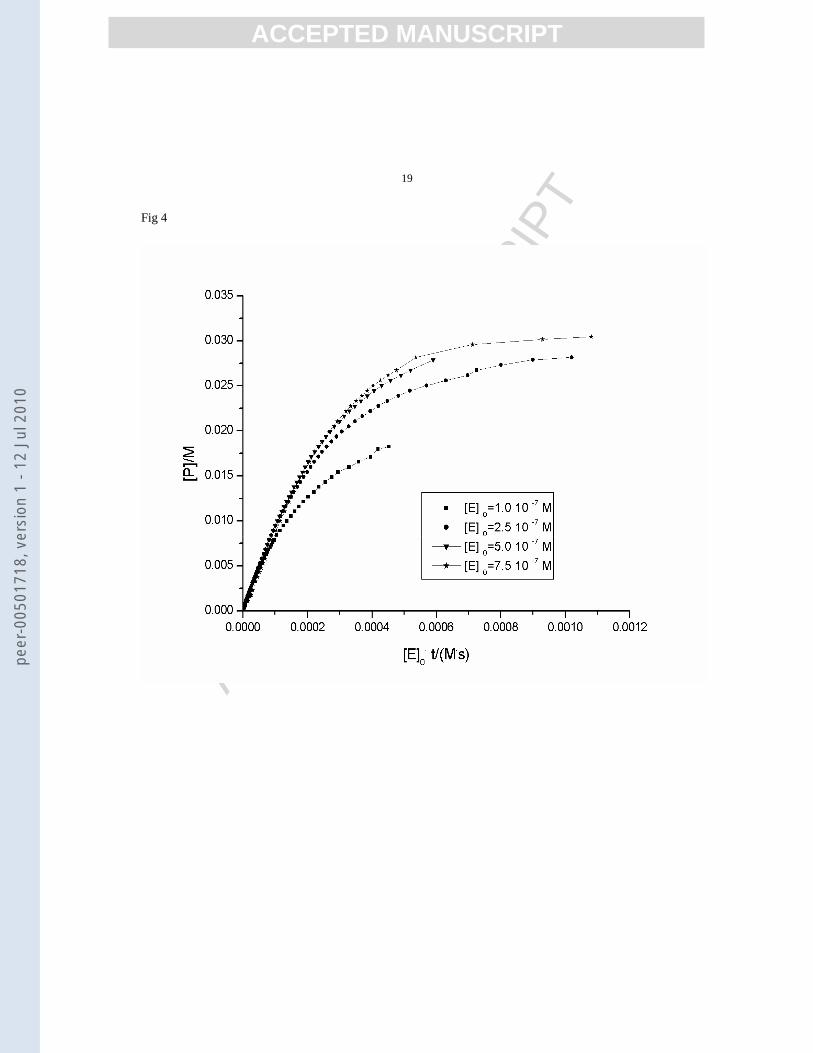
enzymes were significantly inactivated in. At 343K for urease catalyzed urea hydrolysis as well as for the
decompostion of a 0.5M hydrogen peroxide in the presence of catalase, the typical pattern offered by the Selwyn
tests (figs. 4 and 5) indicated the occurrence of enzyme inactivation.
Figure 4.
Figure 5.
peer
-005
0171
8, v
ersi
on 1
- 12
Jul
201
0
ACC
EPTE
D M
ANU
SCR
IPT
ACCEPTED MANUSCRIPT
11
The plots [P] = f(t) for urease and 2OV = f(t)) for catalase were used for the estimation of the inactivation
constant as described before. The conversions used were 10%, where the results are more precise.
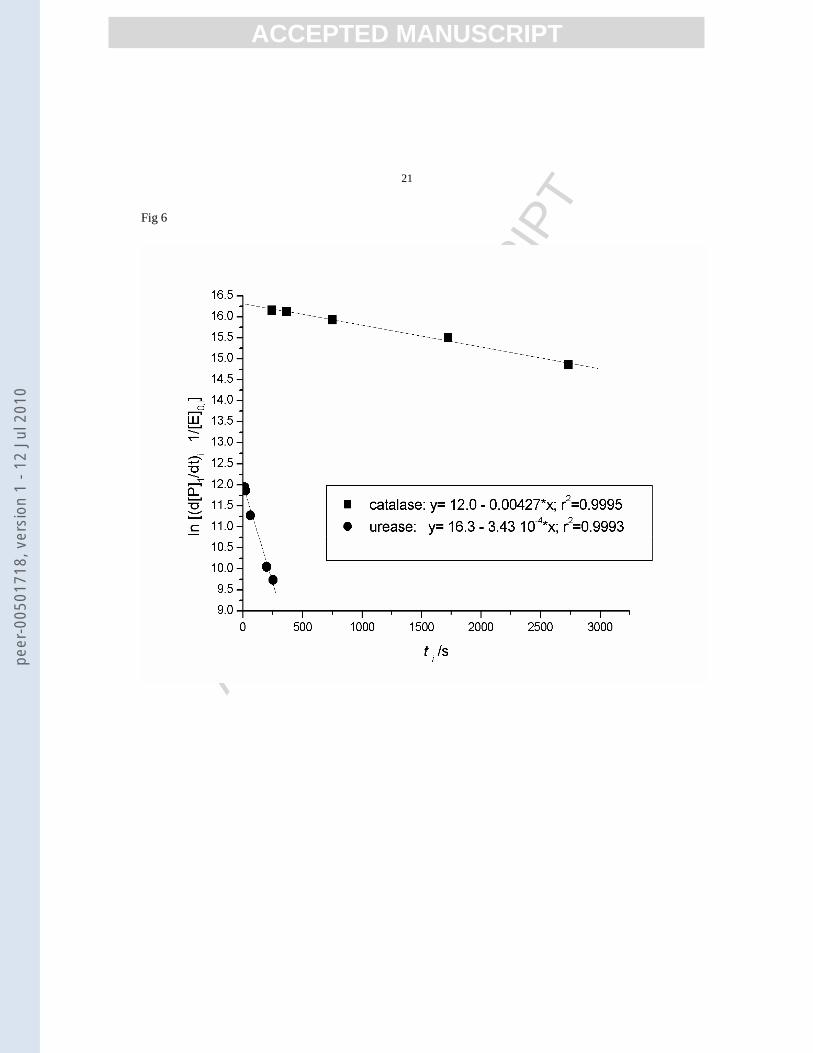
The values of rate constants of inactivation, estimated by linear regression on equation (7) are:
- 13in s10)12.027.4(k −−⋅±= for catalase at [S]
= 0.5M and T = 298K
- 14in s10)14.043.3(k −−⋅±= for urease at [S] =
0.04M and T = 343K
Figure 6.
The results indicate that both inactivations (thermal inactivation of urease and substrate inactivation of catalase)
can be rationalized as first order processes, the plots corresponding to equation (7) being linear, as illustrated in
figure 6. The values of the rate constants were in the range with the literature data: 7.10-3 s-1 for catalase in
buffered media [9] , and 5.10-4 s-1 for urease in buffered media [13]. The differences can be attributed to the
experimental conditions.
As compared to other methods used to analyse the
enzyme inactivation, the isoconversional method has several benefits: is a “model free” method (do not need to
adopt a specific kinetic model), can be used for different conversions allowing the identification of inactivation
dependence on medium composition and can be extended for inactivation processes of higher orders.
CONCLUSIONS
The analysis of the extended progress curves for detecting the enzyme inactivation can be made qualitatively
by using the Selwyn test and quantitatively by using the proposed isoconversional method. The overall constants
of first order inactivation can be estimated using the extended kinetic curves at different initial enzyme
concentrations. The accuracy of the results obtained on the simulated data indicated that the method can be
successfully used for estimating the overall inactivation constant without the assumption of a certain model for
enzyme inactivation.
peer
-005
0171
8, v
ersi
on 1
- 12
Jul
201
0
ACC
EPTE
D M
ANU
SCR
IPT
ACCEPTED MANUSCRIPT
12
The method was also applied to the thermoinactivation of urease in the hydrolysis of urea and to substrate
inactivation of catalase in the decomposition of hydrogen peroxide. The results were in good agreement with
literature data.
ACKNOWLEDGMENTS
The authors wish to acknowledge financial support from CNCSIS-ANCS Romania, Exploratory Research
Program 2008.
REFERENCES
1. S.Yoshioka, K.Izutsu, Y.Aso and Y.Takeda, Inactivation kinetics of enzyme pharmaceuticals in aqueous
solution, Pharm. Res. 8 (1991) 480-484.
2. S.Ajit, Enzyme deactivation, Biotech. Adv. 6 (1988) 349-446.
3. A.Cornish-Bowden, Detection of errors of interpretation in experiments in enzyme kinetics, Methods 24
(2001) 181-190.
4. M.J.Selwyn, A simple test for inactivation of an enzyme during assay, Biochim. Biophys. Acta, 105
(1965) 193-195.
5. S.Schnell and S.M.Hanson, A test for measuring the effects of enzyme inactivation, Biophys. Chem. 125
(2007) 269-274.
6. P.Vrabel, M.Polakovic, V.Stefuca and V.Bales, Analysis of mechanism and kinetics of thermal
inactivation of enzymes: evaluation of multitemperature data applied to inactivation of yeast invertase,
Enz. Microb. Technol. 20 (1997) 346-354.
7. C.Aymard and A.Belarbi, Kinetics of thermal deactivation of enzymes: a simple three parameters
phenomenological model can describe the decay of enzyme activity, irrespectively of the mechanism,
Enz. Microb. Technol. 27 (2000) 612–618.
peer
-005
0171
8, v
ersi
on 1
- 12
Jul
201
0

ACC
EPTE
D M
ANU
SCR
IPT
ACCEPTED MANUSCRIPT
13
8. M.V.Potapovich, A.N.Eryomin and D.I.Metelitza, Ultrasonic and thermal inactivation of catalases from
bovine liver, the methylotrophic yeast Pichia pastoris and the fungus Penicillium piceum, Appl.
Biochem. Microbiol. 41 (2005) 529–537.
9. O.M.Lardinois, M.M.Mestdagh and P.G.Rouxhet, Reversible inhibition and irreversible inactivation of
catalase in presence of hydrogen peroxide, Biochim. Biophys. Acta 1295 (1996) 222-238.
10. F.Sannino and L.Gianfreda, Pesticide influence on soil enzymatic activities, Chemosphere 45 (2001)
417-425.
11. A.Radomska, S.Glab and R.Koncki, Spectrophotometric bioanalytical flow-injection system for control
of hemodialysis treatment, Analyst 126 (2001) 1564–1567.
12. V.Illeova, M.Polakovic, V.Stefuca, P.Acai and M.Juma, Experimental modelling of thermal inactivation
of urease, J. Biotechnol. 105 (2003) 235-243.
13. F.Kara, G.Demirel and H.Tumturk, Immobilization of urease by using chitosan–alginate and
poly(acrylamide-co-acrylic acid)/j-carrageenan supports, Bioprocess. Biosyst. Eng. 29 (2006) 207–211.
14. H.Friedman, Kinetics of thermal degradation of char-forming plastics from thermogravimetry.
Application to a phenolic plastic, J. Polym. Sci. 6 (1964) 183–195.
15. T.Ozawa, New method of analysing thermogravimetric data, Bull. Chem. Soc. Japan 38 (1965) 1881-
1886.
16. J.H.Flynn and L.A.Wall, A quick direct method for the determination of activation energy from
thermogravimetric data, J. Polym. Sci. 4 (1966) 323-328.
17. H.E.Kissinger, Reaction kinetics in differential thermal analysis, Anal. Chem. 29 (1957) 1702–1706.
18. S.Vyazovkin and C.A.Wight, Model-free and model-fitting approaches to kinetic analysis of isothermal
and nonisothermal data, Termochim. Acta 340-341 (1999) 53-68.
19. S.Vyazovkin, L.Vincent and N.Sbirrazzuoli, Thermal denaturation of collagen analyzed by
isoconversional method, Macromol.Biosci. 7 (2007) 1181-1186.
peer
-005
0171
8, v
ersi
on 1
- 12
Jul
201
0

ACC
EPTE
D M
ANU
SCR
IPT
ACCEPTED MANUSCRIPT
14
20. F.Rodante, S.Vecchio and M.Tomasetti, Kinetic analysis of thermal decomposition of penicillin sodium
salts: model-fitting and model-free methods, J.Pharm.Biomed.Anal. 29 (2002) 1031-1043.
21. E. A. Whitehead, in: Dynamics of Biochemical Systems, ed. J. Ricard and A. Cornish-Bowden, Subunit
interactions and enzyme kinetic: the linkage approach, vol. 81 (Penum, New York, 1984) p. 45-64.
22. C.Chevillard, M.L.Cardenas and A.Cornish-Bowden, The competition plot: a simple test of whether two
reactions occur at the same active site, Biochem. J. 289 (1993) 599–604.
23. R.Lumry and H.Eyring, Conformational Chages of Proteins, J. Phys. Chem. 58 (1954) 110-120.
24. M.D.Johnston Jr. Computational Chemistry, An Emphasis on Practical Claculations (Elsevier,
Amsterdam, 1988).
25. J.Ianni, KINTECUS, Windows Version 3.1, 2003, http://www.kintecus.addr.com/.
peer
-005
0171
8, v
ersi
on 1
- 12
Jul
201
0
ACC
EPTE
D M
ANU
SCR
IPT
ACCEPTED MANUSCRIPT
15
LIST OF FIGURES
Figure 1. Estimation of isoconversional times for various initial enzyme concentration
( 5,04,03,02,01,0 ][][][][][ EEEEE <<<< )
Figure2. Selwyn test of inactivation for the model 1(simple model with one inactivation step)
Figure 3. Results for linear fit of equation (7) on model 1 for several substrate conversions (3%:
9985.0;00515.068.6 2 =⋅−= rxy ; 6%: 9998.0;00503.066.6 2 =⋅−= rxy ; 10%: 9999.0;00502.066.6 2 =⋅−= rxy )
Figure 4. Selwyn plots of products concentration versus (t·[E]0) for urea 0.04 M hydrolysis in the presence of
different initial concentrations of urease at 343K
Figure 5. Selwyn plots of O2 versus (t·[E]0) for H2O2, 0.5 M, decomposition in the presence of different initial
concentrations of catalase at 298 K
Figure 6. Results of linear regression on equation (7) for inactivation of catalase and urease
peer
-005
0171
8, v
ersi
on 1
- 12
Jul
201
0
ACC
EPTE
D M
ANU
SCR
IPT
ACCEPTED MANUSCRIPT
16
Fig 1
peer
-005
0171
8, v
ersi
on 1
- 12
Jul
201
0
ACC
EPTE
D M
ANU
SCR
IPT
ACCEPTED MANUSCRIPT
17
Fig 2
peer
-005
0171
8, v
ersi
on 1
- 12
Jul
201
0
ACC
EPTE
D M
ANU
SCR
IPT
ACCEPTED MANUSCRIPT
18
Fig 3
peer
-005
0171
8, v
ersi
on 1
- 12
Jul
201
0
ACC
EPTE
D M
ANU
SCR
IPT
ACCEPTED MANUSCRIPT
19
Fig 4
peer
-005
0171
8, v
ersi
on 1
- 12
Jul
201
0

ACC
EPTE
D M
ANU
SCR
IPT
ACCEPTED MANUSCRIPT
20
Fig 5
peer
-005
0171
8, v
ersi
on 1
- 12
Jul
201
0
ACC
EPTE
D M
ANU
SCR
IPT
ACCEPTED MANUSCRIPT
21
Fig 6
peer
-005
0171
8, v
ersi
on 1
- 12
Jul
201
0
ACC
EPTE
D M
ANU
SCR
IPT
ACCEPTED MANUSCRIPT
22
Table 1. Kinetic models used for data simulation
No. Name Kinetic model
1 simple Michaelis-Menten model + monomolecular
inactivation inin
21
EEPEESSE
⎯→⎯
+⎯→⎯⎯→←+
2 substrate inhibition + monomolecular inactivation
inin
3
21
EEESSSES
PEESSE
⎯→⎯
⎯→←+
+⎯→⎯⎯→←+
3 product inhibition + monomolecular inactivation
inin
3
21
EEEPPE
PEESSE
⎯→⎯
⎯→←+
+⎯→⎯⎯→←+
4 two steps monomolecular inactivation
2,in2in
1,in1in
21
EEEPEESSE
⎯→⎯⎯→⎯
+⎯→⎯⎯→←+
5 Lumry-Eyring model for thermoinactivation [23]
2,in2in
1,in1,in
21
EEEPEESSE
⎯→⎯⎯⎯→←
+⎯→⎯⎯→←+
peer
-005
0171
8, v
ersi
on 1
- 12
Jul
201
0

ACC
EPTE
D M
ANU
SCR
IPT
ACCEPTED MANUSCRIPT
23
Table 2. Results of the inactivation constant for refference model at different initial substrate concentrations
and conversions
[S]0/M Conversion % 13in s/10k −⋅ std. dev 510⋅ 1/ −s error %
3 5.07 5.39 1.06
6 5.05 1.74 0.34 0.005
10 4.92 1.60 0.32
3 4.76 19.8 4.15
6 5.00 4.07 0.81 0.01
10 5.00 3.16 0.63
3 5.02 4.41 0.86
6 4.99 4.47 0.89 0.02
10 5.02 1.01 0.20
3 5.15 16.3 3.17
6 5.02 4.26 0.84 0.1
10 5.02 1.32 0.26
peer
-005
0171
8, v
ersi
on 1
- 12
Jul
201
0
ACC
EPTE
D M
ANU
SCR
IPT
ACCEPTED MANUSCRIPT
24
Table 3. Rate constants of inactivation for several simulated kinetic models
Model 13in s/10k −⋅ std. dev 310⋅ 1/ −s
2 4.996 0.002
3 5.001 0.009
4 5.002 0.026
5 4.646 0.144
peer
-005
0171
8, v
ersi
on 1
- 12
Jul
201
0
Copyright © 2022 FDOKUMEN