Estimation of crustal Q β in the NW Himalaya using teleseismic broadband SH waveforms of the 8...
16
Acta Geophysica vol. 58, no. 4, pp. 645-660 DOI: 10.2478/s11600-009-0065-y ________________________________________________ © 2009 Institute of Geophysics, Polish Academy of Sciences Estimation of Crustal Q β in the NW Himalaya using Teleseismic Broadband SH Waveforms of the 8 October 2005 South Asian Earthquake Sushil KUMAR Wadia Institute of Himalaya Geology, Dehra Dun, India e-mail: [email protected] Abstract The average value of the intrinsic shear wave quality factor, Q β , for the 15 km of the upper crust in the NW Himalaya is estimated. Thirty- two teleseismic broadband SH and sSH waveforms of 8 October 2005 South Asian earthquake (Mw = 7.6), from sixteen Global Seismographic Network stations of the National Earthquake Information Center network have been used. The selected windows of the direct and depth phases have been Fourier transformed and smoothed using the Hamming and Tuckey technique. Ratio of the smoothed spectra of depth and direct phases are obtained in the frequency range 0.2-1.5 Hz. A straight line is fitted in the least-square sense to the spectral ratio versus frequency. The value of Q β is estimated from the slope of the line. The frequency inde- pendent average value of Q β is estimated to be 218±56. Key words: seismic hazard, shear wave analysis, intrinsic attenuation, NW Himalaya, 8 October 2005 South Asian earthquake. 1. INTRODUCTION Attenuation properties of the medium are important in studying the earth- quake size and drop of the ground motion with distance, which helps in seismic hazard mitigation. Kumar, D. (2005) estimated frequency indepen-
-
Upload
independent -
Category
Documents
-
view
2 -
download
0
Transcript of Estimation of crustal Q β in the NW Himalaya using teleseismic broadband SH waveforms of the 8...

Acta Geophysica vol. 58, no. 4, pp. 645-660
DOI: 10.2478/s11600-009-0065-y
________________________________________________ © 2009 Institute of Geophysics, Polish Academy of Sciences
Estimation of Crustal Qβ in the NW Himalaya using Teleseismic Broadband SH Waveforms of the 8 October 2005 South Asian Earthquake
Sushil KUMAR
Wadia Institute of Himalaya Geology, Dehra Dun, India e-mail: [email protected]
A b s t r a c t
The average value of the intrinsic shear wave quality factor, Qβ , for the 15 km of the upper crust in the NW Himalaya is estimated. Thirty-two teleseismic broadband SH and sSH waveforms of 8 October 2005 South Asian earthquake (Mw = 7.6), from sixteen Global Seismographic Network stations of the National Earthquake Information Center network have been used. The selected windows of the direct and depth phases have been Fourier transformed and smoothed using the Hamming and Tuckey technique. Ratio of the smoothed spectra of depth and direct phases are obtained in the frequency range 0.2-1.5 Hz. A straight line is fitted in the least-square sense to the spectral ratio versus frequency. The value of Qβ is estimated from the slope of the line. The frequency inde-pendent average value of Qβ is estimated to be 218±56.
Key words: seismic hazard, shear wave analysis, intrinsic attenuation, NW Himalaya, 8 October 2005 South Asian earthquake.
1. INTRODUCTION Attenuation properties of the medium are important in studying the earth-quake size and drop of the ground motion with distance, which helps in seismic hazard mitigation. Kumar, D. (2005) estimated frequency indepen-

S. KUMAR
646
dent average value of Qβ in the border region between the Ganga Basin and Himalaya in Bihar using teleseismic broadband SH waveforms for the 1988 Nepal–India border earthquake. In this paper, the average inelastic attenua-tion parameter Qβ , for the shear waves in 15 km of the upper crust at north-ern edge of the Himalaya, in NW Himalayan region, has been estimated. It is the first estimate of this kind for this region. The quality factors obtained here represent the average value for the crustal layers enclosed between the hypocenter and the free surface through which sSH travels from the earth-quake source. A number of other studies of Q elsewhere in the Indian region have been carried out. Estimates of coda Q are available for the Himalayan region (Gupta et al. 1995, 1996, 1998; Kumar, N. et al. 2005). Chandraseka-ran and Das (1994) evaluated Q using the strong motion records of two earthquakes in the Himalaya. Singh et al. (1999) estimated Q using Lg waves in the Indian shield. The coda Q in the Koyna region of the Indian shield has been estimated by Gupta et al. (1998) and Mandal and Rastogi (1998). Singh (1991) estimated the Q structures beneath north and central India from the inversion of surface wave attenuation. Kumar, N. et al. (2005) estimated the coda wave attenuation, Qc , for the NW Himalayan region us-ing local earthquakes.
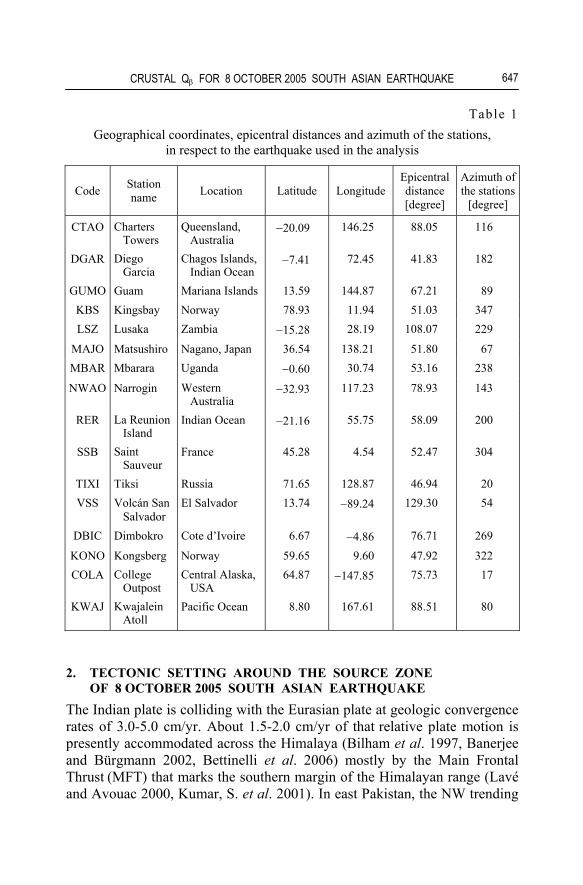
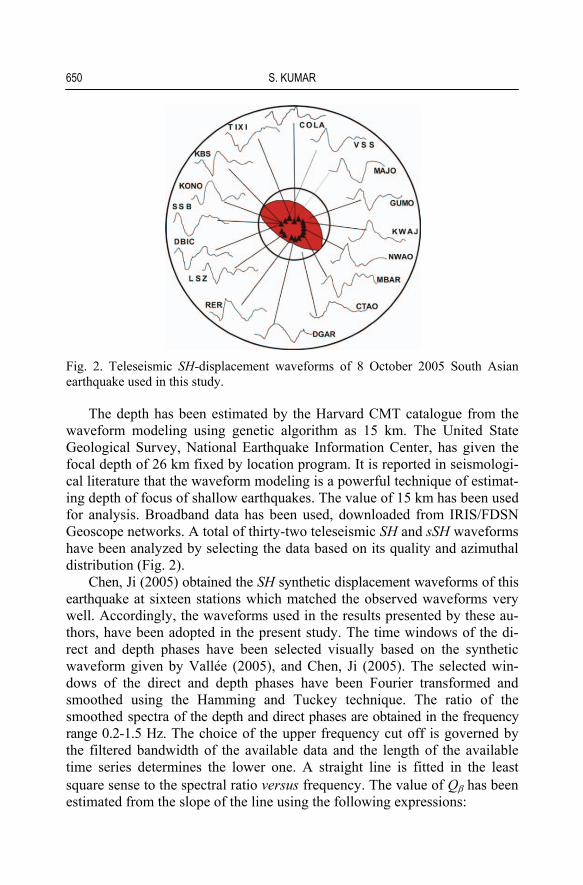
This 2005 earthquake provided good opportunity to estimate Qβ of this region. The present study is based on the teleseismic broadband SH and surface reflected SSH waveforms from the 2005 South Asian earthquake (Mw = 7.6). This earthquake took place in South Asia in the northernmost syntaxis region. The seismograms of the stations at LSZ, GUMO, MAJO, VSS, COLA, SSB, KONO, KBS, MBAR, NWAO, DBIC, RER, CTAO, DGAR, KWAJ and TIXI were used in the analysis. Table 1 gives the geo-graphical coordinates of the stations along with their corresponding epicen-tral distances; and azimuth of the stations in respect to the earthquake.
The basis for estimating the average Qβ in the crust in the epicentral re-gion are the spectral ratios of the sSH and the SH phases. The path traveled by the direct SH wave and the corresponding depth phase, i.e., sSH, from a shallow earthquake to distant recording stations are approximately the same except for the up-going and surface-reflected portion of the path in the hypo-central region. Therefore, the spectral ratio of the depth and the direct phases provide information for the average value of Qβ for the extra path traversed by the sSH phases in the hypocentral region. However, this assumption may be only a crude approximation for the stations closer to the source. That is why all stations used in this study should be beyond 30o. In this data set, the nearest station is DGAR, which is beyond 41o, while the rest of the stations are much farther, which strongly supports the approximation.
CRUSTAL Qβ FOR 8 OCTOBER 2005 SOUTH ASIAN EARTHQUAKE
647
Table 1 Geographical coordinates, epicentral distances and azimuth of the stations,
in respect to the earthquake used in the analysis
Code Station name Location Latitude Longitude
Epicentraldistance [degree]
Azimuth of the stations
[degree]
CTAO Charters Towers
Queensland, Australia
−20.09 146.25 88.05 116
DGAR Diego Garcia
Chagos Islands, Indian Ocean
−7.41 72.45 41.83 182
GUMO Guam Mariana Islands 13.59 144.87 67.21 89 KBS Kingsbay Norway 78.93 11.94 51.03 347 LSZ Lusaka Zambia −15.28 28.19 108.07 229
MAJO Matsushiro Nagano, Japan 36.54 138.21 51.80 67 MBAR Mbarara Uganda −0.60 30.74 53.16 238
NWAO Narrogin Western Australia
−32.93 117.23 78.93 143
RER La Reunion Island
Indian Ocean −21.16 55.75 58.09 200
SSB Saint Sauveur
France 45.28 4.54 52.47 304
TIXI Tiksi Russia 71.65 128.87 46.94 20 VSS Volcán San
Salvador El Salvador 13.74 −89.24 129.30 54
DBIC Dimbokro Cote d’Ivoire 6.67 −4.86 76.71 269
KONO Kongsberg Norway 59.65 9.60 47.92 322 COLA College
Outpost Central Alaska, USA
64.87 −147.85 75.73 17
KWAJ Kwajalein Atoll
Pacific Ocean 8.80 167.61 88.51 80
2. TECTONIC SETTING AROUND THE SOURCE ZONE OF 8 OCTOBER 2005 SOUTH ASIAN EARTHQUAKE
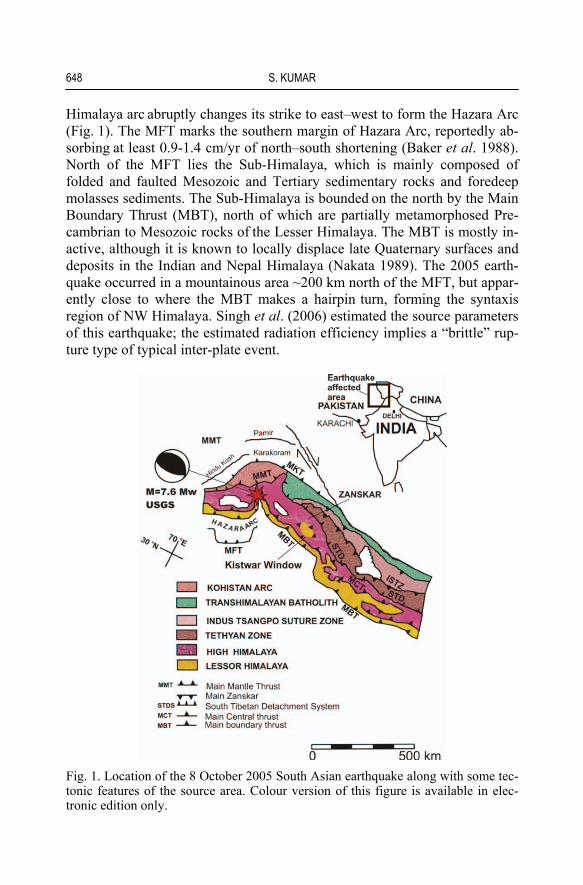
The Indian plate is colliding with the Eurasian plate at geologic convergence rates of 3.0-5.0 cm/yr. About 1.5-2.0 cm/yr of that relative plate motion is presently accommodated across the Himalaya (Bilham et al. 1997, Banerjee and Bürgmann 2002, Bettinelli et al. 2006) mostly by the Main Frontal Thrust (MFT) that marks the southern margin of the Himalayan range (Lavé and Avouac 2000, Kumar, S. et al. 2001). In east Pakistan, the NW trending
S. KUMAR
648
Himalaya arc abruptly changes its strike to east–west to form the Hazara Arc (Fig. 1). The MFT marks the southern margin of Hazara Arc, reportedly ab-sorbing at least 0.9-1.4 cm/yr of north–south shortening (Baker et al. 1988). North of the MFT lies the Sub-Himalaya, which is mainly composed of folded and faulted Mesozoic and Tertiary sedimentary rocks and foredeep molasses sediments. The Sub-Himalaya is bounded on the north by the Main Boundary Thrust (MBT), north of which are partially metamorphosed Pre-cambrian to Mesozoic rocks of the Lesser Himalaya. The MBT is mostly in-active, although it is known to locally displace late Quaternary surfaces and deposits in the Indian and Nepal Himalaya (Nakata 1989). The 2005 earth-quake occurred in a mountainous area ~200 km north of the MFT, but appar-ently close to where the MBT makes a hairpin turn, forming the syntaxis region of NW Himalaya. Singh et al. (2006) estimated the source parameters of this earthquake; the estimated radiation efficiency implies a “brittle” rup-ture type of typical inter-plate event.
Fig. 1. Location of the 8 October 2005 South Asian earthquake along with some tec-tonic features of the source area. Colour version of this figure is available in elec-tronic edition only.

CRUSTAL Qβ FOR 8 OCTOBER 2005 SOUTH ASIAN EARTHQUAKE
649
3. METHODS OF ESTIMATING Qβ Aki and Richards (1980) represented the attenuation of a horizontally pola-rized shear wave in the frequency domain as
( )0( ) ( )exp π ,SH f SH f f t Qβ= − (1)
where SH0(ƒ) is the amplitude of the wave at a reference site, SH(ƒ) is the amplitude of the wave at a distance R, Vs is the shear wave speed, t is the tra-vel time (=R/Vs), and Qβ is the attenuation parameter. The above equation for the depth phases, sSH, can be written as
0( ) ( )exp π ( ) ,sSH f SH f f t Qβτ⎡ ⎤= − +⎣ ⎦ (2)
where sSH(ƒ) is the spectral amplitude of the surface reflected phase, τ is the two-way travel time of the phase from the source to the surface and back to the source depth level.
If A(ƒ) represents the ratio of spectra of the depth phase sSH and the di-rect phase SH, then it can be written as follows:
( )( ) ( ) ( ) exp π .A f sSH f SH f f Qβτ= = − (3)
The geometrical divergence factors have been omitted from the above ex-pression, as they are independent of frequency. Hence, the effect of this fac-tor on A(ƒ) will be only to scale it by a constant without affecting the frequency dependent structure. Thus, the determination of Qβ is not affected at all.
By taking natural logarithms of eq. (3), we get the following equation:
ln ( ) π .A f f Qβτ= − (4)
This is an equation of a straight line with –π τ/Qβ as its slope; Qβ can be de-termined from this expression.
4. DATA SET AND ANALYSIS The source parameters of the 8 October 2005 South Asian earthquake are as given by the Harvard CMT catalogue:
Epicenter: 34.370°N, 73.470°E Origin time: 03h50m52.0s Hypocentral depth: ~15 km Earthquake duration: ~ 30 s Seismic moment: 3.25×10²⁰ N⋅m (Mw = 7.6) Parameters of the focal mechanism solution of the 8 October 2005 South
Asian earthquake: strike 318o, dip 29o, and rake 107o.
S. KUMAR
650
Fig. 2. Teleseismic SH-displacement waveforms of 8 October 2005 South Asian earthquake used in this study.
The depth has been estimated by the Harvard CMT catalogue from the waveform modeling using genetic algorithm as 15 km. The United State Geological Survey, National Earthquake Information Center, has given the focal depth of 26 km fixed by location program. It is reported in seismologi-cal literature that the waveform modeling is a powerful technique of estimat-ing depth of focus of shallow earthquakes. The value of 15 km has been used for analysis. Broadband data has been used, downloaded from IRIS/FDSN Geoscope networks. A total of thirty-two teleseismic SH and sSH waveforms have been analyzed by selecting the data based on its quality and azimuthal distribution (Fig. 2).
Chen, Ji (2005) obtained the SH synthetic displacement waveforms of this earthquake at sixteen stations which matched the observed waveforms very well. Accordingly, the waveforms used in the results presented by these au-thors, have been adopted in the present study. The time windows of the di-rect and depth phases have been selected visually based on the synthetic waveform given by Vallée (2005), and Chen, Ji (2005). The selected win-dows of the direct and depth phases have been Fourier transformed and smoothed using the Hamming and Tuckey technique. The ratio of the smoothed spectra of the depth and direct phases are obtained in the frequency range 0.2-1.5 Hz. The choice of the upper frequency cut off is governed by the filtered bandwidth of the available data and the length of the available time series determines the lower one. A straight line is fitted in the least square sense to the spectral ratio versus frequency. The value of Qβ has been estimated from the slope of the line using the following expressions:
CRUSTAL Qβ FOR 8 OCTOBER 2005 SOUTH ASIAN EARTHQUAKE
651
π ,Qβ τ θ= − ln ( ) ,A f fθ = (5)
where θ is the slope of the fitted line. The time τ here is for the slant paths for the up and down going waves in the crust corresponding to the epicentral distance of the respective stations. The shear velocity model used in the Qβ estimation is given in Table 2.
Table 2 Velocity model used in the estimation
of Qβ study for the NW Himalaya
Thickness [km]
Vs [km/s]
0.0 − 5.0 3.02 10.0 3.15 15.0 3.39
half space ≥ 3.39
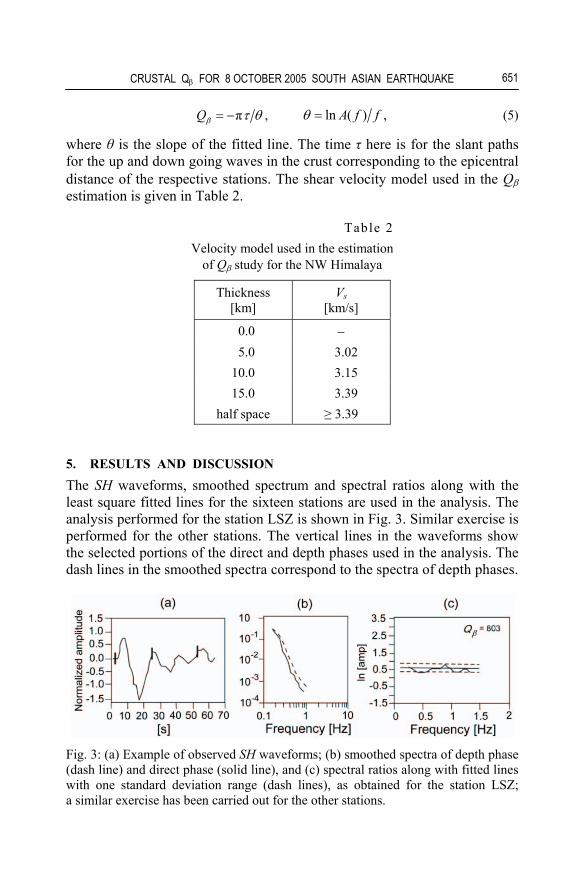
5. RESULTS AND DISCUSSION The SH waveforms, smoothed spectrum and spectral ratios along with the least square fitted lines for the sixteen stations are used in the analysis. The analysis performed for the station LSZ is shown in Fig. 3. Similar exercise is performed for the other stations. The vertical lines in the waveforms show the selected portions of the direct and depth phases used in the analysis. The dash lines in the smoothed spectra correspond to the spectra of depth phases.
Fig. 3: (a) Example of observed SH waveforms; (b) smoothed spectra of depth phase (dash line) and direct phase (solid line), and (c) spectral ratios along with fitted lines with one standard deviation range (dash lines), as obtained for the station LSZ; a similar exercise has been carried out for the other stations.

S. KUMAR
652
The least-square fitted lines are shown with one standard deviation (SD) range. The fittings of spectral ratios are good at all the stations within one SD range, except of the five mentioned stations.
There could be a systematic change in the spectral decay slope if Q is strongly dependent on frequency (Bowman 1988, Flanagan and Wiens 1998, Roth et al. 1999). However, in the frequency band under observation, such a systematic change in the slope could not be determined in the present analy-sis. Accordingly, the choice of the simpler model of frequency independence of Q in the frequency range of 0.2-1.5 Hz was found suitable and adopted. The studies of Bowman (1988) and Roth et al. (1999) also indicate that, within a narrow bandwidth, Q appears to be frequency independent. Hough (1997), Hough and Anderson (1988), and Hough et al. (1999) also have found a frequency independent Q model to be adequate. The fits of the lines showing the slopes show that the assumption of the frequency-independence of Qβ in the frequency band studied here is justified. The values of the shear wave quality factor, Qβ , obtained in the analysis, range from 140 to 313 with an average value equal to 218±56. These are rounded off values to the near-est tens and are given in Table 3. The scatter in the estimates of the Qβ val-ues obtained from different stations reflects the variation in the signal quality at the stations and in some measure to the differences in the paths. The sig-nals are simple waveforms at GUMO, MAJO, VSS, COLA, SSB, MBAR, NWAO, DBIC, RER, DGAR and KWAJ, and somewhat complex in nature at CTAO, KBS, LSZ, TIXI and KONO. At these stations, results show the high variations in the Qβ values. This is probably due to poor signal-to-noise ratio. That is why the results obtained at these stations have not been included in the final average value of Qβ . The observed variations in estimates of Q are
Table 3 Average values of the intrinsic shear wave quality factor Qβ , for the upper 15 km of the crust in the NW Himalaya region,
obtained using the teleseismic waveform recorded at sixteen stations
Station code Qβ Station code Qβ
CTAO 452 RER 183 DGAR 210 SSB 152 GUMO 192 TIXI 388
KBS 102 VSS 313 LSZ 803 DBIC 282
MAJO 255 KONO 426 MBAR 251 COLA 140 NWAO 268 KWAJ 155
CRUSTAL Qβ FOR 8 OCTOBER 2005 SOUTH ASIAN EARTHQUAKE
653
not expected to arise due to propagation of the rupture for the focal mechan-ism of the event, as that effect will be canceled out upon taking the ratios of the direct and the depth phase spectra. Overall, the estimates are consistent. In this situation, the travel times for the depth phases are longer than those for the direct waves, and slopes of the spectra for the depth phases are signif-icantly steeper than those for the direct waves.
In the analysis of the Qβ structure of the NW Himalaya region, a simple three- ayer crustal model was applied, consisting of three layers, in the upper 15 km thick crust, over a half space for the NW Himalaya region. The north-west Himalayas value given by Kumar, N. et al. (2006) was found to be ade-quate. However, other models Kumar, S. et al. (1987), Roecker 1982, Khattri 1992, Kumar, S. and Sato (2003), and Crust2 (2000), were also con-sidered in estimating the Qβ structure. The Crust2 and Roecker models are not found suitable for this region as in these models investigators did not in-clude soft sediments at the top of the crust. That is why their estimates of shear wave velocities for the upper crustal layers are a little higher. In the adopted model, the shear velocity was estimated using local earthquake data and incorporating the soft sediments in the upper part of the crust. The shear wave velocities estimated by Kumar, S. et al. (1987), Khattri (1992), and Kumar, S. and Sato (2003) have almost the same average values as Kumar, N. et al. (2006) for the upper 15 km crustal layer. These models were ac-quired specifically for the Garhwal Himalaya.
Many workers estimated the Q value for the Himalayan region (Table 4); their results are consistent with the average value estimated in this study, ex-cluding Q obtained in the border region, between the Ganga Basin and Hi-malaya in Bihar. For the Garhwal Himalaya, Gupta et al. (1995) estimated that the coda Q value is about 219 at 1.5 Hz. Concerning the comparison of the obtained intrinsic shear wave quality factor Qβ with the coda Q(Qc), Aki (1980a) argued that the relation Qβ = Qc being valid in routine analysis of coda waves provides a reliable measure of Qβ in the region. Derivation of Qβ from direct S waves is difficult as a more energetic S waveform interferes with the earlier arrived P-waveform and also their amplitudes often go out of the ranges of seismic recorders (Steensma and Biswas 1988). For the Koyna region of the Indian shield the coda Q value is about 231 (Mandal and Ras-togi 1998). Gupta et al. (1995) also estimated Qc for the Koyna region using local earthquake data at about 275. Since the Himalaya is composed of stacking of the sliced formations of the Indian shield, the attenuation para-meter may have similar values there as well. Jin and Aki (1986) interpreted Qc as a tectonic parameter and the regions with high tectonic activity are characterized by low Qc values. For the northwest Himalayas, close to the study area, the frequency-dependent coda Q(Qc) estimated increases from 113 to 343 at 1.5 Hz are also in good agreement with the present result, indi-
S. KUMAR
654
cating a heterogeneous and tectonically active region of the Himalaya seg-ment (Mukhopadhyay and Tyagi 2007). In the Siwalik Hills to the Gangetic plain, Northwest Himalayan (southwest of MBT) the frequency-dependent average Qc value is 210 at 1.5 Hz (Kumar, N. et al. 2005).
Factually, Q studies reveal that the Q value is low for active regions as compared to that for stable regions. However, Q for the Koyna-Warna area, which belongs to a stable region, is low in the entire frequency range as compared to the other stable regions.
Contrarily, Kumar, D. (2005) estimated frequency-independent average value of Qβ in the border region between the Ganga Basin and Himalaya in Bihar to be about 1250, which is quite high for the Ganga Basin. Qβ has been estimated for the upper 55 km of the earth thickness. Some studies carried out for the Hindu Kush region, Afghanistan Central Asia, mentioned that Qc increases with depth in the 0.4 to 24 Hz frequency range (Roecker 1982). In the Ganga Basin this was the only deeper earthquake available for estimating Q for 55 km depth and this may be the reason for the estimated high Q value for this region. The occurrences of intermediate focal depth earthquakes in the Ganga Basin or the Himalaya are uncommon. The studied 1988 earth-quake was the only well determined event with broadband recording availa-ble presently (Zhou et al. 1995). That is why this estimated high Q value may be restricted to this particular region only.
Comparison of Q with the global estimation A strong correlation between Qc and the level of tectonic activity of the re-gion has been observed by several investigators (Table 4) (e.g., Aki 1980b, Pulli and Aki 1981, Roecker et al. 1982, van Eck 1988). In general, the re-gions having low Qc value are characterized by higher tectonic activity, and tectonically stable regions show high Qc value. But there are some excep-tions as well. In the western United States, in agreement with the present re-sult, Qc has a value of 180; in contrast, however, in the central United States it is greater, amounting to about 1084 (Singh and Herrmann 1983). For the Tsukuba and Oishiyama, Japan, and the Stone Canyon, California, Qc values vary from 50 to 200 at 1 Hz (Aki and Chouet 1975) which is less than ob-tained in this study.
In many other different tectonic regions of the world, low Qc values are in agreement at low frequency (0.2-1.5) with the values obtained in this study for the upper crust. Similar consistent results of Q value have been es-timated for the New England; central and south-central Alaska; southern Philippines; western Anatolia region, Turkey and Coastal plain, South Caro-lina; the estimated Q values amounted to 205, 276, 232, 250, and 278, re-spectively. The Q value estimated in this study is greater than those obtained for southern Norway; Mono Craters, California region; northern Philippines;

CRUSTAL Qβ FOR 8 OCTOBER 2005 SOUTH ASIAN EARTHQUAKE
655
Baja California Mexico; Friuli region, Italy; Kanto region, Japan and south-ern Kanto region, Japan, in which the estimated Q values amounted to 187, 106, 105, 183, 125, 113, and 173, respectively.
A number of studies have shown that Qβ is quite high even in seismogen-ic zones (Hough and Anderson 1988, Abercrombie and Leary 1993, Leary and Abercrombie 1993). However, it is expected to be high in the stable re-gions. Modeling of aftershock seismograms of the 1993 Latur earthquake in stable south Indian shield region shows similarity in the obtained results and general behavior of Qβ ; it revealed 800 in the upper crust and 1000-1200 in the lower crust (Krishna et al. 1999).
Table 4 Seismic attenuation quality factors Qc
in different regions of the world at low frequency
Region Qc References
Western United States 180 Singh and Herrmann (1983) Central United States 1084 Singh and Herrmann (1983) Tsukuba and Oishiyama, Japan and Stone Canyon, California 50-200 Aki and Chouet (1975)
New England 205 Pulli (1984) Central and south-central Alaska 276 Steensma and Biswas (1988) Southern Philippines 232 Kanao and Ito (1992) Western Anatolia region, Turkey 250 Akinci and Eyidoğan (1994) Coastal plain, South Carolina 278 Reha (1984) Southern Norway 187 Kvamme and Havskov (1989) Mono Craters, California region 106 Lee et al. (1989) Northern Philippines 105 Kanao and Ito (1992) Baja California Mexico 183 Dominguez et al. (1997) Friuli region, Italy 125 Console and Rovelli (1981) Kanto region, Japan 113 Kazuo et al. (1993) Southern Kanto region, Japan 173 Kinoshita (1994) South Indian shield region, upper crust 800 Krishna et al. (1999) South Indian shield region, lower crust 1000-1200 Krishna et al. (1999) Garhwal Himalaya, India 219 Gupta et al. (1995) Koyna region of the Indian shield, India 231 Mandal and Rastogi (1998) Koyna region of the Indian shield, India 275 Gupta et al. (1995) Northwest Himalayas, India 113-343 Mukhopadhyay and Tyagi (2007) Northwest Himalayan (southwest of MBT), India 210 Kumar, N. et al. (2005)
Between the Ganga Basin and Himalaya in Bihar, India 1250 Kumar, D. (2005)
NW Himalaya, India 218±56 This study
S. KUMAR
656
6. CONCLUSIONS Using teleseismic broadband SH and sSH waveforms of the 8 October 2005 South Asian earthquake from 16 GSN stations of NEIC network, the intrinsic attenuation characteristics of the NW Himalaya region have been computed.
In summary, the average value of the intrinsic shear wave quality factor Qβ determined for the upper 15 km of crust is 218±56, which signifies a seismically active region. This indicates that the syntaxis region of NW Himalaya region is highly heterogeneous and seismically very active. The results could be compared with the Qc estimates if any local networks would records the local seismicity in the NW Himalaya.
The correlation of this result with the local and global observations can be summarized by stating that the intrinsic attenuation value at low frequen-cy (0.5 to 1.5) is similar to those obtained for the Garhwal Himalaya, Northwest Himalaya, the Koyna region, South Carolina, central and south-central Alaska, Philippines, Turkey and New England. This value is lower than obtained for the Ganga Basin, Central United State; and higher than those obtained for western United States, southern Norway, Mono Craters, California, Baja California, Mexico, central Japan, Friuli region, Italy, southern Norway, Kanto region, and southern Kanto region, Japan.
Acknowledgements . The author is thankful to the Director of the
Wadia Institute of Himalayan Geology, Dehra Dun, India, for giving neces-sary permission to publish this work. Thanks to Dr. Dinesh Kumar, Reader in the Kurukshetra University, Krukshetra and Dr. S.C. Gupta, chief scientif-ic officer at IIT Roorkee, Roorkee, for providing the necessary computer programs and critically checking the manuscript and results. Special thanks to Professor Bob Yeats, USA, for correcting the manuscript grammatically.
R e f e r e n c e s
Abercrombie, R., and P. Leary (1993), Source parameters of small earthquakes re-corded at 2.5 km depth, Cajon Pass, southern California: Implications for earthquake scaling, Geophys. Res. Lett. 20, 14, 1511-1514, DOI: 10.1029/ 93GL00367.
Aki, K. (1980a), Attenuation of shear-waves in the lithosphere for frequencies from 0.05 to 25 Hz, Phys. Earth Planet. Int. 21, 1, 50-60, DOI: 10.1016/0031-9201(80)90019-9.
Aki, K. (1980b), Scattering and attenuation of shear waves in the lithosphere, J. Geophys. Res. 85, B11, 6496-6504, DOI: 10.1029/JB085iB11p06496.
Aki, K., and B. Chouet (1975), Origin of coda waves: Source, attenuation, and scattering effects, J. Geophys. Res. 80, 23, 3322-3342, DOI: 10.1029/ JB080i023p03322.
CRUSTAL Qβ FOR 8 OCTOBER 2005 SOUTH ASIAN EARTHQUAKE
657
Aki, K., and P.G. Richards (1980), Quantitative Seismology, Theory and Methods, Vol. I, W.H. Freeman, San Francisco CA, 535 pp.
Akinci, A., and H. Eyidoğan (1996), Frequency-dependent attenuation of S and coda waves in Erzincan region (Turkey), Phys. Earth Planet. Int. 97, 1-4, 109-119, DOI: 10.1016/0031-9201(96)03155-X.
Baker, D.M., R.J. Lillie, R.S. Yeats, G.D. Johnson, M. Yousuf, and A.S. Hamid Zamin (1988), Development of the Himalayan frontal thrust zone: Salt Range, Pakistan, Geology 16, 1, 3-7, DOI:10.1130/0091-7613(1988)016< 0003:DOTHFT>2.3.CO;2.
Banerjee, P., and R. Bürgmann (2002), Convergence across the northwest Himalaya from GPS measurements, Geophys. Res. Lett. 29, 13, 1652, DOI: 10.1029/ 2002GL015184.
Båth, M. (1974), Spectral Analysis in Geophysics, Elsevier, Amsterdam, 563 pp. Bettinelli, P., J.P. Avouac, M. Flouzat, F. Jouanne, L. Bollinger, P. Willis, and
G.R. Chitrakar (2006), Plate motion of India and interseismic strain in the Nepal Himalaya from GPS and DORIS measurements, J. Geodesy 80, 8-11, 567-589, DOI: 10.1007/s00190-006-0030-3.
Bilham, R., K. Larson, J. Freymueller, F. Jouanne, P. Le Fort, P. Leturmy, J.L. Mugnier, J.F. Gamond, J.P. Glot, J. Martinod, N.L. Chaudury, G.R. Chitra-kar, U.P. Gautam, B.P. Koirala, M.R. Pandey, R. Ranabhat, S.N. Sapkota, P.L. Shrestha, M.C. Thakuri, U.R. Timilsina, D.R. Tiwari, G. Vidal, C. Vi-gny, A. Galy, and B. de Voogd (1997), GPS measurements of present-day convergence across the Nepal Himalaya, Nature 386, 6620, 61-64, DOI: 10.1038/386061a0.
Bowman, J.R. (1988), Body wave attenuation in the Tonga subduction zone, J. Geophys. Res. 93, B3, 2125-2139, DOI: 10.1029/JB093iB03p02125.
Chandrasekaran, A.R., and J.D. Das (1994), Evaluation of factor-Q from strong mo-tion records, Proceedings of 10th Symposium on Earthquake Engineering 1, 105-113.
Chen, Ji (2005), Inversion by Chen Ji available at http://earthquake.usgs. gov/earthquakes/eqinthenews/2005/usdyae/finitefault/.
Console, R., and A. Rovelli (1981), Attenuation parameters for Friuli region from strong-motion accelerogram spectra, Bull. Seism. Soc. Am. 71, 6, 1981-1991.
Crust2 (2000), The global crustal model CRUST2 is available at http://mahi.ucsd. edu/Gabi/rem.html.
Dominguez, T., C.J. Rebollar, and R.R. Castro (1997), Regional variations of seis-mic attenuation of Lg waves in southern Mexico, J. Geophys. Res. 102, B12, 27,501-27,509, DOI: 10.1029/97JB02332.
Flanagan, M.P., and D.A. Wiens (1998), Attenuation of broadband P and S waves in Tonga: Observations of frequency dependent Q, Pure Appl. Geophys. 153, 2-4, 345-375, DOI: 10.1007/s000240050199.
Gupta, S.C., V.N. Singh, and A. Kumar (1995), Attenuation of coda waves in the Garhwal Himalaya India, Phys. Earth Planet. Int. 87, 3-4, 247-253, DOI: 10.1016/0031-9201(94)02968-H.

S. KUMAR
658
Gupta, S.C., K. Ashwani, V.N. Singh, and S. Basu (1996), Lapse-time dependence of Qc in the Garhwal Himalaya, Bull. Ind. Soc. Earthq. Tech. 33, 147-159.
Gupta, S.C., S.S. Teotia, S.S. Rai, and N. Gautam (1998), Coda Q estimates in the Koyna region, India, Pure Appl. Geophys. 153, 2-4, 713-731, DOI: 10.1007/ s000240050216.
Hough, S.E. (1997), Empirical Green’s function analysis: Taking the next step, J. Geophys. Res. 102, B3, 5369-5384, DOI: 10.1029/96JB03488.
Hough, S.E., and J.G. Anderson (1988), High frequency spectra observed at Anza, California: Implications for the Q structure, Bull. Seism. Soc. Am. 78, 692-707.
Hough, S.E., J.M. Lees, and F. Monastero (1999), Attenuation and source properties at the Coso Geothermal Area California, Bull. Seism. Soc. Am. 89, 1606-1619.
Jin, A., and K. Aki (1986), Temporal change in coda Q before the Tangshan earth-quake of 1976 and the Haicheng earthquake of 1975, J. Geophys. Res. 91, B1, 665-673, DOI: 10.1029/JB091iB01p00665.
Kanao, M., and K. Ito (1992), Attenuation of Coda Waves in the Source Area of the 1990 July 16 Luzon Earthquake, Philippines, Bull. Disas. Prev. Res. Inst. of Kyoto Univ. 42, 2, 1-365.
Kazuo, Y., H. Sato, Y. Iio, H. Ito, T. Ohminato, and M. Ohtake (1993), Frequency-dependent Attenuation of High-frequency P and S Waves in the Upper Crust in Western Nagano Japan, Pure Appl. Geophys. 153, 489-502.
Khattri, K.N. (1992), Local seismic investigation in the Garhwal-Kumaon Hima-layas, Mem. Geol. Soc. Ind. 23, 45-66.
Kinoshita, S. (1994), Frequency-dependent attenuation of shear waves in the crust of the southern Kanto area Japan, Bull. Seism. Soc. Am. 84, 1387-1396.
Krishna, V.G., C.V.R.K. Rao, H.K. Gupta, D. Sarkar, and M. Baumbach (1999), Crustal seismic velocity structure in the epicentral region of the Latur earthquake (September 29, 1993) southern India: inferences from modelling of the aftershock seismograms, Tectonophysics 304, 3, 241-255, DOI: 10.1016/S0040-1951(99)00028-1.
Kumar, D. (2005), Estimation of crustal Qβ in the Ganga Basin using teleseismic broad-band SH waveforms for the 1988 Nepal–India border earthquake, J. Asian Earth Sci. 25, 1, 69-75, DOI: 10.1016/j.jseaes.2004.01.013.
Kumar, N., I.A. Parvez, and H.S. Virk (2005), Estimation of coda wave attenuation for NW Himalayan region using local earthquakes, Phys. Earth Planet. Int. 151, 3-4, 243-258, DOI: 10.1016/j.pepi.2005.03.010.
Kumar, N., J. Sharma, B.R. Arora, and S. Mukhopadhyaya (2006), Imaging deep structures through the inversion of earthquake data: an example from Kan-gra-Chamba region of Himachal Himalaya: DCS-DST News 16(1), 7-8.
Kumar, S., and T. Sato (2003), Compressional and Shear wave velocities in the crust beneath the Garhwal Himalaya North India, J. Him. Geol. 24, 77-85.

CRUSTAL Qβ FOR 8 OCTOBER 2005 SOUTH ASIAN EARTHQUAKE
659
Kumar, S., R. Chander, and K.N. Khattri (1987), Compressional wave velocity in the second crustal layer in Garhwal Himalaya, J. Assoc. Expl. Geophys. 8, 219-225.
Kumar, S., S.G. Wesnousky, T.K. Rockwell, D. Regona, V.C. Thakur, and G.G. Seitz, (2001), Earthquake recurrence and rupture dynamics of Himalayan Frontal Thrust India, Science 294, 5550, 2328-2331, DOI: 10.1126/science. 1066195.
Kvamme, L.B., and J. Havskov (1989), Q in southern Norway, Bull. Seism. Soc. Am. 79, 1575-1588.
Lavé, J., and J.P. Avouac (2000), Active folding of fluvial terraces across the Si-waliks Hills, Himalayas of Central Nepal, J. Geophys. Res. 105, B3, 5735-5770, DOI: 10.1029/1999JB900292.
Leary, P., and R. Abercrombie (1993), Frequency dependent crustal scattering and absorption at 5-160 Hz from coda decay observed at 2.5 km depth, Geo-phys. Res. Lett. 21, 11, 971-974, DOI: 10.1029/94GL00977.
Lee, K.S., A.P. William, and S. James (1989), Site-dependent coda Q at Mono Cra-ters, California, Bull. Seism. Soc. Am. 79, 5, 1559-1574.
Mandal, P., and B.K. Rastogi (1998), A frequency-dependent relation of coda Qc for Koyna-Warna region, India, Pure Appl. Geophys. 153, 1, 163-177, DOI: 10.1007/s000240050190.
Mitchell, B.J. (1980), Frequency dependence of shear wave internal friction in the continental crust of eastern North America, J. Geophys. Res. 85, B10, 5212-5218, DOI: 10.1029/JB085iB10p05212.
Mitchell, B.J. (1981), Regional variation and frequency dependence on Qb in the crust of the United States, Bull. Seism. Soc. Am. 71, 1531-1538.
Mukhopadhyay, S., and C. Tyagi (2007), Lapse time and frequency-dependent attenuation characteristics of coda waves in the northwestern Himalayas, J. Seismol. 11, 2, 149-158, DOI: 10.1007/s10950-006-9042-y.
Nakata, T. (1989), Special Paper 232, Active faults of the Himalaya of India and Nepal, in tectonics of the western Himalayas. In: L.L. Malinconico and R.J. Lillie (eds.), Geol. Soc. Am. 232, Boulder, CO, 243-264.
Pulli, J.J. (1984), Attenuation of coda waves in New England, Bull. Seism. Soc. Am. 74, 1149-1166.
Pulli, J.J., and K. Aki (1981), Attenuation of seismic waves in the lithosphere: com-parison of active and stable areas. In: J.E. Beavers (ed.), Earthquakes and Earthquake Engineering: the Eastern US, Ann Arbor Science Publishers, Ann Arbor, MI, 129-141.
Reha, S. (1984), Q determined from local earthquakes in the South Carolina coastal plain, Bull. Seism. Soc. Am. 74, 2257-2268.
Roecker, S.W. (1982), Velocity structure of the Pamir-Hindu Kush region: possible evidence of subducted crust, J. Geophys. Res. 87, B2, 945-959, DOI: 10.1029/JB087iB02p00945.
S. KUMAR
660
Roecker, S.W., B. Tucker, J. King, and D. Hatzfeld (1982), Estimates of Q in central asia as a function of frequency and depth using the coda of locally recorded earthquakes, Bull. Seism. Soc. Am. 72, 1, 129-149.
Roth, E.G., D.A. Wiens, L.M. Dorman, J. Hildebrand, and S.C. Webb (1999), Seis-mic attenuation tomography of the Tonga-Fiji region using phase pair meth-ods, J. Geophys. Res. 104, B3, 4795-4809, DOI: 10.1029/1998JB900052.
Singh, D.D. (1991), Anelasticity of the crust and upper mantle beneath north and central India from the inversion of observed Love and Rayleigh wave attenua-tion data, Pure Appl. Geophys. 135, 4, 545-558, DOI: 10.1007/BF01772405.
Singh, S., and R.B. Herrmann (1983), Regionalization of crustal coda Q in the con-tinental United States, J. Geophys. Res. 88, B1, 527-538, DOI: 10.1029/ JB088iB01p00527.
Singh, S.K., M. Ordaz, R.S. Dattatrayam, and H.K. Gupta (1999), A spectral analy-sis of the May 21, 1997, Jabalpur, India earthquake (Mw ¼ 5.8) and estima-tion of ground motion from future earthquakes in the Indian shield region, Bull. Seism. Soc. Am. 89, 1620-1630.
Singh, S.K., A. Iglesias, R.S. Dattatrayam, B.K. Bansal, S.S. Rai, X. Perez-Campos, G. Suresh, P.R. Baidya, and J.L. Gautam (2006), Muzaffarabad earthquake of 8 October 2005 (Mw 7.6): A preliminary report on source characteristics and recorded ground motion, Current Science 91, 689-695.
Steensma, G.J., and N.N. Biswas (1988), Frequency dependent characteristics of coda wave quality factor in central and southcentral Alaska, Pure Appl. Geophys. 128, 1-2, 295-307, DOI: 10.1007/BF01772602.
Vallée, M. (2005), Inversion by Martin Vallée available at http://geoazur.oca.eu/ spip.php?article112var_recherche=SEISME/FPAKISTAN/081005/note1.html
Van Eck, T. (1988), Attenuation of coda waves in the Dead Sea region, Bull. Seism. Soc. Am. 78, 770-779.
Zhou, R., F. Tajima, and P.L. Stoffa (1995), Earthquake source parameter determi-nation using genetic algorithms, Geophys. Res. Lett. 22, 4, 517-520, DOI: 10.1029/94GL03345.
Received 25 June 2009 Received in revised form 11 October 2009
Accepted 30 November 2009