
estimation of channels transmission loss from remote sensing
10
HYDROLOGICAL PROCESSES Hydrol. Process. 23, 1359–1368 (2009) Published online 4 February 2009 in Wiley InterScience (www.interscience.wiley.com) DOI: 10.1002/hyp.7259 Integration of remote sensing and GIS for modelling flash floods in Wadi Hudain catchment, Egypt Mohammed El Bastawesy, 1 * Kevin White 2 and Ayman Nasr 1 1 National Authority for Remote Sensing and Space Sciences (NARSS), Egypt 2 Geography Department, Reading University UK Abstract: This paper presents a new approach to modelling flash floods in dryland catchments by integrating remote sensing and digital elevation model (DEM) data in a geographical information system (GIS). The spectral reflectance of channels affected by recent flash floods exhibit a marked increase, due to the deposition of fine sediments in these channels as the flood recedes. This allows the parts of a catchment that have been affected by a recent flood event to be discriminated from unaffected parts, using a time series of Landsat images. Using images of the Wadi Hudain catchment in southern Egypt, the hillslope areas contributing flow were inferred for different flood events. The SRTM3 DEM was used to derive flow direction, flow length, active channel cross-sectional areas and slope. The Manning Equation was used to estimate the channel flow velocities, and hence the time-area zones of the catchment. A channel reach that was active during a 1985 runoff event, that does not receive any tributary flow, was used to estimate a transmission loss rate of 7Ð5 mm h 1 , given the maximum peak discharge estimate. Runoff patterns resulting from different flood events are quite variable; however the southern part of the catchment appears to have experienced more floods during the period of study (1984–2000), perhaps because the bedrock hillslopes in this area are more effective at runoff production than other parts of the catchment which are underlain by unconsolidated Quaternary sands and gravels. Due to high transmission loss, runoff generated within the upper reaches is rarely delivered to the alluvial fan and Shalateen city situated at the catchment outlet. The synthetic GIS-based time area zones, on their own, cannot be relied on to model the hydrographs reliably; physical parameters, such as rainfall intensity, distribution, and transmission loss, must also be considered. Copyright 2009 John Wiley & Sons, Ltd. KEY WORDS flash floods; dryland catchments; remote sensing; DEM; GIS Received 18 June 2008; Accepted 15 December 2008 INTRODUCTION Water security and flood hazards are of great environmen- tal, economical and political importance for all dryland countries (Tooth, 2000). Flooding and associated sedi- ment transport in drylands receive little recognition as environmental problems, due to the relative infrequent occurrence of runoff events and lack of observations (White, 1995; Gheith and Sultan, 2002). The paucity of good quality rainfall and discharge data presents a particular problem for hydrological analysis in dryland catchments (McMahon, 1979). Direct measurements of runoff hydrographs and associated sediment transport in dryland catchments are very rare. The exceptions are a few well-equipped experimental catchments such as Wal- nut Gulch in Arizona (Goodrich et al., 1997) Nahal Yael in Israel (Yair and Lavee, 1985; Yair, 1983, 1992), and Wadi Tabalah catchment in Saudi Arabia (Sorman and Abdulrazzak, 1993). Notwithstanding the important con- tributions made by these catchments, the general lack of observations of dryland floods results from the difficulty of access, shortage of available funding, and safety issues * Correspondence to: Mohammed El Bastawesy, National Authority for Remote Sensing and Space Sciences (NARSS), 23 Joseph Bros Tito, st, El Nozha El Gedida, P.O.Box 1564, Alf Maskan, Cairo, Egypt. E-mail: [email protected] associated with sampling these extreme events (White, 1995). Due to these limitations, remotely sensed data are of great importance in dryland hydrological modelling, and are increasingly being used to estimate a range of hydrological variables for the parameterisation of hydro- logical models (Sharma and Singh, 1992; Foody et al., 2004). These include the estimation of rainfall, evapo- transpiration and landuse – land cover parameters (Xinmei et al., 1995; Rezacova et al., 2007), which in turn have a strong influence on overland flow generation; transmis- sion loss and channeled runoff. Due to the shortage of instrumented catchments, indi- rect estimation of discharge is more common for dryland hydrological studies and can be achieved using a variety of techniques; these include deterministic rainfall–runoff models, runoff regression models, and flood morphologi- cal and sedimentary evidence. The credibility of a model depends mainly on validation against measured stream flow hydrographs, which are generally rare (Wheater et al. 1997). Consequently, non-calibrated models are frequently developed and applied to high magnitude floods in dryland catchments (Lange et al., 1999), but this approach is fraught with uncertainty, due to the extreme diversity of dryland catchment forms and pro- cesses. Traditionally, in flooding studies, attention has focused on the prediction of storm hydrographs with a Copyright 2009 John Wiley & Sons, Ltd.
-
Upload
independent -
Category
Documents
-
view
3 -
download
0
Transcript of estimation of channels transmission loss from remote sensing
HYDROLOGICAL PROCESSESHydrol. Process. 23, 1359–1368 (2009)Published online 4 February 2009 in Wiley InterScience(www.interscience.wiley.com) DOI: 10.1002/hyp.7259
Integration of remote sensing and GIS for modelling flashfloods in Wadi Hudain catchment, Egypt
Mohammed El Bastawesy,1* Kevin White2 and Ayman Nasr1
1 National Authority for Remote Sensing and Space Sciences (NARSS), Egypt2 Geography Department, Reading University UK
Abstract:
This paper presents a new approach to modelling flash floods in dryland catchments by integrating remote sensing and digitalelevation model (DEM) data in a geographical information system (GIS). The spectral reflectance of channels affected byrecent flash floods exhibit a marked increase, due to the deposition of fine sediments in these channels as the flood recedes.This allows the parts of a catchment that have been affected by a recent flood event to be discriminated from unaffected parts,using a time series of Landsat images. Using images of the Wadi Hudain catchment in southern Egypt, the hillslope areascontributing flow were inferred for different flood events. The SRTM3 DEM was used to derive flow direction, flow length,active channel cross-sectional areas and slope. The Manning Equation was used to estimate the channel flow velocities, andhence the time-area zones of the catchment. A channel reach that was active during a 1985 runoff event, that does not receiveany tributary flow, was used to estimate a transmission loss rate of 7Ð5 mm h�1, given the maximum peak discharge estimate.Runoff patterns resulting from different flood events are quite variable; however the southern part of the catchment appears tohave experienced more floods during the period of study (1984–2000), perhaps because the bedrock hillslopes in this area aremore effective at runoff production than other parts of the catchment which are underlain by unconsolidated Quaternary sandsand gravels. Due to high transmission loss, runoff generated within the upper reaches is rarely delivered to the alluvial fanand Shalateen city situated at the catchment outlet. The synthetic GIS-based time area zones, on their own, cannot be reliedon to model the hydrographs reliably; physical parameters, such as rainfall intensity, distribution, and transmission loss, mustalso be considered. Copyright 2009 John Wiley & Sons, Ltd.
KEY WORDS flash floods; dryland catchments; remote sensing; DEM; GIS
Received 18 June 2008; Accepted 15 December 2008
INTRODUCTION
Water security and flood hazards are of great environmen-tal, economical and political importance for all drylandcountries (Tooth, 2000). Flooding and associated sedi-ment transport in drylands receive little recognition asenvironmental problems, due to the relative infrequentoccurrence of runoff events and lack of observations(White, 1995; Gheith and Sultan, 2002). The paucityof good quality rainfall and discharge data presents aparticular problem for hydrological analysis in drylandcatchments (McMahon, 1979). Direct measurements ofrunoff hydrographs and associated sediment transport indryland catchments are very rare. The exceptions are afew well-equipped experimental catchments such as Wal-nut Gulch in Arizona (Goodrich et al., 1997) Nahal Yaelin Israel (Yair and Lavee, 1985; Yair, 1983, 1992), andWadi Tabalah catchment in Saudi Arabia (Sorman andAbdulrazzak, 1993). Notwithstanding the important con-tributions made by these catchments, the general lack ofobservations of dryland floods results from the difficultyof access, shortage of available funding, and safety issues
* Correspondence to: Mohammed El Bastawesy, National Authority forRemote Sensing and Space Sciences (NARSS), 23 Joseph Bros Tito, st,El Nozha El Gedida, P.O.Box 1564, Alf Maskan, Cairo, Egypt.E-mail: [email protected]
associated with sampling these extreme events (White,1995). Due to these limitations, remotely sensed data areof great importance in dryland hydrological modelling,and are increasingly being used to estimate a range ofhydrological variables for the parameterisation of hydro-logical models (Sharma and Singh, 1992; Foody et al.,2004). These include the estimation of rainfall, evapo-transpiration and landuse–land cover parameters (Xinmeiet al., 1995; Rezacova et al., 2007), which in turn havea strong influence on overland flow generation; transmis-sion loss and channeled runoff.
Due to the shortage of instrumented catchments, indi-rect estimation of discharge is more common for drylandhydrological studies and can be achieved using a varietyof techniques; these include deterministic rainfall–runoffmodels, runoff regression models, and flood morphologi-cal and sedimentary evidence. The credibility of a modeldepends mainly on validation against measured streamflow hydrographs, which are generally rare (Wheateret al. 1997). Consequently, non-calibrated models arefrequently developed and applied to high magnitudefloods in dryland catchments (Lange et al., 1999), butthis approach is fraught with uncertainty, due to theextreme diversity of dryland catchment forms and pro-cesses. Traditionally, in flooding studies, attention hasfocused on the prediction of storm hydrographs with a
Copyright 2009 John Wiley & Sons, Ltd.

1360 M. EL BASTAWESY, K. WHITE AND A. NASR
particular emphasis on estimating the timing of peakdischarge (Foody et al., 2004). The flash flood hydro-graph is commonly of short duration and rapid time topeak. Peak discharge is followed by rapid reduction inflow velocity, and suspended sediments (clay, silt andsand) are deposited forming a slack-water deposit, orclay drape (Baker, 1987) that usually marks the max-imum flow width attained during the flood. However,the development of slack-water deposits are controlledby the presence and abundance of fine-grained sedimentsources within the catchment (i.e. granite, sandstones),and the preservation conditions (Benito and Thorndy-craft, 2005). The latter is greatly influenced by post-flood erosion processes, such as tributary runoff scoursand gullying, and wind deflation. Most ephemeral floodreconstruction techniques are based on identification ofwatermarks and inundation indicators, including scourmarks and lines of silt, and drifted debris (Benito andThorndycraft, 2005). This paper introduces a methodfor recognition and estimation of ephemeral floods fromtime-series of satellite images acquired shortly before andafter flash flood events for a typical dryland catchmentin the southern Eastern Desert of Egypt. These stageindicators were incorporated into a geographical informa-tion system (GIS), along with a digital elevation model(DEM), to estimate channel runoff velocities, simulate thespatially distributed unit hydrograph and estimate trans-mission losses.
STUDY AREA
The overwhelming majority of the Egyptian populationlive in the Nile Valley and Delta region, leaving mostof the land area of Egypt uninhabited. The Egyptiangovernment wishes to exploit and fully develop naturalresources throughout the country and has proposed atarget of 25% land habitation by 2050. The TushkaProject, west of Lake Nasser, is a well known exampleof a government development plan intended to expandhabitation into the Sahara Desert. 5 ð 109 m3 of waterwill be annually diverted from Nasser Lake into theTushka basin through artificial channels constructed inorder to create a new community away from the Nilefloodplain and Delta (Kim and Sultan, 2002). The regionof Shalateen in the southern Eastern Desert is anotherkey site in these sustainable development plans, and isthe focus of the research presented here. Infrastructure,settlements and land reclamation for agriculture activityare proposed to accommodate more than half a millionpeople on the alluvial fan of Shalateen (El Gebali, 2001).The alluvial fan is fed by water and sediment dischargefrom the Wadi Hudain catchment (El-Etr et al., 1991).
Wadi Hudain is a typical dryland catchment located inShalateen District in the south-eastern part of the EasternDesert of Egypt. The catchment is the largest drainingthe Eastern Desert towards the Red Sea and has an areaof 11 825 km2 (Figure 1). Political administration of theShalateen area is contested between the Egyptian and
Figure 1. Location map of the study area
Sudanese governments. The proposed sustainable devel-opment plans in the Shalateen area include the recla-mation of 250 000 Feddan (Feddan D 4200 m2) on thealluvial fan of Wadi Hudain, by harvesting runoff fromthe catchment and exploiting groundwater resources. Thetopography varies greatly from rugged hills incised bydeep, narrow and meandering wadis, especially in thenorth and southern parts, to low relief areas dominatingthe south-western part of the catchment. The underlyingrock units of high relief areas are dominated by Pre-cambrian basement rocks non-conformably overlain byCretaceous sandstone. Both Precambrian and Cretaceousrocks are affected by the Red Sea rifting-related Tertiarybasaltic cones (Sadek, 2004). The basement rocks formhigh to medium relief weathered blocky mountains, withparallel volcanic dykes trending, in general, east–west.Quaternary sand sheets and wadi fills occupy the lowlandareas to the west, the alluvial fan and coastal depositsbordering the Red Sea. Thrust faults and fractures are ofimportance to the geomorphological setting of the catch-ments; most of the scarps are aligned north-west–south-east and east–west, and wadi courses are structurallycontrolled in many areas. The two main subcatchmentsof Wadi Hudain are Faykouh and Naam, capturing flowsfrom the south and north, respectively, before their con-fluence into an east flowing main channel (Hudain) tothe Red Sea. The main channel trunk of Wadi Faykouhis shallow, wide, and relatively straight and of low gradi-ent as it passes through the low-relief areas. By contrast,Wadi Naam is deeply incised, narrower and more sinuous.
Due to the limited development of this hyper-arid area,rainfall and runoff gauging stations have not yet beeninstalled within the study area. The nearest meteorologi-cal station is located in Ras Benas 250 km to the north.The annual average rainfall here ranges from 0 to 25 mmwhich mostly falls during Spring and Autumn. The RedSea Mountains and southern Sinai are affected, mainly inAutumn, by convective storms resulting from the incur-sion of the African Monsoon. (i.e., the Active Red SeaTrough) (Krichak et al., 1997; Ziv et al., 2004; Dayan
Copyright 2009 John Wiley & Sons, Ltd. Hydrol. Process. 23, 1359–1368 (2009)DOI: 10.1002/hyp
INTEGRATION OF REMOTE SENSING AND GIS FOR MODELLING FLASH FLOODS 1361
and Morin, 2006). The absence of rainfall and dischargedata from the catchment hinders understanding of theinfrequent surface runoff; this understanding is essentialif the Government plans for runoff harvesting are to bemanaged sustainably. Only flash floods severe enoughto reach the coastal settlements are accounted for in theliterature. Currently, hydrological modelling of this catch-ment is fully empirical and does not consider the spatialand temporal variations of rainfall and runoff within thesub-catchments. However, most of the convective rain-fall cells are of local occurrence and are likely to affectonly a small part of the catchment headwaters, resultingin all runoff being lost in transmission into the under-lying alluvium before reaching the outlet at the coast.These events must be taken into account in planning therunoff harvesting systems required to implement the WadiHudain project.
Visual analysis of archived Landsat images availablefor this area (path 173/row 44—Worldwide ReferenceSystem) spanning the period from 1984 to 2000 revealsthe occurrence of several significant flash flood eventswhich were not recorded at the coastal outlet of the catch-ment. This highlights the inadequacy of current hydro-logical data for planning purposes, and also suggests thatthe rate of recharge of groundwater aquifers is currentlybeing underestimated.
DATA AND METHODS
The active channels and upslope contributing areas
The study area was extracted from the available Land-sat scenes (Table I). False colour composites of bands7 (2Ð08–2Ð35 µm, shortwave infrared) 4 (0Ð76–0Ð90 µmnear infrared) and 2 (0Ð52–0Ð60 µm visible green) dis-played as red, green and blue, were found to provide thebest overall discrimination of the channel surficial materi-als for mapping purposes. These bands were also selectedto minimise inter-band correlation, thereby maximisinginformation content of the resulting composite image.Following flow recession, fine sediments settle on top ofthe now dry channels and the spectral signatures exhibita contrasting brightness compared with the surroundingarea. Channels which have experienced recent flow caneasily be detected and mapped by the marked increase inbrightness along the length of the active reach. The width
Table I. Landsat satellite images available for the study area
Scene number Acquisition date Sensor Evidence of flashflood
1 01-10-1984 TM No2 05-11-1985 TM Yes4 05-12-1987 TM Yes5 08-03-1988 TM No6 07-03-1989 TM Yes7 17-12-1993 TM No8 06-09-1998 TM Yes9 06-11-2000 ETMC No
of the bright signature decreases in the downstream direc-tion, indicating attenuation of the flood peak, as wateris lost by infiltration into the channel bed. The recentlyactive channels are not necessarily the same in differentflood events, indicating that the subcatchments that con-tribute flow vary from one event to another. By usingincrease in channel brightness to map active channels,it is possible to determine the upslope flow-contributingareas for each flood event. The contributing area wasdetermined using a three-step process. First, the activechannels were identified from the satellite images. Thiswas done on the basis of brightness as described above.Second, within the active channel network, the conflu-ence points were mapped where active tributaries met.Third, the upslope contributing area was then delineatedfrom a point on the active channel just downstream ofthe lowest active confluence point. Namely, a pour pointcorresponding to this location was used as input to the‘watershed’ function in ArcGIS and used in combinationwith the flow accumulation grid to compute the activeupslope contributing area. In the model, the contributingareas developed depend upon the duration, intensity andspatial extent of the rainfall. Thus, larger, more intenseevents produce a greater runoff response. From the low-est confluence point it is assumed, in the model, that thewater will re-infiltrate into the wadi bed and the magni-tude of the flow will determine the distance over whichsurface flow will be maintained; larger runoff events willpropagate further down the channel. The likelihood of aflow event reaching the catchment outlet thus depends onthe size of the rainfall event and the antecedent channelconditions.
The four available Landsat scenes acquired in 1985,1987, 1989, and 1998, show clearly the occurrenceof recent channel runoff (Figure 2). The changes inspectral reflectance resulting from deposition of claydrape sediments are shown in Figure 3.
The spatially distributed time-area zones
Techniques for determining channel width, depth, andrepresentative grain sizes are well established in the liter-ature. Because of the time involved, the cost, and lack ofan accurate representation of the spatial variability withina catchment, alternative techniques for extracting chan-nel morphological properties from high resolution DEMshave been proposed (Smart et al., 2004). Although, thehigh resolution DEM is not available for this study area,the SRTM3 DEM (3 arc second resolution, ca 90 m cellsize in the study area) was used to measure the chan-nel width, depth and perimeter at several cross-sections(Table II). This resolution is not high enough to repre-sent an accurate cross-section (i.e. it does not capturethe small-scale terraces or leaves within the channels).However, most open channel methods require that chan-nel cross-sections are generalised prior to estimating flowcharacteristics (Hey, 1979), so SRTM3 data should pro-vide a reasonable approximation for the relatively largechannels considered here.
Copyright 2009 John Wiley & Sons, Ltd. Hydrol. Process. 23, 1359–1368 (2009)DOI: 10.1002/hyp

1362 M. EL BASTAWESY, K. WHITE AND A. NASR
Figure 2. Landsat TM and ETMC images of the Faykouh catchment in 1985, 1987, 1989 and 1998. See Table I for precise dates of image acquisition
Figure 3. Landsat spectral reflectance of pre- and post-flood channeldeposits
Overland and channel flow velocity was estimatedempirically using the Manning Equation:
V D(
�R0Ð67S0Ð5
n
)�1�
where V is the cross-sectional average velocity (m s�1);n is the Manning coeffiecent of roughness; R is thehydraulic radius (m); S is the slope of the water surface,which is assumed to be parallel to the slope of thechannel bed.
The widths of the channels at selected cross-sectionswere measured from the active channels mapped on thesatellite images. These selected cross-sections were over-laid on the DEM for the estimation of mean depth. Slopewas estimated from the DEM for reaches centred on theselected cross-sections. Hydraulic radius (which is nearlyequal to the depth of flow in shallow braided channel sys-tems in dryland areas (White, 1995)) was calculated fromthe measured cross-section areas and perimeter (Table II).Manning’s n was set to 0Ð02 for channels and 0Ð06 forhillslopes; these values are typical of reported values from
Copyright 2009 John Wiley & Sons, Ltd. Hydrol. Process. 23, 1359–1368 (2009)DOI: 10.1002/hyp
INTEGRATION OF REMOTE SENSING AND GIS FOR MODELLING FLASH FLOODS 1363
Table II. Parameters of the landsat active channels and DEM-derived cross- sections
Number Width(m)
Mean depth(m)
Cross section area (m2) Perimeter(m)
Hydraulic radius Slope percentage Runoff Velocity(m s�1)
1 540 1Ð5 810 543 0Ð67037 0Ð002929 1Ð72 540 1Ð33 718Ð2 542Ð5 0Ð755361 0Ð004903 2Ð93 630 1Ð14 718Ð2 632 0Ð879978 0Ð009117 4Ð34 450 0Ð8 360 452 1Ð255556 0Ð005618 4Ð35 450 0Ð6 270 451 1Ð67037 0Ð00856 5Ð16 450 0Ð8 360 451 1Ð252778 0Ð002346 2Ð87 270 0Ð3 81 270Ð6 3Ð340741 0Ð002 1Ð8
similar catchments (El Bastawesy, 2006). The flow direc-tion was derived from the DEM using the technique ofJenson and Domingue (1988). Since the D-8 flow direc-tion represents the direction of flow within each cell inthe catchment as either diagonal or orthogonal, and thegrid resolution is known, the cell flow length will beequal either to the grid cell length (L) or L
p2. The
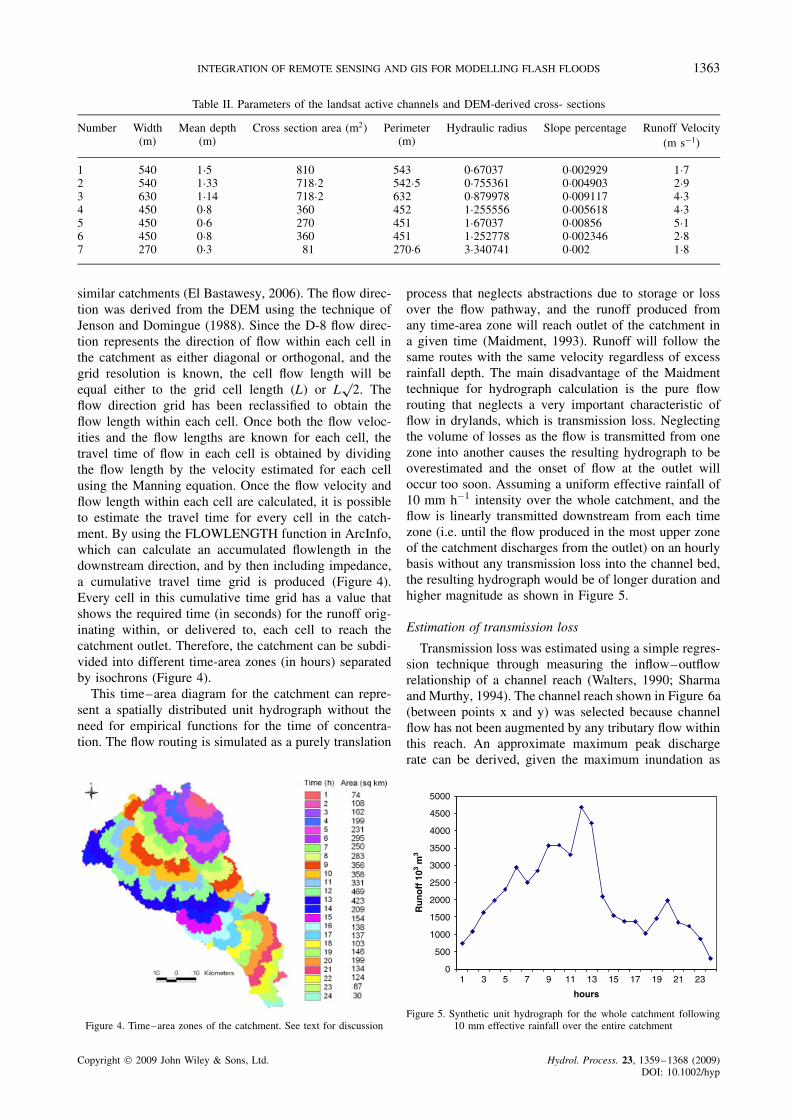
flow direction grid has been reclassified to obtain theflow length within each cell. Once both the flow veloc-ities and the flow lengths are known for each cell, thetravel time of flow in each cell is obtained by dividingthe flow length by the velocity estimated for each cellusing the Manning equation. Once the flow velocity andflow length within each cell are calculated, it is possibleto estimate the travel time for every cell in the catch-ment. By using the FLOWLENGTH function in ArcInfo,which can calculate an accumulated flowlength in thedownstream direction, and by then including impedance,a cumulative travel time grid is produced (Figure 4).Every cell in this cumulative time grid has a value thatshows the required time (in seconds) for the runoff orig-inating within, or delivered to, each cell to reach thecatchment outlet. Therefore, the catchment can be subdi-vided into different time-area zones (in hours) separatedby isochrons (Figure 4).
This time–area diagram for the catchment can repre-sent a spatially distributed unit hydrograph without theneed for empirical functions for the time of concentra-tion. The flow routing is simulated as a purely translation
Figure 4. Time–area zones of the catchment. See text for discussion
process that neglects abstractions due to storage or lossover the flow pathway, and the runoff produced fromany time-area zone will reach outlet of the catchment ina given time (Maidment, 1993). Runoff will follow thesame routes with the same velocity regardless of excessrainfall depth. The main disadvantage of the Maidmenttechnique for hydrograph calculation is the pure flowrouting that neglects a very important characteristic offlow in drylands, which is transmission loss. Neglectingthe volume of losses as the flow is transmitted from onezone into another causes the resulting hydrograph to beoverestimated and the onset of flow at the outlet willoccur too soon. Assuming a uniform effective rainfall of10 mm h�1 intensity over the whole catchment, and theflow is linearly transmitted downstream from each timezone (i.e. until the flow produced in the most upper zoneof the catchment discharges from the outlet) on an hourlybasis without any transmission loss into the channel bed,the resulting hydrograph would be of longer duration andhigher magnitude as shown in Figure 5.
Estimation of transmission loss
Transmission loss was estimated using a simple regres-sion technique through measuring the inflow–outflowrelationship of a channel reach (Walters, 1990; Sharmaand Murthy, 1994). The channel reach shown in Figure 6a(between points x and y) was selected because channelflow has not been augmented by any tributary flow withinthis reach. An approximate maximum peak dischargerate can be derived, given the maximum inundation as
0
500
1000
1500
2000
2500
3000
3500
4000
4500
5000
1 3 5 7 9 11 13 15 17 19 21 23
hours
Ru
no
ff 1
03 m3
Figure 5. Synthetic unit hydrograph for the whole catchment following10 mm effective rainfall over the entire catchment
Copyright 2009 John Wiley & Sons, Ltd. Hydrol. Process. 23, 1359–1368 (2009)DOI: 10.1002/hyp
1364 M. EL BASTAWESY, K. WHITE AND A. NASR
recorded on the satellite image and a rough estimate ofthe channel topography from the DEM. The downstreamreduction of the maximum peak discharge was estimatedat different cross-sections downstream of x. The transmis-sion loss rate (mm h�1) in the modelled channel reachwas estimated, using the generated time area zone (i.e.flow travel times) and the active channels areas (km2) forthis reach.
RESULTS
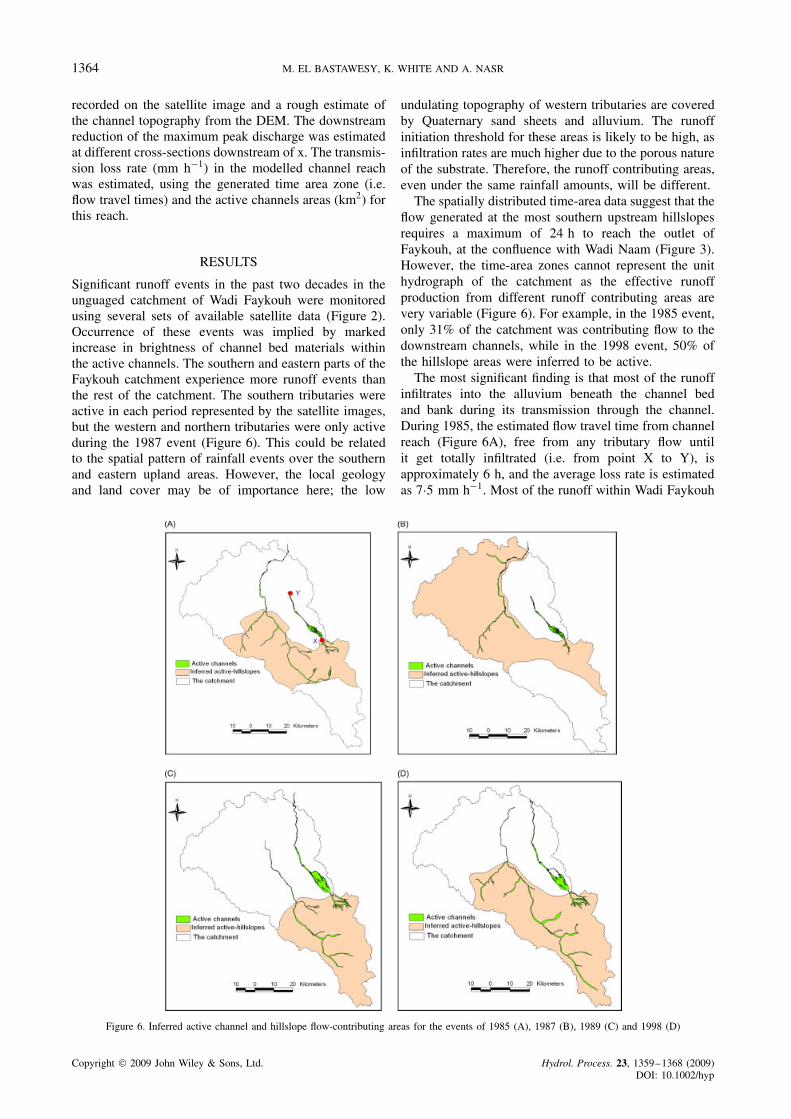
Significant runoff events in the past two decades in theunguaged catchment of Wadi Faykouh were monitoredusing several sets of available satellite data (Figure 2).Occurrence of these events was implied by markedincrease in brightness of channel bed materials withinthe active channels. The southern and eastern parts of theFaykouh catchment experience more runoff events thanthe rest of the catchment. The southern tributaries wereactive in each period represented by the satellite images,but the western and northern tributaries were only activeduring the 1987 event (Figure 6). This could be relatedto the spatial pattern of rainfall events over the southernand eastern upland areas. However, the local geologyand land cover may be of importance here; the low
undulating topography of western tributaries are coveredby Quaternary sand sheets and alluvium. The runoffinitiation threshold for these areas is likely to be high, asinfiltration rates are much higher due to the porous natureof the substrate. Therefore, the runoff contributing areas,even under the same rainfall amounts, will be different.
The spatially distributed time-area data suggest that theflow generated at the most southern upstream hillslopesrequires a maximum of 24 h to reach the outlet ofFaykouh, at the confluence with Wadi Naam (Figure 3).However, the time-area zones cannot represent the unithydrograph of the catchment as the effective runoffproduction from different runoff contributing areas arevery variable (Figure 6). For example, in the 1985 event,only 31% of the catchment was contributing flow to thedownstream channels, while in the 1998 event, 50% ofthe hillslope areas were inferred to be active.
The most significant finding is that most of the runoffinfiltrates into the alluvium beneath the channel bedand bank during its transmission through the channel.During 1985, the estimated flow travel time from channelreach (Figure 6A), free from any tributary flow untilit get totally infiltrated (i.e. from point X to Y), isapproximately 6 h, and the average loss rate is estimatedas 7Ð5 mm h�1. Most of the runoff within Wadi Faykouh
Figure 6. Inferred active channel and hillslope flow-contributing areas for the events of 1985 (A), 1987 (B), 1989 (C) and 1998 (D)
Copyright 2009 John Wiley & Sons, Ltd. Hydrol. Process. 23, 1359–1368 (2009)DOI: 10.1002/hyp

INTEGRATION OF REMOTE SENSING AND GIS FOR MODELLING FLASH FLOODS 1365
is completely lost before reaching the outlet of thecatchment. Only during the 1989 event did runoff exitthe catchment of Wadi Faykouh into Wadi Hudain andreach the alluvial fan and Shalateen. Therefore, most ofthe runoff in Wadi Faykouh catchment appears to bepercolating into underlying alluvial aquifer.
Sensitivity analysis
The above results demonstrate significant differencesin flow activity in response to different rainfall events.This suggests that rainfall patterns within the catchmentare also variable, each storm delivering rainfall to adifferent part of the catchment. Therefore, it is importantto investigate the influence of local rainfall distributionand consequent patterns of transmission loss on runoffpropagation. To do this, we apply a hypothetical rainfallevent of 10 mm h�1, which is widely agreed to be theminimum threshold required to initiate runoff (Cookeet al., 1982; Beven, 2002), which covers a small part(159 km2)of the Faykouh catchment (4957 km2), in orderto simulate runoff propagation and transmission lossinto the main channel that receives no tributary flow(Figure 7). Once the overland flow reaches the channel,the channel flow was routed toward the outlet. The flowrouting is based on the following assumptions:
1. The rainfall excess generated in each cell flows out inone direction along the steepest slope (D-8 algorithm)until it reach the catchment outlet.
2. The routed cell flow does not interact or affect anyflows from other cells sharing the same flow path.
Therefore, the calculated flow velocity at a givenlocation will be constant as it is based on a fixedhydraulic radius at a given cross-section. To investigatemodel sensitivity to transmission loss, the model wasrun using different transmission loss rates of 10, 20, 30,40, 50 and 60 mm h�1. The hydrograph modelled frompartial rainfall coverage (Figure 8) is totally differentfrom that modelled when the storm covers the entirecatchment (Figure 5). The incorporation of transmissionloss into the flood propagation model significantly altersthe hydrograph magnitudes and timing. For example,a transmission loss rate of 10 mm h�1 would be lowenough for runoff produced by rainfall intensity of10mm h�1 in the catchment headwater area to propagatethrough a channel reach of 46 km length and reach theoutlet (Figure 7). At the cross-section (P1 in Figure 7),the estimated amount of runoff produced from thatevent is 2Ð89 million m3 with a peak discharge rateof 196 m3 s�1, but at the outlet (P3) the total runoffvolume estimated was 0Ð64 million m3 and the estimatedpeak discharge rate was 38 m3 s�1, therefore, 78% ofthe estimated runoff was lost during transmission fromthe upper reach of the channel to the outlet. When thetransmission loss rate reaches 60 mm h�1, under the samestorm coverage and intensity, the runoff cannot reach the
P1
P2
P3
25 0 25 Km12.5
Non-active channel
The catchment
Storm coverage
Active channel
Figure 7. Map showing the location of a hypothetical local storm of 10 mm effective rainfall over the headwaters of the catchment
Copyright 2009 John Wiley & Sons, Ltd. Hydrol. Process. 23, 1359–1368 (2009)DOI: 10.1002/hyp

1366 M. EL BASTAWESY, K. WHITE AND A. NASR
0
100
200
300
400
500
600
700
800
900
1 3 6 7
Runoff duration (hour)
Dis
char
ge
( 103
m3 )
50 mm/h
40 mm/h30 mm/h20 mm/h
10 mm/h
2 4 5
Figure 8. Sensitivity of runoff hydrograph generated from storm inFigure 7 to varying transmission loss rates
outlet and totally disappears at the cross-section P2 inFigure 7.
DISCUSSION
Understanding the response of dryland catchments torainfall events is essential in order to assess the impactof flash floods on the increasing anthropogenic activitieswithin these catchments. The southern coastal zone ofHalayeb and Shalateen has recently attracted the attentionof developers, and sustainable development plans are inthe process of being implemented. Currently, accessibilityto this sensitive area on the Sudanese border is restrictedand heavily controlled by the military. Remote sensingdata are vital in such situations when field data aredifficult to obtain. Remote sensing data have been usedto delineate active channels in different events. This ispossible due to the higher reflectance of fine sediments,laid down during the final stages of flood recession.Although transient, the resulting higher albedo can lastfor several months before being removed by aeolianerosion processes. Figure 9 shows the removal of finesediment in the channel between December 1987 and
March 1988. The preservation conditions can be variablefrom one channel to another and even within the samechannel, due to the availability of fine sediment, themagnitudes and reoccurrence intervals of floods, andbiological activity within the catchments.
The available Landsat TM and ETMC data archives forthis area were used to recognise recent flash flood eventswithin the channels. The southern subcatchment of WadiFaykouh appears to experience more flash floods thanthat of Wadi Naam. This may be related to monsoonalincursions into the southern Red Sea area in Egypt.The active channel cross-sectional areas were estimatedfrom these images and used as input to a simple open-channel flow equation (Manning) that has been widelyused for both overland and channel flow estimationfor both dryland and humid catchments (O’Connor andWebb, 1988; Rico, et al., 2001; Liu et al., 2003). Theisochron zones of the catchment (Maidment, 1993) weredelineated and used to model flow propagation throughthe catchment. The accuracy and resolution of the DEM(Wolock and Price, 1994; Zhang and Montgomery, 1994)and other hydrological parameters (e.g. Manning’s n)(Arcement and Schneider, 1989) has a significant effecton the catchment hydrograph, but the sensitivity of modeloutput to these parameters is addressed elsewhere (ElBastawesy, 2005). In addition, the application of theManning equation to dryland channels induces someuncertainty, e.g. hydraulic radius has to be estimated firstbefore calculating the flow; in reality the hydraulic radiusvaries with flow stage. At the beginning of flow, onlya fraction of the total bankfull channel cross-section isconveying flow. This increases until, at bankfull stage,the complete cross-section is inundated. Following peakflow, the active cross-sectional area starts to decrease.Thus, the active channel cross-sections are spatially andtemporally variable over the catchment, although it isconsidered temporally constant during flow routing in themodel developed here. For perennial channels, hydraulicradius, channel resistance and flow velocity can all bemeasured at cross-sections for different flow stages that
Figure 9. Decrease of reflectance within the Wadi Faykouh channel from December 1987 (left) to March 1988 (right), resulting from Aeolian erosionof the residual fine alluvium deposited during the recession stage of a flash flood
Copyright 2009 John Wiley & Sons, Ltd. Hydrol. Process. 23, 1359–1368 (2009)DOI: 10.1002/hyp

INTEGRATION OF REMOTE SENSING AND GIS FOR MODELLING FLASH FLOODS 1367
are sustained for a sufficient period of time to allowmonitoring. For dryland channels, however, such anevaluation requires a flow event to occur, and these maybe spaced several years apart.
Magnitudes of flash floods are controlled by a com-bination of rainfall characteristics (amount, intensity,duration and distribution over the catchment). Addition-ally, local lithological and geomorphological conditionsalso influence the runoff production within the catch-ment, even under the same meteorological conditions.The event of 1989 was very extreme as it delivered runofffrom Wadi Faykouh to the alluvial fan and Shalateen, butfollowing events were of more local influence. In general,the whole catchment is unlikely to be uniformly affectedby an individual storm. Therefore, the flow-productinghillslope areas will be different from one storm to another(Figure 10). It is clearly evident from this research thatdifferent hydrographs are produced from different eventswithin the same catchment, due to the spatial variabil-ity of runoff-contributing areas within the catchment as afunction of storm pattern, orientation, intensity and dura-tion (Singh, 1997). This temporal and spatial variation inrunoff processes makes it extremely difficult to generalisea standard conceptual model for dryland catchments. Thishas given rise to a plethora of hydrological models whichincorporate different elements.
It is entirely possible that more than one rainfallevent has occurred between acquisition of the successiveimages used for this research. This could result in errorsin discriminating the contributing hillslopes. However, asFigure 9 demonstrates, the fine sediments deposited in thefalling stages of a flood do not persist for a great lengthof time, and given the infrequent occurrence of runoff-producing storms in hyperarid areas relative to frequencyof image data acquisition by suitable remote sensinginstruments (e.g. Landsat, ASTER, SPOT etc.), this
Figure 10. Subsets of Figure 2a (upper) and c (lower) show the temporaland spatial variation in runoff of different events
should not be a major problem for wider implementationof this method.
Transmission loss significantly reduces the volumes ofrunoff. The majority of runoff events produced upstream,particularly in dryland catchments of thousands of squarekilometres surface area, will not reach the outlet. Manyflash flood models ignore this critical process and over-estimate runoff because they model the hydrograph assimply the gross runoff production from the different landcover units within the catchments (Costa, 1987; Gheithand Sultan, 2002; Foody et al., 2004). The overland flowproduction is lumped from the whole catchment, and therole of channel networks, underlying rock units, geom-etry and pattern is too often overlooked. Realistically, adryland hydrological modelling approach should be semi-distributed, not just for overland flow production, butalso for the subsequent channel routing and transmissionloss. Such models can be implemented using existing GIStechniques, as outlined in this paper. However, the sim-ulated hydrographs, whether produced for the whole orpart of the catchment (Figure 8), cannot be tested becausethere are no flow observations. This is why the methodhas been developed and this research has the potentialof investigating the multi-temporal satellite images todefine the occurrence of floods in arid and hyper-aridareas where installing and maintaining instrumentation isdifficult. As part of the next phase of research, the methoddeveloped in this study can be applied to an instrumenteddryland catchment for validation. The satellite imagesacquired shortly before and after the occurrence of keyflash flood events along with the DEM can be used tosimulate the runoff hydrographs.
CONCLUSION AND RECOMMENDATIONS
Multi-temporal analysis of active channels affected byrecent flash floods is possible using imagery from theLandsat TM/ETMC archive. These data are used, alongwith DEM derivatives, in a GIS for the determinationof synthetic spatially distributed time area-zones of thecatchment. However, the use of these zones to estimatethe unit hydrograph for larger dryland catchments canbe misleading. The catchment-scale storm pattern, theunderlying geology, landcover and geomorphology, andchannel transmission loss all have a significant effect onrunoff production. Runoff within larger catchments canbe completely lost into the underlying channel alluviumbefore reaching the outlet. The use of remote sensingdata and GIS models has great potential for modellingflash floods in drylands, by identifying the active sub-catchments, and routing the resultant flows down throughthe catchment. We recommend that dryland hydrologicalmodelling should take advantage of the increasing avail-ability of high spatial and temporal resolution satelliteimages, so that flash flood protection measures can beproperly managed and allocated. This will also maximisethe benefits of the limited water resources available indrylands.
Copyright 2009 John Wiley & Sons, Ltd. Hydrol. Process. 23, 1359–1368 (2009)DOI: 10.1002/hyp
1368 M. EL BASTAWESY, K. WHITE AND A. NASR
REFERENCES
Arcement GJ, Schneider VR. 1989. Guide for selecting Manning’sroughness coefficients for natural channels and flood plains. UnitedStates Geological Survey Water-supply Paper 2339.
Baker VR. 1987. Paleoflood hydrology and extraordinary flood events.Journal of Hydrology 96: 79–99.
Benito G, Thorndycraft VR. 2005. Palaeoflood hydrology and its role inapplied hydrological. Journal of Hydrology 313: 3–15.
Beven K. 2002. Runoff generation in semi-arid areas. In DrylandRivers, Hydrology and Geomorphology of Semi-arid Channels , Bull LJ,Kirkby MJ (eds). John Wiley and Sons: Chichester; 57–105.
Cooke RU, Brunsden D, Doornkamp JC. 1982. Urban Geomorphologyin Drylands . Oxford University Press: Oxford.
Costa JE. 1987. Hydraulics and basin morphometry of the largest flashfloods in the conterminous United States. Journal of Hydrology 93:313–338.
Dayan U, Morin E. 2006. Flash flood–producing rainstorms over theDead Sea: a review. Geological Society of America Special Paper 401.
El Bastawesy M. 2005. Development of a GIS-based hydrological modelfor the hyper-arid catchment of Wadi Haymour . Unpublished PhDthesis, University of Reading, UK.
El Bastawesy M. 2006. Influence of DEM source and resolution on thehydrographical simulation of Wadi Keed catchment, Southern Sinia,Egypt. The Egyptian Journal of Remote Sensing and Space Science 9:68–79.
El-Etr HA, El-Rakaiby Ml, Ashmawy MH, Abdel Tawab S, Ham-dan AH, Saleh A. 1991. Mitigation of flash flood hazards, Egypt.Academy of Scientific Research and Technology-UNDP/UNDROProject No. EGY/87/002/B/01/31, Cairo.
El Gebali, H. 2001. Sustainable development of the Red Sea Governorate,Egypt. Urban development strategy in Arab cites Conference, KingSaud University Scientific Repository.
Foody GM, Ghoneim E M, Arnell NW. 2004. Predicting locationssensitive to flash flooding in an arid environment. Journal of Hydrology292: 48–58.
Gheith H, Sultan M. 2002. Construction of a hydrologic model for theestimating wadi runoff and groundwater recharge in the Eastern Desert,Egypt. Journal of Hydrology 263: 36–55.
Goodrich DC, Lane LJ, Shillito RM, Miller SN, Syed KH, Wool-hiser DA. 1997. Linearity of basin response as a function of scalein a semi-arid watershed. Water Resources Research 33: 2951–2965.
Hey RD. 1979. Flow resistance in gravel-bed rivers. Journal of theHydraulics Division, HY4 105: 365–379.
Jenson SK, Domingue JO. 1988. Extracting topographic structure fromdigital elevation data for geographical information system analysis.Photogrammetric Engineering and Remote Sensing 54: 1593–1600.
Kim J, Sultan M. 2002. Assessment of the long term hydrologic impactsof Lake Nasser and related irrigation projects in southwestern Egypt.International Journal of Hydrology 262: 68–83.
Krichak SO, Alpert P, Krishnamurti TN. 1997. Red Sea trough/cyclonedevelopment—numerical investigation. Meteorology and AtmosphericPhysics 63: 153–170.
Lange J, Leibundgut Ch, Greenbaum N, Schick AP. 1999. A noncali-brated rainfall-runoff model for large, arid catchments. Water ResourcesResearch 35(7): 2161–2172.
Liu YB, Gebremeskel S, De Smedt F, Hoffmann L, Pfister L. 2003.A diffusive transport approach for flow routing in GIS-based floodmodelling. International Journal of Hydrology 283: 91–106.
Maidment DR. 1993. HydroGIS 93: application of geographicalinformation system in hydrology and water resources. Proceeding ofthe Vienna Conference. IAHS Publication No. 211.
McMahon TA. 1979. Hydrological characteristics of arid zones. In TheHydrology of Areas of Low Precipitation, Proceedings of CanberraSymposium. IAHS Publication 128; 105–123.
O’Connor JE, Webb RH. 1988. Hydraulic modelling for palaeofoodanalysis. In Flood Geomorphology , Baker VR, Kochel RC, Patton PC(eds). Wiley Interscience: New York; 383–402.
Rezacova D, Sokol Z, Pesice P. 2007. A radar-based verification ofprecipitation forecast for local convective storms. AtmosphericResearch 83: 211–224.
Rico M, Benito G, Barnolas A. 2001. Combined palaeoflood andrainfall–runoff assessment of mountain floods (Spanish Pyrenees).International Journal of Hydrology 245: 59–72.
Sadek M F. 2004. Discrimination of basement rocks and alteration zonesin Shalatein area, Southeastern Egypt, using Landsat TM imagery data.Egyptian Journal of Remote Sensing and Space Sciences 7: 89–98.
Sharma KD, Murthy JSR. 1994. Estimating transmission losses in anarid region- a realistic approach. Journal of Arid Environments 27:107–112.
Sharma KD, Singh S. 1992. Runoff estimation using Landsat thematicMapper data and the SCS model. Hydrological Science Journal 37:39–52.
Singh VP. 1997. Effect of spatial and temporal variability in rainfalland watershed characteristics on stream flow hydrograph. Journal ofHydrological Processes 11: 1649–1669.
Smart G, Aberle J, Duncan M, Walsh J. 2004. Measurement and analysisof alluvial bed roughness. Journal of Hydraulic Research 42(3):227–237.
Sorman AU, Abdulrazzak MJ. 1993. Infiltration-recharge through wadibeds in arid regions. Hydrological Science Journal 38: 173–186.
Tooth S. 2000. Process, form and change in dryland rivers: a review ofrecent research. Earth-Science Reviews 51: 67–107.
Walters M. 1990. Transmission losses in arid regions. Journal ofHydraulic Engineering 116(1): 129–138.
Wheater HS, Woods BB, Jolley TJ. 1997. An integrated model ofarid zone water resources: evaluation of rainfall-runoff simulationperformance. IAHS Publication 240; 395–405.
White K. 1995. Field techniques for estimating downstream changes indischarge of gravel-bedded ephemeral streams: a case study in southernTunisia. Journal of Arid Environments 30: 283–294.
Wolock DM, Price CV. 1994. Effects of digital elevation map scale anddata resolution on a topographically based watershed model. WaterResources Research 30: 3041–3052.
Xinmei H, Lyons TJ, Smith RC, Hacker JM. 1995. Estimation of landsurface parameters using satellite data. Jourrnal of HydrologicalProcesses 9: 631–643.
Yair A. 1983. Hillslope hydrology, water harvesting and aerialdistribution of some ancient agriculture systems, northern Negev,Israel. Journal of Arid Environments 6: 283–301.
Yair A. 1992. The control of headwater area on channel runoff in a smallarid catchment. In Overland Flow Hydraulics and Erosion Mechanics ,Parsons AJ, Abrahams AD (eds). UCL Press: London.
Yair A, Lavee H. 1985. Runoff generation in arid and semiarid zones. InHydrological Forecasting , Anderson MG, Burt TP (eds). John Wileyand Sons: Chichester; 183–220.
Zhang W, Montgomery DR. 1994. Digital elevation model gridsize, landscape representation, and hydrological simulations. WaterResources Research 30: 1019–1028.
Ziv B, Dayan U, Sharon D. 2004. A mid-winter, tropical extremeflood producing storm in southern Israel: synoptic scale analysis.Meteorology and Atmospheric Physics 88: 53–63.
Copyright 2009 John Wiley & Sons, Ltd. Hydrol. Process. 23, 1359–1368 (2009)DOI: 10.1002/hyp