
Estimating Pairwise Statistical Significance of Protein Local Alignments Using a...
12
Estimating Pairwise Statistical Significance of Protein Local Alignments Using a Clustering-Classification Approach Based on Amino Acid Composition Ankit Agrawal 1 , Arka Ghosh 2 , and Xiaoqiu Huang 1 1 Department of Computer Science, Iowa State University, 226 Atanasoff Hall, Ames, IA 50011-1041, USA {ankitag,xqhuang}@iastate.edu 2 Department of Statistics, Iowa State University, 303 Snedecor Hall Ames, IA, 50011-1210, USA [email protected] Abstract. A central question in pairwise sequence comparison is as- sessing the statistical significance of the alignment. The alignment score distribution is known to follow an extreme value distribution with ana- lytically calculable parameters K and λ for ungapped alignments with one substitution matrix. But no statistical theory is currently available for the gapped case and for alignments using multiple scoring matri- ces, although their score distribution is known to closely follow extreme value distribution and the corresponding parameters can be estimated by simulation. Ideal estimation would require simulation for each sequence pair, which is impractical. In this paper, we present a simple clustering- classification approach based on amino acid composition to estimate K and λ for a given sequence pair and scoring scheme, including using mul- tiple parameter sets. The resulting set of K and λ for different cluster pairs has large variability even for the same scoring scheme, underscoring the heavy dependence of K and λ on the amino acid composition. The proposed approach in this paper is an attempt to separate the influence of amino acid composition in estimation of statistical significance of pair- wise protein alignments. Experiments and analysis of other approaches to estimate statistical parameters also indicate that the methods used in this work estimate the statistical significance with good accuracy. Keywords: Clustering, Classification, Pairwise local alignment, Statis- tical significance. 1 Introduction Sequence alignment is extremely useful in the analysis of DNA and protein sequences [1]. Sequence alignment forms the basic step of making various high level inferences about the DNA and protein sequences - like homology, finding protein function, protein structure, deciphering evolutionary relationships, etc. I. M˘ andoiu, R. Sunderraman, and A. Zelikovsky (Eds.): ISBRA 2008, LNBI 4983, pp. 62–73, 2008. c Springer-Verlag Berlin Heidelberg 2008
-
Upload
independent -
Category
Documents
-
view
2 -
download
0
Transcript of Estimating Pairwise Statistical Significance of Protein Local Alignments Using a...

Estimating Pairwise Statistical Significance of
Protein Local Alignments Using aClustering-Classification Approach Based on
Amino Acid Composition
Ankit Agrawal1, Arka Ghosh2, and Xiaoqiu Huang1
1 Department of Computer Science, Iowa State University,226 Atanasoff Hall, Ames, IA 50011-1041, USA
{ankitag,xqhuang}@iastate.edu2 Department of Statistics, Iowa State University, 303 Snedecor Hall
Ames, IA, 50011-1210, [email protected]
Abstract. A central question in pairwise sequence comparison is as-sessing the statistical significance of the alignment. The alignment scoredistribution is known to follow an extreme value distribution with ana-lytically calculable parameters K and λ for ungapped alignments withone substitution matrix. But no statistical theory is currently availablefor the gapped case and for alignments using multiple scoring matri-ces, although their score distribution is known to closely follow extremevalue distribution and the corresponding parameters can be estimated bysimulation. Ideal estimation would require simulation for each sequencepair, which is impractical. In this paper, we present a simple clustering-classification approach based on amino acid composition to estimate Kand λ for a given sequence pair and scoring scheme, including using mul-tiple parameter sets. The resulting set of K and λ for different clusterpairs has large variability even for the same scoring scheme, underscoringthe heavy dependence of K and λ on the amino acid composition. Theproposed approach in this paper is an attempt to separate the influenceof amino acid composition in estimation of statistical significance of pair-wise protein alignments. Experiments and analysis of other approachesto estimate statistical parameters also indicate that the methods used inthis work estimate the statistical significance with good accuracy.
Keywords: Clustering, Classification, Pairwise local alignment, Statis-tical significance.
1 Introduction
Sequence alignment is extremely useful in the analysis of DNA and proteinsequences [1]. Sequence alignment forms the basic step of making various highlevel inferences about the DNA and protein sequences - like homology, findingprotein function, protein structure, deciphering evolutionary relationships, etc.
I. Mandoiu, R. Sunderraman, and A. Zelikovsky (Eds.): ISBRA 2008, LNBI 4983, pp. 62–73, 2008.c© Springer-Verlag Berlin Heidelberg 2008

Estimating Pairwise Statistical Significance of Protein Local Alignments 63
There are many programs that use some well known algorithms [2,3] or theirheuristic version [1,4,5]. Recently, some enhancements in alignment programfeatures have also become available [6,7] using difference blocks and multiplescoring matrices. Quality of a pairwise sequence alignment is gauged by thestatistical significance rather than the alignment score alone, i.e., if an alignmentscore has a low probability of occurring by chance, the alignment is consideredstatistically significant.
For ungapped alignments, rigorous statistical theory for the alignment scoredistribution is available [8], and it was shown that the statistical parameters Kand λ can be calculated analytically for a pair of sequences with given amino acidcomposition and scoring scheme. However, no perfect theory currently exists forgapped alignment score distribution, and for score distributions from alignmentprograms using additional features like difference blocks [6], and which use mul-tiple parameter sets [7]. The problem of accurately determining the statisticalsignificance of gapped sequence alignment has attracted a lot of attention in therecent years [9,10,11,12,13,14,15]. There exist a couple of good starting pointsfor statistically describing gapped alignment score distributions [16,17], but acomplete mathematical description of the optimal scores distribution remainsfar from reach [17]. Some excellent reviews on statistical significance in sequencecomparison are available in the literature [18,19,20].
The statistical significance of a pairwise alignment depends upon various fac-tors sequence alignment method, scoring scheme, sequence length, and sequencecomposition [19]. The straightforward way to estimate statistical significance ofscores from an alignment program for which the statistical theory is unavailableis to generate a distribution of alignment scores using the program with ran-domly shuffled versions of the pair of sequences, and compare the obtained scorewith the generated score distribution, either directly or by fitting an extremevalue distribution (EVD) curve (explained in the next section) to the generateddistribution to get the EVD parameters K and λ, and using the EVD formulawith the estimated K and λ to calculate the statistical significance of the ob-tained score. However, the parameters thus obtained are ideally valid only forthe specific sequence pair under consideration, and for any other sequence pair,the parameters should be recomputed by generating another distribution, whichis very time-consuming and impractical.
Thus, BLAST2.0 [1] uses a lookup method wherein the parameters K andλ are pre-computed for different scoring schemes assuming average amino acidcomposition of both sequences. PRSS program in the FASTA package [4,5,9]calculates the statistical significance of an alignment by aligning them, shufflingthe second sequence up to 1000 times, and estimating the statistical significancefrom the distribution of shuffled alignment scores. It uses maximum likelihoodto fit an EVD to the shuffled score distribution. A similar approach is also usedin HMMER [21]. It also uses maximum likelihood fitting [22] and also allowsfor censoring of data left of a given cutoff, for fitting only the right tail of thehistogram. A heuristic approximation of the gapped local alignment score dis-tribution is also available [10], and based on these statistics, accurate formulae

64 A. Agrawal, A. Ghosh, and X. Huang
for statistical parameters K and λ for gapped alignments are derived and im-plemented in a program called ARIADNE [11]. These methods can provide anaccurate estimation of statistical significance for gapped alignments, but cur-rently do not incorporate the additional features of sequence alignment, likeusing difference blocks and multiple parameter sets [6,7].
The problem of estimating the statistical significance of the database searcheshas been addressed in much detail over the past two decades as discussed earlier.However, accurate estimation of the statistical significance of specific pairwisealignments needs directed research efforts. It is an important problem critical incomparison of various alignment programs, and especially with new alignmentprograms coming up with additional features to suit the features of the real bio-logical sequences, this problem of estimating statistical significance for pairwisesequence alignments becomes particularly important. It has also been shown re-cently [23] that pairwise statistical significance is a better indicator of homologythan database statistical significance. The method used in [23], although wasshown to be accurate, but is also very time-consuming, as it involves generat-ing a score distribution of tens of thousands of alignments. The need for fastermethods for estimating pairwise statistical significance was also stressed in [23].
In this paper, we propose and implement a simple clustering-classificationapproach that clusters the universe of protein sequences based on amino acidcomposition, and estimates the parameters K and λ for all cluster pairs fordifferent scoring schemes and alignment methods. In this way, we attempt toseparate the dependence of the statistical parameters K and λ on amino-acidcomposition from other factors like alignment method and scoring schemes. Thetask of estimating statistical significance thus reduces to classifying the sequencesto appropriate clusters, and using the corresponding K and λ values of theclassified cluster pair. This approach is similar to the lookup method used inBLAST2.0 [1] but takes into account the features of the specific sequence pairbeing aligned. For simple alignment methods, the results are also presented usingother approaches (PRSS [4,5,9] and ARIADNE [11]), and for advanced alignmentmethods [6,7] currently no other quick methods are available to estimate pairwisestatistical significance except the method described in this paper.
2 The Extreme Value Distribution for Ungapped andGapped Alignments
Just as the distribution of the sum of a large number of independent identicallydistributed (i.i.d) random variables tends to a normal distribution (central limittheorem), the distribution of the maximum of a large number of i.i.d. randomvariables tends to an extreme value distribution (EVD). This is an importantfact, because it allows us to fit an EVD to the score distribution from any localalignment program, and use it for estimating statistical significance of scoresfrom that program. The distribution of Smith-Waterman local alignment scorebetween random, unrelated sequences is approximately a Gumbel-type EVD [8].In the limit of sufficiently large sequence lengths m and n, the statistics of HSP

Estimating Pairwise Statistical Significance of Protein Local Alignments 65
(High-scoring Segment Pairs which correspond to the ungapped local alignment)scores are characterized by two parameters, K and λ. The probability that theoptimal local alignment score S exceeds x is given by
Pr(S > x) ∼ 1 − exp[−Kmne−λx]
This is valid for ungapped alignments [8], and the parameters K and λ can becomputed analytically from the substitution scores and sequence compositions.An important point here is that this scheme allows for the use of only onesubstitution matrix. For the gapped alignment, no perfect statistical theory hasyet been developed, although there is ample evidence that it also closely followsan extreme value distribution [9,11,24,7].
3 Clustering-Classification Approach
This paper presents a simple clustering-classification approach based on aminoacid composition for estimating statistical significance of pairwise protein localalignments, which is essentially an enhanced lookup method, where K and λvalues are pre-computed for each cluster pair by simulation. Subsequently, for agiven sequence pair, the sequences are individually classified to the correspondingclusters based on their amino acid composition, and the K and λ parameters forthe cluster pair are used for statistical significance calculation of alignments ofthe sequence pair.
3.1 Clustering
There are many algorithms available for clustering like hierarchical clustering,k-means clustering, etc. [25]. Here we are dealing with clustering the universe ofprotein sequences whose number is in hundreds of thousands. Therefore, we usek-means clustering as hierarchical methods typically involve the computation ofa distance matrix of quadratic complexity with respect to the input size. In thiswork, we have used the k-means implementation in R package [26]. Each of the kclusters of sequences is represented by a single representative sequence (centralsequence), and subsequently the parameters K and λ are computed for each pairof the k representative sequences. Given below a pseudo code for the clusteringmodule:
alphabet = "ACDEFGHIKLMNPQRSTVWY" #protein alphabet (amino acids)
sequences4R = set of sequences to be clustered
nSeq = number of sequences
for (i in 1:nSeq) {
seqArray = sequences4R[i]
lenSeq=length(seqArray)
for (j in 1:lenAlphabet-1) {
AACounts[i,j] = number of occurrences of amino acid alphabet[j] in seqArray
}
AAComposition[i,]=AACounts[i,]/lenSeq
}
66 A. Agrawal, A. Ghosh, and X. Huang
k = number of clusters
seqClusters = clustered sequences based on AAComposition
for (i in 1:k) {
clust_reprSeq[i] = representative sequence of cluster[i]
}
for (i in 1:k) {
for (j in 1:i) {
Compute the value of K and lambda by empirical simulation
K_clusters[i,j] = K_clusters[j,i] = estimated K
lambda_clusters[i,j] = lambda_clusters[j,i] = estimated lambda
}
}
3.2 Classification
Given two protein sequences for estimation of statistical parameters, they areclassified individually to the appropriate clusters. Each of the k clusters ob-tained in the clustering step have their center, which corresponds to the centralamino acid composition for that cluster. A sequence is classified to the clusterthat minimizes the sum of squares of differences between the amino acid com-position of the sequence and the central amino acid composition of the cluster.Subsequently, the pre-computed K and λ values for the classified cluster pairare used for the statistical significance estimation of alignments of the two inputsequences. Given below a pseudo code for the classification module:
alphabet = "ACDEFGHIKLMNPQRSTVWY"
sequences4R = set of two sequences for which K and lambda is to be estimated
nSeq = 2
for (i in 1:nSeq) {
seqArray = sequences4R[i]
lenSeq=length(seqArray)
for (j in 1:lenAlphabet-1) {
AACounts[i,j] = number of occurrences of amino acid alphabet[j] in seqArray
}
AAComposition[i,]=AACounts[i,]/lenSeq
}
k = number of clusters
for (j in 1:nSeq) {
classifiedCluster[j] = classified cluster based on AAComposition
}
estimatedK = K_clusters[classifiedCluster[1],classifiedCluster[2]]
estimatedLambda=lambda_clusters[classifiedCluster[1],classifiedCluster[2]]
4 Tools and Programs Used
We worked with the alignment programs SIM [27], which is an ordinary align-ment program (similar to SSEARCH), and GAP4 [7], which allows dynamically
Estimating Pairwise Statistical Significance of Protein Local Alignments 67
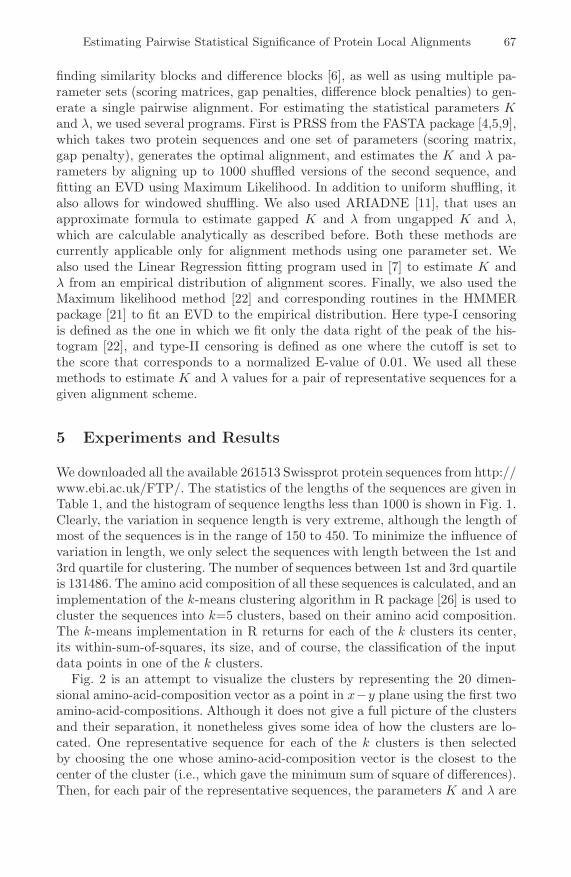
finding similarity blocks and difference blocks [6], as well as using multiple pa-rameter sets (scoring matrices, gap penalties, difference block penalties) to gen-erate a single pairwise alignment. For estimating the statistical parameters Kand λ, we used several programs. First is PRSS from the FASTA package [4,5,9],which takes two protein sequences and one set of parameters (scoring matrix,gap penalty), generates the optimal alignment, and estimates the K and λ pa-rameters by aligning up to 1000 shuffled versions of the second sequence, andfitting an EVD using Maximum Likelihood. In addition to uniform shuffling, italso allows for windowed shuffling. We also used ARIADNE [11], that uses anapproximate formula to estimate gapped K and λ from ungapped K and λ,which are calculable analytically as described before. Both these methods arecurrently applicable only for alignment methods using one parameter set. Wealso used the Linear Regression fitting program used in [7] to estimate K andλ from an empirical distribution of alignment scores. Finally, we also used theMaximum likelihood method [22] and corresponding routines in the HMMERpackage [21] to fit an EVD to the empirical distribution. Here type-I censoringis defined as the one in which we fit only the data right of the peak of the his-togram [22], and type-II censoring is defined as one where the cutoff is set tothe score that corresponds to a normalized E-value of 0.01. We used all thesemethods to estimate K and λ values for a pair of representative sequences for agiven alignment scheme.
5 Experiments and Results
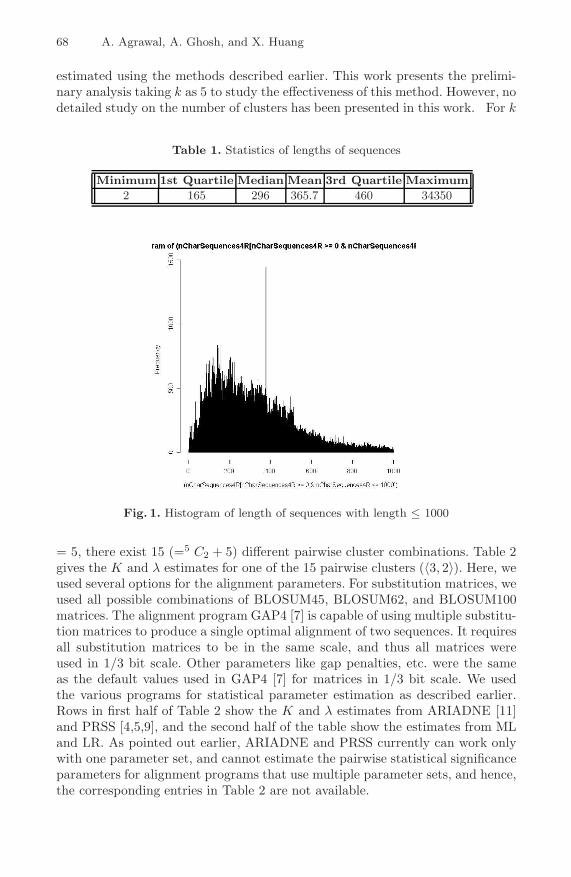
We downloaded all the available 261513 Swissprot protein sequences from http://www.ebi.ac.uk/FTP/. The statistics of the lengths of the sequences are given inTable 1, and the histogram of sequence lengths less than 1000 is shown in Fig. 1.Clearly, the variation in sequence length is very extreme, although the length ofmost of the sequences is in the range of 150 to 450. To minimize the influence ofvariation in length, we only select the sequences with length between the 1st and3rd quartile for clustering. The number of sequences between 1st and 3rd quartileis 131486. The amino acid composition of all these sequences is calculated, and animplementation of the k-means clustering algorithm in R package [26] is used tocluster the sequences into k=5 clusters, based on their amino acid composition.The k-means implementation in R returns for each of the k clusters its center,its within-sum-of-squares, its size, and of course, the classification of the inputdata points in one of the k clusters.
Fig. 2 is an attempt to visualize the clusters by representing the 20 dimen-sional amino-acid-composition vector as a point in x−y plane using the first twoamino-acid-compositions. Although it does not give a full picture of the clustersand their separation, it nonetheless gives some idea of how the clusters are lo-cated. One representative sequence for each of the k clusters is then selectedby choosing the one whose amino-acid-composition vector is the closest to thecenter of the cluster (i.e., which gave the minimum sum of square of differences).Then, for each pair of the representative sequences, the parameters K and λ are
68 A. Agrawal, A. Ghosh, and X. Huang
estimated using the methods described earlier. This work presents the prelimi-nary analysis taking k as 5 to study the effectiveness of this method. However, nodetailed study on the number of clusters has been presented in this work. For k
Table 1. Statistics of lengths of sequences
Minimum 1st Quartile Median Mean 3rd Quartile Maximum
2 165 296 365.7 460 34350
Fig. 1. Histogram of length of sequences with length ≤ 1000
= 5, there exist 15 (=5 C2 + 5) different pairwise cluster combinations. Table 2gives the K and λ estimates for one of the 15 pairwise clusters (〈3, 2〉). Here, weused several options for the alignment parameters. For substitution matrices, weused all possible combinations of BLOSUM45, BLOSUM62, and BLOSUM100matrices. The alignment program GAP4 [7] is capable of using multiple substitu-tion matrices to produce a single optimal alignment of two sequences. It requiresall substitution matrices to be in the same scale, and thus all matrices wereused in 1/3 bit scale. Other parameters like gap penalties, etc. were the sameas the default values used in GAP4 [7] for matrices in 1/3 bit scale. We usedthe various programs for statistical parameter estimation as described earlier.Rows in first half of Table 2 show the K and λ estimates from ARIADNE [11]and PRSS [4,5,9], and the second half of the table show the estimates from MLand LR. As pointed out earlier, ARIADNE and PRSS currently can work onlywith one parameter set, and cannot estimate the pairwise statistical significanceparameters for alignment programs that use multiple parameter sets, and hence,the corresponding entries in Table 2 are not available.
Estimating Pairwise Statistical Significance of Protein Local Alignments 69
Fig. 2. k-means clusters (k=5). Sequences in each cluster are represented by differentcolors. This visualization represents the 20-dimensional amino-acid-composition vectorby a 2-dimensional vector (corresponding to the first two entries of the 20-dimensionalamino-acid-composition vector), and hence is not complete, but gives an overall ideaof how the clusters are located.
Table 2. K and λ estimates for the cluster pair 〈3, 2〉
Substitution Gap Gap ARIADNE PRSS(1000 shuffles)Matrix Open Ext K λ uniform -w 10 -w 20
K λ K λ K λBLOSUM45 12 2 0.01795 0.184148 0.0329 0.1869 0.03736 0.1941 0.0381 0.1974BLOSUM62 14 3 0.06445 0.200311 0.0956 0.2104 0.1108 0.2154 0.1212 0.2181BLOSUM100 16 4 0.15101 0.210326 0.1888 0.224 0.2624 0.2328 0.1564 0.2198BL45,62,100 12,14,16 2,3,4 NA NA NA NA NA NA NA NABL45,BL62 12,14 2,3 NA NA NA NA NA NA NA NABL45,BL100 12,16 2,4 NA NA NA NA NA NA NA NABL62,BL100 14,16 3,4 NA NA NA NA NA NA NA NA
Substitution Gap Gap Maximum Likelihood (100000 shuffles) LinearRegr.Matrix Open Ext Full Censored-I Censored-II (100000 shfls)
K λ K λ K λ K λBLOSUM45 12 2 0.03387 0.189248 0.0316 0.1876 0.089487 0.204045 0.1083 0.2063BLOSUM62 14 3 0.08757 0.205953 0.0875 0.2058 0.045709 0.196304 0.2389 0.2195BLOSUM100 16 4 0.18503 0.2191 0.1761 0.2179 0.358664 0.228915 0.4009 0.2304BL45,62,100 12,14,16 2,3,4 0.10576 0.194163 0.0967 0.1923 0.096223 0.192396 0.2358 0.2044BL45,BL62 12,14 2,3 0.06773 0.194176 0.0919 0.1982 0.123769 0.202883 0.1551 0.2057BL45,BL100 12,16 2,4 0.09969 0.195183 0.0911 0.1932 0.147417 0.200051 0.3205 0.2102BL62,BL100 14,16 3,4 0.15685 0.207436 0.1570 0.2074 0.243203 0.21407 0.2807 0.2157
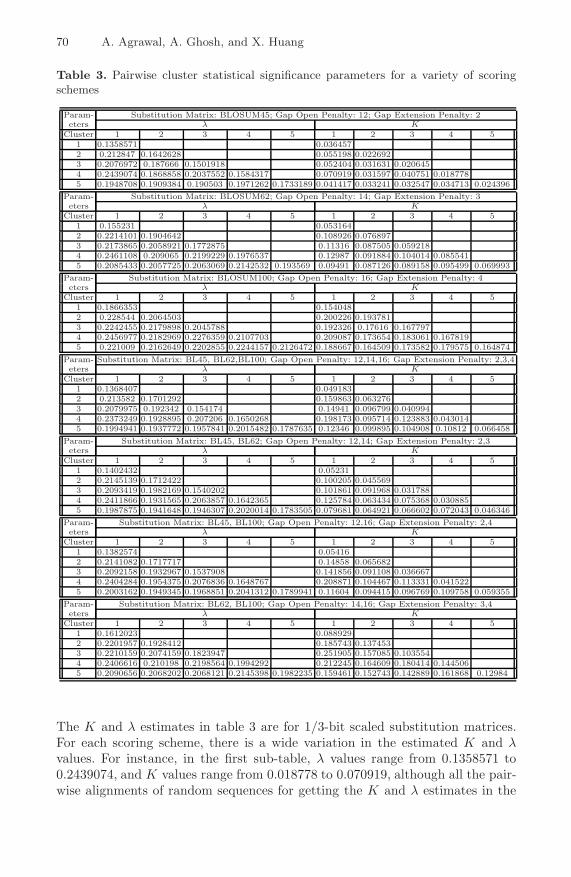
It was reported in [23] that that Maximum likelihood fitting with type-I cen-soring gives the most accurate estimates of K and λ for estimation of pairwisestatistical significance. Therefore, we report the corresponding the K and λ es-timates for all cluster-pairs in Table 3, presenting the final result of this work.There are 7 sub-tables in Table 3, each showing the K and λ estimates for allcluster pairs for a unique scoring scheme (7 scoring schemes are presented here).
70 A. Agrawal, A. Ghosh, and X. Huang
Table 3. Pairwise cluster statistical significance parameters for a variety of scoringschemes
Param- Substitution Matrix: BLOSUM45; Gap Open Penalty: 12; Gap Extension Penalty: 2eters λ K
Cluster 1 2 3 4 5 1 2 3 4 51 0.1358571 0.0364572 0.212847 0.1642628 0.055198 0.0226923 0.2076972 0.187666 0.1501918 0.052404 0.031631 0.0206454 0.2439074 0.1868858 0.2037552 0.1584317 0.070919 0.031597 0.040751 0.0187785 0.1948708 0.1909384 0.190503 0.1971262 0.1733189 0.041417 0.033241 0.032547 0.034713 0.024396
Param- Substitution Matrix: BLOSUM62; Gap Open Penalty: 14; Gap Extension Penalty: 3eters λ K
Cluster 1 2 3 4 5 1 2 3 4 51 0.155231 0.0531642 0.2214101 0.1904642 0.108926 0.0768973 0.2173865 0.2058921 0.1772875 0.11316 0.087505 0.0592184 0.2461108 0.209065 0.2199229 0.1976537 0.12987 0.091884 0.104014 0.0855415 0.2085433 0.2057725 0.2063069 0.2142532 0.193569 0.09491 0.087126 0.089158 0.095499 0.069993
Param- Substitution Matrix: BLOSUM100; Gap Open Penalty: 16; Gap Extension Penalty: 4eters λ K
Cluster 1 2 3 4 5 1 2 3 4 51 0.1866353 0.1540482 0.228544 0.2064503 0.200226 0.1937813 0.2242455 0.2179898 0.2045788 0.192326 0.17616 0.1677974 0.2456977 0.2182969 0.2276359 0.2107703 0.209087 0.173654 0.183061 0.1678195 0.221009 0.2162649 0.2202855 0.2244157 0.2126472 0.188667 0.164509 0.173582 0.179575 0.164874
Param- Substitution Matrix: BL45, BL62,BL100; Gap Open Penalty: 12,14,16; Gap Extension Penalty: 2,3,4eters λ K
Cluster 1 2 3 4 5 1 2 3 4 51 0.1368407 0.0491832 0.213582 0.1701292 0.159863 0.0632763 0.2079975 0.192342 0.154174 0.14941 0.096799 0.0409944 0.2373249 0.1928895 0.207206 0.1650268 0.198173 0.095714 0.123883 0.0430145 0.1994941 0.1937772 0.1957841 0.2015482 0.1787635 0.12346 0.099895 0.104908 0.10812 0.066458
Param- Substitution Matrix: BL45, BL62; Gap Open Penalty: 12,14; Gap Extension Penalty: 2,3eters λ K
Cluster 1 2 3 4 5 1 2 3 4 51 0.1402432 0.052312 0.2145139 0.1712422 0.100205 0.0455693 0.2093419 0.1982169 0.1540202 0.101861 0.091968 0.0317884 0.2411866 0.1931565 0.2063857 0.1642365 0.125784 0.063434 0.075368 0.0308855 0.1987875 0.1941648 0.1946307 0.2020014 0.1783505 0.079681 0.064921 0.066602 0.072043 0.046346
Param- Substitution Matrix: BL45, BL100; Gap Open Penalty: 12,16; Gap Extension Penalty: 2,4eters λ K
Cluster 1 2 3 4 5 1 2 3 4 51 0.1382574 0.054162 0.2141082 0.1717717 0.14858 0.0656823 0.2092158 0.1932967 0.1537908 0.141856 0.091108 0.0366674 0.2404284 0.1954375 0.2076836 0.1648767 0.208871 0.104467 0.113331 0.0415225 0.2003162 0.1949345 0.1968851 0.2041312 0.1789941 0.11604 0.094415 0.096769 0.109758 0.059355
Param- Substitution Matrix: BL62, BL100; Gap Open Penalty: 14,16; Gap Extension Penalty: 3,4eters λ K
Cluster 1 2 3 4 5 1 2 3 4 51 0.1612023 0.0889292 0.2201957 0.1928412 0.185743 0.1374533 0.2210159 0.2074159 0.1823947 0.251905 0.157085 0.1035544 0.2406616 0.210198 0.2198564 0.1994292 0.212245 0.164609 0.180414 0.1445065 0.2090656 0.2068202 0.2068121 0.2145398 0.1982235 0.159461 0.152743 0.142889 0.161868 0.12984
The K and λ estimates in table 3 are for 1/3-bit scaled substitution matrices.For each scoring scheme, there is a wide variation in the estimated K and λvalues. For instance, in the first sub-table, λ values range from 0.1358571 to0.2439074, and K values range from 0.018778 to 0.070919, although all the pair-wise alignments of random sequences for getting the K and λ estimates in the
Estimating Pairwise Statistical Significance of Protein Local Alignments 71
first sub-table were done using the SIM program with BLOSUM45 substitutionmatrix, gap open penalty 12, and gap extension penalty 2, i.e. using the samescoring scheme. Since the only contributing factor for the difference betweenK and λ values for different cluster pairs is the amino acid composition, wecan observe that the statistical parameters heavily depend on the amino acidcomposition. Clustering the protein sequences into groups of similar amino acidcomposition has therefore to some degree separated the dependence of the sta-tistical significance parameters on the amino acid composition, which is veryhelpful for quick and accurate estimates of statistical significance for specificpairwise alignments. Once parameter estimation for the cluster-pairs is done fora given scoring scheme, subsequent statistical significance estimation for any se-quence pair using the same soring scheme is very quick, since it only involvesclassification of the sequences to corresponding clusters, and using the statisticalparameters for the corresponding cluster-pair.
6 Conclusion and Future Work
The implementation of a clustering-classification based approach for estimatingthe statistical parameters K and λ for estimating the statistical significance ofpairwise alignments is done and is experimented with. The clusters are based onthe amino-acid composition and the estimates of the statistical parameters Kand λ for each cluster-pair are calculated by simulation. Given two sequences, theestimate of K and λ for that pair is given by the K and λ values corresponding tothe cluster-pair to which the given sequences are classified based on the amino-acid-composition.
The estimated values of K and λ for different clusters show a considerablevariability, even for the same alignment scoring scheme, which suggests thatthe influence of amino acid composition on statistical parameters K and λ isvery strong, and it is imperative to use different K and λ values for differentsequences. The clustering technique used in this work has therefore separated theinfluence of amino acid composition on statistical parameters, which is the maincontribution of this paper. Another major significance of this work is that thismethod can be applied to any new alignment program with any scoring schemewithout the knowledge of the statistics of the alignment procedure (which is ingeneral difficult to determine). Once the influence of amino acid composition onstatistical significance parameters is separated from other factors, all that needsto be done is the accurate estimation of the statistical parameters for all clusterpairs using the new alignment program, and subsequently use those values forany pair of sequences with individually similar amino acid composition as that ofthe clusters to which the pair of sequences are individually classified. Especiallywith a number of new alignment methods being developed, this technique isexpected to be very useful in comparing them.
Although the simple idea is very promising, it is unclear how well it worksfor an application where statistical significance is used, like homology detection.This approach is just a beginning of the efforts to separate the influence of amino
72 A. Agrawal, A. Ghosh, and X. Huang
acid composition, and clustering is just one of the many methods which can doso. It may be possible that it is not the exact composition clusters that twoprotein sequences under comparison fall into that matters, but instead, simplythe difference between the composition distributions of the two proteins, whichneeds further exploration. Another shortcoming of this work is that by clusteringhundreds of thousands of sequences in to just five clusters, we lose a lot of in-formation about the amino acid composition distribution across the real proteinsequences. An analytical study of the amino acid composition distribution maybe required to get the optimal number of clusters. Hence, this method can befurther looked into in detail to evaluate the performance of clustering. Anotherimprovement can be to use a small scale simulation along with the proposedapproach to increase the accuracy of the statistical significance estimates.
References
1. Altschul, S.F., Madden, T.L., Schaffer, A.A., Zhang, J., Zhang, Z., Miller, W.,Lipman, D.J.: Gapped BLAST and PSI-BLAST: A New Generation of ProteinDatabase Search Programs. Nucleic Acids Research 25(17), 3389–3402 (1997)
2. Smith, T.F., Waterman, M.S.: Identification of Common Molecular Subsequences.Journal of Molecular Biology 147(1), 195–197 (1981)
3. Sellers, P.H.: Pattern Recognition in Genetic Sequences by Mismatch Density. Bul-letin of Mathematical Biology 46(4), 501–514 (1984)
4. Pearson, W.R.: Effective Protein Sequence Comparison. Methods in Enzymol-ogy 266, 227–259 (1996)
5. Pearson, W.R.: Flexible Sequence Similarity Searching with the FASTA3 ProgramPackage. Methods in Molecular Biology 132, 185–219 (2000)
6. Huang, X., Chao, K.M.: A Generalized Global Alignment Algorithm. Bioinformat-ics 19(2), 228–233 (2003)
7. Huang, X., Brutlag, D.L.: Dynamic Use of Multiple Parameter Sets in SequenceAlignment. Nucleic Acids Research 35(2), 678–686 (2007)
8. Karlin, S., Altschul, S.F.: Methods for Assessing the Statistical Significance ofMolecular Sequence Features by Using General Scoring Schemes. Proceedings ofthe National Academy of Sciences, USA 87(6), 2264–2268 (1990)
9. Pearson, W.R.: Empirical Statistical Estimates for Sequence Similarity Searches.Journal of Molecular Biology 276, 71–84 (1998)
10. Mott, R., Tribe, R.: Approximate Statistics of Gapped Alignments. Journal ofComputational Biology 6(1), 91–112 (1999)
11. Mott, R.: Accurate Formula for P-values of Gapped Local Sequence and ProfileAlignments. Journal of Molecular Biology 300, 649–659 (2000)
12. Altschul, S.F., Bundschuh, R., Olsen, R., Hwa, T.: The estimation of statisticalparameters for local alignment score distributions. Nucleic Acids Research 29(2),351–361 (2001)
13. Schaffer, A.A., Aravind, L., Madden, T.L., Shavirin, S., Spouge, J.L., Wolf, Y.I.,Koonin, E.V., Altschul, S.F.: Improving the Accuracy of PSI-BLAST ProteinDatabase Searches with Composition-based Statistics and Other Refinements. Nu-cleic Acids Research 29(14), 2994–3005 (2001)
14. Bundschuh, R.: Rapid Significance Estimation in Local Sequence Alignment withGaps. In: RECOMB 2001: Proceedings of the fifth annual International Conferenceon Computational biology, pp. 77–85. ACM, New York (2001)
Estimating Pairwise Statistical Significance of Protein Local Alignments 73
15. Poleksic, A., Danzer, J.F., Hambly, K., Debe, D.A.: Convergent Island Statistics:A Fast Method for Determining Local Alignment Score Significance. Bioinformat-ics 21(12), 2827–2831 (2005)
16. Kschischo, M., Lassig, M., Yu, Y.: Toward an Accurate Statistics of Gapped Align-ments. Bulletin of Mathematical Biology 67, 169–191 (2004)
17. Grossmann, S., Yakir, B.: Large Deviations for Global Maxima of Independent Su-peradditive Processes with Negative Drift and an Application to Optimal SequenceAlignments. Bernoulli 10(5), 829–845 (2004)
18. Pearson, W.R., Wood, T.C.: Statistical Significance in Biological Sequence Com-parison. In: Balding, D.J., Bishop, M., Cannings, C. (eds.) Handbook of StatisticalGenetics, pp. 39–66. Wiley, Chichester (2001)
19. Mott, R.: Alignment: Statistical Significance. Encyclopedia of Life Sciences (2005),http://mrw.interscience.wiley.com/emrw/9780470015902/els/article/
a0005264/current/abstract
20. Mitrophanov, A.Y., Borodovsky, M.: Statistical Significance in Biological SequenceAnalysis. Briefings in Bioinformatics 7(1), 2–24 (2006)
21. Eddy, S.R.: Multiple Alignment Using Hidden Markov Models. In: Rawlings, C.,Clark, D., Altman, R., Hunter, L., Lengauer, T., Wodak, S. (eds.) Proceedings ofthe Third International Conference on Intelligent Systems for Molecular Biology,pp. 114–120. AAAI Press, Menlo Park (1995)
22. Eddy, S.R.: Maximum Likelihood Fitting of Extreme Value Distributions (1997),unpublished manuscript, citeseer.ist.psu.edu/370503.html
23. Agrawal, A., Brendel, V., Huang, X.: Pairwise Statistical Significance VersusDatabase Statistical Significance for Local Alignment of Protein Sequences. In:Mandoiu, I., Sunderraman, R., Zelikovsky, A. (eds.) ISBRA 2008. LNCS(LNBI),vol. 4983, pp. 50–61. Springer, Heidelberg (in press, 2008)
24. Olsen, R., Bundschuh, R., Hwa, T.: Rapid Assessment of Extremal Statistics forGapped Local Alignment. In: Proceedings of the Seventh International Conferenceon Intelligent Systems for Molecular Biology, pp. 211–222. AAAI Press, MenloPark (1999)
25. Anderson, T.W.: An Introduction to Multivariate Statistical Analysis, 2nd edn.Wiley-Interscience, Chichester (2003)
26. Language, R.A.: Environment for Statistical Computing. R Foundation for Statis-tical Computing, Vienna, Austria (2006)
27. Huang, X., Miller, W.: A Time-efficient Linear-space Local Similarity Algorithm.Advances in Applied Mathematics 12(3), 337–357 (1991)


![3-[(2-HYDROXYBENZYLIDENE) AMINO]PHENYL}IMINO)](https://static.fdokumen.com/doc/165x107/631c6e3f7051d371800f7901/3-2-hydroxybenzylidene-aminophenylimino.jpg)

