ESSnet Big Data II - European Commission
272
1 ESSnet Big Data II Grant Agreement Number: 847375-2018-NL-BIGDATA https://webgate.ec.europa.eu/fpfis/mwikis/essnetbigdata https://ec.europa.eu/eurostat/cros/content/essnetbigdata_en Workpackage J Innovative Tourism Statistics Deliverable J5: Final Report containing final results and a full description of the methodology used Final version, 17.11.2020 ESSnet co-ordinator: Peter Struijs (CBS) [email protected] Workpackage Leader: Marek Cierpiał-Wolan (Statistics Poland, Poland) [email protected] telephone : + 48 17 85 35 210 ext. 311 mobile phone : + 48 515 037 640 Prepared by: WPJ team
-
Upload
khangminh22 -
Category
Documents
-
view
0 -
download
0
Transcript of ESSnet Big Data II - European Commission

1
ESSnet Big Data I I
G r a n t A g r e e m e n t N u m b e r : 8 4 7 3 7 5 - 2 0 1 8 - N L - B I G D A T A
h t t p s : / / w e b g a t e . e c . e u r o p a . e u / f p f i s / m w i k i s / e s s n e t b i g d a t a
h t t p s : / / e c . e u r o p a . e u / e u r o s t a t / c r o s / c o n t e n t / e s s n e t b i g d a t a _ e n
W o rkpa c ka ge J
In no va t i ve To ur i sm Sta t i s t i c s
De l i vera bl e J 5 :
F i na l Repo rt c o nta i n i ng f i na l resu l ts a nd a fu l l desc r i p t i o n o f the metho do l o gy use d
Final version, 17.11.2020
ESSnet co-ordinator:
Peter Struijs (CBS) [email protected]
Workpackage Leader:
Marek Cierpiał-Wolan (Statistics Poland, Poland) [email protected]
telephone : + 48 17 85 35 210 ext. 311 mobile phone : + 48 515 037 640
Prepared by:
WPJ team

2
Workpackage J team:
Marek Cierpiał-Wolan (Statistics Poland) Rui Alves (INE) Vassiliki Benaki (ELSTAT) Eleni Bisioti (ELSTAT) Mascia Di Torrice (ISTAT) Maria Fernandes (INE) Boris Frankovič (SOSR) Tobias Gramlich (HESSE) Kostadin Georgiev (BNSI) Nico Heerschap (CBS) Maria Laftsidou (ELSTAT) Filipa Lidónio (INE) Asimina Katri (ELSTAT) Shirley Ortega-Azurduy (CBS) Martina Özoğlu (SOSR) Eleni Papadopoulou (ELSTAT) Christina Pierrakou (ELSTAT) Danny Pronk (CBS) Galya Stateva (BNSI) Marcela Zavadilová (SOSR)

3
Table of contents
Executive summary ................................................................................................................................. 5
Glossary ................................................................................................................................................... 7
Introduction ............................................................................................................................................ 8
1. Big data sources .......................................................................................................................... 9
1.1. Inventory of big data sources ................................................................................................. 9
1.2. Web scraping ........................................................................................................................ 15
1.3. Source characteristics ........................................................................................................... 18
2. Methods used for new tourism data ........................................................................................ 35
2.1. Methodology for combining and disaggregating data ................................................................ 35
2.1.1. Combining data ...................................................................................................................... 35
2.1.2. Spatial-temporal disaggregation of tourism data .................................................................. 40
2.2. Flash estimates ............................................................................................................................ 41
2.3. Methodology to improve the quality of data in various statistical areas ................................... 44
2.3.1. Estimations of the size of tourist traffic ................................................................................. 47
2.3.2. Estimation of expenses related to trips ................................................................................. 48
2.3.3. Tourism Satellite Accounts .................................................................................................... 49
3. Implementation of Tourism Integration and Monitoring System prototype ........................... 56
4. Case studies .............................................................................................................................. 63
4.1. Web scraping ........................................................................................................................ 63
WPJ.1.BG .......................................................................................................................................... 63
WPJ.1.DE-Hesse ............................................................................................................................... 65
WPJ.1.IT ..........................................................................................................................................70
WPJ.1.NL .......................................................................................................................................... 73
WPJ.1.PT .......................................................................................................................................... 79
WPJ.1.SK .......................................................................................................................................... 90
4.2. Source characteristics ........................................................................................................... 96
WPJ.2.DE-Hesse ............................................................................................................................... 96
WPJ.2.IT ........................................................................................................................................99
WPJ.2.NL ........................................................................................................................................ 105
WPJ.2.PT ........................................................................................................................................ 107
4.3. Legal aspects ....................................................................................................................... 110
WPJ.3.DE-Hesse ............................................................................................................................. 110
WPJ.3.NL ........................................................................................................................................ 112

4
4.4. Combining data ................................................................................................................... 114
WPJ.4.EL ........................................................................................................................................114
WPJ.4.DE-Hesse ............................................................................................................................. 118
WPJ.4.IT ........................................................................................................................................119
WPJ.4.NL ........................................................................................................................................ 124
WPJ.4.PL .......................................................................................................................................127
WPJ.4a.PT ...................................................................................................................................... 129
WPJ.4b.PT ...................................................................................................................................... 131
WPJ.4.SK ........................................................................................................................................ 136
4.5. Spatial-temporal disaggregation of data ............................................................................ 143
WPJ.5.NL ........................................................................................................................................ 143
WPJ.5.PL………. ............................................................................................................................... 149
WPJ.5.SK ........................................................................................................................................ 154
4.6. Flash estimates of the occupancy of accommodation establishments .............................. 166
WPJ.6.NL ........................................................................................................................................ 166
WPJ.6.PL. ........................................................................................................................................ 172
WPJ.6.SK ........................................................................................................................................ 175
4.7. Methodology to improve the quality of data in various statistical areas ........................... 199
WPJ.7.PL .......................................................................................................................................199
4.8. Experimental tourism statistics........................................................................................... 208
WPJ.8.BG ........................................................................................................................................ 208
WPJ.8.NL ........................................................................................................................................ 229
5. Conclusions ............................................................................................................................. 233
References .......................................................................................................................................... 237
Annexes ............................................................................................................................................... 243
Annex 1 – Quality indicators of data matching ................................................................................ 243
Annex 2 – General approach for data disaggregation...................................................................... 245
Annex 3 – Combining biased and unbiased data ............................................................................. 248
Annex 4 – Quality template for combining data from various sources ........................................... 249
Annex 5 – R script to visNetwork object WPJ.2.PT........................................................................... 262
Annex 6 – R script to visNetwork object (detail) .............................................................................. 269
Annex 7 – CBS taxonomy .................................................................................................................. 270
Annex 8 – Process for data linkage .................................................................................................. 271

5
Executive summary
This deliverable J5 Final Report containing final results and a full description of the methodology used,
summarizes the work implemented under the workpackage J - Innovative Tourism Statistics (WPJ) of
the ESSnet Big Data II project by eight European statistical institutes:
Statistics Poland (GUS) represented by the Statistical Office in Rzeszów (leader of the WPJ),
National Statistical Institute of the Republic of Bulgaria (BNSI),
Hellenic Statistical Authority (ELSTAT),
Hesse Statistical Office (HESSE, Germany),
Italian National Institute of Statistics (ISTAT),
Statistics Netherlands (CBS),
Statistics Portugal (INE),
and Statistical Office of the Slovak Republic (SOSR).
Detailed information related to each of the issues under consideration by the project participants can
be found in the four partial reports available on the WIKI platform of the ESSnet Big Data II project, in
the part dedicated to the WPJ package1.
The work undertaken in the project was an attempt to meet the following challenges:
• preparing an inventory of data sources related to tourism statistics (including big data sources)
in individual partner countries along with their description and classification,
• developing a scalable solution for downloading data using web scraping techniques from
selected web portals offering the possibility of booking accommodation,
• implementing methods of combining and matching data on tourist accommodation
establishments in order to integrate statistical databases with data from web scraping for the
purpose of improving the completeness of the survey population of tourist accommodation
establishments,
• spatial-temporal disaggregation of the use of tourist accommodation establishments,
• preparing flash estimates of occupancy of tourist accommodation establishments to shorten
the time of data publication for external recipients,
• developing a methodology for estimating the volume of tourist traffic and tourist expenses
with the use of various data sources (statistical and non-statistical).
The activities listed here allowed for a preliminary assessment of the impact of the obtained results
on the improvement of the data presented in the Tourism Satellite Account (TSA). In addition, the key
issue addressed by WPJ was the preparation of the Tourism Integration and Monitoring System (TIMS)
prototype along with the micro-services dedicated to the above-mentioned areas that would support
statistical production in the field of tourism statistics and assist in monitoring changes in the tourism
sector.
1https://webgate.ec.europa.eu/fpfis/mwikis/EssNetbigdata/index.php/WPJ_Milestones_and_deliverables [accessed: 23.09.2020]

6
The presented final report consists of 5 chapters.
The first chapter includes a description of the work implemented in the initial stage of the project and
relating to the Task 1: Inventory of big data sources related to tourism statistics. The reader will find
here a general list of data sources (including big data) identified by individual WPJ partner countries
during the inventory process. The catalogue is divided according to different subdirectories, e.g. types
of sources and frequency, availability, usefulness in estimating the demand and supply side of tourism.
In the subchapter dedicated to web scraping, attention is paid to the issue of identifying tourist portals
that will provide the most complete information on accommodation, transport or food. In the
subchapter entitled Source characteristics, the concept of mapping identified sources and variables to
official statistical variables and domains using relationship maps was presented. In this part, the reader
will get acquainted with the visNetwork tool, which provides an interactive graphical representation
of the relationships and interconnections between multi-purpose data sources, survey data and web
scraped data, variables and domains, as well as countries and experimental results.
The second chapter of the report describes the methods developed and tested during the project by
partner countries under Task 3: Developing a methodology for combining and disaggregation data
from various sources. In particular, it contains details on the methods of combining data collected by
web scraping techniques from web portals offering accommodation booking services with statistical
databases containing the population frame for the survey on the use of tourist accommodation
establishments, as well as description of methods for spatial and temporal disaggregation of data in
the field of tourism. In this chapter, the reader can also learn about the results of the methodological
work undertaken in the field of flash estimates (Task 4: Flash estimates in the field of tourism). In
subchapter 2.3 the approach and methods used for estimating a size of tourist traffic and estimating
expenses related to trips are presented. While, in the last subchapter, the reader can trace the results
related to Tourism Satellite Accounts (TSA), as part of work within Task 5: Use of big data sources and
developed methodology to improve the quality of data in various statistical areas.
The third chapter presents an example of the implementation of the main components of the Tourism
Integration and Monitoring System (TIMS) prototype with dedicated micro-services. This system will
support statistical production in the area of tourism statistics and assist in monitoring changes in the
tourism sector. This part of the document describes the user interface (UI) and user experience (UX)
of the system prototype developed as part of the WPJ work. Additionally, the reader can view
exemplary graphic interface design here.
The fourth chapter consists of case studies with results of individual tasks performed in each partner
country. The lists are grouped according to the topics they relate to (web scraping, source
characteristics, legal aspects, combining data, spatial-temporal disaggregation, flash estimates,
methodology to improve the quality of data in various statistical areas and experimental tourism
statistics). Each use case has a standardized form, which makes it possible to easily identify the country
to which the case relates and to clearly trace the preconditions required for its preparation, the steps
taken, the expected and final results obtained.
The report ends with the Conclusions and a list of annexes. One of them, Annex 4 is dedicated to the
Quality template completed for data gathered from various sources (including big data sources). The
basis of this form are the statistical concepts of ESS Single Integrated Metadata Structure, which have
been extended and adapted to big data sources by members of the workpackage K - Methodology and
Quality.

7
Glossary
API (Application Programming Interface) is a way, understood as a strictly defined set of rules and
their descriptions, in which computer programs communicate with each other.
BAT (batch file) is a script file in DOS, OS/2 and Microsoft Windows. It consists of a series of commands
to be executed by the command-line interpreter, stored in a plain text file.
GSBPM (Generic Statistical Business Process Model) describes and defines the set of business
processes needed to produce official statistics.
GSIM (Generic Statistical Information Model) is a reference framework of internationally agreed
definitions, attributes and relationships that describe the pieces of information that are used in the
production of official statistics (information objects). This framework enables generic descriptions of
the definition, management and use of data and metadata throughout the statistical production
process.
HTML (HyperText Markup Language) is a hypertext markup language that allows one to describe the
structure of information contained within a web page, giving meaning to individual fragments of text
– forming hyperlinks, paragraphs, headers and lists - and embedding file objects in the text.
JSON (JavaScript Object Notation) is an open standard file format, and data interchange format, that
uses human-readable text to store and transmit data objects consisting of attribute–value pairs and
array data types (or any other serializable value).
Metadata is a description of other data.
PNG (Portable Network Graphic) is commonly used file to store web graphics, digital photographs,
and images with transparent backgrounds.
RSS (Rich Site Summary) is a web feed that allows users and applications to access updates to websites
in a standardized, computer-readable format.
XLSX (Office Open XML) is a zipped, XML-based file format developed by Microsoft for representing
spreadsheets, charts, presentations and word processing documents.
XML (Extensible Markup Language) is a universal markup language designed to represent different
data in a structured way. It is platform-independent, which facilitates the exchange of documents
between different systems.
Web scraping (also known as Screen Scraping, Web Data Extraction, Web Harvesting, etc.) is
a technique used to extract large amounts of data from websites.
Web service is a service offered by an electronic device to another electronic device, communicating
with each other via the World Wide Web.

8
Introduction
In the last few years, tourism trends have changed, both on the demand and supply sides. The rapidly
changing and available new technologies require national statistical offices (NSIs) to continuously
adapt their IT systems to collect data, including data from unstructured big data sources, as well as to
verify and process them. Moreover, the situation forces the NSIs to improve the methods and
techniques of acquiring new types of data and to implement innovative tools to advance the
consistency and comparability of the generated results, also in the area of tourism statistics.
Additionally, the current crisis caused by the COVID-19 pandemic, affecting all types of economic
activity, has had a particularly severe impact on the tourism industry, consequently causing a lot of
intermediate negative effects across the economy in many countries. The weaker condition of tourism
means worse results in trade, transport, warehousing, agriculture or the real estate market, sports,
culture and communication. As the pandemic unfolds in Europe, a significant part of destinations is
completely or partially inaccessible due to border closure and restrictions resulting from the
suspension of international air connections. The tourist industry, as well as the behaviour of tourists
themselves, due to the restrictions introduced, have changed, which has had an impact on the level
of tourist traffic in Europe.
This crisis has shown how important it is for official statistics to have monitoring tools and systems
that can quickly detect and visualize changes in the tourism industry in the EU. There is therefore a
need for faster, more disaggregated and up-to-date information that responds to the needs of
national governments, city authorities and tourism industry stakeholders, as well as tourism
entrepreneurs. In addition, such a system would enable official statistics to monitor the changes and
effects of the reopening of national economies to local and foreign tourists. It could be used to
measure how quickly the tourism industry begins to recover once countries begin easing travel
restrictions.
The participants of the pilot WPJ package were faced, among other things, with such a challenge - the
development of the Tourism Integration and Monitoring System (TIMS) prototype along with its
individual components. Another important element related to the use of new information sources
(including big data sources) in tourism statistics was the development of innovative approaches to
combine these data with data held by official statistics, which due to their different structure,
frequency and methodological differences in terms of collecting and processing data was not an easy
task.
All results achieved during the two-year work within the WPJ and the solutions developed in the
above-mentioned areas are presented in this report.
9
1. Big data sources
Today’s digital world brings us many big data sources which may help tourism statistics being more
up to date. However, there is still a big dependence on official statistics due to the nature of tourism,
because not every movement means tourism activity. Tourism is very specific industry based on
travellers behaviour and its limitations. According to European regulation 692/2011 on tourism
statistics: “tourism means the activity of visitors taking a trip to a main destination outside their usual
environment, for less than a year, for any main purpose, including business, leisure or other personal
purpose, other than to be employed by a resident entity in the place visited”. Also tourism industry
includes accommodation, food and beverage, rental, transport, cultural, sport, travel agent and
tourism operator service. Tourism is an industry characterized by the cross-sectional nature of
economic activities and industries within the economy. Therefore tourism isn’t reflected only by one
or two industries but as a whole. From big data sources is very difficult to distinguish if the movement
fulfils all the criterions of tourism, however, connecting data sources of official statistics with the big
data may make official statistics more accurate due to its correlation with tourism statistics and may
provide additional information.
1.1. Inventory of big data sources
To create the catalogue and determine the usefulness of data sources, it was necessary to inventory
them. During the work, the sources that are already available or can be used in the future to improve
the quality of official statistical data in the field of tourism were selected. The inventory included
external (including administrative), statistical and Internet sources. As a result of the work, detailed
catalogues containing characteristics of the identified sources were created. The Flow Models of these
sources were presented in the J2 deliverable. The main catalogue, containing information on the
identified sources by individual partner countries, was divided into three subdirectories:
1. catalogue by types of sources and frequency,
2. catalogue by thematic areas,
3. catalogue by usefulness – demand vs supply side.
As part of ongoing work, project partners have inventoried a total of 130 sources of information. Just
over half of them (57.7%) were external sources, while the remaining 42.3% were internal sources.
Considering the number of identified sources in individual countries, it was found that the Netherlands
(44 sources), Slovakia (20), Poland (16) and Italy (14) showed the highest number of sources.
The Netherlands showed the largest number of internal and external data sources (22 sources each).
Among the remaining countries, Italy (9) and Slovakia (8) had the highest number of internal sources,
while Poland (13) and Slovakia (12) collected the highest number of external sources. A detailed
summary of the number of identified sources broken down by type is presented in Table 1.

10
Table 1. Number of data sources identified broken down by type
Type of source
Country participating in the grant
BG Hesse EL IT NL PL PT SK
Number of identified sources
Total 6 12 11 14 44 16 7 20
Internal sources 4 6 2 9 22 3 1 8
External sources 2 6 9 5 22 13 6 12
During the inventory, the identified sources were divided according to their usefulness in estimating
the demand and supply side of tourism. Considering that some data sources can be used to estimate
both sides of tourism at the same time, this division has also been included in the compilation
(see Table 2).
As a result of the conducted works, it was found that among all the inventoried sources, those which
data can be used for estimating the demand side of tourism have largely prevailed
(82 sources).To estimate both the demand and supply 26 sources may be helpful for calculating and
22 for the supply side. The largest number of sources that could improve statistics on the demand side
of tourism was identified by the Netherlands (25 sources), Slovakia (13), Poland (10) and Italy (9).
In the case of sources useful for estimating the supply side of tourism the Netherlands identified the
largest number of sources (8). The Netherlands also showed the highest number of sources that can
be used to estimate both the demand and supply sides of tourism – over 40% of this type of sources
was identified by all partner countries.
Table 2. Availability of external data sources by country of origin of the source
Availability of
external sources
Country participating in the grant
BG Hesse EL IT NL PL PT SK
Number of identified sources
Total 2 6 9 5 22 13 6 12
Available sources 2 2 2 2 13 11 5 2
Sources not
available
(temporarily or
permanently)
- 4 7 3 9 2 1 10
External data sources include those that partner countries do not yet have access to as well as those
with limited availability. Analysing the availability of external data sources in all partner countries it
was found that 52% of them were accessible. The highest share of available external sources was
observed in Poland (almost 85%). Also Portugal showed a similar rate of availability of sources (83%).
It is worth noting that among 11 online sources identified by partner countries, 10 were reported by
the Netherlands and 1 by Poland. Table 3 presents availability of identified external data sources
broken down into available and unavailable ones.

11
Table 3. Breakdown of collected data sources according to their usefulness for estimating the demand or supply side of tourism
Side of tourism
Country participating in the grant
BG Hesse EL IT NL PL PT SK
Number of identified sources
Total 6 12 11 14 44 16 7 20
Supply side 1 1 1 3 8 2 2 4
Demand side 5 9 6 9 25 10 5 13
Both sides - 2 4 2 11 4 - 3
Among the available external data sources, those useful for estimating the demand side of tourism
prevail (Table 4). In Bulgaria, Germany and Greece all available external data sources are useful for
estimating demand side of tourism. The Netherlands reported only 31% of available external data
sources as useful for demand side of tourism, but almost 54% of data sources identified by this country
can be useful for both side of tourism.
Table 4. Breakdown of available external data sources according to their usefulness for estimating the demand or supply side of tourism
Side of tourism
Country participating in the grant
BG Hesse EL IT NL PL PT SK
Number of identified sources
Available external
sources in total 2 2 2 2 13 11 5 2
Supply side - - - 1 2 1 2 1
Demand side 2 2 2 1 4 7 3 1
Both sides - - - - 7 3 - -
The inventory of data sources identified by WPJ partners are have varying frequencies. Most of them
have a monthly frequency. Sources which data have weekly or even daily frequencies have also been
shown. They constitute a very important element in the construction of the system supporting official
data in the field of tourism due to the obtained high frequency time series, which will facilitate analysis
and allow more accurate capture of changes.
On the basis of the data sources inventory, the project partners have developed Flow Models for their
countries according to the accepted scheme. Each model presents proposed directions for combining
data collected from external sources and web scraping with data from official statistics. An important
issue regarding the Flow Model is the block breakdown of data sources that can be used to compile
statistics on the demand and supply side of tourism. One important element of the models developed
by particular countries was to present areas and directions in which the results of combining data from
inventoried sources (using statistical methods) in the future will be used to improve official statistics.

12
Proposed areas and directions:
Improving the completeness of tourist accommodation base,
Spatial disaggregation of data on tourist accommodation base,
Flash estimates of the use of tourist accommodation base,
Improving the quality of data on trips,
Improving the quality of tourists expenses data,
Improvement of satellite accounts,
City tourism,
Event related tourism,
Tourism potential,
Tourism attractiveness.
The models developed by the project partners have been adapted to the number and types of
inventoried sources in each country and to the areas where they will be applied in the short term.
Their brief characteristics, taking into account the type of external data sources planned to be used
and statistics potentially to be improved, broken down by country, is presented below.
A team from the Netherlands to improve the quality of tourism supply side data, in addition to data
from web scraping, intends to use information from the Register of non-categorized tourist
accommodation establishments (Chamber of Commerce (via Business Register), Register of Addressen
and Buildings (BAG 2019), and others (Locatus, Airports register). Among the external data sources
that may be useful in estimating the demand side are, among others, NBTC-NIPO Research Company
on holiday, recreation and other sources (Terrace Research, business travel, Museum and recreation
statistics). The planned results include: Improving the completeness of tourist accommodation base,
spatial disaggregation of data on tourist accommodation base, improving the quality of tourist’s
expenditure data and improvement of tourism satellite accounts.
In Poland, the data obtained using the web scraping method of web portals offering accommodation
are used as a basis for improving the quality of data on tourist accommodation. To improve quality,
additional information will be used from the Register of non-categorized tourist accommodation
establishments (EOT), which is run and updated in Poland by commune offices. Information obtained
from web scraping and data from Border guard data, Automatic Number Plate Recognition System
(ANPRS) and traffic sensors are used to improve the quality of estimates of data on tourism demand
(surveys of the participation of Polish residents in trips).
An important element in estimating the demand side of tourism can be data held by intelligent cities,
which, among other things, in their assumption, focus on the development of “smart” tourism using
the latest solutions and information technologies in conjunction with big data (Gretzel et al. 2016;
Wang et al. 2016). Polish partners continue to cooperate with the city of Rzeszów in the use of data
from smart systems in their possession. Among the identified data sources, there is a possibility to use
data on car traffic. The level of traffic volume is measured on the basis of monitoring located at the
largest intersections of the city monitored. Example data concerning car traffic at intersections in the
city of Rzeszów are presented in Table 5.

13
Table 5. Data from car intersections from Smart City Rzeszów system
Data on the number of cars entering and leaving the city, combined with data obtained from license
plates (from which the municipality/country of origin of the vehicle owner may be identified), can be
used to estimate the number and country of origin of tourists as well as same-day visitors. This is of
particular importance for cities that are close to the border, as well as for those that are particularly
popular with foreign visitors.
Furthermore, data from city parking meters can also be used to estimate the number of same-day
tourists. Systems supporting parking spaces in cities have registers containing data on car registration
and the hours in which a given car occupied a parking space in a selected place in the city. A good
example is the city of Rzeszów, which will be the first Polish city to introduce in 2021 video monitoring
of the state of free parking spaces based on the MESH 5G technology. The deployed cameras, sensors
and neural networks will collect and analyse information about parking cars 24 hours a day.
Knowledge about the number of daily arrivals of same-day visitors from abroad and the place where
their cars were parked in the city may be of particular importance when estimating the expenditure
of foreigners on shopping in Poland. Thanks to the above-mentioned system the number of vehicles
parking near shopping centres will be determined.
Other interesting data from Smart City systems that can be used for tourism statistics include data on
waste production and water consumption. According to Zorpus et al. (2014), on average, one hotel
tourist can produce 1 kg of waste per day which is undoubtedly a very interesting variable in terms of
the possibility of using it to estimate the number of foreign visitors to the city. Based on data on the
level of waste consumption in cities (daily, weekly), it will be possible to estimate the level of tourist
traffic (this especially applies to the cities with a high intensity of seasonal tourist traffic). Information
gathered from Smart City systems also enables the estimation of the number of participants in events
such as outdoor concerts and sports events, by monitoring the number of buses stopping at stops and
the people who use them. This system is currently being tested in Rzeszów. In the near future with
the help of ANPRS cameras, among other things, will allow for automatic recognition of license plates,
as well as monitoring of stopping time, size and type of vehicle at the stop and the area occupied by
the bus. Then, data from local servers will be filtered in the central system and will generate a report
on vehicles that have stopped at the stops. As evidenced by the example of the city of Rzeszów, great
opportunities are provided by the system that counts people entering/leaving the main square of the
city and collects data from traffic sensors located on the roads and promenades leading to the market
square where various types of events take place. Motion sensors located on the promenades leading
to the city square record all people entering and leaving the market.

14
The use of data from “smart” sources opens up new opportunities for tourism statistics. Cooperation
between city authorities with the above-mentioned systems, and the Statistical Offices may bring
mutual benefits and contribute to the change of the concept of tourist traffic management, inventing
innovative ways of managing it, and thus ultimately lead to an increase in tourist traffic in the region.
More accurate statistical data showing the level of tourist traffic in cities and produced on the basis
of combining data from official statistics with data from smart systems will translate into decisions
made by decision-makers regarding regional policy.
As a result of using statistical methods, i.e. combining and disaggregating data from these sources, it is
planned to achieve several goals. These include: improving the completeness of the tourist
accommodation establishments base, improving the quality of data on tourists' trips and expenses,
event tourism, developing flash estimates of the use of tourist accommodation establishments.
The effects of the described work and the results obtained may be used in the future for improvement
of Tourism Satellite Accounts (TSA).
In Portugal, estimates of the supply side of tourism were be compiled using data obtained from web
scraping and data from National Tourism Registration - Tourist Establishments and National Tourism
Registration - Local Accommodation. Data from tourism demand side surveys in future will be
supported in the future by data from web scraping and data from administrative sources - Airport
Data, Credit and Debit Card Transactions. As a result of combining data from these sources, it is
planned to achieve six expected results, including improvement of quality of tourists’ expenses data,
improvement of quality of data on trips, flash estimates for tourist accommodation and improvement
of Tourism Satellite Accounts (TSA).
In Italy, the improvement of the quality of the supply side data could be achieved by using web
scraping related data and data from administrative sources such as Water consumption and Waste
production. The estimation of tourism demand side could be improved on the basis of web scraped
data and using Survey on museums and similar institutions data, Water consumption data, Railway,
airport and port data and Border Traffic survey (BI) data. Exploiting the potential of the data
combination, ISTAT will aim to develop results that can contribute to the achievement of the
10 objectives. These include, among others, the following: improving the quality of data on trips,
improving the quality of tourist expenses data, improving the completeness of tourist accommodation
base, tourism potential and others.
Bulgaria has developed a Flow Model in which data from the Ministry of Interior, Airports and others
will be used to improve the quality of tourism supply side data. In the case of the demand side of
tourism, apart from the data obtained using the web scraping method, Bulgaria intends to obtain
additional information from the same sources as for the supply side. Based on data from the above-
mentioned sources, Bulgaria intends to obtain results for improving the completeness of tourist
accommodation base, flash estimates of the use of tourist accommodation base, improving the quality
of data on trips, improvement of satellite accounts.
In the Flow Model developed by Slovakia, the basis for improving the quality of tourism supply data,
in addition to data from web scraping, are data from Regulatory reporting FIN1-12 and Monthly bed
tax data including the overnights data in the cities Bratislava and Košice. The tourism demand side in
Slovakia will be additionally estimated based on data from web scraping and from an external source

15
- financial transaction data. As a result of using WPJ methods of combining data, Slovakia will attempt
to improve the quality of data on tourism trips and improve the completeness and data validation of
tourist accommodation establishments. Improving the quality of data in this area will allow the
Improvement of Tourism Satellite Accounts (TSA) in the future. In addition, data from BTB data (unique
Wi-Fi connection, etc.) can be used to determine Tourism potential, Tourism in selected cities or
regions, Tourism centre points (attractions).
Germany (Hesse) improves data quality of the supply side of tourism by using several data sources
gathered by web scraping and linked to official statistics (accommodation survey and business
register) in order to improve completeness of official tourism statistics as well as improve plausibility
checks and imputation of survey data with data stemming from web scraping. Additionally, Hesse
established a cooperation in order to use anonymous mobile network data to measure tourism flows
not covered by official statistics (day visits, overnight stays in small accommodation businesses). This
will contribute to improve the picture of the demand side of tourism. Other external data sources
include the number of visitors and travellers by plane and ship which contribute to the demand side
of tourism. Given data from financial transactions regarding the “sharing economy” become available
from cooperation with data holder (see workpackage G), they could be used to complete the picture
on the demand side of tourism. Additionally, there exist some surveys strongly related to tourism in
general and may cover expenses of tourists in detail. Either they have a very strong regional focus or
they do not contain information on expenses.
Greece has developed a Flow Model which focuses on improving the quality of tourism supply side
data. Estimates may be developed using data from web scraping and external data sources such as
the Tax Authority Register of Short-Term Lease Properties and Register of properties in Greece, which
are offered for short-term lease through digital platforms. By combining such data, Greece intends to
achieve the following goals: improving the completeness of tourist accommodation survey frame,
compiling flash estimates of tourist accommodation statistics.
1.2. Web scraping
Collecting data from websites related to tourism activities is one of the key ways to improve the quality
of data related to accommodation establishments as well as information on trips and expenditure.
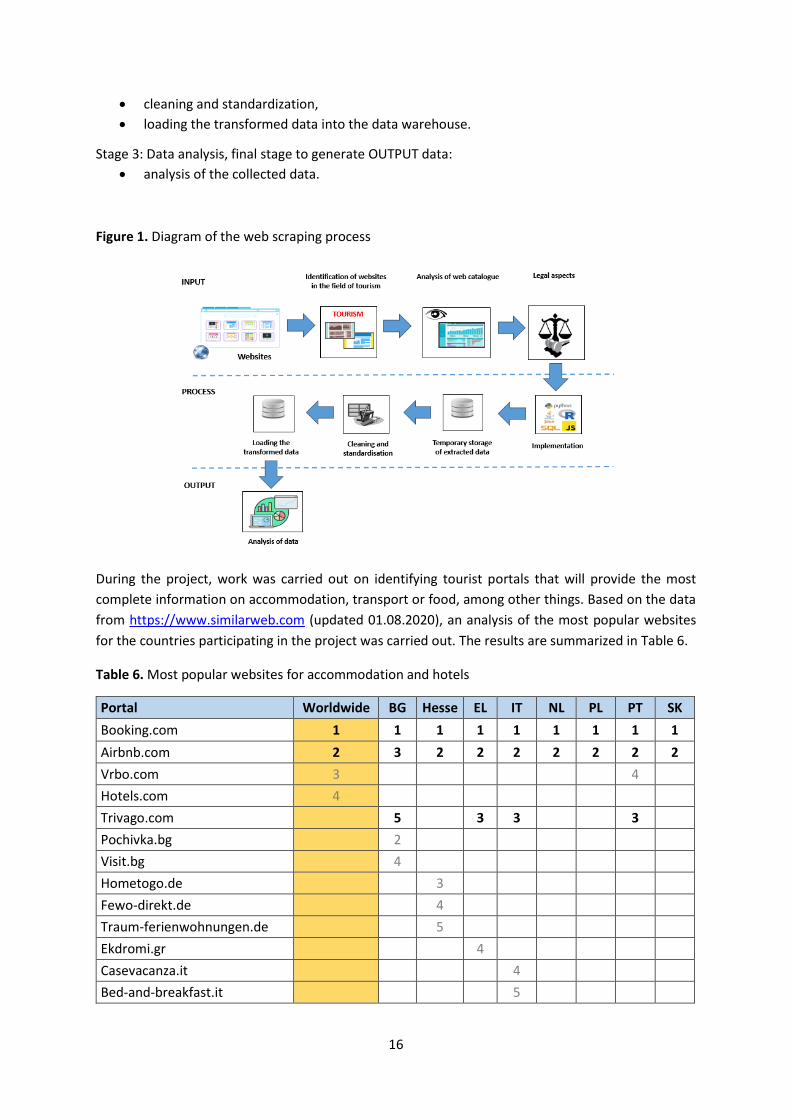
Deliverable J1- ESSnet Methods for webscraping, data processing and analyses presents the Flow
Model (see Figure 1) for web scraping processes in the field of tourism.
It consists of three stages:
Stage 1: Methods for web scraping to gather the INPUT data, i.e.
identification of websites,
analysis of the catalogue of websites,
analysis of legal aspects.
Note that the collected data are not structured and not suitable for immediate analysis.
Stage 2: Data processing steps to PROCESS data, i.e.
implementation and saving of extracted data in a temporary database,
16
cleaning and standardization,
loading the transformed data into the data warehouse.
Stage 3: Data analysis, final stage to generate OUTPUT data:
analysis of the collected data.
Figure 1. Diagram of the web scraping process
During the project, work was carried out on identifying tourist portals that will provide the most
complete information on accommodation, transport or food, among other things. Based on the data
from https://www.similarweb.com (updated 01.08.2020), an analysis of the most popular websites
for the countries participating in the project was carried out. The results are summarized in Table 6.
Table 6. Most popular websites for accommodation and hotels
Portal Worldwide BG Hesse EL IT NL PL PT SK
Booking.com 1 1 1 1 1 1 1 1 1
Airbnb.com 2 3 2 2 2 2 2 2 2
Vrbo.com 3 4
Hotels.com 4
Trivago.com 5 3 3 3
Pochivka.bg 2
Visit.bg 4
Hometogo.de 3
Fewo-direkt.de 4
Traum-ferienwohnungen.de 5
Ekdromi.gr 4
Casevacanza.it 4
Bed-and-breakfast.it 5

17
Table 7. Most popular websites for accommodation and hotels (cont.)
Portal Worldwide BG Hesse EL IT NL PL PT SK
Landal.nl 3
Roompot.nl 4
Centerparcs.nl 5
Noclegi.pl 3
Profitroom.com 4
Noclegowo.pl 5
Megaubytovanie.sk 3
Ubytovanienaslovensku.eu 4
Sorger.sk 5
Based on the results obtained, the most popular websites in Europe are:
Booking.com
Airbnb.com
Trivago.com
The remaining places in the ranking are local websites offering services only within a given country.
However, it should be noted that the popularity ranking of websites is based on the number of visits
to the website, but it does not specify how the portal was searched. For websites that are available in
most European countries, searches for accommodation establishments may refer to those located in
a given country as well as abroad. Therefore, in the next stage, an exemplary number of offers
provided on international websites was checked and compared with the number of offers on selected
national websites. The results are presented in Table 8.
Table 8. Number of establishments in selected portals
Portal BG Hesse EL IT NL PL PT SK
Booking.com 4 718 3 944 5 871 22 032 13 490 8 130 5 205 2 566
Hotels.com 2 076 4 850 20 122 2 314 6 025 6 393 11 430 653
Nocowanie.pl 36 710 47 949 4 881
Pochivka.bg 17 226
traum-ferienwohnungen.de 702
Ekdromi.gr 401
Landal.nl 641
noclegi.pl 34 839
Megaubytovanie.sk 4 827
On this basis, it is not possible to clearly indicate the best and most complete website containing
accommodation establishments that could be subject to the web scraping process and constitute the
only source of information for all countries.
Attention should be also paid to the limitations of search engines on individual websites. Very often,
portals, especially international ones, limit the number of results presented at one time. The
Booking.com portal limits the number of results displayed for a given location to a maximum of 1 000,

18
the Airbnb.com portal presents a maximum of 300 offers for a single location, while most domestic
portals present all offers at the same time. Therefore, the preparation of web scraping processes for
international portals requires the development of more comprehensive solutions.
In summary, the best approach for countries is to retrieve data from both international and local
portals, and then subject the created database to cleaning and standardization processes. All the steps
necessary for this purpose and the description of the remaining stages in the model presented in
Figure 1 are described in detail in the above-mentioned deliverable J1.
1.3. Source characteristics
Objectives defined for WPJ – Innovative Tourism Statistics, state that “The increasing growth of
information leads to big data and information systems targeting to administer, analyse, aggregate and
visualise these data”. Variable or data issues, such as overlapping concepts, indirect relations between
sources and redundancies or inconsistencies of information, although not always obvious or
immediately recognizable, are inevitable, when combining big data sources with administrative
sources and official statistics.
Big data as well as administrative data are not produced for the purpose of official statistics and,
therefore, before integrating them in the production system of official statistics, potential quality,
methodological, legal, privacy and other issues should be identified and addressed while, when
multiple sources are to be combined their indirect interconnections should also be taken into account.
As the information expands horizontally (more domains or areas) and vertically (more information for
each domain or area), it will be increasingly difficult to manage, search, extract implicit information
and check for inconsistencies. Therefore, it is strategically imperative to prepare and present the
relevant information in a user-friendly interface capable to deal with increasing complexity.
This subchapter will address source and variable mapping concerning official statistics variables and
domains. The goal is to provide an interactive graphical representation of the relationships and
interconnections between data sources (multi-purpose data sources, survey data and web scraped
data), variables and domains, countries and experimental results.
This approach is inspired by network analysis which can be considered as map of relationships. These
relationships are composed by nodes (for example, statistical domains or data sources) and edges that
represent the connections between nodes. In this map of relationships not only different types of
nodes but also different types or intensities of connections (edges) can be represented. For example
if a particular source is very reliable or its data is highly relevant to a particular domain, a thicker line
than otherwise can graphically represent its connection.
Source and variable identification and taxonomy are part of a bottom-up process to produce a basis
for ontology. As data sources and variables are identified and described, it is possible to organize them
in categories with an underlying structure of connections. The end result provide domain knowledge
within a shared framework and contribute to reducing ambiguities and misinterpretations.

19
R Packages for network visualisation
Dedicated commercial and open source2 software for ontology development is widely available.
Nevertheless, it is possible to cover the basic principles with an already familiar language such as R.
This language offers some advantages as is an already a common tool in NSIs. As such, it will be
probably not only faster to produce and disseminate results as well to share data and code but also to
integrate them in current existing workflows. Discarding the need to learn a new tool is also an
important reason to consider.
Network visualization is valuable alternative to represent a complex and otherwise static set of heavily
interconnected data. In order to do this the visNetwork package3, an R interface to “vis.js” JavaScript
library were chosen for interactive visualization of networks consisting of nodes and edges. Although
it is not mandatory to know JavaScript to use this package, some basic knowledge is helpful for some
functionality such as action related events. The visNetwork is very flexible and accessible not only
because it is based on open-source software, but also because it works on any modern browser for up
to a few thousand nodes and edges.
The package has highly customizable options such as shapes, styles, colours, sizes, images but, most
importantly, interactive controls (highlight, collapsed nodes, selection, zoom, physics, movement of
noes, tooltip and events). Additionally it uses HTML canvas for rendering.
It is based on html widgets, so it is compatible with shiny, R Markdown documents, and RStudio
viewer. R’s ability to read and write in a multitude of formats makes it very appealing to this sort of
task. In future work, if it would become necessary to adopt a new tool, all the work produced could
very likely be used.
Network visualisation for WPJ
In order to create an interactive network, the graphic WPJ Flow Models from Bulgaria, Germany-
Hesse, Greece, Italy, the Netherlands, Poland, Portugal and Slovakia had to be “translated” in two
input data objects describing nodes and their connections (edges). This can be done using a tabular
format like CSV, XLSX or even R dataframe’s.
2 https://protege.stanford.edu/ 3 https://datastorm-open.github.io/visNetwork/

20
Figure 2. WPJ Flow Models “translated” in two input data objects describing nodes and their connections (edges)
This first step, illustrated in the figure above, requires a significant work of re-conceptualization in
order to make the different workflows compatible and consistent without tampering with their
substance. The majority of the countries used a similar template but its implementations and content
varied. Making them compatible is quite challenging.
The structure of the nodes tabular object is very simple. It only needs 8 fields:
Id: a unique identification numeric value.
Label: a string value to describe the ID identification.
Title: string value that will be displayed when the node is selected, or when the mouse pointer
hover on it.
Group: string value to be used as input to a combo-box that will allow selecting which layer of
information will be displayed. It can have multiple categories separated by a comma.
Value: a numeric value that defines the size of the object. It will vary according the number of
countries that used it.
Shape: string value that identifies the nature of the node.
Colour: string value that identifies the nature of the node.
url: string value, a web link that will be active and allow the user to open it in a browser upon
a click.
The Figure 3 presents a detail of the nodes tabular object. As mentioned, nodes can have multiple
shapes, colours, sizes which can be used as attributes. Multiple-labelled attributes can also be used in
a “group” column, so each node can have multiple attributes (or categories). This enables the user to
select thru a comb-box, different layers of information to be displayed. Edges can also have different
lengths, widths, arrows and formats.

21
Figure 3. A detail of the nodes tabular object
The structure of the edges tabular is also very simple:
From: string value, id of the node from where the connection starts.
from_label: string value, the according label of the id. It makes identification easier.
to: numeric value, id of the node to where the connection ends.
to_label: string value, the according label of the id. It makes identification easier.
Length: numeric value to define the size of the connection (edge).
Width: numeric value to define the width of the connection (edge).
Label: string value. Useful to comment a particular connection (edge).
Arrows: string value, defines the direction of the connection.
Figure 4. The structure of the edges tabular
Using input data (nodes and edges) in a tabular format has advantages when it comes to fill in the data
but has some evident disadvantages when dealing with import/export formats, managing file
locations, just to name a few. Therefore, the best option available is to integrate data in the R script
itself4. This way in just one text file both data and code to produce network visualization are available.
This also has obvious advantages when it comes to share and disseminate the results.
The script is then “self-contained” in the sense that the data is embedded in the code. For that purpose
it can be used the dput {base} R command that conveniently recreates an object, such as a dataframe.
It does so by writing an ASCII text representation of an R object to the RStudio console which in in turn
can be copied to the script itself. This way the user is not required to import data, he just needs to run
4 The complete script can be found in the wiki page of the project or be requested to [email protected]. An image detail can be found in Annex 6.

22
the code. The script is also heavily commented and organized in an outline layout. Comments include
an introduction to the script, what’s new about that particular version of the script and what’s new
about the input data (e.g. corrections, additions). In some cases there are even short descriptions of
the available options. This makes very easy for the user to understand each single step of the script.
The Figure 5 presents a detail of the R script in RStudio IDE.
Figure 5. A detail of the R script in RStudio IDE
RStudio’s feature “Show document outline” (Ctrl+Shift+O) that can be found in the top right corner of
the image above shows the complete outline of the script and makes it easier to browse. The outline,
the comments and the use of the pipe operator (%>%) are focused on usability so the user can feel
encouraged to experiment new options.
The script creates data and a visNetwork object, shows the result on RStudio viewer and saves it as an
HTML file. This can be useful for non R users or just simply to share. Nodes with more connections
(edges) are automatically placed on the centre while nodes with fewer options are relegated to the
periphery of the network thus giving centrality a sense of relevance. Overlapping of nodes is also
automatically minimized. As mentioned earlier, the size of the nodes is proportional to the number of
countries they relate to. The Figure 6 presents a general (static) view of the visNetwork “Overview of
the Inputs and Outputs of the Pilot Project on Innovative Tourism Statistics”.

23
Figure 6. Overview of the Inputs and Outputs of the Pilot Project on Innovative Tourism Statistics
Interactivity is a key feature in this visualization. Green navigation buttons on the bottom left and
bottom right of the network canvas can be used to navigate, zoom in and out and re-centre. There is
also available a multi-selection feature: a long click as well as a control-click will add to the selection.
Figure 7. Navigation buttons
When hovering a selected node, a tooltip presents additional information contained in the nodes
object more precisely in the “title” field. When a node is in fact an URL (in the case of this visNetwork,
it has the shape of a light-blue coloured triangle), the web link is showed, it can be accessed upon
double-click, causing it to open a new window with the related content.
Figure 8. Additional information contained in the nodes object
24
At any moment, the user can create a screen-shot of the network by using the “Export as PNG” button.
The resulting image will be saved to “Downloads” folder. This can be useful for extracting images of
different layers of insights that the complete visNetwork inherently holds.
Figure 9. “Export as PNG” button
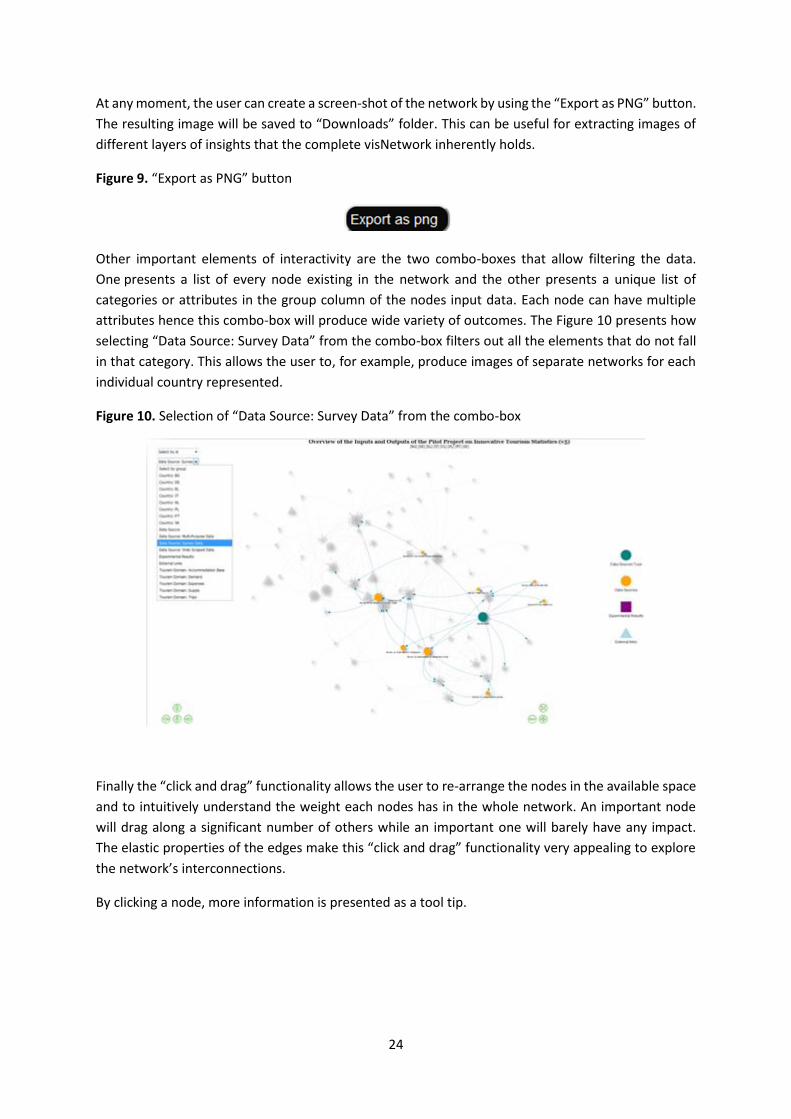
Other important elements of interactivity are the two combo-boxes that allow filtering the data.
One presents a list of every node existing in the network and the other presents a unique list of
categories or attributes in the group column of the nodes input data. Each node can have multiple
attributes hence this combo-box will produce wide variety of outcomes. The Figure 10 presents how
selecting “Data Source: Survey Data” from the combo-box filters out all the elements that do not fall
in that category. This allows the user to, for example, produce images of separate networks for each
individual country represented.
Figure 10. Selection of “Data Source: Survey Data” from the combo-box
Finally the “click and drag” functionality allows the user to re-arrange the nodes in the available space
and to intuitively understand the weight each nodes has in the whole network. An important node
will drag along a significant number of others while an important one will barely have any impact.
The elastic properties of the edges make this “click and drag” functionality very appealing to explore
the network’s interconnections.
By clicking a node, more information is presented as a tool tip.

25
Figure 11. A node with more information
Dragging a node will give a sense of the importance it holds in the global network, since it will literally
pull all other direct or indirect connected nodes along with it. This inertia weight is proportional to its
relative importance to the whole network.
Figure 12. A dragged node with more information
The use of URL’s as showed in the Figure 13 represented as a light-blue triangle node is good way to
link and expand the visNetwork to other contents. In the present case, the URL’s only link to existing
webpages. Nevertheless if the visNetwork (in HTML format) is stored, for example in a shared network
drive, it is possible to link to documents with other formats such as PDF, MS Word, MS Excel, among
other. This feature will significantly expand the limits of depth and format of data that a visNetwork
is natively able to support.
Figure 13. The use URL link to existing webpages

26
This visualization tool is also found adequate to variable mapping as it is described in use case
WPJ.2.PT. Variable mapping adds a new layer of information to the previously developed visNetwork
“Overview of the Inputs and Outputs of the Pilot Project on Innovative Tourism Statistics (v5)”. Based
on the existing R script, this new version with extended content allows clearer and intuitively views
on the process on how variables are used in the workflow that intermediates data sources and
experimental results.
Describing an interactive tool in a static format such as written report (as in this case) is challenging
and will always come as short. Therefore, it is highly recommended to run the R script and use the
HTML version of this VisNetwork in order to fully benefit the experience of such a dynamic product.
A small video on how to use and make a visNetwork is available on https://youtu.be/cYETq0rIT9k
as extension of this work.
A quality evaluation framework for administrative- and web-data
The data structures found while scraping web data from the internet show some similarities with
administrative data sources, e.g. accommodation identifier, name of the accommodation and type of
accommodation. The main difference seems to be that administrative data sources have formal
taxonomies, while web data do not. In fact, users of online platforms like Hotels.com or Booking.com
have a number of degrees of freedom to name their accommodations, to classify them. They also may
leave some fields empty and can choose or define an own accommodation category to advertise on
the web.
In 2008, a framework for the evaluation of the quality of administrative and other secondary data
sources was introduced by Daas et al (2009). This framework puts forward a successive evaluation of
quality aspects that includes three hyper-dimensions: Source, Metadata, and Data. The relevancy of
this approach is that it highlights different quality aspects (dimensions) of a data source. Hence each
dimension may contain several quality indicators.
A quality indicator is measured (or estimated) by one or more qualitative or quantitative methods. An
important result of this sequential process is the fact that it efficiently guides the user in the evaluation
of the quality of sources and (meta) data. Moreover, a hierarchy is introduced among hyper-
dimensions. It prevents investing time and effort in the determination of quality aspects that may not
(yet) be relevant at for example an exploratory phase. Last, by evaluating each hyper-dimension,
informed decisions (and actions) on data sources can be rapidly (under)taken.
In this section, the checklist proposed by Daas et al. (2008b; 2009) was applied on an example of multi-
data sources. Basically, a comparison between the hyper-dimensions of an Administrative Data Source
(Register of Addresses and Buildings, BAG) and a Web Source (Hotels.com) is displayed in Table 9 and
Table 11. These tables focus on the Source and Metadata hyper-dimensions. Notice that third hyper-
dimension (Data) is kept outside the scope of the current Pilot Track WPJ project.
The Source hyper-dimension deals with the quality aspects related to the data source as a whole, the
data source keeper and the delivery of the data source to the NSI. The Source hyper-dimension is
composed of five quality dimensions: Supplier, Relevance, Privacy and Security, Delivery, and
Procedures. Table 9 lists the dimensions, quality indicators and measurement methods for the Source
hyper-dimension.

27
The Metadata hyper-dimension focuses on the metadata inherent to aspects of the data source.
Clarity of the definitions and completeness of the meta information are some of the quality aspects
included. The Metadata hyper-dimension is composed of four dimensions: Clarity, Comparability,
Unique keys, and Data treatment (by the data source keeper). The latter is a special case as it consists
of quality indicators used to determine whether the data source keeper performs any checks on
and/or modifies the data in the source. See Table 11.
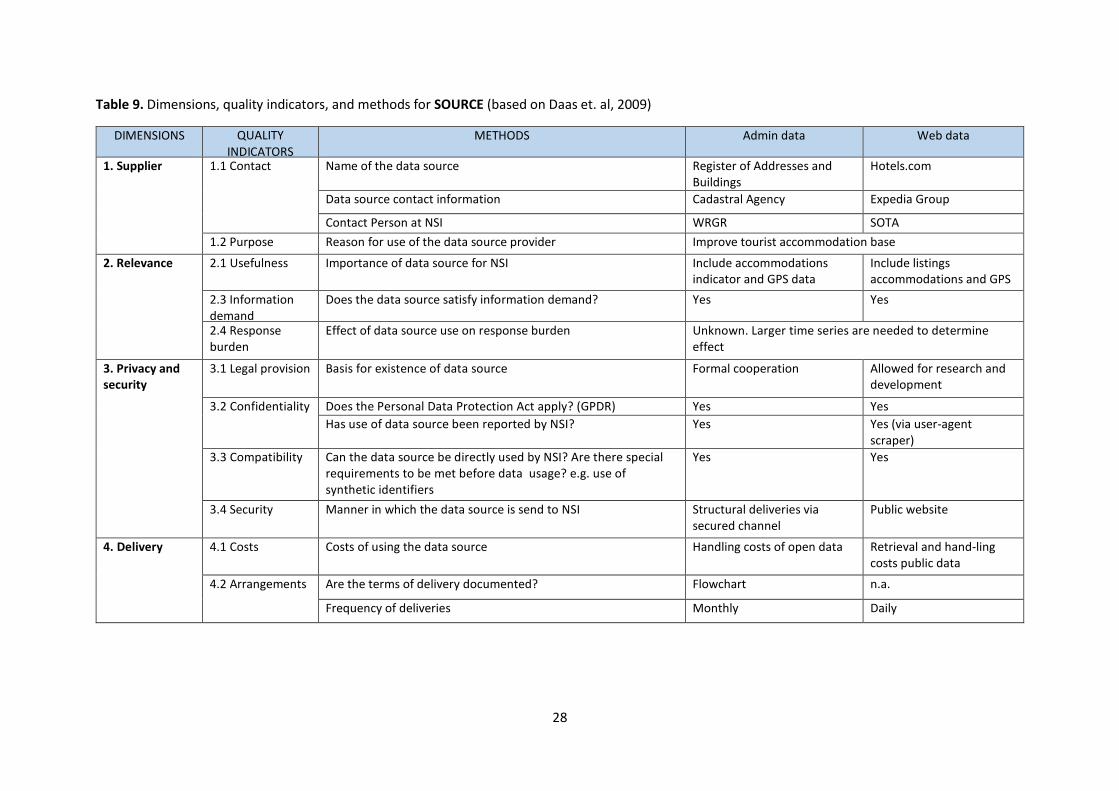
28
Table 9. Dimensions, quality indicators, and methods for SOURCE (based on Daas et. al, 2009)
DIMENSIONS
QUALITY INDICATORS
METHODS
Admin data Web data
1. Supplier 1.1 Contact
Name of the data source Register of Addresses and Buildings
Hotels.com
Data source contact information Cadastral Agency Expedia Group
Contact Person at NSI WRGR SOTA
1.2 Purpose Reason for use of the data source provider Improve tourist accommodation base
2. Relevance 2.1 Usefulness
Importance of data source for NSI Include accommodations indicator and GPS data
Include listings accommodations and GPS
2.3 Information demand
Does the data source satisfy information demand?
Yes Yes
2.4 Response burden
Effect of data source use on response burden Unknown. Larger time series are needed to determine effect
3. Privacy and security
3.1 Legal provision
Basis for existence of data source
Formal cooperation Allowed for research and development
3.2 Confidentiality Does the Personal Data Protection Act apply? (GPDR) Yes Yes
Has use of data source been reported by NSI? Yes Yes (via user-agent scraper)
3.3 Compatibility Can the data source be directly used by NSI? Are there special requirements to be met before data usage? e.g. use of synthetic identifiers
Yes Yes
3.4 Security Manner in which the data source is send to NSI
Structural deliveries via secured channel
Public website
4. Delivery 4.1 Costs
Costs of using the data source
Handling costs of open data Retrieval and hand-ling costs public data
4.2 Arrangements
Are the terms of delivery documented? Flowchart n.a.
Frequency of deliveries Monthly Daily

29
Table 10. Dimensions, quality indicators, and methods for SOURCE (based on Daas et. al, 2009) (cont.)
DIMENSIONS
QUALITY INDICATORS
METHODS
Admin data Web data
4. Delivery 4.3 Punctuality
How punctual can the data source be delivered? Within a week after the end of the month n.a.
Rate at which exceptions are reported
Monthly n.a.
4.4 Selection What data are delivered? All cities; all dwellings n.a.
Do these comply with the requirements of NSI? Yes, but data lack of second home indicator Yes
5.Procedures 5.1 Data collection
Familiarity with the way the data are collected
Yes, structural (since 2012) and under alliance agreement (since 2019)
Empirical
5.2 Planned changes
Familiarity with planned changes of data source
Yes No
5.3 Feedback
Ways to communicate changes to NSI Per mail/telephone No
Contact data source supplier in case of trouble? Yes No
In which cases and why? Coverage problems or update problems No
5.4 Fall-back scenario (Risk estimation)
-Dependency risk of NSI High. There at least wo other statistics using same source
Medium. There are other data sources.
-Emergency measures when data source is not delivered according to agreement
Open data are available but editing is required
n.a.

30
Table 11. Dimensions, quality indicators, and methods for METADATA (based on Daas et. al, 2009)
DIMENSIONS QUALITY INDICATORS METHODS Admin data Web data
1. Clarity Description 0 = missing 1 = ambiguous 2 = clear
1.1 Population Unit definition Clarity score of the definition
Residence object (house or building)
2 Tourist accommodation (hotel, holiday home or similar)
2
1.2 Classification variable Clarity score of the definition
Purpose of use City
2 2
Type of tourist accommodation Location
1 2
1.3 (Key) Count variable definition
Clarity score of the definition
Construction year Status dwelling Surface
2 2 2
Price Guest reviews Capacity
2 1 0
1.4 Time dimensions Clarity score of the definition
Monthly (update depends on city)
2 Daily (update depends on accommodation
2
1.5 Definition changes Familiarity with occurred changes
Yes (included in metadata)
2 No (self-check) 0
1.5. Decisions and actions: When one or more of the above quality indicators are scored ‘description unclear’ (score 1) or ‘description missing’ (score 0 ) the data source keeper needs to be contacted. Only when these issues are solved, evaluation may continue from here on. In all other cases evaluation stops here. Remark: Data source keeper of Web-data needs to be contacted. (Unavailability of accommodation capacity is a constraint.)
2. Comparability Description 0: missing 1: unequal: conversion is impossible 2: unequal, conversion is possible 3: equal (100% identical)
2.1 Population unit definition comparison
Comparability with NSI definition
Comparable definitions 2 Comparable definition 2
2.2 Classification variable definition comparison
Comparability with NSI definition
Purpose of use City
2 3
Type of tourist accommodation Location
2 2
2.3 Count variable definition comparison
Comparability with NSI definition
Construction year Status dwelling Surface (built)
3 3 2
Price Guest reviews Capacity
2 1 0
2.4 Time differences Comparability with NSI definition
Yes, per month 3 No 2

31
Table 12. Dimensions, quality indicators, and methods for METADATA (based on Daas et. al, 2009) (cont.)
DIMENSIONS QUALITY INDICATORS METHODS Admin data Web data
2.4. Decisions and actions: When the data source is used to replace or is used in addition to other data sources and some of the comparability indicators have scored ‘unequal and conversion is impossible’ (score 1) or ‘description missing’ (score 0), the data source cannot be used and the evaluation stops here. These scores are less relevant for Data sources that are used for new statis-tics. In the latter and all other cases, evaluation may continue. Remark: Web-data source can be partially used.
3. Unique keys 0: keys missing 1: keys unequal, conversion is impossible 2: keys unequal, conversion is possible 3: keys equal (100% identical)
3.1 Identification keys Presence of unique keys Residence object ID 2 HotelID 2
Comparability with unique keys used by NSI
Accommodation number 2 Accommodation number 2
3.2 Unique combinations of variables
Presence of useful combinations of variables
Postcode, house number, house letter latitude, longitude (CRS: Amersfoort)
3 2
Postal Code, street latitude, longitude (CRS : 4326)
2 2
3.3. Decisions and actions: Data sources that need to be linked to other sources and were found not to contain unique keys or unique combination of variables, cannot be used. When this is the case, evaluation should stop here. When the presence of unique keys or unique combination of variables is not known for a data sources, this should be investigated in more detail. Contacting the data source keeper might be required to solve this problem. In all other cases evaluation may continue. Remark: Web-data source can be used

32
Table 13. Dimensions, quality indicators, and methods for METADATA (based on Daas et. al, 2009) (cont.)
DIMENSIONS QUALITY INDICATORS
METHODS Admin data
Web data
4. Data treatment (by data source keeper) Description 0 = Do not know 1 = No 2 = Yes
4.1 Checks Population unit checks performed
Yes 2 No (foreign address found)
1
Variable checks performed Yes (City, Purpose of Use)
2 2
Yes (City) Street
2 2
Combinations of variables checked
Yes, Postcode Street House number House letter
2 1 1 1
Yes, Postal Code Street House number House letter
1 1 1 1
Extreme value checks Yes, surface, construction year
2 2
Address Geolocation
2 2
4.2 Modifications Familiarity with data modifications
Yes, editing is done 2 No 1
Are modified values marked and how?
Yes, status variable is provided (changes in names)
2 No 1
Familiarity with default values used
Yes, original and corrected files are available
2 Yes, (self-check) 2
4.3. Decisions and actions: If in one or more of the above indicators a ‘do not know’ (score 0) is answered, the data source keeper needs to be contacted to clarify these issues. Remark: Web-Data scores low in checks and modifications
5.1. Conclusion METADATA 1 Is every question for each indicator answered?
1: no (describe which not and why) 2: yes

33
Table 14. Dimensions, quality indicators, and methods for METADATA (based on Daas et. al, 2009) (cont.)
5.2. Conclusion METADATA 2 Do all the indicators in the Clarity, Comparability, and Unique key dimensions have a score of 2 or higher and in the Data treatment dimension a score of 1 or higher?
1: no 2: yes Go to Data-part of the evaluation procedure (under development) If no (score 1): Is this a problem for the NSI? 1: no, because current use of web data is for accommodations inventory ……………………………………………………………… …………………………………………………………………………………… ……………………………………………………………………………………. Go to Data-part of the evaluation procedure (under development) 2: yes, because…………………………………………………………….. ……………………………………………………………………………………. ………………………………………………………………………………..….. ………………………………………………………………………………..….. ………………………………………………………………………………….... STOP EVALUATION

34
Next steps
The ideal situation will be to evaluate and/or benchmark more data sources. However, due to time
constraints, this task has not be reached. Nevertheless, it is worth to mention that the work of
Daas et al (2019) contemplates this extension and provides also recommendation on who should fill
this checklist, i.e.
Who should use this checklist?
The checklist should be filled in by an internal (future) user of the data source and/or an expert for
the secondary data source. For the Source part it is advised to contact the NSI contact person for the
particular data source (if available).
The operationalization of the next step will mean that the Statistics Netherlands selects some
additional experiences on web scraping other platforms (e.g. Booking.com and Airbnb) that are
connected to the ESSnet Big Data WPJ. In Table 15 and Table 16 a qualitative comparison between
these extra web data was displayed. Herein the symbols denote the most commonly observed score:
Good (+); Reasonable (o); Poor (-) and Unclear (?).
Table 15 and Table 16 show that so far web data of Booking.com seems to be a new potential source
for Tourism Statistics. See also report of Spinder (2019).
Table 15. Evaluation results for the Source hyper-dimension
DIMENSIONS DATA SOURCES
Hotels.com Booking.com Airbnb.com Tripadvisor.com Skyscanner.net taxi2airport.com
1. Supplier + + + ? ? ? 2. Relevance + + + + + + 3. Privacy and security + + o ? ? ? 4. Delivery o o o ? ? ? 5. Procedures -/? +/o O ? ? ?
Table 16. Evaluation results for the Metadata hyper-dimension
DIMENSIONS DATA SOURCES
Hotels.com Booking.com Airbnb.com Tripadvisor.com Skyscanner.net taxi2airport.com
1. Clarity o/- + o/? ? ? ? 2. Comparability o + - ? ? ? 3. Unique keys o o/? o ? ? ? 4. Data treatment + o/- o ? ? ?

35
2. Methods used for new tourism data
2.1. Methodology for combining and disaggregating data
Among the many inventoried data sources related to tourism, web scraping databases, administrative
registers and surveys for tourist accommodation establishments are of particular importance for the
process of combining and disaggregating data. The combination of web scraping databases and
administrative registers of tourist accommodation establishments will allow for the acquisition of new
accommodation establishments. Thanks to the high frequency of data from web scraping of
accommodation portals, it is possible to disaggregate monthly data on the occupancy of
accommodation establishments into daily data.
2.1.1. Combining data
The linkage of data from web scraping with data from administrative registers and statistical survey
frames is largely dependent on an appropriate matching strategy between these sources. Therefore,
achieving a reliable and as complete as possible result in terms of the population of tourist
accommodation establishments requires cross-checking the aggregates available on tourism-related
Internet portals and the aggregates from the administrative records and surveys of tourist
accommodation establishments.
When the data from portals are collected, the first question that arises pertains to the number of the
establishments which occurred in the portal data as well as in the survey frame. It may be implemented
by data linkage (or data matching) of data from the survey and data from accommodation portals.
Data linkage
Data linkage enables to check if a given tourist accommodation establishment from the portals is also
present in the survey frame. There are two main approaches to this task: deterministic (or rule-based)
record linkage and probabilistic (or fuzzy) record linkage. In the case of the simplest deterministic
matching, an identifier or a group of identifiers across databases are compared. Two records are linked
when all of the identifiers agree. A single unique identifier, e.g. some ID from the business register, can
serve as a matching variable. If it is not available then a group of identifiers can be used, e.g. postal
code and address.
The scraped data contain several identifiers that can be used for the linkage:
name of an accommodation establishment,
address,
postal code,
longitude and latitude.
The linking process is however hampered by a number of difficulties. Postal codes and addresses from
accommodation portals often contain typographical and data entry errors, such as transposed digits
and misspellings. This situation may occur if the portal does not force a standard format when entering
data (or uses a different scheme than the business register or addresses from the survey frame).
Sometimes the address is hidden in the name of establishment while the field address is not filled in.
On the other hand, geographical coordinates represented by pins on the map are sometimes absent

36
or not placed precisely near the building entrance or in the centre of the building. Additionally, some
hotels may choose their gate to the parking lot as their GPS-address.
As a result, there is no completely reliable identifier that can be used for linkage. Thus, the data linkage
cannot be conducted without preparatory data pre-processing and additional tools.
The consecutive subsection present two approaches for data linkage: the first one is based on
geographical coordinates and distances between accommodation establishments, the second one is
based on comparing text strings formed from addresses and postal codes of accommodation
establishments.
Distance-based linkage
In the first step, addresses and postal codes need to be to the same format. Many rules standardizing
text strings may be implemented with the so-called regular expressions. For more details see,
e.g. Friedl J. (2006). Standardization is recommended for every type of data linking. Data
standardization enables to analyse and use data in a consistent manner. Unfortunately, such
standardization is difficult for addresses. The variety of names of streets and the variety of misspellings
make it hard to describe all possible regular expressions to handle the problem.
This results in the difficulty to perform deterministic linking based on addresses but it still is very
helpful during next step of data linkage, i.e. deriving latitude and longitude from (pre-processed or
standardized) addresses. These coordinates can be obtained using any geocoding software. Some
countries have the knowledge and tools needed to implement the geolocation process. For other
countries WPJ developed a tool for geolocation of address of accommodation establishments from the
survey frame and web scraping. The solution was prepared in JavaScript language and uses HERE Maps
API. HERE Maps are precise and up to date, so they are often used for car navigation. The variety of
available functionalities in the application, as well as extensive documentation and technical support,
allowed to build a universal tool being a part of the prototype created by WPJ. A very important
function used in the developed solution is an automatic parsing of address data to a common structure,
which significantly reduces the time needed to prepare batch files for the used tool. The more work is
done in address standardization, the better performance of HERE Maps API is achieved. In a case that
a given address is not recognized at all by the geolocation tool, latitude and longitude can be taken
from the portal. In order to allow analysis and selection of the optimal tool, each partner - while
working on the geolocation process and preparing case studies - has chosen the tool that will be best
suitable for their situation.
If the geographical coordinates are available for the addresses from the survey as well as from the
accommodation portal, then the distance-based approach can be applied. In this approach there is no
need for the establishments from different data sources to have exactly the same coordinates.
Nevertheless, the coordinates in all data sources must come from the reference coordinate system
which uniquely define the positions of the points in space. It is common to use WGS 84 - which is also
used in the Global Positioning System (GPS). Also prominent web map services often use this
coordinate reference system (CRS). And so do many internet portals when using these prominent web
services when showing points on maps.

37
The distance-based approach can be applied in the following way:
1. Calculate the distance between all establishments from the survey frame and all
establishments from scraped data. This can be done with, e.g. Haversine formulae or
Vincenty’s formulae5.
2. For each establishment in scraped data find all establishments in the survey frame for which
the distance between the establishment from scraped data and establishments from the
survey frame does not exceed a threshold.
3. For each establishment in scraped data, match the closest one found in the second step.
In the second step, various thresholds can be chosen with respect to, e.g. accommodation type groups.
For instance, hotels – in general – are larger than apartments or holiday homes. Moreover, hotels have
sometimes more than one entrance which results in two different sets of coordinates.
In a deterministic approach, establishments are paired if the distance between their addresses or
geolocations does not exceed a critical value. Setting this threshold plays a crucial role in this method:
using a threshold too low (i.e. only a small distance is allowed) will result in too many False Negative
pairs. Allowing for larger distances possibly introduces too many False Positive pairs.
String matching
Techniques based on comparing text strings composed of addresses, place names and postal codes of
accommodation establishments can be used to pair them. Among the many metrics for comparing text
strings one can mention:
Levenshtein distance (Levenshtein V. I. (1966)).
Jaro-Winkler distance (Winkler W. E. (1990)).
Jaccard index (Jaccard P. (1901)) for n-grams (Weaver W. (1955))
Cosine distance for n-grams (Sidorov G., Gelbukh A., Gómez-Adorno H., Pinto D. (2014).)
Levenshtein distance takes into account addition, deletion, and replacement of characters - the more
such operations are needed to turn one string into another, the greater the distance. The maximum
distance between two strings is equal to the length of the longer strings. The Jaro-Winkler distance
takes into account letter transpositions and the occurrence of a prefix. The Jaro-Winkler distance is
normalized but it does not satisfy the triangle inequality, so it is not a metric in a strict sense. The next
two methods are based on the concept of n-grams. The N gram of a given word is the sequence of n
characters in that word. For example, the word “major” has three 3-grams: “maj”, “ajo”, “jor” and four
2-grams: “ma”, “aj”, “jo”, ”or”. The Jaccard index is the quotient of the number of common n-grams
divided by the number of all different n-grams in both words. If a dictionary of n-grams is created on
the basis of, e.g. all compared strings, then each string can be assigned a vector of binary variables
describing the presence of n-grams in them. Then, for every two vectors, the cosine of the angle
between them can be determined, calculated as the quotient of their dot product and the product of
their norms.
In a deterministic approach, establishments are paired if the chosen similarity measure does not fall
below a predetermined critical value. Again, setting the threshold plays a crucial role. Similar to the
distance-based approach described above, a critical value for string similarity chosen too high will
5 Haversine formula is based on spherical trigonometry whereas Vincenty’s formulae is based on ellipsoidal trigonometry and requires solving iteratively a system of (truncated) equations.

38
result in more falsely missing pairs. On the other side, a critical value chosen too low will produce more
False Positive pairs.
Evaluation of data linkage
Quality of matching can be checked by reviewing names and addresses of paired establishments and
deriving the number of correctly and incorrectly matched and not-matched establishments.
After matching of accommodation establishments, four situations may happen:
1. Establishment was paired correctly (True Positive, TP).
2. Two establishments were incorrectly paired due to small distance between them (distance
smaller than threshold) (False Positive, FP).
3. Establishment was not paired correctly due to high distance (True Negative, TN).
4. Two establishments were not paired incorrectly due to high distance between them (False
Negative, FN).
Results of matching can be summarized in the form of a confusion matrix, which is often used when
evaluating the performance of a classification model (see Table 17). For more details see,
e.g. Christen et al. (2007).
Table 17. Confusion matrix for data linkage results
Actual
Total Population (all establishments in
the portals and survey frames)
Match (establishment is present in portals and
survey frame)
Non-match (establishment is present
in portals only)
Predicted Match
true matches True Positives (TP)
false matches False Positives (FP)
Non-match false non-matches
False Negatives (FN) true non-matches
True Negatives (TN)
Increasing the threshold (i.e. the distance between a pair of coordinates) generates a higher number
of True Positives and False Positives and, at the same time, a lower number of True Negatives and False
Negatives – it is a trade-off. To find an optimal threshold several indicators can be used. Details can be
found in Annex 1 – Quality indicators of data matching.
Improvement of quality of frame for survey of tourist accommodation establishments
The database of establishments created by data linkage of the statistical frame and scraped data
(hereafter referred to as joint database) is the final output of the methodology for data linkage. This
database contains three subsets:
1. Establishments occurred in the statistical frame and scraped data - fully described by both data
sources.
2. Establishments occurred in the statistical frame only - described by statistical data in
a sufficient way.
3. Establishments occurred in the scraped data only - relevant variables need to be derived.

39
There are several variables possibly not covered by the scraped data or obtained by web scraping with
uncertainty and possible misclassification, e.g.:
Type of accommodation with respect to statistical classification.
Information about the accommodation type is present in the portals but this does not
necessarily match the accommodation type in the statistical frame. A set of possible
accommodation types in the portals usually overlaps only partially accommodation types used
in official statistics. Moreover, accommodation establishment may be, e.g. labelled hotel in the
portals even if it is not a hotel according to statistical definitions.
Number of bed places.
It is usually not possible to derive a total number of bed places directly from the portals by
a simple query. The reason is threefold:
o only some of the establishment’s rooms are offered on the portals,
o some of the rooms offered on the portals are already booked (not displayed when
querying),
o there is a limit on the number of adults in a query.
Single months in which establishment is (not) operating.
Preliminary analysis of scraped data revealed that on average hotels have higher prices, star rating,
guest reviews rating and total number of reviews than other accommodation establishment types.
Hotels also operate during the whole year more often than other establishments. Thus, all of these
variables may be helpful to predict accommodation type for the establishments present only in the
scraped data.
A subset of establishments in the joint database, common for scraped data and statistical data,
contains information about the true accommodation type used in official statistics and months in
which the establishment operates as well as variables obtained from the portals (listed above).
This subset will be called the training set. One of the well-known classification method is a classification
tree. Details of the method are provided in, e.g. Breiman et al. (1984). Thanks to the classification
model, the type of accommodation used in official statistics can be assigned to all establishments that
are only available in web scraped data. A similar procedure can be applied for assigning months in
which the accommodation establishment is operating. The number of bed places can be estimated
with a regression tree. Implementations of classification and regression trees are almost the same.
Several implementations of machine learning (ML) methods in R can be found in Brownlee (2017).
Model selection in any ML method must be implemented carefully. To this end, there are several
approaches that can be used e.g. cross-validation or bootstrapping. Details can be found in,
e.g. Kohavi R. (1995). K-fold cross-validation and bootstrapping are implemented in R packages,
e.g. caret.
Finally, after predictions for the missing information are made, information about all required variables
is available for all of the establishments in the joint database. Since geolocation data, the
nomenclature of territorial units for statistics (NUTS), longitude and latitude coordinates are available
on micro unit level, the data can be aggregated on any spatial level.

40
2.1.2. Spatial-temporal disaggregation of tourism data
In the majority of European Union countries, the survey of the occupancy of tourist accommodation
establishments is a monthly survey. The structure of the form does not allow to answer the following
questions:
How many tourists stayed overnight during the last weekend of the month?
How many tourists stayed at the accommodation establishment on each day of the month?
Estimating the daily number of tourists or overnight stays, taking into account the known monthly
values of these aggregates, is an example of the problem of temporal disaggregation.
Data sources
Two data sources are used for temporal disaggregation: low-frequency data, e.g. monthly data that
are a subject to disaggregation as well as high-frequency data, e.g. daily data containing auxiliary
variables. In the case of disaggregation of data on the occupancy of accommodation establishments,
they include:
Data from internet portals offering accommodation.
The data are collected using the web scraping method with a daily frequency and include
information such as: location of the accommodation establishment (address and/or
geographical coordinates), type of establishment, number of stars, guest rating and
accommodation price. The collected data are used to calculate daily statistics of continuous
variables, such as price, broken down by type of establishment and its location. Missing data
should be imputed. The data obtained by means of web scraping include both information on
the establishments that are included in the survey of tourist accommodation establishments
and those that do not participate in this survey (new establishments not yet covered by the
survey).
Data from the survey of the tourist accommodation establishments.
The survey data include information on accommodation establishments, such as: the number
of tourists accommodated, the number of nights spent and, in the case of some types of
establishments, also the number of rooms rented. Depending on the country in which the
survey is conducted, it may cover all establishments or only a part of them, e.g. establishments
with 10 or more bed places.
Estimation procedure
The first step in temporal disaggregation is regression. Using auxiliary variables, a regression model is
built and preliminary estimates of the variable are prepared. The simplest approach selects one
variable (Dagum E.B., Cholette P.A. (2006)) and estimates the model using the classical method of least
squares, or selects multiple variables and estimates the model using the generalized least squares
method (Chow G.C., Lin A.L. (1971), Fernandez R.B. (1981), Litterman R.B. (1983)).
Typically, daily aggregates do not add up to a monthly value. Hence, the second stage of temporal
disaggregation is benchmarking. The difference between the monthly value and the daily aggregates
must be estimated for each day. The simplest version of additive or multiplicative benchmarking is
described in the works of Denton F.T. (1971), Di Fonzo T. (2003). Other versions of benchmarking
include modelling the random component for daily data. The random component can also be modelled
as a first-order autoregressive process (Chow G.C, Lin A.L. (1971), Fernandez, R.B. (1981)) or a random

41
walk process (Litterman R.B. (1983)). Details can be found in Annex 2 – General approach for data
disaggregation.
It may occur that the results of the temporal disaggregation are unacceptable, e.g. negative. This is
most often the result of poor regression results. In this case, one can take the logarithm of the
dependent variable. Regression results are always positive after high frequency data modelling.
Another possibility is to use the idea of “shrinkage”. This method reduces the mean square error at
the expense of biasing the results. Examples of the use of this method are:
• least absolute shrinkage and selection operator, abbreviated as LASSO (Tibshirani R. (1996)),
• ridge regression (Hoerl A. E ., Kennard R. W. (1970))
In general, both methods can be described as least squares with a condition that normalizes the
parameter vector, but the way they work is slightly different.
The LASSO method adds the variables to the model sequentially depending on the value of the
regularization parameter. The higher its value, the closer the results to those obtained with the
classical method of least squares. For ridge regression, there is also a non-negative regularization
parameter, but all the variables are included in the model at once. If the parameter is zero, ridge
regression becomes least squares. The higher the parameter value, the closer the results are to the
mean value of the forecasted variable.
Both methods generate several sets of forecasts. The researcher selects the result set that is closest to
the least squares result and is, at the same time, acceptable.
Precision measures and tests for temporal disaggregation
In the case of regression, there are many measures of precision such as R-squared, Mean Absolute
Percentage Error (MAPE), Root Mean Squared Error (RMSE), etc. These measures are calculated from
the true and forecasted values. The difficulty in measuring precision for temporal disaggregation is that
there are no actual values for daily data. It cannot be assumed that the precision measures for monthly
data will be analogous to the measures for daily data. This is due to the temporal disaggregation
benchmarking stage distorts the forecasts obtained at the regression stage. To account for this, one
should calculate precision measures for errors for daily data and for errors for monthly data.
The result can be tested in terms of weekly and annual seasonality. The tests include:
• F-Test for binary variables (Maravall A. (2011)),
• ANOVA Welch test (Welch B. L. (1951)),
• Kruskall and Wallis test (Kruskal W. H. and W. A. Wallis (1952)).
If the null hypothesis is rejected, the seasonality is significant.
2.2. Flash estimates
According to the Regulation (EU) No 692/2011 of the European Parliament and of the Council of
6 July 2011 concerning European statistics on tourism as well as the Commission Delegated Regulation
(EU) 2019/1681 of 1 August 2019 amending Regulation (EU) No 692/2011 of the European Parliament
and of the Council concerning European statistics on tourism, European Union countries should submit
to Eurostat data on accommodation statistics in the following scope:

42
1. For “hotels and similar accommodation” and for “holidays and other short-stay
accommodation”, the scope of observation should at least include all tourist accommodation
establishments having 10 or more bed places.
2. For “camping grounds, recreational vehicle parks and trailer parks”, the scope of observation
should at least include all tourist accommodation establishments having 10 or more places.
3. Member States accounting for less than 1% of the total annual number of nights spent at
tourist accommodation establishments in the European Union may further reduce the scope
of observation, to at least include all tourist accommodation establishments having 20 or more
bed places (20 or more places).
The scope of information about tourist accommodation establishments provided to Eurostat can
therefore be and in fact is different between countries. In many countries establishments having less
than ten bed places are not covered by the surveys, additionally different thresholds are used in
specific countries to collect information on establishments. The frequency of data collection is not very
diverse and usually data are collected on a monthly basis (in the case of project partners, all countries
collect information on a monthly basis), while differences often occur in the observed population of
establishments as well as methods of data collection.
This is an important issue when developing flash monthly estimates concerning capacity of tourist
accommodation establishments as specific countries has a different scope of information for use based
on surveys. Table 18 shows the scope and frequency of survey on tourist accommodation
establishments in partner countries
Table 18. Data collection on accommodation establishments in partner countries
Country Surveys on accommodation establishments
Monthly Yearly
BG Establishments with 10 or more bed places
DE Establishments with 10 or more bed places
EL Without threshold
IT Without threshold
Only rural
accommodation
establishments
NL
Sample of establishments is monthly drawn from yearly survey, which is based on opening periods and bounded to capacity restriction: 55.1 – Hotels, hostels and B&Bs with more than 5 bed places
55.2 – Rental houses/apartments/youth hostels with more than 10
bed places
55.3 – Camping sites with more than 4 pitches
Without threshold
PL Establishments with 10 or more bed places Establishments with 9 or
less bed places
PT
Hotel establishments (hotels, apartment hotels, tourist apartments,
tourist villages, pousadas and quintas da Madeira) – without
threshold
Local accommodation with 10 or more beds
Rural/lodging tourism – without threshold

43
Table 19. Data collection on accommodation establishments in partner countries (cont.)
Country Surveys on accommodation establishments
Monthly Yearly
SK
Establishments without threshold regarding the number of bed
places
Statistical units (legal persons and natural persons/entrepreneurs
with the Company Registration Number) – Accommodation
establishments
Description of data sources
Two data sources were used to estimate the variables of interest in terms of the occupancy of tourist
accommodation establishments:
• data from web scraping of tourist accommodation portals;
• data from the survey on the use of the accommodation base.
Data from the web scraping of accommodation booking portals contain information about the
accommodation establishment, i.e. its location and data on the offer of this entity, the most important
of which are the price and type of the accommodation establishment. Then, data from web scraping
is used to calculate monthly aggregates, thanks to which information about the distribution of prices
in the main types of accommodation establishments as well as the number of offers in these
establishments are gathered.
Data from a statistical survey - data from a monthly survey on the occupancy of tourist accommodation
establishments, which covers entities of the national economy conducting activities classified
according to NACE to the groups: 55.1, 55.2 and 55.3. The aggregated data from this survey includes
information on the number of establishments and their types in a given region (voivodship), the
number of guests, the number of nights spent and the number of rented rooms.
Methodology
Data aggregated into monthly series from both sources described above are combined. It should be
noted that data from web scraping can be obtained almost on an ongoing basis, while the data from
the survey are available with a delay of several months. Missing values from the survey of
accommodation establishments will be forecasted on the basis of available data from web scraping.
After combining the data, a set of explanatory variables is determined for each explained variable.
The developed algorithm determines these variables in two stages.
In the first stage, a correlation matrix is used, thanks to which only the variables best correlated with
the explanatory variable are selected as potential candidates for the model.
The second stage uses the method of Hellwig’s information capacity indicators (Hellwig 1968,
Hellwig 1972), the idea of which is to select such explanatory variables that are strongly correlated
with the explanatory variable, and at the same time poorly correlated with each other. In order to use
this method, the vector of the correlation of the dependent variable with the explanatory variables
and the correlation matrix of the explanatory variables should be calculated. The method considers all

44
combinations of potential explanatory variables. For each combination of potential explanatory
variables, information capacity indicators are calculated: individual and integral. Individual and integral
indices of information capacity are normalized in the interval [0.1] and the value they take is the higher
the more the explanatory variables are correlated with the dependent variable and the weaker they
are correlated with each other.
The combination of the variables corresponding to the maximum value of the integral information
capacity of the indicators is selected as the set of explanatory variables.
Then a regression model is built based on the selected variables to estimate the missing values. On the
basis of the preliminary results, it can be concluded that even the linear regression model estimated
by the least squares method has good prognostic properties. With sufficiently long time series it is
possible to make forecasts based on the ARIMAX model (Autoregressive Integrated Moving Average
with Explanatory Variable).
2.3. Methodology to improve the quality of data in various statistical areas
In almost every EU’s country National Statistical Institutes conduct a household sample survey on
participation of residents in trips. Due to the level of detail of a questionnaire or small subsample size
for some destination countries, the research have large variability in expenditure as well as the
problem of non-response related to expenditure by expenditure category with respect to some
destination countries. If a country domain is not well represented then there may be no representative
in a sample for some strata and the results, e.g. expenditures for business trips cannot be estimated.
Countries that are visited by a different route than air are usually very numerous in the sample survey.
Most travel destinations that are rare in the sample survey are visited by air. Therefore, the emphasis
was put on this mode of transport.
The methodology for estimating the number of trips in air traffic was developed in the Big Data I
project. Within the framework of Big Data II project this methodology has been enhanced and linked
to the methodology of expenditure estimation.
In the presented approach there are several data sources to combine to estimate trips and
expenditures:
destination airports available from the national airports,
a list of airports all over the world covering airport name, city, country, International Air
Transport Association (IATA), International Civil Aviation Organization (ICAO) and Federal
Aviation Administration (FAA) codes,
data on flight routes consisting of origin, hub and destination airports, IATA and ICAO codes,
type of aircraft, date of arrival and departure,
data on technical information on aircrafts about the type of aircraft, airline, ID, total number
of seats and seats in each class,
administrative data from Civil Aviation Offices (CAO) on the number of passengers from
national airports in domestic and foreign traffic. Foreign traffic data covered only direct flights
from national airports which gives much less countries than from the sample survey,
crucial statistics of trips from the sample survey (share of residents in total international air
traffic),

45
prices and costs of flight tickets, accommodation, local transportation, restaurants and cafes,
etc., obtained by web scraping of relevant portals,
data on expenditure from the sample survey.
The next figure shows which data sources can be combined.

46
Figure 14. Flowchart of trips and expenditure estimation

47
2.3.1. Estimations of the size of tourist traffic
In this section, a method for estimating a size of tourist traffic is presented. This approach is based on
simple linkage of several data sources using unique identifiers and calculations of conditionals
distribution. Data on flights usually covers name and location of an airport, IATA and ICAO codes, type
of aircraft, date of arrival and departure etc. Country name, type of aircraft, IATA and ICAO codes are
the keys to join several data sources into one database.
Distribution of trips with respect to air traffic can be estimated with following procedure:
Collect all origin and destination airports with a use of an online flight connection search
engine.
Use flights schedules to derive a distribution of flights for each origin airport.
Attach a country where the airports are located with airport code lists (IATA, ICAO, FAA).
Attach a capacity of aircraft (seats) with data on technical information on aircrafts.
Calculate a distribution of flights (measured with seats) for each airport available from national
airports. The destination airports identified in this step will be called the hub airports.
Calculate a distribution of flights for each hub airport. Repeat this step until all destination
airports are reached.
Remove all routes that are irrelevant with respect to time or cost efficiency. For instance, the
route Stokholm – Lisboa – Rio de Janeiro seems to be fine but Lisboa – Kiev – Rio de Janeiro
rather not. Time and cost efficiency does not provide an unambiguous rule. Nevertheless, the
more obviously irrelevant routes are removed, the better the results.
Use a data from civil aviation office to benchmark distribution of flights from a given origin
airports to the known total.
For each hub airport calculate the number of passengers that travel further using a relevant
statistic from the sample survey (share of tourist using airports from a given country as a hub).
Sum up passengers from all routes: travelling directly from origin country, travelling with a use
of one hub airport, etc.
The analysis of the size of tourist traffic showed that the distribution of trips in air traffic based only
on big data is different compared to the distribution of trips in the sample survey, as it represents the
preferences both of the inhabitants of a given country and of other Europeans who use airports in this
country, as transfer airports. This means that the trip estimator is biased. On the other hand, estimates
of trips based on big data show less variability over time and greater completeness than the results
from the sample survey. Therefore, it seems that adopting results based only on big data is not
a satisfactory choice. The question arises of how to combine two sets of trip data where one is
unloaded but its precision is not acceptable at very low aggregation levels and the other is biased but
has far greater stability of the results at low aggregation levels.
In general, the problem of combining weighted and unbiased estimators has been studied by many
researchers. One of the proposed solutions is the James-Stein estimator (Green E. J.,
Strawderman W. E. (1991), Fourdrinier D., Wells M. T. (2012)). The James-Stein estimator can be used
to obtain the final distribution of trips. Details of its use can be found in Annex 3 – Combining biased
and unbiased data.

48
2.3.2. Estimation of expenses related to trips
In the presented approach, there are two groups of data sources used to build the expenditure
database: the sample survey of trips and data from various portals obtained through web scraping.
The basic data sources that can be linked to air trip expenditure include websites offering the booking
and sale of accommodation, airline tickets, and websites with catering establishments. Through web
scraping, one can collect data on, among other things:
• prices of accommodation by type of accommodation establishment,
• ticket prices by airline and route,
• average prices of meals in catering establishments (on websites, in the restaurant description,
price ranges for standard dishes are often given and not prices for specific meals).
These data can be divided into two groups: data that should be collected frequently due to rapid
changes, e.g. flight tickets prices, accommodation prices, and data that can be collected with low
frequency, e.g. food and beverages, local transportation costs.
The data from the sample survey on trips should cover several consecutive years to include a wide
range of trips with respect to their descriptions (e.g. destination country, purpose of trip, type of
accommodation, means of transportation) and their expenditure.
The use of big data to estimate trips with the James-Stein estimator increases the number of countries
with estimated trips in relation to the results of the sample survey itself. Since some distant destination
countries may not be well-represented in the expenditure database, auxiliary information is needed
to improve the estimation of expenditure e.g. scraped data. These data cannot be linked to the data
from the sample survey directly. For instance, there is a trip to Brazil, means of transport: plane,
accommodation establishment type: hotel. In the scraped data there are many offers of hotels in Brazil
in a given period of time as well as many offers of flight tickets. Thus, the scraped data need to be
aggregated: only some statistics should be derived from the data.
The data analysis showed that the distribution of accommodation prices has strong right asymmetry
and outliers. After comparing various statistics of accommodation prices from portals with the average
expenses per night provided by the survey on trips, it turned out that the median price describes better
the variability of accommodation expenditure in the survey.
First, the case of estimating expenditure for countries that did not appear in the sample survey in
a given period, but appeared in historical data will be presented.
In the first step, a database must be prepared. It is a subset of a database from the survey on trips of
past data containing data for trips including descriptive variables such as destination country, purpose
of trip, type of accommodation as well as the expenditure by category. There must be no missing values
in the expenditure variables.
After aggregating the data from big data sources to the form of statistics, they can be added to the
database of individual trip survey data according to the keys, e.g. country, type of accommodation
establishment and quarter. By using the combined big data and the categorical variables describing
trips, it is possible to estimate travel expenses and average expenditure for accommodation. If the
number of trips is already given, then only the average expenditure needs to be estimated. The total

49
expenditures will be obtained by multiplying the number of trips and the average expenditure
(by expenditure category).
When the database is ready, there is the need to choose a method for prediction. Among others, the
following methods may be used:
Regression Trees (Breiman, et al. (1984)),
Support Vector Machine (Cristianini, et al. (2000)),
Random Forest (Ho, (1998)),
Optimal Weighted Nearest Neighbour Classifiers (Samworth (2012)),
Predictive Mean Matching (Rubin, (1986)),
Bayesian Linear Regression (Box, et al. (1973)),
Random Indicator for Nonignorable Data (Jolani, (2012)).
These methods are available in rpart, kknn, e1071, randomForest, mice, and caret packages in R.
Comparison and selection of the prediction model may be based on methods of cross-validation or
bootstrapping with a use of e.g. Root of Mean Squared Error (RMSE) or Mean Absolute Percentage
Error (MAPE). The best results in terms of RMSE were achieved by Optimal Weighted Nearest
Neighbour Classifier and Regression Tree. The best results in terms of RMSE were achieved by Support
Vector Machine. Moreover, results were always admissible for these three methods while in the case
of some other methods the results sometimes were e.g. negative.
It is possible to predict the expenditures for a new dataset with the use of the selected model.
To create the new dataset for a given country:
Pick trips to this country from the past data from the same quarter (or all past data if it is not
available).
Find in the whole dataset k the most similar trips to the selected one in the previous step with
a use of kknn package. Similarity is based on trip characteristics, expenditures, and big data.
Now, average expenditures can be estimated with a use of the selected model for all records in the
dataset for a given country. Furthermore, total expenditures can be estimated as well in some
breakdowns as this country is represented by several trip records.
The meta model can be used to estimate expenses for a country that has never appeared in the sample
survey but nevertheless exists in big data sources. For this purpose, the same database can be used,
but the model is estimated without categorical variables describing the trip. Then, the average
expenditure per tourist is estimated only on big data. By using the kknn package, it is possible to find
countries that are most similar to a given country. Then, the previously described procedure can be
used to obtain data in different sections.
2.3.3. Tourism Satellite Accounts
Tourism is a specific type of economic activity that is defined not in terms of production, like other
economic activities, but in terms of consumption. In the case of tourism, the factor determining the
scope of the phenomenon is the way products are used, not the way they are produced. Therefore, it
is not distinguished neither in terms of institutional sectors nor in terms of types of activity or products
and services, which makes it impossible to analyse it within the standard system of national accounts.
For this reason, the methodology of national accounts provides the possibility of introducing tools

50
enabling the analysis of phenomena such as tourism, in functional terms. These tools are known as
satellite accounts because they are, in some measure, satellites of the main accounts. These accounts
provide a comprehensive view and the possibility of economic analysis of the tourism sector by
balancing tourism-related supply and demand and estimating the direct impact of tourism on the main
macro-aggregates of a country’s economy.
The methodological framework of the Tourism Satellite Account: Recommended Methodological
Framework 2008 (TSA: RMF 2008) was developed by the World Tourism Organization (UNWTO), the
United Nations Statistics Division (UNSD), the Organization for Economic Cooperation and
Development (OECD) and the Statistical Office of the European Union (Eurostat). This account is
harmonized with national accounts, using the same concepts, definitions and classifications as national
accounts, and is used to measure tourism activity and the importance of tourism to the economy of
a country or region.
The complete Tourism Satellite Account provides6:
Macroeconomic aggregates that describe the size and the direct economic contribution of
tourism, such as tourism direct gross value added (TDGVA) and tourism direct gross domestic
product (TDGDP), consistent with similar aggregates for the total economy and for other
productive economic activities and functional areas of interest;
Detailed data on tourism consumption, a more extended concept associated with the activity
of visitors as consumers, and a description of how this demand is met by domestic supply and
imports, integrated within tables derived from supply and use tables which can be compiled
both at current and constant prices;
Detailed production accounts of the tourism industries, including data on employment,
linkages with other productive economic activities and gross fixed capital formation;
Link between economic data and non-monetary information on tourism, such as number of
trips (or visits), duration of stay, purpose of trip, modes of transport, etc., which is required to
specify the characteristics of the economic variables.
The full TSA consists of a set of 10 tables. Tables 1-3 contain data on the expenditure of visitors
(residents and non-residents), Table 4 contains information on tourism consumption from Tables 1-2
and its components that are difficult to assign to a specific type of tourism, which together make up
the internal tourism consumption. Table 5, in turn, concerns the supply side - it is an account of the
production of tourism goods and services. Table 6 is the basic element of the TSA. It compares tourism
supply with domestic tourism consumption. This table is the basis for calculating the direct
contribution of tourism to the economy, i.e. the gross tourism value of TDGVA and the contribution of
tourism to GDP. Table 7 provides information on employment in tourism activities, and Table 8
presents tourism-related fixed capital formation and collective consumption - these tables are optional
and are not an essential part of the TSA. Table 10 contains selected non-financial measures to facilitate
the interpretation of TSA results.
The result of the TSA compilation is both the possibility of a comprehensive analysis of the impact of
tourism on individual industries, and the possibility of a synthetic assessment of its contribution to the
economy.
6 Tourism Satellite Accounts in Europe 2019 edition report

51
The current tourism satellite account methodology is used in many countries from all continents.
Since 2010, Eurostat has encouraged EU Member States to submit available national TSA data every
three year, on voluntary basis. The latest data was submitted to Eurostat in 2019 and according to the
Tourism Satellite Accounts in Europe 2019 edition report, it was submitted by 27 European countries
(25 Member States and 2 EFTA countries), and an increasing number of countries preparing TSA proves
their great importance in shaping tourism policy. All partner countries participating in the project are
developing TSAs.
According to the above mentioned report, national methodologies for developing TSA are not
harmonized enough to produce data fully comparable across countries. Comparability and
interpretation of results are influenced by methodological differences between national TSAs and TSA:
RMF 2008, different degrees of completeness of tables, different levels of statistical “maturity” (some
preliminary data, others from pilot projects) and different reference years are reported. However, the
results provide useful information on the state of implementation of TSA and estimates at the EU and
national level on the economic dimension of tourism.
An important element of the TSA methodology and the starting point is the determination of the value
of demand related to tourist consumption. As far as the demand side is concerned, it was assumed
that it consists of the consumption expenditure of tourist traffic participants, i.e. expenditure on goods
and services purchased by or on behalf of visitors in connection with a specific tourist trip. The TSA
does not measure all the economic effects of tourism, but only the effects of the tourism expenditure
incurred during the reporting period, usually during the year. The investment expenditure related to
the development of tourism supply is not analysed in the core part of the TSA and is not included in
the calculation of tourism’s contribution to value added and GDP in the economy.
The basic sources of supply, on the other hand, are mainly tables closely related to national accounts,
i.e. supply and use tables, input-output tables.
Among the sources of data on tourism demand, the most common listed in the report Tourism Satellite
Accounts in Europe 2019 edition are surveys conducted for the purposes of Regulation 692/2011 on
European statistics in the field of accommodation statistics conducted among enterprises and surveys
on tourist demand conducted among households. However, countries use many different sources
available as surveys results, but they do not fully meet TSA's information needs.
One of the objectives of the WPJ was an inventory of previously used and potential sources of data on
tourism, as well as the use of innovative data collection methods and combining data from various
sources in order to improve the completeness and quality of data collected so far.
Currently, obtaining data on tourists and their expenditure is very difficult on the one hand due to,
among other things, mass tourism, open borders, as well as the fact that tourists are a specific group
(fleeting population) - the people to be surveyed are tourists only when they travel. Obtaining reliable
information through surveys is therefore often a complicated and costly undertaking.
On the other hand, the availability of new data sources such as big data, the use of administrative
registers and the use of innovative data collections methods (web scraping) provide potentially great
opportunities to improve the estimates of expenditure incurred by tourists during the trip or to
improve the quality of data on the accommodation establishments and their occupancy by tourists.

52
The scope of work carried out as part of the WP, of course, did not allow for the development of
a tourism satellite account, taking into account estimates based on newly acquired data, as the work
concerned the improvement of completeness and quality of data relating mainly to the TSA tables
concerning tourism expenditure. Moreover, the data necessary to develop TSA data is much more
detailed than the pilot data collected during the project implementation. In addition, the proposed
methods of collecting and estimating data relate to the years 2019-2020, and those developed by TSA
partner countries most often concern earlier years - the development of TSA is a time-consuming
process and due to the availability of necessary data from national accounts, it is usually delayed
compared to the reference years in tourism statistics.
Table 20. Reference year for the last TSA data
Year Country
2018 NL, PT – estimation
2017 IT , SK , BG
2015 DE , EL
2013 PL source: TSA 2019 edition and web sites information
Nevertheless, based on the results of the work carried out by the WPJ, an attempt was made to assess
the degree of improvement in the data on tourist expenditure incurred by tourists in the reference
country included in Tables 1, 2, 4 and 6 of the TSA.
Attempts to estimate the impact of the newly acquired data on the values in the TSA tables concerning
tourists’ expenditure were made on the example of TSA for Poland. The main reason was that the
testing of the newly proposed method of improving the estimation of the number of trips and the
amount of outbound expenditure of residents was carried out on the results of the survey of the trips
of residents carried out in Poland. This survey is conducted not only for the needs of tourism statistics,
but also for the needs of balance of payments statistics, and its methodology allows for the
identification of detailed items of expenditure (incurred by tourists in the country and abroad).
Therefore, the newly estimated values were also compared to the results of the last version of TSA for
Poland. As indicated above, the last TSA for Poland in full version unfortunately refers to 2013.
Consequently, the estimates of the increase in the value of expenditure obtained thanks to the use of
new methods of obtaining and combining data should be considered only illustrative and intended to
show the scale of the increase in the value of total expenditure (consumption). When estimating the
increase in the value of expenditure, data on tourist accommodation establishments obtained as
a result of scraping portals offering accommodation were used, as well as the results of estimating the
number of outbound trips of Poles to non-European countries (which are insufficiently surveyed) and
the expenditure incurred in Poland during these outbound trips.
To estimate the increase in expenditure of foreigners in Poland and domestic expenditure of Poles,
data on the number of tourist accommodation establishments obtained as a result of web scraping,
taking into account the size of newly identified establishments, were used. Additionally, for tourism
expenditure of Poles, the results of estimating the number of foreign trips with overnight stays of Poles
and related expenditure were also used. Thus, the estimates concerned only tourists using
accommodation.
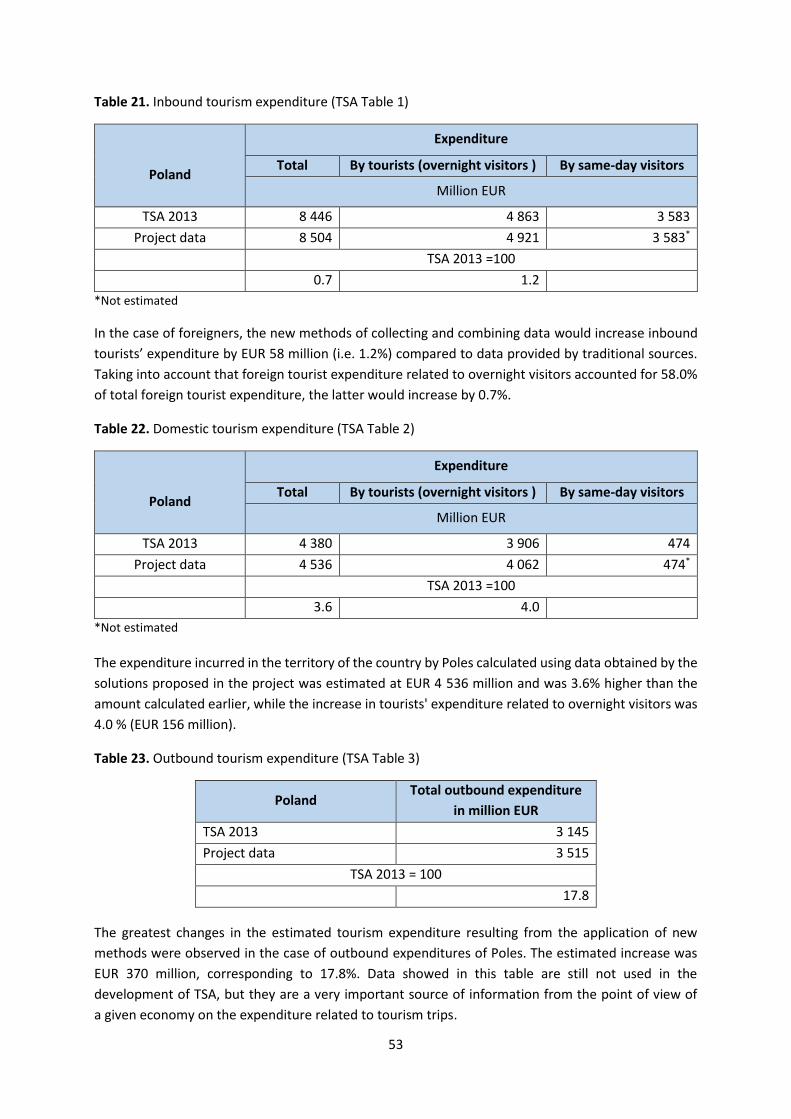
53
Table 21. Inbound tourism expenditure (TSA Table 1)
Poland
Expenditure
Total By tourists (overnight visitors ) By same-day visitors
Million EUR
TSA 2013 8 446 4 863 3 583
Project data 8 504 4 921 3 583*
TSA 2013 =100
0.7 1.2
*Not estimated
In the case of foreigners, the new methods of collecting and combining data would increase inbound
tourists’ expenditure by EUR 58 million (i.e. 1.2%) compared to data provided by traditional sources.
Taking into account that foreign tourist expenditure related to overnight visitors accounted for 58.0%
of total foreign tourist expenditure, the latter would increase by 0.7%.
Table 22. Domestic tourism expenditure (TSA Table 2)
Poland
Expenditure
Total By tourists (overnight visitors ) By same-day visitors
Million EUR
TSA 2013 4 380 3 906 474
Project data 4 536 4 062 474*
TSA 2013 =100
3.6 4.0
*Not estimated
The expenditure incurred in the territory of the country by Poles calculated using data obtained by the
solutions proposed in the project was estimated at EUR 4 536 million and was 3.6% higher than the
amount calculated earlier, while the increase in tourists' expenditure related to overnight visitors was
4.0 % (EUR 156 million).
Table 23. Outbound tourism expenditure (TSA Table 3)
Poland Total outbound expenditure
in million EUR
TSA 2013 3 145
Project data 3 515
TSA 2013 = 100
17.8
The greatest changes in the estimated tourism expenditure resulting from the application of new
methods were observed in the case of outbound expenditures of Poles. The estimated increase was
EUR 370 million, corresponding to 17.8%. Data showed in this table are still not used in the
development of TSA, but they are a very important source of information from the point of view of
a given economy on the expenditure related to tourism trips.

54
Table 24. Internal tourism consumption (TSA Table 4)
Poland
Internal
tourism
consumption
Internal
tourism
expenditure
Inbound
tourism
expenditure
Domestic
tourism
expenditure
Other
components
of tourism
consumption
TSA 2013 14 505 12 826 8 446 4 380 1 679
Project data 14 719 13 040 8 504 4 536 1 679*
TSA 2013 =100
1.5 1.7 0.7 3.6
*Not estimated
In 2013, the total tourist consumption in the economic territory of Poland was estimated at
EUR 14 505 million. Almost 90% of consumption was made by tourists, and the major part (66%) was
expenditure of tourists and same-day visitors coming from abroad. Using new sources and methods of
collecting data and maintaining the appropriate structures from 2013, tourism consumption was
estimated at EUR 14 719 million, which would be 1.5% higher.
Table 25. Total domestic supply and tourism ratio (part TSA table 6)
Poland
Tourism gross value
added (at basic prices)
(Million EUR)
Domestic supply (at
purchasers' prices)
(Million EUR)
Internal tourism
consumption
(Million EUR)
Tourism
ratio1
(%)
TSA 2013 3 514 954 517 14 505 1.52
Project data 3 584 14 719 1.54
TSA 2013 =100
2.0 1.5 0.02 1 Tourism ratio = Internal tourism consumption (at purchasers' prices) as proportion of domestic supply
It can be seen that the increase in tourist consumption in Poland estimated on the basis of the new
values of tourist expenditure was not substantial enough to cause a significant change in the tourist
coefficient. However, tourism gross value added increased by EUR 70 million.
It should be noted, however, that the calculations are experimental and that additional sources and
new methods of obtaining and estimating data could only be used to a limited extent. Undoubtedly,
they allowed to obtain higher values of estimated tourism expenditure, while in the case of estimating
the impact of tourism on the main macro-aggregates regarding the Polish economy, they did not cause
significant changes. Anyway, Poland is a country where the tourism factor published in the above-
mentioned report (Tourism Satellite Accounts in Europe 2019 edition) was the lowest among the
project partners, so surely the increase in the value of expenditure estimated with the use of the
project achievements and the change in the tourist index will be greater.
The results obtained from these experimental calculations come as no surprise. The time constraints
of the project have now allowed for the preparation of new estimates only for the totals relevant for
the determination of tourism demand in TSA and no significant changes in the total value of tourist
expenditure are expected, even with the continuation and improvement of the proposed methods.
The data collected with the use of the methods and tools used so far are reliable, and the aim is, above

55
all, to improve their quality and completeness, as well as to identify and measure new, hitherto
unknown phenomena in tourism. One should also not forget about measures to reduce the response
burden.
In the case of this project, however, the project partners emphasize that its development it is
important not only to improve the basic data on tourism statistics as input to the TSA tables, but in
many cases even more important than the total value is the expected improvement in the quality of
estimation of some items related to specific expenditure, difficult to estimate on the basis of data
provided by sample surveys. As an example, Italy gives the underestimation on home rental
expenditure for domestic tourism, but the problem of second homes is increasingly also affecting
inbound tourism. This issue relates not only to the occasional provision of such services in the circle of
family or friends, but also, in an increasingly serious dimension, to services provided under the so-
called collaborative economy. In the near future, it will be possible to receive, via Eurostat, data on
short-term accommodation from four large international platforms, which should significantly improve
the estimates of this phenomenon. Nevertheless, the method proposed in the project for web scraping
on other sites devoted to renting such houses will allow, among other things, to minimize gaps
between tourism statistics and national accounts data currently resulting from the use of sample
survey data. The scope of current web scraping of websites related to tourism covers more and more
issues and will also allow to determine the sizes of other phenomena difficult to estimate but very
relevant in the development of TSA, such as the phenomenon of renting passenger cars without
a driver by tourist or the sales volume of conference services. Above all, however, it will enable a more
accurate estimation of the value of services purchased by tourists in the form of packages
(accommodation, catering, transport, recreational, etc.), which, in accordance with the TSA
methodology, must be disaggregated by the relevant items of tourist expenditure.

56
3. Implementation of Tourism Integration and Monitoring System
prototype
Deliverable J4 - Technical Report presents the concept of the Tourism Integration and Monitoring
System (TIMS) prototype along with dedicated micro-services, which would support statistical
production in the area of tourism statistics and assist in monitoring changes in the tourism sector.
This document describes all the important components that such a system should contain.
Additionally, this chapter presents an example of the implementation of the main components of the
prototype system developed as part of the WPJ work.
Login screen
It is the first element of user interaction with any system, therefore, it should be designed in a way
that ensures easy and quick access to the application. It often happens that it is overloaded with
options and checkboxes, so when designing the login screen to the system, a few good practices should
be implemented:
distraction-free interface
– the interface should not contain any graphic elements or animations. The best practice is to
use a uniform background and simplify the amount of information required for user input.
easy to fill out form
– the number of fields in the login screen should be limited to the necessary two. In the first
field, it is necessary to enter the login - e-mail address or username, and in the second, to
design the password field so that it is easy to complete. In particular, there should be a built-
in option to show the password while typing it. The option “Forgot your password?”, enabling
the user to recover a lost or forgotten password, should also be added.
clear errors description
– all information about errors that occurred during logging should be clearly presented to
inform the user about the situation. Therefore, phrases like “Login Error” should be avoided
and instead information about the type of error, such as “Invalid e-mail entered” should be
provided.
When programming a system that will be used in various European Union countries, it is worth
remembering to add the option that allows the user to select the language.
An exemplary TIMS login screen is presented in Figure 15.

57
Figure 15. TIMS login screen
Action centre
An important design element that provides space for the application identity or facilitates access to
actions performed on the system. It allows the user to access alerts and the message centre, which in
a simple and transparent manner inform about the most important operations and events in the
application (see Figure 16).
Figure 16. Action centre

58
Navigation panel
This element integrates the entire application framework. As a result, fragmented content becomes
full and structured. All the most important functionalities are located in one place, to which the user
has constant access. A well-designed navigation panel allows the user to visualize and clearly present
the possibilities of working in the system. To do this, the core of the application needs to be
emphasized and secondary functions appropriately controlled and hidden. The proposed approach is
presented in Figure 17.
Figure 17. Navigation panel

59
Dashboard view
It is the main view (see Figure 18) which quickly presents dynamic reports generated on the basis of
data stored in the system. Each user should be able to adjust the presented information to their own
needs and analyses. From the dashboard the user can navigate to details to get more information
about the selected data item.
Figure 18. Dashboard view
Sample views for key system functionalities is presented below.
Web scraping
The first one, the web scraping view (see Figure 19), contains information on scripts for downloading
data from web portals. It allows the user to check the details of the selected script (see Figure 20) and
download its code in the form of text or a file (see Figure 21).
Figure 19. Web scraping view

60
Details for individual scripts contain basic information regarding the portal name, frequency of data
retrieval, and the date of the last run of the process.
Figure 20. Web scraping details
The code of scripts prepared in any programming language can be presented in text form directly in
the system window (see Figure 21). In addition, it is also possible to download the source code as a file
and save it to a local disk for customization.
Figure 21. Script code view
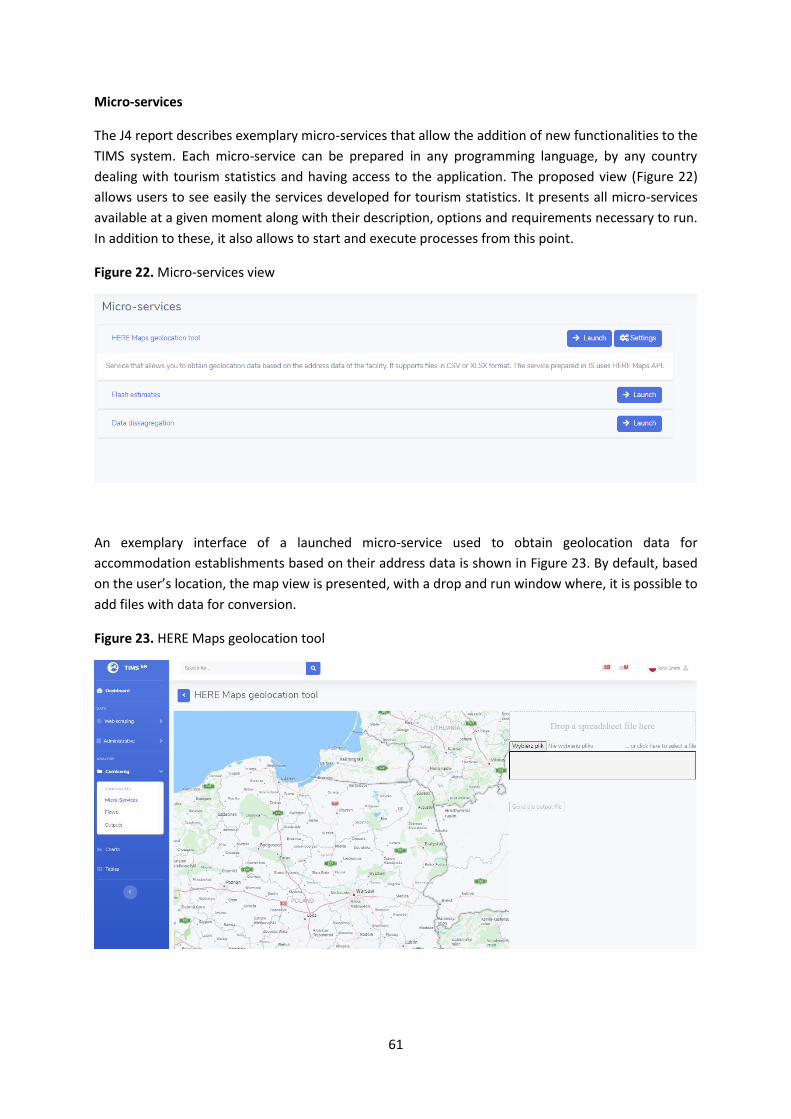
61
Micro-services
The J4 report describes exemplary micro-services that allow the addition of new functionalities to the
TIMS system. Each micro-service can be prepared in any programming language, by any country
dealing with tourism statistics and having access to the application. The proposed view (Figure 22)
allows users to see easily the services developed for tourism statistics. It presents all micro-services
available at a given moment along with their description, options and requirements necessary to run.
In addition to these, it also allows to start and execute processes from this point.
Figure 22. Micro-services view
An exemplary interface of a launched micro-service used to obtain geolocation data for
accommodation establishments based on their address data is shown in Figure 23. By default, based
on the user’s location, the map view is presented, with a drop and run window where, it is possible to
add files with data for conversion.
Figure 23. HERE Maps geolocation tool

62
The exemplary implementation of the TIMS prototype presented in this chapter and described in detail
in deliverable J4, may serve as the basis for the preparation of a system that will be a key element in
creating tourism statistics in all European Union countries.

63
4. Case studies
Following case studies present the results of individual tasks performed in each partner country. This
chapter consists of 8 subchapters dedicated to the results achieved in the following tasks:
1. Web scraping.
2. Source characteristics.
3. Legal aspects.
4. Combining data.
5. Spatial-temporal disaggregation of data.
6. Flash estimates of the occupancy of accommodation establishments.
7. Methodology to improve the quality of data in various statistical areas.
8. Experimental tourism statistics.
4.1. Web scraping
Use Case Identification
Use Case ID WPJ.1.BG
Use Case Name Web scraping
Date of creation 01.01.2019
Use Case Definition
Description: Applying web scraping method to extract data from Hotels.com for
statistical purposes and testing the Polish software in the Bulgarian
circumstances.
Preconditions: IT expert with knowledge to configure and implement the Polish
software and IT operator for daily execution of the software. The Google
Chrome browser is needed. The subject-matter statistician is needed for
analysing of scraped data with R script provided by the Polish team.
Flow:
1. Implementing the Polish software:
Installation
Configuration
Testing
2. Daily execution of Polish software for the next day, next weekend and the last Thursday of
month available accommodation in Bulgaria on the Hotels.com portal.
3. Web scraped data storage on the big data sever in the BNSI IT infrastructure.
4. Analysing the scraped data with R script designed by Statistics Poland.

64
Issues/Exceptions:
There is no Bulgarian version of Hotels.com, therefore the German version was used. The software is
executed manually so data for weekends and holidays are unavailable. Changes on the website of
Hotels.com and time to adjust the software.
Output summary:
CSV files with scraped accommodation data, which are subsequently analysed with the Polish R script.
Estimates on scraped data for Hotels.com:
Prices with density.
Mean and median prices by accommodation type.
Time series with mean and median prices.
Monthly descriptive statistics at national level by accommodation type.
Offers by accommodation types.

65
Use Case Identification
Use Case ID WPJ.1.DE-Hesse
Use Case Name Web scraping
Date of creation 30.09.2020
Use Case Definition
Description: Examining the possibility of using web scraping techniques to extract
data from internet sites for booking and reviewing touristic
accommodations (e.g. Hotels.com or Booking.com). Hesse used the tools
provided by WPJ (Statistics Poland), but also maintains own tools for the
same or different portals. In total during project term, Hesse scraped
around 10 different portals, of which 5 of them on a monthly basis.
Preconditions: Legal situation of web scraping in general and for official statistics must
be checked (see use cases WPJ.3.DE-Hesse on legal aspects). Depending
on implementation status into production systems, some more or less
reliable and powerful IT infrastructure must be available. For a pilot
study, a rather normally equipped system was sufficient. For production,
more reliable systems are needed.
However, some technical preconditions have to be met:
First, an unrestricted access to the internet is needed (at least,
unrestricted access to specific sites. This has to be checked
carefully: often many different servers and domains have to be
contacted for a website to work properly or as expected).
Second, internal IT security condition have to be checked and
met (e.g. unrestricted access to internet, installation and use of
non-standard programs or applications (a specific internet
browser, running of non-signed java applications, executing
JavaScript code, running non-standard analysis software, e.g. R
or KNIME. This also includes carefully checking and planning of
automatic update procedures for installed software or the
operating system. These procedures may interfere with planned
scraping processes or tools may not work as expected after
updating the executing software).
For running web scraping tools, staff with at least basic knowledge of
HTTP, HTML, CSS, XPATH, data structures (XML, JSON) is needed. For
maintaining tools in different languages (Java, JavaScript, R, KNIME,
Python, …), staff with sound knowledge is needed.
Flow:
1. Identify eligible sites (in terms of size/coverage of the target population or a specific subgroup
of the target population, e.g. camping grounds, holiday homes, group accommodations, local
coverage …).
2. Identify relevant information from site: what kind of information is presented; for different
purposes or aims, different information is needed: functional information (e.g. business size

66
(number of rooms or beds offered), prize for staying one night, …) or rather meta data about
a business that is needed for linking micro data with other data sources (name, address,
geolocation) or aggregation.
3. Check terms and conditions, check robots.txt, check sitemap.xml of 1) (see use cases WPJ.3
for legal aspects: WPJ.3.DE-Hesse, WPJ.3.NL on legal aspects).
4. Inspect site and technical accessibility, decide on technology for scraping (i.e. if there is access
to an API; static pages or dynamically generated pages require different approaches).
5. Write script or program to request page, extract information from retrieved page (different
approaches and languages). Hesse used the tools provided by WPJ (Java, JavaScript) as well as
own scripts written for the software R or workflows built in/for the KNIME software.
6. Provide output for further processing or analyses (micro data or aggregated data, e.g. CSV file).
7. (Further processing may include: enriching scraped data by geolocations (pairs of coordinates)
given address (street name, house number, postcode, city name) or, vice versa, “reverse
geocode” geolocation provided on internet sites (resulting in street name, house number,
postcode and city name). WPJ provided a tool for the geocoding task. Alternative tools to
geocode as well as revers geocode have been developed and used by HSL (making use of
openstreetmap.org –i.e. the “Nominatim service” of OSM) However, internally available
official tools that are capable of geocoding as well as reverse geocoding finally have been used
for these tasks.)
Issues/Exceptions:
Hesse has used the tools that have been developed and provided by the Polish colleagues (JavaScript
tool for scraping Hotels.com, Java tool for scraping Booking.com) (but also own tools additionally or if
necessary).
Tool for Hotels.com:
To work properly, the tool needs a list of city or region names and a portal-internal Hotels.com id for
that name. Therefore, in a first separate step (Figure 24), a list had to be compiled separately that
included all 720 unique city name and id combinations for all of the 430 Hessian cities based on the
official register of communities and cities. (Obviously, neither ids nor city names are unique in this list.
This means that there definitely will be some duplicate units after scraping). For a complete coverage,
it turned out to be crucial to include all “duplicate” cities and ids that form a unique combination. (Own
experiments as well as results reported from colleagues from other countries showed that the number
of resulting units after scraping heavily depends on the level (“country”, “county”, “region”, “city”)
that has been chosen for scraping. Maybe, this even is country specific.
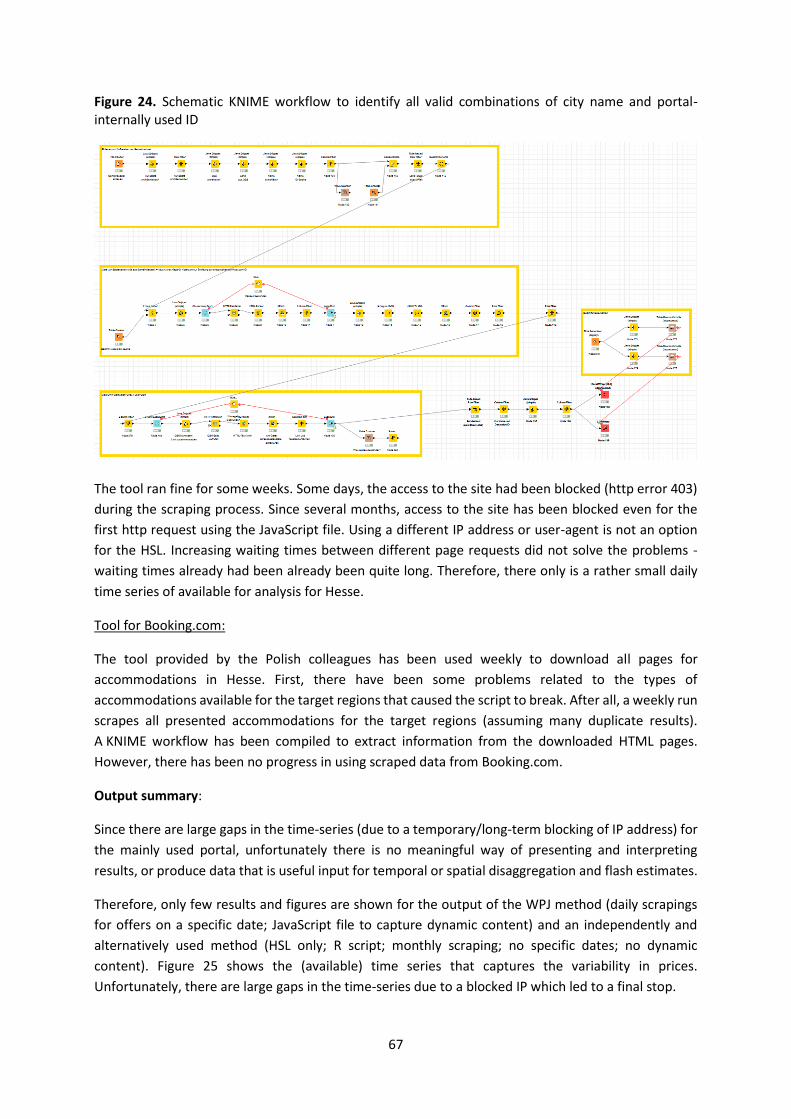
67
Figure 24. Schematic KNIME workflow to identify all valid combinations of city name and portal-internally used ID
The tool ran fine for some weeks. Some days, the access to the site had been blocked (http error 403)
during the scraping process. Since several months, access to the site has been blocked even for the
first http request using the JavaScript file. Using a different IP address or user-agent is not an option
for the HSL. Increasing waiting times between different page requests did not solve the problems -
waiting times already had been already been quite long. Therefore, there only is a rather small daily
time series of available for analysis for Hesse.
Tool for Booking.com:
The tool provided by the Polish colleagues has been used weekly to download all pages for
accommodations in Hesse. First, there have been some problems related to the types of
accommodations available for the target regions that caused the script to break. After all, a weekly run
scrapes all presented accommodations for the target regions (assuming many duplicate results).
A KNIME workflow has been compiled to extract information from the downloaded HTML pages.
However, there has been no progress in using scraped data from Booking.com.
Output summary:
Since there are large gaps in the time-series (due to a temporary/long-term blocking of IP address) for
the mainly used portal, unfortunately there is no meaningful way of presenting and interpreting
results, or produce data that is useful input for temporal or spatial disaggregation and flash estimates.
Therefore, only few results and figures are shown for the output of the WPJ method (daily scrapings
for offers on a specific date; JavaScript file to capture dynamic content) and an independently and
alternatively used method (HSL only; R script; monthly scraping; no specific dates; no dynamic
content). Figure 25 shows the (available) time series that captures the variability in prices.
Unfortunately, there are large gaps in the time-series due to a blocked IP which led to a final stop.

68
Figure 25. Time-series for accommodation booking portal (WPJ method): mean and median prices
Interestingly, Figure 26 shows less variability (but the overall picture is misleading due to scaling and
the large gaps).
Figure 26. Time-series for accommodation booking portal (WPJ method): number of offers
The alternative approach of scraping the same portal monthly using a different method is not capable
of substituting the daily scraping, since variability in the number of offering units as well as variability
in price is not capture by this method.

69
In Figure 27, the increasing numbers are not related to real changes in the population but to changes
in the program used for scraping. Additionally, the gaps visible in the middle of Figure 27 are not
related to the corona crisis but due to temporary failures of the program (temporary blocking of IP).
Figure 27. Time-series for accommodation booking portal (alt. method): (monthly) number of unique units
Figure 28 shows that in the alternative method there is only very small variability in prices visible in
the time-series.
Figure 28. Time-series for accommodation booking portal (alt. method): mean and median prices (log scale)

70
Use Case Identification
Use Case ID WPJ.1.IT
Use Case Name Web scraping
Date of creation 10.09.2020
Use Case Definition
Description: Examining the possibility of using web scraping techniques to extract
data from Booking.com portal.
Preconditions: IT programmer with good knowledge of the web environment. In
particular with knowledge of Java programming language, Selenium
library API, HTML, CSS, and JavaScript.
Flow:
1. Inspection and analysis of the booking’s site. The input of the municipality as a search destination parameter. Study of the results page for the optimization of the extraction of the hotel output information (name, ID, type, address, Atlas Geo-coordinates). To do this, web developer tools installed in the Firefox browser were used. Search for a solution to solve the limit of 1 000 viewable results by using a more selective search criterion.
2. Design and development of the Java application for the acquisition of structure information. Preparation of the input file containing the list of municipalities to set as destination search criteria. If there are more than 1 000 output results, the application automatically applies more filtering selection criteria (area, types of structure, number of stars).
3. Generation of output files in CSV format. The first file contains the search criteria, the number of
structures obtained, and its search URL useful for a possible restart of the application. The other
file contains structure information such as name, type, identifier, address, Atlas geographic
coordinates, and detail URL that may be useful for a subsequent, more in-depth investigation.
The second file can be used for the following scraping to verify the availability of the structure for
the dates and people set as the search criteria. The application implements a code to manage
the detection of bots.
Issues/Exceptions:
Adapting the software in the case of changes in the structure of the website.
A significant initial effort for adding all the specific search parameters to cover the entire territory.
The preliminary identification and specification of all provinces and municipalities to be searched
is essential to be almost sure that some of the available accommodation data are not missing in
the results.
Output summary:
After an initial attempt on the Hotels.com portal, web scraping was performed on the Booking.com
portal, as it was verified that it contains more structures on the Italian territory. The first web scraping
was carried out in November 2019 at the national level. The high number of structures in the country
required limiting the search to a region considered particularly interesting from a tourist point of view
and which shows a high degree of reliability in the statistical coverage of the census survey: Emilia-
Romagna. Web scraping on this region was performed in two different periods: in November 2019 and
in May 2020.

71
The number of listings found by web scraping (6,419) corresponds to about half of the structures
contained in the Emilia-Romagna regional archive.
A first analysis on the variable HotelType shows that there is a critical issue regarding the different
strings of the names of the structures, which must be addressed to understand the outcome of the
extraction from Booking. The variety of denominations presented in the regional archive is vast,
however, it probably responds to administrative classification needs. A similar great variety is present
on Booking, which however shows names that are probably more oriented to attract tourists,
therefore more characterized and more descriptive of the type of accommodation. Some
denominations are the same between the two sources (e.g Hotel, bed & breakfast, camping grounds,
etc.), however some categories, for example, other private accommodations, do not appear at all in
the Booking listings for the Emilia-Romagna region, but probably they are included in other types.
On the other hand, accommodations like alpine refuges and hiking refuges are not covered at all and
it seems difficult that they can be traced in other categories. A series of types appear only on Booking.
Among them, chalets, boats, inns, lodges, motels, resorts, villas, homestay accommodations, and only
a more in-depth analysis, based on a match or link procedures between the structures coming from
the two sources, will be able to ascertain whether they are included in other denominations.
Based on the identified categories, it emerges that the potential coverage of Booking on the Emilia-
Romagna region at the time of the scraping concerned all the touristic villages (100%) and almost all
the rented houses (78.7%), and a high percentage of residences (67.7%). Instead, the less visible
categories on Booking in the Emilia-Romagna region were campsites (13.0%), hostels (24.3%), and
rented rooms (29.9%).
Figure 29. Output of web scraping on Booking.com (.CSV file)

72
Figure 30. Output of web scraping on Booking.com (DB Oracle, with ArcGIS geo coordinate)

73
Use Case Identification
Use Case ID WPJ.1.NL
Use Case Name Web scraping
Date of creation 26.07.2019. (Last update 30.09.2020)
Design scope (Sub-)system from which most specifications are a “white-box”7.
Use Case Definition
Description Use scripts (hotels_com.html and hotel_com.bat) to capture, select and save
data on Dutch accommodations to build an Accommodation Enterprises
Database over time.
Preconditions 1. User has some basic knowledge on HTML, CSS and Java.
2. User can modify script hotels_com.html and hotel_com.bat for own
country (e.g. user-agent authorization and working map).
3. User selects the best approach to generate a list of location codes using
the API of Hotels.com.
4. User tunes the time-out specifications to start browser and to fetch pages.
5. User installs Chrome drive. Scripts require the use of Chrome driver and
Chrome browser.
6. IT-facility has to be directly connected to internet and has tool installed to
clean (daily) the facility from cookies, malware or other junk files
connected to web scraping using open internet and Windows OS.
Flow:
1. Click on command Prompt and change directory to the map containing the scripts
hotels_com.html and hotels_com.bat.
2. Run bat file(s).
3. Check that browser starts.
4. Check if script runs over the list of locations provided for three events (day after, next
weekend and last day of the month).
5. Check if CSV is written in hard-disk.
6. Deploy all CSV files along with a copy of the *.html and *.bat scripts used during web scraping
to production map.
Issues/Exceptions:
1. Web scraper is detected. Run facility cleaner. Restart program on the next location. At the end
of the scraping cycle, try again location that caused errors, based on logging. (If needed, restart
facility.)
2. (Temporal) Changes in the structure of the website. It occurs particularly at the beginning/end
of the month, or eventually, due to a specific event such as changes of country or provinces
policies or legislation (e.g. corona pandemic). Another possible explanation is that the list
location is temporally out-of-order. Try point 1 and/or wait until next day.
7 Three hierarchical categories from Cockburn Design scope (sub)system black-box, (sub)system white-box and component were used. [Cockburn (2001), “Writing effective use cases. Addison-Wesley. ISBN 0-201-70225-8. OCLC 44046973”].

74
3. (Permanent) Changes in the structure of the website, i.e. use site “nl.Hotels.com” instead of
“Hotels.com” or specifications on variable are changed, e.g. portal Hotels.com allows
accommodations to advertise without requiring their address [fixed the Polish team on
Oct-2019].
Output summary:
Building an Accommodation Enterprises Database over time has been a long expected product for
Statistics Netherlands (SN). In the context of the ESSnet WPJ on Pilot Track Innovative Tourism
Statistics, it has to be acknowledge that this goal has been reached under the leadership of Statistics
Poland.
SN started scraping the portal Hotels.com on July 24th 2019. This version of the script was improved at
the end of July thanks to a suggestion made by the Statistical Office of Hessen. In this manner also the
longitude and latitude coordinates8 of all accommodations advertising in Hotels.com are scraped.
By the end of September 2020, the Accommodation Enterprises Database contains 3.8 million records
over the period 24.07.2019 until 30.09.2020. This time series provides information per
accommodation, namely name, address, postal code, accommodation type, price per night, offer
identification, hotel identification, destination name, date scraping, scraping type, latitude and
longitude coordinates, region, number of guest reviews, (accommodation) star rating and guest
reviews rating.
From the statistical point of view, the most important variable is the accommodation type (accType)
and the derived variable “period open”. These are very important features because they provide a
direct way to gather information on when an accommodation is economically active and how the
accommodation owners (i.e. supply side) classify their accommodation (themselves). Consequently,
SN can compare and match the accommodation owner’s classification to the standard NACE
classification, i.e. NACE 55.1 Hotels and similar accommodation; NACE 55.2 Holiday and other short-
stay accommodation; NACE 55.3 Camping grounds, recreational vehicle parks and trailer parks, or
NACE 55.9 Other accommodation.
Moreover, these web scraping data provide daily insights on whether an accommodation might be
operating in a certain month as a support of the Year Inventory of Accommodation enterprises and to
a certain degree to the Monthly Survey on Number of Guests and Number of Overnights.
The main result is an overview of the variable accType and the number of accommodations using the
portal of Hotels.com over time, see Figure 31. These data enable the analysts to select the most
relevant types of accommodations, i.e. Hotel, Hostel, Apartment and Bed and breakfast and apart-
hotel (NACE 55.1) as the most relevant. Furthermore, the analyst may decide to discard
accommodations of the type “Cabin/Lodge” and “Cottage“, since they appear sporadically.
Another relevant result of the Accommodation Enterprises Database is to detect possible new forms
of accommodations. That is the case of the “Chalets” that appeared soon after the corona pandemic
lock-down. A probable explanation is that those accommodation meet relatively easier the corona
8 See also use case WPJ.4.NL.

75
policies to control corona spreading: Guests (households) share a common space and keep social
distancing (and minimum contact) respect to accommodation owners and other guests.
These database provides also an overview of how hard the financial impacts are of the corona
pandemic in the accommodation industry (on the accommodations using the portal of Hotels.com.)
Figure 32 shows the cloud of points and the smoothed9 line representing development of
accommodation prices per night. Notice the massive drop of the (mean and median) accommodation
prices after the corona lock-down announcement in the Netherlands after March 15th and that the size
of the corona drop is connected to the accommodation type.
Finally, this database can be used to connect observations on the price behaviour of accommodations
to the time lines of economic phenomena. It allows to identify some turning points probably connected
to policy measures, e.g., the development of the corona pandemic in the Netherlands.
9 Smoothed line is obtained using the loess method (locally estimated scatterplot smoothing with span = 0.25).

76
Figure 31. Accommodation Enterprises Database: number of accommodations per accommodation type in period 24.07.2019 until 30.09.2020

77
Figure 32. Accommodation Enterprises Database: Mean (Smoothed) Prices per accommodation type in period 24.07.2019 until 30.09.2020

78
Figure 33. Accommodation Enterprises Database: Number of offers and (Mean/Median) Prices along with time line of policy measures due to pandemic crisis in the Netherlands

79
Use Case Identification
Use Case ID WPJ.1.PT
Use Case Name Web scraping
Date of creation 01.10.2020
(Testing began in 2019-08-29, but daily regular scraping began in
2019-10-01)
Use Case Definition
Description: see below
Preconditions: The script for scraping Hotels.com portal is written in JavaScript
programming language and adapting it suit the needs of the users,
namely regarding locations, check-in dates, is very simple. Nevertheless,
the user must have at least basic programming skills (in any language) in
order to do it properly.
Description:
The script for web scraping the portal Hotels.com developed for WPJ granted the opportunity to
experiment on extended data collection from a big data source on a relevant domain such as tourism.
The use of tourism related portals by consumers when making travel arrangements is a widespread
practice, therefore the opportunity to collect and analyse this data is invaluable.
The script does not require a high level of expertise to be tailored to the user’s needs. There are some
notable features about this script:
Easy to adapt and implement;
Returns extensive, relevant and detailed data in a standard format (CSV);
Among other uses, it has significant potential to improve tourist accommodation survey base.
Web scraping of tourism related portals has been regarded as highly promising to expand the resources
available for official statistics. Nevertheless, some concerns have been raised in the past, namely about
ranking of offers and personalised pricing for the travel sector.
A recent report10 (2018) produced under the EU Consumer Programme - “Consumer market study on
online market segmentation through personalised pricing / offer in the European Union” – addressed
this practice of personalized ranking offers and pricing. Although it was not found evidence of general
consistent and systematic personalised pricing, there was some evidence found specifically on the
tourism domain:
Airline and hotel booking websites showed relatively higher evidence of price personalization compared
to websites selling TVs and shoes. - pp. 260
The report also noted that the lack of widespread evidence of personalised pricing should be
interpreted with care since (1) the sample used may not be representative for the EU e-commerce
market as a whole and (2) “online firms may employ any of the latest sophisticated algorithms or
10 Consumer market study on online market segmentation through personalised pricing/offer in the European Union

80
personalisation tools (such as for example digital fingerprinting) which research tools or methodologies
cannot easily detect” (pp.261).
The problem of personalised ranking is addressed by web scraper for Hotels.com as it collects all the
results available. This is crucial because Hotels.com’s website Terms and Conditions explicitly states in
the “How we display products and services on Hotels.com” section:
“(…) In our default sort of “Our Favourites”, the sort order reflects the relevance of properties to your
search criteria, as we want to make sure you are able to quickly and easily find the offer that is right
for you. We measure relevance by taking into account factors like a property’s location, its review
scores, the popularity of the property (measured by how many travellers on our sites make bookings at
that property), the quality of the content provided by the property, and the competitiveness of the
property’s rates and availability, all relative to other properties meeting your chosen search criteria.
The compensation which a property pays us for bookings made through our sites is also a factor for the
relative ranking of properties with similar offers, based on the relevance factors described above. On
our non-default sorts (e.g., by price or by star rating), properties with similar results will be ordered
based on the factors above.”
This excerpt states the criteria used for the ranking but it is not clear how exactly things are done. Later
on the “Terms and Conditions” section states that the algorithm may be a subject to changes along
time and therefore has a dynamic nature.
“Additionally, Hotels.com continually optimizes our service to provide the best experience to travellers.
Accordingly, we may test different default sort order algorithms from time to time.”
Scraping only the first offers provided by website would return a filtered result with not entirely known
criteria and potentially subject to changes along time. The use of the Hotels.com scraper for an
extended period of time should contribute to minimize the eventual impact of such a ranking and/or
changes in the algorithm. Therefore, long term scraping should be a pre-condition to use this data
source.
Tests were performed in order to have objective criteria to decide the appropriate location list to
scrape. Therefore, data was collected for all the 308 municipalities of Portugal mainland and also
Azores and Madeira archipelagos.
Statistics Portugal performed daily web scraping of Hotels.com portal with the script provided by the
Polish Team. The data collected covers a period from October 2019 to August 2020 when the script
was permanently blocked (Error 403).
The script was scheduled to run at 00:55 every day on a desktop computer and it would take about
2h30-3h00 to collect an average of 13 343 daily offers from 12 191 unique hotelId.

81
Flow:
The flow for this use case comprehends, selecting location for web scraping, data collection,
exploratory data analysis and data pre-processing.
1. Selecting location for web scraping
There were several options on how to define the appropriate location search for using the Hotels.com
script. One option could be to select a particularly well known touristic region but they do not always
match administrative regions used in official statistics. Tests were conducted in order to choose the
appropriate list of locationArray to scrape. Three separate hotels_com.html files were prepared and
results compared:
1. The first with locationArray {id: “10233141”, name: “Portugal”}, one search for the entire
country.
2. The second with locationArray with the 18 municipalities integrating Lisbon Metropolitan Area
(NUTS3).
3. Finally with a locationArray for all the 308 municipalities existing in Portugal.
The results of the three files were then compared for locality == “Lisbon” only and revealed different
total number of cases: (1) had 579 cases, (2) had 728 and (3) had 707 cases. The differences found
were not only in the total number of cases for locality == “Lisbon”. When comparing (2) – Lisbon
Metropolitan Area with (3) – PT308 municipalities, the data revealed that there were 27 cases missing
and 48 added. Some hotels were found in Lisbon Metropolitan Area search result (2) but not in the
results for the 308 municipalities (3) and vice-versa. These results seem to imply that the “level” used
for the “locationArray” variable has an impact on what and how many cases are collected.
Not being able to fully understand these discrepancies, a decision was made to scrape the largest
possible amount of data with the most possible detailed granularity. This is particularly relevant if
improvement of touristic accommodation base is intended. Hence, the Hotels.com script was adapted
to collect data from all the 308 existing Portuguese municipalities.
2. Data collection
The minimum number of offers collected at a given day was 5 098 (2020-05-08) and the maximum was
172 103 (2020-03-29). During the period from 2019-10-01 until 2020-08-12 the script was active and
collected over 3.7 million offers being successful for 282 days. The remaining 11% of days, where no
data was collected, are mainly due to changes in the portal that required the script to be adapted or
internal IT maintenance that required the computer, where the script was running, to be rebooted
(mostly during weekends).
The Hotels.com script has mainly three parameters that can be adapted according user needs.
Location (locationArray), which was already previously discussed,
Check-in date (scrapingType): last Thursday of month, next day and next weekend,
Number of guests (adults): 1 or 2 adults and 0 children.

82
Check-in Date
In the Portuguese use case, the pre-defined parameters for scraping data were a combination of check-
in date and number of adults:
1 adult, last Thursday of month,
1 adult, next day,
2 adults, next weekend.
Table 26 presents a cross tabulation of three check-in dates by the number of adults of the
Booking.com.
Table 26. scrapType by adults
scrapingType 1 2
last Thursday of month 1 731 731 0
next day 1 010 930 0
next weekend 0 1 020 039
As expected, these parameters returned duplicate hotelId. Since the data was predominantly intended
to improve tourist accommodation survey base, duplicate hotelId were removed in the next phase and
12 191 unique accommodations were identified.
Figure 34 represent the total amount of offers collected daily for the three above-mentioned check-in
dates and for the entire period the web scraping was active.
Offers for “next day” and “next weekend” follow a similar trend and have a similar volume. These
figures are very eloquent in demonstrating the impact of the COVID-19 pandemic had in the tourism
domain.
Figure 34. Time series of offers for “next day” and “next weekend”
Offers for “Last Thursday of the month” present extreme high values approximately every 90 days.

83
Figure 35. Time series of the last Thursday of the month offers
Distribution of offers by check-in date requires some attention. As it can be seen in Figure 35 “Offers:
Last Thursday of the Month”, does not follow the same trend as “next day” or “next weekend”.
Additionally, not every accommodation provided offers for all the three scrapingTypes.
In fact, 5 217 accommodations (42.8%) only had offers for 1 of the 3 requested check-in dates and they
were mostly for “Last Thursday of the Month”.
Table 27. Number of check in options offers by accommodations
Check in dates n percent
1 5 217 42.8
2 1 441 11.8
3 5 533 45.4
Once outliers are removed, “Last Thursday of the Month” time series fit a similar pattern to “Next Day”
and “Next Weekend” as can be confirmed in the Figure 36.

84
Figure 36. Comparison of time series for different types of offers
3. Exploratory Data Analysis
Web data sources such as Hotels.com portal naturally do not comply with the same strict protocol for
registering data as official statistics. Additionally, it is not entirely known how data was produced and
therefore no assumptions can be made without an adequate exploratory data analysis.
Although, a thorough exploratory data analysis was conducted to the entire data set, the present Use
Case focus only on data (variables) to be used in the use case WPJ.4b.PT.
The data collection returned search results for all the 308 municipalities (location) and for all check-in
dates (scrapingType)/Number of guests (adults). The range of offers by location is very high with
a maximum for Lisbon of 722 400 offers from 3 489 distinct accommodations and with Santa Cruz da
Graciosa with minimum of 400 offers from only 3 accommodations.
Table 28 shows that Lagos and Funchal have a similar number of offers with a very different number
of accommodations (14 985 for the first and 972 for the latter).
Table 28. Top 5 destinations by number of offers, distinct accommodations
destinationName n n_hoteId
Lisboa 722 400 3 486
Porto 380 692 1 601
Lagos 83 291 1 495
Funchal 82 273 972
Albufeira 78 991 2 004
It is important to note that offers by destination may not be exclusively originated by accommodations
from that particular location. Hotels.com “Terms and Conditions” do not guarantee that search results
will include exclusively offers from within the specified location by the user.

85
Table 28 shows that Funchal having approximately the same amount of offers than Lagos but with less
35% of accommodations. Funchal being in located in Madeira Island may limit the range of offers from
other locations (and other accommodations) that Hotels.com algorithm is able to include in the results.
Table 29. Top Bottom 5 destinations by number of offers, distinct accommodations
destinationName n n_hoteId
Proença-a-Nova 1 535 60
Ilha do Corvo 1 290 5
Santa Cruz das Flores 954 5
Lajes das Flores 817 5
Santa Cruz da Graciosa 400 3
The scraper provides a very useful “region” variable but data is registered in an inconsistent format,
either being in language, abbreviation or reference scope (district, region or area). For example, for
Lisbon related accommodations 9 different designations can be found. Additionally this variable has
71.8% of missing values.
Table 30. Multiple names for Lisbon region
region n percent
LIS 1 873 0.8
lisboa 1 116 0.5
Lisboa 154 297 65.1
Lisbon 75 622 31.9
Lisbon Area 65 0.0
Lisbon District 621 0.3
Lisbon Region 122 0.1
LISBON REGION 135 0.1
Region Lizbony 3 155 1.3
Some inconsistency is also found in addresses where different use of spaces, caps, abbreviation,
language, among other calls for standardization. Table 31 shows examples of nine different ways to
register an address for the same street.

86
Table 31. Different protocols for address (street)
street
Av. da Liberdade, 247
Avenida Liberdade, 185
Avenida Liberdade 243
Avenida da Liberdade 180 B
Avenida da Liberdade Nº 177 4º Esquerdo
Avenida da Liberdade, n 204, 3 esquerdo
Avenida da Liberdade, 138-142
Avenida da Liberdade, 177 4DTO
Avenida Liberdade 202, 2nd Floor
Furthermore is not easy to determine if an address is complete, that is, to have street, house number,
floor and postal code, because it is not uncommon for an address not to have one of these elements.
For example, the complete address for Statistics Portugal Headquarters does not have a house
number; it is the building’s name that is used for identification. In the data collected by web scraping,
17% (n = 2,078) of hotelId’s do not have a house number in their corresponding address.
The identification variables hotelId and offerId proved to be very robust as they are in fact unique.
As to the case of hotelName, it was expected to find the same hotel for different localities but that
could be easily identified by cross referencing hotelId or offerId. Unexpectedly, there are 5.3% of
hotelId’s that have two or more hotelName’s. Table 32 shows an example of a hotelId associated with
five different names.
Table 32. Example of multiple hotelName’s for the same hotelId and offerId
hotelName hotelId offerId
Joker Guest House 44295775 1418464800
Welcom Lisbon 44295775 1418464800
U INN Lisbon 44295775 1418464800
Joker Guest House Lisbon 44295775 1418464800
Travel Inn Lisbon 44295775 1418464800
Some minor inconsistencies were also found in accommodation names although hotelId proved to be very robust.

87
Table 33. Example of same hotelId and offerId for different hotelName
hotelName hotelId offerId
A da Avo -The Guesthouse 42101832 1348258624
À da Avó -The Guesthouse 42101832 1348258624
Foreign locations
The search results also included foreign located accommodations, namely from Spain, that accounted
for 6% (n=729). These locations are mainly from areas near the Portugal/Spain and border were
discarded. The examples can be found in the Table 34.
Table 34. Foreign locations returned from search results
hotelName locality street region
Alojamientos Rurales Los Molinos Fuentes de Leon Timoteo Pérez Rubio 16 A Badajoz
Hotel Spa Vilavella A Mezquita Lugar de Vilavella, s/n Ourense
Hospedería El Pico del Fraile Cobreros Carretera De Santa Colomba, 1 Zamora
Hotel Las Bovedas Badajoz Autovía Madrid-Lisboa, km 405.7 Badajoz
Accommodation Type
Accommodation type (accType) is a relevant variable when combining scraped data with survey data.
Almost every case has data in this field, only 0.97% (n=117) have a missing value.
Hotel and Apartments are by far the most common accommodation type found in the data scraped
from Hotels.com portal.
Table 35. Accommodation type frequency table
accType n percent valid_percent
Hotel 1 356 464 36.1 36.5
Apartment 837 897 22.3 22.6
Guest House 451 335 12.0 12.2
Hostel 204 423 5.4 5.5
Country House 183 373 4.9 4.9
Bed and breakfast 179 947 4.8 4.8
Apart-hotel 146 020 3.9 3.9
Vacation home Condo 136 324 3.6 3.7
Villa 74 734 2.0 2.0
Cottage 40 597 1.1 1.1
Other 102 261 2.7 2.7
NA 49 325 1.3 -

88
Even though these categories are similar to the ones used in official statistics there is no guarantee on
the degree of accuracy they have. For some cases, this variable registers not actually types of
accommodation, but rather information on the services provided, such as “with wifi” or “All inclusive”.
This kind of appropriation of a particular field for registering other information rather than the one it
originally was meant for is also found in hotelNames where long descriptions of the accommodation
can be found, for example: “House With one Bedroom in Águeda, With Wonderful Mountain View,
Pool Access and Enclosed Garden - 55 km From the Beach”.
Based on hotelId it was possible to account for 4.4% (n=541) accommodations with two or more
accommodation types.
Table 36. Accommodations with one or more accType
accType n percent
1 11 650 95.6
2 524 4.3
3 17 0.1
Table 37 presents an example of an accommodation establishment that changed the accType three
times during the period data was collected.
Table 37. Example: Accommodation accType changes along time
hotelId hotelName accType date
2693234 Arts In Hotel Conde Carvalhal Apart-hotel 2019-10-01
2693234 Arts In Hotel Conde Carvalhal Apart-hotel 2020-01-02
2693234 Arts In Hotel Conde Carvalhal Apartment 2020-01-03
2693234 Arts In Hotel Conde Carvalhal Apartment 2020-07-22
2693234 Arts In Hotel Conde Carvalhal Hotel 2020-07-31
2693234 Arts In Hotel Conde Carvalhal Hotel 2020-08-12
This raises concerns when it comes to select a distinct accommodation case that changed one or more
values (either name or accommodation type) along an extended period of data collection. The options
are select the most frequent or just consider the latest update.
4. Data Pre-Processing
The preceding exploratory data analysis was valuable to determine the necessary actions for data
cleaning, pre-processing and standardization. It is of paramount importance and it should be
performed as extensively as wisely as possible in order to what was described in Deliverable J3 -
Methodological framework Report as “make them as similar as possible (thus avoiding False Negatives)
without making them too similar (thus avoiding False Positives)” (pp.21).
89
Define missing values
Remove duplicates cases
Solve multiple categorization for same case
Pre-process string variables to be used for linking data
o Convert to lowercase
o Remove punctuation and accentuation
o Remove curated stop word list
o Trim whitespace and remove double spaces
o Generalize abbreviations especially for address, eg. praça -> pc or avenida -> av (n=16)
Remove all foreign locations
Issues/Exceptions:
Blocked script
The script for Hotels.com ran from 2019-10-01 until 2020-08-12 without major interruptions. Then the
access to the site was permanently blocked (http error 403) and the script would stop at the very first
location. This was not a general block as other countries continued to use the script successfully. To try
to overcome this problem, some steps were undertaken:
Verification of location Id, and test for just for one location - Lisbon – and confirmed that both
id value and location name were still valid
Changed the name of the first location in the script from;
Tested several other first entries (other locations);
Increased timeout in bat file;
Increased minimum and maximum timeout between fetching next page of Hotels.com;
None of these actions were successful in order to resume the scraping process.
Output summary:
The script developed for WPJ for web scraping the portal Hotels.com collected an average of 13 343
daily offers from 12 191 unique hotelId. Over a time span of 316 days the script collected over
3.7 million offers data for 282 days before it was permanently blocked.
The Hotels.com script was adapted to collect data from all the 308 Portuguese municipalities (Azores
and Madeira Archipelagos included) which is a considerable amount of data.
As expected, data scraped from the web lacks the quality found on official statistics data sources in
a number of ways. There are some inconsistency issues but they’re easily identified. Nevertheless, it is
a valuable source when appropriate data cleaning procedures are undertaken.
Exploratory data analysis gave an important insight on how to proceed regarding data cleaning, pre-
processing and standardization which will be determinant to use case WPJ.4a.PT and WPJ.4b.PT

90
Use Case Identification
Use Case ID WPJ.1.SK
Use Case Name Web scraping
Date of creation 04.10.2020
Use Case Definition
Description: Web scraping of the Hotels.com and Booking.com portals.
Preconditions: Scraping codes and suitable browsers installed, regular update
necessary.
Flow:
Scripts provided by PL team were used to scrap data from Hotels.com and Booking.com portals. Both
scripts were tested on the Polish data first. After few adjustments, scripts were launched successfully
on Slovak data. Nevertheless, some problems with both scripts were encountered during the project.
It was decided to web scrap data for entire Slovakia at once and therefore additional information was
linked to web scraped data to be able to analyse them on NUTS3 level at the later stage.
Hotels.com
Data from the Hotels.com portal were scraped from the mid of April 2020. Google Chrome was used
as a browser for web-scraping. Initialization search parameters were set to:
destination: Slovakia; adults= 1; children= 0;
With the use of HERE Maps API tool prepared by the Polish team, variables determining geolocation
were also added to the output file later during the project. Output files with web scraped data were
well structured. Further work was done in order to improve Slovak diacritics marks in output files
because these were not correct after data were web scraped. The web scraping resulted in an error
while running the Hotels.com script few times during the project period. Portal Hotels.com,
e.g. changed structure of offers and street address of the accommodation establishment was no longer
required. This and others problems were solved by the Polish team or other colleagues familiar with
the JavaScript programming. Such issues can hardly be resolved in case there is no support from IT or
people skilled in JavaScript. The web scraped data were cleaned, combined and analysed in the next
steps.
The Polish team also prepared an R code for producing some basic statistics on scraped data, including
plots on offers and prices and histograms. Daily and monthly time series of data can be created, as well
as the database of all unique scraped accommodations throughout the whole period. The code was
revised and some adjustments proposed, mainly related to the speed of the code and some
standardization.
Below are the plots of number of offers (Figure 37), mean and median prices (Figure 38). Histogram of
prices is also displayed (Figure 39).

91
Figure 37. Number of offers
Figure 38. Mean and median prices

92
Figure 39. Histogram of prices
Booking.com
Data from the Booking.com portal were scraped from the beginning of April 2020. Firstly, only data for
three major cities representing the west, the middle and the east of Slovakia were web scraped.
Initialization search parameters were set to:
destination: Bratislava, Banska Bystrica, Kosice;
date_from = today;
date_to = today+1;
adults= 1;
children= 0;
rooms= 1;
Later, data for entire Slovakia were web scraped, when destination was changed to “Slovakia”. These
time series cover the period from August 2019 to April 2020. Other searched parameters were not
changed. As mentioned above, some problems were also encountered during running the
Booking.com script. Here are main of our observations:
Different behaviour of the script depending on the way how the script was launched: If it was run
with a direct double-click on the jar file, non-existent types caused breakdowns. If it was run using
command prompt, non-existent types were passed.
The minimum number of pages scraped for a specific type was 2. There were several
accommodation types in Slovakia which contained only few offers (e.g. boats, luxury tents, holiday
complexes). The script did not return results for such cases if parameter “type” was changed one
by one. It was the main reason why it was decided to web scrap data for all accommodation types
at once by using the pipe sign “|” to split them.

93
Scraping of the whole set of types at once caused stock effect, when the i-th type was scraped
altogether with all previous types, i.e. if the number of the types is n, first type is scraped n-times,
second one (n-1)-times etc.
Maximum 40 pages (or 1 000 offers) were available for Slovak mutation of Booking.com. As data
was web scraped for all Slovakia at once some of available accommodation data were missing (not
an issue for flash estimates and temporal disaggregation, but insufficiency for the survey frame
update).
Existence of discrepancies between the folder name and the accommodation type which should be
stored in that folder. For example, “Hostels” data were stored in the folder “Agritourism farms” or
“Agritourism farms” data were stored in the folder “Holiday homes”. But “Apartments” data were
correctly stored in the folder “Apartments”.
Non-availability of information on address in scraped data is a big disadvantage.
The script stopped working on the 1st of May 2020.
Output files contained raw scraped Booking.com web-pages with complete html code behind. R code
was made for extracting necessary data from scraped files, based on regular expressions. Despite
frequent changes of Booking.com page, main classes and structures of the pages remained more or
less stable, thus it was possible to identify key objects and pull the information from them. After that,
structured data frames of daily files were created and used for further analysis. With the use of parallel
programming in R, it was possible to process a daily file in about 38 seconds (about 700 html files, each
with ca 12 000 rows per day).
Below are some plots of data from Booking.com.
Figure 40. Number of offers
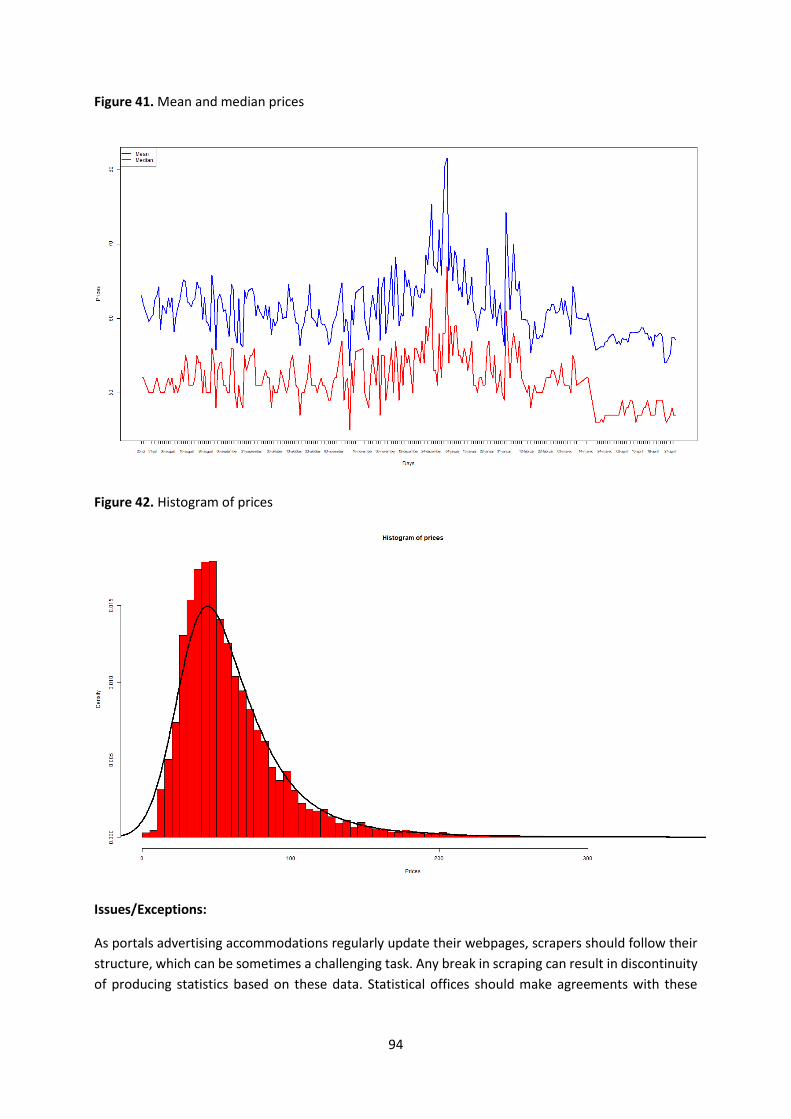
94
Figure 41. Mean and median prices
Figure 42. Histogram of prices
Issues/Exceptions:
As portals advertising accommodations regularly update their webpages, scrapers should follow their
structure, which can be sometimes a challenging task. Any break in scraping can result in discontinuity
of producing statistics based on these data. Statistical offices should make agreements with these

95
providers or use their API services, which can be, however, often insufficient in terms of volume and
timeliness.
Output summary:
Within the scope of the project daily scraping of Hotels.com and Booking.com webpages was possible
with the use of scrapers prepared by the Polish team. Some issues were encountered during the
period, most of them resolved by Polish colleagues. Both web pages offered valuable information for
the frame update, flash estimates and temporal disaggregation studies. Stability of the web scraping
is an issue in general, as any change of the web service can lead to the interrupt.

96
4.2. Source characteristics
Use Case Identification
Use Case ID WPJ.2.DE-Hesse
Use Case Name Source characteristics
Date of creation 30.09.2020
Use Case Definition
Description: Short description of data sources and characteristics.
Preconditions: None
Flow:
1. Define aims end expected results of using and combining data sources.
2. Identify existing data sources, check underlying definitions and concepts.
3. Check availability / access of 2). Not all data of 2) necessarily is or has to be hold by official
statistics.
4. Check aggregation level of information: micro data vs. aggregated data (e.g. geographical
aggregation: NUTS1, NUTS3, LAU).
5. Check temporal granularity: e.g. data may be available at regular intervals (available biennial,
yearly, quarterly and monthly) or at any point in time (e.g. data from web scraping).
Issues/Exceptions:
Covering time-periods of existing and available data sources maybe do not overlap or overlap only
partly. The temporal aggregation may be different, so temporal disaggregation (and re-aggregation)
may be necessary. Whereas some data sources are up-to-date, others maybe are available only after
a larger time lag (weeks, months but even years). This may require gathering data prospectively long
before it can be used (e.g., generally it is not possible to scrape data from the past in order to compare
it with data sources from the same period that are available after a specific time lag).
Definitions and concepts of different data sources can be different or information on methods,
definitions and concepts is sparse or even missing.
Output summary:
Since there has been a description of sources and characteristics in a previous deliverable, general
results are shown. Figure 43 shows the overall relations between data source types, data sources and
the expected experimental result, based on a tool for visualization developed by WPJ (Task 1C).

97
Figure 43. Overall network of data sources, data source types, expected outcome within WPJ
The overall picture in Figure 43 shows that many partners in principle share the same data source
(since originated in EU legislation) and therefore share the same expected experimental result. Some
data sources are not available by all partners, but in principle could be available for other partners, too
(e.g. web scraping of specific sites – e.g. of flights and aircraft data). Some data sources exist in
principle, but are not (yet) available. Some data sources are rather country specific (i.e. specific
registers or surveys, or websites targeting a specific target population or covering a specific
geographical region).
The main goal is to produce “innovative tourism statistics”, e.g. “flash estimates”, “spatial and
temporal disaggregation of data on tourist accommodation data base”. Other goals can be achieved
on this way: “Improving tourist accommodation base of reference”, “improve quality of tourists’
expense data”, “improve quality of data on trips”, “improve quality of tourist transport data”.
Figure 43 shows that there is no single data source or data source type that is sufficient for producing
this “innovative tourism statistics”. It is the interplay of different data sources types and data sources
that allows producing innovative statistics. Figure one shows that this is especially web data, survey
data, multi-purpose data (register or administrative data sources).

98
Figure 44 shows the schematic picture for Hesse.
Figure 44. Schematic network of data sources, data source types, and expected outcome for Hesse (DE)
Especially some of the multi-purpose data as well as survey data from Figure 43 are not available for
Hesse (since these data source types typically contain rather partner specific data sources).

99
Use Case Identification
Use Case ID WPJ.2.IT
Use Case Name Source characteristics
Date of creation 08.09.2020
Use Case Definition
Description: Identification of the potentially informative sources for the construction
of an integrated tourism statistic system.
Preconditions: None
Flow:
Collaborate in the definition of the general structure of the document, suggesting the collection of new
information on each source.
Identify the most popular national and international websites in the tourism sector to choose the best
input for the web scraping procedures.
Make an inventory of data sources related to tourism statistics by selecting those from which data may
be useful to improve the quality and the completeness of official tourism statistics.
Identify, describe, and classify source characteristics taking into account their usefulness for estimating
the demand- and supply-sides of tourism.
Issues/Exceptions:
The real usability of some sources is a critical point. There are periodicity issues due to the production
of only annual data, so it is impossible to know the seasonal peaks. There are difficulties to distinguish
between tourism and non-tourism mobility. Furthermore, some of the sources are too sectorial
sources.
Output summary:
The total number of identified sources for Italy was 14. Also, three international websites were
identified (Booking.com, Hotels.com, and Tripadvisor.com). As concerns the websites, it seems that
national ones are less used so it was decided to put the initial focus of web scraping on the most
popular (Booking.com).

100
Table 38. Number of data sources identified in Italy broken down by type
Number of identified sources
Internal External Availability (of external sources) Supply-side Demand-side Both
sides
9 5 2 sources available, and 3 temporarily or
permanently not available 3 9 2
Table 39. Data sources identified in Italy (available)
Data source Frequency Additional information Potential risk involved Level Legislation External/
internal
Short
/middle/
long term
source
Waste
production annual
only annual data; so it is
impossible to know the seasonal
peaks
NUTS3 (Cities)
External
(National
Institute for
Environmental
Protection)
Long term
Water
consumption annual
only annual data; so it is
impossible to know the seasonal
peaks
NUTS3 (Cities) national Internal Long term

101
Table 40. Data sources identified in Italy (available) (cont.)
Data source Frequency Additional information Potential risk involved Level Legislation External/
internal
Short
/middle/
long term
source
Airport data monthly
number of passengers
(national, international,
scheduled, charter
service)
difficulties in distinguishing
between tourism and non-tourism
mobility
airport
Regulation
EC n.
437/2003
and
Regulation
EC n.
1358/2003,
updated by
Regulation
(EC) n.
1791/2006
internal Long term
Port authority
data monthly number of passengers
difficulties in distinguishing
between tourism and non-tourism
mobility
port embarking/
disembarking at
least 200,000
passengers.
Directive
2009/42/EC internal Long term
Railway data quarterly number of passengers
difficulties in distinguishing
between tourism and non-tourism
mobility
size of railway
enterprises
Regulation
EC n.
91/2003
internal Long term
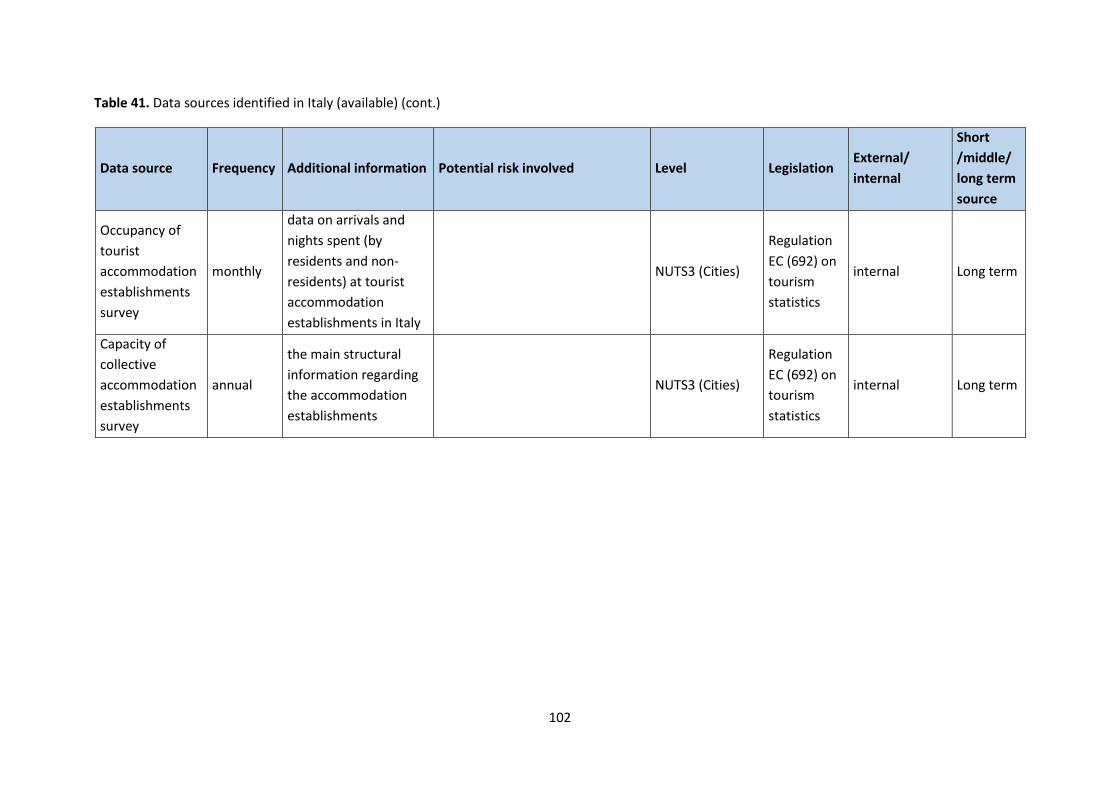
102
Table 41. Data sources identified in Italy (available) (cont.)
Data source Frequency Additional information Potential risk involved Level Legislation External/
internal
Short
/middle/
long term
source
Occupancy of
tourist
accommodation
establishments
survey
monthly
data on arrivals and
nights spent (by
residents and non-
residents) at tourist
accommodation
establishments in Italy
NUTS3 (Cities)
Regulation
EC (692) on
tourism
statistics
internal Long term
Capacity of
collective
accommodation
establishments
survey
annual
the main structural
information regarding
the accommodation
establishments
NUTS3 (Cities)
Regulation
EC (692) on
tourism
statistics
internal Long term

103
Table 42. Data sources identified in Italy (available) (cont.)
Data source Frequency Additional information Potential risk involved Level Legislation External/
internal
Short
/middle/
long term
source
Trips and
holidays survey monthly
data on participation of
residents in trips for
personal reasons and
business trips
(domestic and
outbound); provides a
set of information on
tourist trips, such as
destination, booking,
the main purpose, type
of accommodation, the
main means of
transport, duration,
and period of the year
for each trip
NUTS2
(REGIONS)
Regulation
EC (692) on
tourism
statistics
internal Long term

104
Table 43. Data sources identified in Italy (available) (cont.)
Data source Frequency Additional information Potential risk involved Level Legislation External/
internal
Short
/middle/
long term
source
International
tourism Survey monthly
Resident and non-
resident travellers at
the Italian borders
(road and rail crossings,
international ports and
airports).
NUTS2
(REGIONS)
External (Bank
of Italy) Long term
Survey on rural
tourist
accommodations
annual
Characteristics of
farmhouse
accommodations
NUTS3 (Cities) national internal Long term
Survey on
museums and
similar
institutions
every four
years number of admissions
usable only to estimate this
specific part of cultural tourism NUTS3 (Cities) national internal Long term
Table 44. Data sources identified in Italy (not yet available)
Data source Additional information Potential risk involved
mobile phone data Agreements with mobile phone data providers are in progress, but the authorization of
the Italian Privacy Authority is in progress privacy issues
traffic images data Experimental statistics for measurement of traffic flow on the Italian road network
data on financial transactions They could become available from Workpackage G.

105
Use Case Identification
Use Case ID WPJ.2.NL
Use Case Name Source characteristics
Date of creation 09.06.2020. (Last update 25.09.2020)
Design scope (Sub-)system from which most specifications are a “white-box”11.
Use Case Definition
Description Use HTML script (visNet_Workflow_v5.html) to get an overview of the Inputs
and Outputs of the Pilot Track Project on Innovative Tourism statistics, case:
The Netherlands. Analyse and evaluate the I/O Source Characteristics in the
Dutch domain. Eventually, use R-script (visNet_Workflow_v5.R) to edit the
HTML output.
Preconditions 1. User has basic knowledge on interactive HTML i.e. user can select filters
for own country.
2. User has basic knowledge on R to load R-libraries and change (read- and
write-) directories.
3. User has installed R (version R-4.0.2) and RStudio with libraries dplyr
(version 1.0.0), visNetwork (visNetwork version 2.0.9) and rstudioapi or
can download then from internet.
Flow:
1. Open visNet_Workflow_v5.html on any browser by clicking on file.
2. Use “Select by Group” to choose “Country: NL”.
3. Browse over the nodes of interest. Nodes are classified on “Data Source Type”, “Data
Sources”, “Expected Results” and “External links”.
4. Export overview as *.png or make a print-screen for reporting.
Issues/Exceptions:
Check that R, RStudio and libraries are properly installed.
Output summary:
The product “An overview of the Inputs and Outputs of the Pilot Project on Innovative Tourism
Statistics” puts forward a tool to analyse and evaluate simultaneously more than seven Flow Models.
In the current use case, this tool is used to depict the Flow Model of Statistics Netherlands (SN). It is
connected to the Catalogue of Sources of WPJ and the Task 1c on “Source Characteristics” lead by
Statistics Portugal and in cooperation with the Hellenic Statistical Authority and Statistics Netherlands.
11 Three hierarchical categories from Cockburn Design scope (sub)system black-box, (sub)system white-box and component are used. [Cockburn (2001), “Writing effective use cases. Addison-Wesley. ISBN 0-201-70225-8. OCLC 44046973”].
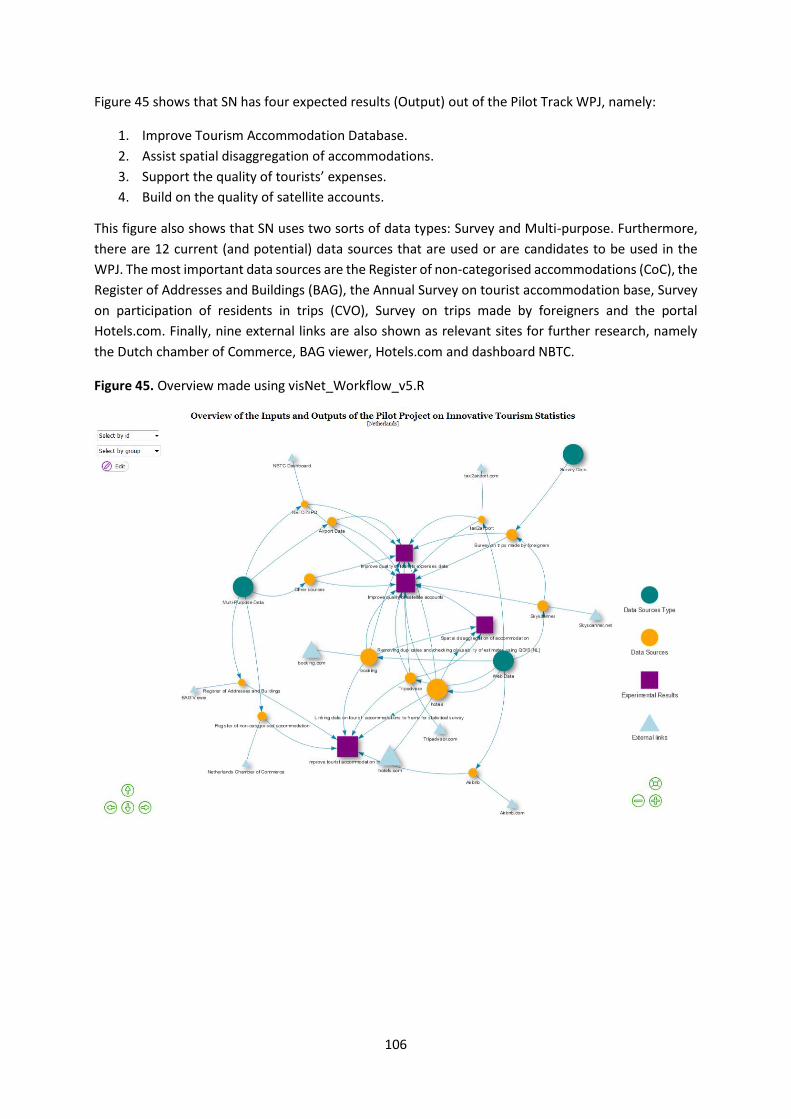
106
Figure 45 shows that SN has four expected results (Output) out of the Pilot Track WPJ, namely:
1. Improve Tourism Accommodation Database.
2. Assist spatial disaggregation of accommodations.
3. Support the quality of tourists’ expenses.
4. Build on the quality of satellite accounts.
This figure also shows that SN uses two sorts of data types: Survey and Multi-purpose. Furthermore,
there are 12 current (and potential) data sources that are used or are candidates to be used in the
WPJ. The most important data sources are the Register of non-categorised accommodations (CoC), the
Register of Addresses and Buildings (BAG), the Annual Survey on tourist accommodation base, Survey
on participation of residents in trips (CVO), Survey on trips made by foreigners and the portal
Hotels.com. Finally, nine external links are also shown as relevant sites for further research, namely
the Dutch chamber of Commerce, BAG viewer, Hotels.com and dashboard NBTC.
Figure 45. Overview made using visNet_Workflow_v5.R

107
Use Case Identification
Use Case ID WPJ.2.PT
Use Case Name Source characteristics
Date of creation 02.10.2020
Use Case Definition
Description: Variable mapping adds a new layer of information to the previously
developed visNetwork “Overview of the Inputs and Outputs of the Pilot
Project on Innovative Tourism Statistics (v5)”. Based on the R script
previously developed, this new version concerns exclusively Portugal and
the WPJ.4b.PT use case – combining data. This allows a clearly and
intuitively views on the process of using variables.
Preconditions: This use case is preceded by use case’s WPJ.1.PT (web scraping), use case
WPJ.4a.PT (geolocation), availability of data on tourist accommodation
survey base and use case WPJ.4b.PT (combining data). Basic knowledge
of R and RStudio IDE and familiarity with R script visNet_Workflow_v5.R
is also advisable.
Flow:
1. Identify variables and tool to add to the visNetwork.
2. Edit edges and node accordingly.
3. Edit and run the R Script.
4. Filter data on the html version of the visNetwork.
Issues/Exceptions:
This use case only relates to the specific case of Portugal, although is bares similarities with other
countries that also used the same data sources, tools (geolocation tool) for the expected result:
improve survey population of tourist accommodation establishments.
Output summary:
The resulting visNetwork visually maps the direct and indirect connections between data sources,
variables used, tools and experimental results, establishing the flow of the process. The output is the
R code, the html file and the images (screen captures). The former has the benefit of ease of share the
last two have the benefit of a universal and friendly format.
This output is a very simple proof of concept to illustrate the possibility on how the visNetwork is a
suitable tool to visualize the interconnections between data sources, available variables, tools and
expected results.
Figure 46 shows the complete visNetwork for the Portuguese case, where new nodes (Tool and
Variables) integrated with the previously presented workflow are presented.

108
Figure 46. Complete visNetwork for Portugal.
In Figure 47 details of the visNetwork on the variables, data sources, tool and experimental results,
combining data from survey and web data in order to improve survey population of tourist
accommodation establishments can be found. The edges (connections) also identify the method used
to link data, 1-1 matching in the case of the coordinates and string matching for Name, Address and
PostalCode.
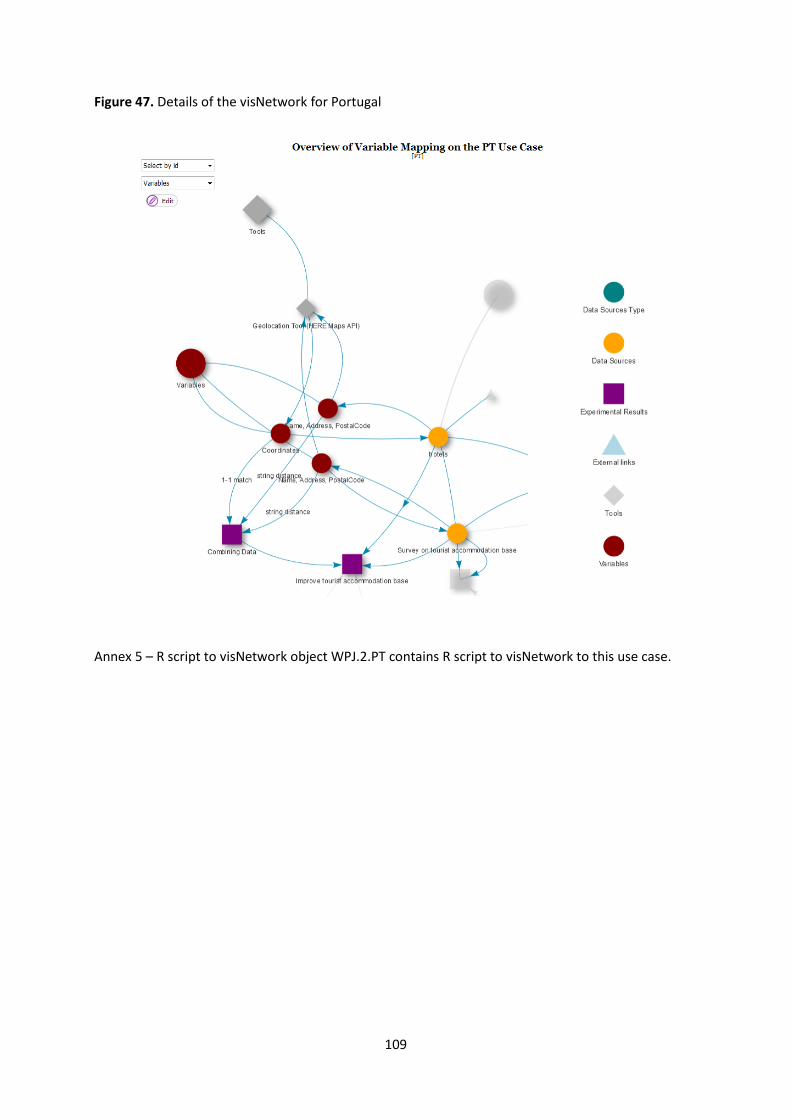
109
Figure 47. Details of the visNetwork for Portugal
Annex 5 – R script to visNetwork object WPJ.2.PT contains R script to visNetwork to this use case.

110
4.3. Legal aspects
Use Case Identification
Use Case ID WPJ.3.DE-Hesse
Use Case Name Legal aspects
Date of creation 30.09.2020
Use Case Definition
Description: Description of legal aspects
Preconditions: None
Flow:
1. Identify and check relevant general legal requirements and IT security procedures to meet.
2. Consult local legal department and data security and data protection officer.
3. If necessary or optionally, develop a web scraping policy respecting 1) and 2).
4. If necessary, inform relevant positions (e.g. data protection agency), also referring to 3).
5. Implement general or special limitations into scraping software (e.g. user-agent, breaks).
6. Check for reactions of providers. Adapt 5) to reactions from providers.
7. Check for changes in legal requirements. Adapt 5) to changes.
Issues/Exceptions:
Even if web scraping legally may considered legitimate in general, there may be different opinions
whether this mode of data collection should be used (internally, as well as public opinion).
Only in few cases, there may be a legal obligation for service providers to bear scraping by official
statistics. If there is no such obligation of providing a service, providers may exclude any user from the
service at any time (e.g. by blocking user-agents, IP address or a range of ID addresses). If other users
use these IP addresses, they also may be negatively affected.
A strategy for web scraping may include contacting providers (voluntarily or obligatory) in advance.
This may even enable providers to prevent their sites being scraped from the beginning. (Alternatively,
contacting in advance may make scraping possible at all).
Output summary:
In principle, general web scraping is considered legal since these data are generally available to or
accessible by everyone. However, there are some limitations: the technical process of scraping must
not cause damage to the infrastructure of the website provider or data holder and must not hinder
providers or other visitors to the website in their normal use of the website. Technical barriers must
not be overridden automatically. Some offices for official statistics have developed and adopted a web
scraping policy to make their efforts as transparent as possible to the public as well as to website
owners or providers. This policy may include:
Specification of a distinct “user agent” in order to being identifiable as coming from and
belonging to official statistics (no fake user agent, no “spoofing”). This identification may

111
include a link to a website with more information on the origin of the scraper and the purpose
of scraping.
No “spoofing” of IP address / no hide of IP origin (rotation, VPN) in order to prevent being
blocked.
Planned breaks of a specific number of seconds between subsequent page request to the same
server to lower burden on server and network, but no forced imitation of “human interaction”
(e.g. special emphasize on random waiting times).
Use specific APIs whenever possible to decrease server and network burden.
Contact website owners or providers in advance and announce scraping process as well as
purpose. (In general, there is no need to ask for permission, but otherwise there could be a
permission when scraping would not be possible or allowed otherwise).
(e.g., see https://statistik.hessen.de/ua or see the recommendations of ESSnet Big Data II -
WPC )
In Germany for some official statistics, basic laws explicitly mention web scraping as the mode of data
collection (e.g. in price statistics). In such cases, there even may be a legal obligation for website
owners or providers to bear web scraping by official statistics.
In principle, specific web scraping projects for official statistics should be conducted after internal
consultation of the legal department as well as the data security and protection officer.
There have been mixed experiences regarding contacting website providers in advance. For most of
the websites, there was no reaction at all (either to the scraping or the announcement). In one case,
there was reaction to the scraping process (resulting in a temporarily blocked IP address). In another
case, there was positive reaction to the advance letter (resulting in the possibility of using an API
instead of scraping) even after scraping became negatively noticeable to the provider.

112
Use Case Identification
Use Case ID WPJ.3.NL
Use Case Name Legal aspects of web scraping: the case of the Netherlands
Date of creation 30.09.2020
Design scope (Sub-)system from which specifications are a “white-box”.12
Use Case Definition
Description Explaining the legal basis applicable in the Netherlands to able to scrape the
portal Hotels.com.
Preconditions The process of web scraping should be transparent, consistent, ethical, and with
respect to all relevant legislation.
Flow:
Web scraping process should cope with the following questions:
1. Is there a legal basis for NSIs to be able to web scrape?
2. If that is the case, which rules must be adhered to?
3. And how should the web scraped data be stored, processed and published?
Issues/Exceptions:
“Information shall only be made public in such a way that no identifiable information about an
individual person, household, enterprise or institution can be derived from it, unless, there is a valid
reason to assume that the undertaking or institution concerned has no objections to the disclosure.”
Output summary:
The use of big data sources, such as web scraping, is not free of rules in the Netherlands. However,
these rules are not always crystal clear. These rules include European law as well as Dutch law. In fact
three questions need to be answered:
1. Is there a legal basis for NSIs to be able to web scrape?
2. If that is the case, which rules must be adhered to?
3. And how should the web scraped data be stored, processed published?
To start with the first question, generally speaking, web scraping is prohibited by the so called
European directive 96/9/EG (later the Directive on Copyright in the Digital Single Market), especially if
this goes together with the violation of Intellectual property rights. For example, commercially
republishing of web scraped data or building your own index for pages on someone else's website boils
down to whether the operator of the original site “suffers unjustified harm” in the case substantial
investments were made. However, an exception to this rule is provided for scientific and statistical
research, because there is usually no commercial use or goal. Another legal basis that can be used by
Statistics Netherlands to web scrape is found in the Dutch CBS-law. This law is the foundation for the
work that Statistics Netherlands carries out. Especially Article 3 provides the basis why Statistics
Netherlands is allowed to web scrape. Among other things, this article points to ‘the use for statistical
12 Three hierarchical categories from Cockburn Design scope (sub)system black-box, (sub)system white-box and component were used. [Cockburn (2001), “Writing effective use cases. Addison-Wesley. ISBN 0-201-70225-8. OCLC 44046973”].

113
research by government for the purpose of policy, practice and science’, which should also lead to
publication of the results. Finally, one should be aware that if data are web scraped, to say, outside
the country’s borders, the rules in the country apply where the website is hosted.
In addition to the legal basis, it is also important which rules much be adhered to when and how one
is web scraping data from the internet (second question). It can never be the goal to web scrape
unlimited data at any time without any rules. When it comes to the web scraping itself, Statistics
Netherlands has committed itself to the rules described in the ESSnet web scraping policy: ‘the purpose
of this policy is to ensure that web scraping activities of National Statistical Institutes (NSIs) are carried
out transparently, consistently, ethically, and with respect to all relevant legislation; and that web
scraped data are used in an appropriate and ethical manner that limits the burden on website owners
and survey respondents to the greatest extent possible’.13 Important elements of this policy are: follow
the established protocols (scraping bots), be transparent and identify yourself, respect the wishes of
the website owner, minimise the burden on websites and ensure that all web scraped data is securely
stored and processed.
If there is a good legal basis and the data are web scraped according to the proposed rules, it is, finally
(third question), important that the data are stored and processed securely and published correctly.
When publishing web scraped data, as with any other statistical data, one has to adhere at all times to
applicable privacy rules. These privacy rules are mainly regulated in the European General Data
Protection Regulation (GDPR14). The GDPR is designed to give individuals greater control over the ways
in which their personal data is collected, stored, transferred and used. Some principles are:
- Legality: organizations must ensure, among other things, that they have a legal basis to process
personal data, and that they process this data in a fair and transparent manner.
- Limited Use: personal data may only be collected for specific, explicit, legitimate purposes.
- Data minimization: data collection should be limited to only those data that are relevant and
necessary for the intended use.
Beside the protection of personal data (including for example the self-employed), these principles can
be supplemented with Article 37 of the CBS-law. This law states15: ‘information shall only be made
public in such a way that no identifiable information about an individual person, household, enterprise
or institution can be derived from it, unless, in the case of information relating to an enterprise or
institution, there is a valid reason to assume that the undertaking or institution concerned has no
objections to the disclosure.’
13 See the draft: https://webgate.ec.europa.eu/fpfis/mwikis/EssNetbigdata/index.php/WPC_EssNet_Webscraping_policy_draft 14 See: https://gdpr-info.eu/ 15 See https://wetten.overheid.nl/BWBR0015926/2019-01-01 (Wet op het Centraal bureau voor de statistiek; in Dutch)

114
4.4. Combining data
Use Case Identification
Use Case ID WPJ.4.EL
Use Case Name Combining data
Date of creation 01.08.2019
Use Case Definition
Description: Exploration of the possibility to use data collected from web portals by
means of web scraping techniques in order to enhance existing tourism
statistics. ELSTAT’s efforts are focused on linking the scraped data to the
survey frame of tourist accommodation statistics (NACE Rev.2 55.1
Hotels and similar establishments) aiming at improving it in terms of
completeness and coverage.
Preconditions: For this case study, the web scraper tool (Hotel_com_v3) developed and
deployed by Statistics Poland under the WPJ has been used. Adaptation
of the web scraper tool to national IT environment was required as well
as access to the population frame for hotels and similar establishments
which includes the relevant establishments registered in the Hellenic
Chamber of Hotels (HCH).
Flow:
1. Pre-processing of the Tourist Accommodation Establishments Register.
2. Pre-processing of the records retrieved from Web scraping.
3. Process of data linking.
4. Evaluation of data linkage.
Issues/Exceptions:
The linking process is hampered by difficulties. Data standardization helps to analyse and use data in
a consistent manner. However, such standardization is difficult for addresses: The plethora of street
names, the existence of streets with more than one name as well as misspellings increase the
complexity of the standardization of addresses.
Output summary:
In the framework of the pilot workpackage, daily web scraping on Hotels.com for the period from
8-8-2019 to 19-9-2019 resulted in 1 110 records with unique establishment id for the NUTS 2 Region
of Attica. These records referred to various types of establishments, while 508 of the afore-mentioned
entries referred to types of accommodation that could be considered relevant to the accommodation
type “hotels and similar establishments” as it is defined for statistical purposes. More specifically, guest
houses, villas, apartments, country houses and other similar establishments were excluded in order to
get the list of 508 entries which were further elaborated.

115
The retrieved establishments were compared to those in the Register of Tourist Accommodation
Establishments, as updated based on the Register of the Hellenic Chamber of Hotels received in
August 2019 (Table 45).
Table 45. Combining web scraped data with the Register of Tourist Accommodation Establishments
Area Attica
Tourism Register 876 unique establishments (665 active)
Web Scraping Hotels.com 508 establishments with unique id
Matches 343
Non-matches 165
Although inactive hotels are excluded from the survey frame, they were considered for the purposes
of this case study, as their status might have changed to active in the meantime, in case they were
temporary closed or under change of ownership.
In order to match a tourist accommodation establishment from the web data to the statistical Register
the fuzzy lookup Add-In was used. The group of identifiers used for the matching were: the postal code,
the title of the hotel and its address. During the preparation phase of scraped data, the “translit”
function was used for standardizing the data by converting all Greek characters to Latin ones. A more
detailed description and the VBA code are presented in the Annex 8 – Process for data linkage.
The similarity percentage of the related records was assumed on 50%, i.e. when result was below 50%,
it was considered as “non-match”, while when it was 50% or above, it was considered as “match”.
Hence, 343 establishments were matched (similarity ranging from 50% to 100%), while 165
establishments were not matched (Table 46).
Table 46. Matched records - results
Similarity percentage range
Number of records
True Positive
False Positive
Matched establishment flagged as inactive in the Register
Cannot be resolved
50%-59% 22 19 2 1
60%-69% 33 29 1 2 1
70%-79% 57 55 2
80%-89% 54 51 1 2
90%-100% 177 174 3
Total units 343 328 4 10 1
Quality of the data linkage process for the resulted 343 matched records were manually cross-checked
(title, location, address) to resolve if it is a True Positive or a False Positive match. The results of the
evaluation process are summarized in the form of a confusion matrix, which is often used when
evaluating the performance of a classification model.
The database of establishments created by data linkage of the web scraped and statistical frame data
is the final output of the methodology for the data linkage process.

116
It was anticipated that matched establishments with similarity percentage below 90% would be mostly
False Positive. However, it turned out that for most of such cases either the address was spelled
differently in the two datasets or the title of the establishment in the web portal included the hotel
chain name as well, i.e. they were True Positive matches. Moreover, in a few cases the address was
missing in the Register, and in a couple of cases the title of the establishment had changed but the
establishment was still registered under the old title in the Register.
Finally, analysis showed that 328 of the 343 matches are True Positive, while 4 are False Positive,
10 seem to be True Positive, but the matched establishment in the Register is flagged inactive, and
1 case could not be resolved.
Additionally, 25 of the 165 non-matches turned out to be False Negative, 4 cases could not be resolved,
while the rest 136 cases are considered presumable as True Negative since no establishment with
a similar title or address occurs in the Register.
Table 47. Confusion Matrix
To sum up, the data linkage of web scraped data for Attica with the relevant hotels in the Register of
Tourist Accommodation establishments, resulted in 493 resolved cases out of 508 cases in total
(97.0%), while 328 out of the 343 establishments that occur in both the web scraping and the Register
were identified (95.6%).
Main conclusions:
• For a significant number of hotels, web scraping can be used to identify the months
of operation of the accommodation, which can be used for assessing or estimating the monthly
occupancy.
• Web scraping could be used to identify latest updates in the Register (new establishments)
before they are made available in administrative data sources.
• In urban areas, the postal code, the address and the title of the accommodation seem to give
information that can be used effectively for matching establishments from web scraping with
those in the Register.
ACTUAL
TOTAL (all
establishments in portals)
MATCH (establishment in web scraping and Tourism
Accommodation Register)
NON MATCH (establishment present in
web scraping only) Total
PR
EDIC
TED
MATCH true matches True Positives (TP)
328 false matches False Positives (FP)
4 332
NON MATCH false non-matches False Negatives (FN)
25 true non-matches True Negatives (TN)
136 161
Total 353 140 493

117
• The NACE classification of the establishments in the web scraping file may not be covered
correctly. Several accommodations that are registered as hotels on the platform, are in fact
other types of accommodation establishments, according to statistical definitions.

118
Use Case Identification
Use Case ID WPJ.4.DE-Hesse
Use Case Name Combining data
Date of creation 30.09.2020
Use Case Definition
Description: A brief description of steps to take for combination of data sources.
Preconditions: None
Flow:
1. Specify goal to achieve with data linkage
a. Identify missing units from one data source
b. Join data sources to enrich information on units present in both data sources
Different goals may require different sources or different matching strategies.
2. Specify costs of misclassifications, i.e. wrong combinations of units from different data
sources. This refers to consequences of false positive combinations or false negative
combinations. Depending on the goal and / or the specific application, costs of misclassification
can be very different.
3. Identify data sources that are available to reach goals from 1). Check definitions and
specifications of the data sources. Specify expected outcome, e.g. overlap of data sources.
4. Identify matching keys needed for combination of data sources from 3). Typically, data sources
at least need some information in common that allow combination on unit level. These may be:
a. unique identifiers (e.g. ID number, tax number, register numbers)
b. non-unique identifiers (names, address information (street name, house number,
postcode, city name).
5. Assess quality of matching keys from 4): do they contain a lot of errors (e.g. typographical
errors, different spellings, missing values, digit transpositions)?
6. Decide on matching strategy, e.g. to combine data sources from 3) using matching keys
from 4): e.g.
a. deterministic matching
b. probabilistic matching.
Matching strategies are not necessarily exclusive. Depending on the specific application,
different strategies may be used jointly or subsequently to combine data sources.
7. After combining data sources, assess quality of the resulting combination manually e.g. on a
subsample. Do results match expectations from 3)? Assess results in the light of 2).
8. Assess the following steps (e.g. further analyses) on robustness for erroneous combinations of
the data sources.
Issues/Exceptions:
Data sources may not available or accessible. There may be legal obstacles for the combination of data
at all or on using the matching keys. There may be no common matching keys or matching keys may
be of poor quality. Combination of data may produce too much false combinations or even few
misclassifications are too costly. Combining data may introduce systematic linkage bias when units
correctly combined (true positives) differ systematically from units that cannot be combined (false
negatives).
Output summary: See deliverable J3 which includes the case study from DE-Hesse.

119
Use Case Identification
Use Case ID WPJ.4.IT
Use Case Name Combining data
Date of creation 10.09.2020
Use Case Definition
Description: Examining the possibility of matching different sources of data: web
scraping and administrative data to complete and enrich information on
accommodation establishments.
Preconditions: IT programmer with knowledge of matching instruments and functions.
Flow:
1. The Directorate for environmental and territorial statistics of ISTAT provided the register of the
accommodation establishments of the Emilia-Romagna Region. This regional archive was
identified as one of the most suitable for the scope, having a good quality in terms of
exhaustiveness and completeness of the information, the complete coincidence between the
register and the results of the Capacity survey, territorial coverage, and good sensitivity of the
regional contacts. Furthermore, Emilia-Romagna is a relevant area of the country in terms of
tourism (for both establishments and tourist flows). The Region has provided this archive to ISTAT
only since 2018, as a consequence of the updating of the national statistical program.
2. Since this was the first time this archive was available, some issues which needed to be clarified
occurred, for instance, the difference between the number of records in the register and the
number of accommodation establishments, because, for the rental accommodation managed as
enterprises, the number of establishments is greater than 1. What is a unique record in the register
(single management of several lodgings) refers to more accommodation establishments in the
area. Moreover, the classification of the “open-air” accommodations and the difference between
the three typologies (campsites, tourist villages and campsites and tourist villages in the mixed
form) was clarified. There are 25 683 establishments in the regional register, of which 9,733
establishments were type C2 “Other private accommodation establishments” (not disseminated
on the ISTAT Data warehouse). For this reason, there are 15 950 accommodation establishments
in the register, referring to 11,526 different records, which represent 7.4% of Italian structures.
3. Some preparatory operations were carried out for the standardization of the text strings, on both
datasets, especially on the name of the hotel, to make them comparable. In particular, isolation
of the name of the structure from the classification attributes (hotel, B&B, others); the breakdown
of the address to the highest possible level of detail (the street, street number, postal code, and
municipality); the elimination of duplicates (the same string of name-province, city, address). The
city and the postal code were extrapolated with a regular expression from the formatted address,
obtained with ArcGIS API. Two different workflows were carried out starting from here, as
described in the following points 4-9 and 10-13.
4. HERE Maps Geographic tool was used for the location (only for scraped structures). The input
expects the following list of fields: UNIT-ID, NAME, CITY, ADDRESS, and POSTAL CODE. The most
relevant output fields of HERE Maps are POSTAL CODE, STATE, STREET, HOUSENUMBER, LATITUDE
and LONGITUDE unpacked on as many different information fields. HERE Maps location was

120
successful on the web scraping archive in 86.6% of structures, being the other cases False Negative
(of which the majority was null).
5. The advantage of having more details in the fields allows us to diversify the types of combinations
and to be able to proceed for subsequent steps by loosening the constraints on the conditions to
obtain a larger number of matches.
6. A unique code has been added to the administrative data archive because the fiscal code is
sometimes duplicated (for units belonging to the same owner); in other cases, it is absent. The
same process was performed on the scraped data.
7. The first comparison was an exact match between two strings on hotel name and postal code. For
them, a matching score of 100% was considered.
8. In the next attempt of comparison Jaro-Winkler similarity was tried, namely a measure of similarity
between two strings. The Jaro measure is the weighted sum of the percentage of matched
characters from each file and transposed characters. Winkler increased this measure for matching
the initial words and then rescaled it by a piecewise function, whose intervals and weights depend
on the type of string (first name, last name, street, and others).
9. Dozens of tests were carried out, without still finding the perfect matching score. The next steps
will be:
repeating the process on the most up-to-date archives;
using ArcGIS software on both sources to format the addresses and extrapolate address,
municipality, postcode, the province on multiple fields (as with HERE Maps);
new matching with Jaro-Winkler storing the results with different scores.
Issues/Exceptions:
HERE Maps tool was also tried to obtain the location of the structures in the regional archive,
but the results were not satisfactory as 40% of cases were False Negative on the province, of
which the majority was null.
Finding the best matching score: if too high, namely more restrictive, the risk is the loss of
information, but if it is too low the wrong data could be compared.
Output summary:
Table 48. Results of matching on 2018/2019 Emilia-Romagna administrative archive (HERE Maps geo-
localization of structures scraped on Booking.com)
Feature Emilia-Romagna Archive Booking.com on Emilia-Romagna
Reference period 2018 19.11.2019/03.12.2019
Survey Population 11 526 structures on 328
municipalities
5 670 on 315 municipalities
(*only 4 109 mapped with HERE Maps)
1-1 matching (Linkage Hotel
name and postal code) 607 (5,2%)(a)
1-1 matching (Linkage Hotel
name, HERE Maps address
with Jaro-Winkler)
Score Jaro-Winkler Hotel name
Score Jaro-Winkler Address
1-1 matching %(a)
80 80 1025 8.9
85 85 242 2.1
(a) On 11 526 records

121
1. ArcGIS was used for the location of structures in both sources. The software returns the formatted
address, the coordinates in terms of latitude-longitude (based on it), and a score of the calculated
coordinates, useful by selecting only the coordinates with the highest score, considered the most
reliable ones.
2. Several attempts of linkage were made: by hotel name and municipality; by formatted hotel name
(upper case, removal of spaces, removal of words classifying the structures like a hotel, room,
camping, farmhouse) and municipality; by formatted address (for multiple ones it matches the
structure name with a tolerance of 1 character); by latitude and longitude coordinates (even in this
case, if there are many structures it matches the structure name with a tolerance of 1). In the latter
attempt, many different distances of tolerance were tried (10, 20, and 30 meters). Every attempt
was numbered and stored in a separate column of the database to trace it and identify the
successful ones for each structure.
3. Evaluation of the candidate's score matching the address. It can be in a range of 0 to 100, in which
100 indicates the candidate is a perfect match.
4. Check of the matchings: some territories were not well covered (under-coverage) by the web
scraping results, so a geographical analysis of the areas covered by web scraping with GIS software
was carried out. Moreover, types of accommodation included and excluded from web scraping
were identified to detect the not satisfactory matches. As a result, three lists of municipalities were
defined to allow the IT experts to refine the criteria for carrying out web scraping. The first list with
low matching coverage, namely with the greater distances between the regional register (higher
values) and the web scraping results (n. 41 municipalities). In the list, there are provincial capitals
(Parma, Piacenza, Reggio Emilia, Modena, Bologna, Ferrara, Ravenna, Rimini) and highly receptive
municipalities (Salsomaggiore Terme, Comacchio, Cervia, Cesenatico, Gatteo, Cattolica, Riccione).
The second list contains those municipalities absent in the web scraping output, although they
have establishments in the regional register (n. 165). In this list, there are also municipalities with
many establishments, as, for instance, Misano Adriatico with 250 units; the third list with the ones
that are present in web scraping but not in the regional register.
Issues/Exceptions:
Cleaning, standardization, formatting address data may be very complex and time-demanding.
The choice of the optimal set of information to carry out the match (matching type) can be difficult.
Finding the best matching score: if too high, namely more restrictive, the risk is the loss of
information, but if it is too low wrong data would be compared. In particular, some cases with a
less precise address, namely countryside areas where farmhouses have not a house number, need
more approximation during the match.
Considering the attempts that maximize the number of matched structures (4 270, referring to the
year 2019) gives a percentage of 1-1 matching of about 33%. Furthermore, further analysis is
needed to count the False Negative and False Positive matches.
Need to obtain data from other portals (international or national ones) to understand the
incidence of the structures present on the web compared with the total.
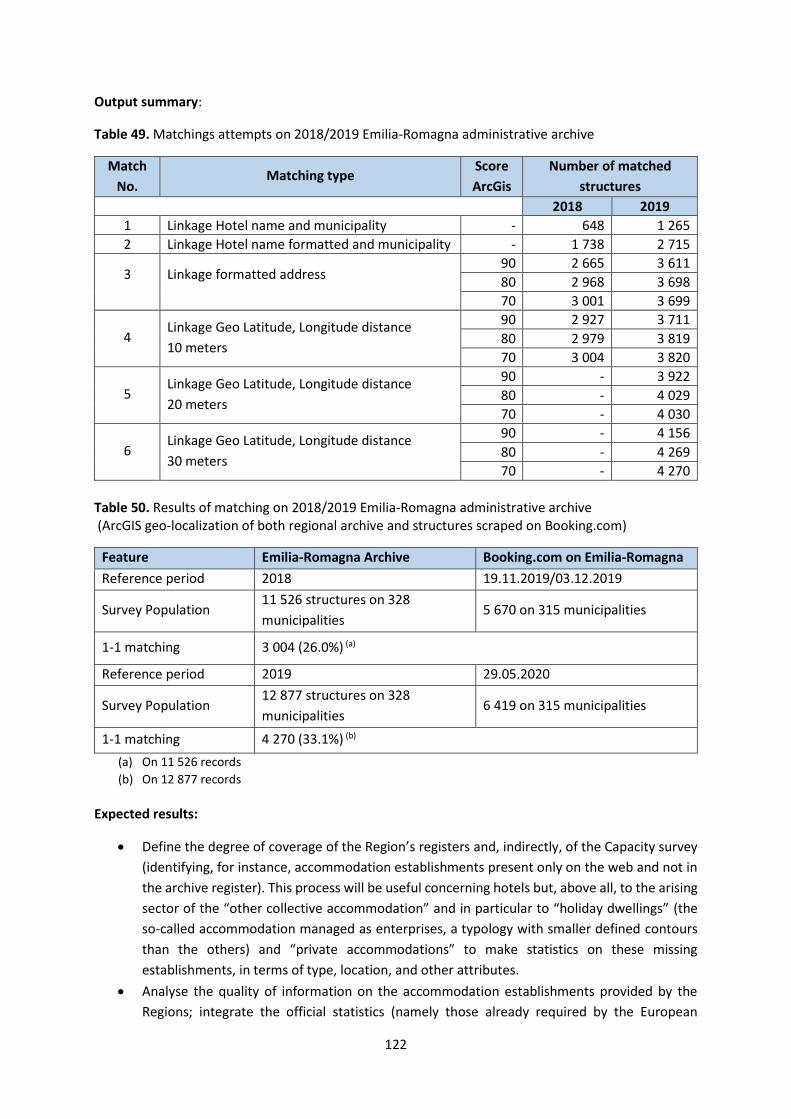
122
Output summary:
Table 49. Matchings attempts on 2018/2019 Emilia-Romagna administrative archive
Match
No. Matching type
Score
ArcGis
Number of matched
structures
2018 2019
1 Linkage Hotel name and municipality - 648 1 265
2 Linkage Hotel name formatted and municipality - 1 738 2 715
3 Linkage formatted address 90 2 665 3 611
80 2 968 3 698
70 3 001 3 699
4 Linkage Geo Latitude, Longitude distance
10 meters
90 2 927 3 711
80 2 979 3 819
70 3 004 3 820
5 Linkage Geo Latitude, Longitude distance
20 meters
90 - 3 922
80 - 4 029
70 - 4 030
6 Linkage Geo Latitude, Longitude distance
30 meters
90 - 4 156
80 - 4 269
70 - 4 270
Table 50. Results of matching on 2018/2019 Emilia-Romagna administrative archive (ArcGIS geo-localization of both regional archive and structures scraped on Booking.com)
Feature Emilia-Romagna Archive Booking.com on Emilia-Romagna
Reference period 2018 19.11.2019/03.12.2019
Survey Population 11 526 structures on 328
municipalities 5 670 on 315 municipalities
1-1 matching 3 004 (26.0%) (a)
Reference period 2019 29.05.2020
Survey Population 12 877 structures on 328
municipalities 6 419 on 315 municipalities
1-1 matching 4 270 (33.1%) (b)
(a) On 11 526 records
(b) On 12 877 records
Expected results:
Define the degree of coverage of the Region’s registers and, indirectly, of the Capacity survey
(identifying, for instance, accommodation establishments present only on the web and not in
the archive register). This process will be useful concerning hotels but, above all, to the arising
sector of the “other collective accommodation” and in particular to “holiday dwellings” (the
so-called accommodation managed as enterprises, a typology with smaller defined contours
than the others) and “private accommodations” to make statistics on these missing
establishments, in terms of type, location, and other attributes.
Analyse the quality of information on the accommodation establishments provided by the
Regions; integrate the official statistics (namely those already required by the European

123
Regulation on tourism statistics/PSN) and collect new variables (like, for instance,
establishments and geographic coordinates) that are present on the web; make statistics on
linked establishments.

124
Use Case Identification
Use Case ID WPJ.4.NL
Use case Name Combining data (Geo tool)
Date of creation 25.11.2019. (Last update 04.12.2019)
Design scope Component from which most specifications are a “black-box” 16.
Use Case Definition
Description Using script geo2.html to convert (map forward and backward) addresses of
accommodations into location data (latitude and longitude coordinates) and to
save the output into (ouputfileWS.csv) to match with Dutch Accommodation
Enterprises Database (based on Hotels.com) over time.
Preconditions 1. User needs some basic knowledge on Excel and CSV files to prepare input
file Establishment by type of accommodation.csv.
2. Developer of geolocation tool requires knowledge on database HERE.
3. Script requires the use of Chrome driver/browser.
4. Script does not require any knowledge on HTML, CSS or Java.
Flow:
1. Click on geo2.html.
2. Check that browser starts.
3. Choose file Establishment by type of accommodation.csv or drop spreadsheet into square
drawn in html. (Message “Starting geolocation for address” will appear).
4. Wait until script runs over the list of addresses provided in the CSV file. (Message: “Finished
processing all addresses”).
5. Location tool will plot green tags ().
6. Check if ouputfileWS.csv is written in hard-disk.
7. Deploy CSV file along with a copy of the geo2.html used during geolocation.
Issues/Exceptions:
1. Geolocation process does not start. Check if Chrome-driver is properly installed.
2. Message “Starting geolocation for address” remains long “on” without saving CSV file.
(Depending on the length of the CSV, the process can take easily a half an hour for two or
three thousand records).
3. Control if geolocation tool output is plotted, i.e. green symbols provide the found
geolocations.
4. If address or postal code are (partially) incomplete, the database delivers outcomes that have
to be checked.
5. If address or postal code are empty, the result is an empty cell.
16 Three hierarchical categories from Cockburn Design scope (sub) system black-box, (sub)system white-box and component are used. [(Cockburn, 2001) “Writing effective use cases. Addison-Wesley. ISBN 0-201-70225-8. OCLC 44046973”].

125
Output summary:
The geolocation tool developed by Statistics Poland provides a very robust tool to find the locations of
large sets of addresses. It was used in the context of Tourism Statistics. But, it can be applied easily for
other purposes, e.g. Museum or Sport Statistics and even more generally to foresee enterprises data
(e.g. Chamber of Commerce) of geolocations. The steps to upload and download data in the
geolocation tool are easy and are depicted in Figure 48.
Last, it was found out that the geolocations provided by the geolocation tool using the database HERE
are proxies of the data available in the Register of Addresses and Building of the Netherlands (BAG).
The BAG provides the geolocation of the building, whereas the geolocation tool (and Hotels.com)
provides the coordinates of the (adjacent) street, as reported in the deliverable J3 of WPJ.
Figure 48. Impression about the upload and download address information in geolocation tool
Step 1
Step 2
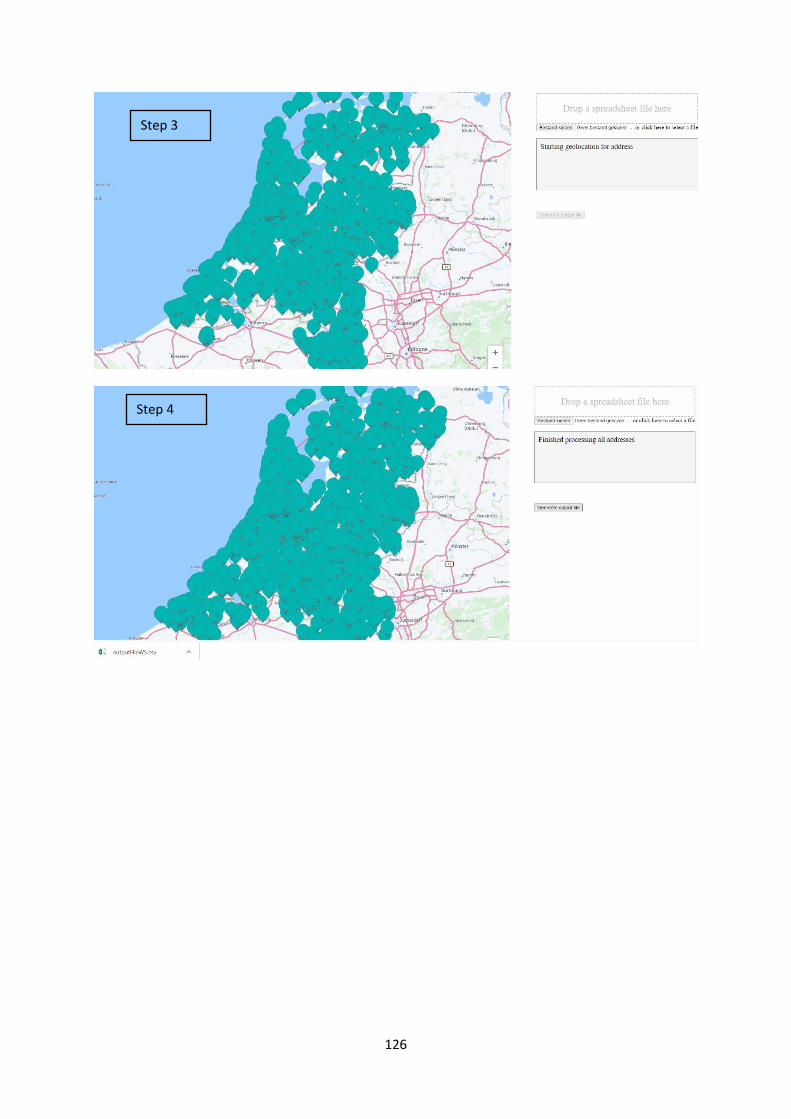
126
Step 3
Step 4

127
Use Case Identification
Use Case ID WPJ.4.PL
Use Case Name Combining data
Date of creation 01.09.2020
Use Case Definition
Description: Methods of combining data from surveys of the occupancy of
accommodation establishments and web scraping of accommodation
portals based on address data and geographical coordinates.
Preconditions: Programming skills in R language and knowledge of text mining
techniques.
Flow:
1. Preparation of two separate databases of accommodation establishments containing address
variables (postal code, city, street, apartment number, etc.) on the basis of the database of
accommodation establishments obtained from the accommodation portal and the database
of the survey population of the tourist accommodation establishments.
2. Assigning geographic coordinates using the HERE Maps API tool for the records from both
databases.
In a situation where it is not possible to obtain geographic coordinates for establishments from
the accommodation portal using the above-mentioned tool (due to an incorrect address or its
lack), the coordinates given in the offer on this portal are assigned - if available.
3. Determining the value of the critical distance - the maximum distance that will be a
determinant for the pairing of establishments.
4. Calculation of the distance matrix using the Haversine or Vincent formula on the basis of
previously obtained geographic coordinates.
5. Pairing the establishments in accordance with the principle that each establishment from the
accommodation portal is assigned to the closest establishment from the statistical surveys,
which is also below the established critical distance.
Issues/Exceptions:
Combining establishments from the population frame of the survey of tourist accommodation
establishments with establishments obtained as a result of the web scraping process of
accommodation portals, based solely on geographic coordinates and distances, is characterized by
a high percentage of incorrectly paired establishments among all paired ones. It is therefore legitimate
to use, in addition to geographical proximity, other available information as an additional matching
criterion.
Output summary:
To combine data on accommodation establishments, population frame of the survey of tourist
accommodation establishments held by official statistics and data obtained from web scraping of the
Hotels.com portal were used. The population frame contained information on 16 407 establishments,
while the web scraping data set included 3 742 accommodation establishments. The geographical
coordinates for both datasets were generated using the HERE MAPS API tool, although for most of the

128
establishments from the second set they were available directly on the Hotels.com portal. This
approach ensured adequate comparability of the resulting coordinates. The pairing was made on the
basis of Vincent’s formula. As a result, 1 719 establishments were paired. On the basis of the error
matrix, a number of indicators were determined. Their definitions and symbols are given in Annex 1 –
Quality indicators of data matching. 94% of the establishments were correctly paired (TP = 774) or
correctly unpaired (TN = 16561). Such high accuracy is the result of a very high value of the second
component (TN). 2 023 establishments obtained from the Hotels.com portal and 14 688
establishments from the survey population were not paired at all.
Table 51. Error matrix for pairing of accommodation establishments
Reality
Pairing No pairing
Prediction
Pairing TP=774 FP=945
No pairing FN=151 TN=16 561
In a situation where the population is unbalanced, other indicators should be used to analyse the
relationship for TP and TN separately. Additionally, it is suggested that the matching method should
have high sensitivity and precision. Then, with high frequency, the paired establishment will be paired
correctly, and the unpaired establishment will be correctly unpaired.
Subsequently, the remaining indicators were determined. The sensitivity index is high and was 0.836,
which means that 83.6% of the establishments that should be paired are paired correctly. On the other
hand, the precision ratio has not reached a high value and was 0.45, which means that out of 925
paired establishments only 45% have been paired correctly. The measure that connects these two
indices (Sensitivity Index and Precision Index) is F1, which is their harmonic mean. F1 was 0.585, which
can be considered a rather low score. The F1 indicator focuses on paired establishments and does not
draw any information about properly unpaired establishments at all. To take this into account, the
Youden index, calculated as the sum of the sensitivity and specificity index minus one, is used. The
Youden index was 0.782 which is quite a high score. The negative prediction value was 0.991, which
means that correctly unpaired establishments were a very large group, among all unpaired
establishments. Moreover, the positive and negative probability factor and a diagnostic chance
quotient were calculated, which were respectively 15.5 (the quotient of TPR and FPR), 0.173
(the quotient of FNR and TNR) and 89.9 (quotient of the positive and negative probability factor).
The experience gained allows to conclude that the pairing of establishments based on geographic
coordinates is a very quick method that does not require standardization of data, but has some
imperfections that one should be aware of. The use of additional information about establishments,
e.g. their names, should be an additional criterion for pairing establishments.

129
Use Case Identification
Use Case ID WPJ.4a.PT
Use Case Name Combining data (geolocation)
Date of creation 01.10.2020
Use Case Definition
Description: Geo locating data from Hotels.com portal and official statistics survey
adds a new important layer of information that can be used, for example,
to link and combine both data sources. Since a key variable does not exist
to link both of them, using a tool to generate coordinates could provide
a viable alternative. Geolocation tool uses address data to attribute
coordinates (latitude and longitude) and that data can be found in both
data sources.
Preconditions: To use the geolocation tool it is necessary to have the output files from
web scraping for the Hotels.com portal. This file does not require any
modification. As for the survey file, it must comply with a simple
structure: variables have to be renamed with specific designations:
unitid, name, city, address and postalCode. Chrome web browser must
be installed.
Flow:
Geolocation tool has a very friendly user interface and allows for drag and drop for one file at a time.
Once the process is complete, the “generate output file” button becomes enabled and by clicking it
produces a CSV file with the results. The process is identical for files from both data sources.
Issues/Exceptions:
Geocoding data from Hotels.com ran without any issues but there was a problem with survey data
(XLSX format). The geolocation tool would crash after some time due to an out of memory related
error. Although the file had a considerable size (1,97MB; 9 341 cases and 20 variables), neither its size
nor the geocoding tool were probably the cause of the crash.
The file original was split in multiple files and the geolocation tool would work on some and would
crash on others. The solution found to overcome this issue was to process the survey data file with
synthetic data so that would become identical in structure and format with the data from web scraping
process (CSV format). In this synthetic file the only real data was the Id and the address provided by
the survey data file. It was then processed without any issues with the geolocation tool.
Output summary:
The geolocation tool provided latitude and longitude for 63.5% (n=7 743) of the scraped file. For the
remaining cases missing coordinates, Openstreetmap Nominatin was used to complement that
information. This approach only geo located about 20% of that missing data. Since these were not
encouraging results and Nominatim usage policy is somewhat restrict, this approach was abandoned
and its results discarded for the present use case.

130
As for the survey data file, the geolocation tool provided coordinates for 86.3% (n=8 092). The
difference for the percentage of coordinates attributed to the cases for both data sources is most likely
to be related to the quality of the data itself.

131
Use Case Identification
Use Case ID WPJ.4b.PT
Use Case Name Combining data
Date of creation 01.10.2020
Use Case Definition
Description: Scraped data from Hotels.com portal has a high potential to improve
survey accommodation base used for official statistics. Available data for
matching is already present in both data sources, namely name of
accommodations, address and postal code. Additional data (coordinates)
was added using geo tool. Methods chosen to link data were matching
1-1 and string distance matching.
Preconditions: This use case is preceded by use case WPJ.1.PT (web scraping) and use
case WPJ.4a.PT (geolocation) as well the availability of a survey data base
on tourist accommodations.
Flow:
The flow for this use case comprehends prioritization of data, linking data, matching string of distance
and coordinates.
1. Prioritize reference data
Data from Hotels.com was collected for the 308 municipalities found in Portugal mainland and Madeira
and Azores Archipelagos. These data collection criteria returned an extensive amount of data. In order
to better control the results of combining data from web scraping and survey data, both data sources
were prioritized by common criteria of accommodation type and territorial scope.
Hotels.com data was filtered using accommodation type: “Hotel”, “Apart-Hotel” and “Pousada”.
Survey data was also filtered with equivalent criteria. For this purpose, CAE-Rev.3 classification
(national classification for economic activities) that is NACE-Rev.2 equivalent up to four digits with an
added fifth digit for increased detail and adaptability to the national context, was used. The selected
accommodations were classified by the following CAE-Rev3 codes:
55111 Hotel with restaurant
55121 Hotel without restaurant
55114 Pousadas
55116 Apart-Hotel with restaurant
As for territorial scope, data concerns only Portugal Mainland (both Madeira and Azores Archipelagos
being excluded from the present case).
As a result, web scraped data from Hotels.com was reduced to 1 856 distinct hotelId and survey data
to 1 474 accommodations. These subset of data sources will be referred to as reference data as
opposing to complete data.

132
2. Linking web scraped data to survey data by Name and Postal Code and Locality
Approximate string matching of data from Hotels.com and survey data was performed with preceding
a basic text mining approach. Accommodation names and addresses were standardized and a curated
stop words list was used. An additional step was then undertaken and addresses were also
standardized with a special focus on name places and common abbreviations. The importance of data
cleaning and standardization for such a task as this one of combining data sources cannot be stressed
enough. Naturally, the same procedures were applied in both data sources.
For string matching, a string distance that computes the number of operations such as substitution,
deletion, insertion or transposition of characters needed to turn one string in another was used. In this
case Optimal String Alignment distance (OSA) was chosen which is similar to the Levenshtein distance
but allows transposition of adjacent characters. Each substring may be edited only once. This method
is available in Mark P.J. van der Loo’s strindist R package.
Matching by string distance was then performed by concatenating accommodation name, postal code
and locality. Duplicated strings were removed if any resulted from this concatenation. Results up to
a string distance of 3 OSA are presented in Table 52.
Table 52. Match by name, postal code and locality (OSA <= 3)
osa n percent
0 458 72.2
1 70 11.0
2 52 8.2
3 54 8.5
Total 634 100.0
Exact matching (OSA = 0) accounts for 458 cases which is about 25% of the 1 856 cases available for
Hotels.com reference data. Matching by string distance added another 176 cases. All the 634 cases
were then manually validated cross referencing complete available address and geolocation data. This
validation confirmed that all the 634 cases were True Positives (TP).
In conclusion, string distance linkage from Hotels.com data to survey data, using Name and complete
Postal Code and Locality with a threshold of up to 3 OSA allows a 34.2% match and a precision of 117.
3. Linking web scraped data to survey data by Name, Postal Code (4 digits) and Locality
Postal codes are updated with some regularity and new ones are created, hence there are examples
of outdated postal codes that were not updated in some sources (Hotels.com, e.g.). Complete postal
code is composed by a series of 4 plus 3 digits separated by a hyphen (0000-000) but it is not rare to
find only the first 4 digits. Furthermore most of the changes are made to the last 3 digits so data linkage
using complete postal code (7 digits) will always be challenging.
17 𝑃𝑟𝑒𝑐𝑖𝑠𝑖𝑜𝑛 =
𝑇𝑃
𝑇𝑃+𝐹𝑃
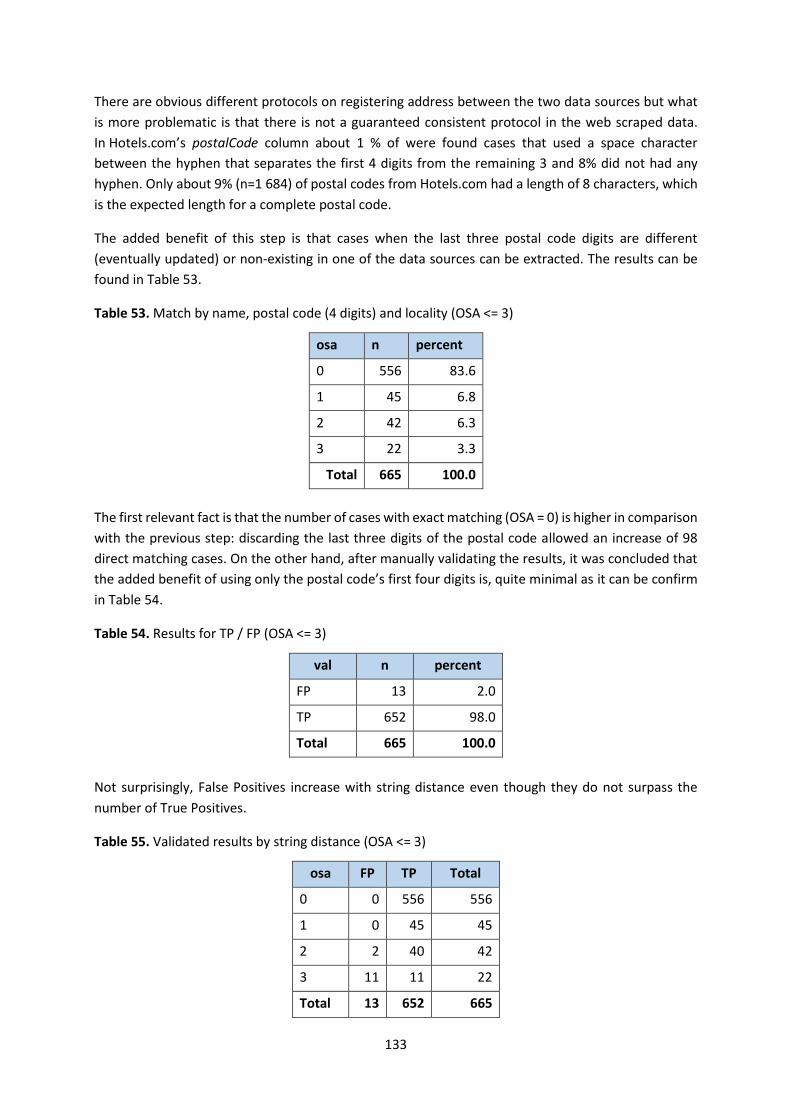
133
There are obvious different protocols on registering address between the two data sources but what
is more problematic is that there is not a guaranteed consistent protocol in the web scraped data.
In Hotels.com’s postalCode column about 1 % of were found cases that used a space character
between the hyphen that separates the first 4 digits from the remaining 3 and 8% did not had any
hyphen. Only about 9% (n=1 684) of postal codes from Hotels.com had a length of 8 characters, which
is the expected length for a complete postal code.
The added benefit of this step is that cases when the last three postal code digits are different
(eventually updated) or non-existing in one of the data sources can be extracted. The results can be
found in Table 53.
Table 53. Match by name, postal code (4 digits) and locality (OSA <= 3)
osa n percent
0 556 83.6
1 45 6.8
2 42 6.3
3 22 3.3
Total 665 100.0
The first relevant fact is that the number of cases with exact matching (OSA = 0) is higher in comparison
with the previous step: discarding the last three digits of the postal code allowed an increase of 98
direct matching cases. On the other hand, after manually validating the results, it was concluded that
the added benefit of using only the postal code’s first four digits is, quite minimal as it can be confirm
in Table 54.
Table 54. Results for TP / FP (OSA <= 3)
val n percent
FP 13 2.0
TP 652 98.0
Total 665 100.0
Not surprisingly, False Positives increase with string distance even though they do not surpass the
number of True Positives.
Table 55. Validated results by string distance (OSA <= 3)
osa FP TP Total
0 0 556 556
1 0 45 45
2 2 40 42
3 11 11 22
Total 13 652 665
134
Below some examples of strings from Hotels.com and survey data that are False Positives and have an
OSA string distance of 3 can be found:
“soria 1250 lisboa” VS “florida 1250 lisboa”
“patria 1050 lisboa” VS “italia 1050 lisboa”
“flor baixa 1100 lisboa” VS “lis baixa 1100 lisboa”
In conclusion, string distance linkage from Hotels.com data to survey data, with a threshold of up to
3 OSA allows a 35.1% match with a Precision of 0.98.
4. Linking web scraped data to survey data by Latitude and Longitude
Geocoding data (latitude and longitude) from Hotels.com and survey data was provided by the
geolocation tool developed by the Polish Team and it was described in use case WPJ.4a.PT. The process
of attributing coordinates uses address information so better results are expected when protocol used
to register addresses is stricter. Additionally addresses from hotel accommodations like the ones used
in this use case’s reference data are more likely to have complete and accurate addresses than, for
example, tourist apartments.
Geolocation tool provided coordinates for 90.2% of cases (n=1 329) from a total of 1 474 in survey
data. The equivalent Hotels.com data is higher: geolocation tool provided coordinates for 96.2% of the
cases (n=1 785) from a total of 1 856. However, these include duplicate values, that is, duplicate
coordinates for different accommodations. Once again, this would be expected in the case of tourist
apartments or bed & breakfast accommodations (one or more can share the same building) but not
quite so in hotel equivalent touristic accommodations. Once these duplicates coordinates are removed
84.7% (n=1 248) of unique coordinates were found in survey data and 85.2% (n=1 581) in Hotels.com.
Following this data cleaning process and using latitude and longitude, it was possible to direct match
635 accommodations from Hotels.com and survey data. These results were manually validated by
cross referencing name and address: 8 cases turned out to be False Positives.
Table 56. Linking web data to survey data by Latitude and Longitude: Results for TP/FP
val n percent
FP 8 1.3
TP 627 98.7
In conclusion, direct match from Hotels.com data to survey data with coordinates allows a 33.8%
match with a Precision of 0.99.
Issues/Exceptions:
Duplicates strings resulted from data cleaning or concatenation of values to be matched (when
concatenating, for example, name + postal code + locality) are not contemplated in this method.
A significant amount of data is still yet to be determined as False Positive or False Negatives.

135
Output summary:
Approximate string matching web scraped data to survey data using accommodation name, postal
code (either with 7 or 4 digits) and locality within Optimal String Alignment (OSA) distance of up to 3,
proved to be solid method for combining data.
Direct matching with coordinates provided by geolocation tool has different but equivalent results in
terms of number of matches.
Both methods for combining data result in matching over 30% of Hotels.com accommodations with
very high Precision values. When comparing both methods, one finds that there are 386
accommodations that match both with string distance and coordinate.
Table 57. Comparing results from string distance and coordinates
Direct match by coordinates
Match by string distance FP TP NA Total
FP 1 2 10 13
TP 1 386 265 652
NA 6 239 946 1 191
Total 8 627 1 221 1 856
When combining both approaches it is possible to match 890 accommodations, which represent 48%
of Hotels.com cases. Although this is not a very high matching rate, this approach guarantees a low
number of False Positive, therefore a very high precision value.

136
Use Case Identification
Use Case ID WPJ.4.SK
Use Case Name Combining data
Date of creation 06.10.2020
Use Case Definition
Description: Use of web scraped data for the purpose of survey frame update.
Preconditions: At least one daily file of web scraped data from one or various portals. In
case of a longer series of scraped data file with unique accommodation
establishments would be needed.
Flow:
Hotels.com and Booking.com reservation portals were scraped, as these were equipped with the
programmes for scraping from the Polish team. Despite lower preference of Hotels.com in Slovakia,
Booking.com portal is a clear leader and thus can provide most exhaustive information for a possibility
of a survey frame update. There are also other booking portals in Slovakia, e.g. Megaubytovanie.sk,
offering domestic accommodations, but they were not scraped due to the technical limitations and
lack of expertise in this field.
Data scraped from Hotels.com covered 608 unique accommodations, whereas data from Booking.com
covered 5 253 accommodations. Considering the size of Slovakian survey frame, which consists of
5 930 unique records (as of 31.12.2019), it was decided to use the Booking.com data within this case
study.
First of all, GPS coordinates were imputed (longitude and latitude) into the survey frame file. HERE
Maps API tool prepared by the Polish team was used. When comparing with another similar tools, this
one performed better and reached higher precision of localized addresses. Majority of them were
designated precisely, some of them were not exactly found and thus replaced by a street or even city
centre and some of them were totally bypassed. The Table 58 illustrates the results of this procedure.
Table 58. Results of imputing GPS coordinates to the survey frame
Number of records 5 930
Uniquely localized 4 440
Not localized at all 104
Repeated coordinates (city centres, street centres) 1 386
The frame that was used do not theoretically cover the whole base of scraped data. There are two
main reasons for it – first, the frame was lastly updated on 31 December 2019, there can be new
accommodation establishments already active on reservation portals and second, there are many
physical persons offering an accommodation establishment at web portals, which are not part of the
survey frame. Nevertheless, after the identification of units not covered by the frame, these can be
further filtered and only those relevant for the survey further processed.
There was a major difference between data from Hotels.com and Booking.com. Whereas Booking.com
data were more exhaustive in terms of volume, Hotels.com were enriched by the addresses of

137
accommodations. These can bring another important information into the linking process, as many of
the GPS coordinates in the frame are not unambiguously and precisely assigned. On the other hand,
due to the tight coverage of the Hotels.com data it was decided to use the Booking.com data for the
sake of this use case. There are three linking criteria – municipality, name of the accommodation and
the distance.
There is one crucial issue when it comes to the distances between establishments – they do not
perfectly match. Coordinates imputed with HERE Maps API can be, in some cases, significantly different
to those used by Hotels.com or Booking.com data. On the reservation portals they are usually pointing
at the access road or at the front of a building, whereas coordinates in the survey are stuck to a building
itself, which can cause various distances. They can be calculated e.g. by the Haversine formula. The
following picture illustrates the difference between the frame and Hotels.com coordinates.
Figure 49. Coordinates in the frame (left) and on the Hotels.com (right)
Taking into consideration that a large part of the survey coordinates points at some city or street
centres, using only distances as a linking criterion can cause many false matches (False Positives). This
problem can be solved by the use of addresses, when an accommodation is linked by a similarity in the
name, within a similar street name and city. Similarity can be calculated by e.g. Jaro-Winkler formula,
which measures distances between string and usually yields satisfying results. However, in
Booking.com data there are no addresses available distances and establishment names within
a specific municipality were used.
The linking procedure is as follows:
Identification of the municipality names and their standardization in both Booking.com and survey
frame files, in order to have a stable blocking structure. Two accommodations can be linked only
if they are within the same municipality.
Cleaning and standardization of the accommodation names – each put to lower case, any
punctuation omitted, key words like apartment, hotel, pension, chateau, etc. deleted. Otherwise,
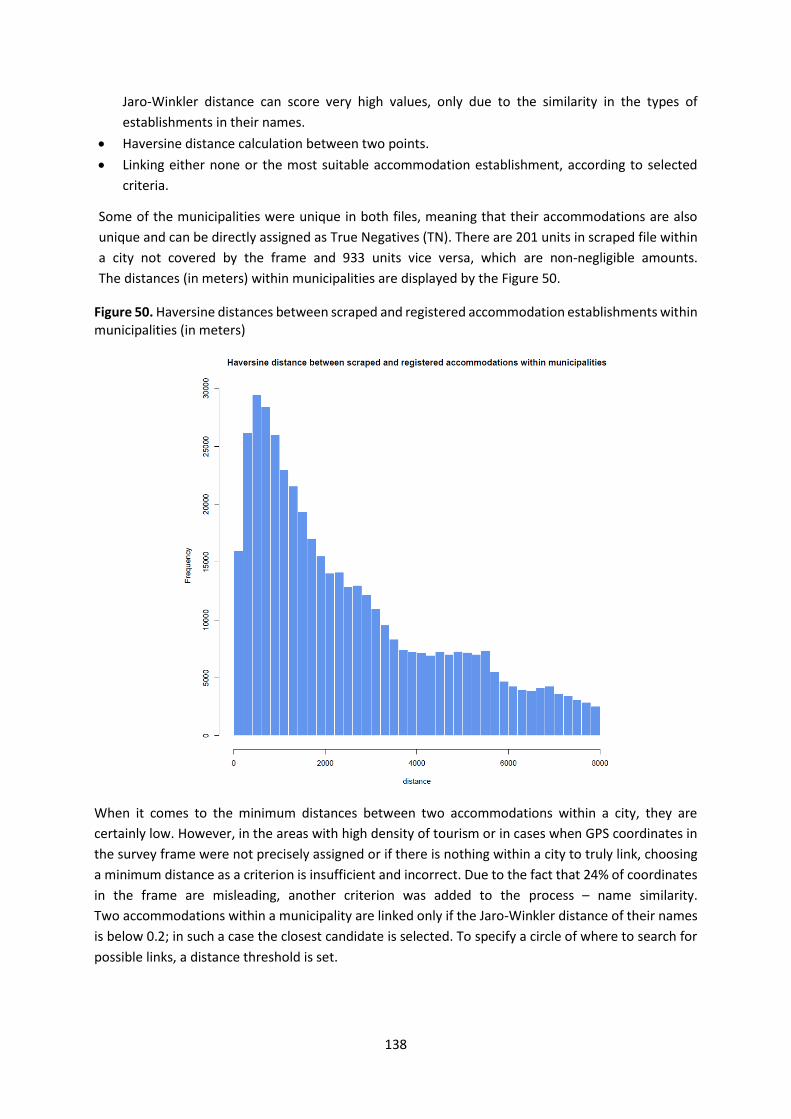
138
Jaro-Winkler distance can score very high values, only due to the similarity in the types of
establishments in their names.
Haversine distance calculation between two points.
Linking either none or the most suitable accommodation establishment, according to selected
criteria.
Some of the municipalities were unique in both files, meaning that their accommodations are also
unique and can be directly assigned as True Negatives (TN). There are 201 units in scraped file within
a city not covered by the frame and 933 units vice versa, which are non-negligible amounts.
The distances (in meters) within municipalities are displayed by the Figure 50.
Figure 50. Haversine distances between scraped and registered accommodation establishments within municipalities (in meters)
When it comes to the minimum distances between two accommodations within a city, they are
certainly low. However, in the areas with high density of tourism or in cases when GPS coordinates in
the survey frame were not precisely assigned or if there is nothing within a city to truly link, choosing
a minimum distance as a criterion is insufficient and incorrect. Due to the fact that 24% of coordinates
in the frame are misleading, another criterion was added to the process – name similarity.
Two accommodations within a municipality are linked only if the Jaro-Winkler distance of their names
is below 0.2; in such a case the closest candidate is selected. To specify a circle of where to search for
possible links, a distance threshold is set.

139
Figure 51. Minimum Haversine distance between scraped and registered accommodation establishments within municipalities.
Several threshold settings were tested – 30, 50, 70, 100, 200 and 500 meters. Each time a random
sample was selected from the linked database, which was used for a clerical review in order to assess
the links with respect to the real status. The following confusion matrix (from the point of view of the
scraped data) was considered.
The following confusion matrices relate to the different threshold settings. Since the linked files were
reviewed only as random samples, values in the matrices are just in the form of estimates of real
values.
Table 59. Confusion matrix for the threshold of 30 meters
Threshold = 30 m Actual
Matched Not matched
Predicted Positive 45 0
Negative 45 163
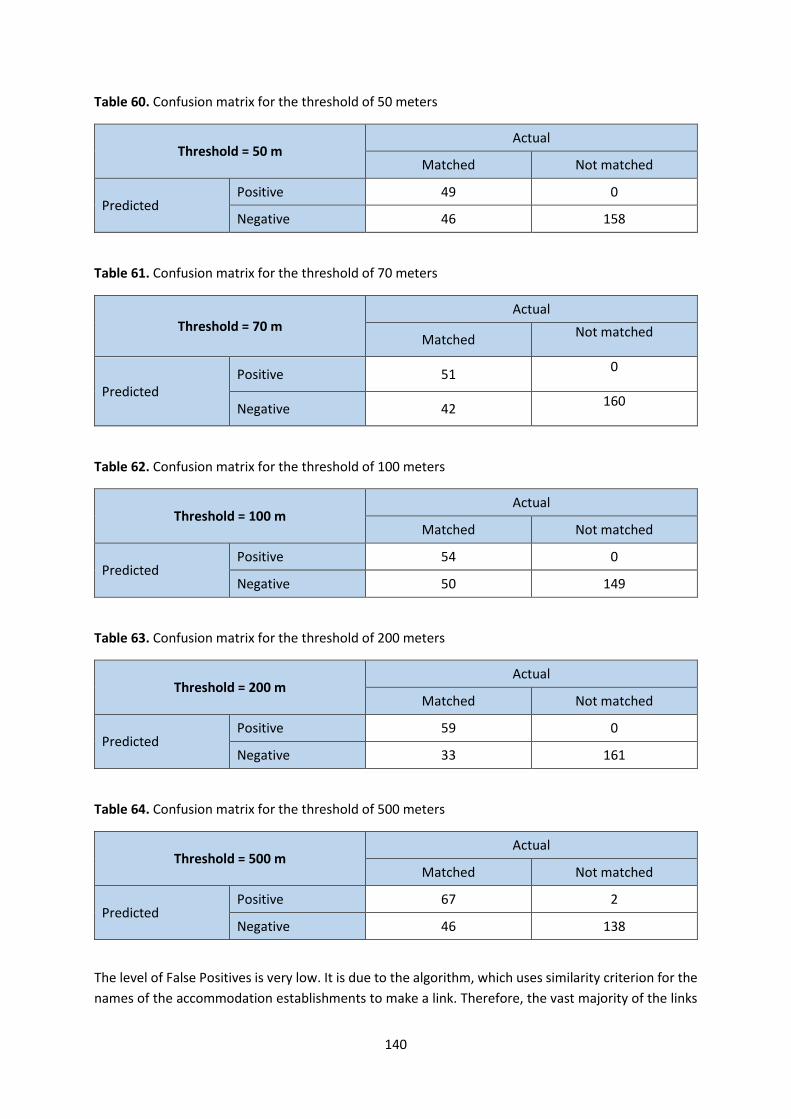
140
Table 60. Confusion matrix for the threshold of 50 meters
Threshold = 50 m Actual
Matched Not matched
Predicted Positive 49 0
Negative 46 158
Table 61. Confusion matrix for the threshold of 70 meters
Threshold = 70 m Actual
Matched Not matched
Predicted Positive 51
0
Negative 42 160
Table 62. Confusion matrix for the threshold of 100 meters
Threshold = 100 m Actual
Matched Not matched
Predicted Positive 54 0
Negative 50 149
Table 63. Confusion matrix for the threshold of 200 meters
Threshold = 200 m Actual
Matched Not matched
Predicted Positive 59 0
Negative 33 161
Table 64. Confusion matrix for the threshold of 500 meters
Threshold = 500 m Actual
Matched Not matched
Predicted Positive 67 2
Negative 46 138
The level of False Positives is very low. It is due to the algorithm, which uses similarity criterion for the
names of the accommodation establishments to make a link. Therefore, the vast majority of the links

141
that are made are True Positives. On one hand, it increases the quality of the links made, on the other
it also increases the level of negatives – not only True Negatives but also False Negatives (missed links).
For the purposes of the survey frame update mainly negatives are of interest (in contrast to the usual
focus on the positives). What needs to be maximized is the quality of True Negatives by decreasing the
number of False Negatives and False Positives, as they both cause a loss of possible candidates for a
frame update. It should be noted that with the use of scraped data units from the frame cannot be
deleted as they have no obligation to advertise themselves on the Internet and also due to
considerable inaccuracy of the linking procedure. Units that are found in the data and are not part of
the frame can be further examined and just after that added to the database. Linking can give some
advice on which units to check for update but cannot be used as an automatic process, as survey frame
contains many information that cannot be scraped from the Internet. Strict linking rules yield many
negatives, when only perfect matches are taken into account. In such a case the set of negatives would
contain significant ratio of False Negatives, which would require manual review. On the other hand,
relaxed rules lead to smaller group of negatives and thus fewer manual examination but tend to
increase False Positives, which absorb some truly unmatchable units that should be subject of the
frame update.
Based on the confusion matrices the following characteristics can be calculated.
Table 65. Calculations of precision, sensitivity, specificity and accuracy
Threshold Precision Sensitivity Specificity Accuracy
30 m 1 0.5 1 0.82
50 m 1 0.52 1 0.82
70 m 1 0.55 1 0.83
100 m 1 0.52 1 0.8
200 m 1 0.64 1 0.87
500 m 0.97 0.6 0.99 0.81
In order not to miss out any possible candidate for the frame update it was decided to include also
name comparison, which resulted in extremely high precision for any threshold. Only justifiable units
are linked and other left for manual checking, there is no need to link accommodations with different
names (Jaro-Winkler of 0.2 is rather loose). Regarding our findings, a circle with 70 m radius was used
to search for establishments. The survey frame units with wrongly assigned coordinates would not be
reachable with even higher threshold, on the contrary, as much False Positives as possible were
avoided.
A preparation of a similar study was made, but without considering the accommodation
establishments names. A threshold of 70 metres was used, where the nearest establishment was
linked (if any within the circle). The confusion matrix is as follows.

142
Table 66. Confusion matrix for the threshold of 70 meters
Threshold = 70 m Without names
Actual
Match Do not match
Predicted Positive 68 56
Negative 31 97
It is obvious that the values changed a lot. On one hand, the number of True Positives raised, as there
were no further obstacles. On the other, the number of False Positives increased dramatically, which
could cause a loss of possible newly established accommodations. The group of negatives, set for
further examination, is now smaller. Under these findings, it was preferred to incorporate also the
names into the process, maybe with higher value of Jaro-Winkler distance.
Issues/Exceptions:
The use of Hotels.com data with addresses is also subject of further analysis, when the street names
and house numbers can be used instead of GPS coordinates. A higher sensitivity is expected.
Output summary:
Booking.com data were used for the study on the survey frame update. They outperform the
Hotels.com in terms of volume and GPS precision. IT was proved that it can be used to point out
possible units that can be further manually checked for the possibility to be added to the frame.
However, relatively high level of inaccuracy of the linking procedure avoids the automatic use of the
whole process at the moment.
143
4.5. Spatial-temporal disaggregation of data
Use Case Identification
Use Case ID WPJ.5.NL
Use Case Name Spatial-temporal disaggregation of data
Date of creation 20.08.2020. (Last update 02.10.2020)
Design scope (Sub-)system from which most specifications are a “black-box”18.
Use Case Definition
Description Using web scraped data from Hotels.com to disaggregate monthly survey data
on number of tourists to smaller timescales.
Preconditions Web scraped data from Hotels.com is available for several months. Survey
data for several months is available.
Flow:
Data on number of tourists staying at hotels is available through the tourism survey. This survey
however is conducted on a monthly basis and does not tell how the tourists were distributed within
this month. One might expect relatively large numbers of tourists during weekends or specific holidays.
Statistics Poland provided an R script to disaggregate the monthly survey data to daily data, using the
data web scraped on a daily basis from Hotels.com. It was adapted for use in Statistics Netherlands.
Adapting was mostly just pointing the script to the right data.
The provided script was firstly ran using input data from Poland, then with own data on Amsterdam.
The script outputs a data file. The output data from the script was visualised in graphs, see the example
below.
18 Three hierarchical categories from Cockburn Design scope (sub)system black-box, (sub)system white-box and component were used. [Cockburn (2001), “Writing effective use cases. Addison-Wesley. ISBN 0-201-70225-8. OCLC 44046973”].

144
Figure 52. The script output data for nights spent in the tourist accommodation establishments in Amsterdam
The peaks that are clearly visible occur on Fridays. These could be people booking a weekend in
Amsterdam.
The disaggregated data shows a very low point on November 17th. This corresponds with a very high
number of offers in the web scraping data for that day. The reason why there were so many offers that
day is unknown.
The output of the script should give daily values for number of guests and overnight stays, both for
domestic and foreign tourists. In the output data, for some variables, the value is the same for every
day, see the Table 67. This also occurred when the input data from Poland was used, but in that case
it was a different set of variables being the same. The auxiliary file on R2 shows a zero for these
variables.
Table 67. The script output data with the same value for certain variables
0
10
20
30
40
50
60
70
80
90
2019-08-01 2019-09-01 2019-10-01 2019-11-01 2019-12-01 2020-01-01 2020-02-01
Amsterdam - nights

145
New script
Statistics Poland has provided a new version of the R script in July 2020. This script was again tested
with own input data.
The new version of the script can use several different methods for the disaggregation (LASSO, log-
linear, ridge and shrinkage). It also offers a choice of using mean price, number of offers, available
supply, or a combination of these, from the web scraping data.
All different methods were tested. A small piece of code to loop over the different methods, using the
same input data, and to create graphs for each one was written by Statistics Netherlands.
To visualise the weekend effect, the Fridays were highlighted in red in the graphs.
The problem with some variables not varying on a daily basis is fixed in this new script.
The LASSO method creates output that is similar to that from the old script, when used with the
number of offers and mean price as input. When the supply is also included, something strange
happens: in the first half of the time series the data seems inverted. Instead of peaks on Fridays, very
low values can be seen on Fridays. From roughly November onward, the situation is ‘normal’ again.
Figure 53. Output of the Lasso method for number of offers and mean price
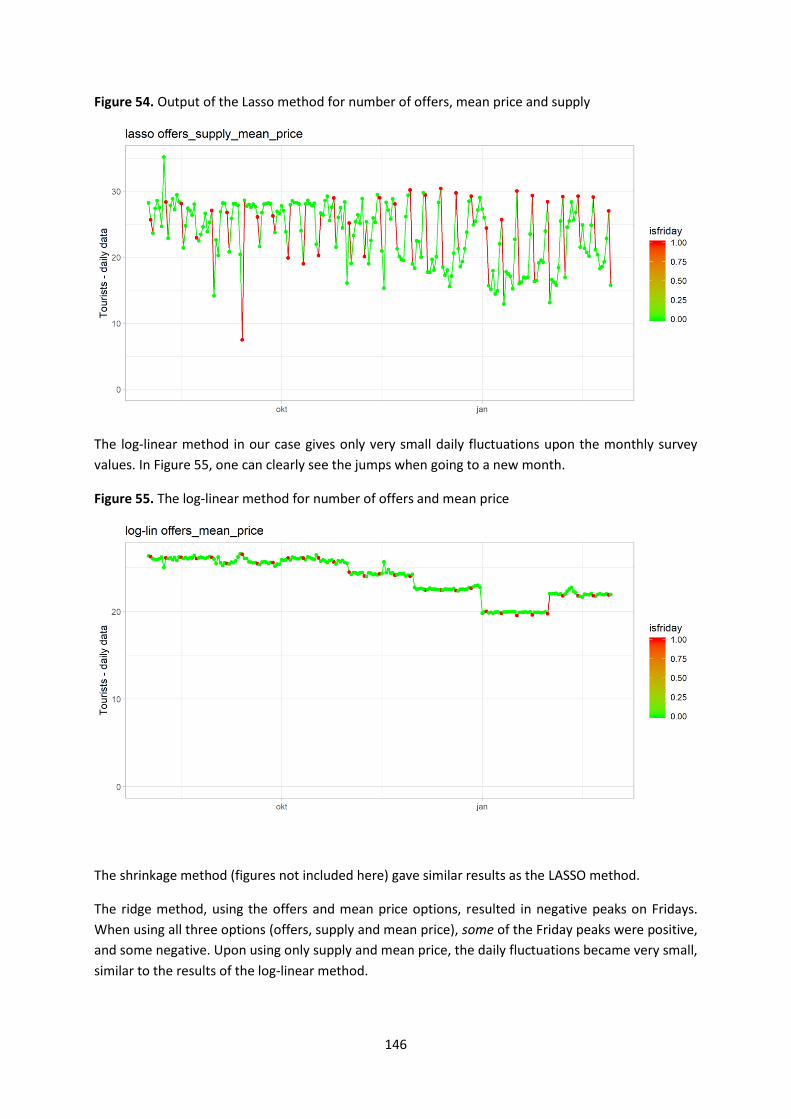
146
Figure 54. Output of the Lasso method for number of offers, mean price and supply
The log-linear method in our case gives only very small daily fluctuations upon the monthly survey
values. In Figure 55, one can clearly see the jumps when going to a new month.
Figure 55. The log-linear method for number of offers and mean price
The shrinkage method (figures not included here) gave similar results as the LASSO method.
The ridge method, using the offers and mean price options, resulted in negative peaks on Fridays.
When using all three options (offers, supply and mean price), some of the Friday peaks were positive,
and some negative. Upon using only supply and mean price, the daily fluctuations became very small,
similar to the results of the log-linear method.
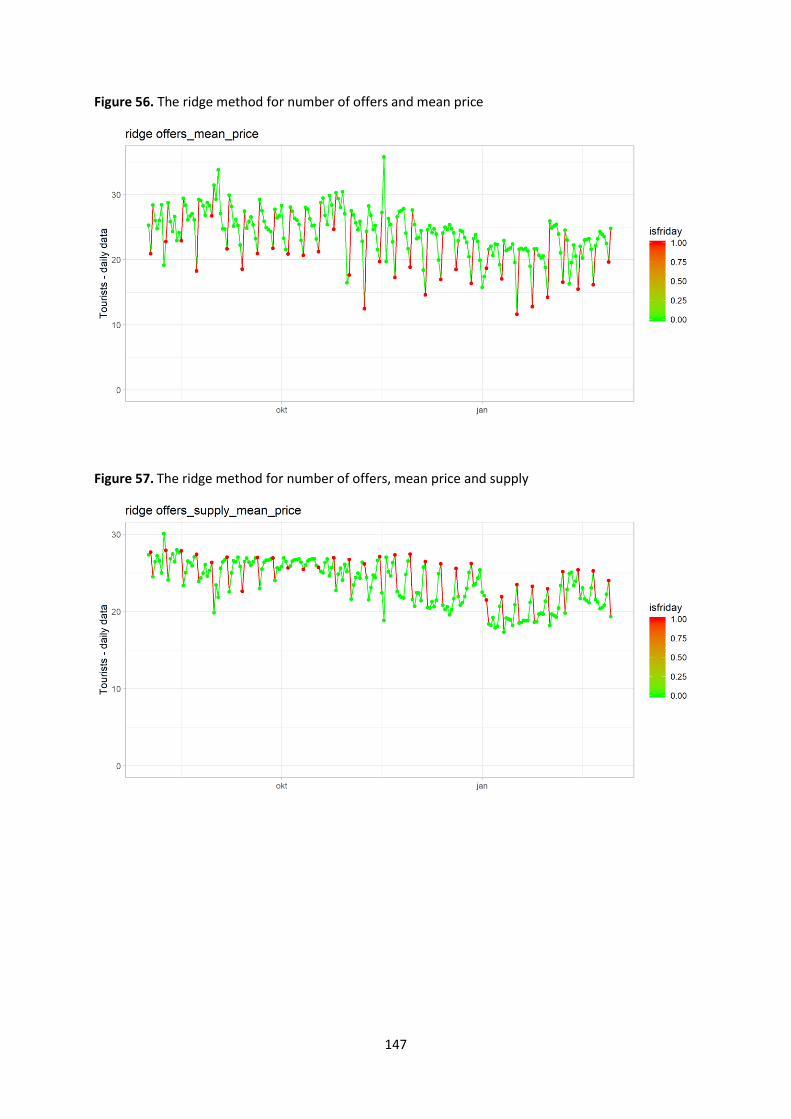
147
Figure 56. The ridge method for number of offers and mean price
Figure 57. The ridge method for number of offers, mean price and supply
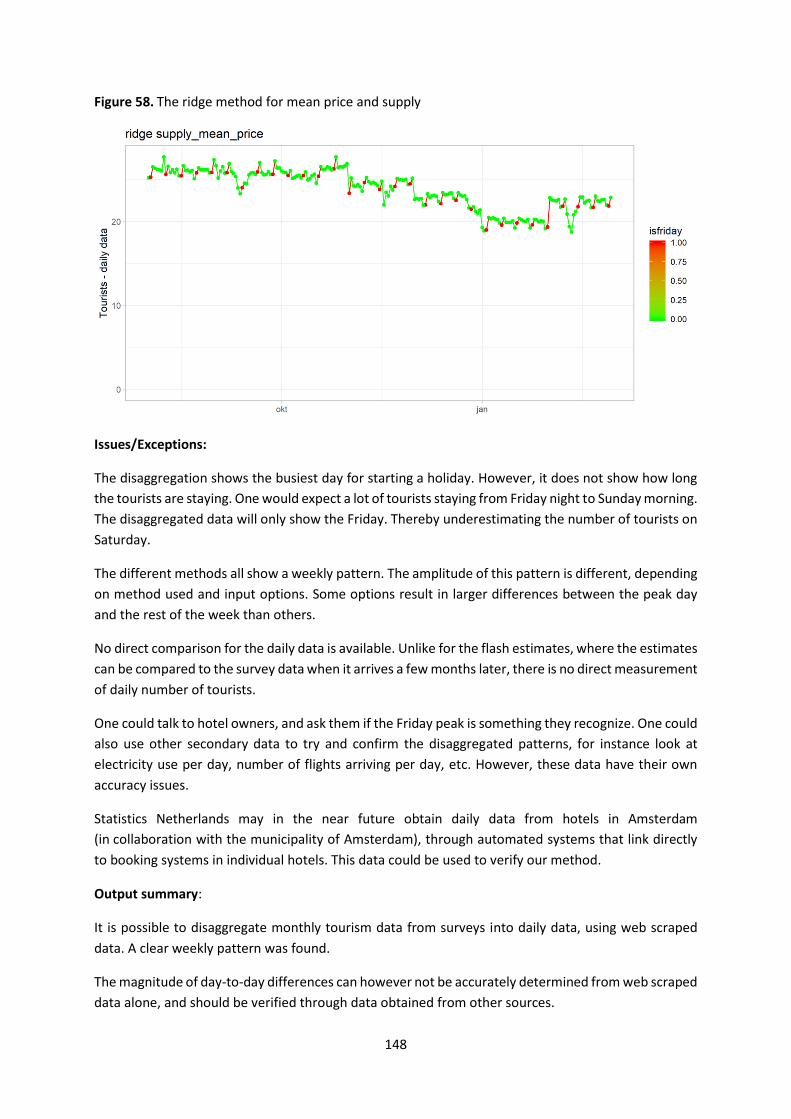
148
Figure 58. The ridge method for mean price and supply
Issues/Exceptions:
The disaggregation shows the busiest day for starting a holiday. However, it does not show how long
the tourists are staying. One would expect a lot of tourists staying from Friday night to Sunday morning.
The disaggregated data will only show the Friday. Thereby underestimating the number of tourists on
Saturday.
The different methods all show a weekly pattern. The amplitude of this pattern is different, depending
on method used and input options. Some options result in larger differences between the peak day
and the rest of the week than others.
No direct comparison for the daily data is available. Unlike for the flash estimates, where the estimates
can be compared to the survey data when it arrives a few months later, there is no direct measurement
of daily number of tourists.
One could talk to hotel owners, and ask them if the Friday peak is something they recognize. One could
also use other secondary data to try and confirm the disaggregated patterns, for instance look at
electricity use per day, number of flights arriving per day, etc. However, these data have their own
accuracy issues.
Statistics Netherlands may in the near future obtain daily data from hotels in Amsterdam
(in collaboration with the municipality of Amsterdam), through automated systems that link directly
to booking systems in individual hotels. This data could be used to verify our method.
Output summary:
It is possible to disaggregate monthly tourism data from surveys into daily data, using web scraped
data. A clear weekly pattern was found.
The magnitude of day-to-day differences can however not be accurately determined from web scraped
data alone, and should be verified through data obtained from other sources.

149
Use Case Identification
Use Case ID WPJ.5.PL
Use Case Name Spatial-temporal disaggregation of data
Date of creation 01.09.2020
Use Case Definition
Description: Temporal disaggregation of the monthly data on the occupancy of
accommodation establishments into daily data.
Preconditions: Basic knowledge of programming in R language
Flow:
1. Preparation of monthly time series from the survey on the occupancy of accommodation
establishments and daily time series of statistics from the accommodation portal.
2. Construction of a regression model for monthly data using the Classic Least Square Method or
the Generalised Least Square Method.
3. Benchmarking of preliminary daily results to known monthly values.
Issues/Exceptions:
The time series of the daily statistics from the accommodation portal must be complete. Gaps in daily
data must be imputed.
Output summary:
Two data sources are used in temporal disaggregation: low-frequency data, which must be
disaggregated, and high-frequency data containing auxiliary variables. In the case of disaggregation of
data on the use of the accommodation establishments, these data include:
data from the web scraping of accommodation portals,
data from statistical surveys on the occupancy of accommodation establishments.
This use case was prepared on the basis of data concerning two regions at NUTS 2 level and six
variables: tourists and overnight stays in total and divided into Poles and foreigners. The first region
(Mazowieckie Voivodship) can be considered as a tourist region because it has a large number of
accommodation establishments where many tourists spend the night per 1 thousand inhabitants each
year. The second region (Podkarpackie Voivodship) can be considered as a non-tourist region.
Within the project, three methods have been tested:
LASSO,
log-line model,
ridge regression
with auxiliary variables, including the number of offers on the portal, the average price of offers and
the value of all offers. The models were built with all variables or only with the average price of offers.

150
Precision of the methods being compared
The models were estimated in R Studio using the lars and glmnet packages. The R-square was
calculated for monthly and daily data for all methods and sets of variables. No R-squared value in the
tables below means that the model has not generated acceptable forecasts, except for the average
value of the dependent variable.
Table 68. R-square of models for the tourist region
Method Variables Tourists Nights spent
Monthly data Daily data Monthly data Daily data
LASSO 3 0.9946 0.8910 - 0.2448
1 - 0.1820 - 0.1593
Log-line model 3 0.9992 0.3558 0.9993 0.2989
1 0.9992 0.2102 0.9992 0.1788
Ridge regression 3 0.9952 0.8768 0.9927 0.8474
1 0.9936 0.8431 0.9919 0.8048
Table 69. R-square of models for the non-tourist region
Method Variables Tourists Nights spent
Monthly data Daily data Monthly data Daily data
LASSO 3 0.9831 0.8822 0.9138 0.2939
1 - 0.0427 - 0.0422
Log-line model 3 0.9996 0.2639 0.9996 0.2299
1 0.9994 0.0792 0.9994 0.0766
Ridge regression 3 0.9890 0.8998 0.9751 0.7473
1 0.9614 0.4665 0.9430 0.4532
In any case, the results for the disaggregation of the number of tourists are better (a higher R-square
coefficient is achieved) than for overnight stays provided. It turns out that the R-square is similar for
all methods and regions for monthly data. In the case of daily data, differences in R-square between
regions are more visible in favour of the tourist region. The log-line model has achieved a high R-square
for monthly data, but a surprisingly low R-square for daily data. In several cases LASSO could not
generate acceptable forecasts except for the average value of the dependent variable. Among other
things, this may be due to the fact that the implementation of LASSO in the lars package allows to
generate only steps in which a new variable enters the model. The most reliable method proved to be
ridge regression. Its implementation in R allows to forecast at any value of the regulation parameter.

151
Details of the implementation for both methods can be found in Annex 2 – General approach for data
disaggregation.
Calendar effects and seasonality
This section presents results on the occurrence of seasonality in disaggregated data as well as on
calendar effects. Since there are no true values for high-frequency data, it is possible to rely mainly on
intuition when interpreting the results. For the occupancy of tourist accommodation establishments,
one can expect:
Greater use of accommodation establishments at the weekend than in the middle of the
week and during certain holidays and events such as New Year’s Eve party.
Dependence of the occupancy of accommodation establishments on the season in coastal
and mountain areas.
Lower usage on holidays such as Christmas and Easter.
Figure 59 shows the weekly seasonality of disaggregated data form 28th January to 31st March 2019.
Figure 59. Seasonality of disaggregated data
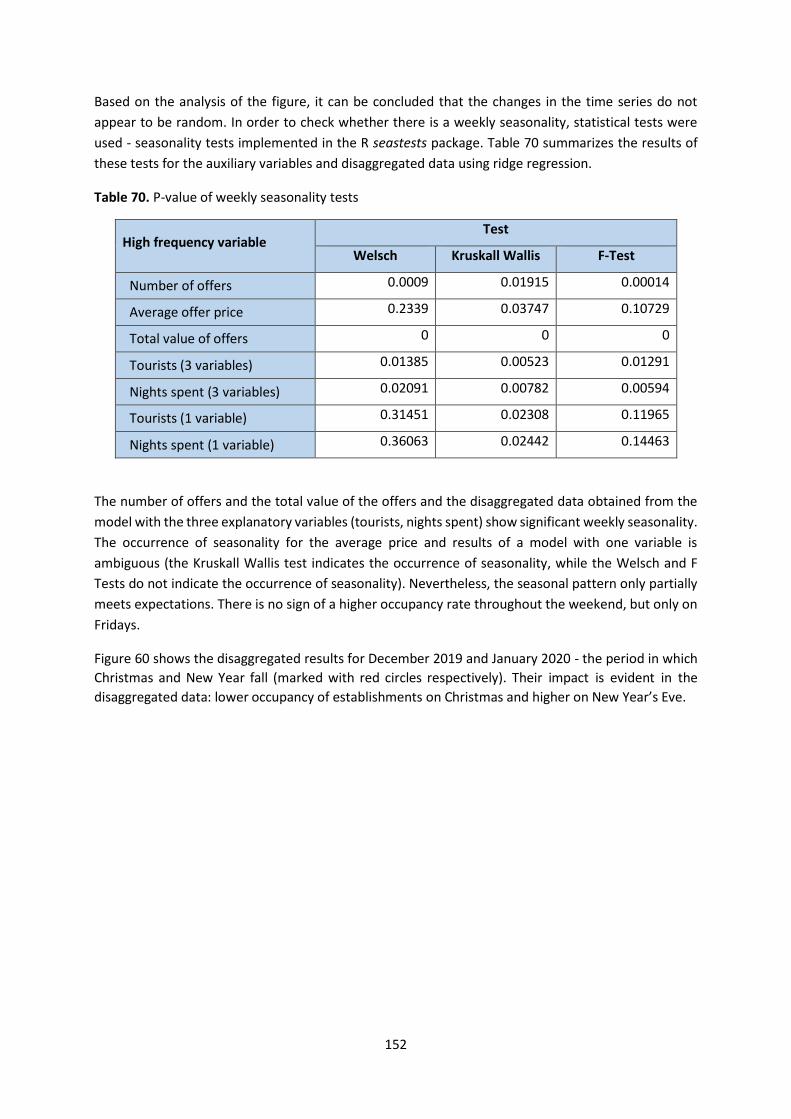
152
Based on the analysis of the figure, it can be concluded that the changes in the time series do not
appear to be random. In order to check whether there is a weekly seasonality, statistical tests were
used - seasonality tests implemented in the R seastests package. Table 70 summarizes the results of
these tests for the auxiliary variables and disaggregated data using ridge regression.
Table 70. P-value of weekly seasonality tests
High frequency variable Test
Welsch Kruskall Wallis F-Test
Number of offers 0.0009 0.01915 0.00014
Average offer price 0.2339 0.03747 0.10729
Total value of offers 0 0 0
Tourists (3 variables) 0.01385 0.00523 0.01291
Nights spent (3 variables) 0.02091 0.00782 0.00594
Tourists (1 variable) 0.31451 0.02308 0.11965
Nights spent (1 variable) 0.36063 0.02442 0.14463
The number of offers and the total value of the offers and the disaggregated data obtained from the
model with the three explanatory variables (tourists, nights spent) show significant weekly seasonality.
The occurrence of seasonality for the average price and results of a model with one variable is
ambiguous (the Kruskall Wallis test indicates the occurrence of seasonality, while the Welsch and F
Tests do not indicate the occurrence of seasonality). Nevertheless, the seasonal pattern only partially
meets expectations. There is no sign of a higher occupancy rate throughout the weekend, but only on
Fridays.
Figure 60 shows the disaggregated results for December 2019 and January 2020 - the period in which
Christmas and New Year fall (marked with red circles respectively). Their impact is evident in the
disaggregated data: lower occupancy of establishments on Christmas and higher on New Year’s Eve.

153
Figure 60. Calendar effects in disaggregated data
In the presented case study, ridge regression turned out to be the most reliable method in terms of
the precision and acceptability of disaggregated data, and the disaggregated results showed weekly
seasonality and calendar effects.
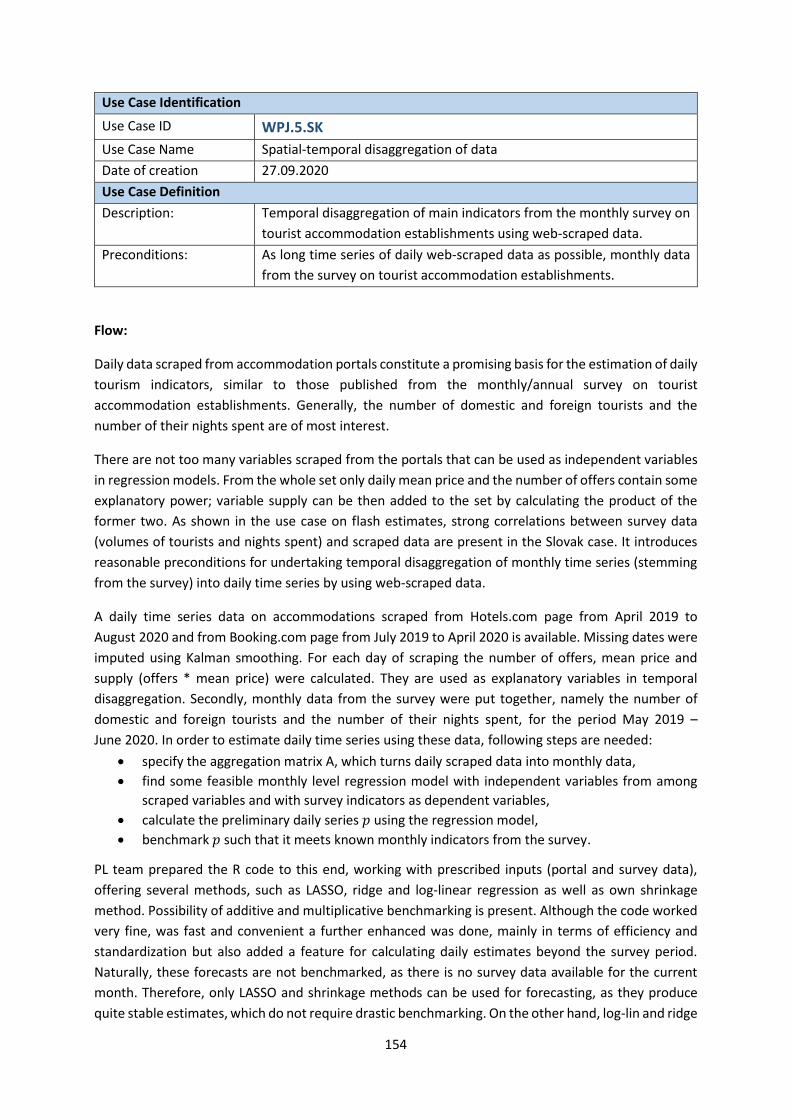
154
Use Case Identification
Use Case ID WPJ.5.SK
Use Case Name Spatial-temporal disaggregation of data
Date of creation 27.09.2020
Use Case Definition
Description: Temporal disaggregation of main indicators from the monthly survey on
tourist accommodation establishments using web-scraped data.
Preconditions: As long time series of daily web-scraped data as possible, monthly data
from the survey on tourist accommodation establishments.
Flow:
Daily data scraped from accommodation portals constitute a promising basis for the estimation of daily
tourism indicators, similar to those published from the monthly/annual survey on tourist
accommodation establishments. Generally, the number of domestic and foreign tourists and the
number of their nights spent are of most interest.
There are not too many variables scraped from the portals that can be used as independent variables
in regression models. From the whole set only daily mean price and the number of offers contain some
explanatory power; variable supply can be then added to the set by calculating the product of the
former two. As shown in the use case on flash estimates, strong correlations between survey data
(volumes of tourists and nights spent) and scraped data are present in the Slovak case. It introduces
reasonable preconditions for undertaking temporal disaggregation of monthly time series (stemming
from the survey) into daily time series by using web-scraped data.
A daily time series data on accommodations scraped from Hotels.com page from April 2019 to
August 2020 and from Booking.com page from July 2019 to April 2020 is available. Missing dates were
imputed using Kalman smoothing. For each day of scraping the number of offers, mean price and
supply (offers * mean price) were calculated. They are used as explanatory variables in temporal
disaggregation. Secondly, monthly data from the survey were put together, namely the number of
domestic and foreign tourists and the number of their nights spent, for the period May 2019 –
June 2020. In order to estimate daily time series using these data, following steps are needed:
specify the aggregation matrix A, which turns daily scraped data into monthly data,
find some feasible monthly level regression model with independent variables from among
scraped variables and with survey indicators as dependent variables,
calculate the preliminary daily series 𝑝 using the regression model,
benchmark 𝑝 such that it meets known monthly indicators from the survey.
PL team prepared the R code to this end, working with prescribed inputs (portal and survey data),
offering several methods, such as LASSO, ridge and log-linear regression as well as own shrinkage
method. Possibility of additive and multiplicative benchmarking is present. Although the code worked
very fine, was fast and convenient a further enhanced was done, mainly in terms of efficiency and
standardization but also added a feature for calculating daily estimates beyond the survey period.
Naturally, these forecasts are not benchmarked, as there is no survey data available for the current
month. Therefore, only LASSO and shrinkage methods can be used for forecasting, as they produce
quite stable estimates, which do not require drastic benchmarking. On the other hand, log-lin and ridge

155
methods suffer from poor estimation of the preliminary series, when benchmarking is a very crucial
step. Another option would be to use flash estimates for benchmarking of forecasted values.
Moreover, as coronavirus pandemic affected the whole tourism industry, there is a huge fall in time
our time series, mainly in April 2020, when the government measures in Slovakia restricted
accommodation owners from undertaking their business. Majority of them, however, did not interrupt
advertising on the portals. This inconsistence can thus hardly confuse our models by changing the
negative relationship between the number of offers and the number of tourists into slightly positive
one for some period. To this end, in order to produce robust and reliable estimates, the R code was
adjusted to leave out this period from modelling.
Data from Hotels.com
1. ridge
Ridge regression method brings the most variability in time series among the methods.
By comparison of statistics of both low frequency (monthly) and high frequency (daily) regression
models, combination of all three independent variables (offers, supply and mean price) explains
the variability of dependent variables the most (highest R-squared). On the other hand, variable
offers in uncorrelated with the final benchmarked daily series. The coefficient of variation of
projected series on the number of tourists is 61%. Seasonal pattern in daily series is apparent,
however, negative values can occur, especially in the case of low monthly values (coronavirus
pandemic measures imposed). The following figures illustrate the daily numbers of tourists, as
estimated with this method. Grey lines represent ends of weeks, in order to be able to detect
possible seasonal patterns. The general trend is obvious, as it stems from the monthly survey data.
The New Year’s Eve highest peak, local Saturday peaks as well as slow recovery from the pandemic
measures are reasonable. On the other hand, it seems that the series are quite volatile. Figures
for specific months (September and December 2019) allow deeper look into daily data. Although
these values cannot be compared to any official statistics, they bring at least some potential of
further examination and modelling.

156
Figure 61. The ridge regression method of offers, supply and mean price

157
Figure 62. The ridge regression method of tourists accommodated in December 2019
Figure 63. The ridge regression method of tourists accommodated in September 2019
2. LASSO
LASSO regression method performed best with the combination of offers and supply as
independent variables (highest R-squared and correlations) and in contrast to the ridge regression
brings less variability and volatility into the daily series while still preserving some seasonality.
Variable number of offers is now more correlated to the number of tourists. The coefficient of
variation of projected series on the number of tourists is 56%. Negative values can still occur.
The following figures, similar to those of the previous method, illustrate the daily numbers of
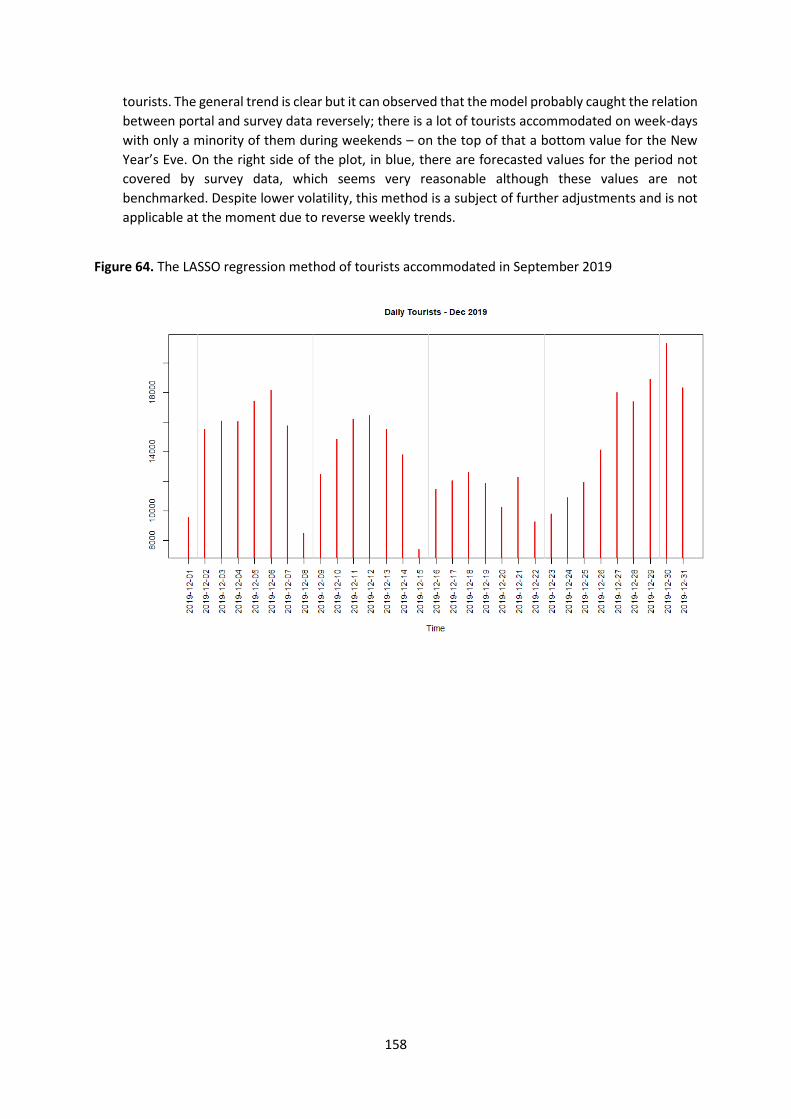
158
tourists. The general trend is clear but it can observed that the model probably caught the relation
between portal and survey data reversely; there is a lot of tourists accommodated on week-days
with only a minority of them during weekends – on the top of that a bottom value for the New
Year’s Eve. On the right side of the plot, in blue, there are forecasted values for the period not
covered by survey data, which seems very reasonable although these values are not
benchmarked. Despite lower volatility, this method is a subject of further adjustments and is not
applicable at the moment due to reverse weekly trends.
Figure 64. The LASSO regression method of tourists accommodated in September 2019

159
Figure 65. The LASSO regression method of tourists accommodated in September 2019

160
Figure 66. The LASSO regression method of tourists accommodated

161
3. shrinkage
Shrinkage method is developed by PL team. Its main idea is to adjust negative values in preliminary
series. However, as benchmarking to the monthly values can introduce negatives and it is a last
step of the process, they occur also with this method. Offers and supply were chosen as
explanatory variables, as they yield best statistics. Coefficient of variation is equal to 56%.
Shrinkage brings less variability and volatility and thus less seasonality into the series than LASSO
and ridge. Weekly trends resemble to inverse parabolas with peaks at the middle of the weeks,
which is not particularly feasible.
Figure 67. The shrinkage method of tourists accommodated in December 2019
Figure 68. The shrinkage method of tourists accommodated in September 2019

162
Figure 69. The shrinkage method of tourists accommodated

163
4. log-lin
This method suffers from catching no seasonal pattern, resulting time series look more like mean
values over the month. Log transformation destroys almost every signal in this case, as a result
preliminary series are very smoothed with lack of diversity. Therefore, it is not suitable for this
task.
Data from Booking.com
Data scraped from Booking.com cover shorter period than data from Hotels.com. Moreover, as they
comprise much more establishments and advertisers, daily mean prices tend to be smooth with low
variance, thus constituting weaker position for modelling. What varies is the number of offers (many
accommodations with only one room), but the analysis indicated that it is not enough volume of
information for making reliable daily predictions.
From among the above-mentioned methods, ridge, LASSO and log-lin brought poor results with such
a short period of explanatory variables, the only acceptable estimates are those with shrinkage
method. The number of offers and mean price were chosen as independent variables. Coefficient of
variation of resulting time series is only 40%, generally it seems that the information is not correctly
recorded – there are peaks on weekdays, in contrast to Fridays and Saturdays. Longer time series
would be necessary.
Figure 70. The log-lin method of tourists accommodated in December 2019

164
Figure 71. The log-lin method of tourists accommodated

165
Figure 72. The log-lin method of tourists accommodated in September 2019
Issues/Exceptions:
Some other regression models and approaches can be tested to find most feasible solution. In Slovakia,
Hotels.com page is not particularly popular but was still able to produce sound background for
temporal disaggregation. Google trend data could be useful for disaggregation of monthly time series
into weekly ones. In order to calculate precision and accuracy of daily estimates, some pilot survey on
daily tourism among accommodations would be necessary.
Output summary:
From among the tested methods, Hotels.com data with the use of ridge regression with explanatory
variables number of offers, mean price and their product turned out to be the most feasible solution
for temporal disaggregation of monthly series into daily series, especially in terms of seasonality,
volatility and expected behaviour of tourists throughout the year. Booking.com data suffer from
insufficient period length and from the amount of advertising accommodation establishments, which
smooths the average room price. Longer time series of scraped data would be beneficial.

166
4.6. Flash estimates of the occupancy of accommodation establishments
Use Case Identification
Use Case ID WPJ.6.NL
Use Case Name Flash estimates
Date of creation 20.08.2020. (Last update 02.10.2020)
Design scope (Sub-)system from which most specifications are a “black-box” 19.
Use Case Definition
Description Using web scraped data from Hotels.com to create flash estimates on the
number of tourists.
Preconditions Web scraped data from Hotels.com is available for recent months. Survey data
from earlier months is available.
Flow:
Statistics Poland provided an R script for creating flash estimates. This script was adapted for use in
Statistics Netherlands. The script combines survey data on the number of tourists in hotels from earlier
months with web scraped data from Hotels.com from recent months, in order to ‘predict’ what the
survey is likely to find in the recent months. Such a model could be used for creating flash estimates
on the number of tourists.
Adapting the script took little time, and was mostly about pointing the script to the location of our
data. Setting up the file with survey data for the script to use took a little bit more time.
The web scraped data was already available from use case WPJ.1.NL.
The data from the tourism survey from Statistics Netherlands had to be put in a specific format for the
model to use. This required some manual work (selecting and copying bits of data from SN website,
cut & pasting columns).
In the future, this could be automated, using the ‘open data’ web service of SN. This could be used to
create a fully-automated system, that web scrapes and creates flash estimates on its own.
The script can use two different methods to model the number of tourists, a linear model and an
ARIMAX model. It is expected that the ARIMAX model to be better at adapting to seasonality effects,
which is important because the number of tourists staying in hotels in The Netherlands is strongly
seasonal. At time of writing however, web scraped data for a full 12 months is not available yet. This
means ARIMAX model cannot be used yet, only the linear model was tested.
The script models the number of guests in hotels, as well as the number of nights spent. It also
discriminates between national guests and foreign guests. The script can use the mean price of
available hotel rooms as an input to the model, and also the number of offers available on the website.
19 Three hierarchical categories from Cockburn Design scope (sub)system black-box, (sub)system white-box and component were used. [Cockburn (2001), “Writing effective use cases. Addison-Wesley. ISBN 0-201-70225-8. OCLC 44046973”].
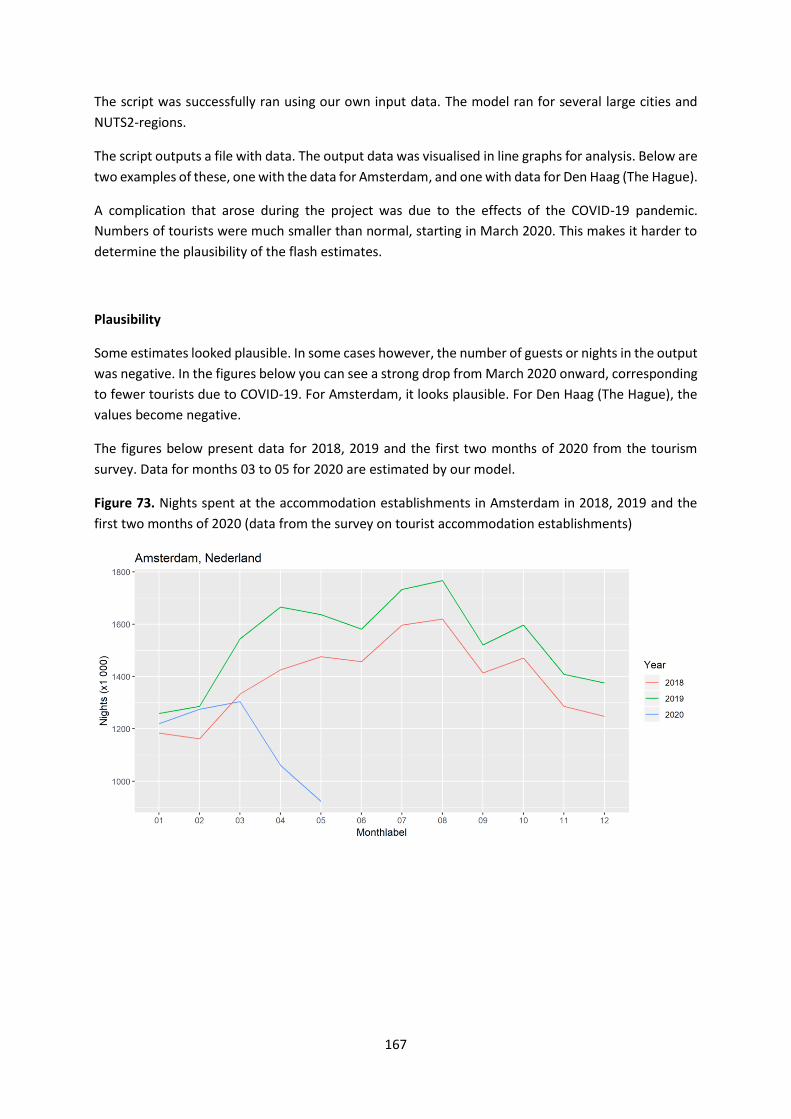
167
The script was successfully ran using our own input data. The model ran for several large cities and
NUTS2-regions.
The script outputs a file with data. The output data was visualised in line graphs for analysis. Below are
two examples of these, one with the data for Amsterdam, and one with data for Den Haag (The Hague).
A complication that arose during the project was due to the effects of the COVID-19 pandemic.
Numbers of tourists were much smaller than normal, starting in March 2020. This makes it harder to
determine the plausibility of the flash estimates.
Plausibility
Some estimates looked plausible. In some cases however, the number of guests or nights in the output
was negative. In the figures below you can see a strong drop from March 2020 onward, corresponding
to fewer tourists due to COVID-19. For Amsterdam, it looks plausible. For Den Haag (The Hague), the
values become negative.
The figures below present data for 2018, 2019 and the first two months of 2020 from the tourism
survey. Data for months 03 to 05 for 2020 are estimated by our model.
Figure 73. Nights spent at the accommodation establishments in Amsterdam in 2018, 2019 and the
first two months of 2020 (data from the survey on tourist accommodation establishments)

168
Figure 74. Nights spent at the accommodation establishments in Den Haag in 2018, 2019 and the first two months of 2020 (data from the survey on tourist accommodation establishments)
A possible explanation for these negative values could be that the model does not work very well when
the data is very far away from the training data. In the Figure 75, the blue dots are the training data
and the orange dots are the forecasts. For March, the mean price was around 400, close to the range
of prices in the training data. For April and May, the prices were extremely low, around 100 and 200.
One could argue that the model is not valid for this price range that is far away from the training data.
The forecasts could improve once survey data for March and April is available (that is, once we have
blue dots in the 100 – 200 price range).
Figure 75. Mean price and nights spent at the tourist accommodation establishments in Den Haag [blue dots - training data, orange dots – forecasts]
-50
0
50
100
150
200
250
0 100 200 300 400 500 600
MeanPrice vs Nights - Den Haag
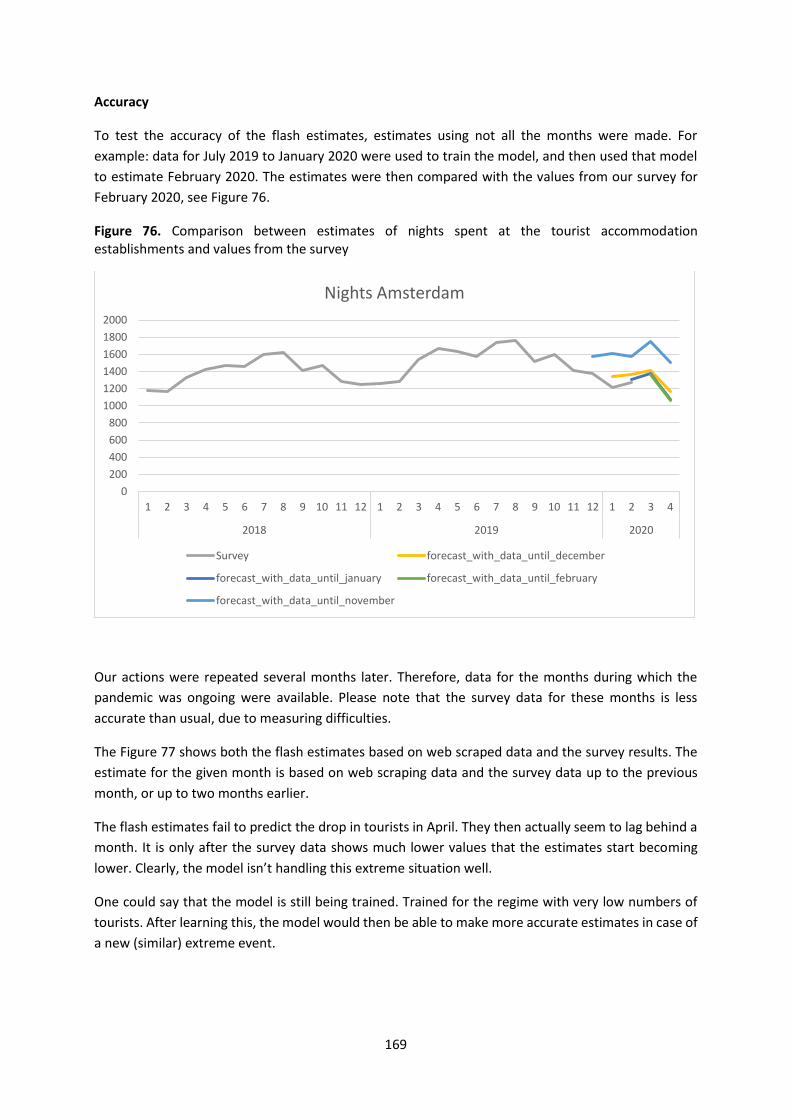
169
Accuracy
To test the accuracy of the flash estimates, estimates using not all the months were made. For
example: data for July 2019 to January 2020 were used to train the model, and then used that model
to estimate February 2020. The estimates were then compared with the values from our survey for
February 2020, see Figure 76.
Figure 76. Comparison between estimates of nights spent at the tourist accommodation establishments and values from the survey
Our actions were repeated several months later. Therefore, data for the months during which the
pandemic was ongoing were available. Please note that the survey data for these months is less
accurate than usual, due to measuring difficulties.
The Figure 77 shows both the flash estimates based on web scraped data and the survey results. The
estimate for the given month is based on web scraping data and the survey data up to the previous
month, or up to two months earlier.
The flash estimates fail to predict the drop in tourists in April. They then actually seem to lag behind a
month. It is only after the survey data shows much lower values that the estimates start becoming
lower. Clearly, the model isn’t handling this extreme situation well.
One could say that the model is still being trained. Trained for the regime with very low numbers of
tourists. After learning this, the model would then be able to make more accurate estimates in case of
a new (similar) extreme event.
0
200
400
600
800
1000
1200
1400
1600
1800
2000
1 2 3 4 5 6 7 8 9 10 11 12 1 2 3 4 5 6 7 8 9 10 11 12 1 2 3 4
2018 2019 2020
Nights Amsterdam
Survey forecast_with_data_until_december
forecast_with_data_until_january forecast_with_data_until_february
forecast_with_data_until_november

170
Figure 77. Flash estimates based on web scraped data and the survey results
Technical problems encountered
Whilst testing the R script, small technical issue happened: the script searches for a region in the names
of the web scraping files. It also matches part of the file. This created an error because both files
‘Amsterdam South, Amsterdam, Nederland’ and ‘Amsterdam, Nederland’ were matched to the text
“Amsterdam, Nederland”. For now, one of the files was removed to solve this. A change has to be
made to the script to become fully automated.
For two smaller cities, the script failed. The error message was (while running the ‘lm’ command):
“Error in terms.formula(formula, data = data) : duplicated name 'X55.10000_offers' in data frame
using '.' “. The reason why the script fails is unknown. The input data looks similar to that of other
cities.
In the web scraped data, the filenames contained the code ‘%20’, e.g. ‘Monthly statistics -
Groningen,%20Nederland’. The other input files do not. The ‘%20’ was manually replaced with a space
in the filenames. It would be convenient if the script that produces the monthly statistics of web
scraping would remove the ‘%20’ automatically.
In our opinion, this script can be run by anyone with basic R skills. Some documentation or a short
manual could help someone who is using the script for the first time. It is assumed that all required R-
packages and updates are available in the National Statistical Offices.
-500
0
500
1000
1500
2000
1 2 3 4 5 6 7 8 9 10 11 12 1 2 3 4 5 6 7 8 9 10 11 12 1 2 3 4 5 6 7
2018201820182018201820182018201820182018201820182019201920192019201920192019201920192019201920192020202020202020202020202020
Nights Amsterdam
Survey Flash estimate (1 month) Flash estimate (2 month)

171
Output summary:
Web scraped data from Hotels.com was used to create flash estimates on the number of tourists
staying at hotels. These estimates could be accurate under normal circumstances. The current
abnormal situation due to the COVID-19 pandemic however could not be accurately estimated by the
model.

172
Use Case Identification
Use Case ID WPJ.6.PL
Use Case Name Flash estimates
Date of creation 1.09.2020
Use Case Definition
Description: Flash estimates of the occupancy of accommodation establishments.
Preconditions: Basic knowledge of R-language programming, knowledge of methods of
estimating and verifying econometric forecasts.
Flow:
1. Preparation of monthly time series of data from the survey of the occupancy of
accommodation establishments.
2. Aggregation of daily data from web scraping of tourist portals to monthly statistics.
3. Summary of both sources by year and month.
4. Calculation of a data correlation matrix and on its basis narrowing the set of potential
explanatory variables.
5. The use of Hellwig’s information capacity index method to select the final set of explanatory
variables for the model.
6. Building an econometric model.
7. Calculation of forecasts.
Issues/Exceptions:
In recent years, there has been a growing demand from stakeholders for data on the rapidly changing
situation in the tourism market. The time that units have to report on the occupancy of tourist
accommodation establishment and then the time needed for the official statistical units to process the
data received makes the data on the occupancy of tourist accommodation establishments often more
than one month late. The COVID-19 pandemic has forced many businesses to temporarily suspend or,
in extreme cases, close down their operations. As a result, the situation in the tourist services market
has changed. Such changes significantly reduce the quality of forecasts.
Output summary:
As a result of the work carried out, it was verified to what extent the combination of non-statistical
data (here from web scraping and available immediately after the end of the month) with official
accommodation data will affect the speed and accuracy of predictions of data on tourism statistics.
Analyses have also been carried out on the accuracy of the forecasts in the face of the imbalance in
the tourism market caused by the pandemic. The results presented below concern five voivodships,
the selection of which for analysis was dictated by several factors such as: attractiveness and size of
the tourist market proximity of borders, and diversity of tourist attractions. The results refer to the
model determined on the basis of data before the introduction of restrictions related to the
coronavirus pandemic and the results of the model based on data after the introduction of restrictions.

173
Table 71 and Table 72 present the quality indicators of the developed models.
Table 71. Model quality indicators before the imposition of restrictions related to COVID-19 (for data
from February 2019 to December 2019)
Voivodship Model quality
indicator Number of
tourists Number of
nights spent
Dolnośląskie R-square 0.7344 0.4497
MAPE [%] 5.6897 10.3175
Małopolskie R-square 0.6965 0.3796
MAPE [%] 7.5922 13.5518
Mazowieckie R-square 0.8234 0.7458
MAPE [%] 4.7434 5.1889
Podkarpackie R-square 0.6204 0.6539
MAPE [%] 15.9696 17.9956
Pomorskie R-square 0.5804 0.5211
MAPE [%] 22.5484 34.2698
Table 72. Model quality indicators after the imposition of restrictions related to COVID-19 (for data from February 2019 to March 2020)
Voivodship Model quality
indicator Number of
tourists Number of
nights spent
Dolnośląskie R-square 0.7499 0.5754
MAPE [%] 11.7492 14.5075
Małopolskie R-square 0.3838 0.1757
MAPE [%] 22.6783 27.7175
Mazowieckie R-square 0.6195 0.6225
MAPE [%] 125.6613 48.8748
Podkarpackie R-square 0.7033 0.6901
MAPE [%] 26.6235 31.3144
Pomorskie R-square 0.5787 0.5334
MAPE [%] 29.8027 41.1669
It can be seen that the quality of the models has decreased in the latter case. This is due to very large
nominal drops in the tested values. For all studied voivodships, MAPE (The mean absolute percentage
error) is higher in the models after the introduction of restrictions limiting or even making it impossible
to rent hotel establishments.
Therefore, the errors of expired forecasts increased due to the model’s inability to reflect the declines caused by the closure of accommodation establishments at the end of at the end of the first quarter of 2020. This situation for the Podkarpackie Voivodship can be observed in the Figure 78.
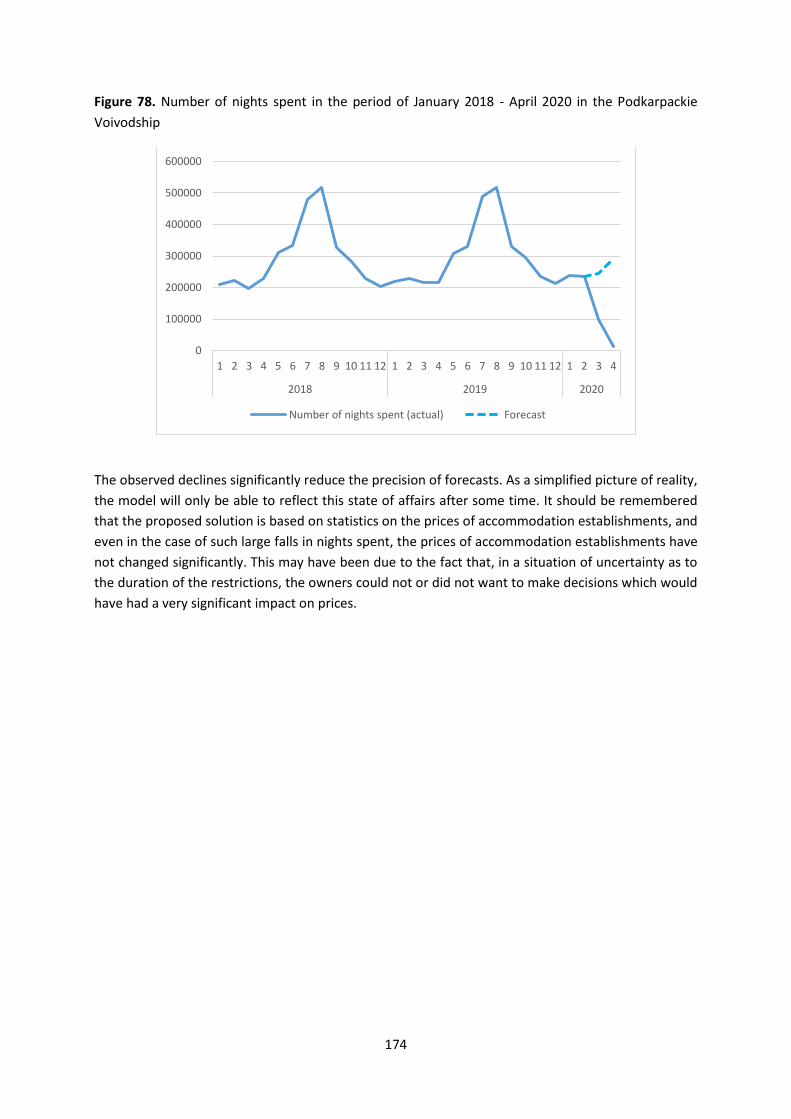
174
Figure 78. Number of nights spent in the period of January 2018 - April 2020 in the Podkarpackie
Voivodship
The observed declines significantly reduce the precision of forecasts. As a simplified picture of reality,
the model will only be able to reflect this state of affairs after some time. It should be remembered
that the proposed solution is based on statistics on the prices of accommodation establishments, and
even in the case of such large falls in nights spent, the prices of accommodation establishments have
not changed significantly. This may have been due to the fact that, in a situation of uncertainty as to
the duration of the restrictions, the owners could not or did not want to make decisions which would
have had a very significant impact on prices.
0
100000
200000
300000
400000
500000
600000
1 2 3 4 5 6 7 8 9 10 11 12 1 2 3 4 5 6 7 8 9 10 11 12 1 2 3 4
2018 2019 2020
Number of nights spent (actual) Forecast

175
Use Case Identification
Use Case ID WPJ.6.SK
Use Case Name Flash estimates
Date of creation 03.10.2020
Use Case Definition
Description: Use of possible data sources to calculate flash estimates for the main
indicators from the survey on tourist accommodation establishments.
Preconditions: As long time series of monthly web-scraped data as possible, monthly
data from the survey on tourist accommodation establishments and
possible some other time series related to tourism.
Flow:
Within this use case, three data sources were analysed that can bring some prediction power for the
main tourism indicators – number of tourists and number of nights spent. First of all, data scraped
from the Internet within this project were examined, namely from Hotels.com and Booking.com pages.
Secondly, Google Trends data were used, which measure weekly (and also daily) interest in search
terms and webpages.
Booking.com
Daily scraped data from July 2019 to April 2020 from Booking.com were obtained. After processing the
data, monthly statistics were calculated (number of offers and quantiles of prices per accommodation
type), which could serve as good explanatory variables and be able to underpin our regression model.
However, shortness of these time series was not the only obstacle to find solid correlations with the
survey data. Another problem was the volume of the data, which caused very low variability in mean
(and also quantile) prices and thus blurred such an important information. The number of offers is
obviously an important variable for such a large portal but, maybe surprisingly, failed to produce
satisfying correlations with survey data (taking into account that Booking.com advertises many small
accommodations that can quickly sell off and thus substantially decrease the number of offers, strong
correlation with the number of tourists was expected). One of the reasons can be the coronavirus
pandemic, which locked all the accommodations establishments but many of them did not stop
advertising and therefore the relation between number of offers and tourism performance was
disturbed. As a result, Booking.com data are not used for calculating flash estimates within this study.
The corrplots used in the following figures represent the Pearson correlations between survey
variables (Tourists and Nights spent) and scraped variables (others). The section in the circle illustrates
the exact value of the correlation, so as the user can distinguish between values e.g. 0.6 and 0.7.

176
Figure 79. The matrix representing correlations between variables from Booking.com and survey on tourist accommodation establishments.
Hotels.com
Our time series of Hotels.com data are from April 2019 to August 2020 and are quite promising for
finding some sound regression model for calculating predictions. In order to enrich the set of possible
regressors, Google Trends data were added to the model, just to see if it can constitute stronger
regression power than Hotels.com data. Price variables bring vital information in possible models,
whereas number of offers strongly depends on whether the spring 2020 pandemic lockdown is taken
into account or not – there are absolutely poor results for the correlations of the number of offers and
the survey data when the whole period of April 2019 to July 2020 is taken into account. With the
exclusion of April and May 2020 the correlation levels for the number of offers increase.
From the figures below one can examine that there are several variables from Hotels.com that
correlate with the survey indicators. Apart from them, also Google Trends data are quite consistent
with the survey. Based on these values, 8 variables were chosen for further processing, namely the
number of offers (3 NACE categories, just as an attempt), lower quantile prices (Q25) for NACE 55.1
and for all establishments, median prices (Q50) for NACE 55.1 and for all establishments and Google
Trends series. The first matrix represents correlations for the whole period, the second stands for the
period without April and May 2020.

177
Figure 80. The matrix representing correlations between variables from Hotels.com (including Google Trends data) and survey on tourist accommodation establishments for April 2019 to July 2020

178
Figure 81. The matrix representing correlations between variables from Hotels.com and survey on tourist accommodation establishments excluding April and May 2020
Figure 82 depicts the monthly time series of the number of tourists from the survey and the number
of offers and the mean price from Hotels.com data, respectively. The former reveals negative
dependence of the time series (with the exception of lockdown), the latter shows positive relation.

179
Figure 82. Monthly time series of the number of tourists from the survey and the number of offers from Hotels.com
Figure 83. Monthly time series of the number of tourists from the survey and the mean price from Hotels.com

180
PL team prepared an R code for the calculation of flash estimates but SK made its own, since significant
level of customization was needed. Two approaches were used – linear model and ridge regression.
Strong multicollinearity of independent variables were encounter here and therefore not all of them
can be used in the model simultaneously. For the linear model approach, our code first calculates all
of the possible models at all levels using potential independent variables (255 models in 1.07 second)
and choose the one with most significant predictors – usually only one variable gave the best model
and it was never a Google Trends time series, Hotels.com price data tended to be better predictors
within this short regression period (April 2019 – July 2020). Despite high R-squared values (0.83 – 0.96),
plots below hint that these predictions are quite different from the actual indicators. In order to find
the best possible model, three regression periods were chosen and benchmarked to the actual values.
Presumably, longer the period better the model, as it can be learned by more information. However,
it is not always the truth.
1. April 2019 – December 2019
This very short period (only 9 data points) provided some basic information to the model, but it is
obvious that although the general trend was captured, predicted values for the number of tourists are
overestimated (with exception of February 2020). It is understandable, as the model lacked some data
on the pandemic – an unknown scenario until March 2020. If one wanted to use a model based on
Hotels.com data for the upcoming period, some “pandemic” data points would definitely needed to
be incorporated.
Figure 84. Predictions for the number of tourists at the tourist accommodation establishments based on the model built on period between April 2019 and December 2019
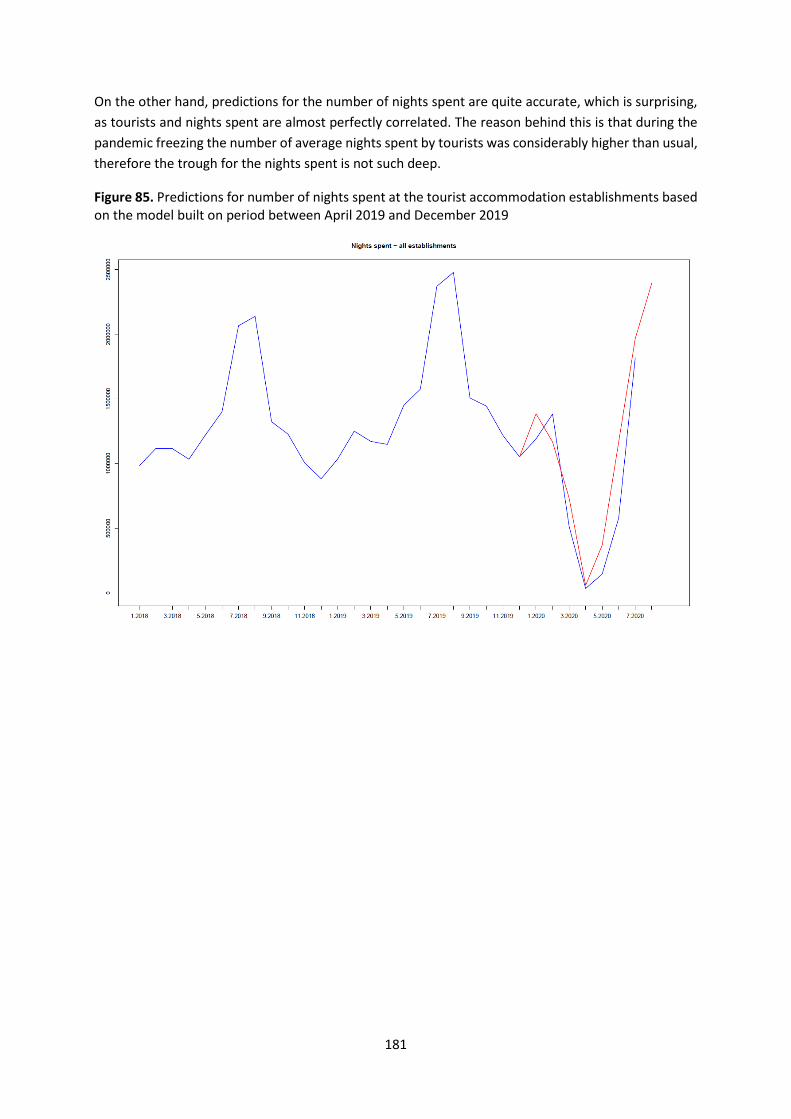
181
On the other hand, predictions for the number of nights spent are quite accurate, which is surprising,
as tourists and nights spent are almost perfectly correlated. The reason behind this is that during the
pandemic freezing the number of average nights spent by tourists was considerably higher than usual,
therefore the trough for the nights spent is not such deep.
Figure 85. Predictions for number of nights spent at the tourist accommodation establishments based on the model built on period between April 2019 and December 2019

182
2. April 2019 – March 2020
With three more data points the model matured a little bit, but still overestimated the number of
tourists during the lockdown period and also July by a non-negligible amount. Prediction for August is
even higher and it is in line with the general expectations.
Figure 86. Predictions for number of tourists at the tourist accommodation establishments based on the model built on period prior to the pandemic lockdown

183
Figure 87. Predictions for number of nights spent at the tourist accommodation establishments based on the model built on period prior to the pandemic lockdown
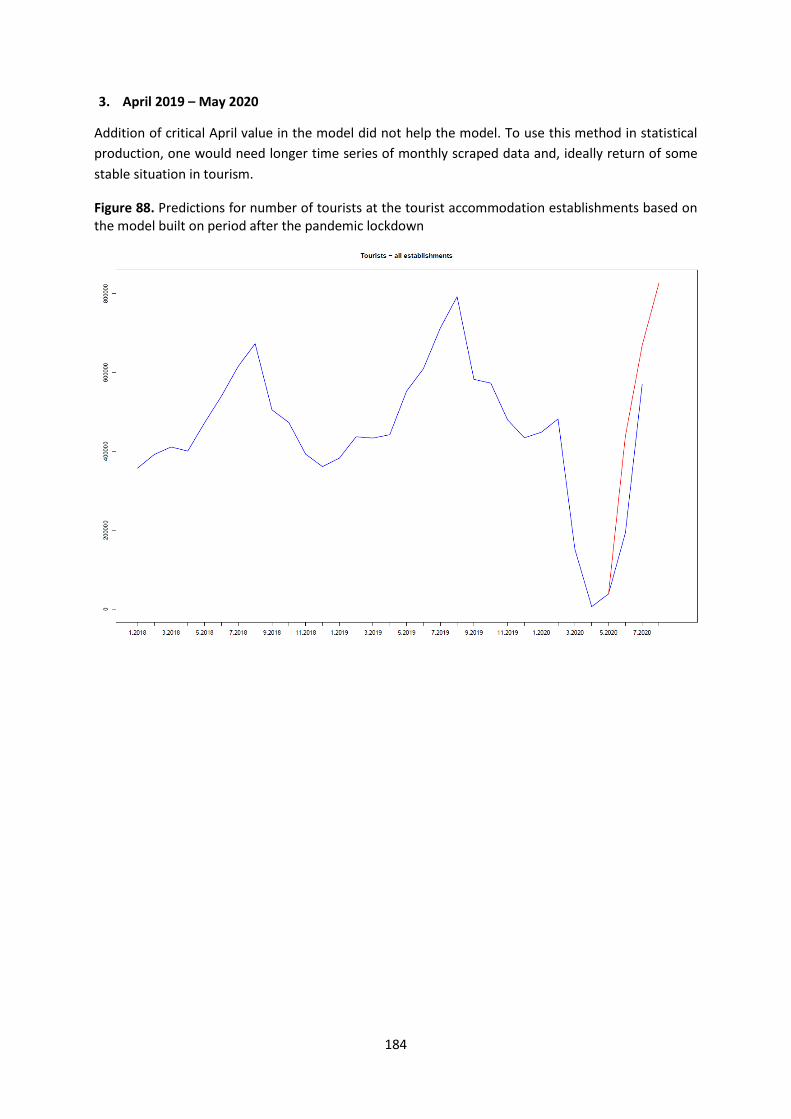
184
3. April 2019 – May 2020
Addition of critical April value in the model did not help the model. To use this method in statistical
production, one would need longer time series of monthly scraped data and, ideally return of some
stable situation in tourism.
Figure 88. Predictions for number of tourists at the tourist accommodation establishments based on the model built on period after the pandemic lockdown

185
Figure 89. Predictions for number of nights spent at the tourist accommodation establishments based on the model built on period after the pandemic lockdown
In ridge regression, multicollinearity of predictors is treated by reducing parameters of most of the
variables at the expense of the most significant ones, when a penalty term is introduced.
All 8 independent variables were used in the model. The results were however not acceptable, as some
weird patterns appeared in estimated time series (false trends, reverse or even negative values).
Figure 90 illustrates predictions based on April 2019 – March 2020 values.
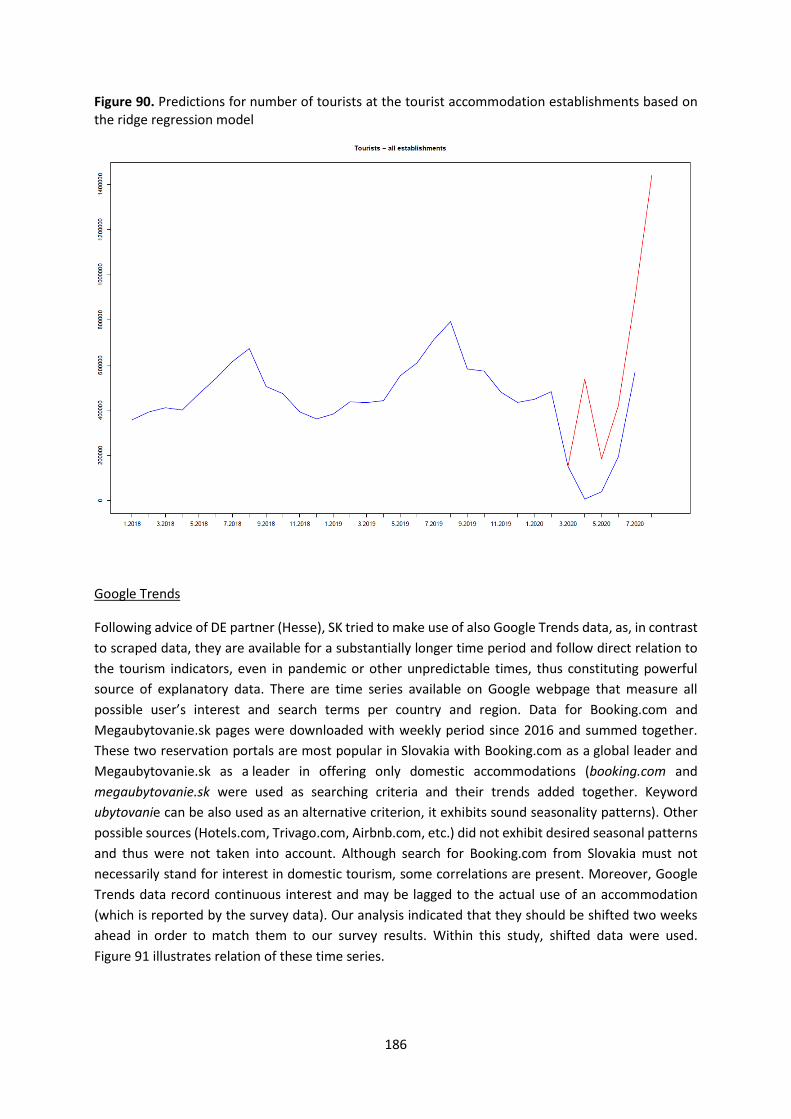
186
Figure 90. Predictions for number of tourists at the tourist accommodation establishments based on the ridge regression model
Google Trends
Following advice of DE partner (Hesse), SK tried to make use of also Google Trends data, as, in contrast
to scraped data, they are available for a substantially longer time period and follow direct relation to
the tourism indicators, even in pandemic or other unpredictable times, thus constituting powerful
source of explanatory data. There are time series available on Google webpage that measure all
possible user’s interest and search terms per country and region. Data for Booking.com and
Megaubytovanie.sk pages were downloaded with weekly period since 2016 and summed together.
These two reservation portals are most popular in Slovakia with Booking.com as a global leader and
Megaubytovanie.sk as a leader in offering only domestic accommodations (booking.com and
megaubytovanie.sk were used as searching criteria and their trends added together. Keyword
ubytovanie can be also used as an alternative criterion, it exhibits sound seasonality patterns). Other
possible sources (Hotels.com, Trivago.com, Airbnb.com, etc.) did not exhibit desired seasonal patterns
and thus were not taken into account. Although search for Booking.com from Slovakia must not
necessarily stand for interest in domestic tourism, some correlations are present. Moreover, Google
Trends data record continuous interest and may be lagged to the actual use of an accommodation
(which is reported by the survey data). Our analysis indicated that they should be shifted two weeks
ahead in order to match them to our survey results. Within this study, shifted data were used.
Figure 91 illustrates relation of these time series.
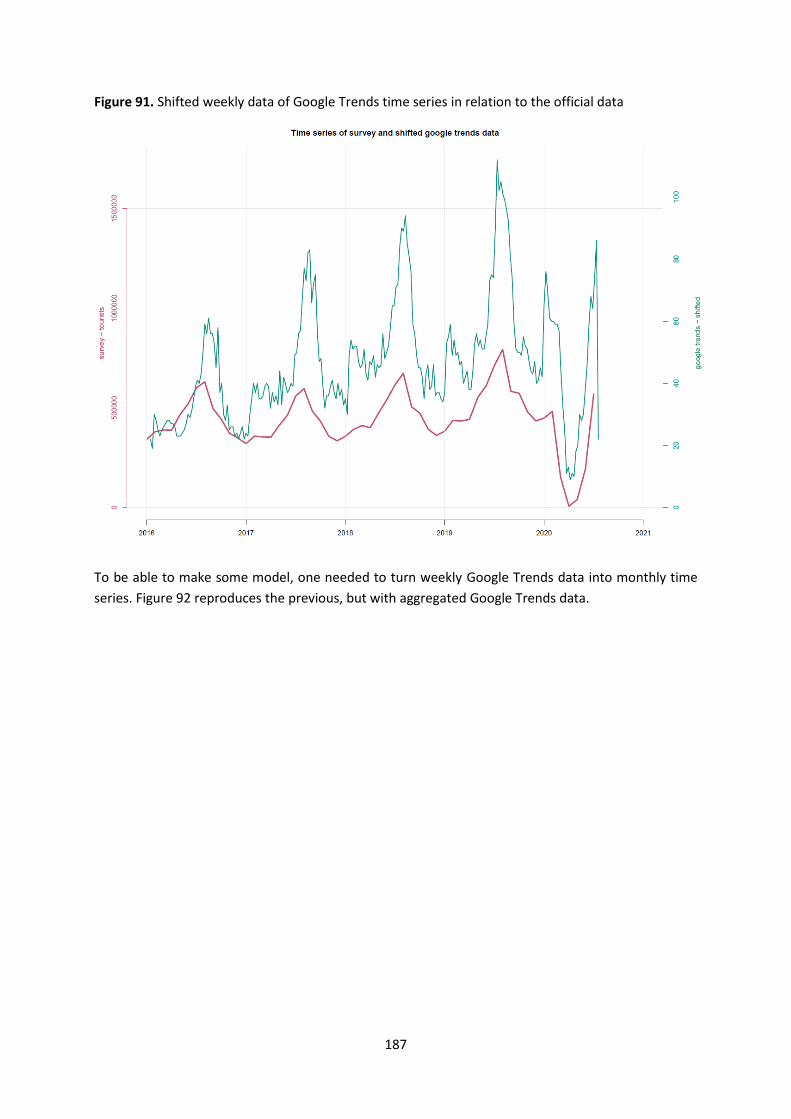
187
Figure 91. Shifted weekly data of Google Trends time series in relation to the official data
To be able to make some model, one needed to turn weekly Google Trends data into monthly time
series. Figure 92 reproduces the previous, but with aggregated Google Trends data.

188
Figure 92. Shifted monthly data of Google Trends time series in relation to the official data
Regarding correlations between the survey indicators and trends data, they are all positive and of
sufficient level.
Figure 93. Correlations between the survey indicators and Google Trends data

189
Scatterplot below (and also time series plot above) suggests some quadratic relationship between
survey data and trends data, one might assume that the best model would be linear model with some
transformation of trends data.
Figure 94. Scatterplot of official and Google Trends data
To find the most feasible model, 8 options with 2 different prediction periods were tested. Let us
denote survey data as 𝑦 and Google Trends data as 𝑥. Models considered were:
1. 𝑦 = 𝛽0 + 𝛽1𝑥 + 𝛽2𝑥2 + 𝛽3𝑥3 + 𝜀
2. 𝑦 = 𝛽0 + 𝛽1𝑥 + 𝛽2𝑥2 + 𝜀
3. 𝑦 = 𝛽0 + 𝛽1𝑥 + 𝜀
4. 𝑦 = 𝛽0 + 𝛽1 ln 𝑥 + 𝜀
5. 𝑦 = 𝛽0 + 𝛽1√𝑥 + 𝜀
6. 𝑦 = 𝛽0 + 𝛽1√𝑥 + 𝛽2 √𝑥3
+ 𝜀
7. 𝑦 = 𝛽0 + 𝛽1√𝑥 + 𝛽2 √𝑥3
+ 𝛽3 √𝑥4 + 𝜀
8. 𝑦 = 𝛽0 + 𝛽1√𝑥 + 𝛽2 √𝑥3
+ 𝛽3 √𝑥4 + 𝛽4 √𝑥5
+ 𝜀

190
Prediction period 2016 – 2018
First, SK tried to build the model on a relatively stable data and checked if it can provide enough
information to calculate feasible predictions for 2019 (when there was a big tourism peak during the
summer season) and for pandemic lockdown. In order to select appropriate model, simulations were
made, when each time some of the data points were randomly chosen and used to estimate the
models. Mean squared errors can put some guidance into which option is the most acceptable in terms
of bias and variance. The following are the results for the number of nights spent.
Figure 95. Simulations of tested models for the number of nights spent based on Google Trends data
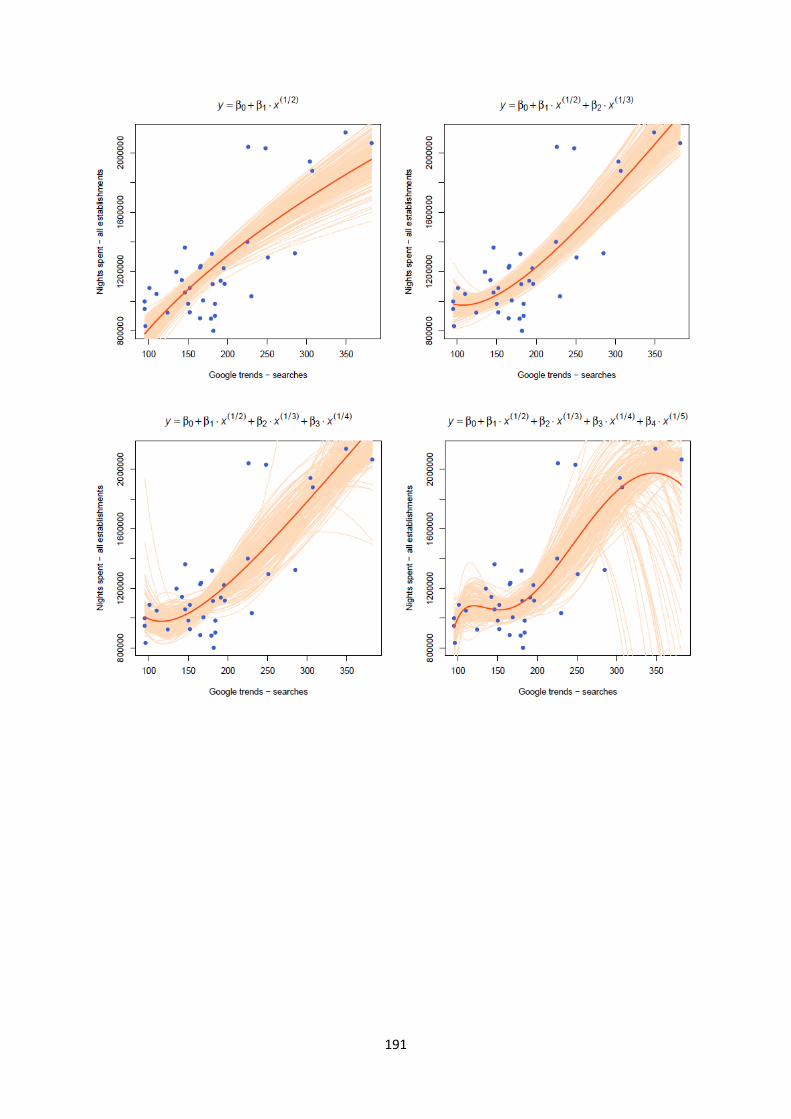
191

192
Figure 96. Mean squared errors of the tested models
Based on these results options 2, 3 and 6 were chosen for further processing. Model 2 performed best
for the number of tourists, with adjusted R-squared equal to 0.55 and MAPE 11.6%. When it comes to
the number of nights spent, model 2 was able to reproduce the 2019 summer peak, whereas model 3
was more powerful for the pandemic lockdown (but still very inaccurate). Model 2 was chosen to be
more acceptable, with adjusted R-squared equal to 0.62 and MAPE 14%.
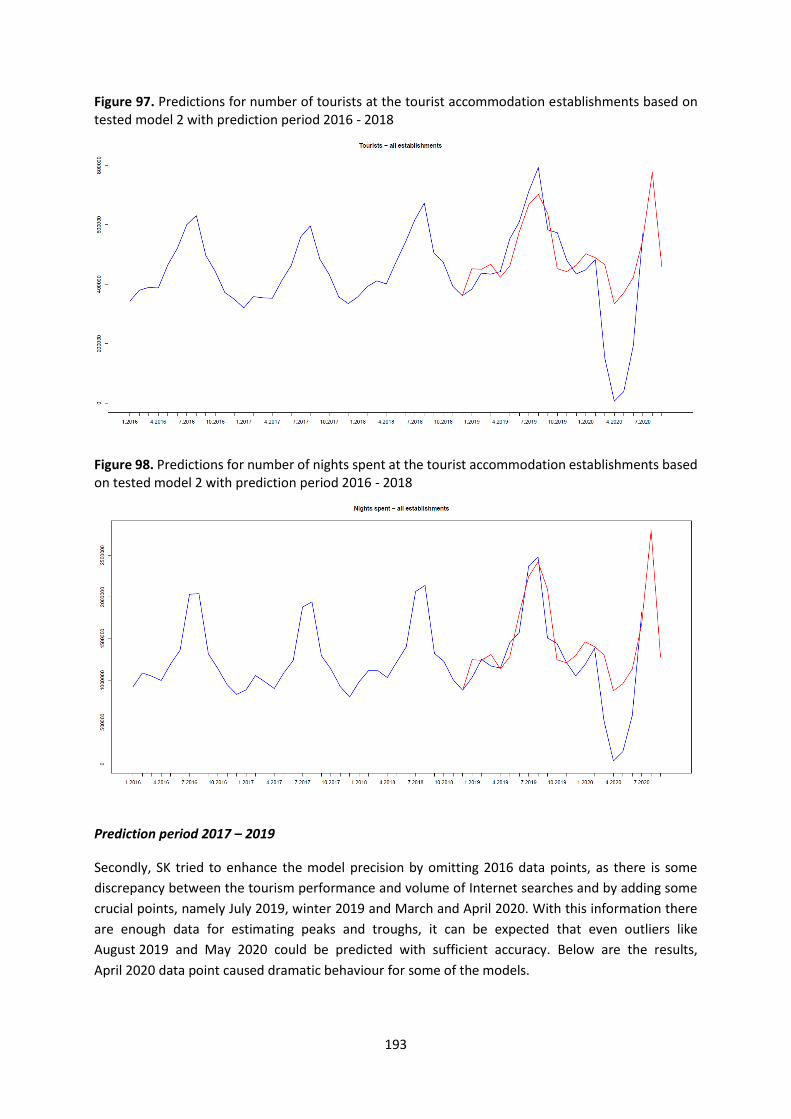
193
Figure 97. Predictions for number of tourists at the tourist accommodation establishments based on tested model 2 with prediction period 2016 - 2018
Figure 98. Predictions for number of nights spent at the tourist accommodation establishments based on tested model 2 with prediction period 2016 - 2018
Prediction period 2017 – 2019
Secondly, SK tried to enhance the model precision by omitting 2016 data points, as there is some
discrepancy between the tourism performance and volume of Internet searches and by adding some
crucial points, namely July 2019, winter 2019 and March and April 2020. With this information there
are enough data for estimating peaks and troughs, it can be expected that even outliers like
August 2019 and May 2020 could be predicted with sufficient accuracy. Below are the results,
April 2020 data point caused dramatic behaviour for some of the models.

194
Figure 99. Simulations of tested models for the number of nights spent based on Google Trends data
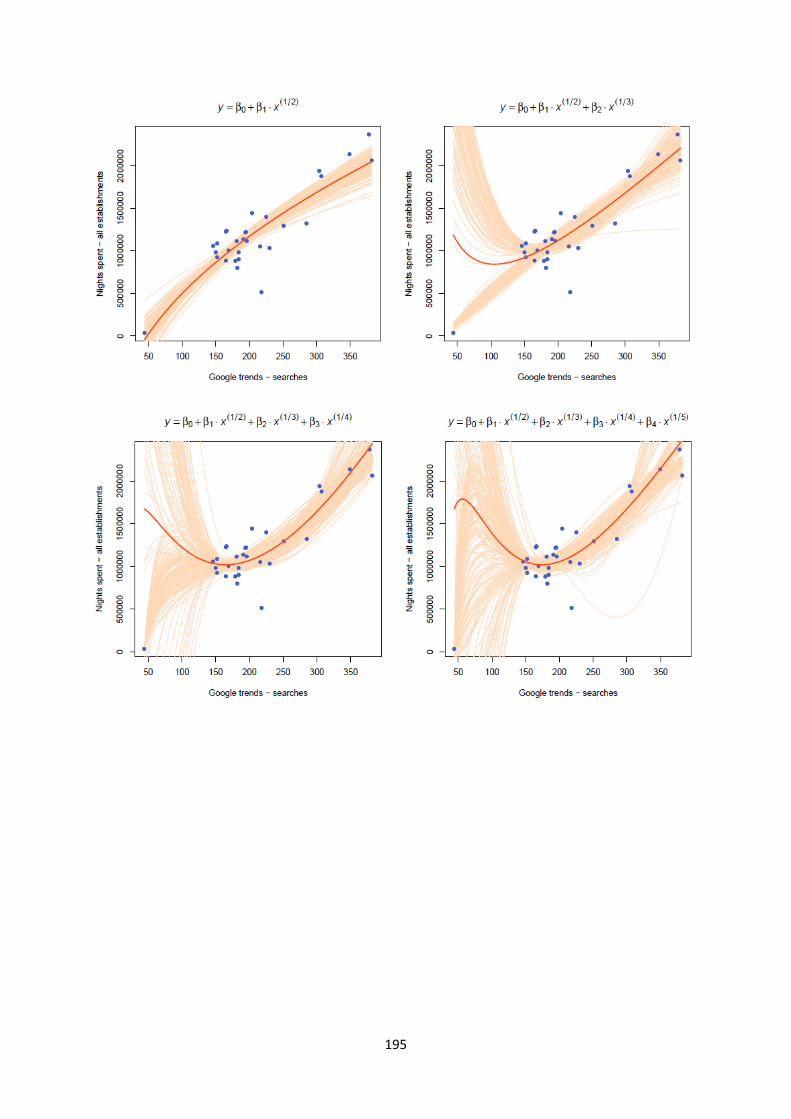
195

196
Figure 100. Mean squared errors of the tested models
Unsurprisingly, mean squared errors for models 7 and 8 are very high, due to the extreme variance.
Models 2 – 5 were chosen for further processing. Model 5 seemed to make most feasible predictions
for the number of tourists, with adjusted R-squared of 0.67 and MAPE 54% (such high due to the
April 2020 data point). For the number of nights spent basic linear model (number 3) yielded the best
predictions in terms of peaks and troughs (but all of them were quite similar) with adjusted R-squared
of 0.78 and MAPE 36%.
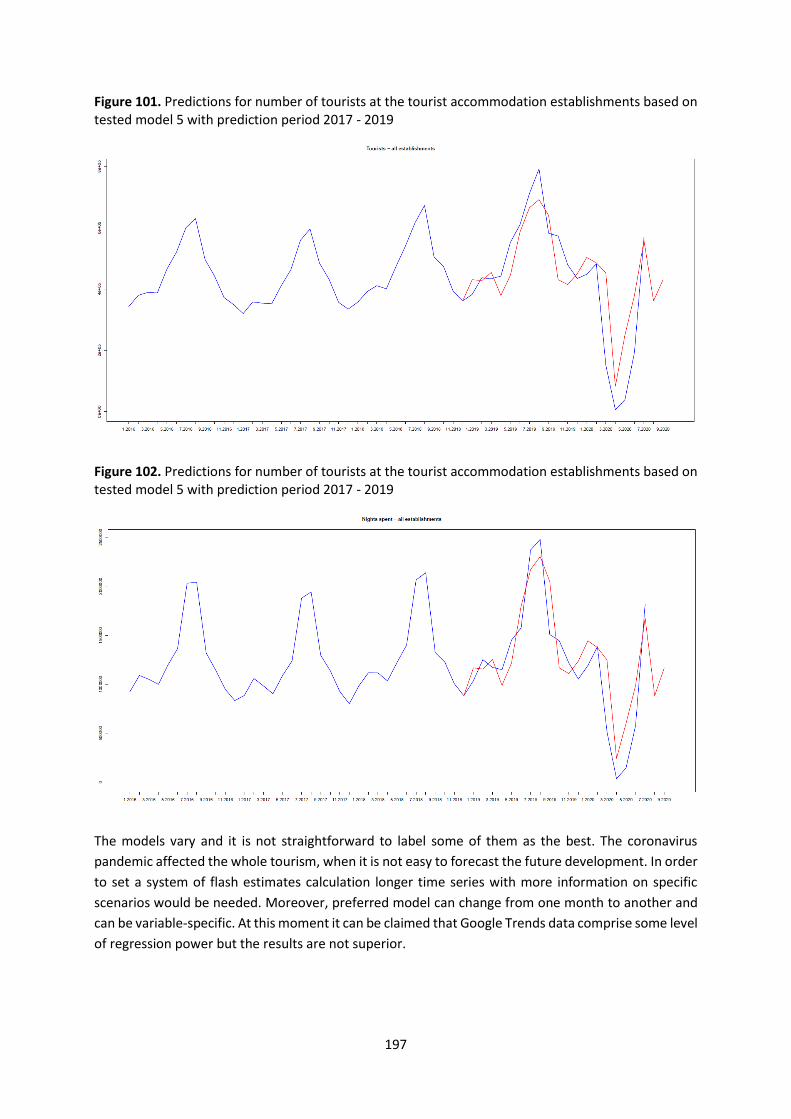
197
Figure 101. Predictions for number of tourists at the tourist accommodation establishments based on tested model 5 with prediction period 2017 - 2019
Figure 102. Predictions for number of tourists at the tourist accommodation establishments based on tested model 5 with prediction period 2017 - 2019
The models vary and it is not straightforward to label some of them as the best. The coronavirus
pandemic affected the whole tourism, when it is not easy to forecast the future development. In order
to set a system of flash estimates calculation longer time series with more information on specific
scenarios would be needed. Moreover, preferred model can change from one month to another and
can be variable-specific. At this moment it can be claimed that Google Trends data comprise some level
of regression power but the results are not superior.

198
Issues/Exceptions:
Setting a system of flash estimates would require regular and continuous time series of auxiliary data,
either scraped or obtained from external data sources (like Google Trends data). Any interruption or
break of the data supply could cause failure of flash estimates production.
Output summary:
From among 3 tested data sources that could serve as instrumental for modelling of flash estimates,
Hotels.com and Google Trends data exhibited some potential and explanatory power. It is hard to say
if the model based on Google Trends data outperformed the one based on Hotels.com data, they both
showed some pros and cons:
Model based on Hotels.com data
rather stable data source with direct connection to domestic tourism
price variables strongly correlate with the tourism indicators
provided sound predictions for even pandemic lockdown (but only for number of nights spent,
which could be due to a discrepancy between survey indicators)
extensive daily scraping necessary, which can crash at any time
not specifically robust in unexpected scenarios (accommodation owners advertising even if there
are some restrictions, distribution of prices with low variance)
still too short time series
Model based on Google Trends data
easily accessible real time data on user’s searching activity, long time series available
significant correlation with tourism indicators
provided promising predictions for peaks and troughs
robust in unexpected scenarios as the user behaviour on the Internet is in line with the current
circumstances
indirect connection to domestic tourism as it is mixed with foreign tourism
impossible to calculate regional estimates
Both of the approaches can be further developed. In case of unusual situation in the field of tourism,
which was encountered, e.g. in 2020, they can provide vital auxiliary information for the models.
On the other hand, in case of stable progress, time series forecasting without external explanatory
variables could yield more feasible flash estimates.

199
4.7. Methodology to improve the quality of data in various statistical areas
Use Case Identification
Use Case ID WPJ.7.PL
Use Case Name Methodology to improve the quality of data in various statistical areas
Date of creation 01.09.2020
Use Case Definition
Description: Estimation of the number of trips using data from a sample survey of
trips, administrative sources and big data. Estimation of tourism
expenditure with the use of data obtained in the process of web scraping
of portals related to the tourism industry.
Preconditions: Knowledge of the basic methods of machine learning and their
implementation in the R programme.
Flow:
1. Collect all origin and destination airports with the use of an online flight connection search
engine.
2. Use flights schedules to derive a distribution of flights for each origin airport.
3. Attach a country where the airports are located with airport code lists (IATA, ICAO, FAA).
4. Attach a capacity of aircraft (seats) with data on technical information on aircrafts.
5. Calculate the distribution of flights (measured with seats) for each airport available from
national airports. The destination airports identified in this step will be called hub airports.
6. Calculate the distribution of flights for each hub airport. Repeat this step until all destination
airports are reached.
7. Remove all routes that are irrelevant with respect to time or cost efficiency.
8. Use data from civil aviation office to benchmark distribution of flights from a given origin
airports to the known total.
9. For each hub airport calculate the number of passenger that travels further using a relevant
statistic from the sample survey (share of tourist using airports from a given country as a hub).
10. Sum up passengers from all routes: travelling directly from origin country, travelling with the
use one hub airports, etc.
11. Using web scraping, collection of data on accommodation establishment prices, air ticket
prices and average meal prices.
12. Aggregation of the abovementioned data into statistics (average, median, quartile).
13. Combination of aggregated data with the micro-data base of the sample survey of trips
according to keys, e.g. country, type of accommodation establishment and quarter.
14. Construction of the average expenditure model using machine learning methods
Issues/Exceptions:
In the survey of trips of Poles, there are about 80 countries each year, and when estimating trips using
big data over 140 destinations are obtained. Due to the very large number of countries for which it
would be necessary to collect data through web scraping, the project work was limited to the countries

200
of South America with 13 countries only. Web scraping started in 2019 and continued in 2020. The
crisis related to COVID-19 has caused huge disturbances in data from accommodation portals, such as
a drop in the number of offers in certain market segments, as well as the suspension of international
flights and, as a result, a lack of data on flight ticket prices. For this reason, the description of the results
is limited to 2019. It should be noted that in order to generate reliable statistics, using data from tourist
portals, web scraping should be carried out over a sufficiently long period.
Output summary:
All the analysis results presented in this section refer to trips and expenditure of Polish residents
travelling to South American countries.
Estimation of trips in air traffic
In 2019, the number of South American countries that appeared in the survey of the participation of
Polish residents in trips was between 4 and 6, depending on the quarter. In the same period, the
number of countries generated on the basis of big data was between 8 and 10. Finally, the number of
countries with estimated trips in 2019, using the James-Stein estimator, was between 9 and 10
(see Table 73).
Table 73. Number of countries with estimated trips to South America by source
Source of data Q1 2019 Q2 2019 Q3 2019 Q4 2019
Survey of participation of Polish residents in trips 6 4 6 6
Big data 10 8 8 9
Survey of participation of Polish residents in trips
and big data combined with James-Stein’s estimator 10 9 10 9
Figure 103 shows which countries were obtained in each source as illustrated by the case of Q3 2019.
Three countries occurred simultaneously in both sources, five only in the big data collection, and two
only in the survey of participation of Polish residents in trips. Three countries did not appear in either
of these sources.
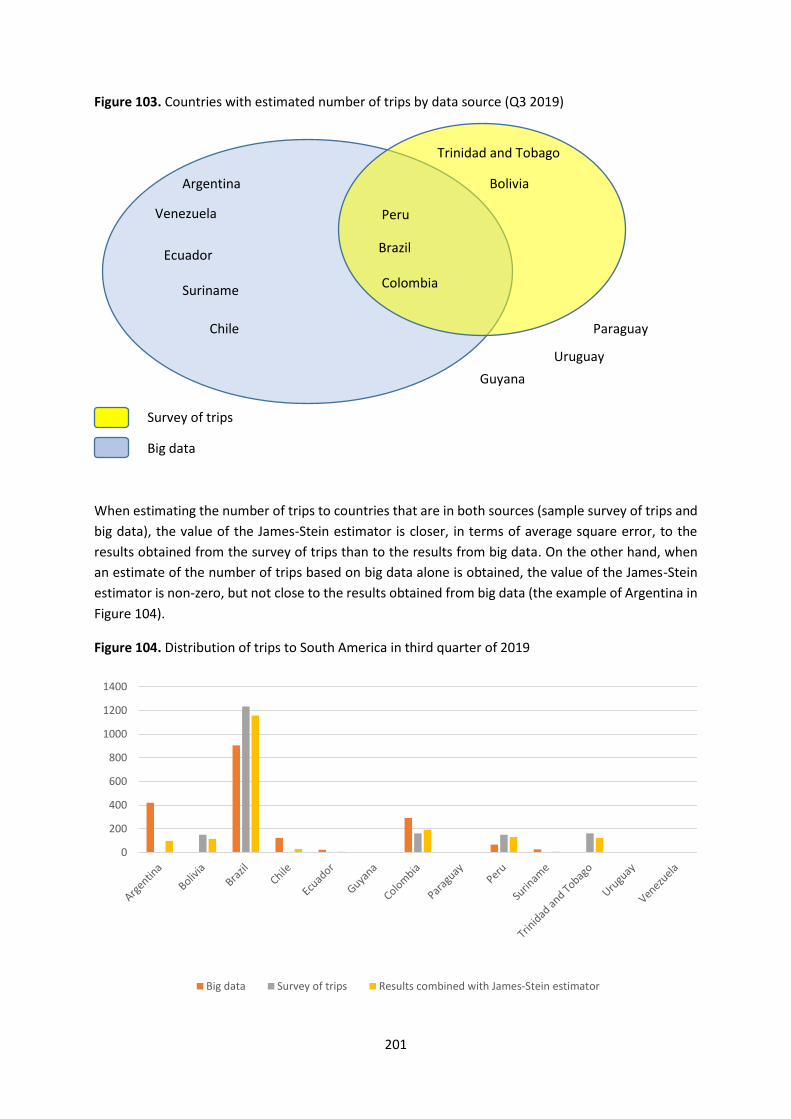
201
Figure 103. Countries with estimated number of trips by data source (Q3 2019)
When estimating the number of trips to countries that are in both sources (sample survey of trips and
big data), the value of the James-Stein estimator is closer, in terms of average square error, to the
results obtained from the survey of trips than to the results from big data. On the other hand, when
an estimate of the number of trips based on big data alone is obtained, the value of the James-Stein
estimator is non-zero, but not close to the results obtained from big data (the example of Argentina in
Figure 104).
Figure 104. Distribution of trips to South America in third quarter of 2019
0
200
400
600
800
1000
1200
1400
Big data Survey of trips Results combined with James-Stein estimator
Paraguay
Venezuela
Argentina
Ecuador
Suriname
Bolivia
Guyana
Brazil
Colombia
Peru
Trinidad and Tobago
Uruguay
Chile
Survey of trips
Big data
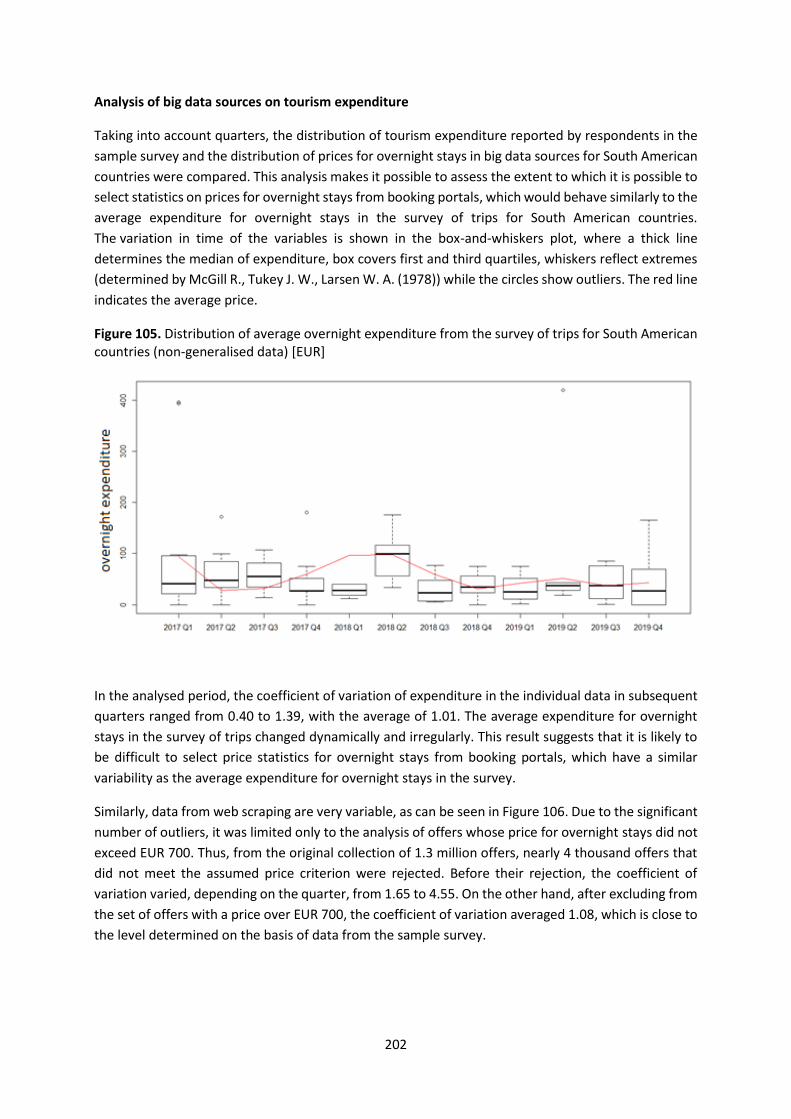
202
Analysis of big data sources on tourism expenditure
Taking into account quarters, the distribution of tourism expenditure reported by respondents in the
sample survey and the distribution of prices for overnight stays in big data sources for South American
countries were compared. This analysis makes it possible to assess the extent to which it is possible to
select statistics on prices for overnight stays from booking portals, which would behave similarly to the
average expenditure for overnight stays in the survey of trips for South American countries.
The variation in time of the variables is shown in the box-and-whiskers plot, where a thick line
determines the median of expenditure, box covers first and third quartiles, whiskers reflect extremes
(determined by McGill R., Tukey J. W., Larsen W. A. (1978)) while the circles show outliers. The red line
indicates the average price.
Figure 105. Distribution of average overnight expenditure from the survey of trips for South American countries (non-generalised data) [EUR]
In the analysed period, the coefficient of variation of expenditure in the individual data in subsequent
quarters ranged from 0.40 to 1.39, with the average of 1.01. The average expenditure for overnight
stays in the survey of trips changed dynamically and irregularly. This result suggests that it is likely to
be difficult to select price statistics for overnight stays from booking portals, which have a similar
variability as the average expenditure for overnight stays in the survey.
Similarly, data from web scraping are very variable, as can be seen in Figure 106. Due to the significant
number of outliers, it was limited only to the analysis of offers whose price for overnight stays did not
exceed EUR 700. Thus, from the original collection of 1.3 million offers, nearly 4 thousand offers that
did not meet the assumed price criterion were rejected. Before their rejection, the coefficient of
variation varied, depending on the quarter, from 1.65 to 4.55. On the other hand, after excluding from
the set of offers with a price over EUR 700, the coefficient of variation averaged 1.08, which is close to
the level determined on the basis of data from the sample survey.
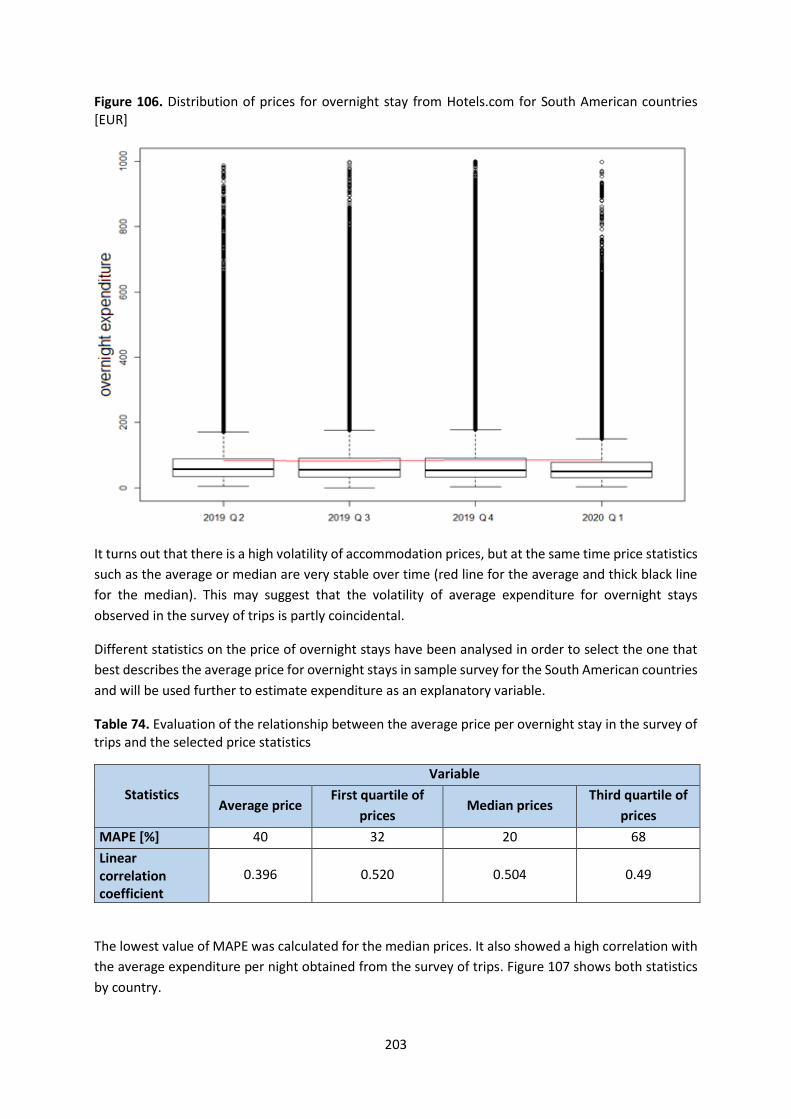
203
Figure 106. Distribution of prices for overnight stay from Hotels.com for South American countries [EUR]
It turns out that there is a high volatility of accommodation prices, but at the same time price statistics
such as the average or median are very stable over time (red line for the average and thick black line
for the median). This may suggest that the volatility of average expenditure for overnight stays
observed in the survey of trips is partly coincidental.
Different statistics on the price of overnight stays have been analysed in order to select the one that
best describes the average price for overnight stays in sample survey for the South American countries
and will be used further to estimate expenditure as an explanatory variable.
Table 74. Evaluation of the relationship between the average price per overnight stay in the survey of trips and the selected price statistics
Statistics
Variable
Average price First quartile of
prices Median prices
Third quartile of
prices
MAPE [%] 40 32 20 68
Linear correlation coefficient
0.396 0.520 0.504 0.49
The lowest value of MAPE was calculated for the median prices. It also showed a high correlation with
the average expenditure per night obtained from the survey of trips. Figure 107 shows both statistics
by country.

204
Figure 107. Median prices for overnight stays in the accommodation portal and the average price for overnight stays in the survey of trips
Analyses show that the classic measure of the central trend, which is the average, as well as positional
measures, such as, e.g. the third quartile, poorly reflect the average values of expenditure on
accommodation in a sample survey. The stability over time of the median accommodation price and,
at the same time, the fairly high similarity of its trend over time to the trend of average expenditure in
the survey of trips may suggest that its use may improve the stability of the results in that survey.
In order to estimate residents' tourism expenditure, data on airline ticket prices from kayak.com and
meal prices available on tripadvisor.com were also collected. However, due to the short time of data
collection and the small volume of the collection, such analyses as for overnight stays were not
conducted.
Estimation of travel expenses based on big data
Two groups of variables were used to build the model for estimating tourism expenditure:
sample survey: the number of tourists and overnight stays and a binary variable specifying the
country of destination of the trip
big data: median accommodation prices for NACE 55.1 and 55.2 establishments, median flight
ticket prices, average meal prices
ANCOVA’s analysis was used to determine the extent to which the selected variables allow the
variability of tourism expenditure to the South American countries to be explained. The ANCOVA
0,0
10,0
20,0
30,0
40,0
50,0
60,0
70,0Argentina
Bolivia
Brazil
Chile
Colombia
EcuadorParaguay
Peru
Uruguay
Trinidad and Tobago
Venezuela
Median price from accommodation portal Mean price from survey of trips

205
analysis showed that almost a third of the expenditure volatility can be explained by the explanatory
variables.
Figure 108. ANCOVA for tourism expenditure of tourists visiting South America in 2019
The sources of big data explain a total of 5.1% of the total expenditure volatility, which is 16.3% of the
explained volatility. The specificity of countries, which cannot be expressed by the variables from the
big data collections, represents only 0.8% of the total expenditure volatility. This means that several
variables coming from the web scraping of tourist portals fully actually explain the variability of
expenditure at the country level. The ANOVA analysis indirectly indicates that the linear model will
explain at most 31% of the expenditure variability. Therefore, without the use of more complex
methods, it will not be possible to better explain the variability of expenditure at the level of individual
data. For this reason, the best-performing methods measured by the average square error (RMSE) and
coefficient of determination (R-square), i.e. regressive tree (Breiman L., Friedman J. H., Olshen R. A.,
Stone C. J. (1984)) and the weighted method of k-nearest neighbours (Samworth R.J. (2012)) were used
during the project implementation.
Table 75. Statistics on tourism expenditure models for tourists visiting South America
Name of method RMSE R-square
Linear model 138.49 0.293
Regressive tree (cp=0.03) 119.50 0.466
Weighted method of k-nearest neighbours (k=5) 119.24 0.490
Using the k-nearest neighbours weighted method with k=5, the total expenditure of Poles travelling to
South American countries was estimated for individual quarters of 2019. Expenditure is presented on
a logarithmic scale, which shows the differences in expenditure between different countries
(see Figure 109). The result in the range of 6-7 means that expenditure was between 1 million and 10
68,7%
2,7%1,5%1,0%
25,4%
0,8%
31,3%
Residual variance Big data - flight tickets Big data - accommodation
Big data - restaurants and cafes Tourists and nights spent Country specificity
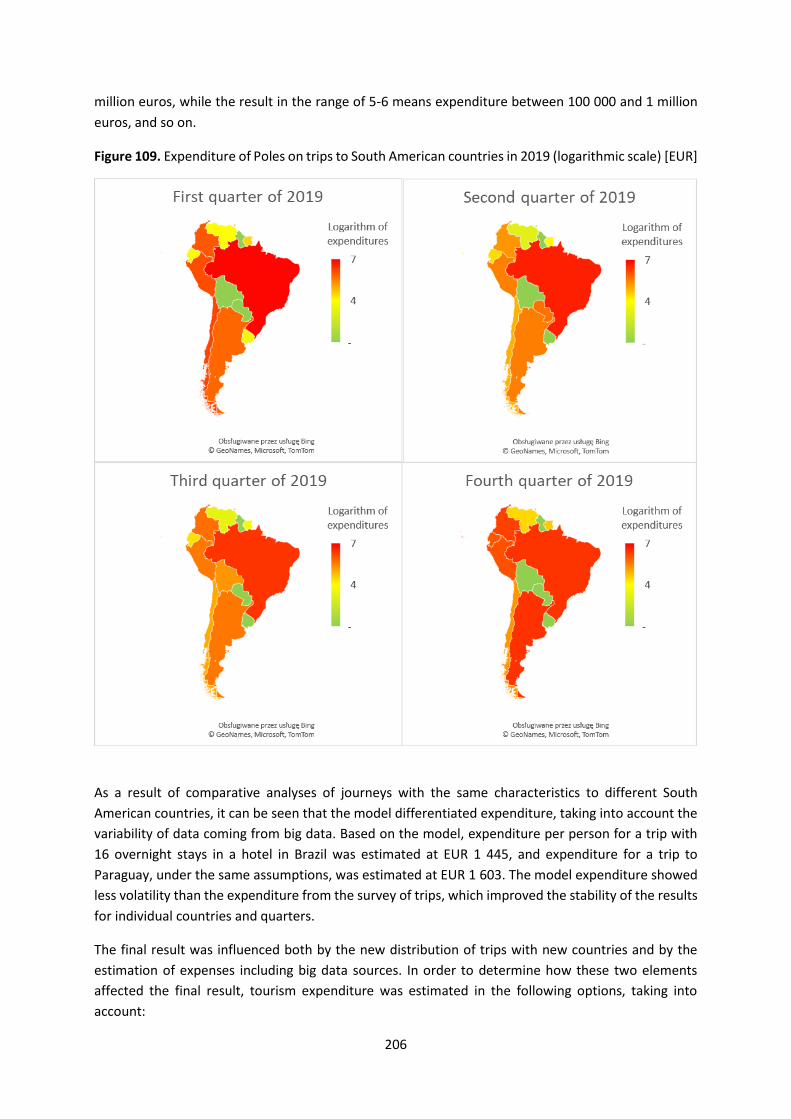
206
million euros, while the result in the range of 5-6 means expenditure between 100 000 and 1 million
euros, and so on.
Figure 109. Expenditure of Poles on trips to South American countries in 2019 (logarithmic scale) [EUR]
As a result of comparative analyses of journeys with the same characteristics to different South
American countries, it can be seen that the model differentiated expenditure, taking into account the
variability of data coming from big data. Based on the model, expenditure per person for a trip with
16 overnight stays in a hotel in Brazil was estimated at EUR 1 445, and expenditure for a trip to
Paraguay, under the same assumptions, was estimated at EUR 1 603. The model expenditure showed
less volatility than the expenditure from the survey of trips, which improved the stability of the results
for individual countries and quarters.
The final result was influenced both by the new distribution of trips with new countries and by the
estimation of expenses including big data sources. In order to determine how these two elements
affected the final result, tourism expenditure was estimated in the following options, taking into
account:

207
1. the average expenditure directly from the sample survey of trips and the distribution of trips
from the model,
2. the distribution of trips from the survey and the average expenditure from the model.
For 2019, total expenditure increased after modelling from EUR 22 335 000 by EUR 3 978 000 to
EUR 26 313 000. The amount of EUR 3 978 000 can be broken down into the effect of modelling the
expenditure itself, the change in the distribution of trips itself and the remaining effect of the total
change.
The following Sankey diagram (cf. Kennedy A.B.W., Sankey H.R. (1898)) shows the settlement of
changes in total expenditure by country and data sources.
Figure 110. Structure of expenditure on trips to South America in 2019 by country and data sources
Tourists from countries obtained from big data generated 1.5% of expenditure, and tourists from
countries that appeared in the survey in 2019, after modelling, generated 98.5% of expenditure. The
change in the distribution of trips alone generated 1% of the total expenditure, while modelling the
average expenditure alone generated 14% of the total expenditure.
Combination of administrative data, survey data and big data pertaining to air traffic enabled to
estimate trips to a larger number of countries than it results only from the survey of the participation
of Polish residents in trips.
The use of machine learning methods, taking into account data from web scraping of prices of flight
tickets, accommodation, costs of meals made it possible to estimate expenditure which are more
stable for individual countries and periods (quarters) then sample survey solely.

208
4.8. Experimental tourism statistics
Use Case Identification
Use Case ID WPJ.8.BG
Use Case Name Experimental tourism statistics
Date of creation 01.01.2019
Use Case Definition
Description: Applying the web scraping method to extract data from Booking.com and
Pochivka.bg for statistical purposes. The Booking.com is scraped daily
and Pochivka.bg is scraped weekly.
Preconditions: IT expert with web scraping experience and knowledge. IT operator for
execution of the software. Dedicated IT environment. The subject-
matter statistician is needed for processing and analysing of scraped
data.
Flow:
1. Analysing of websites structure.
2. Studying the possibility to use a free tool for web scraping and selecting the Webscraper.io
Chrome Extension as such.
3. Configuring the Webscraper.io Chrome Extension.
4. Scraping the data manually for seven months.
5. Extracting the configurations of Webscraper.io Chrome Extension for websites as JSON files.
6. Developing the Python Scrapy software with webscraper.io JSON configuration for scraping
the Booking.com and Pochivka.bg data.
7. Configuring the Python Scrapy software to be executed automatically on scheduled time.
8. Collection of scraped data automatically from Booking.com and Pochivka.bg.
9. Processing, editing and classifying scraped data.
10. Analysing data and produce experimental outputs for tourism statistics.
Issues/Exceptions:
• Only 80 pages of Bookings.com page could be scraped by Python Scrapy software.
• Changes on websites structures.
Output summary:
CSV files with scraped accommodation data.
Estimates on scraped data:
Descriptive statistics by accommodation types.
Price index per week/month by NUTS 3
Correlation coefficient between rating and price
Average price of accommodations by months for Booking.com and Pochivka.bg

209
Experimental statistics on accommodations at Booking.com and Pochivka.bg
Aims
The Bulgarian National Statistical Institute (BNSI) is interested in producing experimental statistics by
applying the web scraping method to extract data from Booking.com and Pochivka.bg for statistical
purposes. On the basis of the collected scraped data and their processing, the following outputs were
produced:
Number and change of accommodations by type and months/weeks,
Number of accommodations by NUTS 3 and months/weeks,
Average price of accommodations by NUTS 3, by Type and by months/weeks ,
Price index of accommodations by NUTS 3, by Type and by months/weeks,
Correlation coefficient between rating and price,
Average price of accommodations by months/weeks for Booking.com and Pochivka.bg.
Data Sources
BNSI used the following data sources to reach the main aims of this use case:
www.Booking.com
www.Pochivka.bg
Booking.com is scraped daily and Pochivka.bg is scraped weekly.
Methodology
Regarding collection of data from Booking.com, the BNSI IT experts developed a script based on
Webscraper.io Chrome Extension, which successfully extracted data daily from April 26, 2019 until
March 15, 2020 for the purpose of the survey. Over 300 daily files with some holiday gaps were
collected. Since October last year, the Python Scrapy software with webscraper.io JSON configuration
has been developed. 281 files since October 2019 until August 2020 with daily information for
accommodations offered for two adults at current day by Booking.com were collected. The collected
data by script based on Webscraper.io Chrome Extension are not with good quality and are treated as
test data. For this reason it was decided (after working out Python Scrapy software) to use the scraped
data for October 2019 – August 2020 for the current use-case and for calculating the above-mentioned
indicators.
The daily collected information from Booking.com consists of the following characteristics:
pagination (page with offers),
priority (for sorting purposes),
element (site – www.booking.com),
hotel name,
location (for NUTS 3 classification),
price,
currency,
rating,
review_Count,
date_scraped.

210
BNSI collects weekly information for accommodations offered by www.pochivka.bg. The information
consists of offer URL:
pagination,
priority,
page,
hotel_name,
rating,
location,
price_silen_leten, price_slab_leten, price_silen_zimen, price_slab_zimen, price_other_season
currency,
address,
tip_nast,
date_scraped,
The detailed flow for execution of the use-case 2 could be described in nine main steps:
1. Analysing of websites structure.
2. Studying the possibility of using a free tool for web scraping and selecting the Webscraper.io
Chrome Extension as such.
3. Configuring the Webscraper.io Chrome Extension.
4. Scraping the data manually for seven months.
5. Extracting the configurations of Webscraper.io Chrome Extension for websites as JSON files.
6. Developing the Python Scrapy software with webscraper.io JSON configuration for scraping
the Booking.com and Pochivka.bg data.
7. Configuring the Python Scrapy software to be executed automatically on scheduled time.
8. Collection of scraped data automatically from Booking.com and Pochivka.bg.
9. Processing, editing and classifying scraped data.
The processing of data consists of primary editing of the data and then classification of the edited data.
For this aim, the national classification of the populated places (EKATTE) (Universal classification of
administrative and territorial units) was used and after that it was aggregated, in order that the data
for accommodation are aggregated up to level region (NUTS 3). Furthermore, the classification for the
types of accommodation was also applied. Thus the test scraped data for availability of vacant
accommodation are distributed in three large categories: Hotels (Hotels, Motels, Apart hotels, Family
hotels), Private accommodations (apartments and guest rooms) and others, n.e.c (camping sites,
hostels and any other n.e.c accommodations).
Analysis of data is done with the aim to monitor the accommodations and their prices in the time.
All experimental outputs relate to weekly and monthly periods. The annual price of accommodation
for 2 persons has been calculated as simple mean by the statistical functions of Python script.
Results
All aggregated tables with results for the respective indicators for the period October 2019 –
August 2020 are available on the BNSI Intranet at the rubric “Experimental statistics from Big Data
sources” while they are generated automatically from the special database for big data.

211
This is the first experiment of BNSI for scraping data from tourist websites. In this document, for the
objectives of the project the result of our work during the two-year period of the project were
illustrated.
On the basis of the data received, one could make flash estimates for the trend for supply of
accommodation (double rooms) and the change of their prices in the time at national and regional
level, as well as per types of accommodation.
Unfortunately, these results still have only experimental character and have to be treated as such,
without evaluating their quality.
In the future, experimenting towards this direction will be continued aiming at using these data as
additional, alternative source for production of official tourist statistics.
The following indicators were produced on the weekly and monthly bases:
Indicator 1: Number and change of accommodations by type and period
Note: due to the large size of the weekly data, this document presents only graphically for
completeness.
The monthly data are presented in their wholeness.
Table 76. Number and change of accommodations by type and months for Booking.com
Month
Hotels (Hotels, Motels, Apart hotels, Family
hotels)
Private accommodations (apartments and
guest rooms)
Others, n.e.c
Hotels Change
Private accommodations
Change
Others Change
2019-10 11 023 11 423 6 665 0 0 0
2019-11 7 781 7 468 4 778 -0.29411 -0.34623 -0.28312
2019-12 8 150 6 742 4 585 0.047423 -0.09721 -0.04039
2020-01 8 012 6 023 3 902 -0.01693 -0.10664 -0.14896
2020-02 10 172 9 373 5 780 0.269596 0.556201 0.481292
2020-03 10 382 12 026 7 802 0.020645 0.283047 0.349827
2020-04 8 806 12 380 7 373 -0.1518 0.029436 -0.05499
2020-05 9 814 12 053 7 255 0.114467 -0.02641 -0.016
2020-06 13 153 11 598 5 547 0.340228 -0.03775 -0.23542
2020-07 15 201 10 953 4 329 0.155706 -0.05561 -0.21958
2020-08 15 692 10 118 4 255 0.032301 -0.07623 -0.01709
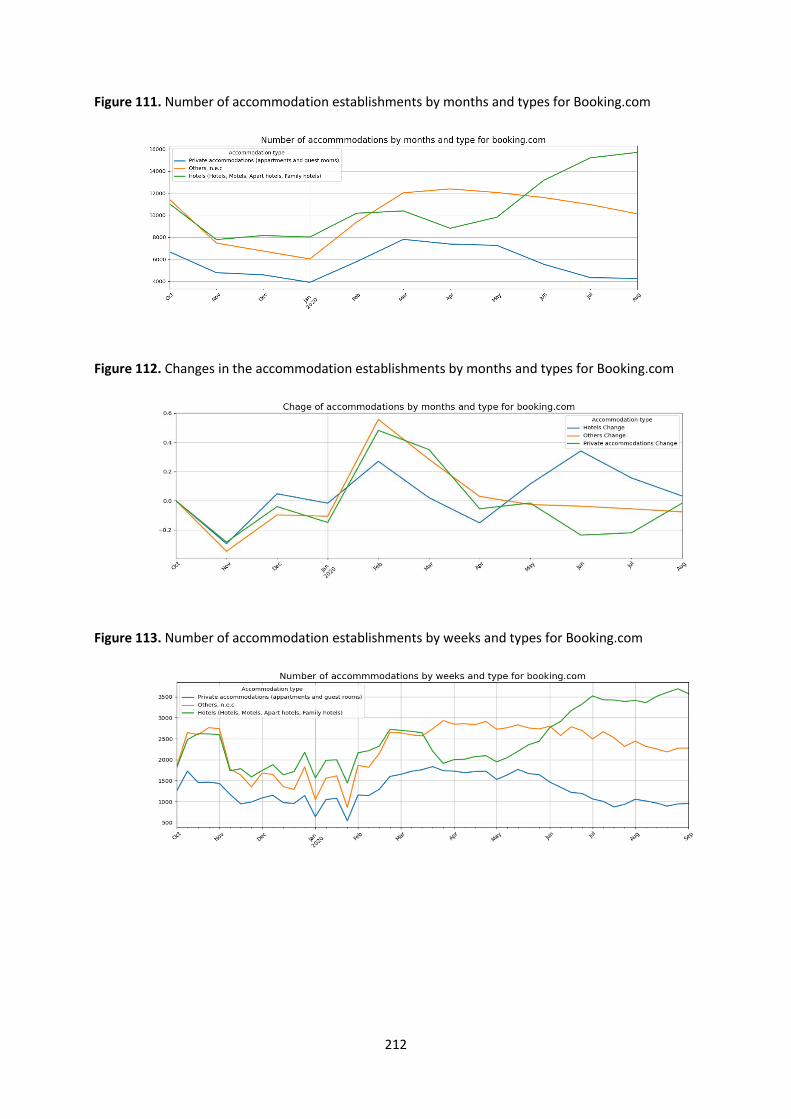
212
Figure 111. Number of accommodation establishments by months and types for Booking.com
Figure 112. Changes in the accommodation establishments by months and types for Booking.com
Figure 113. Number of accommodation establishments by weeks and types for Booking.com
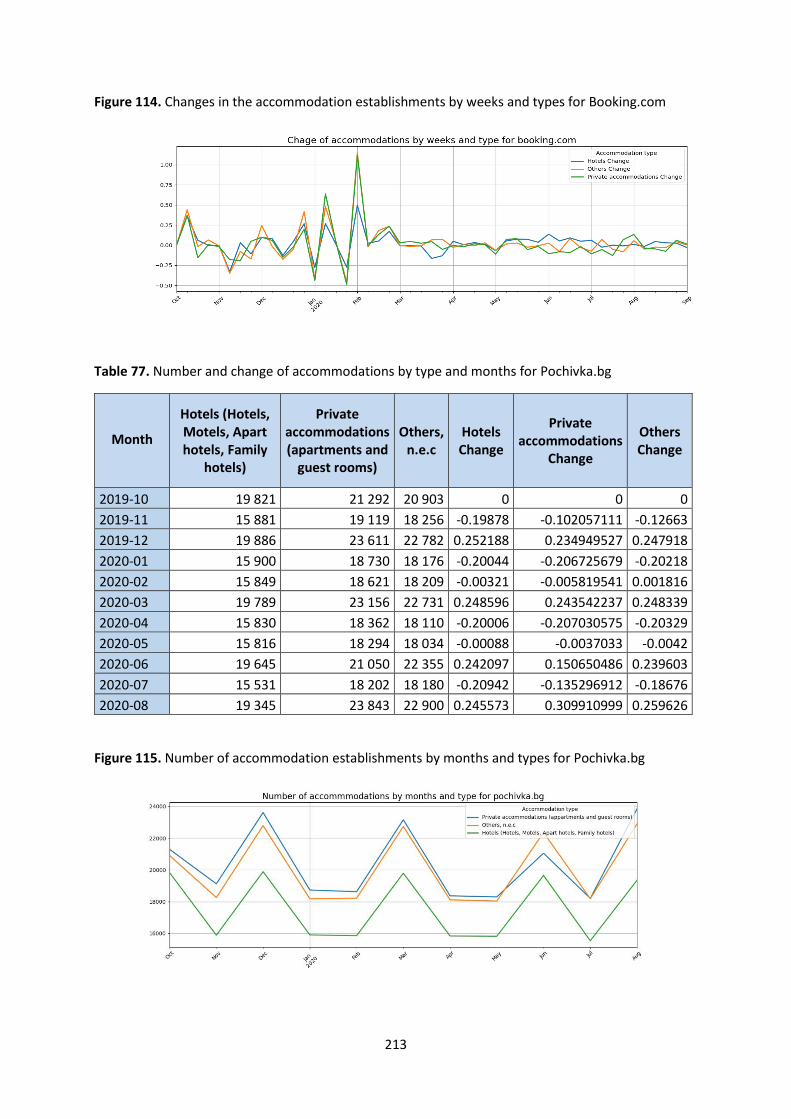
213
Figure 114. Changes in the accommodation establishments by weeks and types for Booking.com
Table 77. Number and change of accommodations by type and months for Pochivka.bg
Month
Hotels (Hotels, Motels, Apart hotels, Family
hotels)
Private accommodations (apartments and
guest rooms)
Others, n.e.c
Hotels Change
Private accommodations
Change
Others Change
2019-10 19 821 21 292 20 903 0 0 0
2019-11 15 881 19 119 18 256 -0.19878 -0.102057111 -0.12663
2019-12 19 886 23 611 22 782 0.252188 0.234949527 0.247918
2020-01 15 900 18 730 18 176 -0.20044 -0.206725679 -0.20218
2020-02 15 849 18 621 18 209 -0.00321 -0.005819541 0.001816
2020-03 19 789 23 156 22 731 0.248596 0.243542237 0.248339
2020-04 15 830 18 362 18 110 -0.20006 -0.207030575 -0.20329
2020-05 15 816 18 294 18 034 -0.00088 -0.0037033 -0.0042
2020-06 19 645 21 050 22 355 0.242097 0.150650486 0.239603
2020-07 15 531 18 202 18 180 -0.20942 -0.135296912 -0.18676
2020-08 19 345 23 843 22 900 0.245573 0.309910999 0.259626
Figure 115. Number of accommodation establishments by months and types for Pochivka.bg

214
Figure 116. Changes in accommodation establishments by months and types for Pochivka.bg
Figure 117. Number of accommodation establishments by weeks and types for Pochivka.bg
Figure 118. Changes in accommodation establishments by weeks and types for Pochivka.bg
From Table 76 and Table 77 and their graphic images it is seen that since the beginning of the observed
period (October 2019) the monthly and weekly data for both websites follow smooth trend – the share
of the accommodation of the type of hotels and private apartments (double rooms) is the greatest.
This trend changes sharply in March 2020 when the lockdown for COVID-19 started worldwide. From
the graphics it is seen clearly that the number of supplied accommodations rises sharply since there is
no demand. After June 2020 it starts a smooth decrease in the accommodations, which is due to the

215
recovered demand on behalf of the consumers and gradually going out of the COVID collapse.
An interesting detail is the sharp decrease in the number of supply of the type of private apartments,
which shows that people seek mostly secluded accommodations but not hotel accommodation.
Due to this reason the number of supplied hotels continues to rise, even during the heaviest summer
months – July and August.
Indicator 2: Number of accommodations by NUTS 3 and period
The distribution of the offered accommodation by regions (NUTS 3) shows difference between the two
sources – Booking.com and Pochivka.bg (see Table 78 ad Table 79).
On the first website the number of the supplied accommodation is the biggest in the capital city, in the
large seaside centres – Burgas and Varna, and in the mountain centres. The other regions in the country
are far behind due to lack of demand and interest, as well as due to lack of concentration of
accommodations. This makes the structure of the accommodation at regional level significantly
uneven. Unlike booking, the biggest national tourist website – Pochivka.bg offers more evenly
distribution of the accommodation at regional level, including in smaller regional towns. Most likely
this is due to the fact that package tourist services are offered on this website, including
accommodation for rural tourism.
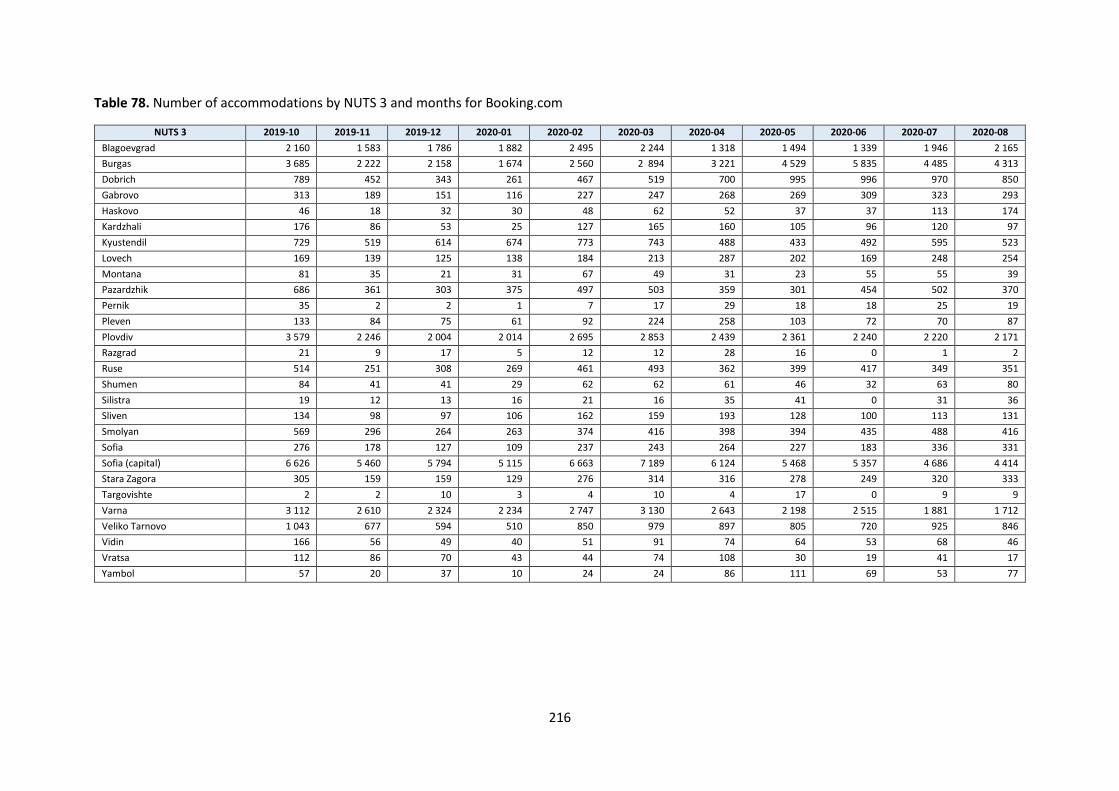
216
Table 78. Number of accommodations by NUTS 3 and months for Booking.com
NUTS 3 2019-10 2019-11 2019-12 2020-01 2020-02 2020-03 2020-04 2020-05 2020-06 2020-07 2020-08
Blagoevgrad 2 160 1 583 1 786 1 882 2 495 2 244 1 318 1 494 1 339 1 946 2 165
Burgas 3 685 2 222 2 158 1 674 2 560 2 894 3 221 4 529 5 835 4 485 4 313
Dobrich 789 452 343 261 467 519 700 995 996 970 850
Gabrovo 313 189 151 116 227 247 268 269 309 323 293
Haskovo 46 18 32 30 48 62 52 37 37 113 174
Kardzhali 176 86 53 25 127 165 160 105 96 120 97
Kyustendil 729 519 614 674 773 743 488 433 492 595 523
Lovech 169 139 125 138 184 213 287 202 169 248 254
Montana 81 35 21 31 67 49 31 23 55 55 39
Pazardzhik 686 361 303 375 497 503 359 301 454 502 370
Pernik 35 2 2 1 7 17 29 18 18 25 19
Pleven 133 84 75 61 92 224 258 103 72 70 87
Plovdiv 3 579 2 246 2 004 2 014 2 695 2 853 2 439 2 361 2 240 2 220 2 171
Razgrad 21 9 17 5 12 12 28 16 0 1 2
Ruse 514 251 308 269 461 493 362 399 417 349 351
Shumen 84 41 41 29 62 62 61 46 32 63 80
Silistra 19 12 13 16 21 16 35 41 0 31 36
Sliven 134 98 97 106 162 159 193 128 100 113 131
Smolyan 569 296 264 263 374 416 398 394 435 488 416
Sofia 276 178 127 109 237 243 264 227 183 336 331
Sofia (capital) 6 626 5 460 5 794 5 115 6 663 7 189 6 124 5 468 5 357 4 686 4 414
Stara Zagora 305 159 159 129 276 314 316 278 249 320 333
Targovishte 2 2 10 3 4 10 4 17 0 9 9
Varna 3 112 2 610 2 324 2 234 2 747 3 130 2 643 2 198 2 515 1 881 1 712
Veliko Tarnovo 1 043 677 594 510 850 979 897 805 720 925 846
Vidin 166 56 49 40 51 91 74 64 53 68 46
Vratsa 112 86 70 43 44 74 108 30 19 41 17
Yambol 57 20 37 10 24 24 86 111 69 53 77

217
Table 79. Number of accommodations by NUTS 3 and Months for Pochivka.bg
NUTS 3 2019-10 2019-11 2019-12 2020-01 2020-02 2020-03 2020-04 2020-05 2020-06 2020-07 2020-08
Blagoevgrad 3 171 2 674 3 281 2 634 2 656 3 475 2 857 2 840 3 311 2 715 3 422
Burgas 23 039 20 172 25 194 20 096 19 956 24 960 19 950 19 733 23 423 19 496 25 066
Dobrich 2 549 2 190 2 722 2 168 2 158 2 539 1 974 2 013 2 529 2 096 2 661
Gabrovo 1 367 1 167 1 475 1 188 1 187 1 480 1 185 1 191 1 493 1 171 1 428
Haskovo 520 438 534 434 442 491 363 379 526 414 529
Kardzhali 538 444 573 458 461 576 421 430 549 457 582
Kyustendil 1 244 1 005 1 273 1 019 1 025 1 275 1 019 1 021 1 279 1 050 1 318
Lovech 1 537 1 343 1 650 1 294 1 294 1 608 1 280 1 272 1 580 1 261 1 595
Montana 463 390 498 398 408 500 402 401 478 396 495
Pazardzhik 1 720 1 459 1 781 1 426 1 413 1 721 1 365 1 365 1 683 1 389 1 777
Pernik 99 90 102 85 89 112 93 91 110 83 95
Pleven 319 260 321 261 259 315 254 252 326 265 335
Plovdiv 2 706 2 277 2 817 2 237 2 247 2 865 2 310 2 311 2 782 2 281 2 862
Razgrad 106 91 112 91 93 91 61 63 117 92 110
Ruse 867 731 915 746 735 869 652 663 853 712 912
Shumen 497 430 552 436 439 523 405 402 538 440 551
Silistra 113 87 104 84 83 108 89 87 109 94 111
Sliven 512 436 544 442 435 543 438 439 532 435 537
Smolyan 2 174 1 840 2 276 1 841 1 837 2 254 1 799 1 803 2 254 1 790 2 265
Sofia 1 505 1 279 1 605 1 297 1 299 1 482 1 142 1 149 1 594 1 250 1 585
Sofia (capital) 2 419 1 913 2 349 1 831 1 820 2 292 1 826 1 826 2 213 1 802 2 251
Stara Zagora 595 536 671 540 544 687 537 540 668 523 673
Targovishte 123 103 137 106 115 138 108 110 131 106 137
Varna 3 358 2 922 3 647 2 850 2 818 3 675 3 006 2 977 3 379 2 867 3 707
Veliko Tarnovo 1 938 1 607 1 963 1 554 1 554 2 003 1 611 1 601 1 910 1 561 1 954
Vidin 273 220 277 214 230 346 315 308 324 270 328
Vratsa 195 167 211 171 175 258 220 218 230 192 217
Yambol 619 546 696 521 526 465 249 283 525 442 605

218
Indicator 3: Average price of accommodations by NUTS 3, type and period
Note: Due to the large size of this kind of tables with data it is impossible to include them in this
document. All results are presented only graphically.
The average monthly and weekly prices for the period October 2019 – August 2020 for the offered
accommodations are with nearly equal values for both observed websites. As expected, the average
prices decrease during the period after the COVID lockdown and begin to rise smoothly during the
summer period and to recover their level before March 2020. This indicator could be used as
observation of the change in the average prices of the different type accommodation in almost real
time (for double rooms).
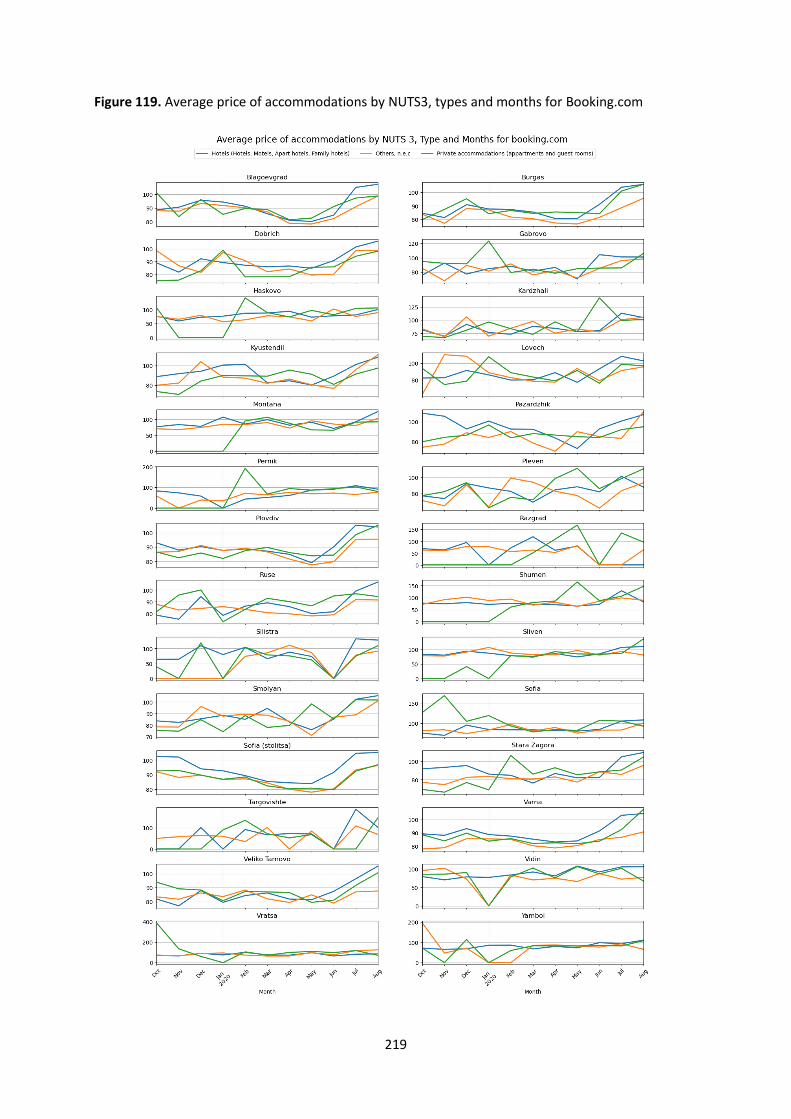
219
Figure 119. Average price of accommodations by NUTS3, types and months for Booking.com

220
Figure 120. Average price of accommodations by NUTS3, types and months for Pochivka.bg
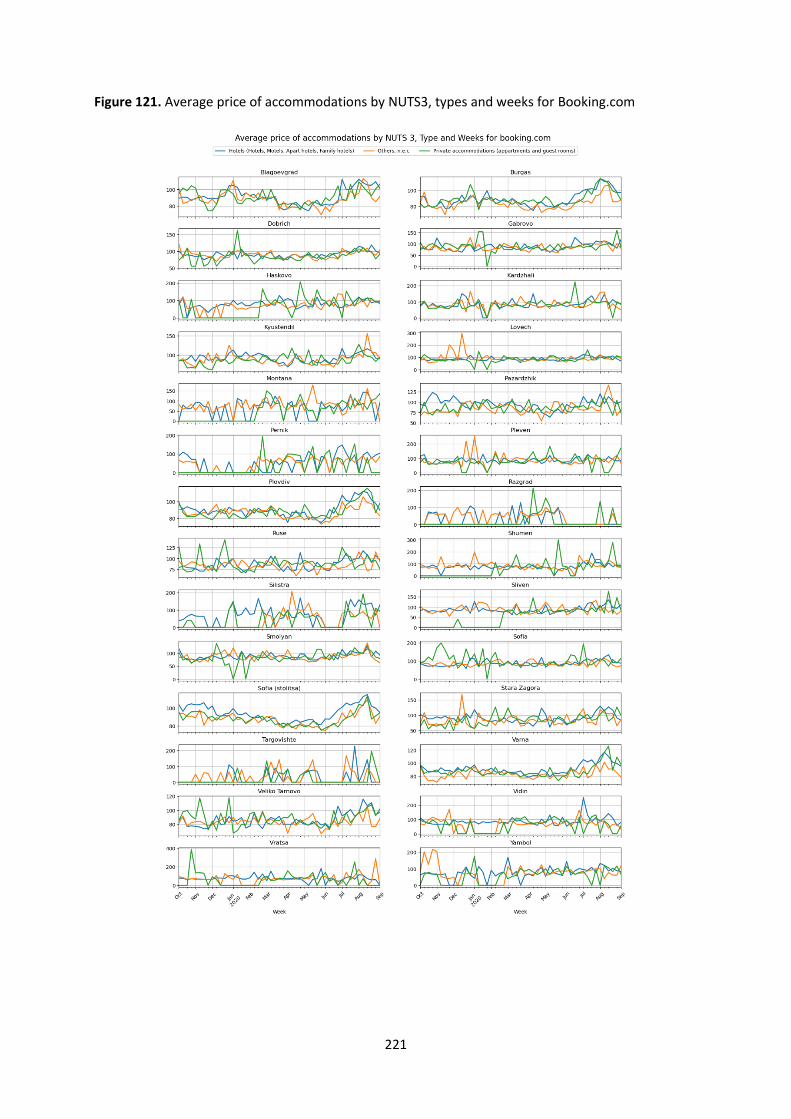
221
Figure 121. Average price of accommodations by NUTS3, types and weeks for Booking.com

222
Figure 122. Average price of accommodations by NUTS3, types and weeks for Pochivka.bg

223
Indicator 4: Price index of accommodations by NUTS 3, type and period
Note: Due to the large size of this kind of tables with data it is impossible to include them in this
document. All results are presented only graphically.

224
Figure 123. Price index of accommodations by NUTS3, types and weeks for Booking.com

225
Figure 124. Price index of accommodations by NUTS3, types and months for Booking.com

226
Figure 125. Price index of accommodations by NUTS3, types and weeks for Pochivka.bg

227
Figure 126. Price index of accommodations by NUTS3, types and months for Pochivka.bg
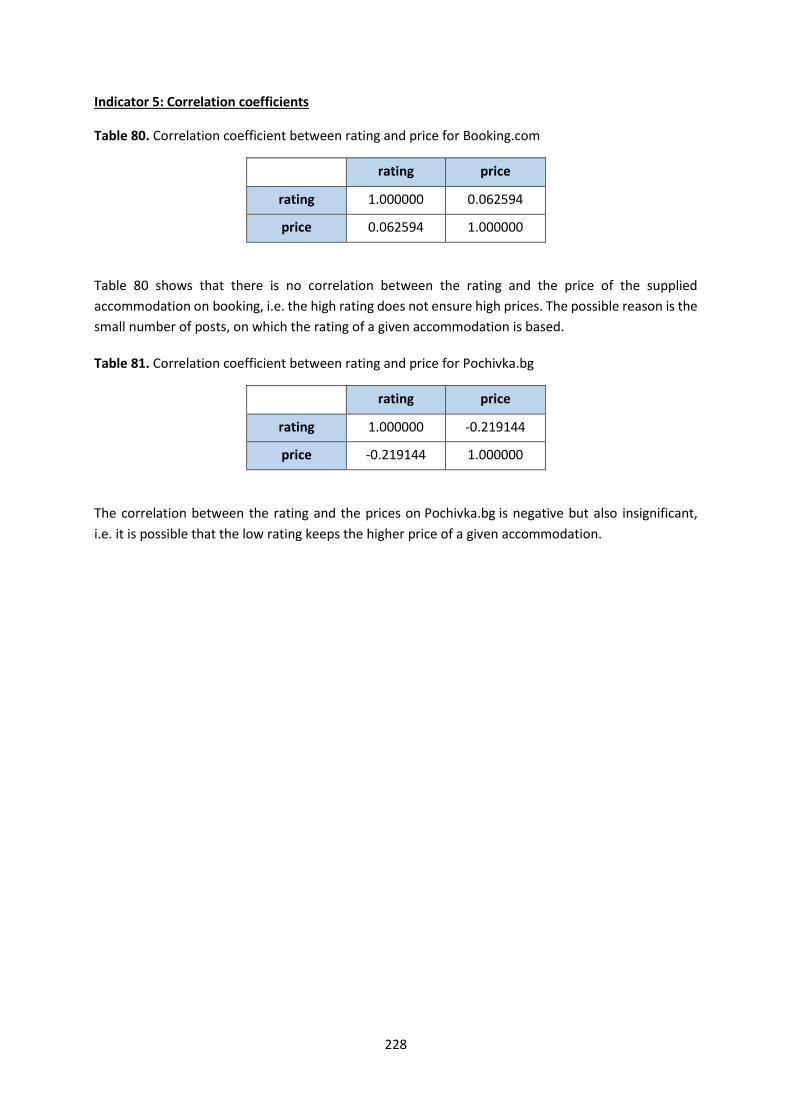
228
Indicator 5: Correlation coefficients
Table 80. Correlation coefficient between rating and price for Booking.com
rating price
rating 1.000000 0.062594
price 0.062594 1.000000
Table 80 shows that there is no correlation between the rating and the price of the supplied
accommodation on booking, i.e. the high rating does not ensure high prices. The possible reason is the
small number of posts, on which the rating of a given accommodation is based.
Table 81. Correlation coefficient between rating and price for Pochivka.bg
rating price
rating 1.000000 -0.219144
price -0.219144 1.000000
The correlation between the rating and the prices on Pochivka.bg is negative but also insignificant,
i.e. it is possible that the low rating keeps the higher price of a given accommodation.

229
Use Case Identification
Use Case ID WPJ.8.NL
Use Case Name Experimental tourism statistics
Date of creation 05.04.2020 (Last update 02.10.2020)
Design scope (Sub-) system from which most specifications are a “black-box”20.
Use Case Definition
Description: Use Google Trends (GT) API to find proxies of number of tourists and
number of nights spend by tourists.
Preconditions: 1. User has to select the names of platforms to be checked in the API.
2. User has to select the tourist countries of interest.
3. Survey data on guests and nights spent (2015-2020) are available.
Flow:
1. Extract (week) GT indexes about NL, BE, DE, US, UK and World using keywords “booking”,
“hotels”, “airbnb”, “trivago”, “tripadvisor” and “bed and breakfast” using the Google Trends
API
2. Concatenate weekly data and estimate monthly GT index averages.
3. Compute cumulative indices based on platforms and developments (Year-on-Year and Month-
on-Month).
4. Link GT indices to Survey data.
5. Compute Correlation matrix.
6. Use index developments to estimate number of tourists and number of nights spent by tourists
in the Netherlands.
Issues/Exceptions:
1. The GT API provides an (time dependent) index in the range 1-100.
2. GT indices are available for the last 5 years.
3. Effects of rescaling on the estimates have to be researched yet.
4. Estimates about February and March obtained at the beginning of April 2020 were not accurate
enough (see Figure 127)
5. Estimates about Augustus and September obtained in October 2020 seem reasonable
(see Figure 128)
6. This approach concentrates in hotels, holiday homes, bed and breakfast and Airbnb-
accommodations. Camping parks and other country-side accommodation forms are out-of-
scope.
7. Notice that searching an accommodation with Google (input data of Google Trends) does no
immediately means that there is a real booking of an accommodation. It does not provide
information either on the number of guests connected to the searcher. The latter means that
two persons can be searching an accommodation for just one visitor. But also that one person
20 Three hierarchical categories from Cockburn Design scope (sub)system black-box, (sub)system white-box and component were used. [Cockburn (2001), “Writing effective use cases. Addison-Wesley. ISBN 0-201-70225-8. OCLC 44046973”].

230
can be searching (and eventually booking) an accommodation for one person or more.
Moreover, the indices returned by the GT API are in the scale 1-100. These are re-scaled
permanently21.
8. The results can be biased because the Survey data on guests and night spent does not include
guests (nor nights spent) booked via Airbnb.
9. Only GT-indices from NL were used in the exploratory estimations (based on the correlations
found). The estimates for German, British and US American tourists is not shown here as it
requires further analysis.
10. Autocorrelation (and tuning based on time-lags) have not been taken into account yet.
Output summary:
Continuous research and feasibility studies of innovative data sources is a crucial task for Statistical
Offices to support the quality and timeliness of tourism statistics. The current case study shows the
results obtained by using Google Trends (GT) at three moments in time.
T1) immediately after the announcement of the corona lock-down in the Netherlands: third week
of March 2020;
T2) during the first week of the (first-wave) corona lock-down: first week April 2020, and
T3) during the first week of the (second-wave) corona without lock-down but with strict public
measures (i.e. not enforced but strongly advised): last week of September 2020.
The main research question is about finding proxies of the number of tourists and the number of nights
spent by tourists in the Netherlands. Therefore, the country of origin of the most frequent visitors of
the Netherlands were used as input data and the platforms (that potential) visitors may be using to
find an accommodation to visit the Netherlands as keywords.
The results shown here are based on the case of guests and nights spent in hotels in the city of
Amsterdam. The correlation matrices obtained at time T1 are shown in the Figure 127. The highest
correlations values belong to “booking Amsterdam” and “all countries” (= 0.72) and “booking
Amsterdam” and “European excl. Dutch”. Surprising are the negative correlation values of “hotels
Amsterdam” and almost all countries of origin.
21 Stephens-Davidowitz, S. and Varian, H. (2014), A Hands-on Guide to Google Data, Section 4, p. 9-22, Google, Inc., September 3, 2014 (Revised March 7, 2015).

231
Figure 127. Correlation matrices at time T1
A cumulative GT is proposed as proxy for the number of guests spending the night in hotels in
Amsterdam. In the Figure 128, the three curves (cumulative) GT-index, survey estimates available at
the moment of the corona lock-down and number of guests estimated using the development of the
cumulative GT-index was shown. It was observed that there is a strong correlation (0.80).
Figure 128. Estimates of the total number of guests in hotels in Amsterdam at time T1
An update of the estimation has been done at time T3. Figure 129 shows the corresponding
correlations and Figure 130 the estimates. Notice that based on a suggestion of Statistics Poland and
a comment of Statistics Italy, a ranking page for travel and tourism22 has been used to check which
portals are the most relevant for the Netherlands. This page shows that Tripadvisor is more relevant
than Trivago. This information has been used in the keywords choice for the update of the results on
Google Trends.
22 https://www.similarweb.com/top-websites/category/travel-and-tourism/

232
Figure 130 shows again three curves: (cumulative) GT-index, survey estimates available at the moment
of the (second-wave) corona and number of guests estimated using the development of the cumulative
GT-index. A strong correlation (= 0.93) is observed.
Figure 129. Correlation matrices at time T3
Figure 130. Estimates of the total number of guests in hotels in Amsterdam at time T1
In conclusion, the cumulative GT-index seems to be a good proxy for the number of guests.
Furthermore, based on the correlations and rapid estimates, GT-indices may be considered as
a potential input for statistics. However, the method is not robust enough yet for rapid estimates and
other unforeseen events, such as the corona pandemic. Notice, though that almost all methods might
fail in such extreme conditions.
233
5. Conclusions
This chapter outlines the complex dynamics and the need of an up-to-date system for the integration
and monitoring of information about Tourism in Europe. It also provides a set of findings obtained
through case studies as a result of the work carried out by the ESSnet Big Data II (Pilot Track) Work
Package J on Innovative Tourism Statistics. Furthermore, it points out the benefits of using micro-services
implemented in the Tourism Integration and Monitoring System (TIMS) which were modularly tested
across eight European WPJ partners. Finally, this chapter summarizes the enriched and deepen available
evidence base on big data methodology and implemented processes as cornerstones of the prototype
TIMS system and its potentialities.
Tourism statistics in context
Changes in the behaviour of tourists, the broad adoption of new technologies in the tourism economy,
actualization of EU legislation (GPDR) as well as the rising of unforeseen large-scale events (such as the
COVID-19 pandemic), force national statistical offices to conduct activities consisting of constant
identification of new sources of information, improvement of statistical approaches of obtaining data,
and innovation in linking both to their production processes and statistical output. Meeting these
challenges is an extremely complex phenomenon. This is due to frequent limitations in access to the
resources of administrators, differences in the methodology used during data collection, processing and
compilation, as well as difficulties in the selection of methods used to combine data from external
sources with data held by official statistics.
The WPJ was implemented in cooperation with employees from eight European statistical offices. All of
them with diverse backgrounds and more importantly representing their own countries tourism realities
and potential but with the same goal: Respond to the dynamic challenges being faced by the tourism
economy. The involvement of people with many years of experience in the field of tourism and IT allowed
the development of technical and methodological solutions that can be used in the future to improve
the quality of tourism statistics.
Sources of information
The research shows that in all participating European countries, there are additional sources that can
be used to improve the quality of survey results on both the demand and supply sides of tourism
(see WPJ product Catalogue of Sources). Although at the moment, not all of the 130 sources identified
in the project have open access to data, there are chances to use their potential in the future, based
on appropriate arrangements with individual administrators.
During the project, innovative sources from smart systems were also identified. These can be an
important source of information for tourism statistics and are in the possession of many European
cities. They include data from Automatic Number Plate Recognition System (ANPRS) which enhance
the monitoring of vehicle movements or the use of parking spaces. Data provided by Smart City can be
used to estimate tourist traffic at the local level, including traffic related to the organization of mass
events such us concerts and sports events. Moreover, data source like anonymized data from mobile
networks allow to measure aggregated tourism flows (e.g. day visits, event tourism) besides overnight
tourism.

234
Due to the frequency of data updates, it is particularly important to recognize and use big data
collections obtained from websites. During the implementation of the project, it was shown that global
and local portals, containing information on accommodation, food and transport prices offer great
potential for the improvement of the quality of statistical data in the field of tourism. They can provide
data on the number of tourist establishment, trips of tourists and their expenses. Based on the analysis
of the scraped data, it was concluded that the offers posted on international portals have the largest
amount of relevant information about collective accommodation establishments, such as: price per
night, address details, geolocation data, number of stars, customer reviews, etc. This information can
be used for creating official statistics for both the demand side and the supply side of tourism. Notice
that web scraping supports the identification and categorization of new accommodation types,
e.g. the rising of the accommodation type “chalets” in the Netherlands which reflects the Dutch policy
efforts to flatten the curve of spreading the coronavirus pandemic in the Netherlands.
Furthermore, notice also that in three countries participating in the project (Bulgaria, Poland, Slovakia),
it was shown that local portals are richer than global ones in the offers of small accommodation
establishments, e.g. agritourism farms, which often do not advertise on international portals. It should
be emphasized that this is of particular importance in the time of the COVID-19 pandemic. This is due
to a change in the behaviour of tourists who, due to the introduced restrictions on international traffic
and maintaining social distance, began to use small accommodation establishments more often.
Therefore, as part of the project, web scraping was developed for both global and local portals.
It must be stressed that the recent draft agreement between Eurostat and the international platforms
concerning the exchange of data and metadata on short-stay accommodation for compiling official
statistics will, of course, facilitate the country’s access to these data. Nevertheless, the download of
data from websites is still necessary to enrich the information provided by official statistics by
collecting other variables on tourist accommodation establishments (e.g. their facilities, their services
for persons with reduced mobility, their geographic coordinates, etc.). This is useful concerning hotels
but, above all, to the other collective accommodation and in particular to “holiday dwellings” and
“private accommodations” to make statistics on these establishments.
Due to the international nature of the project and the large diversity of individual portals in terms of
their structure, the WPJ developed a common method for retrieving data from websites. For this
purpose, using technologies and open source libraries, a tool (Visual Modeler) was created to facilitate
the extraction of data from unstructured sources. The versatility of the tool was confirmed by all
project partners. Thanks to the built-in functionalities, it was possible to download data from web
portals in a consistent manner in all countries. Visual Modeler, in comparison to other methods of data
collection, is distinguished primarily by its user interface, thanks to which no specialized programming
knowledge is required to initiate the web scraping process23.
Furthermore, an open source visualization tool (visNetwork) has been develop to provide a dynamic
and rapid overview of the Inputs and Outputs of the WPJ pilot project, i.e. showing the data sources
and the expected results relationships across the eight participating countries (Flow Models).
23 A short video about Visual Modeler is available on https://youtu.be/cYETq0rIT9k.

235
Statistical approaches
During the course of the work, all project partners tested several methods for combining web scraping
data with data from the tourist accommodation survey. For this purpose, the address data was
standardized with the use of a geolocation micro-service (using the HERE Maps API). On the basis of
the obtained results, it was shown that the method of combining records, based only on address data,
is prone to errors resulting from different methods of data recording. Although the method of
combining data based on geographic coordinates allowed to obtain results in a shorter time, the
precision of the obtained results was still unsatisfactory. A hybrid solution turned out to be the most
effective way to combine data prepared by the project group. This solution consisted in combining the
data connection method based on geographic coordinates with the use of a specified distance radius
with address data. Thanks to the use of the hybrid method, results characterized by high precision
were obtained.
As part of the project implementation, many methods related to the connection, processing and
development of tourism data were used (including Distance-based data linkage with Vincenty's
formulae, Least absolute shrinkage and selection operator, LASSO, Ridge regression, Spatial-temporal
disaggregation with regularization term, Linear model, ARIMA, James-Stein estimator, Regression
Trees, Support Vector Machine, Random Forest, Optimal Weighted Nearest Neighbor Classifiers,
Predictive Mean Matching, Bayesian Linear Regression, Random Indicator for Nonignorable Data),
which allowed to:
estimate the number of residents' trips to countries not shown in the survey of trips. The
results were obtained by combining administrative data, statistical surveys data and big data
in the field of air traffic,
estimate the size of tourists' expenses using the machine learning method in terms of flight
schedules and prices of accommodation, air tickets and meals. This ensured greater stability
of the results for individual countries and quarters than the estimation of data only on the
basis of the sample survey alone,
disaggregate monthly data on the occupancy of accommodation establishments into daily
data, maintaining weekly seasonality and calendar effects,
develop flash estimates of the number of people accommodated in tourist accommodation
establishments in the T + 1 period, with significant use of data obtained through web scraping
from local and global accommodation portals. The obtained results were highly competitive
with the results obtained from the monthly survey of the occupancy of accommodation
establishments in tourism. It must be admitted, however, that the COVID-19 pandemic
situation forced the project team to revise models that are resistant to extreme situations,
improve the quality of estimates for the main Tourism Satellite Account (TSA) aggregates,
including, in particular, internal tourism consumption. The pilot application of solutions
developed during the project implementation allowed for new estimates of the total value.
However, the applied methods require further development towards the determination of the
size of the phenomena, which are currently difficult to estimate and are of great importance
in the development of the TSA. It will be particularly important for estimating the value of
second home services, estimating tourist packages, assessing the phenomenon of renting cars
by tourists, as well as estimating the value of sales of conference services.

236
Link to production process and statistical output
In many countries, tourism is treated as a priority sector due to its role and benefits it brings to the
economy. Possessing reliable and up-to-date information on tourist traffic, the length of tourists’ stay
and the level of their expenses opens up new possibilities for conducting an effective tourism policy.
The solutions developed during the project implementation allow for the provision of more detailed
and up-to-date data on tourism at the European level, without the need for additional research.
However, due to the complex nature of the phenomenon of tourism, the innovative methods of
collecting and combining data used in the project require further improvement and adaptation to the
capabilities and resources of individual countries. Additionally, when developing solutions dedicated
to tourism statistics, the impact of unforeseen phenomena such as the current COVID-19 pandemic on
the tourism industry should be taken into account. Nevertheless, the solutions presented in this report
are an important step towards creating a coherent information system useful for authorities,
representatives of the tourism industry and tourists themselves.

237
References
Abdulkadri A., Evans A., Ash T., (2016). An assessment of big data for official statistics in the Caribbean:
Challenges and opportunities, Studies and Perspectives Series – The Caribbean No. 48, 58
Altin L., Tiru M., Saluveer E., Puura A., (2015). Using Passive Mobile Positioning Data in Tourism and
Population Statistics, NTTS 2015 Conference abstract
Andreou E., Ghysels E., Kourtellos A., (2012). Forecasting with mixed-frequency data
Box, G. E. P.; Tiao, G. C., (1973). Bayesian Inference in Statistical Analysis. Wiley
Braaksma B., Zeelenberg K., (2020). Big data in official statistics, CBS Discussion Paper
Breiman, L., Friedman, J. H., Olshen, R. A., and Stone, C. J., (1984). Classification and Regression Trees,
Wadsworth International Group, Belmont
Brownlee, D. J., (2017). Machine Learning Mastery With R. Melbourne: Jason Brownlee
Cai D., Yu S., Wen J.-R., Ma W.-Y., (2003). Extracting content structure for web pages based on visual
representation
Chow, G.C., and A.L. Lin., (1971). Best Linear Unbiased Interpolation, Distribution, and Extrapolation
of Time Series by Related Series. Review of Economics and Statistics no. 53 (4):372–375.
doi: 10.2307/1928739
Christen, P., Goiser, K., (2007). Quality and Complexity Measures for Data Linkage and Deduplication
[in:] Guillet, F. J., Hamilton, H. J. (eds.) Quality Measures in Data Mining, SCI, Springer, Heidelberg,
Vol. 43, pp. 127–151
Cockburn, A., (2001), Writing effective use cases. Addison-Wesley. ISBN 0-201-70225-8. OCLC
44046973
Cristianini, N., Shawe-Taylor, J., (2000). An Introduction to Support Vector Machines and other kernel-
based learning methods, Cambridge University Press
Dagum, E.B., Cholette P.A., (2006). Benchmarking, Temporal Distribution, and Reconciliation Methods
for Time Series, Lecture Notes in Statistics. New York: Springer
Daas P., Ossen S., Vis-Visschers R., Arends-Tóth J., (2019). Checklist for the Quality evaluation of
Administrative Data Sources, CBS Discussion paper 09042
Daas P.J.H., Puts M., Tennekes M., Priem A.,(2014).Big Data as a Data Source for Official Statistics:
experiences at Statistics Netherlands. Proceedings of Statistics Canada International Methodology
Symposium 2014, Gatineau, Canada
Daas P.J.H., Puts M.J.H., Buelens B., van den Hurk P.A.M., (2015). Big data as a source for official
statistics.31, 249–269

238
Demunter C., (2017). European Commission, DG EUROSTAT STATISTICAL WORKING PAPERS, Tourism
statistics: Early adopters of big data 2017 edition, Eurostat, STATISTICAL WORKING PAPERS
Demunter C., Seynaeve G.,(2017). Better quality of mobile phone data based statistics through the
use of signalling information – the case of tourism statistics, NTTS Conference
Denton, F.T., (1971). Adjustment of Monthly or Quarterly Series to Annual Totals — Approach Based
on Quadratic Minimization. Journal of the American Statistical Association no. 66 (333):99–102
Di Fonzo, T., (2003). Temporal Disaggregation of a System of Time Series when the Aggregate is Known:
Optimal vs. Adjustment Methods. In Paris–Bercy 05/12/1994 – 06/12/1994. Workshop on Quarterly
National Accounts, edited by R. Barcellan and G.L. Mazzi, 63–77. Luxembourg: Office for Official
Publications of the European Communities
Ding, Y. Fienberg S.E., (1994). Dual system estimation of Census undercount in the presence of
matching error, Survey Methodology, 20, 149-158
European Commission, (2014). Feasibility Study on the Use of Mobile Positioning Data for Tourism
Statistics, Eurostat, Consolidated report
European Commission, Consumer market study on online market segmentation through personalised
pricing/offer in the European Union, (2018) - Request for Specific Services 2016 85 02 for the
implementation of Framework Contract EAHC/2013/CP/04, Final report, Ipsos – London Economics –
Deloitte consortium
Fernandez, R.B., (1981). A Methodological Note on the Estimation of Time-Series. Review of Economics
and Statistics no. 63 (3):471–476. doi: 10.2307/1924371
Fourdrinier D., Wells M. T., (2012). On Improved Loss Estimationfor Shrinkage Estimators. Statistical
Science, 27, 1, 61-81
Friedl, J. E. F., (2006). Mastering Regular Expressions, O'Reilly Media, Third edition
Glez-Pena, D, Lourenço A, López-Fernández H, Reboiro-Jato M, Fdez-Riverola F., (2013). Web scraping
technologies in an API world. Briefings in Bioinformatics, Vol.15, Issue 5: 788–797
Green, E. J, Strawderman W. E., (1991). A James-Stein Type Estimator for Combining Unbiased and
Possibly Biased Estimators. Journal of the American Statistical Association, 86, 416, 1001-1006
Gretzel, U., Zhong, L., Koo, C. (2016): Application of smart tourism to cities. International Journal of
Tourism Cities, 2(2). https://doi.org/10.1108/IJTC-04-2016-0007
Hedden, H. (2016). The Accidental Taxonomist, 2nd edition
Heerschap, N. Ortega S., Priem A. Offermans M., (2014). Innovation of tourism statistics through the
use of new big data sources. In 12th Global Forum on Tourism Statistics, Prague, CZ
Heerschap, N., (2017). Ontwikkeling van een datasysteem voor toerisme, CBS-NRIT Symposium
Trendrapport Toerisme 2017, November 2017, The Hague, NL

239
Heerschap N., (2014). Mobile phone data and other new sources for tourism statistics (in Dutch)
Section 10.2, Statistics Netherlands book on Tourism, 158-168, The Hague, The Netherlands
Heerschap N.M., Ortega Azurduy S.A.,. Priem A.H., Offermans M.P.W., (2014). Innovation of tourism
statistics through the use of new Big Data sources, paper presented at the Global Forum on Tourism
Statistics, Prague
Heerschap N.M., Ortega Azurduy S., (2020). Tourism statistics and the use of social media data,
Discussion Paper
Hellwig, Z., (1968). On the optimal choice of predictions, UNESCO, Paris
Hellwig, Z., (1972). Approximative Methods of Selection of an Optimal Set of Predictors, [in]: Study XVI
of the UNESCO Statistical Office, Towards a System of Quantitative Indicators of Components of
Human Resources Indicators Development, UNESCO, Paris
Ho, T. K., (1998). The Random Subspace Method for Constructing Decision Forests, IEEE Transactions
on Pattern Analysis and Machine Intelligence, 20 (8), pp. 832–844
Hoekstra,R. ten Bosch, O. Harteveld F., (2010), Automated Data Collection from Web Sources for
Official Statistics: First Experiences, Project report, June 2010, The Hague
Hoerl A. E.; Kennard R. W., (1970). Ridge regression: Biased estimation for nonorthogonal problems.
Technometrics. 12 (1): 55–67. doi:10.1080/00401706.1970.10488634
Jaccard P., (1901) Distribution de la flore alpine dans le bassin des Dranses et dans quelques régions
voisines. Bulletin de la Société Vaudoise des Sciences Naturelles 37, 241-272
Jolani, S., (2012). Dual Imputation Strategies for Analyzing Incomplete Data, Dissertation. University
of Utrecht
Kennedy A. B. W.; Sankey H. R., (1898). The Thermal Efficiency of Steam Engines. Minutes of the
Proceedings of the Institution of Civil Engineers. 134 (1898): 278–312
Kohavi R., (1995). A study of cross-validation and bootstrap for accuracy estimation and model
selection. Proceedings of the Fourteenth International Joint Conference on Artificial Intelligence. San
Mateo, CA: Morgan Kaufmann. 2 (12): 1137–1143
KOMUSO team, (2019).“Quality Guidelines for Multisource Statistics - QGMSS”, ESSnet project
Kruskal, W. H., Wallis W. A., (1952). Use of Ranks in One-Criterion Variance Analysis. Journal of the
American Statistical Association 47 (260), 583-621
Kwok L., Yu B., (2015). - Taxonomy of Facebook messages in business-to-consumer communications:
What really works? , Tourism and Hospitality Research
Laloli H., (2015).Taxonomy Tools, Intern CBS-rapport
Laloli H., (2015). Taxonomy for the CBS, Intern CBS-presentation

240
Levenshtein V. I., (1966). Binary codes capable of correcting deletions, insertions, and reversals. Soviet
Physics Doklady. 10 (8): 707–710
Litterman, R.B., (1983). A Random Walk, Markov Model for the Distribution of Time Series. Journal of
Business & Economic Statistics no. 1 (2):169–173
Maravall, A., (2011). Seasonality Tests and Automatic Model Identification in TRAMO-SEATS. Bank of
Spain
Maślankowski M., Salgado D., Quaresma S., Ascari G., Brancato G., Di Consiglio L., Righi P., Tuoto
T.,Daas P., Six M., Kowarik A., (2020) Quality report template, ESSnet on Big Data II
Maślankowski M., Salgado D., Quaresma S., Ascari G., Brancato G., Di Consiglio L., Righi P., Tuoto
T.,Daas P., Six M., Kowarik A., (2020). Revised Version of the Quality Guidelines for the Acquisition
and Usage of Big Data - Final version, ESSnet on Big Data II
McGill R., Tukey J. W., Larsen, W. A., (1978). Variations of box plots. The American Statistician, 32, 12–
16. doi: 10.2307/2683468
McKercher B., (2016). Towards a taxonomy of tourism products, Tourism Management, Volume 54,
June 2016, pp. 196-208
Piela P., (2018). Non-traditional data sources in Social Statistics of Statistics Finland, 17th Meeting of
ECLAC, Santiago de Chile
Powers D. M. W., (2011). Evaluation: From Precision, Recall and F-Measure to ROC, Informedness,
Markedness & Correlation. Journal of Machine Learning Technologies. 2 (1): 37–63
Rubin, D. B., (1986). Statistical Matching Using File Concatenation with Adjusted Weights and Multiple
Imputations, Journal of Business & Economic Statistics, 4 (1), pp. 87–94
Salgado D., Oancea B., (2020). On new data sources for the production of official statistics
Samworth R.J., (2012) Optimal weighted nearest neighbour classifiers. Annals of Statistics, 40, 2733-
2763
Sidorov G., Gelbukh A., Gómez-Adorno H., Pinto D., (2014). Soft Similarity and Soft Cosine Measure:
Similarity of Features in Vector Space Model. Computación y Sistemas. 18 (3): 491–504.
doi:10.13053/CyS-18-3-2043
Spinder, S., (2019). Estimation of the number of guests and overnight stays in platform-related
accommodations, Discussion paper, October 2019, The Hague
Stateva G., ten Bosch O., Maślankowski J., Barcaroli G., Scannapieco M., Summa D., Greenaway M.,
Jansson I., Wu D., (2018). Methodological and IT Issues and Solutions. ESSnet Big Data I
Stateva G., ten Bosch O., Maślankowski J., Righi A., Scannapieco M., Greenaway M., Swier N.,
Jansson I., Wu D., (2016) Legal aspects related to Webscraping of Enterprise Web Sites. ESSnet Big
Data I

241
Stehman, S. V., (1997). Selecting and interpreting measures of thematic classification accuracy.
Remote Sensing of Environment. 62 (1): 77–89
Stephens-Davidowitz, S. and Varian, H. (2014), A Hands-on Guide to Google Data, Section 4, pp. 9-22,
Google, Inc., September 3, 2014 (Revised March 7, 2015)
Ten Bosch, O., Windmeijer, D., van Delden A., Van den Heuvel, G., (2018). Web scraping meets survey
design: combining forces, October 2018, Barcelona
Tibshirani R., (1997). The LASSO Method for Variable Selection in the Cox Model. Statistics in Medicine.
16 (4): 385–395. CiteSeerX 10.1.1.411.8024. doi:10.1002/(SICI)1097-0258(19970228)16:4<385::AID-
SIM380>3.0.CO; 2-3
UNECE, (2014). A Suggested Framework for the Quality of Big Data, Deliverables of the UNECE Big Data
Quality Task Team, December, 2014
Van Delden, A., Scholtus, S., De Waal, T., (2019). Methods for Measuring the Quality of Multisource
Statistics, In Conference: Use of administrative data in social statistics, June 2019, Valencia
United Nations, Commission of the European Communities–Eurostat, World Tourism Organization,
and Organisation for Economic Co-operation and Development, (2010). Tourism Satellite Account:
Recommended Methodological Framework 2008. Luxembourg, Madrid, New York, Paris. United
Nations publication, Sales No. E08. XVII.27. (herein referred to as “TSA: RMF 2008”)
Wang, X., Li, X.R., Zhen, F., Zhang, J.H., (2016). How smart is your tourist attraction?: Measuring tourist
preferences of smart tourism attractions via a FCEM-AHP and IPA approach. Tourism Management,
54: 309–320. https://doi.org/10.1016/j.tourman.2015.12.003
van der Valk J., Mitriaieva A., Seifert W., Strauch K., Skovbo M., Schnor O., Cierpial-Wolan M.,
Jasiukiewicz D., Kuzma I., Balmand S., Franconi L. (2016). Border Region Data collection, Project
n° 2016CE16BAT105, Final report
Weaver W., (1955). Translation. Machine translation of languages, 14:15-23
Welch, B. L., (1951). On the Comparison of Several Mean Values: An Alternative Approach. Biometrika
38 (3/4), 330-336
Winkler W. E., (1990). String Comparator Metrics and Enhanced Decision Rules in the Fellegi-Sunter
Model of Record Linkage. Proceedings of the Section on Survey Research Methods. American Statistical
Association: 354–359
Zorpas, A., Voukkali, I., Loizia, P., (2014). The impact of tourist sector in the waste management plans.
Desalination and Water Treatment. 56. 1–9. http://dx.doi.org/10.1080/19443994.2014.934721
Zult D., de Wolf P.P., Bakker, B., van der Heijden P.G.M., (2019). A General framework for multiple-
recapture estimation that incorporates linkage error correction, May 2019, The Hague

242
WP8 (2018), Deliverable 8.2: Report describing the quality aspects of Big Data for Official Statistics,
ESSnet Big Data I, version 7 May 2018, pp. 6-7. (based on Suggested Framework for the Quality of Big
Data, Deliverables of the UNECE Big Data, Quality Task Team)
WPF (2019a), Deliverable F1: BREAL- Big Data REference Architecture and Layers Business Layer,
ESSnet project, December 2019
WPF (2019b), Process and Architecture, ESSnet Big Data II, Vienna Meeting, December 2019
WPJ (2020a), Deliverable J1: ESSnet Methods for webscraping data processing and analyses,
23 July 2019
WPJ (2020b), Deliverable J2: Interim technical report showing the preliminary results and a general
description of the methods used, 7 January 2020
WPJ (2020c), Deliverable J3: Methodological framework report, 13 March 2020
WPJ (2020d), Deliverable J4: Technical Report, 16 June 2020
WPE (2020), Deliverable E3: Interim technical report concerning the conditions for using the data, the
methodology and the procedures (AIS data: Example based on BREAL, 2019)
ESSnet Big Data II (2019), Vienna Track Meeting, 11-12 December 2019
WP2 (2011) Deliverable 2.2. Use of Administrative and Accounts Data for Business Statistics, ESSnet
project, March 2013
WP2 (2011) Deliverable 2.2. Use of Administrative and Accounts Data for Business Statistics, ESSnet
project, March 2013

243
Annexes
Annex 1 – Quality indicators of data matching
Several indicators can be used to assess the quality of data pairing. Many of them are based on the
confusion matrix.
Table 1. Confusion matrix for data matching
true status /
linkage result Match (positive) Non-match (negative) Sum (linkage)
Link (positive) True Positive (TP) False Positive (FP) Positive (all links)
Non-link (negative) False Negative (FN) True Negative (TN) Negative (all non-links)
Sum (true status) Positive (all matches) Negative (all non-matches) All pairs (best match
only)
Taking into account the frequency of occurrence of each of the four possible pairing results, i.e. True
Positive (TP), True Negative (TN), False Positive (FP) and False Negative (FN), a number of measures of
the quality of pairing of establishments can be built (Stehman S.V. (1997), Powers D.M.W (2011)).
These include:
sensitivity (recall) or True Positive rate (TPR)
𝑇𝑃𝑅 =𝑇𝑃
𝑇𝑃 + 𝐹𝑁
specificity (SPC) or True Negative rate (TNR)
𝑇𝑁𝑅 =𝑇𝑁
𝐹𝑃 + 𝑇𝑁
precision (or positive predictive value, PPV - positive predictive value)
𝑃𝑟𝑒𝑐𝑖𝑠𝑖𝑜𝑛 =𝑇𝑃
𝑇𝑃 + 𝐹𝑃
accuracy (ACC)
𝐴𝐶𝐶 =𝑇𝑃 + 𝑇𝑁
𝑎𝑙𝑙 𝑝𝑎𝑖𝑟𝑠
false discovery rate (FDR)
𝐹𝐷𝑅 =𝐹𝑃
𝑇𝑃 + 𝐹𝑃
false ommision rate (FOR)
𝐹𝑂𝑅 =𝐹𝑁
𝐹𝑁 + 𝑇𝑁
negative predictive value (NPV)
𝑁𝑃𝑉 =𝑇𝑁
𝐹𝑁 + 𝑇𝑁
False Positive rate (FPR)
𝐹𝑃𝑅 =𝐹𝑃
𝐹𝑃 + 𝑇𝑁
False Negative rate (FNR)
𝐹𝑁𝑅 =𝐹𝑁
𝑇𝑃 + 𝐹𝑁

244
F1 score
𝐹1 = 2 ∙𝑝𝑟𝑒𝑐𝑖𝑠𝑖𝑜𝑛 ∙ 𝑟𝑒𝑐𝑎𝑙𝑙
𝑝𝑟𝑒𝑐𝑖𝑠𝑜𝑛 + 𝑟𝑒𝑐𝑎𝑙𝑙
Youden index
𝐽 = 𝑇𝑃𝑅 + 𝑇𝑁𝑅 − 1
positive likelihood ratio (LR +)
𝐿𝑅+=𝑇𝑃𝑅
𝐹𝑃𝑅
negative likelihood ratio (LR-)
𝐿𝑅−=𝐹𝑁𝑅
𝑇𝑁𝑅
diagnostic odds ratio (DOR)
𝐷𝑂𝑅 =𝐿𝑅 +
𝐿𝑅 −
TPR, TNR, PPV, ACC, NPV, F1, Youden index, LR + and DOR are stimulants, i.e. the higher the index value,
the better the matching. The rest of these indicators are destimulants, i.e. the higher the indicator
value, the worse the matching.
However, there is no single best measure to look at or to use. Typically, more than one measure has
to be considered, as true and negative results are connected: often, the higher the number of True
Positives, the higher the number of False Positives. As an illustrative case, the number of True Positives
is highest if all links are considered positive. Additionally, costs of False Negatives or positives can be
different given different aims or applications of a data linkage. In the case of enriching the survey
population frame, False Positive linkage results may be less costly than False Negatives (since False
Positives may attract attention at a later stage of the survey anyway). For the use of flash estimates
(i.e. combining data sources on a micro level with additional characteristics to enable additional
analyses) False Positives may weight stronger than False Negatives. Often they do not attract attention
during analyses and may introduce bias into results).

245
Annex 2 – General approach for data disaggregation
In this Annex, a matrix notation is used to present an idea of temporal disaggregation. Assume 𝑌𝑙𝑥1 is
a low frequency data vector, 𝑋ℎ𝑥𝑘 is a matrix of 𝑘 high frequency auxiliary variables. Let 𝐴𝑙𝑥ℎ be an
aggregation matrix such that 𝐴𝑋 is a low frequency data matrix. The objective is to estimate the high
frequency data vector 𝑦ℎ𝑥1 satisfying the form 𝐴𝑦 = 𝑌.
The first step of temporal disaggregation is regression. Using auxiliary variables, a regression model is
built and preliminary estimates of 𝑝 for the variable 𝑦 are prepared. In the simplest approach, one
variable is selected and the model is estimated using the classical method of least squares, or many
variables are selected and the model is estimated by the generalized method of least squares.
Typically, aggregated 𝑝 values do not add up to 𝑌. Hence, benchmarking is the second step in temporal
disaggregation. The difference between 𝑌 and 𝐴𝑝 defined as
𝑢 = 𝑌 − 𝐴𝑝
is estimated as follows
𝑦 = 𝑝 + 𝐷𝑢 = 𝑝 + 𝑒
where 𝐷 is the distribution matrix.
Let 𝑈 be the variance-covariance matrix 𝑢. The distribution matrix for additive or multiplicative
benchmarking (Denton F.T. (1971), Di Fonzo T. (2003)) is, respectively, of the form
𝐷 = 𝐴′(𝐴𝐴′)−1𝑈−1
and
𝐷 = Diag(X)𝐴′(𝐴𝐴′)−1𝑈−1Diag(X).
The random component 𝑒 for high frequency data can also be modeled as a first-order autoregressive
process (Chow G.C, Lin A.L. (1971), Fernandez, R.B. (1981)) or a random walk process (Litterman R.B.
(1983))
If the results of temporal disaggregation obtained by the above method are unacceptable, regression
methods with a regularization parameter such as LASSO or ridge regression should be used.
A very useful tool that visualizes the procedure of selecting variables for the model using the LASSO
method is the LASSO path graph.
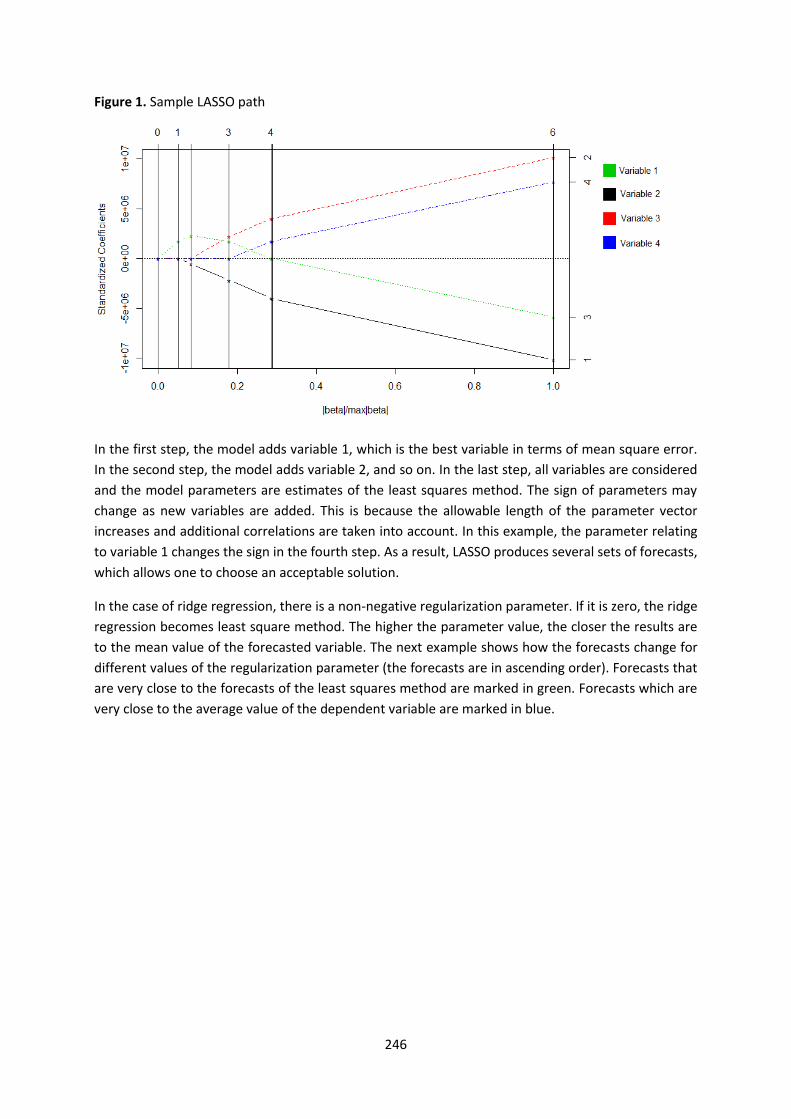
246
Figure 1. Sample LASSO path
In the first step, the model adds variable 1, which is the best variable in terms of mean square error.
In the second step, the model adds variable 2, and so on. In the last step, all variables are considered
and the model parameters are estimates of the least squares method. The sign of parameters may
change as new variables are added. This is because the allowable length of the parameter vector
increases and additional correlations are taken into account. In this example, the parameter relating
to variable 1 changes the sign in the fourth step. As a result, LASSO produces several sets of forecasts,
which allows one to choose an acceptable solution.
In the case of ridge regression, there is a non-negative regularization parameter. If it is zero, the ridge
regression becomes least square method. The higher the parameter value, the closer the results are
to the mean value of the forecasted variable. The next example shows how the forecasts change for
different values of the regularization parameter (the forecasts are in ascending order). Forecasts that
are very close to the forecasts of the least squares method are marked in green. Forecasts which are
very close to the average value of the dependent variable are marked in blue.

247
Figure 2. An example of ridge regression
As with LASSO, ridge regression produces several sets of forecasts.

248
Annex 3 – Combining biased and unbiased data
Assume that 𝑋 is an unbiased estimator of the parameter vector 𝜃 of length 𝑝, (𝑝 > 2) with the
expected value 𝜃 and the variance 𝜎2, and that 𝑌 is the biased estimator of 𝜃 with the expected value
𝜃 + 𝜂 and the variance 𝜏2. The James-Stein estimator for the observation vector 𝐱 and 𝐲 is of the form
𝐱 +(𝑝 − 2)𝜎2
‖𝐲 − 𝐱‖2(𝐲 − 𝐱),
where ‖𝐲 − 𝐱‖ is the Euclidean norm.
The James-Stein estimator has a lower mean square error than the maximum likelihood estimator
when the number of estimated parameters exceeds two. This property is also true when the variance
𝜎2 is not known a priori and will be replaced by its estimator of the form
�̂�2 =1
𝑛∑(𝑦𝑖 − �̅�)2
𝑛
𝑖
,
where 𝑦𝑖 are the elements of 𝐲.
If there are 𝑚 observations of the 𝐲 vector, the James-Stein estimator is given by the formula
𝐱 +(𝑝 − 2)
𝜎2
𝑚‖�̅� − 𝐱‖2
(�̅� − 𝐱),
where �̅� = (�̅�1, … , �̅�𝑝).

249
Annex 4 – Quality template for combining data from various sources
Following template is a result of work performed by the workpackage K – Methodology and quality.
Members of WPK adapted the structure of the template of Single Integrated Metadata Structure
(SIMS) to the needs of big data sources. The definitions and guidelines were based on the ESS
handbook for quality and metadata reports (EHQMR)
The members of the WPK analysed each subconcept of the EHQMR:
New subconcepts were introduced when the existing ones did not cover all relevant aspect of
quality of new data sources. These new subconcepts are indicated by an "A" for "additional"
in the subconcept number.
Subconcepts not relevant for new data sources were deleted. The numbering of the
subconcepts of EHQMR was retained so the following subconcepts are not numbered
consecutively.

250
S.01 Contact
SIMS Concept name Answer
S.01 Contact Not relevant as matters discussed in this chapter are a general description of quality issues encountered throughout the project duration in all countries involved. Nevertheless, contact information to the leader of the project is provided below.
S.01.1 Contact organisation Statistical Office in Rzeszów, Marek Cierpiał-Wolan
S.01.6 Contact email address
S.01.7 Contact phone number
00 48 17 853 52 10 w. 311
S.02 Metadata Update
SIMS Concept name Answer
S.02 Metadata update Not relevant for the pilot projects, since no Official Statistics is published.
S.03 Statistical Presentation
SIMS Concept name Answer
S.03 Statistical presentation
S.03.1 Data description As part of the project, the work in this task was concentrated on identifying new tourist accommodation establishments
(not currently included in the statistical survey). The following variables have been determined:
name of the establishment,
address details of the establishment (country, region, city, street, zip code),
geolocation of establishments (longitude and latitude),
type of new accommodation establishment (according to statistical classification),
capacity of the new accommodation establishment,

251
months in which establishment is operating.
The statistical output produced: Tourism Accommodation Statistics - population frame and its characteristics.
S.03.4
Statistical concepts and definitions
new tourist accommodation establishments (not included in the survey frame of tourism establishment base) were
obtained by web scraping of accommodation portals and by comparison with survey frame of tourist accommodation
establishments with the use of geolocation coordinates and address data.
geolocation of all establishments was obtained by the use of HERE Maps API to extract geolocation coordinates
(longitude and latitude) of establishments from survey and from accommodation portals. Alternatively, other internally
available tools have been used for geocoding.
types of accommodation establishments and their number of bed places showed discrepancies as booking portals have
their own classification of accommodation types. This classification do not follow the one used in official statistics. This
information was corrected by the use of machine learning methods.
months in which establishment is operating was obtained with the rule: “if the offer of a given establishment is present
during a month then the establishment is operating” – this value was also calculated with the use of machine learning.
names of the accommodation establishments mention mixed forms of accommodations (hotel/B&B and
resort/camping site), hence when the accommodation representative subscribes this accommodation establishments
in a (travel agency or aggregator) platform, he/she often leaves this field empty. This holds, in particular, for large
accommodation companies and multinational hospitality businesses.
S.3.5 Statistical unit The unit for this workpackage was a domestic accommodation establishment. Survey frame of tourist accommodation
establishment is obtained with the use of the NACE rev.2 code of activities. This does not cover all units operating in a
given country as attribution of NACE code depends on business structure of enterprises. It means that sometimes for
very small establishments, the scraped data refers to a particular person or household. In contrast to the traditional
ways, these households/persons may not be surveyed (they are not in the Business Register or their turnover or number
of employees is lower than specific threshold). But for the purposes of accommodation supply they are actually
economically active and thanks to web scraping of booking portals their activities can be included in the data

252
S.3.6 Statistical population Web scraped data provided data on all tourist accommodation establishments that were active in travel and aggregator
platforms. The WPJ had population set as accommodation establishments advertising in Hotels.com and Booking.com.
The statistical population were new domestic accommodation establishments with complementary information on
their types, regions and other information allowing for their identification
S.3.7 Reference area Data referred to countries that were taking part in the project as well as to tourist accommodation establishments that
were offered by accommodation portals in a given country. The web scraper of Hotels.com had proxy “destination” set
differently in each country. Some partners have been able to use just the country’s name as this “destination”, some
partners have to specify provinces and cities, and some follow NUTS classification. Commonly used aggregates for
geographical breakdown in each country was applied. The decision of set destination depended on the size of the
country, its touristic attractiveness and other issues specific to the given country.
S.3.8 Time coverage Web scraping of portals has begun in July 2019 onwards. Most of the project partners have been scraping data daily
and have a substantial time series of data. Some exceptions to that occurred when a web scraper was temporary
blocked or the structure of the website has changed and the web scraping code needed adjustments.
S.04 Unit of Measure
SIMS Concept name Answer
S.04 Unit of measure Hotels.com – unit of measure
Date - Day, Month and Year in which an accommodation establishment is detected
scrapingType - Date configuration (next day, next weekend or last Thursday of Month) used to gather accommodation
prices
destinationName - Geographical area connected to the destination_id defined by the platform and chosen by a visitor
using the search engine of the platform
offerId - Platform id assigned to an specific visitor’s search of accommodation (Demand-side)

253
hotelId - Platform_id (client number) assigned to an specific accommodation establishment (Supply-side)
hotelName - Name of the accommodation establishment in the platform database
accType - Type of accommodation establishment registered by the accommodation responsible to classify its
accommodation business in the platform (e.g. when searching accommodations on the platform by this “type”)
locality - Refers to the city where an accommodation establishment is located or established.
postalCode - Combination of numbers and letters in addresses that denote the neighbourhood and street to locate
establishments
latitude and longitude coordinates - typically provided in CRS (Coordinate Reference System) WGS84
street - Address, .i.e. street name and house number of an accommodation establishment
guestReviewsTotal - Cumulative number of the number of quest reviews
Booking.com – unit of measure
Date - Date - Day, Month and Year in which an accommodation establishment is detected
Accom_id - Platform_id (client number) assigned to an specific accommodation establishment (Supply-side)
Name_accom - Name of the accommodation establishment in the platform database
Name_long - Full name of the accommodation establishment in the platform database; it contains often the type of
accommodation as well
Type_accom - Type of accommodation registered by the accommodation responsible to classify its accommodation
business in the platform
Address_accom - Refers to the city where an accommodation establishment is located or established

254
Location – Refers to the city where an accommodation is located establishment or established.
Postal_code - Combination of numbers and letters in addresses that denote the neighbourhood and street to locate
establishments
Longitude and Latitude - typically provided in WGS84 coordinates
Street name - Address, .i.e. street name
House number - House number of an accommodation establishment
Numberl_reviews - Cumulative number of the number of quest reviews.
S.05 Reference Period
SIMS Concept name Answer
S.05 Reference period Day, Month and Year in which an accommodation establishment is detected - the moment it firstly occurs on the booking website. Then subsequently each time the accommodation establishment was scraped.
S.06 Institutional Mandate
SIMS Concept name Answer
S.06 Institutional mandate
S.06.1 Legal acts and other agreements
There is no legal EU mandate regulating web scraping of websites. Each partner country has their own rules of using web scraping method to gather data. Please see more in the use case dedicated to legal aspects.
S.06. A Data access and data transmission
Access to raw data is based on public online availability. A few changes on the end-point APIs had been implemented to the code of web scraper and the new code sent to the partners as soon as possible.
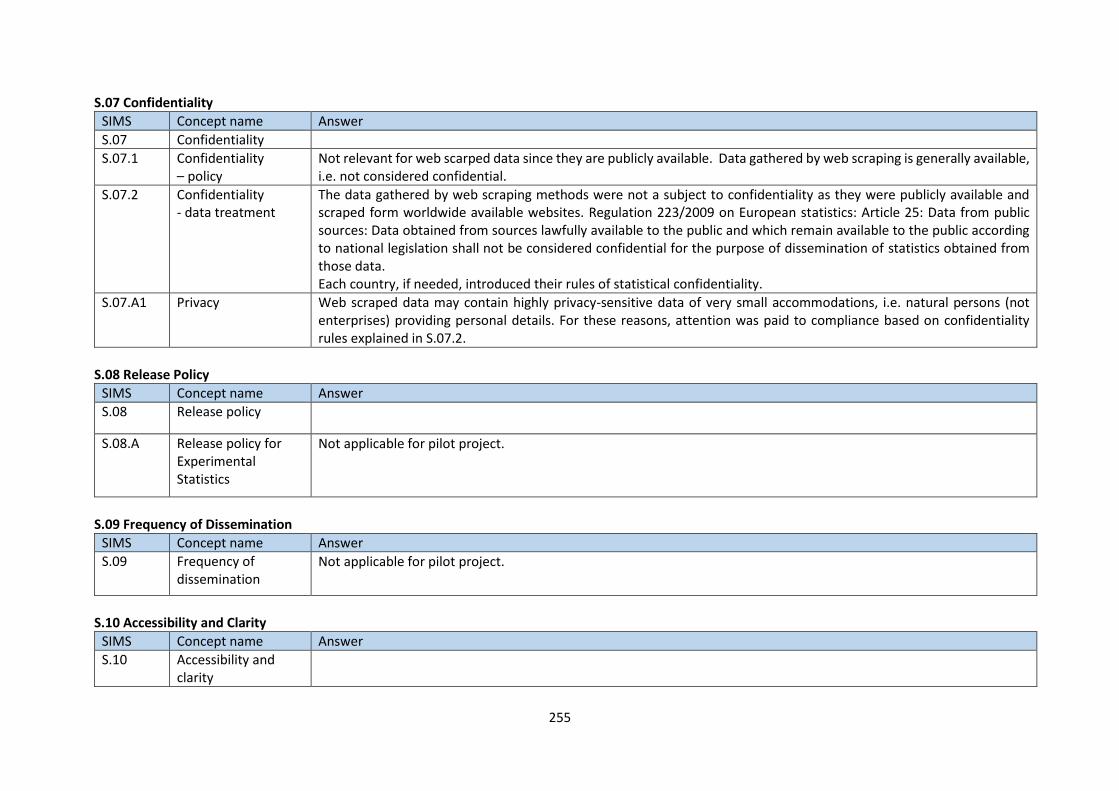
255
S.07 Confidentiality
SIMS Concept name Answer
S.07 Confidentiality
S.07.1 Confidentiality – policy
Not relevant for web scarped data since they are publicly available. Data gathered by web scraping is generally available, i.e. not considered confidential.
S.07.2 Confidentiality - data treatment
The data gathered by web scraping methods were not a subject to confidentiality as they were publicly available and scraped form worldwide available websites. Regulation 223/2009 on European statistics: Article 25: Data from public sources: Data obtained from sources lawfully available to the public and which remain available to the public according to national legislation shall not be considered confidential for the purpose of dissemination of statistics obtained from those data. Each country, if needed, introduced their rules of statistical confidentiality.
S.07.A1 Privacy Web scraped data may contain highly privacy-sensitive data of very small accommodations, i.e. natural persons (not enterprises) providing personal details. For these reasons, attention was paid to compliance based on confidentiality rules explained in S.07.2.
S.08 Release Policy
SIMS Concept name Answer
S.08 Release policy
S.08.A Release policy for Experimental Statistics
Not applicable for pilot project.
S.09 Frequency of Dissemination
SIMS Concept name Answer
S.09 Frequency of dissemination
Not applicable for pilot project.
S.10 Accessibility and Clarity
SIMS Concept name Answer
S.10 Accessibility and clarity

256
S.10. 6 Documentation on methodology
- Methodological manual for tourism statistics - J1 Deliverable of WPJ for the ESSnet on Big Data II: ESSnet Methods for web scraping, data processing and
analyses - J2 Deliverable of WPJ for the ESSnet on Big Data II: Interim technical report showing the preliminary results and a
general description of the methods used - J3 Deliverable of WPJ for the ESSnet on Big Data II: Methodological Framework Report
S.10. 7 Quality documentation
- J1 Deliverable of WPJ for the ESSnet on Big Data II: ESSnet Methods for webscraping, data processing and analyses - J2 Deliverable of WPJ for the ESSnet on Big Data II: Interim technical report showing the preliminary results and a
general description of the methods used - J3 Deliverable of WPJ for the ESSnet on Big Data II: Methodological Framework Report - K6 Deliverable of WPK for the ESSnet on Big Data II: Quality report template - final - K3 Deliverable of WPK for the ESSnet on Big Data II: Revised Version of the Quality Guidelines for the Acquisition and
Usage of Big Data - Final version
S.11 Quality Management
SIMS Concept name Answer
S.11 Quality management
S.11.1 Quality assurance Statistics Netherlands is certified according to ISO9001 since 2018. This means that a Quality management of
methodology and process development for official statistics has been adopted, audited and assessed. This certification
means that Statistics Netherlands focusses on:
the quality procedures for internal and external reports, recommendations and briefs;
the quality assurance of statistical development projects in which methodologists and business analysts participate;
the quality assurance of methodological courses taught to statisticians;
the internal management of the department These second and third points, in particular, provide the grounds to ensure the middle- and long-term of innovative projects such as the WP J on Tourism Statistics were met.
S.11.2 Quality assessment Each country assessed the quality of the results by themselves based on the rules and criteria applied in their country.

257
S.12 Relevance
SIMS Concept name Answer
S.12 Relevance
S.12.1 User needs Tourism statisticians, touristic organizations, ministries and other public users.
S.12.3 Completeness Not applicable for pilot project.
S.12.A Added Value through new data source
Identification of tourist accommodation establishments not covered by the survey allows to improve (expand) the survey
frame of tourist accommodation establishments, provides more complete information about establishments operating
in the country, and thus improves the quality of results to obtain.
The use of web scraping techniques, and in particular platforms such as Hotels.com and Booking.com, allow accelerating the inventarisation process of tourist accommodations. The chosen platforms provide up-to- date inside information on the population dynamics of hospitality businesses and households.
S.13 Accuracy and Reliability
SIMS Concept name Answer
S.13 Accuracy and reliability
S.13. 1 Overall accuracy Each country assessed the quality of the results by themselves based on the rules and criteria applied in their country.
S.13. 2 Sampling error Not applicable for pilot project.
S.13. 3 Non- sampling error As for the coverage of NACE 55.3 (camping sites), the web scraping data does not cover this economic activity. In general, there are websites and platform specialized to and targeting this area of touristic activity. These sites have not been part of the pilot project.
Unit non- response - rate
Please see the chapter dedicated to use cases for more description.
Item non- response -
rate
Not applicable for this pilot project as the units were not responding to a survey.

258
S.13. 3.1 Coverage error Undercoverage error occurred as only accommodation establishments available on booking portals will be gathered.
There is no possibility to calculate the percentage of undercoverage error due to the lack of data on how many
establishments were not present on chosen booking portals and are not covered by the survey on tourists’
accommodation statistics.
Overcoverage error in terms of duplicates occurred if the same accommodation establishment is included in two or more booking portals. This was treated by the use of geolocation data. Please see details in the chapter “Use cases”. Overcoverage also may occur when accommodation establishments advertise on the platforms that do not belong to the defined target population. This overcoverage is hard to detect with information from the platform only.
S.13.3.1.1 Overcoverage – rate Not applicable to this pilot project. Web scraped websites only offer units active in the business of accommodation renting.
S.13. 3.2 Measurement error The main measurements errors were:
- Scraper features: Changes on the location_id or street_addresses in platforms lead the scraper to fail and stop. The web scraped code was corrected in such instances.
- Target population: Platform (Hotels.com) filtered on proximity provoked that accommodations outside the population target got included in the scraping files, i.e. web scraped listings contained foreign accommodations, namely those close to the borders of either city or country. In such cases regular expressions to detect patterns on postcodes or special characters in language were used. Geolocation has been used to determine whether an accommodation belongs to a specific geographic area or not.
- Chained-brand Hotels & Resorts: Rapid changes in ownership of the Leisure and recreation industry required more flexible and adaptive approaches to detect and correct for merging, acquisition and franchise connected to multinationals such as Holiday Inn (UK), Best Western or Hilton (US), NH Hotel Group (ES), Jinjiang International (CN), Scandic Hotels(SE) and Accor(FR). No solution was found to this problem as there is very little information about platform policies to keep its registry of accommodations up-to-date.
S.13. 3.3 Nonresponse error The main issue were listings of companies with name and address of accommodations missing, sometimes even on purpose. Some listings instead of the name of the accommodation provided used this as a sort of description such us “Studio on a houseboat, near city centre!” or “Spacious, modern family home on the canal with parking”. The strategy was to leave this accommodation aside in a sort of “quarantine” group until new data were collected, analysed and assessed.

259
S.13.3.4 Processing error The applied method to properly connect establishments from the population frame to web scraped data used both probabilistic matching (based on latitude-and longitude coordinates (or distance) and accommodation names) and deterministic (based on names and address data) allowed to minimize the occurrence of processing errors.
S.13.3.5 Model assumption error
Not applicable for pilot project.
S.14 Timeliness and Punctuality
SIMS Concept name Answer
S.14 Timeliness and punctuality
S.14.1 Timeliness Web scraping allowed adding new units on a regular basis. Flash estimates in terms of accommodation establishments and their occupancy were also calculated at t+1.
S.15 Coherence and Comparability
SIMS Concept name Answer
S.15 Coherence and Comparability
S.15.1 Comparability - geographical
The data gathered is comparable between geographical areas. The exception are those areas close to borders when the listings from foreign accommodations being wrongfully assigned. Please see more explanation in 13. 3.2
S.15.2 Comparability - over time
If no legal problems occur or the web scrapped website disappear there will be no problem with comparability over time.
S.15.3 Coherence- cross domain
Not applicable for this pilot project.
S.15.4 Coherence – internal
S.15.A.1 Coherence - with existing information/ Official Statistics
The type of accommodation establishment included on booking portals often differ to the classification used in official
statistical. Machine learning methods were applied to assign proper type.
S.15.A.2 Comparability - between information from several distinct new data sources
The degree of the comparability between data sources depends on how well the establishments from different data sources were matched. When matched correctly the data describes the same establishment.
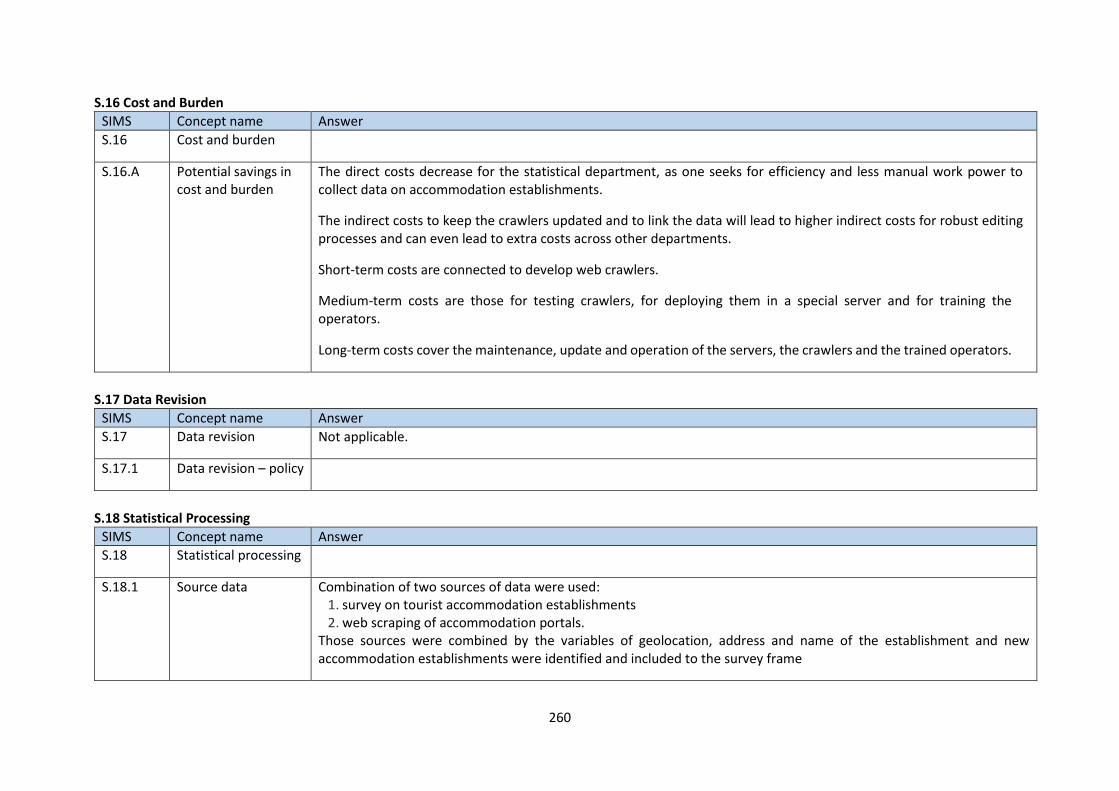
260
S.16 Cost and Burden
SIMS Concept name Answer
S.16 Cost and burden
S.16.A Potential savings in cost and burden
The direct costs decrease for the statistical department, as one seeks for efficiency and less manual work power to collect data on accommodation establishments.
The indirect costs to keep the crawlers updated and to link the data will lead to higher indirect costs for robust editing processes and can even lead to extra costs across other departments.
Short-term costs are connected to develop web crawlers.
Medium-term costs are those for testing crawlers, for deploying them in a special server and for training the operators.
Long-term costs cover the maintenance, update and operation of the servers, the crawlers and the trained operators.
S.17 Data Revision
SIMS Concept name Answer
S.17 Data revision Not applicable.
S.17.1 Data revision – policy
S.18 Statistical Processing
SIMS Concept name Answer
S.18 Statistical processing
S.18.1 Source data Combination of two sources of data were used: 1. survey on tourist accommodation establishments 2. web scraping of accommodation portals.
Those sources were combined by the variables of geolocation, address and name of the establishment and new accommodation establishments were identified and included to the survey frame

261
S.18.2 Frequency of data acquisition and recording
Frequency of web scraping depends on the purposes: for enriching the survey frame monthly updates (or even only every second or third month) are be sufficient, but for the flash estimates more frequent scrapings are necessary (in order to capture the short term changes of the price).
S.18.3 Data collection
S.18.4 Data validation
S.18.5 Data compilation
S.18.5.1 Imputation – rate
S.19 Comment
SIMS Concept name Answer
S.19 Comment

262
Annex 5 – R script to visNetwork object WPJ.2.PT ##========================================================##
## ##
## Network Visualization with R ##
## ESSnet Big Data II WPJ Use Case WPJ.04.PT ##
## ##
## Rui Alves ##
## Statistics Portugal ##
## Email: [email protected] ##
## ##
##========================================================##
# Load Packages -----------------------------------------------------------
# Packages should be installed and loaded before running the script
library(dplyr) # works with dplyr version 1.0.0 and R-4.0.2
library(visNetwork) # works with visNetwork version 2.0.9 and R-4.0.2
library(rstudioapi) # make sure you have it installed
# Create set_wd function --------------------------------------------------
set_wd <- function() {
# library(rstudioapi) # make sure you have it installed
current_path <- getActiveDocumentContext()$path
setwd(dirname(current_path ))
print( getwd() )
}
set_wd()
# ~~2. Run Code to create Dataframes ---------------------------------------------------------------
# ~~2.1 Create Nodes ---------------------------------------------------------------
nodes <- structure(list(id = c(2000230, 1000110, 7000110, 6000630, 6000640,
6000610, 2e+06, 2000220, 2000210, 3e+06, 2000223, 2000222, 2000211,
1, 3000330, 9000001, 9e+06, 8e+06, 8000001, 8000002, 8000003,
6000999), label = c("Credit & Debit Card transactions", "hotels",
"Hotels.com", "Improve quality of satellite accounts", "Improve quality of tourists expenses data",
"Improve tourist accommodation base", "Multi-Purpose Data", "NRT Local Accommodation",
"NTR Tourist Establishments", "Survey Data", "travelBI by Turismo de Portugal",
"Turismo de Portugal Local Accommodation Open Data", "Turismo de Portugal Tourist Establishments Open Data",
"Web Data", "Survey on tourist accommodation base", "Geolocation Tool (HERE Maps API)",
"Tools", "Variables", "Name, Address, PostalCode", "Name, Address, PostalCode",
"Coordinates", "Combining Data"), title = c("id:2000230 <br> <br> Credit & Debit <br> card transactions",
"id:1000110 <br> <br> Hotels.com", "id:7000110 <br> <br> https://www.Hotels.com",
"id:6000630 <br> <br> Improve quality <br> of satellite", "id:6000640 <br> <br> Improve quality <br> of tourists expenses <br> data",
"id:6000610 <br> <br> Improve tourist <br> accommodation <br> base of reference",
"id:2000000 <br> <br> Multi-Purpose", "id:2000220 <br> <br> National Tourist Registration <br> Local Accommodation",
"id:2000210 <br> <br> National Tourist Registration <br>Tourist Establishments",
"id:3000000 <br> <br> Survey <br> Data", "id:2000223 <br> <br> Turismo de Portugal: <br> TravelBI <br>
https://travelbi.turismodeportugal.pt/en-us/Pages/Home.aspx",
"id:2000222 <br> <br> Turismo de Portugal Open Data: <br>Local Accommodation <br>
https://dadosabertos.turismodeportugal.pt/datasets/estabelecimentos-de-al",
"id:2000211 <br> <br> Turismo de Portugal Open Data: <br> Tourist Establishment <br>
https://dadosabertos.turismodeportugal.pt/datasets/empreendimentos-turisticos-existentes?geometry=-91.485%2C33.243%2C75.771%2C54.949",
"id:1 <br> <br> Web <br> Scraped", "id:3000330 <br> <br> Survey on <br> tourist <br> accommodation base",
"id:9000001 <br> Geolocation Tool <br> (HERE Maps API)", "id:9000000 <br> Tools",
"id:8000000 <br> Variables", "id:8000001 <br> Survey Data <br> Name of accommodations <br> Address <br> Postal Code",
"id:8000002 <br> Hotels.com Data <br> Name of accommodations <br> Address <br> Postal Code",
"id:8000003 <br> Latitue <br> Longitude", "id6000999 <br> Use Case WPJ.03.PT"
), group = c("Country: PT, Tourism Domain: Demand, Data Source: Multi-Purpose Data",
"Tourism Domain: Supply, Data Source: Web Scraped Data, Tourism Domain: Accommodation Base, Tourism Domain: Expenses, Variables",
"Tourism Domain: Supply, Data Source: Web Scraped Data, Tourism Domain: Accommodation Base, Tourism Domain: Expenses, External Links",
"Tourism Domain: Demand, Experimental Results", "Tourism Domain: Demand, Experimental Results",
"Tourism Domain: Supply, Experimental Results, Variables", "Data Source, Data Source: Multi-Purpose Data",
"Tourism Domain: Demand, Data Source: Multi-Purpose Data", "Tourism Domain: Demand, Data Source: Multi-Purpose Data",
"Data Source, Data Source: Survey Data", "Tourism Domain: Demand, Data Source: Multi-Purpose Data, External Links",
"Tourism Domain: Demand, Data Source: Multi-Purpose Data, External Links",
"Tourism Domain: Demand, Data Source: Multi-Purpose Data, External Links",
"Data Source, Data Source: Web Scraped Data", "Tourism Domain: Supply, Data Source: Survey Data, Variables",
"Tools, Variables", "Tools, Variables", "Variables", "Variables, Data Source, Data Source: Survey Data",
"Variables, Data Source, Data Source: Web Scraped Data", "Variables",
"Experimental Results, Variables"), value = c(4, 4, 2, 4, 4,
4, 6, 4, 4, 6, 2, 2, 2, 6, 4, 4, 6, 6, 4, 4, 4, 4), shape = c("dot",
"dot", "triangle", "square", "square", "square", "dot", "dot",
"dot", "dot", "triangle", "triangle", "triangle", "dot", "dot",
"diamond", "diamond", "dot", "dot", "dot", "dot", "square"),
color = c("orange", "orange", "lightblue", "purple", "purple",
"purple", "teal", "orange", "orange", "teal", "lightblue",
"lightblue", "lightblue", "teal", "orange", "darkgrey", "darkgrey",
"darkred", "darkred", "darkred", "darkred", "purple"), url = c(NA,
NA, "https://www.Hotels.com", NA, NA, NA, NA, NA, NA, NA,
"https://travelbi.turismodeportugal.pt/en-us/Pages/Home.aspx",
"https://dadosabertos.turismodeportugal.pt/datasets/estabelecimentos-de-al",
"https://dadosabertos.turismodeportugal.pt/datasets/empreendimentos-turisticos-existentes?geometry=-91.485%2C33.243%2C75.771%2C54.949",

263
NA, NA, NA, NA, NA, NA, NA, NA, NA)), row.names = c(NA, 22L
), class = "data.frame")
# ~~2.2 Create Edges ---------------------------------------------------------------
edges <- structure(list(from = c(1, 1, 1, 1, 1, 1, 1, 1, 1, 1, 1, 1, 1,
1000110, 1000110, 1000110, 1000110, 1000110, 1000120, 1000120,
1000120, 1000120, 1000130, 1000130, 1000140, 1000140, 1000140,
1000150, 1000150, 1000150, 1000150, 1000160, 1000160, 1000160,
1000170, 1000180, 1000190, 1000201, 1000202, 1000203, 1000204,
2e+06, 2e+06, 2e+06, 2e+06, 2e+06, 2e+06, 2e+06, 2e+06, 2e+06,
2e+06, 2e+06, 2e+06, 2e+06, 2e+06, 2e+06, 2e+06, 2e+06, 2e+06,
2e+06, 2e+06, 2e+06, 2e+06, 2e+06, 2000210, 2000210, 2000210,
2000220, 2000220, 2000220, 2000230, 2000230, 2000240, 2000240,
2000250, 2000260, 2000270, 2000270, 2000280, 2000280, 2000290,
2000290, 2000290, 2000299, 2000299, 2000301, 2000302, 2000302,
2000303, 2000304, 2000304, 2000304, 2000305, 3e+06, 3e+06, 3e+06,
3e+06, 3e+06, 3e+06, 3e+06, 3e+06, 3e+06, 3e+06, 3e+06, 3e+06,
3000310, 3000310, 3000320, 3000320, 3000330, 3000330, 3000330,
3000330, 3000330, 3000350, 3000360, 6000610, 6000610, 6000620,
6000620, 6000620, 6000630, 6000630, 6000640, 6000640, 6000640,
6000650, 6000650, 6000660, 6000701, 6000702, 1000190, 1000190,
1000110, 1000110, 1000120, 1000120, 1000120, 1000140, 1000140,
1000140, 2000297, 2000297, 2000297, 2000297, 2000297, 2000298,
2000298, 2000298, 2000298, 2000298, 3000370, 3000370, 3000370,
3000370, 3000370, 3000310, 3000310, 3000310, 3000330, 3000380,
3000380, 3000391, 3000391, 3000391, 3000392, 3000392, 3000392,
2000297, 1000130, 1000140, 1000201, 1000202, 1000203, 1000203,
1000204, 1000204, 2002001, 2002001, 2002001, 2002001, 2000295,
2000295, 2000295, 2000295, 1000202, 2000293, 2000293, 2000293,
2000292, 2000294, 2000294, 2000294, 3000340, 3000340, 1000170,
1000170, 1000170, 1000191, 1000191, 1000191, 1000191, 1000191,
1000191, 1000191, 2000292, 1000180, 3000310, 9e+06, 8e+06, 8e+06,
8000001, 8e+06, 8000003, 8000001, 8000002, 9000001, 3000330,
1000110, 8000001, 8000002, 8000003, 6000999), from_label = c("Web Data",
"Web Data", "Web Data", "Web Data", "Web Data", "Web Data", "Web Data",
"Web Data", "Web Data", "Web Data", "Web Data", "Web Data", "Web Data",
"Hotels.com", "Hotels.com", "Hotels.com", "Hotels.com", "Hotels.com",
"Booking.com", "Booking.com", "Booking.com", "Booking.com", "Airbnb.com",
"Airbnb.com", "Tripadvisor.com", "Tripadvisor.com", "Tripadvisor.com",
"Skyscanner.net", "Skyscanner.net", "Skyscanner.net", "Skyscanner.net",
"taxi2airport.com", "taxi2airport.com", "taxi2airport.com", "365tickets.com",
"seatguru.com", "Pochivka.bg", "Other webpages (booking accommodation)",
"hrs.com", "holydaycheck", "pincamp", "Multi-Purpose Data", "Multi-Purpose Data",
"Multi-Purpose Data", "Multi-Purpose Data", "Multi-Purpose Data",
"Multi-Purpose Data", "Multi-Purpose Data", "Multi-Purpose Data",
"Multi-Purpose Data", "Multi-Purpose Data", "Multi-Purpose Data",
"Multi-Purpose Data", "Multi-Purpose Data", "Multi-Purpose Data",
"Multi-Purpose Data", "Multi-Purpose Data", "Multi-Purpose Data",
"Multi-Purpose Data", "Multi-Purpose Data", "Multi-Purpose Data",
"Multi-Purpose Data", "Multi-Purpose Data", "Multi-Purpose Data",
"NTR Tourist Establishments", "NTR Tourist Establishments", "NTR Tourist Establishments",
"NRT Local Accommodation", "NRT Local Accommodation", "NRT Local Accommodation",
"Credit & Debit Card transactions", "Credit & Debit Card transactions",
"Airport Data", "Airport Data", "Tax Authority Register of Short-Term Lease Properties",
"Register of Properties offered for short-term lease through digital platforms",
"Register of non-categorised accommodation", "Register of non-categorised accommodation",
"Register of Addresses and Buildings", "Register of Addresses and Buildings",
"NBTC-NIPO", "NBTC-NIPO", "NBTC-NIPO", "Other sources", "Other sources",
"Monthly bed tax data inc. overnights", "Financial transaction data",
"Financial transaction data", "Regulatory reporting FIN1-12",
"BTB data", "BTB data", "BTB data", "Register of accommodation establishments",
"Survey Data", "Survey Data", "Survey Data", "Survey Data", "Survey Data",
"Survey Data", "Survey Data", "Survey Data", "Survey Data", "Survey Data",
"Survey Data", "Survey Data", "Survey on participation of residents in trips",
"Survey on participation of residents in trips", "Survey on trips made by foreigners",
"Survey on trips made by foreigners", "Survey on tourist accommodation base",
"Survey on tourist accommodation base", "Survey on tourist accommodation base",
"Survey on tourist accommodation base", "Survey on tourist accommodation base",
"Survey on the visits by foreigners", "Survey data on tourist trips",
"Improve tourist accommodation base", "Improve tourist accommodation base",
"Spatial disaggregation of accommodation", "Spatial disaggregation of accommodation",
"Spatial disaggregation of accommodation", "Improve quality of satellite accounts",
"Improve quality of satellite accounts", "Improve quality of tourists expenses data",
"Improve quality of tourists expenses data", "Improve quality of tourists expenses data",
"Flash estimates", "Flash estimates", "Improve quality data on trips",
"Update register of accommodation establishments", "Improve quality of tourists transport data",
"Pochivka.bg", "Pochivka.bg", "Hotels.com", "Hotels.com", "Booking.com",
"Booking.com", "Booking.com", "Tripadvisor.com", "Tripadvisor.com",
"Tripadvisor.com", "Border traffic survey (BI)", "Border traffic survey (BI)",
"Border traffic survey (BI)", "Border traffic survey (BI)", "Border traffic survey (BI)",
"Waste production (ISPRA)", "Waste production (ISPRA)", "Waste production (ISPRA)",
"Waste production (ISPRA)", "Waste production (ISPRA)", "Water Consumption",
"Water Consumption", "Water Consumption", "Water Consumption",
"Water Consumption", "Survey on participation of residents in trips",
"Survey on participation of residents in trips", "Survey on participation of residents in trips",

264
"Survey on tourist accommodation base", "Survey on rural tourism accommodations",
"Survey on rural tourism accommodations", "Railway, airport and port data",
"Railway, airport and port data", "Railway, airport and port data",
"Survey on museums and similar", "Survey on museums and similar",
"Survey on museums and similar", "Border traffic survey (BI)",
"Airbnb.com", "Tripadvisor.com", "Other webpages (booking accommodation)",
"hrs.com", "holydaycheck", "holydaycheck", "pincamp", "pincamp",
"Mobile phone data", "Mobile phone data", "Mobile phone data",
"Mobile phone data", "Water Demand", "Water Demand", "Water Demand",
"Water Demand", "hrs.com", "Smart City", "Smart City", "Smart City",
"Land Border Traffic", "Parking Meters Data", "Parking Meters Data",
"Parking Meters Data", "Border Traffic Survey", "Border Traffic Survey",
"365tickets", "365tickets", "365tickets", "nocowanie", "nocowanie",
"nocowanie", "nocowanie", "nocowanie", "nocowanie", "nocowanie",
"Land Border Traffic", "seatguru.com", "Survey on participation of residents in trips",
"Tools", "Variables", "Variables", "Name, Address, PostalCode",
"Variables", "Coordinates", "Name, Address, PostalCode", "Name, Address, PostalCode",
"Geolocation Tool (HERE Maps API)", "Survey on tourist accommodation base",
"hotels", "Name, Address, PostalCode", "Name, Address, PostalCode",
"Coordinates", "Combining Data"), to = c(1000110, 1000120, 1000130,
1000140, 1000150, 1000160, 1000170, 1000180, 1000190, 1000201,
1000202, 1000203, 1000204, 2000305, 6000610, 6000620, 6000650,
7000110, 2000305, 6000610, 6000620, 7000120, 6000610, 7000130,
6000630, 6000640, 7000140, 3000310, 3000320, 6000630, 7000150,
6000630, 6000640, 7000160, 7000170, 7000180, 7000190, 2000305,
7000191, 7000192, 7000193, 2000210, 2000220, 2000230, 2000240,
2000250, 2000260, 2000270, 2000280, 2000290, 2000292, 2000293,
2000294, 2000295, 2000296, 2000297, 2000298, 2000299, 2000301,
2000302, 2000303, 2000304, 2000305, 2002001, 2000211, 2000223,
6000610, 2000222, 2000223, 6000610, 6000630, 6000640, 6000630,
6000640, 6000610, 6000610, 2000271, 6000610, 2000281, 6000610,
2000291, 6000630, 6000640, 6000630, 6000640, 3000330, 6000640,
6000702, 3000330, 3000310, 6000673, 6000674, 6000701, 2002991,
2002992, 3000310, 3000320, 3000330, 3000340, 3000350, 3000360,
3000370, 3000380, 3000391, 3000392, 6000630, 6000640, 6000630,
6000640, 6000610, 6000620, 6000640, 6000650, 6000701, 6000660,
6000660, 6000611, 6000612, 6000611, 6000612, 6000630, 6000611,
6000612, 6000611, 6000612, 6000660, 6000611, 6000630, 6000630,
6000630, 6000660, 6000610, 6000650, 6000630, 6000640, 6000630,
6000640, 6000650, 6000610, 6000620, 6000650, 6000630, 6000640,
6000672, 6000671, 6000660, 6000660, 6000674, 6000671, 6000672,
6000673, 6000660, 6000674, 6000671, 6000672, 6000673, 6000660,
6000671, 6000674, 6000630, 6000610, 6000620, 6000660, 6000672,
6000674, 6000674, 6000671, 6000673, 6000674, 2000305, 2000305,
6000610, 6000610, 2000305, 6000610, 2000305, 6000610, 6000674,
6000671, 6000673, 6000672, 6000674, 6000671, 6000672, 6000673,
2000305, 6000671, 6000672, 6000673, 6000660, 6000671, 6000672,
6000673, 6000640, 6000660, 6000671, 6000672, 6000673, 6000610,
6000620, 2000305, 6000650, 6000640, 6000630, 7000194, 6000640,
6000660, 6000671, 9000001, 8000002, 8000001, 9000001, 8000003,
1000110, 3000330, 9000001, 8000003, 8000001, 8000002, 6000999,
6000999, 6000999, 6000610), to_label = c("Hotels.com", "Booking.com",
"Airbnb.com", "Tripadvisor.com", "Skyscanner.net", "taxi2airport.com",
"365tickets.com", "seatguru.com", "Pochivka.bg", "Other webpages (booking accommodation)",
"hrs.com", "holydaycheck", "pincamp", "Register of accommodation establishments",
"Improve tourist accommodation base", "Spatial disaggregation of data on tourist accommodation base",
"Flash estimates of the use of tourist accommodation base", "Hotels.com",
"Register of accommodation establishments", "Improve tourist accommodation base",
"Spatial disaggregation of data on tourist accommodation base",
"Booking.com", "Improve tourist accommodation base", "Airbnb.com",
"Improve quality of satellite accounts", "Improve quality of tourists expenses data",
"Tripadvisor.com", "Survey on participation of residents in trips",
"Survey on trips made by foreigners", "Improve quality of satellite accounts",
"Skyscanner.net", "Improve quality of satellite accounts", "Improve quality of tourists expenses data",
"taxi2airport.com", "365tickets.com", "seatguru.com", "Pochivka.bg",
"Register of accommodation establishments", "hrs.com", "holydaycheck",
"pincamp", "NTR Tourist Establishments", "NRT Local Accommodation",
"Credit & Debit Card transactions", "Airport Data", "Register of non-categorised tourist accommodation establishments",
"Tax Authority Register of Short-Term Lease Properties", "Register of Properties offered for short-term lease through digital
platforms",
"Register of Addresses and Buildings", "NBTC-NIPO", "Land Border Traffic",
"Smart City", "Parking Meters Data", "Water Demand", "Ministry of Interior",
"Border traffic survey (BI)", "Waste production (ISPRA)", "Other sources",
"Monthly bed tax data inc. overnights", "Financial transaction data",
"Regulatory reporting FIN1-12", "BTB data", "Register of accommodation establishments",
"Mobile phone data", "Turismo de Portugal Open Data", "travelBI by Turismo de Portugal",
"Improve tourist accommodation base", "Turismo de Portugal Local Accommodation Open Data",
"travelBI by Turismo de Portugal", "Improve tourist accommodation base",
"Improve quality of satellite accounts", "Improve quality of tourists expenses data",
"Improve quality of satellite accounts", "Improve quality of tourists expenses data",
"Improve tourist accommodation base", "Improve tourist accommodation base",
"Netherlands Chamber of Commerce", "Improve tourist accommodation base",
"BAG Viewer", "Improve tourist accommodation base", "NBTC Dashboard",
"Improve quality of satellite accounts", "Improve quality of tourists expenses data",
"Improve quality of satellite accounts", "Improve quality of tourists expenses data",
"Survey on tourist accommodation base", "Improve quality of tourists expenses data",
"Improve quality of tourists transport data", "Survey on tourist accommodation base",

265
"Survey on participation of residents in trips", "Tourism potential",
"Tourism attractiveness", "Update register of accommodation establishments",
"Railway, airport and port data", "Survey on museums and similar institutions",
"Survey on participation of residents in trips", "Survey on trips made by foreigners",
"Survey on tourist accommodation base", "Border Traffic Survey",
"Survey on the visits by foreigners", "Survey data on tourist trips",
"Water Consumption", "Survey on rural tourism accommodations",
"Railway, airport and port data", "Survey on museums and similar",
"Improve quality of satellite accounts", "Improve quality of tourists expenses data",
"Improve quality of satellite accounts", "Improve quality of tourists expenses data",
"Improve tourist accommodation base", "Spatial disaggregation of accommodation",
"Improve quality of tourists expenses data", "Flash estimates",
"Update register of accommodation establishments", "Improve quality data on trips",
"Improve quality data on trips", "Eurostat Experimental Statistics",
"WPJ Milestones and Deliverables", "Eurostat Experimental Statistics",
"WPJ Milestones and Deliverables", "Improve quality of satellite accounts",
"Eurostat Experimental Statistics", "WPJ Milestones and Deliverables",
"Eurostat Experimental Statistics", "WPJ Milestones and Deliverables",
"Improve quality data on trips", "Eurostat Experimental Statistics",
"Improve quality of satellite accounts", "Improve quality of satellite accounts",
"Improve quality of satellite accounts", "Improve quality data on trips",
"Improve tourist accommodation base", "Flash estimates", "Improve quality of satellite accounts",
"Improve quality of tourists expenses data", "Improve quality of satellite accounts",
"Improve quality of tourists expenses data", "Flash estimates",
"Improve tourist accommodation base", "Spatial disaggregation of accommodation",
"Flash estimates", "Improve quality of satellite accounts", "Improve quality of tourists expenses data",
"Event related tourism", "City Tourism", "Improve quality data on trips",
"Improve quality data on trips", "Tourism attractiveness", "City Tourism",
"Event related tourism", "Tourism potential", "Improve quality data on trips",
"Tourism attractiveness", "City Tourism", "Event related tourism",
"Tourism potential", "Improve quality data on trips", "City Tourism",
"Tourism attractiveness", "Improve quality of satellite accounts",
"Improve tourist accommodation base", "Spatial disaggregation of accommodation",
"Improve quality data on trips", "Event related tourism", "Tourism attractiveness",
"Tourism attractiveness", "City Tourism", "Tourism potential",
"Tourism attractiveness", "Register of accommodation establishments",
"Register of accommodation establishments", "Improve tourist accommodation base",
"Improve tourist accommodation base", "Register of accommodation establishments",
"Improve tourist accommodation base", "Register of accommodation establishments",
"Improve tourist accommodation base", "Tourism attractiveness",
"City Tourism", "Tourism potential", "Event related tourism",
"Tourism attractiveness", "City Tourism", "Event related tourism",
"Tourism potential", "Register of accommodation establishments",
"City Tourism", "Event related tourism", "Tourism potential",
"Improve quality data on trips", "City Tourism", "Event related tourism",
"Tourism potential", "Improve quality of tourists expenses data",
"Improve quality data on trips", "City Tourism", "Event related tourism",
"Tourism potential", "Improve tourist accommodation base", "Spatial disaggregation of accommodation",
"Register of accommodation establishments", "Flash estimates",
"Improve quality of tourists expenses data", "Improve quality of satellite accounts",
"nocowanie.pl", "Improve quality of tourists expenses data",
"Improve quality data on trips", "City Tourism", "Geolocation Tool (HERE Maps API)",
"Name, Address, PostalCode", "Name, Address, PostalCode", "Geolocation Tool (HERE Maps API)",
"Coordinates", "hotels", "Survey on tourist accommodation base",
"Geolocation Tool (HERE Maps API)", "Coordinates", "Name, Address, PostalCode",
"Name, Address, PostalCode", "Combining Data", "Combining Data",
"Combining Data", "Improve tourist accommodation base"), length = c(250,
250, 250, 250, 250, 250, 250, 250, 250, 250, 250, 250, 250, 250,
250, 250, 250, 5, 250, 250, 250, 5, 250, 5, 250, 250, 5, 250,
250, 250, 5, 250, 250, 5, 5, 5, 5, 250, 5, 5, 5, 250, 250, 250,
250, 250, 250, 250, 250, 250, 250, 250, 250, 250, 250, 250, 250,
250, 250, 250, 250, 250, 250, 250, 5, 5, 250, 5, 5, 250, 250,
250, 250, 250, 250, 250, 5, 250, 5, 250, 5, 250, 250, 250, 250,
250, 250, 250, 250, 250, 250, 250, 250, 250, 250, 250, 250, 250,
250, 250, 250, 250, 250, 250, 250, 250, 250, 250, 250, 250, 250,
250, 250, 250, 250, 250, 5, 5, 5, 5, 250, 5, 5, 5, 5, 250, 5,
250, 250, 250, 250, 250, 250, 250, 250, 250, 250, 250, 250, 250,
250, 250, 250, 250, 250, 250, 250, 250, 250, 250, 250, 250, 250,
250, 250, 250, 250, 250, 250, 250, 250, 250, 250, 250, 250, 250,
250, 250, 250, 250, 250, 250, 250, 250, 250, 250, 250, 250, 250,
250, 250, 250, 250, 250, 250, 250, 250, 250, 250, 250, 250, 250,
250, 250, 250, 250, 250, 250, 250, 250, 250, 250, 250, 250, 5,
250, 250, 250, 250, 250, 250, 250, 250, 250, 250, 250, 250, 250,
250, 250, 250, 250, 250), width = c(1, 1, 1, 1, 1, 1, 1, 1, 1,
1, 1, 1, 1, 1, 1, 1, 1, 1, 1, 1, 1, 1, 1, 1, 1, 1, 1, 1, 1, 1,
1, 1, 1, 1, 1, 1, 1, 1, 1, 1, 1, 1, 1, 1, 1, 1, 1, 1, 1, 1, 1,
1, 1, 1, 1, 1, 1, 1, 1, 1, 1, 1, 1, 1, 1, 1, 1, 1, 1, 1, 1, 1,
1, 1, 1, 1, 1, 1, 1, 1, 1, 1, 1, 1, 1, 1, 1, 1, 1, 1, 1, 1, 1,
1, 1, 1, 1, 1, 1, 1, 1, 1, 1, 1, 1, 1, 1, 1, 1, 1, 1, 1, 1, 1,
1, 1, 1, 1, 1, 1, 1, 1, 1, 1, 1, 1, 1, 1, 1, 1, 1, 1, 1, 1, 1,
1, 1, 1, 1, 1, 1, 1, 1, 1, 1, 1, 1, 1, 1, 1, 1, 1, 1, 1, 1, 1,
1, 1, 1, 1, 1, 1, 1, 1, 1, 1, 1, 1, 1, 1, 1, 1, 1, 1, 1, 1, 1,
1, 1, 1, 1, 1, 1, 1, 1, 1, 1, 1, 1, 1, 1, 1, 1, 1, 1, 1, 1, 1,
1, 1, 1, 1, 1, 1, 1, 1, 1, 1, 1, 1, 1, 1, 1, 1, 1, 1, 1, 1, 1,
1, 1, 1, 1), label = c(NA, NA, NA, NA, NA, NA, NA, NA, NA, NA,
NA, NA, NA, NA, NA, NA, NA, NA, NA, NA, NA, NA, NA, NA, NA, NA,
NA, NA, NA, NA, NA, NA, NA, NA, NA, NA, NA, NA, NA, NA, NA, NA,

266
NA, NA, NA, NA, NA, NA, NA, NA, NA, NA, NA, NA, NA, NA, NA, NA,
NA, NA, NA, NA, NA, NA, NA, NA, NA, NA, NA, NA, NA, NA, NA, NA,
NA, NA, NA, NA, NA, NA, NA, NA, NA, NA, NA, NA, NA, NA, NA, NA,
NA, NA, NA, NA, NA, NA, NA, NA, NA, NA, NA, NA, NA, NA, NA, NA,
NA, NA, NA, NA, NA, NA, NA, NA, NA, NA, NA, NA, NA, NA, NA, NA,
NA, NA, NA, NA, NA, NA, NA, NA, NA, NA, NA, NA, NA, NA, NA, NA,
NA, NA, NA, NA, NA, NA, NA, NA, NA, NA, NA, NA, NA, NA, NA, NA,
NA, NA, NA, NA, NA, NA, NA, NA, NA, NA, NA, NA, NA, NA, NA, NA,
NA, NA, NA, NA, NA, NA, NA, NA, NA, NA, NA, NA, NA, NA, NA, NA,
NA, NA, NA, NA, NA, NA, NA, NA, NA, NA, NA, NA, NA, NA, NA, NA,
NA, NA, NA, NA, NA, NA, NA, NA, NA, NA, NA, NA, NA, NA, NA, NA,
NA, "string distance", "string distance", "1-1 match", NA), arrows = c("FALSE",
"FALSE", "FALSE", "FALSE", "FALSE", "FALSE", "FALSE", "FALSE",
"FALSE", "FALSE", "FALSE", "FALSE", "FALSE", "to", "middle;to",
"middle;to", "to", "FALSE", "to", "to", "to", "FALSE", "to",
"FALSE", "to", "to", "FALSE", "to", "to", "to", "FALSE", "to",
"to", "FALSE", "FALSE", "FALSE", "FALSE", "to", "FALSE", "FALSE",
"FALSE", "FALSE", "FALSE", "FALSE", "FALSE", "FALSE", "FALSE",
"FALSE", "FALSE", "FALSE", "FALSE", "FALSE", "FALSE", "FALSE",
"FALSE", "FALSE", "FALSE", "FALSE", "FALSE", "FALSE", "FALSE",
"FALSE", "FALSE", "FALSE", "FALSE", "FALSE", "to", "FALSE", "FALSE",
"to", "to", "to", "to", "to", "to", "to", "FALSE", "to", "FALSE",
"to", "FALSE", "to", "to", "to", "to", "to", "to", "to", "to",
"to", "to", "to", "to", "FALSE", "FALSE", "FALSE", "FALSE", "FALSE",
"FALSE", "FALSE", "FALSE", "FALSE", "FALSE", "FALSE", "FALSE",
"to", "to", "to", "to", "to", "to", "to", "to", "to", "to", "to",
"FALSE", "FALSE", "FALSE", "FALSE", "to", "FALSE", "FALSE", "FALSE",
"FALSE", "to", "FALSE", "to", "to", "to", "to", "to", "to", "to",
"to", "to", "to", "to", "to", "to", "to", "to", "to", "to", "to",
"to", "to", "to", "to", "to", "to", "to", "to", "to", "to", "to",
"to", "to", "to", "to", "to", "to", "to", "to", "to", "to", "to",
"to", "to", "to", "to", "to", "to", "to", "to", "to", "to", "to",
"to", "to", "to", "to", "to", "to", "to", "to", "to", "to", "to",
"to", "to", "to", "to", "to", "to", "to", "to", "to", "to", "to",
"to", "to", "to", "to", "FALSE", "to", "to", "to", "FALSE", "FALSE",
"FALSE", "to", "FALSE", "to", "to", "to", "to", "to", "to", "to",
"to", "to", "to")), row.names = c(NA, 223L), class = "data.frame")
# Create VisNetwork object ------------------------------------------------
# Create VisNetwork object
# "height" and "width" are optional and the default is automatic.
# "height" can be customized in pixels or as a percentage
# according your display resolution.
# "main" and "submain" define the title and subtitle.
visNet_Workflow_var_map <- visNetwork(nodes, edges,
# height = "800px",
height = "1000px",
width = "100%",
main="Overview of Variable Mapping on the PT Use Case",
submain="[PT]") %>%
# ~~Create Legend ------------------------------------------------
# Create a user defined VisNetwork Legend
visLegend(useGroups = FALSE,
width = 0.3,
# width = 0.2,
position = "right",
addNodes = data.frame(
label = c("Data Sources Type", "Data Sources", "Experimental Results", "External links", "Tools", "Variables"),
shape = c("dot", "dot", "square", "triangle", "diamond", "dot"),
color = c("teal", "orange", "purple", "lightblue", "lightgrey", "darkred"))) %>%
# ~~Interaction ----------------------------------------------
# Added functionalities for user interaction: navigations buttons and multi selection.
# Green navigation buttons are placed on the bottom left and bottom right of the network canvas.
# These will help to navigate, zoom in and out and re-center.
# Multi-selection: a long click as well as a control-click will add to the selection.
visInteraction(navigationButtons = TRUE, multiselect = T ) %>%
# ~~Export Current Network Canvas to PNG -------------------------------------------
# A small button with "Export to PNG" text will be placed on the bottom right corner
# of the network canvas. On click, a PNG file (the default) will be exported to downloads folder.
# Can be configured to "jpeg" or "pdf"
visExport(type = "png") %>%
# ~~Use igraph Layout -------------------------------------------
# Using a igraph layout allows to compute coordinates and fast rendering.
# The network will be rendered faster and with no stabilization.
# This is an option but will over run default settings for VisNetwork
# visIgraphLayout(type = "full") %>%

267
# ~~Default Format for Nodes -----------------------------------------
# Nodes will get a dot shape by default if none is provided in
# nodes$shape.
visNodes(shape = "dot",
color = list(
highlight = "#FF8000"),
shadow = list(enabled = TRUE, size = 10),
labelHighlightBold = T) %>%
# ~~Default Format for Edges -----------------------------------------
visEdges(shadow = FALSE,
color = list(color = "#0085AF", highlight = "#C62F4B"),
# smooth = list(enabled = F), # to generate straight lines
arrows = 'to') %>%
# ~~General Options (combo box)----------------------------------------------------------
# Creates two combo boxes for selection of nodes. One based on nodes id label (nodes$label)
# and another based on multiple groups per nodes using a comma as it is the case
# of nodes$group
# visOptions(highlightNearest = list(enabled = T, degree = 1, hover = T),
visOptions(highlightNearest = list(enabled = T, degree = 2, hover = T),
manipulation = TRUE,
# First combo box "Select by id"
# Defined by nodesIdSelection can be "values : Optional. Vector of possible values (node's id),
# and so order is preserve. Default to all id in nodes data.frame.
nodesIdSelection = list(enabled = T, selected = "1"),
# Second combo box "Select by group"
# Defined by selectedBy, uses multiple "categories" separated by a comma in nodes$group
selectedBy = list(variable = "group", multiple = TRUE)) %>%
# ~~Layout Options ----------------------------------------------------------
# When not using hierarchical layout, providing random seed manually
# will produce the same layout every time.
visLayout(randomSeed = 11, improvedLayout = T, hierarchical = F) %>%
# ~~Open URL in New Window--------------------------------------------------
# This fires an event when a node is selected and double clicked on.
# In this case the event is open url as defined in nodes$url in a new
# browser window.
# visEvents(selectNode =
visEvents(doubleClick =
"function(params) {
var nodeID = params.nodes[0];
var url = this.body.nodes[nodeID].options.url;
window.open(url, '_blank');
}") %>%
# ~~Clustering Options OFF--------------------------------------------------
# By default, clustering is performed based on nodes$group.
# Nevertheless in this case that variable has multiple groups per node,
# so we can define on which nodes should the clustering be done.
# This helps to keep the initial network declutered.
# Clusters can be expanded by double click and can be reinitialized by
# clicking the "Reinitialize clustering" in the lower left corner of
# the canvas
# visClusteringByConnection(nodes = c(1,2,3)) %>%
# ~~Physics Options--------------------------------------------------
# Configuration of the physics system governing the simulation
# of the nodes and edges.
# BarnesHut is the recommended solver for non-hierarchical layout.
# The remaining parameters were fine tuned for this particular network.
# visPhysics(maxVelocity = 5,
# solver = "barnesHut",
# barnesHut = list(avoidOverlap = 0.15,
# gravitationalConstant = -1500,
# springConstant = 0.01),
# repulsion = list(centralGravity = 1.5))
visPhysics(maxVelocity = 5,
solver = "barnesHut",
barnesHut = list(avoidOverlap = 0.15,
# centralGravity = 1,
gravitationalConstant = -1500,
springConstant = 0.01),

268
repulsion = list(centralGravity = 1.5))
# Show result on RStudio viewer-----------------------------------------------------------
visNet_Workflow_var_map
# Save visNetwork to HTML File -----------------------------------------------------------
# Save the visNetwork object to a single self-contained HTML file for sharing.
visSave(visNet_Workflow_var_map , file = "visNet_Workflow_var_map.html")
# ================ |-------------| ================
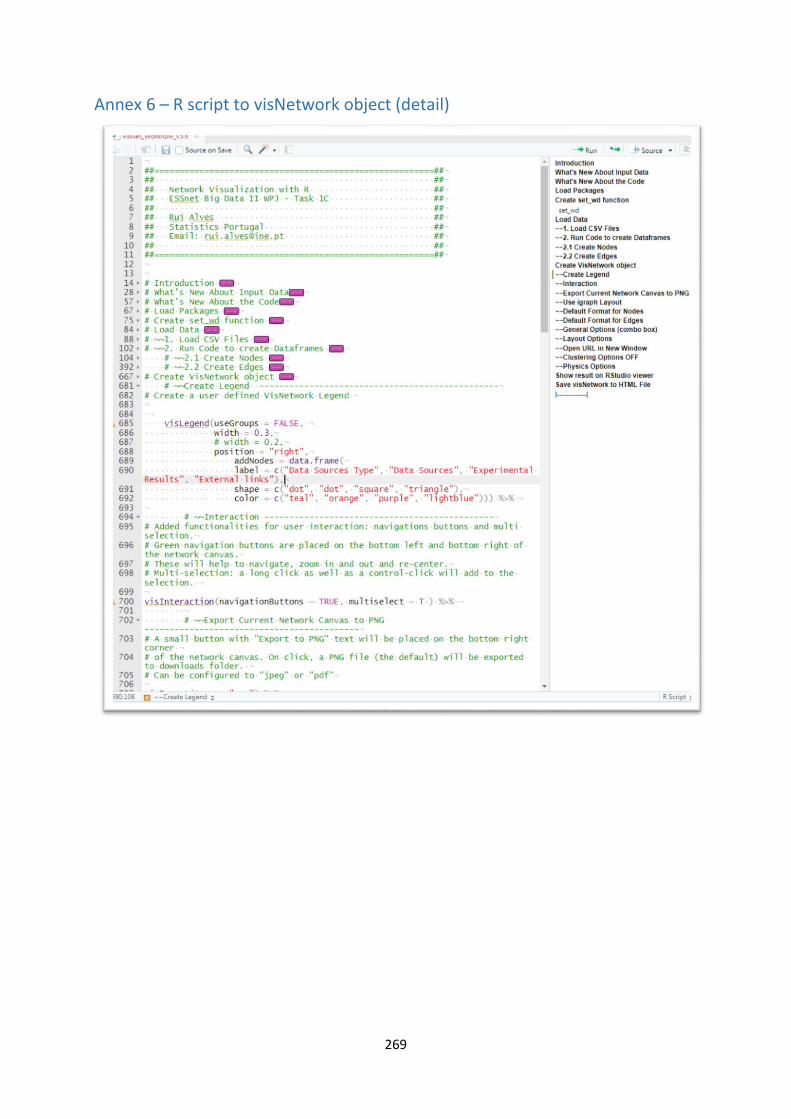
269
Annex 6 – R script to visNetwork object (detail)

270
Annex 7 – CBS taxonomy
CBS Nederlands toerisme CBS English tourism
toerisme @ CBS taxonomie tourism @ CBS taxonomy
Broader Terms Broader Terms
BT recreatie en cultuur BT recreation and culture
More specific terms More specific terms
NT2 accommodatiegebruik NT business travel
NT2 bestedingen toeristen NT holidays by Dutch people
NT2 logiesaccommodaties NT overnight accommodation
NT2 logiesvormen NT tour group
NT2 reisgezelschap NT tourism accounts
NT2 toerismebeleid NT tourism policy
NT2 toerismerekeningen NT tourist areas
NT2 toeristen NT tourist expenditure
NT2 toeristengebieden NT tourists
NT2 vakanties van Nederlanders NT types of accommodation
NT2 zakelijk toerisme NT use of accommodation
Related terms Related terms
RT reisbranche RT travel industry
Non preferred terms Non preferred terms
UF vreemdelingenverkeer UF foreigners traffic
CBS Nederlands gebruik van accommodaties CBS English use of accommodation
accommodatiegebruik @ CBS taxonomie use of accommodation @ CBS taxonomy
Broader Terms Broader Terms
BT toerisme BT tourism
More specific terms More specific terms
NT3 overnachtingen NT length of stay
NT3 verblijfsduur NT overnight stays
CBS Nederlands bestedingen toeristen CBS English tourist expenditure
bestedingen toeristen @ CBS taxonomie tourist expenditure @ CBS taxonomy
Non preferred terms Non preferred terms
UF toeristische bestedingen UF tourist spending

271
Annex 8 – Process for data linkage
Step-by-step process:
1. Download and installation of “Fuzzy Lookup Add-In For Excel24”
2. Insert two datasets in different excel sheets (scraped data and survey frame of tourist
accommodation establishments). Prepare scraped data removing blanks (i.e. from postal
code) or non-text characters Write a new VBA function “translit” and use it to transliter hotel’s
name column to capital Latin characters. This function uses two arguments: inchar and exchar.
The inchar definition is a column (or row) in the sheet that contains one by one the characters
to be replaced in the text and the exchar argument is another line (or column) that contains
the characters that will replace them.
The vba code is the following:
Function translit(keimeno As String, inchar As Variant, _
exchar As Variant) As String
Application.Volatile True
Dim VarrAs Variant
Dim pl As Integer, gr As Integer, lu As Integer
Dim gramma As String
pl = Len(keimeno)
ReDimVarr(pl - 1)
For gr = 1 Topl
gramma = Mid(keimeno, gr, 1)
For lu = 1 To inchar.Count
If gramma = inchar(lu) Then gramma = exchar(lu): Exit For
Next
Varr(gr - 1) = gramma
Next
transfer = Join(Varr, "")
End Function
3. A joint database of establishments resulted by linking scraped with Register data is the final
output of the methodology for the data linkage process.
4. Evaluation of the linkage process by calculating the confusion matrix.
24 The Fuzzy Lookup Add-In for Excel performs fuzzy matching of textual data in Microsoft Excel. It can be used
to identify fuzzy duplicate rows within a single table or to fuzzy join similar rows between two different tables.
The matching is robust to a wide variety of errors including spelling mistakes, abbreviations, synonyms and
added/missing data. For instance, it might detect that the rows “Mr. Andrew Hill”, “Hill, Andrew R.” and “Andy
Hill” all refer to the same underlying entity, returning a similarity score along with each match. While the default
configuration works well for a wide variety of textual data, the matching may also be customized for specific
domains or languages.

272
The Transliteration system: UN/ELOT was used as follows:
Transliteration system: UN/ELOT
The United Nations recommended system was approved in 1987 (resolution V/19), based on
the ELOT 743 conversion system of the Greek Standardization Organization.