Final Report - European Commission
477
-
Upload
khangminh22 -
Category
Documents
-
view
1 -
download
0
Transcript of Final Report - European Commission

C l ient : European Commission - DG Envi ronment
Subject : Opt ion for coastal i nformation systems
Doc. t it le : F i na l Report
Document no . " 2 1 807-REL-T006 . 2
D istr i bution l i st : DG Envi ronment , fi le 2 1 807
rev. date
0 0 1 . 07 . 20 1 1
1 29 . 07 . 20 1 1
2 3 1 . 08 .20 1 1
3
issued for pa es preparedComments 9 1 + 6Ann . ER
Approva l 1 1 6 + 6An n . ER
I nfo rmat ion 1 24 + 6An n . ER, /,--
checked
ME
ME
approved
MB
MB
Thetis S . p .A .Caste l l o 2737/f, 30 1 22 VeneziaTe l . +39 04 1 240 6 1 1 1
Fax +39 04 1 52 1 0292
www. thet i s . i t
. . . . . . . . . . . . . . . . . . . . . . . . . . . . . . . . . . . . . . . . . . . . . . . . . . . . . . . . . . . . . . . . . . . . . . . . . . . ..
. . . . . . . . . . . . . . . . . . . . . . . . . . . . . . . . . . . . . . . . . . . . . . . . . . . . . . . . . . . . . . . . . . . .
� . . . . . . . . . . . . . . . . . . . . . . . . . . . . . . . . . . . . . . . . . . . . . . . . . . . . . . . . . . . . . . . . . . . . . . . . . . .
: ¢ x:.. . . . . . . . . . .. \
. . . . . :
'i?iI 1:1;: "i'i:
EMAS.. .. . . ..... ... .. . . . .. .. . . .. ... ..... .. . .. . .... .
. . . . . . . . . . . . : , : , :. :
21807-REL-T006.2 page 2/124
Table of contents
1 Non-technical summary .................................................................................................... 4
2 Introduction ..................................................................................................................... 10
2.1 Study objective and expected results ................................................................... 10
2.2 Study structure ..................................................................................................... 11
2.3 Objective and structure of the final report ............................................................ 12
3 Study Methodology ......................................................................................................... 14
3.1 General overview of existing coastal information systems................................... 14
3.2 In-depth description of selected coastal information systems .............................. 20
3.3 Development of key structuring policy requirements for CISs ............................. 22
3.4 Impact assessment of policy requirements and options ...................................... 23
3.5 Stakeholder identification and involvement .......................................................... 25
3.6 Stakeholder participation ...................................................................................... 26
4 Analysis of CIS illustrative cases .................................................................................... 29
4.1 Overview analysis ................................................................................................. 29
4.2 In-depth analysis of selected CIS ......................................................................... 37
4.3 Results interpretation ........................................................................................... 40
5 Policy requirements ........................................................................................................ 49
5.1 Approach for the policy requirements identification ............................................. 49
5.2 Policy requirements description ........................................................................... 53
6 Policy options definition .................................................................................................. 59
6.1 Problem identification and objective definition ..................................................... 59
6.2 Baseline scenario and policy options definition .................................................... 65
7 Impact assessment of policy options .............................................................................. 77
7.1 Impacts definition .................................................................................................. 77
7.2 Assessment of direct impacts of policy options .................................................... 81
7.2.1 Direct impacts: expected benefits ............................................................ 84
7.2.2 Direct impacts: cost implications ............................................................. 93
7.3 Assessment of indirect impacts of policy options ............................................... 106
7.4 Policy options comparison .................................................................................. 115
8 Conclusions .................................................................................................................. 121

21807-REL-T006.2 page 3/124
Annexes
Annex 1 – Overview analysis: analytical tables of European CIS cases
Annex 2 – Overview analysis: analytical tables of extra-European CIS cases
Annex 3 – Results of the in-depth analysis
Annex 4 – Information source for the in-depth analysis
Annex 5 – List of identified stakeholders
Annex 6 – Workshop report
21807-REL-T006.2 page 4/124
1 Non-technical summary
The European Commission has recently launched a review of the EU ICZM Recommendation,
with a view to a follow-up proposal by the end of 20111. An impact assessment is conducted
to explore the need and options for future EU action and to assess potential social, economic
and environmental consequences that new initiatives proposed by the European Commission
may have. This important activities imply a wide variety of initiatives aiming to provide input to
the Recommendation review, including: an on-line public consultation, a public hearing event
held on the 30th of May in Brussels, Member State reports on progress in ICZM implementa-
tion, the OURCOAST project2 gathering and disseminating case studies and practical exam-
ples of coastal management practice in Europe, specific studies to inform the impact assess-
ment. The present study is part of these latest initiatives, together with other three parallel
studies: (i) a study to examine the Member States reports on progress on ICZM up to 2010, (ii)
a study to assess the impacts of the policy options for a follow-up proposal to the EU ICZM
Recommendation, (iii) a study to model land-use changes in the European coasts.
One of the main challenges in the implementation of ICZM is the one related to the integration
of different sources of knowledge and different types of information in order to better under-
stand coastal processes and dynamics and in order to develop scenarios for better evaluate,
and manage properly, the possible impacts deriving from different coastal uses. Within this
framework, gathering and proper structuring of relevant data, transparent and ready available
information to decision makers and stakeholders, adequate communication to citizens, infor-
mation sharing, effective and concrete use of data and information in policy and decision mak-
ing are all key elements to support and implement integrated planning and management of
coastal zones. The diffusion, further development (including innovation) and actual use of in-
formation tools (coastal information systems - CISs) can therefore concretely improve the im-
plementation of ICZM in Europe; indeed this is one of the strategic objective of EU ICZM relat-
ed policies. This study aims to contribute to this overall goal, in particular by the identification
of the key structuring requirements and related policy options for coastal information systems
that may significantly improve the support to ICZM implementation through scientifically-based
data, functions, tools and mechanisms.
To respond to this goal, the study is organised in three main technical activities. The first one
dealt with the overview and in-depth analysis of CIS illustrative cases to depict main character-
istics of existing operative systems, related strengths, weaknesses and gaps in supporting
ICZM. The second activity represents the core of the study; based on the Task 1 results, and
other significant input, this activity aimed to identify policy requirements and related policy op-
tions to improve CIS support to the diffusion and implementation of ICZM processes at various
scales. The same activity assessed policy options in terms of expected (direct and indirect)
benefits and costs or negative effects. Task 1 and Task 2 activities implied stakeholder in-
volvement and participation (Task 3) in relation to various steps of the study. This task in par-
ticular included the organisation of a stakeholder workshop that was held in Marseille on the
6th of May 2011.
1 http://ec.europa.eu/environment/iczm/home.htm 2 http://ec.europa.eu/environment/iczm/ourcoast.htm
21807-REL-T006.2 page 5/124
The overview analysis considered forty CIS illustrative cases, representing different levels of
application (local, sub-national, national, transnational and regional sea one), regional seas
and CIS’ typologies. Based on the obtained results, twelve cases were further in-depth ana-
lysed through direct interviews of main involved actors. Task 1 analysis highlighted the follow-
ing main issues related to CIS support to ICZM:
For the great majority of considered illustrative cases (28 – 70%) the CIS geographical
area of interest is mainly defined by administrative boundaries (in particular for the na-
tional and sub-national levels). For the 30% of the cases (in particular local level ones)
the area of interest has been mainly defined according to an ecosystem-based ap-
proach;
Territory and environmental data and information are properly considered in CISs,
while social and in particular economic and governance data are properly included in
a relatively limited number of CISs;
Other data gaps or weaknesses are related to: (i) historical series, generally limited to
a small number of specific issues, (ii) climate change related data, (iii) 3D data (e.g.
DEM)
Almost half of the considered CIS cases provides basic ICZM knowledge and process
related functionalities: availability of geo-spatial data, operation at different spatial
scale, multi-time data and information (although limited only to specific issues), sup-
port to problem understanding and structuring, support to identification and assess-
ment of planning and management alternatives;
More advanced ICZM functions are much less available, such as: ICZM indicators and
indexes, climate change related functions (i.e. on-line tools enabling users to interac-
tively visualise and analyse climate change and sea level related data), stakeholder
involvement and participation, vision building and scenario development, support to
monitoring and evaluation, support to adaptive planning and management;
Tools enabling an appropriate e-participation in ICZM (i.e. e-forum, geo-tagging, video
sharing, etc.) are still not much diffused (20% of the cases).
The overview and in-depth analysis highlighted significant strengths of existing CISs, which
however are not always properly exploited to fully support the ICZM processes at various
scales. The same analysis enabled to identify main current CIS’s weakness and gaps; i.e. key
issues to be dealt with in terms of new, and often innovative, requirements. The main problem
to be addressed is therefore a twofold problem that can be summarised as follows:
Underuse or improper use of existing coastal information systems within the ICZM
process at various scales.
Existence weakness and gaps to be addressed through the development of new CIS’
features to further improve their use within the ICZM process at various scales.
In relation to the above twofold problem, it is important to act on all the CIS’ component includ-
ing in particular: contents (data, information and related structuring), on-line functions and
tools related to different target users (expert and non-expert), CIS’ scope in relation to different
users (decision and policy making, coast management and planning, stakeholder participation,
etc.), and management and operation mechanisms. Contents and function related require-
ments can mainly act on the design and development of new CISs features thus principally

21807-REL-T006.2 page 6/124
addressing the second aspect of the problem, while mechanisms can also determine signifi-
cant improvement in the use of already existing features, thus strengthening their positive ef-
fects on the ICZM process (first aspect of the problem).
Policy options formulated by the study aim to address the above problem; their general objec-
tive is therefore to improve the concrete support of coastal information systems to the ICZM
process, enhancing CISs diffusion and strengthening their use in strict connection to integrat-
ed coastal planning and management. In relation to this general objective, the following specif-
ic objectives have been identified:
Increase the use of coastal information system in providing full support to implement
the key ICZM principles, in particular as defined by the Recommendation
2002/413/EC, such as: broad overall perspective (thematic and geographic), long term
perspective, adaptive management and sound scientific basis, local specificities and
diversity of European coasts, working with natural processes, involving all parties con-
cerned in the management process, support and involvement of all relevant adminis-
trative bodies (at national, regional and local level), use a combination of instruments
to facilitate coherence between sectoral policies objectives and between planning and
management.
Provide support (through data, functions and management mechanisms) to the on-
going integration process between ICZM and MSP, and more in general between
ICZM and close related policies (including in particular the EU policy on climate
change adaptation).
Simplify the use of coastal information systems in order to make easier and more im-
mediate their support to the ICZM decision making.
Within the above framework, the study subsequently focused on the formulation of the policy
options for coastal information systems, i.e. integrated and homogenous sets of the key struc-
turing policy requirements. Firstly a “baseline scenario” was defined, to set a reference
benchmark for the impact assessment of the policy options. In the specific context of the
study, the baseline scenario is defined as the scenario not including the implementation of
new policy requirements for coastal information systems and implying the fulfilment of already
set legislative requirements, in particular related to implementation of the INSPIRE Directive.
In relation to the identified problems and objective, the study formulated the following three
policy options:
P1 – Improving data and information base; P1 option deals with the principal identified
data and information gaps, specifically related to: socio-economic and governance da-
ta, integrated information (i.e. indicators, indexes or maps generated through the inte-
grated analysis of different data typologies), multi-time data (i.e. historical series) and
climate change data. The final goal is therefore the creation of a wider database able
to address the various sectors and integrated aspects of the ICZM holistic approach
as well as its long-term perspective, thus improving the current main contents gaps
characterising the baseline scenario. The implementation of the P1 policy option main-
ly relies on the integration within CISs of already existing data and information, still not
included in the system, rather than on the acquisition of new data or the realisation of
new study.

21807-REL-T006.2 page 7/124
P2 – Improving and innovating functions and tools; P2 option mainly aims to improve
the availability of functionalities and tools directly supporting ICZM decision makers
and coastal planners and managers, as well as to increase stakeholders’ involvement
and participation in the ICZM process. This policy option is therefore characterised by
two main objectives. The first goal is to provide users with on-line functions and tools
enabling them to interactively analyse and elaborate CIS’s data, thus supporting ICZM
decision making through new information produced by these tools. In this perspective
P2 policy option can be strictly related to P1 one; a wider and more complete data and
information base can better support data analysis and elaboration through the newly
available tools. The second goal is to further develop on-line tools to involve stake-
holders in the generation and use of coastal information and more in general in the
ICZM process. The implementation of this option will significantly evolve the current
state of the art (baseline scenario) in relation to interactive tools (for ICZM decision
making and stakeholder involvement) available on-line.
P3 – Enhancing cooperation; P3 policy option mainly aims to enhance cooperation
among different subjects involved in the CISs implementation and management and
more in general in ICZM process, thus improving the CISs support to this latter. Spe-
cifically, increased horizontal and vertical cooperation is desirable among: structures
of the same authority involved in ICZM and/or the CIS’ management and operation,
different public authorities involved in the ICZM process, different coastal data provid-
ers and managers, managers of different CISs related to the same area of interest.
The P3 policy option is implemented through the following principal specific issues:
o Progressively move towards the adoption of an ecosystem-based approach in
the definition of the CIS’s context and geographic area of application;
o Establish strict link and cooperation between the structure responsible for the
CIS management and operation and the structure responsible for the imple-
mentation of the ICZM process;
o Improve the use of protocols facilitating geo-spatial data sharing, implying co-
operation among different data producers and managers.
P3 focus is therefore on the reinforcement (respect to the baseline scenario) of coor-
dination mechanisms that can enhance the CIS usefulness in promoting and imple-
menting ICZM principle. It does not only refer to changes and modification to be
brought to the coastal information systems themselves, but it also implies a great ef-
fort in cooperation among different subjects directly or indirectly related to CISs and
more in general to the ICZM process.
The conceptual framework of the three policy options and the baseline scenario is illustrated in
Figure 6-3. Policy options were then assessed in terms of direct (or primary) and indirect (or
derived) impacts. Direct impacts are those related to effects directly determined by a CIS poli-
cy option on key issues of ICZM diffusion and implementation in Europe or to the use and the
operation of the coastal information systems. Indirect impacts are those directly or indirectly
deriving from the direct ones. Evaluation of direct and indirect impacts attempt to assess both
expected benefits and negative effects. Expected benefits express how the policy options
would contribute to the achievement of the identified general and sector objectives and to pro-
vide solutions to the main depicted problem. Negative impacts can be mainly due to increase

21807-REL-T006.2 page 8/124
in costs or in general effort needed for the policy implementation, and increase in difficulties
related to the use of the system.
All the three options represent a significant step forward compared to the baseline scenario,
since they include new requirements to be implemented in the CISs, contributing to further in-
crease the support to the ICZM process. The impact assessment showed that the three policy
options can be conceptually distributed along a gradient. P3 represents the most ambitious
policy option, in terms of economic and human resources likely required for its implementation,
but also in terms of expected direct and indirect benefits. P2 is in a relative medium position,
while P1 is characterised by a relative lower level of ambition.
Cost related to the implementation of the three policy options in the European Union are
summarised by the following general figures (all estimations represent additional costs to the
baseline scenario):
P1 policy option: 13.3 – 20.0 million € for the development cost and 26.0 – 38.9 million
€ for yearly management costs;
P2 policy option: 18.4 – 27.6 million € for the development cost and 30.7 – 46.1 million
€ for yearly management costs;
P3 policy option: 43.1 – 64.7 million € for the development cost and 53.5 – 80.2 million
€ for yearly management costs;
Any use of these estimations should acknowledge the important simplification and assumption
that the study necessarily had to include dealing with the heterogeneous nature of existing
coastal information systems and the main gaps in the input data needed for the analysis (see
chapter 7.2.2 for methodological details).
The full implementation of the P3 option would require an effort (to upgrade about the 64% of
existing CISs) that is 1.6 greater than the one required by the full implementation of the P1 op-
tion (corresponding to 41% of CISs to be upgraded); P3 expected effort is also greater than P2
one (56% of CISs to be upgraded). The following rough schematisation of policy ambition and
implementation challenge can be therefore defined: P3 > P2 > P1. However, the implementa-
tion of all the three policy options still requires relevant efforts.
In terms of likely affected categories the following considerations are possible: P3 option is
expected to mainly affect international institutions and bodies (e.g. Regional Sea Commis-
sions) and the public administrations involved in ICZM in terms of decision making and coastal
planning and management. Also the other two policies will likely generate significant positive
effects for decision makers and coastal planners/managers of the public administrations. P2
will significantly affect research institution and the civil society, too, while P1 expected benefits
will be probably related again to research institutions and private companies, as well.
Significant differences exist among the various European regions in relation to the current im-
plementation level of the three policy options and the related expected benefits and effort
needed for their further improvement. The analysis showed the greatest challenges in general
are related to: (i) the P3 option implementation in all the regions with relatively minor relevance
for the North Sea and (ii) the Black Sea region for all the three policy options, where however
there are significant on-going initiatives that will probably improve the current situation. Com-
pared to P3, P2 option is better represented in the current CISs, although a relevant effort is
still required, in particular for the Baltic Sea, the Celtic Sea and the Bay of Biscay and Atlantic
Iberian Coast, at least according to the analysis performed in this study. Finally main chal-
21807-REL-T006.2 page 9/124
lenges related to P1 implementation are expected to be in general lower than P3 and P2 ones,
being slightly more consistent for the Mediterranean and the North Sea.
In terms of policy instruments for the implementation of the different option the following main
considerations are provided by the study:
P1 policy option includes essential requirements to improve the CISs’ capacity in sup-
porting the ICZM process and can be therefore considered as a necessary (or basic)
step to improve CIS’ support to ICZM. In this perspective, this policy option can be in-
corporated in an EU binding legislative framework (i.e. EU Directive) defining obliga-
tions for the ICZM implementation, also in relation to the CISs further improvement. A
strict link with the INSPIRE Directive is also essential for the P1 policy option imple-
mentation.
An EU binding legislative framework could also fit with the second policy option (P2),
which also includes some essential requirements for the improvement of the CISs
support to the ICZM process (i.e. the development of new tools to better support ICZM
decision making and stakeholders’ participation). However, this could be more effi-
ciently implemented through the Recommendation policy instrument that enables a
higher level of flexibility.
The implementations of the P3 policy option (focusing on enhanced cooperation) can
be likely more efficiently supported through incentives, e.g. a policy programme
providing a common framework for and financial support to projects and studies deal-
ing with P3 key issues. The higher costs related to the P3 policy option also suggest
to avoid the adoption of a strictly binding approach for the implementation of this poli-
cy and to prefer a more flexible and progressive mechanism.
As a final conclusion, the study suggests to adopt a two phase approach. The first four-five
years phase would focus on P1 and P2 policy options (to be implemented through an EU Di-
rective and/or an EU Recommendation). Different effort could be given to each of the two poli-
cy option according to the differences highlighted in the current implementation level among
the various European Regions; i.e.: greater attention to P2 for the Baltic Sea, the Celtic Sea
and the Bay of Biscay and Atlantic Iberian Coast; equal attention to P1 and P2 for the North
Sea and the Mediterranean Sea for which however almost half of the analysed systems are
currently characterised by a good level of P1 and P2 implementation; great attention to CIS
strengthen and CIS-ICZM link reinforcement in general for the Black Sea.
The first phase should not totally neglect the P3 option; whenever opportunities arise this
should be promoted through a dedicated policy programme, even if the major focus would be
on P1 and P2, and its implementation monitored to correctly depict the occurring progresses.
An interim and final evaluation of the first phase results will be useful to prepare the second
phase that will specifically focus on the implementation of the P3 option. This evaluation will
be also useful to fine-tune the policy instrument to be used to successfully implement the P3
option in the second phase, i.e. the continuation of an incentives-based policy programme
and/or the development of another policy instrument (e.g. a specific EU Recommendation).
21807-REL-T006.2 page 10/124
2 Introduction
2.1 Study objective and expected results
Gathering and proper structuring of relevant data, transparent and ready available information
to decision makers and stakeholders, adequate communication to citizens, information shar-
ing, effective and concrete use of data and information in policy and decision making are all
key elements to support and implement integrated planning and management of coastal
zones. In relation to ICZM, EC Communication COM(2007)308 highlights that “While the
methodology to assess the spatial impacts of EU policies has progressed, the gaps in data
and the lack of effective information-sharing systems are still a barrier to its more widespread and pro-active use in decision making processes”.
In this perspective the study generally aims to contribute to the implementation of the above
issues within the development and use of coastal information systems, thus contributing to the
diffusion of tools resulting in being actually useful and concretely used in integrated coastal
zone planning and management. To pursue this overall goal, the study foresees the identifica-
tion and assessment of policy requirements for coastal information systems that will likely con-
tribute to the follow-up proposal to the EU-ICZM Recommendation (2002/413/EC). Indeed, the
study focuses on the role that coastal information systems can play in concretely supporting
the implementation of ICZM processes at various scales (local, sub-national, national and in-
ternational). Therefore the study concern is mainly on operational systems rather than on re-
search initiatives. It may also include systems that are at an advanced stage of development
(pilot or pre-operational systems) or other ones that are particularly relevant for innovation for
examples in terms of functionalities, technological platforms or contents. The above overall
aim can be detailed in the following specific study objectives:
Provide an overview of illustrative examples of existing coastal information systems in
order to depict a general understanding of the main characteristics and level of use of
existing systems with the ICZM processes. This overview also aims to identify the
more interesting systems to be in-depth analysed;
Analyse in details the selected coastal information systems. The in-depth analysis en-
ables to clearly understand the strength and weakness of existing systems and identi-
fy the elements to be further improved;
Develop key structuring policy requirements for ICZM supporting information systems,
on the basis of the results obtained by pursuing the previous described goals. Identi-
fied requirements shall be: (i) relevant at the EU level, (ii) the most remarkable ones in
supporting the development of coastal information systems related to ICZM, (iii) con-
crete and operational in order to result in being really useful, (iv) ambitious and inno-
vative to introduce new steps in the development of coastal information systems and
in their use in the ICZM process;

21807-REL-T006.2 page 11/124
Assess the positive and negative impacts of the policy requirements and related policy
options (i.e. integrated sets of policy requirements) to identify the conditions that can
contribute to the improvement of coastal information system and those than can im-
pede the process;
Organise the involvement and participation of different typologies of key stakeholders
in various steps of the study, in order to benefit from their expertise and experience.
The main expected result is a key set of properly identified, assessed and validated policy op-
tions (and related policy requirements) for coastal information systems. These requirements
will likely support the further extension, improvement and innovation of ICZM related infor-
mation systems with the aim to concretely support the ICZM implementation at the EU level
and in the EU member states. The study expected results also include:
A general overview of existing coastal information system around Europe;
An understating of the key factors supporting or limiting ICZM-related information sys-
tems;
A full understanding of the role of coastal information system in the concrete support
to the implementation of the various ICZM steps.
2.2 Study structure
The study is organised in four principal tasks, including three technical ones and one task
dealing with project management, technical coordination and final reporting. Each task is
structured in sub-tasks as briefly described below. Figure 2-1 illustrates the conceptual
scheme of the study activities, as well as the mutual interrelations among the same. Sub-tasks
belonging to the same task are identified by a specific colour: Task 1 – orange, Task 2 – yel-
low, Task 3 – light blue, and Task 4 – grey.
The first task of the study is dedicated to the analysis of the illustrative cases of existing
coastal information systems. As highlighted in the previous section, the focus is on operational
systems, in case including some innovative, pre-operational or pilot systems, whose analysis
can provide remarkable information for the other study activities. Task 1 is divided in two sub-
tasks. The first one (1.1) aims to depict a general overview of the existing information systems
supporting ICZM and has enabled to select the most representative ones to be in-depth ana-
lysed by the second sub-task (1.2).
The results of Task 1 constitute one of the bases for the implementation of Task 2 “Definition
of the policy requirements/options and assessment”. This task is divided in three sub-tasks.
The first one (2.1) is dedicated to develop key structuring policy requirements for ICZM sup-
porting information systems. The same policy requirements are assessed in sub-task 2.3 in
terms of impact evaluation of policy options (i.e. integrated set of policy requirements), accord-
ing to the methodology optimised in sub-task 2.2.
Task 3 is dedicated to the stakeholder involvement and participation, and is structured in three
sub-tasks: stakeholder identification and involvement (3.1), stakeholder participation (3.2),
analysis of stakeholder feedbacks (3.3). Stakeholder participation has been in particular rele-
vant for the optimisation and validation of policy requirement, and related policy options, identi-
fied and assessed in Task 2. Stakeholders can bring a very important contribution to the study,

21807-REL-T006.2 page 12/124
concurring to generate concretely useful results. The study therefore has foreseen their in-
volvement also in other activities, including specifically feedbacks on illustrative cases of
coastal information system for the overview and the in-depth analysis (sub-task 2.1) as well as
the same development of policy requirements (sub-task 2.1).
Technical tasks are continuously supported by project management and coordination (Task 4).
Task 4 also includes a specific sub-task dedicated to the elaboration of the draft and conclu-
sive version of this final report.
1.1 General overview of coastal information systems
1.2 In-depth description of coastal information systems
2.1 Development of key structuring policy requirements
2.3 Impact assessment of policy requirements
2.2 Optimisation of the methodology for the impact assessment
3.1 Stakeholder identification and involvement
3.2 Stakeholder participation
3.3 Analysis of stakeholder feedbacks
4.2 Final reporting
4.1 Project management and technical coordination
Figure 2-1 Conceptual scheme of the study activities.
2.3 Objective and structure of the final report
This document constitutes the final report of the study “Options for coastal information sys-
tems” and aims to illustrate findings and results of the performed activities. Table 2-1 summa-
rises all the deliverables issues during the study, including this final report.
The final report is structured in eight chapters. The first chapter includes the executive sum-
mary. Chapter 2 illustrates introduction contents, i.e. the study’s objective and expected re-
sults as well as the study structure, which is organised in three tasks including different sub-
tasks. Chapter 3 deals with methodological aspects for each of the three technical tasks mak-
ing the study. The fourth chapter illustrates Task 1 results, related to the overview and in-
21807-REL-T006.2 page 13/124
depth analysis of the considered illustrative cases of existing CISs. The same chapter sum-
maries the main issues arising from the interpretation of these results. Detailed data gathered
by Task 1 activities are reported in the following annexes:
Annex 1 contains the analytical tables of the analysed European CIS cases;
Annex 2 contains the analytical table of the analysed extra-European CIS cases;
Annex 3 contains the results of the in-depth analysis, i.e. information gathered through
direct interviews on selected CIS cases;
Annex 4 contains details on information sources used for the in-depth analysis.
Chapter 5 describes the approach used in the identification of policy requirements aiming to
improve CIS support to ICZM, including stakeholder contribution, and the developed policy re-
quirements. Based on the results of previous activities, chapter 6 focuses on the identification
of the core problem and objectives of the analysis and develop the related policy options, i.e.
integrated sets of policy requirements. Chapter 7 deals with the impact assessment of the de-
fined policy options, including identification of direct and indirect impacts to be used in the as-
sessment, their evaluation and policy options comparison. Finally, chapter 8 attempts to draw
some conclusions in relation to the follow-up of the EU-ICZM Recommendation
(2002/413/EC). The report is completed by Annex 5 including the list of stakeholders invited to
support the study and Annex 6, the Report of the stakeholder workshop held in Marseille on
the 6th of May 2011.
Table 2-1 Study deliverables.
Title Reference code Issuing date
Inception Report 21807-REL-T001.1 01.03.2011
Progress Report 21807-REL-T002.1 27.05.2011
Discussion Paper – Stakeholder Work-shop 6th May 2011 Marseille
21807-REL-T003.0 28.04.2011
Workshop Report – Stakeholder Work-shop 6th May 2011 Marseille
21807-REL-T004.0 20.05.2011
Policy options – Progress results 21807-REL-T005.0 14.06.2011
Final Report 21807-REL-T006.0 30.06.2011

21807-REL-T006.2 page 14/124
3 Study Methodology
3.1 General overview of existing coastal information sys-tems
Sub-task 1.1 aims to depict a general overview of the characteristics of existing coastal infor-
mation systems, through the analysis of a wide set of illustrative cases. The study gives much
relevance on the concrete and practical effects of the use of information system within the
ICZM process. Therefore, the focus is on operational system, i.e. information systems that are
already used to support coastal planning and management. However, the overview may also
include some pre-operational, pilot or innovative systems, whenever these can provide par-
ticularly relevant information for the following tasks of the study and in particular for the defini-
tion of policy requirements. This is for example the case of not-yet operational systems that
can make available some innovative functionalities or procedures resulting in being particularly
useful in relation to CIS/ICZM key issues.
The term coastal information system (CIS) refers to a wide variety of system typologies, in-
cluding among the others: web-site, web-portal, web-GIS or web-atlas, off-line GIS, indicators
web viewers, spatial data infrastructure, map and data service, mixed systems.
The methodological approach has included scan of various types of information sources, i.e.:
EU funded and co-funded projects related to ICZM and/or coastal information sys-
tems, in particular considering INTERREG projects or other EC programmes aiming to
the development of operative tools and procedures (Table 3-1);
Main research projects co-financed by EU (FP6 and FP7 principally) related to ICZM
and/or coastal information system (Table 3-1);
Other projects directly commissioned by the European Commission such as
EUROSION and in particular OURCOAST, dealing with an overview and analysis of
ICZM best practices in Europe;
Relevant non-EU initiatives, i.e. illustrative examples from United States and other
countries such as Australia;
Scientific literature;
Other information available on Internet about implemented and used coastal infor-
mation system; particular attention has been given to available on-line CIS and to in-
ternational networks (ICAN – International Coastal Atlas Network, EUCC – Coastal
and Marine Union, PAP/RAC, BALTIC LAGOON network, ANCORIM – Atlantic Net-
work for Coastal Risk Management, etc.);
Other internet sources, including among the others web-sites of: Regional Sea Com-
missions (HELCOM, OSPAR Commission, Black Sea Commission and UNEP-MAP),
other International Organisations (such as the European Environmental Agency), and
national and sub-national administrative authorities.
21807-REL-T006.2 page 15/124
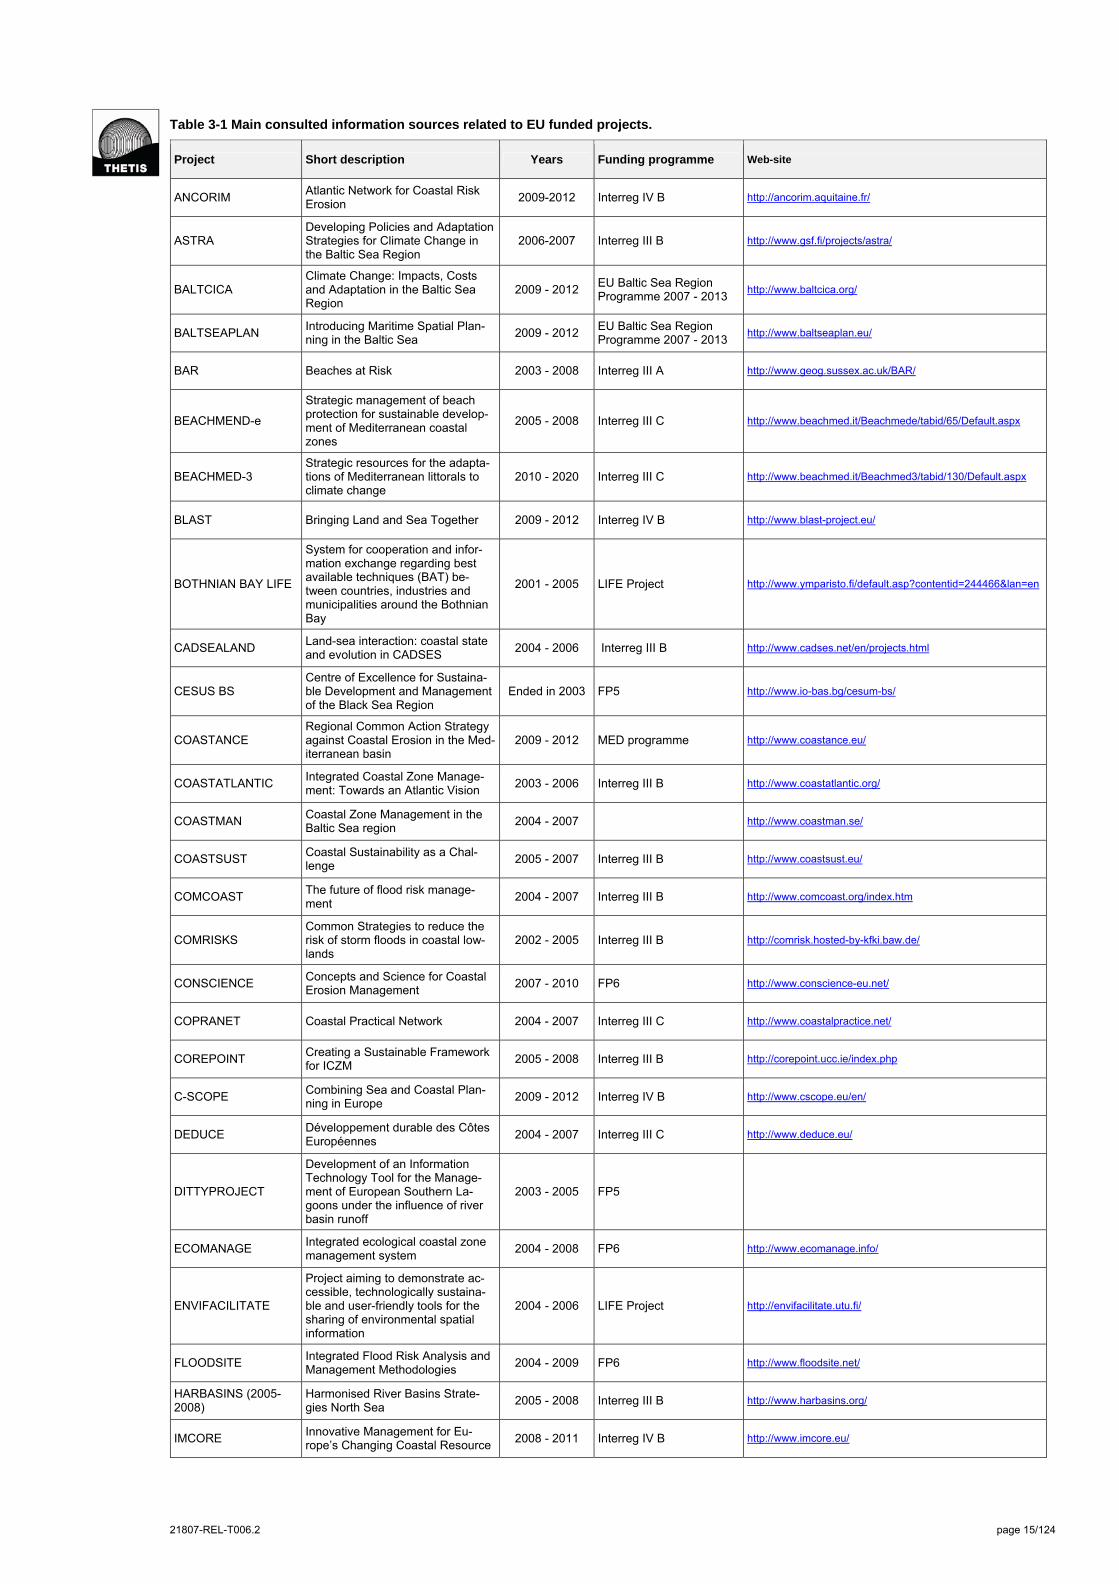
Table 3-1 Main consulted information sources related to EU funded projects.
Project Short description Years Funding programme Web-site
ANCORIM Atlantic Network for Coastal Risk Erosion
2009-2012 Interreg IV B http://ancorim.aquitaine.fr/
ASTRA Developing Policies and Adaptation Strategies for Climate Change in the Baltic Sea Region
2006-2007 Interreg III B http://www.gsf.fi/projects/astra/
BALTCICA Climate Change: Impacts, Costs and Adaptation in the Baltic Sea Region
2009 - 2012 EU Baltic Sea Region Programme 2007 - 2013
http://www.baltcica.org/
BALTSEAPLAN Introducing Maritime Spatial Plan-ning in the Baltic Sea
2009 - 2012 EU Baltic Sea Region Programme 2007 - 2013
http://www.baltseaplan.eu/
BAR Beaches at Risk 2003 - 2008 Interreg III A http://www.geog.sussex.ac.uk/BAR/
BEACHMEND-e
Strategic management of beach protection for sustainable develop-ment of Mediterranean coastal zones
2005 - 2008 Interreg III C http://www.beachmed.it/Beachmede/tabid/65/Default.aspx
BEACHMED-3 Strategic resources for the adapta-tions of Mediterranean littorals to climate change
2010 - 2020 Interreg III C http://www.beachmed.it/Beachmed3/tabid/130/Default.aspx
BLAST Bringing Land and Sea Together 2009 - 2012 Interreg IV B http://www.blast-project.eu/
BOTHNIAN BAY LIFE
System for cooperation and infor-mation exchange regarding best available techniques (BAT) be-tween countries, industries and municipalities around the Bothnian Bay
2001 - 2005 LIFE Project http://www.ymparisto.fi/default.asp?contentid=244466&lan=en
CADSEALAND Land-sea interaction: coastal state and evolution in CADSES
2004 - 2006 Interreg III B http://www.cadses.net/en/projects.html
CESUS BS Centre of Excellence for Sustaina-ble Development and Management of the Black Sea Region
Ended in 2003 FP5 http://www.io-bas.bg/cesum-bs/
COASTANCE Regional Common Action Strategy against Coastal Erosion in the Med-iterranean basin
2009 - 2012 MED programme http://www.coastance.eu/
COASTATLANTIC Integrated Coastal Zone Manage-ment: Towards an Atlantic Vision
2003 - 2006 Interreg III B http://www.coastatlantic.org/
COASTMAN Coastal Zone Management in the Baltic Sea region
2004 - 2007 http://www.coastman.se/
COASTSUST Coastal Sustainability as a Chal-lenge
2005 - 2007 Interreg III B http://www.coastsust.eu/
COMCOAST The future of flood risk manage-ment
2004 - 2007 Interreg III B http://www.comcoast.org/index.htm
COMRISKS Common Strategies to reduce the risk of storm floods in coastal low-lands
2002 - 2005 Interreg III B http://comrisk.hosted-by-kfki.baw.de/
CONSCIENCE Concepts and Science for Coastal Erosion Management
2007 - 2010 FP6 http://www.conscience-eu.net/
COPRANET Coastal Practical Network 2004 - 2007 Interreg III C http://www.coastalpractice.net/
COREPOINT Creating a Sustainable Framework for ICZM
2005 - 2008 Interreg III B http://corepoint.ucc.ie/index.php
C-SCOPE Combining Sea and Coastal Plan-ning in Europe
2009 - 2012 Interreg IV B http://www.cscope.eu/en/
DEDUCE Développement durable des Côtes Européennes
2004 - 2007 Interreg III C http://www.deduce.eu/
DITTYPROJECT
Development of an Information Technology Tool for the Manage-ment of European Southern La-goons under the influence of river basin runoff
2003 - 2005 FP5
ECOMANAGE Integrated ecological coastal zone management system
2004 - 2008 FP6 http://www.ecomanage.info/
ENVIFACILITATE
Project aiming to demonstrate ac-cessible, technologically sustaina-ble and user-friendly tools for the sharing of environmental spatial information
2004 - 2006 LIFE Project http://envifacilitate.utu.fi/
FLOODSITE Integrated Flood Risk Analysis and Management Methodologies
2004 - 2009 FP6 http://www.floodsite.net/
HARBASINS (2005-2008)
Harmonised River Basins Strate-gies North Sea
2005 - 2008 Interreg III B http://www.harbasins.org/
IMCORE Innovative Management for Eu-rope’s Changing Coastal Resource
2008 - 2011 Interreg IV B http://www.imcore.eu/

21807-REL-T006.2 page 16/124
Project Short description Years Funding programme Web-site
INTERMAREC Interregional Maritime Cluster 2004 - 2007 Interreg III C http://www.intermarec.net/
LITUSGO
LitusGo: Training Mediterranean local authorities and civil organiza-tions on ICZM and reaction to the impacts of climate changes
2009 - 2012 Leonardo da Vinci Project http://www.litusgo.com/?index
MAREMED MAritime REgions cooperation for the MEDiterranean
2010 - 2014 MED programme http://www.maremed.eu/index.php?act=,,,,,,,en
MESMA Monitoring and Evaluation of Spa-tially Managed Areas
2009 - 2013 FP7 http://www.mesma.org/
MESSINA Managing European Shoreline and Sharing Information on Near-shore Areas
2004 - 2006 Interreg III C http://www.interreg-messina.org/
MICORE Morphological impacts and coastal risks induced by extreme storm events
2008 - 2011 FP7 https://www.micore.eu/
PEGASO ICZM project for the Mediterranean and the Black Sea
2010 - 2014 FP7 http://www.pegasoproject.eu/
PLANCOAST 2005 - 2008 Interreg III B http://www.plancoast.eu/
RESPONSE Responding to the risks from cli-mate change
2006 - 2009 EU life program http://www.coastalwight.gov.uk/response.html
SAFECOAST 2005 - 2008 Interreg IV B http://www.safecoast.org/
SAIL Schéma d'Aménagement Intégré du Littoral
2002 - 2005 Interreg II C http://www.vliz.be/projects/sail/
SEAREG DECISION SUPPORT FRAME as a tool for assessing sea level rise
2002 - 2005 Interreg III B http://www.gsf.fi/projects/seareg/
SPICOSA (2008-2011) Science and Policy Integration for Coastal System Assessment
2008 -2001 FP6 http://www.spicosa.eu/index.htm
SUSCOD (2009 - 2013)
SUStainable COastal Development 2009 - 2013 Interreg IV B http://www.noord-holland.nl/web/Projecten/Suscod.htm
SUSTAIN (2010-2012) Assessing sustainability and strengthening operational policy
2010 - 2012 Interreg IV C http://www.sustain-eu.net/
SDI4SEB SUSTAINABLE DEVELOPMENT INDICATORS FOR ICZM IN THE SOUTH-EST BALTIC
2007 - 2008 http://corpi.ku.lt/~SDI-4-SEB/index.html
THESEUS Innovative technologies for safer European coasts in a changing cli-mate
2009 -2013 FP7 http://www.theseusproject.eu/
TIDE
TIDE makes integrated manage-ment and planning a reality in the Elbe, Weser, Schelde and Humber estuaries
2009 -2010 Interreg IV B http://www.tide-project.eu/
21807-REL-T006.2 page 17/124
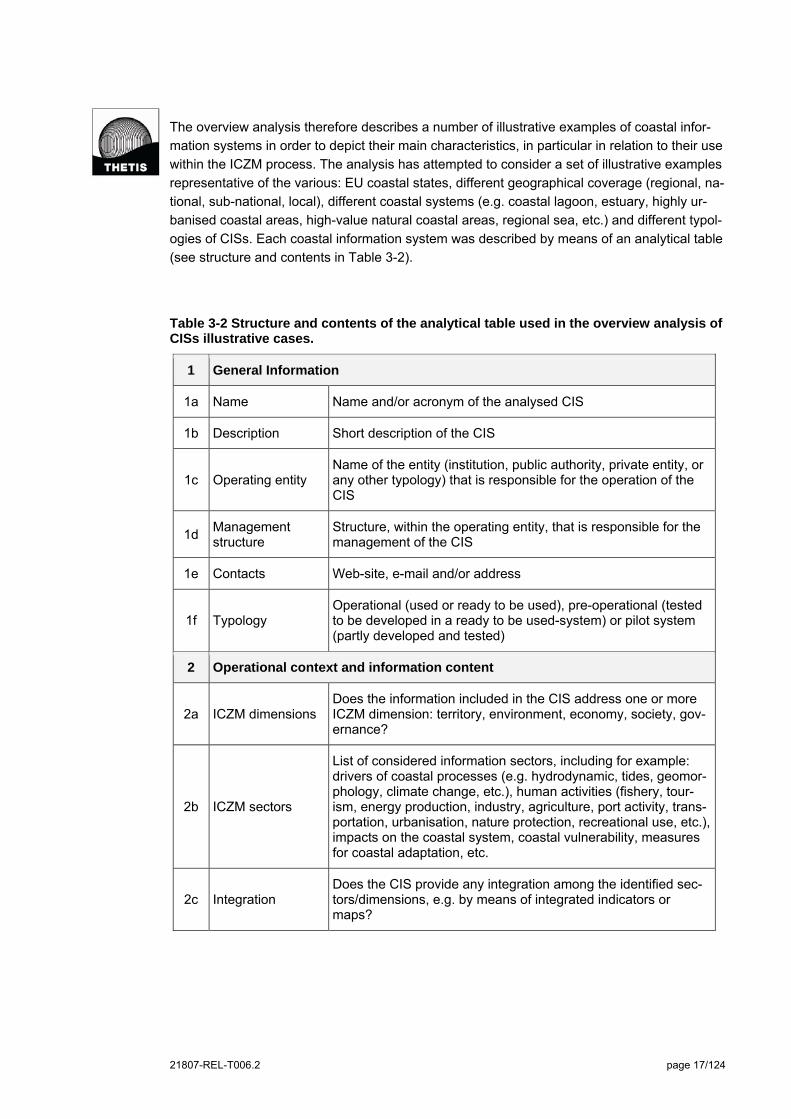
The overview analysis therefore describes a number of illustrative examples of coastal infor-
mation systems in order to depict their main characteristics, in particular in relation to their use
within the ICZM process. The analysis has attempted to consider a set of illustrative examples
representative of the various: EU coastal states, different geographical coverage (regional, na-
tional, sub-national, local), different coastal systems (e.g. coastal lagoon, estuary, highly ur-
banised coastal areas, high-value natural coastal areas, regional sea, etc.) and different typol-
ogies of CISs. Each coastal information system was described by means of an analytical table
(see structure and contents in Table 3-2).
Table 3-2 Structure and contents of the analytical table used in the overview analysis of CISs illustrative cases.
1 General Information
1a Name Name and/or acronym of the analysed CIS
1b Description Short description of the CIS
1c Operating entity Name of the entity (institution, public authority, private entity, or any other typology) that is responsible for the operation of the CIS
1d Management structure
Structure, within the operating entity, that is responsible for the management of the CIS
1e Contacts Web-site, e-mail and/or address
1f Typology Operational (used or ready to be used), pre-operational (tested to be developed in a ready to be used-system) or pilot system (partly developed and tested)
2 Operational context and information content
2a ICZM dimensions Does the information included in the CIS address one or more ICZM dimension: territory, environment, economy, society, gov-ernance?
2b ICZM sectors
List of considered information sectors, including for example: drivers of coastal processes (e.g. hydrodynamic, tides, geomor-phology, climate change, etc.), human activities (fishery, tour-ism, energy production, industry, agriculture, port activity, trans-portation, urbanisation, nature protection, recreational use, etc.), impacts on the coastal system, coastal vulnerability, measures for coastal adaptation, etc.
2c Integration Does the CIS provide any integration among the identified sec-tors/dimensions, e.g. by means of integrated indicators or maps?

21807-REL-T006.2 page 18/124
2d Spatial scale
Operating scale(s) of the CIS; European, regional (e.g. Mediter-ranean Sea, Baltic Sea, Black Sea. North-east Atlantic Ocean), national, sub-national, local and specification of the considered coastal area/s. e.g. Local scale – Lagoon of Venice and its drainage basin
2e Flexibility
Has the CIS been developed in order to be applied only to a specific coastal territory (e.g. the Lagoon of Venice) or as a tool that can be applied to various similar coastal contexts (e.g. coastal lagoons in general)?
3 ICZM functionalities
3a Knowledge related functionalities
Does the CIS provide knowledge functionalities supporting the ICZM process? i.e.:
Integration among information dimensions and/or sec-tors supporting integrated assessment;
Availability of spatial information, i.e. not only maps but proper GIS data on the coastal system (dynamic map-ping vs. static mapping);
Operation at different spatial scales;
Multi-time data and information;
Inclusion of relevant ICZM indicators3;
Inclusion of functionalities or maps related to assess-ment of coastal vulnerability to climate change;
Inclusion of ICZM best-practices database;
Others
3b Process related functionalities
Does the CIS provide process functionalities supporting the ICZM process? i.e.:
Problem understanding (e.g. definition of impacts, risk and vulnerability) and structuring (i.e. conceptual model-ling of problems);
Stakeholder involvement and participation;
Vision building and scenario development;
Assessment of alternatives in planning and/or man-agement;
Monitoring and evaluation;
Adaptive planning and management;
Others.
3 Considered ICZM indicators are the 27 ones defined by the Deduce project (http://www.deduce.eu/index.html) and the work performed by the Working Group on Indicators and Data.

21807-REL-T006.2 page 19/124
4 Users
4a User typology
List of target users, including the following possible ones: Poli-cy-makers, Decision-makers, Coastal planners and/or manag-ers, Specialised and expert users, Representative of private sectors (e.g. industrial or energy companies); Civil society (i.e. general users, NGOs or any other representative of the civil so-ciety that are interested in being informed on and/or participat-ing in ICZM)
5 Use of the system
5a Accessibility
Access to the CIS:
Free access on-line (access allowed to all users with or without password) to the complete CIS;
Free access on line (access allowed to all users with or without password) to part of the CIS;
Restricted access on-line (e.g. access allowed only to restricted users such as researchers);
Only off-line access.
5b User-friendliness
Expert judgment on the user-friendliness of the system: low, medium, high. The expert judgment of user-friendliness will be evaluated through the analysis of available interface in case of on-line access or available documentations in case of off-line access to the CIS.
5c Interactiveness
Availability of Web 2.0 tools or other e-participation tools (e.g. on-line forum, blogs, video-sharing, chat, interactive web-GIS) enabling a high level of interaction between external users and the CIS.
5d Data access
Availability of functionalities enabling direct access to data, in particular:
Availability of downloadable data;
Availability of downloadable maps;
Availability of downloadable spatial data (GIS layer);
Meta-data provision.
6 Technological characteristics
6a Used technology Typology of the used technological platform: (i) open source, (ii) licensed software, (iii) mixed solution, (iv) other (non-IT).
6b Integration with other tools
Is the CIS integrated with tools providing specific functionalities managed/operated by the same or other entities? Including the following possible ones: models (e.g. morphological, environ-mental or hydrological models), relational database, Decision Support System, others.

21807-REL-T006.2 page 20/124
6c Integration with other CIS
Is the analysed CIS connected/integrated with other CISs? A specific CIS may be part of a network of coastal information sys-tems sharing the same general structure and enabling mutual interchange of data.
6d Interoperability
Expert judgment on the basis of above information or specific information provided on this issue: low, medium, high.
Interoperability is intended as the possibility for spatial data sets to be combined, and for services to interact, without repetitive manual intervention, in such a way that the result is coherent and the added value of the data sets and services is enhance
7 Cost/resources
7a Resources If possible, investment cost (where available); costs and human resources to operate the systems (estimates, where available)
Available information varies significantly; most advanced and well-known coastal information
systems are described in details while information on less popular ones (that however may be
relevant for the implementation of the ICZM process, in particular at the local level) may be
less available. Some systems are totally accessible on line, while others only partially or not at
all. The description of coastal information systems considered in the overview analysis varies
consequently. Contents of analytical tables actually depends on information availability; for
some illustrative cases available information have been not sufficient to describe some of the
characteristics addressed by the analytical tables. In such case these specific fields (rather
few) have remained blank.
3.2 In-depth description of selected coastal information sys-tems
Out of the overview analysis a subset of coastal information systems was selected for an in-
depth description. Selection was based on the qualitative analysis of all CISs’ characteristics
highlighted by the general overview (except those related to the general description of the
CIS), in particular focusing on those information of the analytical table strictly related to the
ICZM implementation, as described in section 4.2 that illustrates the rationale of the selection
procedure. Selection based on the qualitative judgement of the main CISs’ characteristics was
than reviewed in order to include illustrative cases representing various European sea basins,
spatial levels of application, system typologies.
Selected systems were then described in details. The analysis investigated the following top-
ics and sub-topics. Some of them represent further specification of issues addressed in the
overview analysis, while others are new ones:
General Information
Name and acronym of the CIS;
Description;

21807-REL-T006.2 page 21/124
Operating entity;
Contacts;
Typology.
Operational context and information content
Further description of the CIS information content (i.e. addressed ICZM dimensions
and sectors) and the integration among different information typologies;
Metadata management and availability;
Data and information providers (e.g. universities, other research institution, statistics
institutions, environmental agencies, cartographic institutions or agencies, etc.);
Scalability and flexibility of the system.
Technological characteristics
Used technology;
Integration with other tools (e.g. models, relational database, decision support sys-
tems, etc.);
Integration with other coastal information systems;
Interoperability.
ICZM related functionalities
Detailed description of ICZM knowledge related functionalities identified by the over-
view analysis, including: integration among dimensions and/or sectors supporting in-
tegrated assessment; availability of spatial information, i.e. not only maps but proper
GIS data on the coastal system (dynamic mapping vs. static mapping); operation at
different spatial scales; multi-time data and information; inclusion of relevant ICZM in-
dicators; inclusion of functionalities or maps related to assessment of coastal vulnera-
bility to climate change; inclusion of ICZM best-practices database; others;
Detailed description of ICZM process related functionalities identified by the overview
analysis: problem understanding (e.g. definition of impacts, risk and vulnerability) and
structuring (i.e. conceptual modelling of problems); stakeholder involvement and par-
ticipation; vision building and scenario development; assessment of alternatives in
planning and/or management; monitoring and evaluation; adaptive planning and man-
agement; others;
Availability of summary information that can directly support the ICZM process, includ-
ing: indicators (specifically ICZM ones), integrated maps (e.g. composite impact on
the coastal system, coastal risk, coastal vulnerability, integrated coastal zone plan-
ning, marine spatial planning), graphs, summary reports, fact sheets, etc.
System development and management
CIS developer;
Description of difficulties encountered in developing the system, such as for example:
obstacles related to data acquisition and integration (e.g. heterogeneity of data format,
lack of metadata, etc.), obstacles in institutional cooperation, budget limitation, techno-
logical problems, etc.;
21807-REL-T006.2 page 22/124
Costs related to the system development;
Description of management modalities, including: (i) structure and roles (e.g. system
management, data management, data check and validation, data publication, interac-
tion with external users, etc.) of the specific entities (e.g. a specific department of the
public administration) responsible for the CIS management, (ii) data and software up-
dating;
Cost related to system management, human resources;
Users’ description, including: multiple/single users, user levels and relative privileges,
user typologies, access modalities, management of user access.
Experience with the implementation
Description of the actual use of the CIS, such as for example management of coastal
data, data sharing, communication, coastal monitoring, coastal planning and man-
agement, etc.;
Effective support to ICZM; the analysis will indicate whether the CIS is actually used
within an on-going ICZM process and in case will describe the directly supported
steps: investigation, analysis, assessment, issue prioritisation, planning, management,
monitoring and reviewing.
Conclusive remarks
Conclusive remark on the actual or potential efficacy of the system in supporting the
implementation of the ICZM process; i.e. Does the system provide appropriate infor-
mation and/or functionalities to support the implementation of ICZM in an adaptive
management framework?
Benefits and usefulness of the system.
Information for the in-depth analysis was acquired by means of desk and “field” research. Field
research consisted in remote interviews (e-mail, telephone and/or skype interview) and/or
meetings for direct interview with representative of the CIS operating entity (see Annex 4 - In-
formation sources for the in-depth analysis).
3.3 Development of key structuring policy requirements for CISs
Within the context of the “Options for coastal information system” study, a policy requirement
is defined as a requisite that can be concretely implemented in coastal information systems in
order to improve their use in supporting the diffusion and implementation of the ICZM process
at various scales (regional sea, national, sub-national and local). Policy requirements have
been defined according to the following criteria:
Relevant at the EU and/or regional level (i.e. regional seas); they should be applied
to different geographical contexts and to various coastal typologies;
Multi-phase oriented; they should be related to CIS’s support to different phases of
the ICZM process (i.e.: assessment, scoping, planning, management, monitoring, re-
viewing);

21807-REL-T006.2 page 23/124
Limited in number; identified requirements should be the most relevant ones, i.e.
those likely to determine most significant positive effects in improving the support to
ICZM;
Realistic and operationally oriented; defined requirements should be concretely
useful for the ICZM process and therefore be really implementable rather than repre-
senting very good but not applicable options;
Ambitious and innovative; although key requirements will be operationally oriented
and realistic, they might include ambitious scope and innovative elements.
Furthermore, definition of policy requirements considered the following specific input:
Results of the overview and in-depth analysis of illustrative cases of CISs (Task 1);
Analysis of the thematic literature;
Results of a first stakeholder consultation involving the invited speakers to the work-
shop held in Marseille on the 6th of May, who have provided their precious contribution
to the preliminary identification of policy requirements and direct impacts to be consid-
ered in the impact assessment (see section 3.6);
Contributions and feedbacks provided by the participants to the stakeholder work-
shops held in Marseille on the 6th of May;
Overview analysis of main policy documents related to the implementation of ICZM in
Europe. Policy requirements for ICZM supporting information systems attempts to fo-
cus on main issues highlighted by this analysis;
Preliminary assessment of direct impacts of policy requirements; this assessment en-
abled to verify the usefulness of previously identified policy requirements and optimise
their definition and full description.
3.4 Impact assessment of policy requirements and options
Subsequently to their definition, key structuring policy requirements and the related policy op-
tions (i.e. integrated sets of policy requirements) were assessed in terms of direct (or primary)
and indirect (or derived) impacts determined by their implementation throughout the EU, in
particular in relation to the support provided to the diffusion and implementation of ICZM poli-
cies. The assessment methodology was structured according to framework and the key ana-
lytical steps identified by the EC Impact Assessment Guidelines4 ; in particular the following
steps were considered:
1. Problem identification;
2. Objectives definition;
3. Baseline scenario definition;
4. Policy options development;
5. Identification of direct (or primary) impacts;
4 http://ec.europa.eu/governance/impact/commission_guidelines/docs/iag_2009_en.pdf
21807-REL-T006.2 page 24/124
6. Identification of indirect (or derived) impacts;
7. Impact assessment;
8. Options comparison.
As further described below, direct and indirect impacts were distinguished to properly take in
consideration specificities of the study’s impact assessment, i.e. evaluation of policy options
contribution to further improve CISs’ support to the ICZM process.
The first step describes the nature and extent of main problems to be addressed by the impact
assessment. These problems were defined on the basis of the results generated by Task 1
(overview and in-depth analysis of illustrative case of existing CISs), including in particular: the
state of implementation and use of coastal information systems, as well as gaps, limits and
obstacles identified. The second step of the methodology set the objectives related to the pre-
viously defined problems. Third step dealt with the definition of the baseline scenario to be
used as benchmark for the policy options evaluation. Policy options were then defined (step 4)
and closely linked to problems previously identified. Policy options are represented by inte-
grated sets of the key structuring policy requirements defined by sub-task 2.1.
The following methodological step (5 and 6) aimed to identify direct (or primary) and indirect
(or derived) impacts. Direct impacts are those related to effects directly determined by a CIS
policy option on key issues of ICZM diffusion and implementation in Europe or to the use and
the operation of the coastal information systems. Expected positive direct impacts express
how the policy options would contribute to the achievement of the identified general and sector
objectives and to provide solution to the problem to be addressed. Direct impacts assessment
also includes the evaluation of possible negative effects and cost implications. Indirect impacts
are those directly or indirectly deriving from the direct ones. Indirect impacts identification was
based on the list provided in the EC Impact Assessment Guidelines and grouped in three cat-
egories: economic, social and environmental ones.
Afterward (step 7) the magnitude of the direct and indirect impacts was assessed and estimat-
ed for each policy option in relation to the baseline scenario. The methodological approach for
the evaluation of the impact magnitude implied the definition of qualitative scores expressed
by the following possibilities: ---; --; -; 0; +; ++; +++. Negative values express a negative inter-
pretation of the expected effect (e.g. decreased involvement and participation of stakeholders
in the ICZM process) in comparison to the baseline scenario, whereas positive values express
an expected positive impact (e.g. increased involvement and participation of stakeholders in
the ICZM process).
Impact assessment included the evaluation of cost implications. This analysis was in particular
structured in the following three steps:
Qualitative evaluation of costs;
Quantitative evaluation of the effort required for the policy implementation;
Quantitative evaluation of costs.
The qualitative evaluation of costs was based on the definition of qualitative scores according
to the same methodology used to evaluate the other (direct and indirect) impacts, thus ensur-
ing consistency and homogeneity of the applied approach. In order to be coherent with the
evaluation of these other impacts, in this case negative values still represent a negative inter-
pretation of the expected effect (i.e. increase in costs, for example related to the development

21807-REL-T006.2 page 25/124
of maintenance of the CIS requirements included in the policy option), while positive values
indicate expected positive effects (i.e. decrease in costs).
The quantitative evaluation of the effort (in terms of human and/or economic resources) re-
quired for the policy implementation was based on the appraisal of the level of implementation
of the three policy options in the CIS illustrative cases considered in the study, according to a
0-3 range; a 3 score represents the proper implementation of the policy option for the consid-
ered CIS, 0 is the condition of no implementation of any aspect of the policy option, 1 and 2
represent an intermediate situation being 2 a condition closer to the proper policy option im-
plementation. The used methodology is further described in section 7.2.2. This evaluation en-
abled to understand the current level of implementation of each policy option, to assess what
regions are further off from the proper policy option implementation and to estimate the effort
still needed for the policy option implementation at the European and regional sea levels.
Finally, cost quantification was based on the analysis of cost data gathered by Task 1 and the
results of the previous two steps, i.e. qualitative evaluation of cost and quantitative evaluation
of the required effort. The specific adopted methodology is described section 7.2.2.
Results of the evaluation process were used to compare options among each other (step 8). In
particular, final comparison highlighted for each policy option: expected main positive (direct
and indirect) effects (benefits), expected main implications in terms of costs and effort required
for the policy options implementation, who’s mainly affected, what regions are further off from
a proper policy option implementation.
3.5 Stakeholder identification and involvement
The study implied the involvement of a group of stakeholders in order to gain from their expe-
rience on ICZM and receive feedbacks on various steps.
Stakeholders are all those who need to be considered in achieving project or programme
goals and whose participation and support are crucial to its success. In the context of the pre-
sent study, particular attention was therefore given to their identification, not only including
coastal GIS end-users (e.g. decision-makers, planners, coastal managers) and more special-
ised users or providers of coastal information (e.g. coastal GIS specialists), but also more in
general representatives of the ICZM context. The selection of the relevant stakeholders was
made taking into account the specificities of the ICZM implementation process in Europe; the
ICZM multi-level governance framework was therefore considered. This consists of:
International level (e.g. EC-DG, the European Environmental Agency and related Eu-
ropean Topic Centres, Regional Seas Commissions);
National level (mainly Member States relevant Ministries or National Environmental
Agencies and National Coastal Agencies; also including Member State representa-
tives participating to the EU ICZM Expert Group);
Sub-national levels (such as governmental institution acting at the sub-national level
and their European associations or sub-national agencies dealing with aspects related
to ICZM);
Local (e.g. municipalities).
21807-REL-T006.2 page 26/124
In order to gather feedbacks on more technical aspects addressed by the project, CIS and
ICZM experts (from main European research institutions) were invited, too. Furthermore, tak-
ing into consideration the need for the ICZM implementation of involving all segments of the
civil society, and in order to pursue the aim of integration among different perspectives and
stakes, representatives of the private sectors (such as representative of main sector associa-
tions, dealing for example with fishing, tourism, port management, aquaculture, etc.) and of
the civil society (such as members of coastal forum and coastal partnerships of representa-
tives of NGOs and other association) were considered as well.
Stakeholders’ selection was done performing a stakeholder analysis which identified primary
and secondary stakeholders who have a vested interest in the issues with which the study is
concerned. The goal of stakeholder analysis was to develop a strategic view of the human and
institutional landscape, and the relationships between the different stakeholders and the is-
sues concerned. The stakeholder analysis consisted in the following phases:
1. Identifying the key stakeholders and their interests;
2. Assessing the interest, power, and relation to other stakeholders;
3. Identifying how best to engage stakeholders.
In order to identify stakeholders an initial brainstorming (involving the study team) on all possi-
ble stakeholders was performed, taking into consideration: who possesses claims, who are the
people or groups most knowledgeable about coastal resources and coastal GIS, who are the
actors at different governance levels responsible for ICZM implementation in EU Member
Countries. A preliminary stakeholders list served as input for the development of the definitive
stakeholders list. The snowball technique was employed. The snowball samples begin from a
core of known elements that are then increased by adding new elements given by members of
the original sample. Afterwards a definitive list of potential parties was identified.
This final list is included in Annex 5. All these stakeholders were contacted and a formal invita-
tion to participate to the study was then sent to them by e-mail. Those who responded posi-
tively to the invitation were involved in the concrete activities described in the next section.
3.6 Stakeholder participation
In order to motivate the identified stakeholders to actively participate in the study, their in-
volvement was considered throughout the whole duration of the same, rather than only at the
end of the activities. Stakeholder participation in particular implied three steps, which were im-
plemented through different modalities as described in this section. The three participatory
steps related to:
1. Support to activities of Task 1, in particular dealing with the overview analysis of exist-
ing coastal information systems and the selection of illustrative CISs to be in-depth
analysed;
2. Support to the initial identification and description of policy requirements, as well as to
the definition of direct and indirect impacts to be considered by the impact assessment
of the same policy requirements;
21807-REL-T006.2 page 27/124
3. Validation of policy requirements for coastal information systems and feedbacks for
the definition of related policy options, in particular through the organisation of a
stakeholder workshop that was held in Marseille on the 6th of May.
All the stakeholders that responded positively to the invitation were involved in the first activity.
Progress results of Task 1 of the study were made available (by e-mail) to participating stake-
holders; in particular: the list of CISs analysed by the general overview and the list of CISs se-
lected for the in-depth analysis including a short description of the reasons (rationale) support-
ing the selection. Each participating stakeholder was invited to provide its feedbacks (by e-
mail) on two specific issues:
Identification of further CISs to be analysed by the general overview;
Validation on the preliminary selected CISs to be in-depth analysis, and in case identi-
fication of other cases to be considered.
First feedbacks were used to finalised the list of forty illustrative cases considered in the over-
view analysis (see section 4.1), while the second sub-activity validated the CISs identified for
the in-depth analysis and agreed on the used selection method (see section 4.2).
The second activity involved a restricted number of stakeholders: i.e. seven invited speakers
at the stakeholder workshop who provided their precious contribution to the preliminary identi-
fication of policy requirements and direct impacts to be considered in the impact assessment.
Stakeholders were in particular involved in a two-step consultation. Firstly, they were invited to
respond to a short questionnaire sent by e-mail asking their opinion on major CIS’s strengths
and weaknesses and most relevant policy requirements for CIS in order to enhance the sup-
port to the ICZM. The following specific questions were included in the questionnaire:
In your opinion what are the current strengths of CIS?
What are the current weaknesses of CIS?
Based on the given answers to the previous questions, what are on your opinion the
most relevant policy requirements for CIS in order to enhance the support to the ICZM
process?
All the involved stakeholders provided their answers to the questionnaire. These were used to
structure and orientate a skype-call (second step) aiming to further discuss and fine-tune poli-
cy requirements and direct impacts previously identified. Feedbacks were used to define a
preliminary list of policy requirements.
The third activity represented the core of the stakeholder involvement and focused on the or-
ganisation of a 1-day stakeholder workshop held in Marseille on the 6th of May. The workshop
was structured in two sessions (see the Workshop agenda included in Annex 6). Morning ses-
sion aimed to:
Illustrate preliminary results of the study also in order to structure and support the af-
ternoon discussion;
Illustrate some examples of concrete uses of coastal information system in supporting
the ICZM process and related future expectations and development.
21807-REL-T006.2 page 28/124
Stakeholders were invited to participate to the workshop and contribute to the project through
two interlinked steps. Firstly, they were asked to fill a short questionnaire (see Annex 6) to
provide their support in:
Validation and priority definition of the preliminary identified policy requirements;
Impact assessment of preliminary identified policy requirements.
Through the questionnaire, stakeholders were firstly asked to express their evaluation of the
policy requirement importance according to a 1 to 10 scale; afterwards, they were invited to
provide an assessment of direct impacts of policy requirements, through qualitative scores.
More detailed on the used procedures and the relative results are illustrated in section 5.1 of
the present report and in the Annex 6 – Workshop report.
Results of the questionnaires were then used to structure the afternoon discussion session
that focused on:
Discussion on and validation of policy requirements;
Discussion on policy options, i.e. integrated set policy requirements.
Annex 6 (Workshop Report) describes the main issues discussed during the workshop and the
most relevant feedbacks that emerged from this discussion. As illustrated in the following
chapters (from 5 to 7), these feedbacks were used to: (i) fine-tuned policy requirements and
their organisation in groups, (ii) optimise the definition and the structure of direct impacts to be
considered in the policy assessment, (iii) to define policy options. This latter aspect was also
discussed during the XI meeting of the EU ICZM Expert Group held on the 20th of June in
Brussels. Related feedbacks were used to finalise the identified policy options.

21807-REL-T006.2 page 29/124
4 Analysis of CIS illustrative cases
The current chapter illustrates the activities performed under Task 1, the obtained information
and the related interpretation. In particular:
Section 4.1 describes the CIS illustrative cases addressed by the overview analysis,
including both European and extra-European cases. Detailed results of the overview
analysis (i.e. CIS analytical tables) are reported in Annex 1 and Annex 2;
Section 4.2 refers to the in-depth analysis of specific cases, including in particular the
description of the criteria used in the selection of those cases. Results of this analysis
(i.e. reports of the direct and remote interviews) are included in Annex 3, while Annex
4 describes the details of the used information sources;
Finally, section 4.3 summarises the main elements arising from the interpretation of
results produced by the overview and in-depth analysis of European illustrative cases,
depicting a general picture of the current state of implementation and use of coastal
information systems, as well identifying main strengthens, weaknesses and existing
gaps.
4.1 Overview analysis
The overview analysis considered forty European illustrative cases of CISs. During the analy-
sis a wider initial number of CISs was identified; however some cases were not finally consid-
ered since they resulted in addressing too specific sectors, totally not-connected to any ICZM
process, or still in a very initial development phase or because only very few specific infor-
mation is available, thus not enabling a proper description. Table 4-1 and Figure 4-2 respec-
tively show the principal descriptive characteristics (short name, extended name, geographic
coverage, spatial level, European sea basins of reference, country) and distribution of ana-
lysed CISs. Considered European Sea Basins are those included in the European Atlas of the
Sea (Figure 4-1), i.e.:
Baltic Sea (8 cases);
North Sea (11 cases);
Norwegian Sea (1 case);
Celtic Sea (7 cases);
Bay of Biscay and Atlantic Iberian Coast (6 cases);
Mediterranean Sea (13 cases);
Black Sea (3 cases).
Nine cases are related to two (such as Geoseportal, Nokis or Rediam) or even three European
Sea Basins (i.e. Geoidd-Litto); this has been accounted in the above distribution. Detailed re-
sults of the overview analysis (i.e. analytical tables) of European illustrative cases are report in
Annex 1.

21807-REL-T006.2 page 30/124
Figure 4-1 European Sea Basins, according to the European Atlas of the Sea sub-division (source: http://ec.europa.eu/maritimeaffairs/atlas/maritime_atlas/#extent=-22.9_15.7_74.3_74&theme=themeGeography.subthemeIMPSeaBasins , last visit on 24.06.2011 at 14.00).

21807-REL-T006.2 page 31/124
Table 4-1 European illustrative cases considered by the overview analysis.
Short name Name Geographic coverage Spatial level European Sea Basin State
HELCOM MDS HELCOM Map and Data Service
Baltic Sea Regional Baltic Sea -
LMS Lounaispaikka Map Ser-vice - LMS
Varsinais Suomi Sub-National Baltic Sea Finland
South East Baltic Coastal Zone Database
Integrated Atlas of the State of the Coast in the South-Eastern Baltic
South East Baltic Sea Transnational Baltic Sea Poland Russia Lithu-ania
REWAL CIS Coastal Information Sys-tem of the municipality of Rewal
Rewal coast in Baltic Sea Local Baltic Sea Poland
Oder Estuary – GIS ICZM Coastal Information Sys-tem of the Oder Estuary
Oder Estuary and Meck-lenburg-Vorpommern Coastal Area
Sub-National Baltic Sea Germany
GeoSeaPortal Geographical Sea Portal for the German coast
German coast National Baltic Sea and North Sea Germany
CIS-FFD Coastal Information Sys-tem supporting Fish Farm-ing in Denmark (CIS-FFD)
Denmark National Baltic Sea and North Sea Denmark
NOKIS North Sea and Baltic Sea Coastal Information Sys-tem
North Sea and Baltic Sea National Baltic Sea and North Sea Germany
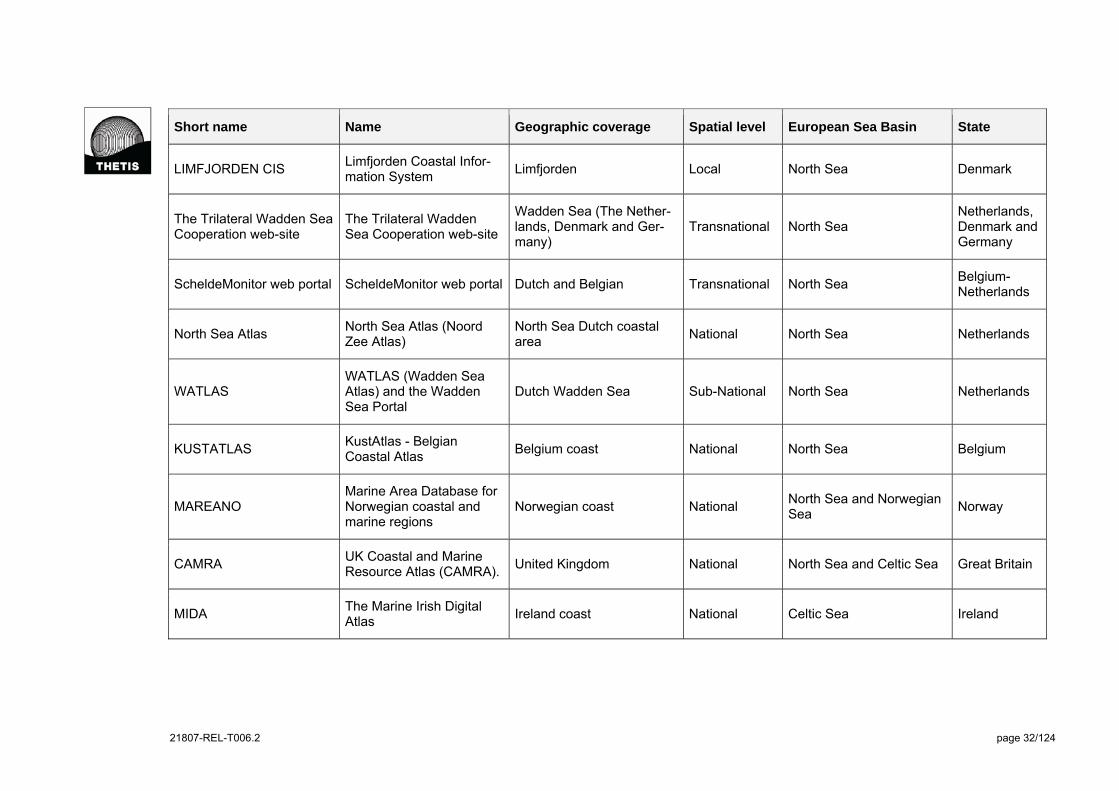
21807-REL-T006.2 page 32/124
Short name Name Geographic coverage Spatial level European Sea Basin State
LIMFJORDEN CIS Limfjorden Coastal Infor-mation System
Limfjorden Local North Sea Denmark
The Trilateral Wadden Sea Cooperation web-site
The Trilateral Wadden Sea Cooperation web-site
Wadden Sea (The Nether-lands, Denmark and Ger-many)
Transnational North Sea Netherlands, Denmark and Germany
ScheldeMonitor web portal ScheldeMonitor web portal Dutch and Belgian Transnational North Sea Belgium-Netherlands
North Sea Atlas North Sea Atlas (Noord Zee Atlas)
North Sea Dutch coastal area
National North Sea Netherlands
WATLAS WATLAS (Wadden Sea Atlas) and the Wadden Sea Portal
Dutch Wadden Sea Sub-National North Sea Netherlands
KUSTATLAS KustAtlas - Belgian Coastal Atlas
Belgium coast National North Sea Belgium
MAREANO Marine Area Database for Norwegian coastal and marine regions
Norwegian coast National North Sea and Norwegian Sea
Norway
CAMRA UK Coastal and Marine Resource Atlas (CAMRA).
United Kingdom National North Sea and Celtic Sea Great Britain
MIDA The Marine Irish Digital Atlas
Ireland coast National Celtic Sea Ireland
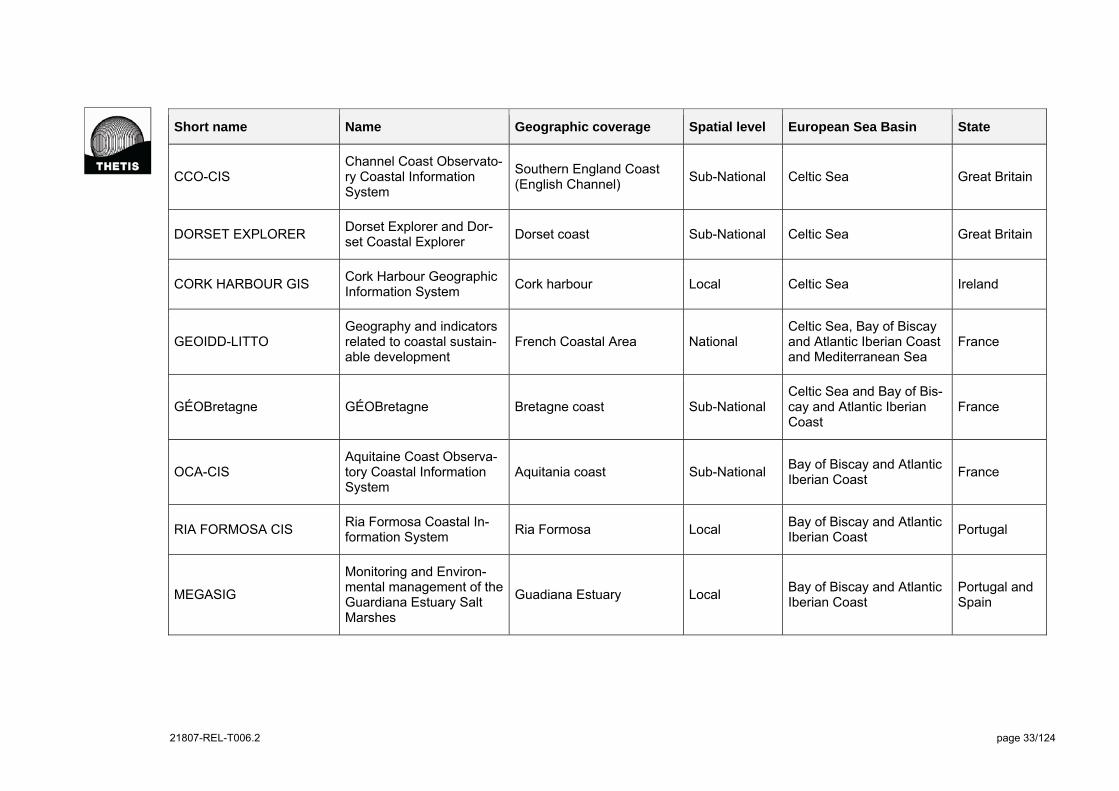
21807-REL-T006.2 page 33/124
Short name Name Geographic coverage Spatial level European Sea Basin State
CCO-CIS Channel Coast Observato-ry Coastal Information System
Southern England Coast (English Channel)
Sub-National Celtic Sea Great Britain
DORSET EXPLORER Dorset Explorer and Dor-set Coastal Explorer
Dorset coast Sub-National Celtic Sea Great Britain
CORK HARBOUR GIS Cork Harbour Geographic Information System
Cork harbour Local Celtic Sea Ireland
GEOIDD-LITTO Geography and indicators related to coastal sustain-able development
French Coastal Area National Celtic Sea, Bay of Biscay and Atlantic Iberian Coast and Mediterranean Sea
France
GÉOBretagne GÉOBretagne Bretagne coast Sub-National Celtic Sea and Bay of Bis-cay and Atlantic Iberian Coast
France
OCA-CIS Aquitaine Coast Observa-tory Coastal Information System
Aquitania coast Sub-National Bay of Biscay and Atlantic Iberian Coast
France
RIA FORMOSA CIS Ria Formosa Coastal In-formation System
Ria Formosa Local Bay of Biscay and Atlantic Iberian Coast
Portugal
MEGASIG
Monitoring and Environ-mental management of the Guardiana Estuary Salt Marshes
Guadiana Estuary Local Bay of Biscay and Atlantic Iberian Coast
Portugal and Spain
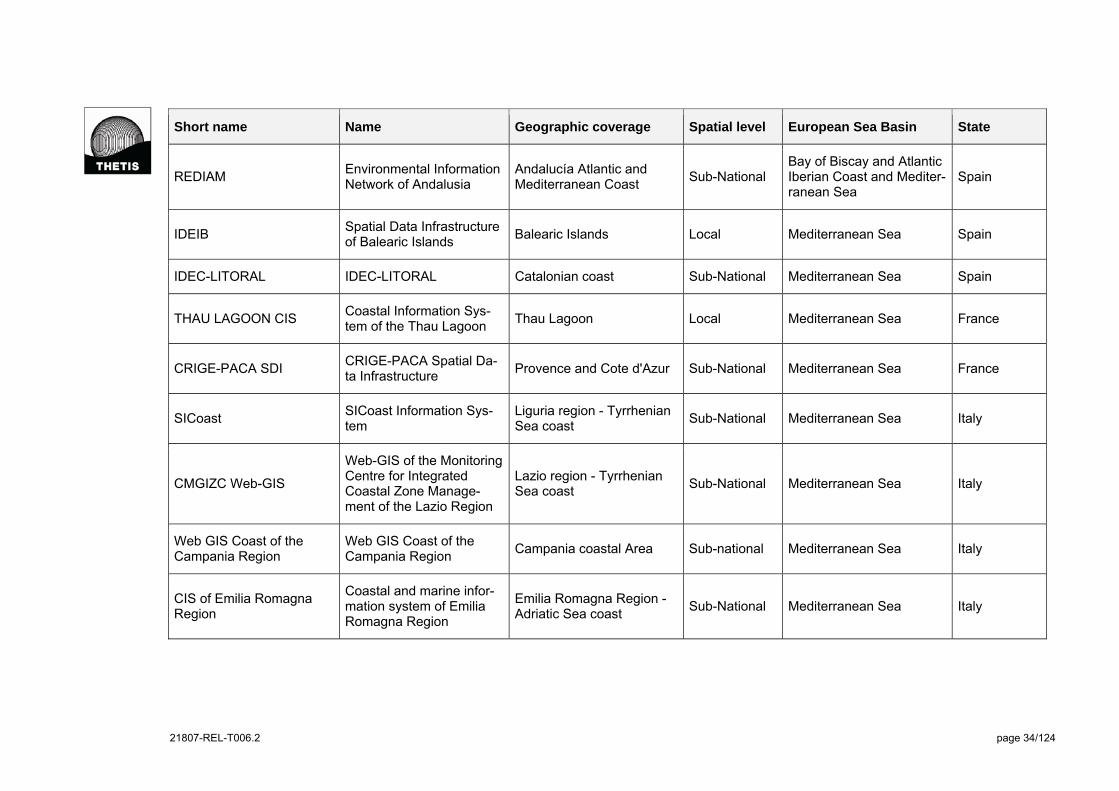
21807-REL-T006.2 page 34/124
Short name Name Geographic coverage Spatial level European Sea Basin State
REDIAM Environmental Information Network of Andalusia
Andalucía Atlantic and Mediterranean Coast
Sub-National Bay of Biscay and Atlantic Iberian Coast and Mediter-ranean Sea
Spain
IDEIB Spatial Data Infrastructure of Balearic Islands
Balearic Islands Local Mediterranean Sea Spain
IDEC-LITORAL IDEC-LITORAL Catalonian coast Sub-National Mediterranean Sea Spain
THAU LAGOON CIS Coastal Information Sys-tem of the Thau Lagoon
Thau Lagoon Local Mediterranean Sea France
CRIGE-PACA SDI CRIGE-PACA Spatial Da-ta Infrastructure
Provence and Cote d'Azur Sub-National Mediterranean Sea France
SICoast SICoast Information Sys-tem
Liguria region - Tyrrhenian Sea coast
Sub-National Mediterranean Sea Italy
CMGIZC Web-GIS
Web-GIS of the Monitoring Centre for Integrated Coastal Zone Manage-ment of the Lazio Region
Lazio region - Tyrrhenian Sea coast
Sub-National Mediterranean Sea Italy
Web GIS Coast of the Campania Region
Web GIS Coast of the Campania Region
Campania coastal Area Sub-national Mediterranean Sea Italy
CIS of Emilia Romagna Region
Coastal and marine infor-mation system of Emilia Romagna Region
Emilia Romagna Region - Adriatic Sea coast
Sub-National Mediterranean Sea Italy
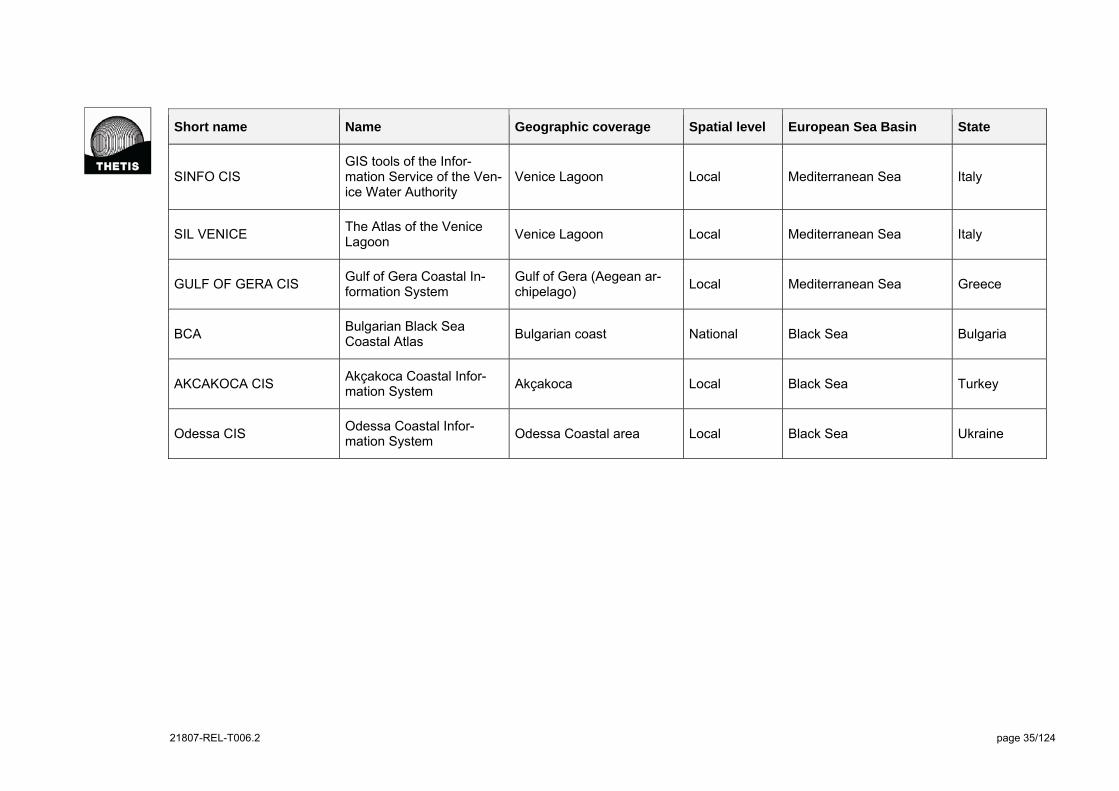
21807-REL-T006.2 page 35/124
Short name Name Geographic coverage Spatial level European Sea Basin State
SINFO CIS GIS tools of the Infor-mation Service of the Ven-ice Water Authority
Venice Lagoon Local Mediterranean Sea Italy
SIL VENICE The Atlas of the Venice Lagoon
Venice Lagoon Local Mediterranean Sea Italy
GULF OF GERA CIS Gulf of Gera Coastal In-formation System
Gulf of Gera (Aegean ar-chipelago)
Local Mediterranean Sea Greece
BCA Bulgarian Black Sea Coastal Atlas
Bulgarian coast National Black Sea Bulgaria
AKCAKOCA CIS Akçakoca Coastal Infor-mation System
Akçakoca Local Black Sea Turkey
Odessa CIS Odessa Coastal Infor-mation System
Odessa Coastal area Local Black Sea Ukraine

21807-REL-T006.2 page 36/124
Figure 4-2 Distribution of European illustrative cases considered by the overview analysis.
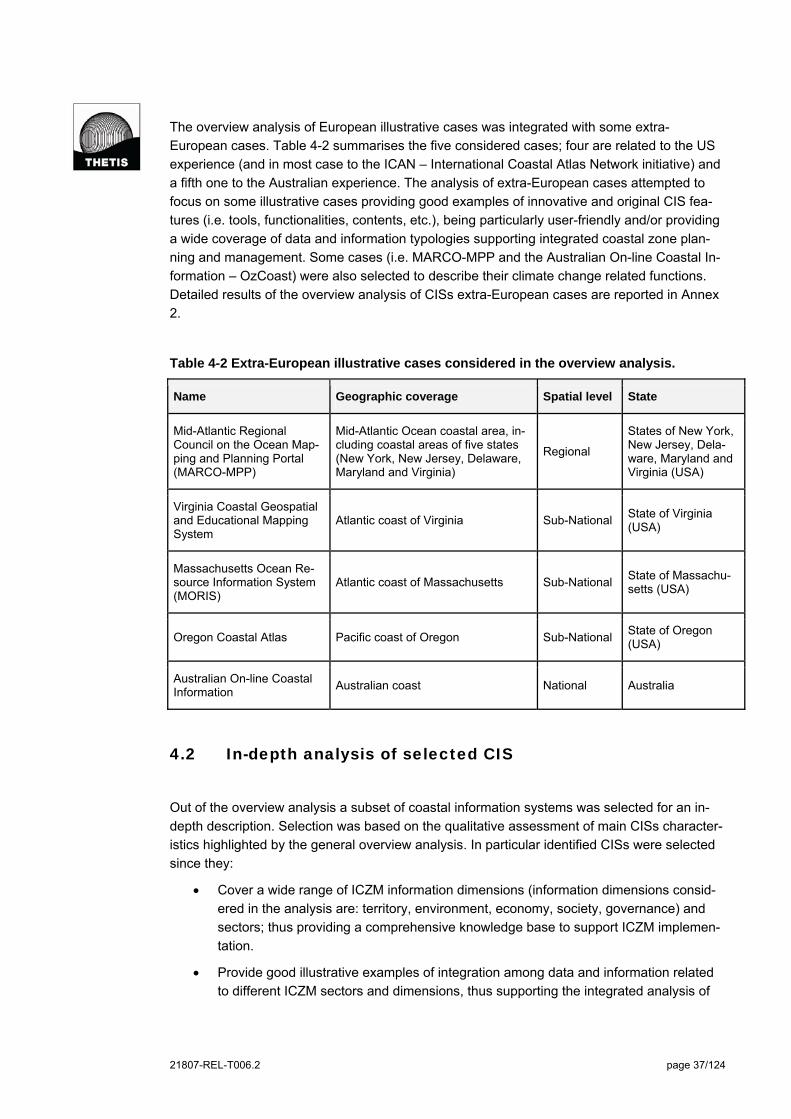
21807-REL-T006.2 page 37/124
The overview analysis of European illustrative cases was integrated with some extra-
European cases. Table 4-2 summarises the five considered cases; four are related to the US
experience (and in most case to the ICAN – International Coastal Atlas Network initiative) and
a fifth one to the Australian experience. The analysis of extra-European cases attempted to
focus on some illustrative cases providing good examples of innovative and original CIS fea-
tures (i.e. tools, functionalities, contents, etc.), being particularly user-friendly and/or providing
a wide coverage of data and information typologies supporting integrated coastal zone plan-
ning and management. Some cases (i.e. MARCO-MPP and the Australian On-line Coastal In-
formation – OzCoast) were also selected to describe their climate change related functions.
Detailed results of the overview analysis of CISs extra-European cases are reported in Annex
2.
Table 4-2 Extra-European illustrative cases considered in the overview analysis.
Name Geographic coverage Spatial level State
Mid-Atlantic Regional Council on the Ocean Map-ping and Planning Portal (MARCO-MPP)
Mid-Atlantic Ocean coastal area, in-cluding coastal areas of five states (New York, New Jersey, Delaware, Maryland and Virginia)
Regional
States of New York, New Jersey, Dela-ware, Maryland and Virginia (USA)
Virginia Coastal Geospatial and Educational Mapping System
Atlantic coast of Virginia Sub-National State of Virginia (USA)
Massachusetts Ocean Re-source Information System (MORIS)
Atlantic coast of Massachusetts Sub-National State of Massachu-setts (USA)
Oregon Coastal Atlas Pacific coast of Oregon Sub-National State of Oregon (USA)
Australian On-line Coastal Information
Australian coast National Australia
4.2 In-depth analysis of selected CIS
Out of the overview analysis a subset of coastal information systems was selected for an in-
depth description. Selection was based on the qualitative assessment of main CISs character-
istics highlighted by the general overview analysis. In particular identified CISs were selected
since they:
Cover a wide range of ICZM information dimensions (information dimensions consid-
ered in the analysis are: territory, environment, economy, society, governance) and
sectors; thus providing a comprehensive knowledge base to support ICZM implemen-
tation.
Provide good illustrative examples of integration among data and information related
to different ICZM sectors and dimensions, thus supporting the integrated analysis of
21807-REL-T006.2 page 38/124
complex coastal systems in particular by means of summary information (e.g. indica-
tors or integrated maps, such as for example maps of coastal vulnerability to single or
multi risks) concretely useful for decision and policy making.
Provide good illustrative examples of ICZM knowledge related functionalities, in par-
ticular: integrated analysis of different information (see previous point); operation at
different spatial scale supporting multi-scale and/or cross-border analysis; multi-time
data set enabling the analysis of past trends of key coastal processes and supporting
the definition of possible future evolution; use of ICZM indicators; inclusion of maps on
coastal vulnerability to climate changes and other risks.
Are directly related to an ICZM process, that in some cases have also acted as key
driver for the development and implementation of the coastal information system.
Provide good examples of ICZM process related functionalities, such as those sup-
porting: problem understanding (e.g. assessment of impacts, vulnerability and risk)
and structuring (i.e. conceptual modelling of identified problems); stakeholder in-
volvement and participation (i.e. through Web-GIS and/or other e-participation tools),
vision building and scenario development; assessment of alternatives in planning
and/or management; monitoring and evaluation.
Are integrated with other tools (e.g. models, relational database, decision support sys-
tems, web viewers for indicators and/or statistics, etc.) and/or other coastal infor-
mation systems (also through international networks such as ICAN) that can signifi-
cantly improve the functionalities of the specific CIS, its capacity in providing data and
information useful for the ICZM process and enhance opportunities for the exchange
of experiences and best practices.
Above criteria were used to select cases to be in-depth described. The identified subset as a
whole widely covers these criteria; this actually means that each specific coastal information
system included in the subset positively responds to more than one single criteria, although
generally not to all of them. Selection based on criteria judgement was than reviewed in order
to include illustrative cases representing various:
European Sea Basins (ref. Figure 4-1); selected cases are related to: Baltic Sea (2
cases), North Sea (2 cases), Celtic Sea (4 cases), Bay of Biscay and Atlantic Iberian
Coast (2 cases), and Mediterranean Sea (5 cases). Two cases are related to more
than one sea basins (i.e. REDIAM and GEOID-Litto). The overview analysis did not
enable to identify a good illustrative case for the Black Sea;
Spatial levels of application, including regional (i.e. Regional Sea; 1 case), national (4
cases), sub-national (5 cases) and local (2 cases) ones. ICZM concrete processes are
mainly occurring at the national and sub-nationals levels; these are therefore more
widely covered in the in-depth analysis;
System typologies, including examples of: web-portal, web-GIS, web-atlas, off-line
GIS, indicators web viewers, spatial data infrastructure, map and data service, mixed
systems.
Table 4-3 summarises the twelve illustrative cases that have been selected and in-depth de-
scribed. These must not be considered as the best available CIS in Europe; they rather repre-
sent a heterogeneous set of good illustrative cases, whose analysis provided proper infor-
mation about strengths and weakness of currently available system, in particular in relation to

21807-REL-T006.2 page 39/124
their use in concretely supporting the ICZM process. Detailed contents of the analysis (i.e. re-
ports of the direct and remote interviews) are reported in Annex 3, while the relative infor-
mation sources are summarised in Annex 4.
Table 4-3 Illustrative cases considered in the in-depth analysis.
Name Geographic coverage Spatial level European Sea Basin
HELCOM Map and Data Service
Baltic Sea Regional Baltic Sea
Coastal Information System of the Oder Estuary
Oder Estuary and Mecklen-burg-Vorpommern Coastal Area
Sub-National Baltic Sea
North Sea Atlas (Noord Zee Atlas)
North Sea Dutch coastal area
National North Sea
KustAtlas - Belgian Coastal Atlas
Belgium coast National North Sea
The Marine Irish Digital At-las
Ireland coast National Celtic Sea
Dorset Coastal Explorer Dorset coast Sub-National Celtic Sea
Cork Harbour Geographic Information System
Cork harbour Local Celtic Sea
Geography and indicators related to coastal sustaina-ble development
French Coastal Area National
Celtic Sea, Bay of Bis-cay and Atlantic Iberian Coast and Mediterrane-an Sea
Environmental Information Network of Andalusia
Andalucía Atlantic and Med-iterranean Coast
Sub-National Bay of Biscay and At-lantic Iberian Coast and Mediterranean Sea
CRIGE-PACA Spatial Data Infrastructure
Provence and Cote d'Azur Sub-National Mediterranean Sea
Coastal and marine infor-mation system of Emilia Romagna Region
Emilia Romagna Region - Adriatic Sea coast
Sub-National Mediterranean Sea
GIS tools of the Information Service of the Venice Water Authority
Venice Lagoon Local Mediterranean Sea
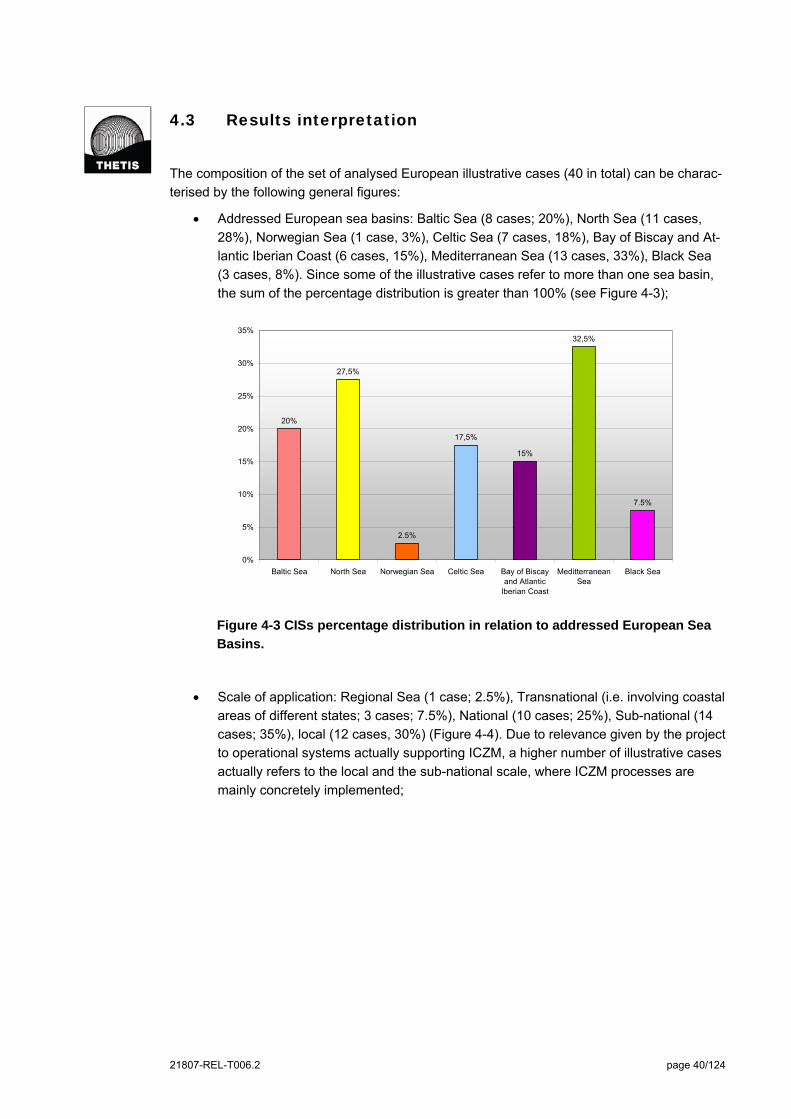
21807-REL-T006.2 page 40/124
4.3 Results interpretation
The composition of the set of analysed European illustrative cases (40 in total) can be charac-
terised by the following general figures:
Addressed European sea basins: Baltic Sea (8 cases; 20%), North Sea (11 cases,
28%), Norwegian Sea (1 case, 3%), Celtic Sea (7 cases, 18%), Bay of Biscay and At-
lantic Iberian Coast (6 cases, 15%), Mediterranean Sea (13 cases, 33%), Black Sea
(3 cases, 8%). Since some of the illustrative cases refer to more than one sea basin,
the sum of the percentage distribution is greater than 100% (see Figure 4-3);
20%
27,5%
17,5%
15%
32,5%
2.5%
7.5%
0%
5%
10%
15%
20%
25%
30%
35%
Baltic Sea North Sea Norwegian Sea Celtic Sea Bay of Biscayand Atlantic
Iberian Coast
MeditterraneanSea
Black Sea
Figure 4-3 CISs percentage distribution in relation to addressed European Sea
Basins.
Scale of application: Regional Sea (1 case; 2.5%), Transnational (i.e. involving coastal
areas of different states; 3 cases; 7.5%), National (10 cases; 25%), Sub-national (14
cases; 35%), local (12 cases, 30%) (Figure 4-4). Due to relevance given by the project
to operational systems actually supporting ICZM, a higher number of illustrative cases
actually refers to the local and the sub-national scale, where ICZM processes are
mainly concretely implemented;
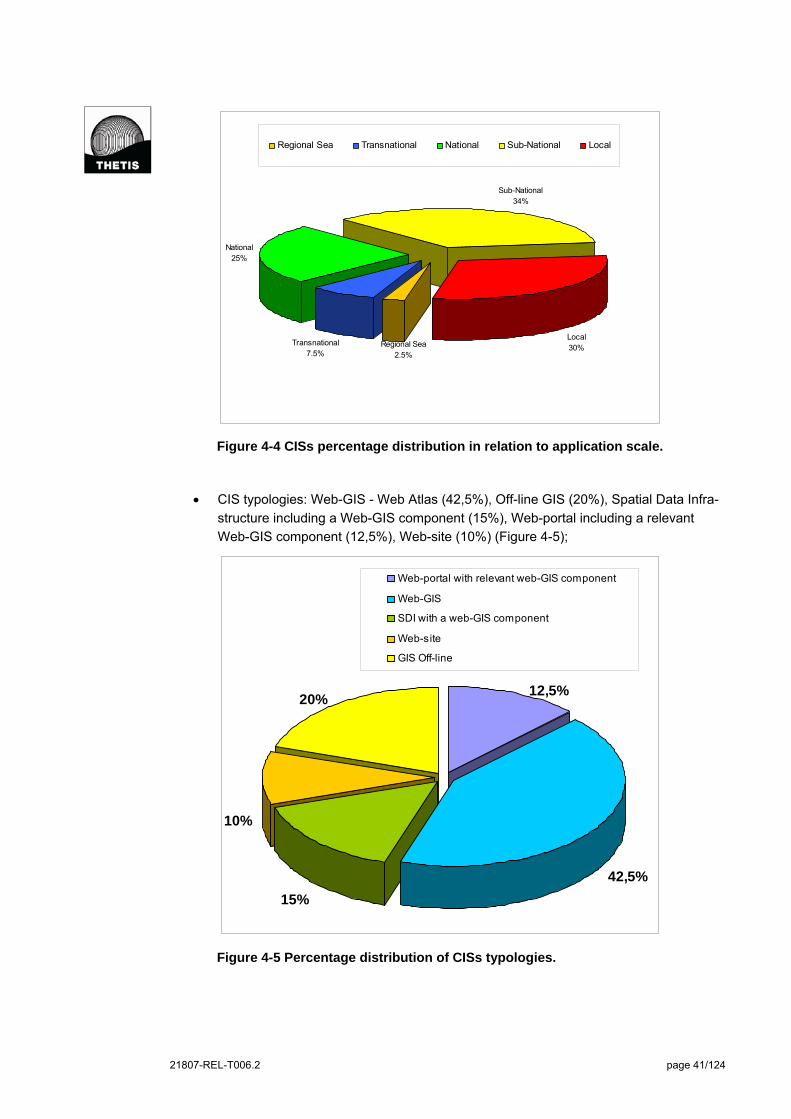
21807-REL-T006.2 page 41/124
National25%
Sub-National34%
Local30%
Transnational7.5%
Regional Sea2.5%
Regional Sea Transnational National Sub-National Local
Figure 4-4 CISs percentage distribution in relation to application scale.
CIS typologies: Web-GIS - Web Atlas (42,5%), Off-line GIS (20%), Spatial Data Infra-
structure including a Web-GIS component (15%), Web-portal including a relevant
Web-GIS component (12,5%), Web-site (10%) (Figure 4-5);
42,5%
15%
10%
12,5%20%
Web-portal with relevant web-GIS component
Web-GIS
SDI with a web-GIS component
Web-site
GIS Off-line
Figure 4-5 Percentage distribution of CISs typologies.

21807-REL-T006.2 page 42/124
The great majority of analysed illustrative cases are multi-sector (87.5%) thus attempt-
ing to deal with the holistic and integrated nature of the ICZM perspective. The selec-
tion of illustrative cases was actually based on this specific requirement, too. Some
cases are mainly related to specific sectors (oil spill – 2.5%, erosion and coastal dy-
namics – 5%, fish farming and aquaculture – 5%), however providing data and infor-
mation useful in general for the ICZM process.
The analysis of the information acquired through the overview and in-depth analysis enabled
to draw the following specific considerations related to CIS state of implementation and use in
relation to ICZM.
Operational context and information content
For the great majority of considered illustrative cases (28 – 70%) the CIS geographical
area of interest is mainly defined by administrative boundaries (in particular for the na-
tional and sub-national levels). For the 30% of the cases (in particular local level ones)
the area of interest has been mainly defined according to an ecosystem-based ap-
proach, specifically referring to: coastal lagoon (4 cases), estuary (3 cases), bay (2
cases), fjord (1 case), marine area (1 case – English Channel), regional sea (1 case –
Baltic Sea). Almost all analysed CISs include geo-spatial data related both to the land
and marine components of the coastal systems; 4 cases “only” contains marine data
and one case appears to mainly include land information;
The overview analysis investigated the typologies of ICZM information dimensions
addressed by the considered CISs cases. All of them include data related to the terri-
tory and the great majority properly deals with environmental information (90%). The
other information dimensions are properly considered only by some CISs, in particu-
lar: 63% case for the economy dimension, 45% for the society dimension, and 40% for
the governance one (Figure 4-6).
90%
5%5%
100%
45%
17,5%
37,5%
62,5%
12,5%
25%
40%
12,5%
47,5%
0%
10%
20%
30%
40%
50%
60%
70%
80%
90%
100%
Environmental Territorial Society Economy Governance
No
Low
Covered
Figure 4-6 Percentage of CISs addressing the five ICZM dimensions.

21807-REL-T006.2 page 43/124
Integrated information (e.g. integrated maps and indicators) resulting from the joint
analysis of different data typologies related to various ICZM sectors and dimensions is
properly provided by the 32.5% of analysed cases. Another 32.5% of cases support
the integrated assessment with a rather limited number of value-added products, while
the 27.5% cases does not directly included examples of integrated assessment (for 3
cases, 7.5%, information on this issue is not available).
ICZM functionalities
Results concerning the investigation of ICZM knowledge related functionalities are
summarised by the following figures. About the 55% of the analysed CIS provides the
following specific functionalities:
o Availability of geo-spatial data; proper geographic information are made availa-
ble to user that can use them for specific analysis supporting integrated coastal
planning and management;
o Operation at different spatial scale; some of the available spatial data can be re-
scaled according to the considered spatial extent, thus enabling to visualize
more details at a higher scales. This possibility can support multi-scale assess-
ment of main coastal process and dynamics;
o Multi-time data and information, that however is often limited to a small number
of specific issues, in particular: shoreline position, satellite images and ortho-
photos, population and population density, land uses, environmental monitoring
data. Multi-time information is essential for the assessment of coastal process
past trends and therefore the evaluation of future evolution and related uncer-
tainty.
More advance knowledge related functionalities are much less frequently included in
the analysed CISs: ICZM indicators and indexes (20%), climate change related func-
tions (12.5%), ICZM best-practices database (7.5%), others (12.5%) (including: other
indicators such as for example sustainability indicators, coastal encyclopaedia, coastal
barometer web-tool, etc.).
Results concerning the investigation of ICZM process related functionalities can be
summarised by the following figures:
o More than the 50% of cases resulted in providing direct supports (in terms of
functionalities) to problem understanding and structuring (60%) and identifica-
tion and assessment of planning and management alternatives (52.5%);
o Other functions are much less diffuse: stakeholder involvement and participa-
tion (35%), vision building and scenario development (18%), monitoring and
evaluation (15%), adaptive planning and management (2.5%);
o Some CISs (23%) provides other ICZM process related functionalities, such as
support to international cooperation approached by 5 cases.

21807-REL-T006.2 page 44/124
Use of the system
77.5% of the illustrative cases are totally or in great part accessible on-line, while the
22.5% are currently only off-line accessible;
About 52.5% provides direct access to and download of geo-spatial data. The analysis
showed that 33% of analysed CISs (included in the above 52.5%) enables users to
access and directly visualise geo-spatial data through WMS (Web Map Service). 25%
of cases currently do not enable geo-spatial data downloading even if CISs are ac-
cessible on-line, while the remaining 22.5% of CISs is only off-line accessible;
Metadata are on-line provided by the 68% of analysed CISs (48% of cases clearly ap-
pears to meet INSPIRE DIRECTIVE related metadata protocols – ISO
19115/ISO19139) while 4 cases related to on-line CISs currently do not include proper
metadata description. 23% is related to off-line system that may include metadata,
that however are not on-line visible;
Tools enabling an appropriate e-participation in ICZM (i.e. e-forum, geo-tagging, video
sharing, etc.) are still not much diffused (20%). Some CISs (25%) provide tools ena-
bling partial e-participation and interactiveness (e.g. feedback tools, data exchange
platform, etc.). Great majority of CISs do not include specific e-participation tools
(Figure 4-7).
20,0%
22,5%57,5%
Appropriate Limited No tools
Figure 4-7 Percentage of CISs including e-participation tools.
21 cases are available in one language, while 14 cases are available in more than one
language (10 in two, 3 in three and 1 in four languages). No information is available
for 5 off-line cases. 23 CISs are available in English, including all the 14 multi-
languages CISs.
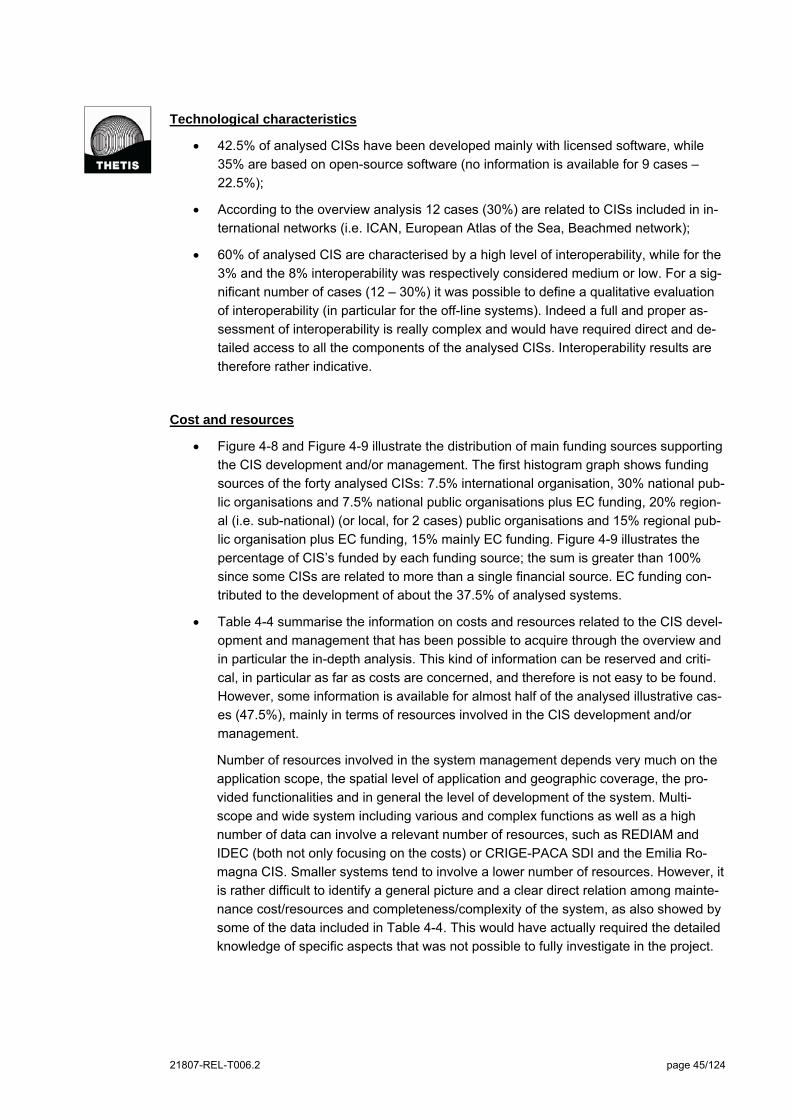
21807-REL-T006.2 page 45/124
Technological characteristics
42.5% of analysed CISs have been developed mainly with licensed software, while
35% are based on open-source software (no information is available for 9 cases –
22.5%);
According to the overview analysis 12 cases (30%) are related to CISs included in in-
ternational networks (i.e. ICAN, European Atlas of the Sea, Beachmed network);
60% of analysed CIS are characterised by a high level of interoperability, while for the
3% and the 8% interoperability was respectively considered medium or low. For a sig-
nificant number of cases (12 – 30%) it was possible to define a qualitative evaluation
of interoperability (in particular for the off-line systems). Indeed a full and proper as-
sessment of interoperability is really complex and would have required direct and de-
tailed access to all the components of the analysed CISs. Interoperability results are
therefore rather indicative.
Cost and resources
Figure 4-8 and Figure 4-9 illustrate the distribution of main funding sources supporting
the CIS development and/or management. The first histogram graph shows funding
sources of the forty analysed CISs: 7.5% international organisation, 30% national pub-
lic organisations and 7.5% national public organisations plus EC funding, 20% region-
al (i.e. sub-national) (or local, for 2 cases) public organisations and 15% regional pub-
lic organisation plus EC funding, 15% mainly EC funding. Figure 4-9 illustrates the
percentage of CIS’s funded by each funding source; the sum is greater than 100%
since some CISs are related to more than a single financial source. EC funding con-
tributed to the development of about the 37.5% of analysed systems.
Table 4-4 summarise the information on costs and resources related to the CIS devel-
opment and management that has been possible to acquire through the overview and
in particular the in-depth analysis. This kind of information can be reserved and criti-
cal, in particular as far as costs are concerned, and therefore is not easy to be found.
However, some information is available for almost half of the analysed illustrative cas-
es (47.5%), mainly in terms of resources involved in the CIS development and/or
management.
Number of resources involved in the system management depends very much on the
application scope, the spatial level of application and geographic coverage, the pro-
vided functionalities and in general the level of development of the system. Multi-
scope and wide system including various and complex functions as well as a high
number of data can involve a relevant number of resources, such as REDIAM and
IDEC (both not only focusing on the costs) or CRIGE-PACA SDI and the Emilia Ro-
magna CIS. Smaller systems tend to involve a lower number of resources. However, it
is rather difficult to identify a general picture and a clear direct relation among mainte-
nance cost/resources and completeness/complexity of the system, as also showed by
some of the data included in Table 4-4. This would have actually required the detailed
knowledge of specific aspects that was not possible to fully investigate in the project.

21807-REL-T006.2 page 46/124
7,5%
30%
7,5%
20%
15%
15%
5%
0%
5%
10%
15%
20%
25%
30%
35%
40%
Inte
rnat
iona
lO
rgan
isat
ion
Nat
iona
l Pub
licO
rgan
isat
ion
Reg
iona
l Pub
licO
rgan
isat
ion
EC
Fun
ding
No
info
rmat
ion
EC Funding
Figure 4-8 Funding sources (in percentage) for the analysed CISs.
7,5%
37,5%
35%
37,5%
5%
0,0%
5,0%
10,0%
15,0%
20,0%
25,0%
30,0%
35,0%
40,0%
InternationalOrganization
National PublicOrganization
Regional PublicOrganization
EC Funding No Information
Figure 4-9 Percentage number of CIS’s funded by each funding source.

21807-REL-T006.2 page 47/124
Table 4-4 Information on costs/resources related to CIS development and management.
CIS Development costs/resources Management costs/resources
Helcom MDS Development of current application (2007-2009) involved: 1 part-time persons (map services) and 2-3 person full-time (data preparation)
4 persons in total: 1 dealing with data administration and 2-3 persons with layer preparation
Lounaispaikka Map Ser-vice
A full time project planner for 2 years and two software devel-opers for 2 months each
1 person full time; need for another full time person
CIS Oder Estuary
The whole project ICZM Oder was started in 2004 with a total budget of 2 million € Between 2004 and 2008: 425,000 € for the Web Portal devel-opment, including 365,000 € for the Web-GIS development
4 persons
North Sea Atlas First web version of the Atlas involved 2 full time developers for about one year
Management (in particular updating) cost is about 15.000 €/y, involving 8 persons
Watlas Initial development (9 years ago): 35.000 €
Management costs for the whole CIS (Wadden Sea Portal) is 375.000 € per year (including resources for 3.3 full time equivalent per year – fte/year). Management costs for Watlas (web atlas) include in the Wadden Sea Portal is: resources for 0.2 fte/year and 10.000 €/y of external technical costs.
KustAtlas 46,381 € for the development of the printed version of the Atlas 25,073 € for the development of the on-line version, plus 5,855 for multi-language translation
MIDA 1 full time staff and 4 part-time resources
Dorset Explorer One person (Dorset Coast Forum) for data management and 5 persons (County Council GIS team) for the tool devel-opment and maintenance
Cork Harbour GIS System development and management is in charge of 4-5 (part-time) persons at CMRC
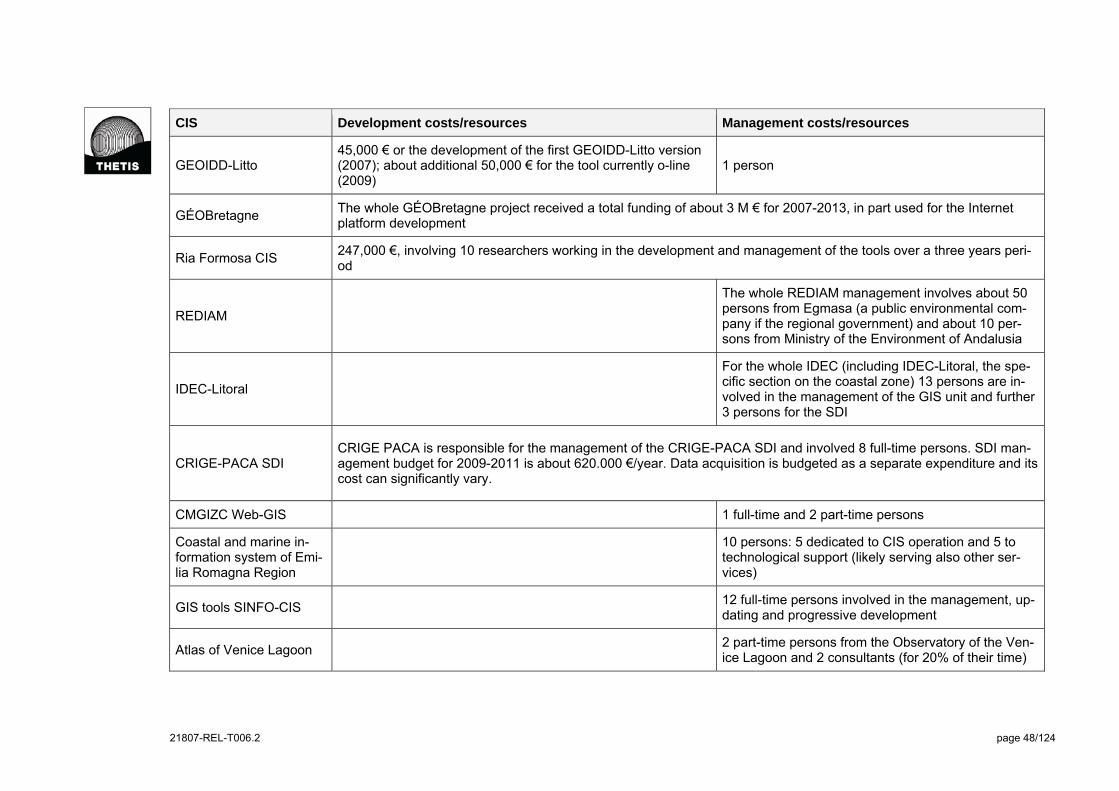
21807-REL-T006.2 page 48/124
CIS Development costs/resources Management costs/resources
GEOIDD-Litto 45,000 € or the development of the first GEOIDD-Litto version (2007); about additional 50,000 € for the tool currently o-line (2009)
1 person
GÉOBretagne The whole GÉOBretagne project received a total funding of about 3 M € for 2007-2013, in part used for the Internet platform development
Ria Formosa CIS 247,000 €, involving 10 researchers working in the development and management of the tools over a three years peri-od
REDIAM
The whole REDIAM management involves about 50 persons from Egmasa (a public environmental com-pany if the regional government) and about 10 per-sons from Ministry of the Environment of Andalusia
IDEC-Litoral
For the whole IDEC (including IDEC-Litoral, the spe-cific section on the coastal zone) 13 persons are in-volved in the management of the GIS unit and further 3 persons for the SDI
CRIGE-PACA SDI CRIGE PACA is responsible for the management of the CRIGE-PACA SDI and involved 8 full-time persons. SDI man-agement budget for 2009-2011 is about 620.000 €/year. Data acquisition is budgeted as a separate expenditure and its cost can significantly vary.
CMGIZC Web-GIS 1 full-time and 2 part-time persons
Coastal and marine in-formation system of Emi-lia Romagna Region
10 persons: 5 dedicated to CIS operation and 5 to technological support (likely serving also other ser-vices)
GIS tools SINFO-CIS 12 full-time persons involved in the management, up-dating and progressive development
Atlas of Venice Lagoon 2 part-time persons from the Observatory of the Ven-ice Lagoon and 2 consultants (for 20% of their time)

21807-REL-T006.2 page 49/124
5 Policy requirements
The current chapter illustrates the approach used for the identification of policy requirements
that was based on various input, including the results of the overview and in-depth analysis of
illustrative cases of coastal information systems (Task 1 – see chapter 4). Much relevance
was also given to the precious input and feedbacks provided by the involved stakeholders,
previously and during the 6th of May workshop. Finally, the chapter describes the selected pol-
icy requirements.
5.1 Approach for the policy requirements identification
Within the context of the “Options for coastal information system” study, a policy requirement
is intended as a requisite that can be concretely implemented in coastal information systems
in order to improve the use of the same CISs in supporting the diffusion and implementation of
the ICZM process at various scales (international, national, sub-national – regional and local).
Identified policy requirements are related to the following four categories: scope, contents,
functions of and mechanisms of coastal information systems. Afterwards, policy requirements
have been grouped to the derive policy options (described in section 6) that have been evalu-
ated in terms of expected direct and indirect impacts. Results of this latter activity are de-
scribed and discussed in chapter 7.
The identification of policy requirements followed a three steps approach. In the first step poli-
cy requirements identification was based on:
Results of the overview and in-depth analysis of illustrative cases of CISs that enabled
to understand the present state of CISs’ development and use, as well as to identify
main current gaps and weakness. In particular, policy requirements definition focused
on the main problem, and the related objectives, depicted on the basis of the analysis
of Task 1 results; problem and objectives identification are the first step of the impact
assessment activity and is specifically described in section 6.1;
Analysis of the thematic literature5, in particular related to the comparative analysis of
coastal information system and/or to the evaluation of their support to coastal and ma-
rine planning;
Overview analysis of main policy documents related to the implementation of ICZM in
Europe. Policy requirements for ICZM supporting information systems attempts to fo-
cus on main issues highlighted by this analysis;
Results of a first stakeholder consultation on policy requirements definition involving
the invited speakers (see agenda and list of invited speakers in Annex 6 – Workshop
Report) to the workshop held in Marseille on the 6th of May, who had provided their
5 Just to provide some examples: (i) O’Dea K., Dwyer E., Cummins V. and Wright D.J., 2011. Potential and limitations of Coastal Web Atlases. Journal of Coastal Conservation. Published on line: 03 March 2011; (ii) Wright D.J., Dwyer N. and Cummins V. (eds.) 2011. Coastal Informatics: web atlas design and implementation. Information Science Refer-ence, Hershey, New York, USA; (iii) Meiner A., 2010. Integrated maritime policy for the European Union - consolidat-ing coastal and marine information to support maritime spatial planning. Journal of Coastal Conservation, 14:1-11.

21807-REL-T006.2 page 50/124
precious contribution to the preliminary identification of policy requirements and direct
impacts to be considered in the impact assessment. Stakeholders were in particular
involved in a two-steps consultation. Firstly, they responded to a questionnaire sent by
e-mail asking their opinion on major CIS’s strengths and weaknesses and most rele-
vant policy requirements for CIS in order to enhance the support to the ICZM. Second-
ly, they participated to a skype-call to further discuss and fine-tune policy require-
ments and direct impacts to be assessed.
The above activities enabled to identify an initial set of policy requirements. Subsequently to
their initial definition, policy requirements were than assessed by the study team in terms of
expected direct impacts (benefits, negative impacts and costs) according to the methodology
illustrated in section 3.4 (step 2). As expressed in section 6.1 (see in particular Figure 6-2)
benefits included in the identified direct impacts express how policy requirements (and the re-
lated policy options) would contribute to address main problems arising from the analysis of
the current state of the art and to fulfil the related objectives, dealing with the improvement and
strengthen of CIS support to the ICZM process.
The list of direct impacts used for the policy requirements evaluation was defined again with
the support of the stakeholders involved in the above mentioned consultation (held before the
stakeholder workshop). The impact evaluation exercise specifically aimed to verify the validity
and usefulness of the preliminarily identified policy requirements and direct impacts, thus con-
tributing to the definition of relevant requirements in terms of positive effects for the ICZM poli-
cy implementation. Direct impacts were identified on the basis of the:
Results of the already mentioned preliminary stakeholder consultation (included in the
above described step 1) involving the workshop invited speakers, in particular through
the skype-call discussion;
Overview analysis of main policy documents related to the implementation of ICZM in
Europe (also included in the previously described step 1).
Identified direct impacts for policy requirements evaluation are:
Integrated knowledge on the coastal system;
Bridged gap between scientific information and policy/decision making in the ICZM
process;
Involvement of stakeholders in the ICZM process, also aiming to improve awareness
on sustainable coastal planning and management;
Support and facilitation in climate change adaptation of coastal zones within the wider
context of ICZM;
Periodical evaluation process of ICZM planning and management; support an ICZM
adaptive process;
Cooperation among different institutions and institutional levels;
Implementation of ICZM in a regional sea context;
Adoption of a long-term perspective for ICZM;
Support to the integration of ICZM with other closely related policies (in particular IMP-
MSP and climate change policies);

21807-REL-T006.2 page 51/124
Costs related to maintenance and updating of the CIS;
Simplification of the use of the coastal information system.
Evaluation of the direct impacts of the identified policy requirements was done through the def-
inition of qualitative scores expressed by the following possibilities: ---; --; -; 0; +; ++; +++.
Negative values express a negative interpretation of the expected effect (for example de-
crease in civil society participation in ICZM or increase in costs related to maintenance and
updating of the CIS), whereas positive values express an expected positive impact (e.g. in-
crease in civil society participation in ICZM or decrease in costs). Table 5-1 reports the results
of the direct impacts evaluation.
Finally (third step) policy requirements were presented and discussed at the stakeholder
workshop held in Marseille on the 6th of May. Initially, workshop participants were asked to fill
a short questionnaire to provide their support in the:
validation of the preliminary identified policy requirements, as resulting from steps 1
and 2 of the identification approach;
impact assessment of preliminary identified policy requirements, to contribute to verify
their actual validity and usefulness.
Questionnaire results are described in the workshop report (Annex 6), that also summarised
the main feedbacks provided during the open discussion. Workshop participants agreed on
the presented and discussed policy requirements and on the used categorisation in four
groups (scope, contents, functions, mechanisms). Thus the workshop enables to validate the
identified policy requirements and the related specific feedbacks were used to optimise their
description, illustrated in section 5.2. Results of the policy requirements impact assessment
are consistent with the evaluation summarised in Table 5-1 for some of the considered direct
impacts (e.g. integrated knowledge on the coastal system or involvement of stakeholders in
the ICZM process) while are different for others (e.g. simplification of the use of the coastal in-
formation system). These differences confirm the difficulty to define homogeneous values, as
also highlighted by the high variability of responses provided by workshop participants for
some of the impacts. Variability and heterogeneity are expected to be less significant for the
policy impact evaluation, since policy options aggregate various requirements in depicting a
more general aim.
From a methodological perspective, it is finally important to stress that the whole study refers
to a wide variety of coastal information systems, related to different operating scales (local,
sub-national, national and regional sea one), geographic areas and system typologies. Policy
requirements refer to the same variability of systems and conditions; in this context they at-
tempt to be:
enough general to properly deal with this variability;
enough flexible to permit the implementation of specific solutions able to address
specific ICZM problems;
at the same time, enough specific to determine their possible concrete realisation with
the CIS development and implementation.

21807-REL-T006.2 page 52/124
Table 5-1 Example of evaluation of direct impacts of preliminary identified policy requirements.
Inte
gra
ted
kn
ow
led
ge
on
th
e co
asta
l sy
stem
Bri
dg
ed g
ap b
etw
een
sci
-en
tifi
c in
form
atio
n a
nd
p
olic
y/d
ecis
ion
mak
ing
in
the
ICZ
M p
roce
ss
Invo
lvem
ent
of
stak
eho
ld-
ers
in t
he
ICZ
M p
roce
ss
Su
pp
ort
an
d f
acil
itat
ion
in
clim
ate
chan
ge
adap
tati
on
o
f co
asta
l zo
nes
wit
hin
th
e w
ider
co
nte
xt o
f IC
ZM
Per
iod
ical
eva
luat
ion
pro
-ce
ss
of
ICZ
M p
lan
nin
g a
nd
m
anag
emen
t; s
up
po
rt a
n
ICZ
M a
dap
tive
pro
cess
Co
op
erat
ion
am
on
g d
if-
fere
nt
inst
itu
tio
ns
and
in-
stit
uti
on
al l
evel
s
Imp
lem
enta
tio
n o
f IC
ZM
in
a re
gio
nal
sea
co
nte
xt
Ad
op
tio
n o
f a
lon
g-t
erm
p
ersp
ecti
ve
for
ICZ
M
Su
pp
ort
to
th
e in
teg
rati
on
o
f IC
ZM
wit
h o
ther
clo
sely
re
late
d p
olic
ies
Co
sts
rela
ted
to
mai
nte
-n
ance
an
d u
pd
atin
g o
f th
e C
IS
Sim
plif
icat
ion
of
the
use
o
f th
e co
asta
l in
form
atio
n
syst
em
Include end-user in the system design ++ ++ + ++ ++ +++
Address different user expectations and needs +++ ++ ++ ++ -- +++
Adopt an ecosystem-based approach in the definition of the CIS’ context and geographic area of application ++ ++ ++ + +++ +++ ++ +++ ---
Continue and strengthen the effort in matching the INSPIRE Directive +++ + ++ ++ ++ -- ++
Improve economic and in particular social and governance information within CISs +++ ++ + + ++ -
Improve availability of information resulting from the integrated analysis of data related to different topics +++ +++ ++ ++ +++ + + ++ +++ -- ++
Improve availability of multi-time data +++ ++ ++ +++ +++ ---
Develop and implement a common ontology for coastal and marine information ++ ++ +++ ++
Improve functionalities directly supporting ICZM decision making in a short and long term perspective +++ +++ + ++ +++ ++ ++ +++ ++ --- ++
Improve diffusion and innovation of e-participation tools +++ + + ++ -- +++
Integrate 3D data and develop 3D tools +++ ++ ++ --- --
Ensure data and metadata availability ++ +++ +++ + -
Improve availability of geospatial data and CIS functions related to climate change ++ ++ +++ +++ ++ -- --
Establish strict link and cooperation between the structure responsible for the CIS management and opera-tion and the structure responsible for the implementation of the ICZM process ++ + +++ +++ ++ ++ + ++
Improve the use of protocols facilitating geo-spatial data sharing ++ ++ +++ ++ ++ +
Develop on-line tools to measure the real use of CIS + ++ +++ - ++
Participate to CIS and/or ICZM networks + ++ +++ ++ +++ ++ --
21807-REL-T006.2 page 53/82
5.2 Policy requirements description
The three steps procedure described in the previous chapter allowed identifying 17 policy re-
quirements, below grouped in the four already mentioned categories.
Scope
A1. Include end-user in the system design
Consultation of the user community throughout the CIS design phase is essential to en-
sure to match users’ needs and develop a really useful and concretely used system. This
firstly requires the identification of the user community and their active participation in the
definition of the specific system requirements, as actually done by some of the analysed
CIS illustrative cases.
A2. Address different user expectations and needs
A CIS may aim to provide data and functionalities to different users, such as policy and
decision makers, coastal planners and managers, researchers, representative of the
economic sectors, citizens, students, CIS experts etc. These can have different expertise
and skills, and different requirements and expectation. Multiple-users CISs are required
to deal with diverse user typologies, providing them with different knowledge levels, data,
functionalities and interfaces. The development of multi-user systems requires a proper
evaluation of users’ needs, thus being strictly related to policy requirement (a1).
A3. Progressively move towards the adoption of an ecosystem-based approach in the defini-
tion of the CIS’ context and geographic area of application
The adoption of an ecosystem-based approach is one of the key pillars of the ICZM policy.
In relation to CISs this would imply the inclusion in the CIS's geographical area of applica-
tion of the drainage basin, the land component of the coastal area, and the marine area,
thus promoting integration across the land-sea boundary.
The adoption of an ecosystem-based approach can also require the definition of the CIS’
area of application beyond administrative (sub-national and national) boundaries, thus im-
plying a cross-border cooperative effort in creating common CIS platforms, also at the in-
ternational level (some examples have been analysed in this study, such as: Integrated
Atlas of the state of the coast in the South-Eastern Baltic, Trilateral Wadden Sea coopera-
tion web-site, Schelde Monitor, Oder Estuary coastal information system, MEGASIG).
A4. Continue and strengthen the effort in matching the INSPIRE Directive
Continue and strengthen the effort in matching the INSPIRE Directive, specifically in rela-
tion to metadata standards, geo-spatial data availability and interoperability in general. It is
in particular important to ensure the high-quality and standards-compatible metadata are
continued to be provided; this can be rather challenging in particular for historical geo-
spatial data. Use of various-levels structure to organise and describe metadata (e.g. ab-
stract, discovery, full metadata) can be very useful in approaching different target users.

21807-REL-T006.2 page 54/124
Contents
B1. Improve economic and in particular social and governance information within CISs
The great majority of coastal information system widely covers territory and environmental
information. Economic information is considered by a good number of CISs, however only
for limited data typologies (such as for examples location of main economic activities). So-
cial and governance information is rarely properly addressed. Indeed, there is a need to
improve economic and in particular social and governance geospatial data within CISs. In
relation to the governance dimension, it would be very important to include in the CIS the
progress results of the ICZM process, i.e. information (data, spatial layers, documents,
etc.) on ICZM related plans and policies. These should be made available to all users thus
improving awareness and participation of all possibly involved stakeholders on the on-
going ICZM process.
This policy requirement is strictly related to the holistic nature of ICZM and the related
ecosystem-based management approach, aiming to determine progress towards good
environmental status of coastal ecosystems that is directly relevant to socio-economic
benefits and human well-being.
B2. Improve availability of information resulting from the integrated analysis of data related to
different topics (and possibly to different ICZM information dimensions: territory, environ-
ment, society, economy and governance).
Integrated information (i.e. information directly related to integrated management, such as
in particular integrated maps, indicators and indexes) can result really useful in supporting
ICZM decision making and communication, in particular in relation to cross-sector analysis
and assessment, for example related to: coastal sensitivity, vulnerability and risk, overall
pressure on the coastal system, coastal evolution, adaptation, etc. These added value
products are also particularly important in dealing with multi-uses zoning (of both land and
marine components of the coastal systems) and resolution of conflicts induced by multiple
human uses. A specific CIS section on integrated data and geo-spatial data related to
ICZM could be developed to properly structure this kind of information.
B3. Improve availability of multi-time data
Historical series of data and geospatial information are essential for the assessment of
coastal process trends and the evaluation of their future evolution. Currently, availability of
multi-time data is limited to some specific issues, such as in particular: shoreline position,
satellite images and orthophotos, population and population density, land uses, some en-
vironmental monitoring data. Multi-timing should be expanded to other spatial information,
also addressing the economic, social, and governance dimensions.
B4. Develop and implement a common ontology for coastal and marine information
Terminology used to describe same or similar information sectors and data typologies is
not uniform; there are differences among various information systems (e.g. shoreline vs.
coastline). These differences can obstacle data search, sharing and integration. The
adoption of a common ontology could reduce this limitation.
21807-REL-T006.2 page 55/124
Functions
C1. Improve functionalities and tools directly supporting ICZM decision making in a short and
long term perspective
Coastal information systems only partly provide functionalities specifically supporting the
ICZM decision making process, in particular for the public administrations. These kinds of
functionalities are particularly required and useful for: vision building and scenario devel-
opment, assessment of planning and management alternatives, monitoring and evaluation
of the ICZM process. Their complexity and completeness can widely vary, including data
driven functions (such as integrated maps, scenario maps or ICZM indicator), customised
functions and more ambitious Decision Support Tools (DST). DST should be in case de-
signed and developed on the basis of real end-users expectation, thus avoiding too gen-
eral and no-useful tools.
C2. Improve diffusion and innovation of e-participation tools
There is a clear need to evolve from information/communication to real participation in the
generation and use of coastal information and more in general in the ICZM process. How-
ever few CISs provide proper e-participation tools and functionalities; such tools therefore
need to be further developed and innovated. Some examples are: blog, e-forum, social
networks, platform for participated GIS (for example to analyse conflicts among coastal
uses), wiki-like tools focusing on ICZM or specific related topics, functionality enabling us-
ers to provide georeferred naturalistic or environmental observations (geo-tagging func-
tions), etc.. Also database containing information on coastal stakeholders can be very
useful in supporting mutual cooperation and full participation within the ICZM process.
Effort shall also be dedicated to develop specific interactive education tools aiming to in-
crease civil society awareness. Analysed CIS cases showed very few tools or sections
specifically dedicated to education that is a fundamental step towards awareness rising.
C3. Integrate 3D data and develop 3D tools
3D data and tools can be useful in the analysis of some relevant coastal management is-
sues, such as flooding vulnerability and risk, coastal erosion and definition of related inter-
ventions, topographic and bathymetry evolution, habitat conservation and requalification,
etc. These data and tools are mainly addressed to specialised users, but can also result in
being useful for the decision making process for example for 3D visualisation; their devel-
opment can be therefore linked to the c1 policy requirement.
C4. Ensure data and metadata availability
CISs should provide the possibility to download the majority of data and geospatial data
they contain, thus supporting the use of coastal information for a wide spectrum of ICZM
related initiatives. Downloadable data must be accompanied by a detailed metadata de-
scription, also including clear and transparent link to the original data producers.
C5. Improve availability of geospatial data and CIS functions related to climate change
Climate change and sea level rise will likely improve significantly coastal vulnerability in
the next decades. However, these issues appear to be rarely considered in the analysed
illustrative cases of coastal information systems. There is an evident need to improve the
availability of geo-spatial data and functionalities (such as for example coastal vulnerability
maps to sea level rise, coastal evolution scenarios, visualisation tools, etc.) related to cli-

21807-REL-T006.2 page 56/124
mate change impacts, vulnerability and adaptation. This would actually support main-
streaming of climate change vulnerability and adaption in coastal and marine plans and
polices.
Mechanism
D1. Establish strict link and cooperation between the structure (department, office, division,
etc.) responsible for the CIS management and operation and the structure (often a differ-
ent one) responsible for the implementation of the ICZM process.
Modalities to develop or reinforce this cooperation can be different and depend on the
specific ICZM case and in particular on the involved subjects. One example could be the
creation of a working group (or a coordination board) for the definition of guidelines for the
implementation, management and use of the CIS. The working group should primarily fa-
cilitate the embedding of the CIS in the policy making and planning/management process,
therefore leading to a concrete use of the CIS for ICZM implementation.
The working group should involve representatives (with different roles: policy makers,
coastal planners, coastal managers, CIS experts, etc.) of all the public (at the all relevant
governance levels) and private bodies/structures involved in the concrete implementation
of the ICZM process, including those operating the CIS.
D2. Improve the use of protocols facilitating geo-spatial data sharing
Open Geospatial Consortium standards (such as Web Map Service – WMS, Web Feature
Services – WFS, and Web Coverage Services – WCS, etc.) offer a high potential for data
and metadata sharing, implying the following advantages: data and metadata are updated
by data producers, responsibility of data and metadata quality check is shared among dif-
ferent subjects (again the data producers), reduction of management costs in particular re-
lated to the previous two issues, reduction of limitation to data accessibility related to re-
strictive data policies and Intellectual Property Rights (IPS).
D3. Develop on-line tools to measure the real use of CIS
These tools should aim to assess the real use of CISs within an ICZM process and there-
fore by the ICZM community. Generally available web statistic tools can provide part of the
needed information, however innovative tools are required.
D4. Participate to CIS and/or ICZM networks
Participation to CIS ad/or ICZM networks (such as ICAN – International Coastal Atlas
Network) can be particularly useful for the exchange of best practices on CIS manage-
ment and use within an ICZM process. These networks can also be very important to
share knowledge related to more technical aspects, including data contents, interoperabil-
ity, metadata, functions and tools, etc., as well as to connect initiatives at different levels
(sub-national, national and international).
Participants to the Marseille stakeholder workshop were invited to evaluate the relative im-
portance of above policy requirements through a questionnaire that was distributed to them
before the same workshop (as mentioned in section 5.1). In particular, they were asked to ex-
press a score ranging from 1 to 10 for each of the policy requirement (where 1 stands for “not
relevant at all” and 10 stands for “extremely important), to evaluate their relative importance.
Figure 5-1 shows the mean score of the policy requirement evaluation based on 21 filled ques-
tionnaires.

21807-REL-T006.2 page 57/124
All policy requirements got a mean score greater than 6, thus resulting in being all relevant
although with relatively significant differences. Policy requirements getting scores higher than
8 were:
C4 - Ensure data and metadata availability (score = 8.5);
D1 - Establish strict link and cooperation between the structure responsible for the
CIS management and operation and the structure responsible for the implementation
of the ICZM process (score = 8.4);
A2 - Address different user expectations and needs (score = 8.3);
B1 - Improve economic and in particular social and governance information within
CISs (score = 8.2);
A4 - Continue and strengthen the effort in matching the INSPIRE Directive (score =
8.1);
A1 - Include end-user in the system design (score = 8.1).
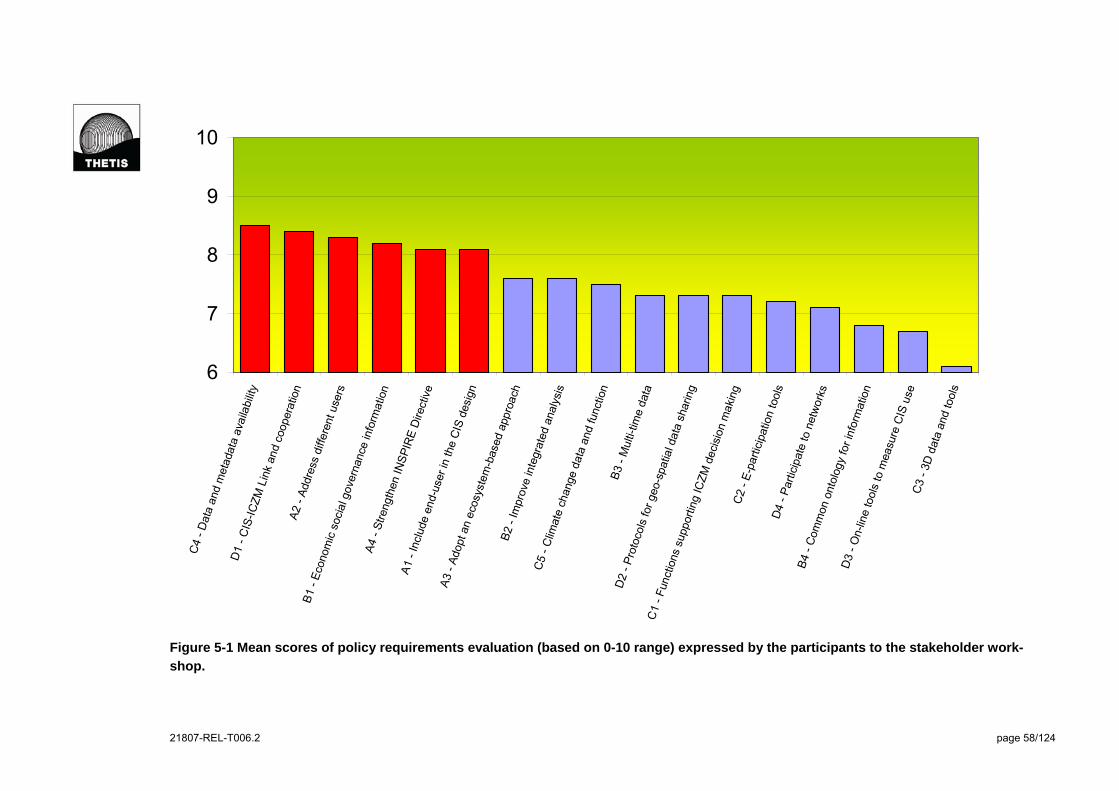
21807-REL-T006.2 page 58/124
6
7
8
9
10
C4
- D
ata
and
met
adat
a av
aila
bilit
y
D1
- C
IS-I
CZ
M L
ink
and
coop
erat
ion
A2
- A
ddre
ss d
iffer
ent u
sers
B1
- E
cono
mic
soc
ial g
over
nanc
e in
form
atio
n
A4
- S
tren
gthe
n IN
SP
IRE
Dire
ctiv
e
A1
- In
clud
e en
d-us
er in
the
CIS
des
ign
A3
- A
dopt
an
ecos
yste
m-b
ased
app
roac
h B
2 -
Impr
ove
inte
grat
ed a
naly
sis
C5
- C
limat
e ch
ange
dat
a an
d fu
nctio
nB
3 -
Mul
ti-tim
e da
ta
D2
- P
roto
cols
for
geo-
spat
ial d
ata
shar
ing
C1
- F
unct
ions
sup
port
ing
ICZ
M d
ecis
ion
mak
ing
C2
- E
-par
ticip
atio
n to
ols
D4
- P
artic
ipat
e to
net
wor
ks
B4
- C
omm
on o
ntol
ogy
for
info
rmat
ion
D3
- O
n-lin
e to
ols
to m
easu
re C
IS u
seC
3 -
3D d
ata
and
tool
s
Figure 5-1 Mean scores of policy requirements evaluation (based on 0-10 range) expressed by the participants to the stakeholder work-
shop.

21807-REL-T006.2 page 59/124
6 Policy options definition
Following the impact assessment methodology, this chapter describes results of the first four
steps:
1. Problem identification;
2. Objectives definition;
3. Baseline scenario definition;
4. Policy options development.
Policy options are intended as integrated sets of the policy requirements described in chapter
5. Conceptually, steps 1 “Problem identification” also oriented the definition of the same policy
requirements, as previously described, that were just used to formulate the policy options.
6.1 Problem identification and objective definition
The overview and in-depth analysis highlighted significant strengths of existing CISs, which
however are not always properly exploited to fully support the ICZM processes at various
scales. The same analysis enabled to identify main current CIS’s weakness and gaps; i.e. key
issues to be dealt with in terms of new, and often innovative, requirements. The main problem
to be addressed is therefore a twofold problem that can be summarised as follows:
Underuse or improper use of existing coastal information systems within the ICZM
process at various scales.
Existence of weaknesses and gaps to be addressed through the development of new
CIS’ features to further improve their use within the ICZM process at various scales.
Available coastal information systems already include relevant information, functions and tools
that can be used to support the ICZM process. However, in some cases these are not fully ex-
ploited to properly underpin integrated coastal zone planning and management. Indeed, Task
1 results showed that more than 50% of the analysed CISs provides a good “basic” support to
ICZM knowledge (i.e. availability of geo-spatial data, operation at different spatial scale, multi-
time data) and process related aspects (i.e. problem understanding and structuring and, even
if less frequently, identification and assessment of planning and management alternatives).
However support to “more advanced” ICZM aspects (e.g. integrated analysis, stakeholder in-
volvement and participation, vision building and scenario development, adaptive planning
management, international cooperation) is much less frequently addressed.
The above described situation is not only related to existing gaps and limits in the CISs’ devel-
opment (in terms of availability of data or of specific functions and tools, such as those directly
supporting decision making or e-participation in ICZM), but is also determined by the underuse
of existing CIS potentialities to concretely support the ICZM process. In this perspective, the
key issue to be addressed is the reinforcement, or in some cases the establishment, of strict
link and cooperation among CIS managers and ICZM actors in order to embed the develop-
ment and use of the same CISs in the policy making and coastal planning/management pro-
cess. CIS cases considered in the in-depth analysis provide good examples of direct link to

21807-REL-T006.2 page 60/124
on-going ICZM processes; however the same, at least in some cases, still highlight the oppor-
tunity to reinforce relations between CISs and coastal plans and policies and to support CIS
evolvement in tools more accepted and valuable for coastal decision making.
Results of the Public Consultation “Possible way forward for maritime spatial planning and in-
tegrated coastal management in the EU”6, taking place from 23 March to 20 May 2011, high-
lighted this aspect, too. Although information on the coastal and marine systems are generally
available, stakeholders participating to the consultation stressed the great importance (85% of
responses expressed a 5 or 4 score on a 1-5 range) of having “Information systems that facili-
tate the sharing and use of data between competent authorities, stakeholders and the public”.
The second aspect of the defined problem is specifically related to existing gaps and weak-
ness of CISs in relation to their use in proper supporting ICZM, which would require the further
development or even the innovation of some CISs elements (contents and functions). The
overview and in-depth analysis of CIS illustrative cases (see section 4.3) enabled to identify
the following main “weak” elements:
The CIS context and geographical area of application are not generally defined ac-
cording to an ecosystem-based approach;
Economic and in particular social and governance geo-spatial data are often not ade-
quately covered in CISs contents;
Availability of multi-time data is limited to some specific issues and in general does not
cover aspects that are particularly relevant for integrated coastal planning and man-
agement;
Integrated information (e.g. integrated maps and indicators) resulting from the joint
analysis of different data typologies related to various ICZM sectors and dimensions is
properly provided by few systems;
Climate change appears to be rarely covered, both in terms of data availability and
functions to on-line interactively visualise and analysis these data;
As previously stressed, coastal information systems only partly provide integrated in-
formation and functionalities specifically supporting the ICZM decision making pro-
cess, in particular for the public administrations. This is particular evident for more
complex ICZM aspects, such as vision building and scenario development, adaptive
planning management, international cooperation;
Tools enabling an appropriate e-participation in ICZM (i.e. e-forum, geo-tagging, video
sharing, etc.) are still poorly diffused.
Other features appear to be already adequate to provide support to the ICZM process, thus
requiring minor or even no new development. These include:
Multi-sector approach; the great majority of analysed CIS cases considers all the key
sectors of the coastal systems, thus attempting to deal with the holistic and integrated
nature of the ICZM perspective;
6 Public Consultation “Possible way forward for maritime spatial planning and integrated coastal zone management in the EU”. ICZM component – provisional results of the web-based consultation. 23/3 – 20/5 2011. Brussels, 10.06.2011 ENV.D2 (2011). Available at http://ec.europa.eu/environment/iczm/pdf/report_online_consultation.pdf ; last visit on 24.06.2011 at 19.00.
21807-REL-T006.2 page 61/124
Environmental and territory data and information are in general properly covered;
A good portion of coastal information systems (more than 50%) provides “basic” sup-
port to knowledge and processes related aspects of ICZM, as previously pointed out;
Great part of the systems is accessible on-line and there is a great effort in making
geo-spatial data and metadata directly accessible and freely available to users; how-
ever use of Open Geospatial Consortium standards and protocols is still limited;
Interoperability appears to be one of the main goal of CIS developers and managers
and the majority of analysed cases are significantly progressing on this issue;
Use-friendliness generally is adequate to support the CIS use in coastal planning and
management. This aspect can constitute a real limit only for specific CIS cases.
As already stressed in the policy requirements definition, it is important to act on all the CIS’
component including in particular: contents (data, information and related structuring), func-
tions related to different target users (expert and non-expert) and scope (decision and policy
making, coast management and planning, stakeholder participation, etc.), and management
and operation mechanisms. Contents and function related requirements can mainly act on the
design and development of new CISs features, while mechanisms can also determine signifi-
cant improvement in the use of already existing features, thus strengthening their positive ef-
fects on the ICZM process.
The second step of the methodology sets the objectives related to the identified problem. The
general objective of the policy options and related impact assessment is to improve the con-
crete support of coastal information systems to the ICZM process at various scales, enhancing
CISs diffusion and strengthening their use in strict connection to integrated coastal planning
and management. In relation to this general objective, the following specific objectives have
been identified:
Increase the use of coastal information system in providing full support to implement
the key ICZM principles, in particular as defined by the Recommendation
2002/413/EC;
Provide support (through data, functions and management mechanisms) to the on-
going integration process between ICZM and MSP, and more in general between
ICZM and close related policies;
Simplify the use of coastal information systems in order to make easier and more im-
mediate their support to the ICZM decision making.
Figure 6-1 shows the main links among the specific and general objectives and the two as-
pects of the identified problem. The same conceptual scheme includes two important criteria
considered for the comparison among options:
Limit and possibly reduce costs related to the development, maintenance and updat-
ing of coastal information system;
Provide benefits on relevant key economic, social and environmental issues that can
be indirectly affected by the improvement of CIS use within the ICZM process.
21807-REL-T006.2 page 62/124
General and specific objectives are than linked to expected benefits considered in the identi-
fied direct impacts (see sections 5.1 and 7.1). These express how the policy requirements and
options would contribute to the implementation of the same objectives. Figure 6-2 illustrates
the main links between the specific objectives and the direct impacts used in the assessment.
The first specific objective contributes to the general one through an improved support of CISs
to the implementation of the specific ICZM aspects related to the eight key principles identified
by the Recommendation 2002/413/EC. Figure 6-2 shows main links of each key principle to
the identified direct impacts. In this perspective, this objective deals with both aspects charac-
terising the considered problem, i.e.: (i) underuse or improper use of already existing CISs
strengths and (ii) weakness and gaps limiting the CISs support to ICZM.
The second specific objective focuses on a key issue of the on-going debate of ICZM imple-
mentation, i.e. the harmonisation between the ICZM and MSP policies and more in general the
integration between ICZM and other closely related policies, including IMP and the climate
change adaptation policy. An improved integration among these closely related policies can
also reinforce other essential aspects of the ICZM process (referring to the eight key princi-
ples), including: the adoption of an ecosystem-based approach, the implementation of ICZM in
a regional sea context, the cooperation among different sectors and institutional levels. Figure
6-2 highlights the direct links of this specific objective with the ICZM principle 8 “use of a com-
bination of instruments designed to facilitate coherence between sectoral policy objectives and coherence between planning and management” and to the related direct impact. This objec-
tive is mainly related to the first aspect of the identified problem; however actions related to the
development of new functions (dashed line in Figure 6-1) might also contribute to this specific
objective, too.
Finally, the third specific objective contributes to the general one by pursuing a simplified and
immediate use of the coastal information system in supporting ICZM decision making. This ob-
jective is not much related to the CIS use-friendliness; indeed Task 1 analysis highlighted that
this aspect does not currently constitute a strong limit in the CISs use. The objective is much
more related to the development (and innovation) of information and functions that can be di-
rectly used in feeding the decision making process on coastal planning and management. In
this perspective, this objective is specifically related to the second aspect of the identified
problem.

21807-REL-T006.2 page 63/124
Improve support of CISs to the ICZM process at various scales enhancing CISs diffusion and strengthening their use
GENERAL OBJECTIVE
GENERAL CRITERIA
Weakness and gaps to be addressed to improve CISs use within ICZM
Under use or improper use of existing CISs within ICZM
IDENTIFIED PROBLEM
Simplify use of CISs to better support ICZM
Provide support to the integration between ICZM and MSP and between ICZM and other closely related policies
Increase use of CISs in supporting the implementation of key ICZM principles
SPECIFIC OBJECTIVES
Limit and possibly reduce costs
Provide benefits on relevant economic, social and environmental issues that can be affected by improvement of CIS use within ICZM
Figure 6-1 Conceptual links among identified problem, general and specific objectives.
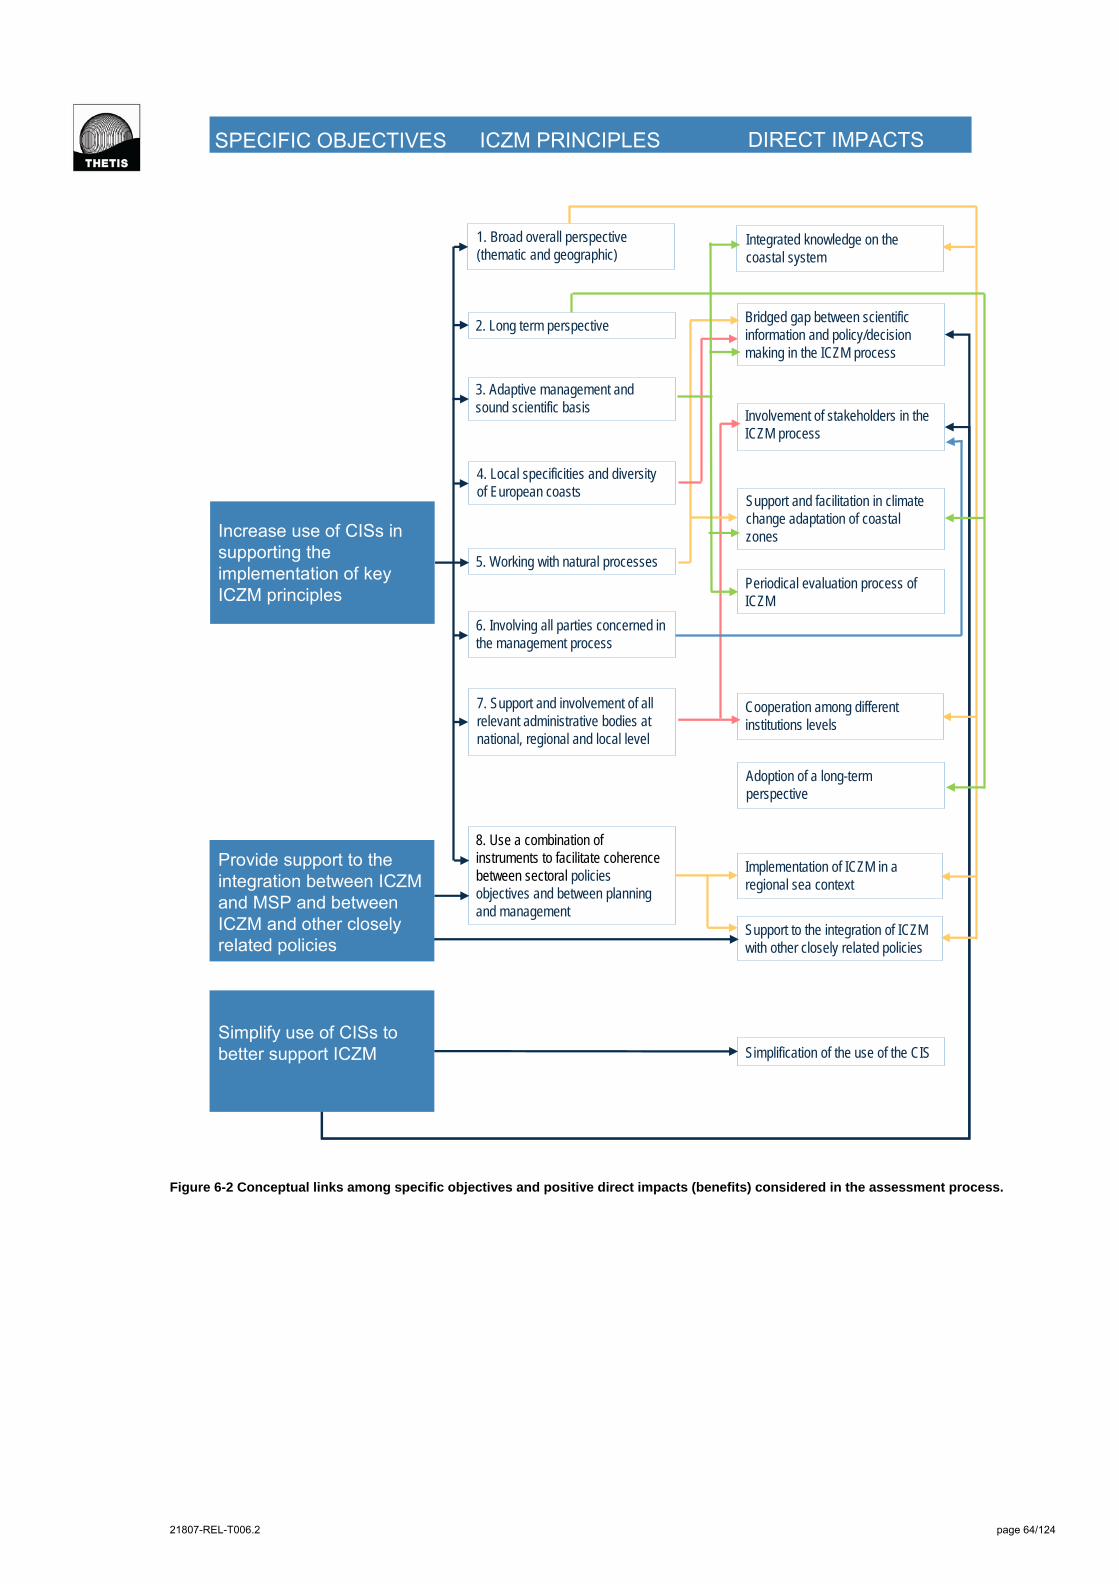
21807-REL-T006.2 page 64/124
Increase use of CISs in supporting the implementation of key ICZM principles
Simplify use of CISs to better support ICZM
Involvement of stakeholders in the ICZM process
Bridged gap between scientific information and policy/decision making in the ICZM process
Integrated knowledge on the coastal system
Cooperation among different institutions levels
Periodical evaluation process of ICZM
Support and facilitation in climate change adaptation of coastal zones
Support to the integration of ICZM with other closely related policies
Implementation of ICZM in a regional sea context
Adoption of a long-term perspective
Simplification of the use of the CIS
ICZM PRINCIPLESSPECIFIC OBJECTIVES DIRECT IMPACTS
3. Adaptive management and sound scientific basis
2. Long term perspective
1. Broad overall perspective (thematic and geographic)
6. Involving all parties concerned in the management process
5. Working with natural processes
4. Local specificities and diversity of European coasts
8. Use a combination of instruments to facilitate coherence between sectoral policies objectives and between planning and management
7. Support and involvement of all relevant administrative bodies at national, regional and local level
Provide support to the integration between ICZM and MSP and between ICZM and other closely related policies
Figure 6-2 Conceptual links among specific objectives and positive direct impacts (benefits) considered in the assessment process.

21807-REL-T006.2 page 65/124
6.2 Baseline scenario and policy options definition
Policy options are intended as integrated and homogenous sets of the key structuring policy
requirements. These are grouped together to define a strategy (i.e. the policy option) generally
aiming to improve CIS’s support to ICZM implementation, through specific objectives and mo-
dalities. Policy options have been clearly defined on the basis of the previous study activities
and in particular the results of the analysis of CISs illustrative case and the step-by-step defini-
tion of policy requirements (see chapter 5). A further very relevant input to the definition of pol-
icy options came from the stakeholder workshop held in Marseille on the 6th of May; main re-
lated feedbacks can be summarised in the following points:
Provide a clear definition of the baseline scenario, that should also include those poli-
cy requirements that are related to the fulfilment of already set legislative demands;
Use all the identified policy requirements for the formulation of the policy options;
Clearly differentiate the identified policy options; categorizations used to group the
policy requirements (four groups: scope, contents, functions and mechanism) can be
very useful in supporting the formulation of properly differentiated policy options.
Feedbacks on the policy options formulation were also provided by the EC ICZM expert group,
in particular at the XI group meeting.
The first conceptual step of this part of the study dealt with the definition of the “baseline sce-
nario”, i.e. the reference scenario to relatively assess direct and indirect impacts of policy op-
tions, as described in chapter 7. In the specific context of this study, the baseline scenario is
defined as the scenario not including the implementation of new policy requirements for
coastal information systems and implying the fulfilment of already set legislative requirements,
in particular related to implementation of the INSPIRE Directive. As agreed with participants to
the stakeholder workshop, the baseline scenario includes the two identified policy require-
ments strictly and directly related to the INSPIRE Directive:
Continue and strengthen the effort in matching the INSPIRE Directive (A4);
Ensure data and metadata availability (C4), policy requirement strictly related to the
previous one.
Afterwards, three policy options were developed, as formed by different policy requirements
and being characterised by a different level of ambition (low, medium, high) in terms of ex-
pected benefits on the ICZM process, but also in terms of likely costs or burdens linked to the
policy option implementation, as further illustrated in the following parts of this chapter.
The following four policy requirements were considered as common to all the three policy op-
tions:
Include end-user in the system design (A1);
Address different user expectation and needs (A2);
Develop on line-tools to measure the real use of CIS (D3) in particular in concreting
support ICZM;
Participate to CIS and/or ICZM networks (D4).

21807-REL-T006.2 page 66/124
These were included in all the three policy options since can provide an evident benefit to all
of them with relatively limited use of economic resources and human skills. Ready involvement
of final users in the system design and a multi-users oriented system can improve the real use
and usefulness of CISs, specifically in the ICZM process, with relatively limited costs. Indeed,
users can help to rightly orientate the CIS design and development (in terms of objectives,
contents, functions and technological platform) since its real beginning. The further develop-
ment of on-line tools to measure the real CIS’s use can provide relevant feedbacks to orien-
tate the development and management of the system, as well. Similarly, participation to CIS
and/or ICZM networks can require limited economic and human resources and result in being
particularly advantageous for the ICZM implementation, enabling to share worldwide experi-
ences and best practices, as well as knowledge related to more technical aspects.
Task 1 highlighted that most of the analysed coastal information systems lack data and func-
tions supporting the assessment of climate change impacts, vulnerability and adaptation on
the coasts. However, provisional results of the Public Consultation "Possible way forward for
maritime spatial planning and integrated coastal management in the EU”7, taking place from
23 March to 20 May 2011, showed that “stakeholders” are well informed about the risk that
may affect the coast in a specific country/region also due to the impacts of climate change. It
is likely that a wide variety of studies, projects and/or plans related to climate change effects
on the coastal systems have been produced and related data and information are available,
but they have not been included in most the CISs. Thus the “C5 policy requirement” has been
split in two:
Improve availability of geospatial data related to climate change (C5.I); this policy re-
quirement is considered less ambitious and was therefore included in the first policy
option. It should mainly imply the integration in coastal information systems of already
existing data and information related to the climate change issues;
Improve availability of functions related to climate change (C5.II), i.e. functions and
tools enabling to interactively visualise or even analyse climate change drivers (includ-
ing sea level rise) and their effect on the coastal systems in terms of impacts, vulnera-
bility and risk. This policy requirement is considered more ambitious since it implies
the design and development of new functions. It was therefore included in the second
policy option.
The three developed policy options are described below.
P1 – Improving data and information base (low ambition)
This policy option mainly aims to improve the data and information base of CISs in particular
to increase: the role of the scientifically-based approach, multi-sector and integrated (holistic)
knowledge and long-term evaluation in supporting the ICZM planning and management pro-
cess. The policy option deals with the principal identified data and information gaps, i.e.: socio-
economic and governance data, integrated information, multi-time data (i.e. historical series)
and climate change data. In relation to these identified gaps, the policy option in particular
aims to improve the availability of geo-spatial data, i.e. georeferred data than can be visual-
7 Public Consultation “Possible way forward for maritime spatial planning and integrated coastal zone management in the EU”. ICZM component – provisional results of the web-based consultation. 23/3 – 20/5 2011. Brussels, 10.06.2011 ENV.D2 (2011). Available at http://ec.europa.eu/environment/iczm/pdf/report_online_consultation.pdf ; last visit on 24.06.2011 at 19.00.
21807-REL-T006.2 page 67/124
ised as maps or elaborated to derived other thematic maps, thus providing spatial information
useful for integrated coastal planning and management.
The implementation of the P1 policy option mainly relies on the integration within CISs of al-
ready existing data and information, still not included in the system, rather than on the acquisi-
tion of new data or the realisation of new study. The final goal is therefore the creation of a
wider database able to address the various sectors and integrated aspects (i.e. not only envi-
ronmental and territorial issues) of the ICZM holistic approach as well as its long-term per-
spective (through multi-time data). The policy option includes the eight policy requirements (4
common and 4 specific ones; these latter mainly related to the “Content” category). The four
specific ones are further detailed below:
Improve economic and in particular social and governance information within CISs
(B1);
The great majority of coastal information system widely covers territory and environ-
mental information. Economic information is considered by a good number of CISs,
however only for limited data typologies (such as for examples location of main eco-
nomic activities). Social and governance information is rarely properly addressed. In-
deed, there is a clear need to properly cover all the aspects that are essential in deal-
ing with the sustainable planning and management of the coastal and marine systems
and the sustainable use of coastal and marine resources.
The overview and in-depth analysis showed that some socio-economic and govern-
ance information are included at least in some of the analysed CISs. The main chal-
lenges (i.e. priority) compared to the baseline situation are related to the improvement
of the following information within CIS:
o Economic information; this type of information is generally covered in terms of
spatial location of main marine economic activities (e.g. location of fishing,
marine traffic, energy production, energy transportation, mining, harbours).
Similar geo-spatial data are required for economic activities (e.g. location of
tourism facilities, coastal industry, terrestrial traffic also in relation to marine
traffic, commercial activities, etc.) occurring on the land component of the
coastal system. Furthermore, location information need to be integrated with
quantitative data on the economic activities, that are generally totally lacking,
such as tourist fluxes, fishing production, energy production, quantitative data
on marine and terrestrial traffic, and related economic values
o Social information; more frequently available data are related to the demo-
graphic sectors. Other data are generally lacking, these mainly refers to data
useful to understand the quality of life of coastal population, such as: location
of main social services (e.g. schools, hospitals, cultural services, recreational
services), employment and labour market, housing market, emergency ser-
vices. Geo-spatial data on the location of tourist services and attractions need
to be further improved, too.
o Governance information; task 1 overview analysis showed how this specific
information typology is particularly poorly considered in current CISs. Main
priorities are related to: (i) detailed land use to support integrated coastal zon-
ing, (ii) detailed marine use to support maritime spatial planning, (iii) maps on
competence on the coastal and marine system, (iv) spatial plans addressing
21807-REL-T006.2 page 68/124
the coastal system, (iv) sector plans addressing the coastal system, (v) in
case available scenarios on the evolution of the coastal physical, natural and
socio-economic system.
Improve availability of information resulting from the integrated analysis of data related
to different topics (B2);
Integrated analysis and elaboration of different data typologies can generate and pro-
vide summary and integrated information very useful to underpin the ICZM decision
making process. This specific aspect of the P1 option aims to improve the availability
of integrated information within CISs. B2 requirement differs from the C1 requirement
(included in the P2 option) since it does not aim to design and develop on-line tools to
enable users to interactively generate this type of information. P1 “simply” deals with
the publication on-line of “static” integrated information; in this perspective B2 re-
quirement can be seen as a preliminary step of C1 one. Two main types of integrated
information are identified: indicators and/or indexes and integrated maps.
According to Task 1 analysis, indicators and indexes resulted in being included only in
the 20% of the analysed cases; ICZM indicators identified by the Deduce project can
represent a good reference to further diffuse this type of integrated information.
Standardised indicators can enable to relatively compare different coastal areas and
the same system in different time steps, thus tracking its evolution. Integrated maps
that could be included in CISs strictly depend on the specific characteristics of the
considered coastal system and the goals of the on-going ICZM process. Some exam-
ples are maps on: (i) multi-use of the coastal and marine system, (ii) coastal vulnera-
bility to single and multi-drivers, (iii) coastal natural and/or technological (single and
multi) risk (e.g. oils spill, fire, industrial accident, flooding, coastal erosion, desertifica-
tion, hydraulic risk, etc.), (iv) level of protection of high-value areas and ecosystems,
(v) specific indexes (e.g. the Baltic Sea Pressure Index and the Baltic Sea Impact In-
dex contained in Helcom MSD or the Ecological Sensitivity Index provided by the
Odessa CIS). Important integrated maps are related to governance aspects men-
tioned for the B1 requirement, i.e. the development and on-line availability of integrate
coastal zone and maritime spatial planning maps.
Improve availability of multi-time data (B3);
Historical series of data and geospatial information are essential for the assessment of
coastal process trends and the evaluation of their future evolution. Currently, availabil-
ity of multi-time data is limited to some specific issues (indeed provided by about 55%
of the analysed CISs), as highlighted in Task 1 analysis (such as in particular: shore-
line position, satellite images and orthophotos, population and population density, land
uses, some environmental monitoring data). Multi-timing should be expanded to other
spatial information, considering the following possible priorities:
o Include other relevant territorial and environmental issues, such as for exam-
ple morphological evolution, environmental quality of various matrixes or
physical data (e.g. waves, storminess, etc.). Specific typologies of multi-time
data to be further expanded depends on the considered coastal system and
related CIS;

21807-REL-T006.2 page 69/124
o Provide multi-time data on main coastal impact and risk, including for example
coastal erosion, coastal and river flooding, oil spill, saltwater intrusion, major
pollution events, etc.;
o Expand multi-timing to economic, social and governance information, current-
ly addressed in some cases only in terms of land use and demographic data
(see B1 policy requirement);
o Include historical series of key data related to climate change and sea level
rise impact and vulnerability (see C5.I requirement);
o Provide values of ICZM indicators at different time steps to illustrate the evolu-
tion of key coastal process and aspects.
Improve availability of geospatial data related to climate change (C5.I);
Climate change and sea level rise will likely improve significantly coastal vulnerability
in the next decades. However, these issues appear to be rarely considered in the ana-
lysed illustrative cases of coastal information systems. There is an evident need to im-
prove the availability of geo-spatial data and functionalities (this aspect is considered
in the P2 policy option).
As previously described, provisional results of the Public Consultation "Possible way
forward for maritime spatial planning and integrated coastal management in the EU”,
taking place from 23 March to 20 May 2011, showed that “stakeholders” are well in-
formed about the risk that may affect the coast in a specific country/region also due to
the impacts of climate change. It is therefore likely that a wide variety of studies, pro-
jects and/or plans related to climate change effects on the coastal systems have been
produced and related data and information are available, but they have not been in-
cluded in most the CISs. This specific policy requirement therefore mainly deals with
the collection and inclusion within the CIS of already available climate change related
information, with particular focus on geo-spatial data that can be mapped on the terri-
tory. Main data relevant for the ICZM process can summarised as follows:
o Past trends of main climate change drivers (e.g. air and water temperature,
precipitation, storminess), relative sea level rise (therefore including eustacy,
subsidence and isostacy contribution) and storm surges;
o Future projection of main climate change drivers, relative sea level rise and
storm surges;
o Thematic maps on coastal vulnerability and risk related to main climate
change and sea level rise impacts on the coastal systems; e.g. permanent in-
undation due to sea level rise, storm surges and flooding, coastal erosion,
change in sedimentation patterns, impacts on wetlands and other high-value
natural systems, saltwater intrusion in freshwater system, combined river and
marine flooding;
o Thematic maps on current, planned and envisaged (scenarios) adaptation
measures (i.e. coastal defences, beach nourishment, coastal planning, zon-
ing, natural system migration, etc.). Adaptation information is essential since
adaptation can strongly influence coastal vulnerability.

21807-REL-T006.2 page 70/124
This policy requirement is connected to the previous one, since a greater availability of
multi-time data is essential to the development of great part of the above information.
In this perspective important historical data include obviously those related to climate
change and sea level rise and the physical characteristic of the system (such as the
coastline evolution or the location of important ecological systems), but even refers to
socio-economic data (e.g. demography, infrastructure distribution, GDP, economic
values, etc.) that are essential to evaluate coastal vulnerability.
P2 – Improving and innovating functions and tools (medium ambition)
This policy option mainly aims to improve the availability of functionalities and tools directly
supporting ICZM decision makers and coastal planners and managers, as well as to increase
stakeholders’ involvement and participation in the ICZM process. This policy option is there-
fore characterised by two main objectives. The first goal is to provide users with on-line func-
tions and tools enabling them to interactively analyse and elaborate CIS’s data, with particular
relevance for geo-spatial information, thus supporting ICZM decision making through custom-
ised information (e.g. thematic and integrated maps) produced by these new tools and func-
tions. In this perspective P2 policy option can be strictly related to P1 one; a wider and more
complete data and information base can better support data analysis and elaboration through
the newly available tools, in particular in relation to the integration of different information ty-
pologies. Task 1 analysis highlighted that, although there is a clear need to evolve from infor-
mation/communication to real participation in the generation and use of coastal information
and more in general in the ICZM process, few CISs provide proper e-participation tools and
functionalities; P2 option therefore aims to further develop these tools.
The policy option includes eight policy requirements (4 common and 4 specific ones, these lat-
ter related to the “Function” category). The four specific ones are further detailed below:
Improve functions directly supporting ICZM decision making in a short and long term
perspective (C1);
This requirement is conceptually linked to the B2 one (see policy option P1), actually
representing a further and more demanding step in providing direct support to ICZM
decision making. It specifically aims to design and develop on-line tools to enable us-
ers to interactively generate information useful for coastal planning and management.
The main difference between B1 and C1 is therefore related to the possibility of cus-
tomisation of final products offered by the latter. Again, the specific function/tools to be
realised depend on the particular CIS’s goals and application contexts; the following
four levels of implementation can be identified:
o Dynamic visualisation of spatial layers; i.e. the function enabling to select and
overlay more than one layer in a single view to produced customised maps.
This function is provided by the great majority of analysed CISs including a
Web-GIS component, together with other basic tools (e.g. zooming in and out,
panning, legend customisation, etc.). However some of them are still limited to
a static visualisation, i.e. visualisation of pre-define maps;
o Improved Web-GIS functions; these refer to functions that are normally avail-
able in off-line GIS but are currently very limited or totally lacking in on-line
CISs, such as: buffering, spatial layer classification according to customised
legend, distance calculation from a specific target and related mapping, trans-
parency visualisation of a specific layer to show simultaneously two different

21807-REL-T006.2 page 71/124
layers (i.e. flooded areas on orthophotos or infrastructure), visualisation of at-
tribute data (i.e. numeric data associated to geo-spatial features), possibility to
create graphs and/or statistics on attribute data associated to a specific geo-
spatial layer, spatial query, etc. These functions can significantly improve the
possibility to generate customised maps, thus resulting in being very useful for
coastal planning and management.
o Functions for the on-line generation of integrated maps, such as those de-
scribed in the B2 requirement, part of the P1 policy option. While B2 is “lim-
ited” to the on-line publication of pre-defined integrated maps, C1 enables us-
ers to generate own customised analysis and maps, mainly in two ways: (i)
selecting, or even providing, the specific geo-spatial dataset to be analysed to
derive the integrated maps, and/or (ii) selecting the method (e.g. a specific
method for the calculation of the Coastal Vulnerability Index) to be used to
aggregate the different dataset.
o Tools for the creation of scenarios on coastal evolution; these represent the
more advanced level of CIS development, aiming to provide scenarios on key
coastal process and issues (i.e. urbanisation, tourism development, popula-
tion development, coastal vulnerability to climate change, etc.). Such scenari-
os can be very useful in assessing possible alternatives and contribute to en-
visage and plan the future. Scenarios tools are normally based on models and
require great initial investment.
Task 1 analysis showed that the great majority of the on-line available CISs just satisfy
the first level. The priority is therefore on the complete implementation of the first level
and the greater diffusion, currently very limited, of the second type of on-line functions.
Improve diffusion and innovation of e-participation tools (C2);
Task 1 showed that tools enabling an appropriate e-participation in ICZM are still not
much diffused (20%). Some other CISs (25%) provide tools enabling partial e-
participation and interactiveness. Although e-participation is not a specific objective of
all CIS typologies (for example it is not strictly relevant for Spatial Data Infrastructure),
it should be further strengthened due to the relevant role that stakeholder involvement
and participation play in the ICZM process. Some examples are: blog, e-forum, e-
room (virtual space to share data, documents, maps, etc.), social networks, platform
for participated GIS (for example to analyse conflicts among coastal uses), wiki-like
tools focusing on ICZM or specific related topics, functionality enabling users to pro-
vide georeferred naturalistic or environmental observations (geo-tagging functions), e-
learning platform to freely provide training material, etc.. Also database containing in-
formation on coastal stakeholders can be very useful in supporting mutual cooperation
and full participation within the ICZM process.
Integrate 3D data and develop 3D tools (C3);
3D data resulted in being very poorly considered in the analysed CISs. The main prior-
ity is therefore to visualise and make available “basic” 3D data, i.e. data describing the
three dimensional variation of the coastal and marine systems, respectively Digital El-
evation Model or Digital Terrain Model and bathymetric data. 3D digital models can be
very useful for various application, related for example to: coastal morphology evolu-
tion, analysis of sedimentation/erosion patterns, evaluation of coastal flooding impact
21807-REL-T006.2 page 72/124
and risk, planning of coastal defences and other coastal interventions (such as beach
nourishment), habitat re-construction or re-qualification (for example for dune sys-
tems), etc. 3D data can be used to feed on-line 3D tools. However due to the current
situation, the focus is on data availability rather than on tools development.
Improve availability of CIS functions related to climate change (C5.II);
The conceptual link of this requirement to C5.I (see policy option P1) is very similar to
the one characterising B2-C1 relation. This requirement specifically aims to design
and develop on-line tools to enable users to interactively visualise and analyse climate
change and sea level related data and generate customised thematic maps on coastal
vulnerability and risk to the most relevant impacts (e.g. coastal and river flooding,
permanent inundation, coastal erosion, wetland loss or migration, etc.).
An interesting example is the Sea Level Rise and Coastal Flooding Impacts Viewer
from the US National Oceanic and Atmospheric Administration (NOAA; available at
http://www.csc.noaa.gov/slr). The purpose of this data viewer is to provide coastal
managers and scientists with a preliminary look at sea level rise and coastal flooding
impacts. The viewer is a tool that uses nationally consistent data sets and analyses to
advise the user of the impacts (in terms of submersions and coastal flooding) of a
range of different scenarios of sea level rise. Considered vulnerability targets include:
the coastal physical system, the socio-economic system and main wetland areas. An-
other example is represented by MARCO Portal from the US Mid-Atlantic Regional
Council on the Ocean (available at http://maps.tnc.org/MARCO/index.html) and further
described in the relative analytical table included in Annex II. Besides being useful for
coastal planners and mangers, these tools are very powerful for communication pur-
poses.
P2 focus is on functions provided to ICZM users. C1 and C2 are the core policy requirements
of this policy option; indeed C3 and C5 address some specific aspects that are particularly im-
portant for the previous C1 and C2 policy requirements. C3 and C5 can be seen as sort of
sub-policy requirements of the two previous ones.
P3 – Enhancing cooperation (high ambition)
This policy option mainly aims to enhance cooperation among different subjects involved in
the CISs implementation and management and more in general in ICZM process, thus improv-
ing the CISs support to this latter. Specifically, increased horizontal and vertical cooperation is
desirable among: structures of the same authority involved in ICZM and/or the CIS’ manage-
ment and operation, different public authorities involved in the ICZM process, different coastal
data providers and managers, managers of different CISs related to the same area of interest.
The policy option includes eight policy requirements (4 common and 4 specific ones). The four
specific ones are further detailed below:
Progressively move towards the adoption of an ecosystem-based approach in the def-
inition of the CIS’s context and geographic area of application (A3);
The adoption of an ecosystem-based approach is one of the key pillars of the ICZM
policy. However, the CIS’s area and context of application are normally identified ac-
cording to administrative boundaries; only some cases (about 30%) attempted to ap-
ply the ecosystem-based criteria (in particular at the local level). The progressive
adoption of this approach can result in being very useful in supporting the ICZM pro-
21807-REL-T006.2 page 73/124
cess since enables to correctly look at any process (e.g. sediment budget, pollutant
load generation and transfer, saltwater intrusion, coastal-river flooding, etc.) linking the
drainage basin, the coastal system and the marine area, and to consequently address
the definition of planning and management strategies and intervention in a unique and
integrated framework, thus promoting integration across the land-sea boundary. The
ecosystem approach is also a fundamental step in synergistically merging the imple-
mentation of different EU policies and directives dealing with the coastal system, in-
cluding ICZM, the Integrated Maritime Policy (and the related Marine Spatial Planning
– MSP), the Water Framework Directive, the Marine Strategy Framework Directive,
the climate change adaptation policy in coastal areas, etc.
Although very promising, the adoption of an ecosystem-based approach is also very
challenging and resource demanding for various aspects. Technically, it requires the
acquisition and organisation within the CIS of a great set of, often heterogeneous,
geo-spatial data not only related to the coastal system itself, but also to the drainage
basin and the marine system. Furthermore, it needs a great effort in cooperation at the
horizontal and vertical level among the various administrations having competences
on the different part of the system. Cooperation can be also required at the interna-
tional level, when the ecosystem extends beyond national boundaries, as approached
by some illustrative CIS cases analysed in Task 1 (e.g. Integrated Atlas of the state of
the coast in the South-Eastern Baltic, Three later Wadden Sea cooperation web-site,
Schelde Monitor, Oder Estuary coastal information system, MEGASIG). Actually, the
development of a cross-border coastal information system, for example through an
EU-funded project, can act as a catalyser for longer international cooperation in the
ICZM implementation.
Establish strict link and cooperation between the structure responsible for the CIS
management and operation and the structure responsible for the implementation of
the ICZM process (D1);
The goal of this specific requirement is to reinforce or even totally establish a strict co-
operation between CIS managers and operators and experts in charge to implement
the ICZM process. This would avoid that information systems are created just because
money and data are available and would bring to really embed the CIS development
and use with the ICZM process. This does not only imply that CIS data and functions
are used to support coastal planning and management, but even that the ICZM pro-
cess act as a driver in specifically defying CIS objectives and features.
Modalities to develop or reinforce this cooperation can be different and depend on the
specific ICZM case and in particular on the involved subjects. One example could be
the creation of a working group (or a coordination board) for the definition of guidelines
for the development, management and use of the CIS. The working group should in-
volve representatives (with different roles: policy makers, coastal planners, coastal
managers, CIS experts, etc.) of all the public (at the all relevant governance levels)
and private bodies/structures involved in the concrete implementation of the ICZM
process, including those operating the CIS.
Similarly to A3, this requirement may result in being very useful since would enable to
focus CIS development and use to the specific ICZM needs, but would also require a
significant collaborative effort among different subjects. Specific resources and time
should be therefore dedicated to this cooperation, although these are expected to be
21807-REL-T006.2 page 74/124
less that those required for the progressive adoption of an ecosystem-based ap-
proach.
Improve the use of protocols facilitating geo-spatial data sharing (D2), implying coop-
eration among different data producers and managers;
This requirement is included in the P3 policy option since, like the previous two, signif-
icantly depends on an enhanced cooperation. In this specific case cooperation is
needed among different data providers and managers to share geo-spatial information
through an improved use of Open Geospatial Consortium standards (such as Web
Map Service – WMS, Web Feature Services – WFS, and Web Coverage Services –
WCS, etc.). The technical solution does not represent a relevant limit to data and
metadata sharing, while the establishment of a collaborative approach may result in
being onerous, at least in the initial phase.
The required effort can be however balanced by the following main advantages: data
sharing leads any subject to have access to a wider dataset; responsibility and effort
related to data (and metadata) management, updating and quality check are shared
among the different data providers; management costs are consequently reduced; lim-
itation to data accessibility related to restrictive data policies and Intellectual Property
Rights can also significantly reduced or totally eliminated.
Develop and implement a common ontology for coastal and marine information (B4);
Finally, the implementation of this requirement needs a collaborative effort in defying a
common ontology for coastal and marine information, taking advantages of the al-
ready on-going initiatives, such as for example the work promoted by ICAN – the In-
ternational Coastal Atlas Network. A common ontology can eliminate some of the ob-
stacles currently limiting data search, sharing and integration.
P3 focus is on the coordination mechanism that can enhance the CIS usefulness in promoting
and implementing ICZM principle. It is highly ambitions since it does not only refer to changes
and modification to be brought to the coastal information systems, but it also implies a great
effort in cooperation among different subjects directly or indirectly related to CISs.
Figure 6-3 illustrates the main conceptual links among the different identified policy options.
P1, P2 and P3 can be considered progressive scenarios in terms of likely required resources
and effort (human and economic) for their implementation and expected benefits in concrete
support to the ICZM process. All the three represent a step forward compared to the baseline
scenario, since they include new requirements to be implemented in the CISs, aiming to in-
crease the support to the ICZM process, and requires additional resources. In this perspective
P1 depicts a relatively low ambitious policy option; P2 a medium ambitious policy option and
P3 a high ambitious policy option.
P1 and P2 policy options mainly act on the design and development of new CISs features to
improve support to ICZM, respectively related to data/information (contents) and func-
tions/tools. P1 deals with the principal identified data and information gaps, i.e.: socio-
economic and governance data, integrated information, multi-timing and climate change data.
Its focus is mainly on the integration within CISs of already existing data and information, still
not included in the system, rather than on the acquisition of new data or the realisation of new
study. The final goal is therefore the creation of a wider database able to address the various
sectors and integrated aspects (i.e. not only environmental and territorial issues) of the ICZM
21807-REL-T006.2 page 75/124
holistic approach as well as its long-term perspective (through multi-time data). P1 policy op-
tion, at least for some of its components, and the related creation of a more complete CIS da-
tabase are often a pre-requisite for the full implementation of the P2 policy option, which focus
is on the design and development of new on-line available tools enabling users to interactively
visualise, analyses and/or summarise data and information, thus supporting ICZM decision
making. P2 policy option also stresses the importance to further improve e-participation tools.
Both aspects (decision making and participation oriented functions/tools) require investment to
support design and development of new on-line functions and tools. Related costs and efforts
are expected to be higher than those characterising P1 option (see impact assessment in
chapter 7), in particular due to the required initial costs of development. At the same time, P2
option aims to provide tools (and the related data) that can be directly used by decision mak-
ers, coastal planners and coastal managers in their contribution to ICZM, as well as to directly
support one of the key principle of the process: the stakeholders’ involvement and participa-
tion. Benefits on the ICZM process are therefore expected to be higher than those related to
P1. In this perspective (expected higher costs, effort and benefits) P2 option is considered
more ambitious to be implemented and in terms of likely positive results.
P3 policy option focuses on increased cooperation, not only in relation to specific CIS aspects
(such as data sharing, CIS management or common ontology definition) but also, and in par-
ticular, in relation to the real use of the same CIS within the ICZM process and the progressive
adoption of an ecosystem-based approach, requiring collaborative effort of the different (public
and private) subjects involved in integrated coastal planning and management of a specific
territory. Enhancing cooperation can result in being greatly effective in promoting the use of
CIS within the ICZM process, also having important effects on various fundamental ICZM as-
pects, such as: involvement of and cooperation among all relevant administrative levels and
bodies, international cooperation including the ICZM implementation within a regional sea con-
text, working with natural processes, or implementation of instruments to facilitate coherence
between sectoral policies and between planning and management. P3 option is therefore ex-
pected to be particularly ambitious in terms of likely benefits for the use of CIS within the ICZM
process. At the same time costs related to its implementation are expected to be higher than
those characterising the other two policy options. Significant investments of economic and in
particular human resources are necessary to both initiate and maintain alive the collaborative
processes; these are not only strictly related to the specific CIS context but even imply the en-
gagement of other ICZM actors, in particular for the adoption of the ecosystem-based ap-
proach. P3 can be therefore considered the most ambition option, requiring more effort to be
implemented but also likely generating greater benefits. P3 and P1-P2 options are mutually
interrelated. Some aspects of the latter can represent steps towards the realisation of P3 re-
quirements, such as in the case of integrated information (P1) and decision support functions
(P2) that can underpin the enhancement of cooperation among CIS and ICZM; improved sci-
entifically-based information can also contribute to the progressive adoption of an ecosystem-
based approach. On the contrary P3 implementation can reinforce some of the P1 and P2 el-
ements; for example the improvement of the use of protocols facilitating geo-spatial data shar-
ing can contribute, even significantly, to cover the gap on availability of social, economic and
governance geo-spatial data.
The impact assessment illustrated in chapter 7 enabled to clearly understand policy options
implications in terms of benefits, negative impacts and costs, thus also providing further infor-
mation to confirm the level of ambition characterising the three options.
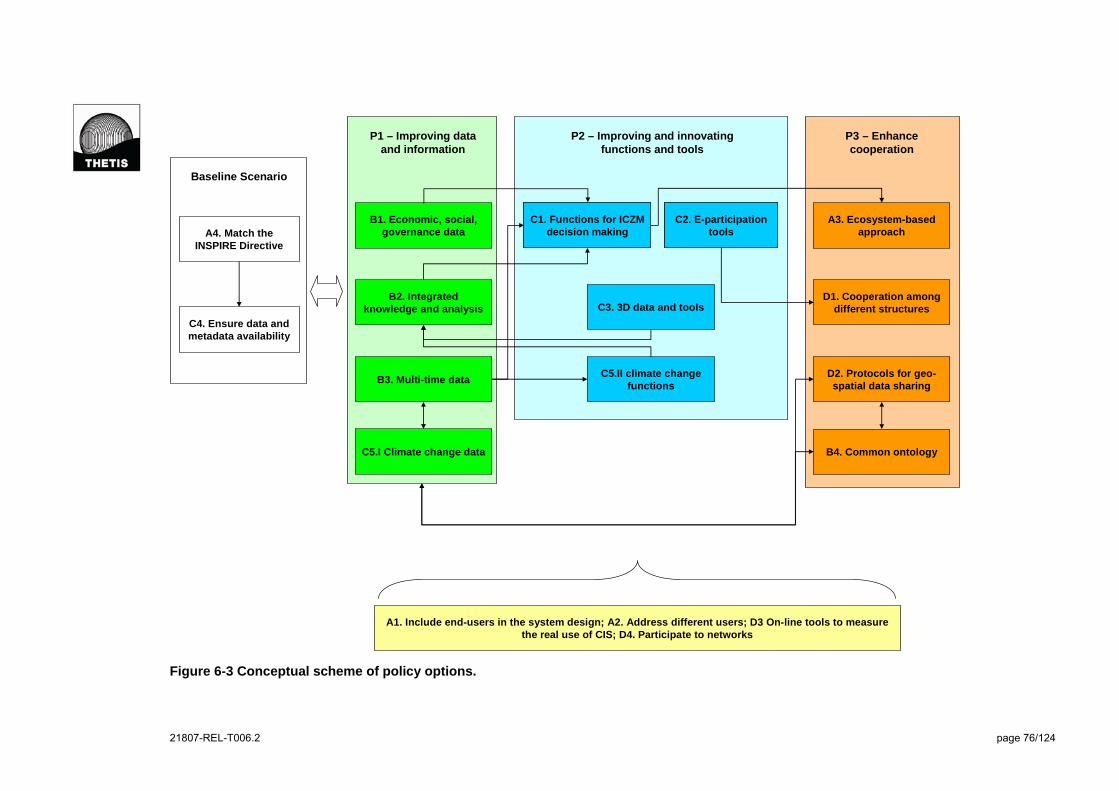
21807-REL-T006.2 page 76/124
A4. Match the INSPIRE Directive
C4. Ensure data and metadata availability
Baseline Scenario
B1. Economic, social, governance data
B2. Integrated knowledge and analysis
B3. Multi-time data
P1 – Improving data and information
C1. Functions for ICZM decision making
C2. E-participation tools
C1. Functions for ICZM decision making
C2. E-participation tools
P2 – Improving and innovating functions and tools
C3. 3D data and tools
C5.II climate change functions
A3. Ecosystem-based approach
D1. Cooperation among different structures
D2. Protocols for geo-spatial data sharing
P3 – Enhance cooperation
B4. Common ontology
A1. Include end-users in the system design; A2. Address different users; D3 On-line tools to measure the real use of CIS; D4. Participate to networks
C5.I Climate change data
Figure 6-3 Conceptual scheme of policy options.

21807-REL-T006.2 page 77/82
7 Impact assessment of policy options
Following the impact assessment methodology, this chapter describes results last four steps:
5. Identification of direct impacts;
6. Identification of indirect impacts;
7. Impact assessment;
8. Options comparison.
7.1 Impacts definition
Policy options were assessed in terms of direct (or primary) and indirect (or derived) impacts.
Direct impacts are those related to effects directly determined by a CIS policy option on key
issues of ICZM diffusion and implementation in Europe or to the use and the operation of the
coastal information systems. Indirect impacts are those directly or indirectly deriving from the
direct ones. Evaluation of direct and indirect impacts attempt to assess both expected benefits
and negative effects. Expected benefits are those related to the improvement of the CIS’s
support to key ICZM issues (such as for example cooperation among different institutions and
institutional levels or involvement of stakeholders in the ICZM process), i.e. they express how
the policy options would contribute to the achievement of the identified general and sector ob-
jectives (step 2) and to provide solutions to the main depicted problem (step 1). Figure 6-2 il-
lustrates the main link between specific objectives and considered positive impacts (benefits).
Other types of benefits may be related to the reduction of costs or use of human resources, for
example in relation to maintenance and operation of the system. Negative impacts can be
mainly due to increase in costs or in general effort needed for the policy implementation, and
increase in difficulties related to the use of the system.
Direct impacts for the policy options assessment include the same direct impacts used to for
the policy requirements validation (see section 5.1, step 2 of the policy requirements defini-
tion); their definition was therefore based on:
the results of the already mentioned preliminary stakeholder consultation involving the
workshop invited speakers, in particular through the skype-call discussion;
overview analysis of main policy documents related to the implementation of ICZM in
Europe.
This preliminary list of direct impacts was than discussed during the stakeholder workshop
held in Marseille on the 6th of May. Main related feedbacks are summarised as follows; work-
shop participants:
agreed on the proposed direct impacts (those already mentioned in section 5.1 and
used to preliminarily assess policy requirements);
suggested that policy impacts assessment should be based on an integrated evalua-
tion of expected benefits and costs;
21807-REL-T006.2 page 78/124
suggested to include some other “costs or expected negative impacts” in the list of di-
rect impacts to better support the understanding of negative implications of policy op-
tions;
suggested to structure direct impacts by grouping them in homogenous categories;
The final list of direct impacts used to assess the three policy options was therefore defined
also on the basis of the above workshop feedbacks8. Direct impacts are conceptually organ-
ised as follows.
Aspects related to ICZM principles (as identified by the Recommendation 2002/413/EC)
Integrated knowledge on the coastal system;
Bridged gap between scientific information and policy/decision making in the ICZM
process;
Involvement of stakeholders in the ICZM process, also aiming to improve awareness
on sustainable coastal planning and management;
Support and facilitation in climate change adaptation of coastal zones within the wider
context of ICZM;
Periodical evaluation process of ICZM planning and management; support an ICZM
adaptive process;
Cooperation among different institutions and institutional levels;
Adoption of a long-term perspective for ICZM.
Links with a broader policy context
Implementation of ICZM in a regional sea context;
Support to the integration of ICZM with other closely related policies (in particular IMP-
MSP and climate change policy).
Use of the system
Simplification of the use of the coastal information system.
Costs and use of resources
Development or initial costs;
Costs related to maintenance and updating of the CIS;
Learning (or training) costs.
The selection of indirect or derived impacts depended on the policy options and the direct im-
pacts individuated. The analysis was based on the EC Impact Assessment Guidelines (in par-
ticular Table 1, p. 33). According to the EC Guidelines, the study considered the division of in-
direct impacts in three groups: economic, social and environmental ones. The main objective
of this activity of the study was to assess indirect impacts of CISs policy options that can im-
prove the support to the implementation of ICZM processes at various scales. Indirect impacts
8 This list slightly differs for the one used in the assessment of policy requirements; in particular as suggested by workshop participants it also includes some other direct impacts related to “costs”.

21807-REL-T006.2 page 79/124
were therefore selected, form the list included in the EC Guidelines, referring to this overall
scope; i.e. relevant indirect impacts are those significantly affected by the identified policy op-
tions and that can therefore enable to assess policy options indirect effects. Other potential
economic, social or environmental impacts listed in the EC Guidelines were judged less rele-
vant for the three policy options defined or not applicable to the current study. For example,
potential impacts on property rights, consumers and households, macroeconomic environment
or even conduct of SMEs are more relevant when looking at impacts of information systems
themselves but less when looking at policy requisites to use CIS to support ICZM.
A limited number of key derived impacts were selected also to simplify the evaluation process
and keep it as realistic as possible. In this perspective, policy options could potentially affect
other issues as well, but these indirect impacts are expected to be smaller than key identified
ones or even impossible to qualitatively assess in a reliable way. As underlined in the EC
Guidelines, in sorting out the possible derived impacts the time dimension must constantly
keep in mind; i.e. whether the impact is short term or long term. Whenever relevant, short and
long term distinction was therefore addressed by the assessment. Identified indirect impacts
are listed below. Key questions related to their evaluation are highlighted for economic and
social impact.
Economic impacts
Functioning of internal market and competition
What impact (positive or negative) does the policy option have on the free movement
of goods, services, capital and workers?
Will it lead to a reduction in consumer choice, higher prices due to less competition,
the creation of barriers for new suppliers and service providers, the facilitation of anti-
competitive behaviour or emergence of monopolies, market segmentation, etc.?
Competitiveness, trade and investment flows
What impact does the policy option have on the global competitive position of EU
firms?
Does it impact on productivity?
What impact does the option have on trade barriers?
Does it provoke cross-border investment flows (including relocation of economic activi-
ty)?
Administrative Burden
Does the option have budgetary consequences for public authorities at different levels
of government (national, regional, local); both immediately and in the long run?
Does it bring additional governmental administrative burden?
Does the option require the creation of new or restructuring of existing public authori-
ties?
Innovation and research
Does the policy option stimulate or hinder research and development?
Does it facilitate the introduction and dissemination of new production methods, tech-
nologies and products?
Does it affect intellectual property rights (patents, trademarks, copyright, other know-
how rights)?

21807-REL-T006.2 page 80/124
Does it promote or limit academic or industrial research?
Does it promote greater productivity/resource efficiency?
Social impacts
Employment and labour market;
Does the option facilitate new job creation?
Does it lead directly or indirectly to a loss of jobs?
Does it have specific negative consequences for particular professions, groups of
workers, or self-employed persons?
Does it affect the demand for labour?
Does it have an impact on the functioning of the labour market?
Better living conditions in terms of effects on social protection, health and safety, edu-
cation system;
Does the option have an impact on services in terms of quality/access for all?
Does it have an effect on the education and mobility of workers (health, education,
etc.)?
Does the option affect the access of individuals to public/private education or voca-
tional and continuing training?
Does it affect universities and academic freedom / self-governance?
Does the option affect the health and safety of individuals/populations, including life
expectancy, mortality and morbidity, through impacts on the socio-economic environ-
ment (working environment, income, education, occupation, nutrition)?
Environmental
Integration of risk in coastal planning and management, leading to less coastal vul-
nerability and higher resilience/adaptation;
Biodiversity, flora, fauna and landscapes;
Sustainable use of coastal space (or sustainable land use planning)
As described in the following two chapters, policy options were assessed in terms of expected
direct and indirect impacts. Each policy option is formed by various policy requirements; the
impact assessment attempted to evaluate the integrated effects of the different policy require-
ments taking in consideration synergy, contrasting and cumulative effects.
Impact evaluation focused on the analysis of the principal links among policy options, direct
impacts and indirect impacts, thus not considering minor and more uncertain ones. The evalu-
ation implied the definition of qualitative scores (expressed by the following possibilities: ---; --;
-; 0; +; ++; +++) and the related description of potential effects (see next two sections). Nega-
tive values indicate a negative interpretation of the expected effect (for example decrease in
civil society participation in ICZM or increase in costs related to maintenance and updating of
the CIS), whereas positive values indicate an expected positive impact (e.g. increase in civil
society participation in ICZM or decrease in costs). Policy options have been evaluated in rela-
tion to the baseline scenario; i.e. scores represent delta differences with respect to the base-
line scenario condition.

21807-REL-T006.2 page 81/124
The above methodology was also used to qualitatively assess the cost implications of the
three policy options. As described in section 7.2.2, cost analysis also included the quantitative
estimation of the required effort for each policy option implementation at the European and re-
gional sea level and the elaboration of quantitative estimations of development and manage-
ment costs.
7.2 Assessment of direct impacts of policy options
This section illustrates the assessment of each policy option in terms of their contribution (i.e.
benefits or positive direct impacts) to the achievement of the general and specific objectives
identified in step 2 of the methodology. The analysis also highlights main negative implication,
also including development, management and learning costs of the three policy options. Quali-
tative scores corresponding to the assessment of direct impacts are summarised in Table 7-1.
The table highlights (in blue) the major expected benefits and therefore contributions to the
improvement of CIS support to the ICZM process; major negative impacts are marked in or-
ange.
As described in chapter 6, four policy requirements were considered as common to all the
three policy options, thus their likely main effects are also common to the three policy options.
A1 (Include end-user in the system design), A2 (Address different user expectation and
needs) and D3 (Develop on line-tools to measure the real use of CIS) policy requirements
generally aim to better meet real user needs and are expected to determine some benefits re-
lated to the following issues:
Bridge gap between scientific information and policy/decision making in the ICZM pro-
cess; the three policy requirements can help to match user (including policy and deci-
sion makers, coastal planners and managers) needs with scientific knowledge and to
proper use this latter in the ICZM process;
Involvement of stakeholders in the ICZM process; ready involvement of final users in
the system design and a multi-users oriented system can significantly improve the real
use and usefulness of CISs and therefore the participation within the ICZM process;
Simplification of the use of the system, by properly orientating the CIS design and de-
velopment and specifically its user interface.
Main benefits of the D4 (Participate to CIS and/or ICZM networks) policy requirement are re-
lated to opportunities offered by sharing of worldwide experiences and best practices, as well
as knowledge related to more technical aspects related to CISs. Main related benefits are ex-
pected for the following issues:
Integrated knowledge on the coastal system;
Bridge gap between scientific information and policy/decision making in the ICZM pro-
cess;
Cooperation among different institutions and institutional levels;
Implementation of ICZM in a regional sea context.

21807-REL-T006.2 page 82/124
For all the four above policy requirements, costs can be rather limited in comparison to ex-
pected benefits. Some costs are expected to address different user expectation and needs, in
particular in relation to the CIS development, and to develop on-line tools to measure the real
CIS’s utilisation, while participation to CIS and ICZM networks can require dedicated re-
sources and time. The ready involvement of users in the system design can help to partially
optimise the use of resources thus contributing to cost reduction. Knowledge and experience
exchange through CIS and ICZM networks can also help in addressing the proper solution to
specific needs, thus contributing, although partially, to cost reduction.
The expected benefits (i.e. contribution to the identified general and specific objectives) of the
three policy options are described in the following section. The impact assessment of the three
policy options also considers the evaluation of two other important criteria:
Limitation and possibly reduction of costs related to the development, maintenance
and updating of coastal information system; cost implications are assessed in sections
7.2.1;
Provision of benefits on relevant key economic, social and environmental issues that
can be indirectly affected by the improvement of CIS use within the ICZM process; this
aspect is analysed in section 7.3.
The diagram of Figure 7-1 highlights main direct impacts (benefits and costs) of the three poli-
cy options. In particular continuous lines refer to direct benefits and costs that were respective-
ly associated to +++ and --- scores as described below; dashed lines refer direct benefits and
costs that were respectively associated to ++ and -- scores.
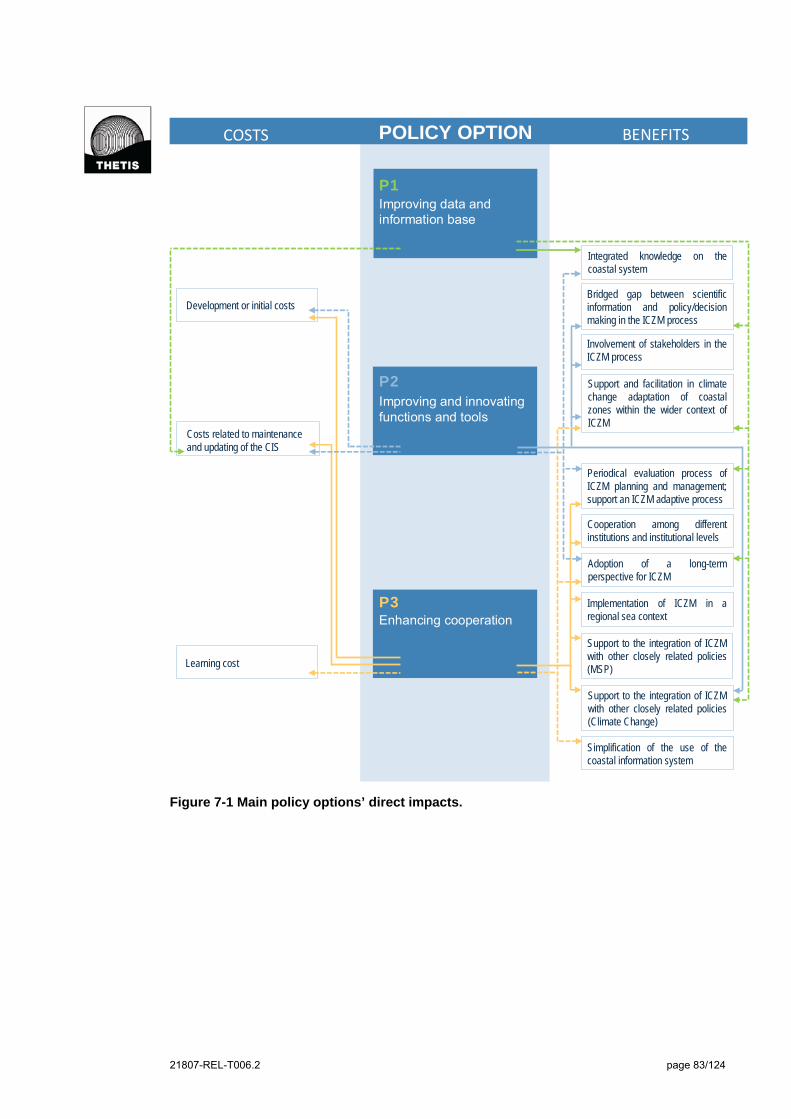
21807-REL-T006.2 page 83/124
P1Improving data and information base
P2Improving and innovating functions and tools
P3Enhancing cooperation
POLICY OPTION
Learning cost
Costs related to maintenanceand updating of the CIS
Development or initial costs
COSTS
Involvement of stakeholders in the ICZM process
Bridged gap between scientific information and policy/decision making in the ICZM process
Integrated knowledge on the coastal system
BENEFITS
Cooperation among different institutions and institutional levels
Periodical evaluation process of ICZM planning and management; support an ICZM adaptive process
Support and facilitation in climate change adaptation of coastal zones within the wider context of ICZM
Support to the integration of ICZM with other closely related policies (MSP)
Implementation of ICZM in a regional sea context
Adoption of a long-term perspective for ICZM
Simplification of the use of the coastal information system
Support to the integration of ICZM with other closely related policies (Climate Change)
Figure 7-1 Main policy options’ direct impacts.

21807-REL-T006.2 page 84/124
7.2.1 Direct impacts: expected benefits
Integrated knowledge on the coastal system
This direct impact is relevant for the three policy options, since all of them contribute in en-
hancing the knowledge on the coastal system and its diffusion towards different targets and
users. Efforts aiming to improve integrated data and knowledge are particularly important for
this direct impact.
P1 – Improving data and information base; P1 directly aims to further develop the
CISs data and information base in particular to cover all aspects relevant for the
knowledge of the coastal system (i.e. including social, economic and governance data
as well as environmental and territory data) as well as to deal with time dimension
through multi-time data. These requirements are essential to underpin the adoption of
a holistic approach and the integrated knowledge of the coastal system. Integrated
knowledge is specifically addressed by P1 policy option through the improvement of
information resulting from the integrated analysis of data related to different topics
(such as indicators and integrated maps) - (Score: +++).
P2 – Improving and innovating functions and tools; benefits related to this policy op-
tion are again relevant since P2 aims to improve the functions directly supporting the
ICZM decision making process; these functions strongly rely on the availability of inte-
grated information. 3D and in particular climate change related tools can contribute in
generating integrated information; coastal vulnerability to climate change for example
requires to approach physical (e.g. coastal typology or climate drivers), social (e.g.
population density), economic (e.g. land and infrastructure economic values) and gov-
ernance (e.g. land planning and adaptation planning) information throughout an inte-
grated evaluation. Improvement of e-participation tools appears to have a negligible
effect on this impact - (Score: ++).
P3 – Enhancing cooperation; among the three policy options P3 is the one likely pro-
ducing less benefits on this specific ICZM aspect. These benefits are mainly related to
the progressive adoption of an ecosystem-based approach that can indirectly help the
integrated analysis of different sector data. Indirect benefits can be also produced by
CISs policy requirements enhancing data exchange (i.e. development of a common
ontology and use of protocols facilitating geo-spatial data sharing); these can enlarge
possibility to improve the CISs data base for all the information dimensions (territory,
environment, society, economy and governance). Hence, P3 benefits are expected to
be less relevant than P1 and P2 ones - (Score: +).

21807-REL-T006.2 page 85/124
Bridged gap between scientific information and policy/decision making in the ICZM
process
This direct impact aims to assess the contribution that each policy option can give to the prop-
er use, within the ICZM, of scientific knowledge; this is often available but not always fully
used in decision making. This direct impact is not only related to the improvement of data and
information (that is although essential) but also to their integration in forms and typologies (e.g.
indicators or integrated maps) that can result in being ready useful for the decision making
process.
P1 – Improving data and information base; P1 main benefits on this specific aspect
are related to the improvement of integrated analysis and relative results that can re-
sult really useful in supporting ICZM decision making, in particular in relation to cross-
sector analysis and assessment. Improvement of the CISs data base can also indi-
rectly contribute to bridge the gap between science and decision making for those as-
pects currently poorly covered (i.e. society, economy and governance) - (Score: ++).
P2 – Improving and innovating functions and tools; P2 is the more effective policy in
terms of improvement of the links between scientific knowledge and decision making.
It specifically aims to further develop and diffuse CISs’ functions and tools directly
supporting ICZM decision making that necessarily need to rely on scientific
knowledge. 3D and climate change related functions can also contribute to this bene-
fit; similarly they strongly depend on scientific knowledge and tools (such as models)
and can enable to analysis data to generate information ready useful for decision
makers, coastal planners and coastal managers - (Score: +++).
P3 – Enhancing cooperation; P3 does not directly affect this benefit; however an en-
hanced cooperation can contribute to improve the proper use of scientific information
in coastal planning and management. This can be in particular pursued through a bet-
ter cooperation among CIS managers and the structure responsible for the ICZM im-
plementation; a better cooperation can bring to a clear definition of needs within the
ICZM process and to a better use of available information and more in general of sci-
entific knowledge. Other requirements are relatively less important for this benefit -
(Score: +).
Involvement of stakeholders in the ICZM process, also aiming to improve awareness on
sustainable coastal planning and management
There is a clear need to move from communication to real participation in the ICZM process,
to fully benefit from the great experience and expertise that stakeholder can provide to the
ICZM process. CISs can include facilities improving the real participation in two directions:
stakeholders can fully benefit from the use of CISs functions and data or they can feed CISs
with information and any other indication relevant for the ICZM process. This issue is specifi-
cally addressed by the P2 policy option.
P1 – Improving data and information base; P1 option does not specifically contribute
to improve stakeholder participation into the ICZM process. Indeed, a greater availa-
bility of data does not immediately imply an improved participation. Indirect benefits
can be generated by the improved availability of information resulting from the inte-
grated analysis of data related to different topics; integrated maps, indicators or in-
21807-REL-T006.2 page 86/124
dexes can support communication and awareness rising on coastal planning and
management. However, in general P1 effects are considered negligible - (Score: 0).
P2 – Improving and innovating functions and tools; P2 specifically aims to improve
stakeholders’ involvement and participation, in particular through the further develop-
ment and innovation of e-participation tools. Innovation is expected to play a signifi-
cant role since can provide new modalities for a real participation in the ICZM process.
Positive effects on this aspect can be also generated by improved decision supporting
tools; although these are mainly intended for more expert users they can efficiently
summarise data and information in more communicative products (e.g. indicators, in-
tegrated maps, scenarios, process simulation, etc.) - (Score: +++).
P3 – Enhancing cooperation; the effect of this policy option might be rather significant
even if less relevant than P2 one. Main positive implications are related to possibilities
offered by a specific policy requirement included in this policy option. Wider use of
protocols facilitating geo-spatial data sharing can support a proper diffusion and use of
data and information as well as data exchange among different stakeholders. Howev-
er, this requirement directly affects participative use of coastal information system, ra-
ther than real stakeholder participation into the ICZM process - (Score: +).
Support and facilitation in climate change adaptation of coastal zones within the wider
context of ICZM
Climate change vulnerability and adaptation are key issues for coastal management and will
likely become more important in the future. These issues are related to the availability of data
and tools specifically focusing on the climate change sectors, but need also to be addressed in
terms of better cooperation and coordination among different subjects.
P1 – Improving data and information base; more data and information can support a
proper knowledge of the system and a better planning and management process, also
including the identification of adaptation measures to climate change. Socio-economic
information is essential in correctly understanding climate change vulnerability of the
coastal system (for example in terms of people or infrastructure at risk for flooding).
P1 option also includes the improvement of availability of climate change related data;
in this perspective acquisition and integration (with the CISs) of data on current and
planned adaptation measures are essential. Multi-time data are also important in par-
ticular to understand historical trends and evaluate their future evolution, which is par-
ticularly relevant for climate change related assessments. Although necessary, the
improvement of the information base does not immediately imply a more efficient ad-
aptation strategy – (Score: ++).
P2 – Improving and innovating functions and tools; P2 specifically addresses this as-
pect through the improvement of the availability of functions dealing with climate
change vulnerability and adaptation. Similarly to the P2 option, it is important to stress
that these functions should not be limited to vulnerability assessment but also attempt
to take in consideration adaptation issues, too. 3D data and tools can be very useful in
side supporting more complex climate change related functionalities; 3D is actually
essential in dealing with elevation, relative sea level rise and flooding data. The real
effect of this policy option on this ICZM aspect strictly depends on developed func-
tions, being also very much related to the application scale – (Score: +++).

21807-REL-T006.2 page 87/124
P3 – Enhancing cooperation; main positive effects of P3 policy option are related to
the adoption of an ecosystem-based approach. This enables to properly deal with
multi-scale analysis and to connect the local scale to the regional one, thus linking the
specific interventions (local scale) to a wider plan looking at the whole coastal system
(regional or supra-regional scale), as necessary when dealing with climate change
risks assessment and the related definition of adaptation measures – (Score: ++).
Periodical evaluation process of ICZM planning and management; support an ICZM
adaptive process
This issue attempts to evaluate how policy requirements and options can help the adaptive
planning process, in particular through the creation of tools and mechanism supporting the pe-
riodical and shared assessment of the ICZM process.
P1 – Improving data and information base; Main P1 positive effects are related to the
increase availability of multi-time data that can enable to understand how processes
evolve in time, and of integrated analysis results. Standardised indicators (such as the
one defined by the Deduce project) or other standardised products (for example inte-
grated maps related to pressure on the coast, state of the coast, coastal and marine
uses or coastal and marine conflicts) can support the periodical assessment process
that is one of the essential basis of adaptive management – (Score: ++).
P2 – Improving and innovating functions and tools; similarly to the previous policy op-
tion, main P2 expected benefits are related to a specific requirement, i.e. the im-
provement of functions directly supporting decision making. Tools including advanced
ICZM process related functions (i.e. assessment of alternative in planning and man-
agement, vision building, scenario development, monitoring of the ICZM process) can
be useful in supporting adaptive management – (Score: ++).
P3 – Enhancing cooperation; P1 and P2 can provide useful data and tools to support
adaptive management. However they are totally ineffective if a proper mechanism
aiming to promote the adaptive process is not put in place and fully implemented. In
this perspective cooperation is really essential, in particular when referred to collabo-
ration between CIS managers and ICZM experts. A close cooperation among these
two subjects can maximise the benefits produced by the use of CISs in feeding and
underpinning the periodical process of evaluating, problem conceptualising, planning,
managing and monitoring – (Score: +++).
Cooperation among different institutions and institutional levels
This direct impact is particular relevant for the P3 policy option that is actually based on a
strong enhancement of cooperation involving various aspects of the development, operation
and use of coastal information systems.
P1 – Improving data and information base; P1 expected effects on cooperation among
different institutions are considered not relevant. Some positive effects could be indi-
rectly generated by the improved integrated analysis of data, if this implies a greater
cooperation among different data managers or producers. The net effect of this policy
option is however considered not relevant in comparison to the baseline scenario –
(Score: 0).

21807-REL-T006.2 page 88/124
P2 – Improving and innovating functions and tools; P2 option evaluation for this im-
pact is very similar to the previous one. Positive effects, although limited, could be
generated by the further development of functions supporting the decision making
process, that can require or facilitate cooperation among different institutions. These
effects are however expected to be relatively limited if compared to the baseline sce-
nario and the P3 policy option – (Score: 0).
P3 – Enhancing cooperation; this direct impact is specifically addressed by the P3 pol-
icy option; actually almost all P3 policy requirements significantly contribute to en-
hance cooperation among different subjects involved in the CISs implementation and
management and more in general in the ICZM process. The progressive adoption of
an ecosystem-based approach strictly needs and promotes horizontal and vertical co-
operation among all the bodies involved in the integrated management of a specific
coastal ecosystem. Cooperation is also essential among different departments or of-
fices belonging to the same public administration, as fostered by the D1 policy re-
quirements. The increase in the use of protocols for geo-spatial data sharing and the
development of a common coastal ontological system requires and support close col-
laborations among data producers and managers (not only including public admin-
istration, but also research institutions, NGOs and the representatives of the economic
sector) – (Score: +++).
Adoption of a long-term perspective for ICZM
All the three policy options include some CISs requirements that can be relevant in promoting
the adoption of a long-term perspective. The three policy options have effects that can be as-
sociated to similar evaluation of the final score related to this impact, even if these effects are
rather different.
P1 – Improving data and information base – main P1 benefits in terms of long term
perspective are related to the improved availability of multi-time data that can enable
to understand processes evolution and to define scenarios for the future. A scientifi-
cally-based elaboration of future scenario is essential to properly deal with long-term
planning and management. P1 also considers the improvement of availability of cli-
mate change data, including projections that are directly related to a long-term vision -
(Score: ++).
P2 – Improving and innovating functions and tools; P2 option aims to improve func-
tions directly supporting decision making in a short and long-term perspective. This
policy option has also positive implications on the considered direct impacts since
aims to promote the further development of specific functions dealing with climate
change. Tools enabling to generate climate change impact scenarios (e.g. coastal
scenarios related to flooding, permanent inundation and loss of land, saltwater intru-
sion, and erosion) enable to address specific issues of the long-term coastal planning
and management. The other policy requirements of this option does not specifically af-
fect this impact – (score: ++);
P3 – Enhancing cooperation – A strong cooperation between the ICZM responsible
structure and CIS managers and operators can reinforce the real and lasting use of
CIS contents and functions within the ICZM process. This can enable continuous CIS
support to coastal planning and management that is essential for a long-term perspec-
tive, thus not limiting the use of CIS to specific short-term needs. The progressive
21807-REL-T006.2 page 89/124
adoption of an ecosystem-based approach also needs the long-term vision that is es-
sential to understand most of the natural processes and to plan and implement
measures to counteract possible problems affecting them, such as in the case of the
reconstruction of natural coastal habitats just to mention an example - (Score: ++).
Implementation of ICZM in a Regional Sea context
The adoption of a holistic and ecosystem-based approach also implies the need to refer to the
wide scale represented by the regional sea level that enables to properly take in consideration
regional (environmental, social, economic and governance) drivers and problems. Cooperation
at this level can be really powerful and efficient to join the resources (including economic
ones) to tackle major problems and benefit for more relevant opportunities. The assessment of
this impact is similar to the one related to “cooperation among different institutions and institu-
tional levels”; indeed cooperation is essential to promote ICZM implementation at the regional
sea context.
P1 – Improving data and information base; P1 expected effects on this issue are con-
sidered not relevant. Some positive effects could be indirectly generated by the im-
proved integrated analysis of data, if this implies a greater cooperation at the regional
sea level. The net effect of this policy option is however considered not relevant –
(Score: 0).
P2 – Improving and innovating functions and tools; some positive effects are expected
for this policy options. Increased cooperation within the regional sea could be sup-
ported by improved tools and functions for decision making that could facilitate ex-
change of ideas and mutual understanding among coastal decision makers. Improved
e-participation functions can also point to the same direction, facilitating best practise
exchange among stakeholders of different countries. Sharing and discussion are initial
and fundamental steps towards a more advanced cooperation between countries of
the same Regional Sea – (Score: +);
P3 – Enhancing cooperation; Implementation of ICZM in a regional sea context is par-
ticularly promoted by P3 policy option due in particular to the progressive adoption of
an ecosystem-based approach. At a greater level this implies that ICZM problems are
also tackled within a regional sea perspective. Actions supporting data sharing and
the definition of common data and information platforms (including a common ontolo-
gy) can definitely improve a shared regional sea’s knowledge. An important role can
be also played by the Regional Sea Commissions and Conventions. Proper use of
CIS in supporting ICZM implementation can be further promoted by a strong link with-
in these Commissions between CIS managers and coastal experts dealing with ICZM
(in particular for those regional seas that have a proper CIS; such as the Helcom MDS
for the Baltic Sea Commission or the SDI for the Mediterranean Sea that the EU fund-
ed PEGASO project is developing) – (Score: +++).
21807-REL-T006.2 page 90/124
Support to the integration of ICZM with other closely related policies
This direct impact aims to evaluate main policy options implication on the integration between
ICZM and most relevant closely related EU policies, referring specifically to the Maritime Spa-
tial Planning (MSP), as one of the key cross-cutting tools to underpin the Integrated Maritime
Policy (IMP)9 and climate change adaptation10. The below described effect can be considered
as added-values for the implementation of policies closely related to ICZM.
Maritime Spatial Planning
The Blue Paper and the related progress report on the EU’s IMP identify MSP as one of the
key cross-sector tools (together with integrated surveillance and the building of a marine
knowledge base) to support integrated policy and decision making and to underpin IMP. The
Roadmap on MSP sets ten key principles to properly address the implementation of maritime
spatial planning with the EU context. All the three identify policy options can contribute to sup-
port most of the MSP principles. In this context the analysis focuses in particular on key princi-
ple number 9 “Achieving coherence between terrestrial and maritime planning – relation with
ICZM”.
P1 – Improving data and information base; integration between ICZM and MSP is not
specifically addressed by this policy option. However a greater availability of social,
economic and governance data, integrating the already available terrestrial and envi-
ronmental information, can underpin the adoption of a holistic and cross-sectors ap-
proach that necessarily requires dealing with the evaluation of cross land-sea bounda-
ries issues. For similar reasons some limited benefits can be determined by the further
improvement of integrated analysis – (Score: +).
P2 – Improving and innovating functions and tools; P2 benefits on MSP-ICZM integra-
tion are expected to be modest. Similarly to the P1 option, they are mainly related to
effort put in further supporting integrated assessment and related decision making,
towards the development of specific functions and tools – (Score: +).
P3 – Enhancing cooperation; among the three P3 option is the one expected to gen-
erate major positive impacts on MSP-ICZM integration. The progressive adoption of
an ecosystem-based approach in the definition of the CIS’s context and area of appli-
cation rightly moves toward this direction. Actually, the ecosystem approach is an
overarching principle for MSP and for the same ICZM. Enhanced cooperation among
CIS managers and structures or groups responsible for the ICZM implementation can
properly addresses the CIS progressive development, in order to provide proper sup-
port to ICZM-MPS integration in terms of data, integrated analysis and functions -
(Score: +++).
9 Main reference policy documents are: COM(2007) 575 final, An Integrated Maritime Policy for the European Union; COM(2008) 791 final, Roadmap for Maritime Spatial Planning: Achieving Common Principles in the EU; COM(2009) 540 final, Progress report on the EU’s Integrated Maritime Policy. 10 Main reference policy document is COM(2009) 147 final, White Paper. Adapting to climate change: Towards a Eu-ropean framework for action

21807-REL-T006.2 page 91/124
Climate change
The EU framework proposed by the White Paper on climate change adaption for the first
Phase (2009-2012) focuses on four actions: (1) building a solid knowledge base on the impact
and consequences of climate change for the EU, (2) integrating adaptation into EU key policy
areas, (3) employing a combination of policy instruments to ensure effective delivery of adap-
tation and (4) stepping up international cooperation on adaptation. The first and second ac-
tions are the most relevant in terms of integration between climate change and ICZM (and
IMP-MSP) policies.
P1 – Improving data and information base; positive effects are mainly expected in
terms of contribution to the development of a scientific knowledge base on climate
change impacts, vulnerability and adaptation. P1 directly deal with the improvement of
the availability of climate change related geo-spatial data. Benefits can be also pro-
duced by increase in historical series (multi-time data), particularly useful in assessing
past and expected future trend of coastal processes, and the further collection of so-
cial, economic and governance data. These latter are necessary to define a clear pic-
ture of the coastal vulnerability as well as to understand the current level of adaptation
and plan future interventions. In a broader perspective, the improvement of CIS con-
tents could also positively affect the on-going development of the Clearing House
Mechanisms, by providing data and information about climate change issues – (Score:
++);
P2 – Improving and innovating functions and tools; similarly to P1 options, P2 is likely
to generate benefits mainly in term of the further development of the knowledge base
on climate change, also specifically including methods, models and prediction tools.
Indeed P2 option specifically includes the improvement or functions related to climate
change vulnerability and adaptation. It also aims to promote the proper use and inno-
vation of functions and tools addressing climate change relevant aspects for the
coastal zones, including indicators that are expressly mentioned by the White Paper to
monitor the impact of climate change and progress on adaptation. Functions directly
supporting policy and decision making can also help mainstreaming climate change
adaptation into coastal planning and management, thus concretely contributing to the
integration with ICZM and MSP – (Score: +++);
P3 – Enhancing cooperation; main positive effects are expected by the progressive
adoption of an ecosystem-based approach. This enables to properly deal with multi-
scale analysis and to connect the local scale to the regional one, thus linking the spe-
cific interventions (local scale) to a wider plan looking at the whole coastal system (re-
gional or supra-regional scale), as necessary when dealing with climate change risks
assessment and the related definition of adaptation measures. Main effects are ex-
pected on White Paper’s actions related to the integration of adaptation into key EU
policy dealing with the coastal and marine system (IMP-MSP and the same ICZM), in
particular at the regional sea level. Enhanced cooperation at various levels can also
facilitate exchange of knowledge and best practices thus contributing to a common
understanding of climate change adaptation and to the development of European
guidelines for coastal and marine adaptations, as requested by the White Paper -
(Score: +++).
21807-REL-T006.2 page 92/124
Simplification of the use of the coastal information system
This impact intends to evaluate the effect of policy options on the operative use of the coastal
information system. A simpler and more immediate use is expressed by positive scores, while
a more complex and less intuitive use is expressed by negative scores. The general assump-
tion is that user friendliness is not much affected by the number and typologies of data includ-
ed in the CISs, while is relevantly influenced by provided CISs’ functions and by mechanisms
governing the use of the system. Indeed, the evaluation of this impact is difficult since it de-
pends on the specific implementation modalities of considered requirements (for example in
terms of user interfaces and system ergonomics) and target users (user friendliness for an ex-
pert user could not be affected at all even for very relevant modification of the system). In rela-
tion to this latter aspect, the evaluation of this impact refers to a generic non-expert user.
P1 – Improving data and information base; user-friendliness should not be very much
affected by the improvement of data and information contained in the coastal infor-
mation systems, if the same is provided with efficient tools for database management
and user-friendly interfaces for data query and search. A consistent increase in the
number and typology of data may however determine some difficulties for the users
who have to search throughout a wider database. Limited positive effects can be as-
sociated to the improvement of the availability of integrated information if this is in
readily accessible and useful forms (e.g. indicators). The net score is considered
slightly negative, although it depends very much on the specific CIS – (Score: -).
P2 – Improving and innovating functions and tools; P2 direct impacts related to user-
friendliness are different in sign and magnitude and depend on the specific policy re-
quirement. The improvement of functions supporting ICZM decision making or e-
participation are expected to facilitate the use of the systems since they will provide
tools and interfaces directly responding to non-expert users’ needs. However, user-
friendliness will be very much affected by the specific design of functions and related
user interfaces. 3D and climate change related functions are expected to complicate,
at least partially, the use of the system since they are specifically aimed at expert us-
ers. The net effect is considered slightly positive – (Score: +).
P3 – Enhancing cooperation; great part of the elements forming the P3 policy option
are likely to positively influence the user-friendliness of the system. A stronger coop-
eration between CIS developers and managers and ICZM experts can successfully
orientate the system design and progressive development towards real user needs
and facilitate user interaction with CIS’ functions and contents. Use of standardised
protocols and the development of a common ontology aims to define a common plat-
form for data exchange that is particularly helpful in the simplifying the use of the sys-
tem – (Score: ++).

21807-REL-T006.2 page 93/124
7.2.2 Direct impacts: cost implications
This part of the impact assessment focuses on the analysis of costs and efforts required for
the implementation of the three policy options, including both a qualitative and a quantitative
evaluation of related implications. The analysis is in particular structured in the following three
steps:
Qualitative evaluation of costs;
Quantitative evaluation of the effort required for the policy implementation;
Quantitative evaluation of costs.
The qualitative evaluation of costs is based on the definition of qualitative scores according to
the same methodology used to evaluate the other impacts, thus ensuring consistency and
homogeneity of the applied approach. Qualitative evaluation considers three cost categories:
development or initial cost, cost related to the maintenance and updating of the system (man-
agement cost) and learning (or training) cost. The three costs are jointly analysed to better un-
derstand mutual links among them. Development cost refers to economic and/or human re-
sources needed to design and develop a CIS function or to initiate an initiative related to a
specific policy requirement, such as for example data collection or the creation of stronger
links between the structure responsible for the CIS management and the structure responsible
for the ICZM implementation. The second cost (management costs) refers to economic and/or
human resources needed to maintain the policy option during time and bringing the necessary
updates, while learning cost refers to economic and/or human resources needed to develop
skills needed to operate the specific policy requirements.
The quantitative evaluation of the effort needed to implement each of the three policy option
was based on the appraisal of the level of implementation of the three policy options in the CIS
illustrative cases considered in the study, according to a 0-3 range, as further described in the
specific section dealing with this issue.
Cost quantification was based on the analysis of cost data gathered by Task 1 (see Table 4-4)
and the results of the previous two steps, i.e. qualitative evaluation of cost and quantitative
evaluation of the required effort. The specific adopted methodology is described in the section
dealing with this issue.
Qualitative evaluation of costs
Negative scores represent a negative effect, i.e. an increase in costs, while positive scores are
indicative of a positive effect, i.e. costs reduction.
P1 – Improving data and information base; P1 mainly focuses on the progressive im-
provement of data and information contents of CISs, likely implying the integration
within CISs of already existing data and information rather than the acquisition of new
data or the realisation of new study. Main costs are related to maintenance and updat-
ing of a wider database, while the initial costs may be more limited and expected to be
determined by the definition of a conceptual scheme for the new data integration and
the related development needs. Major costs are expected for the management and
updating of multi-time data, due to their quantity and the heterogeneity of data typolo-
21807-REL-T006.2 page 94/124
gies to be considered, and information resulting from the integrated analysis of sector
data. Learning costs should be rather limited since needed skills are already available
being mainly related to “standard” data management. Some investment could be nec-
essary to improve capacity related to the integrated analysis of data related to differ-
ent topics. The following scores were defined:
o Developing costs: -
o Maintenance and updating costs: --
o Learning costs: 0
P2 – Improving and innovating functions and tools; P2 mainly focuses on the im-
provement and innovation of functions addressing different specific needs (support to
ICZM decision making, e-participation, 3D data analysis and climate change related
assessment). Development costs are expected to be high, requiring initial economic
investments and specific skills, although these can be easily provided by specialised
software houses. Costs related to maintenance and updating of the system are ex-
pected to be still significant; specific human resources are required to keep the new
functions alive and ensure they properly work, as well as to provide support to users.
Some learning costs must be taken in consideration, since training and time could be
needed to internally develop new skills to deal with the function management. The fol-
lowing scores were defined:
o Developing costs: --
o Maintenance and updating costs: --
o Learning costs: -
P3 – Enhancing cooperation; assessment of cost related to this option is particularly
complex since it also need to take into account short and long term effects as well as
strong difference among different policy requirements. Development costs are clearly
relevant for the wider diffusion of protocols facilitating geo-spatial data sharing. Medi-
um-high investment, in particular in terms of dedicated human resources and time, is
also required to start the adoption of an ecosystem based approach and to initiate a
stronger cooperation between CIS and ICZM groups. Development costs are signifi-
cant also for the definition of a common ontology.
CISs maintenance and updating costs vary significantly. The adoption of an ecosys-
tem-based approach requires dedicated resources also in this phase and participation
to coordinating platform between CIS and ICZM groups can be time and resource
consuming as well. However, this latter requirement can have some slightly positive
effects in terms of cost reduction in the long-term since it can positively influence the
system optimisation. After the initial phase, major cost reductions are expected by the
improvement in the use of protocols facilitating geo-spatial data sharing. This can im-
ply the following advantages (and related reduction in maintenance and updating
costs): data and metadata are updated by data producers, responsibility of data and
metadata quality check is shared among different subjects (again the data producers),
reduction of management costs in particular related to the previous two issues, reduc-
tion of limitation to data accessibility related to restrictive data policies and Intellectual
Property Rights.
21807-REL-T006.2 page 95/124
Learning costs are considered more relevant than those characterising P1 and P2 op-
tions. New specific skills are required to properly approach the ecosystem-based
management and in particular to transform it in concrete modifications and integration
of the CIS contents and functions. New skills are likely required to deal with Open Ge-
ospatial Consortium standards and the definition of a common ontology, which nor-
mally are not part of public authorities’ competence. No specific learning investment
should be expected to improve coordination among CIS and ICZM groups. In relation
to above considerations, the following scores were defined:
o Developing costs: ---
o Maintenance and updating costs: --- in the short term, + in the long term
o Learning costs: --
Qualitative scores corresponding to the assessment of costs are summarised in Table 7-1.
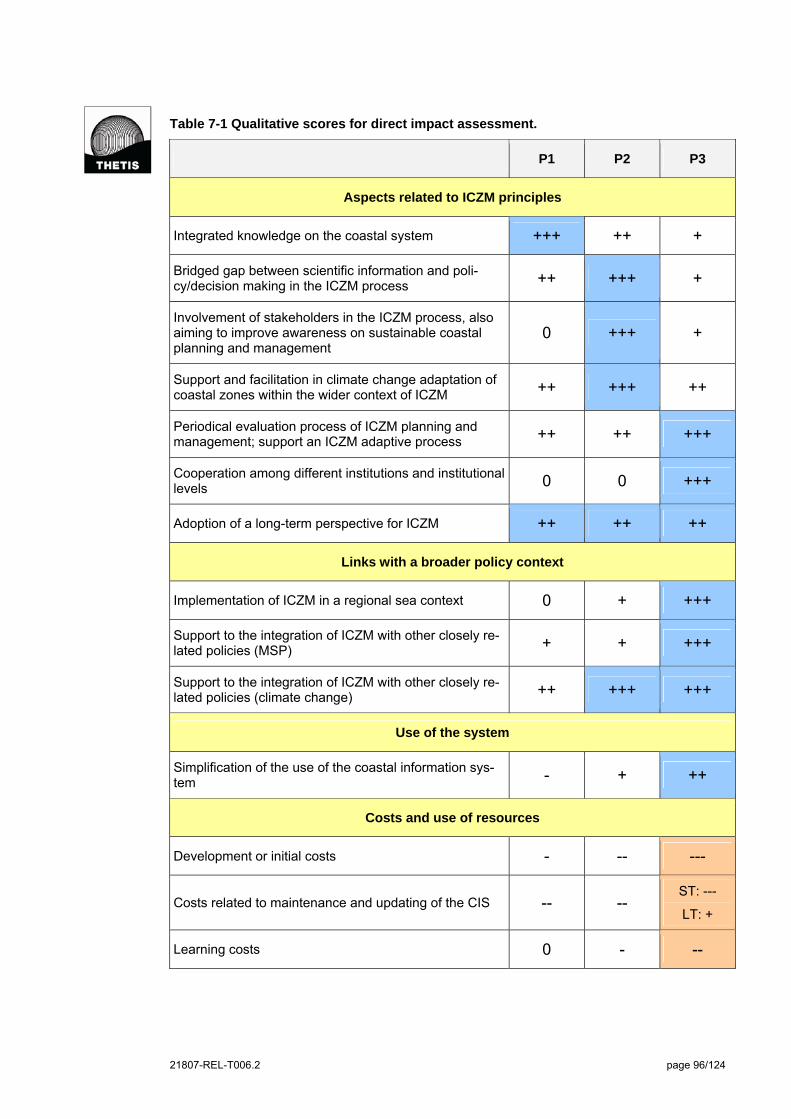
21807-REL-T006.2 page 96/124
Table 7-1 Qualitative scores for direct impact assessment.
P1 P2 P3
Aspects related to ICZM principles
Integrated knowledge on the coastal system +++ ++ +
Bridged gap between scientific information and poli-cy/decision making in the ICZM process ++ +++ +
Involvement of stakeholders in the ICZM process, also aiming to improve awareness on sustainable coastal planning and management
0 +++ +
Support and facilitation in climate change adaptation of coastal zones within the wider context of ICZM ++ +++ ++
Periodical evaluation process of ICZM planning and management; support an ICZM adaptive process ++ ++ +++
Cooperation among different institutions and institutional levels 0 0 +++
Adoption of a long-term perspective for ICZM ++ ++ ++
Links with a broader policy context
Implementation of ICZM in a regional sea context 0 + +++
Support to the integration of ICZM with other closely re-lated policies (MSP) + + +++
Support to the integration of ICZM with other closely re-lated policies (climate change) ++ +++ +++
Use of the system
Simplification of the use of the coastal information sys-tem - + ++
Costs and use of resources
Development or initial costs - -- ---
Costs related to maintenance and updating of the CIS -- -- ST: ---
LT: +
Learning costs 0 - --
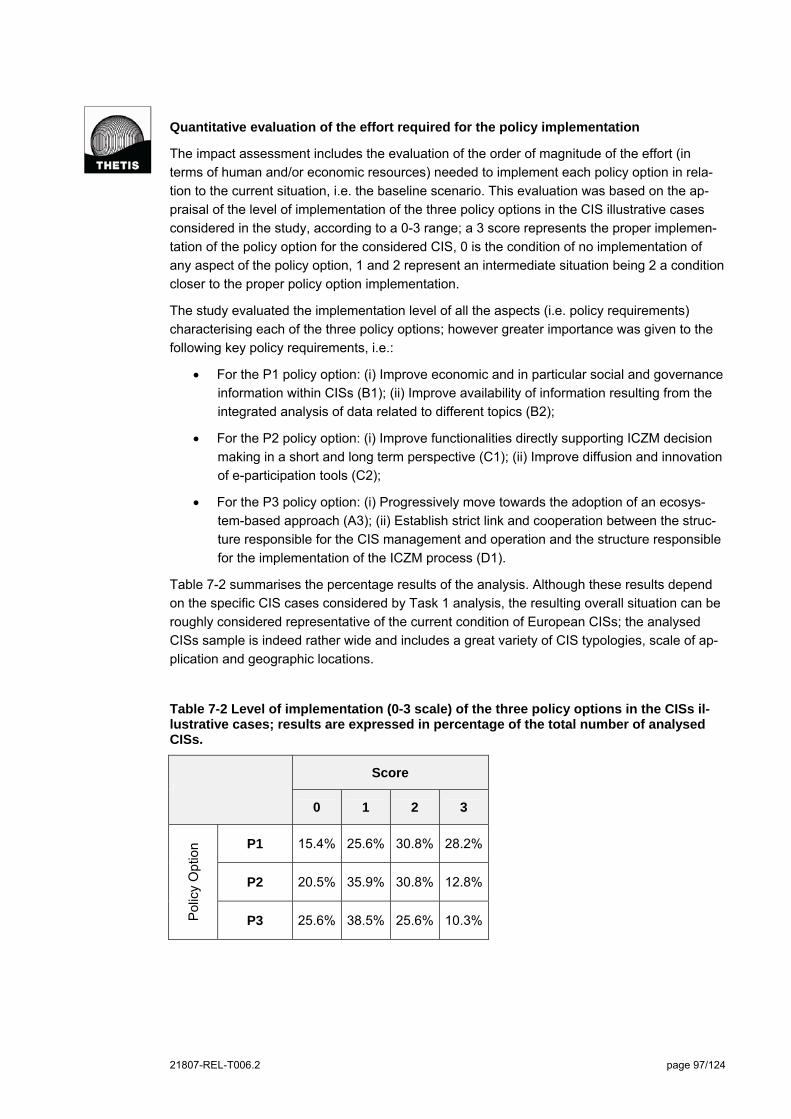
21807-REL-T006.2 page 97/124
Quantitative evaluation of the effort required for the policy implementation
The impact assessment includes the evaluation of the order of magnitude of the effort (in
terms of human and/or economic resources) needed to implement each policy option in rela-
tion to the current situation, i.e. the baseline scenario. This evaluation was based on the ap-
praisal of the level of implementation of the three policy options in the CIS illustrative cases
considered in the study, according to a 0-3 range; a 3 score represents the proper implemen-
tation of the policy option for the considered CIS, 0 is the condition of no implementation of
any aspect of the policy option, 1 and 2 represent an intermediate situation being 2 a condition
closer to the proper policy option implementation.
The study evaluated the implementation level of all the aspects (i.e. policy requirements)
characterising each of the three policy options; however greater importance was given to the
following key policy requirements, i.e.:
For the P1 policy option: (i) Improve economic and in particular social and governance
information within CISs (B1); (ii) Improve availability of information resulting from the
integrated analysis of data related to different topics (B2);
For the P2 policy option: (i) Improve functionalities directly supporting ICZM decision
making in a short and long term perspective (C1); (ii) Improve diffusion and innovation
of e-participation tools (C2);
For the P3 policy option: (i) Progressively move towards the adoption of an ecosys-
tem-based approach (A3); (ii) Establish strict link and cooperation between the struc-
ture responsible for the CIS management and operation and the structure responsible
for the implementation of the ICZM process (D1).
Table 7-2 summarises the percentage results of the analysis. Although these results depend
on the specific CIS cases considered by Task 1 analysis, the resulting overall situation can be
roughly considered representative of the current condition of European CISs; the analysed
CISs sample is indeed rather wide and includes a great variety of CIS typologies, scale of ap-
plication and geographic locations.
Table 7-2 Level of implementation (0-3 scale) of the three policy options in the CISs il-lustrative cases; results are expressed in percentage of the total number of analysed CISs.
Score
0 1 2 3
Pol
icy
Opt
ion P1 15.4% 25.6% 30.8% 28.2%
P2 20.5% 35.9% 30.8% 12.8%
P3 25.6% 38.5% 25.6% 10.3%

21807-REL-T006.2 page 98/124
The P1 policy option, focusing on the improvement of the CIS’ information base, is properly or
almost properly implemented (3 and 2 values) by about the 59% of existing coastal information
systems, while P2 and P3 are less diffuse, respectively covering approximately the 43.5% and
36% of existing CISs. The level or real proper implementation (score equal to 3) is obviously
less diffuse: 28.2% for P1, 12.8 for P2 and 10.3 for P3.
This implies that the full implementation of the P3 policy option would require an effort (to up-
grade about the 64% of existing CISs) that is 1.6 greater than the one required by the full im-
plementation of the P1 option; P3 expected effort is also greater than P2 one.
The same analysis was also geographically disaggregated to look at any differences among
the various European sea basins: Baltic Sea, North Sea, Celtic Sea, Bay of Biscay and Atlan-
tic Iberian Coast, Mediterranean Sea, Black Sea (Norwegian Sea was not considered since it
was possible to analyse only one CIS for that basin). Figure 7-2, Figure 7-3 and Figure 7-4
show the percentage results for the three policy options for each of the above basin:
P1 policy option is properly or almost properly (score 3 or 2) implemented in particular
in the Baltic Sea (86%). CISs representative of the Celtic Sea and the Bay of Biscay
and Atlantic Iberian Coast are also characterised by percentage values (respectively
71% and 67%) greater than the average value (59%). The Mediterranean (54%) and
the North Sea (60%) are characterised by a value very similar to the average one. P1
option, like the other two options, appears to be very poorly implemented at the cur-
rent state in the Black Sea CISs; however these data should be very carefully consid-
ered since for the Black Sea only three CIS cases were available and therefore ana-
lysed.
P2 policy option is better represented in the Mediterranean (54%) and the North Sea
(50%) CISs. The Baltic Sea and the Celtic Sea are characterised by smaller percent-
age values (43%), very close to the average one (43.5%). Besides the Black Sea,
which again is biased by the small number of cases that was possible to analyse, Bay
of Biscay and Atlantic Iberian Coast is the regional sea basin where P2 policy appears
to be less implemented (33%).
P3 policy is in particular implemented in the North Sea CISs (50%). The Mediterrane-
an presented a slightly better situation (38%) than the one characterising the Celtic
Sea and the Baltic Sea. Again, the Bay of Biscay and the Atlantic Iberian Coast pre-
sents the less implemented situation also for the P3 option, at least according to the
analysed CISs.

21807-REL-T006.2 page 99/124
0%
10%
20%
30%
40%
50%
60%
70%
80%
90%
100%
0 1 2 3
Option 1
Baltic Sea
North Sea
Celtic Sea
Bay of Biscay and Atlantic Iberian Coast
Mediteranean Sea
Black Sea
Figure 7-2 Current level of implementation of the P1 policy option in each European Sea Basin.
0%
10%
20%
30%
40%
50%
60%
70%
80%
90%
100%
0 1 2 3
Option 2
Baltic Sea
North Sea
Celtic Sea
Bay of Biscay and Atlantic Iberian Coast
Mediteranean Sea
Black Sea
Figure 7-3 Current level of implementation of the P2 policy option in each European Sea Basin.

21807-REL-T006.2 page 100/124
0%
10%
20%
30%
40%
50%
60%
70%
80%
90%
100%
0 1 2 3
Option 3
Baltic Sea
North Sea
Celtic Sea
Bay of Biscay and Atlantic Iberian Coast
Mediteranean Sea
Black Sea
Figure 7-4 Current level of implementation of the P3 policy option in each European Sea Basin.
Although the above described results surely depend on the specific considered CISs, some
overall conclusions can be drawn:
Baltic Sea CISs appear to already properly or almost properly meet P1 requirements,
while a significant effort is still required for the P2 (57%) and P3 (71%) policy option
implementation;
The three policy options are diffuse in about the 50% of the North Sea analysed CIS,
with a slight prevalence of P1 options (60%);
Celtic Sea CISs are characterised by a situation similar to the Baltic Sea ones; P1 re-
quirements appear to be quite well diffused (71%), while P2 and P3 implementation
still requires relevant effort;
The Bay of Biscay and Atlantic Iberian Coast CISs are also characterised by a situa-
tion similar to the Baltic Sea (and the Celtic Sea) one; however “2 and 3” percentage
values are lower (also for the P1 option) and a greater effort in their policy implemen-
tation is required;
P1 and P2 policy options appear to be properly or almost properly represented in
more than the 50% of the Mediterranean CISs. A consistent effort is still required for
the other 50%, but a greater effort is required for the implementation of the P3 policy
options (62%);
The Black Sea current situation appears to need a consistent effort to help CISs in
meeting any of the three policy options, as also confirmed by the qualitative analysis
of acquired information. It must be again stressed that it was possible to analyse only
three Black Sea CIS cases. However, it is worth mentioning some relevant on-going
21807-REL-T006.2 page 101/124
initiatives that will definitely improve the Black Sea situation, such as in particular the
development of the Black Sea Information System (BSIS). Other interesting initiatives
have been developed by the Ukrainian Scientific Centre of Ecology of the Sea
(UkrSCES) that also implemented the Odessa CIS considered by this study.
The above discussed numbers mask a great variability of specific conditions in terms of policy
option and policy requirement implementation. The general derived considerations are useful
to address the overall picture at the European or Regional Sea scale, while choice for and fu-
ture evolution of single CISs will depend on: the specific CIS current situation, the CIS’ main
objectives and context of application, the CIS typology, its main target users, etc.
Quantitative evaluation of costs
The quantitative analysis of the cost implication of the three policy options was based on the
data gathered by Task 1 of the study (see Table 4-4). Although much effort was dedicated to
the acquisition of these kind of data, cost (or human resources) figures resulted in being avail-
able for a limited number of CIS cases (i.e. 19 cases on the total of 40 considered CISs, in-
cluding in particular the twelve cases considered by the in-depth analysis). In relation to the
available data, the quantitative analysis attempted to treat separately development and man-
agement costs. Quantitative estimation of cost implications of the three policy options was
done according to the methodological approach described below.
Cost data acquired by Task 1 were initially homogenised. In particular data on human re-
sources involved in the CIS development and/or management were expressed in monetary
terms. The annual cost of one full-time equivalent person was estimated to 50000 €, repre-
senting the average yearly costs in EU as estimated by taking into account the tariffs used as
a basis for the calculation of administrative costs in the context of the Action Programme for
reducing administrative burdens in 2008-2009 (Secretariat General European Commission).
Data jointly referring to development and management costs (i.e. those related to the Dorset
Coastal Explorer, the Rio Formosa CIS or to the Cork Harbour GIS) were split in two, assum-
ing an equal distribution. Data referring to the GÉOBretagne application were not considered
since they are related to the whole project and not specifically referring to the development
and management of the CIS tool. This methodological step generated a dataset of homoge-
nised costs related to 18 illustrative CIS cases.
Afterwards, the study analysed the level of implementation of the three policy options in the 18
CIS cases for which cost data are available, according to the quantitative evaluation described
in the previous section. Cases getting a score of 3 or 2 at least for one of the three policy op-
tions (i.e. cases with a “good” level of policy option implementation) were finally selected; this
brought to discard only one CIS case that was considered to not properly implement any of the
three policy options. The final dataset therefore included 17 cases, and in particular data on
development costs for 9 cases and data on management costs for 16 cases.
The study assumes that the cost related to the development and/or management of each of
the finally selected CIS case is determined by:
Cost not depending on the three policy options implementation, i.e. cost related to the
development and management of the “baseline scenario” (for example related to the
CIS basic structure, acquisition and management of essential territorial spatial data
21807-REL-T006.2 page 102/124
and metadata, acquisition and management of environmental data and metadata,
simple Web-GIS application enabling spatial data visualisation, etc.)
Cost specifically related to the implementation of the policy options for which the spe-
cific CIS assumed a score of 3 or 2 (representing a “good” level of policy option im-
plementation). Most of the CIS cases properly implement a combination of two or
three different policy options.
Given the above consideration, development and/or management costs of each CIS case
were spit according to the following steps. The cost of the baseline scenario was assumed to
be a fixed percentage of the total cost. The literature review did not enable to find a repre-
sentative figure for this cost component11, thus the study applied a sensitivity analysis ap-
proach, considering a range of different percentage values; i.e. baseline scenario cost equal to
40%, 50% and 60% of the total costs. The remaining cost (policy options cost) was associated
to the implementation of the policy options for which the specific CIS assumed a score of 2 or
3. This cost was further split according to percentage weights defined on the basis of the quali-
tative evaluation of development and management costs (see Table 7-1), to properly take in
consideration the relative importance of expected cost implications. The following cases were
possible:
The CIS gives “good” implementation (score of 3 or 2) to a single policy option (e.g.
P1); in this case the policy options cost was totally attributed to this specific policy op-
tion (e.g. P1);
The CIS gives “good” implementation (score of 3 or 2) to two policy options. The policy
options cost was attributed to the two specific policy options according to the following
percentage weights:
o In case P1 and P2 policy options are properly implemented: (i) 0.33 (P1) and
0.66 (P2) for the development costs; (i) 0.50 (P1) and 0.50 (P2) for the man-
agement costs;
o In case P1 and P3 policy options are properly implemented: (i) 0.25 (P1) and
0.75 (P3) for the development costs; (i) 0.40 (P1) and 0.60 (P3) for the man-
agement costs;
o In case P2 and P3 policy options are properly implemented: (i) 0.40 (P2) and
0.60 (P3) for the development costs; (i) 0.40 (P2) and 0.60 (P3) for the man-
agement costs;
The CIS gives “good” implementation (score of 3 or 2) to all the three policy options.
The policy options cost was attributed to three policy options according to the follow-
ing percentage weights: (i) 0.17 (P1), 0.33 (P2), 0.50 (P3) for the development costs;
(ii) 0.29 (P1), 0.29 (P2), 0.42 (P3) for the management costs.
For each of the considered CIS cases, the application of the above procedure enabled to de-
rive the development and/or management costs associated to the proper implementation of
the three policy options. Finally, costs were averaged. Table 7-3, Table 7-4 and Table 7-5 il-
lustrate the obtained estimations of development and yearly management costs associated to
11 The impact assessment of the “Proposal for a Directive of the European Parliament and the Council establishing an infrastructure for spatial information in the Community (INSPIRE)” – SEC(2004)980 provides some average figures for information systems at the sub-national and national level. However, these specifically refer to the implementation of the INSPIRE requirements, that are only a part of the “baseline scenario” considered by this study.
21807-REL-T006.2 page 103/124
the three policy options implementation. In particular for the two cost categories (development
and maintenance) the tables include the following data (representing additional costs respect
to the baseline situation, thus specifically referring to the policy options implementations.):
Average cost of the policy option implementation for a single CIS:
o Average development costs for a single CIS related to the policy option im-
plementation varies (depending on assumption on the baseline scenario
costs) between: 20300 and 30500 € for P1 option; 23100 and 34700 € for P2
option; 52600 and 78900 € for P3 option;
o Average yearly management costs for as single CIS related to the policy op-
tion implementation varies (depending on assumption on the baseline scenar-
io costs) between: 39600 and 59400 € for P1 option; 38500 and 57800 € for
P2; 65200 and 97900 € for P3. Yearly management costs are greater than
development costs.
Standard deviation related to the above average value. As highlighted by the high
standard deviation values, cost data are characterised by relevant heterogeneity. This
is related to the heterogeneity of analysed CIS cases that significantly differ in terms
of scale of application, scope, typology and concrete use. The cost of policy option
implementation for a single CIS can therefore significantly differ from the derived av-
erage values, depending on the above identified factors.
Number of cases considered to derive the average and standard deviation values.
Due to the adopted methodology this number is different for the three policy options;
Average costs were then used to derive the estimations of the overall cost of the policy options
implementation in the European Union. The total number of coastal information systems in EU
is not known or easily inferable. Within the study, this number was defined considering the fol-
lowing assumptions:
Each coastal Member States develops its coastal information system; the total num-
ber of national CISs is therefore equal to 22;
Each EU coastal costal region develops its coastal information system, the total num-
ber of regional (i.e. sub-national) CISs is therefore equal to 44612;
The number of local coastal information systems in Europe is similar to the assumed
number of regional CISs (i.e. 446). This hypothesis is based on the assumption that
each European coastal region includes on average a specific costal system (e.g. del-
ta, coastal lagoon, estuary, marine protected area, etc.) deserving particular attention
and thus needing a specific CIS;
The total number of intra-national and international cooperative CISs is negligible in
relation to the estimation of an overall cost figure for the European Union.
12 An EU coastal region is a statistical region defined at NUTS3 level, responding to one of the following criteria: (i) Region with a sea border (372 regions correspond to this criterion); (ii) Region with more than half of its population within 50 km from the sea (73 regions correspond to this criterion); Hamburg, this German region, which does not cor-respond to the definition criteria, has been added to the EU coastal regions list, taking into account its strong maritime influence. According to this definition 446 EU coastal regions have been identified. These regions belong to the 22 Member States with a coastline (source: Eurostat Statistic in Focus 38/2010; http://epp.eurostat.ec.europa.eu/cache/ITY_OFFPUB/KS-SF-10-038/EN/KS-SF-10-038-EN.PDF; last access: 26.08.2011).

21807-REL-T006.2 page 104/124
On the basis of the above assumptions the total number of coastal information sys-
tems in the European Union is assumed to 914.
The analysis of the level of implementation of the three policy options (see previous section
“Quantitative evaluation of the effort required for the policy implementation”) showed that a
certain percentage of the existing coastal information systems already properly match (score
3) the requirements of such policy options; i.e. 28.2% for P1, 12.8% for P2 and 10.3% for P3.
These percentage values were then used to estimate the total number of CISs that presently
do not properly implement the three policy options in the EU; i.e. 656 for P1, 797 for P2 and
820 for P3. Finally the overall costs of the policy options implementation in the EU were esti-
mated by multiplying these latter numbers for the computed average cost. This procedure en-
abled to avoid the percentage of CISs already conforming to P1, P2 and P3 to be included in
the total cost estimation.
Considering the above assumptions, the following overall cost estimations (representing addi-
tional costs respect to the baseline situation, thus specifically referring to the policy options
implementations) for the European Union were obtained (see Table 7-6):
P1 policy option: 13.3 – 20.0 million € for the development cost and 26.0 – 38.9 million
€ for yearly management costs;
P2 policy option: 18.4 – 27.6 million € for the development cost and 30.7 – 46.1 million
€ for yearly management costs;
P3 policy option: 43.1 – 64.7 million € for the development cost and 53.5 – 80.2 million
€ for yearly management costs;
It is finally important to stress that the obtained cost estimations significantly depend on a se-
ries of important assumptions that the study necessarily had to include in order to deal with: (i)
the heterogeneous nature of existing coastal information systems in terms of application scale,
scope, use and typology, (ii) the fragmented and heterogeneous cost data on existing CISs
that were possible to acquire within the study; (iii) the sub-division of cost data in components
representing the baseline scenario and the three policy options, (iv) the estimation of the total
number of coastal information systems (at the local, sub-national or regional and national lev-
el) in the European Union.

21807-REL-T006.2 page 105/124
Table 7-3 Estimation of the average (development and management) costs for a single CIS related to the policy options implementation – assumption on cost of the baseline situation = 40% of the total cost (all costs are expressed in thousands Euros).
Cost of the baseline scenario: 40% Option P1 Option P2 Option P3
Development costs
Mean 30.5 34.7 78.9
Standard deviation 28.3 25.4 87.1
Number of cases 9 7 6
Management costs (yearly)
Mean 59.4 57.8 97.9
Standard deviation 33.0 32.9 49.3
Number of cases 13 13 10
Table 7-4 Estimation of the average (development and management) costs for a single CIS related to the policy options implementation – assumption on cost of the baseline situation = 50% of the total cost (all costs are expressed in thousands Euros).
Cost of the baseline scenario: 50% Option P1 Option P2 Option P3
Development costs
Mean 25.4 28.9 65.7
Standard deviation 23.6 21.1 72.6
Number of cases 9 7 6
Management costs (yearly)
Mean 49.5 48.2 81.6
Standard deviation 27.5 27.5 41.0
Number of cases 13 13 10
Table 7-5 Estimation of the average (development and management) costs for a single CIS related to the policy options implementation -– assumption on cost of the baseline situation = 60% of the total cost (all costs are expressed in thousands Euros).
Cost of the baseline scenario: 60% Option P1 Option P2 Option P3
Development costs
Mean 20.3 23.1 52.6
Standard deviation 18.9 16.9 58.1
Number of cases 9 7 6
Management costs (yearly)
Mean 39.6 38.5 65.2
Standard deviation 22.0 22.0 32.8
Number of cases 13 13 10
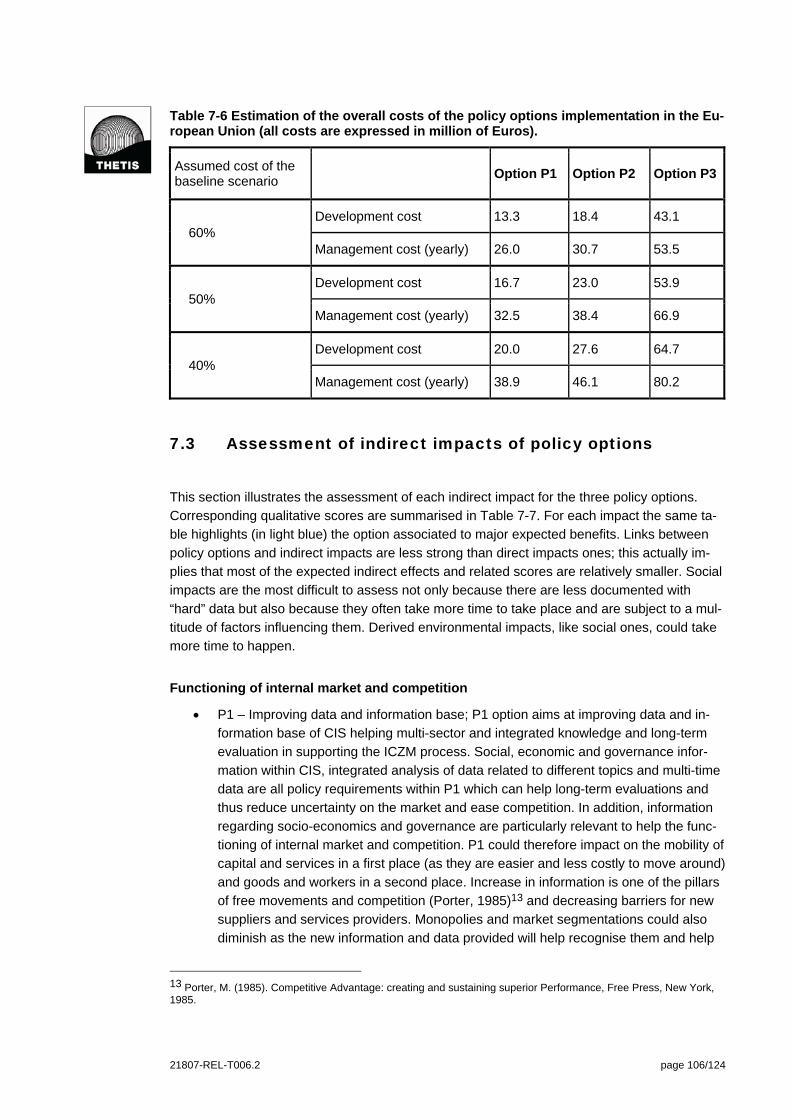
21807-REL-T006.2 page 106/124
Table 7-6 Estimation of the overall costs of the policy options implementation in the Eu-ropean Union (all costs are expressed in million of Euros).
Assumed cost of the baseline scenario
Option P1 Option P2 Option P3
60% Development cost 13.3 18.4 43.1
Management cost (yearly) 26.0 30.7 53.5
50% Development cost 16.7 23.0 53.9
Management cost (yearly) 32.5 38.4 66.9
40% Development cost 20.0 27.6 64.7
Management cost (yearly) 38.9 46.1 80.2
7.3 Assessment of indirect impacts of policy options
This section illustrates the assessment of each indirect impact for the three policy options.
Corresponding qualitative scores are summarised in Table 7-7. For each impact the same ta-
ble highlights (in light blue) the option associated to major expected benefits. Links between
policy options and indirect impacts are less strong than direct impacts ones; this actually im-
plies that most of the expected indirect effects and related scores are relatively smaller. Social
impacts are the most difficult to assess not only because there are less documented with
“hard” data but also because they often take more time to take place and are subject to a mul-
titude of factors influencing them. Derived environmental impacts, like social ones, could take
more time to happen.
Functioning of internal market and competition
P1 – Improving data and information base; P1 option aims at improving data and in-
formation base of CIS helping multi-sector and integrated knowledge and long-term
evaluation in supporting the ICZM process. Social, economic and governance infor-
mation within CIS, integrated analysis of data related to different topics and multi-time
data are all policy requirements within P1 which can help long-term evaluations and
thus reduce uncertainty on the market and ease competition. In addition, information
regarding socio-economics and governance are particularly relevant to help the func-
tioning of internal market and competition. P1 could therefore impact on the mobility of
capital and services in a first place (as they are easier and less costly to move around)
and goods and workers in a second place. Increase in information is one of the pillars
of free movements and competition (Porter, 1985)13 and decreasing barriers for new
suppliers and services providers. Monopolies and market segmentations could also
diminish as the new information and data provided will help recognise them and help
13 Porter, M. (1985). Competitive Advantage: creating and sustaining superior Performance, Free Press, New York, 1985.

21807-REL-T006.2 page 107/124
new comers (outsiders) to enter the market by reducing the comparative advantage
that the insider had by being in the market for longer and having more information -
(Score: ++).
P2 – Improving and innovating functions and tools; P2 effects on this indirect impacts
is expected to be less relevant that P1 one. Functions supporting ICZM decision mak-
ing can partially help people and goods to travel, by reducing uncertainty and risks
and helping planning of their decision. E-participation tools aims to increase participa-
tion and van have positive effect on free exchange of information about elements that
can ease coastal management. This could increase competition by providing free in-
formation to the market, therefore helping new comers to enter the market and dimin-
ishing the comparative advantage of insiders – (Score: +).
P3 – Enhancing cooperation; the adoption of an ecosystem-based approach generally
implies the increase of the CIS’ area of application. This can also increase impacts on
internal market and competition, therefore determining potentially decreased prices
due to more transparency. P3 also implies a better cooperation both for institutions
and for data producers and managers, this better cooperation means that more and
better data can be provided easily to the market thus helping its functioning and com-
petition. This policy option is also more ambitious than the two others and should have
a stronger impact on the internal market and competition – (Score: ++).
Competitiveness, trade and investment flows
P1 – Improving data and information base; in theory P1 policy option should help EU
firms in accessing economic, social and governance data useful to increase their
competitiveness and their productivity, at least partially. No effect on trade barriers
can be easily detected. Cross-border flows should be facilitated by the availability of
multi-time and cross-sector data. In the scientific literature, there has been an in-
crease in the attention paid to the strategic potential of information systems and a new
willingness to accept the possibility that information systems can be the source of stra-
tegic gains. This belief is reflected in a host of publications, from the popular press to
respected journals. Much of this has been supported by a set of studies, principally in-
volving marketing and distribution, financial services, and the airlines14 - (Score: +)
P2 – Improving and innovating functions and tools; improving and innovating function-
alities could partially help the competitive position of EU firms by providing them with
new tools better supporting coastal planning and decreasing related uncertainty. Im-
provement and innovation of e-participation tools and functionalities is also related to
competitiveness and might have an impact on productivity, although this is expected
to be limited - (Score: +).
P3 – Enhancing cooperation; the ecosystem based approach should be of crucial im-
portance for helping cross-border investment flows (as this approach is likely to cover
several regions/countries). The development of a common ontology for coastal and
marine information should help firms to access information and data more easily. An
easier access to data and information should also fostered by the improvement in the
14 Information & Management, Volume 11, Issue 3, October 1986, Pages 131-136 , Information systems for sustain-able competitive advantage, Eric K. Clemons, Department of Decision Sciences, The Wharton School, University of Pennsylvania, 1300 Steinberg Hall - Dietrich Hall, Philadelphia, PA 19104-6366, USA;
21807-REL-T006.2 page 108/124
use of protocols facilitating geospatial data sharing and the related cooperation among
data providers – data managers. P3 option also includes the creation of cooperative
mechanisms among different subjects involved in the CIS implementation and man-
agement and in ICZM process. Enhanced cooperation could increase investment
flows in the region both because the cooperation reflects a better image of efficiency
of the system in general, but also in terms of stability and governance - (Score: ++).
Administrative Burden
This indirect impact refers to benefits and costs induced by the policy options for the public
administration in general. It does not specifically address CIS’ development and management
costs as determined by the implementation of the policy requirements forming the policy op-
tions; these are actually considered in the list of direct impacts.
P1 – Improving data and information base; public administrations could be able to
benefit from the policy requirements increasing the information on economic, social
and governance; but it is likely that they will have to provide part of the information as
well, implying thus time and labour force to do this. No restructuring should be neces-
sary for this option but a minimum cost will be sustained in terms of workers being in-
volved in providing the contents. As a net effect positive and negative impact might
balance, although it is rather difficult to really predict the prevailing effect – (Score: 0);
P2 – Improving and innovating functions and tools; public administrations just like pri-
vate firms can benefit from additional decision making tools and e-participation tools.
Direct costs (development, maintenance and training costs) could be relatively high in
the short run for public administrations directly involved in the CIS implementation, or
more in general in the ICZM process. Administrations could support costs (mainly
learning costs) in the short term. It is very likely that in the long run, these costs will
decrease or even disappear and only net benefits will remain. The indirect benefits for
public administrations in general (and not only the ones dealing with CIS and ICZM)
should be strong because this policy option is aimed at providing decision making
tools in particular supporting public administration - (Score: short term - ; long term
++).
P3 – Enhancing cooperation; establishing a link or increase cooperation between CIS
management and operation responsible structure and implementation structure of
ICZM could also be a cost for public administration involved in the process. This cost
will be higher with the requirement to adopt an ecosystem-based approach because of
the need for new skills, contacts and management changes. Assuming that the use of
protocols is mostly dealt with by public administrations this policy option could end up
being the more costly in particular in the short-term. In the long-term the benefits of
having a working cooperation system in the field of CIS (and relative link to ICZM) to-
gether with adopting an ecosystem based approach will outcome the initial costs pro-
ducing evident benefits for the public administration – (Score: short term -- ; long term
++).
21807-REL-T006.2 page 109/124
Innovation and research
Reduced operational costs and greater competition stimulate research. Better access to a
comprehensive system of information and data also act in stimulating innovation and research.
In the same way that public authorities and the private sector can benefit from additional data
and increased availability of information, the research community can improve productivity
through reduced operating costs for finding and assembling data. This indirect impact is one of
the most evident and straightforward coming from the three policy options as defined. As a
basis, the impact will be positive for all policy options.
P1 – Improving data and information base; providing more information can help re-
search and thus innovation. This is particularly true when, such in the case of the P1
policy option, new data attempts to fill existing gaps (social, economic and governance
information or multi-time geospatial data). Both industrial and academic research can
benefit from it and resource efficiency as well as productivity can benefit from it too -
(Score: ++);
P2 – Improving and innovating functions and tools; - P2 option aims to innovate CIS’
functions supporting integrated decision making and e-participation, as well as specific
tools addressing 3D analysis and climate change vulnerability assessment. These
tools are not basically oriented to researchers since they rather attempt to improve
support to decision making. However a significant effect on this issue is expected in
terms of demand to the research community for innovative solutions to develop the
required tools. E-participation tools can facilitate communication between research
and policy-decision makers, enabling to better clarify ICZM needs and orientate re-
search activities as well as to argue for more funding for research on key ICZM issues
– (Score: ++).
P3 – Enhancing cooperation; this policy options is expected to have lower effects on
research and innovation. Some benefits could be triggered by a possible demand of
innovative solutions for geo-spatial data sharing. Improved cooperation, also at the
transnational level as required by the adoption of the ecosystem-based approach,
could help in focusing the right demands to the research community to better support
ICZM – (Score: +).
Employment and labour market
Effects of policy options on the employment and the labour market are important to take in
consideration; some professions could have a higher offer and the policy options will require
new training. However, if compared to the other indirect impacts and the comprehensive la-
bour market, the magnitude of the effects on this issue is expected to be smaller. In particular
in the long run, impacts are probably negligible.
Some job opportunities, in particular in terms of consulting services, could be created by the
three policy requirements common to all the policy options. Consulting services could be re-
quired to train and/or advise the public administration workers to deal with end-user involve-
ment in the system design and networking. Some specific expertise could be required to de-
velop multi-user systems. So this could create additional work in the short term. Knowing the
extent of the additional workload and if the labour market could be affected significantly is im-
possible but a rough estimate tells us that the whole labour market should not be modified.

21807-REL-T006.2 page 110/124
P1 – Improving data and information base; improving availability of information and
data will probably require additional workload in the implementation and maintenance
phase of P1. Employment or more accurately specific skills professionals will benefit
from additional job offer in the marketing particular in the short term; this increase will
not be sustainable in the long term as the number of workers to maintain the infor-
mation updated and relevant will likely decrease and will be less than in the initial
phase. The expected result is relatively small – (Score: short term + ; long term 0).
P2 – Improving and innovating functions and tools; in addition to the short term re-
quirement of specific skilled workers in the system design phase common to all policy
options, the development of new functionalities and tools will require training of pre-
sent workers and/or employing highly skilled workers (in particular to design and de-
velop the new functions and tools). This will twist the labour market towards an in-
crease in job offer in particular for professions with high skills and young workers. This
impact will not modify drastically the labour market but only a segment of it. Again
benefit effects will be more consistent in the short term and likely negligible in the
long-term – (Score: short term + ; long term 0).
P3 – Enhancing cooperation; P3 option is probably the one with most impact on la-
bour market in the short term; however these are also the most complex to be envis-
aged. Again workers implied directly in improving the mechanisms linked to the adop-
tion on an ecosystem based approach, in developing a common ontology or in apply-
ing data sharing protocols will be solicited and jobs could be created in the short term,
less in the long term. The higher level of ambition of this policy option could require
more labour force involvement; the short term effect on the labour market is expected
to be stronger than for the other two policy options. Mechanisms regarding coopera-
tion between structures implied in management and implementation could lead to
downsizing of both structures in the name of efficiency (like when two organisations
are merging) but could also require more personal to deal with the cooperation itself.
In any case this is unlikely to modify the labour market significantly - (Score: short
term ++ ; long term 0).
Better living conditions in terms of effects on social protection, health and safety, edu-
cation system
In general the indirect impact on living conditions in terms of social protection, health and edu-
cation are important and relevant but also characterised by the long term aspects. The impact
short term is mostly negligible.
P1 – Improving data and information base; CIS users will definitely benefit from a bet-
ter set of information and will be able to compare the provision of services (provided
that social and governance data are included in CIS). Universities and experts will
greatly benefit from it (see Research and Innovation impacts), whereas social or
health services organisation or financing should not be modified significantly. On the
other hand, public health could benefit from additional information on coastal zones.
Indeed, human health is affected by climate-related events such as permanent inun-
dation and flooding, degraded water quality, storms, etc. Information on those events
should improve public health management. The impact will be mainly long term and
relatively small as the availability of new information is not enough to provoke a strong
21807-REL-T006.2 page 111/124
impact on living conditions; indeed many other factors can influence these conditions -
(Score: +).
P2 – Improving and innovating functions and tools; improving the diffusion and innova-
tion of e-participating tools can help access for all to information and tools. Quality of
services in general could be improved but also motivate training and cross-border par-
ticipation. Public health could also benefit from functionalities regarding climate
change assessment and adaptation planning, included in P2 policy option. Expected
impacts are partially greater than P1 ones – (Score: ++).
P3 – Enhancing cooperation; ecosystem based approach could have again one of the
most significant impact on improving social protection safety and education by provid-
ing a set of information which relies to a geographic area which is usually not consid-
ered (or at least data need to be aggregated and therefore might lose their richness).
More importantly, the cooperation between data provider and data managers will im-
pact on planning in the sectors of social protection, public health and education. In this
context, products and services related to coastal hazards could be provided in a better
way – (Score: ++).
Integration of risk in coastal planning and management, leading to less coastal vulner-
ability and higher resilience/adaptation
All policy options are likely to contribute to increase knowledge, understanding and analysis of
coastal risks, thus contributing to its integration into coastal planning and management and in
the long-term to an increase in coastal resilience and adaptation.
P1 – Improving data and information base; increase in the role of scientifically-based
approach, multi-sector and integrated (holistic) knowledge and long-term evaluation in
supporting the ICZM process should have a relevant impact on awareness of coastal
risk and vulnerability. Additional data on climate change, governance and socio-
economic contexts are the essential basis to actually be able to realise complete
coastal risk management, understand true risks for the economy and the population
and thus promote integration of risk, vulnerability, resilience and adaption concepts
and related strategies in coastal planning and management. Multi-time data can fur-
ther help in correctly addressing this issue, since they enable to analyses past (natural
and technological) risk events and evaluate future scenarios characterised by different
occurrence probabilities and impacts (Score: ++).
P2 – Improving and innovating functions and tools; to better support ICZM decision
makers and coastal planners and managers, as well as to increase stakeholders’ in-
volvement and participation in the ICZM process are of the utmost importance for un-
derstanding and increasing awareness on coastal risk and vulnerability, thus promot-
ing their integration within the planning and management process. Decision support
tools and functions can be specifically designed and developed in order to deal with
coastal risk problems, in particular to analyse available information to generate coastal
risk and vulnerability maps for the past, current and future situation or to provide pos-
sible alternative options for coastal adaptation – (Score: +++)
P3 – Enhancing cooperation; to increase cooperation among different subjects in-
volved in the CISs implementation and management and more in general in ICZM
21807-REL-T006.2 page 112/124
process could have a discreet benefit on integration of coastal risk in coastal planning
and management; this can be particularly evident for the progressive adoption of an
ecosystem-based approach that enables to set the right context to properly deal with
the spatial scale relevant for coastal risk management - (Score: ++)
Biodiversity, flora, fauna and landscapes
This indirect impact aims to evaluate if defined policy options may have some positive (or
negative) effect on the sustainable management of natural coastal habitats, including related
flora and fauna biodiversity and landscape values.
P1 – Improving data and information base; effects of P1 policy option are rather lim-
ited and mainly related to the increase in the integrated knowledge on the coastal sys-
tem. A better understanding of coastal processes, in particular due to higher availabil-
ity of multi-time data, and increased availability of socio-economic data may support
understanding of pressures on habitats and biodiversity and the definition of proper
protection measures. Promotion of integrated analysis can provide further understand-
ing of pressures and conflicts induced by human uses on natural systems (Score: +);
P2 – Improving and innovating functions and tools; P2 assessment is similar to P1
one. Limited benefits are expected as consequences of improved decision making,
coastal planning and coastal management capacities induced by new functions. E-
participation tools can provide relevant feedbacks on the status of coastal natural sys-
tems (for example through geo-tagging functions) and the opportunity to contribute to
the share definition of sustainable management options for natural systems (Score: +)
P3 – Enhancing cooperation; P3 option is the one likely having more relevant effects
on this indirect impact. This is mainly due to the progressive adoption of an ecosys-
tem-based approach, which is very important in properly addressing sustainable man-
agement of coastal ecosystem. Ecosystem-based definition of the CIS and ICZM geo-
graphic area is essential in correctly dealing with the continuum land – coast – marine
systems. It can also imply transnational cooperation in addressing protection and sus-
tainable management of large natural ecosystems - (Score: ++).
Sustainable use of coastal space (or sustainable land use planning)
Results of the assessment of this indirect impact are rather similar to those related to the pre-
vious ones. All the three policy options are likely to positively affect the sustainable use of the
coastal space.
P1 – Improving data and information base; effects of P1 policy option are rather lim-
ited and mainly related to the increase in the integrated knowledge on the coastal sys-
tem. Increased availability of socio-economic and governance data may support im-
proved understanding of current uses of the coastal and marine space, related con-
flicts and already adopted planning and management measures. Promotion of inte-
grated analysis can provide further understanding of pressures and conflicts induced
by human uses on the coastal space, as well as generate summary maps on coastal
uses and related conflicting or synergic overlaps. All these issues can improve inte-
grated planning of the coastal space thus contributing to its sustainable management
and use - (Score: +);

21807-REL-T006.2 page 113/124
P2 – Improving and innovating functions and tools; to better support ICZM decision
makers and coastal planners and managers through customised tools, as well as to
increase stakeholders’ involvement and participation in the ICZM process are of the
utmost importance to support the sustainable management and use of the coastal
space. Decision support tools and functions can be specifically designed and devel-
oped in order to deal sustainable coastal planning, while increase participation in the
ICZM process can facilitate resolution of conflicts among different uses and consen-
sus building – (Score: ++);
P3 – Enhancing cooperation; P3 option is the one likely having more relevant effects
on this indirect impact. This is mainly due to the progressive adoption of an ecosys-
tem-based approach, which is very important in properly addressing sustainable man-
agement of the coastal space, also in relation to the closely related drainage basin
and marine area. Greater cooperation among all different levels involved in the CIS
management and operation and/or in the whole ICZM process is also essential in
promoting the sustainable use of coastal resource, including in particular the coastal
space. The increased use of data sharing protocols can further underpin sustainable
land use planning through a higher availability of data – (Score: +++).
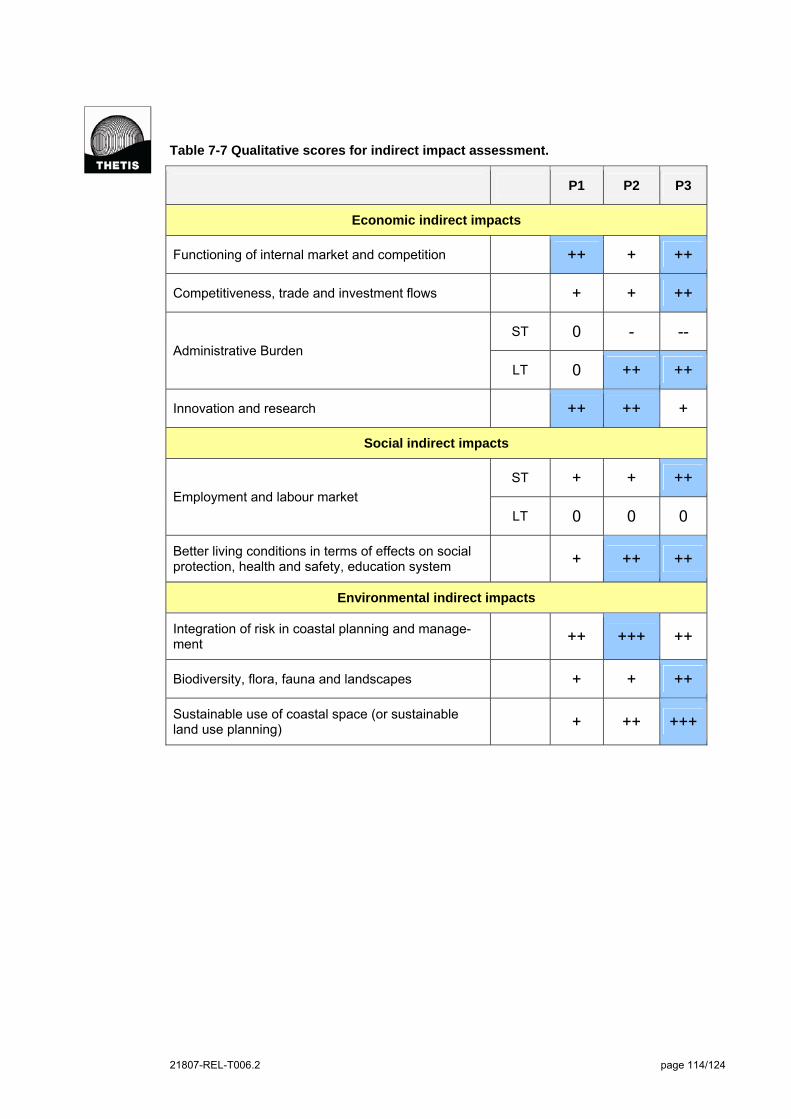
21807-REL-T006.2 page 114/124
Table 7-7 Qualitative scores for indirect impact assessment.
P1 P2 P3
Economic indirect impacts
Functioning of internal market and competition ++ + ++
Competitiveness, trade and investment flows + + ++
Administrative Burden
ST 0 - --
LT 0 ++ ++
Innovation and research ++ ++ +
Social indirect impacts
Employment and labour market
ST + + ++
LT 0 0 0
Better living conditions in terms of effects on social protection, health and safety, education system
+ ++ ++
Environmental indirect impacts
Integration of risk in coastal planning and manage-ment
++ +++ ++
Biodiversity, flora, fauna and landscapes + + ++
Sustainable use of coastal space (or sustainable land use planning)
+ ++ +++
21807-REL-T006.2 page 115/124
7.4 Policy options comparison
Table 7-9 summarises the main expected benefits and costs for the three defined policy op-
tions. In particular the comparative tables includes for each policy option:
Main positive direct effects; i.e. those with a score of +++. For the direct impact “Sim-
plification of the use of the coastal information system” a score of ++ was considered
being this the maximum value given to any of the three policy option;
Main negative direct impacts, i.e. costs with a score of -- or ----;
Main positive indirect effects, i.e. those with a score of ++ or +++;
Main negative indirect effects, i.e. those with a score of -- or ---.
Table and histograms included in section 7.2 are also very useful to compare the three policy
options.
P3 option is the one expected to generate the greatest direct benefits, this contributing more
significantly to further improve CISs support to the ICZM process. Enhanced cooperation (P3
option) within the management and use of the coastal information system can produce rele-
vant positive effects in relation to: support to the ICZM adaptive process, cooperation among
different institutions and institutional levels, adoption of a long-term perspective for ICZM, im-
plementation of ICZM in a regional sea context, support to the integration of ICZM with other
closely related policies (MSP and climate change). Significant direct benefits are also ex-
pected for the P2 policy option, in particular in relation to: bridged gap between scientific in-
formation and policy/decision making in the ICZM process, involvement of stakeholders in the
ICZM process, support and facilitation in climate change adaptation of coastal zones within the
wider context of ICZM, adoption of a long-term perspective for ICZM, support to the integration
of ICZM with other closely related policies (climate change). Finally, according to the analysis
P1 option is the one related to relatively more limited benefits, in particular in relation to: inte-
grated knowledge on the coastal system, adoption of a long-term perspective for ICZM. In re-
lation to the direct benefits the following rough schematisation can be proposed: P3 ≥ P2 > P1.
P3 is also the option likely producing more positive effects (i.e. simplification) in terms of op-
erative use of the coastal information system. Positive effects are also expected for the P2
option, while P1 could determine some increase, although slight, difficulties for the users.
The analysis of indirect impacts confirmed that P3 is the option likely determining the great-
est benefits on key economic, environmental and social aspects. P2 main positive effects are
likely on: innovation and research, better living conditions and integration of risk in coastal
planning and management. Relevant indirect positive effects of P1 policy are related to inno-
vation and research and functioning of internal market and competition. The administrative
burden associated to P2 and P3 are expected to increase in the short term, while should be
positively affected in the long-term; P1 option should not have significant (positive or negative)
effects on administrative burdens. In relation to the indirect impacts the following rough sche-
matisation can be proposed: P3 > P2 > P1.

21807-REL-T006.2 page 116/124
Although P3 is the option expected to generate more consistent direct and indirect impacts, it
is also the one for which implementation would requires a greater economic and human re-
source effort. All the three typology of costs (development or initial, maintenance and updat-
ing, and leaning costs) are expected to be higher than the one likely characterising the other
two policy options. After the initial phase, cost reductions are expected by the improvement in
the use of protocols facilitating geo-spatial data sharing; thus in the long term management
cost could decrease. P2 costs are also expected to be relevant, although minor of P3 ones,
and in particular related to the development and maintenance of the new CIS functions. P1 op-
tion should be associated to relatively lower development costs; costs will be mainly related to
the maintenance and updating of a wider CIS database, in particular in relation to the im-
provement of economic, social and governance geo-spatial data. Quantitative assessment of
costs produced the following rough estimations (all estimations represent additional costs to
the baseline scenario) related to the implementation of the three policy options in the Europe-
an Union:
P1 policy option: 13.3 – 20.0 million € for the development cost and 26.0 – 38.9 million
€ for yearly management costs;
P2 policy option: 18.4 – 27.6 million € for the development cost and 30.7 – 46.1 million
€ for yearly management costs;
P3 policy option: 43.1 – 64.7 million € for the development cost and 53.5 – 80.2 million
€ for yearly management costs;
The quantitative evaluation of the effort needed for the policy option implementation confirmed
the above described situation. P3 is the option currently less developed, thus requiring a
greater effort for a proper implementation at the European level, corresponding to about 64%
of existing CISs. This effort is significantly greater than the one required by the full implemen-
tation of the P1 option (corresponding to 42% of existing CISs) and greater than the P2 one
(corresponding to 56% of existing CISs).
Significant differences exist among the various European regions in relation to the current
implementation level of the three policy options and the related effort needed for their further
improvement. The analysis showed the greatest challenges in general are related to: (i) the P3
option implementation in all the regions with relatively minor relevance for the North Sea and
(ii) the Black Sea region for all the three policy options, where however there are significant
on-going initiatives. Compared to P3, P2 option is better represented in the current CISs, alt-
hough a relevant effort is still required, in particular for the Baltic Sea, the Celtic Sea and the
Bay of Biscay and Atlantic Iberian Coast, at least according to the analysis performed in this
study. Finally main challenges related to P1 implementation are expected to be in general
lower than P3 and P2 ones, being slightly more consistent for the Mediterranean and the
North Sea.
It is finally important to assess and compare policy options in terms of who’s mainly affected
by expected benefits. The analysis considered the following subject categories: international
institutions and bodies, public administrations involved in ICZM in terms of decision making
and coastal planning and management, private companies, research institutions and civil so-
ciety. Table 7-8 summaries the effects of each policy option on the considered target groups.
International institutions and bodies (e.g. Regional Sea Commission) are expected to be in
particular affected by the P3 policy option. Enhanced cooperation in general, and in particular
the progressive adoption of an ecosystem based approach within CISs, can significantly con-
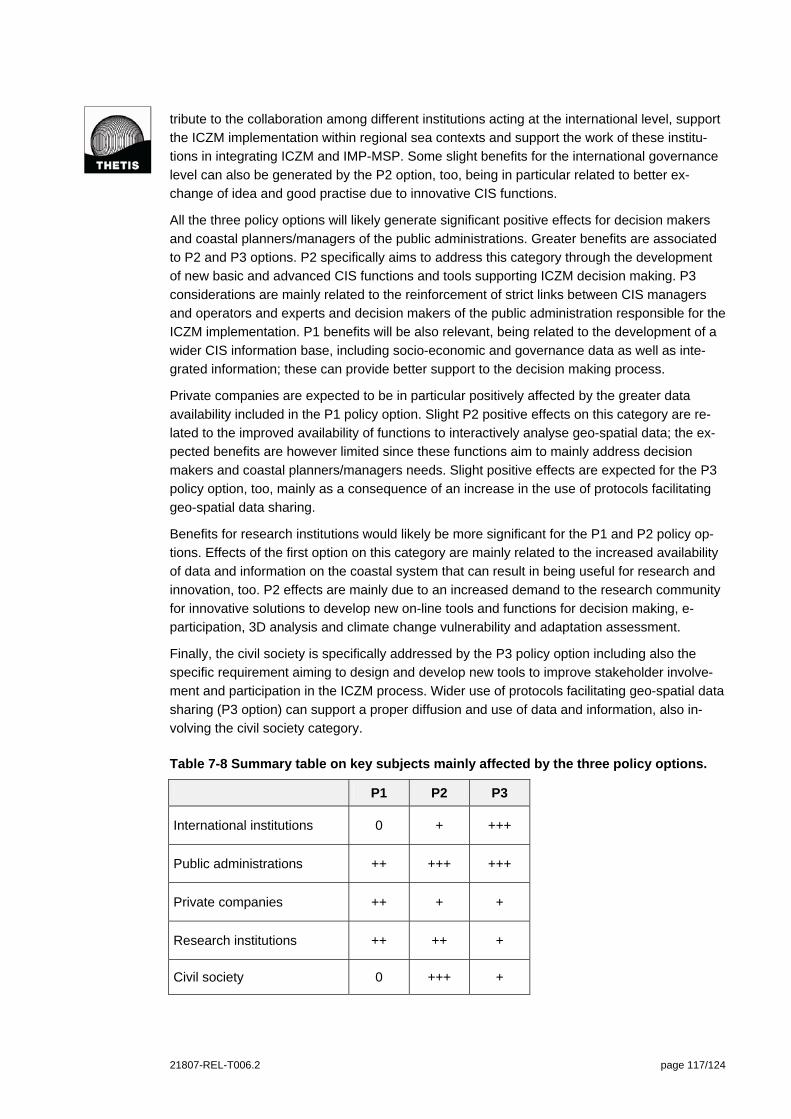
21807-REL-T006.2 page 117/124
tribute to the collaboration among different institutions acting at the international level, support
the ICZM implementation within regional sea contexts and support the work of these institu-
tions in integrating ICZM and IMP-MSP. Some slight benefits for the international governance
level can also be generated by the P2 option, too, being in particular related to better ex-
change of idea and good practise due to innovative CIS functions.
All the three policy options will likely generate significant positive effects for decision makers
and coastal planners/managers of the public administrations. Greater benefits are associated
to P2 and P3 options. P2 specifically aims to address this category through the development
of new basic and advanced CIS functions and tools supporting ICZM decision making. P3
considerations are mainly related to the reinforcement of strict links between CIS managers
and operators and experts and decision makers of the public administration responsible for the
ICZM implementation. P1 benefits will be also relevant, being related to the development of a
wider CIS information base, including socio-economic and governance data as well as inte-
grated information; these can provide better support to the decision making process.
Private companies are expected to be in particular positively affected by the greater data
availability included in the P1 policy option. Slight P2 positive effects on this category are re-
lated to the improved availability of functions to interactively analyse geo-spatial data; the ex-
pected benefits are however limited since these functions aim to mainly address decision
makers and coastal planners/managers needs. Slight positive effects are expected for the P3
policy option, too, mainly as a consequence of an increase in the use of protocols facilitating
geo-spatial data sharing.
Benefits for research institutions would likely be more significant for the P1 and P2 policy op-
tions. Effects of the first option on this category are mainly related to the increased availability
of data and information on the coastal system that can result in being useful for research and
innovation, too. P2 effects are mainly due to an increased demand to the research community
for innovative solutions to develop new on-line tools and functions for decision making, e-
participation, 3D analysis and climate change vulnerability and adaptation assessment.
Finally, the civil society is specifically addressed by the P3 policy option including also the
specific requirement aiming to design and develop new tools to improve stakeholder involve-
ment and participation in the ICZM process. Wider use of protocols facilitating geo-spatial data
sharing (P3 option) can support a proper diffusion and use of data and information, also in-
volving the civil society category.
Table 7-8 Summary table on key subjects mainly affected by the three policy options.
P1 P2 P3
International institutions 0 + +++
Public administrations ++ +++ +++
Private companies ++ + +
Research institutions ++ ++ +
Civil society 0 +++ +

21807-REL-T006.2 page 118/124
The impact assessment and the policy options comparison confirmed that P3 represents the
most ambitious policy option, in terms of economic and human resources likely required for its
implementation, but also in terms of expected direct and indirect benefits. P2 is in a relative
medium position, while P1 is characterised by a relative lower level of ambition. The following
rough schematisation of policy ambition and implementation challenge can be therefore de-
fined: P3 > P2 > P1. However, as highlighted by the analysis described in section 7.2.2, the
implementation of all the three policy options at the European and Regional Sea levels still re-
quire significant efforts (with important geographic differences), in particular to address the key
challenges related to the requirements requiring greater investment of human and economic
resources. i.e.:
Improve economic and in particular social and governance information within CISs
(B1), for the P1 policy option;
Improve functionalities directly supporting ICZM decision making in a short and long
term perspective (C1), for the P2 policy option;
Establish strict link and cooperation between CIS management and operation and the
ICZM process (D1) and in particular progressively move towards the adoption of an
ecosystem-based approach (A3), for the P3 policy option.

21807-REL-T006.2 page 119/124
Table 7-9 Summary comparative table for the policy options.
P1 Option P2 Option P3 Option
Positive direct effects
Integrated knowledge on the coastal system
Bridged gap between scientific information and policy/decision making
Involvement of stakeholders in the ICZM process
Support and facilitation in climate change adaptation of coastal zones within the wider context of ICZM
Support to the integration of ICZM with other closely related policies (climate change)
Periodical evaluation process of ICZM planning and management; support an ICZM adaptive process
Cooperation among different institutions and institutional levels
Implementation of ICZM in a regional sea context
Support to the integration of ICZM with other closely related policies (MSP)
Support to the integration of ICZM with other closely related policies (climate change)
Simplification of the use of the coastal information system
Negative direct impacts
Costs related to maintenance and updating of the CIS
Development or initial costs
Costs related to maintenance and updating of the CIS
Development or initial costs
Costs related to maintenance and updating of the CIS (some positive effects are expected in the long-term)
Learning costs

21807-REL-T006.2 page 120/124
P1 Option P2 Option P3 Option
Positive indirect effects
Functioning of internal market and competition
Innovation and research
Integration of risk in coastal planning and management
Administrative burden (long term)
Innovation and research
Better living conditions in terms of effects on social protection, health and safety, education system
Integration of risk in coastal planning and management
Sustainable use of coastal space (or sustainable land use planning)
Functioning of internal market and competition
Competitiveness, trade and investment flows
Administrative burden (long term)
Employment and labour market (short term)
Better living conditions in terms of effects on social protection, health and safety, education system
Integration of risk in coastal planning and management
Biodiversity, flora, fauna and landscapes
Sustainable use of coastal space (or sustainable land use planning)
Negative indirect effects
Administrative burden (short term)
21807-REL-T006.2 page 121/124
8 Conclusions
The study “Options for coastal information systems” principally aimed at defying possible poli-
cy options for the further development of coastal information systems finalised to improve their
operative support to the ICZM process at various scales (local, sub-national, national, transna-
tional and regional sea one). The results of the study will contribute, together with other stud-
ies and activities promoted by the EC DG Environment, to the follow-up proposal to the EU-
ICZM Recommendation (2002/413/EC). To reach this objective the study implied the realisa-
tion of technical activities – including the analysis of CIS’ illustrative cases, the definition of
CIS’ policy requirements and policy options and their impact assessment – and involved a
group of stakeholders that provided precious feedbacks on various aspects.
The overview and in-depth analysis highlighted significant strengths of existing CISs, which
however are not always properly exploited to fully support the ICZM process at various scales.
The same analysis enabled to identify main current CIS’s weakness and gaps; i.e. key issues
to be dealt with in terms of new, and often innovative, requirements. The main problem to be
addressed is therefore a twofold problem that can be summarised as follows:
Underuse or improper use of existing coastal information systems within the ICZM
process at various scales.
Existence of weaknesses and gaps to be addressed through the development of new
CIS’ features to further improve their use within the ICZM process at various scales.
The general objective of the policy options addressing the above problem is to improve the
concrete support of coastal information systems to the ICZM process, enhancing CISs diffu-
sion and strengthening their use in strict connection to integrated coastal planning and man-
agement. This in particular implies: (i) the improvement of CISs’ support to the implementation
of the key ICZM principles, in particular as defined by the Recommendation 2002/413/EC, (ii)
the support to the on-going integration process between ICZM and MSP, (iii) the simplification
of the use of coastal information systems in order to make easier and more immediate their
support to the ICZM decision making. In relation to the identified problems and objective, the
study formulated the following three policy options:
P1 – Improving data and information base; P1 option deals with the principal identified
data and information gaps, i.e.: socio-economic and governance data, integrated in-
formation, multi-time data (i.e. historical series) and climate change data. The imple-
mentation of the P1 policy option mainly relies on the integration within CISs of al-
ready existing data and information, still not included in the system, rather than on the
acquisition of new data or the realisation of new study. The final goal is therefore the
creation of a wider database able to address the various sectors and integrated as-
pects of the ICZM holistic approach as well as its long-term perspective.
P2 – Improving and innovating functions and tools; P2 option mainly aims to improve
the availability of functionalities and tools directly supporting ICZM decision makers
and coastal planners and managers, as well as to increase stakeholders’ involvement
and participation in the ICZM process. This policy option is therefore characterised by
two main objectives. The first goal is to provide users with on-line functions and tools
enabling them to interactively analyse and elaborate CIS’s data, thus supporting ICZM
decision making through customised information produced by these new tools. In this
21807-REL-T006.2 page 122/124
perspective P2 policy option can be strictly related to P1 one; a wider and more com-
plete data and information base can better support data analysis and elaboration
through the newly available tools. The second goal is to further develop on-line tools
to involve stakeholders in the generation and use of coastal information and more in
general in the ICZM process.
P3 – Enhancing cooperation; P3 policy option mainly aims to enhance cooperation
among different subjects involved in the CISs implementation and management and
more in general in ICZM process, thus improving the CISs support to this latter. Spe-
cifically, increased horizontal and vertical cooperation is desirable among: structures
of the same authority involved in ICZM and/or the CIS’ management and operation,
different public authorities involved in the ICZM process, different coastal data provid-
ers and managers, managers of different CISs related to the same area of interest.
The study also highlighted the importance to:
Properly involve users since the initial phase of the CIS design and subsequently in its
management;
Continue and strengthen the effort in matching the INSPIRE Directive provisions, in-
cluding in particular any initiative aiming to improve availability of data and metadata.
Policy option impact assessment and comparison showed that the three policy options can be
conceptually distributed along a gradient. P3 represents the most ambitious policy option, in
terms of economic and human resources likely required for its implementation, but also in
terms of expected direct and indirect benefits. P2 is in a relative medium position, while P1 is
characterised by a relative lower level of ambition. The following rough schematisation of poli-
cy ambition and implementation challenge can be therefore defined: P3 > P2 > P1. However,
the implementation of all the three policy options still requires relevant efforts.
Quantitative assessment of costs produced the following rough estimations related to the im-
plementation of the three policy options in the European Union (all estimations represent addi-
tional costs to the baseline scenario):
P1 policy option: 13.3 – 20.0 million € for the development cost and 26.0 – 38.9 million
€ for yearly management costs;
P2 policy option: 18.4 – 27.6 million € for the development cost and 30.7 – 46.1 million
€ for yearly management costs;
P3 policy option: 43.1 – 64.7 million € for the development cost and 53.5 – 80.2 million
€ for yearly management costs;
These estimations give an indication of the expected order of magnitude of the policy option
implementation at the EU level. They significantly depends on a series of relevant assump-
tions that the study necessarily had to include in order to deal with the heterogeneous nature
of existing coastal information systems and the main gaps in the input data needed for the
analysis.
Significant differences exist among the various European regions in relation to the current im-
plementation level of the three policy options and the related expected benefits and effort
needed for their further improvement. The analysis showed the greatest challenges in general
are related to: (i) the P3 option implementation in all the regions with relatively minor relevance
for the North Sea and (ii) the Black Sea region for all the three policy options, where however

21807-REL-T006.2 page 123/124
there are significant on-going initiatives. Compared to P3, P2 option is better represented in
the current CISs, although a relevant effort is still required, in particular for the Baltic Sea, the
Celtic Sea and the Bay of Biscay and Atlantic Iberian Coast, at least according to the analysis
performed in this study. Finally main challenges related to P1 implementation are expected to
be in general lower than P3 and P2 ones, being slightly more consistent for the Mediterranean
and the North Sea.
As above described, P1, P2 and P3 policy options can be considered progressive scenarios in
terms of policy ambition and implementation challenges. In this perspective the following con-
siderations can be drawn in relation to the follow-up of the EU ICZM Recommendation
P1 policy option includes essential requirements (i.e. the enlargement of the information base
according to a holistic and integrated approach and long-term management needs) to improve
the CISs’ capacity in supporting the ICZM process; indeed P1 option may be considered as a
necessary (or basic) step to evolve the current CISs’ situation as depicted by the baseline
scenario. In this perspective, this policy option can be incorporated in an EU binding legislative
framework (i.e. EU Directive) defining obligations for the ICZM implementation, also in relation
to the CISs further improvement. A strict link with the INSPIRE Directive is also essential for
the P1 policy option implementation.
An EU binding legislative framework could also fit with the second policy option (P2), which
also includes some essential requirements for the improvement of the CISs support to the
ICZM process (i.e. the development of new tools to better support ICZM decision making and
stakeholders’ participation). However this could be more efficiently implemented through the
Recommendation policy instrument that enables a higher level of flexibility. A greater flexibility
is required since the P2 implementation could actually depend consistently on the specific
needs of the considered ICZM process and the characteristics of the considered CIS, includ-
ing its main objectives and context of application, typology and prevalent target users. For ex-
amples, some ICZM processes could need to mainly focus on the improvement of stakeholder
involvement through new e-participation tools, while others could primarily focus on improving
direct support to decision makers through on-line functions and tools; some other CISs could
also need to balance these two aspects thus addressing both requirements with a similar ef-
fort.
P3 policy option focuses on the enhancement of cooperation in the CIS management and op-
eration as well as in the progressive adoption of an ecosystem-based approach. The imple-
mentations of this policy option can be likely more efficiently supported through incentives, e.g.
a policy programme providing a common framework for and financial support to projects and
studies dealing with P3 key issues. The higher costs related to the P3 policy option also sug-
gest to avoid the adoption of a strictly binding approach for the implementation of this policy
and to prefer a more flexible and progressive mechanism. An incentives-based policy pro-
gramme can be surely efficient in improving methodological aspects and disseminating pilot
case studies. A more substantial P3 implementation and member states commitment (includ-
ing international cooperation among member states, also within a Regional Sea perspective)
would likely require other types of policy instruments (e.g. a specific Recommendation).
In terms of temporal evolution of the improvement of CIS’ support to the ICZM process, the
proposal is to adopt a two phase approach. The first four-five years phase would focus on P1
and P2 policy options (to be implemented through an EU Directive and/or an EU Recommen-
dation). Different effort could be given to each of the two policy option according to the differ-
ences highlighted in the current implementation level among the various European Regions;

21807-REL-T006.2 page 124/124
i.e.: greater attention to P2 for the Baltic Sea, the Celtic Sea and the Bay of Biscay and Atlan-
tic Iberian Coast; equal attention to P1 and P2 for the North Sea and the Mediterranean Sea
for which however almost half of the analysed systems are currently characterised by a good
level of P1 and P2 implementation; great attention to CIS strengthen and CIS-ICZM link rein-
forcement in general for the Black Sea.
The first phase should not totally neglect the P3 option; whenever opportunities arise this
should be promoted through a dedicated policy programme, even if the major focus would be
on P1 and P2, and its implementation monitored to correctly depict the occurring progresses.
An interim and final evaluation of the first phase results will be useful to prepare the second
phase that will specifically focus on the implementation of the P3 option. This evaluation will
be also useful to fine-tune the policy instrument to be used to successfully implement the P3
option in the second phase, i.e. the continuation of an incentives-based policy programme
and/or a specific EU Recommendation.

21807-REL-T006.2 Annex 1
Annex 1 – Overview analysis: analytical tables of European CIS cases
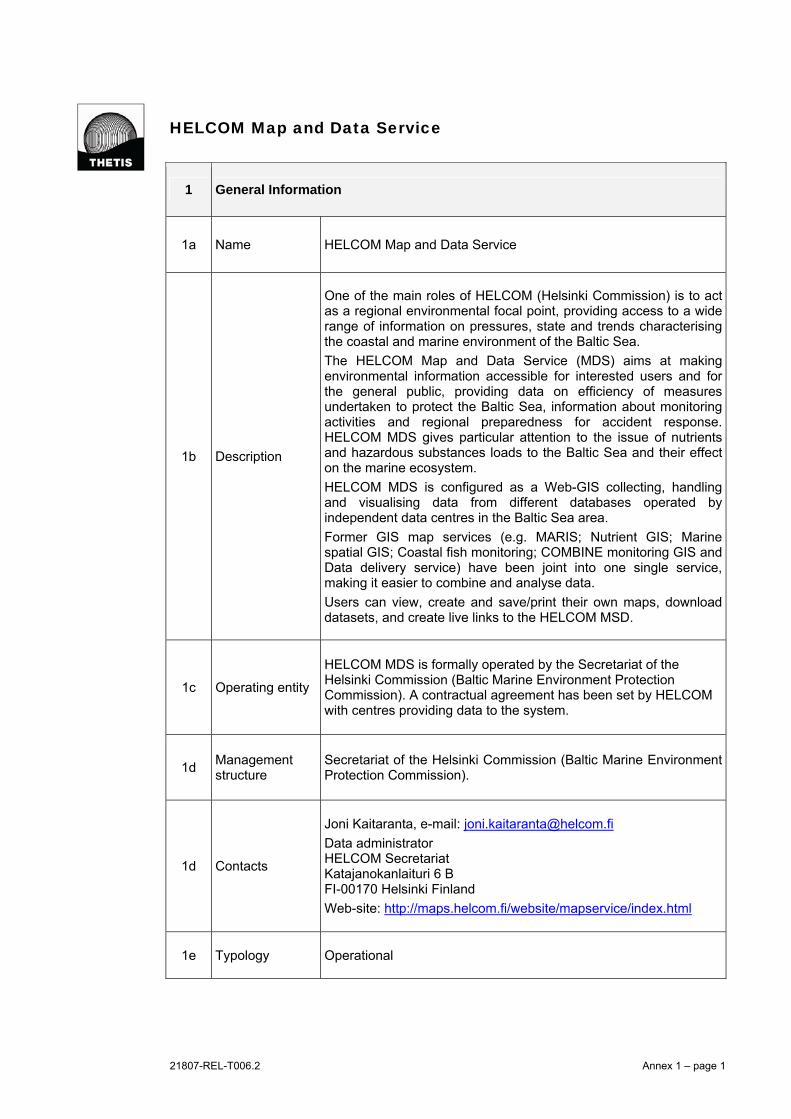
21807-REL-T006.2 Annex 1 – page 1
HELCOM Map and Data Service
1 General Information
1a Name HELCOM Map and Data Service
1b Description
One of the main roles of HELCOM (Helsinki Commission) is to act as a regional environmental focal point, providing access to a wide range of information on pressures, state and trends characterising the coastal and marine environment of the Baltic Sea.
The HELCOM Map and Data Service (MDS) aims at making environmental information accessible for interested users and for the general public, providing data on efficiency of measures undertaken to protect the Baltic Sea, information about monitoring activities and regional preparedness for accident response. HELCOM MDS gives particular attention to the issue of nutrients and hazardous substances loads to the Baltic Sea and their effect on the marine ecosystem.
HELCOM MDS is configured as a Web-GIS collecting, handling and visualising data from different databases operated byindependent data centres in the Baltic Sea area.
Former GIS map services (e.g. MARIS; Nutrient GIS; Marine spatial GIS; Coastal fish monitoring; COMBINE monitoring GIS and Data delivery service) have been joint into one single service, making it easier to combine and analyse data.
Users can view, create and save/print their own maps, download datasets, and create live links to the HELCOM MSD.
1c Operating entity
HELCOM MDS is formally operated by the Secretariat of the Helsinki Commission (Baltic Marine Environment Protection Commission). A contractual agreement has been set by HELCOM with centres providing data to the system.
1d Management structure
Secretariat of the Helsinki Commission (Baltic Marine Environment Protection Commission).
1d Contacts
Joni Kaitaranta, e-mail: [email protected]
Data administrator HELCOM Secretariat Katajanokanlaituri 6 B FI-00170 Helsinki Finland
Web-site: http://maps.helcom.fi/website/mapservice/index.html
1e Typology Operational
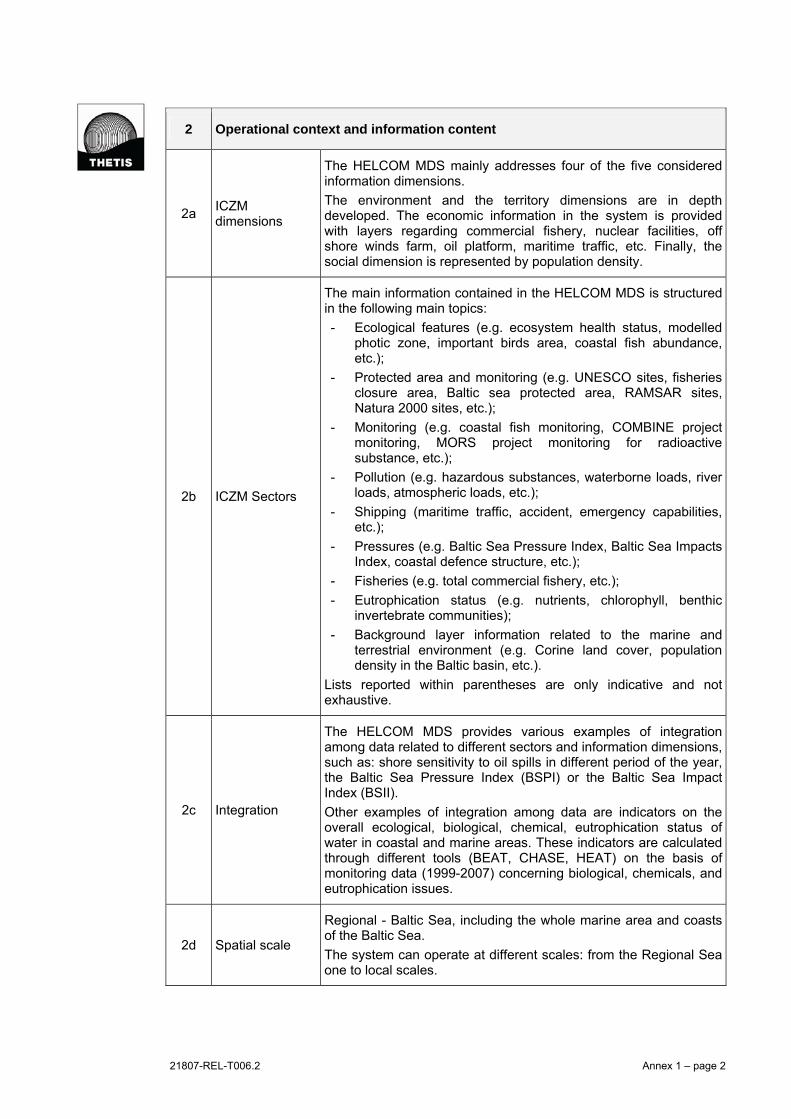
21807-REL-T006.2 Annex 1 – page 2
2 Operational context and information content
2a ICZM dimensions
The HELCOM MDS mainly addresses four of the five considered information dimensions.
The environment and the territory dimensions are in depth developed. The economic information in the system is provided with layers regarding commercial fishery, nuclear facilities, off shore winds farm, oil platform, maritime traffic, etc. Finally, the social dimension is represented by population density.
2b ICZM Sectors
The main information contained in the HELCOM MDS is structured in the following main topics:
- Ecological features (e.g. ecosystem health status, modelled photic zone, important birds area, coastal fish abundance, etc.);
- Protected area and monitoring (e.g. UNESCO sites, fisheries closure area, Baltic sea protected area, RAMSAR sites, Natura 2000 sites, etc.);
- Monitoring (e.g. coastal fish monitoring, COMBINE project monitoring, MORS project monitoring for radioactive substance, etc.);
- Pollution (e.g. hazardous substances, waterborne loads, river loads, atmospheric loads, etc.);
- Shipping (maritime traffic, accident, emergency capabilities, etc.);
- Pressures (e.g. Baltic Sea Pressure Index, Baltic Sea Impacts Index, coastal defence structure, etc.);
- Fisheries (e.g. total commercial fishery, etc.);
- Eutrophication status (e.g. nutrients, chlorophyll, benthic invertebrate communities);
- Background layer information related to the marine and terrestrial environment (e.g. Corine land cover, population density in the Baltic basin, etc.).
Lists reported within parentheses are only indicative and not exhaustive.
2c Integration
The HELCOM MDS provides various examples of integration among data related to different sectors and information dimensions, such as: shore sensitivity to oil spills in different period of the year, the Baltic Sea Pressure Index (BSPI) or the Baltic Sea Impact Index (BSII).
Other examples of integration among data are indicators on the overall ecological, biological, chemical, eutrophication status of water in coastal and marine areas. These indicators are calculated through different tools (BEAT, CHASE, HEAT) on the basis of monitoring data (1999-2007) concerning biological, chemicals, and eutrophication issues.
2d Spatial scale
Regional - Baltic Sea, including the whole marine area and coasts of the Baltic Sea.
The system can operate at different scales: from the Regional Seaone to local scales.
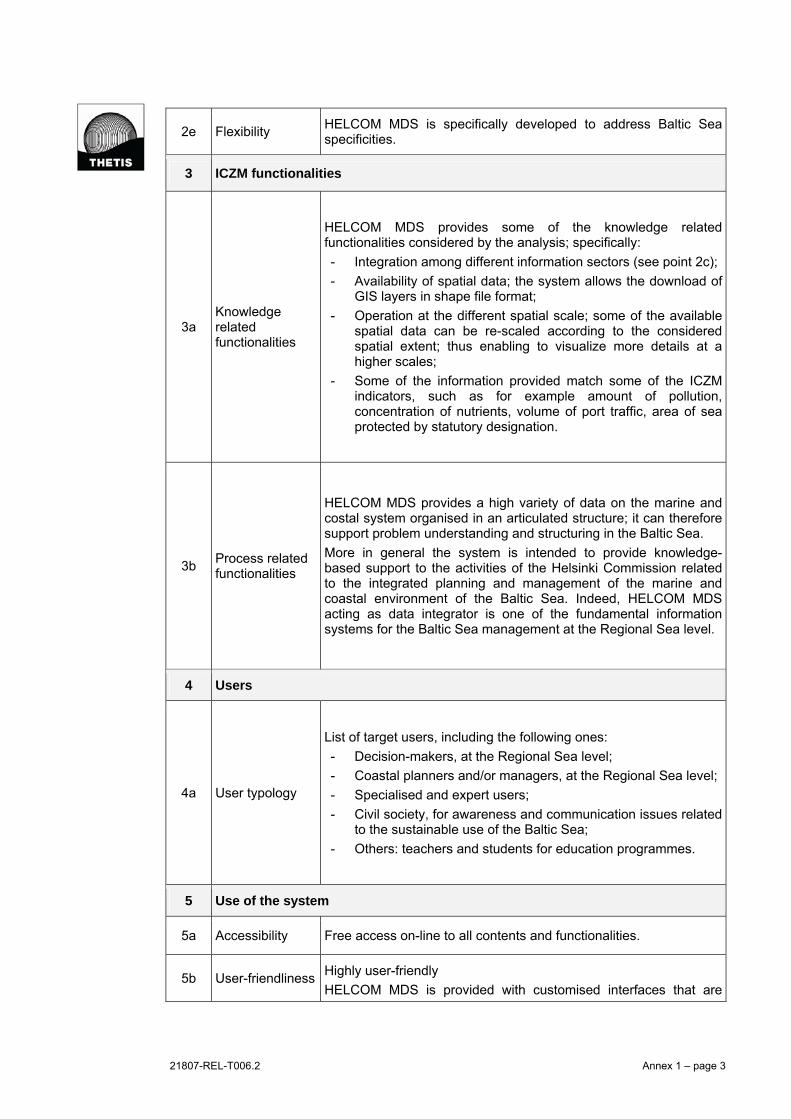
21807-REL-T006.2 Annex 1 – page 3
2e Flexibility HELCOM MDS is specifically developed to address Baltic Sea specificities.
3 ICZM functionalities
3a Knowledge related functionalities
HELCOM MDS provides some of the knowledge related functionalities considered by the analysis; specifically:
- Integration among different information sectors (see point 2c);
- Availability of spatial data; the system allows the download of GIS layers in shape file format;
- Operation at the different spatial scale; some of the available spatial data can be re-scaled according to the considered spatial extent; thus enabling to visualize more details at a higher scales;
- Some of the information provided match some of the ICZM indicators, such as for example amount of pollution, concentration of nutrients, volume of port traffic, area of sea protected by statutory designation.
3b Process related functionalities
HELCOM MDS provides a high variety of data on the marine and costal system organised in an articulated structure; it can therefore support problem understanding and structuring in the Baltic Sea.
More in general the system is intended to provide knowledge-based support to the activities of the Helsinki Commission related to the integrated planning and management of the marine and coastal environment of the Baltic Sea. Indeed, HELCOM MDS acting as data integrator is one of the fundamental information systems for the Baltic Sea management at the Regional Sea level.
4 Users
4a User typology
List of target users, including the following ones:
- Decision-makers, at the Regional Sea level;
- Coastal planners and/or managers, at the Regional Sea level;
- Specialised and expert users;
- Civil society, for awareness and communication issues related to the sustainable use of the Baltic Sea;
- Others: teachers and students for education programmes.
5 Use of the system
5a Accessibility Free access on-line to all contents and functionalities.
5b User-friendliness Highly user-friendly
HELCOM MDS is provided with customised interfaces that are

21807-REL-T006.2 Annex 1 – page 4
rather simple to be used. Moreover use of the system is supported by a detailed and simply usable “User Manual” and a FAQ (frequently asked questions) section that provides ready information on main questions related to the use of system. All the system interfaces and metadata sheets are in English.
5c Interactiveness HELCOM MDS includes a feedback tool to send suggestions in order to improve system’s functionalities and contents.
5d Data access
The system enables the download of the great part of spatial data and also provides functionalities for the direct connection to the HELCOM GIS-Server via Web Map Service (WMS) interface.
Finally, HELCOM MDS allows the easy access to detailed and clear metadata (metadata sheets) for all the available layers.
6 Technological characteristics
6a Used technology ESRI ArcGis Server 9.3.1 and Flex (licensed software).
6b Integration with other tools
HELCOM MDS is configured as a Web-GIS collecting (via WMS) handling and visualising data from different GIS databases operated by independent data centres in the Baltic Sea area. The adopted solution enables to directly link the above GIS databases to the HELCOM MDS platform that is used to visualise this information in an integrate way. Management and update of single databases are ensured by the relative data managers and providers.
The site of the Helsinki Commission provides links to other relevant - for the Baltic Sea – web-sites for database and map services related to the activities of the same Commission, whose data are at least partially viewable through and integrated within the HELCOM MDS. These are
- COMBINE monitoring data, downloadable from ICES Oceanographic database and viewable and downloadable in the ICES EcoSystemData map service (http://ecosystemdata.ices.dk/map/index.aspx);
- HELCOM MORS; database of the MORS project dealing with monitoring of radioactive substances in water, sediments, and biota downloaded via International Atomic Energy Agency's Marine Information System (http://maris.iaea.org). In the HELCOM MDS only monitoring stations, not data, are shown;
- Data and metadata produced by the EU funded project BALANCE (Baltic Sea Management – Nature Conservation and Sustainable Development of the Ecosystem through Spatial Planning, http://www.helcom.fi/GIS/BalanceData/en_GB/main/). Part of the BALANCE datasets can be visualized and downloaded in the HELCOM Map and Data Service.
HELCOM Baltic Sea Protected Area (BSPA) database, containing a wide range of information on protected areas of this Regional Sea, hosted in the HELCOM website (http://bspa.helcom.fi/), is completely disjointed from HELCOM MDS.
6c Integration with other CIS
In the case of HELCOM this issue is strictly connected with and therefore addressed in point 6b.
21807-REL-T006.2 Annex 1 – page 5
6d Interoperability
High.
Most of the dataset included in the HELCOM MDS are available via WMS. The HELCOM MDS provides Open Geospatial Consortium compliant Web Map Services (WMS) so that the user can access available layers directly from its own client. This guarantees a high interoperability of the system.
Metadata are structured and described according to the standard ISO 19115, being therefore complying with the INSPIRE Directive.
7 Cost/Resources
7a Resources 3 persons full time from 2009 for CIS implementation. 4 persons for system management.
Web-site consultation dor the overview analysis of HELCOM Map and Data Service:
http://www.helcom.fi/GIS/en_GB/HelcomGIS/; last visit on 07/02/2011 at 10.38.
http://maps.helcom.fi/website/mapservice/index.html; last visit on 07/02/2011 at
10.40.
MARIS: Maritime Accident Response Information System:
http://www.ymparisto.fi/default.asp?node=13181&lan=en; last visit on 07/02/2011 at
13.00.
http://gis.ekoi.lt/gis/index.php; last visit on 18/02/2011 at 10.00.
http://www.hnit-baltic.lt/; HNIT-Baltic Geoinfoservisas, last visit on 18/02/2011 at
10.00.

21807-REL-T006.2 Annex 1 – page 6
Lounaispaikka Map Service
1 General Information
1a Name Lounaispaikka Map Service (LMS)
1b Description
The ENVIFACILITATE Life project has supported the improvement of a regional Geographic Information (GI) network in the South-Western Region of Finland, called Lounaispaikka. The network is a good example of benefits that may be generated by the collaboration of regional actors in the GI field. Key players of the Lounaispaikka are the: Regional Council, National Land Survey of Finland, Geological Survey of Finland, Finnish Environment Institute, Game and fisheries research Institute, Provincial Museum of South-West of Finland and National Board of Antiquities.
Lounaispaikka Map Service (LMS) is one of the results of the collaborative effort provided by the above network. LMS is a freely Internet accessible map service, enabling to share and visualise spatial data and metadata provided by the network member organisations (over 120 datasets) for the South-Western Region of Finland. It is based on a distributed architecture and Web Map Service (WMS).
LMS has been in particular created to support the easy access to spatial information of the South-Western Region of Finland. It combines a vast collection of spatial information contents into a single and easy to use map interface, in particular dedicated to public administrations and planning experts.
1c Operating entity The secretariat of Lounaispaikka Map Service is located in the Regional Council of South-West Finland
1d Management structure
Secretariat of Lounaispaikka Map Service, Regional Council of South-West Finland
1e Contacts
Savola Kaisa, e-mail: [email protected]
Paikkatietoyhteistyön koordinaattori GI samarbetskoordinator Coordinator for GI Co-operation Ratapihankatu 36 20101 Turku
Web-site: www.lounaispaikka.fi
1f Typology Operational
2 Operational context and information content
2a ICZM dimensions
The LMS addresses all the five considered ICZM dimensions. The five dimensions are more or less equally addressed by the LMS that therefore make available a wide information base.
Governance information for example includes maps related to regional and local master plans, also related to the coastal area.
2b ICZM Sectors Over 120 datasets are included in the LMS. The following main sectors are covered by LMS:
21807-REL-T006.2 Annex 1 – page 7
- Aerial photographs;
- Topographic map;
- Natural aspects (e.g. nature conservation areas, spawning areas, traditional rural biotopes, etc.)
- Administrative boundary;
- Geological information and surface and water system (e.g. geological map, soil map, elevation, drainage basins);
- Land and water use;
- Weather and climate data from fixed stations;
- Transport and traffic information (e.g. railroad network and terrestrial viability);
- Harbour and commercial traffics line;
- Cable network for the communication;
- Military infrastructure and areas;
- Regional plan and local master plans;
- Social data (e.g. population density);
- Services (e.g. public services in Turku, accessibility of public schools and hospitals, recreation)
- Cultural heritage (built heritage, archaeological sites, historical maps);
- Energy production.
2c Integration The service does not appear to provide examples of integration among different information and sectors
2d Spatial scale Sub-National Scale - South-Western Region of Finland.
Data contained in the LMS are related to the land component of the coastal and marine system.
2d Flexibility The LMS has been developed in order to be applied specifically to the South-Western Region of Finland. The Lounaispaikka network can support the dissemination of the LMS experience.
3 ICZM functionalities
3a Knowledge related functionalities
LMS provides some of the knowledge related functionalities considered by the analysis, specifically:
- Availability of spatial information; LMS does not allow to directly download data (spatial data may be visualised). However it provides a very good knowledge about a wide number of data sources, thus supporting data acquisition from direct providers;
- Operation at the different spatial scale; some of the available spatial data can be re-scaled according to the considered spatial extent; thus enabling to visualize more details at a higher scales.
3b Process related functionalities
LMS includes a high number and a wide variety of spatial information; these are organised according to a two level tree structures. LMS structure is well articulated and complete, thus enabling the users to easily find data and information. Thus LMS is well-shaped for problem understanding and structuring.

21807-REL-T006.2 Annex 1 – page 8
LMS support data sharing among different regional actors, thus proving a wide set of data for regional planning. In this perspective, it is important to mention that the LMS developing process has involved stakeholders in order to address usability problems of the provided data.
4 Users
4a User typology LMS combines a vast collection of spatial information contents into a single and easy to use map interface, mainly dedicated to public authorities and planning experts.
5 Use of the system
5a Accessibility Lounaispaikka is a map service with free access on-line.
5b User-friendliness
High/Medium user friendly.
The easy to use service interface takes into account the needs of both Geographic Information (GI) professionals and every day users with no prior GI knowledge. Intuitive operation of the system. Help on-line documentation could be further improved.
Currently the only used language for all the LMS is the Finnish. In-going implementation includes the development of the English version of the LMS.
5c Interactiveness
LMS is totally accessible on-line, although only enabling interactive data visualisation. The service does not directly provide e-participation tools, except for a simple feedback tool used by the users to provide suggestions in order to improve the functionality of the system.
However, the Lounaispaikka network strongly supports cooperation and interaction; in particular it provides an Internet forum bringing regional professionals together to discuss issues related to geographic information.
5d Data access
Only metadata consultation is currently available from the LMS. Spatial data cannot be downloaded; however LMS provides complete information on data sources, thus supporting data request to original data providers.
6 Technological characteristics
6a Used technology
The LMS is based on open source technologies (MAP SERVER and GEOSERVER and other). Previously the system was developed using ESRI software, but during the last two years the system was converted to open source.
6b Integration with other tools
LMS is connected with the University of Turku Spatial Data Achieve. This share the metadata search functionality with the LMS service.
6c Integration with other CIS
The standardised Web Map Service (WMS) interface enables the map application to import geographic data directly from the data providers. For example the LMS includes WMS layers from National Land Survey of Finland, Finnish Meteorological Institute and Geological Survey of Finland etc.

21807-REL-T006.2 Annex 1 – page 9
The use of WMS interfaces guarantee that the information are constantly up-to-date.
6d Interoperability
High.
LMS is based on a distributed architecture and Web Map Service (WMS) interfaces that provide spatial from multiple servers to the same map layout.
WMS interfaces guarantee that the information is up-to-date and the system respects the INSPIRE Directive. Also the metadata aim to be organised complying standards of the INSPIRE directive.
7 Cost/Resources
7a Resources
LMS is supported by the Regional Council of South-West Finland, University of Turku, Southwest Finland Regional Environment Centre, Yrkehögskolan Sydväst, Turku School of Economics, Åbo Akademi and Turku University of Applied Sciences.
The development of the system involved a full-time project planner for two years who was in charge of the service renewal and did most of the work related on map service development. In addition, two software developers were hired full-time for a couple of months.
At the moment, operation activities involve only one person dealing with the general coordination of the network. However, the need to involve a full-time person specifically dealing with the map service implementation and update has been highlighted by Kaisa (mail sent on the 28.03.2011)

21807-REL-T006.2 Annex 1 – page 10
Information sources for the overview analysis of Lounaispaikka Map Service:
Antti Vasanen, 2006. Presentation titled: “Lessons learnt on distributed viewing services
Lounaispaikka Map Service and ICZM Map Viewer of the ENVIFACILITATE”. GI-ENVI
Workshop Turku 6 October 2006;
Toivonen T. and Kalliola R., 2006. Building networks and services for geographical
information: Lessons learnt in the ENVIFACILITATE project. UTULCC Publications Vol.
12. University of Turku Laboratory of Computer Cartography 2006.
Tolvanen, H. & R. Kalliola (2008). A structured approach to geographical information in
coastal research and management. Ocean & Coastal Management 51: 6, 485–494.
Kalliola R. and Laurila L., 2009. Contributing Coastal Zone Management by GIS analyses
– The case of Finnish marine Zone. Journal of Coastal Research SI 56 – 1233-1236.
Kaisa Savola, 2011. Information provided by mail on the 28.03.2011 at 14.20, CET time.
Web-site consultation for the overview analysis of Lounaispaikka Map Service:
http://utu-lcc.utu.fi/; last visit on 9/03/2011 at 16.50;
http://www.lounaispaikka.fi/; last visit on 9/03/2011 at 16.00;
http://envifacilitate.utu.fi/; last visit on 18/03/2011 at 11.00.

21807-REL-T006.2 Annex 1 – page 11
Integrated Atlas of the State of the Coast in the South-Eastern Baltic
1 General Information
1a Name Integrated Atlas of the State of the Coast in the South-Eastern Baltic
1b Description
The main aim of the “Sustainable Development Indicators for ICZM in the South-Eastern Baltic - SID4SEB” project was to follow and implement the main strategy of the European Parliament and the Council concerning adopted recommendations for the Integrated Coastal Zone Management in the South-Eastern Baltic.
The Integrated Atlas of evaluated coastal and marine indicators, set up through GIS tools, is the main result of the project achievements. It covers the Baltic coast of three neighbouring countries: Poland, Russia (Kaliningrad region) and Lithuania. The report of the state of the coast and the related database, accessible from the main web site of the project, show the (static) maps and graphics for each of the 27 indicators (and all related parameters) defined by the Deduce project.
The project web-site also includes a description of the adopted methodology for each developed indicator and the final recommendation identified by the project.
1c Operating entity
The project involved the following three partners:
- Maritime Institute in Gdansk (Poland);
- Atlantic Branch of P.P. Shirshov Institute of Oceanology of the Russian Academy of Sciences in Kaliningrad (Russia);
- Coastal Research and Planning Institute at Klaipėda University (Lithuania).
1d Management structure
The work has been jointly produced by the 3 partners mentioned at the point 1c
1e Contacts
Contacts:
Klaipėda University; [email protected], tel. +370 46398848
Maritime Institute in Gdansk; [email protected], tel. +48 583013718
Atlantic Branch of Institute of Oceanology, Russian Academy of Sciences in Kaliningrad: chuboris@;ioran.baltnet.ru, tel. +7 (4012) 451574.
Web site: http://corpi.ku.lt/~SDI-4-SEB/index.html
1f Typology Operational
2 Operational context and information content
21807-REL-T006.2 Annex 1 – page 12
2a ICZM dimensions
Including the complete list of the 27 ICZM indicators identified by the Deduce project, the Atlas addresses all the ICZM dimensions: territory, environment, economy, society and governance.
2b ICZM Sectors
Data and various information typologies (static maps and/or graphics) area provided for the following 27 indicators.
- Demand for property at the coast
- Area of built-up land
- Development on ‘brownfield’ land
- Demand for road travel at the coast
- Pressure for coastal and marine recreation
- Land take by intensive agriculture
- Amount of semi-natural habitat
- Area of land and sea protected by statutory designations
- Effective management of designated sites
- Changes to significant coastal and marine habitats and species
- Loss of cultural distinctiveness
- Patterns of employment
- Volume of port traffic
- Intensity of tourism
- Sustainable tourism
- Bathing water quality
- Amount of coastal and marine litter
- Amount of nutrients in coastal waters
- Amount of oil pollution
- Degree of social inclusion
- Household prosperity
- Number of second homes
- Fish stocks and fish landings
- Water consumption
- Sea level rise and extreme weather conditions
- Coastal erosion and accretion
- Natural and human assets at risk from flooding
2c Integration
ICZM indicators are in some cases developed through the integration of different information. This is for example the case of the indicators related to flooding risk, including maps on the number of people living in ‘at risk’ area for flooding and the protected areas within the river flood risk zone.
2d Spatial scale Transitional scale – Baltic coast of Poland, Russia and Lithuania
2d Flexibility The system has been developed in order to be applied specifically to the selected area of the Baltic Sea
21807-REL-T006.2 Annex 1 – page 13
3 ICZM functionalities
3a Knowledge related functionalities
The Atlas is specifically designed and developed on the basis of the 27 ICZM indicators. These provide other ICZM knowledge related functionalities:
- Integration among sectors (see point 2c) for the computation of some of the indicators;
- Multi-time data and information are available for some indicators in the form of graphs.
The Atlas does not contains information specifically referring to coastal vulnerability to climate change; however it includes some maps and graphics about sea level rise and storming in the study area.
3b Process related functionalities
The Atlas provides a high variety of data on the marine and costal system organised in an articulated and easy to use structure.
The “State of the coast report”, available in 4 languages (English, Lithuanian, Romanian and Polish) is composed of 27 chapters, correspondent to the 27 ICZM indicators. Every chapter includes extended texts, images and graphs describing the main results of each monitored indicator, reporting several information such as data sources, results, implication for planning, further needed work. A key message is also provided, summarizing the main achieved results.
This information can support various phases on an ICZM process addressing the South-Eastern Baltic, in particular in relation to planning, monitoring and adaptive management in general.
It is also important to stress that the Atlas is the results of a trans-national cooperation among three Baltic States, thus stetting the basis for a further cooperation in the management of this specific area.
4 Users
4a User typology
A wide typology of target users is expected, since the results of the project achievements have been presented to the public, regional, central and local authorities, associations and research organizations trough publications, conferences and meetings. Target users possibly include:
- Decision makers;
- Coastal managers/coastal planners
- Civil society
5 Use of the system
5a Accessibility All indicators, and related maps and graphics, are freely accessible on-line
5b User-friendliness Highly user friendly
Maps and graphs can be quickly visualised. Wide explanation on

21807-REL-T006.2 Annex 1 – page 14
the use and the meaning of each indicator is provided in the methodology section.
The system is available in English.
5c Interactiveness No specific e-participation tools are provided
5d Data access
The Atlas enables to save (as image) only static maps and graphs. Data used to derive the indicators are not available in Internet.
Metadata related to each indictor are included in deception sheet accessible trough the methodology section. This sheet includes information on: indicator objective, parameters used to calculate the indicator, spatial and temporal coverage, data sources, methodology, modality used to present the data, adding value to the data, information on aggregation and disaggregation, notes.
6 Technological characteristics
6a Used technology Not-applicable
6b Integration with other tools
No specific integration with other tools
6c Integration with other CIS
No specific integration with other CIS
6d Interoperability Not-applicable in relation to the INSPIRE Directive
The Atlas fully meets the requirements of the Deduce Project in relation to the ICZM indicators.
7 Costs/resources
6a Resource
Web-site consultation for the overview analysis of the Integrated Atlas of the State of the
Coast in the South-Eastern Baltic:
http://corpi.ku.lt/~SDI-4-SEB/index.html, last visit on 24/02/2011 at 09.50
21807-REL-T006.2 Annex 1 – page 15
Rewal CIS
1 General Information
1a Name Rewal CIS
1b Description
Rewal CIS was developed within the MESSINA Project (Managing European Shoreline and Sharing Information on Nearshore Areas, part funded by the INTERREG III C West Zone programme) aiming at implementing the European recommendations for the design of dedicated Geographical Information Systems for the coastal areas developed within the EUROSION EC project.
Rewal CIS mainly focuses on erosion problems and on the related hazards of a long term near-shore investment in the Rewal area in Poland, and in particular in the Trzęsacz village. The main aim is to monitor past and future cliff erosion, thus providing elaborated scenarios (for the next 1000 years) and maps to coastal authorities and local government and supporting local spatial planning. Urban sprawl and massive tourism (for the archaeological ruins of village of Trzesacz) issues were also considered, completing a socio-economic assessment of the area.
Many datasets (including spatial layers and related attributes) were collected for Rewal area. The data reaching back even to year 1933 consisted of archival and present raster and vector maps, pictures, high resolution space images, coefficients of erosion rate and future investment plans up to 2015. All data were organized in one coordinate system with the use of ArcGIS software and presented in a way to enable display and analysis.
1c Operating entity Rewal municipal authority
The CIS was developed by the University of Szczecin (Poland) in collaboration with the same Rewal municipality.
1d Management structure
Rewal municipal authority in collaboration with the Laboratory of Remote Sensing and Marine Cartography of the University of Szczecin (Poland)
1e Contacts
Kazimierz Furmanczyk; email: [email protected] University of Szczecin (Poland)
Szakowsky Igor; e-mail: [email protected] University of Szczecin (Poland)
Web-site of the MESSINA Project: http://www.interreg-messina.org
1f Typology Operational
2 Operational context and information content
21807-REL-T006.2 Annex 1 – page 16
2a ICZM dimensions The CIS mainly focus on tow of the five considered ICZM dimension, in particular the territory and social-economic ones.
2b ICZM Sectors
Main relevant data included in the Rewal CIS are:
- Satellite data and aerial photographs;
- Cadastral/land parcelling data;
- Topographic database;
- 3D digital terrain model;
- Local development and strategy;
- Socio-economic data.
2c Integration No specific integrated data among different information is directly provided within the system
2d Spatial scale Local – Rewal coastal area.
Rewal municipality is located along the Western Pomeranian coast
2d Flexibility
Rewal CIS was developed according to recommendations for the design of dedicated Geographical Information Systems for coastal areas defined within the EUROSION EC project.
Furthermore, its design and development was based on a previous experience implemented in the neighboured city of Dziwnow, focused on topography and socioeconomic aspects of this city.
3 ICZM functionalities
3a Knowledge related functionalities
In relation to ICZM knowledge related functionalities, the CIS provides multi-time information especially concerning the erosion process, assessed through comparison of rectified air photographs dated 1951, 1973 and 1996.
No other functionalities are provided.
3b Process related functionalities
The CIS was specifically developed to address the current and future erosion risk of the Rewal coastal area within an ICZM perspective, in particular considering effects on the archaeological ruins of village of Trzesacz and related tourism activity.
In this perspective, Rewal CIS provides data and functionalities supporting scenario development and assessment of planning alternatives. Taking into account the past erosion rate the CIS was used to elaborate future erosion scenarios related to two planning alternatives for the archaeological ruins of village of Trzesacz:
- Cliff protection through different systems;
- No specific coastal protection and move existing ruins of Trzesacz to a not affected place.
The main CIS output were coastal risk maps for the next 20, 50, 100 years for the two different proposed scenarios.
The CIS does not provide specific tools and functionalities for the stakeholder participation. However, the design and the development to the CIS involved the municipality since the early

21807-REL-T006.2 Annex 1 – page 17
beginning. The CIS was also used as a demonstrative tool, informing local stakeholders on coastal problems related to erosion.
4 Users
4a User typology
As alternatives are analyzed in coastal planning and their effects on coastal erosion are evaluated, the main target users can be:
Decision-makers;
Coastal planners and/or managers.
Given the tourist attraction of the site, general public can also be interested in the CIS data.
5 Use of the system
5a Accessibility Only off-line access
5b User-friendliness
5c Interactiveness No specific e-participation tools are provided
5d Data access At the moment, the access of the system is restricted only to off-line users; thus no data and metadata are provided to free access.
6 Technological characteristics
6a Used technology The CIS was developed with ArcGIS - ESRI software
6b Integration with other tools
The system makes use of a buffering tool, in order to calculate the shoreline changes, based on coefficients of erosion rate. A Model Builder module was also developed to automate the time-consuming analysis of scenario generation (Szakowski and Benedyczak, 2007).
6c Integration with other CIS
No specific integration with other CIS
6d Interoperability
7 Cost/resources
7a Resources
Information sources for the overview analysis of Rewal CIS:
MESSINA practical guide, 2006. Integrating the shoreline into spatial policies.
MESSINA Newsletter issue 5 - December 2006.
Szakowski, I. and Benedyczak, R., 2007. Developing coastal erosion affects scenarios
near Trzęsacz village in next 100 years with the use of geoinformatics. Annals of
Geomatics T. 5, z. 1, s. 105-111, bibliogr. 8 poz. Paper in Polish, abstract in English.

21807-REL-T006.2 Annex 1 – page 18
Coastal Information System Oder Estuary
1 General Information
1a Name Coastal Information System Oder Estuary – GIS ICZM
1b Description
The Coastal Information System (CIS) Oder Estuary is a Web-portal collecting scientific information (data, projects results, publications, etc.) about the Oder Estuary Region. The CIS Oder Estuary is part of the ICZM-Oder project “Research for an Integrated Coastal Zone Management in the German Oder Estuary Region”, fully described in the Web portal ad this specific address: http://www.ikzm-oder.de/en/projekt-ikzm-oder.html. The ICZM-ODER project has been dealing mainly with the following key topics:
- Dialogues and regional participation;
- Internet supported tools for ICZM (e.g. the CIS Oder Estuary);
- Spatially integrated regional ICZM;
- Coastal waters in transition (climate change);
- National strategy, training and international integration.
Within the above framework, the CIS Oder Estuary mainly aims to:
- serve as a container for data information, project results, publications etc.;
- give access to this data and information to a broad public;
- support integrated management and planning processes;
- serve as a transferable model for other regions. The aim was to develop a system, that is spatially expandable and transferable to other regions;
- establish a German-Polish dialogue concerning coastal areas;
- set up concrete tools in order to build a basis for a sustainable development for the Oder estuary.
The CIS Oder Estuary Web portal provides access to a Web GIS tool, called GIS-ICZM, in the same web portal. The GIS ICZM allows free access to regional spatial information. The system includes multi-disciplinary spatial data related to a cross-border (German-Polish) coastal and marine area, i.e. the Oder Estuary and the part of the wider Mecklenburg-Vorpommern German region.
More in general, the Oder Estuary region has been included in numerous project dealing with ICZM and related aspects, such as:
- LOICZ-IGBP (Land Ocean Interactions in the Coastal Zone);
- Indicator programme of UNESCO-IOC (Intergovernmental Oceanographic Commission);
- Integrated Coastal Area - River Basin Management (ICARM)” of UNEP (United Nations Environment Programme);
- EU FP6 SPICOSA project (Science and Policy Integration
21807-REL-T006.2 Annex 1 – page 19
for Coastal Systems Assessment)
- INTEREG IIIB ASTRA project "Developing Policies & Adaptation Strategies to Climate Change in the Baltic Sea Region“.
Information and results of these projects are included in the CIS Oder Estuary web portal. In particular some of the results are included in the GIS-ICZM tool (e.g. those generated by the ASTRA project).
1c Operating entity EUCC Germany; German branch of the Coastal & Marine Union
1d Management structure
EUCC Germany; German branch of the Coastal & Marine Union
1e Contacts
Nardine Stybel, e-mail: [email protected]; [email protected]
EUCC Germany
Baltic Sea Research Institute/Institut für Ostseeforschung Warnemünde (IOW) Seestr 15
CIS Oder Estuary web portal: http://www.ikzm-oder.de/en/startseite.html
1f Typology Operational
2 Operational context and information content
2a ICZM dimensions
The GIS-ICZM addresses four of the five considered ICZM dimension: territory (e.g. in relation to geographic descriptors, administrative boundaries, infrastructure, coastal protection, etc.), environment (biological reserve, water pollution, results of the eutrophication model, harmful substance in fish and mussels), social and economic dimensions (church, hospital, museum, tourism facilitates, pipeline, wind-farm and traffic features).
2b ICZM Sectors
The GIS-ICZM contains a wide variety and as high number of spatial information; main addressed information sectors are:
- Bathymetry;
- Sediment characteristics;
- Shoreline typology and coastal structures (dune, dike, moles etc.);
- Coastal protection;
- Flooding zones according to different levels of flood risk;
- Biological aspects (benthic species, feeding area for birds, fish species);
- Biological reserves (national protected areas and international reserves, etc.);
- Seasonal sensitivity to oil spills for the coast and for the marine area;
- Coastal water typology according to the Water Framework Directive;
- Water eutrophication (i.e. concentration of nitrate and phosphate);
- Results of the eutrophication model in different years;
21807-REL-T006.2 Annex 1 – page 20
- Water and sediment chemical pollution;
- Harmful substance in fish and mussels;
- Naval and terrestrial traffic features;
- Tourism facilities;
- Civil features (Church, hospital, museum etc.);
- Offshore wind farm;
- Pipes and cables;
- Administrative boundaries;
- Mining area; i.e. areas for the extraction of sediments.
2c Integration
The GIS ICZM provides some good examples of integrated analysis, including in particular layers related to:
- Flooding zones according to four different levels of flood risk;
- Sensitivity of the coastal and marine areas to oil spills, determined by the Precaution Pollution Control (VPS) Model.
2d Spatial scale Sub-National – Oder estuary and coastal-zone of the Mecklenburg-Vorpommern Region.
2d Flexibility
The Web Portal (CIS Oder Estuary) may be considered as a highly flexible tool. Its structure can be replicated in similar context. Indeed, one of the objectives of the CIS Oder Estuary is to develop a system spatially expandable and potentially transferable to other regions.
The GIS-ICZM has been developed in order to be mainly applied to Oder Estuary area.
3 ICZM functionalities
3a Knowledge related functionalities
Analysis of the ICZM knowledge related functionalities specifically focuses on GIS-ICZM, that includes many of the considered functionalities:
- GIS-ICZM provides good examples of integrated information, such as those described in 2c;
- Operation at the different spatial scale. Some of the available spatial data can be re-scaled according to the considered spatial extent; thus enabling to visualize more details at a higher scale For example the information regarding the coastal ship traffic can be scaled until the very local scale.
- GIS-ICZM includes multi-disciplinary spatial data related to a cross-border (German-Polish) coastal and marine area, thus contributing to support the German-Polish dialogue and cooperation on ICZM;
- Inclusion of functionalities or maps related to assessment of coastal vulnerability to climate change. Oder Estuary was included in the ASTRA project as a case study, whose results (flood risk assessment) are included in the GIS-ICZM.
3b Process related functionalities
Analysis of the ICZM process related functionalities mainly focuses on GIS-ICZM, that includes some of the considered functionalities:

21807-REL-T006.2 Annex 1 – page 21
- The GIS-ICZM includes a high number and a wide variety of spatial information; these are organised according to a two level tree structures. The structure can support research of information useful for problem understanding;
- The GIS-ICZM tool is constantly used to support the various phases of the Oder ICZM process and related projects (including EU funded ones). The development of the whole Web portal was strongly supported by several institutions and administrations, providing a demand driven implementation of the system;
- Support to the German-Polish dialogue and cross-border cooperation on ICZM; indeed many layers refer to a cross-border area;
- Besides being a Web-GIS, the GIS-ICZM does not specifically include tools supporting stakeholder participation. However the portal provides an E-learning Platform “ICZM-D Lerner”. This is a freely accessible web-based learning system consisting of on-line study, information and teaching modules that is a useful tool for the participation and dissemination of the information.
4 Users
4a User typology The system is addressed to local and regional authorities, scientists, Polish and German actors and citizens (also including students and teachers).
5 Use of the system
5a Accessibility
Free access on-line to all of the CIS Oder Estuary and the GIS-ICZM.
Many sections of the CIS Oder Estuary and of the Web-GIS are available in three languages: Polish, German and English.
5b User-friendliness Both the web-portal and GIS-ICZM are highly user-friendly.
The system is available in three languages: German, Polish and English.
5c Interactiveness
Besides being a Web-GIS, the GIS-ICZM does not specifically include tools supporting stakeholder e-participation. However the portal provides an E-learning Platform “ICZM-D Lerner”. This is a freely accessible web-based learning system consisting of on-line study, information and teaching modules that is a useful tool for the participation and dissemination of the information.
5d Data access Only metadata are completely available from this GIS-ICZM through the Metadata Management System (MMS).
6 Technological characteristics
6a Used technology
A first release of the GIS ICZM was developed through ESRI technology.
Use of a licensed software was than perceived as a limitation, mainly for economic reasons. In a second step it was therefore decided to abandon the ERSI technology and adopt an open source software. In particular the system now is developed with

21807-REL-T006.2 Annex 1 – page 22
the UMN MAP SERVER. The UMN MAP SERVER is an Open Source platform for publishing spatial data and interactive mapping applications to the web. This second development has been achieved in collaboration with the University of Rostock.
6b Integration with other tools
The GIS ICZM is not directly integrated with other tools. However it includes outcome of an eutrophication model related to various years.
6c Integration with other CIS
The GIS ICZM of the Oder Estuary is linked (however not directly) to the GIS ICZM M-V, containing data about the coastal area of the whole federal state of Mecklenburg - Vorpommern (M-V). The GIS-ICZM M-V acts as an umbrella system for the GIS ICZM of the Oder Estuary, also aiming to establish a connection to the systems of neighbouring regions: i.e. the federal state Schleswig-Holstein and those in Denmark and Poland.
6d Interoperability
High.
ISO 19115 is the core of the metadata standard of INSPIRE. The ISO 19115 standard was chosen as the GIS ICZM metadata standard. More in general the Web-GIS refers to INSPIRE Directive.
7 Cost/Resources
7a Resources
The whole project ICZM Oder started in May 2004 with a budget of 2 million of Euros for the first 3 years period. It was supported by the Federal Ministry of Education and Research Germany (BMBF). After this successful first three years period (2004-2007), the project was being renewed for other three years (2007-2010).
Between 2004 and 2008, the realisation of the CIS Oder Estuary Web Portal was funded with about € 425,000 provided BMBF, part of phase I and II of the ICZM Oder project. The cost of the implementation of the Web-GIS is about € 365,000.

21807-REL-T006.2 Annex 1 – page 23
Information sources for the overview analysis of GIS ICZM-Oder:
Körfer A., 2008. COPRANET (Coastal Practice Network) – Case study: Integrated Coastal
Zone Management in the Oder (Odra) Estuary Region.
Schernewski G., Bock S., Janßen H., Löser N. and Hmielorz A. (2007): Regional Climate
Change and coasts: A case study on perception, information, dissemination and
education, In: W. Leal Filho, F. Manke & P. Schmidt-Thomé (eds.) (2007): Information,
Communication and Education on Climate Change – European Perspectives,
Umweltbildung, Umweltkommunikation und Nachhaltigkeit, Vol. 26, Peter Lang GmbH,
Frankfurt am Main.
Schuldt B. and Borgwardt K., 2007. Integrative Werkzeuge im IKZM-Oder. Coastal
development: The Oder estuary and beyond Coastline Reports 8 (2007), ISSN 0928-
2734, ISBN 978-3-9811839-0-0 S. 163 – 170.
Thamm R., Bock S. and Schernewski G., 2010. Regional Information Systems and Coastal
Databases for ICZM in Germany – are they efficient and informative? Coastal
development: The Oder estuary and beyond Coastline Reports 8 (2007), ISSN 0928-
2734, ISBN 978-3-9811839-0-0 S. 151 – 161.
Web-site consultation for the overview analysis of GIS ICZM-Oder:
http://ww.ikzm-oder.de/en/startseite.html; last visit on 08/03/2011 at 10.00;
http://ec.europa.eu/ourcoast/index.cfm?menuID=9&articleID=202; last visit on 08/03/2011
at 11.00;
http://balticlagoons.net/?p=291; last visit on 08/03/2011 at 10.30.

21807-REL-T006.2 Annex 1 – page 24
GeoSeaPortal
1 General Information
1a Name GeoSeaPortal
1b Description
GeoSeaPortal is a marine geo-information portal of the German Federal Marine and Hydrographic Agency (BSH), for marine and coastal protection, navigation safety, offshore industry and integrated marine spatial planning. It provides an unique access point to the currently available hydro-oceanographic and geographic data from the BSH. The BSH is also currently developing a central Spatial Data Infrastructure (SDI-BSH); within this SDI the GeoSeaPortal represents a tool allowing to search scientific information using a meta-information system and showing Web-GIS interactive maps. The SDI-BSH will be an important contribute, for marine data, to the national spatial data base (NGDB) and the national spatial data infrastructure (GDI-DE), encouraging sharing and exchanging territorial data in Germany, also in the perspective of the European INSPIRE Directive.
GeoSeaPortal displays data on the Map-Viewer, through WMS services, from several BSH information systems including:
- NAUTHIS, Nautical hydrographic Information System of BSH, offering aid to the commercial navigation, showing e.g. wrecks, obstruction to navigation, seaward limits, hydrography etc.
- CONTIS, Continental Shelf Research Information System, a marine database of BSH on the several (current and planned) uses of the sea
- GVU, a BSH database on water pollution in the German area and the exclusive economic zone;
- MARNET, about BSH environmental monitoring network; - SGE, Shelf Geo Explorer, about BSH geodata on sediment
distribution, thickness, structure of the seabed etc. - MUDAB, German data base for marine data, a joint project
between BSH and the Federal Environmental Agency (UBA), displaying physical and chemical parameters for water and sediment, as well as radiochemical data of seawater.
An overview of the contents of these Web Map Services and the relative URL are provided by the GeoSeaPortal website. The website provides also:
- an overview of the ongoing Spatial Data Infrastructure (SDI -BSH) initiative;
- An user manual for the use of GeoSeaPortal (German only); - The access to the Metadata Portal (to search data and
metadata through keywords or spatial selection), and to the Map-viewer, enabling to visualize, customize, save and print maps.
1c Operating entity German Federal Maritime and Hydrographic Agency (BSH)
1d Management structure
German Federal Maritime and Hydrographic Agency (BSH)

21807-REL-T006.2 Annex 1 – page 25
1d Contacts
Johannes Melles, e-mail: [email protected] (specialist issues).
Jöerg Gerdes, e-mail: [email protected] (technological issues)
GeoSeaPortal site: http://www.bsh.de/de/Meeresdaten/Geodaten/index.jsp
1e Typology Operational
2 Operational context and information content
2a ICZM dimensions
The system (in particular through the Map-Viewer component) mainly addresses four of the five ICZM dimensions: territory (e.g. administrative boundaries, nature/ecological reserve) environment (e.g. monitoring network, pollution data, geological data), economy (e.g. exclusive economic zone, fishery zone, exploitation of resources) and governance dimension (in particular in relation to detailed information on maritime zoning).
2b ICZM Sectors
The information content of GeoSeaPortal is structured in the following themes, each of them includes several layers:
- Bathymetry and coastline - Administration limits - Energy related information (e.g. platforms, pipeline, offshore
wind farms) - Marine Environmental monitoring network - Hydrography - Navigational aids (e.g. buoys, lights, radio radar, etc.) - Rocks wrecks and related obstruction to navigation and other
uses; - Seawards limits, including spatial data on maritime zoning; - Skin of the Earth (dredged areas, depth areas, land areas,
berthing, pontoons…) - Topography - Remote sensing Sea Surface Temperature - Sea Surface Temperature analysis - Prediction model water current, level, salinity and
temperature; - Palaeographic structures; - Seabed sediments - Subsurface sediments - Seabed survey
- Sediment contamination (HCB, PCB, metals)
- Water contamination (metals, nutrients, PAHs, PCB, pesticides).
The above listed information is all relative to the marine area. No information on land is currently available in GeoSeaPortal.
However the GeoSeaPortal structure enables to integrate in the Map Viewer any spatial data available through a WMS connection. In particular the Map Viewer already enables to show spatial data of integrated CIS (see point 6c).
2c Integration No specific integrated information among different data is directly provided within the system
21807-REL-T006.2 Annex 1 – page 26
2d Spatial scale National - German marine area
2e Flexibility GeoSeaPortal has been specifically developed in order to be applied to German marine and coastal area.
3 ICZM functionalities
3a Knowledge related functionalities
GeoSeaPortal provides some of the knowledge related functionalities:
- Although spatial layers cannot be directly downloaded, the system is designed to share them through Web Map Service (WMS). All relative url are provided by GeoSeaPortal;
- Operation at the different spatial scale; some of the available spatial data can be re-scaled according to the considered spatial extent; thus enabling to visualize more details at a higher scales, e.g. bathymetry, etc.
3b Process related functionalities
The system does not currently provides specific ICZM process related functionalities.
4 Users
4a User typology
Potential users are:
- Marine planners and/or managers; actually the system provides useful information (such as spatial data on maritime zoning and uses of the marine spaces)
- Private sector (e.g. industry/energy companies), as for information regarding petroleum platforms, offshore wind farms;
- Specialised/expert users, since original data can be access through WMS connection. These users can be also particularly interested spatial data resulting from modelling activities (e.g. modelling of current, water level, temperature, salinity).
5 Use of the system
5a Accessibility
Data related to the sectors described in point 2b are all freely accessible on-line through the Web-GIS component.
The system also includes a restricted area dedicated to authorised users.
5b User-friendliness
Highly/Medium user friendly
Some components of the web-portal are highly user friendly. This is case of the Metadata Portal that quickly and easily enables to search for metadata and spatial data, also enabling visualization of the latter through a direct integration with the Web-GIS component.
Some other components can be further improved in terms of user-friendliness; such as in the case of the Web-GIS for which for example the spatial data loading is not totally intuitive.
User manual is available in German. The web-portal is in German, including some parts in English
5c Interactiveness The system does not currently include e-participation tools and
21807-REL-T006.2 Annex 1 – page 27
functionalities
5d Data access
All spatial data are accessible by Web Map Services. The Web-GIS enables users to export and print maps.
The system includes a component (Metadata Portal) specifically dedicated to metadata management. This enables to search for and show complete metadata (complying with the ISO 19139 standard.) for each layer. In most of the cases direct link to the specific data web-site is also provided
6 Technological characteristics
6a Used technology
6b Integration with other tools
Through WMS application, Geoseaportal displays data from several information systems managed by BSH (see 1b). GeoSeaPortal is also integrated with BSH remote sensing activities, operating since 1990 with an own facility for the real-time reception and immediate processing of high resolution data from meteorological US satellites.
Finally, as part of oceanographic services, BSH manage a model to simulate the present and future hydrodynamic behaviour of the North Sea and Baltic. GeoSeaPortal is integrated with this tool, displaying data on modelled oceanic currents, sea level height, water temperature and salinity.
6c Integration with other CIS
Through WMS, GeoSeaPortal is directly integrated to the following systems:
- HELCOM map and data service, providing data for the whole Baltic Regional Sea;
- GRID-Arendal system, collaborating centre of the United Nations Environment Programme (UNEP), established by the Government of Norway as a Norwegian Foundation, to communicate environmental information to policy-makers and facilitate environmental decision-making for change;
- Geography network, geographic data provided by ESRI
6d Interoperability
High
Metadata are compliant with the ISO 19139 international standard, related to the INSPIRE Directive. Interoperability is properly managed through WMS.
7 Costs/Resources
7a Resources
Web-site consultation for the overview analysis of the GeoSeaPortal.
http://www.bsh.de/de/Meeresdaten/Geodaten/index.jsp; last visit on 01/04/2011 at 13.00.

21807-REL-T006.2 Annex 1 – page 28
Coastal Information System supporting Fish Farming in Denmark
1 General Information
1a Name Coastal Information System supporting Fish Farming in Denmark (CIS-FFD) – (Placering af havbrug i Danmark).
1b Description
Coastal Information System supporting Fish Farming in Denmark (CIS-FFD) is a Web-GIS tool specifically aiming to provide data and functionalities for the planning and management of fish aquaculture in the Denmark coastal areas. This CIS provides a comprehensive overview of all the regulatory constraints, environmental and territorial act on Danish territorial waters. In this perspective this CIS includes a wide variety of data related to the Danish coastal area which may be relevant for other purposes related to ICZM, too.
Danish government aims to promote fish production through sustainable marine fish farming in Denmark. In this perspective, in 2001 it established an Aquaculture Committee to deal with the sustainable development of this economic activity. The Committee established working groups dealing with specific aspects; one of them was in charge to address the scientific basis for the proper zoning of new marine fish farming sites in Denmark.
This activity produced a series of GIS information that are presently collected in and made available by the Web-GIS. This tool in currently updated and its information may be useful for fish farmers (for example to set a new or expand an existing fish aquaculture site) or for local authorities dealing with fish farming regulation and licensing. The Web-GIS in particular includes spatial information enabling identifying areas that are not suitable (due to environmental conditions) or not usable (e.g. coastal and marine protected areas) for fish farming, thus providing data for a proper site identification.
1c Operating entity DTU Aqua – National Institute of Aquatic Resources Technical University of Denmark (DTU)
1d Management structure
National Institute of Aquatic Resources
Section for Coastal Ecology - DTU Aqua
1e Contacts
Suzanne Rindom, e-mail: [email protected]
Communications Officer National Institute of Aquatic Resources Section for Coastal Ecology DTU Aqua - Technical University of Denmark Charlottenlund Slot Jægersborg Allé 1 2920 Charlottenlund
Denmark Web-GIS: http://gis.dfu.min.dk/website/Havbrug/viewer.htm
1f Typology Operational
2 Operational context and information content
21807-REL-T006.2 Annex 1 – page 29
2a ICZM dimensions
The Web-GIS addresses more ICZM dimension: territory (e.g. marine protected areas, Ramsar Site, etc.), economy (pipeline, corridor for the navigation, mining for beach nourishment, etc.) and environment (e.g. chemical and physics characteristics of the sea water, such as temperature and salinity). The governance dimension is also considered in this CIS; besides including some background information (licensed area to be used for sand excavation), the CIS also contains a specific layer representing the results of the planning effort, i.e. classification of licensable reservation for the location of marine fish farming in Denmark. Indeed this CIS has been used as an important tool in the planning process.
2b ICZM Sectors
GIS layers are organised in three categories:
- Constraints for fish farming development due to other uses, e.g.: areas already used for fish farming, safety zone for maritime transportation and underwater cables and pipelines, mining zones, freshwater areas, safety zone around oil platforms, hazard zones (e.g. due to the presence of mines on the sea bottom);
- Constrains to fish farming development due to regulation, e.g.: Nature 2000 areas, Ramsar site, other high-values areas, military areas, areas of biological relevance, areas under other specific regulations, etc.
- Territorial and environmental information useful for the identification of suitable areas for fish farming development, related to: proximity of existing fish farming sites, proximity to dumping sites, proximity to wastewater discharges, water depth, water salinity and temperature, wave height and hydrodynamic, tidal characteristics.
2c Integration
This Web-GIS supports the integrated assessment of the Danish marine coastal area, providing a common platform to integrate spatial and environmental information, aiming to identify the most suitable area for fish farming in the Exclusive Economic Zone of Denmark. Final results of the assessment (map of the areas with total or partial or any restriction to fish farming) are included in the CIS.
2d Spatial scale National Scale – Sea and coastal zone in Denmark.
Basically, the analysis was conducted for (and the Web-GIS refers to) the entire Exclusive Economic Zone (EEZ) of Denmark.
2d Flexibility
The Web-GIS been developed in order to be applied to the specific marine coastal territory of Denmark. Even if it has been specifically developed to identify area suitable for fish farming and to support related licensing procedures, the CIS provides data useful for other aspects related to ICZM.
The Web-GIS structure is very similar to the one used to implement the Limfjorden Coastal Information System.
3 ICZM functionalities
21807-REL-T006.2 Annex 1 – page 30
3a Knowledge related functionalities
The Web-GIS supports the integrated assessment of territorial and environmental information of the Danish EEZ, in particular enabling to identify and map those areas that are suitable (totally or partially) for fish farming.
3b Process related functionalities
This Web-GIS provides a conceptual model for problems related to fish farming in the marine areas of Denmark.
It therefore clearly supports problem understanding and structuring. Although the CIS is focusing on sector aspects (fish farming), there is clear intention to evaluate interrelations and conflicts with other human activities (e.g. navigation, sediment dredging, port activity, nature protection, environmental quality preservation, recreation activities) in an ICZM perspective.
4 Users
4a User typology Users of the system are mainly coastal planners and/or managers dealing with fish farming regulation as well as representative of the private sector (fishermen and fish farmers).
5 Use of the system
5a Accessibility Free access on-line to the complete Web-GIS.
5b User-friendliness
Medium.
The use of the web-GIS on-line is rather simple and user-friendly, however a specific help on-line documentation is not available. The Web-GIS is available only in Danish language.
5c Interactiveness No specific e-participation tools are available.
5d Data access
The Web-GIS does not enable to download spatial data, while it provides the possibility to print simply customized maps.
Metadata description is available for each layer; however metadata do not fulfil the INSPIRE Directive requirements.
6 Technological characteristics
6a Used technology The Web-GIS is developed with ArcIMS server (ESRI licensed software).
6b Integration with other tools
No specific integration with other tools
6c Integration with other CIS
The Web-GIS is not directly integrated with other coastal information systems. However, the DTU Aqua (National Institute of Aquatic Resources) provides link to other GIS on related arguments from the same Web-page from which the Limfjorden CIS can be accessed. These are:
- “Blåmuslinger”: GIS containing information regarding the productivity of mussels in the Danish territorial water.
- “Limfjorden”: Web-GIS tool specifically aiming to provide data and functionalities for the planning and management of mussel farming and fishing activities in the Limfjord area.
21807-REL-T006.2 Annex 1 – page 31
6d Interoperability Low.
There is no compliance with the INSPIRE DIRECTIVE and with the standard of the collected metadata (ISO 19115).
7 Cost/Resources
7a Resources
Web-site consultation for the overview analysis of the CIS-FFD:
http://www.praesten.dtu.dk/Inst/AQUA/Om_DTU_Aqua/Afdelinger/Faglige_stottefunktioner/
GIS.aspx; last visit on 01/03/2011 at 14.00.
http://gis.dfu.min.dk/website/Havbrug/viewer.htm; last visit on 01/03/2011 at 16.00.

21807-REL-T006.2 Annex 1 – page 32
NOKIS - North Sea and Baltic Sea Coastal Information System
NOKIS web site (www.nokis.org) has not been active during the implementation of the
overview analysis since it is undergoing significant further development. The current
description is therefore based on available literature. Due to the unavailability of the on-line
system the description of NOKIS is partial; the new development could significantly change
the contents of this description. For these reasons, a full analytical sheet is not provided for
the NOKIS system.
NOKIS was a joint project of KFKI (German Coastal Engineering Research Council) and BAW
(Federal Waterways and Research Institute) with the main objective to establish a metadata
information system for the North Sea and Baltic Sea coastal regions (Kazakos, 2004). The
project NOKIS (2002-2004) is now finished but its activity is continuing and widening within
NOKIS ++ , “Information Infrastructures for the North Sea and Baltic Sea Coast as
Contribution to Integrated Coastal Zone Management" (2004-2008), focusing on the
integration of different data sources from participants all over the coast. NOKIS and NOKIS ++ are both funded by the German Federal Ministry of Education and Research.
The initial motivation for the project NOKIS was the lack of an infrastructure for the exchange
of geodata across administrative boundaries between the German Wadden sea national parks
and other governmental administrations (e.g. water management and administration of
waterways and navigation) on the federal and state levels. Today, around 20 partners from
administration, research and industry are cooperating within NOKIS.
The geographical area involved in the NOKIS system includes the German coast of North Sea
and Baltic Sea, as shown in Figure 1. It includes the National Park of Schleswig-Holstein,
Wadden Sea, with 440,000 ha and 400 km coast.
Met. Sat. 9
(c) Google Earth, 2007
120 km
Tönning
Met. Sat. 9
(c) Google Earth, 2007(c) Google Earth, 2007
120 km120 km120 km
TönningTönning
Figure 1 Geographical coverage of NOKIS (Kohlus and Heidmann, 2007).
21807-REL-T006.2 Annex 1 – page 33
The platform offers information about the German coastal zone including abstracts of coastal
journals, completed and on-going research projects, and it provides a number of recent project
reports. The database is bi-lingual (German and English) to ensure international accessibility.
Project partners from a variety of research institutions and state agencies cooperated in
NOKIS. As a result, the central metadata repository includes documentation about a wide
range of data types commonly used. Examples include GIS data from the national park
offices, containing monitoring results from the German Wadden Sea as well as extensive time
series from tidal gauges which are maintained by coastal protection authorities on state level
(Heidmann et al., 2008).
Metadata, “data about data”, supply standardised basic information about data records like
documents, maps or series of measurements, making easier data searching, exchanging and
processing. The NOKIS metadata model is fully compliant with the standards for
geoinformation of the International Organization for Standardization (ISO), guaranteeing
sufficient meta information available for documentation and intelligent search methods. The
most important standard for NOKIS (Heidmann et al., 2008) are ISO 19115 (Geographic
information – Metadata), ISO 19136 (Geographic information – Geography Markup Language)
and ISO 19139 (Geographic information - Metadata - XML schema).
The overall architecture of the NOKIS system consists mainly of local metadata bases and a
central server located at BAW. Original data remain on local, while metadata, generated
locally, are then uploaded to the central NOKIS metadata server. Any proprietary information
is filtered out during this replication process (Lehfeldt & Heidmann, 2002). The NOKIS multi-
lingual Editor is the central tool for the generation and maintenance of metadata records,
allowing the user in creating valid ISO 19115/19119 metadata. There are no license fees since
NOKIS is based on open source software, and each declared partner is granted the right of
use for the metadata editor.
Furthermore NOKIS makes available different services, including (Heidmann et al., 2008):
An OGC Catalogue Services, holding information about the data, about data access
services, and about the services available for visualization and analysis. The catalogue
services provide standard-compliant metadata to serve higher level metadata information
systems in Germany, like Geoportal.Bund of the GDI-DE, PortalU for environmental
information and in the future INSPIRE.
A Coastal Gazetteer, to support users in retrieving spatial information. It stores complete
place names (many places may have more than one name, either because it changed
with the time or because of different languages) and geometries for the coastal zone
allowing users with options to run spatial queries not only defining a spatial extent but also
entering geographical search terms. They are checked against the gazetteer vocabulary
and all existing geometries. The NOKIS gazetteer also covers the temporal variability of
geometries and names, which is normally not included in conventional gazetteers but
which is of special interest for the tidal flats along the German coast.
A Data Access Service, to provide ways to access the information itself and not only to
metadata;
Visualization services, focusing on the visualization of time series and field data, which is
not or only insufficiently covered by the OGC services, as for example vector field data
(e.g. wind fields or current fields) and vector point data (e.g. wind direction and speed at a
certain point).
21807-REL-T006.2 Annex 1 – page 34
Information sources for the overview analysis of Atlas of Nokis:
Lehfeldt, R., Heidmann, C., "NOKIS - a metadata information system for German coastal
regions of the North Sea and Baltic Sea", Proc. Hydroinformatics 2002, Cardiff, Vol. 2,
(2002), pp 1506-1512.
Heidmann,C., Sellerhoff, F., Lehfeldt, R., Valikov, A., Kazakos, W., 2008. Providing
Access to Environmental Data in a SOA in NOKIS. Environmental Informatics and
Industrial Ecology. The NOKIS project has been completed. All data are now available in
the following portals: Proceedings of 22nd international conference on informatics for
environmental protection.
W. Kazakos, W., 2004. Metadata in Coastal Areas – Perspectives and Experiences. In: G.
Schernewski & N. Löser (eds.): Managing the Baltic Sea. Coastline Reports 2, ISSN 0928-
2734 S. 245 – 250.
Kohlus, J., and Heidman, C., 2007. Nokis. North and Baltic Sea Information-System
Information Infrastructure for the North and Baltic Sea. Enviroinfo2007. Warsaw, Sept 12-
14, 2007.
21807-REL-T006.2 Annex 1 – page 35
Limfjorden Coastal Information System
1 General Information
1a Name Limfjorden Coastal Information System
1b Description
Limfjorden Coastal Information System is a Web-GIS tool specifically aiming to provide data and functionalities for the planning and management of mussel farming and fishing activities in the Limfjord area. In this perspective the CIS includes a wide variety of data related to the coastal area which may be relevant for other purposes related to ICZM, too. With a coastline of 1.000 km the Limfjord is the largest fjord in Denmark. The fjord is strongly impacted by intensive mussel (blue mussels and flat oyster) commercial fishery. National policy aims to support the sustainable use of Limfjord’s natural resources, in particular improving the sustainable production of cultured mussels in balance with the extensive fishery of blue mussels and flat oysters. In order to ensure an efficient procedure of the preparation and evaluation of applications for culturing licenses, a production area classification was conducted involving central and local authorities and organisations. The production areas were classified in areas not available for mussel production (e.g. harbours, polluted areas), areas with restrictions for certain forms for mussel production (e.g. national and international nature protected areas, navigation corridors, areas of recreational interests), and areas without any restrictions. Furthermore, the stocks of blue mussels and flat oyster were mapped in order to identify important fishing grounds. Through the GIS analysis fishing grounds for trawling of herring and sprat were identified, too. Limfjord has also been included as case-study in the European funded SPICOSA project (Science and Policy Integration for COastal System Assessment).
1c Operating entity National Institute of Aquatic Resources Section for Coastal Ecology - DTU Aqua
1d Management structure
National Institute of Aquatic Resources Section for Coastal Ecology - DTU Aqua
1e Contacts
Per Dolmer, e-mail: [email protected] Kerstin Geitner, e-mail: [email protected] National Institute of Aquatic Resources Section for Coastal Ecology DTU Aqua - Technical University of Denmark Charlottenlund Slot Jægersborg Allé 1 2920 Charlottenlund Denmark Web-GIS: http://gis.dfu.min.dk/website/Limfjord/viewer.htm
1f Typology Operational
21807-REL-T006.2 Annex 1 – page 36
2 Operational context and information content
2a ICZM dimensions
The CIS addresses more ICZM dimension: territory (marine protected areas, bathing beaches and areas close to summer houses), economy (pipeline, corridor for the navigation) and environment (polluted areas). The governance dimension is also considered in this CIS; besides including some background information (licensed area to be used for sand excavation), the CIS also contains a specific layer representing the results of the planning effort, i.e. classification of licensable productive areas according to total, partial or any restriction to mussel production. Indeed this CIS has been used as an important tool in the planning process.
2b ICZM Sectors
GIS layers are organised in three categories:
- Areas not available to mussel production: Harbours, Depots of dredged sediments, Streams polluted with discharged water, Local polluted areas, Pipes and cables;
- Areas available for some forms of mussel production: Areas regulated by international nature protection directives (Habitat, Ramsar, Bird Directives); Areas regulated by national nature protection directives; Mussel fishing areas; Areas with eel grass and macroalgae; Areas included in monitoring programme of macroalgae; Areas with stone reefs; Areas close to summerhouses; Areas close to bathing beaches; Navigational corridors; Areas for the extraction of sediments;
- Areas with fishing grounds: Blue mussels; Flat oyster; Herring/sprat
2c Integration
The CIS supports the integrated assessment of the Limfjorden area, providing a common platform to integrate various spatial and environmental information, aiming to identify the most suitable are for the sustainable production of cultured mussels in balance with the extensive fishery. Final results of the assessment (map of the areas with total, partial or any restriction to mussel farming) are included in the CIS.
2d Spatial scale Local scale – Limfjorden fjord in the North-West of Denmark.
2d Flexibility
The CIS been developed in order to be applied to the specific coastal territory of Limfjorden. Even if it has been specifically developed to identify area suitable for mussel farming and to support related licensing procedures, the CIS provides data useful for other aspects related to ICZM.
3 ICZM functionalities
3a Knowledge related functionalities
The CIS supports the integrated assessment of territorial and environmental information of the Limfjorden area, in particular enabling to identify and map those are that are suitable (totally or partially) for mussel farming and the areas that are important for fishing activities.
3b Process related functionalities
This CIS provides a conceptual model of problems related to mussel farming and fishing in the Limfjorden area. It therefore clearly supports problem understanding and structuring. Although

21807-REL-T006.2 Annex 1 – page 37
the CIS is focusing on sector aspects (mussel farming and fishing), there is clear intention to evaluate interrelations and conflicts with other human activities (e.g. navigation, sediment dredging, port activity, nature protection, environmental quality preservation, recreation activities) in an ICZM perspective. The tool has been actually used in the planning process, also involving mussel farmers and authorities (Dolmer and Geitner, 2004).
4 Users
4a User typology Users of the system are mainly coastal planners and/or managers dealing with the mussel production regulation as well as representative of the private sector (fishermen and mussel farmers).
5 Use of the system
5a Accessibility Free access on-line (access allowed to all users with or without password) to the complete CIS.
5b User-friendliness The use of the web-GIS on-line is rather simple and user-friendly, however a specific help on-line documentation is not available. The web-GIS is available only in Danish language.
5c Interactiveness No specific e-participation tools are available.
5d Data access
The does not enable to download spatial data, while it provides the possibility to print simply customized maps. Metadata description is available for each layer; however metadata do not fulfil the INSPIRE Directive requirements.
6 Technological characteristics
6a Used technology The CIS is developed with ArcIMS server (ESRI licensed software).
6b Integration with other tools
No specific integration with other tools
6c Integration with other CIS
The Limfjorden CIS is not directly integrated with other coastal information systems. However, the Danish Institute for Fisheries Research (Denmark Fiskeriundersøgelser - DFU) provides link to other GIS on related arguments from the same Web-page from which the Limfjorden CIS can be accessed. These are: - “Blåmuslinger”: GIS containing information regarding the
productivity of mussels in the Danish territorial water. - “Placering af havbrug”: GIS including information on aquaculture
activities in the Danish territorial water. This CIS provides a comprehensive overview of all the regulatory constraints, environmental and territorial act on Danish territorial waters.
6d Interoperability Low. There is no compliance with the INSPIRE DIRECTIVE and with the standard of the collected metadata (ISO 19115).
7 Cost/Resources
7a Resources
21807-REL-T006.2 Annex 1 – page 38
Information sources for the overview analysis of Limfjord Coastal Information System:
Dolmer P. and Geitner K., 2004. Integrated Coastal Zone Management of cultures and
fishery of mussels in Limfjorden, Denmark. In journal: ICES C.M. 2004/ (ISSN: ) , vol: V:07,
pages: 1-9, 2004. Type: Full conference paper publ. in journal. Presented at: ICES Council
Meeting, 2004.
Dolmer P. and Geitner K., 2007. Integrated Coastal Zone Management of cultures and
fishery of mussels in Limfjorden, Denmark. part of: Abstracts from Nordic Workshop on
Marine Spatial Planning. 6.- 8. June, Copenhagen, Denmark.
Web-site consultation for the overview analysis of Limfjord Coastal Information System:
Http://www.praesten.dtu.dk/Inst/AQUA/Om_DTU_Aqua/Afdelinger/Faglige_stottefunktioner
/GIS.aspx; last visit on 01/03/2011 at 14.00.
http://gis.dfu.min.dk/website/Limfjord/viewer.htm; last visit on 01/03/2011 at 16.00.
21807-REL-T006.2 Annex 1 – page 39
The Trilateral Wadden Sea Cooperation web-site
1 General Information
1a Name The Trilateral Wadden Sea Cooperation web-site
1b Description
The Trilateral Wadden Sea Cooperation (TWSC) web-site is maintained by the Common Wadden Sea Secretariat (CWSS) to enhance public access to information about the Wadden Sea Area and its protection.
Since 1978, the responsible ministries of the Netherlands (Minister of Agriculture, Nature and Food Quality), Denmark (Minister of the Environment) and Germany (Federal Minister for the Environment, Nature Conservation and Nuclear Safety) have been working together on the protection and conservation of the Wadden Sea covering management, monitoring and research, as well as political matters. Thus they established the Trilateral Wadden Sea Cooperation that was built upon a Joint Declaration on the Protection of the Wadden Sea adopted in 1982. The challenge of the Trilateral Wadden Sea Cooperation (TWSC) is to implement ecosystem management of the Wadden Sea Area by applying and integrating relevant EU Directives, as set out in point 6 of the Schiermonnikoog Declaration (2005).
The TWSC web-site is structured in the following sections:
- “Trilateral Cooperation” provides information on the history of the cooperation, the reference area, the organizational structure, the structured of the CWSS and the international collaboration;
- “News/Service” provides link to the CWSS e-mail Newsletter, and other communication and training services;
- “Management” provides direct access to specific information regarding different topics. In particular this section allows the download of the Wadden Sea Plan 2010. Within this section is also possible to access information regarding the Wadden Sea World Heritage, the NATURA 2000 Wadden Sea zones, the Shipping and the Particularly Sensitive Sea Area (PSSA), Coastal Protection and Sea Level Rise (CPSL) and the Eutrophication Criteria.
- “Trilateral Monitoring and Assessment Program (TMAP),” provides all the information generated by this monitoring program. This in particular is related to twelve main topics; for each of them TMAP section provides static maps, documents and/or graphic (no spatial layers). The same section also includes all the information (documents) contained in the Quality Status Report published in December 2009.
TWSC site does not include on-line mapping viewers or tools.
The same web-site also includes a direct link to the Wadden Sea Forum (WSFM; http://www.waddensea-forum.org/). This forum is an independent platform of stakeholders from Denmark, Germany and The Netherlands aiming to contribute to an advanced and sustainable development of the trilateral Wadden Sea Region. The WSF was established in 2002 and consists of representatives of the following main sectors: agriculture, energy,
21807-REL-T006.2 Annex 1 – page 40
fisheries, industry and harbour, nature protection, tourism, as well as local and regional governments. National governments are represented as observers.
1c Operating entity Common Wadden Sea Secretariat (CWSS)
1d Management structure
Common Wadden Sea Secretariat (CWSS)
1d Contacts
Dr. Harald Marencic, e-mail: [email protected] e-mail: [email protected] Common Wadden Sea Secretariat Virchowstr. 1 D 26382 Wilhelmshaven Germany Web-site: http://www.waddensea-secretariat.org/index.html
1e Typology Operational
2 Operational context and information content
2a ICZM dimensions
TWSC web-site mainly addresses three of the five considered information dimensions. The environment and the territory dimensions are in depth developed and made available in the TMAP section (in the forms of documents, maps and/or graphs).
The web-site also provides other documental information through its various section. In this perspective it is important to highlight the planning documents (governance dimension) provide by the “Management” section, in particular including the Trilateral Wadden Sea Plan 2010.
2b ICZM Sectors
TMAP section includes documents, static maps and/or graphics related the following twelve topics:
- Physical environment; - Habitats and maps; - Climate and sea level rise; - Hazardous substances; - Eutrophication; - Alien species; - Estuaries; - Salt marshes; - Tidal area; - Dunes; - Fish; - Birds; - Marine mammals.
2c Integration
Some of the information contained in the web-site has been produced by integrating different data typologies. An example is the Map of the Particularly Sensitive Sea Area (PSSA); identifying areas needing special protection due to their ecological, socio-economic or scientific relevance and due to their vulnerability to maritime activities.

21807-REL-T006.2 Annex 1 – page 41
2d Spatial scale Transnational – Wadden Sea, including the relative Danish, German and Dutch components.
2e Flexibility TWSC web-site was specifically developed to deal with the international cooperation in the Wadden Sea integrated planning and management.
3 ICZM functionalities
3a Knowledge related functionalities
Two knowledge related functionalities are provided by the TWSC web-site:
- Integration among different information sectors (see point 2c);
- Inclusion of a specific TMAP thematic section related to climate change impacts on the Wadden Sea (only documents are made available).
It is important to stress again that TWSC web-site does not provide any interactive mapping functionality and therefore spatial data.
3b Process related functionalities
TWSC web-site provides some of the ICZM process related functionalities considered by the analysis; specifically:
- It supports problem understanding and structuring by providing structured and easy-to-use information on various territorial and environmental topics relevant for the Wadden Sea management;
- It includes a direct link to the Wadden Sea Forum (WSF –see: http://www.waddensea-forum.org/), thus supporting stakeholder involvement and participation.
- It supports monitoring and evaluation of planning processes; information included in the TMAP section (result of the TMAP project) is used to assess the implementation of the measures set out in the Wadden Sea Plan 2010 (WSP-2010).
- It fully supports cooperation among the three Wadden Sea countries the joint management of this complex marine and coastal system. Indeed, the web-portal itself was designed and development within the cooperative framework.
4 Users
4a User typology
Information is mainly provided in terms of documents including static maps and/or graphics. These can be directly used in the planning and management process. Main target users therefore are: - Decision-makers; - Coastal planners and/or managers;
The same information can be also very useful for communication purposes, thus involving the civil society user typology.
5 Use of the system
5a Accessibility Free access on-line to all the TWSC web-site contents and functionalities.
21807-REL-T006.2 Annex 1 – page 42
5b User-friendliness
Highly user-friendly.
Logic structure in themes and sub-themes is particularly helpful. Searching and visualising tools support the use of the system. The system is available in English.
5c Interactiveness
TWSC web-site does not directly include e-participation tools. However, two initiatives are worth to be mentioned: - The web-site includes a direct link to the Wadden Sea
Forum (WSF – see: http://www.waddensea-forum.org/). This forum is an independent platform of stakeholders from Denmark, Germany and The Netherlands aiming to contribute to an advanced and sustainable development of the trilateral Wadden Sea Region;
- The International Wadden Sea School (IWSS); an educational programme for school classes from the Wadden Sea countries, in particular aiming to transfer the trans-boundary approach to the management of the Wadden Sea to the young generations.
5d Data access
No alphanumeric and spatial data are directly provided by the web-site. Data and information are available only within documents.
Data can be anyhow requested through a registration form.
6 Technological characteristics
6a Used technology TWSC-CIS is a web-site developed with “html” languages and standards.
6b Integration with other tools
No specific integration with other tools
6c Integration with other CIS
No specific integration with other CIS
6d Interoperability Not applicable
7 Cost/resources
7a Resources
Web-site consultation for the overview analysis of the Trilateral Wadden Sea Cooperation:
http://www.waddensea-secretariat.org; last visit on 11/04/2011 at 10.30;
http://www.waddensea-forum.org/; last visit on 11/04/2011 at 11.30;
http://www.lancewadplan.org/; last visit on 11/04/2011 at 12.30.
21807-REL-T006.2 Annex 1 – page 43
ScheldeMonitor web portal
1 General Information
1a Name ScheldeMonitor web portal
1b Description
The ScheldeMonitor is a web-portal providing information, data and indicators concerning the Scheldt Estuary area, including part of the Belgian and Dutch territory.
Flanders and Netherlands formalised their cooperation on the sustainable management of the Schlede estuary by the December 21, 2005 Treaty. The Flemish-Dutch Scheldt Commission (VNSC) is the instrument for the implementation of common objectives related to sustainable policy and management, in particular focusing on: security against floods, optimal accessibility of the Scheldt ports and maintenance of a healthy and dynamic estuary ecosystem. The first ScheldeMonitor project started on December 2003 (before the implementation of the Treaty and the creation of VNSC Commission); the related web-portal has been continuously innovated and updated. In 2010 ScheldeMonitor knew an evolution from Scheldt information system to portal of information, data and indicators on research and monitoring of the Scheldt estuary. Currently the fourth phase of project is under going, in particular aiming to improve support of the web-portal to the integrated monitoring and ICZM in general of the Scheldt Estuary.
In particular the ScheldeMonitor web-portal contains a great number of publications, datasets, links and maps related to this estuary. The web portal offers three different options to explore and search for the various typology of information included in the same system:
- Information; this section enables to search for different information (metadata) related to various typology of elements: persons, institutes, publications, journals, projects, events, datasets, maps, urls. Information can be searched through simple and advance queries based on key words. For some element this option also enables to access to the searched element (for example a map or a dataset);
- Data portal: this second option gives access to a wide variety of information collected in the web portal and provided by different sources and in different formats (parameters, data sources, map layers, figures, dataset and publications). Selection is performed through a window menu; results of the selection can be than visualised (for each information a metadata description is also made available) and downloaded (for a great part of the information). Georeferred information can be spatially showed through a Web-GIS component, either on a cartographic base or on Google maps.
- Indicators: The list of the available indicators (17) is reported in section 2b. The indicators for the Scheldt Estuary are framed within the ‘Target 2030’ of the Long Term Vision (LTV) for the Scheldt Estuary. These indicators can serve as
21807-REL-T006.2 Annex 1 – page 44
a tool for the exploration, planning, implementation and analysis of policies and are also useful as a link between scientific research and policy.
In addiction the research can be refine by selecting a specific theme among the following available ones: shipping, safety, hydrodynamics, morphodynamics, physical characteristics and biochemistry, habitat diversity, ecology and diversity, fisheries, socio-economical system, administration and law, recreation and tourism.
The user can also start the research by selecting on of the available theme; in such case, the user can directly access:
- the list of the metadata and the data document related to the chosen theme;
- the data-portal and its web-GIS application with the list of all data (including spatial ones) related with to the chosen theme;
- the list of the indicators related to the chosen theme.
1c Operating entity
The development of the ScheldeMonitor web-portal was funded by the Executive Secretariat of Flemish-Dutch Scheldt Commission (in Dutch: Vlaams Nederlandse Schelde Commissie) (VNSC). The Flemish and Dutch governments have drawn up a new working structure for their joint research and monitoring program, involving: - The Flemish Ministry of Mobility and Public Works,
Department of Mobility and Public Works, Maritime Access Division;
- The Dutch Ministry of Infrastructure and the Environment, Rijkswaterstaat, Centre for Water Management Water service.
The representative of the contractor is the Flanders Marine Institute (VLIZ).
1d Management structure
Flanders Marine Institute (VLIZ)
1d Contacts
Klaas Deneudt, e-mail: [email protected]
Vlaams Instituut voor de Zee VLIZ - InnovOcean site Wandelaarkaai 7 8400 Oostende Belgium
ScheldeMonitor Web-Portal: http://www.scheldemonitor.org/home.php
1e Typology Operational
2 Operational context and information content
2a ICZM dimensions
The ScheldeMonitor Web-Portal mainly addresses all the five considered information dimensions. The environment and the territory dimension are in depth developed. The economic information in the system is provided with layers regarding tourism, recreation, fisheries, shipping and port development. The social dimension is addressed by the specific socio-economic

21807-REL-T006.2 Annex 1 – page 45
theme. Governance is related to the administration and law theme. The five dimensions are also considered by the 17 indicators system.
2b ICZM Sectors
Information (of different typology) that can be accessed through the “data” options are structured in and related to the following themes and sub-themes:
- Shipping: navigation channel, harbour development, nautical management, inland shipping, ocean shipping, recreation, risk;
- Safety: history, flooding, risks, future; - Hydrodynamics: water balance, water level and tide, waves,
current; - Morphodynamics: sand extraction, dredging and dumping,
geomorphology, ecotopes and physiotopes; - Physical characteristics and biochemistry: physical
parameters, water quality, sediment quality, air quality, pollution, light climate;
- Habitat diversity: ecotopes and physiotopes, nature development, habitats and nature areas;
- Ecology and diversity: vegetation, plankton, benthos, fish, birds, mammals, amphibian, macrophytes, ecological functioning;
- Fisheries; - Socio-economical system; - Administration and law; - Recreation and tourism.
The 17 indicators included in the system are (some of them can be related to various themes):
- Shipping (socio-economic importance of ports, nautical management, soil interfering activities and environmental effects of ports and shipping);
- Safety (safety against flooding and protection and development of natural areas);
- Hydrodynamics (morphology and dynamics in the estuary); - Morphodynamics (oil interfering activities, morphology and
dynamics in the estuary); - Physical characteristic and biochemistry (surface water
quality, environmental effects of ports and shipping, loads of pollutant substances);
- Habitat diversity (status of species and habitats, protection and development of natural areas and opportunities for nature);
- Ecology and Diversity (status of species and habitats, threats to biodiversity and opportunities for nature);
- Fisheries (Fisheries pressure); - Socio-economical system (population pressure, socio-
economic importance of residential tourism, fisheries, societal response and co-operation and use of the instrument 'indicators for the Scheldt estuary');
- Recreation and tourism (opportunities for recreation on water and land and socio-economic importance of residential tourism).
21807-REL-T006.2 Annex 1 – page 46
2c Integration
The system provides various information data can be considered as results of an integrated analysis. There are for example various data and information (including maps) related risk, including flooding. Furthermore the system includes 17 indicators that in most of the cases are the results of an integrated evaluation of different data (see point 2b).
2d Spatial scale Transnational scale – Schelde Estuary zone, including the Dutch and Belgium areas.
2e Flexibility ScheldeMonitor web-portal was specifically developed to address the coastal and the estuary zone of the Schelde river between the Flanders and the Dutch Regions.
3 ICZM functionalities
3a Knowledge related functionalities
ScheldeMonitor web-portal provides many of the knowledge related functionalities considered by the analysis, specifically:
- Integration among different information sectors (see point 2c);
- Full availability of data and information; the system allows the availability of a wide variety of information typology (parameters, data sources, map layers, figures, dataset and publications). Many information (including spatial) can be downloaded.
- Operation at the different spatial scale; some of the available spatial data can be re-scaled according to the considered spatial extent; thus enabling to visualize more details at a higher scales;
- Availability of multi-time data, for example in the case of spatial data, multi-time maps are provided for the geomorphologic features of the territory (7 different time step from the 1936 to 2004);
- Inclusion of ICZM indicators; the web-portal includes 17 indicators related to various themes which are particularly relevant in supporting ICZM steps. The indicator functionality is rather advanced. The specific indicator window makes available: key message related to the indicator, summary sheet, technical sheets on measures used to calculate the indicator, links to data suppliers, link to the data portal enabling to view the data correlated to the specific considered indicator. The indicator summary appears to be particularly useful to support policy and decision making.
3b Process related functionalities
Schelde Monitor Web-portal provides relevant illustrative and innovative examples of ICZM process related functionalities considered by the analysis, specifically:
- ScheldeMonitor provides a wide support to problem understanding and structuring. It contains a wide variety of information and a high number of data. All are structured according to theme and sub-themes, thus already providing a conceptual structure of the many data and information available. The portal enables users to search for data and information through intuitive and user friendly functionalities.
- Many of the information can properly support planning and
21807-REL-T006.2 Annex 1 – page 47
management phases of the ICZM process. This is particularly evident for the indicators, which represent a synthetic information very useful in supporting policy and decision making.
- Indicators can be particularly relevant in supporting progress towards defined targets, and specifically the Target 2030 of the Long Term Vision (LTV); thus they can properly support adaptive management. In this perspective it is interesting to highlight that the set also includes an indicator specifically dealing with the use of the indicators instruments by target users.
- Stakeholder involvement and participation; the ScheldeMonitor web portal includes the “e-room” tool. This is a virtual project-space that offers an online environment where minutes, reports, calendars can be kept and shared with others users within the Research and Monitoring of the Scheldt-estuary (O&M) project. A calendar is used to show a clear overview of planned meetings and workshops. Login and password are needed to gain access to the e-room. Furthermore, An email with new literature, datasets, projects and conferences, is transmitted bimonthly.
- ScheldeMonitor fully supports cooperation among authorities of two different member states in the joint management of the complex Schlede Estuary system. Indeed, the web-portal itself was designed and development within the cooperative framework.
4 Users
4a User typology
The broad nature of the Schelde Monitor CIS is intended for anyone who may be interested in estuary and marine information in this zone. For this reason potential users are:
- Decision-makers;
- Coastal planners and/or managers;
- Specialised and expert users.
- Civil society.
The various information typologies included in the web-portal have different user targets. Indicators are for example very relevant for policy and decision making as well as for communication. Raw spatial and numeric data can support activities of experts, including researches. Maps may be more useful for coastal planners and managers.
5 Use of the system
5a Accessibility
Free access on-line to all the system described in this sheet. Some parts of the site are protected and can be accessed only with login and password. Accounts are granted to certain groups within the scope of specific projects (MONEOS, VNSC, ...).
5b User-friendliness
Highly user-friendly.
The web-portal offers a wide variety of information and searching/visualising tools. Notwithstanding this complexity user-friendliness is particularly evident and use of the web-portal is very

21807-REL-T006.2 Annex 1 – page 48
intuitive, also thanks to an ergonomic optimisation of the tools. Logic structure in themes and sub-themes is particularly helpful.
Many parts of the system are available in two languages: Dutch and English.
5c Interactiveness
Interactivity with the system is particularly high. In particular the web-portal provides three main tools:
- Feedback; Schelde Monitor includes a feedback tool to send suggestions in order to improve system’s functionalities and contents;
- E-service; used by the users to subscribe to a bimonthly e-mail newsletter on literature, datasets, projects and conferences related to the Schelde Estuary;
- E-room; this is a virtual project-space that offers an online environment where minutes, reports, calendars can be kept and shared with others users.
5d Data access
A great part of data (including spatial ones) and other information typologies can be downloaded. Documents and information on the 17 indicators are accessible and downloadable to all users.
Metadata sheet are available for alphanumeric and spatial data.
6 Technological characteristics
6a Used technology ScheldeMonitor web portal is a web-site developed with “php” languages and standards.
6b Integration with other tools
ScheldeMonitor web-portal includes different tools mutually integrated, in particular: the information tool, the data portal and the indicator tool.
6c Integration with other CIS
The system is alimented with data and information supplied by various data providers.
6d Interoperability
7 Cost/resources
7a Resources
Web-site consultation for the overview analysis of the ScheldeMonitor web portal:
http://www.scheldemonitor.org/home.php; last visit on 03/04/2011 at 10.30.

21807-REL-T006.2 Annex 1 – page 49
North Sea Atlas
1 General Information
1a Name North Sea Atlas (NoordZeeAtlas in Dutch)
1b Description
The North Sea Atlas is a Web-GIS on the marine environment of the Dutch North Sea; the Atlas includes information on coastal water but no specific data on the coastal territory. Provided spatial data refer to physical and environmental characteristics, use of the sea, policy and management issues related to the considered area of the North Sea. The Atlas is also available in printed form. Maps have been regularly published since 2004.
The Atlas has been developed to support the activity of the North Sea Interdepartmental Consultation Directorate (IDON), a cooperative board of 10 ministries, specifically dealing with integrated aspects of the Dutch North Sea management.
1c Operating entity North Sea Office
1d Management structure
North Sea Office
1e Contacts
Ad Stolk, e-mail: [email protected], [email protected] Ministry of Infrastructure and Environment North Sea Directorate P.O. Box 5807 2280 HV Rijswijk - The Netherlands
Web-GIS: http://www.noordzeeatlas.nl/en/nzaEn.html
Web-Site: http://www.noordzeeatlas.nl/en/index.html
1f Typology Operational
2 Operational context and information content
2a ICZM dimensions
The Nord Sea Atlas includes information related to four of the five considered ICZM dimensions: territory (e.g. 3 and 12 miles nautical limits, protected areas, bathymetry), environment (e.g., characteristics of biological systems in various environmental matrixes such as sediment and marine water, pollutant concentrations) and economy (locations of offshore wind-farms, marine traffic). Governance is also properly addressed; a specific section of the Atlas deals with –information related to “Policy and management of the Dutch North Sea”.
2b ICZM Sectors
Main sectors covered by the Atlas are:
- Physical geography, e.g.: depth on the Dutch Continental Shelf, geomorphology, sediment physical characteristics, seasonal current regimes, wind speed, tide, etc.;
- Characteristics of biological systems;
- National monitoring stations for sea water and sediment;
- Chemical concentration of pollutants in sediment and in sea water;
21807-REL-T006.2 Annex 1 – page 50
- Integrated information on erosion and transportation of the suspended matter in the Dutch North Sea;
- Different use of the marine area, including: archaeological zones, division of the Dutch Continental Shelf, pollution reports on Dutch Continental Shelf, sand and shell extraction, dumping sites of dredged material, submarine cables, platforms and pipelines, traffic separation scheme, military use;
- Policy and management of the Dutch North Sea: national competence areas in the North Sea, maritime zoning of the Dutch North Sea (statutory administrative zones), map of the spatial policy document PKB “key planning decision”, protected sites according to the EU Birds and Habitats Directive, drainage basins according to the Water Framework Directive, map showing elements related to mining uses, seabed protection area.
2c Integration
The Atlas gives much relevance to aspects related to planning and management of the Duct North Sea Atlas, also including results of integrated analysis.
This is the case of the map of the spatial policy document PKB “key planning decision”. PKB defines the objective for the spatial policy of the Dutch North Sea: to enhance the economic significance of the North Sea, and to conserve and develop internationally important ecological and landscape values. Another example of integrated analysis is provided by the map showing elements relevant of the mining uses of the sea and related regulation.
2d Spatial scale
National Scale – Dutch North Sea
The Atlas focuses on the marine area and does not include information on the coastal territory. For some layers, information is available for a larger portion of the North Sea.
2d Flexibility The system has been developed in order to be applied specifically to the zone of Dutch Sea.
3 ICZM functionalities
3a Knowledge related functionalities
Nord Sea Atlas provides some of the knowledge related functionalities considered by the analysis; specifically:
- Integration among different information sectors (see point 2c);
- Availability of spatial data; the Atlas enables direct connection of users thought ESRI Arc Explorer (free software) that allows the visualisation of selected layers on a client computer;
- Inside the Atlas there are different multi-time data and information, such as concentration of pollutants in the sea sediment.
3b Process related functionalities
The Atlas specifically focuses on the Dutch marine area; in a strict sense it does not provide specific support to ICZM. However, the Atlas is specifically developed to support the activity of the North Sea Interdepartmental Consultation Directorate (IDON) in the perspective of Maritime Spatial Planning (MSP) and Integrated Maritime Policy (IMP), with evident connection to the ICZM issues. In this perspective, the Atlas in particular provides support to assessment of alternatives in marine planning and management.
21807-REL-T006.2 Annex 1 – page 51
4 Users
4a User typology
The Atlas is specifically oriented to users dealing with marine planning and management, therefore including:
- Decision-makers, at the national level;
- Coastal planners and/or managers, at the national and regional level.
5 Use of the system
5a Accessibility
The North Sea Atlas can be accessed in two different ways:
- Through Web.-GIS interfaces and functionalities;
- Direct connection of users thought ESRI Arc Explorer (free software) that allows the visualisation of selected layers on a client computer;
5b User-friendliness
Medium user-friendly.
The Atlas is built around an interactive map very easy to browse, which allows anyone to visualize provided maps and layers. Description of information contained in each maps (group of layers) is not always totally explanatory.
The system is available in English.
5c Interactiveness No specific e-participation tools are provided.
5d Data access
The Atlas does not allow to download spatial data; however it enables direct connection of users thought ESRI Arc Explorer (free software) that allows the visualisation of selected layers on a client computer. Pre-defined static maps available in the Atlas and customised maps can be exported and print.
Metadata are in general provided for the pre-defined maps (groups of layers) included in the Atlas. However, they are not available for the specific layers.
6 Technological characteristics
6a Used technology ESRI ArcSDE (licensed software).
6b Integration with other tools
No specific integration with other tools
6c Integration with other CIS
The Nord Sea Atlas is included in the European Atlas of the Seas. http://ec.europa.eu/maritimeaffairs/atlas/index_en.htm), together with the other following CISs:
- MAGIC (United Kingdom);
- De Kust Atlas (Belgium);
- The Atlas of the Venice Lagoon (Italy);
- Coastal Atlas of Andalusia (SIGLA)
- Cross Channel Atlas.
6d Interoperability Medium
Data in the system are freely accessible by a client computer through ArcExplorer / ArcExplorerWeb applications and IMS-server
21807-REL-T006.2 Annex 1 – page 52
connections. Direct download of spatial data from the Atlas in not available.
ISO 19115 compliant metadata are available in ESRI sheet format only for some layers. A metadata catalogue is not available, while some additional description is provided for every static map.
7 Cost/Resources
7a Resources About 8 persons are involved in the Atlas management
Web-site consultation fir the overview analysis of the North Sea Atlas:
http://www.noordzeeatlas.nl/en/index.html; last visit on 19/03/2011 at 12.00.
21807-REL-T006.2 Annex 1 – page 53
WATLAS - Wadden Sea Atlas and the Wadden Sea Portal
1 General Information
1a Name WATLAS (Wadden Sea Atlas) and the Wadden Sea Portal
1b Description
Watlas is a web-atlas collecting data of the Dutch Wadden-Sea region. Watlas includes interactive thematic maps on topics (e.g. tourism, fisheries, mining, landscape, etc.) relevant for the management of the Wadden Sea. By selecting one of the topic users visualise a pre-defined map including various pre-selected layers that can be further customised. One of the viewable layer enables to recall and visualise photos of the Wadden Sea environment.
Layers and maps included in the web-atlas are provided by various bodies dealing with the management of the Wadden Sea, and mainly by the Rijkswaterstaat - Directorate Northern Netherlands (part of the Dutch Ministry of Transport, Public Works and Water Management) and the related National Institute for Coastal and Marine Management (RIKZ).
Watlas has been developed within the InterWad project involving four Dutch ministries: LNV (agriculture, nature management and fisheries), V&W (transport, public works and water management), EZ (economic affairs) and VROM (housing, spatial planning and the environment). InterWad is a project that has developed and manages the Wadden Sea Portal (http://www.waddenzee.nl/) also including the Watlas web atlas. In general, the Wadden Sea Portal collects and disseminates news, facts, documents and information on knowledge, policy, management and use of the Dutch Wadden Sea. Besides Watlas, the Wadden Sea Portal provides other tools that can implement the above goals, specifically: the Wadden barometer, the encyclopaedia and the Geoportal.
Watlas is interfaced with the “Wadden barometer” web-tool (http://www.waddenzee.nl/waddenbarometer.html). The Wadden barometer provides information related to different themes in terms of indicators, qualitative trends and description of processes. Addressed themes are: nature, water environment, climate, social economic, energy and minerals, tourism, safety and coastal protection. Each theme includes more specific sub-themes. For some of them the barometer provides a direct access to Watlas, thus enabling to visualise the layers associated to the selected sub-theme.
The encyclopaedia, accessible by the Wadden Sea Portal, provides basic information (documents) about the history, landscape, culture and human activities of the Wadden Sea area. There are different possibilities for searching a document:
- Through keyword search in the "Quick search" functionality made available by the encyclopaedia;
- Clicking the desired keyword in the "Aquabrowser" tool provided by the encyclopaedia;
- Using "Watlas" to perform a map-search; Watlas is therefore directly interfaced with the encyclopaedia tool;
21807-REL-T006.2 Annex 1 – page 54
The Geoportal application (accessible form the Wadden Sea Portal home-page) is used to share and make available spatial data and metadata related to the Wadden Sea. Search can be done through key words and/or a map viewer enabling to select an area of interest. For the selected information:
- Metadata are showed thought an extended and detailed metadata sheet;
- Data can be downloaded as spatial layers;
- Spatial data can be visualised through Interwad OGC services using a WMS connection.
1c Operating entity
Watlas was developed within the InterWad project involving four Dutch ministries: LNV (agriculture, nature management and fisheries), V&W (transport, public works and water management), EZ (economic affairs) and VROM (housing, spatial planning and the environment).
The web-atlas (and in general the web-site on the Wadden Sea) is still maintained by the InterWad team, whose office is based in Leeuwarden within the “House for the Wadden Sea”.
1d Management structure
InterWad team, based in Leeuwarden.
1d Contacts
Piet Feddema; e-mail:
[email protected]; [email protected]
Kantoorlocatie InterWad, RCW en Waddenacademie:
Huis voor de Wadden
Ruiterskwartier 121 A
8911 BS Leeuwarden
Web-site: http://www.waddenzee.nl/
Watlas: http://mapserver521.waddenzee.nl
1e Typology Operational
2 Operational context and information content
2a ICZM dimensions
Watlas includes information related to three of the five considered ICZM dimensions: territory (e.g. protected areas, landscape), environment (e.g. bathymetry, topography, water quality) and economy (locations of offshore wind-farms, tourism, mining).
2b ICZM Sectors
Watlas enable to quickly visualise the following thematic maps:
- Topography and bathymetry;
- Water quality monitoring stations;
- Hydrography;
- Landscape;
- Natural features;
- Protected areas;
- Human activities (e.g. fishery, transportation, wind-farm, tourism and recreational activities);

21807-REL-T006.2 Annex 1 – page 55
- Energy production and mining;
- Military zone.
Each thematic map contains some pre-selected layers that however can be customised by the users. Each layer is described by a synthetic metadata sheet.
2c Integration No specific integration among information is directly provided
2d Spatial scale Sub-National – Dutch area of the Wadden Sea.
2e Flexibility Watlas has been developed in order to be applied to the specific area of the Wadden Sea.
3 ICZM functionalities
3a Knowledge related functionalities
Various ICZM knowledge related functionalities are provided by the Wadden Sea Portal in general, including Watlas and the other previously described tools.
Watlas supports the operation at different spatial scale. Available spatial data can be re-scaled according to the considered spatial extent, thus enabling to visualize more details with a higher scale. This is particularly evident for topography and bathymetry data.
Watlas is interfaced with the “Wadden barometer” web-tool. The Wadden barometer provides information related to different themes in terms of indicators, qualitative trends and description of processes. Addressed themes are: nature, water environment, climate, social economic, energy and minerals, tourism, safety and coastal protection. Each theme includes more specific sub-themes. For some of them the barometer provides a direct access to Watlas, thus enabling to visualise the layers associated to the selected sub-theme. Even if the Wadden barometer does not specifically refer to the ICZM indicators, it appears to be a good tool providing synthetic information for communication and management objectives.
The encyclopaedia tool can be also very useful to quickly search documents related to the knowledge and management of the Wadden Sea area.
Spatial data can be downloaded through the Geoportal application that also provides detailed metadata description.
3b Process related functionalities
Watlas does not include specific ICZM process related functionalities. However, it contains a wide and articulated set of maps and layers. Furthermore, the general Wadden Sea Portal provides other tools (Wadden barometer and encyclopaedia) that together with the Watlas information can properly support the ICZM process in its various phases.
The Wadden Sea Portal managed by the InterWad project team provides an e-forum space to the users. The forum can be used to provide comments, opinions and suggestions regarding the future improvement of the web-site and the related tools. To join the forum, users must previously register.
21807-REL-T006.2 Annex 1 – page 56
4 Users
4a User typology
Watlas is mainly acting as maps and data viewer, integrated with the barometer and the encyclopaedia tool providing other synthetic data. Target users appear to mainly be policy and decision makers rather than coastal professionals and expert users. Civil society in general is also included as possible target user of the atlas.
Coastal professionals and experts can be more interest in the use of the Geoportal tool that makes available spatial data and metadata.
5 Use of the system
5a Accessibility Free access on-line to all the Watlas contents and functionalities, as well as to all the other Wadden Sea Portal’s tools.
5b User-friendliness
Highly user-friendly.
Watlas is built around an interactive map very easy to browse, which allows anyone to identify, visualize and query datasets relevant to their interest. Use of the Wadden barometer and the encyclopaedia is also very intuitive. Use of the Geoportal is more complex since this tool is mainly addressed to expert users.
Watlas is a bi-lingual system, available in Dutch and English.
5c Interactiveness
The Wadden Sea Portal managed by the InterWad project team provides an e-forum space to the users. The forum can be used to provide comments, opinions and suggestions regarding the future improvement of the web-site and the related tools. To join the forum, users must previously register.
5d Data access
Static maps visualised through Watlas can be exported in different customized format such as png and gif. All layers included in the atlas are described through metadata.
All spatial data can be downloaded through the Geoportal application that also provides a detailed description of metadata.
6 Technological characteristics
6a Used technology
Watlas was developed using the UMN Mapserver Technologies (open source technology).
The Geoportal is based on the Open Source application “GeoNetwork” and is strictly related to standards and requirements of the INSPIRE Directive.
6b Integration with other tools
Watlas is directly interfaced with the “Wadden barometer” web-tool (http://www.waddenzee.nl/waddenbarometer.html). The Wadden barometer provides information related to different themes in terms of indicators, qualitative trends and description of processes. Addressed themes are: nature, water environment, climate, social economic, energy and minerals, tourism, safety and coastal protection. Each theme includes more specific sub-themes. For some of them the barometer provides a direct access to Watlas, thus enabling to visualise the layers associated to the

21807-REL-T006.2 Annex 1 – page 57
selected sub-theme.
Watlas is also directly interfaced with the encyclopaedia tool, described in point 1b.
6c Integration with other CIS
No specific integration with other CIS
6d Interoperability
High.
The use of standard protocols for data management (according to INSPIRE Directive) guarantees a high interoperability of the system. Metadata are managed through a specific application (Geoportal) in compliance with INSPIRE protocols and requirements. All spatial data are freely available and can be downloaded through the same application.
7 Cost/resources
7a Resources
In the 2002, the initial development cost of the Wadden Sea Portal was 35.000 €.
Management costs for the whole CIS (Wadden Sea Portal) is 375.000 € per year (including resources for 3.3 full time equivalent per year – fte/year).
Management costs for Watlas (web atlas) include in the Wadden Sea Portal is: resources for 0.2 fte/year and 10.000 €/y of external technical costs.
Information sources for the overview analysis of Watlas:
Piet Feddema, 2011. Information provided by mail on the 02.05.2011 at 09.33, CET time.
Web-site consultation the overview analysis of Watlas:
http://mapserver521.waddenzee.nl; last visit on 18/03/2011 at 12.00.
http://www.waddenzee.nl; lat visit on 18/03/2011 at 12.00.

21807-REL-T006.2 Annex 1 – page 58
KustAtlas - Belgian Coastal Atlas
1 General Information
1a Name KustAtlas - Belgian Coastal Atlas
1b Description
The Belgian Coastal Atlas is an initiative of the Belgium Coordination Centre on ICZM. It was firstly published in 2004 as a book, triggered by the reporting obligations to the European Commission about the state of the Belgian coasts related to the ICZM Recommendations (2002/413/EC). From the beginning, main aim was to present a general and synthesised overview of the main characteristics of the Belgian coast in relation to ICZM.
The many requests for maps encouraged the developers to launch a web-based atlas in 2005. The Belgian Coastal Atlas is presently a digital atlas which contains information and maps on different coastal aspects. It provides online access to unique maps (static maps) which are downloadable as pdf documents; underlying data related to the maps are available in excel format. The Atlas is structured in 12 main sectors (chapters); each chapter is related to specific ICZM indicators. Other sustainability indicators are also provided by a link to the “Sustainability barometer” website. To improve communication functionalities, the atlas is presently available in four languages: Dutch, English, France and German.
Following the initial book perspective, the on-line system mainly aims to provide an easily accessible, simple, user-friendly atlas to users, as well as to make available readily usable maps on Belgian coasts. Maps have been produced using data mostly provided by the public authorities and their administrations.
The Belgian Coastal Atlas currently offers partially limited possibilities for interactivity. The ICZM Coordination Centre is working to move from static version of the web atlas to an interactive data-driven atlas, where sustainability indicators for the coasts will again play a prominent role. The final product will be a policy supporting tool supporting the ICZM process for a wide range of users.
1c Operating entity
The Belgium Coordination Centre on Integrated Coastal Zone Management.
The development involved the collaboration with three private partners: Aquaterra, Five to Nine and Magenta.
1d Management structure
The Belgium Coordination Centre on Integrated Coastal Zone Management is responsible for the atlas management.
1d Contacts
Kathy Belpaeme, e-mail: [email protected]
The Belgium Coordination Centre on Integrated Coastal Zone Management in Belgium Ghent, BELGIUM
Web-site of the atlas: http://www.kustatlas.be/en/; Web-site of the Belgium Coordination Centre on ICZM:

21807-REL-T006.2 Annex 1 – page 59
http://www.kustbeheer.be
1e Typology Operational
2 Operational context and information content
2a ICZM dimensions
The Atlas contains data related to all the five considered ICZM dimensions: territory, environment, economy, society and governance (e.g. in relation to the latter, the Atlas includes maps and information on spatial planning and policy priorities for the coasts, as well as on use of the sea).
2b ICZM Sectors
The Atlas is structured in 12 main sectors (chapters):
- Spatial setting; - Physical environment; - Spatial structure; - Use of the sea; - Environment and nature; - Tourism and recreation; - Industry and business; - Fishery and agriculture; - Culture and heritage; - Living near the sea; - Coastal defence - Integrated coastal zone management
Each chapter contains data, maps and descriptive information related to various items. Moreover, each chapter is related to the relevant ICZM indicators.
2c Integration
The KustAtlas includes numerous examples of integrated information, in particular in relation to 27 ICZM indicators and the sustainability indicators of the “Sustainability barometer”; some examples are: percentage of Natura 2000 sites in Favourable Conservation Status according to Habitat and Bird EC Directives; Flooding risk maps (population at risk, area of protected sites and value of economic assets at risks). Integrated maps are also provided, merging multiple information in the same map (e.g. multifunctional use of the sea, coastal evolution and defence, etc.).
2d Spatial scale
National – The atlas mainly focuses on the Belgian coast.
However the transnational level is also approached by the Atlas; the ICZM indicators, monitored within the SAIL project (Schéma d'Aménagement Intégré du Littoral) cover the wider area of the Southern North Sea (Essex –UK; Kent – UK, Nord-Pas De Calais - France, West Flanders - Belgium and Zeeland -the Netherlands).
2e Flexibility
KustAtlas was specifically designed to deal with the coastal area of Belgium. However, the Atlas served as an example to develop similar tools in Vietnam and Spain (Catalonia) (see http://ec.europa.eu/ourcoast/index.cfm?menuID=9&articleID=168).
21807-REL-T006.2 Annex 1 – page 60
3 ICZM functionalities
3a Knowledge related functionalities
Several knowledge related functionalities, supporting ICZM process are available in the KustAtlas:
- Integration among different information sectors (see point 2c);
- Availability of some spatial information; shape file are available only for a limited number of layers;
- Multi-time data information, provided by every sustainability indicator and by several chapters of the Atlas (e.g. physical environment, fishery and agriculture, coastal defence);
- Inclusion of all 27 ICZM indicators identified by the Deduce project; the indicators were developed , by the SAIL project (Schéma d'Aménagement Intégré du Littoral), a partnership of regional and local authorities, maritime organisations, and coastal and marine agencies, working together for the sustainable development of the Southern North Sea tidal area (http://www.vliz.be/projects/SAIL/db.php);
- Inclusion of 21 sustainability indicators, through a link to the so called sustainability barometer (http://www.vliz.be/projects/indicatoren/, Dutch only). It allows to gain an overview of the current state and the trend of several sustainability indicators of the coast, identifying also possible signals for coastal policy adjustment or harmonisation. A trend is given for each indicator stating whether the latter is positive, negative or neutral. The data are presented as graphs and tables but not with geographically explicit spatial referencing.
3b Process related functionalities
The articulated structure of Kustatlas, organised in different thematic chapters and providing a high variety of data, extended text, graphs and factsheets can support problem understanding and structuring for the Belgian coast area.
Definition of trend for each sustainability indicator further helps problem understanding, assessing whether the coast is moving towards or away from sustainability, supporting coastal managers and decision-makers.
Including to wide set of indicators (ICZM and sustainability ones) and relative temporal trends, the KustAtlas can support the definition of possible scenarios for the future evolution of the coastal area.
4 Users
4a User typology
The target KustAtlas audience includes:
- general public, for the wide and easily understandable information content;
- coastal planners and managers, especially for the information about plans and policies;
- policy makers and decision makers, especially for the ICZM and sustainability indicators.
Scientific users (e.g. universities, research institutes), administrations and supporting services and schools, also demonstrated their interest in the Atlas, through the frequent

21807-REL-T006.2 Annex 1 – page 61
requests for additional information and maps.
In particular the integrated map on the multi-functional use of thesea has been requested many times by different user typologies, also including administrations and research institutions (Belpaeme and Maelfait, 2011).
5 Use of the system
5a Accessibility
Free access on-line to all the Atlas.
All data contained in the atlas are freely available; data are mostly provided by public authorities and their administrators. No licensing or data release issues apply. Illustrations, pictures, maps and texts of this atlas can be used subject to prior written permission of the copyright owners and an express mention of the source.
5b User-friendliness
Highly user friendly.
The user interface is very simple and it presents an intuitive use. The multi-language (French, Dutch, German and English) functionality helps users from different countries.
5c Interactiveness
No specific e-participation tools are provided by the KustAtlas.
Feedback process, by means of questionnaires for user satisfaction, was created.
The ICZM Coordination Centre is working to move from a static version of the web atlas to an interactive data-driven atlas. The final product will be a policy supporting tool supporting the ICZM process for a wide range of users.
5d Data access
All maps are downloadable in “*.pdf” format. Some data are downloadable also in excel format. Availability of downloadable spatial data is provided only for some cases.
The Atlas does not include specific metadata information structured according to a shared standard. However, metadata descriptive sheets are available for the maps and indicators contained in the Atlas.
6 Technological characteristics
6a Used technology
The system uses the Apache web-server and the MSSQL relational database. The web-site is set up in php/html and flash applications and action-scripts were used for the interactive maps.
6b Integration with other tools
The system is linked to the sustainability indicator database developed by the same Coordination Centre for ICZM.
ICZM indicators are directly incorporated in the KustAtlas; however these were developed by the SAIL project for a wider area, i.e. Southern North Sea (Essex –UK; Kent – UK, Nord-Pas De Calais - France, West Flanders - Belgium and Zeeland -the Netherlands). Direct integration is therefore set between the KustAtlas and the ICZM indicator web-site (SAIL project web-site).
6c Integration with other The KustAltas will be further developed within the C-Scope
21807-REL-T006.2 Annex 1 – page 62
CIS project that also foresees the further improvement of the Dorset Explorer and in particular the development of the Dorset Coastal Explorer. However KustAtlas and Dorset Coastal Explorer are different tools, with different aims and different target users: the first one is mainly a communication tool designed as a portal site to wider audience; the second one is mainly a planning tool, designed for stakeholders and planners.
KustAtlas is a member of the International Coastal Atlas Network (ICAN).
6d Interoperability
Low (not properly applicable).
At the moment the Atlas is a collection of static maps with limited possibilities to analyze, compare and integrate the different information contents.
Future implementation of the Atlas includes the development of a functionality enabling to import GIS format maps within the Google Earth software.
7 Cost/Resources
7a Resources
Cost for the development of the printed atlas: €46,381. Cost for the development of the on-line atlas: Development on-line version: €25,073, Development/translation German and French version: € 5,855. The cost of updating the atlas is not known.
The book and the online version of the Belgian Coastal Atlas were financed by the project partners of the Coordination Centre: the province of West-Flanders and the two main Flemish coastal administrations, and by European structural funds within the objective 2 program for the Belgian coast.
21807-REL-T006.2 Annex 1 – page 63
Information sources for the overview analysis of KustAtlas:
Belpaeme K. and Maelfait H., 2011. Chapter 10: “Belgium”. In Wrigth D., Dwyer E.,
Cummins V.[eds.], 2011. Coastal informatics: Web Atlas Design and Implementation.
Information science reference, Hershey, New York. pp. 156-164.
Clive G. (2008). Making the Coast Visible: an indicators-based approach to measuring
the sustainable development of coastal areas. Bruges: Schéma d’Aménagement Intégré
du Littoral.
Belpaeme K., 2009. Presentation: “User analysis of the Belgian coastal atlas and future
user needs”. Presented in the: ICAN Workshop, 17 November 2009, Trieste.
Maelfait H. and Belpaeme K., 2010. The Belgian Coastal Atlas: moving from the classic
static atlas to an interactive data-driven atlas.
Web-site consultation for the overview analysis of KustAtlas:
http://ec.europa.eu/ourcoast/index.cfm?menuID=9&articleID=168; last visit on 22/03/2010
at 11.00.
www.kustbeheer.be; last visit on 24/02/2011 at 12.00.
http://www.cscope.eu; last visit on 24/02/2011 at 12.30.

21807-REL-T006.2 Annex 1 – page 64
MAREANO - Marine Area Database for Norwegian coastal and marine regions
1 General Information
1a Name MAREANO (Marine Area Database for Norwegian coastal and marine regions)
1b Description
MAREANO is a Web-portal collecting and distributing data provided by various institutions and organisations. MAREANO includes a relevant Web-GIS component used to share maps on depth and topography, sediment composition as well as seabed biodiversity, habitats, biotopes and pollution of Norwegian marine coastal and offshore regions.
The main aim of MAREANO is to provide a tool giving direct access to reliable knowledge to industry, authorities, researchers and the general public. For examples, MAREANO may provide data and information related to the questions such as:
- How is the seascape of the Norwegian continental shelf?
- What does the seabed consist of?
- How is the biodiversity distributed on the seabed?
- How are habitats and biotopes distributed on the seabed?
- What is the relationship between the physical environment, biodiversity and biological resources?
- How are contaminants stored in sediments?
In this way MAREANO aims to contribute a better knowledge base for managing human activities in the Norwegian coastal and offshore area, such as fishing, oil and gas exploitation.
1c Operating entity
MAREANO is coordinated by the Institute of Marine Research, in collaboration with the Geological Survey of Norway and the Norwegian Hydrographic Service. The three programme partners are members of the Executive Group that acts as the MAREANO’s operational management team. Many other institutions and organisations are involved in the programme supporting the MAREANO tool.
1d Management structure
The MAREANO Executive Group made by the Institute of Marine Research, the Geological Survey of Norway and the Norwegian Hydrographic Service
1e Contacts
Ole Arve Misund, e-mail: [email protected] Head of the Executive Group - Institute of Marine Research (IMR) Kjell Bakkeplass, [email protected] GIS - Institute of Marine Research (IMR) Web site: http://www.mareano.no/english/index.html General contact: [email protected]
1f Typology Operational
2 Operational context and information content

21807-REL-T006.2 Annex 1 – page 65
2a ICZM dimensions
Environmental information on sea and coastal region are in depth developed. Some economic information is included in the system in relation to industrial activities. No specific social and governance data are provided.
2b ICZM Sectors
Main spatial information included in MAREANO are related to:
- Hydrodynamic characteristics;
- Protected areas, such for example protected coral areas;
- Landscapes and land forms;
- Marine habitats, including distribution of benthic fauna, communities, biological diversity and production;
- Detailed bathymetry;
- Sediments physical characteristics;
- Pollution in the sediment;
- Industrial activities, such as maps of pipelines, offshore platforms, aquaculture sites.
MAREANO data refers specific to the marine environment and do not include information on the coastal area.
2c Integration No specific integration among information is directly provided
2d Spatial scale National – Norwegian marine coastal and off-shore area
2e Flexibility MAREANO is specifically developed for the Norwegian marine area
3 ICZM functionalities
3a Knowledge related functionalities
MAREANO is a marine oriented tool that however is also useful in supporting ICZM and related MSP aspects. MAREANO data can support integrated assessment of environmental and economic related information, in particular in relation to the sustainable management of the Norwegian marine resources.
Other knowledge related functionalities include operation at the different spatial scale; some of the available spatial data can be re-scaled according to the considered spatial extent; thus enabling to visualize more details at higher scales.
3b Process related functionalities
Strictly speaking, MAREANO does not provide specific ICZM process related functionalities.
However, the same MAREANO web-site stresses the relevance of the tool in supporting sustainable planning and management. “MAREANO will fill knowledge gaps related to seabed conditions and biodiversity defined in The Integrated Management Plan for the Marine Environment of the Barents Sea and the Sea Areas off the Lofoten Islands presented by the Government in 2006. The Plan is due to be revised in 2010, and MAREANO will contribute to a better knowledge base for managing human activities such as fishing and oil and gas exploitation. Priority mapping areas for this phase are located along the shelf break and on the continental shelf in the western part of the mapping area. In the Management Plan, these areas are regarded as being especially ecologically important and vulnerable”.
4 Users

21807-REL-T006.2 Annex 1 – page 66
4a User typology The main aim of MAREANO is to give users from the authorities, research. Industry and the general public direct access to reliable scientifically-based knowledge.
5 Use of the system
5a Accessibility Free access on-line to all information. Spatial data can be only visualized and not directly downloaded.
5b User-friendliness
Highly user-friendly
MAREANO is provided with customised interfaces that enables easy browsing and access to data. MAREANO is available both in Norwegian and English.
5c Interactiveness No specific e-participation tools are provided.
5d Data access
A detailed metadata sheet - also identifying the relative data provider – can be visualised for all the layers contained in the MAREANO system.
The MAREANO’s users of public sector users will be able to view or download data through Norway Digital, the national geo-referenced data infrastructure. Other users will be able to access data through the agencies responsible for the individual data sets, for example obtain sea depth data from the Norwegian Hydrographical Service, geological data from the Geological Survey of Norway and data on biology from the Institute of Marine Research.
6 Technological characteristics
6a Used technology
6b Integration with other tools
No specific integration with other tools
6c Integration with other CIS
MAREANO is a Web-portal collecting and distributing data provided by various institutions and organisations. In particular the Web-GIS is linked via WMS to databases of the following governmental agencies (all participating to the MAREANO programme):
- NGU: Geological Survey of Norway
- IMR: Institute of Marine Research
- NHS: Norwegian Hydrographic Service
- DIRNAT: Norwegian directorate for mature Management
- IBCAO: International Bathymetric Chart of the Arctic Ocean
6d Interoperability Most of the dataset included in the MAREANO system are available via WMS, ensuring high interoperability in data sharing.
7 Cost/Resources
7a Resources No specific information is available on resources needed to implement and manage the Web tool.
21807-REL-T006.2 Annex 1 – page 67
Information sources for the overview analysis of MAREANO:
Thorsnes T., 2009: MAREANO – An introduction. Norwegian Journal of Geology. Vol. 89,
pp. 3. Trondheim 2009. ISSN 029-196X.
Web-site consultation for the overview analysis of MAREANO:
http://www.mareano.no/kart/viewer.php?language=en last visit on 09/02/2011 at 15.00.
http://www.statkart.no last visit on 09/02/2011 at 15.15.
http://www.ngu.no last visit on 09/02/2011 at 15.30.
http://www.imr.no/ (Institute of Marine Research) last visit on 02/09/2011 at 16.15.
http://www.sjokart.no/eng/Norwegian_Mapping_Authority/ (the Norwegian Mapping
Authority) last visit on 02/09/2011 at 16.30.
21807-REL-T006.2 Annex 1 – page 68
CAMRA - UK Coastal and Marine Resource Atlas
1 General Information
1a Name UK Coastal and Marine Resource Atlas (CAMRA).
1b Description
The UK Coastal and Marine Resource Atlas is a tool for maritime contingency planning and response, and was commissioned in recognition of the need to update the 1990 Government and Industry sponsored coastal sensitivity maps produced by the Nature Conservancy Council.
The atlas contains environmental and other resource datasets covering the Great Britain coastline and marine areas of the UK Continental Shelf. The Atlas is designed as a GIS web based tool to access a wide range of information on coastal and marine resources, in particular aiming to support assessment and management emergency incidents such as an oil spill.
In particular, the Atlas provides a flexible resource for national oil spill planning and management, facilitating:
- Seamless multi agency, operational response;
- Audit and contingency planning, consistent with the UK National Contingency Plan (NCP);
- Clean-up management;
- Damage assessment, compensation, responsibilities;
- Provide information on sensitive resources of the UK coastline and its seas to all stakeholders;
- Assist in identification of protection and clean-up priorities.
The Atlas is currently hosted in the web-site of the Multi-Agency Geographic Information for the Countryside (MAGIC) system.
1c Operating entity Maritime and Coastguard Agency (MCA)
1d Management structure
Maritime and Coastguard Agency (MCA)
1d Contacts
Kevin Colcomb, e-mail: [email protected] Maritime and Coastguard Agency Counter Pollution and Response Branch Maritime and Coastguard Agency Bay 1/09, Spring Place 105 Commercial Road Southampton SO15 1EG, UK Web-site: http://www.mcga.gov.uk/ MAGIC web-site: http://magic.defra.gov.uk/projectsummary.htm CAMRA is currently hosted in the web-site of the Multi-Agency Geographic Information for the Countryside (MAGIC) system.
1e Typology Operational
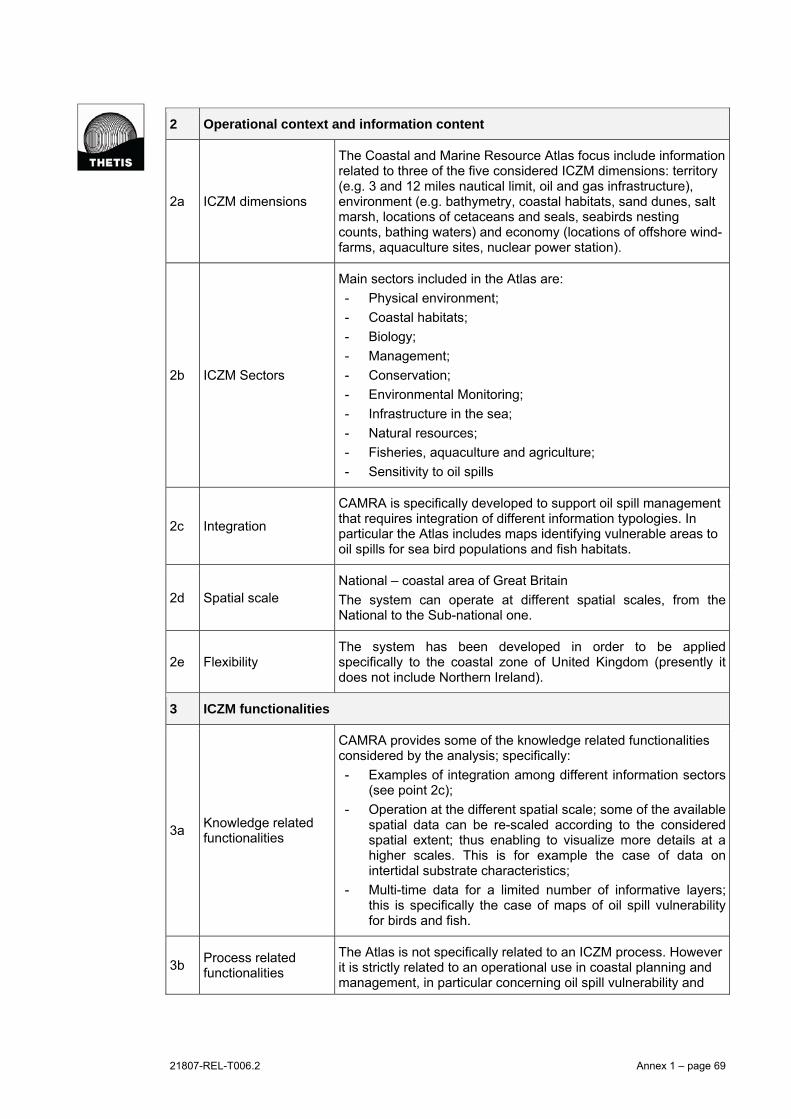
21807-REL-T006.2 Annex 1 – page 69
2 Operational context and information content
2a ICZM dimensions
The Coastal and Marine Resource Atlas focus include information related to three of the five considered ICZM dimensions: territory (e.g. 3 and 12 miles nautical limit, oil and gas infrastructure), environment (e.g. bathymetry, coastal habitats, sand dunes, salt marsh, locations of cetaceans and seals, seabirds nesting counts, bathing waters) and economy (locations of offshore wind-farms, aquaculture sites, nuclear power station).
2b ICZM Sectors
Main sectors included in the Atlas are:
- Physical environment;
- Coastal habitats;
- Biology;
- Management;
- Conservation;
- Environmental Monitoring;
- Infrastructure in the sea;
- Natural resources;
- Fisheries, aquaculture and agriculture;
- Sensitivity to oil spills
2c Integration
CAMRA is specifically developed to support oil spill management that requires integration of different information typologies. In particular the Atlas includes maps identifying vulnerable areas to oil spills for sea bird populations and fish habitats.
2d Spatial scale National – coastal area of Great Britain
The system can operate at different spatial scales, from the National to the Sub-national one.
2e Flexibility The system has been developed in order to be applied specifically to the coastal zone of United Kingdom (presently it does not include Northern Ireland).
3 ICZM functionalities
3a Knowledge related functionalities
CAMRA provides some of the knowledge related functionalities considered by the analysis; specifically:
- Examples of integration among different information sectors (see point 2c);
- Operation at the different spatial scale; some of the available spatial data can be re-scaled according to the considered spatial extent; thus enabling to visualize more details at a higher scales. This is for example the case of data on intertidal substrate characteristics;
- Multi-time data for a limited number of informative layers; this is specifically the case of maps of oil spill vulnerability for birds and fish.
3b Process related functionalities
The Atlas is not specifically related to an ICZM process. However it is strictly related to an operational use in coastal planning and management, in particular concerning oil spill vulnerability and

21807-REL-T006.2 Annex 1 – page 70
risk.
In this perspective, it is important to stress that the Atlas is directly used and managed by and operative organisation, i.e. the Maritime and Coastguard Agency.
4 Users
4a User typology
The digital atlas is primarily a tool aimed at supporting government agencies involved in environmental planning and in particular in oil spill contingency planning and response.
The Atlas contains a wide and complete set of information on the coastal area; therefore as a secondary function it can be of use to experts working in the area of coastal and marine environmental management in the private, public and voluntary sectors.
5 Use of the system
5a Accessibility Free access on-line to the entire Atlas (only visualisation).
5b User-friendliness
Medium.
The selection and visualisation of the data is not direct, but requires different steps (at least two). The system is available in English.
5c Interactiveness No specific e-participation tools are provided.
5d Data access
Direct download is possible only for some layers, while others may be requested to the related data providers. Furthermore, static maps visualised through the web-GIS can be exported in pdf format.
Complete metadata and link to the data provider’s website are available for each layer. The metadata comply the ISO 19115 standards.
6 Technological characteristics
6a Used technology The data storage is in local system with a SQL Server and the interface is made with ESRI ArcSDE (licensed software).
6b Integration with other tools
No specific integration with other tools
6c Integration with other CIS
The Coastal and Marine Resource Atlas is part of the Multi-Agency Geographic Information for the Countryside (MAGIC), that provide data related to the whole UK territory (not only coastal zones).
MAGIC - and the integrated CAMRA – is included in the European Atlas of the Seas. http://ec.europa.eu/maritimeaffairs/atlas/index_en.htm), together with the other following CISs:
- MAGIC (United Kingdom);
- De Kust Atlas (Belgium);
- De NoordZee Atlas (Netherlands);
- The Atlas of the Venice Lagoon (Italy);

21807-REL-T006.2 Annex 1 – page 71
- Coastal Atlas of Andalusia (SIGLA)
- Cross Channel Atlas.
6d Interoperability
High.
MAGIC is part of a distributed network of geographic information systems called SPIRE - Shared Spatial Information Services. SPIRE is a Defra initiative aiming to improve the quality and accessibility of geographic information not only within Defra but also across its executive agencies and non-departmental public bodies.
SPIRE programme has implemented a central store for geographic information to facilitate data sharing within the Defra network of organisations. This allows data to be managed once for multiple uses. SPIRE programme has put in place various mechanisms to provide access to this data including a portal and web map service for Defra network desktop GIS users.
7 Cost/resources
7a Resources
The Atlas is the product of a project managed and collaboratively funded by: the Maritime and Coast Guard Agency (MCA), DEFRA (Department for Environment, Food and Rural Affairs), the Scottish Executive (SE), Scottish Natural Heritage (SNH), the Energy Institute (EI), JNCC, the Environment Agency (EA), English Nature (EN; now Natural England), the Department of Trade and Industry (DTI), the Hampshire County Council (HCC), Essex County Council (ECC), Kent County Council (KCC) and the British Geological Survey (BGS).
No specific information is available on cost and resources. Interactive maps included in the whole MAGIS are monthly updated. The web site reports the detailed description of any provided modification and update; as a very rough estimation about 20 MAGIC layers are monthly updated.
Information sources for the overview analysis of CAMRA:
DEFRA, 2006. Coastal and Marine Resource Atlas. Final Report. Downloadable from:
http://magic.defra.gov.uk/Me1302_4030_FRP.pdf
Green D. 2011. Chapter 13 “United Kingdom”. In Wrigth D., Dwyer E., Cummins V.[eds.],
2011. Coastal informatics: Web Atlas Design and Implementation. Information science
reference, Hershey, New York, pp. 192-213.
Web-site consultation for the overview analysis of CAMRA:
http://magic.defra.gov.uk/projectsummary.htm; last visit on 03/03/2011 at 12.00.

21807-REL-T006.2 Annex 1 – page 72
MIDA - The Marine Irish Digital Atlas
1 General Information
1a Name The Marine Irish Digital Atlas (MIDA)
1b Description
The Marine Irish Digital Atlas (MIDA) is a web tool built in a web-GIS environment, where people interested in coastal and marine information for Ireland can visualize and identify pertinent geospatial datasets and determine where to acquire them. The atlas, which is being constantly updated, currently displays more than 140 layers from over 35 coastal and marine organizations both within Ireland and abroad. It also features an “InfoPort” which is a repository of text, imagery, links to spatial data sources and additional reference material for a wide range of coastal and marine topics.
Specific objectives of the MIDA Atlas are to:
- Develop a web site for presentation of geo-referenced marine datasets of environmental importance;
- Provide greater accessibility to data and information in the form of a web enabled, customised GIS;
- Provide flexibility of use by providing a range of tools that allow users to select, overlay and compare geospatial layers;
- Enable users to identify sources of data, information and expertise on the marine environment;
- Encourage a greater appreciation of Ireland's coastal regions by incorporating educational and informational materials based on multi-media technology.
The MIDA team has been active in the creation of the International Coastal Atlas Network (ICAN).
1c Operating entity
MIDA has been developed by the Coastal and Marine Research Centre (CMRC) of University College Cork , in partnership with the Centre for Coastal and Marine Research, University of Ulster, Coleraine, Northern Ireland.
Funders of the Atlas are:
- Ireland’s Higher Education Authority under the National Development Plan PRTLI III Programme (development funds);
- Environment and Heritage Service, Northern Ireland (Northern Ireland data and partnership);
- Coastal and Marine Research Centre, University College Cork.
1d Management structure
Coastal and Marine Research Centre, University College Cork
1d Contacts
Ned Dwyer, e-mail: [email protected] or [email protected] Coastal and Marine Research Centre University College Cork Naval Base, Haulbowline Cobh, County Cork, Ireland
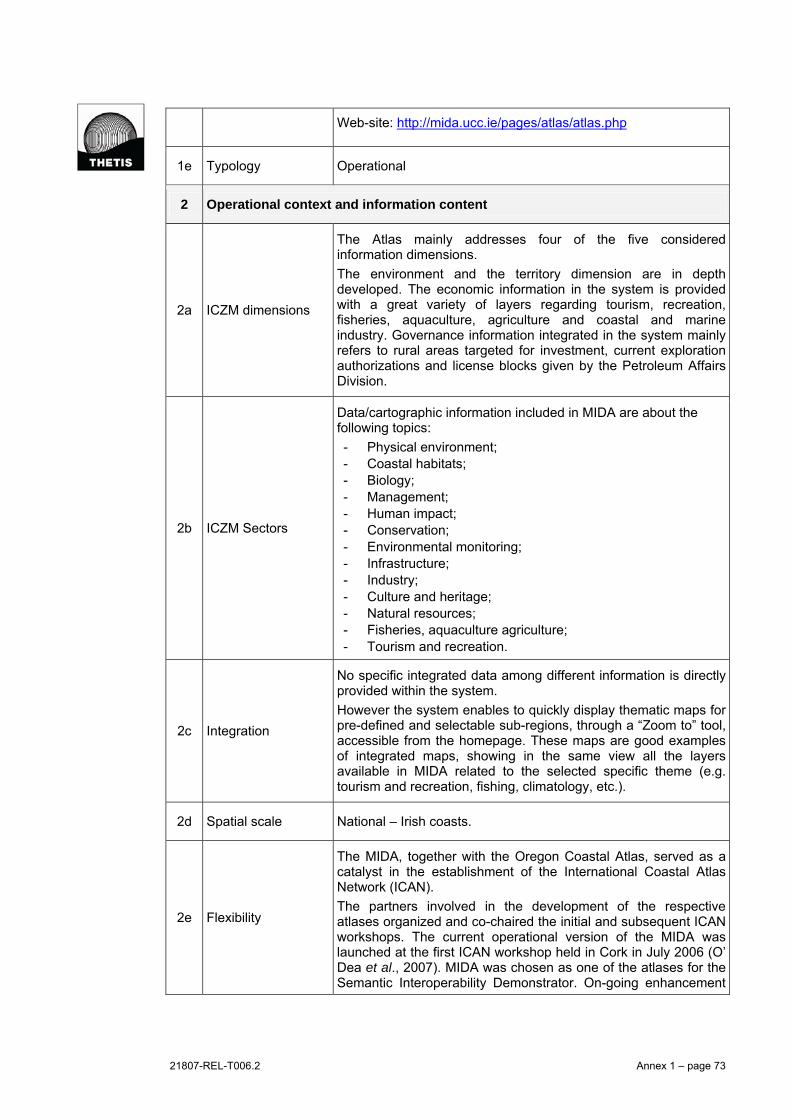
21807-REL-T006.2 Annex 1 – page 73
Web-site: http://mida.ucc.ie/pages/atlas/atlas.php
1e Typology Operational
2 Operational context and information content
2a ICZM dimensions
The Atlas mainly addresses four of the five considered information dimensions.
The environment and the territory dimension are in depth developed. The economic information in the system is provided with a great variety of layers regarding tourism, recreation, fisheries, aquaculture, agriculture and coastal and marine industry. Governance information integrated in the system mainly refers to rural areas targeted for investment, current exploration authorizations and license blocks given by the Petroleum Affairs Division.
2b ICZM Sectors
Data/cartographic information included in MIDA are about the following topics:
- Physical environment; - Coastal habitats; - Biology; - Management; - Human impact; - Conservation; - Environmental monitoring; - Infrastructure; - Industry; - Culture and heritage; - Natural resources; - Fisheries, aquaculture agriculture; - Tourism and recreation.
2c Integration
No specific integrated data among different information is directly provided within the system.
However the system enables to quickly display thematic maps for pre-defined and selectable sub-regions, through a “Zoom to” tool, accessible from the homepage. These maps are good examples of integrated maps, showing in the same view all the layers available in MIDA related to the selected specific theme (e.g. tourism and recreation, fishing, climatology, etc.).
2d Spatial scale National – Irish coasts.
2e Flexibility
The MIDA, together with the Oregon Coastal Atlas, served as a catalyst in the establishment of the International Coastal Atlas Network (ICAN).
The partners involved in the development of the respective atlases organized and co-chaired the initial and subsequent ICAN workshops. The current operational version of the MIDA was launched at the first ICAN workshop held in Cork in July 2006 (O’ Dea et al., 2007). MIDA was chosen as one of the atlases for the Semantic Interoperability Demonstrator. On-going enhancement
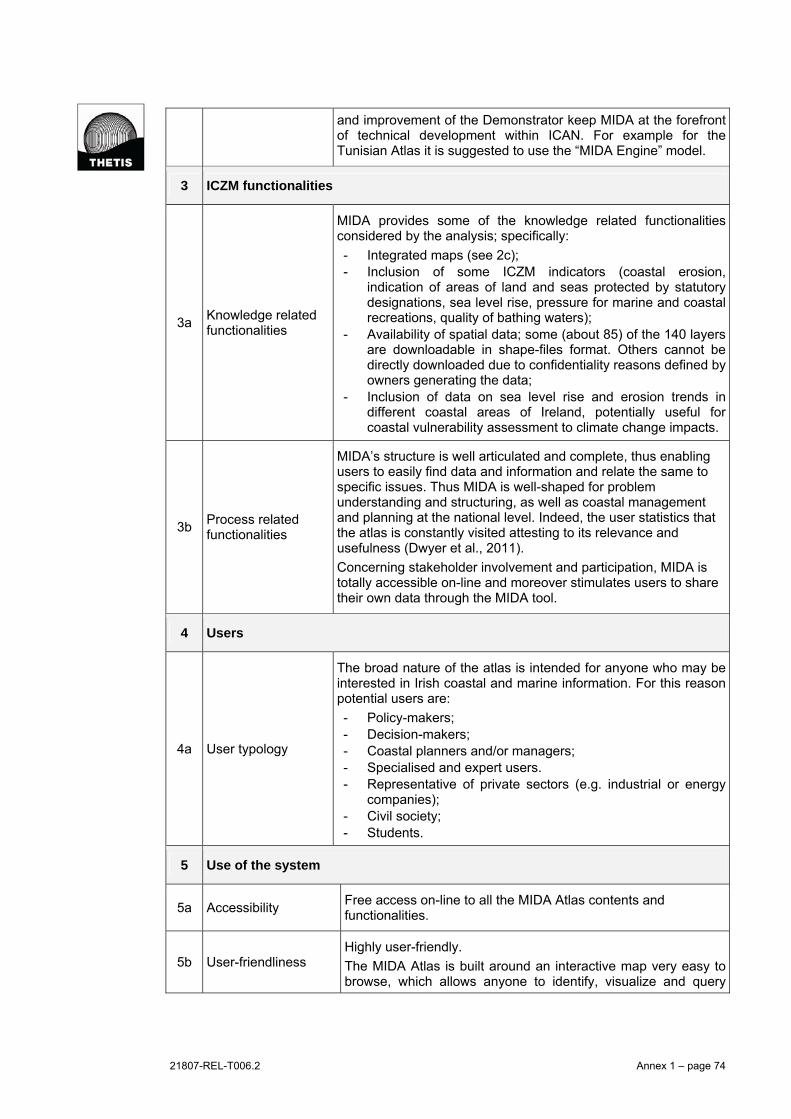
21807-REL-T006.2 Annex 1 – page 74
and improvement of the Demonstrator keep MIDA at the forefront of technical development within ICAN. For example for the Tunisian Atlas it is suggested to use the “MIDA Engine” model.
3 ICZM functionalities
3a Knowledge related functionalities
MIDA provides some of the knowledge related functionalities considered by the analysis; specifically:
- Integrated maps (see 2c); - Inclusion of some ICZM indicators (coastal erosion,
indication of areas of land and seas protected by statutory designations, sea level rise, pressure for marine and coastal recreations, quality of bathing waters);
- Availability of spatial data; some (about 85) of the 140 layers are downloadable in shape-files format. Others cannot be directly downloaded due to confidentiality reasons defined by owners generating the data;
- Inclusion of data on sea level rise and erosion trends in different coastal areas of Ireland, potentially useful for coastal vulnerability assessment to climate change impacts.
3b Process related functionalities
MIDA’s structure is well articulated and complete, thus enabling users to easily find data and information and relate the same to specific issues. Thus MIDA is well-shaped for problem understanding and structuring, as well as coastal management and planning at the national level. Indeed, the user statistics that the atlas is constantly visited attesting to its relevance and usefulness (Dwyer et al., 2011).
Concerning stakeholder involvement and participation, MIDA is totally accessible on-line and moreover stimulates users to share their own data through the MIDA tool.
4 Users
4a User typology
The broad nature of the atlas is intended for anyone who may be interested in Irish coastal and marine information. For this reason potential users are:
- Policy-makers; - Decision-makers; - Coastal planners and/or managers; - Specialised and expert users. - Representative of private sectors (e.g. industrial or energy
companies); - Civil society; - Students.
5 Use of the system
5a Accessibility Free access on-line to all the MIDA Atlas contents and functionalities.
5b User-friendliness Highly user-friendly.
The MIDA Atlas is built around an interactive map very easy to browse, which allows anyone to identify, visualize and query
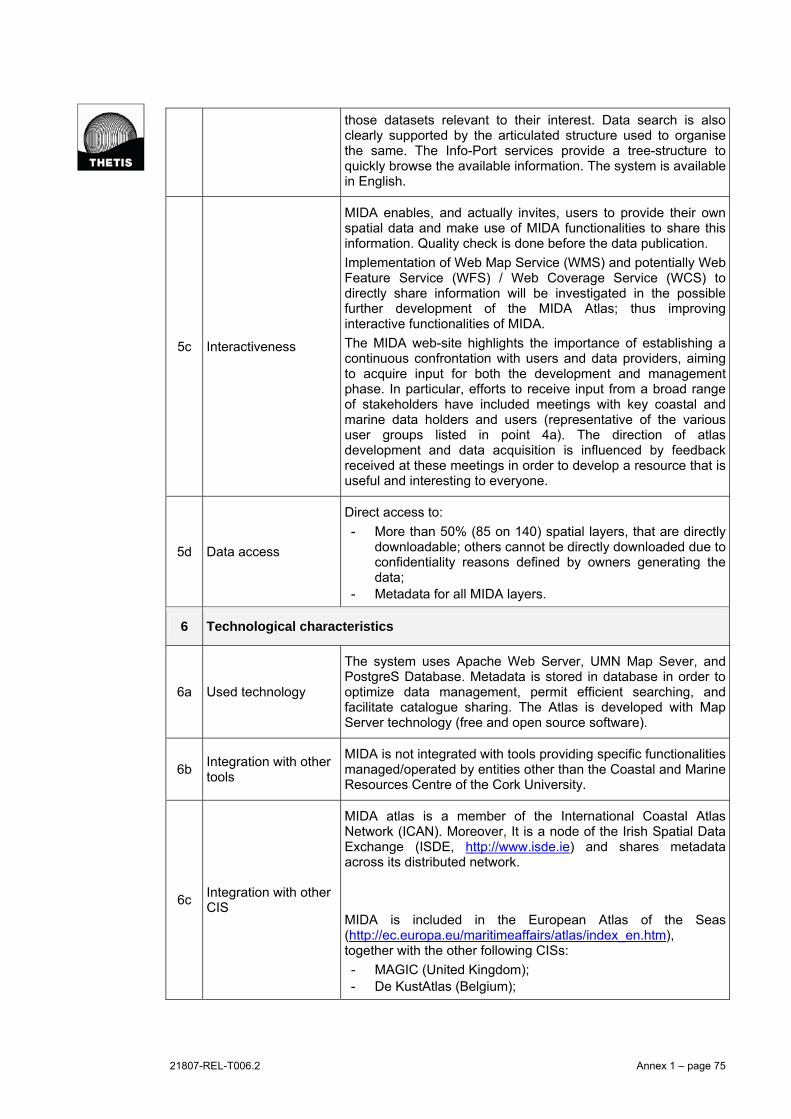
21807-REL-T006.2 Annex 1 – page 75
those datasets relevant to their interest. Data search is also clearly supported by the articulated structure used to organise the same. The Info-Port services provide a tree-structure to quickly browse the available information. The system is available in English.
5c Interactiveness
MIDA enables, and actually invites, users to provide their own spatial data and make use of MIDA functionalities to share this information. Quality check is done before the data publication.
Implementation of Web Map Service (WMS) and potentially Web Feature Service (WFS) / Web Coverage Service (WCS) to directly share information will be investigated in the possible further development of the MIDA Atlas; thus improving interactive functionalities of MIDA.
The MIDA web-site highlights the importance of establishing a continuous confrontation with users and data providers, aiming to acquire input for both the development and management phase. In particular, efforts to receive input from a broad range of stakeholders have included meetings with key coastal and marine data holders and users (representative of the various user groups listed in point 4a). The direction of atlas development and data acquisition is influenced by feedback received at these meetings in order to develop a resource that is useful and interesting to everyone.
5d Data access
Direct access to:
- More than 50% (85 on 140) spatial layers, that are directly downloadable; others cannot be directly downloaded due to confidentiality reasons defined by owners generating the data;
- Metadata for all MIDA layers.
6 Technological characteristics
6a Used technology
The system uses Apache Web Server, UMN Map Sever, and PostgreS Database. Metadata is stored in database in order to optimize data management, permit efficient searching, and facilitate catalogue sharing. The Atlas is developed with Map Server technology (free and open source software).
6b Integration with other tools
MIDA is not integrated with tools providing specific functionalities managed/operated by entities other than the Coastal and Marine Resources Centre of the Cork University.
6c Integration with other CIS
MIDA atlas is a member of the International Coastal Atlas Network (ICAN). Moreover, It is a node of the Irish Spatial Data Exchange (ISDE, http://www.isde.ie) and shares metadata across its distributed network.
MIDA is included in the European Atlas of the Seas (http://ec.europa.eu/maritimeaffairs/atlas/index_en.htm), together with the other following CISs:
- MAGIC (United Kingdom); - De KustAtlas (Belgium);

21807-REL-T006.2 Annex 1 – page 76
- De NoordZee Atlas (Netherlands); - The Atlas of the Venice Lagoon (Italy); - Coastal Atlas of Andalusia (SIGLA) - Cross Channel Atlas.
The MIDA Atlas displays data layers from numerous coastal and marine organizations both within Ireland and abroad, thus providing a single resource for finding and viewing data on Irish coastal and marine environment. Currently, the atlas is not dynamically WMS supported.
6d Interoperability
High.
In 2002 the Irish government began developing the Irish Spatial Data Infrastructure (ISDI; McCormack 2004). The development of the ISDI is closely involved with the larger INSPIRE initiative for developing a European Spatial Data Infrastructure. ISO 19115 is the core of the metadata standard of the ISDI and INSPIRE, therefore the approaches taken in this project are in line with these future infrastructures (McCormack 2003).
The ISO 19115 standard was chosen as the MIDA’s metadata standard because many key organisations handling spatial data in Ireland (e.g., Marine Institute, Environmental Protection Agency with the Water Framework Directive, The Department of the Environment with the ISDI) have adopted or are in the process to adopt it.
7 Cost/resources
7a Resources
This MIDA development project began in September 2002 and then it was funded for 3 years by the Higher Education Authority (HEA) under the National Development Plan's PRTLI 3 programme. Additional funding is being received from the Environment and Heritage Service, Northern Ireland.
The management of MIDA currently involves one full time staff and four part time resources.
Ned Dwyer is the MIDA manager.. Kathrin Kopke is the data manager; she is the coordinator of the acquisition and of preparation of new layers as well as updating the atlas. The others provide technical support, contributing to the database design and programming and creating, editing and preparing various GIS layers as well as completing metadata records.

21807-REL-T006.2 Annex 1 – page 77
Information sources for the overview analysis of MIDA:
Dwyer E., Kopke K., Cummins V., O’Dea L., Dunne D., 2011. Chapter 7: “Ireland”. In
Wrigth D., Dwyer E., Cummins V.[eds.], 2011. Coastal informatics: Web Atlas Design and
Implementation. Information science reference, Hershey, New York, pp. 105-130.
Wright D.J., Dwyer N, Kopke K., O’Dea L., 2010. Report of International Coastal Atlas
Network Workshop: Formalizing the network, engaging the Mediterranean. 16-20
November 2009, UNESCO International Centre for Theoretical Physics, Trieste, Italy.
O’Dea L, Cummins V, Wright D. J., Dwyer E., Ameztoy I., 2007. Report on coastal
mapping and informatics Trans-Atlantic Workshop: Potentials and limitations of coastal
web atlases. University College Cork, Ireland.
Dwyer N., O’Dea L., Cummins V., Arévalo J., Perales D., Coutel K., 2005. Data Collection
Experience with the Marine Irish Digital Atlas. Proceeding on “GIS Ireland Conference,
Dublin, October 2005.
O’Dea L., 2004. Improving access to coastal information: metadata in the Marine Irish
Digital Atlas. Paper presented at ECO-IMAGINE Opening Conference, 13-15 May 2004,
Seville, Spain.
O’Dea L., Cummins V., Dwyer N., 2004. Developing an informational Web Portal for
coastal data in Ireland: data issues in the Marine Irish Digital Atlas. Oceanology
International 2004's; GIS in the Marine and Coastal Environment Conference, London.
Dwyer E., O’Dea L., Cummins V., 2004. The Marine Irish Digital Atlas: providing
geospatial information to a wide audience. Littoral 2004, 20-22 September 2004,
Aberdeen, Scotland, UK.
Web-site consultation for the overview analysis of MIDA:
http://mida.ucc.ie/pages/atlas/atlas.php; last visit on 08/02/2011 at 10.30

21807-REL-T006.2 Annex 1 – page 78
Channel Coast Observatory Coastal Information System
1 General Information
1a Name Channel Coast Observatory Coastal Information System (CCO-CIS)
1b Description
The Channel Coastal Observatory is the data management centre for the Regional Coastal Monitoring Programme and is hosted by the New Forest District Council, in partnership with the University of Southampton and the National Oceanography Centre in Southampton.
The Channel Coast Observatory provides Web-based interfaces to browse tow on-line integrated tools: a Data Catalog and a Map Viewer. The two tools enable users to query, visualise and download a wide range of marine and coastal data on the UK south coast and the English Channel, including: coastal GIS data (such as Digital Terrain Models, monitoring data, or sediment distribution maps), aerial photography, reports.
1c Operating entity Channel Coastal Observatory - National Oceanography Centre
1d Management structure
Channel Coastal Observatory - National Oceanography Centre
1e Contacts
Channel Coastal Observatory - National Oceanography Centre University of Southampton Waterfront Campus, European Way Southampton SO14 3ZH, United Kingdom Tel: +44 (0)23 8059 8467 Fax: +44 (0)2380 596320 Email: [email protected] Web-site: http://www.channelcoast.org/
1f Typology Operational
2 Operational context and information content
2a ICZM dimensions The CIS contains very detailed data related to territory and partly environment. No data are provided for economic, social and governance dimensions.
2b ICZM Sectors
Main spatial data included in the Channel Coast Observatory CIS are: - Remotely sensed data - Aerial photography - Colour Infrared aerial photography - Topographic and bathymetry data - LIDAR data - Hydrographic data - Sediment distribution data - Cliff line - Waves data - Waves and tides real-time data

21807-REL-T006.2 Annex 1 – page 79
2c Integration No specific integration among information is directly provided
2d Spatial scale Sub-National – Coastal area in southern England along the English Channel
2d Flexibility Channel Coast Observatory Coastal information System hasn’t been developed in order to apply to other coastal territory.
3 ICZM functionalities
3a Knowledge related functionalities
CCO CIS strongly support the operation at different spatial scale. Available spatial data can be re-scaled according to the considered spatial extent, thus enabling to visualize more details at a higher scales. This is particularly evident for aerial photography and bathymetry data.
Other knowledge related functionalities include:
- Possibility to query and download a consistent sub-set of spatial information and other data typologies;
- Availability of multi-time data, such as in the case of waves and tidal historical data;
- Integrated data query; data can be queried according to both spatial and alphanumeric criteria in an integrated way.
Above functions can easily support extraction of data and their use by external users for sector analysis related to ICZM.
3b Process related functionalities
Primary goal the Channel Coast Observatory CIS is to share and make easily available marine and coastal data. In this perspective, it is not directly linked to an ICZM process; it can provide information and data to be used in ICZM at the regional scale, such as for example for the assessment of coastal erosion problems.
4 Users
4a User typology
The system is mainly dedicated to expert users. Information contained in the system is mainly scientific data and documentation that require a high level of expertise on hydrodynamic and morphological coastal processes.
5 Use of the system
5a Accessibility
Free access on-line to the whole system. After a free registration, all data (numeric, spatial, maps and report) can be visualised. Great part of them can also be downloaded.
The introductive web-page includes a clear explanation of the conditions of use of the data.
5b User-friendliness High.
The system is very user friendly and the web interface includes an explanatory help file. The system is available in English.
5c Interactiveness No specific e-participation tools are provided. Users can provide feedbacks on usability of the system.
5d Data access The CIS provide functionalities for the free download of great part

21807-REL-T006.2 Annex 1 – page 80
of data and reports. A 300 Mb limit is set for one downloading section.
All data (numeric and spatial) are provided with metadata information (particularly detailed) that can be visualised and downloaded. The metadata formats comply with ISO standards.
6 Technological characteristics
6a Used technology MapServer technology (Open source)
6b Integration with other tools
No specific integration with other tools
6c Integration with other CIS
No specific integration with other CIS
6d Interoperability
High.
The use of standard protocols for data management (according to INSPIRE Directive and a freely downloadable data policy) guarantees a high interoperability of the system. The metadata formats comply with ISO standards.
7 Cost/Resources
7a Resources
Information sources for the overview analysis of Channel Coast Observatory Coastal
Information System:
Green D. 2011. Chapter 13 “United Kingdom”. In Wrigth D., Dwyer E., Cummins V.[eds.],
2011. Coastal informatics: Web Atlas Design and Implementation. Information science
reference, Hershey, New York, pp. 192-213.Web-site consultation.
Web-site consultation for the overview analysis of Channel Coast Observatory Coastal
Information System:
http://www.channelcoast.org/; last visit on 14/02/2011 at 15.50.
21807-REL-T006.2 Annex 1 – page 81
Dorset Explorer - Dorset Coastal Explorer
1 General Information
1a Name Dorset Explorer - Dorset Coastal Explorer
1b Description
Dorset Explorer is a web-GIS allowing users to visualize of layers related to the Dorset Region in the South of England. Spatial information is not only related to the coastal area, but more in general to the whole Dorset territory. The system is also particularly interesting since provides some innovative functionalities for data query and investigation, also enabling to re-call information related to local planning. Dorset Explorer development is strictly related to the activities of the Dorset Coast Forum that has been at the forefront of Integrated Coastal Zone Management (ICZM) since 1995. The Dorset Coast Forum is an established Strategic Coastal Partnership made up of over 220 public, private and voluntary member organisations. The Dorset Coast Forum covers from Lyme Regis to Christchurch out to 12 nautical miles. Its primary objective is to encourage co-operation and dialogue between all the different stakeholders of the coast in the Dorset area. C-SCOPE Interreg (Cross Border 2 Seas Programme) project, currently under going, is providing funds for the further evolution of the Dorset Explorer. This description is mainly related to the version of the Dorset Explorer available through the C-SCOPE web-site (http://www.cscope.eu/en/). However, the system is under evolution and will in particular include ICZM and sustainability indicators in order to fully support scientific-based decision making. Indicators to be implemented will be defined accordingly to the experience acquired by the ICZM Coordination Centre in Belgium (see Kust Atlas description), partner of the C-SCOPE project. The tool should be finalised by the end of 2011. C-SCOPE will also develop a framework for integrating terrestrial and marine management planning, involving the development of a pilot Marine Spatial Plan for a selected area of the Dorset coast. This experience will contribute in supporting integration between ICZM and MSP policies and tools, hopefully to be transferred in the Web-GIS component as well. Finally, C-SCOPE will provide a series of hi-tech interactive coastal information points (or Coastal explorer access points) to improve stakeholders’ engagement. A detailed description of the new system that will be developed is contained in Chapter 5, under the section Dorset Coastal Explorer.
1c Operating entity
Dorset Coast Forum The Dorset Coast Forum team is hosted by Dorset County Council and funded by: Weymouth and Portland Borough Council, Borough of Poole, Environment Agency, Natural England, Wessex Water, Dorset Wildlife Trust, Dorset County Council, West Dorset District Council
1d Management structure
Dorset Coast Forum
1e Contacts James Feaver; e-mail: [email protected]

21807-REL-T006.2 Annex 1 – page 82
Dorset Coast Forum Marine and Coastal GIS Officer c/o Dorset County Council County Hall, Dorchester – Dorset - DT1 1XJ United Kingdom
Web: http://www.cscope.eu/en/
1f Typology Pre-operational; a consistent part of the system is under improvement
2 Operational context and information content
2a ICZM dimensions
The Dorset Explorer mainly addresses four of the five ICZM dimension providing a lot of related information. Considered dimensions are: territory (e.g. general geographic descriptors, marine natural area, landscape, area of outstanding natural beauty, and heritage coast natural areas), society (e.g. population data census, schools location, hospital locations, etc.), economy (e.g. mineral areas, waste and landfill site, land use policies, etc.) and governance (e.g. 2002 Adopted Local Plan, specific information on local planning, etc). The environmental dimension is also considered, even if it is relatively much less addressed by the Dorset Explorer
2b ICZM Sectors
Dorset Explorer includes a complex and wide series of data, main related to:
- Base map (DTM and historical aerial photos);
- Dorset Digital Terrain Model (DTM);
- Aerial Photography
- Highways network;
- Traffic sensitivity;
- 2002 Adopted Local Plan, showing among the others: landscape and conservation, ancient monument, area of great landscape value (AGLV), area of outstanding natural beauty (AONB), nature conservation/reserve, parks and gardens of special historic interest, Sites of Nature Conservation Interest (SNCI). etc;
- Recreational activities
- Land Use Policies, including data on: car parking, community use, employment, environmental improvement, housing, main urban area, schools, etc.;
- Water protection (i.e. pollution control reed bed);
- Landscape, such as: registered common land, open access land, dedicated access land, heritage coast, character areas, natural areas, marine natural areas, green belt, world heritage site;
- Administrative boundaries;
- Population census;
- Community, including: libraries, ambulance station, police estates, fire stations, pharmacies, etc.
- Historic environment (monuments, protected wreck sites, war graves, conservation areas etc.).
2c Integration
No specific integration among information is directly provided at the moment.
The Dorset Coastal Explorer, is currently under development within the C-SCOPE project.

21807-REL-T006.2 Annex 1 – page 83
2d Spatial scale Sub national scale – Dorset region and its coastal marine zone
2d Flexibility The Dorset Explorer has been developed in order to be applied to the specific coastal territory of the Dorset region
3 ICZM functionalities
3a Knowledge related functionalities
Dorset Explorer currently provides some of the knowledge related functionalities considered by the analysis; specifically:
- Operation at the different spatial scale; some of the available spatial data can be re-scaled according to the considered spatial extent; thus enabling to visualize more details at higher scales;
- Availability multi time data: The aerial photos are available for different periods (2002-2005-2009).
ICZM knowledge related functionalities will be significantly expanded in the new Dorset Coastal Explorer tool that will include ICZM and sustainability indicators to properly support scientifically-based decision making.
3b Process related functionalities
Dorset Explorer development and future implementation is strictly related to the objectives and activities of the Dorset Coast Forum, whose principal aim is to encourage co-operation and dialogue within the ICZM process. Web-GIS and other web-tools can support this objective.
Dorset Explorer already supports and includes some ICZM process related functionalities (partly also innovative). In particular:
- The Local Plan Policy Report tool enables to re-call (through an hyperlink function) and visualise a report with all relevant policies, documents or other information about a selected area;
- It is possible to generate short reports describing the selected features (areas) of some layers, such as: natural area, marine natural areas, monuments or other important areas. Report is activated through an hyperlink function. These information may be useful in supporting some of the ICZM related aspects (such as for example communication and awareness raising).
ICZM process related functionalities will be relevantly improved by the C-SCOPE project, in particular through:
- A framework for integrating terrestrial and marine management planning, involving the development a pilot Marine Spatial Plan for a selected area of the Dorset coast. This experience will contribute in supporting integration between ICZM and MSP policies and tools;
- A series of hi-tech interactive coastal information points (or Coastal explorer access points) to improve stakeholders’ engagement. These access point will permit to highlight features such as marinas, beaches and “Codes of Practice” for safe and sustainable use of the coast.
4 Users
4a User typology
One of the main goal of Dorset Explorer is disseminating information and related services and makes them accessible to ensure data sharing. The system may be therefore useful for a wide range of users’ typology, i.e. all ICZM stakeholders.

21807-REL-T006.2 Annex 1 – page 84
5 Use of the system
5a Accessibility Free access on-line (access allowed to all users without password) to all the information and functionalities provided by the system
5b User-friendliness
Highly user-friendly. The system is very easy to use. It also provides clear explanation of all the functionalities included in the interactive screen through specific help pages. The system is available in English.
5c Interactiveness
No specific e-participation tools are available. Dorset Explorer enables users to provide suggestions to improve the functionality of the system. This can be done through a specific feedback form. Also in this case, C-SCOPE will improve interactiveness. In particular a series of hi-tech interactive coastal information points (or Coastal explorer access points) to improve stakeholders’ engagement will be designed and realised.
5d Data access
Dorset Explorer only provides the possibility to export customised maps in pdf format. Spatial data can not be downloaded. Few information is available on the viewable maps; in particular legends and metadata are not provided.
6 Technological characteristics
6a Used technology
Dorset Explorer 2.5 has been developed with MapInfo and MapXtreme technologies. A technological upgrade of the system is also under development towards a more flexible platform.
6b Integration with other tools
The system is integrated with the web sites providing information to generate reports on local policies and descriptive information of the selected areas, through the tools described in 3b.
6c Integration with other CIS
No specific integration with other CIS. The development of the Dorset Coastal Explorer is part of the C-SCOPE project that also foresees the further improvement of the Belgian Kust Atlas (involving the ICZM Coordination Centre of Belgium). However KustAtlas and Dorset Coastal Explorer are different tools, with different aims and different target users: the first one is mainly a communication tool designed as a portal site to wider audience; the second one is mainly a planning tool, designed for stakeholders and planners.
6d Interoperability
7 Cost/Resources
7a Resources One person at Dorset coast Forum managing data and 5 persons for the tool development and maintenance, including base mapping data.
Web-site consultation for the overview analysis of Dorset Explorer - Dorset Coastal Explorer:
Web-site: http://www.dorsetforyou.com last visit on 17/02/2011 at 12.30
Web-site: http://195.49.180.76/dorsetexplorer/?version=edlp last visit on 17/02/2011 at
12.30
Web-site: http://www.cscope.eu last visit on 17/02/2011 at 12.45.
21807-REL-T006.2 Annex 1 – page 85
Cork Harbour Geographic Information System
1 General Information
1a Name Cork Harbour Geographic Information System
1b Description
The Cork Harbour Geographic Information System has been developed within the Interreg COREPOINT (COastal REsearch and POlicy INTegration) project (2004-2008).
One of the main goals of the Corepoint project was to bridge the gap between research institutions and local authorities dealing with ICZM. The project intended to properly use scientific experience and resources to provide improved information for planners responsible for local coastal areas as part of an ICZM approach. The project selected Cork Harbour as one of the site for the development of GIS tools supporting the ICZM process.
Cork Harbour initiative focused on coastal and vulnerability, habitat loss, tourism pressures and development options for the Brownfield area (Corepoint, 2005). Inside the COREPOINT activity, the final outcome of the Cork Harbour ICZM related initiative was the development and publication of an Integrated Management Strategy for Cork Harbour in 2008. The strategy was the result of a cooperative effort jointly done by local authorities and academic experts.
Cork Harbour initiative also included the development of a GIS providing support to the above ICZM processes. In particular within this GIS, the Coastal and Marine Resources Centre (CMRC) of the Cork University developed a GIS section (called “Coastal Inventory”) providing a comprehensive database of shoreline features, aiming to support the monitoring, management, development and conservation of coastal, estuarine and riparian habitats. The Coastal Inventory enables to generate maps, reports and statistics that can be used by planners, managers, and regulators in decisions making on the coastal area.
Cork Harbour and the related GIS were also analysed by the EU FP7 SPICOSA project (2009-2011) aiming in general to develop a self-evolving and operational research approach framework for the assessment of policy options for the sustainable management of coastal zone systems.
At the moment funding for the support and the implementation of the Integrated Management Strategy and hence the development of the GIS, are allocated through a new INTERREG project called IMCORE.
1c Operating entity
The Planning Policy Unit (PPU) of Cork County Council and the Coastal and Marine Resources Centre (CMRC) of Cork University are the IMCORE project partners. They also operate the Secretariat function.
One of the main functions of the Secretariat is to manage the stakeholder contact database for the Forum and maintain the http://www.corkharbour.ie/ website, which will be a focal point for information on relevant activities.
21807-REL-T006.2 Annex 1 – page 86
1d Management structure
The Coastal and Marine Resources Centre of the Cork University
1e Contacts
Cathal O’ Mahony, [email protected]
Coastal Inventory Team Coastal and Marine Resources Centre University College Cork Naval Base, Haulbowline Cobh, County Cork, Ireland
web-site: http://cmrc.ucc.ie/CI/index.htm
1f Typology Operational
2 Operational context and information content
2a ICZM dimensions
The GIS mainly addresses four of the five considered information dimensions: environmental (e.g. shoreline, river), territorial (land use manmade shoreline, roads) society (e.g. residential structures, marinas, water safety training, diving) and economic (industrial area, tourism activities).
2b ICZM Sectors
The Coastal Harbour GIS includes the following main spatial layers:
- Shoreline type (e.g. revetments, sea walls, beaches, docks, rocky shores);
- Shoreline features (e.g. jetties, piers, pontoon, steps, ladders);
- Shoreline vulnerability (e.g. state of repair, conditions, erosion);
- Land use (e.g. agriculture, industry, residential, amenity).
- Administrative boundaries;
- Population density;
- Tourism structures (marinas, diving, charter companies, sailings clubs).
2c Integration
Inside the Cork Harbour GIS there is a customized feature called “The Coastal Inventory”. This is a comprehensive database of shoreline features, aiming to support the monitoring, management, development and conservation of coastal, estuarine and riparian habitats.
2d Spatial scale
Local - Cork Harbour area.
Cork Harbour area is a large natural harbour on the southern coast of Ireland. It is a complex estuarine coastal system with a water body surface area of approximately 100 km2. Some parts of the area are also densely populated, indeed about 65% of County Cork’s population lives in close proximity to the coast.
2d Flexibility
The Cork Harbour GIS was created following the line of development set out in the report "Guidelines for Implementing Local Information Systems at the Coast" developed within the COREPOINT project (COREPOINT: Stojanovic et al., 2007).
The Guidelines were developed on the basis of the experience on

21807-REL-T006.2 Annex 1 – page 87
local ICZM processes of six COREPOINT partners (Essex Estuaries, Sefton Coast, Severn Estuary, Fal Estuary, and Cork Harbour) and results of the engagement and participation of over 100 local stakeholders.
3 ICZM functionalities
3a Knowledge related functionalities
Cork Harbour GIS provides some of the knowledge related functionalities considered by the analysis, specifically: - Integrated maps (see 2c); - Availability of multi-time data: multi-time data are for
example available for the shoreline position.
3b Process related functionalities
The Cork Harbour GIS was developed in order to specifically support the local ICZM experience. Within the COREPOINT project, the ICZM experience focused on the first three (of the five) steps identified for the Cork Harbour area: (i) Issue identification and assessment, (ii) Programme preparation, (iii) Formal adopting and funding. These activities finally led to led to the publication of an Integrated Management Strategy for Cork Harbour in 2008.
The process that underpinned the development of this Strategy document involved a leadership and facilitation role by the local COREPOINT project partners, communication with stakeholders through the Cork Harbour Forum, the organisation of two stakeholder workshops, and consultation with a Strategic Advisory Group (SAG, currently named Harbour Management Focus Group).
The implementation of the ICZM Strategy (forth step of the process) is currently on-progress and involve the design and publication of an ICZM Action Plan (2008-2011). The Action Plan is yearly delivered and subsequently reviewed taking into consideration the interactive nature of ICZM and the need to ensure a flexible process to deal with emerging and changing priorities.
The Cork Harbour GIS has therefore provided data and functionalities supporting various aspects of the ICZM experience, including: problem understanding and structuring, Assessment of alternatives in planning and management, monitoring and evaluation, adaptive planning and management. Furthermore, through the IMCORE project, specific research is undertaken to examine the use of scenarios to support the planning process for climate change and ultimately benefit local coastal communities.
4 Users
4a User typology
Users of the Cork Harbour GIS are mainly coastal planners, managers, and regulators (i.e. decision makers’ level).
Future activities foresee the development of web-GIS that will be made available to all potential users (see http://www.corkharbour.ie/pages/gis.htm).
5 Use of the system
5a Accessibility At the moment, the access of the system is restricted only to off-

21807-REL-T006.2 Annex 1 – page 88
line users.
5b User-friendliness
5c Interactiveness
No specific e-participation tools are currently available within the Cork Harbour GIS. However the GIS has been used in supporting the wide participatory approach and activities underpinning the ICZM process (i.e. Cork Harbour Forum, Harbour Management Focus Group, Cork Harbour News, thematic workshops, Working Groups, etc.).
Next steps foresee the development of a web-GIS tool that will further enhance interactiveness.
5d Data access No data and metadata are directly accessible on line at the moment. The web-GIS development will enable direct access to part of the GIS information.
6 Technological characteristics
6a Used technology The GIS is developed with ESRI software technology (licensed software).
6b Integration with other tools
The GIS includes the “Coastal Inventory” (developed and operated by CMRC), a comprehensive database of shoreline features, aiming to support the monitoring, management, development and conservation of coastal, estuarine and riparian habitats.
6c Integration with other CIS
No integration with other CIS.
6d Interoperability
7 Cost/Resources
7a Resources Initial funding to develop the system was provided by the Interreg IIIB COREPOINT project. The Interreg IVB IMCORE project has provided funding for the further implementation phase.
21807-REL-T006.2 Annex 1 – page 89
Information sources for the overview analysis of the Cork Harbour Geographic Information
System:
COREPOINT, 2008., Cummins V., Griffin P., Gault J., O’Mahony C., and O’Suilleabhain
D. (Editors). Cork Harbour Integrated Management Strategy: 2008. COREPOINT:
Coastal Research and Policy Integration, EU INTERREG IIIB Project. pp.35. [Online].
Available: http://www.corkharbour.ie.
Carlisle M.A., Green D.R., and Ritchie W., 8Eds) 2008. Corepoint Expert Couples and
case studies: Description of physical, ecological, and socio-economic context and of
area-specific Corepoint activities. University of Aberdeen, pp92.
Cummins V., Gault J., O’Mahony C., Köpke K., Griffin P., Walsh E. and O’Suilleabhain D.,
2008. Establishing Information Needs for Planning and Assessment of Recreation Activity
in the Coastal Environment: A Case Study from Cork Harbour, Ireland. Proceedings of
the International Pluridisciplinary Conference - The Littoral: Challenge, Dialogue, Action.
16th-18th January, Lille, France.
COREPOINT: Stojanovic T.A. (2007) Guidelines for Implementing Local Information
Systems at the Coast. COREPOINT and Cardiff University, Cardiff. Available online at:
http://crc67.ucc.ie/corepoint/wp46.
Kopke K., 2006. Applying GIS to Coastal Management in Cork Harbour: the Corepoint
experience. Proceeding to the Thematic Conference: “THE WATERFRONT
MANAGEMENT AND GI”. Genoa (IT), 14th-18thNovember 2006.
Web-site consultation for the overview analysis of the Cork Harbour Geographic Information
System:
http://cmrc.ucc.ie/CI/index.htm; last visit on 23/02/2011 at 10.30.
http://www.corkharbour.ie/; last visit on 24/02/2011 at 15.00.
http://imcore.eu/; last visit on 04/03/2011 time 16.50.
http://corepoint.ucc.ie/; last visit on 04/03/2011 time 17.50.
http://ec.europa.eu/environment/iczm/ourcoast.htm, last visit on 23/02/2011 at 10.00.
21807-REL-T006.2 Annex 1 – page 90
GEOIDD-Litto
1 General Information
1a Name GEOIDD-Litto
1b Description
GEOIDD-Litto (Geographie et indicateurs du développement durable sur le littoral – geography and indicators related to coastal sustainable development) is a web cartographical tool that allows to access a high number of geographic and statistical information, both for land and sea, along the French coast and overseas departments (Guadeloupe, Martinique, Guyane, Reunion).
GEOIDD-Litto responds to one of the main objectives of the French Observatoire du Littoral, in particular related to:
- Organise and share information and data on the coastal system;
- Improve the vertical and horizontal information flow among different administrations dealing with coastal management issues;
- Contribute to the discussion on the standardization of protocols for collecting, processing and sharing data.
The system consists of two separated main tools, with two different web-interfaces:
- A statistical data tool, related to social, economic and environmental statistic indicators. The tool also allows to map the selected data (up to two indicators can be jointly mapped) at the municipality level. The same tool enables to download selected data.
- A geographic data tool, enabling the visualisation of various land and marine spatial information.
GEOIDD-Litto allows users to print maps, to extract statistical data, to build images in different formats (jpeg, png, pdf), to build “portrait of territories” (summary reports with tables and charts), to map own statistical data and to map geographical data from other tools (trough web-service protocol like WMS - Web Map Service).
1c Operating entity
The operating entity is the Observatoire du Littoral (French coastal observatory)
The Observatoire du Littoral includes, as part of an agreement: the Ministry of Ecology, Sustainable Development, Transportations and Housing; the Inter-ministerial Delegation for Territorial Planning; and the General Secretariat of the Sea.
1d Management structure
Observatoire du Littoral
1e Contacts
Sébastien Colas; e-mail: [email protected]
Observatoire du littoral Ministère de l’Ecologie, du Développement durable, des Transports et du Logement
Web site of GEOIDD Litto:
21807-REL-T006.2 Annex 1 – page 91
http://www.littoral.ifen.fr/Cartographie.6.0.html
1f Typology Operational
2 Operational context and information content
2a ICZM dimensions
The CIS addresses all the ICZM dimensions considered by the analysis: territory (e.g. for general geographic descriptors, land and sea uses, marine protected areas), environment (specifically related to nature and biodiversity), economy (e.g. employment, tourism, use of the sea), society (e.g. housing), governance (e.g. urban planning in coastal areas).
2b ICZM Sectors
Information content is structured in the following thematic issues, for each of them the availability of geographical data and/or statistical data interface is indicated:
- land use - geographical and statistical data tool; - water - geographical and statistical data tool; - nature and biodiversity - geographical and statistical data tool; - administrative boundaries - geographical data tool; - transports routes - geographical data tool; - zoning and uses of the sea - geographical data tool; - coastal morphology - geographical data tool; - natural risks – statistical data tool; - agriculture – statistical data tool; - tourism – statistical data tool; - population housing – statistical data tool; - employing – statistical data tool; - urban planning – statistical data tool.
2c Integration The statistical data tool enables to generate maps combining the visualisation of two indicators, thus providing partially integrated information.
2d Spatial scale National scale – France and overseas departments.
The system can operate at different scales: from the national to the local one.
2d Flexibility GEOIDD-Litto has been specifically developed for the French coastal area
3 ICZM functionalities
3a Knowledge related functionalities
Several knowledge functionalities, supporting ICZM process are available:
- Integration among different information sectors (see point 2c); this is provide by the statistical data tool, although limited to the combined visualisation of two indicators;
- The CIS allows interactive mapping, but proper GIS data are not downloadable;
- Operation at the different spatial scale; some of the available spatial data can be re-scaled according to the consideredspatial extent; thus enabling to visualize more details at a higher scales. This functionality is supported by the geographical data tool;

21807-REL-T006.2 Annex 1 – page 92
- For some layers, mainly for socio-economic and territorial data, multi-time information is available (e.g. land use,unemployment rate);
- The CIS include some ICZM indicators, such as for example area of built up land, protected areas, land take by intensive agriculture, sectoral employment. A specific tools is provided to deal with indicators related functionalities (statistical data tool).
3b Process related functionalities
GEOIDD-Litto provides a high variety of data related to different ICZM sectors and dimensions and therefore can properly support the problem understanding process. Information is provided by the two tools in different formats maps and/or indicators.
The statistical data tool is particularly relevant to support problem understanding and decision making in general. Indeed, it allows not only to map and download data and metadata related to selected statistics, but also to generate customized “portraits” on a specific spatial selection. “Portraits” are short report including summary tables and charts.
4 Users
4a User typology
Taking in to account the Observatoire mission and the information content of the CIS, the target users can be mainly identified as:
- Decision makers, in particular since summary information are provided by the system (e.g. indicators and statistics);
- Coastal planners and/or managers, for the information related to territory (use of land and sea) and coastal plans;
- Civil society, interested in being informed on and/or participating in ICZM: the geo-information typology provided by the system are easily understandable from non expert users
5 Use of the system
5a Accessibility Free access on-line without password to the complete CIS
5b User-friendliness
Highly user-friendly
Intuitive operation of the system, for both available tools (geographical data tool and statistical data tool). Animated tutorial are available to help the user. The system in available only in French.
5c Interactiveness No specific e-participation tools appear to be available. However, the system is totally accessible on-line.
5d Data access
Data can be downloaded from the statistical data tool, in excel format. Spatial data (GIS layer) can not be downloaded from the geographic data tool.
Maps can be displayed and printed and the project can be saved in a specific url.
Finally, GEOIDD-Litto allows the easy access to detailed and clear metadata (metadata sheets) for all the available layers.

21807-REL-T006.2 Annex 1 – page 93
6 Technological characteristics
6a Used technology Flash technology; database working with PHP and MySQL technologies
6b Integration with other tools
No specific integration between the GEOIDD-Litto system and other tools.
The website of the Observatoire du littoral enables to access a specific thematic section containing structured information (graphs, factsheets, excel data) on several statistical indicators useful for the sustainable development of the coast.
The system collects most of the statistical and geographical data available in France. Integration with other tools is provided in the “useful links” page, where several links area available, including:
- Geolittoral, an additional tool managed by the CETE Normandy Centre Directorate General of Planning, Housing and Nature that provides large scale data including free coastal orthoimagery;
- Bosco webpage, observation base for coastal monitoring implemented jointly by the BRGM (French geological survey) and CETMEF (Maritime and River Technical Studies Centre), containing shoreline metadata from different sources.
- Territorial observatory, governmental web site providing interactive mapping and download of hundreds of environmental, social and economic data.
Observatory of the Aquitaine coast, decision support tool for the management and development of the Aquitaine coast.
6c Integration with other CIS
In the case of GEOIDD-Litto this issue is strictly connected with and therefore addressed in point 6b.
6d Interoperability
High
The system has been developed following the INSPIRE and MOTIIVE standards, guaranteeing high interoperability. The geographical data tool provides full interoperability with other data providers’ spatial information through OGC - WMS application.
7 Cost/Resources
7a Resources About € 45.000 for the first version of GEOIDD-Litto. (2006). Additional cost of about € 50 000 for the tool currently online (2009).
Web-site consultation for the overview analysis of GEOIDD-Litto:
http://www.littoral.ifen.fr/Cartographie.6.0.html.; last visit on 03/24/2011 at 12.30.

21807-REL-T006.2 Annex 1 – page 94
GÉOBretagne
1 General Information
1a Name GÉOBretagne
1b Description
GÉOBretagne is an Internet platform (Spatial Data Infrastructure – SDI) for the exchange and consultation of geographical information, born from the desire of sharing and publishing geographical information useful for the knowledge and the development of the territory of Bretagne. The GÉOBretagne web-site includes a Web-GIS with spatial data referring to the whole Bretagne Region, also including its coast. In particular the Web-GIS, among many others, contain data specifically related to the Breton littorals.
GÉOBretagne has been developed within a project part of the Contract-Project State-Region (CPER) 2007-2013 in Bretagne, signed in April 12, 2007, aiming at strengthening the competitiveness of Bretagne region by improving data accessibility. GÉOBretagne also aims to disseminate information for the public in compliance with the INSPIRE Directive. GÉOBretagne initiative involves a wide partnership of public bodies that are interested in sharing and exchanging data, and wish to undertake a process of sharing and pooling of data and transparency to the citizen. Partnership includes: state departments, local authorities, public institutions, planning agencies, etc.
GÉOBretagne organisation is articulated in the following main structures:
- A steering committee coordinated by the Bretagne Region and Prefecture of the Bretagne Region;
- A technical committee led by the secretariat GÉOBretagne;
- Thematic groups: repositories of base data (cadastral data, road and addressing, aerial orthophotos and digital elevation model);
- Cataloguing
- Energy
- Littoral
- Hiking and nature activities,
- Telecoms
- Urbanism.
The GÉOBretagne web interface provides two main tools to access, view and use the geographical information:
- A map viewer (Web-GIS), to display data and customise own maps, also through Web Map Service (WMS). Pre-defined maps can also be directly visualised by the users through the Cartographie function.
- A data catalogue, to search and download data and metadata on the Bretagne Region. The catalogue is used to share and make available spatial data and metadata related to the Bretagne Region. Search can be done through key words and/or a map viewer enabling to select an area of interest. For the selected information: (i)Metadata are showed thought an

21807-REL-T006.2 Annex 1 – page 95
extended and detailed metadata sheet (ii) data can be downloaded (for some of them), (iii) spatial data can be visualised through the map viewer or Google.
GÉOBretagne also provides a functionality to search for documents
1c Operating entity GÉOBretagne secretary – Operation and management involves all the various committees (with different roles) of the GÉOBretagne initiative
1d Management structure
GÉOBretagne secretary – Operation and management involves all the various committees (with different roles) of the GÉOBretagne initiative
1e Contacts E-mail contacts; [email protected]; [email protected] GÉOBretagne web-site: http://www.geobretagne.fr/
1f Typology Operational
2 Operational context and information content
2a ICZM dimensions
The more developed ICZM dimensions are those related to territory (e.g. land use and natural parks/protected areas) and the socio-economic (e.g. transports, school, economic activities) issues. The other two dimensions – i.e. governance (e.g. natural park planning). and environment (e.g. bathing water quality) – are partly covered.
2b ICZM Sectors
Spatial data accessible through the map viewer can be selected and visualise by the Geo-catalogue tool. This in particular enables to organise spatial data according to different structures, including the one related to the INSPIRE Directive. According to the default structure data are organised in the following themes:
- Economic activities - Agriculture - Water - School - Cadastral data - Housing - Transport - Administrative boundaries - Littoral - Architectonic, cultural and urban heritage - Natural Park planning - Natural , technological and sanitary risks - Urbanism - Digital economy - Energy - Public facilities
All theme are split in specific layers; the Littoral thematic includes a high number of spatial data concerning coastal issues(e.g. marine parks, natural reserves, landing points, hotels/camping, coastal land use, access to the sea). Other data can be visualised on the map viewer through the OGC service enabling to select one of the pre-define WMS connection (e.g. BRGM – geology or BRGM – risk) or specifying an url

21807-REL-T006.2 Annex 1 – page 96
address.
2c Integration Examples of integrated information are maps related to the assessment of the natural and technological risks for the addressed territory.
2d Spatial scale Sub-National scale - Bretagne (France)
2d Flexibility The system has been developed in order to be applied specifically to the Bretagne territory.
3 ICZM functionalities
3a Knowledge related functionalities
GÉOBretagne provides some of the knowledge related functionalities considered by the analysis; specifically:
- Integration among different information sectors (see point 2c), including some integrated maps related to natural and technological risks;
- Availability of spatial data; GÉOBretagne actually aims to support data sharing and dissemination to public users. Data (including geographical ones) and metadata are shared through the Catalogue functionality;
- Support experiences and best practices exchange in relation to data management and geographic information in general
3b Process related functionalities
GÉOBretagne provides a high variety of data related to different information sectors and dimensions and therefore can properly support problem understanding. Spatial data are organised according to an articulated structure (various possible structures are proposed) that can support user in the elaboration of conceptual models of the territory.
4 Users
4a User typology
Data exchange with public stakeholders of the region is one of the main objective of GÉOBretagne. Public stakeholders are therefore the main target user typology for GÉOBretagne.
Coastal professionals and experts can be more interest in the use of the Catalogue tool that makes available spatial data and metadata.
Civil society is also a target user, since one of the specific GÉOBretagne aim is to diffuse information and data to citizens.
5 Use of the system
5a Accessibility Free access on-line to great part of the system. GÉOBretagne partners have the possibility to access further information and functionalities through login and password.
5b User-friendliness
Highly/Medium user-friendly
Use of the map viewer is easy and intuitive. Use of the catalogue requires more expertise and is less simply, mainly addressing expert users. Help user guides are also available. The web site and the documentation resource are in French language only.
5c Interactiveness No specific e-participation tools are provided by GÉOBretagne

21807-REL-T006.2 Annex 1 – page 97
5d Data access
A great part of spatial data can be downloaded through the Catalogue functionality that also provides a detailed description of metadata. Public bodies of the Britain Region that are members of the GÉOBretagne partnership have access to wider information and can download all spatial data.
Map viewer does not enable the user to directly download data. Maps can be however printed from this interface. Map viewer provides detailed metadata for all available spatial layers.
Users can also customise maps provided importing spatial data through Web Map Service (WMS). WMS service also provides the possibility to visualise and use data share by GÉOBretagne from a client application, for example using the freely available GAIA software.
6 Technological characteristics
6a Used technology
GÉOBretagne map viewer was developed using the GeOrchestra open source software.
The Geoportal is based on the Open Source application “GeoNetwork” and is strictly related to standards and requirements of the INSPIRE Directive.
6b Integration with other tools
The Map-viewer and the catalogue are directly interrelated. Spatial layers included in the catalogue can be for example selected and viewed through the map-viewer.
6c Integration with other CIS
The map viewer (Web-GIS) enables to display data and customise own maps through Web Map Service (WMS), thus establishing a dynamic connection to any geographic dataset accessible through WMS.
6d Interoperability
High.
GÉOBretagne is equipped to meet the regulatory requirements of the INSPIRE Directive:
- It is compliant with metadata standards ISO 19115 and ISO 19139;
- it uses a server architecture OGC WMS, thus properly supporting data exchange and interoperability;
- Spatial data are organised according to INSPIRE structure.
7 Costs/Resources
7a Resources GÉOBretagne project received a total funding of 3 M € for 2007-
2013
Information sources for the overview analysis of GÉOBretagne:
Direction régionale de l’Equipement Bretagne, 2009. Le SIG littoral en Bretagne. Volet
littoral de la plateforme GéoBretagne®.
Web-site consultation for the overview analysis of GÉOBretagne:
http://www.geobretagne.fr/ Last visit on 12/04/2011 at 12.25.
21807-REL-T006.2 Annex 1 – page 98
Aquitaine Coast Observatory Coastal Information System
1 General Information
1a Name Observatoire de la Côte Aquitaine Coastal Information System (OCA-CIS) – (Aquitaine Coast Observatory Coastal Information System)
1b Description
The Aquitaine Coast Observatory is a regional partnership whose main aim is to provide coastal stakeholders with information, expertise and tools supporting decision making and management, within the ICZM context. The partnership, initiated in 2000, involve: the European Union; the French State; the Aquitaine Region; the Departmental Councils of the Gironde, Landes and Pyrénées-Atlantiques; the Inter-communal Syndicate of the Arcachon Basin, the Geological and Mining Research Bureau, and the National Forestry Office. The Aquitaine Coast Observatory is the first European experiment to manage coastal erosion on a regional scale.
The OCA-CIS is one of the main initiatives implemented by the Observatory; this GIS-based tool archive, standardize and disseminate data and metadata related to integrate coastal zone management. The CIS also includes a Web-GIS component, making available a sub-set of the whole CIS data.
The main actors of the Aquitaine Coast Observatory, the Aquitaine Region has developed other ICZM related tools, such as:
- A tool for regional governance and general coastal management; the Aquitaine Coast Public Interest Group, which involves all of Aquitaine's coastal management industry and aims to establish a sustainable development plan for 2007-2020;
- A pluri-disciplinary network of knowledge; the Réseau de Recherche Littoral Aquitaine (RRLA), (Aquitaine Coastline Research Network), associating multiple scientific organizations working in the coastal management sector.
The Aquitaine Region is also involved in ICZM related projects, such as the Atlantic Region’s Coastal Pollution Control (ARCOPOL – aiming to create a Regional network to combat pollution from coastal navigation) and the Atlantic Network for Coastal Risk Management (ANCORIM – aiming to create an operational network uniting European experts in coastal risk management).
1c Operating entity Aquitaine Coast Observatory (Observatoire de la Côte Aquitaine)
1d Management structure
Aquitaine Coast Observatory (Observatoire de la Côte Aquitaine)
1e Contacts Bérengère Papion; e-mail : [email protected]
Web-site of the Aquitaine Coast Observatory: http://littoral.aquitaine.fr/
1f Typology Operational

21807-REL-T006.2 Annex 1 – page 99
2 Operational context and information content
2a ICZM dimensions OCA-CIS address three ICZM dimension: territory, environment (e.g. flora, fauna and environmental quality) and society (e.g. population).
2b ICZM Sectors
OCA-CIS data are related to the following major topics:
- Coastline, aerial photos and satellite images; - Coastal hazards, - Costal facilities, - Fauna and flora; - Geodesy, geology, geomorphology, hydrogeology; - Monitoring instrumentation; - Oceanography; - Environmental quality; - Protected areas; - Beach nourishment interventions; - Corine land cover; - Population density.
Only some of the data included in the OCA-CIS are made available by the Web-GIS.
2c Integration
The OCA-CIS provide some examples of integrated analysis, including information on: coastal hazards and vulnerability of the coast to the erosion. These information are currently not available through the Web-GIS component.
2d Spatial scale
Sub-National scale – Coast of the Aquitaine Region.
The Atlantic shoreline of Aquitania Region stretches over more than 270 kilometres from the mouth of the Gironde Estuary to that of La Bidassoa in the south.
2d Flexibility Specifically focusing on the Aquitaine Region coastal area.
3 ICZM functionalities
3a Knowledge related functionalities
OCA-CIS provides some of the knowledge related functionalities considered by the analysis, specifically:
- Integration among different information, such in the case of coastal hazards and vulnerability of the coast to the erosion;
- Operation at the different spatial scale; some of the spatial data available in the Web-GIS can be re-scaled according to the considered spatial extent; thus enabling to visualize more details at a higher scales;
- Availability of multi-time data; for example coastline layers are available for about 8 years (1938-2009), thus enabling to assess coastline evolution in time.
3b Process related functionalities
The system does not specifically include ICZM process related functionalities; however it aims to support the Aquitaine Coast Observatory activity in providing coastal stakeholders with information, expertise and tools for decision making and
21807-REL-T006.2 Annex 1 – page 100
management, within the ICZM context.
4 Users
4a User typology
Potential users mainly those addressed by the Aquitaine Coast Observatory, i.e.:
- Decision makers, in particular at the regional level;
- Coastal planners and managers, both at the regional and local level.
5 Use of the system
5a Accessibility The access to the entire OCA-CIS is restricted to Aquitaine Coast Observatory members and allowed users. Part of the information is freely accessible through the Web-GIS component.
5b User-friendliness
High (for the Web-GIS component)
Access to thematic maps is rather intuitive; user guide and other information are available (in France). The system is available in French.
5c Interactiveness
OCA-CIS includes a Web-GIS component; however not specific e-participation tools are provided.
The Aquitaine Coast Observatory distributes a newsletter generally dealing with its on activities; this is currently drafted by the Ocean Association in Bordeaux (http://www.ocean.asso.fr).
5d Data access
The web-GIS does not allow downloading data and metadata. The Web-GIS provides a function to export (In pdf format) and print customized maps.
No metadata are provided by the Web-GIS. Metadata are fully developed for the off-line version.
6 Technological characteristics
6a Used technology OCA-CIS is developed with the ESRI-ArcGIS software (licensed software), Data are stored as relational database, to easily extract the desired information.
6b Integration with other tools
No specific integration with other tools
6c Integration with other CIS
No specific integration with other CIS
6d Interoperability
High.
The catalogue tool of metadata used by the Observatory for the OCA-CIS is GeoNetwork (http://adullact.net/projects/geocatalogue/).
This free software has been developed by the Bureau de Recherches Géologiques et Minières (BRGM – Office of Geological and Mining Research) and is based on the ISO 19115 international standard relating to spatial data, and the ISO 19139 standard on XML metadata, in agreement with the European

21807-REL-T006.2 Annex 1 – page 101
INSPIRE directive. It allows search capabilities, visualization, capture, print, import and export of metadata in XML format.
Metadata are not available for the Web-GIS component.
7 Cost/Resources
7a Resources The Aquitaine Coast Observatory is co-financed by the European Union.
Information sources for the overview analysis of Aquitaine Coast Observatory Coastal
Information System:
Florence BOUTEAU, 2009. Data and Indicators in relation with coastal zones in Aquitaine.
Presentation shown at “A day for cartographic system to manage coastal zone: Coastal
and maritime data: a common heritage, a capital to be shared, a challenge for innovation
in Europe”, Bruxells, 10/12/2009.
Web-site consultation for the overview analysis of Aquitaine Coast Observatory Coastal
Information System:
http://littoral.aquitaine.fr/spip.php?page=cartographie; last visit on 18/02/2011 at 11.00.
http://littoral.aquitaine.fr/; last visit on 18/02/2011 at 12.00.
http://www.crpm.org/index.php?act=6,1,2,167; last visit on 18/2/2011 at 11.00.
21807-REL-T006.2 Annex 1 – page 102
RIA FORMOSA Coastal Information System
1 General Information
1a Name RIA FORMOSA Coastal Information System
1b Description
The Ria Formosa CIS was developed within the Ditty Project (2003-2005) - Development of an Information Technology Tool for the Management of European Southern Lagoons under the influence of river basin runoff (funded by the Fifth Framework Program, Energy, Environment and Sustainable Development). The general objective of the Ditty Project was the development of information technology tools integrating databases, geographical information systems (GIS), mathematical models and DSS (Decision Support Systems) to support the management of southern European coastal lagoons and adjacent watersheds, within the spirit of the Water Framework Directive.
Ria Formosa coastal lagoon area was included as one of the test site of the project. Specific aim of the Rio Formosa case study was the implementation of a CIS able to integrate environmental and socio-economic information about the Ria Formosa lagoon and the area covering the river network draining into the lagoon. The CIS is supposed to be a two-way interface between spatial information and various mathematical models of the watershed and Ria Formosa.
The developed tools aimed to support the sustainable development of the considered area and management of its natural resources. Indeed, there are many conflicting interests over the management of this important coastal lagoon area, including: fishing, tourism, aquaculture, salt production, harbour activities, urban development and environmental conservation (i.e. the area include the Ria Formosa Natural Park). Furthermore, several institutions, such as the Natural Park Authority, Municipalities, the Portuguese Navy, just to mention a few, are involved in decision-making over several sectors relevant for the area.
1c Operating entity
The system was developed by the Fernando Pessoa University and the National Research Institute for Fisheries and Sea Research (IPIMAR).
Currently, the GIS component of the system is operated by the Ria Formosa Natural Park (RFNP) that has been identified as the final end-user of the system. The GIS tool is also used by the Fernando Pessoa University for its research activities on the Ria Formosa area.
1d Management structure
Ria Formosa Natural Park (RFNP) and Fernando Pessoa University
1d Contacts Pedro Duarte, e-mail: [email protected]
University Fernando Pessoa
1e Typology Operational

21807-REL-T006.2 Annex 1 – page 103
2 Operational context and information content
2a ICZM dimensions In the CIS all the five ICZM dimensions are addressed: territory, environment, economy, society and governance.
2b ICZM Sectors
The main information topics included in the CIS are summarised as follow:
- Physical environment: elevation and bathymetry, oceanography, physical geology, landscape, land-use, hydrogeology, hydrography, geology, types and use of soils, forest fires;
- Coastal management: Natura 2000 network, ecologic national reserve, administrative boundary, protected areas, management of the territory, vulnerable zones dune re-qualification;
- Biological features: bird census, flora and fauna;
- Socio-economical activities: demography, farming occupation, cultural values, building and accommodation, agriculture, cycle ways, clam farms, fish farm, harbour and nautical activities, recreational activities, salt extraction, waste treatment plants;
- Planning: municipal plans, POOC - Plan of the management of the seashore
2c Integration
The Ria Formosa CIS appears to include a wide variety of information, including some examples of integration among different data typologies, such information related to vulnerable zones and coastal risks.
2d Spatial scale
Local – Ria Formosa Lagoon and river network draining into the Ria Formosa Lagoon.
Ria Formosa is a shallow meso-tidal lagoon located in the south of Portugal in the Algarve Coast. The lagoon has several channels and a large intertidal area, which corresponds roughly to 50% of the total area (about 105 km2), mostly covered by sand, muddy sand-flats and salt marshes. Indeed the lagoon system is over-nourished by the sea and river sediments.
2e Flexibility
The methodological approach used to implement the Ria Formosa CIS was also used in the case of other two case studies of the Ditty project; the Thau Lagoon (France) and the Gera Gulf area (Greece). Ria Formosa CIS can be therefore considered as party flexible and exportable to other similar areas, with the necessary customisation.
3 ICZM functionalities
3a Knowledge related functionalities
Little information is available to properly describe this specific field.
Ria Formosa CIS is specifically developed to support the integrated assessment of different information typologies related to all the five considered dimensions. The tool also provides some example of integrated layers, such as those related to coastal vulnerability and risk.
3b Process related functionalities
The CIS provides high variety of data related to many typologies and therefore may properly support the problem understanding and

21807-REL-T006.2 Annex 1 – page 104
structuring phases.
The CIS is made of a GIS component and a two integrated mathematical models. The soil and water assessment tool enables to simulate land drainage to the coastal ecosystem, providing forcing conditions to the second model, EcoDynamo that simulates hydrodynamic and biogeochemical processes. Furthermore, within the Ditty project the models were coupled with a Decision Support System (DSS); the whole set of tools was therefore used to assess various management options of the Ria Formosa area. In particular, the considered scenarios included various dredging operations and changes in bivalve cultivation practices. A key aspect of the approach was the proper inclusion of the economic aspects of the various options, including for example the economic revenue of shellfish estimated yield. Rio Formosa CIS therefore provides functionalities related to: scenario development and assessment of alternatives, considering both environmental and economic aspects.
The CIS seems to not include specific functionalities related to stakeholder involvement and participation. However, its development and implementation foresaw the early involvement of the end-user (RNFP) and the organisation of special information events (e.g. international workshops).
4 Users
4a User typology
The system is specifically designed to support the scientifically-based management of the Ria Formosa area, also including advanced modelling tools. Indeed, main users are expert users, coastal planners and coastal managers. In particular the final "end-user" of the CIS is the Ria Formosa Natural Park Authority.
5 Use of the system
5a Accessibility Off-line access.
5b User-friendliness
5c Interactiveness No specific e-participation tools appear to be available.
5d Data access No data and metadata are directly accessible on line at the moment.
6 Technological characteristics
6a Used technology The GIS is developed with ESRI (ArcGis 8.3) technology (licensed software).
6b Integration with other tools
Besides the GIS component, the CIS also includes two integrated mathematical models. The soil and water assessment tool enables to simulate land drainage to the coastal ecosystem, providing forcing conditions to the second model, EcoDynamo that simulates hydrodynamic and biogeochemical processes. Furthermore, within the Ditty project the models were coupled with a Decision Support System (DSS), in particularly used for scenario building and assessment of management alternatives.
6c Integration with other CIS
No integration with other CIS
21807-REL-T006.2 Annex 1 – page 105
6d Interoperability
7 Cost/Resources
7a Resources
The budget allocated to the Portuguese partners involved in the Ditty project was about € 247,000. There were approximately 10 researchers working in the development of the tools over a period of three years. No specific data are available for operation coasts.
Information sources for the overview analysis of Ria Formosa CIS:
Duarte P., Azevedo B. and Pereira A., 2005. Hydrodynamic Modelling of Ria Formosa
(South of Portugal) with EcoDynamo. DITTY PROJECT (Development of an information
technology tool for management of Southern European lagoons under the influence of
river-basin runoff - EESD: EVK3-CT-2002-00084).
Duarte P., Azevedo B., Ribeiro C., Pereira A., Falcão M., Serpa D., Bandeira R and Reia
J., 2006. Scenario Analysis in Ria Formosa with EcoDynamo. DITTY PROJECT
(Development of an information technology tool for the management of Southern
European lagoons under the influence of river-basin runoff - EESD Project EVK3-CT-
2002-00084).
Duarte P., Azevedo B., Ribeiro C., Pereira A., Falcão M., Serpa D., Bandeira R and Reia
J., 2006. Hydrodynamic Modelling of Ria Formosa (South Coast of Portugal) with
EcoDynamo. Document developed within the “Ditty Project”. (EESD Project EVK3-CT-
2002-00084).
Falcão M., Fonseca L., Serpa D., Matias D., Joaquim S., Duarte P., Pereira A., Martins C.
and Guerreiro M.J., 2003. Development of an Information Technology Tool for the
Management of European Southern Lagoons under the influence of river-basin runoff.
EVK3-CT-20022-00084 (DITTY Project). Deliverable D3: Synthesis Report (September
2003) Ria Formosa.
Pereira A. and Duarte P., 2002. Development of an information technology tool for the
management of the Southern European Lagoons under the influence of the river basin
runoff. DSS application. CEMAS – Centre for modelling and Analysis of Environmental
System. University Fernando Pessoa, Porto, Portugal.
Roudriges A., Carvalho A., Reia J., Azevedo B., Martins C., Duarte P., Serpa D. and
Falcão M., 2005. A Geographical Information System for Ria Formosa. Downloadable at:
https://bdigital.ufp.pt/dspace/bitstream/10284/828/3/riaformosa.pdf
Web-site consultation for the overview analysis of Ria Formosa CIS:
http://ec.europa.eu/ourcoast/index.cfm?menuID=9&articleID=125; last visit on 18/02/2011
at 14.00.
http://cemas.ufp.pt/; last visit on 14/03/2011 at 9.00.
http://www.algarve-portal.com/en/country/landscapes/ria_formosa/; last visit on
14/03/2011 at 10.00.
http://www2.ufp.pt/~pduarte/; last visit on 14/03/2011 at 11.00.

21807-REL-T006.2 Annex 1 – page 106
MEGASIG – Monitoring and Environmental management of the Guardiana Estuary Salt Marshes
1 General Information
1a Name MEGASIG – Monitoring and Environmental management of the Guardiana Estuary Salt Marshes
1b Description
MEGASIG is an European INTERREG IIIA project that was developed under the framework of the cross-border cooperation between the Centre of Marine and Environmental Research (CIMA) of the University of Algarve-Portugal (proponent institution), the Department of Geology of the University of Huelva- Spain and the Institute of Natural Resources and Agrobiology of Seville-Spain.
Guardiana River is one of the most important rivers in the Iberian peninsula, with a total length of 730 km; 200 km are the natural southern border between Spain and Portugal. The Guadiana estuary area is managed by 5 municipalities (2 Portuguese and 3 Spanish ones) and two Authorities (one Spanish and one Portuguese) dealing with the management of two natural protected areas. Part of the estuary zone – not included in the protected areas - supports economic activities such as salt production, aquaculture, fishing, and tourism. The area is also very important for its ecological value. MEGASIG project enabled to develop a GIS and a web-GIS application for the environmental monitoring and sustainable management of the Guardiana estuary. The project gave also much importance to improve public awareness to the area’s value.
1c Operating entity Centre of Marine and Environment Research of the University of Algarve
1d Management structureCentre of Marine and Environment Research of the University of Algarve
1e Contacts
Carlos Loureiro; e-mail: [email protected] Centre of Marine and Environment Research of the University of Algarve Campus de Gambelas, 8005-139 Faro
1f Typology
Operational
The system is not on-line anymore at the original site www.megasig.org
2 Operational context and information content
2a ICZM dimensions
Environmental and the territorial information are well-developed in the CIS. The territory is also exhaustively explored with a large collection of historical maps, surveys and satellite imagery photographs. Very few information are available for the other dimensions, such as those related to communication networks.

21807-REL-T006.2 Annex 1 – page 107
2b ICZM Sectors
Main spatial data included in MEGASIG are:
- Geographical and administrative boundaries
- Topography and bathymetry
- Geology and geomorphology
- Present and palaeo digital terrain model
- Coastline evolution
- Historical mapping
- Aerial photography and Satellite imagery
- Land use
- Agriculture and forestry
- Climate parameters
- Bio-monitoring
- Water chemical quality
- Sediment quality
- Sampling sites
- Vegetation and habitat mapping
- Nature 2000 sites
- Communication networks
2c Integration No specific integration among information is directly provided.
2d Spatial scale Local – Estuary of the Guadiana River
2d Flexibility The system has been developed in order to be applied specifically to Guadiana Estuary.
3 ICZM functionalities
3a Knowledge related functionalities
No specific ICZM knowledge related functionalities are directly provided. However, the CIS includes a rich set of environmental and physical information that may properly support integrated analysis for the management of the estuary, in particular in relation to geomorphologic aspects.
Furthermore, many information sectors include multi-time data. Time series are for example available for historical maps, coastline evolution, aerial photography and satellite imagery, thus enabling comparative analysis and interpretation of historical geomorphologic and biological phenomena.
3b Process related functionalities
MEGASIG supports problem understanding, in particular relation to the geomorphologic and biological evolution of the Guardiana rivers estuary.
Among the considered ICZM process related functionalities, MEGASIG gave importance to tools for on-line participation. Multimedia informative and didactical application for environmental education were designed and developed. These presented three qualitative levels of information according to the knowledge level of the potential user. Tools were mainly customized for schools and NGO’s and were available in three languages (Spanish, Portuguese and English). As for the CIS,
21807-REL-T006.2 Annex 1 – page 108
those tools appear to not be on-line anymore.
4 Users
4a User typology
MEGASIG project identified the following target user of the CIS:
- Local municipalities
- Administrative Authorities of two natural protected areas
- Regional authorities
- Environmental NGO’S
- School and civil society.
5 Use of the system
5a Accessibility
MEGASIG included an important Web-GIS component and other on-line education and communication tools. However, these are not on-line anymore at the original web-site www.megasig.org
5b User-friendliness The system is not on-line anymore, thus user-friendliness can not be evaluated. The system is available in Portuguese, Spanish and English.
5c Interactiveness
5d Data access
6 Technological characteristics
6a Used technology The GIS application was developed with the ESRI ArcGIS (licensed) software. Web-GIS component was developed using the ESRI ArcIMS software
6b Integration with other tools
The original design of the CIS foresaw the integration of the off-line GIS with a Web-GIS component and multimedia informative and didactical application
6c Integration with other CIS No specific integration with other CIS
6d Interoperability
High.
The system was developed respecting EU INSPIRE initiative guidelines for a spatial information infrastructure (see document downloadable at www.gisig.it/eco-imagine/esri_questionari/04-Nice/Carlos_esri.pdf)
7 Cost/Resources
7a Resources
21807-REL-T006.2 Annex 1 – page 109
Information sources for the overview analysis of MEGASIG:
Loureiro, C.; Albardeiro, L.; Boski, T. (2006). Planning for sea-level rise in coastal
environments – uncertainties of the physical responses of estuarine areas to climate
change. ECO-IMAGINE Thematic Conference "Challenges of building coastal knowledge
and geographic information". Marie Curie Conferences and Training Courses. GISIG &
ICCOPS. University College of Cork. 68-71.
Web-site consultation for the overview analysis of MEGASIG:
http://www.gisig.it/eco-imagine/abstract/Borsisti/Posters_Nice/Loureiro.htm; last visit on
08/02/2011 at 16.00.
http://www.gisig.it/eco-imagine/; last visit on 08/02/2011 at 16.00.
www.gisig.it/eco-imagine/esri_questionari/04-Nice/Carlos_esri.pdf; last visit on
08/02/2011 at 17.00.
21807-REL-T006.2 Annex 1 – page 110
REDIAM - Environmental Information Network of Andalusia
1 General Information
1a Name Environmental Information Network of Andalusia (Red de Información Ambiental de Andalucía - REDIAM)
1b Description
REDIAM is a web-oriented system designed for the integration of the information on the Andalusia environment generated by all types of producers of environmental information centres in the Autonomous Community. The system is composed by integrated different subsystems. These major subsystems refer to topics whose importance and interest deserve special attention:
- Biodiversity
- Geodiversity
- Climate
- Waters
- Wetlands
- Urban environment
- Coastal and marine environment
REDIAM is explicitly designed for information, communication and participation purposes, and is also used as tool for ICZM (in particular the subsystem on coastal and marine environment) by the technicians and decision-makers of the Andalucía Government.
1c Operating entity Andalusian Autonomous Government (Junta de Andalucía), Ministry of the Environment of Andalusia (Consejeria de Medio Ambiente - CMA)
1d Management structure
Ministry of the Environment of Andalusia (Consejeria de Medio Ambiente - CMA). Technical management is commissioned to Egmasa, in-house company of CMA.
1e Contacts
Address for information requests
A/A Directora General de Desarrollo Sostenible e Información Ambiental, Consejería de Medio Ambiente, Dirección General de Desarrollo Sostenible e Información Ambiental, Avda Manuel Siurot, nº 50, 41013 – Sevilla.
E-mail for questions and suggestions: [email protected]
E-mail for information and data requests: [email protected]
Specific contact: José Enrique Frieyro at Egmasa (email: [email protected]), in charge of technical development and management of the Coastal and marine environment subsystem.
REDIAM Web-site http://www.juntadeandalucia.es/medioambiente/site/web/rediam/
1f Typology Operational
21807-REL-T006.2 Annex 1 – page 111
2 Operational context and information content
2a ICZM dimensions
REDIAM addresses all the five ICZM dimension considered by the analysis. The environment dimension is particularly developed. REDIAM also includes information related to territory, economic and social aspects. The governance information is partly covered, in particular in relation to environmental planning features.
2b ICZM Sectors
REDIAM Catalog is composed by the following main information typologies:
- Territory characterisation (topographic information, ortho-photos and ortho-imagery);
- Geographical references (reference systems, geographical grids, toponyms);
- Administrative units;
- Natural resources (biodiversity, geodiversity, climate, water, landscape);
- Environmental quality (atmosphere, water, soil, waste, forest ecosystems);
- Risk (natural hazards, accidents and natural disasters);
- Natural heritage (protected natural areas, public forests, trails, public facilities);
- Areas of special interest (urban environment, coastal and marine environment);
- Environmental planning (natural areas planning, forest plans, water plans);
- Land use (land use, forest resources, mineral resources, water resources, transport and mobility, hunting, etc.);
- Environmental protection facilities;
- Demography and health.
2c Integration
REDIAM is designed as an easy and flexible data provider that allows any user to make further data elaboration, but also provides thematic map viewers integrating different layers and tools, thematic map web services and downloadable static maps. Examples of integrated information provided by REDIAM are those related to natural and technological risks, such as: fire, flooding, erosion and desertification risks.
2d Spatial scale Sub-national – whole Andalusia territory, including Andalusia coastal area
2e Flexibility The system has been developed in order to be applied specifically to the Andalusian territory.
3 ICZM functionalities
3a Knowledge related functionalities
The Coastal and marine environment subsystem, explicitly aimed to support the Andalusian ICZM, is composed of information gathered by the SIGLA project and several other specific studies, such as diagnostics of Coastal sustainability plan developed by the Ministry of Environment, the information on Management plans for natural resources of the coastal parks, maps by the Spanish Institute of Oceanography (ESPACE project), and other results of
21807-REL-T006.2 Annex 1 – page 112
projects related to the costs developed by various research centres.
This information is gradually expanding and complementing the existing basic information (coastal physiography, characterization of the coastline, bathymetry, land use, sea level, waves, winds, streams, reservoirs, water quality, fisheries, artificial reefs , etc.).
3b Process related functionalities
REDIAM provides functionalities supporting problem understanding (such as the coastal vulnerability index), and functionalities for stakeholders involvement and participation.
At present a new specific web GIS tool for ICZM is going to be integrated in the REDIAM, strongly enhancing process related functionalities, by means of:
- 2D, hybrid and 3D map viewer integrating territorial information and dedicated coastal analysis and characterization, that will facilitate problem understanding;
- flooding areas simulator based on defined sea level rise, useful for vision building, scenario development and adaptive planning;
- tools to analyse and compare multi-time data, supporting coastal evolution monitoring and evaluation.
4 Users
4a User typology
REDIAM represents a further step from the Ministry of the Environment of Andalusia towards environmental data standardisation and sharing, aiming to make available to all stakeholders involved in the production and use of environmental information (technician management, members, general public) a web tool of information allowing interaction and participation in the creation and enhancement of environmental information about Andalusia.
Centres or institutions can become members of the REDIAM network through collaboration agreements, sharing common environmental data bases, technical criteria for information gathering and classification, software to manage such information.
5 Use of the system
5a Accessibility
Free access on-line (from the home page) to the environmental data catalog, thematic information packages, web map services, general and thematic map viewers and information request services.
Personnel of Andalusian Autonomous Government can access REDIAM information also via intranet with different user types privileges (basically normal user and technical manager)
5b User-friendliness
Highly user-friendly.
The web page structure allows a very easy and flexible information search and download. Map viewers use common and intuitive web GIS functionalities and icons. REDIAM is available in Spanish and English.
5c Interactiveness E-mail for questions and suggestions and additional information and data request services (like the “Citizen’s post-box”, on-line request forms with digital sign, direct e-mail to system managers)

21807-REL-T006.2 Annex 1 – page 113
are available.
5d Data access
From REDIAM web page these main services are available:
- environmental data catalog
- thematic information packages (including *.pdf documents with detailed description, spatial information in shapefile and GML format, metadata in *.xml format)
- web map services (WMS and Google format)
- general and thematic map viewers
- additional information and data request services
6 Technological characteristics
6a Used technology
The system has been developed using the following software technology:
- ESRI (for Geo-DB and spatial data standardising)
- Oracle (for alphanumeric and metadata storage)
- MapServer (for web-GIS development)
- OGC (for spatial data services)
6b Integration with other tools
REDIAM makes up the Regional Focal Point of Andalucía for the European Information and Observation Network about the Environment (EIONET) and is the specialized node in Environmental Information within the Spatial Data Infrastructures of Andalusia (Infrastructura de Datos Espaciales de Andalucia - IDEAndalucia)
Map viewers can link WMS maps provided by other entities.
6c Integration with other CIS
The information gathered by SIGLA project has been integrated in the subsystem “Coastal and marine environment” of REDIAM
6d Interoperability
High
The use of standard protocols for data management (INSPIRE Directive for spatial data, EUROSTAT standards for statistics, SEIS for methodologies) and downloadable data formats that don’t need license (in particular OGC) guarantees a high interoperability of the system.
7 Cost/Resources
7a Resources Number of involved persons: about 50 in Egmasa and about 10 in CMA.
21807-REL-T006.2 Annex 1 – page 114
Information sources for the overview analysis of REDIAM:
Guisado E. and Malvarez G.C. 2009. Multiple scale morpho-dynamic mapping:
methodological considerations and application for the coastal atlas of Andalusia. Journal
of Coastal Research. 1513-1517.
Wright D.J., Dwyer N, Kopke K., O’Dea L., 2010. Report of International Coastal Atlas
Network Workshop: Formalizing the network, engaging the Mediterranean. 16-20
November 2009, UNESCO International Centre for Theoretical Physics, Trieste, Italy.
Iglesias-Campos A., Malvarez-Garcia G., Ojeda-Zuiar J. and Moreira-Madueno J.M.,
2011. Chapter 15: “Spain”. In Wrigth D., Dwyer E., Cummins V.[eds.], 2011. Coastal
informatics: Web Atlas Design and Implementation. Information science reference,
Hershey, New York, pp. 105-130.
Web-site consultation for the overview analysis of REDIAM:
http://www.juntadeandalucia.es/medioambiente/site/web/rediam/; last visit on 7/02/2011 at
14.30.
http://www.ideandalucia.es/index.php/en/nodes/node-rediam; last visit on 7/02/2011 at
15.15.
http://ec.europa.eu/ourcoast/index.cfm?menuID=6&articleID=1; last visit on 7/02/2011 at
15.15.

21807-REL-T006.2 Annex 1 – page 115
Spatial Data Infrastructure of Balearic Islands
1 General Information
1a Name Spatial Data Infrastructure of Balearic Islands (IDEIB)
1b Description
The Directorate General of Land of the Balearic Island, with the support of the Department of Technology and Communications is developing IDEIB (Infraestructura de Dades Espacials de les Illes Balears – Spatial Data Infrastructure of the Balearic Island) and the related map-viewer. This activity is implemented within the framework of the European Directive INSPIRE and IDEE (Infraestructura de Dades Espacials de España).
IDEIB is currently under construction; related information are provided by the on-line web-site (http://www.ideib.cat/) describing technologies, policies, standards and human resources that will be used to create the Infraestructura de Datos Espaciales (IDE), in which the archipelago’s geographical data will be published.
IDEIB already provides a complete map-viewer (Web-GIS), totally accessible on-line, that is the specific objective of this description. IDEIB site also includes a Catalogue enabling the users to search and visualise metadata of spatial data on the basis of key words. Metadata description also provides url addresses for the WMS connection.
1c Operating entity Directorate General of Land of the Balearic Island Govern of the Balearic Island
1d Management structure
Serveis d'Informació Territorial de les Illes Balears (SITIBSA)
SITIBSA is a public enterprise of the Government of the Balearic Islands operating on geographic information and systems.
1d Contacts
Alexandre Rosselló, e-mail: [email protected]
13b, 1er 07002 PALMA DE MALLORCA
On-line map-viewer: http://ideib.caib.es/visualitzador/visor.jsp
1e Typology Operational. The SDI system in currently under development.
2 Operational context and information content
2a ICZM dimensions The map-viewer of the IDEIB addresses all the five ICZM dimensions. A detailed list of the cartographic information is listed in the section 2b.
2b ICZM Sectors
Cartographic information included in the map-viewer of the IDEIB are listed below:
- Basics images (e.g. Ortho-photos in different years -2008, 2006, 2002, 1965, image from satellite, urban photos, etc.);

21807-REL-T006.2 Annex 1 – page 116
- Topographic maps in different years (2008, 2006, 2002, 1995);
- DEM (2002, 2006);
- Cadastre and propriety;
- Administrative boundary (e.g. municipalities, census section etc.);
- Limits and administrative management for the spatial planning (e.g. Mallorca Territorial Plan, Menorca Equipment Territorial Plan, Menorca Reconversion Territorial Plan, Menorca Risks Territorial Plan, Waste Sector Master Plan, Quarries Sector Master Plan, Industrial Area, etc.);
- Limits and administrative management for the environment (e.g. Paraje Natural Sierra, special nature reserve, Sierra Nature Reserve, protected natural spaces, Natura 2000, place of scientific interest, marine reserves, controlled hunting, wildlife refuges etc.);
- Geology and land use (e.g. Corine Land cover in different years - 1990, 2000, 2002, 2006, geology, etc.);
- Mobility and street (e.g. road network, rail network and metro, seaports, airports, transport infrastructure, transport network etc.);
- Hydrography (e.g. water sources, hydrographic network, geo-morphological flood plans, riparian forests, control surface water, etc.);
- Atmosphere and weather (pluviometric zones);
- Biological aspect (e.g. bionomic, habitat, etc); this section also includes the Bioatlas. This is a free on-line catalog of fauna and flora species of Balearic islands;
- Economy (e.g. tourist establishments, facilities in beach, zone of tourist interest, tourist information offices);
- Health (e.g. sectors sanitary inspections, pharmacies, health centres etc.);
- Infrastructure (e.g. energy, conventional energy centres, pipelines, cogeneration-wind farms, photovoltaic panels, waste facilities, drainage and water treatment, water supply etc.);
- Bathymetry;
- Nautical charts;
- Historic heritage (e.g. monuments, assets of cultural interest, environment assets of cultural interest, oil-mills, flour windmills, water extraction windmills, regulated anchorage, territorial waters, zone with submarine prohibition etc.).
A specific search function allows the user to find the data through the use of key words.
2c Integration No specific integration among information is directly provided.
2d Spatial scale Local scale - Balearic Islands in the Mediterranean Sea.

21807-REL-T006.2 Annex 1 – page 117
2e Flexibility IDEIB and its map-viewer have been developed in order to be applied specifically to the zone of Balearic Island.
3 ICZM functionalities
3a Knowledge related functionalities
IDEIB catalogue and map-viewer provide some of the knowledge related functionalities considered by the analysis; specifically:
- Availability of spatial data; the system is designed to share some of the geographic data through Web Map Service (WMS), in particular through the Catalogue functionality.
- Operation at the different spatial scale is not fully developed; however the map-viewer provides bathymetric layers with different spatial resolution (1:50.000, 1:100.000, 1:200.000);
- Availability of multi-time data, such as in the case ortho-photos and topographic maps enabling to evaluate the evolution of the coastal system.
3b Process related functionalities
The system does not specifically include ICZM process related functionalities.
However, users are invited to provides their own data, thus enabling their participation in the construction IDEIB.
4 Users
4a User typology
Main target users can be identified in:
- Coastal planners and managers; the map-viewer provides a high number of spatial data and the possibility to generate simple customised maps;
- Experts, likely more interest in the Catalogue functionality, enabling to search for metadata and url for WMS connection;
- Citizens, thanks to the intuitive use of the map-viewer.
The complete development of the SDI system will also improve the likely target users.
5 Use of the system
5a Accessibility The Map-viewer and the metadata catalogue are completely accessible on-line
5b User-friendliness
High/Medium
The map-viewer of the IDEIB is built around an interactive map very easy to browse, which allows anyone to identify and visualize those datasets relevant to their interest. Map-viewer is available in 4 languages (Spanish, Catalan, English and German).
Current version of the web-site, likely due to the fact that it is under evolution, is not totally user-friendly.
21807-REL-T006.2 Annex 1 – page 118
5c Interactiveness
No specific e-participation tools are available. The IDEIB and its map-viewer enable users to provide suggestions to improve the functionality of the system. This can be done through a specific feedback form.
5d Data access
The system is designed to share some of the spatial data through Web Map Service (WMS); this can for example visualised thought the freely acquirable GAIA software. Spatial data can not however be downloaded.
The Catalogue is used to manage metadata through specific sheet also including url for the WMS connection..
6 Technological characteristics
6a Used technology Map-Viewer has been developed with licensed ESRI software.
6b Integration with other tools
No specific integration with other tools.
6c Integration with other CIS
There is no proper integration with other CIS. However, the IDEIB web-site allows connection to external web-site and external web-GIS projects, such as:
- New web-site mapping of the Council of Minorca. This web-site provides different thematic web-GIS interfaces, such as those concerning: the insular territorial plan, the waste and quarries sector master plan and environmental planning.
- A web-site mapping of the Council of Mallorca. This web-site provides some thematic web-GIS interfaces , specifically related to the Territorial Plan of Mallorca and a generic map viewer of geographic information of the islands.
6d Interoperability
High
The system is compliant with International standard for metadata (ISO 19115).
The information content is structured according to the specifications of the European Directive INSPIRE.
Indeed the whole SDI development aims to fully meet INSPIRE Directive and the Spanish IDEE requirements.
7 Cost/resources
7a Resources
Web-site consultation for the overview analysis of IDEIB:
http://www.ideib.cat/; last visit on 14/04/2011 at 12.30.
http://ideib.caib.es/visualitzador/visor.jsp; last visit on 15/04/2011 at 12.30.
http://cartografia.cime.es/; last visit on 15/04/2011 at 12.30.
http://www.conselldemallorca.net/; last visit on 15/04/2011 at 12.30.
21807-REL-T006.2 Annex 1 – page 119
IDEC-LITORAL
1 General Information
1a Name IDEC-LITORAL
1b Description
IDEC-LITORAL is the specific section of the Catalonia Spatial Data Infrastructure (IDEC) focusing on the coastal zone. IDEC, including the IDEC-LITORAL section was created by the Institut Cartogràfic de Cataluña according to the Inspire European Directive requirements.
IDEC main objective is to interchange and share spatial information through an internet platform, involving all interested Public Administrations (such as the Generalitat de Catalunya, the Spanish Government, local entities), as well as other public and private institutions of Catalonia. IDEC maintains a map viewer, various thematic geo-portals and some sectoral initiatives (including the IDEC-LITORAL one) with numerous services, a great number of available datasets and of registered organizations. Furthermore, IDEC provides a Platform Resources of Geo-information (PRG); a web-site accessible only to the public administrations and their agencies (part of the IDEC network), enabling authorised users to mutually share and exchange data and information.
IDEC was the first fully developed regional SDI in Spain with a fully functional geo-portal. The portal is updated twice a year and in 2009 there were 161 entities that contributed with metadata, 169 entities with accessible WMS and 657 participant entities in thematic SDIs. IDEC has been awarded as one of the ‘best European practice’ of 2009 in the framework of the eSDInet+ project. In March 2010 the total metadata entries published were 23,344 with 213 registered organisations.
Within the above context IDEC-LITORAL provides a Web-GIS including a great number of spatial data on the coastal zone of Catalonia. It also includes the link to the general IDEC data catalog enabling users to search spatial data related to all IDEC themes (no only those related to the coast) and access to metadata and data in different ways (i.e. direct downloading, through WMS service and/or static visualisation).
Currently IDEC-LITORAL is constantly updated by the Consorti El Far that also hosts the related web-site (http://www.geoportal-idec.net/idecostes/index.jsp).
1c Operating entity Cartographic Institute of Catalonia (ICC)
1d Management structure
Cartographic Institute of Catalonia (ICC) with the technical support of Consortium El Far and
1d Contacts
e-mail: [email protected]
Institut Cartogràfic de Catalunya (ICC) Parc de Montjuïc 08038 Barcelona
Consorci EL FAR C. Escar, 6-8

21807-REL-T006.2 Annex 1 – page 120
08039 Barcelona
Web-site: http://www.geoportal-idec.net/idecostes/index.jsp?pag=home&lang=ca
1e Typology Operational
2 Operational context and information content
2a ICZM dimensions
IDEC-LITORAL addresses four of the five ICZM dimension: territory (e.g. for general geographic descriptors, land use, marine protected areas), environment (e.g. biology related spatial data), economy (e.g. energy consumption, fishery) and society (e.g. employed population, tourism).
2b ICZM Sectors
Data/cartographic information included in the Web-GIS of the IDEC-LITORAL are structured in 5 groups:
- Administrative boundaries;
- Cadastre;
- Coastal Observatory, including for example marine protected area, land protected area, coastal birds, generated waste, average daily water consumption, power consumption, etc.;
- Fishery, including for example: bathymetry, map of sea-grass, coastline, artificial reef, lithology, prohibited areas for fishing, suitable areas for fishing, etc.
- Corine land use in different years.
The IDEC catalog provides a much wider set of spatial data, not specifically referred to the coastal system. Each layer is described through a metadata sheet. A great part of the layers are accessible to the generic user, while for some of them the access is restricted to the authorised users.
2c Integration The IDEC-LITORAL Web-GIS does not specifically include integrated information
2d Spatial scale Sub-National – Catalonian coast in Spain.
2e Flexibility IDEC-LITORAL been developed in order to be applied to the specific coastal territory of Catalonian coast.
3 ICZM functionalities
3a Knowledge related functionalities
IDEC-LITORAL provides some of the knowledge related functionalities considered by the analysis; specifically:
- Availability of spatial data; A great part of the spatial layer included in the IDEC SDI can be directly accessed (through downloading or WMS) by general users. Authorised users can fully benefit of the IDEC SDI and the related web-site to share and exchange spatial data on a high number of themes;
- Support experiences and best practices exchange in relation to data management and geographic information in general.
3b Process related functionalities
IDEC-LITORAL does not directly provides ICZM process related functionality. More in general IDEC SDI aiming to share and
21807-REL-T006.2 Annex 1 – page 121
exchange data and information can decision making (also in the ICZM process) and stakeholder involvement.
4 Users
4a User typology
The final users of the IDEC-LITORAL mainly are:
- Public Administrations, such as the Catalonia Government, the Spanish Government, local entities;
- Other public and private institutions of Catalonia
In general users are identified as all public bodies, actors and services working on public Geographic Information in the Catalonian Region. In march 2010, IDEC involved about 118 registered organizations.
5 Use of the system
5a Accessibility
Full access to all data (including data sharing and exchange) is provided to members of the IDEC network. IDEC system is in general accessible by every user that can utilise the on-line Catalogue to search for and access to spatial data.
IDEC-LITORAL Web-GIS is freely accessible on-line, also enabling map customisation.
5b User-friendliness
Highly/Medium user-friendly.
The Web-GIS is built around an interactive map very easy to browse, which allows anyone to identify and visualize those datasets relevant to their interest. The spatial data catalogue is less easy and intuitive to use, also due to the great number of contained information. The use is however supported by filtering and searching functionalities.
The system is available in Spanish and English.
5c Interactiveness
Stakeholder involvement and participation is a specific aim of the IDEC SDI that provides the Platform Resources of Geo-information – to authorised users - to create a strong mutualisation of decisions related to data and information sharing and exchange.
5d Data access
For the IDEC SDI in general:
- All spatial data can be accessed by authorised users through the Platform Resources of Geo-information;
- More than 35% (15000 on 38000) spatial layers can be directly downloadable by general users through the Catalogue; another consistent part can be visualise through WMS. Other spatial data can not be directly accessed due to confidentiality reasons defined by data producers;
- Metadata complying with ISO 19155 are available for all the IDEC layers.
All IDEC-LITORAL spatial data, including those visualised in the Web-GIS, are part of IDEC SDI

21807-REL-T006.2 Annex 1 – page 122
6 Technological characteristics
6a Used technology
6b Integration with other tools
No specific integration with other tools
6c Integration with other CIS
No specific integration with other CIS
6d Interoperability
High.
The IDEC is compliant with Open Geospatial Consortium standards and implement the existing specifications of the INSPIRE directive.
Metadata are structured and described according to the standard ISO 19115, being therefore complying with the INSPIRE Directive.
7 Cost/resources
7a Resources For the whole IDEC (including IDEC-Litoral, the specific section on the coastal zone) 13 persons are involved in the management of the GIS unit and further 3 persons for the SDI
Information sources for the overview analysis of IDEC-LITORAL:
Spatial Data Infrastructures in Spain: State of play 2010. Spatial application division – K.U.
Leuven Research & Development. Document available at:
http://inspire.jrc.ec.europa.eu/reports/stateofplay2009/rcr09ESv111.pdf
Black, E.D, 2010. Assessing organisational aspects of Sub-national SDIs: The case of the
Balearic Islands and Catalonia. Master Thesis Geographical Information Management
and Applications. Document available at: http://www.geoportal-
idec.net/geoportal/cat/documents/articles/MSC_GIMA_Erica_Black.pdf
Web-site consultation for the overview analysis of IDEC-LITORAL:
http://www.geoportal-idec.net/idecostes/index.jsp?pag=home&lang=ca; last visit on
13/04/2011 at 12.30
http://www.geoportal-idec.cat/geoportal/eng/; last visit on 13/04/2011 at 13.30.

21807-REL-T006.2 Annex 1 – page 123
Thau Lagoon Coastal Information System
1 General Information
1a Name Thau Lagoon Coastal Information System
1b Description
The Thau Lagoon CIS is an off-line GIS managed by the “Observatoire du Syndicat Mixte du Bassin de Thau” (Thau Lagoon Observatory). The Syndicat Mixte du Bassin de Thau (SMBT) is a management body created in 2005 and involving two Etablissements Publics de Coopération Intercommunale (EPCI):
- La Communauté d'Agglomération du Bassin de Thau (CABT);
- La Communauté de Communes du Nord du Bassin de Thau (CCNBT).
In order to achieve the implementation of integrated management of the lagoon and its watershed, SMBT created the Thau Lagoon Observatory, whose main aim is to collect, managed and share information (data, statistics, indicators, maps, etc.) and tools (such as database and GIS) related to this territory. The Observatory also monitors the evolution and sustainable development of the territory, by means of long term indicators, particularly focusing on Integrated Coastal Zone Management (ICZM).
The Thau lagoon situated is situate along the French Mediterranean coast and has a surface of 75 km2 and an average depth of 4 m (max depth: 10 m).The population on the watershed was about 130.000 inhabitants in 2005 with a density of 465 inhabitants for km2 and with a very strong growing rate.
The Thau Lagoon is one of the sites analysed within the DITTY project that produced new management tools for this coastal and contributed to establish links or to strengthen the existing ones between administrative bodies, scientific institutions, universities and technical agencies.
1c Operating entity Syndacat Mixte du Basin de Thau
1d Management structure
Thau Lagoon Observatory of the Syndacat Mixte du Basin de Thau
1d Contacts
Jean Jacques Taillade, e-mail [email protected]
Syndicat Mixte du Bassin de Thau 328, Quai des Moulins 34200 Sète
Web-site: http://smbt.teledetection.fr/
1e Typology Operational

21807-REL-T006.2 Annex 1 – page 124
2 Operational context and information content
2a ICZM dimensions
The Thau Lagoon CIS addresses all the five considered information dimensions, although through simple but very communicative modalities (see section 2b), i.e. static maps contained in the Cartothèque section.
2b ICZM Sectors
The web-site of the Syndacat Mixte du Basin de Thau includes a specific section (Cartothèque) providing a great number of static maps related to the following main sectors:
- Territorial information;
- Planning and management; i.e. maps related to the “Schéma de COhérence Territoriale (SCOT)” and the “Schéma d'Aménagement et de Gestion des Eaux (SAGE)”
- ICZM; i.e. simple maps on competence related to ICZM implementation;
- Population, in particular including maps of the historical evolution of the population;
- Mobility, mainly related to workers travels;
- Economy; e.g. maps related to marinas, port activities, agriculture, maritime transportation, etc.
- Architectonic heritage;
- Natural heritage; such as for example natural protected areas, plans for the wetlands management, high-values areas, etc.;
- Sanitation; mainly waste water treatment plants;
- Drinking water resources;
- Monitoring of water quality of rivers of drainage basin;
- Monitoring of quality of bathing water;
- Monitoring of eutrophication in the lagoon;
- Escherichia coli surveillance.
Above maps are mainly addressing communication purposes and are therefore presented in simple a very clear modalities. The off-line GIS archives and manage data used to derive these maps, also including basic layers and others such as:
- Orthophotos database;
- Digital Elevation Model;
- Bathymetry;
- Topography;
- Cadastral maps.
- Corine Land Cover;
- Urban development, including scenario simulation for 2020.
2c Integration
Main objectives of maps made available by the http://smbt.teledetection.fr/ site in the Cartothèque section appears to be communication and awareness rising. In this perspective for some of the main topics, the web-site provides synthetic maps that integrates different data, such as for example the map of the economic activities or the map of area s with high environmental values.
21807-REL-T006.2 Annex 1 – page 125
2d Spatial scale Local – Thau Lagoon and the related drainage basin.
2e Flexibility The system has been developed in order to be applied specifically to the territory of the Thau Lagoon Hydrographic basin.
3 ICZM functionalities
3a Knowledge related functionalities
Thau Lagoon CIS provides some of the knowledge related functionalities considered by the analysis, specifically:
- Integration among dimensions and/or sectors (see 2c), mainly related to communication aspects;
- Multi-time data and information: the system collects different temporal and environmental variables supporting a multi-level temporal analysis. This is particularly evident for population data and the territorial evolution (orthophotos).
- The Thau Lagoon Observatory has developed a set of 126 indicators (structured in 8 principal themes) for sustainable development and management of the Thau Lagoon in an ICZM perspective. In particular, SMBT, in partnership with the University of Montpellier I, Cepralmar, and the Ecole Normale Superieur de Cachan, formed in 2007-2008 a working group on "indicators" to identify and prioritize sustainable development indicators for the territory of Thau Lagoon. The related report (December 2007) is available on-line. However, at the moment, the indicators are not directly integrated in the web-site.
3b Process related functionalities
Maps included in the web-site appear to properly support communication and awareness raising aspects of the ICZM process. In this perspective it is also important to stress that indicators were developed
4 Users
4a User typology
Main users of on-line maps appear to be the civil society in general and whoever can be interested in communication of the integrated management of the lagoon.
The off-line GIS is presumably targeted to expert users.
5 Use of the system
5a Accessibility The CIS is not on-line, but all the maps and the documents with the elaboration are freely downloadable.
5b User-friendliness
5c Interactiveness The CIS is an off-line system. The web-site freely provides access to static maps to any users
5d Data access All static maps and some documents are downloadable from the web-site (mainly in pdf format). Proper metadata are not available on-line; however map contents are illustrated by summary

21807-REL-T006.2 Annex 1 – page 126
descriptions.
6 Technological characteristics
6a Used technology
6b Integration with other tools
No specific integration with other tools
6c Integration with other CIS
No specific integration with other CIS
6d Interoperability
Interoperability analysis is not fully applicable to the web-site that does not directly provide data.
Interoperability of the off-line system cannot be assessed. As report in (http://smbt.teledetection.fr/index.php?option=com_content&task=view&id=68&Itemid=201), the Observatory will use the on-line catalogue tool called “MDWEB”. MDWEB is a generic tool, open source based on international metadata standards (ISO 19115) and communication (OGC).
7 Cost/resources
7a Resources
Information sources for the overview analysis of Thau Lagoon Coastal Information System:
Rey-Valette H., Damart S., Rodriguez T. and Roussillon J.F., 2007. Hiérarchisation des
indicateurs de développement durable en vue de contribuer à la constitution d’un
observatoire du territoire de Thau. Rapport Final – Atelier Sciences Sociales – Canthier
Pnec «Lagunes Méditerranées». December 2007. Downloadable at:
http://smbt.teledetection.fr/index.php?option=com_content&task=view&id=61&Itemid=193
Web-site consultation for the overview analysis of Thau Lagoon Coastal Information System:
http://smbt.teledetection.fr; last visit on 31/03/2011 time 16.00
http://www.ifremer.fr/syscolag/index2.htm; last visit on 31/03/2011 at 17.00.
http://www.ifremer.fr/lerlr/surveillance/atlas/thau.htm; last visit 31/03/2011 at 9.10
http://ec.europa.eu/ourcoast/index.cfm?menuID=9&articleID=254; last visit 07/04/2011 at
12.10.
21807-REL-T006.2 Annex 1 – page 127
CRIGE PACA Spatial Data Infrastructure
1 General Information
1a Name CRIGE-PACA Spatial Data Infrastructure (CRIGE-PACA SDI)
1b Description
CRIGE-PACA SDI is a framework of spatial data, metadata, users and tools that are interactively connected in order to use spatial data in an efficient and flexible way. The SDI is operated and managed by CRIGE-PACA the “Regional Centre for Geographic Information in Provence-Alpes-Cote d'Azur”. The on-line platform of the CRIGE-PACA SDI is the web-site http://www.crige-paca.org/. This is currently under further development and will be configured and named as Regional Geoportal.
CRIGE-PACA is a non-profit making organization created in 2002, led by national and regional authorities through a seven-year financial plans (2000-2006 and 2007-2013). CRIGE-PACA main mission is to promote, facilitate, support and spread geographical information to public administrations and when possible, to general public and stakeholders. The above overall aim includes the following specific objectives:
- Provide geographic referenced data (digital data-sets) via the existing CRIGE-PACA web-site and its future evolution in the Regional Geoportal; the on-line participative and data-sharing platform (for public administrations) of the CRIGE-PACA SDI;
- Provide technical support to users, including: help-line for assistances, production of technical and requirements guides, editing specifications, technical meetings, on-line resources;
- Support the Regional Geomatic Network, through: promotion of cooperation between local users and data providers, support local communities of interests, management of thematic clusters, experiences and best practices exchange, acting as a resource centre on GIS concepts;
- Act as a coordination centre for the implementation of the INSPIRE directive at the regional level.
CRIGE-PACA is the coordinator of the Regional Geomatic Network involving thematic clusters (Pôles metiers). These clusters are structured around local animators and a certain number of working groups, bringing together regional organisations interests in thematic datasets issues. One of these twelve cluster deals with Sea and Coast (Mer & Littoral) bringing together the coastal stakeholders of the PACA region.
CRIGE PACA received in 2009 an “eSDI NET+ Best Practice Award” for its innovative organisational and institutional aspects in terms of cooperation, subsidiary and sustainability.
CRIGE-PACA SDI and its web-site are constantly updated and innovated; in particular a new version of the web-site (the Regional Geoportal) will be available soon, including new applications to facilitate query and sharing of the data.
21807-REL-T006.2 Annex 1 – page 128
1c Operating entity Regional Centre for Geographic Information in Provence-Alpes-Cote d'Azur – CRIGE-PACA
1d Management structure
Regional Centre for Geographic Information in Provence-Alpes-Cote d'Azur – CRIGE-PACA
1d Contacts
E-mail: [email protected]
Centre Régional de l'Information Géographique de Provence-Alpes-Côte d'Azur Domaine du Petit Arbois- Bâtiment MARTEL Avenue Louis Philibert BP 10019 - 13 545 Aix-en-Provence cedex 4 - FRANCE
Web-site of the CRIGE-PACA: http://www.crige-paca.org/
1e Typology Operational
2 Operational context and information content
2a ICZM dimensions
The CRIGE-PACA SDI addresses all the five ICZM dimensions, attempting to include the information relevant for the thematic clusters being part of the Regional Geomatic Network:
- Environment;
- Water;
- Agriculture;
- Forest;
- Sea and Coast;
- Risks;
- Urbanism;
- Employment;
- Telecom;
- Health;
- Economy;
- Fire
- Roads and transportation.
2b ICZM Sectors
Data/cartographic information included in CRIGE-PACA SDI and accessible through the CRIGE-PACA data catalogue are structured in the following groups of spatial layers (some of them are downloadable):
- Geographic information; including for example topography, bathymetry, road, vegetation features, cadastral map, Euro Global Map, etc.;
- Thematic layers; this section contains about 85 layers/documents such as for example: administrative boundary, land cover, flooding zones, rainfall, mean annual temperature, biological reserves, natural areas, noise exposure, forest zones, identification of potential areas of radon emanations, posidonia monitoring network, soil classification, altitudinal vegetation, etc.). This group also contains some information related to the governance dimension, such as layers and documents related to: Plans de Développement de Massif (PDM), Plans Simples de
21807-REL-T006.2 Annex 1 – page 129
Gestion (PSG), Schémas d'Aménagement et de Gestion des Eaux (SAGE) en région PACA etc.
- Aerial Ortho photos; including for example: orthophotos with high resolution (20 cm), historical aerial photographs of the coast (several years), etc.
- Satellite images: including false colour image of the Region PACA (1999-2006) and false colour image of the Mediterranean 2006.
The CRIGE-PACA web-site also provides the “Cartopas 2010” functionality enabling the users to browse and visualise (in pdf format) maps related to the following themes:
- The territory and its evolution (e.g. land use, land use from 1990 to 2006, population density from 1996 to 2006 etc.);
- Management and planning (e.g. in French “Schémas de cohérence territoriale (SCoT) et schémas directeurs (SD)” and Local Plans (PLU), communal cards (CC), land use plans (POS), etc.);
- Air and climate (e.g. temperature, precipitation, state of air pollution by ozone, state of air pollution by suspended solids, etc.);
- Land polices for sustainable development (e.g. in French «Etat d’avancement des Schémas d’Aménagement et de Gestion des Eaux (SAGE)», the local Agenda 21 site and the map of the local plans energy environment (PLEE));
- Nature and biodiversity (e.g. natural reserve, natural areas of ecological interest for fauna and flora, site NATURA 2000 etc.);
- Landscapes and sites (e.g. map of regional synthesis of classified sites and sites registered under the Act of May 2, 1930 in the PACA region and Operations Great Sites, typology of regional landscapes, etc.);
- Data on water quality (e.g. aquifers and piezometric network, biological quality of the rivers, etc.);
- Water policy (e.g. principal water drainage, targets according to the Water Framework Directive (WFD), ecological and chemical status of rivers and coastal water, vulnerable and sensible zones for the nitrate, urban waste water treatment unit, annual volume of water used by geographical department, etc.);
- Energy (e.g. electricity transmission network, wind energy development, wind speed, wind power and potentially energy, development status of photo voltaic power projects, etc.);
- Housing (e.g. Status of the Local Housing Programs (PLH), percentage of social housing, etc.);
- Transport (e.g. road, traffic in major roads, etc.);
- Natural, technological and mining risk (e.g. flooding risk, atlas of the flooding zones, seismic risk, climatic occurrence of heavy rainfall, industrial risk, etc).
2c Integration
Examples of integrated information are maps from Cartopas 2010, related to the assessment of the natural and technological risks for the addressed territory. The “Natural risk” section for example includes maps related to flooding, seismic and landslide
21807-REL-T006.2 Annex 1 – page 130
risks. Addressed technological risks include for example maps of: risk related to large dams, industrial risk and risk related to mining and quarrying.
Several integrated maps are available also in the data catalogue (e.g. Atlas of flooding zones)
2d Spatial scale Sub-National scale - PACA (Provence – Alpes - Cote d'Azur) Region, also including the related coastal zone.
2e Flexibility
The system has been developed in order to be applied specifically to PACA region territory.
CRIGA-PACA is in contact with various local authorities to whom it offers the possibility of mutualising data by creating a task force for the management of coastal data.
3 ICZM functionalities
3a Knowledge related functionalities
CRIGE-PACA SDI provides some of the knowledge related functionalities considered by the analysis; specifically:
- Integration among different information sectors (see point 2c), including some integrated maps related to natural and technological risks;
- Availability of spatial data; authorised users (mainly public administrations) can benefit of the CRIGE-PACA SDI and the related web-site to share and exchange spatial data on a high number of themes;
- Support experiences and best practices exchange in relation to data management and geographic information in general.
3b Process related functionalities
CRIGE-PACA SDI provides a high variety of data related to different information sectors and dimensions and therefore can properly support problem understanding. Spatial data are organised according to an articulated structure that can support user in the elaboration of conceptual models of the territory.
Stakeholder involvement and participation is a specific aim of the CRIGE-PACA SDI that provides a platform to create a strong mutualisation of decisions related to data and information sharing and exchange.
4 Users
4a User typology
The final users of the Spatial Data Infrastructure developed and managed by the CRIGE-PACA are:
- Government agencies;
- Local governments as municipalities, Provinces, Region;
- Thematic public chambers;
- No profit making organizations;
- Universities and research laboratories.
In general users are identified as all public bodies, actors and services working on public Geographic Information in the PACA Region.
The Regional Geomatic Network currently involves about 3170 persons belongings to more than 1500 organizations.
21807-REL-T006.2 Annex 1 – page 131
5 Use of the system
5a Accessibility
Full access to all data (including data sharing and exchange) is provided to public bodies of the PACA Region that are members of the Regional Geomatic Network. Every public entity can become member of the Network through an on-line application form available in the Geoportal. CRIGE-PACA verifies if the applicant entities are really a public bodies and therefore may become Networks members.
The system is in general accessible by every user that can visualise a great number of spatial layers (some of them can be also downloaded) and pre-defined maps in pdf format (through the “Cartopas 2010” functionality).
5b User-friendliness
Medium user friendly.
Current version on-line is not totally intuitive. “Cartopas 2010” provide an easy-to-use tool for query and browsing maps available in the system The new development of the web-site into the Regional Geoportal will significantly improve the intuitive and easy use of the system.
Currently, the system in only in French.
5c Interactiveness
Stakeholder involvement and participation is a specific aim of the CRIGE-PACA SDI that provides a platform to create a strong mutualisation of decisions related to data and information sharing and exchange.
5d Data access
Public bodies of the PACA Region that are members of the Regional Geomatic Network have access to all information and can download all spatial data. Other users can download some of the spatial layers available in the CRIGE-PACA web-site.
Metadata are provided for all data of the CRIGE-PACA web-site. For the data accessible through “Cartopas 2010” functionality brief metadata descriptions are made available.
6 Technological characteristics
6a Used technology Open sources technologies are adopted for the development of the new version of the Regional Geoportal CRIGE-PAC, including: MAPSERVER, Geosource, PostGIS, MySQL, etc.
6b Integration with other tools
Specific function of the CRIGE-PACA SDI is integration of data and information provided by the various members of the Regional Geomatic Network, i.e. public bodies. The SDI is therefore integrated with several database managed by various data providers (see the list at http://www.crige-paca.org/frontblocks/print/print_LOT_CARTES.asp )
6c Integration with other CIS
In the case of CRIGE-PACA-SDI this issue is strictly connected with and therefore addressed in point 6b.
6d Interoperability High.
The CRIGE-PACA regional Geoportal is compliant with Open Geospatial Consortium standards and implement the existing

21807-REL-T006.2 Annex 1 – page 132
specifications of the INSPIRE directive. The CRIGE-PACA regional Geoportal is one of the first French regional web sites totally interoperable with national and European data management standards.
7 Cost/resources
7a Resources
CRIGE-PACA is responsible for the management of the CRIGE-PACA SDI and the related Regional Geoportal. CRIGE-PACA involves a team composed by 8 full-time persons. The budget for the SDI management from 2009 to 2011 was about 620.000 €/year.
Information sources for the overview analysis of CRIGE-PACA SDI:
Buchait R., 2009. A regional French SDI to coordinate regional dataset production and
dissemination. Presented CPMR “AQUAMARINA”WORKING GROUP - THEMATIC
COMMISSION ON DATA AND INDICATORS”.
Rix J. et al., 2010. Operational SDIs: The Sub National Dimension in the European context.
Article under Review for the International Journal of Spatial Data Infrastructures
Research, submitted 2010-06-21.
Web-site consultation for the overview analysis of CRIGE-PACA SDI:
http://www.crige-paca.org/; last visit on 22/02/2011 time 12.00.
http://www.esdinetplus.eu/; last visit on 22/02/2011 time 12.30.
21807-REL-T006.2 Annex 1 – page 133
SICoast Information System
1 General Information
1a Name SICoast Information System (SICoast-IS)
1b Description
The SICoast Information system (SICoast-IS) was realized by the Spatial Planning Department of the Liguria Region.
SICoast-IS consists of various cartographic interfaces (Web-GISs), each one related to a specific thematic (e.g. geomorphology, nature, landscape, public domain, administrative, regulatory etc.). These are actually pre-defined maps (each one with its own interface), that can be however customised by the user through Web Map Service (WMS). Data included in SICoast-IS have been collected and provided by various regional structures and related to numerous studies and research activities. Data contained in the information systems are those useful in supporting integrated coastal zone planning and management of the Liguria coast. In particular the system and data were used to support the elaboration of the “Territorial Plan of Coordination of the coast” (Piano Territoriale di Coordinamento della Costa). SICoast-IS is regularly updated and integrated with new levels of information, in order to provide a suitable tool to the most recent European policies on maritime spatial planning.
Besides the Internet component, SICoast-IS also includes an Intranet Web-GIS, containing other spatial data and functionalities. This description mainly refers to the information system freely available in Internet.
The Liguria Region Authority has developed other Web-GIS tools related to sector themes that can be relevant for ICZM. Data included in these tools can be easily integrated in SICoast-IS through the WSM functionality. Two Web-GISs are particularly relevant in this perspective:
- SiSea – Information System on the quality marine-coastal waters;
- Web-GIS of the Water Conservation Plan (“Piano di Tutela delle Acque”), with information related to each water body;
- Sirip – Information System on nourishment interventions (under development).
1c Operating entity Spatial Planning Department of the Liguria Regional
1d Management structure
Spatial Planning Department of the Liguria Region Information Systems Service
1d Contacts
Corinna Artom, e-mail: [email protected]
Dipartimento Pianificazione Territoriale, Urbanistica Ufficio Aree Demaniali marittime Regione Liguria Regione Liguria via Fieschi 15 - piano S2 16121 - Genova

21807-REL-T006.2 Annex 1 – page 134
Web-GIS: http://www.cartografiarl.regione.liguria.it/SiraWebGis/IndiceCarte_PT.asp?idCanale=SICOAST
1e Typology Operational
2 Operational context and information content
2a ICZM dimensions
SICoast-IS mainly addresses three of the five considered information dimensions. The environment and the territory dimension are both well developed. Some governance information are integrated in the system, in particular referring to the Plan of use of the public coastal areas (PUD = “Progetto Utilizzo Demanio Marittimo”).
2b ICZM Sectors
The SICoast-IS consists of different web-GIS applications, each on related to one of the following topics:
- Administrative boundary of the coastal municipalities;
- Coastal topography;
- Catalogue of photos of the coast (2006-2008-2010);
- Historical photos of the coast;
- Shoreline evolution from 1944 to 2003;
- Coastal defence;
- Beaches and high coasts;
- Bathymetry;
- Land and marine Natura 2000 sites;
- Atlas of the Marine Habitat;
- Fishing farming plants, aquaculture and barriers for the fish restocking;
- Marine Natural Protected Areas;
- Plan of use of the public coastal areas (PUD = “Progetto Utilizzo Demanio Marittimo”) including the actual use and the future planned one.
These are actually pre-defined maps (each one with its own interface), that can be however customised by the user through Web Map Service (WMS), thus enabling to visualise a higher number of spatial data. The Intranet component (not addressed in this description) includes other spatial data.
2c Integration No specific integration among different information is directly provided within the system.
2d Spatial scale Sub-National – Coast of the Liguria Region on the Tyrrhenian Sea.
2e Flexibility The SICoast-IS has been developed in order to be applied specifically to the coastal zone of Liguria Region.
21807-REL-T006.2 Annex 1 – page 135
3 ICZM functionalities
3a Knowledge related functionalities
SICoast-IS provides some of the knowledge related functionalities considered by the analysis, specifically:
- Operation at the different spatial scale; some of the available spatial data can be re-scaled according to the considered spatial extent; thus enabling to visualize more details at a higher scales, e.g. the aerial photos, bathymetry etc..
- Availability of multi-time data; multi-time spatial data are for example provided for the shoreline evolution (1944-1973-1983-1993-2003). SICoast-IS also includes an historical collection of photos of the coast. Both dataset can be useful to evaluate the morphological evolution of the coastline.
3b Process related functionalities
The various customizable Web-GIS interfaces of SICoast-IS can provide a good support to problem understanding. The on-line component does not currently and directly provides other ICZM process related functionalities.
It is anyhow important to highlight that data contained in the information systems are useful in supporting integrated coastal zone planning and management of the Liguria coast. In particular the system and data were used to support the elaboration of the “Territorial Plan of Coordination of the coast (Piano Territoriale di Coordinamento della Costa).
4 Users
4a User typology
The web-GIS is freely accessible to all the interested users. Target users can be in particular identified in:
- Decision-makers;
- Coastal planners and/or managers;
- Specialized and expert users The latter two can benefit of the WMS service, for example integrating the Liguria Region spatial data with data provided by other sources.
The Intranet component of the system is accessible by the staff of the Spatial Planning Department and by other authorised users (likely other regional public offices).
5 Use of the system
5a Accessibility
Internet versions of SICoast-IS is freely accessible. Users can also customise maps provided by the different Web-GIS through a Web Map Service (WMS). This in particular enable to potentially visualise SICoast-IS any spatial data , including in particular those provided by the Liguria Region through the Cartographic Service: http://www.cartografia.regione.liguria.it. WMS service also provides the possibility to visualise and use data from a client application, for example using the freely available GAIA software. Access to the Intranet version is restricted only to authorised users.
21807-REL-T006.2 Annex 1 – page 136
5b User-friendliness
Highly user-friendly.
The SICoast-IS Web-GIS component is very easy to use and enable a high level of customisation. The system is only in Italian.
5c Interactiveness No specific e-participation tools are provided
5d Data access
Downloading of spatial data is possible for a sub-set of layers, through the Cartographic Service, that is directly linked to the SICoast-IS. The same service provides metadata for all the cartographic layers. These can be both visualised and downloaded. Metadata format respect the ISO 19115 and respects the INSPIRE Directive.
SICoast-IS includes a functionality enables the user to create customised maps, that can exported in pdf format.
6 Technological characteristics
6a Used technology The system uses MapServer (4.10.3), (open source software).
6b Integration with other tools
No specific integration with other tools.
6c Integration with other CIS
SICoast-IS is structured as a set of thematic Web-GIS. All pre-defined interfaces can be highly customised by the users through the WMS functionality. This provides a dynamic integration with other information systems supporting WMS, in particular those provided by the same Liguria Region (see description of some of them in 1b).
SICoast-IS is included in the BEACHMED-e (Strategic management of beach protection for sustainable development of Mediterranean coastal zones) project web-site. The other web-GIS connected inside the BeachMed-e project are
- Emilia Romagna Region Web-GIS;
- Lazio Region web-GIS;
- Toscana Region Web-GIS;
- Catalunya Web-GIS.
6d Interoperability
High.
SICoast utilises Open Geospatial Consortium compliant Web Map Services (WMS). Metadata are structured and described according to the standard ISO 19115, being therefore meeting the INSPIRE Directive requirements.
7 Cost/resources
7a Resources
21807-REL-T006.2 Annex 1 – page 137
Information sources for the overview analysis of SIcoast:
Artom C., 2009. Presentation given to “A day for cartographic system to manage coastal
zones”. Provence-Alpes-Côte d’Azur - Brussels Office on December 2010.
Gattulli O. and Fiorito M., 2010. Presentation given to “MAREMED – kick off meeting”.
Region Provence-Alpes-Cote d’Azur – Marseille, June 2010.
Web-site consultation for the overview analysis of SIcoast:
http://www.regione.liguria.it/argomenti/territorio-ambiente-e-infrastrutture/costa/sistema-
informativo-della-costa-sicoast-.html; last visit on 21/03/2011 at 10.30.
http://www.cartografiarl.regione.liguria.it/SiraWebGis/IndiceCarte_PT.asp?idCanale=SICO
AST; last visit on 21/03/2011 at 12.45.

21807-REL-T006.2 Annex 1 – page 138
CMGIZC Web-GIS
1 General Information
1a Name
CMGIZC Web-GIS
Web-GIS of the “Centro di Monitoraggio per la GestioneIntegrata della Zona Costiera della Regione Lazio” (Web-GIS of the Monitoring Centre for Integrated Coastal Zone Management of the Lazio Region)
1b Description
CMGIZC Web-GIS was developed by the Monitoring Centre for Integrated Coastal Zone Management of the Lazio Region. The Web-GIS covers the coastal and marine area of the Lazio Region.
Main goals of this application are:
- Make a large number of information relevant for the management of the coastal zone available;
- Collect in the same information system data provided by various sources
- Improve accessibility to the information on the coastal zone.
The Web-GIS is accessible through the web-site of the Monitoring Centre for ICZM of the Lazio Region that provides further information on ICZM in this area. The same site also includes an interactive “forum on the coast” aiming to involve citizens and stakeholders to provide opinions on the coastal management and in particular in indicating particular meteo-marine and erosive events along the Lazio coastline.
1c Operating entity Direzione Regionale Ambiente - Gestione Aree Marine Protette (Regional Environment Department – Management of Marine Protected Areas) of the Lazio Regional Authority
1d Management structure
Centro di Monitoraggio per la Gestione Integrata della Zona Costiera (Monitoring Centre for Integrated Coastal Zone Management)
Direzione Regionale Ambiente - Gestione Aree Marine Protette (Regional Environment Department – Management of Marine Protected Areas)
1d Contacts
Paolo Lupino; e-mail: [email protected];
Silvia Bellacicco; e-mail: [email protected]
Monitoring Centre for Integrated Coastal Zone Management Regional Environment Department – Management of Marine Protected Areas Lazio Region
Web-GIS: http://80.94.113.69/cmg_segnalazioni/
CMGIZC Web-Site: http://www.cmgizc.info/
1e Typology Operational

21807-REL-T006.2 Annex 1 – page 139
2 Operational context and information content
2a ICZM dimensions CMGIZC Web-GIS mainly addresses two of the five considered information dimensions. The environment and the territory dimensions are in depth developed.
2b ICZM Sectors
Data/cartographic information included in web-GIS CMGICZ are related to the main following topics:
- Basic cartographic maps;
- Topography;
- Bathymetry;
- Rivers, canals, lakes, and other hydrologic layers;
- Use of the coast (2004-2005);
- Administrative boundary;
- Shoreline in different years (1944, 1955, 1990, 1992, 1994, 1996, 1998, 2002, 2005);
- Marine habitat (such as nursery areas and seagrass meadows)
- Coastal and marine protected coastal area;
- Underwater cables;
- Limitation of the sea use (e.g. military zones and no fishing areas);
- Typology of marine sediments, including potential mining areas;
- Coastal defence interventions;
- Orthophotos;
- Digital Elevation Model.
2c Integration No specific integration among information is directly provided.
2d Spatial scale Sub-National – Coast of Lazio Region along the Italian Tyrrhenian coast.
2e Flexibility The web-GIS was developed in order to be applied to the specific coastal territory of Lazio Region.
3 ICZM functionalities
3a Knowledge related functionalities
CMGIZC Web-GIS provides some of the knowledge related functionalities considered by the analysis, specifically:
- Availability of spatial data; the system is designed to share some of the geographic data through Web Map Service (WMS). To support data sharing, the Web-GIS provides a direct link for the download of the GAIA software; this is a free software that can be easily used to visualise spatial data through WMS (and other similar protocols) from a client desktop. The Web-GIS also provides a clear help supporting the use of GAIA;
- Operation at the different spatial scale; some of the available spatial data can be re-scaled according to the

21807-REL-T006.2 Annex 1 – page 140
considered spatial extent; thus enabling to visualize more details at a higher scales (e.g. coastline and bathymetric line);
- Availability of multi-time data, such as in the case of coastline in nine different years (from 1944 to 2005) enabling to evaluate the evolution of the coastal system.
3b Process related functionalities
CMGIZC web-GIS provides some of the process related functionalities considered by the analysis, specifically:
- Problem understanding and structuring; CMGIZC Web-GIS’s structure is well articulated and complete, thus enabling users to easily find data and information and relate the same to specific issues. Thus CMGIZC Web-GIS is well-shaped for problem understanding and structuring, as well as coastal management and planning at the sub-national level.
Furthermore, a new function called “Calcolo della linea di costa” (Calculation of the coastline) has been recently implemented in the web-GIS. This new tool enables the user (including no-expert ones) to calculate the morphological evolution of the coastline within a specific period a for selected coastal area. As results, the tool generates a graph representing the loss or the acquired volume (sedimentation/erosion budget) for the selected zone and period. The user can also export the linear evolution of the coast in a couple of format.
- Stakeholder involvement and participation; the web-GIS. Includes a specific tool (recently implemented) allowing the user to enter georeferred observations, for example concerning the erosion problem. The design and implementation of the new tool has been funded and by the MedLab European Project. The final aim is to involve citizens and stakeholders who can report relevant erosion, weather, marine and environmental events along the coastline.
The web-site hosting the CMGICZ includes also web coastal forum aiming to involve citizens and stakeholders to provide opinions on the coastal management and in particular in indicating particular meteo-marine and erosive events along the Lazio coastline.
4 Users
4a User typology
The broad nature of this web-GIS is intended for anyone who may be interested in the Lazio region coastal and marine information. For this reason potential users are:
- Policy-makers;
- Decision-makers;
- Coastal planners and/or managers;
- Specialised and expert users.
- Civil society.

21807-REL-T006.2 Annex 1 – page 141
5 Use of the system
5a Accessibility Free access on-line to the complete web-GIS and related tools
5b User-friendliness
Highly user-friendly.
This web-GIS is built around an interactive map very easy to browse, which allows anyone to identify, visualize those datasets relevant to their interest. The new implemented tool for the calculation of the morphological evolution is easy and friendly to use (based on a Wizard solution). The system is only in Italian.
5c Interactiveness
The web-GIS and the related web-site of the “Monitoring Centre for Integrated Coastal Zone Management” include two tools specifically aiming to enhance stakeholder involvement and interaction.
The first one (recently implemented) allows the user to enter georeferred observations, for example concerning erosion, weather, marine and environmental problems and events occurring along the coastline.
The second tool is a web coastal forum aiming to involve citizens and stakeholders in providing and discussing opinions on integrated coastal management, in particular in relation to the main relevant problems for the Lazio Region (such as erosion).
5d Data access
The system is designed to share some of the spatial data through Web Map Service (WMS); this can for example visualised thought the freely acquirable GAIA software. Spatial data can not however be downloaded.
A specific functionality enables the user to create customised maps, that can exported in pdf format
At the moment the access at the metadata information is not allowed because the metadata description is under construction.
6 Technological characteristics
6a Used technology
The web-GIS is developed with MapGuide. MapGuide is an Open Source web-based platform that enables users to develop and deploy web mapping applications and geospatial web services.
6b Integration with other tools
No specific integration with other tools.
6c Integration with other CIS
The web-site of the Monitoring Centre for Integrated Coastal Zone Management provides the link to other two small web-GIS specifically focusing on two naturalistically and tourism relevant islands of the Lazio Region: Ponza and Ventotene.
The web-GIS Lazio Region is included in the BEACHMED-e (Strategic management of beach protection for sustainable development of Mediterranean coastal zones) project web-site. The other web-GIS connected inside the BeachMed-e project

21807-REL-T006.2 Annex 1 – page 142
are:
- Emilia Romagna Region web-GIS;
- Liguria Region web-GIS;
- Toscana Region Web-GIS;
- Catalunya Web-GIS.
6d Interoperability
High.
Most of the dataset included in this Web-GIS are available via WMS. This guarantees a high interoperability of the system.
The structure of the data complies with the directive INSPIRE.
At the moment the access at the metadata information is not allowed because the metadata description is under construction. However the metadata will comply with the requirements of Inspire Directive.
7 Cost/resources
7a Resources Currently web-GIS's maintenance involves one full-time person and two part time (50%) persons
Information sources for the overview analysis of CMGIZC Web-GIS:
Bratti A., 2009. Presentation “Lazio Region’s experience in the sharing of geographical
digital data for the Integrated Coastal Zone Management”. A day for a cartography systems
to damage Coastal Zones. 10 December 2009 - Provence-Alpes-Côte d’Azur.
Lupino P., 2010. “A living lab experience in the integrated coastal zone management”.
Proceedings of the ESA Conference “Work shop of the MEDLAB - pilot project” Frascati 10
July 2010.
Web-site consultation : for the overview analysis of CMGIZC Web-GIS:
http://www.beachmed.it/; last visit on 23/02/2011 at 15.00.
http://www.cmgizc.info/; last visit on 06/04/2011 at 15.00.
http://80.94.113.69/cmg_segnalazioni/; last visit on 06/04/2011 at 18.00.
21807-REL-T006.2 Annex 1 – page 143
Web GIS Coast of the Campania Region
1 General Information
1a Name Web GIS Coast of the Campania Region
1b Description
The Soil Protection Department of Campania Region in the South of Italy has developed a Web based GIS related to coastal management. The system has been developed taking into account the critical issues of the addressed coastal area, mainly affected by erosion for long tracts of its beaches, coastal stability problems, problems related to the presence of port activities and coastal protection structures.
In this perspective, Regional river basin authorities are also working on the preparation of plans to contrast coastal erosion, aiming at identifying coastal areas at risk and establishing guidelines for the implementation of coastal engineering interventions mainly for the high priority areas, with critical environmental problems.
The Web-GIS provides a tool for the Campania Region and other authorities to analyse the evolution of above critical issues, plan monitoring activities and interventions for coastal protection. This tool was developed within a “twinning project” (A.G.I.R.E. POR) between the Campania Emilia-Romagna Regions aiming at transferring a procedural model for the development of an Information System of the Coast in support of integrated management and planning of coastal areas.
1c Operating entity Soil protection Department of Campania Region
1d Management structure
Soil protection Department of Campania Region
1e Contacts
info mail: [email protected]
Difesa del Suolo Regione Campania Via De Gasperi n 28 - 80133 Napoli
Web-GIS: http://www.difesa.suolo.regione.campania.it/content/view/20/36/
1f Typology Operational
2 Operational context and information content
2a ICZM dimensions
The Web-GIS mainly focuses on problems regarding coastal morphology and related coastal protection. Therefore, the Web-GIS considers two of the five analysed ICZM dimensions: territory and environment.
2b ICZM Sectors
Spatial data are structured in the following main groups: Cartographic basic information: - Digital Elevation Model - Administrative boundaries - Coastline evolution

21807-REL-T006.2 Annex 1 – page 144
- Territory - Coastal protection structures - Bathymetry - Geomorphology - Hydrodynamics - Land use - Landslides (IFFI project dataset) - Orthophotos
2c Integration No specific integrated information among different data is directly provided within the system
2d Spatial scale Sub-national scale – Coastal area of the Campania Region
2d Flexibility
The Web-GIS was designed and developed on the basis of the conceptual and procedural model used by Emilia Romagna Region to implement its own CIS. Knowledge transfer has been one of the activity of the A.G.I.R.E. POR project. In particular, main objective of this project was the transfer of a procedural model for the development of an Information System of the Coast in support of management and planning of coastal areas.
3 ICZM functionalities
3a Knowledge related functionalities
The Web-GIS provides only some of the considered ICZM knowledge related functionalities:
- Availability of spatial data; the system is designed to share geographic data through Web Map Service (WMS);
- Operation at the different spatial scale; some of the available spatial data can be re-scaled according to the considered spatial extent; thus enabling to visualize more details at a higher scales;
- Some multi-time data and information are available, e.g. for the coastline evolution, land use and orthophotos at differentyears. These information provides useful data to monitor the coastal evolution process and related problems.
3b Process related functionalities
The Web-GIS does not contain ICZM process related functionalities. Its data can properly support the problem understating and planning of relative solutions in relation to coastal erosion and other problems affecting coastal morphology.
4 Users
4a User typology
Since one of the main objectives of the CIS is to support coastal planning activities, in particular in relation to coastal erosion, the main target users are coastal planners and managers. General users, interested in being informed on coastal protection and evolution are also included as target users; easy understandable and accessible spatial layers are in fact available through the CIS.
5 Use of the system
5a Accessibility Free access on-line without password to the complete Web-GIS
21807-REL-T006.2 Annex 1 – page 145
5b User-friendliness
Highly user-friendly.
The use of the web-GIS on-line is simple and intuitive, also due to the present simple structure and limited contents of the system. Only Italian language is available.
5c Interactiveness No specific e-participation tools are available for interactiveness
5d Data access
From the Web-GIS, maps can be printed and exported in pdf format; however the same tool does not enable to download spatial data.
The system is designed to share spatial data through Web Map Service (WMS); this can for example visualised thought the freely acquirable GAIA software
Very simple metadata are provided for each layer.
6 Technological characteristics
6a Used technology Used technology is MapServer, an Open Source platform for publishing spatial data and interactive mapping applications to the web.
6b Integration with other tools
The Web-GIS includes data of the IFFI Project (Inventory of landslide phenomena) for the Campania Region, displaying landslide areas within 1km from the coast.
6c Integration with other CIS
No direct integration with other CIS is provided. The Soil Protection Department of the Campania Region has developed other Web-GIS that however are not directly to the Web-GIS coast. These for example includes:
Web-GIS on interventions for soil protection; Web-GIS on geological and geomorphological
characteristics; Web-GIS on the Regional Territory Plan.
6d Interoperability
Medium
Spatial data can be share and visualised through Web Map Service. This guarantees a high interoperability of the system in relation to data sharing. However, currently only very simple metadata (not meeting INSPIRE protocols) are provided
7 Costs/Resources
7a Resources
Web-site consultation for the overview analysis of the Web GIS Coast of the Campania
Region:
http://www.difesa.suolo.regione.campania.it/content/view/71/86/. Last visit on 24/02/2011
at 12.30.
21807-REL-T006.2 Annex 1 – page 146
Coastal and marine information system of Emilia Romagna Region
1 General Information
1a Name Coastal and marine information system of Emilia Romagna Region (CIS of Emilia Romagna)
1b Description
Since 2002 the Emilia-Romagna Region has been involved in ICZM and quickly grasped the need for tool that would facilitate the management of data and enable an increased knowledge of coastal issues.
The Coastal and marine information system of Emilia Romagna Region has been implemented within the EU CADSEALAND (Land-sea interaction: coastal state and evolution in CADSES) (2004-2006) project and it has been designed following the guidelines issued by European Commission within the EUROSION programme (EU commission, 2004). After the CADSEALAND project, Emilia Romagna Region was involved in the EU funded PlanCoast project (2006-2008). Within the activities of that project, the CIS of Emilia Romagna was updated to further support coastal and marine spatial planning, too. PlanCoast also foresaw the use of the CIS of Emilia Romagna to define a conceptual framework for the Ferrara coastal area (included in the Emilia Romagna Region) in order to identify and evaluate coastal vulnerability and to define criteria and objectives for territorial programming and planning.
The CIS contains data collected by different Institutions during the last 100 years and several GIS products (maps) resulting from survey activities and from studies recently carried out by the Geological, Seismic and Soil Survey of the Emilia Romagna Region. This CIS refers to the whole Emilia-Romagna coastal zone. This CIS is continuously updated and represents a fundamental support for decision makers and coastal planners dealing with ICZM.
Actually the CIS of Emilia Romagna is undergoing further implementation and upgrades within the EU project MICORE (Morphological Impacts and Coastal Risks induced by Extreme storms events – 2008 – 2011). The general aim of this project is to develop and test online tools for reliable predictions of the morphological impact of marine storm events in support to civil protection mitigation strategies.
This CIS also includes a Web-GIS component, enabling the on-line publication of part of the spatial data contained in the off-line GIS. The Web-GIS will in particular support diffusion and share of data among the peripheral structures of the Emilia Romagna Region.
1c Operating entity Servizio Geologico, Sismico e dei Suoli (SGSS) - Emilia Romagna (Geological, Seismic and Soil Survey – Emilia Romagna Region)
1d Management structure
Geological, Seismic and Soil Survey of Emilia Romagna Region
1e Contacts Luisa Perini, e-mail: [email protected]
Geological, Seismic and Soil Survey

21807-REL-T006.2 Annex 1 – page 147
Regione Emilia-Romagna Viale della fiera 840127 Bologna, Italy
Web-GIS: http://geo.regione.emilia-romagna.it/costa/viewer.htm
Web-site of the site of Geological, Seismic and Soil Survey: http://www.regione.emilia-romagna.it/wcm/geologia_en/index.htm
1f Typology Operational
2 Operational context and information content
2a ICZM dimensions
This CIS addresses four of the five ICZM dimension: territory, environment, economy and society. The environment and the territory dimensions are in-depth developed. The economic dimension mainly refers to information related to tourism and fishing activities. Few social information are available in the CIS; i.e. density population.
2b ICZM Sectors
This CIS has been designed following the guidelines issued by EC within the EUROSION programme (EU commission, 2004). Consequently, the CIS is organized according to these ten thematic topics:
- Topography (e.g. orthophotos, DEM, bathymetry); - Geomorphology, geology and sedimentology; - Hydrodynamics (e.g. waves, tides, current); - Land cover; - Administrative boundaries (provincial and municipal
boundaries); - Demography (e.g. population density and touristic fluxes); - Heritage and protected Areas (e.g. Natura 2000 sites); - Economic information (e.g. tourism infrastructure, fishing
license); - Coastal defences; i.e. database containing the works of
coastal defences; - Sea Uses (e.g. pipelines, offshore plants, area for sand
extraction).
The Web-GIS component currently includes a sub-set of all data available in the off-line version.
2c Integration
This CIS is mainly developed like an operative tool. The aim is to collect and organize the data of the coastal environment. In addition, a large amount of data available makes it possible to define the state of the coastal vulnerability and the coastal risk management through integration of different layers or comparative analysis of the available data.
In particular, the CIS is currently supporting MICORE project, dealing with integrated analysis of data to evaluate morphological impacts of marine storm events in support to civil protection mitigation strategies. The project is specifically targeted to contribute to the development of probabilistic mapping of the morphological impacts of marine storm and the production of early warning and information systems to support long-term disaster reduction.

21807-REL-T006.2 Annex 1 – page 148
2d Spatial scale
Sub-National scale – Coast of the Emilia Romagna Region.
This CIS covers the whole coast of the Emilia-Romagna region; a 130 km coastline along the Adriatic Sea, from the Goro Po mouth to the Gabicce village. The distinctive element of this coast is the beach, produced by the interaction, over a long period of time, between sediment carried to the sea by rivers, redistribution and deposition by the waves and marine currents and the modelling action of the wind.
2e Flexibility
This CIS has not been developed in order to be specifically applied to other coastal territories. However, its conceptual and procedural model has been used to support the design of the Campania Region CIS, within the twinning project A.G.I.R.E. POR.
3 ICZM functionalities
3a Knowledge related functionalities
This CIS provides some of the ICZM knowledge related functionalities considered by the analysis, specifically:
- Integration among different information sectors. CIS of Emilia Romagna Region for example includes maps of coastal vulnerability to erosion, integrating information related to three main aspects: geomorphology, coastal evolution and human impact. Coastal vulnerability issue is further studied in the MICORE project (see 2c);
- Availability of spatial data. Currently the Web-GIS component still does not allow spatial data downloading; this functionality will be implemented in the near future;
- Operation at the different spatial scale; some of the available spatial data can be re-scaled according to the considered spatial extent; thus enabling to visualize more details at a higher scales;
- Availability of multi-time data: multi-time data are for example available for the shoreline position (six years within the 1953 –2006 period) for data related to storm events.
- This CIS does not specifically address coastal vulnerability to climate change, at the moment. MICORE project could determine also improvement related to this point.
3b Process related functionalities
This CIS provides some of the processes related functionalities considered by the analysis, specifically:
- Problem understanding and structuring. This CIS was used within the CADSEALAND project to generate an integrated model of the Emilia Romagna coastal zone, related to: geomorphology, infrastructure, bathymetry, waves and currents. These model and related results enabled to re-construct the historical evolution of coastal morphology. Indeed, erosion and morphological process in general are key topics for the coastal management of the Emilia Romagna Region. Furthermore, the CIS includes a GIS tool, called DSAS - Digital Shoreline Analysis System (developed by the USGS) used to generate 3D morphological models of the shoreline and assess the 3D evolution in different time period.
- Monitoring and evaluation, adaptive planning and management. This CIS includes a database of coastal defence interventions and measures. This Database contains technical

21807-REL-T006.2 Annex 1 – page 149
data about coastal defence infrastructure and data related to the assessment of the effects (or the impacts) induced on the coastal morphology. This Database, integrated with the CIS spatial data, supports the evaluation of coastal defence strategy and the relative adaptive planning and management.
4 Users
4a User typology
The complete version of this CIS is specifically dedicated to the staff of the Geological and Seismic Service of the Soil that has the credits to access to the system.
The web-GIS is freely accessible to all the citizens.
The on-going activities of the MICORE projects and the related results (data and tool) are also targeted to the Italian Civil Protection, for the management and mitigation of coastal risks.
5 Use of the system
5a Accessibility
This CIS is completely accessible only to the staff of the Geological and Seismic Service by an Intranet connection.
The web-GIS component is freely accessible on line and makes available part of the information included in the off-line CIS.
5b User-friendliness
The Web-GIS is highly user-friendly.
Use of off-line system is technically demanding and specifically addressed to expert users. Web-GIS is only in Italian, all related documentation are also in English.
5c Interactiveness
The system includes a Web-GIS component, accessible to all on-line users. However, no other specific e-participation tools are included in the Web-GIS.
Future implementation should develop and activate an interface to collect and exchange data with web users.
5d Data access
Currently, the Web-GIS does not allow spatial data downloading. Static maps in pdf format can be created and exported. Future development also includes the implementation of data downloading functions.
Metadata are provided in the Web-GIS. Indeed the same can be used to query the available layers and visualise those corresponding to the defined selecting criteria.
6 Technological characteristics
6a Used technology
This CIS is developed with ESRI GIS software. All data are stored and managed by Oracle; ArcSDE technology links the Oracle database with ESRI GIS software.
The present hardware solution is quite simple. It is based on two servers: an internal server for processing, updating and validating data and another WEB server for data publication.
6b Integration with other tools
This CIS is an integrated with the following tools:
- The SGSS Centralized Information System, making available raster and vectorial data for the GIS;
- DB-Sea-storm; database of historical data on storminess and

21807-REL-T006.2 Annex 1 – page 150
related meteorological data;
- Some operational models like SWAN and ROMS, used to provide information regarding the forecast and hindcast of sea state and circulation;
- Xbeach model (DELFT Hydraulics) for the sea-storm events modelling. Xbeach is a two-dimensional model for wave propagation, long waves and mean flow, sediment transport and morphological changes of the near shore area, beaches, dunes and back barrier during storms
Some specific tools are implemented by this CIS, including:
- the Repository Manager; tool for the management of the Metadata collected respecting the ISO 19115;
- Database of the coastal defences measures and interventions (such as nourishment).
6c Integration with other CIS
No specific integration with other CIS
6d Interoperability
High
The use of standard protocols (according to the Inspire Directive) for data management guarantees a high interoperability of the system. The data acquired were georeferred according to the WGS84 system (or ETRS98) as outlined in EU directives (INSPIRE) and subsequently converted to the regional georeference system.
7 Cost/Resources
7a Resources
10 persons are involved in the CIS of Emilia Romagna Region and related hardware and software management. 5 of them are specifically dedicated to CIS operation and 5 others to technological support (likely serving also other services).
21807-REL-T006.2 Annex 1 – page 151
Information sources for the overview analysis of CIS of Emilia Romagna Region:
Bortone G., 2008. ”La Gestione Integrata delle Zone Costiere nel Mediterraneo”. Presented
in the conference: “Temi strategici per la protezione dell’ambiente e la promozione di uno
sviluppo territoriale sostenibile dello spazio MED” in Bologna 26 October 2008.
Perini 2007.“Il Sistema Informativo della Costa e i prodotti cartografici di supporto agli studi
e alle strategie di difesa”. “Ambiente e territorio”.
Perini L. e Calabrese Lorenzo, 2009. Il sistema mare-costa dell’Emilia-Romagna.
Pendrangon (Regione Emilia Romagna, 2010).
Montaguti M. 2008. Developing the new Geographic Information System for the Servizio
Geologico, Sismico e dei Suoli, Regione Emilia-Romagna.
Web-site consultation for the overview analysis of CIS of Emilia Romagna Region:
http://geo.regione.emilia-romagna.it/costa/viewer.htm; last visit on 07/02/2011 at 16.30.
http://www.regione.emilia-
romagna.it/wcm/geologia/canali/cartografia/sito_cartografia/web_gis_costa.htm; last visit
on 07/02/2011 at 13.30.
21807-REL-T006.2 Annex 1 – page 152
CISs of Venice Lagoon
Venice Lagoon is a complex and multi-functional coastal system that has been widely studied
and monitored for the great majority of its natural and anthropogenic components. The high
number of researches, studies and projects have generated an incredible amount of data and
information. These are organised in various information systems, only partially integrated
among each other, operated and managed by a variety of public and private subjects. In
relation to the objectives of the “Options for coastal information system” project, two principal
CISs have been considered, being these the more completed and structured ones as well as
those strictly related to a concrete use within coastal zone planning and management. The two
systems are:
The GIS tools of the Information Service of the Venice Water Authority (SINFO CIS);
The Atlas of the Venice Lagoon (SIL Venice) of the Municipality of Venice.
The two systems have different scopes and uses, that actually integrate each others’ ones.
The Information Service was set up in February 1984, implementing the first convention
signed between the Venice Water Authority and the Consorzio Venezia Nuova (in the context
of the first Special Law no. 171/1973 which established the principle that safeguarding of
Venice was a matter of "priority national interest”). Main tasks of the Information Service were
and still are to generate, collect, classify and archive data and information on the lagoon
environment and the related human activities. These data and information are used to support
other bodies operating in the Venice Lagoon (mainly the Venice Water Authority) in dealing wit
the assessment of the state of the system and the causes of the environmental and
morphological deterioration, as well as with the definition of safeguard plans of interventions
(defence from high waters, defence from sea storms and environmental protection) and its
monitoring.
The Atlas of the Venice Lagoon was initially (2006) created by the Venice Municipality as a
collection of maps produced by other bodies. Subsequently the Atlas evolved in an on-line
Web-GIS, mainly to provide free access – to any user – to data and information generated by
various data producers, including the same Venice Water Authority and the related Information
Service. The two main Atlas objectives are to provide support to the Venice Municipality in
dealing with the Venice Lagoon management and to share and diffuse spatial data to
interested users, including other public institutions, citizens and professionals. The Atlas gives
also much relevance to the INSPIRE Directive, aiming to meet related requirements.

21807-REL-T006.2 Annex 1 – page 153
1 General Information
1a Name GIS tools of the Information Service of the Venice Water Authority (SINFO CIS).
1b Description
SINFO CIS refers to a set of GIS-based and related (database, models, decision support systems) tools developed by the “Servizio Informativo” (Information Service) of the Venice Magistrato alle Acque di Venezia (Venice Water Authority - MAV), in order to support the management and safeguarding activities of the Venice Lagoon implemented by the same MAV through it concessionary Consorzio Venezia Nuova.
Main purpose of the MAV Information Service is the organization of data and their integrated analysis in order to provide scientific-based information to support the management and safeguarding of the Venice Lagoon. Specifics objectives can be summarized as follows:
- provide the knowledge base to define the state of the system, identify the causes of degradation and plan actions to safeguard and related monitoring;
- Organise and make easily accessible and understandable the wide and complex set of data and information available on the Venice Lagoon and its territory,
- Standardize the used observation and measurement methodology;
- Facilitate the technical collaboration among different institutions.
The activities of the MAV Information Service started in 1984. First period of activity mainly focused on collection and quality check of available documentation and creation of the Geographic Information System of the Venice Lagoon territory. The second period (started approximately in 1990) started addressing Venice Lagoon problems. This implied the further development of the GIS tools as well as of other integrated tools, including models, specific software and various decision support systems. The third period (relative to recent years) is characterized by an operational dimension, directly serving institutions, where the activities are part of the production processes. The results of these activities were complementary and mutually reinforced by those reached by MAV through its concessionary the “Consorzio Venezia Nuova”,.
Several institutions have collaborated with the MAV Information Service in the acquisition of data included in the SINFO CIS; e.g.
- Veneto Regional Authority;
- Provincial and municipal Authorities of the Veneto Region;
- Universities of the Veneto Region;
- The Italian National Research Council (CNR);
- The National Institute of Statistics (ISTAT)
1c Operating entity Information Service of the Venice Water Authority
1d Management Information Service of the Venice Water Authority
21807-REL-T006.2 Annex 1 – page 154
structure
1d Contacts
Roberto Rosselli, e-mail: [email protected]
San Marco, 2949 Campo Santo Stefano Venezia
Web-site: http://www.salve.it/it/sezioni/sin/home.htm
1e Typology Operational
2 Operational context and information content
2a ICZM dimensions
The SINFO CIS mainly addresses four of the five considered information dimensions. The environment and the territory dimensions are in depth addressed. The economic (e.g. data on the industrial area of Porto Marghera, close to the Venice Lagoon) and the social dimension (e.g. population density, urban structure) are considered, too.
2b ICZM Sectors
Information contained in the SINFO CIS are structured in the following main topics:
- Base maps
o historic maps, remote sensed data, including a wide collection of satellite images and aerial photographs;
o Physical and morphological environment of the Venice Lagoon (canals, tidal flats, mudflats, salt marshes) and its drainage basin;
o Administrative boundaries.
- Morphology (Bathymetry and Digital Elevation Model, channels, elevation of salt marshes, surface of shallow water, salt marshes and tidal flats, evolution of lagoon morphology, granulometry of sediments, geotechnical characteristics, subsidence, Pedology of the drainage basin, Morphological interventions in the Venice Lagoon)
- Hydrodynamic (current, tide, waves, meteorological data, discharge, flows, Hydrographic network and drainage basins, Database of flooding events and flooding risk for lagoon urban systems)
- Biology and biodiversity (Macroalgae and Seagrass distribution and ecological characteristics, and more in general lagoon vegetation, zoobenthos, birds)
- quality (water and sediments quality, drainage basin, residence time)
- Socio-economy (water traffic, hunting, Fish and Fish farming, Land use, Road infrastructure population density, industrial activities; archaeology, sewerage discharges in Venice lagoon).
2c Integration Data and information contained in the set of GIS tools of the MAV Information System have been used, also through models, to
21807-REL-T006.2 Annex 1 – page 155
support many integrated analysis related to the Venice Lagoon management. Results of these analysis have been often included in the SINFO CIS, e.g.:
- database of flooding events and of urban area affected by flooding risk;
- pollution loads (and relative budget) from the drainage basin; - maps of the morphological evolution of the Venice Lagoon,
also including areas subjected to sedimentation or erosion; - map of the archaeological risk.
Above ones are just some examples of integrated analysis results included in the SINFO CIS. Data and information are also used to produce software and systems directly aiming to support decision making, such as the CRUP system, providing integrated information supporting the MAV in licensing discharges into lagoon generated by production activities- Other are illustrated in section 6b.
2d Spatial scale Local scale – Venice Lagoon and its drainage basin
2e Flexibility SINFO CIS is developed to address specificities of the Venice Lagoon, with particular concern for planning, management and safeguarding scopes.
3 ICZM functionalities
3a Knowledge related functionalities
SINFO CIS provides some of the knowledge related functionalities considered by the analysis, specifically:
- Integration among different information sectors (see point 2c); this functionality is widely developed;
- Operation at the different spatial scale; great part of the available spatial data can be re-scaled according to the considered spatial extent; thus enabling to visualize more details at a higher scales.
- The data and information collected at the local level allows a more general inclusion in a larger scale, thus providing an adequate cooperation between different levels;
- Many layers and data present multi-time information. A very interesting example is the exhaustive and comprehensive set of historical maps and survey of the Venice Lagoon morphology, enabling to evaluate the long term evolution of the system. Important time series are also available for environmental quality data for various matrixes (those data are contained in a specific database, called BDMA).
3b Process related functionalities
SINFO CIS, and related tools of the Information Service (models, decision support systems, databases), specifically aims to provide scientifically-base information to local decision makers, planners and managers (Venice Water Authority and its concessionary Consorzio Venezia Nuova) dealing with the sustainable management of the Venice Lagoon.
Use of the system is therefore strictly connected to plans (e.g. the morphological plan of intervention), interventions and monitoring in the Venice Lagoon system, in the perspective of the ICZM process. Actually it is possible to say that SINFO CIS, and all the integrated
21807-REL-T006.2 Annex 1 – page 156
tools, fully support various phases of the integrated management of the Venice Lagoon (starting from problem understanding and structuring and ending with evaluating and adaptive planning).
Furthermore, developed decision support systems, directly or indirectly integrated with GIS information and tools, enable to generate thematic scenarios and assess related alternatives.
SINFO CIS (the GIS tools) does not provide specific participation tools; actually the GIS systems are currently not available on-line. However, many summary data and information are diffused through the “Puntolaguna” initiative. Puntolaguna is a multimedia information point on activities to safeguard Venice and its lagoon delegated to the Italian State and undertaken by the Venice Water Authority through the “Consorzio Venezia Nuova”. A vast and diverse range of informative tools is available for visitors to consult the material in a multi languages support.
Puntolaguna information point offers presentations and visits in the lagoon, educational workshops for schools, training courses for technicians of government.
4 Users
4a User typology
Due to the operative orientation of the SINFO CIS, target users mainly include the following ones:
- Policy-makers;
- Decision-makers;
- Coastal planners and coastal managers;
- Internal experts and specialised and expert users;
- Representative of private sectors
Data and information contained in GIS and database are useful for everybody that may require them to the MAV and Information Service. Other target users are represented by citizens, including teachers and students, in particular in relation to the Puntolaguna initiative.
5 Use of the system
5a Accessibility The system is currently available only for the Intranet users of the Information Service of the Water Venice Authority.
5b User-friendliness The SINFO-CIS is mainly addressing expert users and user-friendless does not represent a relevant requirement. The system is in Italian.
5c Interactiveness
SINFO CIS (the GIS tools) does not provide specific participation tools; actually the GIS systems are currently not available on-line. However, many summary data and information are diffused through the “Puntolaguna” initiative. Puntolaguna is a multimedia information point on activities related to the safeguard of Venice and its lagoon. A vast and diverse range of informative tools is available for visitors to consult the material in a multi languages support.
5d Data access Off-line access and restricted access Intranet to part of the system for Venice Water Authority and Consorzio Venezia Nuova. All users can consult the data at the Information Service and require

21807-REL-T006.2 Annex 1 – page 157
them to MAV and the same Information Service. After the authorization from MAV, the Information Service provides the required data, maps, GIS layer, and meta-data to users.
6 Technological characteristics
6a Used technology SINFO CIS is developed with Geomedia Intergraph (Licensed software). Geomedia area interfaced with numerous Oracle database to manage all the alphanumeric data.
6b Integration with other tools
SINFO CIS is directly or indirectly (for example providing data and acquiring outcome) integrated with a relevant number of other tools (database, models and decision support systems), including for example: - BDMA; Oracle database for the collection, management and
diffusion (currently thought Intranet) of environmental data and document on the Venice Lagoon
- SAMANET; a specific software for the acquisition and management of data (water chemical and physical parameters) continuously measured by fixed monitoring stations;
- CRUP; decision support system, providing integrated information for licensing discharges into lagoon generated by production activities. CRUO is integrated with a dispersive mathematical model able to evaluate the effects of pollutants discharged into the lagoon;
- Specific systems used to manage large dataset, such as: GESCOM supporting licensing for private water uses of the lagoon; SITAR related to archaeological sites in the Venice lagoon; COSS supporting quick visualisation of documents and reports related to studies; MODEL supporting the use of various hydrodynamic models of the Venice Lagoon;
Actually other tools and systems can be mentioned. For a full description please refer to Datei and Monsutti (2010).
6c Integration with other CIS
SINFO-CIS is integrated with the CIS of the Veneto Region coast (SIT della Fascia Costiera Veneta), realized by the Information Service of the Water Authority and the Veneto Region in order to collect all the data and information produced and made available by these two entities about the Veneto coastal system (from Bibione in the North to Scardovari in the South).
6d Interoperability
Medium. The SINFO CIS is designed in full agreement and compliance with standards UNI EN ISO 9001:2000. The main themes (e.g. elevation type and attribute, transport, channel, administrative boundary) provide complete interoperability in full compliance with the INSPIRE directive. This is going to be extended to all spatial data.
7 Cost/resources
7a Resources Management of the whole complex set of tools involves twelve full-time persons.
21807-REL-T006.2 Annex 1 – page 158
Information sources for the overview analysis of SINFO CIS:
Datei S. and Monsutti G., 2010. Il Servizio Informativo. Conoscenza e Gestione del
territorio come risorsa condivisa - The information service. Knowledge and Land
Management as a shared resource. Quaderni del Magistrato alle Acque – Marsilio Editor.
Web-site consultation for the overview analysis of SINFO CIS:
http://www.salve.it/it/sezioni/sin/home.htm; visited on 18/03/2011 at 10.30.
21807-REL-T006.2 Annex 1 – page 159
1 General Information
1a Name The Atlas of the Venice Lagoon - SIL Venice
1b Description
In 2006 the Atlas of the Venice Lagoon was firstly created by the Venice Municipality as a printed volume (still available on line) including 103 thematic maps and associated explanations supplied by public bodies, most of them from Venice Water Authority (Magistrato alle Acque di Venezia). Maps were grouped in five sections: Geosphere, Biosphere, Anthroposphere, Protected Environment and Integrated Analysis. Since February 2011 the Atlas of the Venice Lagoon has become a web portal, allowing access mainly to geographical and environmental data about the Venice Lagoon.
The key objective of the Atlas is to bring together and organise information held and updated by separate data producer bodies; thus various users (citizens, professionals, and various institutions) can refer to a single, shared information base. The Atlas development is based on a cooperative conceptual approach, implying that anyone can share its own data and maps through this tool. Indeed, data and maps contained in both versions of the Atlas (printed and Web-GIS) are generated by a multitude of public bodies, including in particular the Venice Water Authority (Magistrato alle Acque di Venezia) and other bodies such as research institutions (e.g. the Italian National Research Council and the University of Venice), local authorities (e.g. the Venice Municipality), the Veneto Regional Authority and national and international bodies (e.g. the Italian Ministry of the Environment and EEA).
Venice Lagoon is the specific area of interest of the Atlas; however the Atlas also includes environmental data related to the drainage basin and coastal waters. Data sets collected by the Atlas are approximately two hundreds. This number is growing since new datasets are progressively added, in particular through Web Map Service (WMS) protocols.
1c Operating entity Municipality of Venice
1d Management structure
Municipality of Venice, Environment Department, Observatory of the Lagoon and its Territory (Osservatorio della Laguna e del Territorio).
The Atlas has been developed and is maintained by the staff of Observatory of the Lagoon and its Territory, with the support of the Institute of Marine Sciences of the Italian National Research Council (CNR-ISMAR), based in Venice.
1e Contacts
e-mail: [email protected] Osservatorio della Laguna e del Territorio Environment and Safety Directorate of Land Municipality of Venice Campo Manin, San Marco 4023 30124 Venezia Web Atlas: http://www.silvenezia.it/index.php Venice Municipality Web-site: http://www.comune.venezia.it/ambiente
21807-REL-T006.2 Annex 1 – page 160
1f Typology Operational
2 Operational context and information content
2a ICZM dimensions
The Atlas mainly addresses four of the five considered information dimensions.
The environment and the territory dimension are in depth developed. Social related information is provided with some layers, including for example naturalistic and historic tourist route, military fortification, transport lines. Some governance information is also included.
2b ICZM Sectors
Data/cartographic information included in Atlas are structured in the following principal groups:
- Base Maps, e.g.: main morphological elements, imageries from several years, national and regional topography;
- Biosphere, e.g.: habitat of the lagoon, coastal vegetation and habitats, distribution of seagrass in the Venice Lagoon, fish farms, survey of ecological status of small islands, diffusion of invasive macroalgae;
- Atmosphere climate, e.g.: maps of air temperature, rainfall and winds in the lagoon and its catchment areas;
- Hydrosphere, e.g.: tides and waves; water temperature, salinity of the Venice Lagoon;
- Lithosphere, e.g. depth of the lagoon in different years, sedimentology;
- Protected areas, e.g. Natura 2000 sites, RAMSAR area, boat speed limits defined in protected areas;
- Anthroposphere, e.g.: naturalistic and historic tourist route, historical military fortifications, public transport lines in the lagoon; pollutant emissions from major industrial plants;
- Special projects, including: georeferred photographs taken by astronauts from the International Space Station; maps of biogenic reefs in Venice coastal water the coast of Venice; maps on the morphological evolution of the Lagoon.
2c Integration
The Web version of the Atlas currently does not include layers providing an integrated analysis of sector data. Printed version of the Atlas contains a specific section dedicated to the Integrated Analysis, including for the example the following maps: sustainability indicators, cumulative impacts on the Venice Lagoon, conflict among lagoon uses. environmental risk due to heavy metal, salt-marshes functions, etc.
2d Spatial scale
Local scale – Venice Lagoon
Venice Lagoon is the specific area of interest of the Atlas; however the Atlas also includes environmental data related to the drainage basin and coastal waters.
2e Flexibility The Atlas has been developed in order to be applied specifically to Venice Lagoon system.
3 ICZM functionalities
3a Knowledge The Atlas provides some of the knowledge related functionalities

21807-REL-T006.2 Annex 1 – page 161
related functionalities
considered by the analysis; specifically:
- Integration among different information; the printed version of the atlas includes a significant number of maps related to integrated analysis. These are not currently accessible by the Web-GIS;
- Availability of spatial data; some layers are shared via Web Map Server facilities;
- Operation at the different spatial scale; some of the available spatial data can be re-scaled according to the considered spatial extent; thus enabling to visualize more details at a higher scales;
- Availability of multi-time data, such as in the case of morphological maps available for various time steps included in the period 1881 - 2003.
3b Process related functionalities
All data are freely shared by the Web-GIS component of the Atlas and made available to users. Indeed users can through the Atlas generate customised maps that can be used to support problem understanding. Furthermore, the information of Atlas is clearly structured in homogenous groups, thus providing a general conceptual modelling of the Venice Lagoon system.
The main goal of the Atlas is to collect and share data on the Venice Lagoon, rather than supporting a specific planning or managing activity. In this perspective the totally accessible Atlas represents a participation tool, providing the possibility to use all available data.
Moreover, through a specific functionality (using a lagoon map interface) users can enter georeferred naturalistic observations (such as evidence of bird presence, invasive species indication, etc.). In association to the indication of the observation, users can provide video, photos or descriptions thought a proper sheet. Currently this tool is being tested.
4 Users
4a User typology
The Atlas offers a series of customizable maps that may results in being useful for various users:
- Coastal planners and/or managers;
- Specialised and expert users;
- Teachers and students;
- Citizens and citizens’ associations.
5 Use of the system
5a Accessibility Free access on-line (access allowed to all users with or without password) to the complete Atlas.
5b User-friendliness
Highly user-friendly
The system is very easy to use. It is very user-friendly and it offers a clear explanation of all the functionalities that can be activated by the interactive screen. The Web Atlas is available both in Italian and English.
5c Interactiveness The Atlas development is based on a cooperative conceptual approach, implying that anyone can share its own data and maps
21807-REL-T006.2 Annex 1 – page 162
through this tool.
The Atlas enables data producers to share its own spatial data through WMS in a unique Web-GIS environment. Data are stored physically in the data producer’s servers The WMS service allows to publish data in the Web-GIS component of the Atlas and visualize them in combination with data provided by other producers. Data providers have the responsibility to: update and quality check the data, provide relative metadata description (through a metadata sheet), specify the legend of the spatial data. This sharing modality is currently used by a limited number of data producers.
Interactiveness is also provided through a specific functionality (using a lagoon map interface) enabling users to provide georeferred naturalistic observation (see 3b).
5d Data access
The Atlas enables to:
- Generate customised maps and export them in pdf format;
- Access and directly visualise on his own computer some layers through the Web Map Service functionality;
- Visualise a comprehensive and explanatory metadata sheet for all available layers.
6 Technological characteristics
6a Used technology
All the web-portal of the Atlas of the Venice is developed using open source technologies:
- Web-GIS: Pmapper
- Database: PostgreSQL, PostGIS;
- Server: Ubuntu, Apache, Tomcat; Map engines: Mapserver, Geoserver.
6b Integration with other tools
Integration with other tools is particularly developed, since the Atlas mainly visualise and share data provided by various institutions. In particular:
- The Atlas enables data producers to share its own spatial data through WMS in a unique Web-GIS environment (see 5c). This sharing modality is currently used by a limited number of data producers (basically the Institute of Marine Sciences of the Italian National Research Council);
- The Atlas is connected to the Web Map Service of the National Cartographic portal;
- The Atlas integrates output of models of temperature and salinity in the Venice Lagoon, operated the Institute of Marine Sciences of the Italian National Research Council (CNR-ISMAR), based in Venice.;
- The Atlas is connected to the European Pollutant Release and Transfer Register (E-PRTR). This catalog is the new Europe-wide register that provides easily accessible key environmental data from industrial facilities in European Union Member States.
6c Integration with other CIS
The Atlas is not directly integrated with other CIS. However, as previously described, the Atlas includes maps provided by a wide variety of institutions. In particular, many data are provided by the Information Service (SINFO CIS) of the Venice Water Authority.

21807-REL-T006.2 Annex 1 – page 163
6d Interoperability The Atlas provides complete interoperability of spatial data between the various European levels and sectors of Public Administration in full compliance with the INSPIRE directive.
7 Cost/Resources
7a Resources
The management of the Atlas of the Venice Lagoon involves two staff persons (half-time) of the Observatory of the Lagoon and its Territory of the Venice Municipality. Internal effort is supported by external resources. Two consultants provide their service in relation to computer and technical GIS aspects; their commitment on the Atlas management is estimated to be about 20% of the comprehensive working time of each consultant.
Information sources for the overview analysis of Atlas of the Venice Lagoon:
Wright, D.J., Dwyer, N., Kopke, K., and O’Dea, L., 2010. Report of International Coastal
Atlas Network Workshop 4: Formalizing the Network, Engaging the Mediterranean,
UNESCO International Centre for Theoretical Physics, Trieste, Italy, 16-20 November
2009. Available online at http://ican.science.oregonstate. edu/ican4_final_rpt
Web-site consultation for the overview analysis of Atlas of the Venice Lagoon:
http://www.silvenezia.it/index.php; last visit on 19/03/2011 at 15.00.
http://www.ismar.cnr.it/products/data-base/atlas-lagoon-of-
venice/index.html%20?set_language=en&cl=en; last visit on 21/03/2011 at 12.00.
21807-REL-T006.2 Annex 1 – page 164
Gulf of Gera Coastal Information System
1 General Information
1a Name Gulf of Gera Coastal Information System
1b Description
The Gulf of Gera CIS was developed within the Ditty Project (2003-2005) - Development of an Information Technology Tool for the Management of European Southern Lagoons under the influence of river basin runoff (funded by the Fifth Framework Program, Energy, Environment and Sustainable Development). The general objective of the Ditty Project was the development of information technology tools integrating databases, geographical information systems (GIS), mathematical models and DSS (Decision Support Systems) to support the management of southern European coastal lagoons and adjacent watersheds, within the spirit of the Water Framework Directive.
Gulf of Gera was included as one of the test site of the project. The final result of the case study was a CIS including a database, a GIS component and mathematical models (coupled river basin-coastal lagoon models).
The study also generated a DSS meant to allow simulation of different scenarios and to help policy and decision makers for assessing the effectiveness of measures designed to achieve good quality status of waters and a sustainable use of resources, in relation to the Water Framework Directive. Scenarios were defined with stakeholders, addressing issues such as population growth, change in land use or resource exploitation, dredging operations and water reuse. Effects of climate change were also considered.
1c Operating entity
The system was developed by the Municipality of Gera and by the School of Environmental Sciences of the University of Aegean.
The system is not on-line anymore. Municipality of Gera and the School of Environmental Sciences of the University of Aegean are still the contact points.
1d Management structure
1d Contacts
George Sirtis, e-mail: [email protected]
University of the Aegean Department of Marine Science University Hill postal code 81100 MITILENE
Web-site: http://www.gera.gr/index.html
1e Typology Operational
The system is not on-line anymore.

21807-REL-T006.2 Annex 1 – page 165
2 Operational context and information content
2a ICZM dimensions
The Gulf of Gera CIS addresses four of the five considered information dimensions.
The environment and the territory dimension are in depth developed. The economic information in the system is provided with some layers regarding aquaculture sites, agriculture and tourism (hotels). Social information only refers to population density.
2b ICZM Sectors
Spatial data included in Gulf of Gera CIS are structured in the following principal groups:
- Physical environment (river, shoreline, hydrological network);
- Environmental monitoring (monitoring stations in marine and coastal zones);
- Meteorological historical data (rain, temperature);
- Infrastructure (road network);
- Land and marine uses;
- Fisheries, aquaculture and agriculture;
- Tourism and recreation;
- Human impact (urban areas with population density, administrative boundaries).
2c Integration
2d Spatial scale
Local Scale – Gulf of Gera.
The gulf of Gera is a semi-enclosed water body located in the island of Lesvos, Greece in the Aegean archipelago. The watershed of the gulf, of approximately 200 Km2, can be divided into two parts with differences in geomorphology and land use. The western part of 170 Km2, is characterized by a rather smooth terrain cultivated mainly with olive trees, the location of five villages with a total population of 7000 people and a rich hydro graphic network of small rivers flowing mainly during winter. The surface area of the gulf is approximately 43 Km2, and the mean depth of about 10 m. The gulf is connected to the open sea through a channel, having a width of 200-800 m, length of 6.5 Km and depth ranging from 10 to 30 m.
2e Flexibility
The methodological approach used to implement the Gulf of Gera CIS was also used in the case of other two case studies of the Ditty project; the Thau Lagoon (France) and the Ria Formosa (Portugal). Gulf of Gera CIS can be therefore considered as party flexible and exportable to other similar areas, with the necessary customisation.
3 ICZM functionalities
3a Knowledge related functionalities
Gulf of Gera CIS provides only partly ICZM knowledge related functionalities considered by the analysis, specifically:
- Multi-time data and information for some layers, e.g. environmental and meteorological (such as nutrient
21807-REL-T006.2 Annex 1 – page 166
concentration in the water column, rain and temperature). These data were used as input for the models;
- Analysis of climate change issue in the DSS application to derive scenarios to help policy and decision makers for assessing the effectiveness of measures designed to achieve good quality status of waters and a sustainable use of resources.
3b Process related functionalities
The CIS was used in combination with the DSS prototype to generate scenarios to assess the effectives of alternative measure in achieving good quality status of water and a suitable use of resources. ICZM process related functionalities supported by the CIS therefore include:
- Scenario development;
- Assessment of management alternatives.
The CIS appears to not include specific functionalities related to stakeholder involvement and participation. However, the generation of scenarios involved stakeholders.
4 Users
4a User typology
The system is specifically designed to support the scientifically-based management of the Gulf of Gera area, also including modelling and DSS tools. Indeed, main users are expert users, coastal planners and coastal managers. In particular the final "end-user" of the CIS is the Municipality of Gera.
5 Use of the system
5a Accessibility
Off-line access.
A DVD with all the data, the GIS and the report regarding the Ditty project may be requested by the web-site of the Municipality of Gera.
5b User-friendliness
5c Interactiveness No specific e-participation tools are provided
5d Data access No data and metadata are directly accessible on line. Data and metadata can be requested on DVD support (see 5a)
6 Technological characteristics
6a Used technology The CIS was developed with ESRI (ArcIMS) software. Spatial Analyst and 3D Analyst toolboxes were also used for specific elaborations.
6b Integration with other tools
Gulf of Gera CIS is integrated with other tools:
- Database with the meteorological data;
- Hydrodynamic model developed with the Princeton Ocean Model and coupled with an ecological model for the nutrient transport;
Within the Ditty project activities, a Decision Support System was
21807-REL-T006.2 Annex 1 – page 167
also developed, to simulate different management.
6c Integration with other CIS
No integration with other CIS
6d Interoperability
7 Cost/resources
7a Resources
Information sources for the overview analysis of Gulf of Gera CIS:
Aliaume C., Do Chi T., Viaroli P., Zaldívar J. M., 2007. Coastal lagoons of Southern
Europe: recent changes and future scenarios. Transitional Waters Monographs, Volume 1,
Issue 1 (2007).
Kontogianni A., Kavakli Z., Avagianou E. and Tsirtsis G., 2006. Stakeholders Analisys, Gulf
of Gera case study. Document developed inside the Project: “Ditty Project”.
Kontogianni A., Kavakli Z., Avagianou E., Spatharis S. and Tsirtsis G., 2006. Scenario
Analisys, Gulf of Gera case study. Document developed inside the Project: “Ditty Project”.
Kitsiou D., Nitis T., Tsirtis G., Tsaknakis A., Esteve M.A., Falcão M., Giordanni G. and
Loubersac L., 2006. WP3. Geographical Information System (GIS) development.
Document developed inside the Project: “Ditty Project”.
Tsirtsis G., Avagianou E., Kontogianni A., Spatharis S. and Kavakli Z., 2006 DSS
development and application: gulf of Gera case study. Document developed inside the
Project: “Ditty Project”.
Web-site consultation for the overview analysis of Gulf of Gera CIS:
http://www.env.aegean.gr/; last visit on 14/03/2011 at 11.30
http://www.mar.aegean.gr/english/defaulteng.htm; last visit on 14/03/2011 at 11.50
http://www.gera.gr/index.html; last visit 14/03/2011 at 11.30
21807-REL-T006.2 Annex 1 – page 168
Bulgarian Black Sea Coastal Atlas
1 General Information
1a Name Bulgarian Black Sea Coastal Atlas (BCA)
1b Description
The geographical area covered by the Bulgarian Black Sea Coast Atlas (BCA) includes the Bulgarian Black Sea catchment area, the coastline, internal waters, territorial waters, contiguous zone and exclusive economic zone. The main BCA objectives are:
- share and use of geographically-linked spatial information on marine and coastal features along the Bulgarian part of the Black Sea coastal zone;
- provide coastal and marine data available to the general users;
- improve public access to coastal information to help and support different authorities, institutions and stakeholders in coastal zone management.
The idea for the development of the BCA emerged as part of a Bulgarian Oceanographic Data Centre (BGODC) initiative and it has been developed with the financial support of the SIBEMA project (Scientific and Institutional Capacity Building for Implementing European Marine Policy in the Black Sea Region). Only a few data have been published in Internet until now through the GIS Server of BGODC. However, there are many other GIS-layers available in the IO-BAS (Bulgarian Institute of Oceanology within the Bulgarian Academy of Science) geo-database, related to various coastal and marine topics, to be still published in the BCA. Other bodies could contribute in providing useful data to the BCA, including: Water Basin Directorate (Ministry of Ecology), Cadestre Agency – Ministry of Regional Development and Public Works, Navy Hydrographic Service, National Institute of Meteorology and Hydrology – BAS, Institute of Fishery and Aquaculture – Varna.
The whole system is still not available on-line, but it was presented in 2009 at the 4th ICAN workshop (Trieste, November 2009). In his presentation, Stanchev (2009) highlighted the “lack of funding sources for web-atlas development and maintenance. It also tresses the lack of common spatial data standards and harmonised data management between different institutions, lack of common agreement for sharing spatial data between institution involved in data gathering and lack suitably qualified staff”…”The main challenge is to getting the Atlas development under way”.
1c Operating entity Bulgarian Institute of Oceanology within the Bulgarian Academy of Sciences (IO-BAS) and Bulgarian Oceanographic Data Centre (BGODC)
1d Management structure
Bulgarian Institute of Oceanology within the Bulgarian Academy of Sciences (IO-BAS) and Bulgarian Oceanographic Data Centre (BGODC)
1d Contacts
Hristo Stanchev; e-mail [email protected]
Institute of Oceanology –Varna Bulgarian Oceanographic Data Centre (BGODC)
Web site: http://www.bgodc.io-bas.bg/

21807-REL-T006.2 Annex 1 – page 169
1e Typology Pre-Operational
BCA was selected since it is one of the few CIS available for the Black Sea.
2 Operational context and information content
2a ICZM dimensions
The environment and the territory dimensions will be in depth developed, also with information regarding erosion and coast protection structures. The economic information in the system will be related for example to fisheries and aquaculture.
2b ICZM Sectors
According to the presentation of the system given at the 4th ICAN workshop (Stanchev, 2009), the following information sectors will be covered by the atlas:
- Ecological features and eutrophication status - Topographic and nautical maps - Geomorphic typology - Erosion sections, sandy beaches and coast-protection
structures - Sea level rise - Census data for population - Photos of coastline and port/coast-protection structures - Data from CTD monitoring station - Fisheries and aquaculture - Infrastructure - Socio-economic data
2c Completeness and integration
No specific integrated data among different information is directly provided within the system
2d Spatial scale
National – Bulgarian Black Sea coast.
The geographical area covered by the BCA includes the Bulgarian Black Sea catchment area, coastline, internal waters, territorial waters, contiguous zone and exclusive economic zone (EEZ).
2e Flexibility BCA was developed to be specifically applied to the Bulgarian Black Sea coast.
3 ICZM functionalities
3a Knowledge related functionalities
Currently the system does not provide specific ICZM knowledge related functionalities.
3b Process related functionalities
Currently the system does not provide specific ICZM process related functionalities.
4 Users
4a User typology
Different target groups could benefit from the implementation of the BCA: the coastal scientific/research community in Bulgaria and outside; environmental agencies; governmental and municipal authorities; local communities/owners; civil protection authorities; coastal-protection agencies; and decision-makers.

21807-REL-T006.2 Annex 1 – page 170
5 Use of the system
5a Accessibility Only a few data have been published in Internet until now through the GIS Server of BGODC. Numerous data are waiting to be made available in Internet
5b User-friendliness
5c Interactiveness No specific e-participation tools are provided
5d Data access
6 Technological characteristics
6a Used technology BCA was developed with the ESRI ArcGis Server software (licensed software).
6b Integration with other tools
No specific integration with other tools
6c Integration with other CIS
No specific integration with other CIS
6d Interoperability BCA aims to be complaint with the requirements and the protocols of the INSPIRE Directive.
7 Cost/Resources
7a Resources
In his presentation at the 4th ICAN workshop, Stanchev (2009) highlighted the “lack of funding sources for web-atlas development and maintenance. It also tresses the lack of common spatial data standards and harmonised data management between different institutions, lack of common agreement for sharing spatial data between institution involved in data gathering and lack suitably qualified staff”…”The main challenge is to getting the Atlas development under way”.

21807-REL-T006.2 Annex 1 – page 171
Information sources for the overview analysis of Bulgarian Black Sea Coastal Atlas:
Stanchev H., 2009. “The Bulgarian Black Sea Coastal Atlas (BULGCOAST Atlas) –
developments and forthcomings” ICAN 4th Workshop Trieste, Italy, 16-20 November
2009.
Wright, D.J., Dwyer, N., Kopke, K., and O’Dea, L., 2010. Report of International Coastal
Atlas Network Workshop 4: Formalizing the Network, Engaging the Mediterranean,
UNESCO International Centre for Theoretical Physics, Trieste, Italy, 16-20 November
2009. Available online at <http://ican.science.oregonstate. edu/ican4_final_rpt>.
Web-site consultation for the overview analysis of Bulgarian Black Sea Coastal Atlas:
http://www.bgodc.io-bas.bg/ last visit on 02/09/2011 at 10.00

21807-REL-T006.2 Annex 1 – page 172
Akçakoca Costal Information System
1 General Information
1a Name Akçakoca Costal Information System (CIS)
1b Description
The Akçakoca CIS was developed within the pilot project on “testing of methodology on spatial planning for ICZM” (9 months project in year 2007) engaged to the Istanbul Technical University (ITU) as consultant to perform the services required by the UN Office for Project Services (UNOPS). The specific objective of the ICZM pilot project was the development of a spatial plan for the Akçakoca District coastal area – along the Black Sea coast of Turkey - according to the methodology developed within the Tacis/Europe Aid Projects (1998-2003). Related goals were (Tanik et al., 2008):
- To improve the protection of the marine environment and vulnerable coastal zone;
- To help in creating the common regional understanding of ICZM approach and its benefit to the area;
- To enhance and strengthen the capabilities of the regional authorities for the coastal planning and management;
- To contribute to the effective implementation of the Black Sea Strategic Action Plan in the pilot area.
One of the main outcomes of CIS application was the production of integrated land use maps, supporting the analysis of inter-sectoral conflicts and coastal spatial planning.
1c Operating entity Istanbul technical University
1d Management structure
Istanbul technical University; Environmental Engineering Department, Geodesy and Photogrammetry Department and Urban and Regional Planning Department
1e Contacts
Aysegul Tanik; e-mail: [email protected];
Dursun Zafer Seker; e-mail: [email protected]
Department of Environmental Engineering Istanbul Technical University Faculty of Civil Engineering 34469, Maslak - Istanbul, Turkey
1f Typology The system was developed by and used within the pilot project implemented by the Istanbul technical University. It is not clear whether the system is currently used or not.
2 Operational context and information content
2a ICZM dimensions
The GIS database focuses on the territory ICZM dimension (mainly addressed in terms of land use/land cover), also including other three ICZM dimension: environment (e.g. ecological status of the district), economy and society (e.g. socio-demographic data).
2b ICZM Sectors Layers included in the Akçakoca CIS mainly refer to:
- Spatial-Base-Data (e.g. topography, administrative boundaries,

21807-REL-T006.2 Annex 1 – page 173
bathymetry);
- Environmental and territorial data (e.g. geological data, erosion, slope, water resources and streams, forests, land use and land cover);
- Natural hazard and polluted areas;
- socio economic data (e.g. place of interest, transportation network, infrastructures for waste and water management).
2c Integration
The Akçakoca CIS was widely used to derive integrated maps, thus providing scientific-based knowledge to the related ICZM processes. Illustrative examples are:
- Sectoral conflicts between different land uses (e.g. map showing hazelnuts cultivation in forestry areas);
- Conflicts between a specific land use and the natural soil features (e.g. map showing hazelnuts cultivation in highly erodible areas);
- Maps of importance and vulnerability levels for the Akçakoca District; vulnerability is defined a the tolerance level of the natural resource or structure to the human activities.
- Final maps of functional zoning, identifying different zones with different land-use functionality (e.g. forestry, agriculture, tourism) and different sectoral conflicts
2d Spatial scale Local scale - Akçakoca District along the Turkish Black sea coast.
The system mainly includes data and maps related to the land component of the coastal area
2d Flexibility The system has been developed in order to be specifically applied to the Akçakoca District territory.
3 ICZM functionalities
3a Knowledge related functionalities
Akçakoca CIS provides only partly ICZM knowledge related functionalities considered by the analysis; in particular the integrated analysis is supported by means of various maps and information (see 2c).
3b Process related functionalities
The Akçakoca CIS was specifically developed to support the application and testing of an ICZM approach to the Akçakoca District aiming to develop a related spatial plan. The CIS was likely particularly useful for
- Problem understanding and structuring, in particular supported by the various integrated maps provided by the CIS, that can be also useful in prioritising coastal uses;
- Planning; as said above the CIS was intended to support the development of a spatial plan for the Akçakoca coastal area, in particular addressing uses conflicts.
4 Users
4a User typology The project aimed at testing a methodology on spatial planning for ICZM also through the use of the Akçakoca CIS; principal target users therefore were decision-makers and coastal planners.

21807-REL-T006.2 Annex 1 – page 174
5 Use of the system
5a Accessibility Only off-line access
5b User-friendliness
5c Interactiveness No specific e-participation tools are provided
5d Data access The access of the system is restricted only to off-line users; thus no data and metadata are provided to free access.
6 Technological characteristics
6a Used technology
6b Integration with other tools
No integration with other tools
6c Integration with other CIS
No integration with other CIS
6d Interoperability
7 Cost/resources
7a Resources
The GIS work involved Senior experts of the Environmental Engineering Department of ITU, together with the staff from the Geodesy and Photogrammetry Department and Urban and Regional Planning Department
Information sources for the overview analysis of Akçakoca CIS:
Istanbul technical University, 2009. Testing of methodology of spatial planning for ICZM
Akçakoca District Pilot Project. (00039160-RER/01/G33/A/1G/31). February – October
2007. Environmental Collaboration for the Black Sea. Project. Wrap-Up Conference 29
October 2009.
Tanik, A., Seker, D.Z., Ozturk, I., Tavsan, C., 2008. GIS based sectoral conflict analysis in
a coastal district of Turkey. ISPRS Congress. Beijing, 2008. Proceeding of Commission
VIII.
21807-REL-T006.2 Annex 1 – page 175
Odessa Coastal Information System
1 General Information
1a Name Odessa Coastal Information System
1b Description
Odessa CIS is a Web-GIS developed within the PlanCoast Project (2007-2009). The coastline covered by this CIS is about 50 km long and include three main port areas in the Black Sea: Illichevsk, Odessa and Ugnii.
The Odessa CIS includes two main components: the ecological Atlas and the Marine information system for the analysis of the effect of accidental oil spills. The two components enable support the identification of zones at risk for ships and tanker accidents in the North Western part of Black Sea.
The Odessa CIS was expressly designed and implemented to support spatial planning of the coastal zone and marine area of the region of concern, specifically in relation to oil spill risk management. Planning activity was also part of the PlanCoast Project.
1c Operating entity Ukraine Scientific Centre of Ecology of Sea (UkrSCES)
1d Management structure
Ukraine Scientific Centre of Ecology of Sea (UkrSCES)
1e Contacts
Richard Lisovsky; e-mail: [email protected]
Department for Scientific and Information Support Ukrainian Scientific Centre of Ecology
Web-GIS: http://ims2.sea.gov.ua:8083/website/Agglomeration/viewer.htm
UcrSES Web-site: www.sea.gov.ua
1f Typology Operational
2 Operational context and information content
2a ICZM dimensions
The Odessa CIS addresses four of the five considered ICZM dimensions: territory (e.g. city agglomeration, marine and coastal protected areas,) environment (e.g. maritime flora and fauna, natural habitat), economy (e.g. land and sea uses, industrial and waste water treatment plants, tourism infrastructure, pipelines and navigation lines), society (human pressure).
2b ICZM Sectors
The Odessa CIS includes the spatial layers related to the main following topics:
- CIS area of interest, including three detailed areas Illichevsk, Odessa and Ugnii
- Topographic information, including: channels, lakes, rivers, railways, roads, city names, parks, gardens, building, etc.
- Depth
- Coastal human uses
- Tourism infrastructure
21807-REL-T006.2 Annex 1 – page 176
- Sewer discharge and surface/underwater outfall
- Recreational zones;
- Coastal protected zone
- Marine flora and fauna
- Natural habitats
- Birds
- Ecological Sensitivity Index (ESI)
- Information relevant for port activities, including: anchorage area and points, wreck, fishing facilities, navigation lines, underwater pipelines, recommended tracks, traffic separation scheme.
2c Integration
The CIS does not provide much integration among different information. A layer on Ecological Sensitivity Index (ESI) is included; however no clear information on the computation method is provided.
2d Spatial scale Local – Odessa coastal area in the Black Sea
2d Flexibility The system has been developed in order to be applied specifically to Odessa territory.
3 ICZM functionalities
3a Knowledge related functionalities
The CIS does not provide ICZM knowledge related functionalities, besides examples of integration among different information, i.e. the Ecological Sensitivity Index (ESI) layer (see 2c)
3b Process related functionalities
The Web-GIS does not include specific ICZM process related functionalities. The tool has been however used to support coastal and marine planning. Indeed, within the PlanCoast project, the Odessa CIS was expressly designed and implemented to support spatial planning of the coastal zone and marine area of the region of concern, specifically in relation to oil spill risk.
4 Users
4a User typology
Main users of the Odessa CIS appear to be decision-makers and coastal planners; actually the CIS was developed to support planning and management of oil spill related risks. On-line access to the Web-GIS enables any user to have access to available maps.
5 Use of the system
5a Accessibility Free access on line (access allowed to all users without password) to the Web-GIS.
5b User-friendliness
Medium.
Intuitive operation of the system for the turn-off or turn-on of the informative layers. An identify function is available that helps the user to identify the specific features. The system is in Ukraine, also including parts in English.
5c Interactiveness No specific e-participation tools are provided.

21807-REL-T006.2 Annex 1 – page 177
5d Data access
Spatial data (GIS layer) are not downloadable. The maps can be visualised but can not be printed. There is no specific function to create the legend, so the user can hardly manage maps with lots of different data. There is no specific tool for map saving.
The meta-data are available (mainly in Ukrainian).
6 Technological characteristics
6a Used technology The Odessa CIS is designed on the basis of ESRI technology. The system uses an ArcIMS service for the application connect to the web server and ArcSDE service for the database connection.
6b Integration with other tools
No specific integration with other tools
6c Integration with other CIS
No specific integration with other CIS
6d Interoperability
Low.
The GIS project was developed in ArcGis 9.2 so the data layers are ESRI shape file. Spatial data however can not be downloaded and shared. Metadata do not meet requirements of ISO standards (INSPIRE Directive).
7 Cost/Resources
7a Resources
Information sources for the overview analysis of the Odessa CIS:
Richard Lisovsky, 2011. Information provided by mail on the 17.02.2011 at 14.23, CET
time.
Web-site consultation for the overview analysis of the Odessa CIS:
http://ims2.sea.gov.ua:8083/website/Agglomeration/viewer.htm; last visited on 23/02/2011
at 17.00.
http://www.plancoast.eu/wp/?p=203#more-203; last visited on 23/02/2011 at 17.30.
http://www.sea.gov.ua/index.htm.en; last visited on 23/02/2011 at 16.00.
21807-REL-T006.2 Annex 2
Annex 2 – Overview analysis: analytical tables of Extra-European CIS cases

21807-REL-T006.2 Annex 2 – page 1
MORIS - Massachusetts Ocean Resource Information System
1 General Information
1a Name Massachusetts Ocean Resource Information System (MORIS)
1b Description
The Massachusetts Ocean Resource Information System (MORIS) is an on-line mapping tool (Web-GIS) created by the Massachusetts Office of Coastal Zone Management (CZM), the Massachusetts Office of Geographic Information (MassGIS), the Massachusetts Ocean Partnership (MOP), Applied Science Associates (ASA), and Charlton Galvarino.
MORIS can be used to search and display spatial data pertaining to the Massachusetts coastal zone. Users can interactively view various data layers (e.g., tide gauge stations, marine protected areas, access points, eelgrass beds, etc.) over a backdrop of aerial photographs, political boundaries, natural resources, human uses, bathymetry, or other data including Google base maps. In particular, MORIS is designed to:
- Provide spatial data that are, to the extent possible, accurate, scientifically sound, and credible;
- Provide information to decision makers, planners, and the general public that can be used to strengthen environmental policy and guide management decisions;
- Use a collaborative, interactive process that involves a variety of partners and data sources;
- Ensure that the data are available in an easily accessible and useful manner.
Some of the MORIS data are provided and maintained by various agencies external CZM.
The Massachusetts Office of Coastal Zone Management (CZM) is a part of the Executive Office of Energy and Environmental Affairs (EEA). CZM’s mission is to balance the impacts of human activity with the protection of coastal and marine resources. As a networked program, CZM was specifically established to work with other state agencies, federal agencies, local governments, academic institutions, non profit groups, and the general public to promote sound management of the Massachusetts coast. CZM is funded primarily through the Commonwealth of Massachusetts, the National Oceanic and Atmospheric Administration (NOAA), and the U.S. Environmental Protection Agency (EPA).
1c Operating entity Massachusetts Office of Coastal Zone Management
1d Management structure
Massachusetts Office of Coastal Zone Management
1d Contacts
e-mail: [email protected]
Massachusetts Office of Coastal Zone Management 251 Causeway Street, Suite 800 Boston, MA 02114-2138
Web-GIS: http://www.mass.gov/czm/mapping/index.htm
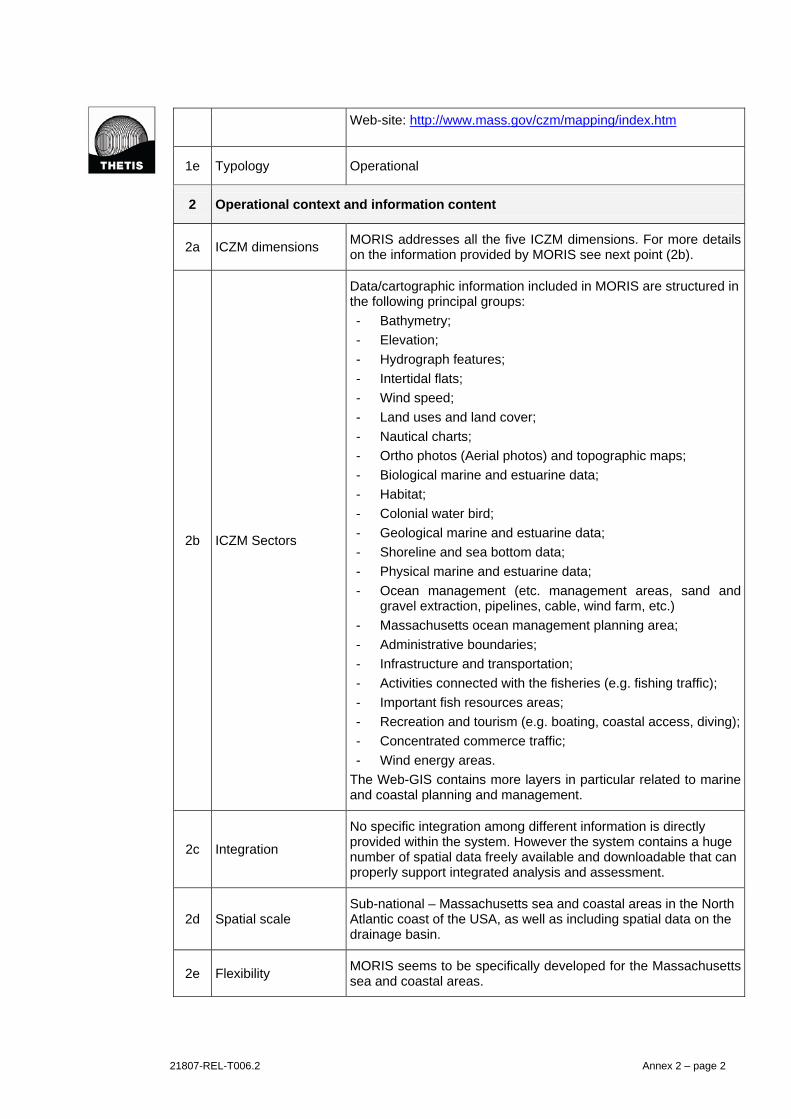
21807-REL-T006.2 Annex 2 – page 2
Web-site: http://www.mass.gov/czm/mapping/index.htm
1e Typology Operational
2 Operational context and information content
2a ICZM dimensions MORIS addresses all the five ICZM dimensions. For more details on the information provided by MORIS see next point (2b).
2b ICZM Sectors
Data/cartographic information included in MORIS are structured in the following principal groups:
- Bathymetry;
- Elevation;
- Hydrograph features;
- Intertidal flats;
- Wind speed;
- Land uses and land cover;
- Nautical charts;
- Ortho photos (Aerial photos) and topographic maps;
- Biological marine and estuarine data;
- Habitat;
- Colonial water bird;
- Geological marine and estuarine data;
- Shoreline and sea bottom data;
- Physical marine and estuarine data;
- Ocean management (etc. management areas, sand and gravel extraction, pipelines, cable, wind farm, etc.)
- Massachusetts ocean management planning area;
- Administrative boundaries;
- Infrastructure and transportation;
- Activities connected with the fisheries (e.g. fishing traffic);
- Important fish resources areas;
- Recreation and tourism (e.g. boating, coastal access, diving);
- Concentrated commerce traffic;
- Wind energy areas.
The Web-GIS contains more layers in particular related to marine and coastal planning and management.
2c Integration
No specific integration among different information is directly provided within the system. However the system contains a huge number of spatial data freely available and downloadable that can properly support integrated analysis and assessment.
2d Spatial scale Sub-national – Massachusetts sea and coastal areas in the North Atlantic coast of the USA, as well as including spatial data on the drainage basin.
2e Flexibility MORIS seems to be specifically developed for the Massachusettssea and coastal areas.
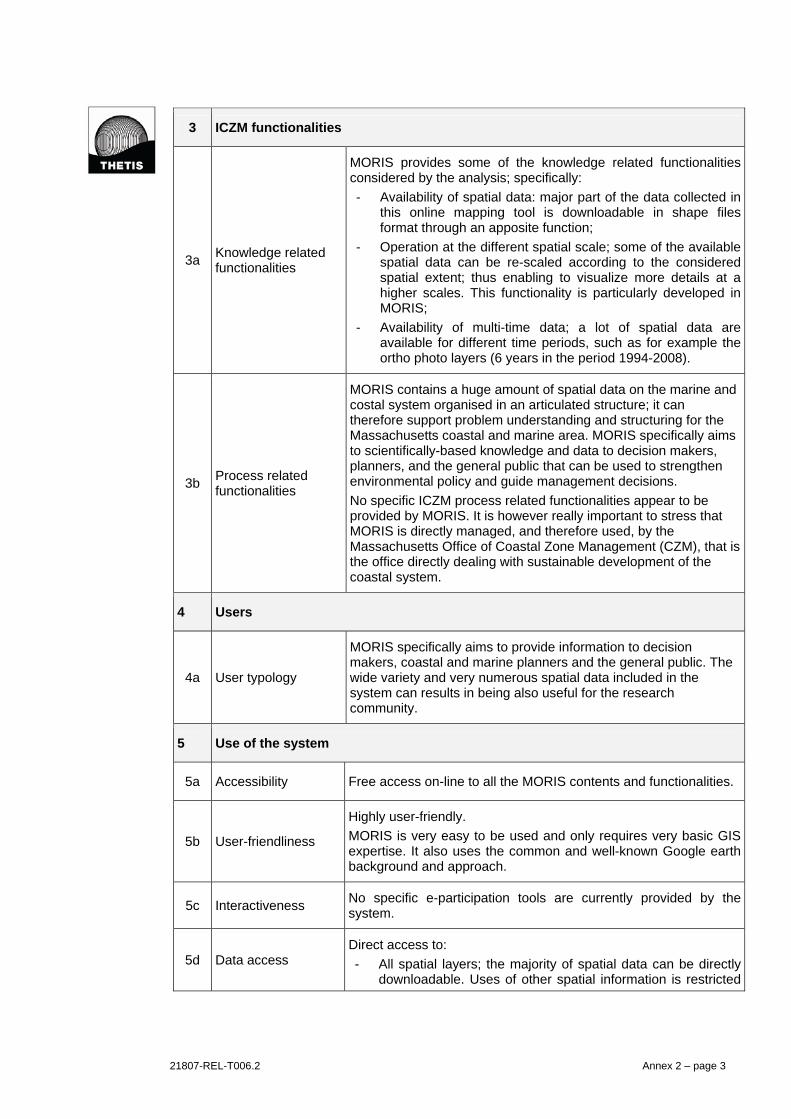
21807-REL-T006.2 Annex 2 – page 3
3 ICZM functionalities
3a Knowledge related functionalities
MORIS provides some of the knowledge related functionalities considered by the analysis; specifically:
- Availability of spatial data: major part of the data collected in this online mapping tool is downloadable in shape files format through an apposite function;
- Operation at the different spatial scale; some of the available spatial data can be re-scaled according to the considered spatial extent; thus enabling to visualize more details at a higher scales. This functionality is particularly developed in MORIS;
- Availability of multi-time data; a lot of spatial data are available for different time periods, such as for example the ortho photo layers (6 years in the period 1994-2008).
3b Process related functionalities
MORIS contains a huge amount of spatial data on the marine and costal system organised in an articulated structure; it can therefore support problem understanding and structuring for the Massachusetts coastal and marine area. MORIS specifically aims to scientifically-based knowledge and data to decision makers, planners, and the general public that can be used to strengthen environmental policy and guide management decisions.
No specific ICZM process related functionalities appear to be provided by MORIS. It is however really important to stress that MORIS is directly managed, and therefore used, by the Massachusetts Office of Coastal Zone Management (CZM), that is the office directly dealing with sustainable development of the coastal system.
4 Users
4a User typology
MORIS specifically aims to provide information to decision makers, coastal and marine planners and the general public. The wide variety and very numerous spatial data included in the system can results in being also useful for the research community.
5 Use of the system
5a Accessibility Free access on-line to all the MORIS contents and functionalities.
5b User-friendliness
Highly user-friendly.
MORIS is very easy to be used and only requires very basic GIS expertise. It also uses the common and well-known Google earth background and approach.
5c Interactiveness No specific e-participation tools are currently provided by the system.
5d Data access Direct access to:
- All spatial layers; the majority of spatial data can be directly downloadable. Uses of other spatial information is restricted

21807-REL-T006.2 Annex 2 – page 4
by confidentiality reasons defined by data producers;
- Metadata are provided for all layers. They are quickly and easily accessible and full explanatory.
6 Technological characteristics
6a Used technology
MORIS is a JavaScript web application that utilizes various components of GeoExt, a JavaScript toolkit for rich mapping applications. The application is run through a client-side web browser.
MORIS pulls data through the GeoServer mapping software. GeoServer is a free, open-source, map-serving platform that serves data using Open Geospatial Consortium, Inc. (OGC) WMS and WFS formats, among others.
6b Integration with other tools
No specific integration with other tools
6c Integration with other CIS
Some of the data contained in MORIS are provided and maintained by various agencies external to CZM.
6d Interoperability
High.
MORIS pulls data through the GeoServer mapping software. GeoServer is a free, open-source, map-serving platform that serves data using Open Geospatial Consortium, Inc. (OGC) WMS and WFS formats, among others.
Metadata description is particularly rich and complete.
7 Cost/resources
7a Resources
Web-site consultation for the overview analysis of MORIS:
http://www.mass.gov/czm/mapping/index.htm; visited on 25/03/2011 at 16.30

21807-REL-T006.2 Annex 2 – page 5
Mapping and Planning Portal of the Mid-Atlantic Regional Council on the Ocean
1 General Information
1a Name Mid-Atlantic Regional Council on the Ocean Mapping and Planning Portal (MARCO-MPP)
1b Description
The MARCO Mapping and Planning Portal (MARCO-MPP) is an on-line Web-GIS based system that allows state, federal, and local decision-makers and the public users to visualize, query, map, and analyze ocean and coastal data in the Mid-Atlantic Region (involving five federal states). The Governors of New York, New Jersey, Delaware, Maryland and Virginia have committed to a new comprehensive, regional approach, creating the Mid-Atlantic Regional Council on the Ocean (MARCO).
MARCO involves the following representative of the five federal states:
- New York State Department of State Division of Coastal Resources and New York Ocean and Great Lakes Ecosystem Conservation Council (New York);
- Coastal Management Program and New Jersey Department of Environmental Protection (New Jersey);
- Maryland Oceans (Maryland);
- Department of Natural Resources and Environmental Control and Delaware Coastal Program (Delaware);
- Virginia Secretary of Natural Resources and Virginia Coastal Zone Management Program (Virginia).
The four MARCO’s priority issue areas and goals are:
- Collaborate on Regional approach to support the sustainable development of renewable energy in offshore areas;
- Coordinate protection of important habitats and sensitive unique offshore areas on regional scale;
- Prepare the region’s coastal communities for the impacts of climate change on ocean and coastal resources;
- Promote improvements in the region’s coastal water quality.
The five MARCO states are working to maintain and improve the health of their ocean and coastal resources, and ensure that they continue to contribute to the high quality of life and economic vitality of their region’s communities well into the future. The five MARCO states agreed to work together to develop a regional, web-based portal as part of their 2009 Action Plan. In response to this need, the Virginia Coastal Zone Management Program provided funding (through their CZM Award from the National Oceanic and Atmospheric Administration - NOAA) for the creation of the mapping and planning portal for the Mid-Atlantic region.
The structure of MARCO is composed of:
- The Council (the five Mid-Atlantic Governors);
- An Executive Committee (State Secretaries and Agency Heads);
- A Management Board (State CZM Directors and Senior

21807-REL-T006.2 Annex 2 – page 6
Policy Advisors);
- Five Action Teams (State staff with expertise in the four priority issue areas plus a team for coastal and marine spatial planning).
1c Operating entity Mid-Atlantic Regional Council on the Ocean.
The portal was developed by a team of representatives from each of the Mid-Atlantic States, NOAA, and The Nature Conservancy.
1d Management structure
Mid-Atlantic Regional Council on the Ocean.
1d Contacts e-mail: [email protected]
Web-GIS: http://maps.tnc.org/MARCO/index.html
MARCO Web-site: http://www.midatlanticocean.org/index.htm
1e Typology Operational
2 Operational context and information content
2a ICZM dimensions
MARCO-MPP mainly addresses three of the five considered information dimensions.
The environment and the territory dimension are in depth developed. The economic information in the system is provided with layers regarding fishing effort and commercial shipping density.
2b ICZM Sectors
Currently, the MARCO portal includes map data layers grouped into five broad categories:
- Administrative layers (e.g. administrative boundaries, marine boundaries and jurisdictions, territorial sea, contiguous zone, exclusive economic zone, wind energy areas, etc.);
- Decision Support (e.g. overlays of various uses and natural features, 50 mile shoreline buffer etc.).
- Human Uses (e.g. fishing effort, commercial shipping density etc.);
- Biological (e.g. sea and benthic habitats, artificial reefs, water birds density information, etc.);
- Geophysical (e.g. vulnerability to sea level rise, bathymetry, major canyons, sediment grain size, seabed form, wind speed, etc.).

21807-REL-T006.2 Annex 2 – page 7
2c Integration
MARCO-MPP contains some layers with integrated information.
The most relevant one is the vulnerability to sea level rise calculated along all the Atlantic coastal area (from Maine to Florida). This layer provides a preliminary overview of the relative susceptibility of the Atlantic coast to sea level rise through the use of a coastal vulnerability index (CVI). The computation of the index is based upon the variables geomorphology, regional coastal slope, tide range, wave height, relative sea-level rise and shoreline erosion and accretion rates. CVI is finally expressed in four classes (low, medium, high, very high).
Other examples of integrated analysis are layers included in the Decision Support category.
2d Spatial scale
Regional – Mid-Atlantic Ocean, including coastal areas of five states (New York, New Jersey, Delaware, Maryland and Virginia).
Layer on coastal vulnerability to sea level rise is referred to the whole Atlantic coast of the United States.
2e Flexibility
MARCO-MPP is specifically developed to address Mid-Atlantic Ocean and related coastal area. However, MARCO-MPP’s structure is very similar to the one adopted by HELCOM Map and Data Service supporting the activity of the Helsinki Commission.
3 ICZM functionalities
3a Knowledge related functionalities
MARCO-MPP provides some of the knowledge related functionalities considered by the analysis, specifically:
- Integration among different information sectors (see point 2c);
- Availability of spatial data; a function inside MARCO-MPP opens a web-page with the list of the downloadable layers and the respective link where the user can find them. Most layers are available for the download.
- Operation at the different spatial scale; some of the available spatial data can be re-scaled according to the considered spatial extent; thus enabling to visualize more details at a higher scales;
- Function abilities or maps related to assessment coastal vulnerability; MARCO-MPP includes a specific layer representing coastal vulnerability to sea level rise (see point 2c). The spatial extension of this layer is from the coast of Florida to the coast of Maine.
3b Process related functionalities
Currently MARCO-MPP does not include ICZM process related functionality. The system is however under constant development. To fully support the coastal and marine spatial planning process, the portal will evolve including more sophisticated decision support features, such as the ability for ocean users and managers to create spatial management scenarios and monitor and evaluate trends and goals.

21807-REL-T006.2 Annex 2 – page 8
4 Users
4a User typology
MARCO-MPP is an on-line tool intended for anyone who may be interested in Mid-Atlantic coastal and marine information. Potential and effective users are mainly state, federal, and local decision-makers and the other public users.
5 Use of the system
5a Accessibility Free access on-line to all the MARCO-MPP contents and functionalities.
5b User-friendliness
Highly user-friendly.
MARCO MPP is provided with customised interfaces that are rather simple to be used. Moreover use of the system is supported by a detailed and simply usable “Help Page” and a clear and explanatory description of layers contained in the system.
5c Interactiveness No specific e-participation tools are currently provided by the system.
5d Data access
- More than 90% of spatial layers are directly downloadable;
- Users can generate a customized map and a printable file in pdf format;
- Metadata description and explanation are provided by all layers included in MARCO-MPP, through a summary fact sheet and a Full Metadata description.
6 Technological characteristics
6a Used technology ESRI ArcGis Server and Flex (licensed software).
6b Integration with other tools
No specific integration with other tools
6c Integration with other CIS
MARCO-MPP is not directly integrated to other CIS. The general MARCO web-site provide a link to the following other mapping systems:
- Multipurpose Marine Cadastre;
- Integrated Ocean Observing System Data Catalog;
- Virginia Coastal GEMS;
- Maryland Coastal Atlas;
- New York Ocean and Great Lakes Atlas.
6d Interoperability
High
Metadata description is particularly rich and complete. They are structured according to the Esri Profile of the Content Standard for Digital Geospatial Metadata.

21807-REL-T006.2 Annex 2 – page 9
7 Cost/resources
7a Resources
The Mid-Atlantic Governors’ commitment to a regional approach is evidenced by the rapid creation of the Mid-Atlantic Regional Council on the Ocean (MARCO). Coastal policy makers and Coastal Zone Management Program (CZM) directors from New York, New Jersey, Delaware, Maryland and Virginia each devoted time and funds to bring about this new regional organization. Exclusive of staff time, the five states have, to date, dedicated about $300,000 to the formation of MARCO and implementation of initial actions.
Web-site consultation for the overview analysis of MARCO-MPP:
http://maps.tnc.org/MARCO/index.html; last visit on 29/03/2011 at 10.30;
http://www.midatlanticocean.org/index.htm; last visit on 29/03/2011 at 10.30.

21807-REL-T006.2 Annex 2 – page 10
Virginia Coastal Geospatial and Educational Mapping System
1 General Information
1a Name Virginia Coastal Geospatial and Educational Mapping System (Coastal GEMS)
1b Description
Virginia Coastal Geospatial and Educational Mapping System (Coastal GEMS) is a dynamic internet mapping application (web-GIS) that serves as a gateway to information about Virginia’s coastal resources.
Coastal GEMS is a result of a collaborative effort, including the data of some agencies and other partnering coastal organizations. Coastal GEMS was developed by the Virginia Coastal Zone Management Program (CZM). The idea of developing web-GIS collecting the coastal data of the Virginia started in the 2001. During a CZM workshop state and local partners expressed the need for a “vision” of Virginia’s Coastal Zone and for a comprehensive inventory of Virginia’s coastal resources. For this reason Virginia CZM has begun collecting spatial data and creating management tools to be included in Coastal GEMS.
Coastal GEMS provides a high number of spatial layers(provided by various data produces) covering the most important topics related to the land and marine components of the coastal system. Each layer is associated to a detailed “fact sheet” collecting the metadata information. These “fact sheets” are of particular importance for layers regarding the Conservation Planning Tools and Conservation Planning examples. These layers are indeed rather complex and not-intuitive, the “fact sheets” clearly explain their contents and meaning, supporting their proper users in coastal and marine planning and management.
Additional data layers are going to be continuously incorporated into Coastal GEMS as agencies continue to develop data and make it available for inclusion.
1c Operating entity Virginia Coastal Zone Management Program Office
1d Management structure Virginia Coastal Zone Management Program Office
1d Contacts
Laura McKay, e-mail: [email protected] Virginia Coastal Zone Management Program Office Department of Environmental Quality 629 East Main Street Richmond, Virginia 23219 Web-GIS: http://128.172.160.131/gems2/# Web-site: http://www.deq.virginia.gov/coastal/coastalgems.html
1e Typology Operational
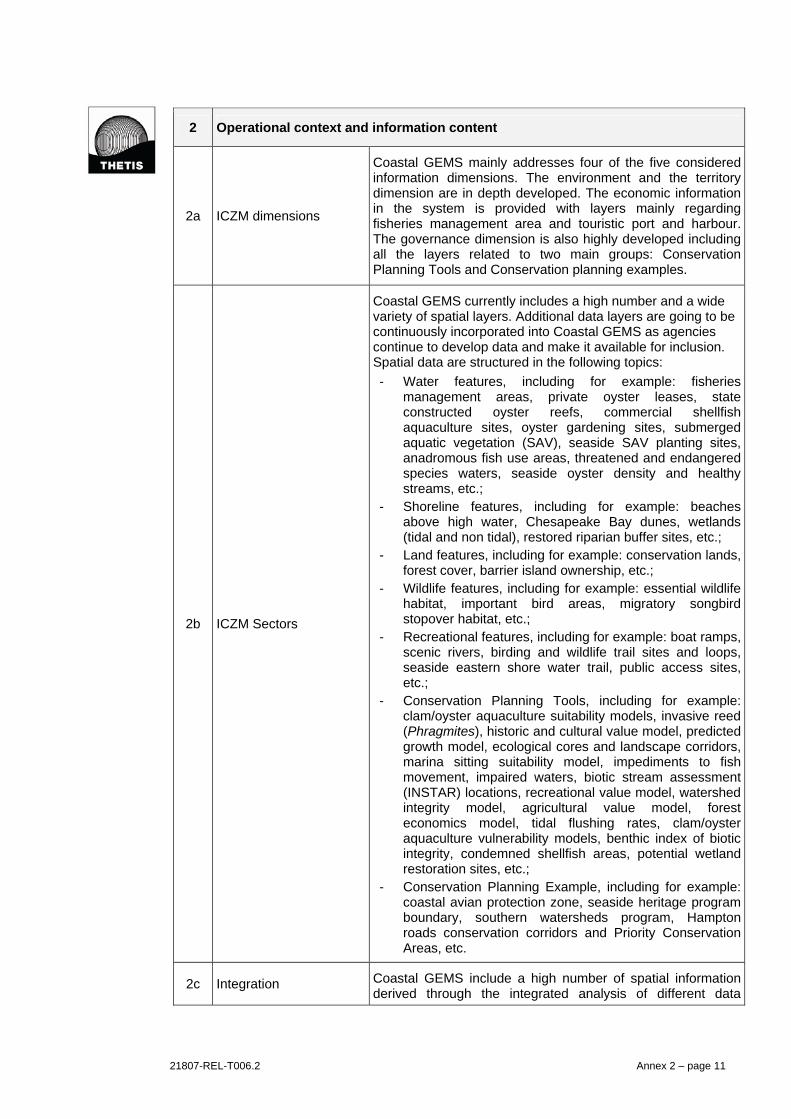
21807-REL-T006.2 Annex 2 – page 11
2 Operational context and information content
2a ICZM dimensions
Coastal GEMS mainly addresses four of the five considered information dimensions. The environment and the territory dimension are in depth developed. The economic information in the system is provided with layers mainly regarding fisheries management area and touristic port and harbour. The governance dimension is also highly developed including all the layers related to two main groups: Conservation Planning Tools and Conservation planning examples.
2b ICZM Sectors
Coastal GEMS currently includes a high number and a wide variety of spatial layers. Additional data layers are going to be continuously incorporated into Coastal GEMS as agencies continue to develop data and make it available for inclusion. Spatial data are structured in the following topics:
- Water features, including for example: fisheries management areas, private oyster leases, state constructed oyster reefs, commercial shellfish aquaculture sites, oyster gardening sites, submerged aquatic vegetation (SAV), seaside SAV planting sites, anadromous fish use areas, threatened and endangered species waters, seaside oyster density and healthy streams, etc.;
- Shoreline features, including for example: beaches above high water, Chesapeake Bay dunes, wetlands (tidal and non tidal), restored riparian buffer sites, etc.;
- Land features, including for example: conservation lands, forest cover, barrier island ownership, etc.;
- Wildlife features, including for example: essential wildlife habitat, important bird areas, migratory songbird stopover habitat, etc.;
- Recreational features, including for example: boat ramps, scenic rivers, birding and wildlife trail sites and loops, seaside eastern shore water trail, public access sites, etc.;
- Conservation Planning Tools, including for example: clam/oyster aquaculture suitability models, invasive reed (Phragmites), historic and cultural value model, predicted growth model, ecological cores and landscape corridors, marina sitting suitability model, impediments to fish movement, impaired waters, biotic stream assessment (INSTAR) locations, recreational value model, watershed integrity model, agricultural value model, forest economics model, tidal flushing rates, clam/oyster aquaculture vulnerability models, benthic index of biotic integrity, condemned shellfish areas, potential wetland restoration sites, etc.;
- Conservation Planning Example, including for example: coastal avian protection zone, seaside heritage program boundary, southern watersheds program, Hampton roads conservation corridors and Priority Conservation Areas, etc.
2c Integration Coastal GEMS include a high number of spatial information derived through the integrated analysis of different data

21807-REL-T006.2 Annex 2 – page 12
typologies. This is particular evident for layers included in the Conservation Planning Tools category, that are often results of modelling application. A couple of examples are:
- Aquaculture Vulnerability Model; this layer is the result of a model studying the risks associated with the shellfish aquaculture. The model firstly considers basics physical and biological conditions necessary for aquaculture success and secondly, the impacts that current land use and proposed local zoning has on suitable growing areas.
- Tidal rushing rates; this layer shows an evaluation of the water bodies in the Virginia coastal zone using several water quality models to calculate residence time. Results are grouped into tidal flushing categories: quickly, intermediate and slowly.
2d Spatial scale Sub-national – Virginia coastal zone along the Atlantic ocean
2e Flexibility Coastal GEMS is specifically developed for the Virginia coastal area
3 ICZM functionalities
3a Knowledge related functionalities
Coastal GEMS provides some of the knowledge related functionalities considered by the analysis, specifically:
- Integration among different information sectors (see point 2c); this functionality is particular developed and a relevant number of integrated information are included in and accessible through the Web-GIS;
- Availability of spatial data; the system allows the downloading of GIS layers in shape file format;
- Operation at the different spatial scale; some of the available spatial data can be re-scaled according to the considered spatial extent; thus enabling to visualize more details at a higher scales.
3b Process related functionalities
Coastal GMES contains a huge amount of spatial data on the marine and costal system organised in an articulated structure; it can therefore support problem understanding and structuring for the Virginia coastal and marine area. Furthermore, coastal vulnerability is evaluated for various relevant topics (see the category Conservation Planning Tools, including for example spatial data on: vulnerability for clam aquaculture or oyster aquaculture), also through the use of specific models, and related layers are included in the Web-GIS.
The system also includes relevant spatial data about plan mainly dealing with coastal protection, thus also showing some of the results of the ICZM process.

21807-REL-T006.2 Annex 2 – page 13
4 Users
4a User typology
As reported in the Coastal GEMS web-site, the system is mainly dedicated to:
- Local and regional planning agencies to better manage growth by determining the most suitable areas for conservation and development;
- State and federal agencies to better manage projects such as roads and major facilities, habitat restoration, and public access plans. They could also use Coastal GEMS as a starting point for the environmental review process in order to quickly access agency data;
- Academic institutions to educate students about coastal resource use and values and to provide a basis of information for classroom projects and/or research;
- Private citizens, advocacy groups, and businesses to formulate their positions on the potential impacts of projects on coastal resources;
- General public to learn more about Virginia’s coastal resources.
Indeed the wide nature of data included in the Coastal GMES can properly address the above variety of target users.
5 Use of the system
5a Accessibility Free access on-line to all the Coastal GEMS contents and functionalities.
5b User-friendliness
Highly user-friendly.
The Coastal GEMS is built around an interactive map very easy to browse, which allows anyone to identify, visualize and query those datasets relevant to their interest. Each layer is described accurately by a metadata description with all the information necessary to support the correct comprehension of the data.
5c Interactiveness No e-participation tools are currently provided by the Coastal GMES
5d Data access
- The majority of spatial layers are downloadable through the link proposed in the “fact sheet”, also illustrating metadata information;
- Metadata description and explanation for all the layers included in the Coastal GEMS. Metadata are managed through detailed fact sheets. It is relevant stressing that these sheets also clearly indicate the last data updating that is a very useful information for the correct use of data.
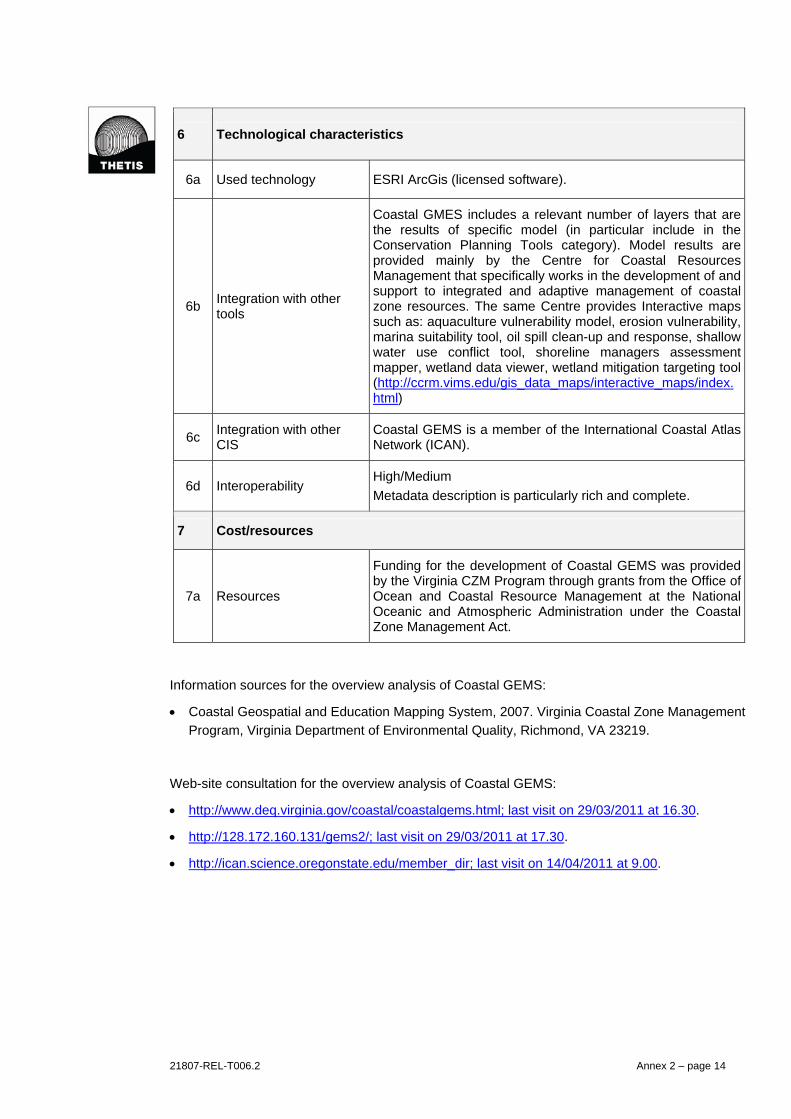
21807-REL-T006.2 Annex 2 – page 14
6 Technological characteristics
6a Used technology ESRI ArcGis (licensed software).
6b Integration with other tools
Coastal GMES includes a relevant number of layers that are the results of specific model (in particular include in the Conservation Planning Tools category). Model results are provided mainly by the Centre for Coastal Resources Management that specifically works in the development of and support to integrated and adaptive management of coastal zone resources. The same Centre provides Interactive maps such as: aquaculture vulnerability model, erosion vulnerability, marina suitability tool, oil spill clean-up and response, shallow water use conflict tool, shoreline managers assessment mapper, wetland data viewer, wetland mitigation targeting tool (http://ccrm.vims.edu/gis_data_maps/interactive_maps/index.html)
6c Integration with other CIS
Coastal GEMS is a member of the International Coastal Atlas Network (ICAN).
6d Interoperability High/Medium
Metadata description is particularly rich and complete.
7 Cost/resources
7a Resources
Funding for the development of Coastal GEMS was provided by the Virginia CZM Program through grants from the Office of Ocean and Coastal Resource Management at the National Oceanic and Atmospheric Administration under the Coastal Zone Management Act.
Information sources for the overview analysis of Coastal GEMS:
Coastal Geospatial and Education Mapping System, 2007. Virginia Coastal Zone Management
Program, Virginia Department of Environmental Quality, Richmond, VA 23219.
Web-site consultation for the overview analysis of Coastal GEMS:
http://www.deq.virginia.gov/coastal/coastalgems.html; last visit on 29/03/2011 at 16.30.
http://128.172.160.131/gems2/; last visit on 29/03/2011 at 17.30.
http://ican.science.oregonstate.edu/member_dir; last visit on 14/04/2011 at 9.00.
21807-REL-T006.2 Annex 2 – page 15
Oregon Coastal Atlas
1 General Information
1a Name Oregon Coastal Atlas (OCA)
1b Description
The Oregon Coastal Atlas is a web atlas including background information for different coastal systems, access to interactive mapping, online geospatial analysis tools and direct download access to various planning and natural resource datasets related to coastal zone management.
The heart of the Coastal Atlas is the archive of geospatial data collected over the years by various program partners of the Oregon Ocean-Coastal Management Program. The Atlas includes four main sections:
- The "Search" section of the OCA website, constantly upgraded, allows to Search and download GIS Spatial Data from he above mentioned archive. Data search can be performed by coastal setting (from a list of predefined coastal places), keyword, data source or spatial scale.
- The Coastal Atlas includes an Internet Map Server to create simple personalized maps, visualising and downloading data relevant to the coast. Maps can be exported as pdf format.
- The OCA web site provides also access to a variety of tools (see 6b) created by NOAA, FEMA and others designed to help different types of coastal users answer questions that are common in coastal areas. In addition, a series of Oregon topic-specific coastal tools constructed by Atlas partners are made available.
- Finally OCA provides a “Learn” section, containing simple introductory information for a range of coastal geographic settings (estuaries, sandy shores, rocky shores, ocean areas) and coastal topics (access, hazards, history, processes)
The Oregon Coastal Atlas is a member of the International Coastal Atlas Network (ICAN), an informal group of organizations who have been meeting since 2006 to scope and implement data interoperability approaches to coastal web atlases. The Atlas is funded by the National Science Foundation, NOAA Coastal Services Centre, and U.S. geological service/Federal Geographic Data Centre.
1c Operating entity
OCA is a multi-group project established by a partnership between Oregon Ocean Coastal Management Program, Oregon State University Department of Geosciences and Ecotrust a NGO based in Portland (Oregon).
1d Management structure
1e Contacts
Atlas info mail [email protected]
Dawn Wright; e-mail [email protected] Department of geosciences 104 Wilkinson Hall – Oregon State University, Corvallis, Oregon, USA
Tania Haddad; e-mail: [email protected]

21807-REL-T006.2 Annex 2 – page 16
Oregon Coastal Management Program 800 NE Oregon St. 18, Suite 1145 Portland, OR 97232, USA
OCA site: http://www.coastalatlas.net/
1f Typology Operational
2 Operational context and information content
2a ICZM dimensions
The atlas mainly deals with ICZM dimension of territory and environment. Some information are also available for the economic (e.g. fishery, energy exploitation), social (beach access, bathing waters) and governance (State marine managed areas, dredge material disposal sites, wave energy preliminary permit sites) dimensions.
2b ICZM Sectors
The information contained in the OCA mainly concerns the following themes:
- Physical environment
- Coastal habitats
- Imagery
- Biology
- Management
- Human impact
- Conservation
- Environmental monitoring
- Infrastructures
- Natural resource
- Fisheries, aquaculture& agriculture
- Tourism and recreation
2c Integration
Some limited Integrated information is available through the Map viewer, i.e. landslide hazard areas, shorelines exposure to waves, beach water quality assessment (different coloured flags).
Much more integrated information can be accessed by the tools section (see 6b), in particular: Coastal Inundation Visualization; Coastal Risk and Vulnerability Assessment Tool; Landslide Hazard Maps; HAZUS-MH risk assessment software program for analyzing potential losses from floods, hurricane winds and earthquakes.
2d Spatial scale Sub-national scale - Oregon coasts and sea.
2d Flexibility Oregon Coastal Atlas is specifically designed to deal with the coastal area of Oregon.

21807-REL-T006.2 Annex 2 – page 17
3 ICZM functionalities
3a Knowledge related functionalities
Some knowledge related functionalities are provided by OCA:
- Integration among different information sectors (see point 2c);
- Availability of spatial data; the system allows the downloading of GIS layers through an intuitive search functionality;
- Operation at the different spatial scale; some of the available spatial data can be re-scaled according to the considered spatial extent; thus enabling to visualize more details at a higher scales.
3b Process related functionalities
OCA provides a high variety of data on the marine and costal system organised in an articulated structure; it can therefore support problem understanding and structuring for the Oregon Coastal Areas.
Extended texts and images provide further support to problem understanding. This kind of information is especially available in the Learn Section of the web site which provides introductory information for a range of coastal geographic settings (Estuaries, Sandy Shores, Rocky Shores, Ocean Areas), and coastal topics (Access, Water Quality, Hazards, Processes). Text information is also available in the Map Viewer section, interrogating the displayed layers.
Learn section is also very useful in addressing communication purposes.
4 Users
4a User typology
The Oregon Coastal Atlas aims at being an useful resource for various user typologies involved or interested in Oregon Coastal Zone management, such as:
- Researchers/scientists; - NGOs; - Government/public bodies; - Consultancies; - Coastal/environmental managers; - Decision makers; - General Public.
Specific tools are also developed for three specific groups of users (public, planners and researchers, see 6b).
On average OCA receives about 13,945 visit per month resulting in about 280,745 page views per month (Haddad et al., 2011).
5 Use of the system
5a Accessibility Free access on-line without password to the complete CIS
5b User-friendliness Highly user-friendliness (designing simple, intuitive and informative web interface; complete help user-guide).
5c Interactiveness
No specific participation tools are available, though it was declared that the OCA has been developed also thanks of coastal people by “thoughtful feedback” on atlas prototypes and other interim steps (see information provided in http://www.coastalatlas.net/).
5d Data access Geospatial data and metadata are available from the search tool of

21807-REL-T006.2 Annex 2 – page 18
OCA. Metadata are compliant with FGDC Content Standards for Digital Geospatial Metadata,
Map can be printed/exported from the Internet Map Server.
6 Technological characteristics
6a Used technology
Maps are served using both proprietary software (ArcIMS) and Open Source Minnesota MapServer and a modified version of the ka-Explorer interface of ka-Map. Ka-Map is an open source project that is aimed at providing highly interactive web-mapping interfaces using features available in modern web browsers.
Server operating System: red Hat Linux, windows 2000 SP3
6b Integration with other tools
Within the coastal atlas web site a variety of tools has been assembled. They are created by several entities (e.g. NOAA, FEMA) and by Atlas partners, designed to help different types of coastal users answer questions that are common in coastal areas and specific for Oregon topics.
Tools are thought for public (e.g. link to The Oregon coastal access inventory for an accurate description of all public beach access points in Coastal Oregon), planners (e.g. Coastal Risk and Vulnerability Assessment Tool of NOAA) or researchers (e.g. link to OrCOOS website facilitates the access to of a wide variety of near real-time ocean observing and modelling systems). The full list of tools is provided at http://www.coastalatlas.net/index.php?option=com_content&task=blogsection&id=3&Itemid=4
6c Integration with other CIS
OCA is a member of the International Coastal Atlas Network (ICAN).
6d Interoperability Use of metadata standard FGDC
7 Cost/resources
7a Resources
Information sources for the overview analysis of the Oregon Coastal Atlas:
Haddad E., Bailey R.J and Wright D.J., 2011. Chapter 6 “Oregon, USA”. In Wright D.J, Dwyer
E., Cummins V.[eds.], 2011. Coastal informatics: Web Atlas Design and Implementation.
Information science reference, Hershey, New York, pp. 91-104.
Report of International Coastal Atlas Network Workshop 4: Formalizing the Network, Engaging
the Mediterranean. 16 – 20 November 2009. Adriatico Guest House UNESCO International
Centre for Theoretical Physics, Trieste, Italy.
Web-site consultation for the overview analysis of the Oregon Coastal Atlas:
http://www.coastalatlas.net/, Last visited on 14/04/2011 at 13.45.
21807-REL-T006.2 Annex 2 – page 19
Australian on-line Coastal Information
1 General Information
1a Name OzCoasts – Australian on-line Coastal Information
1b Description
OzCoasts is a freely accessible on-line system with a web-based interface that provides comprehensive information about Australia's coasts (including its estuaries and coastal waterways) to natural resource managers, marine scientists, planners, policy makers and general public. The content of OzCoasts represents the collaborative efforts of more than 100 coastal scientists from a wide range of government agencies and universities.
OzCoasts was originally called OzEstuaries and was developed during the first National Land and Water Resources Audit to incorporate the Australian Estuarine Database and estuarine datasets compiled in the 2000. The content of the web-site was upgraded several times during the years.
Information collected in the web-site is structured in modules that have been designed in different time steps starting from 2000, involving collaboration with various partners. The web-site modules are:
- Climate Change; it provides information and tools to help communicate the risks of sea level rise and other potential impacts of climate change on coastal areas.
- Conceptual Models; it provides information and useful diagrams on conceptual modelling of different ecosystems;
- Coastal Indicators; the coastal indicator knowledge and information system is an information source and education tool for managers, students, researchers and policy makers with an interest in the coastal zone. It consists of a series of fact sheets that provide background scientific information on issues and measures that are commonly used as indicators.
- Habitat Mapping; it provides different links to web-sites with interactive mapping tools dealing with specific areas. Some of them are interactive three dimension models (i.e. Sydney harbour, Woody Island, Keppel Bay and Cockburn Sound);
- Natural Resource Management; it provides online access to key information and data that support Natural Resource Management Reporting. Information on natural resource condition informs policy at national and state levels, and underpins management at regional and local scales;
- Landform and stability maps: it provides detailed coastal landform and landform sensitivity mapping for the entire continental Australian coastline. Related (topography, bathymetry, estuaries, beaches, political boundaries, bio-regions, geology, infrastructure and land uses and population centres) is provided through a Web-GIS interface.
OzCoasts web-site also includes a “Search Data” function to undertake a simple and advance (estuary search, beach search and
21807-REL-T006.2 Annex 2 – page 20
map search) search to obtain data and information.
It is important to highlight that OzCoasts web-site is highly articulated and contains various complex sections. This is a summary description that can only generally illustrate the completeness and complexity of the system.
1c Operating entity Marine and Coastal Environment Group Geoscience Australia
1d Management structure
Marine and Coastal Environment Group Geoscience Australia
1d Contacts
e-mail: [email protected]
OzCoasts Marine & Coastal Environment Group Geoscience Australia GPO Box 378 CANBERRA ACT 2601 Australia
Web-site: http://www.ozcoasts.org.au/about/about.jsp
1e Typology Operational
2 Operational context and information content
2a ICZM dimensions
OzCoasts addresses all the five considered information dimensions. The Coastal Indicators module includes information related to the territory, environmental, social and economic dimensions.
The governance dimension in depth covered by the “Natural Resource Management” module. Indeed, this module allows to query all typologies of Regional plans and/or strategies for each Australian Region.
2b ICZM Sectors
Data, geographic information and coastal indicators included in the various modules of the OzCoasts are related to the following main topics:
- Climate change and scenarios maps (Climate change module);
- Wide set of coastal indicators (Coastal indicators module) organised in the following main categories and subcategories: (i) coastal issues, including the following sub-categories: declining water quality, climate change, habitat/species alterations, economic values and consequences; (ii) biophysical indicators, including the following sub-categories: water quality, sediment quality, habitant extent and quality, biotic indictors; (iii) pressure indicators, including the following sub-categories: agricultural, industrial, urban, catchment condition; (iv) coastal management indicators (i.e. coastal care community groups, marine network participation, marine protected areas);
- Coastal habitats with some links at external web-site providing interactive mapping tools for the coastal habitats (Habitat mapping module);
- Land form and stability maps of the entire Australian coastal area, viewable through a Web-GIS component. The module

21807-REL-T006.2 Annex 2 – page 21
provides a detailed map of the coastal landform types (or geomorphology) of continental Australia and most adjacent islands (excluding the Great Barrier Reef). As a geomorphological map, it represents not just the topography of the coast, elevation and shape of the coastal landforms but it also indicates what the differing coastal landforms are made of (e.g. varying rock types, laterite, coral, sand, mud, boulders, beachrock). The map classifies coastal landforms into differing combinations of form (generalised shape) and constituents (or fabric) which in turn are indicative of the differing natural processes by which each coastal landform has developed.
2c Integration
OzCoasts includes a wide range of integrated information. Some relevant examples are: land forms, stability maps, vulnerability to inundation and different climate change scenarios maps. Furthermore a complete set of coastal indicators propose integrated views and analysis of the coastal area (see 2a).
2d Spatial scale National – Australian coasts.
2e Flexibility The system has been developed in order to be applied specifically to the Australian coastal area.
3 ICZM functionalities
3a Knowledge related functionalities
OzCoasts provides a relevant number of knowledge related functionalities, specifically:
- Integration among different information sectors (see point 2c);
- Availability of spatial data; some information regarding the coastal habitat are downloadable in shape-files format. Other information are available through the link to the original documents;
- Inclusion of a wide set of indicators focusing on coastal management, issues (see point 2b);
- Inside the OzCoasts are provided a lot of coastal indicators on different ICZM dimensions and sectors (see 2a and 2c);
- Inclusion of various information related to coastal vulnerability to climate change. In particular a specific module is entirely dedicated to climate change, including detailed maps of sea level rise vulnerability and other related information (for example in relation to adaptation strategies to climate change or elevation data and modelling). The indicator set contains a specific sub-category dedicated to climate change, including the following indicators: global warming, ocean acidification, saline intrusion, sea level rise, vector borne disease.
3b Process related functionalities
Process related functionalities are also widely covered by OzCoasts, specifically:
- OzCoasts offers a wide range of conceptual models, in particular: beach geomorphic models, estuarine biophysical models, stressor models process/threat models. This module also enables user to build its own conceptual models. Problem understanding and conceptual modelling is also supported by the wide set of indicators and the module focusing on coastal landform and stability maps. Furthermore the system will soon

21807-REL-T006.2 Annex 2 – page 22
include a Coastal Eutrophication Risk Assessment Tool.
- The coastal stakeholder link search (within the Search Data function) enables to search stakeholders involved in coastal management according to spatial criteria and governance levels. This tool can actually support stakeholder cooperation within the ICZM process;
- Similarly to the previous tool, the regional plan and strategies link search enables to search planning documents according to spatial and typology criteria (e.g. coastal action plan, estuarine management plan, river plan, coastal management plan, wetland management plan, coastal strategies, etc.). This tool can properly support ICZ planning and management.
- Scenario building is provided for coastal vulnerability to sea level rise; in particular detailed inundation maps are available for some coastal areas at the sub-national and local scale.
4 Users
4a User typology
OzCoasts contains a wide variety of information, thus potentially addressing more users:
- Policy and decision-makers, may be more interested in summary information such as those provided by coastal indicators or related to vulnerability maps to sea level rise;
- Same information can be also very useful for coastal planners and/or managers, that can be also interested in information on plans and strategies related to the coastal zones as well as in pre-defined and customised conceptual models;
- Experts can find in the system specific data related to coastal habitats and spatial data related to landform and stability maps;
- Fact sheets on indicators can be also useful to improve civil society awareness on Australian coastal problems.
5 Use of the system
5a Accessibility Free access on-line to all Ozcoasts contents and its functionalities.
5b User-friendliness
Medium user-friendly.
OzCoasts is structured on functional modules (those described in point 1b); this actually helps significantly the use of the system. However, also due to the complexity of the system use of some of the modules is not totally intuitive and requires a high number of steps.
5c Interactiveness
Two participation tools are included in the OzCoasts system:
- A tool for the creation of customised conceptual models of coastal habitats and processes;
- The coastal stakeholder link search (within the Search Data function) enabling users to search stakeholders involved in coastal management according to spatial and governance criteria. This tool can actually support stakeholder cooperation within the ICZM process.
5d Data access This field is not properly applicable to OzCoasts

21807-REL-T006.2 Annex 2 – page 23
6 Technological characteristics
6a Used technology OzCoasts is a web-site developed with java scripts languages and standards.
6b Integration with other tools
No integration with other tools. OzCoasts is actually a systems formed by various tools (or modules).
6c Integration with other CIS
No specific integration with other CIS. OzCoasts is actually an on-line system including a high number of link to other coastal systems and web-site.
6d Interoperability Not applicable
7 Cost/resources
7a Resources
Web-site consultation for the overview analysis of OzCoasts:
http://www.ozcoasts.org.au/; last visit on 28/03/2011 at 10.30

21807-REL-T006.2 Annex 3
Annex 3 – Results of the in-depth analysis

21807-REL-T006.2 Annex 3 - page 1
HELCOM Map and Data Service
General Information
One of the main roles of Helsinki Commission (HELCOM) is to act as regional environmental
focal point, providing access to a wide range of information on pressures, state and trends
characterising the coastal and marine environment of the Baltic Sea.
During recent years, HELCOM has been increasingly using GIS solutions to analyse data and
to visualise complex scientific information on both static maps and interactive internet based
maps.
The HELCOM Map and Data Service (MDS) aims to make environmental information
accessible for stakeholders and for general public, providing data on efficiency of measures
undertaken to protect the Baltic Sea, information about monitoring activities and regional
preparedness for accident response. HELCOM MDS gives particular attention to the issue of
nutrients and hazardous substances loads to the Baltic Sea and their effect on the marine
ecosystem.
HELCOM MDS is formally operated by the Secretariat of the Helsinki Commission (Baltic
Marine Environment Protection Commission). A contractual agreement has been set by
HELCOM with centres providing data to the system.
The HELCOM MDS current on-line is a recently updated version, which has been made
possible by the work of the HELCOM project Development of HELCOM Data and Geographic
Information System which is funded by the Nordic Council of Minsters during 2009-2010.
HELCOM MDS is configured as a Web-GIS visualising and making accessible Baltic Sea
related datasets. Former GIS map services (e.g. MARIS; Nutrient GIS; Marine spatial GIS;
Coastal fish monitoring; COMBINE monitoring GIS and Data delivery service) have been joint
into one single service, making it easier to combine and analyse data.
From the web site of HELCOM MDS, http://maps.helcom.fi/website/mapservice/index.html,
(Figure A3- 1), users are able to:
visualize, analyse and search Baltic Sea environmental data;
draw and save or print customized maps;
download ESRI shape files;
access layers in OGC WMS standard protocol.
For any feedback, questions or assistance, data administrator at HELCOM Secretariat
(Katajanokanlaituri 6 B, FI-00170 Helsinki Finland), Joni Kairaranta can be contacted at
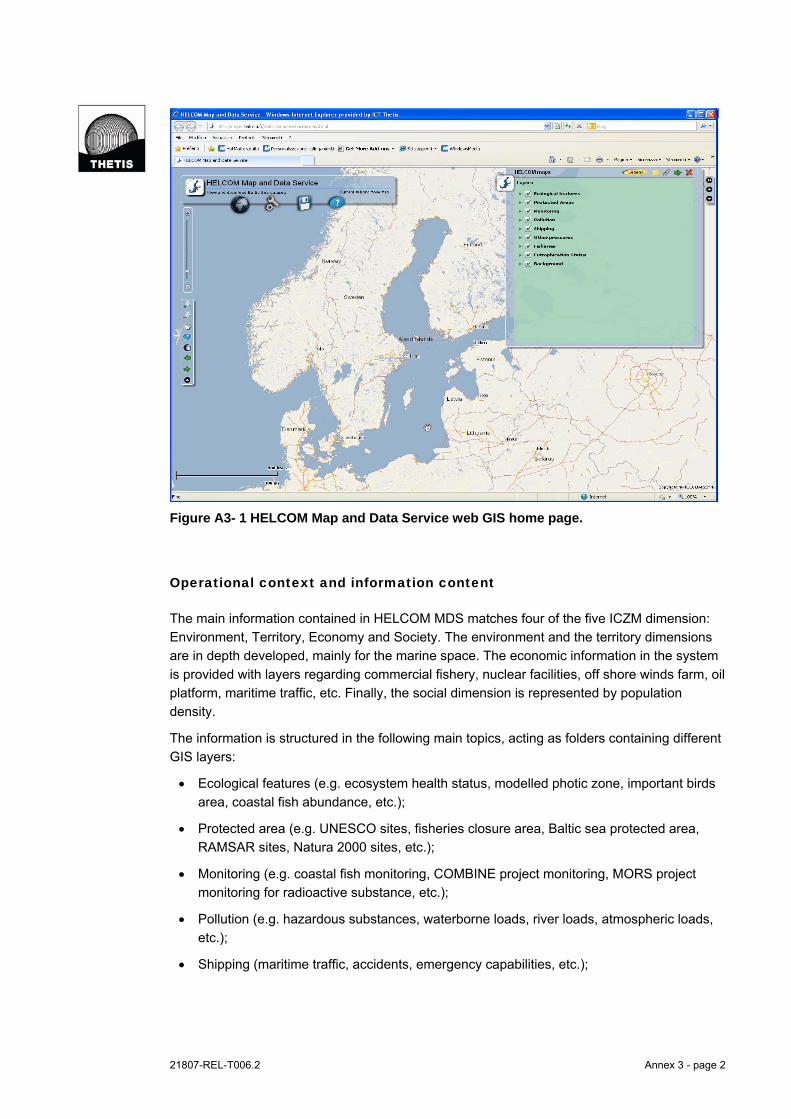
21807-REL-T006.2 Annex 3 - page 2
Figure A3- 1 HELCOM Map and Data Service web GIS home page.
Operational context and information content
The main information contained in HELCOM MDS matches four of the five ICZM dimension:
Environment, Territory, Economy and Society. The environment and the territory dimensions
are in depth developed, mainly for the marine space. The economic information in the system
is provided with layers regarding commercial fishery, nuclear facilities, off shore winds farm, oil
platform, maritime traffic, etc. Finally, the social dimension is represented by population
density.
The information is structured in the following main topics, acting as folders containing different
GIS layers:
Ecological features (e.g. ecosystem health status, modelled photic zone, important birds
area, coastal fish abundance, etc.);
Protected area (e.g. UNESCO sites, fisheries closure area, Baltic sea protected area,
RAMSAR sites, Natura 2000 sites, etc.);
Monitoring (e.g. coastal fish monitoring, COMBINE project monitoring, MORS project
monitoring for radioactive substance, etc.);
Pollution (e.g. hazardous substances, waterborne loads, river loads, atmospheric loads,
etc.);
Shipping (maritime traffic, accidents, emergency capabilities, etc.);
21807-REL-T006.2 Annex 3 - page 3
Pressures (e.g. Baltic Sea Pressure Index, Baltic Sea Impacts Index, coastal defence
structures, etc.);
Fisheries (e.g. total commercial fishery, etc.);
Eutrophication status (e.g. nutrients, chlorophyll, benthic invertebrate communities)
Background layer information related to the marine and terrestrial environment (e.g.
Corine land cover, population density in the Baltic basin, etc.).
Data come from different providers, mainly the HELCOM secretariat, the Finnish
Environmental Institute (SYKE), the Radiation and Nuclear Safety Authority of Finland (STUK),
the European Monitoring and Evaluation Programme (EMEP), the International Council for
exploration of the Sea (ICES).
The HELCOM MDS provides various examples of integration among data related to different
sectors and information dimensions (Table A3- 1). They mainly concern the following 3
thematic issues:
the integrated assessment of the environmental status of coastal areas and open sea
(ecological, chemical, biological and eutrophication state);
the overall assessment of pressure and impacts from anthropogenic sources;
shore sensitivity to oil spill.
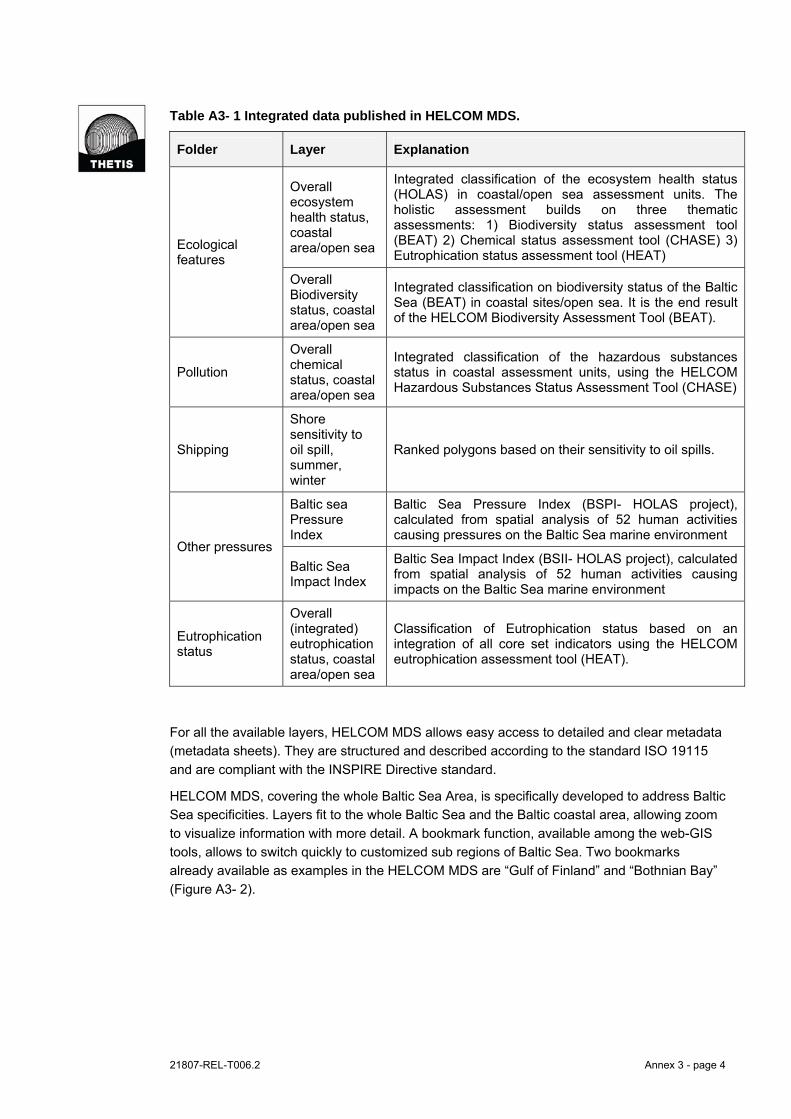
21807-REL-T006.2 Annex 3 - page 4
Table A3- 1 Integrated data published in HELCOM MDS.
Folder Layer Explanation
Ecological features
Overall ecosystem health status, coastal area/open sea
Integrated classification of the ecosystem health status (HOLAS) in coastal/open sea assessment units. The holistic assessment builds on three thematic assessments: 1) Biodiversity status assessment tool (BEAT) 2) Chemical status assessment tool (CHASE) 3) Eutrophication status assessment tool (HEAT)
Overall Biodiversity status, coastal area/open sea
Integrated classification on biodiversity status of the Baltic Sea (BEAT) in coastal sites/open sea. It is the end result of the HELCOM Biodiversity Assessment Tool (BEAT).
Pollution
Overall chemical status, coastal area/open sea
Integrated classification of the hazardous substances status in coastal assessment units, using the HELCOM Hazardous Substances Status Assessment Tool (CHASE)
Shipping
Shore sensitivity to oil spill, summer, winter
Ranked polygons based on their sensitivity to oil spills.
Other pressures
Baltic sea Pressure Index
Baltic Sea Pressure Index (BSPI- HOLAS project), calculated from spatial analysis of 52 human activities causing pressures on the Baltic Sea marine environment
Baltic Sea Impact Index
Baltic Sea Impact Index (BSII- HOLAS project), calculated from spatial analysis of 52 human activities causing impacts on the Baltic Sea marine environment
Eutrophication status
Overall (integrated) eutrophication status, coastal area/open sea
Classification of Eutrophication status based on an integration of all core set indicators using the HELCOM eutrophication assessment tool (HEAT).
For all the available layers, HELCOM MDS allows easy access to detailed and clear metadata
(metadata sheets). They are structured and described according to the standard ISO 19115
and are compliant with the INSPIRE Directive standard.
HELCOM MDS, covering the whole Baltic Sea Area, is specifically developed to address Baltic
Sea specificities. Layers fit to the whole Baltic Sea and the Baltic coastal area, allowing zoom
to visualize information with more detail. A bookmark function, available among the web-GIS
tools, allows to switch quickly to customized sub regions of Baltic Sea. Two bookmarks
already available as examples in the HELCOM MDS are “Gulf of Finland” and “Bothnian Bay”
(Figure A3- 2).
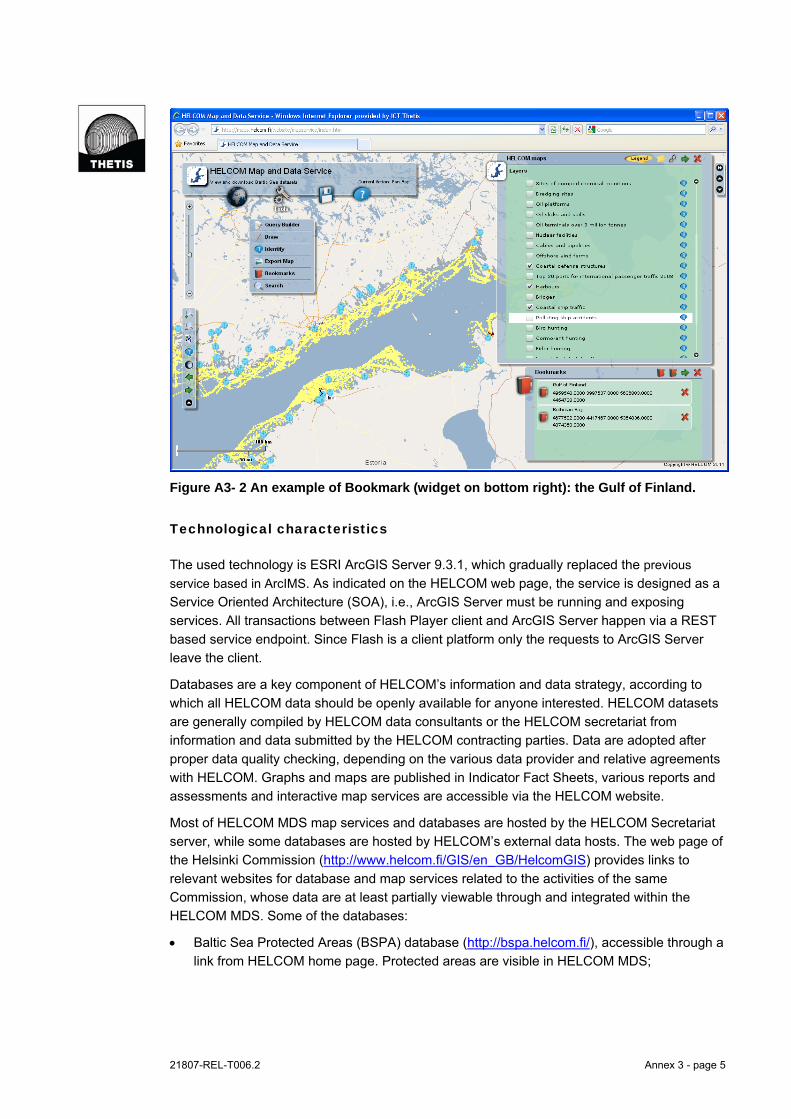
21807-REL-T006.2 Annex 3 - page 5
Figure A3- 2 An example of Bookmark (widget on bottom right): the Gulf of Finland.
Technological characteristics
The used technology is ESRI ArcGIS Server 9.3.1, which gradually replaced the previous
service based in ArcIMS. As indicated on the HELCOM web page, the service is designed as a
Service Oriented Architecture (SOA), i.e., ArcGIS Server must be running and exposing
services. All transactions between Flash Player client and ArcGIS Server happen via a REST
based service endpoint. Since Flash is a client platform only the requests to ArcGIS Server
leave the client.
Databases are a key component of HELCOM’s information and data strategy, according to
which all HELCOM data should be openly available for anyone interested. HELCOM datasets
are generally compiled by HELCOM data consultants or the HELCOM secretariat from
information and data submitted by the HELCOM contracting parties. Data are adopted after
proper data quality checking, depending on the various data provider and relative agreements
with HELCOM. Graphs and maps are published in Indicator Fact Sheets, various reports and
assessments and interactive map services are accessible via the HELCOM website.
Most of HELCOM MDS map services and databases are hosted by the HELCOM Secretariat
server, while some databases are hosted by HELCOM’s external data hosts. The web page of
the Helsinki Commission (http://www.helcom.fi/GIS/en_GB/HelcomGIS) provides links to
relevant websites for database and map services related to the activities of the same
Commission, whose data are at least partially viewable through and integrated within the
HELCOM MDS. Some of the databases:
Baltic Sea Protected Areas (BSPA) database (http://bspa.helcom.fi/), accessible through a
link from HELCOM home page. Protected areas are visible in HELCOM MDS;

21807-REL-T006.2 Annex 3 - page 6
COMBINE monitoring data, downloadable from ICES Oceanographic database and
viewable and downloadable in the ICES EcoSystemData map service
(http://ecosystemdata.ices.dk/map/index.aspx),
HELCOM MORS; database of the MORS project dealing with monitoring of radioactive
substances in water, sediments, and biota downloaded via International Atomic Energy
Agency's Marine Information System (http://maris.iaea.org). In the HELCOM MDS only
monitoring stations are shown;
Data and metadata produced by the EU funded project BALANCE (Baltic Sea
Management – Nature Conservation and Sustainable Development of the Ecosystem
through Spatial Planning, http://www.helcom.fi/GIS/BalanceData/en_GB/main). Part of the
BALANCE datasets can be visualized and downloaded in the HELCOM Map and Data
Service.
The diagram of the current architecture of the HELCOM data and GIS system is shown in the
Figure A3- 3. “Web map services”, “Metadata portal” and “Data delivery services” are provided
in the new version of the MDS as tools of the same web GIS application.
STUK: Radiation and Nuclear Safety Authority of Finland; ICES: International Council for the
Exploration of the Sea; BSPA: Baltic Sea Protected Areas database; PLC: Pollution Load
Compilation database; MORS: Monitoring of Radioactive Substance database
Figure A3- 3 Diagram of the current architecture of the HELCOM data and GIS system.

21807-REL-T006.2 Annex 3 - page 7
The interoperability of the system is high, as specific tools for static map export, download of
shapefiles and connection to layers via WMS are implemented (Figure A3- 4. One of the next
challenges of HELCOM is to move to an OGC - WFS (web feature service) providing an
interface allowing requests for geographical features across the web using platform-
independent calls. Moreover, metadata are structured and described according to the
standard ISO 19115, being therefore complying with the INSPIRE Directive.
Figure A3- 4 Tools for data delivery of HELCOM MDS.
ICZM related functionalities
HELCOM MDS provides various functionalities supporting the ICZM process. Knowledge
related functionalities are various and powerful: extended information contents structured by
thematic groups are easily consultable with an user friendly web-GIS.
The high interactivity of the systems is ensured by different tools available in the web-GIS
application, helping users to find specific information and to combine these in integrated
custom maps. The tools (Figure A3- 5) allow to:
Formulate a Query;
Draw lines and text ;
Interrogate the map for point information;
Export the map (JPG, PNG, SVG formats);
Create bookmarks;
Search layers, by graphical selection or by text, viewing results in detailed table.
As indicated in the previous section the system allows downloading of GIS layers in shape file
format and via WMS (all layers are available as WMS on:
http://maps.helcom.fi/ArcGIS/services/DataDelivery/MapServer/WMSServer).

21807-REL-T006.2 Annex 3 - page 8
Figure A3- 5 Tools for interactivity of HELCOM MDS.
The articulated structure of data organisation in different thematic folders and the availability of
a high variety of data on the marine and costal system can efficiently support problem
understanding and structuring in Baltic Sea management.
Moreover, the presence of several integrated data, as those ones synthetically describing the
environmental status of Baltic Sea, surely help users to better understand environmental
problems and processes characterising the region.
Some multi-time information is also available, allowing users to explore changes in some
parameters over time. This is the case for example for datasets on maritime traffic (in the
shipping folder), as the number of ships equipped with Automatic Identification Systems (AIS)
crossing specific passage lines in the Baltic Sea during different period (from 2007 to 2010).
Furthermore the monitoring folder shows the evolution of the monitoring network from 2005 to
2007.
Some of the information provided matches some of the ICZM indicators, as detailed in the
followings:
The amount of oil pollution;
The amount of nutrients in coastal waters;
The volume of port traffic;
Fish stocks and fish landings (catches/landings)
The area of sea protected by statutory designations, including:
– Baltic sea fishery closure: the area closed for fishing has been drawn according to EC
Council Regulation No 2187/2005 of 21 December 2005 for the conservation of fishery;
– Cod fishery closures, according to the EC Council Regulation (EC) No 1098/2007 of
18 September 2007 establishing a multiannual plan for the cod stocks in the Baltic
Sea and the fisheries exploiting those stocks;

21807-REL-T006.2 Annex 3 - page 9
– Baltic sea protected area: it includes the borders of designated Baltic Sea Protected
Areas, according to the HELCOM Recommendation 15/5 (1994);
– Ramsar sites;
– Natura 2000 sites.
More in general the system is intended to provide knowledge-based support to the activities of
the Helsinki Commission related to the integrated planning and management of the marine
and coastal environment of the Baltic Sea. HELCOM MDS, acting as data integrator, is indeed
a fundamental information system for Baltic Sea management and planning.
System development and management
One of the main challenge of The HELCOM MDS is to constitute a data integrator from
different data sources. Data comes from different databases and different data providers and
therefore one of the main difficulties encountered by the system developers is related to the
heterogeneity of the available data, each of them having different format, different quality level
and different or lacking metadata. The process of data check and data validation, carried out
by the HELCOM secretariat and its data consultants, is therefore different depending on the
different data providers and on the established agreement with them.
The data updating is periodically performed to maintain the Map and Data Service, depending
on the availability of relevant new data as well as regular reporting requirements under the
HELCOM framework (e.g. shipping accidents, illegal discharges, pollution loads etc).
The current application of the ArcGIS Server based HELCOM MDS developed during 2009-
2010, is the result of a long work starting about 5 years ago with:
A first application of MARIS (2005-2007), developed at SYKE (the Finnish Environmental
Institute), only hosted by HELCOM.
A following ArcIMS based systems, developed at HELCOM (2007-2009). The work
involved one person working part time with map services with additional help from 2-3
person for layer preparation and optimization. Additionally, the HELCOM GIS system was
developed with expert input provided on a project basis.
The now available application and the current maintaining and updating of HELCOM Map and
data service for 2011 is carried out by one person working full time with data administration
issues. Input in layer preparation and optimization is also provided by ~2-3 persons as well as
various HELCOM projects.
The target users of the HELCOM MDS are:
Decision-makers, at the Regional Sea level;
Coastal planners and/or managers, at the Regional Sea level;
Specialised and expert users;
Civil society, for awareness and communication issues related to the sustainable use of
the Baltic Sea;
Teachers and students for education programmes.
All the information published in HELCOM MDS is public, without any restriction or privilege for
different users.

21807-REL-T006.2 Annex 3 - page 10
HELCOM MDS includes a feedback tool to send suggestions in order to improve system’s
functionalities and contents. HELCOM is also considering the use of so called Web 2.0
communication channels such us Twitter, Flickr, LinkedIn or Facebook, considering also that
one of the principles of the Data and Information Strategy of the Helsinki Commission is to
facilitate the access of the environmental information to the general public.
Experience with the implementation
This scientific information contained in HELCOM MDS is the basis for many HELCOM
assessments, which in turn provide direct input to policy making.
In March 2009 a survey was prepared by the HELCOM Secretariat targeted to all existing as
well as potential future users of the HELCOM GIS and Data Services. The aim of the
questionnaire was to asses the quality, usefulness and user-friendliness of the current
services in order to identify methods to enhance it.
HELCOM Secretariat received a total of 16 responses out of 230 users and potential users
whom the questionnaire was sent to. This 7% response rate was considered normal for this
kind of e-mail satisfaction survey questionnaire. The distribution of the responses indicates
Sweden, Finland and Poland in the first position, followed by Russia, Estonia and Latvia
(Figure A3- 6). These countries are therefore likely to be the main provenance of the main
web-GIS users.
Figure A3- 6 Spatial distribution of HELCOM GIS and data survey (% responses).
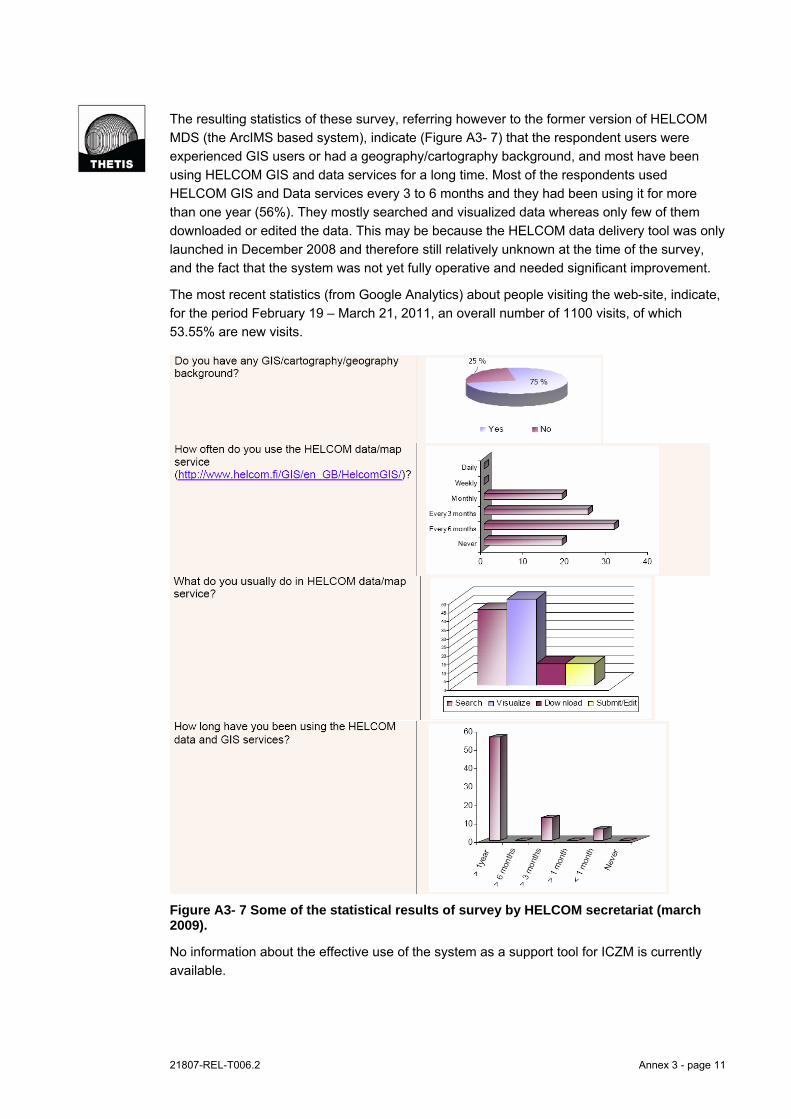
21807-REL-T006.2 Annex 3 - page 11
The resulting statistics of these survey, referring however to the former version of HELCOM
MDS (the ArcIMS based system), indicate (Figure A3- 7) that the respondent users were
experienced GIS users or had a geography/cartography background, and most have been
using HELCOM GIS and data services for a long time. Most of the respondents used
HELCOM GIS and Data services every 3 to 6 months and they had been using it for more
than one year (56%). They mostly searched and visualized data whereas only few of them
downloaded or edited the data. This may be because the HELCOM data delivery tool was only
launched in December 2008 and therefore still relatively unknown at the time of the survey,
and the fact that the system was not yet fully operative and needed significant improvement.
The most recent statistics (from Google Analytics) about people visiting the web-site, indicate,
for the period February 19 – March 21, 2011, an overall number of 1100 visits, of which
53.55% are new visits.
Figure A3- 7 Some of the statistical results of survey by HELCOM secretariat (march 2009).
No information about the effective use of the system as a support tool for ICZM is currently
available.
21807-REL-T006.2 Annex 3 - page 12
Concluding remarks
HELCOM Map and Data Service is the result of a successful project of data integration
combined with top of the range technological solutions for data publication and sharing.
The focus of the service, as defined by Helsinki Commission itself, is to provide a tool to
support environmental planning of the Baltic Sea, which is a fundamental aspect of ICZM.
On the other hand, information on coastal characteristics and dynamics is not very detailed,
and actually the system is poorly linked with coastal plans and policies.

21807-REL-T006.2 Annex 3 - page 13
Coastal Information System Oder Estuary
General Information
The Coastal Information System (CIS) Oder estuary is a web portal collecting scientific
information (data, projects results, publications, etc.) about the Oder estuary region.
The Oder estuary region forms the border between Germany and Poland and is located at the
south-western side of the Baltic Sea. This estuary region (also known as Oder coastal zone)
covers an area of 30-60 km landwards from the sea-shore as well as the Pomeranian Bay (up
to 12 nm seawards from the outer coastline). The land area (about 7.000 km²) includes two
administrative districts on the German side (Ostvorpommern and Uecker-Randow) as well as
three administrative districts (Goleniowski, Kamienski, Policki) and two urban districts
(Szczecin and Świnoujście) on the Polish side.
The CIS of Oder Estuary is part of the ICZM-Oder project “Research for an Integrated Coastal
Zone Management in the German Oder Estuary Region”, fully described in the Web portal at
this specific address: http://www.ikzm-oder.de/en/projekt-ikzm-oder.html.
The ICZM-ODER project, started in 2004 and funded by the Federal Ministry for Education
and Research (BMBF), has been dealing mainly with the following key topics:
- Dialogues and regional participation;
- Internet supported tools for ICZM (e.g. the CIS Oder Estuary);
- Spatially integrated regional ICZM;
- Coastal waters in transition (climate change);
- National strategy, training and international integration.
One major task of the ICZM-ODER was the development of the Coastal Information System
Oder Estuary in the German/Polish cross-border region, aiming at:
- serving as a container for data information, project results, publications etc.;
- giving access to this data and information to a broad public;
- supporting integrated management and planning processes;
- serving as a transferable model for other regions. The aim was to develop a system, that
is spatially expandable and transferable to other regions;
- establishing a German-Polish dialogue concerning coastal areas;
- setting up concrete tools in order to build a basis for a sustainable development for the
Oder estuary.
The CIS Oder Estuary Web portal (http://www.ikzm-oder.de/en/startseite.html, Figure A3- 8)
also links the web GIS tool, called GIS-ICZM, which allows free access to regional spatial
information (http://gis.eucc-d.de/ikzm). The system includes multi-disciplinary spatial data
related to the transnational coastal area of Oder. Because of the cross-border character of the
Oder estuary region, the information system is translated in German, Polish and English in
order to promote the international integration of the project.
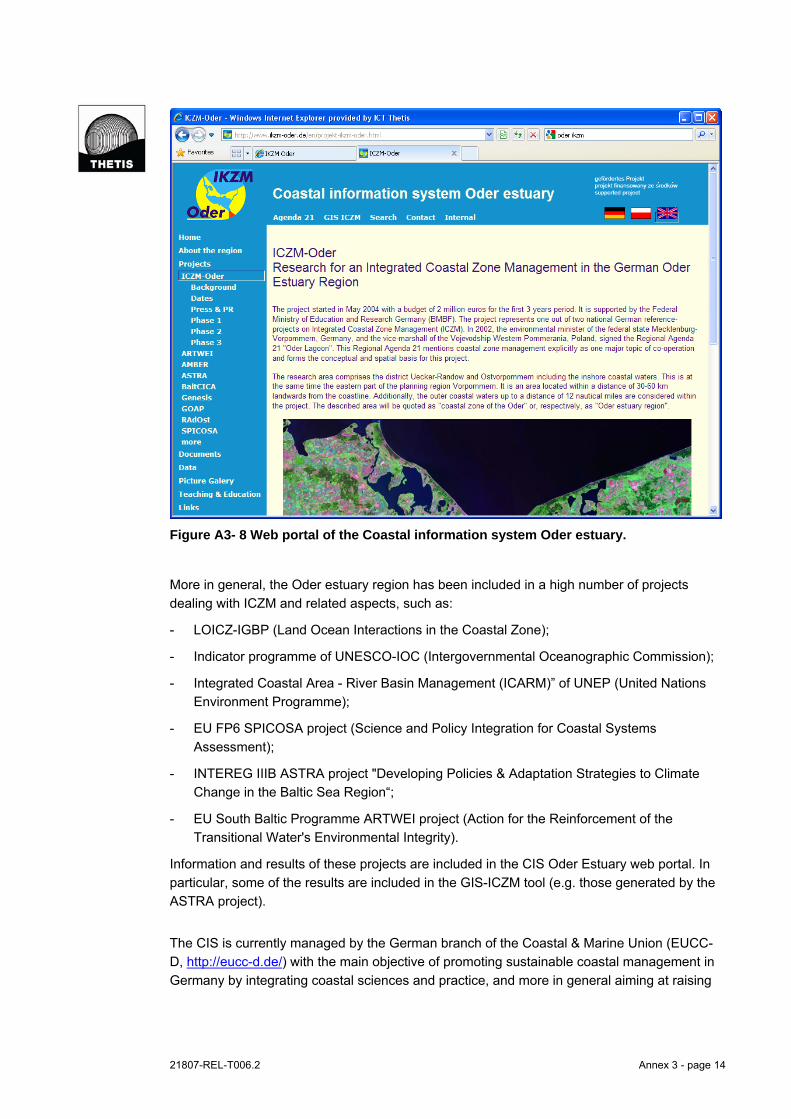
21807-REL-T006.2 Annex 3 - page 14
Figure A3- 8 Web portal of the Coastal information system Oder estuary.
More in general, the Oder estuary region has been included in a high number of projects
dealing with ICZM and related aspects, such as:
- LOICZ-IGBP (Land Ocean Interactions in the Coastal Zone);
- Indicator programme of UNESCO-IOC (Intergovernmental Oceanographic Commission);
- Integrated Coastal Area - River Basin Management (ICARM)” of UNEP (United Nations
Environment Programme);
- EU FP6 SPICOSA project (Science and Policy Integration for Coastal Systems
Assessment);
- INTEREG IIIB ASTRA project "Developing Policies & Adaptation Strategies to Climate
Change in the Baltic Sea Region“;
- EU South Baltic Programme ARTWEI project (Action for the Reinforcement of the
Transitional Water's Environmental Integrity).
Information and results of these projects are included in the CIS Oder Estuary web portal. In
particular, some of the results are included in the GIS-ICZM tool (e.g. those generated by the
ASTRA project).
The CIS is currently managed by the German branch of the Coastal & Marine Union (EUCC-
D, http://eucc-d.de/) with the main objective of promoting sustainable coastal management in
Germany by integrating coastal sciences and practice, and more in general aiming at raising
21807-REL-T006.2 Annex 3 - page 15
international awareness of German initiatives of ICZM. The point of contact at EUCC-D is
Nardine Stybel, e-mail: [email protected]; [email protected], EUCC
Germany, Baltic Sea Research Institute.
Operational context and information content
The GIS-ICZM addresses the ICZM dimensions: territory (e.g. in relation to geographic
descriptors, administrative boundaries, infrastructure, coastal protection, etc.), environment
(biological reserve, water pollution, results of the eutrophication model, harmful substance in
fish and mussels), social and economic dimensions (churches, hospitals, museum, tourism
facilitates, pipeline, wind-farms and traffic features). About the governance ICZM dimension,
only the layers about coastal protection can be traced back to this dimension, as no
information about plans or policies if provided.
More in detail, the GIS-ICZM contains a wide variety and as high number of spatial
information; concerning the following sectors:
– Bathymetry;
– Sediment characteristics;
– Shoreline typology and coastal structures (dunes, dikes, piers, etc.);
– Coastal protection;
– Flooding zones according to different levels of flood risk;
– Biological aspects (benthic species, feeding area for birds, fish species);
– Biological reserves (national protected areas and international reserves, etc.);
– Seasonal sensitivity to oil spills for the coast and for the marine area;
– Coastal water typology according to the Water Framework Directive;
– Water eutrophication (i.e. concentration of nitrate and phosphate);
– Results of the eutrophication model in different years;
– Water and sediment chemical pollution;
– Harmful substance in fish and mussels;
– Naval and terrestrial traffic features;
– Tourism facilities;
– Civil features (Church, hospital, museum etc.);
– Offshore wind farm;
– Pipes and cables;
– Administrative boundaries;
– Mining area; i.e. areas for the extraction of sediments.
The CIS provides also integrated analysis, including in particular layers related to:
– Flooding zones according to four different levels of flood risk;

21807-REL-T006.2 Annex 3 - page 16
– Sensitivity of the coastal and marine areas to oil spills, determined by the Precaution
Pollution Control (VPS) Model.
Metadata are managed with a dedicated web application with search and export tools (Figure
A3- 9). Metadata of a specific GIS layer can be reached from a link in its attribute table.
Figure A3- 9 Metadata manager.
Technological characteristics
The system has been developed with MapServer technology, in collaboration with the
University of Rostock. MapServer is an Open Source platform for publishing spatial data and
interactive mapping applications to the web. A former release of the GIS ICZM was developed
through the licensed ESRI software, and then abandoned due to economical and technical
issues.
The system, even if not properly integrated with other tools, includes the outcomes of an
eutrophication model, showing the modelled concentration of nutrients in different seasons
and years in the marine coastal area (Figure A3- 10 as illustrative example).

21807-REL-T006.2 Annex 3 - page 17
Figure A3- 10 Example of an outcome of the Oder Water Model: map of winter nitrate concentration.
As an example of integration with other CISs, the link from the web portal to the GIS ICZM for
the federal state of Mecklenburg - Vorpommern (MV) has to be mentioned. As indicated in the
web portal, the GIS ICZM MV acts as an umbrella system for the GIS ICZM of the Oder
Estuary, also aiming to establish a connection to the systems of neighbouring regions: i.e. the
federal state Schleswig-Holstein and those in Denmark and Poland.
The extensive link page of the web portal is accessible at http://www.ikzm-
oder.de/en/links.php.
ICZM related functionalities
The CIS includes several ICZM related functionalities, concerning both knowledge and
processes. As for knowledge related functionalities, the GIS-ICZM is provided with integrated
information, information supporting the analysis of coastal vulnerability to climate change and
scalability.
An interesting example of integrated data available is represented by the layers on flooding
zones (see Figure A3- 11), deriving from the ASTRA project "Developing Policies &
Adaptation Strategies to Climate Change in the Baltic Sea Region", aiming at estimating
regional effects of global climate change in the Baltic Sea Region and developing strategies to
face climate change. The ASTRA project analysed 12 case studies, including the significant
case of Oder estuary.
The maps of flooding areas, together with other information related to the ASTRA project,
support the knowledge about Oder coastal vulnerability to climate change. The web portal is
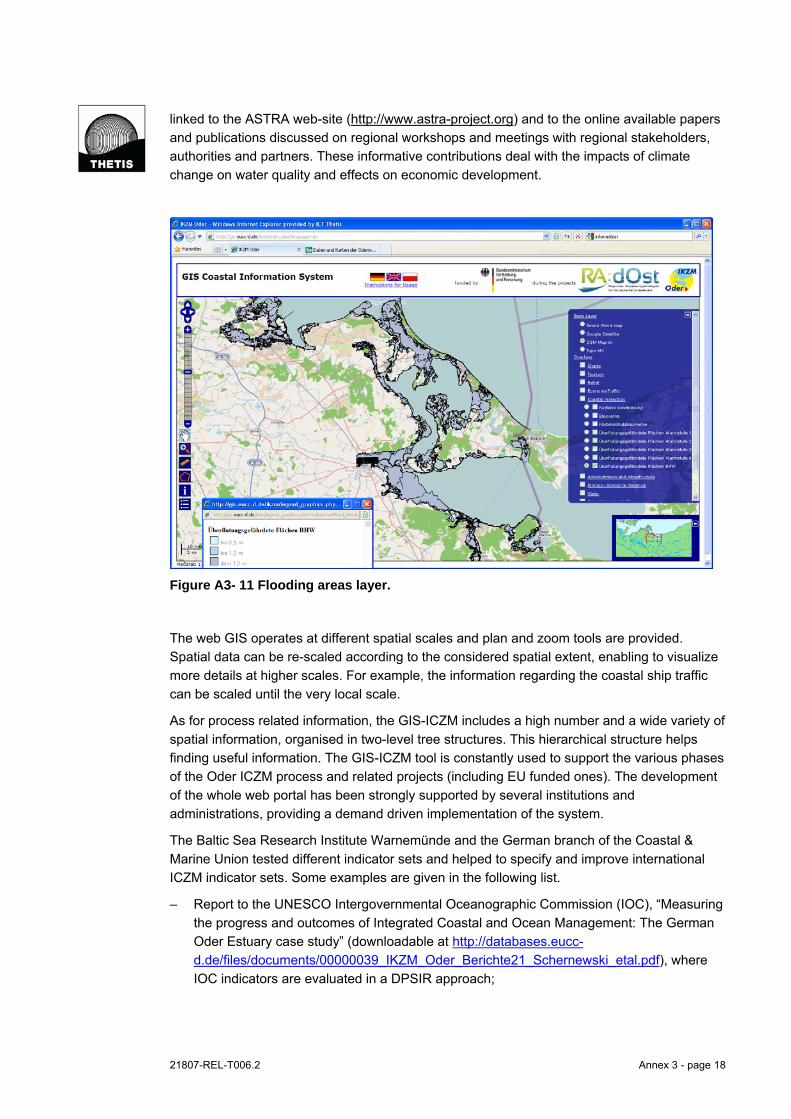
21807-REL-T006.2 Annex 3 - page 18
linked to the ASTRA web-site (http://www.astra-project.org) and to the online available papers
and publications discussed on regional workshops and meetings with regional stakeholders,
authorities and partners. These informative contributions deal with the impacts of climate
change on water quality and effects on economic development.
Figure A3- 11 Flooding areas layer.
The web GIS operates at different spatial scales and plan and zoom tools are provided.
Spatial data can be re-scaled according to the considered spatial extent, enabling to visualize
more details at higher scales. For example, the information regarding the coastal ship traffic
can be scaled until the very local scale.
As for process related information, the GIS-ICZM includes a high number and a wide variety of
spatial information, organised in two-level tree structures. This hierarchical structure helps
finding useful information. The GIS-ICZM tool is constantly used to support the various phases
of the Oder ICZM process and related projects (including EU funded ones). The development
of the whole web portal has been strongly supported by several institutions and
administrations, providing a demand driven implementation of the system.
The Baltic Sea Research Institute Warnemünde and the German branch of the Coastal &
Marine Union tested different indicator sets and helped to specify and improve international
ICZM indicator sets. Some examples are given in the following list.
– Report to the UNESCO Intergovernmental Oceanographic Commission (IOC), “Measuring
the progress and outcomes of Integrated Coastal and Ocean Management: The German
Oder Estuary case study” (downloadable at http://databases.eucc-
d.de/files/documents/00000039_IKZM_Oder_Berichte21_Schernewski_etal.pdf), where
IOC indicators are evaluated in a DPSIR approach;
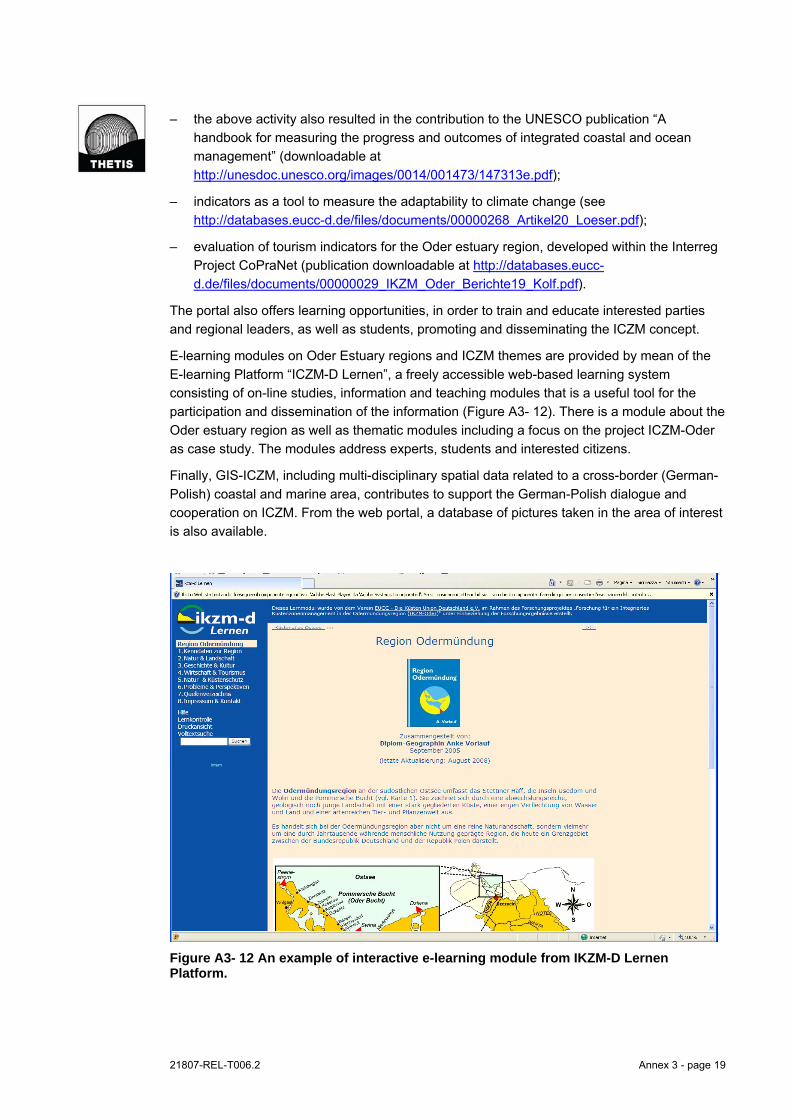
21807-REL-T006.2 Annex 3 - page 19
– the above activity also resulted in the contribution to the UNESCO publication “A
handbook for measuring the progress and outcomes of integrated coastal and ocean
management” (downloadable at
http://unesdoc.unesco.org/images/0014/001473/147313e.pdf);
– indicators as a tool to measure the adaptability to climate change (see
http://databases.eucc-d.de/files/documents/00000268_Artikel20_Loeser.pdf);
– evaluation of tourism indicators for the Oder estuary region, developed within the Interreg
Project CoPraNet (publication downloadable at http://databases.eucc-
d.de/files/documents/00000029_IKZM_Oder_Berichte19_Kolf.pdf).
The portal also offers learning opportunities, in order to train and educate interested parties
and regional leaders, as well as students, promoting and disseminating the ICZM concept.
E-learning modules on Oder Estuary regions and ICZM themes are provided by mean of the
E-learning Platform “ICZM-D Lernen”, a freely accessible web-based learning system
consisting of on-line studies, information and teaching modules that is a useful tool for the
participation and dissemination of the information (Figure A3- 12). There is a module about the
Oder estuary region as well as thematic modules including a focus on the project ICZM-Oder
as case study. The modules address experts, students and interested citizens.
Finally, GIS-ICZM, including multi-disciplinary spatial data related to a cross-border (German-
Polish) coastal and marine area, contributes to support the German-Polish dialogue and
cooperation on ICZM. From the web portal, a database of pictures taken in the area of interest
is also available.
Figure A3- 12 An example of interactive e-learning module from IKZM-D Lernen Platform.

21807-REL-T006.2 Annex 3 - page 20
System development and management
The whole project ICZM Oder started in May 2004 with a budget of 2 million of Euros for the
first 3 years period, supported by the Federal Ministry of Education and Research Germany
(BMBF). After this successful first three years period (2004-2007), the project has been
renewed for other three years (2007-2010).
Between 2004 and 2008, the realisation of the CIS Oder estuary web Portal has been funded
with about € 425.000 provided by BMBF, part of phase I and II of the ICZM Oder project. The
implementation cost of the web-GIS is around € 365.000.
The first version of the CIS has been developed by an external company using ESRI
technologies. This phase resulted in high expenses and technical problems related to the
integration of the CIS with databases and other information sources, so the second
implementation phase has been carried out directly by EUCC-D staff using open source
technologies (MapServer).
An overview of the steering group and the stakeholder involvement is reported in the following
scheme provided by the CIS managers (Figure A3- 13).
Figure A3- 13 Regional, bi-national and international integration of the ICZM-Oder project.

21807-REL-T006.2 Annex 3 - page 21
The steering group, during the development phase of the project, consisted of 12 direct and 8
indirect (extended steering committee) members from the following institutions: 1 NGO, 1
Department of Ministry of Federal State of Mecklenburg-Vorpommern, 6 State Agencies of
Mecklenburg-Vorpommern, 2 Districts, and 1 tourist association.
Polish stakeholders were involved mainly via smaller workshops and cross-border
conferences (the so called "German-Polish Coastal Dialogues").
The system is addressed to local and regional authorities, scientists, Polish and German
actors and citizens (also including students and teachers). All the information published in the
web portal and in the web GIS is accessible without any restriction or privilege for different
users.
The system is currently maintained by four persons at EUCC-D; further improvements are
foreseen, like the integration of an extensive geo-referenced photographic database to the
CIS.
Experience with the implementation
In the graph reported in Figure A3- 14, the long term history of page visits of website portal
(http://www.ikzm-oder.de/) is shown. A growing number of visits characterised the first period
of the time series, with an initial peak in occasion of the launch of the portal and a second
higher peak in 2007; then visits have settled oscillating around a more stable value. Visitors
come from the German Baltic Coastal region (44.8%), followed by Poland (29.6) and
Germany. Outside these areas, the coastal information system attracted comparatively lower
numbers of users (see Figure A3- 15). Taking into account the visiting hours (mainly during
the typical office hours from 8 a.m. to 5 p.m.) a professional use of the portal was deduced.
Figure A3- 14 History of web portal visits provided by EUCC-D.
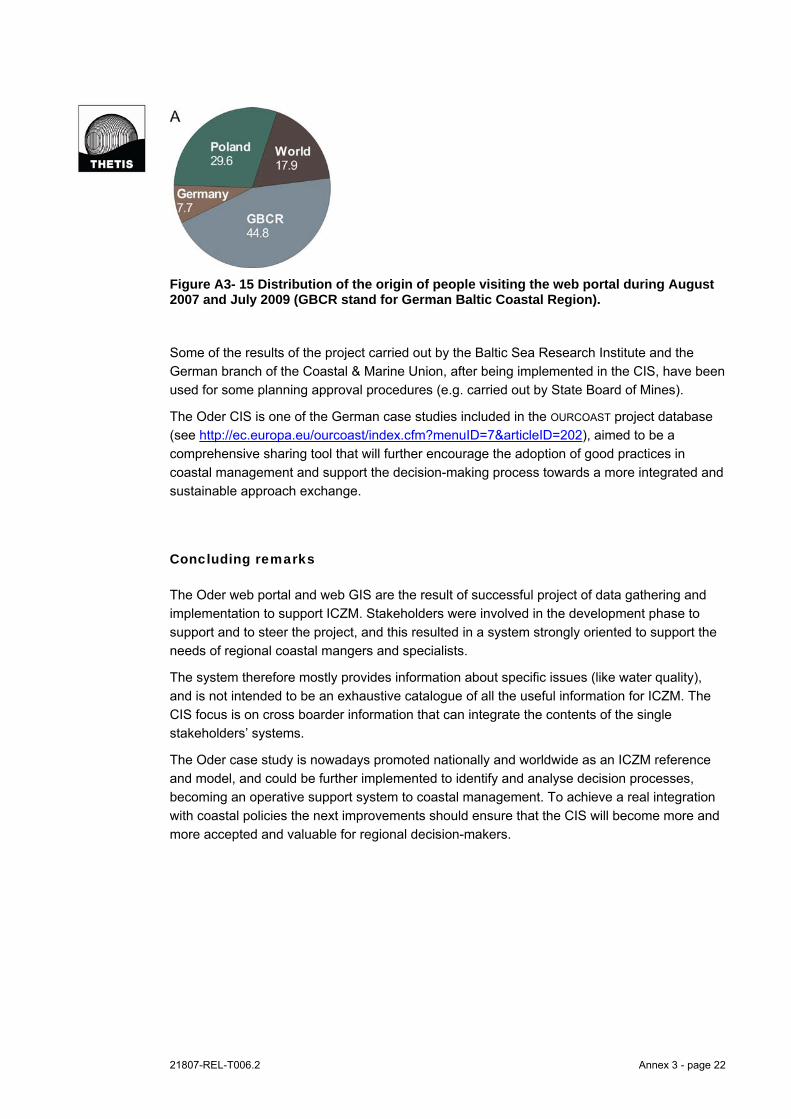
21807-REL-T006.2 Annex 3 - page 22
Figure A3- 15 Distribution of the origin of people visiting the web portal during August 2007 and July 2009 (GBCR stand for German Baltic Coastal Region).
Some of the results of the project carried out by the Baltic Sea Research Institute and the
German branch of the Coastal & Marine Union, after being implemented in the CIS, have been
used for some planning approval procedures (e.g. carried out by State Board of Mines).
The Oder CIS is one of the German case studies included in the OURCOAST project database
(see http://ec.europa.eu/ourcoast/index.cfm?menuID=7&articleID=202), aimed to be a
comprehensive sharing tool that will further encourage the adoption of good practices in
coastal management and support the decision-making process towards a more integrated and
sustainable approach exchange.
Concluding remarks
The Oder web portal and web GIS are the result of successful project of data gathering and
implementation to support ICZM. Stakeholders were involved in the development phase to
support and to steer the project, and this resulted in a system strongly oriented to support the
needs of regional coastal mangers and specialists.
The system therefore mostly provides information about specific issues (like water quality),
and is not intended to be an exhaustive catalogue of all the useful information for ICZM. The
CIS focus is on cross boarder information that can integrate the contents of the single
stakeholders’ systems.
The Oder case study is nowadays promoted nationally and worldwide as an ICZM reference
and model, and could be further implemented to identify and analyse decision processes,
becoming an operative support system to coastal management. To achieve a real integration
with coastal policies the next improvements should ensure that the CIS will become more and
more accepted and valuable for regional decision-makers.

21807-REL-T006.2 Annex 3 - page 23
North Sea Atlas
General Information
The North Sea Atlas is a collection of maps on the marine environment of the Dutch North
Sea, with information on the water system, use, policy and management of the North Sea
(continental shelf and coastal area). The information content, based on the most recent
available data, is limited to the water system including the seabed, with no specific information
on land. The information content is planned to be gradually updated.
The Atlas provides interactive and printable maps very easy to browse, which allows anyone
to visualize provided maps and layers.
The Atlas’ contents can be accessed by means of three ways:
1. using the online version of the Atlas (http://www.noordzeeatlas.nl/en/nzaEn.html);
2. visualising the printed version (2004 edition, which can be requested through the North
Sea Office website http://www.noordzeeatlas.nl/en/index.html);
3. using an ESRI GIS software, like ArcGIS 9.1 (licensed) or ArcExplorer (free reader
software).
The Atlas has been developed and is managed by the North Sea Office (Noordzee loket) to
support the activity of the North Sea Interdepartmental Consultation Directorate (IDON), acting
as a supervisor. IDON is a cooperative board of 10 representatives from different government
sub-structure levels (e.g. agency, directorate general, directorate, department) belonging to
four ministries:
Ministry of Infrastructure and the Environment: spatial planning, use of the sea,
coastguard;
Ministry of Economic Affairs, Agriculture and Innovation: Oil & Gas Mining & Exploration;
Ministry of Foreign Affairs;
Ministry of Defence, Navy, Coastguard.
The primary purpose of IDON, created in 1998, is to debate and coordinate policies, directives and legislation about the North Sea.
For information about North Sea Atlas an info mail is available (noordzeeloket@rws); the
contact person at the Ministry of Infrastructure and Environment, North Sea Directorate (P.O.
Box 5807, 2280 HV Rijswijk - The Netherlands) is Ad Stolk ([email protected]). Project leader of
the North Sea Atlas is Marcel Bommele ([email protected]).

21807-REL-T006.2 Annex 3 - page 24
Operational context and information content
The North Sea Atlas includes information related to four of the five considered ICZM
dimensions: territory (e.g. 3 and 12 miles nautical limits, protected areas, bathymetry),
environment (e.g., characteristics of biological systems in various environmental matrixes such
as sediment and marine water, pollutant concentrations) and economy (e.g. locations of
offshore wind-farms, marine traffic). Governance is also properly addressed; a specific section
of the Atlas deals with –information related to “Policy and management of the Dutch North
Sea”.
The Atlas is structured in three main sections:
Part I. Water system (concerning physical, chemical and biological issues of the marine
area);
Part II. Usages (different uses of the sea);
Part III. Policy and management (concerning administration policies for safeguarding the
North Sea).
Figure A3- 16 North Sea Atlas online featuring Geomorphology map.
21807-REL-T006.2 Annex 3 - page 25
More in detail, information as bathymetry, geomorphology, sediment granulometry,
hydrodynamics compose the information about the physical geography of the area. The
biological system is described through the analysis of species distribution for sediment, water
and air. Data of pollutant concentration in sediments, data about salinity, suspended matter in
water and data about erosion and transportation process of the suspended matter, compose
the chemical description of the sea. The monitoring network is also shown, with the
specification of the monitored stations for physical, chemical and biological data.
The information about the different uses of the sea includes archaeological zones, division of
the Dutch Continental Shelf, pollution reports on Dutch Continental Shelf, sand and shell
extraction, dumping sites of dredged material, submarine cables, platforms and pipelines,
traffic separation scheme, military use.
The section about the policy and management of the Dutch North Sea includes national
competence areas, maritime zoning (statutory administrative zones), maps of the spatial policy
document PKB “key planning decision”, protected sites according to the EU Birds and Habitats
Directive, drainage basins according to the Water Framework Directive, maps showing
elements related to mining uses, and seabed protection areas.
Some integrated information is also provided in the Atlas. The most interesting are the
analysis of the sedimentation/erosion areas together with the transportation direction of
suspended matter in the seawater, the map showing the mining uses of the sea and the
related regulation and the map of the spatial policy document PKB.
In particular, the PKB, “key planning decision”, gives an overall picture of the spatial
developments of the area. PKB defines two key objectives of spatial policy concerning the
North Sea: to enhance the economic significance of the North Sea and to conserve and
develop internationally important ecological and landscape values.
The Atlas content refers to the national scale: all the Atlas information fit the Dutch Continental
shelf or more specifically the Dutch coastal area of the North Sea. For some layers,
information is available for a larger portion of the North Sea. The system has been developed
in order to be applied specifically to the zone of Dutch Sea. However, an upgrade of the
system is planned in order to make the Atlas a more flexible tool.
Metadata, available as descriptive sheets, are in general provided for the pre-defined maps
(groups of layers) included in the Atlas. However, they are not available for the specific layers.
Technological characteristics
The technology used for the North Sea Atlas is the licensed software ESRI ArcSDE. Data
standardization and validation is performed with ESRI ArcGIS.
The North Sea Atlas is part of the European Atlas of the Seas, offering a wide range of
information about Europe's seas. It was developed to raise awareness of Europe's oceans and
seas, in the context of the EU's integrated maritime policy
(http://ec.europa.eu/maritimeaffairs/atlas/index_en.htm).
About interoperability, the Atlas’ architecture is structured with ESRI technologies, so the
formats of spatial datasets are shapefile and ESRI Geo-DB. Data can be consulted in the web
application, but also through ArcExplorer / ArcExplorerWeb applications and IMS-server
connections. Direct download of spatial data from the Atlas in not available.

21807-REL-T006.2 Annex 3 - page 26
Figure A3- 17 Maps overlay in the ArcExplorer Web application.
ISO 19115 compliant metadata are available in ESRI sheet format only for some layers. A
metadata catalogue is not available, while some additional description is provided for every
static map, as in the paper version of the Atlas.
The intention of the steering committee is to upgrade the Atlas towards a more flexible and
interactive tool, developed with open source technologies and based on system architectures
and data formats that ensure high interoperability.
ICZM related functionalities
The high variety and well-structured information contained in the North Sea Atlas, some of
them integrated, together with a particular focus on the water policies and spatial planning of
the marine area are the main peculiar functionalities related to ICZM Knowledge and process.
Furthermore, the Atlas is specifically developed to support the activity of the North Sea
Interdepartmental Consultation Directorate (IDON) in the perspective of Maritime Spatial
Planning (MSP) and Integrated Maritime Policy (IMP), with evident connection to the ICZM
issues.
In this perspective, the Atlas in particular provides support to assessment of alternatives in
marine planning and management. The North Sea Office (http://www.noordzeeloket.nl/)
website in fact provides information about law, policy and regulations in the Dutch Sea area,
allowing to download relevant planning documents, as for example the Management Plan for
the North Sea – 2015, adopted in 2005. The North Sea Office website also provides a link to
the Ministry of Infrastructure and the Environment, Rijkswaterstaat (http://www.rws.nl/rws/dnz),
enabling, after requesting an account, to find maps and shapefiles of the existing different
uses in the North Sea.
However, lacking data about the land territory, the Atlas cannot properly be defined as a
Coastal information System and cannot strictly support the whole ICZM process.
21807-REL-T006.2 Annex 3 - page 27
Some multi-time data, such as concentration of pollutants in the sea sediment, are also
available in the North Sea Atlas, supporting knowledge about the evolution of coastal pollution.
These information concern both metals and persistent organic pollutants. By comparing
results of different years, data for example indicate that cadmium levels fell by 71% between
1981 and 1996. It was linked with a huge drop in the amount of cadmium in the Rhine, in
dredging sludge and in the atmosphere.
The system finally provides spatial data enabling direct connection of users thought ESRI Arc
Explorer (free software) that allows the visualisation of selected layers on a client computer.
Pre-defined static maps available in the Atlas and customised maps can be exported and
print.
System development and management
The North Sea Atlas was first published as a book more than ten years ago. In occasion of the
update that took place in 2002, the Atlas has been also published in a dedicated web site.
The Atlas has been developed by a specialised GIS private company under the coordination
of the North Sea Office and the supervision of IDON. The first web version of the Atlas
involved 2 full time developers for about one year of work.
The system is continuously updated with new maps and technically upgraded with new
functionalities in order to acquire better usability. The cost of this activity is around € 15.000 /
year, and involves about 8 persons.
The main difficulties encountered in developing the atlas were not related to technological
issues but rather concerning data acquisition and institutional cooperation.
The North Sea Office is the focal point for the information about the North Sea and its
management. The publishing of new maps in the Atlas needs to be approved by all the
Ministries that supervise the Atlas’ implementation. For this reason not all the maps produced
by the North Sea Office are finally published in the Atlas. The communication and agreement
among Ministries represents a crucial point for institutional cooperation and for the steering of
the Atlas’ porpoises.
The steering group of the Atlas meets periodically to verify the contents of the Atlas and define
the new cartography to be developed in accordance with the annual budget. Technological
upgrade to enhance the Atlas with new functionalities is budgeted as a separate expenditure
and commissioned to a maintenance company.
The Atlas, free to all users and without any restriction or privilege for different users, is
oriented to a wide kind of users, including public and private entities, research institutions,
students and general public.
21807-REL-T006.2 Annex 3 - page 28
Experience with the implementation
The main porpoise of the Atlas is to share data about water system, use and management of
the North Sea, and represents a focal point to visualise updated information about maritime
issues. The Atlas nowadays is not designed as a participation tool for coastal planners, as its
initial aim is to spread general information about the North Sea to a wide range of users, with
different interests and roles.
On the other hand, the need of information systems to support marine spatial planning and
ICZM is becoming more and more evident, and the number of requests to the Atlas’ managers
for thematic data and scientific information has been growing in the last years. As a
consequence, IDON and the steering committee of the Atlas are heading in that direction,
planning to provide new information contents and functionalities that will allow an easiest
consultation by general public and a more profitable usage by decision makers and
stakeholders.
The Atlas is currently used within ICZM processes just as an investigation tool to acquire an
overview on the state and usage of marine areas.
Concluding remarks
The North Sea Atlas is the main source of updated information about Dutch marine areas,
dealing with physical and quality characteristics, but also with the actual use of the sea and
with the ongoing protection policies.
The actual state of the Atlas can provide a useful overview on marine areas to ICZM
processes, and can represent a good base to develop a more comprehensive tool to support
ICZM processes. This is one of the main aims of the steering group of the Atlas that foresees
important updates and upgrades both on information contents and on functionalities. Among
them, the inclusion of information about inland areas and the implementation of process
related functionalities seem to be the most relevant.
21807-REL-T006.2 Annex 3 - page 29
KustAtlas – Belgian Coastal Atlas
General Information
The KustAtlas (coastal atlas) is an initiative of the Co-ordination Centre for Integrated Coastal
Zone Management, a contact centre for integrated matters in the coastal zone, also
responsible for the maintenance of the atlas and updating the information.
The Atlas contains maps and other information on different coastal aspects, useful to support
ICZM process. It focuses mainly on the Belgian coast but for some issues (ICZM indicators)
also contains data about the wider area of Southern North Sea (Essex –UK; Kent – UK, Nord-
Pas De Calais - France, West Flanders - Belgium and Zeeland - the Netherlands).
The Coastal Atlas is a member of the newly formed International Coastal Atlas Network
(ICAN), a group of organizations who have been meeting over the past two years, to share
experience and knowledge on Coastal Web Atlases and to look at possibilities and added-
value of data interoperability approaches to coastal web atlases.
The Belgian Coastal Atlas was first published as a book in 2004, triggered by the reporting
obligations to the European Commission about the state of the Belgian coasts related to the
ICZM Recommendations (2002/413/EC). From the beginning, the main aim was to present a
general and synthesised overview of the main characteristics of the Belgian coast in relation to
ICZM. The many requests for maps encouraged the developers to launch a web-based atlas.
Since November 2005, the on-line web-atlas is a fully operational system and it is available in
4 languages. Following the initial book perspective, the on-line system mainly aims to provide
an easily accessible, simple, user-friendly atlas to users, as well as to make available readily
usable maps on Belgian coasts. Maps have been produced using data mostly provided by the
public authorities and their administrations.
KustAtlas home page (http://www.kustatlas.be/en, see Figure A3- 18) offers downloadable
maps (as PDF documents) with low possibility of interaction but high attention to the quality
and look of the image. Figures, diagrams and charts are also available and downloadable. The
Atlas is structured in 12 main sectors (chapters).
For direct information requests and suggestions, the contact person is Kathy Belpaeme of the
Belgium Coordination Centre on Integrated Coastal Zone Management in Belgium (Ghent,
BELGIUM, e-mail [email protected]). Web-site of the Belgium Coordination
Centre on ICZM is http://www.kustbeheer.be.
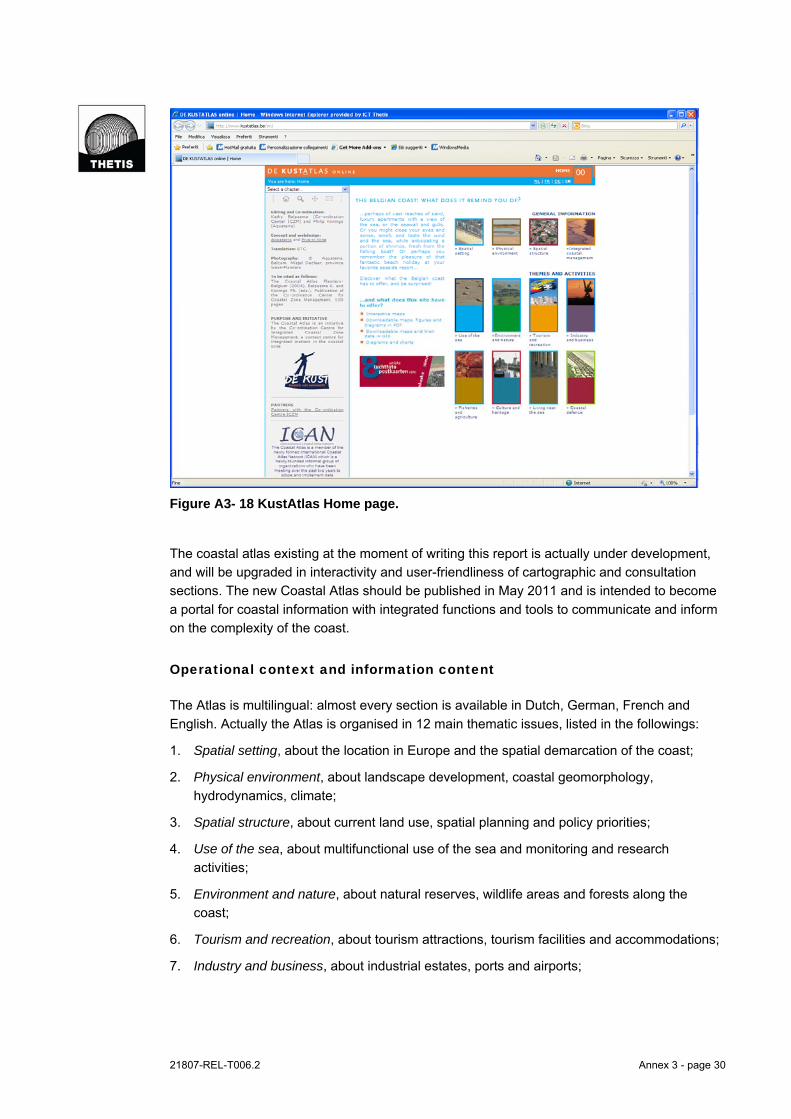
21807-REL-T006.2 Annex 3 - page 30
Figure A3- 18 KustAtlas Home page.
The coastal atlas existing at the moment of writing this report is actually under development,
and will be upgraded in interactivity and user-friendliness of cartographic and consultation
sections. The new Coastal Atlas should be published in May 2011 and is intended to become
a portal for coastal information with integrated functions and tools to communicate and inform
on the complexity of the coast.
Operational context and information content
The Atlas is multilingual: almost every section is available in Dutch, German, French and
English. Actually the Atlas is organised in 12 main thematic issues, listed in the followings:
1. Spatial setting, about the location in Europe and the spatial demarcation of the coast;
2. Physical environment, about landscape development, coastal geomorphology,
hydrodynamics, climate;
3. Spatial structure, about current land use, spatial planning and policy priorities;
4. Use of the sea, about multifunctional use of the sea and monitoring and research
activities;
5. Environment and nature, about natural reserves, wildlife areas and forests along the
coast;
6. Tourism and recreation, about tourism attractions, tourism facilities and accommodations;
7. Industry and business, about industrial estates, ports and airports;

21807-REL-T006.2 Annex 3 - page 31
8. Fishery and agriculture, about general facts on the fishery in Belgium and Agriculture in
the coastal plains, including a brief historical perspective;
9. Culture and heritage, about main events, activities and cultural centres;
10. Living by the sea, about coastal conurbation, settlement types and coastal architectures;
11. Coastal defence, about erosion, sedimentation and coastal protection structures;
12. Integrated coastal zone management, about the balance between the social, economic
and ecological aspects of the coast with link to sustainability indicators.
The above mentioned chapters - each of them containing data, maps and descriptive
information related to various items - match all the five ICZM dimensions of Environment,
Territory, Economy, Society and Governance.
Of particular interest, the Integrated coastal management sector (chapter 12) links the Atlas to
the databases of the sustainability indicator of the coast (for most indicators Dutch only, some
indicators developed in the SAIL project available in English), adding therefore a rich set of
data to the Atlas. Indicators can also be linked to in different thematic chapters.
The so called “sustainability barometer for the coast” is a tool created by the Coordination
Centre for ICZM, in order to monitor the evolution of a set of themes or 'indicators' that are
important for the coast and coastal policy. The indicators can refer to a single data set or can
be the results of aggregated data.
The system provides other examples of integrated data, merging together information from
different sectors. They can be especially found among the ICZM coastal indicators (defined by
SAIL Project and all considered in the KustAtlas) which are accessible from every chapter of
the Atlas. For example, the percentage of Natura 2000 sites in Favourable Conservation
Status (FCS) according to the Habitat and birds EC directives provides information about the
effective management of designed sites, integrating territorial information (Natura 2000 sites)
with environmental current status.
Furthermore, the number of people living in the area at risk from coastal flooding integrates
population density data with territorial data (areas delimited by the 5m height contours).
Similarly, the area of protected sites and value of economic assets within the zone at risk from
coastal flooding is another example of integrated information provided by KustAtlas, merging
economic and environmental data with territorial data.
Integrated maps are also provided, with multiple information contents related to a specific
issue in the same map. For example, the map of multifunctional use of the sea shows
economic activities together with Natura 2000 sites and planned energy production locations;
the same concept is applied to the map of mixed land use. The map of coastal evolution
shows areas in erosion/sedimentation together with the fixed coastline protection structures.
Information factsheets, interactive graphs, maps, trend and indication of data providers are
also available for every ICZM indicator.
Data providers are public authorities and their administrations, gathering the information
themselves within their objectives and policies; in other cases, the data is generated by
universities, consultants or other institutions commissioned by the authorities.
KustAtlas, specifically drawn up for the coastal area of Belgium, served as an example to
develop similar atlases in Vietnam and Catalonia (Spain). Thematic viewers fit to a

21807-REL-T006.2 Annex 3 - page 32
transnational scale, being referred not only to the Belgian coast, but also, as for ICZM
indicators, to the wider area of Southern North Sea. Currently maps can be consulted at two
fixed scales, but the new Atlas now being updated will provide more interactive zoom and pan
functionalities.
Technological characteristics
The system works on the Apache web-server and it runs on a MSSQL relational database.
The web-site is set up in PHP/HTML and, for the interactive maps, flash applications and
action-scripts are used.
As mentioned in the previous section and deepened in the following section, the website is
integrated with the “sustainability barometer” tool, through a link to an external website, from
the chapter 12 (Integrated management of the coast) and from the thematic chapters.
There is no proper integration with other coastal information system. The future development
of KustAtlas will be strictly connected to the development of the new CIS now being developed
by the Dorset Coastal Forum, as both are participating to the European project C-Scope,
aiming, inter alia, to develop tools for achieving sustainable coastal economies and
environments. Moreover, KustAtlas is included in the European Atlas of the Seas
(http://ec.europa.eu/maritimeaffairs/atlas/index_en.htm).
Actually interoperability is low, as the possibilities to analyze, compare and integrate the
different informational contents are not very flexible. The new Atlas will have a strong focus on
cartography, with an enhanced web map viewer application that will allow interactively
visualizing and identifying several layers at different scales. Some new tools (like measure)
will be provided.
Figure A3- 19 Preview of the interactive map viewer to be published in the new coastal atlas in progress.

21807-REL-T006.2 Annex 3 - page 33
ICZM related functionalities
KustAtlas features two main functionalities related to ICZM process: the sustainability
barometer and the analysis of the ICZM indicators.
The first functionality allows direct access to the sustainability indicators database
(http://www.vliz.be/projects/indicatoren/, Dutch only). The so called “sustainability barometer”
allows to gain an overview of the current state and trend of several sustainability indicators of
the coast, as well as identifying possible signals for coastal policy adjustment or
harmonisation. A trend is given for each indicator stating whether the latter is positive,
negative or neutral.
The indicators give an insight about the state of the coast and the sustainability of its
development, and could represent a policy support tool for coastal managers and decision-
makers. Indicators outputs are presented as graphs and tables, without a geographical spatial
reference. The 21 indicators are grouped in 7 chapters:
1. Improving the quality of living environment;
2. Maintaining and strengthening the socio-cultural heritage;
3. Improving the environment and nature;
4. Strengthening the economic fabric;
5. Support tourism and recreation;
6. Implement administrative reforms;
7. Additional Chapter: Climate Change and Coastal Defence.
Another useful functionality to support ICZM processes knowledge is the analysis of the 27
ICZM indicators. Each chapter of the atlas explores relevant indicators for that thematic issue,
by linking to the SAIL project website (http://www.vliz.be/projects/SAIL/db.php). The SAIL
project (Schéma d'Aménagement Intégré du Littoral) was a partnership of regional and local
authorities, maritime organisations, and coastal and marine agencies, working together for the
sustainable development of the Southern North Sea tidal area. One of the major
accomplishments of the SAIL partnership is the implementation of sustainability indicators for
the Southern North Sea region.
Both for sustainability and ICZM indicators some integrated data and maps are provided (see
section on “Operational context and information content”).
Other functionalities mark the system:
Even if designed using thematic classification, the Atlas contains cross-references aimed
to allow seamless navigation through themes and aspects. In the new web Atlas now
being updated figures, graphs, tables, photographs, maps and external links will always
be readily available.
The availability of multi-time information, as for the coastal evolution (sedimentation /
erosion process), landscape evolution, historical perspective of some economic activities;
The availability of interactive graphics, extended explanations of coastal processes help
the users, especially stakeholders, to fully manage the information content, capturing the
implications in coastal planning and management.
21807-REL-T006.2 Annex 3 - page 34
The presence of dedicated fact sheets for each ICZM indicator (PDF documents) reporting
origin, source, results, implications in ICZM and reliability of every indicator.
A key message is furthermore reported in every fact sheet as useful summary information
for the monitored indicator.
Maps and graphics are downloadable in PDF format and available in printable versions
while data underlying some maps are available as XLS files. For some few layers
shapefiles and interactive Google earth layers are also available. This aspect is one of the
main focuses of the actual improvement and updating of the Atlas.
System development and management
For the development of the atlas online at the moment of writing this report, the Coordination
Centre on ICZM collaborated with three private partners:
Aquaterra (http://www.aquaterra.be/nl/) for the geographic information, map digitisation
and content of the atlas;
Five to Nine (http://www.quoted.be/) for the website development;
Magenta (http://www.magenta.be/) for the design.
As for costs, the former printed version of the atlas cost € 46,381, while the development of
the on-line atlas cost € 25,073 for the set up of the on-line version and € 5,855 for the
development/translation of German and French version. The book and the online version of
the Belgian Coastal Atlas were financed by the project partners of the Coordination Centre:
the province of West-Flanders and the two main Flemish coastal administrations, and by
European structural funds within the objective 2 program for the Belgian coast.
The actual further upgrading and updating of the atlas is carried out by the Coordination
Centre within the C-SCOPE project, with the structure and roles reported in the Figure A3- 20.
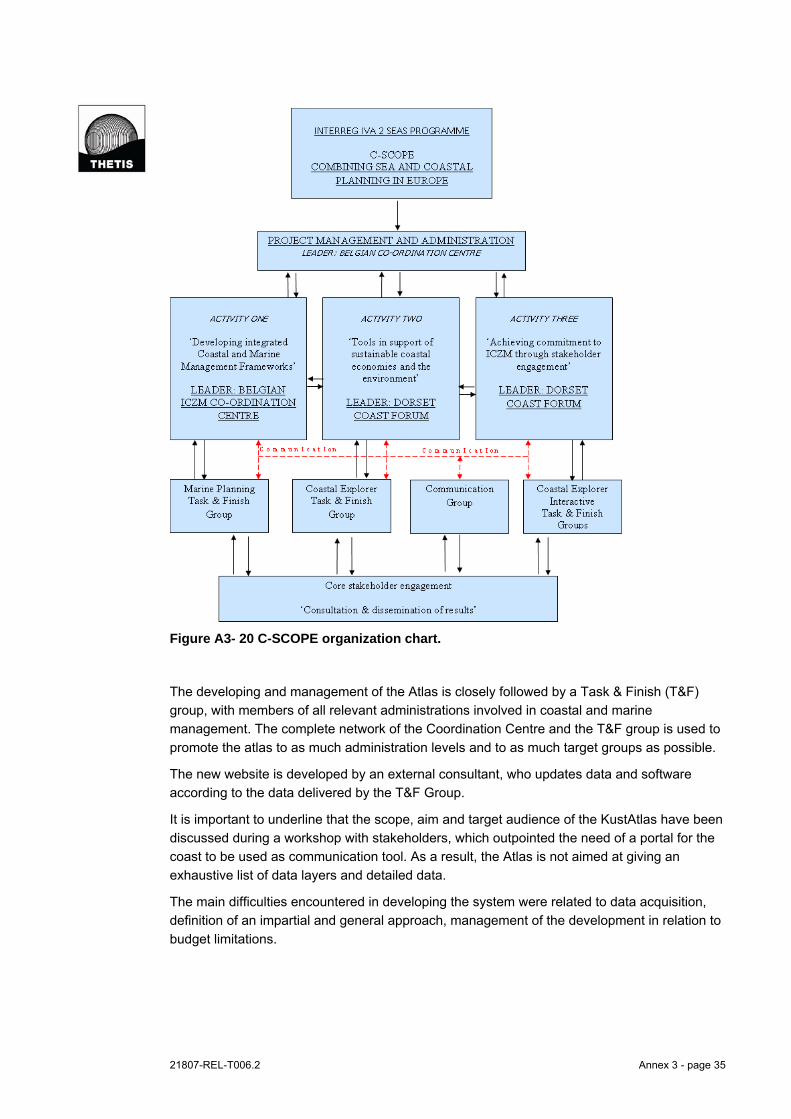
21807-REL-T006.2 Annex 3 - page 35
Figure A3- 20 C-SCOPE organization chart.
The developing and management of the Atlas is closely followed by a Task & Finish (T&F)
group, with members of all relevant administrations involved in coastal and marine
management. The complete network of the Coordination Centre and the T&F group is used to
promote the atlas to as much administration levels and to as much target groups as possible.
The new website is developed by an external consultant, who updates data and software
according to the data delivered by the T&F Group.
It is important to underline that the scope, aim and target audience of the KustAtlas have been
discussed during a workshop with stakeholders, which outpointed the need of a portal for the
coast to be used as communication tool. As a result, the Atlas is not aimed at giving an
exhaustive list of data layers and detailed data.
The main difficulties encountered in developing the system were related to data acquisition,
definition of an impartial and general approach, management of the development in relation to
budget limitations.
21807-REL-T006.2 Annex 3 - page 36
The group in charge of data acquisition made a lot of efforts to deliver the necessary data to
the Co-ordination Centre. There were minor difficulties with copyright issues and indecisions of
some administrations about the terms and conditions of data accessibility. Additional contracts
and agreements on data acquisition had to be signed during the development of the Atlas.
Another difficulty was related to the need of keeping the data general, avoiding to go too much
into detail as regards to naming institutions, concrete projects, dates, etc., because the atlas
wants to be timeless and free from competition issues between institutions.
During the development, the project leader had to make firm decisions to keep the scope clear
and to limit to the budget the multitude of ideas and suggestions received to feed the atlas, as
in the development phase many more layers than foreseen were being collected.
The Atlas is intended to be a communication instrument for teachers, students, guides,
educational initiatives and other coastal stakeholders, becoming an awareness raising tool to
explain the complexity of the coast. Sustainability indicators could also be usefully exploited by
policy makers and decision makers. With the next update, the Coordination Centre aims to
develop the Belgian Coastal Atlas as a more interactive information tool for coastal
stakeholders and members of the wider public interested in coastal complexity.
The access to the whole website is free, without privileges for different users. Illustrations,
pictures, maps and texts of the atlas can be used subject to prior written permission of the
copyright owners and an express mention of the source.
Experience with the implementation
On average, the site has 2.000 hits per month (an average of about 70 people per day) of
which more than 50% are Belgian. Other top visiting countries are the Netherlands, Germany
and France. Since the site is visited mainly during the working week and during working hours,
it can be assumed that the site is visited mostly for work reasons. Most interested users, from
which the main requests for further information come from, are scientific users as well as
general public, administrations, supporting services and schools.
The stakeholders that participated in the definition of the aims of the Atlas were not interested
in developing a decision support tool, and this is the condition that determines the actual
structure of the KustAtlas and the on-going implementations. The integration of sustainability
indicators in the atlas is also intended as an enhancement to add value in terms of raising
awareness on coastal sustainability.
Concluding remarks
The KustAtlas features extensive information contents related to ICZM, with an ICZM
dedicated section and links to specific ICZM coastal indicators defined within the SAIL project.
The new upgraded version of the atlas to be published in May 2011 will enhance cartographic
interactivity with spatial data and connections with implemented coastal policies.

21807-REL-T006.2 Annex 3 - page 37
Explicit aim of the Co-ordination Centre managing the atlas, in accordance with stakeholders
involved in the target definition, is to provide a point of reference for coastal information rather
than a decision support system for policy makers.
This analysis outpointed that the informational contents and functionalities of the atlas, with
particular reference to sustainability indicators, ICZM indicators fact-sheets and reports of
implemented policies, could be usefully exploited also by coastal planners and managers.
As the upgrade of the system foresees a stronger connection with policies on the coast, the
interconnection among costal information, coastal sustainability and coastal management will
be further investigated, and this could represent a great opportunity to develop an exhaustive
portal rich in information and a powerful tool for coastal management as well.
21807-REL-T006.2 Annex 3 - page 38
MIDA – The Marine Irish Digital Atlas
General Information
The Marine Irish Digital Atlas (MIDA) is a web tool built in a web-GIS environment, where
people interested in coastal and marine information for Ireland can visualize and identify
pertinent geospatial datasets and determine where to acquire them. The atlas, which is being
constantly updated, currently displays more than 140 layers from over 35 coastal and marine
organizations both within Ireland and abroad. It also features an “InfoPort” which is a
repository of text, imagery, links to spatial data sources and additional reference material for a
wide range of coastal and marine topics.
The MIDA is part of the International Coastal Atlas Network (ICAN), the group of organizations
that have been meeting since 2006 to scope and implement data interoperability approaches
to coastal web atlases.
Specific objectives of the MIDA Atlas are to:
Develop a web site for presentation of geo-referenced marine datasets of environmental
importance;
Provide greater accessibility to data and information in the form of a web enabled,
customised GIS;
Provide flexibility of use by providing a range of tools that allow users to select, overlay
and compare geospatial layers;
Enable users to identify sources of data, information and expertise on the marine
environment;
Encourage a greater appreciation of Ireland's coastal regions by incorporating educational
and informational materials based on multi-media technology.
MIDA, a fully operational system, has been developed by the Coastal and Marine Research
Centre (CMRC) of University College Cork , in partnership with the Centre for Coastal and
Marine Research, University of Ulster, Coleraine, Northern Ireland.
Funders of the Atlas are:
Ireland’s Higher Education Authority under the National Development Plan PRTLI III
Programme (development funds);
Environment and Heritage Service, Northern Ireland (Northern Ireland data and
partnership);
Coastal and Marine Research Centre, University College Cork.
From the Home page of the Atlas (http://mida.ucc.ie/pages/atlas/atlas.php, Figure A3- 21), it is
possible to add layers to the map, to access layer information (quick overview, metadata and
data files), to zoom to pre-selected regions and specific themes (in order to get an integrated
map displaying all the information layers related to the selected theme and the selected spatial
area), to link to general information about MIDA (Atlas help, list of Layers, data contributors,
information Resource, contacts) and finally to access the search tool (to find layers by text or
spatial selection).

21807-REL-T006.2 Annex 3 - page 39
For information, comments about MIDA, data sharing or mailing list joining an info mail is
available: [email protected]; the point of contact is Ned Dwyer ([email protected]), Coastal and
Marine Research Centre - University College Cork (Naval Base, Haulbowline, Cobh, County
Cork, Ireland).
Figure A3- 21 Homepage of MIDA.
Operational context and information content
The Atlas mainly addresses four of the five considered information dimensions: environment,
territory, economic and governance.
The environment and the territory dimension are the most developed dimensions (50 layers
refer to the physical environment and more than 100 layer refer to the biological environment),
while the economic information is provided by a great variety of layers regarding tourism,
recreation, fisheries, aquaculture, agriculture and coastal and marine industry. Governance
information integrated in the system mainly refers to rural areas targeted for investment,
current exploration authorizations and license blocks given by the Petroleum Affairs Division.
21807-REL-T006.2 Annex 3 - page 40
The information content is related to following topics:
Physical environment;
Coastal habitats;
Biology;
Management;
Human impact;
Conservation;
Environmental monitoring;
Infrastructure;
Industry;
Culture and heritage;
Natural resources;
Fisheries, aquaculture agriculture;
Tourism and recreation.
The list of layers published in the atlas, provided with description, indication of data owner and
status of the publication is available at http://mida.ucc.ie/pages/dataLayers.htm.
The data hierarchy was structured around four main categories (folders in the web-GIS
interface): Management, Physical Environment, Biological Environment, Socio-economic
Activity. Each of these categories is subdivided in several sub-categories.
Data are provided by various and heterogeneous private and public institutions acting at local,
national or international level, as research institution, environmental protection agencies,
cultural and recreation associations, information and cartographic services etc. The complete
list of the 37 current data contributors is available at http://mida.ucc.ie/pages/providers.htm.
Although data layer in the MIDA are provided from numerous organizations, many of these
can be grouped as government organizations, followed by educational institutions (about 27%)
and non governmental organizations (17%) while only about 4% of data layers is provided by
the private sector. The private sector has a low representation among data providers, mainly
due to the commercial sensitivity of certain type of data.
The system can display preset maps on 19 specific themes and 37 specific subregions, by
mean of the “Zoom to” tool, accessible from the homepage. These maps are good examples
of integrated maps, integrating all useful layers to compose a complete information framework
about a selected theme on a selected region. As an example, selecting “climatology” among
the available themes, layers about the location of the weather stations, the amount of
seasonal rainfall and the annual rainfall, over base layers on coastline and bathymetry will be
displayed. Selecting “tourist/recreation”, all the information about the pertinent socio-economic
activities (marinas and pontoons, visitor moorings, surfing associations etc.) and management
activities (national monuments, national parks, nature reserves, areas of outstanding natural
beauty etc.) are displayed together with base layers (bathymetry, coastline).
For each layer, complete metadata is available, stored in a database in order to optimize data
management. Metadata is compliant to ISO 19115 standard, used also by other key

21807-REL-T006.2 Annex 3 - page 41
organisations handling spatial data in Ireland (e.g., Marine Institute, Environmental Protection
Agency with the Water Framework Directive, The Department of the Environment with the
ISDI). In 2002 the Irish government began developing the Irish Spatial Data Infrastructure
(ISDI; McCormack 2004).
The atlas contains three levels of metadata:
Abstract metadata, which provides a brief summary of the dataset; it includes the dataset
title, description, geographical extent, data owner and the data publication date. It is the
first window that appears when the metadata button is clicked in the Information table;
Discovery metadata, which consists of core metadata elements, providing more detailed
information about the dataset, in order to give a better idea of data quality as well as
contact information for the data owner; it serves as the central MIDA metadata database;
Full metadata, which is supplied by data owners and not stored in the MIDA XML
database. Each full metadata page is displayed in HTML as the owner provides it,
therefore its quality, standardisation, and completeness is the responsibility of the data
providers themselves and not of the MIDA development team.
Hyperlinks within the atlas allow users to move easily between the different metadata levels.
MIDA is explicitly dedicated to the whole coastal and marine Irish territory, which includes two
jurisdictions namely the Republic of Ireland and Northern Ireland (which is part of the United
Kingdom). This choice influenced data collection, which is focused on information available on
wide parts of the coast rather than local contexts. The possibility of developing several “local
MIDA” has been considered
Thematic viewers fit national scale, allowing zoom to visualize information with more detail.
The “Zoom to” tool allows working in 37 preset subregions of Ireland, as mentioned above. All
dataset include information pertinent to coastal and/or marine areas. When the dataset
includes information on the inland areas, the complete dataset is presented rather than
clipped. On the seaward side datasets extend to the British coast on the East and the
continental shelf claim area to the West.
The participation in the International Coastal Atlas Network (ICAN), for which the MIDA team
served also as a catalyst together with the Oregon Coastal Atlas, represents another point of
strength towards the flexibility of the system.
Technological characteristics
MIDA has been implemented with Minnesota MapServer software, free and open source
technology. The system uses Apache Web Server, MapServer, and PostgreS Database.
Metadata is stored in a database in order to optimize data management, permit efficient
searching, and facilitate catalogue sharing. Data management is operated with ESRI desktop
applications.
About the server and data repository, a dedicated computer with a LINUX operating system
runs all software and contains all data (geospatial data, metadata and non-geospatial data as
texts, photos, animations etc). Currently, the atlas is not dynamically WMS supported.
The technological architecture of MIDA system is illustrated in the Figure A3- 22.

21807-REL-T006.2 Annex 3 - page 42
Figure A3- 22 Elements of MIDA system, based on the INSPIRE model.
The integration with other coastal information system is performed through the participation in
the above mentioned International Coastal Atlas Network (ICAN). MIDA is also a node of the
Irish Spatial Data Exchange (ISDE) (http://www.isde.ie) and shares metadata across its
distributed network. MIDA is finally included in the European Atlas of the Seas
(http://ec.europa.eu/maritimeaffairs/atlas/index_en.htm).
The interoperability is high, as layers are downloadable in Shapefile format and the metadata
standard (ISO 19115) is compliant to the requirement of both the Irish Spatial Data
Infrastructure (ISDI, developed since 2002 by the Irish government McCormack 2004) and the
larger INSPIRE initiative for developing a European Spatial Data Infrastructure. Currently the
metadata is not delivered using ISO 19139 tags, but developments are underway as of 2011
to integrate this standard.
ICZM related functionalities
MIDA provides various functionalities supporting ICZM knowledge and processes, as:
the typology of the information content, supporting an integrated and dynamic view of the
coastal processes through preset integrated maps, multi-time information and ICZM
indicators;
the GIS tools, allowing the interactivity and the access to spatial data;
the structured organisation of the available information;
the availability of extensive information like texts and images;
the availability of the info email and tools for stakeholder involvement.
About the first topic, multi-time information is displayed only for some layers, such as land
cover change from 1990 to 2000 to 2006, seasonal pattern of rainfall and sea surface
temperature. The data layers include also some of the ICZM specific indicators. These are
coastal erosion, indication of areas of land and seas protected by statutory designations, sea
level rise, pressure for marine and coastal recreations (number of moorings) and quality of
21807-REL-T006.2 Annex 3 - page 43
bathing waters. The inclusion of data on erosion trends, together with those on sea level rise
in different costal areas of Ireland, can also be useful for coastal vulnerability assessment to
climate change impacts. As for integrated maps, see section on “Operational Context and
Information Contents”.
About GIS functionalities, the web-GIS interface provide a high interactivity, allowing to
customise own maps, to make multi-layer interrogations, to search specific topics by text or
spatial selection and to zoom to specific preset areas. This can help user to create customised
work views, possibly useful for ICZM.
Spatial data are also downloadable in shapefile format for about 85 of the 140 layers. The
other data cannot be directly downloaded due to confidentiality reasons defined by data
providers, but links to data owner or internet page where the layer can be downloaded are
provided in metadata contents.
MIDA’s structure is well articulated and complete, thus enabling users to easily find data and
information and relate the same to specific issues. The list of layers prepared for display in
MIDA (http://mida.ucc.ie/pages/dataLayers.htm), with direct link for visualisation in the atlas,
represents a powerful knowledge related functionality.
Metadata is presented in a user-friendly and easy to follow layout. Thus, MIDA is well shaped
for problem understanding and structuring, as well as coastal management and planning at
the national level. The user statistics confirm that the Atlas is constantly visited attesting to its
relevance and usefulness.
Finally, the MIDA InfoPort, directly accessible from the information area, is a comprehensive
guide (work in progress) to information on coastal and marine themes and issues in Ireland. It
offers overview text and images, links to relevant organisations and documentation, and
recommendations on sources of geospatial data, both within and outside of the MIDA (Figure
A3- 23). For some data layer, needing a deeper analysis, the information page is more
complex and structured in five tabs (overview, details, data sources, links and reference). In
this regard the MIDA follows the approach of traditional, printed atlases, which provide text
information in addition to the thematic maps.
Concerning stakeholder involvement and participation, MIDA is totally accessible on-line and,
through the “contribute” link, explicitly stimulates organisation to share their own data through
the MIDA tool, with expected benefits for data owners, data users, and Ireland as a whole.

21807-REL-T006.2 Annex 3 - page 44
Figure A3- 23 The MIDA InfoPort web interface.
System development and management
MIDA has been developed by CMRC with funds from the Higher Education Authority (HEA)
under the Programme for Research in Third-Level Institutions (PRTLI). Additional funding
came from the Environment and Heritage Service, Northern Ireland. CMRC currently
maintains the Atlas from its own resources, since the initial development programme ended in
2007.
The implementation started in 2002, aiming to set up a centralized repository of spatial
datasets to be displayed via the web-GIS application. The main problems encountered during
the development were related to the wide range of data sources, with different data
management practices, data quality, scale, data licensing and metadata quantity, quality and
format.
21807-REL-T006.2 Annex 3 - page 45
The identification of data owners represented a time consuming activity, as well as the
digitalization of back data in non-GIS format and the production of missing layers. The MIDA
team had also to face problems related to data acquisition and licensing restrictions.
Quality control of data produced by other entities resulted very difficult to be performed;
system managers therefore decided to reduce to the minimum the elaboration of other
providers’ data and to include in metadata contents some indications about data quality.
The management of MIDA currently involves one full time staff and four part time resources.
Among them, Ned Dwyer is the MIDA manager. Kathrin Kopke is the data manager; she is the
coordinator of the acquisition and of preparation of new layers as well as updating the atlas.
The others provide technical support, contributing to the database design and programming
and creating, editing and preparing various GIS layers as well as completing metadata
records.
The broad nature of the atlas contents can be exploited by a wide range of potential users,
like:
Policy-makers;
Decision-makers;
Coastal planners and/or managers;
Specialised and expert GIS users;
Representative of private sectors (e.g. industrial or energy companies);
Students;
General public.
There are no different privileges/restrictions for different user typology. The on-line data
access is free to all the MIDA Atlas contents and functionalities.
Experience with the implementation
The graph below shows the number of visits per month as well as the number of unique visits
per month over the last year. The number of visits is always more than 600 visits/months, with
a peak in November with 1400 visits/months (Figure A3- 24).
An analysis performed in 2008 outpointed that most Atlas visitors were from the Republic of
Ireland, followed by visitors from the UK and the USA. High UK interest was expected, as the
MIDA was a cross border collaboration featuring island-wide dataset as well as some specific
Northern Irish data layers. The same 2008 usage statistics showed that the most popular
layers were from the socio-economic activity section, specifically water-based recreation. The
MIDA is also used in teaching on a number of courses organized by the Department of
Geography within UCC. Feedback by students indicates that MIDA is also utilized as a tool by
teachers in some secondary schools.

21807-REL-T006.2 Annex 3 - page 46
Figure A3- 24 Usage statistics for MIDA website.
No information about the effective use of the system as a support tool for ICZM is currently
available.
Further developments of MIDA are planned, depending on the availability of new resources. In
this perspective, the most important activity is the constant update of data and information
published in the Atlas. Other planned activities are the upgrade of the technology for metadata
management and web GIS interface. It is hoped to leverage developments in other funded
projects and re-use these elements within MIDA; an upgrade is expected by the end of 2011.
Concluding remarks
MIDA is a point of reference for coastal spatial data at national scale, and can be usefully
exploited by several kinds of users involved in ICZM. Among them County Councils, in charge
of strategic planning at local scale, can use the information contents of the atlas as a
consolidated and updated basis for further implementation and more detailed analysis through
their own methodologies and technologies.
Constant updating and further development of the system are crucial to guarantee MIDA’s key
driving role in regard to developing catalogue and atlas interoperability on a national and
international level, and could be an opportunity to strengthen the national consciousness of
coastal state and evolution, a fundamental step to implement adequate policies for ICZM.
21807-REL-T006.2 Annex 3 - page 47
Dorset Coastal Explorer
General Information
Dorset Coastal Explorer is a web GIS allowing users to visualize a great number of layers
related to the Dorset Region in the South of England. Spatial information is not only related to
the coastal area, but more in general to the whole Dorset territory. The system is also
particularly interesting since provides some innovative functionalities for data query and
investigation, also enabling to re-call information related to local planning. Dorset Coastal
Explorer provides the possibility to export customised maps as PDF documents.
Dorset Coastal Explorer development is strictly related to the activities of the Dorset Coast
Forum (http://www.dorsetforyou.com/dcf) that has been at the forefront of ICZM since 1995.
The Dorset Coast Forum is an established Strategic Coastal Partnership made up of over 220
public, private and voluntary member organisations, covering fishing, commercial,
environmental, recreational, historical and touristic sectors that, as a whole, have expertise
and local knowledge of Dorset's coast and inshore waters.
The Dorset Coast Forum covers from Lyme Regis to Christchurch out to 12 nautical miles. Its
primary objective is to encourage co-operation and dialogue between all the different
stakeholders of the coast in the Dorset area, promoting a sustainable approach to the
management, use and development of Dorset's coast and inshore waters.
C-SCOPE Interreg project (Cross Border 2 Seas Programme, http://www.cscope.eu/en/),
currently under going, is providing funds for the development of the Dorset Coastal Explorer.
This will be an innovative tool that will provide information on prevailing policies, ecology,
current uses and land/seascape features. It will list relevant planning policies and provide links
to their detail. The tool should be finalised by the end of 2011.
C-SCOPE will also develop a framework for integrating terrestrial and marine management
planning, involving the development of a pilot Marine Spatial Plan for a selected area of the
Dorset coast. Finally, C-SCOPE will provide a series of hi-tech interactive coastal information
points (or Coastal explorer access points) to improve stakeholders’ engagement.
The operating entity is the Dorset Coast Forum; the Dorset Coast Forum team is hosted by
Dorset County Council and funded by Weymouth and Portland Borough Council, Borough of
Poole, Environment Agency, Natural England, Wessex Water, Dorset Wildlife Trust, Dorset
County Council, West Dorset District Council.
The contact person at Dorset Coast Forum is James Feaver (e-mail:
[email protected]), Marine and Coastal GIS Officer, Dorset Coast Forum, Environment
Services, County Hall, Dorchester, Dorset, DT1 1XJ, United Kingdom.
21807-REL-T006.2 Annex 3 - page 48
Operational context and information content
The Dorset Coastal Explorer addresses all the ICZM dimensions, providing a lot of related
information. Governance dimension is particularly dense of information, while the
environmental dimension is less considered in the current version of the Dorset Coastal
Explorer.
Data and information providers are mostly government bodies and private entities. An
exhaustive list is provided in Table A3- 2.
Table A3- 2 Dorset Coastal Explorer data providers.
Provider Type
British Marine Aggregates Producers Association Industry body
British Marine Federation Recreational Industry body
CEFAS Government Agency
Channel Coast Observatory Regional Coastal Monitoring Programme
Fish Farms Private Company
DEFRA National Government Department
Department for Business, Enterprise & Regulatory Reform
National Government Department
Department of Energy and Climate Change. National Government Department
District Councils Local Authorities
Dorset Coast Forum Coastal Partnership
Dorset County Council Local Authority
Dorset Wildlife Trust Voluntary Sector
Dorset's Important Geological Sites Group Voluntary Sector
Eneco Private Company
English Heritage Government Agency
Environment Agency Government Agency
EROCIPS Previous EU project
European Environment Agency
Finding Sanctuary Project for Government Agencies
GetMapping and UK Perspectives Private Companies
Halcrows (for South Devon and Dorset Coastal Advisory Group)
Private Company project for Local Authorities
Joint Nature Conservation Committee (JNCC) Government Agency
London 2012
Marine Fisheries Agency Government Agency
National Grid Private Company
Natural England Government Agency
NOMIS Government Agency
Office for National Statistics (ONS) Government Agency
Oil & Gas UK DEAL Government Agency
Ordnance Survey National Mapping Agency
Plantlife Voluntary Sector
Portland Gas Ltd Private Company
Portland Harbour Authority Harbour Authority
Portland Port Private Company
21807-REL-T006.2 Annex 3 - page 49
Provider Type
Royal Yachting Association Recreational Industry body
SeaZone Private Company
The Crown Estate Government Agency
Weymouth and Portland Borough Council Local Authority
It is important to report in this analysis that at the moment many versions of the Dorset
Explorer 2.5 are available, like the Standard Edition, the East Dorset Local Plan Edition and
other versions dedicated to thematic groups (like highway and roads, footpaths, emergency
planning, etc.). Many of them are online while others are used via intranet or LAN.
Dorset Coastal Explorer is the version that is now under development within the C-SCOPE
project, and that will feature additional tools to support Marine Spatial Planning.
The different versions of the Dorset Explorer 2.5 have the same graphical interface, similar
tools and the same base maps and general thematic layers, but the dedicated versions
deepen the thematic sectors of interest.
The information content here described mainly refers to the Standard Edition and the Dorset
Coastal Explorer edition, but the reader must take into consideration that these systems are
currently being upgraded with new contents and functionalities.
Dorset Coastal Explorer includes a complex and wide series of layers, mainly related to:
– Base data (maps, historical aerial photos, boundaries, Digital Terrain Model (DTM);
– Historic environment (marine and terrestrial);
– Coastal Defence and Engineering (Shoreline Management, Shoreline Management
Policies in Short/Medium/Long Term, Flooding);
– Coastal Demographics;
– Conservation - Habitats (Intertidal, Terrestrial);
– Conservation - Protected Sites (Marine and Terrestrial, Statutory and Non-Statuary);
– Conservation - Species;
– Dredging and dredged material disposal;
– Fisheries (Bylaws, Closed Areas/Restrictions, Fishing Areas, Fishing Industry, Monitoring,
Nursery Areas, Shellfish, Spawning Areas);
– Geophysical (Geology, Oceanography, Bathymetry);
– Infrastructure;
– Land Ownership and Land Use;
– Marine Inputs;
– Military Activities;
– Mineral Extraction;
– Oil and Gas (On shore and off shore sites, Contingency Planning);
– Policies - Portland Harbour MSP;
– Policies - Weymouth & Portland Local Plan (Sport & Community Facilities, Natural
Environment, Development Constraints & Opportunities, Housing, Design & Built
Environment, Transport & Telecommunications, Tourism);

21807-REL-T006.2 Annex 3 - page 50
– Renewable Energy (Electricity Network, Tide and Wave, Wind);
– Shipping (General, Navigation, Ship Routes);
– Tourism and Recreation.
The above listed information fits the sub-national scale of Dorset region and relative coastal
marine zone. The various Dorset Explorer versions have been developed to be applied to
specific issues of the Dorset region, coastal management is one of them.
Integration among different information typologies is a task that will be performed in the next
development phase, in which ICZM and sustainability indicators could be implemented and
included in the system to fully support scientific-based decision making.
Metadata are currently available only in offline applications, in the new system to be
developed the UK GEMINI metadata standard and INSPIRE standard will be used to provide
online metadata.
Technological characteristics
Dorset Explorer 2.5 has been developed with MapInfo and MapXtreme technologies.
A technological upgrade of the system is also under development: the information contents
and functionalities of the Dorset Explorer 2.5 - currently being updated as well - will be
transferred to a more flexible platform, developed with jQuery, OpenLayers, Modernizr,
Proj4js, Google Chart API for the Client-side and FME, RouteWare, Oracle, .NET 4.0, .NET
MVC, ODP.NET (Oracle Data Provider), GeoServer with GeoWebCache (for WMS and WFS)
for the Server-side.
At the actual state of development, many of the layers reported in the previews sections are
“hotlinked” to additional information provided by interested entities. For example: identifying (or
interrogating) a ferry route a link to the home page of the ferry company providing the service
is available in the attribute table, or identifying a marine industry area a fact sheet with
information and web page of the specific facility is provided. Attribute tables and fact sheets
are downloadable in CSV format, while the download of spatial data is currently unavailable.
Even if at the actual state of development the Dorset Explorer has no proper integration with
other coastal information systems, the CIS development itself is strictly connected to the
development of the KustAtlas by the Belgian Co-ordination Centre for ICZM, as both are
participating to the European project C-Scope, aiming, inter alia, to develop tools for achieving
sustainable coastal economies and environments.
ICZM related functionalities
The online versions available at the moment feature standard pan, zoom, multi-layer identify
and measure tools; multi-time data is currently limited to the aerial photos, available for 2002,
2005, 2009).
The extensive information contents already available in the CSCOPE Dorset Explorer, with
particular reference to the inclusion of layers referred to coastal plans, policies and coastal
defence interventions, represent a powerful ICZM related functionality.
The flooding group layer, featuring flood zones (coastal and river), flood defences and areas
benefitting from flood defences, is another useful content for adaptive planning.
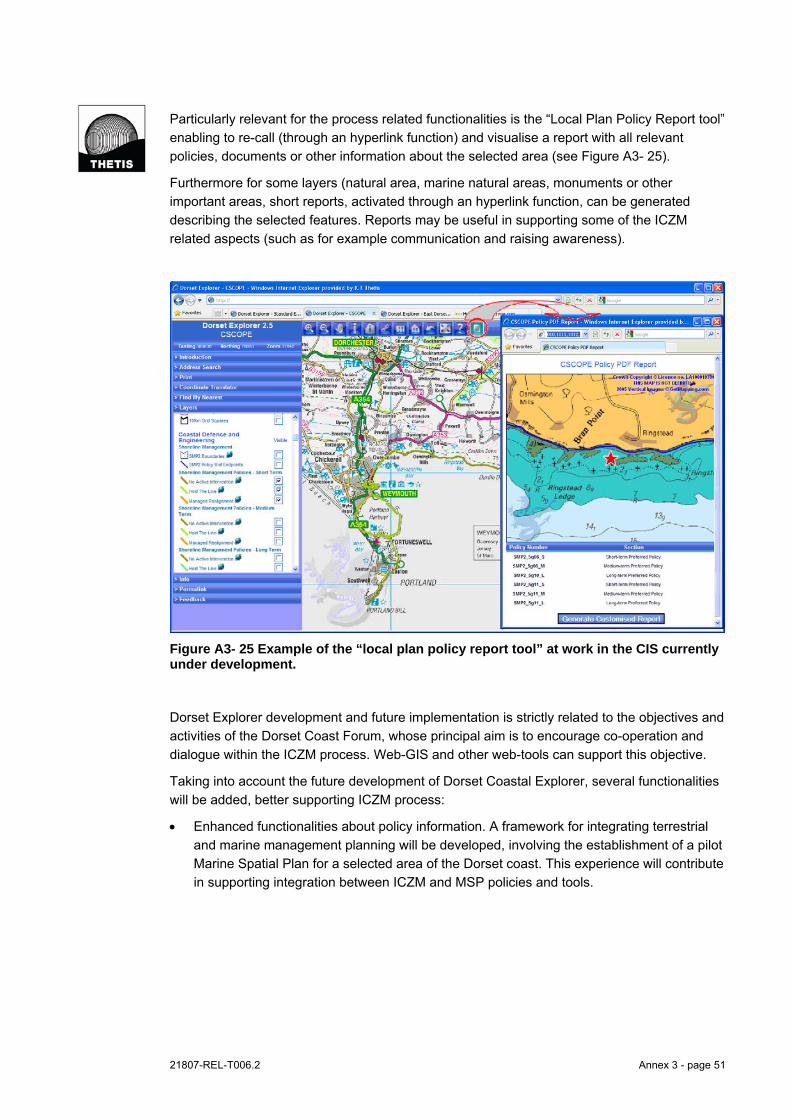
21807-REL-T006.2 Annex 3 - page 51
Particularly relevant for the process related functionalities is the “Local Plan Policy Report tool”
enabling to re-call (through an hyperlink function) and visualise a report with all relevant
policies, documents or other information about the selected area (see Figure A3- 25).
Furthermore for some layers (natural area, marine natural areas, monuments or other
important areas, short reports, activated through an hyperlink function, can be generated
describing the selected features. Reports may be useful in supporting some of the ICZM
related aspects (such as for example communication and raising awareness).
Figure A3- 25 Example of the “local plan policy report tool” at work in the CIS currently under development.
Dorset Explorer development and future implementation is strictly related to the objectives and
activities of the Dorset Coast Forum, whose principal aim is to encourage co-operation and
dialogue within the ICZM process. Web-GIS and other web-tools can support this objective.
Taking into account the future development of Dorset Coastal Explorer, several functionalities
will be added, better supporting ICZM process:
Enhanced functionalities about policy information. A framework for integrating terrestrial
and marine management planning will be developed, involving the establishment of a pilot
Marine Spatial Plan for a selected area of the Dorset coast. This experience will contribute
in supporting integration between ICZM and MSP policies and tools.
21807-REL-T006.2 Annex 3 - page 52
System development and management
Responsibilities for the system are divided. The Dorset Coast Forum manages the coastal
data (1 person). The tool (development and maintenance including base mapping data) is
managed by the County Council GIS team (5 persons).
Difficulties in developing the system mainly deal with copyright issues.
It is important to underline that the development of Dorset Coastal Explorer has been steered
by a Task and Finish group made up of Coast Forum Staff, GIS team members and a number
of external stakeholders.
Experience with the implementation
The actual versions of the Dorset Explorer 2.5 are used by different departments of public
entities (Fire department, for example). The Dorset Explorer 2.5 version dedicated to coastal
management (Dorset Coastal Explorer) is under development and therefore not in use yet.
The scope, aim and target audience of Dorset Coastal Explorer under development within the
C-SCOPE project have been discussed with stakeholders, which outpointed the need of a tool
to analyse and support coastal management and planning.
Public participation has been used for useful data collection by the Dorset Coast Forum.
Concluding remarks
The CIS under development by the Dorset Coast Forum within the C-SCOPE project already
features powerful ICZM related functionalities explicitly aimed to support coastal management.
While the other CIS developed within the C-SCOPE - the KustAtlas - has been oriented by the
involved stakeholder to a wide audience, the Dorset CIS addresses policy makers and coastal
planners.
C-SCOPE will also develop a framework for integrating terrestrial and marine management
planning, involving the development of a pilot Marine Spatial Plan for a selected area of the
Dorset coast. This experience will contribute in supporting integration between ICZM and MSP
policies and tools.
The Dorset Coastal Explorer in its final release could be one of the best examples of tools in
support of ICZM. The following challenge could be represented by its effective use in decision-
making processes dealing with coastal and marine zones.

21807-REL-T006.2 Annex 3 - page 53
Cork Harbour Geographic Information System
General Information
The Cork Harbour GIS was initially developed within the Interreg COREPOINT project (COastal
REsearch and POlicy INTegration) between 2004 and 2008, and then maintained and updated
by the Coastal and Marine Research Centre of the University College Cork (CMRC, website
http://cmrc.ucc.ie).
One of the main goals of the COREPOINT project was to bridge the gap between research
institutions and local authorities dealing with ICZM. The project intended to properly use
scientific experience and resources to provide improved information for planners responsible
for local coastal areas as part of an ICZM approach. The project selected Cork Harbour as
one of the sites for the development of GIS tools supporting the ICZM process.
The Cork Harbour initiative focused on coastal vulnerability, habitat loss, tourism pressures
and development options for a Brownfield area. Inside the COREPOINT activity, the final
outcome of the Cork Harbour ICZM related initiative was the development and publication of
an Integrated Management Strategy for Cork Harbour in 2008. The strategy was the result of a
cooperative effort jointly produced by local authorities and academic experts.
The Cork Harbour initiative also included the development of a GIS providing support to the
above ICZM processes. The GIS is also used as an intermediary mechanism to collect
shoreline feature data and as a framework to house the “Coastal Inventory spatial database”
of shoreline features (see http://cmrc.ucc.ie/CI/index.htm). The GIS and the coastal inventory
compose a Coastal Information System (CIS) aiming to support the monitoring, management,
development and conservation of coastal, estuarine and riparian habitats.
Cork Harbour and the related CIS were also analysed by the EU FP7 SPICOSA project (2009-
2011) to develop a self-evolving and operational research approach framework for the
assessment of policy options for the sustainable management of coastal zone systems.
At the moment funding for the support and the implementation of the Integrated Management
Strategy and hence the development of the CIS, are allocated through a new INTERREG
project called IMCORE.
The Planning Policy Unit (PPU) of Cork County Council and the Coastal and Marine Research
Centre (CMRC) of University College Cork are IMCORE project partners. They also operate
the Secretariat function in joint venture, representing the CIS operating entity. One of the main
functions of the Secretariat is to manage the stakeholder’s involvement in the process, and to
maintain the http://www.corkharbour.ie website, which will be a focal point for information on
relevant activities. Cork Harbour CIS is currently an operational offline system used c/o
CMRC.
The contact person at CMRC is Cathal O’Mahony, email [email protected], while Darragh
O’Suilleabhain is the executive planner at the Planning Policy Unit (PPU) of Cork County
Council.
21807-REL-T006.2 Annex 3 - page 54
Operational context and information content
The CIS is scaled to the Cork Harbour area, a large natural harbour on the southern coast of
Ireland, that represent a complex estuarine coastal system with a water body surface area of
approximately 100 km2. Some parts of the area are also densely populated, with about 65% of
County Cork’s population living in close proximity to the coast.
The CIS addresses all the considered information dimensions: environmental (e.g. shoreline,
river), territorial (land use manmade shoreline, roads) society (e.g. residential structures,
marinas, water safety training, diving), economic (industrial area, tourism activities),
governance (County Development Plan).
The Coastal Harbour CIS includes the following main spatial layers:
– Base data (Orthoimagery, Administrative boundaries, etc.);
– Shoreline type (natural or manmade, e.g. revetments, sea walls, beaches, docks, rocky
shores);
– Shoreline features (e.g. jetties, piers, pontoons, steps, ladders);
– Shoreline vulnerability (e.g. state of repair, conditions, erosion);
– Adjacent Land use (e.g. agriculture, industry, residential, amenity);
– Population density;
– Tourism structures (marinas, diving, charter companies, and sailings clubs);
– Infrastructures and footpaths;
– Activities (Angling, Sailing, Family and adventure, Rowing, Diving, Surfing);
– County Development Plan layers.
Data providers are universities, research institutions, cartographic institutions or agencies that
allow free data distribution. CMRC also carries out in-field geomorphological surveys and
monitoring activities using GPS technologies to integrate the system’s informational content.
The CIS is offline, so metadata is managed with desktop applications.
The system is intended to be a model that can be easily replicated in different sites. The
Coastal Inventory is currently used at CMRC and PPU and by local emergency planners and
tourism agencies, and can be easily replicated and integrated in other local contexts.
Technological characteristics
The core component of the CIS is the Coastal Inventory spatial database, a repository of
vector and raster data in various formats. Data implementation and DB management is
operated at CMRC with ESRI desktop applications. PPU use the Coastal Inventory spatial
database as an additional component to the MapInfo systems in use at their offices.
In relation to interoperability and data access, data (raster and vector) can be distributed by
CMRC in accordance with copyrights of third parties and the governing law, by directly
contacting the Coastal Inventory Team at CMRC.
The CIS is not directly integrated with other systems, but part of the informational contents are
shared with the Marine Irish Digital Atlas http://mida.ucc.ie/.

21807-REL-T006.2 Annex 3 - page 55
ICZM related functionalities
Cork Harbour CIS provides some of the knowledge related functionalities considered by the
analysis, like the availability of spatial information in GIS format, the availability of multi-time
data, the inclusion of data related to the assessment of coastal vulnerability.
Figure A3- 26 Cork Harbour CIS on ArcGIS desktop application featuring shoreline inventory.
The actual conformation of the CIS provides little summary information that can directly
support the ICZM process (costal vulnerability layers are available). Indicators, integrated
maps, graphs, summary reports and fact sheets can be easily produced by expert GIS users
exploiting the Coastal Inventory spatial database.
The Cork Harbour CIS was developed in order to specifically support the local ICZM
experience. Within the COREPOINT project, the ICZM experience focused on the first three
(of the five) steps identified for the Cork Harbour area: (i) Issue identification and assessment,
(ii) Programme preparation, (iii) Formal adopting and funding. These activities finally led to the
publication of an Integrated Management Strategy for Cork Harbour in 2008.
The process that underpinned the development of this Strategy document involved a
leadership and facilitation role by the local COREPOINT project partners, communication with
stakeholders through the Cork Harbour Forum, the organisation of two stakeholder
workshops, and consultation with a Strategic Advisory Group (SAG, currently named Harbour
Management Focus Group).
The implementation of the ICZM Strategy (forth step of the process) is currently on-progress
and involve the design and publication of an ICZM Action Plan (2008-2011). The Action Plan
is yearly delivered and subsequently reviewed taking into consideration the interactive nature

21807-REL-T006.2 Annex 3 - page 56
of ICZM and the need to ensure a flexible process to deal with emerging and changing
priorities.
The Cork Harbour CIS has therefore provided data and functionalities supporting various
aspects of the ICZM experience, including problem understanding and structuring,
assessment of alternatives in planning and management, monitoring and evaluation, adaptive
planning and management. Furthermore, through the IMCORE project, specific research is
undertaken to examine the use of scenarios to support the planning process for climate
change and ultimately benefit local coastal communities.
System development and management
The Coastal Inventory and the Cork Harbour GIS are developed by CMRC on voluntary basis,
aiming at providing a local model to be used in many ICZM contexts, filling an informational
gap in the local authorities’ coastal governance.
The main barriers encountered in developing the system are related to copyright issues and to
the definition of a shared goal. Another bottleneck is that the Integrated Management Strategy
reported in the previous paragraphs is a volunteer initiative, not binding for the entities taking
part to it. Even if the strategy sets quarterly meetings of the partners, some lack of interaction
between entities can be observed.
The Cork Harbour CIS was created following the guide line set out in the report "Guidelines for
Implementing Local Information Systems at the Coast", developed within the COREPOINT
project. The Guidelines were developed on the basis of the experience on local ICZM
processes of six COREPOINT partners (Essex Estuaries, Sefton Coast, Severn Estuary, Fal
Estuary, and Cork Harbour) and results of the engagement and participation of over 100 local
stakeholders.
System development and management is in charge of 4-5 persons (not at full time) at CMRC.
Cathal O’Mahony is manager of the local node of the system, while Vicki O'Donnell, in charge
of data validation and updating, is the contact person at CMRC for data commissioning.
Users of the Cork Harbour CIS are mainly coastal planners, managers, and regulators (i.e.
decision makers level).
Future activities foresee the development of a web GIS that will be made available to all
potential users (see http://www.corkharbour.ie/pages/gis.htm).
Experience with the implementation
At the moment, the access of the system is restricted only to off-line users at CMRC and PPU.
Next development steps will implement a web GIS that will enhance Interactiveness and data
access. CMRC developed the Cork Harbour GIS as a model to be replicated and further
developed in different institutions to support the Cork Harbour development strategy.
At the Planning Policy Unit (PPU) of Cork County Council the Coastal Inventory is used as an
additional informational component of the systems in use at their offices. Darragh
O’Suilleabhain is the executive planner at PPU that follows the project. The CIS has been
used as a support tool to develop the “Marine Leisure Infrastructure Strategy” of the Cork
County Council.
21807-REL-T006.2 Annex 3 - page 57
No specific e-participation tools are currently available apart from the point of contact in the
CMRC web page, but the actual state of the system derives from a wide participatory
approach and activities (i.e. Cork Harbour Forum, Harbour Management Focus Group, Cork
Harbour News, thematic workshops, Working Groups, etc.).
Concluding remarks
The Cork Harbour GIS is a system with a very simple architecture, not oriented to provide an
exhaustive set of information contents and tools for ICZM, but rather aimed at offering a case
study approach to bridge the gap between research institutions and local authorities dealing
with ICZM.
The actual efficacy of the system in supporting the implementation of the ICZM process is
demonstrated by the successful and productive joint venture between the research institution
that developed the system (CMRC) and the local planners involved in ICZM (PPU).
The further implementation of the system, which will enhance the participatory and process
related functionalities, could lead to a more structured and deployable tool able to support
many other aspects of the ICZM.
21807-REL-T006.2 Annex 3 - page 58
GEOIDD-Litto
General Information
GEOIDD-Litto (Géographie et indicateurs liés au développement durable sur le littoral -
Geography and indicators related to coastal sustainable development) is a coastal, marine
and maritime web cartographical tool that allows to access a variety of geographical and
statistical information, both for land and sea, along the French coast and overseas
departments (Guadeloupe, Martinique, Guyane, Reunion).
GEOIDD-Litto is an initiative of the Observatoire du Littoral (French Coastal observatory). The
Observatory includes, as part of an agreement, the Ministry of Ecology, Sustainable
Development, Transportation and Housing; the Inter-ministerial Delegation for Territorial
Planning (DATAR) and the General Secretariat of the Sea. The Centre has a Steering
Committee, a body chaired by DATAR and bringing together all government signatories of the
agreement as well as the Ministry of Food, Agriculture and Fisheries, the French Research
Institute for Exploitation of the Sea (IFREMER), Hydrographic and Oceanographic Department
of the Navy (SHOM), the National Council for Geographic information (CNIG), the Agency for
Marine Protected Areas and the coastal conservancy.
GEOIDD-Litto responds to some of the main objectives of the French Observatoire du Littoral,
in particular related to:
Organise and share information and data on the coastal system;
Improve the vertical and horizontal information flow among different administrations
dealing with coastal management issues;
Contribute to the discussion on the standardization of protocols for collecting, processing
and sharing data.
The operating entity is the Observatoire du Littoral (French coastal observatory). It includes,
as part of an agreement: the Ministry of Ecology, Sustainable Development, Transportation
and Housing; the Inter-ministerial Delegation for Territorial Planning; the General Secretariat
of the Sea.
The home page of the coastal observatory’s cartographical tool is
http://www.littoral.ifen.fr/Cartographie.6.0.html. The contact person is Sébastien Colas at the
Ministry of Ecology, Sustainable Development, Transportation and Housing (e-
mail:[email protected]).
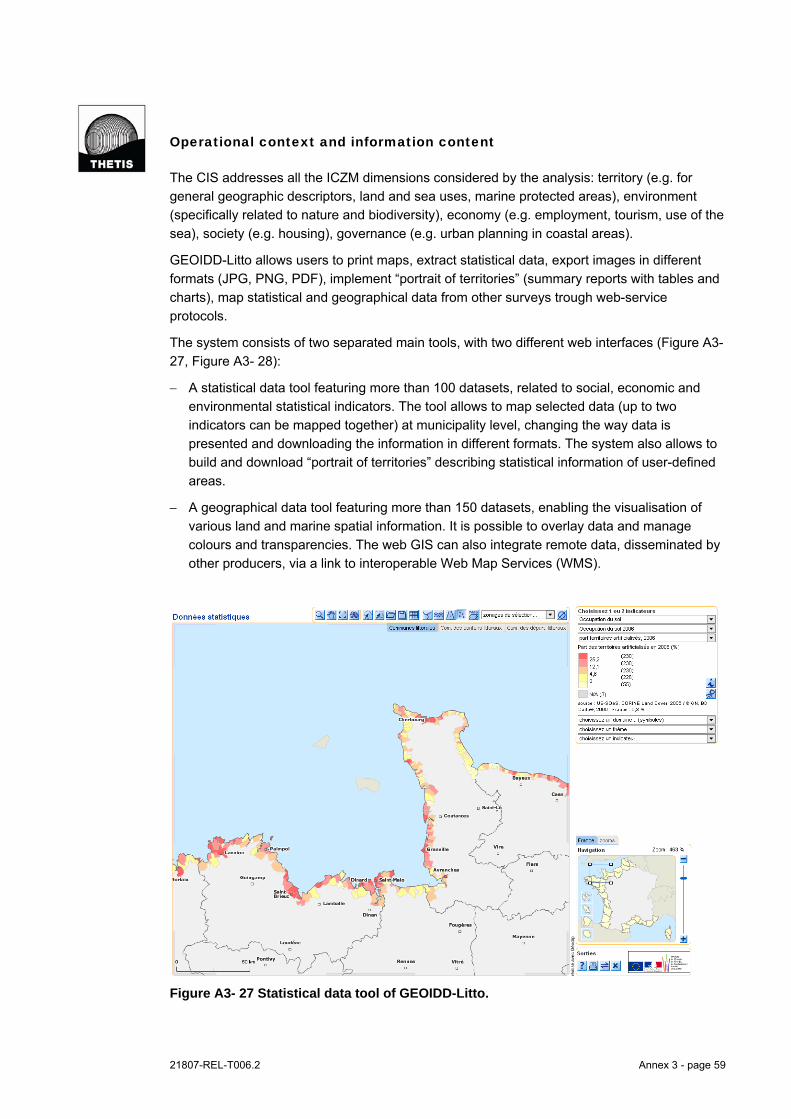
21807-REL-T006.2 Annex 3 - page 59
Operational context and information content
The CIS addresses all the ICZM dimensions considered by the analysis: territory (e.g. for
general geographic descriptors, land and sea uses, marine protected areas), environment
(specifically related to nature and biodiversity), economy (e.g. employment, tourism, use of the
sea), society (e.g. housing), governance (e.g. urban planning in coastal areas).
GEOIDD-Litto allows users to print maps, extract statistical data, export images in different
formats (JPG, PNG, PDF), implement “portrait of territories” (summary reports with tables and
charts), map statistical and geographical data from other surveys trough web-service
protocols.
The system consists of two separated main tools, with two different web interfaces (Figure A3-
27, Figure A3- 28):
A statistical data tool featuring more than 100 datasets, related to social, economic and
environmental statistical indicators. The tool allows to map selected data (up to two
indicators can be mapped together) at municipality level, changing the way data is
presented and downloading the information in different formats. The system also allows to
build and download “portrait of territories” describing statistical information of user-defined
areas.
A geographical data tool featuring more than 150 datasets, enabling the visualisation of
various land and marine spatial information. It is possible to overlay data and manage
colours and transparencies. The web GIS can also integrate remote data, disseminated by
other producers, via a link to interoperable Web Map Services (WMS).
Figure A3- 27 Statistical data tool of GEOIDD-Litto.

21807-REL-T006.2 Annex 3 - page 60
Figure A3- 28 Geographical data tool of GEOIDD-Litto.
Information content is available for metropolitan French NUTS 3 and for overseas NUTS 31,
and is structured in the following thematic issues, for each of them the availability of
geographical data and/or statistical data interface is indicated:
land use - geographical and statistical data tool;
water - geographical and statistical data tool;
nature and biodiversity - geographical and statistical data tool;
administrative boundaries - geographical data tool;
transports routes - geographical data tool;
zoning and uses of the sea - geographical data tool;
coastal morphology - geographical data tool;
natural risks - statistical data tool;
agriculture - statistical data tool;
tourism - statistical data tool;
population housing - statistical data tool;
employing - statistical data tool;
urban planning - statistical data tool.
1 NUTS stands for Nomenclature d'Unités Territoriales Statistiques (Nomenclature of Territorial Units for Statistics). NUTS 3 is the more detailed NUTS level.
21807-REL-T006.2 Annex 3 - page 61
Data providers are mainly national public institutions and agencies. Most of the statistical data
is provided by ministerial statistical surveys, Water Agency or IFREMER. Geographical data is
mainly provided by the French National Institute for Geography (IGN) and by the Hydrographic
and Oceanographic Service (SHOM). CORINE Land Cover is produced by the Ministry of the
Environment, while protected areas are provided by the Ministry of Ecology, Sustainable
Development, Transportation and Housing. Exhaustive lists of statistical and geographical
data, with indication of data providers and date of publication, are available at the following
pages linked to the coastal observatory webpage:
http://www.littoral.ifen.fr/fileadmin/user_upload/divers/liste_geo.pdf
http://www.littoral.ifen.fr/fileadmin/user_upload/divers/liste_stats.pdf
Integrated data are not directly provided. However, the statistical data tool enables to generate
maps combining the simultaneous visualisation of two indicators, thus providing partially
integrated information. By mean of the geographical data tool, more layers can be displayed in
the same map, enabling to customize and export integrated maps.
Metadata is available for every dataset as a PDF factsheet linked to every indicator in both
statistical and geographical tools, describing data domain, theme, type, description, date of
publication, provider and scale.
Technological characteristics
The system uses Flash technology, while databases work with PHP and MySQL technologies.
The system collects most of the statistical and geographical data available in France.
Integration with other tools is provided in the “useful links” page where, inter alia, the following
links are available:
Geolittoral, an additional tool managed by the CETE Normandy Centre Directorate
General of Planning, Housing and Nature that provides large scale data including free
coastal orthoimagery;
Bosco webpage, observation base for coastal monitoring implemented jointly by the
BRGM (French geological survey) and CETMEF (Maritime and River Technical Studies
Centre), containing shoreline metadata from different sources;
Territorial observatory, governmental web site providing interactive mapping and
download of hundreds of environmental, social and economic data;
Observatory of the Aquitaine coast, decision support tool for the management and
development of the Aquitaine coast;
The system has been developed following the INSPIRE and MOTIIVE standards,
guaranteeing high interoperability. The geographical data tool provides full interoperability
with other data providers’ spatial information through OGC - WMS application.
Only statistical data is downloadable as XLS files, while spatial data cannot be downloaded
due to copyright issues, but only visualised in the web tools. Nevertheless, both statistical and
geographical interfaces feature several tools to upload and visualise custom data, allowing
integrated analysis with the information provided by the GEOIDD-Litto. The overall
interoperability is good, the system is designed as a central node to visualise and analyse
coastal data, rather than a portal to acquire data to be further implemented in decentralized
systems.

21807-REL-T006.2 Annex 3 - page 62
ICZM related functionalities
Several knowledge and process related functionalities supporting ICZM are available in the
GEOIDD-Litto. Multi-time information is available mainly for the statistical data tool for socio-
economic and territorial data, (e.g. land use, unemployment rate) but also for environmental
data (water quality in different years). A dedicated animation tool is available to analyze multi-
time data as a temporal slideshow (Figure A3- 29). The CIS includes also maps of ICZM
indicators, such as for example area of built up land, protected areas, land take by intensive
agriculture, sectoral employment.
Figure A3- 29 Temporal animation tool to analyse multi-time data.
The statistical data tool is particularly relevant to support problem understanding and decision
making in general. Indeed, it allows to not only map and download data and metadata related
to selected statistics, but also to generate customized “portraits” on a specific spatial selection.
“Portraits” are short report including summary tables and charts (see Figure A3- 30).
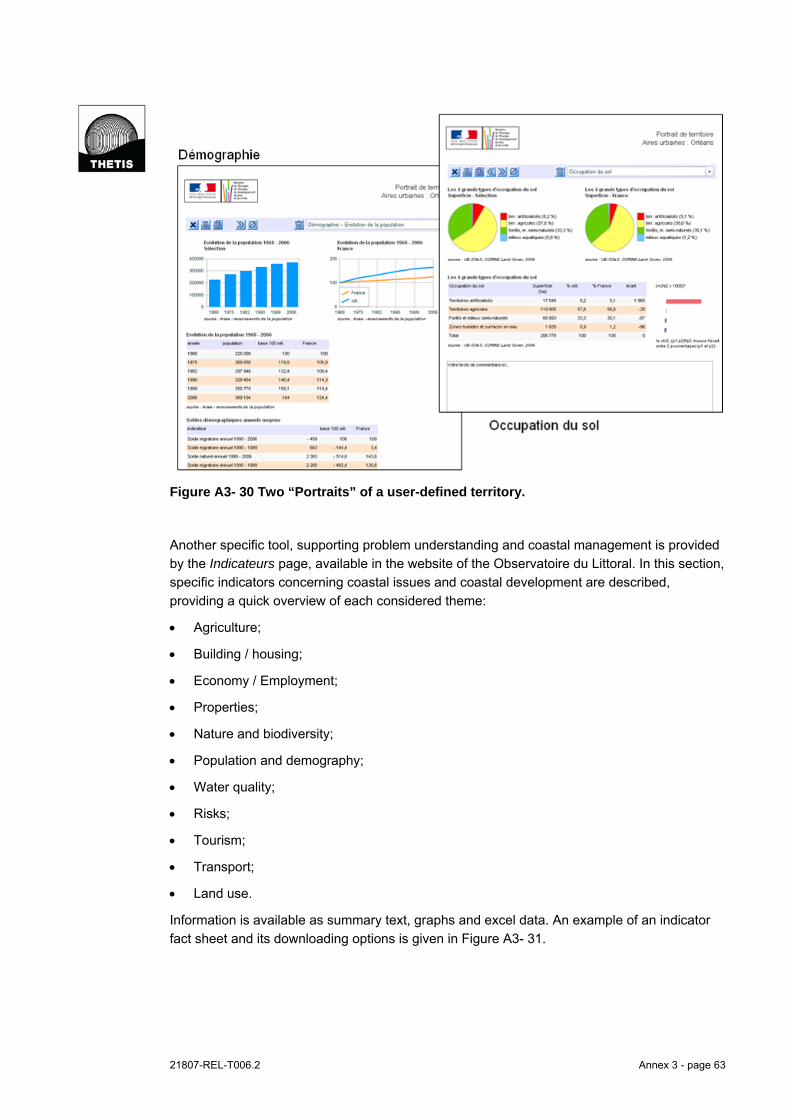
21807-REL-T006.2 Annex 3 - page 63
Figure A3- 30 Two “Portraits” of a user-defined territory.
Another specific tool, supporting problem understanding and coastal management is provided
by the Indicateurs page, available in the website of the Observatoire du Littoral. In this section,
specific indicators concerning coastal issues and coastal development are described,
providing a quick overview of each considered theme:
Agriculture;
Building / housing;
Economy / Employment;
Properties;
Nature and biodiversity;
Population and demography;
Water quality;
Risks;
Tourism;
Transport;
Land use.
Information is available as summary text, graphs and excel data. An example of an indicator
fact sheet and its downloading options is given in Figure A3- 31.
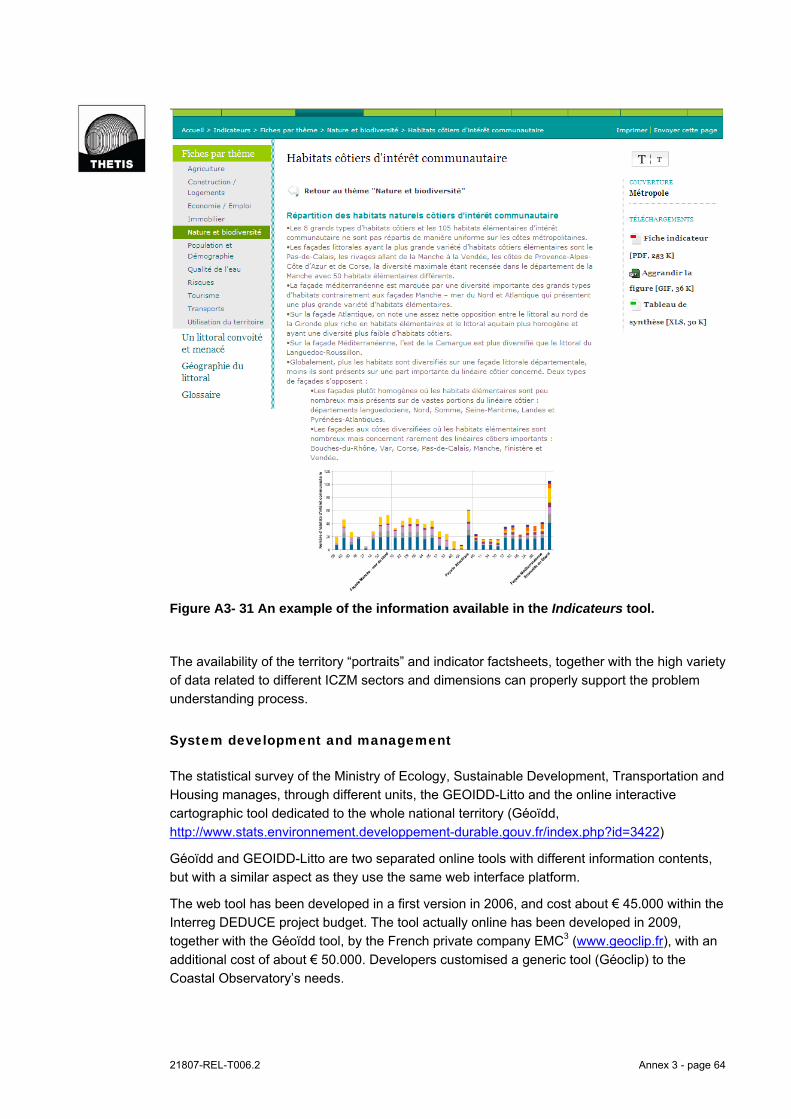
21807-REL-T006.2 Annex 3 - page 64
Figure A3- 31 An example of the information available in the Indicateurs tool.
The availability of the territory “portraits” and indicator factsheets, together with the high variety
of data related to different ICZM sectors and dimensions can properly support the problem
understanding process.
System development and management
The statistical survey of the Ministry of Ecology, Sustainable Development, Transportation and
Housing manages, through different units, the GEOIDD-Litto and the online interactive
cartographic tool dedicated to the whole national territory (Géoïdd,
http://www.stats.environnement.developpement-durable.gouv.fr/index.php?id=3422)
Géoïdd and GEOIDD-Litto are two separated online tools with different information contents,
but with a similar aspect as they use the same web interface platform.
The web tool has been developed in a first version in 2006, and cost about € 45.000 within the
Interreg DEDUCE project budget. The tool actually online has been developed in 2009,
together with the Géoïdd tool, by the French private company EMC3 (www.geoclip.fr), with an
additional cost of about € 50.000. Developers customised a generic tool (Géoclip) to the
Coastal Observatory’s needs.
21807-REL-T006.2 Annex 3 - page 65
GEOIDD Litto is developed in flash technology in order to provide quick and interactive map
services and to work in vectorial format. All the databases work with PHP and MySQL
technologies and are connected with a custom web interface that allows an easy consultation
of new indicators and geographical data, change of reference frame, etc..
The management of the online system (i.e. publishing new geographical or statistical data,
updating the "portraits " pages, publishing new zoning, updating the representation of
indicators, updating of metadata, etc) is in charge of one person (not full-time).
About difficulties encountered in developing the system, the management of sensitive data
can be reported. The Observatory in fact, as a National statistical service, has sometimes to
deal with secret statistical data.
Online tools have no restricted areas or privileged user typologies. Taking into account the
Observatory’s mission and the information content of the CIS, the target users can be mainly
identified as:
Decision makers;
Coastal planners and/or managers;
General public.
Experience with the implementation
Supporting the General Secretariat of the Sea (Secrétariat général de la mer), the
Observatoire du Littoral represent France in the European working group about indicators and
monitoring data of ICZM. It also constitutes the main interlocutor of the European
Environmental Agency and of the European Topic Centre on Terrestrial Environment. Through
the involvement of IFREMER (French Research Institute for Exploitation of the Sea), the
Observatoire du Littoral is also involved in Interreg Project Deduce for the development of the
27 indicators of ICZM.
No information about the effective use of the system as a support tool for ICZM is currently
available.
As reported by the CIS’s managers, the web tools are used by hundreds of people every
month, mostly to map indicators or to produce "portraits" for local spatial planning. The typical
users are researchers, local entities staff (like Départements and Régions employees),
planners and students.
Concluding remarks
GEOIDD-Litto is the National point of reference for coastal statistical data. The system is
designed as a central node to visualise and analyse coastal data, rather than a portal to
acquire data to be further implemented in decentralized systems.
The system provides powerful knowledge related functionalities that can support ICZM
processes, but has no interconnections with stakeholders or local authorities in charge of
coastal planning.

21807-REL-T006.2 Annex 3 - page 66
REDIAM - Environmental Information Network of Andalusia
General Information
REDIAM is a web-oriented system designed for the integration, standardisation, use and
publication of all the information about the Andalusian environment generated by all types of
producers of environmental information centres in the Autonomous Community.
REDIAM home page (Figure A3- 32) is
http://www.juntadeandalucia.es/medioambiente/site/web/rediam/; from this web site different
services are available: a data catalogue for information and services, a download area, a
section dedicated to information requests, FAQ and stakeholder involvement tools, thematic
web GISs.
Figure A3- 32 REDIAM home page.
E-mails for direct information requests and suggestions are available
([email protected] and [email protected] respectively), as
well as log-in section for registered users, news area and direct links section to general
services.
The system is composed by several integrated subsystems, which refer to main topics whose
importance and interest deserve special treatment, like:
Biodiversity;
Geodiversity;
21807-REL-T006.2 Annex 3 - page 67
Climate;
Waters;
Wetlands;
Urban environment;
Coastal and marine environment.
Each subsystem is used in the different system functionalities as a reference to search and
manage metadata and spatial / alpha-numeric information sets about these topics.
Coastal and marine environment subsystem include the information collected and controlled in
the precedent CMA project called SIGLA (GIS of Andalusian Coast), which has been
integrated in this new system to guarantee an easier update, standardisation and publication
of coastal and marine information.
The coastal and marine environment subsystem is aimed to be the official information
reference for all technician and decision-makers of Andalusian Government, but also for other
members of the network, other entities involved in ICZM, stakeholders and general public. The
coastal and marine environment subsystem is going to be upgraded with the publication in the
REDIAM of a new web GIS application dedicated to coastal and marine environment, with
specific functionalities for ICZM.
Operational context and information content
REDIAM is explicitly aimed to be the main repository of Andalusian environmental data, but
also contains territory and society useful information for ICZM.
REDIAM information Catalogue is composed by the following topics:
Territory characterization (topographic info, orthophotos and orthoimagery);
Geographical references (reference systems, geographical grids, toponyms);
Administrative units;
Natural resources (biodiversity, geodiversity, climate, water, landscape);
Environmental quality (atmosphere, water, soil, waste, forest ecosystems);
Risk (natural hazards, accidents and natural disasters);
Natural heritage (protected natural areas, public forests, trails, public facilities);
Areas of special interest (urban environment, coastal and marine environment);
Environmental planning (natural areas planning, forest plans, water plans);
Land use (land use, forest resources, mineral resources, water resources, transport and
mobility, hunting);
Environmental protection facilities;
Demography, Health.

21807-REL-T006.2 Annex 3 - page 68
The “coastal and marine environment” subsystem , accessible from the catalogue topic “Areas
of special interest”, contains about 30 information dataset (mainly GIS layers, but also
publications and indicators), mainly referring to coastal physiography, characterization of the
coastline, bathymetry, land use, sea level, waves, winds, streams, reservoirs, water quality,
fisheries, artificial reefs, etc.).
For every information dataset a detailed metadata page can be found in the web site or
accessed through intranet or extranet applications dedicated to Andalusian Government
personnel or other members of the network (Figure A3- 33).
REDIAM is designed as an easy and flexible data provider that allows any user to make
further data elaboration, but also provides thematic map viewers integrating different layers
and tools, thematic web map services and downloadable static maps.
REDIAM is explicitly dedicated to Andalusian territory. Thematic viewers fit regional reference
scale but allow to zoom into greater scale contexts. Multi-scale definitions are provided for
raster data. Original scale of layers is indicated in metadata sheet when pertinent (for example
topographic sheets imported from original paper version).
The system managers activated a membership programme to share information,
methodologies and tools with universities, research institutions, statistics institutions,
environmental agencies, cartographic institutions, etc.. Members contribute in providing and
updating the information, and can access the system with a preferential channel (i.e. extranet
connection to CMA servers).
In February 2011 REDIAM can count on about one hundred members, mainly representing
departments of Andalusian universities with specific tasks dealing with environment and
sustainable development, but public and private companies and institutions also belong to the
network. Some of the members have specific tasks in close connection with ICZM dimensions,
like for example:
Coastal and marine geological unit, Earth Sciences Department of Cadiz University;
Research unit for coastal planning, Geography Department of Seville University;
Marine hydrographical institute (National Ministry of Defence);
Public agency of Andalusian Ports, Andalusian Ministry of Transports;
Andalusian Ministry of Tourism;
Agricultural and Fishery research institution of Andalusia.
A scheme of REDIAM members follows.

21807-REL-T006.2 Annex 3 - page 69
Figure A3- 33 REDIAM members’ scheme.
21807-REL-T006.2 Annex 3 – page 70
Technological characteristics
REDIAM makes up the Regional Focal Point of Andalusia for the European Information and
Observation Network about the Environment (EIONET) and is the specialized node in
Environmental Information within the Spatial Data Infrastructures of Andalusia (Infrastructura
de Datos Espaciales de Andalucia - IDEAndalucia).
The main technologies used are:
ESRI (for Geo-DB and spatial data standardisation),
Oracle (for alphanumeric and metadata storage),
MapServer (for web-GIS development),
OGC (for spatial data services).
To guarantee a high level of interoperability and flexibility of the system, the REDIAM web
page share standardised and uniform core information through Web map services (WMS) and
downloadable data in SHP, GML and KML formats.
INSPIRE Directive has been used as the protocol to standardise spatial data, EUROSTAT
standards for statistics, SEIS protocol for methodologies.
ICZM related functionalities
The Coastal and marine environment subsystem, explicitly aimed to support the Andalusian
ICZM, contains the information gathered by the SIGLA project and several other specific
studies, such as diagnostics of coastal sustainability plan developed by the Andalusian
Ministry of Environment, the information on Management plans for natural resources of the
coastal parks, maps by the Spanish Institute of Oceanography (ESPACE project), and other
results of projects related to the costs developed by various research centres.
This information is gradually expanding and complementing the existing basic information. At
the time of writing this report, the last WMSs published in Coastal and marine environment
subsystem are:
Physiographical Units of Andalusian Coasts, 2010;
Urban sprawl along the coast, 1956-2007 (3 layers at different scales);
Morphological characterisation of the coast (hierarchical legend and thematic layers for
urban areas, infrastructures, river mouths, dunes and beaches).
For every information dataset a detailed metadata page (Figure A3- 34) can be found in the
web site, where users can also ask for more information through a dedicated page that allow
to send a certified message to system managers, or download the dataset containing spatial
data (SHP and GML), PDF documents describing data template, data elaboration and
classification and metadata (XSL and XML format). Useful spatial information for ICZM can
also be directly accessed by Web Map Services and therefore integrated in desktop and web
application.

21807-REL-T006.2 Annex 3 – page 71
Figure A3- 34 Example of metadata presentation in REDIAM web site. The links at the bottom of the page allow to read more detailed metadata, download the dataset or request more information.
Indicators included in the system (like coastal erosion, turbidity, chlorophyll, water
temperature) are elaborated by CMA from remote sensing images. A publication on
Andalusian ICZM Indicators (Sistema de Indicadores para la gestión integrada del Litoral de
Andalucía - SILA) is also downloadable by the Coastal and Marine Subsystem. The document,
published in 2007 by the Ministry of the Environment of Andalusia, is based on UNESCO
handbook for measuring the progress and outcomes of Integrated Coastal and Ocean
Management, and consists in the gathering of indicators developed by several institutions at
different scales, in the analysis of the most suitable ones for Andalusian coastal areas and
proposes a methodology to define and update a set of indicators for ICZM in Andalusia.
A coastal vulnerability index has also been developed, based on morphological, sea rise and
urbanisation data, but is not published in the web application because needs an expert usage
to be correctly understood and applied.
At present a new tool for ICZM is going to be integrated in the REDIAM, consisting in a
dedicated 2D, hybrid and 3D web GIS integrating general territory information, dedicated
coastal analysis and characterization, web map services provided by other entities (cadastre,
geological service, protected natural areas network), digital terrain and marine bottom model
associated layers and analysis tools (Figure A3- 35).

21807-REL-T006.2 Annex 3 – page 72
Figure A3- 35 Preview of new web GIS for coastal and marine environment, to be published in the REDIAM in 2011.
The new web GIS contains the spatial information about Andalusian coast mentioned above,
and integrates it with new layers and tools, like toponyms, photographical documentation,
environmental and tourist information, route tools, DTM derived layers (shaded relief, slopes,
contours, etc.) and tools (sections and flooding simulator), marine geological and
geomorphological maps, topographic maps and satellite images, tool for comparison of multi-
time cartographies (Figure A3- 36 and Figure A3- 37).

21807-REL-T006.2 Annex 3 – page 73
Figure A3- 36 Preview of the new tool for comparison of multi time cartographies that will be available in new REDIAM web GIS for coastal and marine environment.
Figure A3- 37 Preview of flooding simulator that will be available in new REDIAM web GIS for coastal and marine environment.

21807-REL-T006.2 Annex 3 – page 74
System development and management
Since 1984 the Ministry of the Environment of Andalusia, using tools such as the SinambA
(geographic and environmental information system of Andalusia) has been collecting and
standardizing data and indicators, developing the information base for policy development and
environmental planning and making available all information regarding the status of
Andalusian environment and natural resources.
REDIAM represents a further step in this direction, aiming to make available to all
stakeholders involved in the production and use of environmental information (technician
management, members and general public) a web tool of information allowing interaction and
participation in the creation and enhancement of environmental information about Andalusia.
The system is managed by the Ministry of the Environment of Andalusia with technical support
of Egmasa, public environmental company of the regional government. About 60 persons are
involved in the system management and development, 10 in CMA for strategic management
(control and coordination, in accordance with annual budget), and about 50 in Egmasa for
system management, data management, data check and validation, data publication,
interaction with external users and data requests, data and software updating. Mr. José
Enrique Frieyro at Egmasa (email: [email protected]) is in charge of technical development
and management of the Coastal and marine environment subsystem.
Centres or institutions can become members of the REDIAM network through collaboration
agreements, sharing common environmental data bases, technical criteria for information
gathering and classification, software to manage such information.
Egmasa and CMA defined a protocol to set standards for other providers’ incoming data, to
guarantee data quality and total suitability to the system. Nevertheless reaching topological
correctness of all layers from different providers represented a difficult task to accomplish. The
alignment of hydrographical and topographical data also requested a long standardisation
work but, as a result, this allow 3D views and analysis of different layers referred to dry land
and submarine environment.
REDIAM can be accessed via internet (general public), extranet (members) and intranet
(Ministry of the Environment staff). Extranet and intranet connection allow accessing the Geo-
DB where all spatial data is stored, also through custom extensions of ArcGIS.
Personnel of Andalusian Autonomous Government can access REDIAM information also via
intranet with different user types privileges (basically normal user and technical manager)
(from Figure A3- 38 to Figure A3- 41).
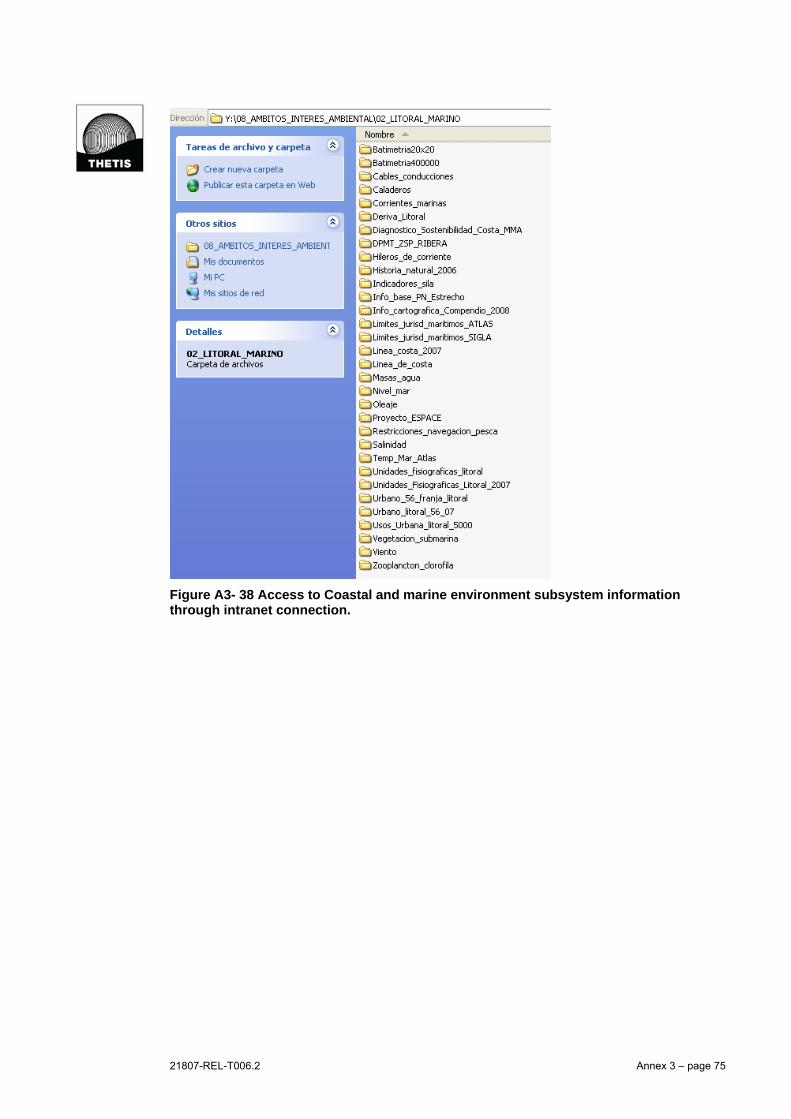
21807-REL-T006.2 Annex 3 – page 75
Figure A3- 38 Access to Coastal and marine environment subsystem information through intranet connection.

21807-REL-T006.2 Annex 3 – page 76
Figure A3- 39 REDIAM services accessible through custom extension of ESRI ArcMAP.
Figure A3- 40 Access to GeoDB through ESRI ArcMAP custom extension.

21807-REL-T006.2 Annex 3 – page 77
Figure A3- 41 Access to GeoDB through ESRI ArcCatalogue for authorized personnel of Andalusian Autonomous Government.
Experience with the implementation
The system is actually exploited by different kinds of users. Web services represent a
comprehensive tool for data sharing and allow stakeholders and general public to access the
information about coastal and marine environment.
For REDIAM members, and in particular public institutions involved in ICZM processes, the
system assures a guaranteed and recognized reference for standardised information.
The system is used by the Regional Ministry of Environment as the official data source for
environmental evaluations and studies, like for example environmental impact assessment of
plans and programmes, management of environmental protected areas. REDIAM has been
used by the CMA as a support for the Andalusian adaptation plan to climate change, and it
has been used by other entities of Andalusian Government to draw up the Andalusian
Territory Plan (Plan de Ordenación del Territorio de Andalucía - POTA). Andalusian Ministry of
21807-REL-T006.2 Annex 3 – page 78
Agriculture and Fishery, as well as Ministry of Tourism, exploits the system to manage coastal
data and to develop plans and analysis.
Concluding remarks
The system represents a very strong and adaptive tool to share information and
methodologies for sustainable development and environmental management. ICZM
functionalities are nowadays being developed and upgraded in accordance with Andalusian
Strategy for ICZM published in 2007 by the Andalusian Ministry of the Environment.
The REDIAM can be usefully exploited for Andalusian coastal management by local entities
and National Authorities in charge of interventions for coastal protection.

21807-REL-T006.2 Annex 3 – page 79
CRIGE PACA Spatial Data Infrastructure
General Information
The system here analysed is a framework of spatial data, metadata, users and tools that are
interactively connected in order to use spatial data in an efficient and flexible way. This
architecture is commonly called Spatial Data Infrastructure (SDI).
This SDI is operated and managed by CRIGE-PACA, the “Regional Centre for Geographic
Information in Provence-Alpes-Côte d'Azur”. The online platform of the CRIGE-PACA SDI is
the web site http://www.crige-paca.org, which is currently under further development and will
be configured and named as Regional Geoportal.
CRIGE-PACA is a non-profit organization created in 2002, led by national and regional
authorities through a seven-year financial plan (2000-2006 and 2007-2013). CRIGE-PACA
main mission is to promote, facilitate, support and spread geographical information to public
administrations on the one hand and, when possible, to general public and stakeholders on
the other hand. This generic aim includes specific objectives:
Provide geographic referenced data (digital data-sets) via the existing CRIGE-PACA web-
site and its future evolution in the Regional Geoportal; the on-line participative and data-
sharing platform (for public administrations) of the CRIGE-PACA SDI;
Provide technical support to users, including: help-line for assistances, production of
technical and requirements guides, editing specifications, technical meetings, on-line
resources;
Support the Regional Geomatic Network, through: promotion of cooperation between local
users and data providers, support local communities of interests, management of thematic
clusters, experiences and best practices exchange, acting as a resource centre on GIS
concepts;
Act as a coordination centre for the implementation of the INSPIRE directive at the
regional level.
CRIGE-PACA is also the coordinator of the Regional Geomatic Network involving thematic
clusters. These clusters are structured around local coordinators (or animators, as defined in
the SDI) and a certain number of working groups, bringing together regional organisations
interests in thematic issues. One of these twelve clusters deals with Sea and Coast (Mer &
Littoral) bringing together the coastal stakeholders of the PACA region.
CRIGE PACA received in 2009 an “eSDI NET+ Best Practice Award” for its innovative
organisational and institutional aspects in terms of cooperation, subsidiary and sustainability.
The info mail [email protected] is available to contact CRIGE PACA (located in
Domaine du Petit Arbois- Bâtiment MARTEL, Avenue Louis Philibert, BP 10019 - 13 545 Aix-
en-Provence cedex 4 – FRANCE).

21807-REL-T006.2 Annex 3 – page 80
Operational context and information content
The website of CRIGE-PACA enables to access different typologies of spatial information, like:
Carthotéque (map library),
Catalogue de donnés (data catalogue),
Pôles métiers (Thematic working groups or thematic clusters).
From the map library, the regional Atlas “Cartopas 2010” (CARTOgraphie en Prêt A Servir)
enables users to browse and visualise static maps related to several themes developed from
data contained in the Geographic Information System (GIS) of the PACA DREAL (Direction
Régionale de l’Environnement, de l’Aménagement et du Logement). The map library mainly
concerns the environmental state of the region Provence-Alpes-Côte d'Azur, with particular
attention also to management, planning and policies for sustainable development. A list of the
map library themes follows, with some examples of contents.
The territory and its evolution (e.g. land use, land use from 1990 to 2006, population
density from 1996 to 2006 etc.);
Management and planning (e.g. in French “Schémas de cohérence territoriale (SCoT) et
Schémas Directeurs (SD)” and Local Plans (PLU), communal cards (CC), land use plans
(POS), etc.);
Air and climate (e.g. temperature, precipitation, state of air pollution by ozone, state of air
pollution by suspended solids, etc.);
Land polices for sustainable development (e.g. in French «Etat d’avancement des
Schémas d’Aménagement et de Gestion des Eaux (SAGE)», the local Agenda 21 site and
the map of the local plans energy environment (PLEE));
Nature and biodiversity (e.g. natural reserve, natural areas of ecological interest for fauna
and flora, site NATURA 2000 etc.);
Landscapes and sites (e.g. map of regional synthesis of classified sites and sites
registered under the Act of May 2, 1930 in the PACA region and Operations Great Sites,
typology of regional landscapes, etc.);
Data on water quality (e.g. aquifers and piezometric network, biological quality of the
rivers, etc.);
Water policy (e.g. principal water drainage, targets according to the Water Framework
Directive (WFD), ecological and chemical status of rivers and coastal water, vulnerable
and sensible zones for the nitrate, urban waste water treatment unit, annual volume of
water used by geographical department, etc.);
Energy (e.g. electricity transmission network, wind energy development, wind speed, wind
power and potentially energy, development status of photo voltaic power projects, etc.);
Housing (e.g. Status of the Local Housing Programs (PLH), percentage of social housing,
etc.);
Transport (e.g. road, traffic in major roads, etc.);
Natural, technological and mining risk (e.g. flooding risk, atlas of the flooding zones,
seismic risk, climatic occurrence of heavy rainfall, industrial risk, etc).
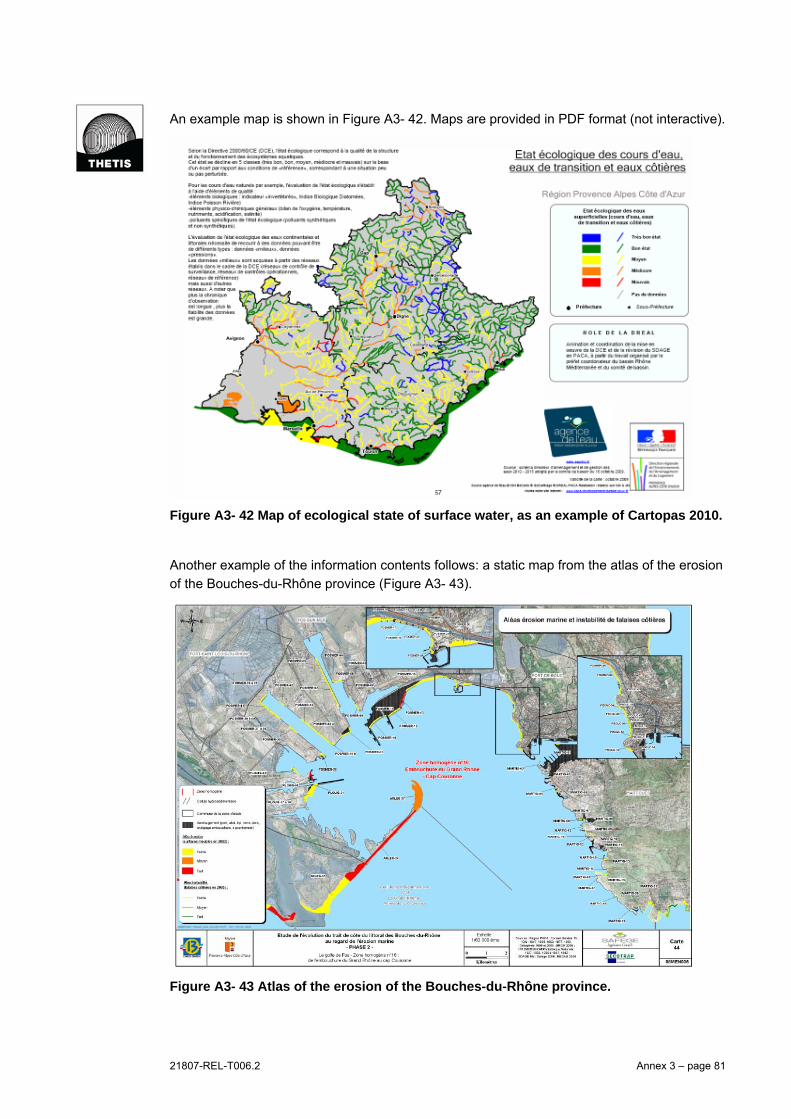
21807-REL-T006.2 Annex 3 – page 81
An example map is shown in Figure A3- 42. Maps are provided in PDF format (not interactive).
Figure A3- 42 Map of ecological state of surface water, as an example of Cartopas 2010.
Another example of the information contents follows: a static map from the atlas of the erosion
of the Bouches-du-Rhône province (Figure A3- 43).
Figure A3- 43 Atlas of the erosion of the Bouches-du-Rhône province.
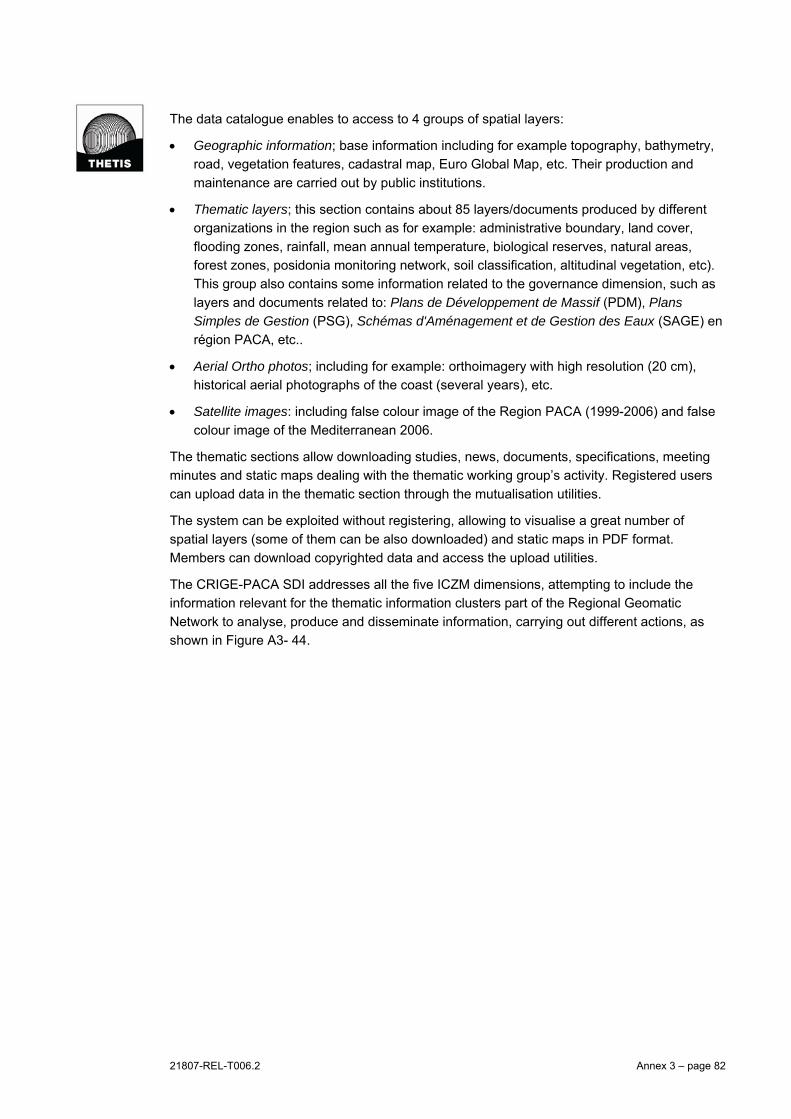
21807-REL-T006.2 Annex 3 – page 82
The data catalogue enables to access to 4 groups of spatial layers:
Geographic information; base information including for example topography, bathymetry,
road, vegetation features, cadastral map, Euro Global Map, etc. Their production and
maintenance are carried out by public institutions.
Thematic layers; this section contains about 85 layers/documents produced by different
organizations in the region such as for example: administrative boundary, land cover,
flooding zones, rainfall, mean annual temperature, biological reserves, natural areas,
forest zones, posidonia monitoring network, soil classification, altitudinal vegetation, etc).
This group also contains some information related to the governance dimension, such as
layers and documents related to: Plans de Développement de Massif (PDM), Plans
Simples de Gestion (PSG), Schémas d'Aménagement et de Gestion des Eaux (SAGE) en
région PACA, etc..
Aerial Ortho photos; including for example: orthoimagery with high resolution (20 cm),
historical aerial photographs of the coast (several years), etc.
Satellite images: including false colour image of the Region PACA (1999-2006) and false
colour image of the Mediterranean 2006.
The thematic sections allow downloading studies, news, documents, specifications, meeting
minutes and static maps dealing with the thematic working group’s activity. Registered users
can upload data in the thematic section through the mutualisation utilities.
The system can be exploited without registering, allowing to visualise a great number of
spatial layers (some of them can be also downloaded) and static maps in PDF format.
Members can download copyrighted data and access the upload utilities.
The CRIGE-PACA SDI addresses all the five ICZM dimensions, attempting to include the
information relevant for the thematic information clusters part of the Regional Geomatic
Network to analyse, produce and disseminate information, carrying out different actions, as
shown in Figure A3- 44.

21807-REL-T006.2 Annex 3 – page 83
Figure A3- 44 Working schemes of the thematic clusters of the CRIGE-PACA Geomatic network.
The thematic working groups are:
Sea and Coast;
Environment and Water;
Agriculture;
Forest;
Forest Fire-fighting;
Risks;
Urban Planning;
Employment;
Telecom;
Health;
Economy;
Roads and transportation.
Particularly relevant for coastal issues is the Sea and Coast (Mer et Littoral) thematic cluster,
which involves stakeholders of the coastal territory as State offices, State Agencies, local
governments (Region, Provinces, Municipalities), research laboratories, private companies

21807-REL-T006.2 Annex 3 – page 84
involved in the coastal management. The main aim is to develop actions in the field of
geographical information in coastal PACA as well as exchange and disseminate data through
the regional CRIGE platform.
A metadata sheet is associated with each layer. For some layers further related
documentation is also available for downloading.
Free access to data is available for most of the layers; the complete content of the SDI can be
accessed by registered users. Full access to all data (including data sharing and exchange) is
provided to public bodies of the PACA Region that are members of the Regional Geomatic
Network. Every public entity can become member of the Network through an on-line
application form available in the web-site. After CRIGE verification, the applicant entity can
become member of the SDI.
Several examples of integrated information can be found in the Atlas “Cartopas 2010” related
to the assessment of the natural and technological risks for the addressed territory. The
“Natural risk” section for example includes maps related to flooding, seismic and landslide
risks. Addressed technological risks include for example maps of risk related to large dams,
industrial risk and risk related to mining and quarrying. Integrated information concern also the
section about water policies, where maps about ecological and chemical status of rivers and
coastal water, vulnerable and sensible zones for the nitrate are available,
Several integrated maps are available also in the data catalogue. One of the most interesting
example are the Atlas of the flooding zones, analysing the phenomena of flooding that may
occur by overflow of rivers, through an hydro-geomorphological approach.
Data providers are universities, research institution, statistics institutions, environmental
agencies, cartographic institutions, etc.); a complete list is currently available at
http://www.crige-paca.org/frontblocks/print/print_LOT_CARTES.asp.
Technological characteristics
The actual SDI is technically supported by a standard (and a bit outdated) web site. The map
viewer linked to the web page was developed with ER Mapper technology. The new geoportal
that will replace the actual web page has been developed mainly with open sources
technologies (MapServer, PostGIS, OpenLayers, MySQL, Typo 3, Geonetwork or Geosource
in France, etc.).
The enhancement of interoperability is one of the principal aims of the Regional Geoportal of
next release, that will be compliant with Open Geospatial Consortium (OGC) standards and
implement the existing specifications of the INSPIRE directive. Some interesting tools will be
integrated in the new geoportal, like the Geo-viewer for data visualization (Figure A3- 45), that
will allow to execute customized spatial data download (spatial reference, projection, extent,
clip, data format, etc.). A preview of the new Geo-viewer of next publication is given below.
Interoperability of spatial data will be managed, in the new Regional Geoportal, by a clear and
user-friendly data catalogue. A preview of the new interface is given below.

21807-REL-T006.2 Annex 3 – page 85
Figure A3- 45 Preview of the Geo-viewer of next publication in the CRIGE-PACA Regional Geoportal.
Figure A3- 46 Preview of the Geo-catalogue of next publication.
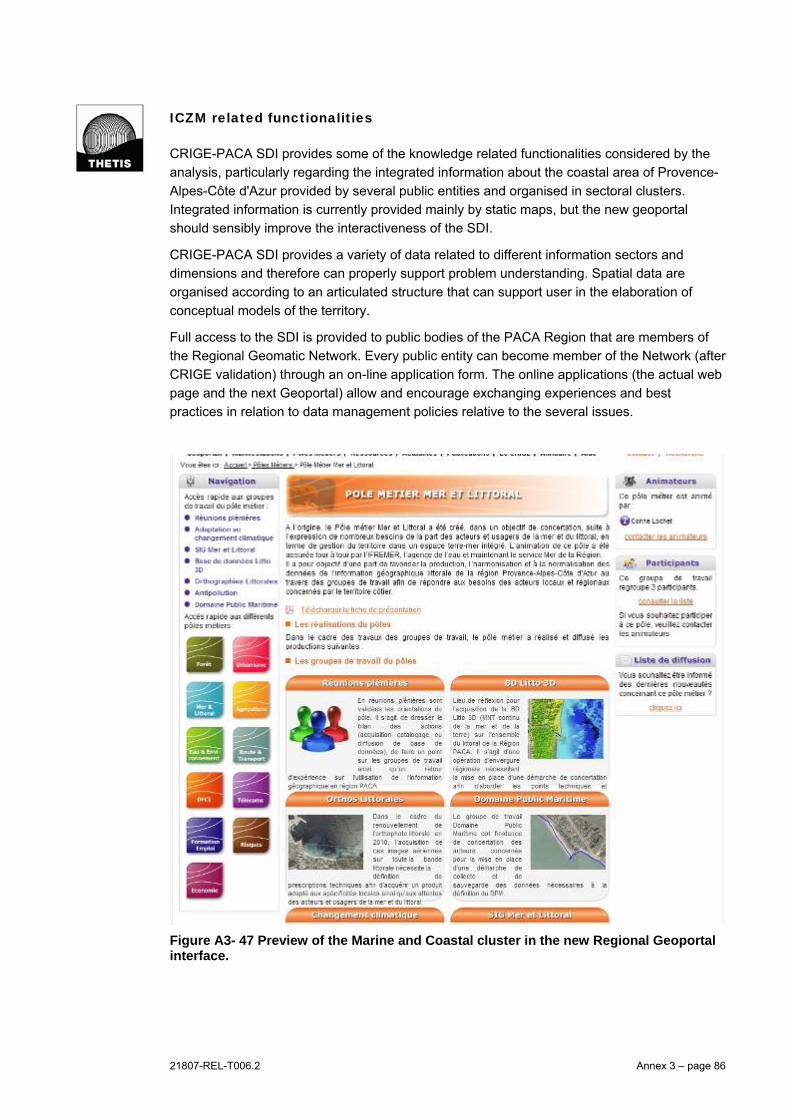
21807-REL-T006.2 Annex 3 – page 86
ICZM related functionalities
CRIGE-PACA SDI provides some of the knowledge related functionalities considered by the
analysis, particularly regarding the integrated information about the coastal area of Provence-
Alpes-Côte d'Azur provided by several public entities and organised in sectoral clusters.
Integrated information is currently provided mainly by static maps, but the new geoportal
should sensibly improve the interactiveness of the SDI.
CRIGE-PACA SDI provides a variety of data related to different information sectors and
dimensions and therefore can properly support problem understanding. Spatial data are
organised according to an articulated structure that can support user in the elaboration of
conceptual models of the territory.
Full access to the SDI is provided to public bodies of the PACA Region that are members of
the Regional Geomatic Network. Every public entity can become member of the Network (after
CRIGE validation) through an on-line application form. The online applications (the actual web
page and the next Geoportal) allow and encourage exchanging experiences and best
practices in relation to data management policies relative to the several issues.
Figure A3- 47 Preview of the Marine and Coastal cluster in the new Regional Geoportal interface.

21807-REL-T006.2 Annex 3 – page 87
Stakeholder involvement and participation is therefore a focal point of the SDI, local data
producers and planners can share information through the CRIGE-PACA SDI, providing a
platform to create a strong mutualisation of decisions related to data and information sharing
and exchange. The Marine and Coastal working group defined a sub-group dedicated to
climate change that aims, inter alia, to implement an “Adaptation to climate change” database.
Some examples of documents provided by the SDI as a result of stakeholders consultation
and Sea Coast thematic cluster “animation” are listed below:
Information on Flooding Emergency Plan (Plan de Submersions Rapides), published in
the SDI 2 March 2011, that will deal with inter-local approaches to achieve a National
plan resulting in contractual agreements within National and Local authorities for the
implementation of action plans including measures of prevention, prediction, protection
and safeguarding of populations within 5 years;
document published 24 September 2010 by the Sea Coast working group, resulting from
previous meetings, containing the stakeholders’ contribution to the definition of the plan
reported above;
detailed presentation of the new national program “Litto3D” to produce a land-sea DSM on
the coastal fringe produced jointly by the Hydrographic and Oceanographic Department of
the Navy (SHOM) and the National Geographic Institute (IGN).
System development and management
CRIGE is in charge of the development and management of the CRIGE-PACA SDI and the
related Regional Geoportal. CRIGE-PACA involves a team composed by 8 full-time persons.
The budget for the SDI management from 2009 to 2011 is around 620.000 €/year. Data
acquisition is budgeted as a separate expenditure, and its cost can vary a lot depending to the
need of copyrighted data, with particular reference to cartography. Mr. Romain Buchaut is the
Coordinator of Regional Geomatic Network at CRIGE.
CRIGE counts 3.193 members belonging to 1.424 organizations. Data acquisition and system
development are driven by stakeholders needs. Thematic clusters coordinators (called
animators) actively contribute to scope the system. Ms. Corine Lochet at PACA Regional
Government is the animator of the coastal and marine thematic cluster working group, which is
currently composed of 164 persons.
One of the major management difficulties is related to the definition and coordination of the
working groups to share data and expertises. The inclusion in the coastal and marine working
group of private companies commissioned to develop informative studies and interventions,
for example, deserves particular attention in CRIGE-PACA vision, as they play an important
role in coastal management. It frequently happens, in fact, that one private company performs
studies or coastal interventions on behalf of different Municipalities that sometimes operate
specifically in their territory in the absence of a broader plan.
Another main problem deals with the acquisition of data, which can represent a major cost to
be concerned in budget setting. Good examples of this issue are the acquisition of basic
cartographic layers from IGN or LIDAR surveys data for detailed bathymetric monitoring.
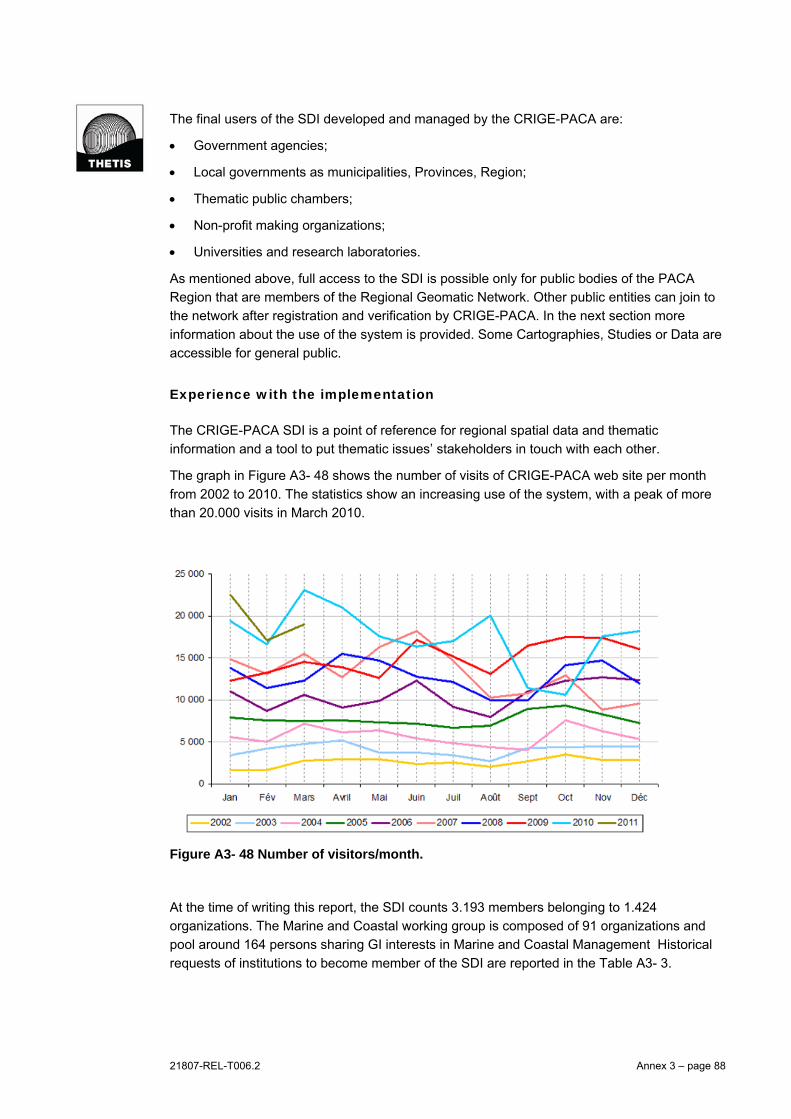
21807-REL-T006.2 Annex 3 – page 88
The final users of the SDI developed and managed by the CRIGE-PACA are:
Government agencies;
Local governments as municipalities, Provinces, Region;
Thematic public chambers;
Non-profit making organizations;
Universities and research laboratories.
As mentioned above, full access to the SDI is possible only for public bodies of the PACA
Region that are members of the Regional Geomatic Network. Other public entities can join to
the network after registration and verification by CRIGE-PACA. In the next section more
information about the use of the system is provided. Some Cartographies, Studies or Data are
accessible for general public.
Experience with the implementation
The CRIGE-PACA SDI is a point of reference for regional spatial data and thematic
information and a tool to put thematic issues’ stakeholders in touch with each other.
The graph in Figure A3- 48 shows the number of visits of CRIGE-PACA web site per month
from 2002 to 2010. The statistics show an increasing use of the system, with a peak of more
than 20.000 visits in March 2010.
Figure A3- 48 Number of visitors/month.
At the time of writing this report, the SDI counts 3.193 members belonging to 1.424
organizations. The Marine and Coastal working group is composed of 91 organizations and
pool around 164 persons sharing GI interests in Marine and Coastal Management Historical
requests of institutions to become member of the SDI are reported in the Table A3- 3.
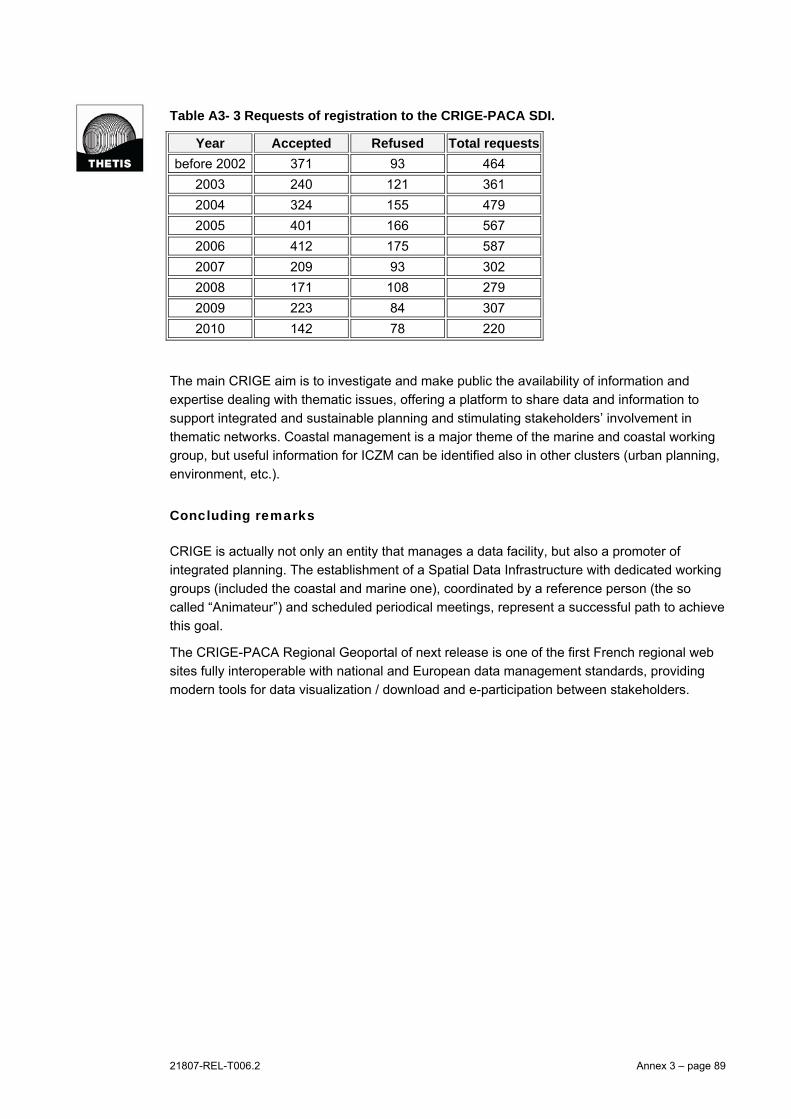
21807-REL-T006.2 Annex 3 – page 89
Table A3- 3 Requests of registration to the CRIGE-PACA SDI.
Year Accepted Refused Total requests
before 2002 371 93 464
2003 240 121 361
2004 324 155 479
2005 401 166 567
2006 412 175 587
2007 209 93 302
2008 171 108 279
2009 223 84 307
2010 142 78 220
The main CRIGE aim is to investigate and make public the availability of information and
expertise dealing with thematic issues, offering a platform to share data and information to
support integrated and sustainable planning and stimulating stakeholders’ involvement in
thematic networks. Coastal management is a major theme of the marine and coastal working
group, but useful information for ICZM can be identified also in other clusters (urban planning,
environment, etc.).
Concluding remarks
CRIGE is actually not only an entity that manages a data facility, but also a promoter of
integrated planning. The establishment of a Spatial Data Infrastructure with dedicated working
groups (included the coastal and marine one), coordinated by a reference person (the so
called “Animateur”) and scheduled periodical meetings, represent a successful path to achieve
this goal.
The CRIGE-PACA Regional Geoportal of next release is one of the first French regional web
sites fully interoperable with national and European data management standards, providing
modern tools for data visualization / download and e-participation between stakeholders.
21807-REL-T006.2 Annex 3 – page 90
Coastal and marine information system of Emilia Romagna Region
General Information
The Coastal and marine information system of Emilia Romagna Region has been mainly
implemented within the EU CADSEALAND (Land-sea interaction: coastal state and evolution
in CADSES, 2004-2006) project and it has been designed following the guidelines issued by
European Commission within the EUROSION programme (EU commission, 2004). After the
CADSEALAND project, Emilia Romagna Region (or RER) was involved in the EU funded
PlanCoast project (2006-2008). Within the activities of that project, the CIS has been updated
to further support coastal and marine spatial planning, too. PlanCoast also foresaw the use of
the CIS to define a conceptual framework for the Ferrara coastal area (included in the Emilia
Romagna Region) in order to identify and evaluate coastal vulnerability and to define criteria
and objectives for territorial programming and planning.
The CIS is managed by the Geological, Seismic and Soil Survey (Servizio Geologico, Sismico
e dei Suoli - SGSS) of Emilia Romagna Regional Government. Home page of the survey is
http://www.regione.emilia-romagna.it/wcm/geologia_en/index.htm; SGSS CIS coordinator is
Ms. Luisa Perini, e-mail: [email protected].
The Coastal and marine information system contains data collected by different Institutions
during the last 100 years and several GIS products resulting from survey activities and from
studies recently carried out by the SGSS. The CIS refers to the whole Emilia-Romagna
coastal zone and marine area, and is continuously updated in order to represent a
fundamental support for decision makers and coastal planners dealing with ICZM.
Actually the Sea-Coast CIS is undergoing further implementation and upgrades within the EU
project MICORE (Morphological Impacts and Coastal Risks induced by Extreme storms
events, 2008 - 2011). The general aim of the project is to develop and test online tools for
reliable predictions of the morphological impact of marine storm events in support to civil
protection mitigation strategies.
The Sea-Coast CIS actually includes a web catalogue of metadata (http://geo.regione.emilia-
romagna.it/catalogo_web/catalogo) and a Web-GIS application (http://geo.regione.emilia-
romagna.it/costa/viewer.htm), enabling the on-line publication of validated spatial data. The
web applications are aimed to share and distribute data among the peripheral structures of the
Emilia Romagna Region, other public and private entities and general public.
21807-REL-T006.2 Annex 3 – page 91
Operational context and information content
The information content currently available in the CIS can be resumed in the following
categories:
Orthoimagery historical archive from 1946 to 2010;
Land use layers from 1946 to 2010 and elaborations on land use change;
Shoreline DTM;
Shoreline DSM from LIDAR and multibeam surveys;
Administrative boundaries;
Geological, geomorphological and sedimentological static maps;
Marine use DB;
Off-shore infrastructures layers;
Bathymetry;
Coastal protection interventions catalogue;
Submarine sands deposits DB;
Dune steadiness layer;
Coastal classification;
Coastal risk and vulnerability.
Further information content is currently work in progress:
Storms and exceptional events DB;
Shoreline interventions DB (fine sand nourishments);
Hydrodynamic;
Demography;
Cultural heritage;
Laws and regulations DB.
Finally, the CIS managers have identified further useful data for ICZM currently not available
and to be gathered or elaborated in the next future:
Ports;
Economic asset;
Marine Authorizations.
All layers are provided with metadata stored in a dedicated Repository manager ISO 19115
compliant, currently being upgraded. The metadata repository will store all the information
about GIS data contained in the regional data catalogue. Part of this metadata is distributed by
the web catalogue.
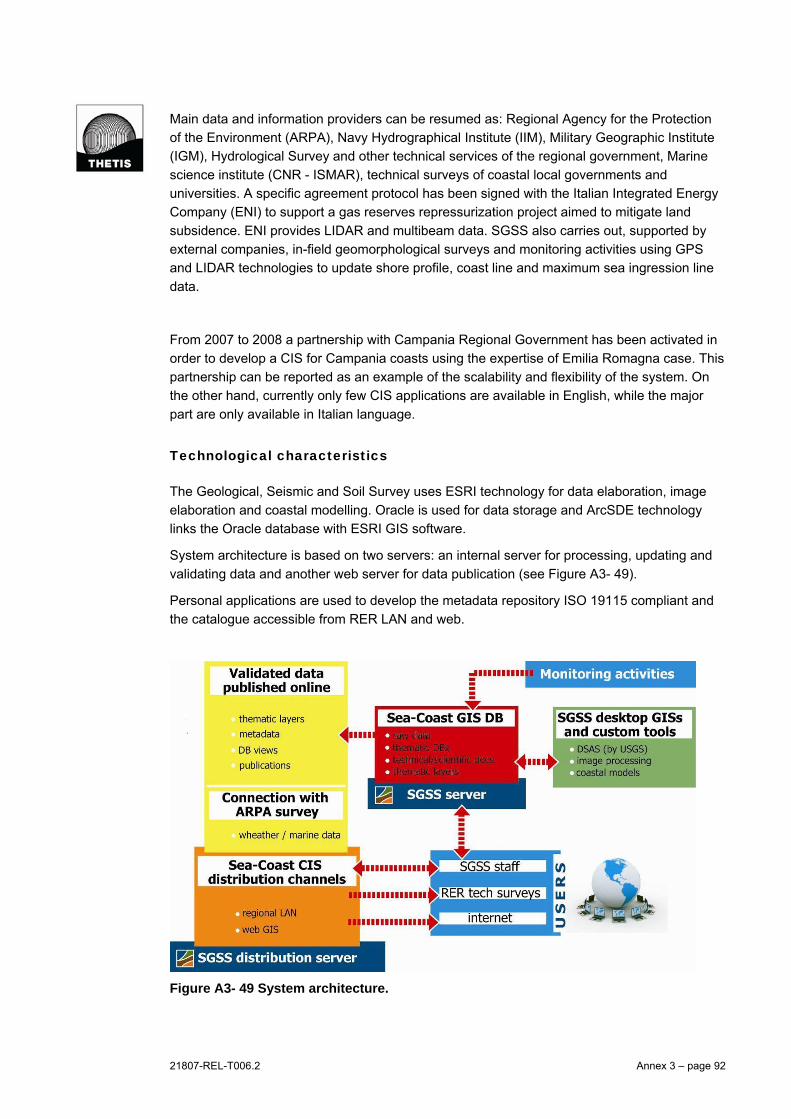
21807-REL-T006.2 Annex 3 – page 92
Main data and information providers can be resumed as: Regional Agency for the Protection
of the Environment (ARPA), Navy Hydrographical Institute (IIM), Military Geographic Institute
(IGM), Hydrological Survey and other technical services of the regional government, Marine
science institute (CNR - ISMAR), technical surveys of coastal local governments and
universities. A specific agreement protocol has been signed with the Italian Integrated Energy
Company (ENI) to support a gas reserves repressurization project aimed to mitigate land
subsidence. ENI provides LIDAR and multibeam data. SGSS also carries out, supported by
external companies, in-field geomorphological surveys and monitoring activities using GPS
and LIDAR technologies to update shore profile, coast line and maximum sea ingression line
data.
From 2007 to 2008 a partnership with Campania Regional Government has been activated in
order to develop a CIS for Campania coasts using the expertise of Emilia Romagna case. This
partnership can be reported as an example of the scalability and flexibility of the system. On
the other hand, currently only few CIS applications are available in English, while the major
part are only available in Italian language.
Technological characteristics
The Geological, Seismic and Soil Survey uses ESRI technology for data elaboration, image
elaboration and coastal modelling. Oracle is used for data storage and ArcSDE technology
links the Oracle database with ESRI GIS software.
System architecture is based on two servers: an internal server for processing, updating and
validating data and another web server for data publication (see Figure A3- 49).
Personal applications are used to develop the metadata repository ISO 19115 compliant and
the catalogue accessible from RER LAN and web.
Figure A3- 49 System architecture.
21807-REL-T006.2 Annex 3 – page 93
The interoperability of the system is guaranteed by the use of standard protocols (INSPIRE)
for data management and storage.
A model used by the Regional Agency for the Protection of the Environment (ARPA) is
integrated with the CIS to provide sea-storm events modelling. This is the XBeach model
developed by Delft Hydraulics, a two-dimensional model for wave propagation, long waves
and mean flow, sediment transport and morphological changes of the near shore area,
beaches, dunes and back barrier during storms. Operational models like SWAN and ROMS
are also used to provide information regarding the forecast of sea state and circulation.
A specific database of historical data on storms, exceptional events and related meteorological
data is currently under development by the SGSS within MICORE project, with dedicated fact
sheets providing extended descriptions, newspaper articles and photos. The sea-storm DB will
be integrated into the CIS.
The final aim of tools integration is to implement a more sophisticated "integrated information
system”, designed in CADSEALAND and MICORE projects, where the SGSS CIS and the
information system of ARPA could melt together providing an adequate instrument for the
purpose of prediction and prevention of coastal risks.
ICZM related functionalities
The system architecture analysed in the previous section provide a variety of information
contents and functionalities specifically dedicated to different levels of use for ICZM.
The most extended information repository is the one managed by the SGSS in the internal
server for data validation and updating. This information is managed and elaborated by SGSS
GIS officers with desktop applications. Custom extensions have been developed to facilitate
DB and metadata management (see Figure A3- 50). A dedicated extension is also used to
handle and analyse DSM LIDAR data.

21807-REL-T006.2 Annex 3 – page 94
Figure A3- 50 SGSS GeoDB access through custom extension of ESRI ArcMAP.
SGSS staff elaborates coastal data with desktop GIS functionalities, producing new useful
information for ICZM, like coastal risk and coastal vulnerability layers. Maps of coastal
vulnerability to erosion are produced integrating information related to three main aspects:
geomorphology, evolutionary trend and human impact (see Figure A3- 51).
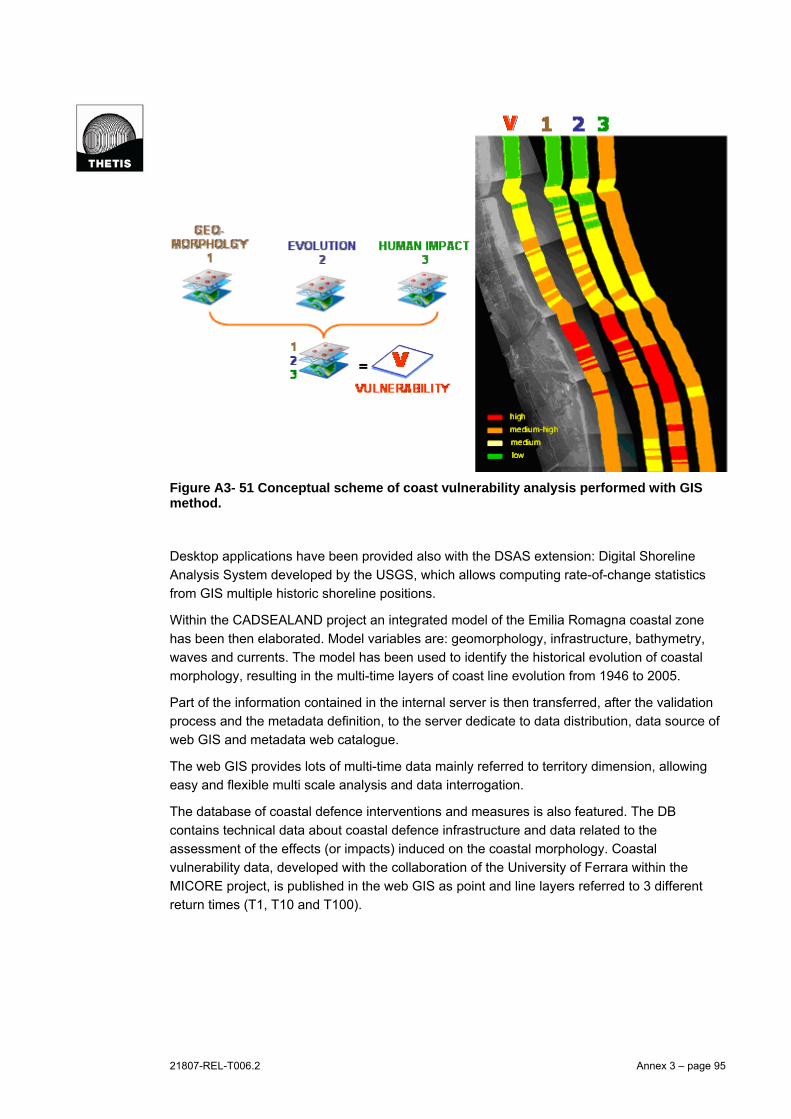
21807-REL-T006.2 Annex 3 – page 95
Figure A3- 51 Conceptual scheme of coast vulnerability analysis performed with GIS method.
Desktop applications have been provided also with the DSAS extension: Digital Shoreline
Analysis System developed by the USGS, which allows computing rate-of-change statistics
from GIS multiple historic shoreline positions.
Within the CADSEALAND project an integrated model of the Emilia Romagna coastal zone
has been then elaborated. Model variables are: geomorphology, infrastructure, bathymetry,
waves and currents. The model has been used to identify the historical evolution of coastal
morphology, resulting in the multi-time layers of coast line evolution from 1946 to 2005.
Part of the information contained in the internal server is then transferred, after the validation
process and the metadata definition, to the server dedicate to data distribution, data source of
web GIS and metadata web catalogue.
The web GIS provides lots of multi-time data mainly referred to territory dimension, allowing
easy and flexible multi scale analysis and data interrogation.
The database of coastal defence interventions and measures is also featured. The DB
contains technical data about coastal defence infrastructure and data related to the
assessment of the effects (or impacts) induced on the coastal morphology. Coastal
vulnerability data, developed with the collaboration of the University of Ferrara within the
MICORE project, is published in the web GIS as point and line layers referred to 3 different
return times (T1, T10 and T100).

21807-REL-T006.2 Annex 3 – page 96
The web GIS features a powerful multilayer interrogation tool that allow to identify and
compare the information of different layers on a spatial based query defined by the user (see
Figure A3- 52). Interrogation outputs pop out in a new browser page report interactively linked
to the main map page and printable in PDF format.
Figure A3- 52 Web GIS application: multilayer interrogation output based on custom spatial criteria.
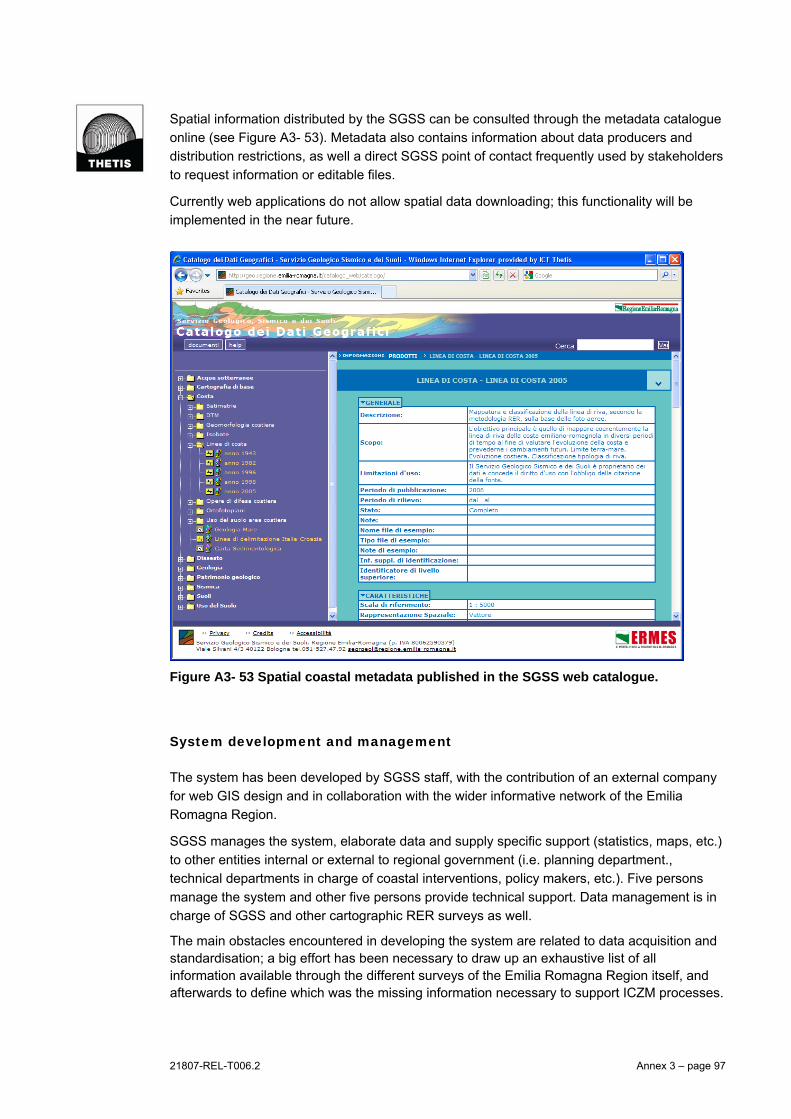
21807-REL-T006.2 Annex 3 – page 97
Spatial information distributed by the SGSS can be consulted through the metadata catalogue
online (see Figure A3- 53). Metadata also contains information about data producers and
distribution restrictions, as well a direct SGSS point of contact frequently used by stakeholders
to request information or editable files.
Currently web applications do not allow spatial data downloading; this functionality will be
implemented in the near future.
Figure A3- 53 Spatial coastal metadata published in the SGSS web catalogue.
System development and management
The system has been developed by SGSS staff, with the contribution of an external company
for web GIS design and in collaboration with the wider informative network of the Emilia
Romagna Region.
SGSS manages the system, elaborate data and supply specific support (statistics, maps, etc.)
to other entities internal or external to regional government (i.e. planning department.,
technical departments in charge of coastal interventions, policy makers, etc.). Five persons
manage the system and other five persons provide technical support. Data management is in
charge of SGSS and other cartographic RER surveys as well.
The main obstacles encountered in developing the system are related to data acquisition and standardisation; a big effort has been necessary to draw up an exhaustive list of all information available through the different surveys of the Emilia Romagna Region itself, and afterwards to define which was the missing information necessary to support ICZM processes.

21807-REL-T006.2 Annex 3 – page 98
Data validation and geoprocessing of non-GIS back data represented another expensive task. SGSS developed a standard protocol to check and validate incoming data from other institutions.
Experience with the implementation
The system is actually exploited by different kinds of users. LAN services are used by SGSS
staff, personnel of technical services of Regional Government (like the ones in charge for
interventions on the coast) and other regional departments (like local territorial planning).
The CIS is therefore interconnected with other entities that use it as a support system and
provide data to improve it as well, like bathymetric and subsidence surveys carried out by the
Regional Agency for the Protection of the Environment (ARPA), or technical surveys in charge
of fine sand nourishments.
The CIS is also usefully exploited by the coastal defence survey of the regional government, in
charge of coastal protection planning as defined by regional guidelines for ICZM approved in
2005.
Web applications of free access are widely used by universities and stakeholders to perform on-line territorial analysis and data requests. On the other hand, the online restricted area is used by operators belonging to the regional technical surveys to manage and implement data. A new dedicated web application, currently under development, will be used by regional technical surveys to manage and update the database of coastal protection interventions (see Figure A3- 54).
Figure A3- 54 Web application implemented to manage and update coastal interventions DB.

21807-REL-T006.2 Annex 3 – page 99
Finally, a further development of the CIS is planned, foreseeing the upgrade of vulnerability
analysis of the coast, the integration of ARPA information system and their sharing with the
Italian Civil Protection Service in order to provide an integrated system for coastal risk
management. This task is already under development on a case study area within the
MICORE project.
Concluding remarks
The Sea-Coast CIS of Emilia Romagna Region provide an effective support to ICZM
programme carried out by Emilia Romagna government, and is an operational application of
regional guidelines for ICZM that have been approved in 2005.
The CIS is also intended to become a decisional support system providing the needful
knowledge for policy and planning actions, structuring a network of all subjects operating in
coastal development, protection and defence and encouraging their cooperation.
21807-REL-T006.2 Annex 3 – page 100
GIS tools of the Information Service of the Venice Water Authority
General Information
SINFO CIS refers to a set of GIS-based and related (database, models, decision support
systems) tools developed by the “Servizio Informativo” (Information Service) of the Venice
Magistrato alle Acque di Venezia (Venice Water Authority - MAV), in order to support the
management and safeguarding activities of the Venice Lagoon implemented by the same
MAV through it concessionary Consorzio Venezia Nuova.
The Information Service was set up in February 1984, implementing the first convention
signed between the Venice Water Authority and the Consorzio Venezia Nuova (in the context
of the first Special Law no. 171/1973 which established the principle that safeguarding of
Venice was a matter of "priority national interest”). Main tasks of the Information Service were
and still are to generate, collect, classify and archive data and information on the lagoon
environment and the related human activities. These data and information are used to support
other bodies operating in the Venice Lagoon (mainly the Venice Water Authority) in dealing wit
the assessment of the state of the system and the causes of the environmental and
morphological deterioration, as well as with the definition of safeguard plans of interventions
(defence from high waters, defence from sea storms and environmental protection) and its
monitoring.
Main purpose of the MAV Information Service is the organization of data and their integrated
analysis in order to provide scientific-based information to support the management and
safeguarding of the Venice Lagoon. Specifics objectives can be summarized as follows:
Produce the knowledge base to define the state of the system, identify the causes of
degradation and develop plan of actions for the Lagoon safeguard and related monitoring;
Organise and make easily accessible and understandable the wide and complex set of
data and information available on the Venice Lagoon and its territory;
Standardize the used observation and measurement methodology;
Facilitate the technical collaboration among different institutions.
All users can consult the data (and related metadata) at the Information Service and require
them to MAV and the same Information Service. After the authorization from MAV, the
Information Service provides the required data, maps, GIS layer, and meta-data to users. Data
and information (such as historical maps, other static digital maps, some spatial layers, etc.)
can be consulted at the Information Service through the SIGLA system showed in Figure A3-
1. A second tool (Co.Op.) has been specifically developed to support the research of
documents related to studies, project and interventions, etc (Figure A3- 56).
The Information Service is located in the historical centre of Venice (S. Marco 2949) and can
be contacted by phone (041-5203188) or by e-mail: [email protected].

21807-REL-T006.2 Annex 3 – page 101
Figure A3- 55 SIGLA tool; the system is currently available only for the intranet users of the Information Service of the Water Venice Authority.
Figure A3- 56 Co.Op. tool for the research of studies and projects realized by the Water Authority of Venice and its metadata (e.g. title, date, location of consultation).
21807-REL-T006.2 Annex 3 – page 102
Operational context and information content
SINFO CIS has gradually evolved in time, since 1984, progressively acquiring new data and
developing new information and tools.
First period of activity mainly focused on collection and quality check of available
documentation and creation of the Geographic Information System of the Venice Lagoon
territory. The second period (started approximately in 1990) started addressing Venice Lagoon
problems. This implied the further development of the GIS tools as well as of other integrated
tools, including models, specific software and various decision support systems. The third
period (relative to recent years) is characterized by an operational dimension, directly serving
institutions, where the activities are part of the production processes. The results of these
activities were complementary and mutually reinforced by those reached by MAV through its
concessionary the “Consorzio Venezia Nuova”.
Several institutions have collaborated with the MAV Information Service in the acquisition of
data included in the SINFO CIS; e.g.:
Veneto Regional Authority;
Provincial and municipal Authorities of the Veneto Region;
Universities of the Veneto Region;
The Italian National Research Council (CNR);
The National Institute of Statistics (ISTAT).
The SINFO CIS mainly addresses four of the five considered information dimensions. The
environment and the territory dimensions are in depth addressed. The economic (e.g. data on
the industrial area of Porto Marghera, close to the Venice Lagoon) and the social dimension
(e.g. population density, urban structure) are considered, too. The SINFO CIS includes several
information which refers to the following main topics:
Base maps
Historical maps, remote sensed data, including a wide collection of satellite images
and aerial photographs;
Physical and morphological environment of the Venice Lagoon (canals, tidal flats,
mudflats, salt marshes) and its drainage basin;
Administrative boundaries.
Morphology (bathymetry and digital elevation model, channels, elevation of salt marshes,
surface of shallow water, salt marshes and tidal flats, evolution of lagoon morphology,
granulometry of sediments, geotechnical characteristics, subsidence, pedology of the
drainage basin, morphological interventions in the Venice lagoon);
Hydrodynamic (current, tide, waves, meteorological data, discharge, flows, hydrographic
network and drainage basins, database of flooding events and flooding risk for lagoon
urban systems);
Biology and biodiversity (macroalgae and seagrass distribution and ecological
characteristics, and more in general lagoon vegetation, zoobenthos, birds);
Quality (water and sediments quality, drainage basin, residence time);

21807-REL-T006.2 Annex 3 – page 103
Socio-economy (water traffic, hunting, fish and fish farming, land use, road infrastructure
population density, industrial activities; archaeology, sewerage discharges in Venice
lagoon).
Data and information contained in the set of GIS tools of the MAV Information System have
been used, also through models, to support many integrated analysis related to the Venice
Lagoon management. Results of these analysis have been often included in the SINFO CIS,
e.g.:
database of flooding events and of urban area affected by flooding risk;
pollution loads (and relative budget) from the drainage basin;
maps of the morphological evolution of the Venice Lagoon, also including areas subjected
to sedimentation or erosion;
map of the archaeological risk.
Above ones are just some examples of integrated analysis results included in the SINFO CIS.
Technological characteristics
SINFO CIS is developed with Geomedia Intergraph (Licensed software). Geomedia area
interfaced with numerous Oracle database to manage all the alphanumeric data. The main
themes (e.g. elevation type and attribute, transport, channel, administrative boundary) provide
complete interoperability in full compliance with the INSPIRE directive. This is going to be
extended to all spatial data.
SINFO CIS is directly or indirectly (for example providing data and acquiring outcome)
integrated with a relevant number of other tools (database, models and decision support
systems), including for example:
BDMA; Oracle database for the collection, management and diffusion (currently thought
Intranet) of environmental data and document on the Venice Lagoon
SAMANET; a specific software for the acquisition and management of data (water
chemical and physical parameters) continuously measured by fixed monitoring stations;
CRUP; decision support system, providing integrated information for licensing discharges
into lagoon generated by production activities. CRUP is integrated with a dispersive
mathematical model able to evaluate the effects of pollutants discharged into the lagoon;
Specific systems used to manage large dataset, such as: GESCOM supporting licensing
for private water uses of the lagoon; SITAR related to archaeological sites in the Venice
lagoon; COSS supporting quick visualisation of documents and reports related to studies;
MODEL supporting the use of various hydrodynamic models of the Venice Lagoon.
Particularly relevant is the integration of INFO-CIS with the CIS of the Veneto Region coast
(SIT della Fascia Costiera Veneta), realized by the Information Service of the Water Authority
and the Veneto Region in order to collect all the data and information produced and made
available by these two entities about the Veneto coastal system. Data and information are
related to the coast from Bibbione in the north and Scardovari in the south and are organized
in two sections: Veneto coast and coastal hinterland (Figure A3- 57). The system is still not
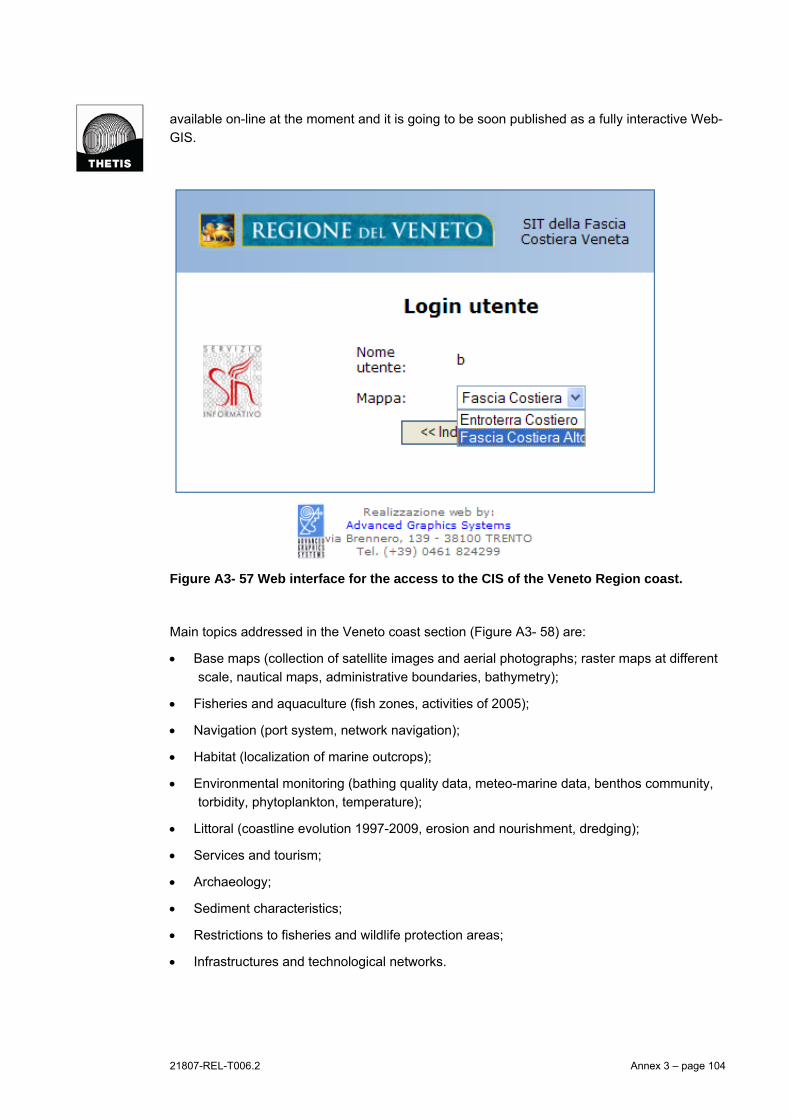
21807-REL-T006.2 Annex 3 – page 104
available on-line at the moment and it is going to be soon published as a fully interactive Web-
GIS.
Figure A3- 57 Web interface for the access to the CIS of the Veneto Region coast.
Main topics addressed in the Veneto coast section (Figure A3- 58) are:
Base maps (collection of satellite images and aerial photographs; raster maps at different
scale, nautical maps, administrative boundaries, bathymetry);
Fisheries and aquaculture (fish zones, activities of 2005);
Navigation (port system, network navigation);
Habitat (localization of marine outcrops);
Environmental monitoring (bathing quality data, meteo-marine data, benthos community,
torbidity, phytoplankton, temperature);
Littoral (coastline evolution 1997-2009, erosion and nourishment, dredging);
Services and tourism;
Archaeology;
Sediment characteristics;
Restrictions to fisheries and wildlife protection areas;
Infrastructures and technological networks.

21807-REL-T006.2 Annex 3 – page 105
Figure A3- 58 Web interface of the Veneto cost section.
Main topics addressed in the hinterland section are:
Base maps (collection of satellite images and aerial photographs; raster maps at different
scale, nautical maps, administrative boundaries, bathymetry);
Protected areas (Important Bird Area, Special Protection Area and Site of Community
Importance;
Infrastructures and technological networks;
Territorial plan.
Metadata are provided for all layers included in the CIS of the Veneto Region coast. In
particular a specific tool enables to visualise a metadata form including the detailed description
of the data source and provider, as well as hyperlinks to detailed information related to the
layer (such as data tables, documents, web-sites with real-time data, etc.).
ICZM related functionalities:
SINFO CIS provides some of the ICZM knowledge related functionalities considered by the
analysis, specifically:
Integration among different information sectors this functionality is widely developed;
Operation at the different spatial scale; great part of the available spatial data can be re-
scaled according to the considered spatial extent; thus enabling to visualize more details at
a higher scales.
The data and information collected at the local level allows a more general inclusion in a
larger scale, thus providing an adequate cooperation between different levels.

21807-REL-T006.2 Annex 3 – page 106
It is particularly important to stress wide availability of multi-timer layers and data. A very
interesting example is the exhaustive and comprehensive set of historical maps and survey of
the Venice Lagoon morphology, enabling to evaluate the long term evolution of the system.
Historical maps can be directly consulted through the SIGLA tool, that enables to focus the
analysis on a specific lagoon area of interest (see an example in Figure A3- 59).
Figure A3- 59 Example of historical map search and visualisation.
Important time series are also available for environmental quality data of various matrixes.
These data are contained in a specific database; BDMA (Environmental Monitoring Database)
is a tool for Internet search and consultation of environmental data on the Venice lagoon and
surrounding areas (drainage basin and the coastal marine area). Other really important
historical datasets are related to the coastline evolution (including quantitative data on erosion,
sedimentation and nourishment processes) of the Venice littorals (see an example in Figure
A3- 60) and the morphological evolution of the lagoon system, including in particular
bathymetric data on shallow waters, tidal flats and salt-marshes. These two set fully support
the assessment of coastal and lagoon dynamics and the definition of related plans of
interventions.
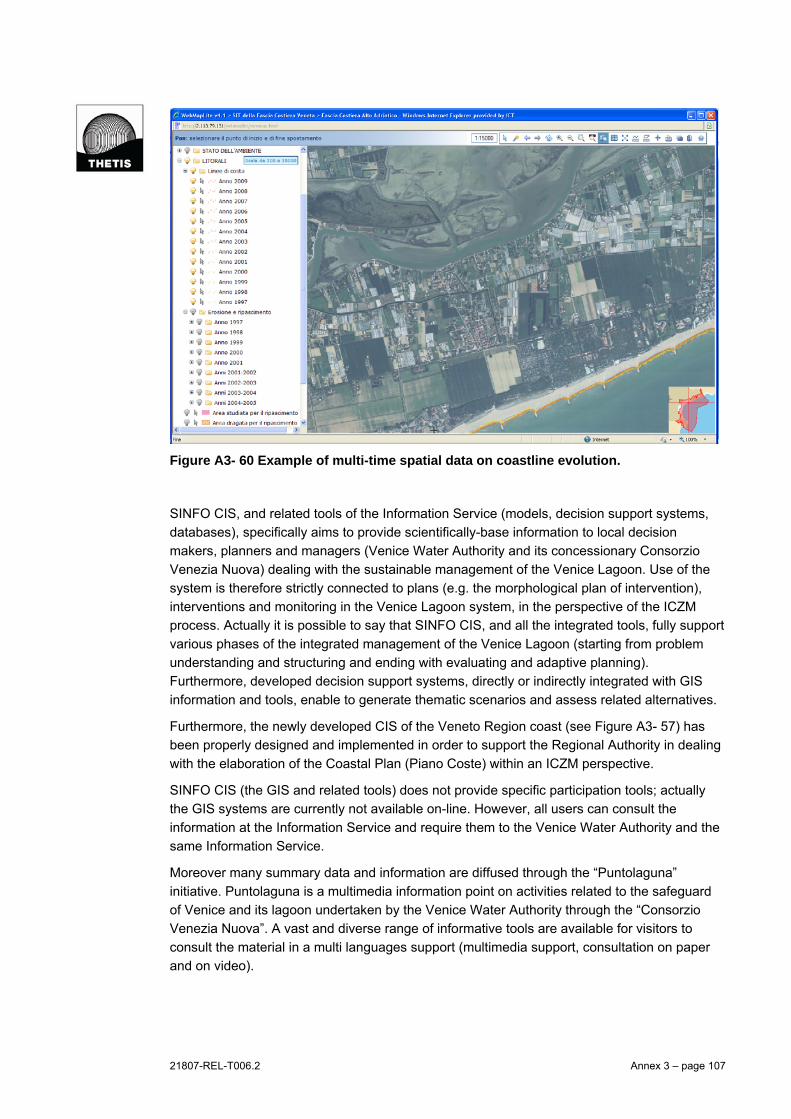
21807-REL-T006.2 Annex 3 – page 107
Figure A3- 60 Example of multi-time spatial data on coastline evolution.
SINFO CIS, and related tools of the Information Service (models, decision support systems,
databases), specifically aims to provide scientifically-base information to local decision
makers, planners and managers (Venice Water Authority and its concessionary Consorzio
Venezia Nuova) dealing with the sustainable management of the Venice Lagoon. Use of the
system is therefore strictly connected to plans (e.g. the morphological plan of intervention),
interventions and monitoring in the Venice Lagoon system, in the perspective of the ICZM
process. Actually it is possible to say that SINFO CIS, and all the integrated tools, fully support
various phases of the integrated management of the Venice Lagoon (starting from problem
understanding and structuring and ending with evaluating and adaptive planning).
Furthermore, developed decision support systems, directly or indirectly integrated with GIS
information and tools, enable to generate thematic scenarios and assess related alternatives.
Furthermore, the newly developed CIS of the Veneto Region coast (see Figure A3- 57) has
been properly designed and implemented in order to support the Regional Authority in dealing
with the elaboration of the Coastal Plan (Piano Coste) within an ICZM perspective.
SINFO CIS (the GIS and related tools) does not provide specific participation tools; actually
the GIS systems are currently not available on-line. However, all users can consult the
information at the Information Service and require them to the Venice Water Authority and the
same Information Service.
Moreover many summary data and information are diffused through the “Puntolaguna”
initiative. Puntolaguna is a multimedia information point on activities related to the safeguard
of Venice and its lagoon undertaken by the Venice Water Authority through the “Consorzio
Venezia Nuova”. A vast and diverse range of informative tools are available for visitors to
consult the material in a multi languages support (multimedia support, consultation on paper
and on video).
21807-REL-T006.2 Annex 3 – page 108
Puntolaguna information point offers presentations on the safeguarding activities and "virtual”
visits to the lagoon. Puntolaguna is also used to organise the following initiatives:
Visit to the lagoon and the work sites of main interventions;
Training courses for technicians from the public administration in particular focusing on
data management and safeguarding activities of the Venetian lagoon ecosystem;
Technical seminars;
Educational laboratory.
System development and management
The complete set of GIS and other tool collectively included in the SINFO CIS has been
progressively developed, since 1984, by the Information Service of the Venice Water
Authority. These activities also implied the collaboration with other public and private entities,
in particular the Consorzio Venezia Nuova and other ones such as the Veneto Regional
Authority and Thetis, an engineering company based in Venice. Data contained in the SINFO
CIS tools have been produced by an remarkable high number of studies, project and
monitoring activities involving a wide variety of subjects working in the Venice Lagoon. A great
part of funds used to develop tools and acquire data have been directly provided by the
Venice Water Authority through its concessionary Consorzio Venezia Nuova. Indeed it is very
difficult to provide a figure of costs related to this remarkable development effort.
Initial difficulties were mainly related to technological aspects of tools development.
Afterwards, main obstacles were represented by data collection; a huge effort was
implemented to acquire raw data from the original producers and to standardise these data to
common formats.
SINFO-CIS is today managed and operated by the staff of the Information Service of the
Venice Authority. Particular attention is given to maintain all part of the system and related
dataset updated to the last available data and technologies (both software and hardware).
About twelve full-time persons are currently involved in the management, updating and
progressive development of this complex system of systems. In particular:
All staff persons are involved in the operative management and use of the GIS tools,
including all the various phase of the production and analysis of spatial information; such
as: data digitalisation, editing, spatial analysis and output production;
Five of the twelve persons are specifically also dedicated to software development,
including web aspects.
Due to the operative orientation of the SINFO CIS, target users mainly include the following
ones:
Policy-makers and decision-makers, in particular those working for the Venice Water
Authority. Moreover, data have been provided to support decision making of various other
institutions;
Coastal planners and coastal managers, in particular technicians working for the
Consorzio Venezia Nuova;
Internal experts and specialised and expert users;
21807-REL-T006.2 Annex 3 – page 109
Representative of private sectors that can be in particular interested in understanding
constrains and opportunities related to the lagoon environment for their economic
activities.
Data and information contained in GIS and database are useful for everybody that may require
them to the MAV and Information Service. Other target users are represented by citizens, in
particular in relation to the Puntolaguna initiative.
Experience with the implementation
SINFO CIS is constantly used by the Venice Water Authority and its concessionary Consorzio
Venezia Nuova as the main data source for studies, projects and interventions related to the
safeguard of the Venice lagoon in the context of the Italian special law. The implemented
studies, projects and monitoring activities generate data and information that are progressively
archived in and managed through the same SINFO CIS’s systems.
The consultation and distribution of the information allows and guarantees support to
management of coastal data, data sharing, communication, coastal monitoring, coastal
planning and management. The system is continuously implemented and is used for the on-
going safeguarding activities, in particular related to: the protection of the historical city of
Venice and its lagoon from high water events, morphological and environmental
requalification, and defence of littorals.
Conclusive remarks
SINFO CIS is a system of different tools, including GIS-based tools, databases, models and
DSS. It archives and manages an incredibly rich and wide amount of information of the Venice
Lagoon.
This system is strictly integrated within its main final users, the Venice Water Authority and the
related concessionary Consorzio Venezia Nuova, that actually utilize tools and data as the
scientific base of studies, projects, interventions, plans, monitoring activities. All these
activities are implemented in a holistic vision aiming to the overall safeguarding of the Venice
lagoon system, including a relevant natural heritage and the related human component. It is
possible to conclude that SINFO-CIS fully supports the implementation of an ICZM-like
process. In this perspective it is relevant to mention some rather new studies promoted by the
Venice Water Authority focusing on the sustainable development of the Venice Lagoon, the
assessment of climate change vulnerability and the development of adaptation strategies to
the same climate change impacts.

21807-REL-T006.2 Annex 4
Annex 4 – Information sources for the in-depth analysis
21807-REL-T006.2 Annex 4 – page 1
HELCOM Map and Data Service
17/02/2011 Beginning of in-depth analysis from results of the overview assessment.
18/02/2011 Email to Manuel Frias and Minna Pyhala (not reply).
28/02/2011 Email to [email protected] and [email protected].
28/022011 Email from Joni Kaitaranta, data administrator in HELCOM and also in charge
of updating and development of the map service. Data requests can be
diverted to him.
08/03/2011 Mail to Joni Kaitaranta asking for further information and phone / skype
interview arrangement.
08/03/2011 Additional information and documentation received via email by Joni
Kaitaranta. Availability on 15 or 16 March for skype interview.
16/03/2011 Skype conference call.
Attendants:
Thetis Marco Zanetto, Chiara Castellani;
HelCom Joni Kaitaranta (Data administrator).
Discussed issues:
information contents and knowledge functionalities;
development and actual management of the system;
use and users of the system;
experiences with the implementation;
potentialities as DSS in ICZM dimensions.
22/03/2011 Additional information about system development and implementation
received via email by Joni Kaitaranta.
01/04/2011 In-depth analysis completed; draft version sent to Joni Kaitaranta.
04/04/2011 Comments and integrations received by HelCom Secretariat.
05/05/2011 In-depth analysis completed.
21807-REL-T006.2 Annex 4 – page 2
Coastal Information System Oder Estuary
04/02/2011 Beginning of in-depth analysis from results of the overview assessment.
09/02/2011 Beginning of further information collection via e-mail by Gerald Schernewski
that indicates Inga Haller and Susanne Schumacher as contact points of CIS
management (EUCC-D).
11/02/2011 Further information requested via e-mail to Inga Haller ([email protected]) and
Susanne Schumacher ([email protected]).
21/02/2011 Availability for a meeting requested via e-mail to Inga Haller (haller@eucc-
d.de) and Susanne Schumacher ([email protected]).
21/02/2011 Availability for face to face meeting from Nardine Stybel.
28/02/2011 Information request to Nardine Stybel via email (nardine.stybel@io-
warnemuende.de) and proposal for skype conference to7 March.
07/03/2011 Phone conference call (+49 381 5197279).
Attendants:
Thetis Marco Zanetto, Angiola Fanelli;
EUCC-D Nardine Stybel,
EUCC-D CIS developers.
Discussed issues:
ICZM related functionalities;
development and actual management of the system;
experiences with the implementation.
14/03/2011 Further information about coastal indicators, steering group, stakeholder
involvement and implementation phase received via email by Nardine Stybel.
06/04/2011 Draft in depth analysis completed and sent to Nardine Stybel.
15/04/2011 Suggestions for improvement received from Nardine Stybel.
15/04/2011 In depth analysis completed.
21807-REL-T006.2 Annex 4 – page 3
North Sea Atlas
08/02/2011 Beginning of in-depth analysis from results of the overview assessment.
09/02/2011 Further information requested via e-mail at [email protected].
10/02/2011 Phone call with Elly Kleis (+31 70 3366600) and email at [email protected] to
have a direct contact with CIS managers.
14/02/2011 Phone call with Elly Kleis and new mail asking for CIS information contact.
14/02/2011 Information contacts received by Elly Kleis: 1st contact is Ad Stolk (+31703366
787), 2nd contact Rob Vransen (+31703366648).
16/02/2011 Beginning of further information collection via email by Ad Stolk.
16/02/2011 Phone interview with Ad Stolk. Discussed issues: ICZM related functionalities,
technologies used, updating and use of the Atlas.
14/04/2011 Phone call: Ad Stolk is out of office for the whole week.
14/04/2011 Draft analysis sent to Ad Stolk and Rob Vransen.
15/04/2011 Phone talk with Marcel Bommele (Project leader of North Sea Atlas,
+31627038241). Discussed issues: development, management and actual
use of the Atlas.
18/04/2011 In depth analysis completed.
22/04/2011 Comments received by Ad Stolk.
26/04/2011 In depth analysis completed.
21807-REL-T006.2 Annex 4 – page 4
KustAtlas – Belgian Coastal Atlas
04/02/2011 Beginning of in-depth analysis from results of the overview assessment.
09/02/2011 Beginning of further information collection via e-mail by Kathy Belpaeme:
– Indication of handbook “Coastal Informatics: Web Atlas Design and
Implementation” as a comprehensive source of information about the
Atlas;
– Information about new updated and upgraded version of the Atlas, with
more interactive maps and links to sustainability indicators, to be
published in May 2011.
14/02/2011 Kathy Belpaeme indicates Sofie Vanhooren as point of contact to achieve
extra information requested about new features that will update and upgrade
the Atlas.
23/02/2011 Beginning of further information collection via e-mail by Sofie Vanhooren
28/03/2011 Phone call with Sofie Vanhooren (+3259340166) asking for missing
information about system development and management.
28/03/2011 As agreed, email to Sofie Vanhooren asking for missing information about
system development and management.
01/04/2011 Further information received via email from Sofie Vanhooren about system
development and management.
04/04/2011 In depth analysis completed; draft version sent to Sofie Vanhooren and Kathy
Belpaeme.
06/04/2011 Comments and integrations received by Sofie Vanhooren and Kathy
Belpaeme.
06/04/2011 In depth analysis completed.

21807-REL-T006.2 Annex 4 – page 5
MIDA – The Marine Irish Digital Atlas
08/02/2011 Beginning of in-depth analysis from results of the overview assessment.
10/02/2011 Beginning of further information collection via e-mail by Ned Dwyer (co-chair
of ICAN and project manager of the MIDA, [email protected]).
21/02/2011 Phone talk with Ned Dwyer to organize meeting.
25/02/2011 Mail from Ned Dwyer.
25/02/2011 Phone talk with Ned Dwyer: meeting arranged for 11 March.
07/03/2011 Mail to Ned Dwyer with overview analysis and indication of further information
needed for in-depth analysis.
11/03/2011 Meeting c/o CMRC.
Attendants:
Thetis Marco Zanetto, Angiola Fanelli;
CMRC Ned Dwyer.
Discussed issues:
origin, initial aim and development of the system;
management arrangements;
experiences with the implementation;
technological solutions;
ICZM related functionalities;
planned upgrades of the system.
01/04/2011 In depth analysis completed; draft version sent to Ned Dwyer.
07/04/2011 Comments and integrations received by Ned Dwyer.
08/04/2011 In-depth analysis completed.

21807-REL-T006.2 Annex 4 – page 6
Dorset Coastal Explorer
17/02/2011 Beginning of in-depth analysis from results of the overview assessment.
18/02/2011 Email to [email protected].
22/02/2011 Information received from James Feaver (Marine and Coastal GIS Officer):
the CIS is not operational yet and has more than a year to run.
04/03/2011 Phone call trial (+441305221697).
04/03/2011 Mail to James Feaver explaining why the system could be included in the in-
depth analysis even if pre-operational, asking for further information and
phone interview arrangement.
10/03/2011 Phone call with James Feaver (+441305221697), remote interview agreed for
23 March.
23/03/2011 Phone interview with James Feaver.
Discussed issues:
Operational systems developed by the Dorset Coast Forum;
State of the art of the new CIS;
knowledge functionalities;
use and users of the systems;
experiences with the implementation;
tool for ICZM policy tracking.
23/03/2011 New documentation collection by email from James Feaver.
06/04/2011 In depth analysis completed; draft version sent to James Feaver.
07/04/2011 Comments, integrations and further information received by James Feaver.
08/04/2011 In depth analysis completed.

21807-REL-T006.2 Annex 4 – page 7
Cork Harbour Geographic Information System
11/02/2011 Beginning of in-depth analysis from results of the overview assessment.
21/02/2011 Phone talk with Ned Dwyer to organize meeting with CIS responsible (Cathal
O’Mahony, [email protected]).
25/02/2011 Mail from Ned Dwyer.
25/02/2011 Phone talk with Ned Dwyer: meeting arranged for 11 March.
07/03/2011 Mail to Ned Dwyer and O’Mahony with overview analysis and indication of
further information needed for in-depth analysis.
11/03/2011 Meeting c/o CMRC.
Attendants:
Thetis Marco Zanetto, Angiola Fanelli;
CMRC Cathal O’Mahony.
Discussed issues:
information contents;
actual management of the system;
use and users of the system;
experiences with the implementation;
potentialities as DSS in ICZM dimensions.
24/03/2011 Email to Vicki O’Donnell (GIS officer, [email protected]) asking for specific
information.
25/03/2011 Email from Vicki O’Donnell with clarifications about data licence agreements.
28/03/2011 Exhaustive CIS information content requested by phone to Cathal O’Mahony.
28/03/2011 Additional specification of CIS information content received by Vicki
O’Donnell.
07/04/2011 In-depth analysis completed; draft version sent to Cathal O’Mahony and Vicki
O’Donnell.
07/07/2011 Integrations received by Vicki O’Donnell.
08/04/2011 In-depth analysis completed.

21807-REL-T006.2 Annex 4 – page 8
GEOIDD - Litto
08/03/2011 Beginning of in-depth analysis from results of the overview assessment.
08/03/2011 Email to [email protected] (returned).
10/03/2011 Email to [email protected] (returned).
10/03/2011 Phone call with operator of the French Environment Agency (+33 2
38797878).
10/03/2011 As agreed with operator, mail sent to cgdd-soes-orleans@developpement-
durable.gouv.fr for the attention of Sébastien Colas.
15/03/2011 Phone call with operator of the French Environment Agency. Sébastien Colas
will answer email today after talking with his boss.
15/03/2011 Beginning of further information collection via e-mail by Sébastien Colas (CIS
manager).
15/03/2011 Email to [email protected] asking for remote
interview on 24 or 25 March.
22/03/2011 Email to [email protected] asking for remote
interview on 24 or 25 March and additional documentation.
24/03/2011 New documentation collection via Email by Sébastien Colas. Availability for
phone talk.
14/04/2011 Phone call trial at +33238797806.
14/04/2011 Draft analysis sent to Sébastien Colas.
15/04/2011 Further information about system development and management collected via
mail by Sébastien Colas.
15/04/2011 Phone call with Sébastien Colas. Discussed issues: system management and
implementation.
15/04/2011 In depth analysis completed and sent to Sébastien Colas.
18/04/2011 Comments received by Sébastien Colas.
18/04/2011 In depth analysis completed.
21807-REL-T006.2 Annex 4 – page 9
REDIAM – Environmental Information Network of Andalusia
13/01/2011 Beginning of in-depth analysis from results of the overview assessment.
14/01/2011 Beginning of further information collection via e-mail (mainly by Jose Enrique
Frieyro de Lara).
25/01/2011 Phone talk with Jose Enrique Frieyro de Lara about integration of SIGLA in
REDIAM system, REDIAM actual functionalities and use, next upgrades.
31/01/2011 Meeting c/o Junta de Andalucia, Consejeria de Medio Ambiente (CMA).
Attendants:
Thetis Marco Zanetto;
CMA Jose Ramón Guzmán Álvarez (Belonging to “Dirección
General de gestión del Medio Natural”);
Egmasa Jose Enrique Frieyro de Lara (Technical manager of Coastal
and marine subsystem of REDIAM).
Discussed issues:
information contents;
management arrangements;
use and users of the system;
technology used;
experiences with the implementation;
next functionalities for ICZM to be implemented in the REDIAM.
07/02/2011 Beginning of further information acquisition via e-mail (by Jose Enrique Frieyro
de Lara) about CIS members and new tool for ICZM to be integrated in the
REDIAM.
10/03/2011 Draft in depth analysis completed and sent to Enrique Frieyro.
10/04/2011 In depth analysis completed.
21807-REL-T006.2 Annex 4 – page 10
CRIGE-PACA Spatial Data Infrastructure
21/02/2011 Beginning of in-depth analysis from results of the overview assessment.
21/02/2011 Beginning of further information collection via e-mail by Corine Lochet.
22/02/2011 Email to Corine Lochet for interview arrangement.
25/02/2011 Email from Corine Lochet (meeting arrangement).
28/02/2011 Email to Corine Lochet: proposed 21, 22, 23 March for face to face interview.
02/03/2011 Further information from Corine Lochet by email. Face to face interview
arranged for 21 March.
21/03/2011 Meeting c/o CRIGE.
Attendants:
Thetis Marco Zanetto;
CMRC Romain Buchaut, Clément Mahoudeau;
PACA Region Corine Lochet.
Discussed issues:
operational context: ICZM in France and in PACA region;
experiences with the implementation;
technological solutions;
ICZM related functionalities;
planned upgrades of the system.
05/04/2011 Mail to Romain Buchaut asking for additional information about the new
regional geoportal.
06/04/2011 Further information received by Romain Buchaut via email.
08/04/2011 In-depth analysis completed; draft version sent to Corine Lochet, Romain
Buchaut, Clément Mahoudeau.
13/04/2011 Comments and integrations received on common work between PACA region
Maritime affairs office and CRIGE organization.
13/04/2011 In-depth analysis completed.

21807-REL-T006.2 Annex 4 – page 11
Coastal and marine information system of Emilia-Romagna Region
17/01/2011 Beginning of in-depth analysis from results of the overview assessment.
19/01/2011 Phone talk with Luisa Perini (CIS point of contact, Geological, Seismic and
Soil Dept., Emilia Romagna Regional Government) about CIS actual
functionalities and use.
19/01/2011 Beginning of further information collection via e-mail (by Luisa Perini).
03/02/2011 Received book “Il sistema Mare Costa dell'Emilia Romagna” from Luisa Perini.
15/02/2011 Meeting c/o Emilia - Romagna Regional Government, Geological, Seismic and
Soil Survey (Servizio Geologico, Sismico e dei Suoli - SGSS).
Attendants:
Thetis Marco Zanetto,
Angiola Fanelli;
SGSS Luisa Perini (CIS point of contact);
SGSS CIS users;
SGSS CIS developers.
Discussed issues:
origin and initial aim of the system;
CIS development and management;
actual use and users of the system;
experiences with the implementation;
ICZM functionalities;
next upgrades to be implemented.
17/02/2011 Screenshots of the system received by Luisa Perini.
31/03/2011 In depth analysis completed; draft version sent to Luisa Perini.
04/04/2011 Comments and integrations received by Luisa Perini.
04/04/2011 Phone talk with Luisa Perini.
04/04/2011 In depth analysis completed.

21807-REL-T006.2 Annex 4 – page 12
GIS tools of the Information Service of the Venice Water Authority
21/03/2011 Beginning of in-depth analysis from result of the overview assessment.
21/03/2011 Beginning of further information collection via phone by Roberto Rosselli.
30/04/2011 Meeting c/o Information Service (SIN) of the Venice Water Authority.
Attendants:
Thetis Claudia Cerasuolo;
SIN Roberto Rosselli.
Discussed issues:
Operational context;
Technological characteristics;
ICZM related functionalities;
System development and management;
Experience with the implementation.
07/04/2011 Meeting c/o Information Service with Claudio Buzzino for consultation of
SIGLA system and CIS of the Veneto Region coast.
14/04/2011 further information received by Gianni Biotto via phone and email.
15/04/2011 In depth analysis completed; draft version sent to Roberto Rosselli.
18/04/2011 comments and integration received / draft version accepted by Roberto
Rosselli.
18/04/2011 In depth analysis completed.
21807-REL-T006.2 Annex 5
Annex 5 – List of identified stakeholders
21807-REL-T006.2 Annex 5 – page 1
Institution Name E-mail
International level
VASAB (Visions and Strategies around the Baltic Sea)
Talis Linkaits (Head of Secretariat)
EEAC (European Environment and Sustainable Development Advisory Councils)
Antonio Domingos Abreu co-chair (WG Marine and Coastal Zones)
Marleen van Rijswijk (member of the Wadden Sea Council)
Ingeborg Niestroy (EEAC Secretary General)
Plan Bleau Jean-Pierre Giraud [email protected]
UNEP-MAP PAP/RAC Marko Prem [email protected]
UNEP-MAP MEDPOL Saverio Civili [email protected]
PSBSC – Black Sea Commission
Mamuka Gvilava [email protected]
Ahmet Kıdeyş [email protected]
OSPAR – Oslo and Paris Commission
David Johnson [email protected]
HELCOM – Helsinki Commission
Anna-Stiina Heiskanen [email protected]
UNESCO IOC (ICAM Programme)
Julien Barbiere [email protected]
EEA Andrus Meiner [email protected]
ETC-SIA Alejandro Campos [email protected]
ETC CCA Sergio Castellari [email protected]
ETC ICM Giovanni Coppini [email protected]
European Commission
EC DG CLIMA Meropi Paneli [email protected]
EC DG DEVCO Alessandra Sensi [email protected]
EC DG ENER Andrea Hercsuth [email protected]
Maria-Daria Taurisano [email protected]
EC DG ENV Hugo De-Groof [email protected]
Jacques Delsalle [email protected]
21807-REL-T006.2 Annex 5 – page 2
Institution Name E-mail
Karen Fabbri [email protected]
Arno Kaschl [email protected]
Karin Zaunberger [email protected]
EC DG ENTR
Alan Vella [email protected]
Michel Massart [email protected]
Herve Jean [email protected]
Katarzyna Kuske [email protected]
Patrick.O'Riordan Patrick.O'[email protected]
EC DG MARE
Ian Shepherd [email protected]
Staffan Ekwal [email protected]
Hermina Busschbach [email protected]
Anne France Woestyn [email protected]
ED DG MOVE
Josep Casanovas [email protected]
Jose Fernandez Garcia [email protected]
EC DG REGIO Michael Latsch [email protected]
EC DG RTD
Nicoleta Ariana Nastaseanu [email protected]
Waddah Saa [email protected]
Wolfram Schrimpf [email protected]
George-Eugeniu Predoiu [email protected]
JRC-ISPRA Carlo Lavalle [email protected]
Vittorio Barale [email protected]
National level
Ministry of the Environment (Cyprus)
Joanna Constantinidou [email protected]
Federal Environment Agency, UBA (Germany)
Wulf Huelsmann [email protected]
National spatial planning agency (Denmark)
Helle Fischer [email protected]
Ministry of the Environment (Estonia)
Silver Vahtra [email protected]
21807-REL-T006.2 Annex 5 – page 3
Institution Name E-mail
Ministry for the Environment, Physical Planning and Public Works (Greece)
Athina Mourmouri [email protected]
General Directorate for Sustainability of the Coast - Ministerio Medio Ambiente (Spain)
Carlos Martínez Peña [email protected]
Ministry of the Environment (Finland)
Tiina Tihlman [email protected]
Délégation interministérielle à l'Aménagement et à la compétitivité des territories – DIACT (France)
Xavier Chauvin [email protected]
Ministry of Ecology, Sustainable Development, transports and housing General Planning, Housing and Nature Directorate (DGALN) (France)
Xavier Fouquart [email protected]
Ministry of the Environment, Land and Sea (Italy)
Daniela Addis [email protected]
Ministry of Regional Development and Local Governments, Spatial Planning Department (Latvia)
Dace Granta [email protected]
Environment and Planning Authority MEPA (Malta)
Christina Mallia [email protected]
Ministry of Environment and Infrastructure (The Netherlands)
Joop Bakker [email protected]
Ministry of Environment and Infrastructure (The Netherlands)
Wim De Vries [email protected]
Maritime Office Gydnia (Poland)
Andrzej Cieslak [email protected]
Ministry of Infrastructure (Poland)
Krzywda Katarzyna [email protected]
National Water Agency (Portugal)
Maria Margarida Almodovar [email protected]
Lisa Sousa Pinto [email protected]
21807-REL-T006.2 Annex 5 – page 4
Institution Name E-mail
Ministry of Environment and Sustainable Development (Romania)
Mihail Costache [email protected]
Ministry of the Environment and Spatial Planning (Slovenia)
Mitja Bricelj [email protected]
Ministry of Sustainable Development (Sweden)
Sten Jerdenius [email protected]
Turkey Aydin Mustafa [email protected]
Department for Environment, Food and Rural Affairs (United Kingdom)
Steve Collins [email protected]
Lithuania D. Gudaitiene Holiman [email protected]
Croatia Sandra Troselj Stanisic [email protected]
Ireland Dick McKeever [email protected]
Bulgaria Krasimir Gorchev [email protected]
Sub-national level
Secretary General of CPRM
Damien Perissé [email protected]
Atlantic Arc Commission (CPRM)
Fabien MESCLIER [email protected]
Balkan and Black Sea Regional Commission (CPRM)
Nicusor Daniel Constantinescu (President)
Island Commission (CPRM)
Jean Didier Hache [email protected]
Inter-Mediterranean Commission (CPRM)
Josefina MORENO BOLARÍN
Baltic Sea Commission (CPRM)
Janne Tamminen [email protected]
North Sea Commission (CPRM)
Lars Haukvik (Executive Secretary)
Conference of Atlantic Arc Cities (CAAC)
Tamara Guirao [email protected]
KIMO Local Authorities International Environmental Organisation
Ryan d'Arcy Metcalfe [email protected]
CEMR – Council of European Municipalities and Regions
Marie Bullet [email protected]
21807-REL-T006.2 Annex 5 – page 5
Institution Name E-mail
Union of the Baltic Cities Elija Eloranta [email protected]
ECTP-CEU - European Council of Spatial Planners
Secretariat ECTP-CEU [email protected]
Local government association (United Kingdom) – coastal issues SIC
Rupert Clubb (Lead Officer of the Coastal SIC)
Roger Thomas (Chairman of the Coastal SIC)
Aberdeenshire Council (United Kingdom)
Ann Bell [email protected]
Sefton Council (United Kingdom)
Andrew Hall [email protected]
Scarborough Borough Council (United Kingdom)
Kate Masser [email protected]
Arc Manche (United Kingdom and France)
Rachel Williams [email protected]
Sylvie Couratin [email protected]
David Zaoui [email protected]
UK Environmental Agency - Flood Risk Mapping & Data Management
Iain Baines [email protected]
Region PACA (France) Corine Lochet [email protected]
Département de l'Hérault (France)
Philippe Carbonnel [email protected]
Dublin Regional Authority (Ireland)
Patricia Potter [email protected]
Cork County Council (Ireland)
Padraig Moore [email protected]
Zeeland (Netherlands) Martin Wiersma [email protected]
Province of Zuid-Holland (Netherlands)
Lenneke Joosen [email protected]
Provincie West-Vlaanderen (Belgium)
Leo Declercq [email protected]
Ministry of Agriculture, Environment and Rural area of Schleswig-Holstein, Coast Protection Unit (Germany)
Jacobus Hofstede [email protected]
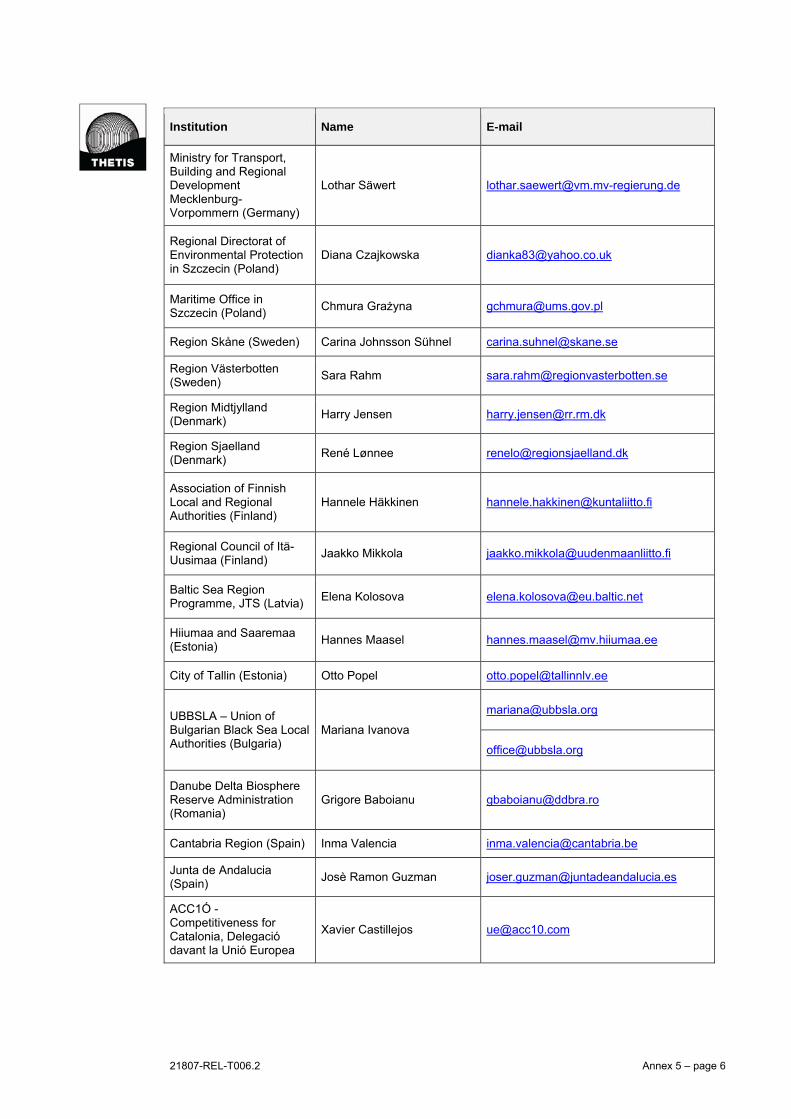
21807-REL-T006.2 Annex 5 – page 6
Institution Name E-mail
Ministry for Transport, Building and Regional Development Mecklenburg-Vorpommern (Germany)
Lothar Säwert [email protected]
Regional Directorat of Environmental Protection in Szczecin (Poland)
Diana Czajkowska [email protected]
Maritime Office in Szczecin (Poland)
Chmura Grażyna [email protected]
Region Skåne (Sweden) Carina Johnsson Sühnel [email protected]
Region Västerbotten (Sweden)
Sara Rahm [email protected]
Region Midtjylland (Denmark)
Harry Jensen [email protected]
Region Sjaelland (Denmark)
René Lønnee [email protected]
Association of Finnish Local and Regional Authorities (Finland)
Hannele Häkkinen [email protected]
Regional Council of Itä-Uusimaa (Finland)
Jaakko Mikkola [email protected]
Baltic Sea Region Programme, JTS (Latvia)
Elena Kolosova [email protected]
Hiiumaa and Saaremaa (Estonia)
Hannes Maasel [email protected]
City of Tallin (Estonia) Otto Popel [email protected]
UBBSLA – Union of Bulgarian Black Sea Local Authorities (Bulgaria)
Mariana Ivanova
Danube Delta Biosphere Reserve Administration (Romania)
Grigore Baboianu [email protected]
Cantabria Region (Spain) Inma Valencia [email protected]
Junta de Andalucia (Spain)
Josè Ramon Guzman [email protected]
ACC1Ó - Competitiveness for Catalonia, Delegació davant la Unió Europea
Xavier Castillejos [email protected]

21807-REL-T006.2 Annex 5 – page 7
Institution Name E-mail
Algarve Basin District Administration, Coastal Department (Portugal)
Sebastião Braz Teixeira [email protected]
Tagus River Basin District Administration, Coastal Department (Portugal)
Celso Aleixo Pinto [email protected]
Kouklia Community Council (Cyprus)
Valia Miltiadous [email protected]
Ipiros Region (Greece) Yannis Houliaras [email protected]
Prefecture of Kavala - Planning Department (Greece)
Grigorios Papadopoulos [email protected]
Regione Emilia-Romagna (Italy)
Katia Raffaelli [email protected]
Regione Lazio (Italy) Paolo Lupino [email protected]
Silvia Bellacicco [email protected]
Regione Liguria (Italy)
Stefano Coppo [email protected]
Ilaria Fasce [email protected]
Corinna Artom [email protected]
Agenzia della Conservatoria delle Coste Regione Sardegna (Italy)
Alessio Satta [email protected]
Regional Development Centre Koper (Slovenia)
Giuliano Nemarnik [email protected]
Tamara Ristic [email protected]
Economic sector
European Network of Maritime Clusters - ENMC
Niko Wijnolst (Chairman) [email protected]
IVEAEMPA and the Cluster of the Balearics Island (ENMC – European Network of Maritime Clusters partner)
Iolanda Piedra
MIF – Marine Industry Forum
Paris Sansoglou (Environmental issues WG)
European Union of Tourist Officers
Liz Buchanan [email protected]
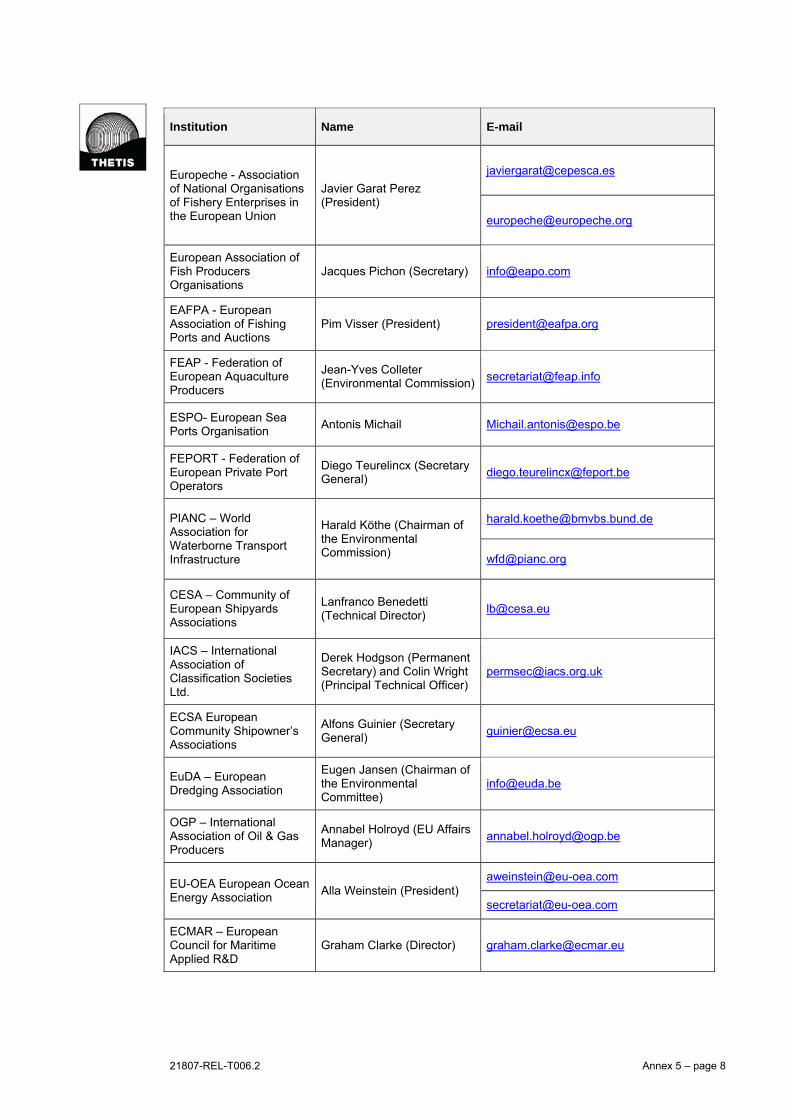
21807-REL-T006.2 Annex 5 – page 8
Institution Name E-mail
Europeche - Association of National Organisations of Fishery Enterprises in the European Union
Javier Garat Perez (President)
European Association of Fish Producers Organisations
Jacques Pichon (Secretary) [email protected]
EAFPA - European Association of Fishing Ports and Auctions
Pim Visser (President) [email protected]
FEAP - Federation of European Aquaculture Producers
Jean-Yves Colleter (Environmental Commission)
ESPO- European Sea Ports Organisation
Antonis Michail [email protected]
FEPORT - Federation of European Private Port Operators
Diego Teurelincx (Secretary General)
PIANC – World Association for Waterborne Transport Infrastructure
Harald Köthe (Chairman of the Environmental Commission)
CESA – Community of European Shipyards Associations
Lanfranco Benedetti (Technical Director)
IACS – International Association of Classification Societies Ltd.
Derek Hodgson (Permanent Secretary) and Colin Wright (Principal Technical Officer)
ECSA European Community Shipowner’s Associations
Alfons Guinier (Secretary General)
EuDA – European Dredging Association
Eugen Jansen (Chairman of the Environmental Committee)
OGP – International Association of Oil & Gas Producers
Annabel Holroyd (EU Affairs Manager)
EU-OEA European Ocean Energy Association
Alla Weinstein (President) [email protected]
ECMAR – European Council for Maritime Applied R&D
Graham Clarke (Director) [email protected]
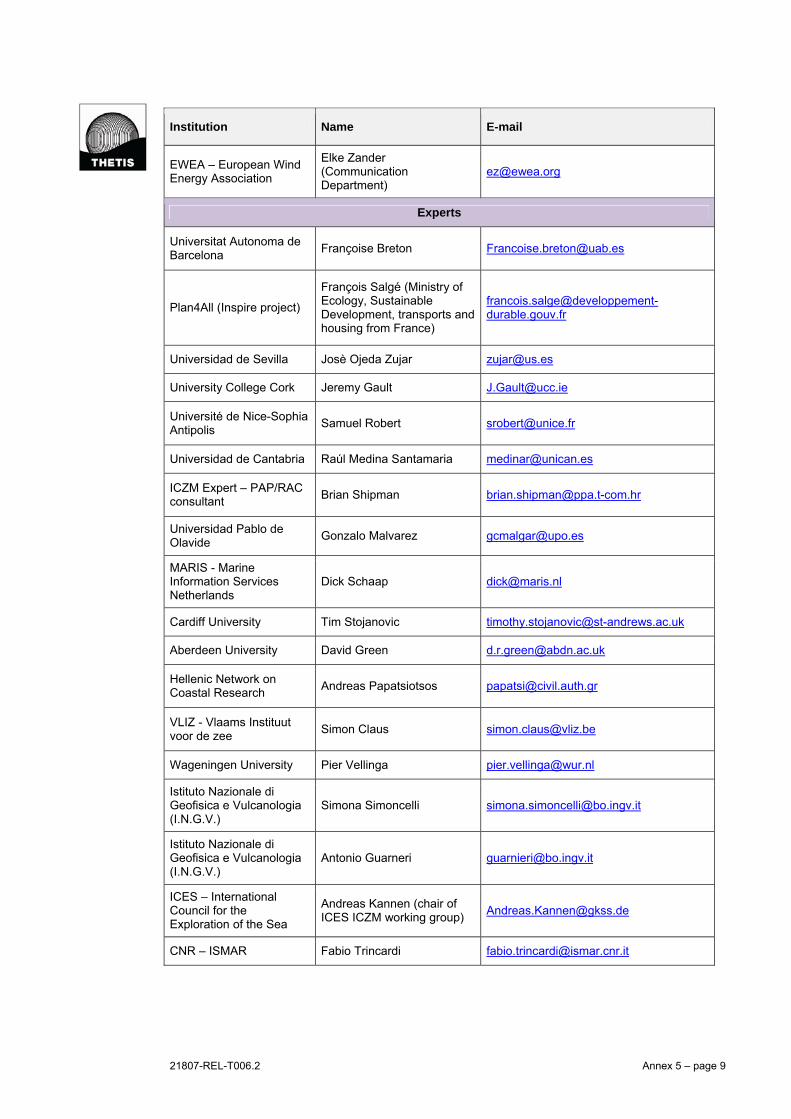
21807-REL-T006.2 Annex 5 – page 9
Institution Name E-mail
EWEA – European Wind Energy Association
Elke Zander (Communication Department)
Experts
Universitat Autonoma de Barcelona
Françoise Breton [email protected]
Plan4All (Inspire project)
François Salgé (Ministry of Ecology, Sustainable Development, transports and housing from France)
Universidad de Sevilla Josè Ojeda Zujar [email protected]
University College Cork Jeremy Gault [email protected]
Université de Nice-Sophia Antipolis
Samuel Robert [email protected]
Universidad de Cantabria Raúl Medina Santamaria [email protected]
ICZM Expert – PAP/RAC consultant
Brian Shipman [email protected]
Universidad Pablo de Olavide
Gonzalo Malvarez [email protected]
MARIS - Marine Information Services Netherlands
Dick Schaap [email protected]
Cardiff University Tim Stojanovic [email protected]
Aberdeen University David Green [email protected]
Hellenic Network on Coastal Research
Andreas Papatsiotsos [email protected]
VLIZ - Vlaams Instituut voor de zee
Simon Claus [email protected]
Wageningen University Pier Vellinga [email protected]
Istituto Nazionale di Geofisica e Vulcanologia (I.N.G.V.)
Simona Simoncelli [email protected]
Istituto Nazionale di Geofisica e Vulcanologia (I.N.G.V.)
Antonio Guarneri [email protected]
ICES – International Council for the Exploration of the Sea
Andreas Kannen (chair of ICES ICZM working group)
CNR – ISMAR Fabio Trincardi [email protected]

21807-REL-T006.2 Annex 5 – page 10
Institution Name E-mail
Bulgarian Academy of Sciences - Institute of Water Problems
Emil Bournaski [email protected]
IFREMER Yves Henocque [email protected]
University of Brest Denis Bailly [email protected]
University College Cork Ned Dwyer [email protected]
New University Lisbon José Carlos Ferreira [email protected]
University of Szczecin Kazimierz Furmanczyk [email protected]
Tour du Valat Lisa Ernoul [email protected]
IDDRI – Institut du développement durable et des relations internationales
Julien Rochette [email protected]
HCMR – Hellenic Centre for Marine Research
Panayotis Panayotidis [email protected]
Civil society
WWF Gemma Parkes [email protected]
North Yorkshire and Cleveland Coastal Forum
Robin Siddle [email protected]
AKTI (Part of the Cyprus Environmental Stakeholder Forum, Sustainable Coastal Development Group)
Xenia I. Loizidou [email protected]
Seas at Risk Monica Verbeek (Executive Director)
Surfrider Foundation Europe
Cendrine Templier (Environment & Local Actions Manager)
Greenpeace Saskia Richartz (Ocean and fishery)
IUCN – International Union for Conservation of Nature
Alain Jeudy [email protected]
European Environmental Bureau – Federation of Environmental Citizens Organisation
Pieter De Pous (Policy Director)
Marine Conservation Society
Sam Fanshawe (Director) [email protected]

21807-REL-T006.2 Annex 5 – page 11
Institution Name E-mail
De Waddenvereniging (Wadden sea society)
Ester Kuppen [email protected]
Paddy Walker [email protected]
Stichting De Noordzee (The North Sea Foundation)
Joop Coolen (Spatial planning)
Sea First Foundation Judith Wouters (President) [email protected]
Corila (Venice Platform) Pierpaolo Campostrini [email protected]
EUCC International Alan Pickaver [email protected]
EUCC Germany Gerald Schernewski [email protected]
Nardine Stybel [email protected]
Gov2U – Government to you
Evika Karamagioli [email protected]
PoCoast Francisco Taveira Pinto [email protected]
MerTerre Isabelle Poitou [email protected]
MIO-ECSDE - Mediterranean Information Office for Environment, Culture and Sustainable Development
Iro Alampei [email protected]
Coalition Clean Baltic Gunnar Norén [email protected]
Environmental Protection Club of Latvia
Ojars Balcers [email protected]
Mediterranean SOS Network
Natalia Roumeliotis [email protected]
MAREAMICO Daniela Addis [email protected]
Natuurpunt Bart Slabbinck [email protected]
Stichting Duinbehoud (Dune Conservation Foundation)
Arnoud van der Meulen [email protected]

21807-RE
Anne
EL-T006.2
ex 6 –WWorkshopp report
Annexx 6
Thetis S.p.A. Castello 2737/f, 30122 Venezia Tel. +39 041 240 6111 Fax +39 041 521 0292 www.thetis.it
Document no.: 21807-REL-T004.0
Distribution list: DG Environment, file 21807
rev. date issued for pages prepared checked approved
0 20.05.11 Information 8 + 3A. ER ME MB
1
2
3
Client: European Commission – DG Environment
Subject: Option for coastal information systems
Doc. title: Workshop Report Stakeholder Workshop - 6th May 2011,
Marseille
21807-REL-T004.0 page 2/8
Table of contents
1 Workshop objective and structure .................................................................................... 3
2 Questionnaire results ........................................................................................................ 4
3 Workshop main feedbacks ............................................................................................... 7
Annex I: List of participants
Annex II: Workshop Agenda
Annex III: Questionnaire distributed to the Workshop participants
21807-REL-T004.0 page 3/8
1 Workshop objective and structure
The project “Options for coastal information systems” mainly aims to identify a set of policy re-
quirements for coastal information systems (CIS), i.e. requisites that can be concretely imple-
mented in order to improve the use of the same CIS in supporting the diffusion and implemen-
tation of the ICZM process at various scales (international, national, sub-national – regional
and local). The project is structured in three technical tasks: (i) task 1 deals with the analysis
of illustrative cases of existing coastal information systems; (ii) task 2 specifically focuses on
the definition of policy requirements and their assessment in terms of expected policy impacts;
(iii) task 3 deals with stakeholder involvement and participation in supporting the CIS analysis
and the definition and assessment of policy requirements.
Stakeholder involvement and participation in particular included the realisation of a 1-day
stakeholder workshop, held in Marseille on the 6th of May (list of workshop participant in Annex
I). The workshop enabled to discuss preliminary project results and gather related stakeholder
feedbacks. In particular the workshop was structured in a morning and an afternoon session
(workshop agenda in Annex II). The morning session aimed to:
Illustrate preliminary results of the project, also to support the afternoon discussion;
Illustrate some examples of concrete uses of coastal information system in supporting
the ICZM process and related future expectations and development.
The afternoon session was entirely dedicated to a guided discussion aiming to provide feed-
backs and suggestions on the following main issues:
Preliminary identified policy requirements;
Impact assessment of preliminary identified policy requirements;
Identification of policy options, i.e. integrated set of relevant policy requirements.
The following materials supported the workshop discussion:
A Discussion Paper distributed to the participants before the workshop;
Presentations given in the morning session, including in particular the specific presen-
tation on preliminary project results (i.e. analysis of illustrative cases, policy require-
ments identification, policy requirement impact assessment);
The results of a questionnaire previously distributed to the workshop participants,
specifically asking their contribution to the:
– Validation and priority definition of the preliminary identified policy requirements,
described in the Discussion Paper;
– Impact assessment of preliminary identified policy requirements, according to
the methodology described in the Discussion Paper.
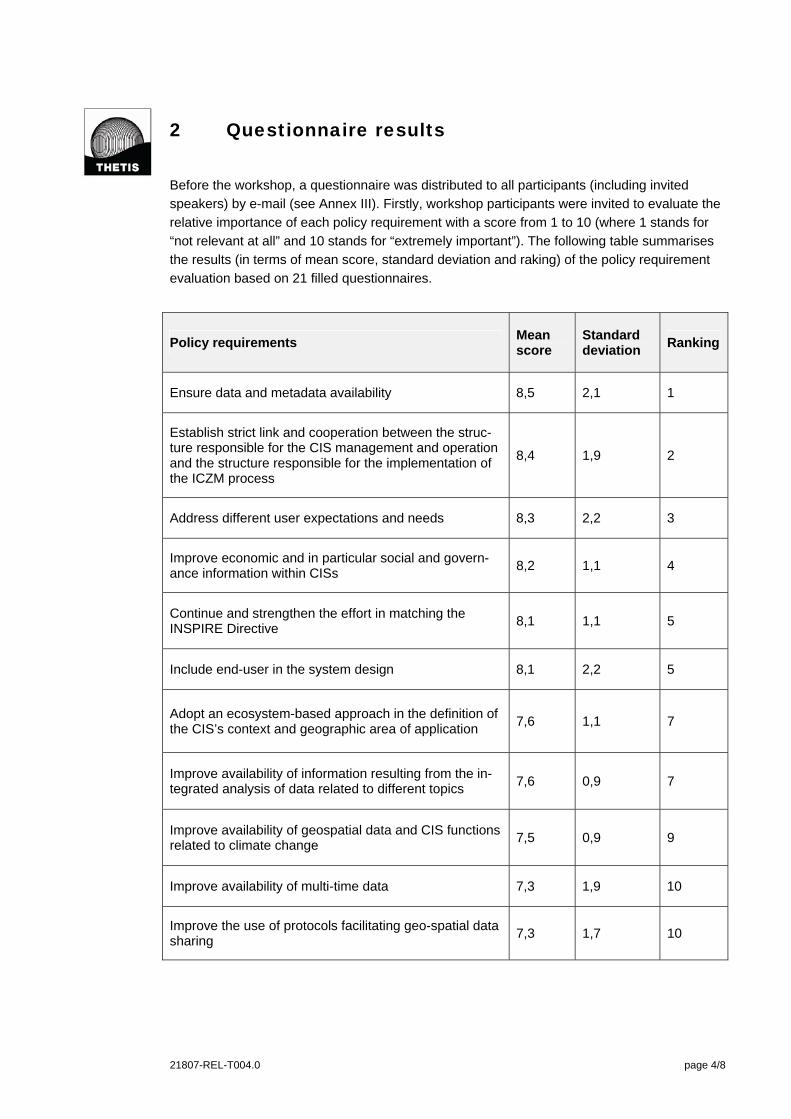
21807-REL-T004.0 page 4/8
2 Questionnaire results
Before the workshop, a questionnaire was distributed to all participants (including invited
speakers) by e-mail (see Annex III). Firstly, workshop participants were invited to evaluate the
relative importance of each policy requirement with a score from 1 to 10 (where 1 stands for
“not relevant at all” and 10 stands for “extremely important”). The following table summarises
the results (in terms of mean score, standard deviation and raking) of the policy requirement
evaluation based on 21 filled questionnaires.
Policy requirements Mean score
Standard deviation
Ranking
Ensure data and metadata availability 8,5 2,1 1
Establish strict link and cooperation between the struc-ture responsible for the CIS management and operation and the structure responsible for the implementation of the ICZM process
8,4 1,9 2
Address different user expectations and needs 8,3 2,2 3
Improve economic and in particular social and govern-ance information within CISs
8,2 1,1 4
Continue and strengthen the effort in matching the INSPIRE Directive
8,1 1,1 5
Include end-user in the system design 8,1 2,2 5
Adopt an ecosystem-based approach in the definition of the CIS’s context and geographic area of application
7,6 1,1 7
Improve availability of information resulting from the in-tegrated analysis of data related to different topics
7,6 0,9 7
Improve availability of geospatial data and CIS functions related to climate change
7,5 0,9 9
Improve availability of multi-time data 7,3 1,9 10
Improve the use of protocols facilitating geo-spatial data sharing
7,3 1,7 10

21807-REL-T004.0 page 5/8
Policy requirements Mean score
Standard deviation
Ranking
Improve functionalities directly supporting ICZM deci-sion making in a short and long term perspective
7,3 1,6 10
Improve diffusion and innovation of e-participation tools 7,2 2,2 13
Participate to CIS and/or ICZM networks 7,1 1,5 14
Develop and implement a common ontology for coastal and marine information
6,8 2,0 15
Develop on-line tools to measure the real use of CIS 6,7 1,7 16
Integrate 3D data and develop 3D tools 6,1 2,1 17
Each participant to the questionnaire selected the ten most important policy requirements ac-
cording to the expressed higher rates. Afterword, each one evaluated direct impacts (using the
matrix included in Annex III) of these ten identified policy requirements through the definition of
qualitative scores expressed by the following possibilities: ---; --; -; 0; +; ++; +++. It is important
to stress that negative values express a negative interpretation of the expected effect (for ex-
ample decrease in civil society participation in ICZM or increase in costs), whereas positive
values express an expected positive impact (e.g. increase in civil society participation in ICZM
or decrease in costs).
Seventeen questionnaires included the definition of qualitative scores expressing direct im-
pacts of defined policy requirements. Results of these questionnaires are summarised in the
following table. In particular this table shows the most frequent score or scores indicated for
each policy requirement – direct impact combination.

21807-REL-T004.0 page 6/8
Total n
umber
of v
otes
expre
ssed
Inte
grate
d knowle
dge on th
e co
asta
l
syst
em
Bridged
gap
bet
ween s
cien
tific
info
rmat
ion a
nd polic
y/dec
isio
n mak
ing
in th
e IC
ZM p
roce
ssIn
volv
emen
t of s
take
holder
s in
the
ICZM
pro
cess
Support an
d faci
litat
ion in
clim
ate
chan
ge ad
apta
tion o
f coas
tal z
ones
within
the
wider
conte
xt o
f ICZM
Perio
dical
eva
luat
ion p
roce
ss o
f ICZM
plannin
g and m
anag
emen
t; su
pport an
ICZM
adap
tive
proce
ssCooper
atio
n am
ong diff
eren
t
inst
itutio
ns an
d inst
itutio
nal le
vels
Imple
men
tatio
n of I
CZM in
a re
gional
sea
conte
xtAdoptio
n of a
long-te
rm p
ersp
ectiv
e fo
r
ICZM
Support to
the
inte
gratio
n of I
CZM w
ith
other
clo
sely
rela
ted p
olicie
s an
d
direct
ives
(e.g
. WFD, M
SFD, IM
P-MSP);
Simplif
icat
ion o
f the
use o
f the
coas
tal
info
rmat
ion s
yste
mCost
s re
late
d to m
ainte
nance
and
updatin
g of t
he CIS
Include end-user in the system design 11 0 ++ +++ 0 0 + + + ++ ++ ‐; 0
Address different user expectations and needs 13 0 ++ +++ 0 0 ++ + + ++ ++ ‐
Adopt an ecosystem-based approach in the definition of the CIS’ context and geographic area of application 8 ++; +++ + 0 +++ + + +++ +; +++ +; +++ ‐; 0 0
Continue and strengthen the effort in matching the INSPIRE Directive 13 +++ + 0 0 0 +; +++ ++ + ++ ++ ‐
Improve economic and in particular social and governance information within CISs 15 +++ ++ + ++ + + + 0; + + ‐ ‐
Improve availability of information resulting from the integrated analysis of data related to different topics 10 +++ ++ + +; ++ +; ++ + + + + 0 ‐
Improve availability of multi-time data 12 +++ + 0 ++ ++ 0 + +++ 0; + ‐ 0
Develop and implement a common ontology for coastal and marine information 6 +++ ++ 0 0 0 +++ 0 0 ++ not
definable0
Improve functionalities directly supporting ICZM decision making in a short and long term perspective 8 ++ +++ ++ ++ ++ 0; + + +++ 0; + ‐; 0 0
Improve diffusion and innovation of e-participation tools 8 +++ +; +++ + + + + + 0 0 ‐; + ‐
Integrate 3D data and develop 3D tools 5 ++ 0; + 0 0;+ 0 0 + 0 +; ++ 0 0
Ensure data and metadata availability 15 + 0 + 0 0 + + 0; + + + 0
Improve availability of geospatial data and CIS functions related to climate change 9 + 0 0 ++; +++ 0 + 0; + ++ + 0; + ‐
Establish strict link and cooperation between the structure responsible for the CIS management and operation and the structure responsible for the implementation of the ICZM process
11 0 ++; +++ 0; + + + +; ++ ++ ++ +; ++; +++ ++ 0; +
Improve the use of protocols facilitating geo-spatial data sharing 8 ++ ++ +; ++ + 0 ++ + + +; ++ ++ +
Develop on-line tools to measure the real use of CIS 6 0 ++ ++ 0 ++ 0 0 0 0 0; ++ 0
Participate to CIS and/or ICZM networks 8 ++ + ++ 0 + + ++ +; ++ + 0 0

21807-REL-T004.0 page 7/8
3 Workshop main feedbacks
Main workshop feedbacks are below organised accordingly to the three key issues addressed
by the discussion:
Preliminary identified policy requirements;
Impact assessment of preliminary identified policy requirements;
Identification of policy options, i.e. integrated set of the most relevant identified policy
requirements.
Main workshop feedbacks related to the preliminary identified policy requirements can be
summarised as follows:
Workshop participants agreed on the preliminary identified policy requirements de-
scribed in the Discussion Paper. Questionnaire results enabled to relatively rank the
policy requirements in terms of perceived importance (see previous chapter 2).
Some policy requirements should be included in the “baseline scenario” to be used to
relatively assess the proposed policy options. This can be defined as the scenario that
does not include the implementation of new policy requirements for coastal infor-
mation systems, also implying the fulfilment of already set legislative requirements in
particular related to implementation of the INSPIRE Directive. In this perspective it
was suggested to include in the baseline scenario the following two identified policy
requirements:
– Continue and strengthen the effort in matching the INSPIRE Directive;
– Ensure data and metadata availability, policy requirement strictly related to the
previous one.
Workshop participants also agreed on the four categories used to organise the policy
requirements: (i) scope, (ii) contents, (iii), functions, (iv) mechanisms.
Other two possible category structures were proposed. According to the first one, poli-
cy requirements can be grouped in two categories: (i) data availability, (ii) user needs.
The second one proposes to organise and summarise policy requirements in the fol-
lowing five categories: (i) availability (including functionality), (ii) user needs, (iii) in-
teroperability, (iv) integrated analysis, (v) ecosystem approach.
Main workshop feedbacks related to the impact assessment of preliminary identified policy re-
quirements can be summarised as follows:
Workshop participants agreed on the proposed direct impacts described in the Dis-
cussion Paper.
Policy impacts assessment should be based on an integrated evaluation of expected
benefits and costs. Considered direct impacts already attempt to assess both aspects;
expected benefits are those related to the improvement in the CIS’s support to key
ICZM issues (such as for example cooperation among different institutions and institu-
tional levels or involvement of stakeholders in the ICZM process). The same evalua-
tion of “cost related to the maintenance and updating of he CIS” tries to consider also

21807-REL-T004.0 page 8/8
cost reduction (i.e. benefits) induced by the implementation of a specific requirement,
for example in relation to data search and acquisition;
It was suggested to include some other “costs or expected negative effects” in the list
of direct impacts. Some examples can be: development cost, learning cost or difficul-
ties related to factors external to the specific CIS context. For example the policy re-
quirement “Adopt an ecosystem-based approach in the definition of the CIS’ context
and geographic area of application” needs an important cooperation effort among dif-
fer administrations that is not strictly related to the CIS development.
Main workshop feedbacks related to the policy options (integrated set of relevant policy re-
quirements) definition can be summarised as follows:
Baseline scenario must be better defined, in particular including those policy require-
ments that are related to the fulfilment of already set legislative demands, as previous-
ly argued;
It was suggested to use all the identified policy requirements for the formulation of the
policy options;
Policy options must be clearly differentiated. In this perspective, categorizations used
or proposed to group the policy requirements can support the formulation of properly
differentiated policy options;
Furthermore, it was also agreed that policy options definition could also be based on
an additive criteria, i.e. the second policy option shall include (all or most) first policy
option’s requirements and the third policy option shall include (all or most) first and
second policy options’ requirements;
Identified direct impacts will be also used to assess the formulated policy options that
will be also evaluated in terms of indirect (or derived) impacts.

21807-REL-T004.0 Annex I
Annex I: List of participants
Participant Institution E-mail
Archias Christine CRIGE PACA (France) [email protected]
Artom Corinna Regione Liguria (Italy) [email protected]
Barale Vittorio Joint Research Centre, European Commission [email protected]
Blanken Wim Geon bv (Netherlands) [email protected]
Carceller Pauline Provence Alpes-Côte d'Azur Region (France)
Cieslak Andrzej Maritime Office in Gdynia (Poland) [email protected]
Claus Simon Flanders marine institute – VLIZ (Belgium) [email protected]
Copitet Alenpa Provence Alpes-Côte d'Azur Region (France)
Dal Forno Elisa Commissario Delegato per l'emergenza socio-economico ambientale determi-natasi nella Laguna di Marano e Grado (Italy)
Delaney Eugenia Thetis S.p.A. (Italy) [email protected]
Desrentes François franç[email protected]
Dessy Claudia Agenzia Regionale Conservatoria delle Coste – Regione Sardegna (Italy) [email protected]
Dwyer Ned Coastal & Marine Resources Centre, University College Cork (Ireland) and In-ternational Coastal Atlas Network
Ernoul Lisa Tour du Valat (France) [email protected]
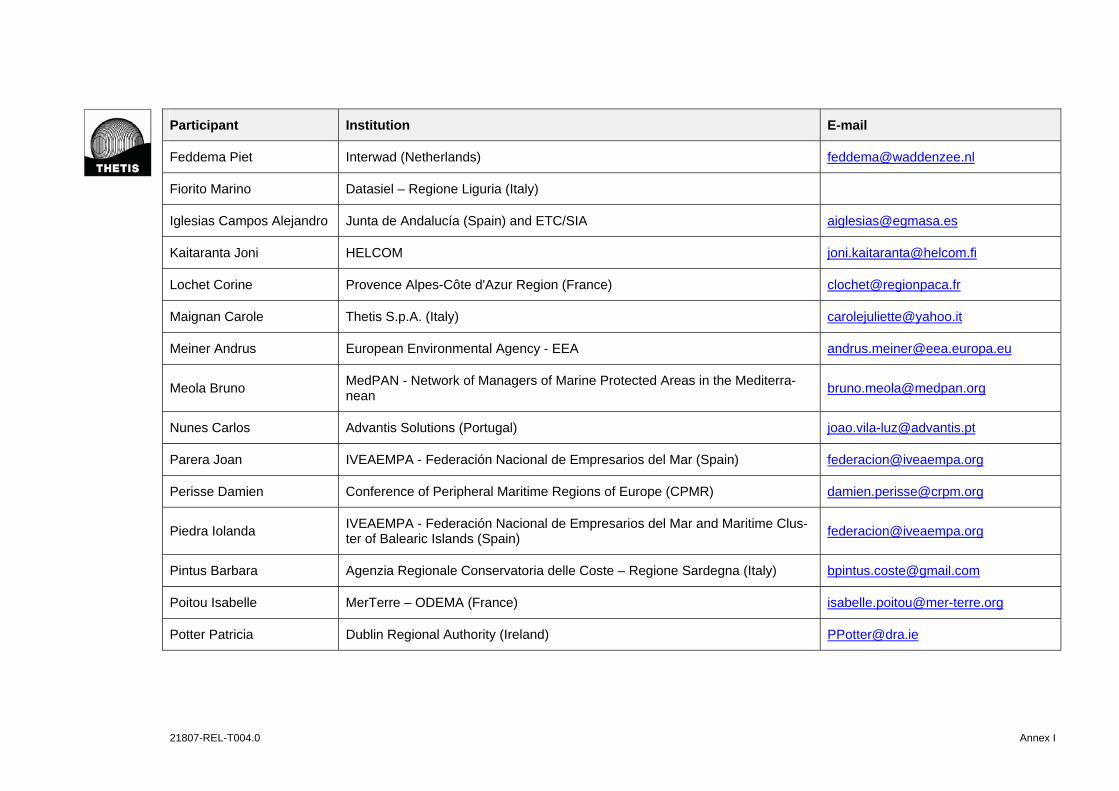
21807-REL-T004.0 Annex I
Participant Institution E-mail
Feddema Piet Interwad (Netherlands) [email protected]
Fiorito Marino Datasiel – Regione Liguria (Italy)
Iglesias Campos Alejandro Junta de Andalucía (Spain) and ETC/SIA [email protected]
Kaitaranta Joni HELCOM [email protected]
Lochet Corine Provence Alpes-Côte d'Azur Region (France) [email protected]
Maignan Carole Thetis S.p.A. (Italy) [email protected]
Meiner Andrus European Environmental Agency - EEA [email protected]
Meola Bruno MedPAN - Network of Managers of Marine Protected Areas in the Mediterra-nean
Nunes Carlos Advantis Solutions (Portugal) [email protected]
Parera Joan IVEAEMPA - Federación Nacional de Empresarios del Mar (Spain) [email protected]
Perisse Damien Conference of Peripheral Maritime Regions of Europe (CPMR) [email protected]
Piedra Iolanda IVEAEMPA - Federación Nacional de Empresarios del Mar and Maritime Clus-ter of Balearic Islands (Spain)
Pintus Barbara Agenzia Regionale Conservatoria delle Coste – Regione Sardegna (Italy) [email protected]
Poitou Isabelle MerTerre – ODEMA (France) [email protected]
Potter Patricia Dublin Regional Authority (Ireland) [email protected]

21807-REL-T004.0 Annex I
Participant Institution E-mail
Prem Marko UNEP-MAP PAP/RAC [email protected]
Queffelec Betty Maritime Institute, Ghent University (Belgium) [email protected]
Santoro Francesca IDEAS – Ca’ Foscari University of Venice (Italy) [email protected]
Serra i Raventós Jordi EUCC-Med Center and Facultat de Geologia, Universitat de Barcelona (Spain) [email protected]
Snoeren Birgit European Commission – DG Environment [email protected]
Suárez de Vivero Juan Department Human Geography, University of Seville (Spain) [email protected]
Tonino Marco IDEAS – Ca’ Foscari University of Venice (Italy) [email protected]
Vasselin Benoit Provence Alpes-Côte d'Azur Region - Marine Office (France) [email protected]
Zanetto Marco Thetis S.p.A. (Italy) [email protected]
21807-REL-T004.0 Annex II
Annex II: Workshop Agenda
Integrated Coastal Zone Management Workshop
Marseille, 6 May 2011
SALLE DE COMMISSION PERMANENTE
HOTEL DE LA REGION Provence -Alpes Côte d'Azur - 27 Place JULES GUESDE 13481
MARSEILLE
WORKSHOP AGENDA
Morning sessions
8.00 – 9.00 Workshop registration
Session 1 – Role of Coastal Information Systems in supporting ICZM implementation
9.00 – 9.15 Welcome to the Workshop
Mireille PEIRANO, Vice President Provence-Alpes-Côte d'Azur Re-gion, Responsible for Sea, Fisher-ies and Coastal Affairs
9.15 – 9.30 State of ICZM policy at the EU level Birgit Snoeren, European Com-mission, DG Environment
9.30 – 10.00 Options for coastal information system, prelim-inary results – key questions for the workshop
Marco Zanetto, Carole Maignan, Thetis s.p.a.
10.00 – 10.20 "Keynote"- Role of CIS in supporting ICZM: progress and challenges
Ned Dwyer, Coastal & Marine Re-sources Centre, University College Cork and International Coastal At-las Network
Session 2 – Illustrative cases of Coastal Information System: Regional Sea, National and Re-gional/local cases (Moderator: Andrus Meiner, European Environmental Agency)
10.20 – 10.40 Role of CIS for ICZM implementation in Medi-terranean Regional sea context
Marko Prem, UNEP-MAP PAP/RAC
10.40 – 11.00 Role of CIS for ICZM implementation in Baltic Regional sea context
Joni Kaitaranta, HELCOM

21807-REL-T004.0 Annex II
11.00 – 11.30 Coffee Break
11.30 - 11.50 WATLAS (Wadden Sea Atlas) and North Sea Atlas
Piet Feddema, Interwad; Wim Blanken, Geon bv
11.50 – 12.10 CRIGE-PACA Spatial Data Infrastructure Corine Lochet, Christine Archi-as, Provence Alpes-Côte d'Azur Region
12.10 – 12.30 KustAtlas of Belgium and Coastal wiki Simon Claus, Flanders marine institute (VLIZ)
12.30 – 12.50 Red de Información Ambiental de Andalucía - REDIAM
Alejandro Iglesias-Campos Jun-ta de Andalucía and ETC/SIA
12.50 - 13.00 Interim conclusions Andrus Meiner, European Envi-ronmental Agency
13.00 – 13.20 Questionnaire compilation1
13.20 – 14.20 Lunch Buffet lunch offered by the Pro-vence-Alpes-Côte d'Azur Region
Afternoon session
Open discussion
14.20 – 14.50 Objective of the afternoon sections and organ-isation
Francesca Santoro, IDEAS Ca’ Foscari University
14.50 – 17.20
Open discussion on:
- Policy requirements
- Policy options
- Expected impacts
Francesca Santoro, Marco Tonino, IDEAS Ca’ Foscari Uni-versity (moderators)
17.20 - 17.30 Workshop Conclusions Birgit Snoeren, European Com-mission, DG Environment
1 A short questionnaire was delivered to all participants, including a description of related ob-jectives and filling modalities. Twenty minutes before lunch break were dedicated to the ques-tionnaire completion. Results were analysed and used to guide the afternoon discussion.
21807-REL-T004.0 Annex III
Annex III – Questionnaire distributed to the workshop participants
EVALUATION OF DIRECT IMPACTS OF POLICY REQUIREMENTS
Dear participant, in order to concretely contribute to the results of the CIS project, you are
kindly asked to fill the following matrix: the results of your contribution will be used to structure
the afternoon discussion session of the workshop.
The following matrix includes 17 policy requirements (on rows) and 11 direct impacts (on col-
umns).
A policy requirement is intended as a requisite that can be concretely implemented in a
coastal information system in order to improve the use of the same CIS in supporting the diffu-
sion and implementation of the ICZM process at various scales (international, national, sub-
national – regional and local).
Impact assessment is a process that prepares evidence for political decision-makers on the
advantages and disadvantages of possible policy requirements by assessing their potential
impact. Direct Impacts are the initial, immediate consequences generated by a policy require-
ment on ICZM implementation.
Information included in the circulated Discussion Paper can support you in filling the following
matrix. In particular Chapter 4 describes the indentified policy requirements, while chapter 5
the impact assessment procedures also including an examples of a filled matrix.
Please proceed as follow:
1. Referring to the first column evaluate the relative importance of each policy require-
ment with a rate from 1 to 10 (where 1 stands for “not relevant at all”, and 10 stands
for “extremely important”).
2. Select the 10 most important policy requirements according to the higher rates you
addressed.
3. Evaluate the direct impacts of the 10 identified policy requirements through the defini-
tion of qualitative scores expressed by the following possibilities: ---; --; -; 0; +; ++; +++
(refer to Chapter 5 of the Discussion Paper for information and example).
Note: negative values express a negative interpretation of the expected effect (for example
decrease in civil society participation in ICZM or increase in costs), whereas positive values
express an expected positive impact (e.g. increase in civil society participation in ICZM or de-
crease in costs).
THANK YOU FOR YOUR PRECIOUS CONTRIBUTION!

21807-REL-T004.0 Annex III