ESSnet-Culture final technical report - European Commission
556
Project profiting from the financial support of the European commission EUROSTAT GRANT AGREEMENT n°10401.2008.002‐2009.352 ESSnet‐CULTURE European Statistical System Network on Culture FINAL REPORT ESSnet ESSnet Culture Culture LE GOUVERNEMENT DU GRAND‐DUCHÉ DE LUXEMBOURG Ministère de la Culture 2012
-
Upload
khangminh22 -
Category
Documents
-
view
1 -
download
0
Transcript of ESSnet-Culture final technical report - European Commission

ESSnet‐CultureFinalReport
- 1-
Project profiting from the financial support of the European commission
EUROSTAT GRANT AGREEMENT n°10401.2008.002‐2009.352
ESSnet‐CULTURE European Statistical System Network on Culture
FINAL REPORT ESSnetESSnet CultureCulture
LE GOUVERNEMENT DU GRAND‐DUCHÉ DE LUXEMBOURG Ministère de la Culture
2012

ESSnet‐CultureFinalReport
- 2-
For more information:
DISCLAIMER
This document is a result of the ESSnet-Culture project co-financed by the European Commission (EUROSTAT Grant Agreement n°10401.2008.002-2009.35). Information in this document represents opinions of the contributors participating in the project. Its content does not necessarily reflect the position of the Member States, nor those of the European Commission.
© September 2012, Luxembourg (LU)
ESSnetESSnet CultureCulture
ESSnet-Culture Project coordinator Ministry of Culture Finances and cultural statistics department (CoStaC) 4 boulevard F.D. Roosevelt L-2912 Luxembourg Guy FRANK Tel: (+352) 247 86623 E-mail: [email protected]
European Commission, Eurostat (ESTAT) Directorate F – Social statistics and Information Society Unit F4: Education, science and culture statistics
Marta BECK-DOMZALSKA Tel : (+352) 4301 33123 E-mail: [email protected]

ESSnet‐CultureFinalReport
- 3-
Acknowledgements
This report has been prepared by
Vladimír BÍNA, Philippe CHANTEPIE, Valérie DEROIN, Guy FRANK, Kutt KOMMEL, Josef KOTÝNEK,
and Philippe ROBIN
The ESSnet-Culture final report is the result of the works of the Task Forces and the consultation process of statisticians and european experts in the field of cultural statistics and
policy, in particular representatives from Ministries of Culture, from National Statistical Offices and the European Commission.
The authors wish to express their thanks to all the experts who have contributed to this project
and drafted this report, especially:
Lars Bager-Sjögren Marta Beck-Domzalska
Philippe Bouquillion Andries van den Broek Rosario Garcia-Ajofrin
Jos de Haan Bart Huynen
Sari Karttunen Rubbina Karruna Anne Kolmodin
Rianne Kloosterman Brigita Lipovšek
Jamilja Van Der Meulen Adolfo Morrone Sylvain Pasqua
Jorma Sarv Katri Soinne
Michael Söndermann Hans Schmeets
Noemí Villazán-Pellejero
The authors would like to thank the participants and the members for the Task Forces who offered imput and expert advice, without forgetting Eurostat, especially the Unit F4 ‘Social statistics and Information Society’ and the Directorate-General Education and Culture of the
European Commission, especially the Unit ‘Culture Policy, Cultural Diversity and Intercultural Dialogue’.


ESSnet‐CultureFinalReport
- 5-
PREFACE
On several occasions, the European Council has underlined the need to develop cultural statistics(1) and the European Parliament has regretted the absence of data in this field(2). Meanwhile, the European Commission, and Eurostat in particular, carried out a significant work back in 1997 on structuring the data and the methodology for cultural statistics, which led to the establishment of the Leadership Group Culture (LEG-Culture), then the publication of the first Cultural statistics in Europe Pocketbook in 2007. The establishment of the Woking Group European Statistical System Network on Culture (ESSnet-Culture), coordinated by the Luxembourgish Ministry of Culture, is a new step for the European cultural statistical cooperation, which will take the development of knowledge on cultural statistics to another level. The report ESSnet-Culture is the main result of two years of works of this European workgroup on cultural statistics. The result of the ambition of the States and the intensive work of national experts, is based on particularly solid and ground-breaking information using classifications and data sources that have been tested by the national statistical institutes, thus allowing States that do not have dedicated analysis services to produce cultural statistics. It is based on the practical approach that prevailed over the LEG-Culture, and many of its results are held up as an international model for harmonised international statistics on culture. This practical and consensual approach is open to an optional logic, and made it possible to obtain results that would have otherwise been difficult to obtain, given the ambitiousness of the goals; these goals were to update the definition of the cultural field, to create a new framework for this field that would be compatible with the framework that UNESCO adopted in 2009, while reflecting on recent phenomena on creativity and the development of creative industries, on the measurement of new cultural habits and practices, and on the transformations in the cultural economy due to digitisation. That is to say that this group effort, focused on the updating of the LEG-Culture and on the creation of a sustainable work environment, took place at a time of significant changes and challenges. Through its conclusions and its pragmatic recommendations, ESSnet-Culture prepared the ground for a production of European statistics on the culture. It is today important to continue without delay for the work committed by ESSnet-Culture to produce regular European data on the culture because expectations were born and a real will to cooperate and to produce data at the level of the Member States have clearly been shown.
(1) See the conclusions of the Council and the representatives of the governments of Member States of the Council: Priority 3 of the Work Plan for Culture 2008-2010 (2008/C 143/06) and Priority area F-culture statistics of the Work Plan for Culture 2011-2014 (2010/C 325/01) (2) See Decision no. 1578/2007/EC of the European Parliament and the Council dated 11 December 2007, Title XII.


ESSnet‐CultureFinalReport
- 7-
ABBREVIATIONS AND SYMBOLS
Statistical symbols
: Data not available - Not applicable, less than half of the unit used or no data b Break in series c Confidential e Estimate f Forecast p Provisional u Unreliable or uncertain % Per cent
Acronyms & abbreviations
AES Adult Education Survey
CAPI Computer Assited Personal Interview
CATI Computer Assisted Telephone Interview
CAWI Computer Assisted Web Interview
CCIs Cultural and Creative Industries
COFOG Classification of the Functions of Government
COICOP Classification of Individual Consumption by Purpose
COICOP/HICP Classification of Individual Consumption by Purpose/Harmonised Index of Consumer Prices
COICOP/HBS Classification of Individual Consumption by Purpose used for Household Budget Surveys
COMEXT Eurostat reference database containing external trade statistics
CN Combined Nomenclature
CPA Statistical Classification of Products by Activity
CPC Central Product Classification
EGMUS European Group on Museum Statistics
EEA European Economic Area
EFTA European Free Trade Association
ESS European Social Survey
Eurostat Statistical Office of the European Union
EU European Union
EU-15 European Union (15 Member States)

ESSnet‐CultureFinalReport
- 8-
EU-27 European Union (27 Member States)
EUR Euros
ESA95 European System of Accounts
ESSnet-Culture European Statistical System Network on Culture
FCS Framework for Cultural Statistics
GDP Gross Domesctic Product
HETUS Harmoside European Time Use Survey
HBD Household Budget Survey
ISO International Organization for Standardization
ISCED International Standard Classification of Education
ISCO International Standard Classification of Occupations
ISIC International Standart Industrial Classification
LEG-Culture Leadership Group on Culture
LFS Labour Force Survey
ICH Intangible Cultural Heritage
ICT Information and Communication Technologie
NACE Statistical Classification of Economic Activities in the European Community
OECD Organisation Econonic Co-operation and Development
SBS Structural Business Statistics
SILC Statistics on Income and Living Conditions
SME Small and Medium Enterprises
STS Short Term Business Statistics
TUS Time Use Survey
UNESCO United Nations Educational, Scientific and Cultural Organisation
UNCTAD United Nations Conference on Trade and Development
UIS UNESCO Institute for Statistics
WG Working Group (Eurostat)
WIPO World Intellectual Property Organization
Country abbreviations The EU of 27 Member States as from 01.01.2007 (EU-27)
AT Austria BE Belgium BG Bulgaria CZ Czech Republic DK Denmark DE Germany

ESSnet‐CultureFinalReport
- 9-
EE Estonia IE Irland EL Greece ES Spain FI Finland FR France IT Italy CY Cyprus LV Latvia LT Lithuania LU Luxembourg HU Hungary MT Malta NL Netherlands PL Poland PT Portugal RO Romania SI Slovenia SK Slovakia SE Sweden UK United Kingdom
European Free Trade Association countries (EFTA)
IS Iceland LI Liechtenstein NO Norway CH Switzerland
Others countries
HR Croatia (Candidate country UE) MK Macedonia (Candidate country UE)
TR Turkey (Candidate country UE)


ESSnet‐CultureFinalReport
- 11-
TABLE OF CONTENTS
PREFACE……………………...……………………………………………………. 5
ABBREVIATIONS AND SYMBOLS ........................................................................ 7
INTRODUCTION ...................................................................................................... 17
PART I. WORK OF THE TASK FORCES OF THE ESSNET-CULTURE PROJECT…. ............................................................................................... 23
EXCUTIVE SUMMARY .......................................................................................................25
FRAMEWORK FOR CULTURAL STATISTICS AND DEFINITIONS ........................37
1. THE CHALLENGES OF UPDATING THE EUROPEAN STATISTICAL FRAMEWORK .............37
2. THE SITUATION IN THE EARLY WORK ..........................................................................38
3. METHODOLOGICAL ISSUES ...........................................................................................41
3.1. Work plan: one process for measuring culture ..................................................41 3.2. To define the theoretical cultural activities by crossing domains and functions
...........................................................................................................................43 3.3. Delimitation of the framework for cultural statistical .......................................49 3.4. Definitions of key concepts of the ESSnet-Culture framework.........................55
4. THE MEASURING OF CULTURAL ACTIVITIES WITHIN ACTIVITIES INCLUDED IN
STATISTICAL CLASSIFICATIONS ...................................................................................59
5. RECOMMENDATIONS FOR FUTURE EUROPEAN WORKS ................................................68
6. ANNEXES TF1 ..............................................................................................................71
Annex 1 - NACE Rev.2 economic activities and their cultural rank ...........................71 Annex 2 - Correspondance table of cultural activities with NACE Rev.2 classes, by
function ...........................................................................................................73 Annex 3 - Cultural domains by products classification (CPA) ...................................75

ESSnet‐CultureFinalReport
- 12-
FINANCING AND EXPENDITURE ON CULTURE ........................................................79
1. BACKGROUND ............................................................................................................................ 80
1.1. Public expenditure on culture ............................................................................80 1.2. Households expenditure on culture ...................................................................86
2. METHODOLOGY OF IMPROVING THE STATISTICS ON PUBLIC AND HOUSEHOLDS
EXPENDITURE ON CULTURE ................................................................................................... 89
2.1. A centralized methodologic model ....................................................................90 2.2. Methodology of applicable sorting aspects, variables and indicators ................93 2.3. Indicators of public and households expenditure on culture ...........................101
3. RECOMMANDATIONS FOR FUTURE EUROPEAN WORKS .................................................... 103
3.1. Public expenditures on culture ........................................................................109 3.2. Household expenditure on culture ...................................................................112
4. ANNEXES TF2 .......................................................................................................................... 107
Annex 1 - Overall overview of the questionnaires: publics expenditure and direct receipts .........................................................................................................107
Annex 2 - Table of availability of data: public expenditures on culture ..................109 Annex 3 - Table of availability of data: financial sources of culture - receipts .........110 Annex 4 - Overall overview of the questionnaire: HBS expenditure ........................111 Annex 5 - Gross consolited public expenditure on culture, initial version ...............112 Annex 6 - Gross consolited public expenditure and direct receipts on culture, target
version .........................................................................................................113 Annex 7 - Households exependiture on culture, narrower version ...........................114 Annex 8 - Households expenditure on culture, broader version ...............................115 Annex 9 - Results of the pilot survey, gross consolidated public expenditure on
culture ...........................................................................................................116
CULTURAL INDUSTRIES ................................................................................................129
1. POLICY NEEDS ........................................................................................................................ 129
2. CULTURAL AND CREATIVE INDUSTRIES FROM A STATISTICAL POINT OF VIEW .......... 132
2.1. The role of cultural and creative industries in current debates ........................132 2.2. Definition of cultural/cultural industries as part of TF3 ..................................133
3. CULTURAL EMPLOYMENT..................................................................................................... 139
3.1. Defining the scope of cultural employment .....................................................140 3.2. Defining cultural occupation: a complex task .................................................146 3.3. Instructions of cultural employment estimate ..................................................147
4. KEYS INDICATORS .................................................................................................................. 151
5. RECOMMANDATIONS ............................................................................................................. 153
6. ANNEXES TF3 ......................................................................................................................... 129
Annex 1 - Classifications levels used by countries in national LFS………………..155

ESSnet‐CultureFinalReport
- 13-
Annex 2 - List of cultural occupations (ISCO-08) ....................................................156 Annex 3 - Inclusion of cultural activities in NACE Rev.2 ........................................160 Annex 4 - Inclusion of cultural occupations in ISCO-08 ..........................................162 Annex 5 - Employment vocabulary, concepts and definitions ..................................166 Annex 6 - Cultural industries indicators manual .......................................................169 Annex 7 - Data availability of the economic and employment characteristics of the
cultural sector ...............................................................................................204
CULTURAL PRACTICES AND SOCIAL ASPECTS OF CULTURE ..........................227
1. INTRODUCTION ....................................................................................................................... 227
2. CULTURAL PARTICIPATION AND CULTURAL POLICY ....................................................... 228
3. SITUATION AT THE START OF TASK FORCE 4 .................................................................... 230
3.1. Leadership Group on Culture Statistics (LEG-Culture) ...............................230 3.2. Eurostat Working Group on culture statistics ..............................................231 3.3. Existing European surveys ...........................................................................232 3.4. UNESCO ......................................................................................................233
4. CHANGING CULTURAL LANDSCAPE .................................................................................... 233
4.1. Societal changes ...........................................................................................234 4.2. Informatisation: The rise and increase of Internet use .................................236 4.3. Mapping the challenge .................................................................................236 4.4. The ICET-Model ..........................................................................................237 4.5. Cultural practices, Internet and ICT .............................................................237 4.6. Conclusion ....................................................................................................239
5. A FRAMEWORK FOR CULTURAL PRACTICES ...................................................................... 240
6. THE EUROPEAN SURVEYS ON CULTURAL PARTICIPATION: A METHODOLOGICAL
OVERVIEW ............................................................................................................................... 242
6.1. Introduction: Eurobarometer versus national surveys ..................................242 6.2. The problem of output harmonisation ..........................................................244 6.3. The EU-Statistics on Income and Living Conditions (EU-SILC) ................244 6.4. Adult Education Survey (AES) ....................................................................245 6.5. Comparison EU-SILC and AES ...................................................................245 6.6. European Social Survey (ESS) .....................................................................246 6.7. The ICT-survey (ICT) and Time Use Survey (TUS) ...................................247 6.8. Conclusion and discussion ...........................................................................247
7. ANALYSIS OF NATIONAL SURVEYS ON CULTURAL PARTICIPATION (FF) ...................... 248
7.1. Methodological analysis ...............................................................................248 7.2. Comparison of national questionnaires ........................................................255
8. MODULE ON CULTURAL PRACTICES ................................................................................... 256
8.1. Introduction ..................................................................................................256 8.2. Methodological guidelines ...........................................................................257 8.3. List of indicators on cultural participation and level of priority ...................260

ESSnet‐CultureFinalReport
- 14-
8.4. Comprehensive questionnaire of cultural practices ......................................263
9. CULTURE AND CIVIL SOCIETY ............................................................................................. 271
10. CONCLUSIONS AND RECOMMENDATIONS ......................................................................... 273
PART II. SPECIFIC DEVELOPMENTS ............................................................. 277
REVIEW OF THE CULTURAL DOMAINS ....................................................................279
1. CULTURAL HERITAGE ................................................................................................285
2. ARCHIVES ...................................................................................................................291
3. LIBRARIES ..................................................................................................................294
4. BOOKS AND PRESS ......................................................................................................297
5. VISUAL ARTS ..............................................................................................................306
6. PERFORMING ARTS .....................................................................................................314
7. AUDIOVISUAL & MULTIMEDIA ...................................................................................319
8. ARCHITECTURE ..........................................................................................................328
9. ADVERTISITING ..........................................................................................................332
10. ART CRAFT .................................................................................................................335
IS IT POSSIBLE TO MEASURE INTANGIBLE CULTURAL HERITAGE AN UPDATE OF WHAT AND WHERE TO LOOK FOR IT ...............................339
1. DEFINING THE FIELD OF STUDY ..................................................................................339
2. IDENTIFICATION AND MEASUREMENT OF ICH EXPRESSIONS ......................................341
3. CULTURAL SPACES .....................................................................................................343
4. ORAL TRADIOTION AND EXPRESSIONS .......................................................................344
5. PERFORMANCES .........................................................................................................344
6. PROCESS .....................................................................................................................345
7. CONCLUSIONS AND PROPOSALS .................................................................................346
ISSUE OF CULTURAL DIVERSITY ...............................................................................349

ESSnet‐CultureFinalReport
- 15-
EXPERIENCE FEEDBACK OF THE SATELLITE ACCOUNTS ON CULTURE ......... ................................................................................................................................351
CLASSIFICATION OF THE FUNCTIONS OF GOVERNMENT (COFOG) AND ANALYSIS OF THE PUBLIC EXPENDITURE OF THE CULTURE…..... 355
CONCEPTS OF CREATIVE INDUSTRIES AND CREATIVE ECONOMIES: WHAT ARE THE ISSUES? .............................................................................................357
CREATIVE INDUSTRIES SPILLOVERS .......................................................................365
1. THE NEED FOR ANALYSING THE CREATIVE INDUSTRIES SPILLOVER - FRAMING OF THE
TOPIC .........................................................................................................................366
2. THE CONCEPT OF SPILLOVER AND ITS MEASUREMENT ..............................................368
3. CREATIVE INDUSTRIES AND SPILLOVERS EFFECT ......................................................371
4. MEASUREMENT OF CI SPILLOVERS .............................................................................376
NOWADAYS CULTURAL PARTICIPATION ................................................................397
1. THE CHALLENGE ........................................................................................................397
2. SOCIETAL CHANGES ...................................................................................................398
3. INFORMATISATION: THE RISE AND INCREASE OF INTERNET USE ...............................400
4. MAPPING THE CHALLENGE .........................................................................................401
5. THE ICET MODEL ........................................................................................................402
6. PARTICIPATION IN THE HIGH ARTS .............................................................................404
7. PARTICIPATION IN THE POPULAR ARTS ......................................................................406
8. PRACTICING THE ARTS FOR LEISURE ..........................................................................408
9. CONCLUSION ..............................................................................................................410
10. ANNEXES: EXAMPLES OF QUESTIONS TO BE ASKED ...................................................411

ESSnet‐CultureFinalReport
- 16-
MEASURING SOCIAL AND CULTURAL PARTICIPATION IN EUROPEAN SURVEYS .............................................................................................................419
1. EU-SILC, ESS AND AES: DESIGN .............................................................................421
2. RESULTS .....................................................................................................................424
3. EXPLANATIONS ..........................................................................................................425
4. INPUT HARMONIZATION AND BEYOND ......................................................................428
5. CONCLUSION ..............................................................................................................430
ANNEXES ................................................................................................................ 433
ANNEX 1: CLASSIFICATIONS ..........................................................................................433
ANNEX 2: EUROPEAN DATA SOURCES .........................................................................457
ANNEX 3: BIBLIOGRAPHY ...............................................................................................461
ANNEX 4: ORGANISATION OF THE PUBLIC ADMINISTRATION RESPONSIBLE FOR CULTURE AND OF THE DEVELOPMENT OF THE CULTURAL STATISTICS .........................................................................................................477
ANNEX 5: NATIONAL WEBSITE’S REFERENCES FOR CULTURE STATISTICS .....481
ANNEX 6: OVERVIEW OF NATIONAL SURVEYS .........................................................483
ANNEX 7: PARTNERS OF ESSnet-Culture PROJECT .......................................................539
ANNEX 8: LIST OF TABLES ..............................................................................................553
ANNEX 9: LIST OF FIGURES .............................................................................................555

ESSnet‐CultureFinalReport
- 17-
1BINTRODUCTION
Emerged in the 70s(3), the statistical comparability among states in the cultural domain is an old concern. Hovewer, the culture is still very late in developing EU statistics in comparison with the economic, social, and environmental domains because, until recent period, the European officials policy considered that it was not the vocation of the European Union to concern itself with culture. Today, States Member are the main actors of the development of the cultural statistics in Europe which has for consequence that organization, methods and contents are very different from one country to another because the statistical developpement at the national level answers mainly concerns of national cultural policies and evaluations of these. The international dimension of the development of cultural statistics has become far more pronounced over the course of the last decade. Given that the development of cultural statistical data has been a major concern of several international authorities (Council of Europe, UNESCO, UNCTAD, OECD, WIPO), several EU member countries have thus demonstrated their interest in resuming work in developing cultural statistics at the European level. Taking advantage of a favourable environment, the EU authorities have proposed restarting the developpement of cultural statistics at the European level by the creation of a ‘new operational workgroup’ on cultural statistics to develop a production of statistical data harmonized on culture considered as a priority. The European statistical development of the culture is a long process that began in November 1995 when the EU Council of Culture Ministers adopted the first resolution on the promotion of statistics concerning culture and economic growth(4). This resolution invites the European Commission ‘to ensure that better use is made of existing statistical resources and that work on compiling comparable cultural statistics within the European Union proceeds smoothly’. In response to this request, the European commission has encouraged the creation of the first European working group on cultural statistics via the European pilot group on cultural statistics, known under the acronym ‘LEG-Culture’ (Leadership Group Culture). The work of LEG-Culture has brought together 14 of the EU-15 members from 1997 to 2000 in a programme aiming to study and describe the conditions for implementing a system of comparable cultural statistics. After evaluating what already exists, LEG-Culture has developped definitions and has highlighted a set of shared concepts alongside its reflections on creating key indicators, with the view to describing European cultural diversity. To facilitate implementation of objectives, the LEG-Culture members have divided themselves into four thematic working groups on the methodology, the cultural employment, the financing on culture and the cultural practices. While LEG-Culture has not managed to produce a set of reliable and comparable cultural statistical data, because of the heterogeneity of the initial existing sources and the limited project duration, it has nevertheless played an essential role in the acquisition of a common statistical language. In fact, LEG-Culture has been able to mark out the European cultural field, a prerequisite to any future data collection and production at the European level. In so
(3) Hyères (FR, 1970) and Stockholm (SE, 1972) (4) Official Journal of the European Communities, 95/C 327/01

ESSnet‐CultureFinalReport
- 18-
doing, it aimed to take a practical and operational approach, and quickly abandoned utopia to arrive at a European definition of culture. Based on the 1986 UNESCO Framework for cultural statistics, LEG-Culture has identified a consensus on the definition of a cultural field organized through eight cultural domains (Cultural heritage; Archives, Libraries; Books and press; Visual arts; Architecture; Performing arts; Audiovisual and multimedia) and six functions (Preservation, Creation, Production, Dissemination, Trade/sales and Education). LEG-Culture has also arrived at a consensus concerning the cultural economic activities and cultural occupations, and has created the first regional survey template on cultural participation. The conclusions of LEG’s are recognized as a reference which create the first ‘European framework on cultural statistics’. The development of a European production of statistics on the culture was going to continue from 2001 till 2004 with the ‘Eurostat Working Group on cultural statistics’. Faced with the two-fold challenge of pursuing the harmonisation of methods and concepts begun by LEG Culture and, more importantly, the producing of statistics, the ‘Eurostat Working Group’ was going to focalize its works on three topics which were particularly important for national and European policies: cultural employment, public and private expenditure on culture and cultural practices. Based on the definition of the cultural field and the works conducted by LEG-Culture, the Eurostat Working Group has developed common methodologies in order to regularly produce statistical data on each of three topics, in particular by using the existing European surveys (cultural employment and the household expenditures). The Eurostat Working Group has also developped the methodology for Eurobarometer surveys carried out in 2001 and 2003, and has identified the main difficulties regarding data collection on public financing (transfer between government levels, breakdown by cultural domains etc.). At the conclusion of the activity of the working group in 2004, only the cultural employment was really the object of a production of data, through the development of a method for evaluating cultural employment by the crossing of the cultural occupations (ISCO) and the cultural economic activities (NACE). From 2005, the EU Council of Culture Ministers and the European Commission have multiplied their initiatives in the domain of cultural policy, and have also demonstrated their will to have reliable and quality cultural statistics, so as to measure the economic impact of the cultural sector as well as its potential impact in the framework of the Lisbon Strategy. If considerable progress was realized by the Member States of the EU on a methodological plan, and more generally on obtaining and learning a common statistical language, it should still be acknowledged that the absence of harmonised data and analyses on cultural phenomena is one of the main weaknesses of the cultural sector. The question of harmonising data collection methods is all the more urgent given that European collection framework is not able to fully measure the economic impact of the creative and cultural sector, nor able to take into consideration its contribution to the development of a knowledge society in terms of innovation and development of human capital. The fact that a real European system for cultural statistics, or the production of harmonised statistical data has not been implemented, means that the only data that can be used are those produced by Member States, even though these data are extremely difficult to compare with one another. The first difficulty is the one of the definition of the cultural field and its limits. The cultural field is hard to define because of its constant evolution which puts in danger any consensus between the European countries on its limits. The cultural field does not have the coherence of an economical sector, not in its structures, in its activities nor in its products because it

ESSnet‐CultureFinalReport
- 19-
includes very heterogeneous activities from the major sectors of the economy: services, industry etc. Another identified difficulty is the heterogeneousness of the statistical organizations of the culture in Europe(5). If on one hand the level of development of the cultural statistics is very different from one country to another in terms of contents as well as of methods and on the other hand, the responsibility of cultural statsitics varies from one country to another, it falls either to the administrations in charge of cultural affairs (Ministry of Culture etc.), or in the National Statistical Institute, or it is a clloaboration of these institutions. Finally, a last obstacle concerns the data collected at the national level(6). The production of data from different countries is heterogeneous in terms of collection method, periodicity, the limits of the field covered and the sources. At the end of 2007, the European Union Council of Culture Ministers identified the improvement and the comparability of cultural statistics as one of the five priority areas of its 2008-2010 Work Plan for Culture. Since then, developing harmonised statistical methods in the cultural arena has emerged as a crucial area that should be dealt with by a group of European experts under the ‘Open Method of Coordination’ (OMC). The OMC is a flexible coordination mechanism between Member States which tries to make national policies converge on areas of mutual interest. It is applied to domains that fall mainly under the sphere of the Member States, as it offers a non-binding framework for concerted action and exchange. Given the specificities of the cultural sector, the OMC is perceived as a way to advance statistical harmonisation on a more voluntary and flexible basis, by encouraging networking and the exchange of best practice. On a statistical level, this new cooperation mechanism leads to the creation of a new European working group on cultural statistics: ‘European Statistical System network on Culture’ (ESSnet-Culture) Further to a call for proposals launched by Eurostat, ESSnet-Culture was created in September 2009 for a duration of two years. Result of a relaunching of the cooperation and the European cultural statistical production, ESSnet-Culture has been using a working method developed by Eurostat for methodological activities. It consisted of a network composed of several organisations that form part of the European Statistical System - the ESS. It aimed to produce results that can be useful by all members of the statistical system. Financed on the basis of a grant agreement between the European Commission and a group of five partners co-responsible for the project (Luxemburgish Ministry of Culture, French Ministry of Culture and Communication, Statistical Office of the Czech Republic, Statistics Estonia and Dutch Ministry of Education, Culture and Science), the mandate of the ESSnet-Culture project group was to ‘develop data generation on the basis of a coordinated statistical system and to examine the possibility of adapting or developing existing methods in order to respond to new needs and to cover new domains if relevant’. The mandate of the ESSnet-Culture was of a methodological nature. While the work kept an eye on the objective of all statistical development - i.e. to generate harmonised statistical data within a reasonable time frame - ESSnet-Culture primarily aimed to develop the prerequisite EU methodological base for future data generation. The main objectives of the ESSnet-Culture were to: (1) Relaunch the statistical cooperation between the European States, revise the European framework for cultural statistics (created by LEG-Culture), (2) improve the existing methodological base to develop new EU cultural statistics, (3) define indicators and variables that make it possible to describe and study the
(5) See Annex 4: Organisation of the public administration responsible for culture and of the development of the cultural statistics (6) See Annex 6: Overview of national surveys

ESSnet‐CultureFinalReport
- 20-
cultural sector in all its complexity and (4) provide a national experience to allow a wider and more advanced analysis of the data. The specific objective of ESSnet-Culture was thus to update and develop the methodology of the existing European framework for cultural statistics (LEG-Culture final report) in order to favour the development of comparable cultural statistics as well as the analysis of cultural phenomena in Europe. To meet the targets within a limited period of time, the ESSnet-Culture focused on specific targets in the areas of culture funding, development of economic indicators and participation in cultural activities. The cultural field and its visual matrix of cultural activities (‘the cultural mandala’) do not yield to ideological representations that have to be excluded from statistical analysis, which would show cultural sectors to be more creative than other sectors. This type of hierarchy is in fact difficult to justify; the criteria are extremely subjective and do not lend themselves to consensus, as there are so many possible approaches. In the spirit of the LEG-Culture, the cultural domain is characterised by an operational process that is entirely concerned with artistic and cultural creation. This creation includes all sectors, including newly integrated sectors (advertising, crafts), to which production, dissemination, advertising, and preservation are then added. The education function has been added to the function of cultural management and administration. The European Union has thus conceived a structure for a unique and original way of viewing culture. The representation that has emerged is one that is open, uniform, specific to cultural and artistic activities, and does not encroach on other sectors such as the ICT sector. While the representation is based on a general classification of activities that was originally designed from an economic point of view, it has finally been employed here with the sole purpose of making an exhaustive and shareable approach available. The range of cultural activities is of course a model for the cultural economy, but also serves as a model for cultural employment, cultural practices, cultural financing, and so on - all of which are layers for which information may be collected, depending on the sources available, and which can allow for precise results in each cultural domain. The ESSnet-Culture has been asked to suggest common definitions, and in particular a definition of cultural activities, which are often also called creative and artistic activities. For more than a decade there has been a profusion of conceptual approaches of varying nature and effectiveness, in academic research into political science, in economic and management sciences, as well as in the diversity of European and national public policies on these activities. It was therefore required of the ESSnet-Culture to articulate or to render compatible often strongly contradictory cultural approaches that formed national ‘traditions’, or almost a ‘world-view’. The report modestly suggests retaining the following definition that has been consensually agreed upon, without overstepping the competency of statistical expertise: ‘Cultural activities are understood as any activity based on cultural values and/or artistic expressions. Cultural activities include market or non-market oriented activities, with or without a commercial meaning and carried out by any kind of organisation (individuals, businesses, groups, institutions, amateurs or professionals)’. More precisely, the creative, artistic and cultural activities that the ESSnet-Culture has defined as falling within the scope of culture includes ten cultural domains - Heritage, Archives, Libraries, Books and press, Visual arts, Performing arts, Audiovisual & Multimedia, Architecture, Advertising, and Art crafts - that are based on the economic functions of Creation, Production & Publishing, Dissemination & Trade, Preservation, Education and Management & Regulation.

ESSnet‐CultureFinalReport
- 21-
Other basic concepts are also introduced, such as the concepts of cultural employment, with the goal of making a common language available for producing comparable data efficiently in the European Union. In response to the public authorities’ need for statistical information, the ESSnet-Culture has developed a table of economic indicators, and has retained several key indicators on companies, employment, the import and export of cultural material, information technologies, and communication in the cultural sector. While recognising that the production of statistics depends on the availability of sources and data, these indicators are suggested as basic guides for the collection of data on cultural activities and their contribution to the economy as a whole, from harmonised data sources. Finally, the inventory of data sources on the public and private financing of culture, on cultural practices, and on social aspects of culture defined the prerequisites and suggested the classifications and survey methodologies required for producing coherent and consolidated European cultural data, notwithstanding the fact that this inventory also highlighted differences in national methodologies that made it difficult to make comparisons at the European level. For example, the analysis of national questions on social and cultural participation has given rise to the creation of a survey formula with a limited number of questions, which could be introduced in future European surveys such as the EU-SILC, thus allowing input-harmonisation. This formula is completely in keeping with the debates concerning the measurement of the social economy, debates which have been taken on board in the current Europe 2020 strategy for smart, sustainable and inclusive growth. Through its work on the defining of the cultural field, and its assessment of the current statistical environment as regards culture, the ESSnet-Culture has provided public and private actors with a substantial base that must now be mobilised to inform European society on cultural activities.


ESSnet‐CultureFinalReport
- 23-
2BPART I. WORK OF THE TASK FORCES OF THE ESSNET-CULTURE PROJECT
The first part of the final report describes the works, the conclusions and the recommendations of the ESSnet-Culture project group. It is made up of four chapters which correspond to the work done by the four Task Forces of the project, from September 2009 until August 2011.


ESSnet‐CultureFinalReport
- 25-
3BEXCUTIVE SUMMARY
The importance of culture within the scope of economic and social development is today unanimously recognized in the European Union. This increased perception of the major role to be played by culture in the achievement of the objectives of key European strategies such as Europe 2020 makes the absence of comparable data at the European level more striking to European institutions and the Member States. The absence of a real European system for cultural statistics, or the fact that no harmonized specific data on culture are yet produced, means that data produced by Member States are often very difficult to compare due to (a) differences in the definition of the cultural field and its boundaries, (b) the constant evolution of the cultural field, which jeopardizes consensus on its very definition, (c) the diversity of administration and data generation systems for cultural statistics within the European Union, (d) the production of data from countries that are heterogeneous in terms of collection methods, periodicity, field covered and sources used, and (e) the absence of any centralization mechanism at European level. Following the adoption of the first resolution of the Council of the European Union in 1995 on the promotion of cultural and economic growth statistics, huge efforts have been made to improve the comparability of cultural statistics at EU level by successive European working groups. From 1997 to 2004, the European pilot group on cultural statistics, known under the acronym ‘Leadership Group Culture’ - LEG-Culture (1999-2000) and the Eurostat Working Group (2001-2004) drew up the first European framework for cultural statistics and developed specific methodologies, for example on cultural employment measurement. Since 2005, the Council of the European Union and the European Commission have multiplied initiatives in the field of cultural policy development, and a priority on culture statistics has been included in two successive Council Work Plans for culture (for the periods 2008-2010 and 2011-2014). Finally, two pocketbooks on ‘Cultural statistics in Europe’ were published by Eurostat in 2007 and 2011. The European Statistical System network on Culture (ESSnet-Culture) was the result of a call for proposals launched by Eurostat in 2009, following a meeting of the European Working Group on Cultural Statistics (June 2008), which the renewal of European work on cultural statistics official. The ESSnet-Culture has been using a working method developed by Eurostat for methodological activities. It consisted of a network composed of several organisations that form part of the European Statistical System - the ESS. It aimed to produce results that can be useful by all members of the statistical system. Financed on the basis of a grant agreement between the European Commission and a group of five partners co-responsible for the project (Luxemburgish Ministry of Culture, French Ministry of Culture and Communication, Statistical Office of the Czech Republic, Statistics Estonia and Dutch Ministry of Education, Culture and Science), the mandate of the ESSnet-Culture project group was to ‘develop data generation on the basis of a coordinated statistical system and to examine the possibility of adapting or developing existing methods in order to respond to new needs and to cover new domains if relevant’.

ESSnet‐CultureFinalReport
- 26-
The mandate of the ESSnet-Culture was of a methodological nature. While the work did not lose sight of the objective of all statistical development - i.e. to generate harmonised statistical data within a reasonable time frame - ESSnet-Culture primarily aimed to develop the prerequisite EU methodological base for all future data generation.
The main objectives of the ESSnet-Culture were to:
o revise the European framework for cultural statistics (created by LEG-Culture); o improve the existing methodological base to develop new EU cultural statistics; o define indicators and variables that make it possible to describe and study the
cultural sector in all its complexity; o provide a national experience to allow a wider and more advanced analysis of the
data. The specific objective of ESSnet-Culture was thus to update and develop the methodology of the existing European framework for cultural statistics (LEG-Culture final report) in order to favour the development of comparable cultural statistics as well as the analysis of cultural phenomena in Europe. To meet the targets within a limited period of time, the ESSnet-Culture focused on specific targets in the areas of culture funding, development of economic indicators and participation in cultural activities. The ESSnet-Culture was created in September 2009 for a period of 24 months (then extended to 26 months). Under the coordination of the Ministry of Culture of Luxembourg, ESSnet-Culture organized a network of experts coming from 27 countries: 25 EU Member States (AT, BE, BG, CZ, DE, DK, EE, EL, ES, FI, FR, HU, IT, LV, LT, LU, MT, NL, PL, PT, RO, SK, SI, UK, SE), 1 EU accession candidate country (TR) and 1 member country of EFTA (CH). ESSnet-Culture comprised two types of partners within each of its Task Forces: the ‘participants’ and the ‘members’. This distinction was in line with the degree of responsibility and involvement of the partners in each TF - and more generally, the implication of the 28 partner countries in the ESSnet-Culture network. Each country joined one or more TFs on a voluntary basis.
A ‘participant’ was an ‘active partner’ of a TF. The participant was directly involved in developing the work of the TF that it had joined. The participant was invited to all meetings organized by the TF (restricted and enlarged meetings). The participants led statistical development through a ‘reinforced network’. This reinforced network brought together 11 countries that had voluntarily joined the ESSnet-Culture project as a participant of one or several TFs (AT, BE, CZ, DK, EE, FI, FR, LU, NL, SE and UK).
‘Member’ status was given to all countries that wished to join a TF without being directly involved in its work. 16 countries were in this way regularly informed of the progress of work carried out by the TF they had joined (BG, CH, DE, EL, ES, HU, IT, LV, LT, MT, PL, PT, RO, SK, SI, TR).

ESSnet‐CultureFinalReport
- 27-
Figure 1 – Overview of ESSnet-Culture network partners
Status of the partners in ESSnet Culture
Participant
Member
300 Km
© Sources: ESSnet-Culture, Arctique
Auteur: P. Robin, Ministry of Culture of Luxembourg, 2011
ESSnet-Culture was divided into 4 Task Forces that were each dedicated to a specific topic particularly important for the development of EU cultural statistics:
framework and definition (TF1);
financing and expenditure (TF2);
cultural industries (TF3);
participation and social aspects (TF4).
Summary of the work of the Task Force ‘Framework and definitions’ (TF1) Coordinated by the French Ministry of Culture and Communication (Department for studies, strategic foresight and statistics - DEPS), TF1 was in charge of updating the European framework for cultural statistics. It brought together 17 countries: 6 participants (AT, FR, LU, NL, SE, UK) and 11 members (DK, EL, ES, FI, IT, LT, PL, PT, SK, CH and TR). The setting-up of a methodological basis has always been the prerequisite for advancing in the definition and the establishment of an information system on culture. The production of comparable statistics at European level is always an ambitious objective - bearing in mind that the development of cultural national statistics in the 27 Member States, new candidate countries and EFTA countries is uneven and insufficient - and can only be a long term goal.

ESSnet‐CultureFinalReport
- 28-
This Task Force aimed to develop a reflection on the delimitation, structure and extension of the cultural field on the basis of the LEG definition and the proposed 2009 UNESCO framework for cultural statistics. To achieve these results, TF1 used a pragmatic method, making use of available European statistical tools, harmonised surveys and linking its work with prior European developments and international concepts. Findings Over two years, TF1 devoted itself to update the definition of the European cultural field, and to create a new framework compatible with the framework that UNESCO adopted in 2009. This new European framework is based on two main requirements - the function of cultural creation and the production of data.
- By placing creation at the centre of the cultural field, Europe affirms the importance that it attaches to the role of artistic and cultural creation in the economic cycle of culture. In this way, it can also include the creation of advertising designs and art trades within its statistical framework.
- The European statistical framework differs from that of UNESCO by its more restricted boundaries but does offer a more practical vision that favours the production of harmonised data on the cultural sector.
The main contribution of TF1 was updating of the European conceptual framework for cultural statistics, developed by the LEG-Culture. This statistical framework defines the cultural domains that have been selected, and takes into account the various aspects of culture (economic, social, and aspects related to audience, consumption, and financing). This makes it possible to use a common language that is recognised by all Member States, in order to produce and publish a basic set of comparable cultural data in the near future. The decision to include or exclude some cultural activities in/from the framework for cultural statistics caused restrictions. As said before, the production of comparable data was the main objective of the ESSnet-Culture. For this to be realised, the choices made for mapping the ESSnet-Culture framework adopted a minimal but solid and realistic approach, based on common standards and the existence of common classifications among which the economic one predominates, as it is the most commonly used.
The ESSnet-Culture framework rests on two important characteristics:
it does not prioritise any cultural domain: one domain is not more central than another;
the representation of this new framework is based on the articulation of sequenced functions that put artistic creation at the core of the framework: the creation is in fact the first feature at the root of cultural activities, and even the domain of heritage is no exception because its activities are dependent upon previous creations.
The absence of hierarchy among cultural domains and the creation-based feature allows the display of a clear and sound framework and avoids the risks of drowning culture in any other sector. Moreover, it is compatible with future updating, with future inclusions of new cultural domains.

ESSnet‐CultureFinalReport
- 29-
ESSnet-Culture proposes an updated European framework for cultural statistics organized in ten cultural domains and six cultural functions.
- The European statistical framework distinguishes ten cultural domains: Heritage, Archives, Libraries, Book and Press, Visuals Arts, Performing Arts, Audiovisual and Multimedia, Architecture, Advertising and Arts crafts.
A cultural domain consists of a set of practices, activities or cultural products centred on a group of expressions recognized as artistic ones.
- The European statistical framework distinguishes six cultural functions: Creation, Production/Publishing, Dissemination/Trade, Preservation, Education and Management/Regulation.
The functions used for the framework are sequenced functions (from creation to dissemination, along with education or support functions) but they do not aim at representing the whole economic cycle. They follow an economic approach (based on the economic statistical classifications) and a practical one simultaneously, with the final objective to produce sound cultural data. Functions are crossed with domains so as to define cultural activities.
- Compared with the LEG-Culture framework, two new domains were added, namely Advertising and Art crafts, as well as one function, namely Management/Regulation.
ESSnet-Culture proposed to exclude some activities from the general framework for cultural statistics, bearing in mind the proposed definition of cultural activities (related to artistic and cultural expressions and values) as well as the need for quality and availability of data (possible identification of selected activities within statistical classifications). As a consequence, following activities were excluded from the proposed framework:
general system software or applications software activities; information activities (telecommunications); leisure activities (games, entertainment activities, gambling etc.) and tourism; natural reserves, zoos or botanical gardens; manufacture of ornamental products (ceramics, jewellery etc.).
TF1 compared the conceptual framework with the statistical activities in the NACE Rev.2 (statistical classification of economic activities in the European Community). In doing so, TF1 identified the cultural statistical activities, and drew up a list of these activities. TF1 thus provided ESSnet-Culture with a methodological base for developing the scope of the statistical component to be used in harmonised surveys. 29 4-digit classes of the NACE Rev.2 are proposed to collect European data on cultural economic activities, among which 22 are entirely cultural in content while 7 are mainly cultural (exceed culture). TF1 reviewed the content of NACE statistical activities and thereby assessed the level of the classification at which cultural data needed to be collected. TF1 thus concluded that only the 4-digit NACE codes would provide the level of detail necessary for producing relevant cultural data and identified the consequences resulting from producing data at a more aggregated level.

ESSnet‐CultureFinalReport
- 30-
Recommendations
1) ESSnet-Culture recommends Eurostat to propose as soon as possible a solid program of actions and developments in order to capitalize on the involvement and expertise of Member States in the future development of European cultural statistics.
2) ESSnet-Culture recommends to provide a better coverage of the cultural
sector in European surveys (in terms of all cultural classes of the NACE Rev.2).
3) ESSnet-Culture recommends to request a more detailed level of classifications
(NACE, ISCO) in harmonized surveys (e.g. in the EU-LFS) so that cultural activities and cultural occupations may be better identified.
4) ESSnet-Culture recommends to put in place a network of thematic working
groups to work on the harmonization of the concepts and methods of the sectoral administrative surveys, in order to produce harmonized statistics on heritage, libraries, visual or performing arts.
5) ESSnet-Culture recommends the establishment of Task Forces on specific
topics related to cultural statistics, under the coordination of Eurostat. These TFs could concentrate on the following themes that have been highlighted by the ESSnet-Culture experts as being of prior importance: cultural employment, trade in cultural goods and services, satellite accounts on culture, copyrights.
Summary of the work of the Task Force ‘Financing and expenditure on culture’ (TF2) Coordinated by the Czech Statistical Office (CZ), TF2 was in charge of developing a methodology for collecting data on public cultural expenditure and cultural expenditure of households. It brought together 17 countries, only 2 participants (AT and CZ) and 15 members (BE, BG, CH, DK, ES, DE, FR, LU, NL, PL, PT, RO, SE, SI and TR). The objective of TF2 was to define the ‘state of the art’ of statistics on cultural expenditure and finance. Moreover, it had also as an objective to deepen the methodological work already carried out in order to be able to collect more exhaustive and more comparable data. Attention was also paid to household expenditure on culture by exploring the potential of the European Household Budget Survey (HBS). Findings TF2 conducted inventories of the cultural public expenditure, with the view to map and to analyze the availability of data, and then to compile a methodology aiming at collecting and producing harmonized data on financing culture. TF2 observed that a joint collection of data on public expenditure on culture (within the EU) would be hindered by various obstacles

ESSnet‐CultureFinalReport
- 31-
jeopardizing the comparability of data, either in time or in space. These obstacles particularly consisted in the countries’ different approaches. The following difficulties were identified: uneven availability of data in Member States, unconsolidated data in some countries, differing national practices regarding the breakdown by cultural domains and the inclusion of non-cultural sectors, difficulties to split data by central/regional/local level, considerable divergences as concerns the implementation of COFOG classification, use of transfer funds instead of purchase or sale of services, lack of definitions as regards the coverage of cultural domains, discrepancies in methodologies, frequent organizational or accounting changes. TF2 proposed to collect a minimum set of data, attainable by all countries, starting from tables structured on cultural domains and sub-domains. The works of TF2 showed the importance of the Household Budget Surveys (HBS) for the study of households’ expenditure on culture. The HBS are harmonized throughout Europe and provide many useful variables. Nevertheless, some important constraints limit the comparability of data provided through HBS between the European countries (sampling design and size, timelines and frequency). TF2 proposed to collect comparable data on households’ expenditure using the COICOP-HBS classification as applied by Eurostat in its pocketbook on culture statistics. TF2 underlined the importance to have a shared set of definitions and concepts of what is meant by ‘culture’ and by ‘public and private spending’. TF2 also pointed out the importance to have a data collection harmonized and organized by the European Union. It thus proposed a simplified data collection organized in two phases (initial table and target table) to collect at the same time data on public cultural expenditure and data on the cultural expenditure of households.
Recommendations
1) As regards public expenditures, ESSnet-Culture recommends to proceed to the
assessment of the quality and comparability of statistics concerning culture and gathered through harmonized data collection on public finance (budgetary data on culture expenditure of the public administration).
2) Always as regards public expenditures, ESSnet recommends to support a better coverage of culture by COFOG through the adoption of more detailed cultural categories.
3) ESSnet-Culture recommends to intensify efforts to allow data collection on
public expenditures allocated by the various levels of government to the various cultural domains, using the methodology developed by TF2.
4) ESSnet-Culture recommends to put in place a Task Force with the mission to
release the necessary requirements for the development of satellite accounts on culture in Europe and the definition of standards.
5) With regards to households’ expenditures, ESSnet-Culture recommends a
greater harmonization of the national surveys on the household budgets and a better coverage of culture by using the most detailed level of the COICOP classification.

ESSnet‐CultureFinalReport
- 32-
Summary of the work of the Task Force ‘Cultural industries’ (TF3) Coordinated by Statistics Estonia (EE), TF3 was in charge of developing economic indicators and defining the field of cultural employment. It brought together 14 countries, 6 participants (DK, EE, FI, FR, NL and SE) and 9 members (CH, DE, EL, ES, IT, LT, LU, PL and RO). The aim of the Task Force was to prepare a proposal for the production of a core data set concerning the cultural/creative industries, including cultural employment. TF3 took into account the experience and practices of various countries to propose ways to measure all important dimensions in relation with cultural industries in European countries. Findings TF3 worked on the concept of ‘cultural industries’, which is a notion widely used by several European countries (France, Sweden, Italy etc.) as well as by UNESCO while some other countries use the concept of ‘creative industries’ (Austria, United-Kingdom etc.). The challenge of TF3 was to statistically define a common field for these industries in order to harmonize statistics on economic dimensions and employment. This work has to be seen against the background of the Green Paper released by the European Commission in 2010 on Unlocking the potential of cultural and creative industries, as well as the overall ‘Europe 2020’ of the European Union for a smart, sustainable and inclusive growth, that favours knowledge and innovation, job creation, social cohesion and sustainability. TF3 concluded that the function of creation must not be confused with the concept of creativity, widely used in the ‘creative industries’ concept. The concept of creative industries is a vague concept that is not clearly defined in the various documents referring to it. It covers different realities and different sectors in academic or national strategies and even in lexical and linguistic difference. The varieties of sectors included in Cultural and Creative Industries (CCIs) - from fine arts to sometimes also telecommunications and software - lead to a variety of figures that do not favour comparability and to mixing up cultural activities with purely industrial activities with no cultural bearing. For all reasons, the ESSnet-Culture framework on culture uses general concepts for mapping the statistical framework on culture: cultural activities, economic activities, as well as economic and statistical concepts of cultural sector and cultural industries. Cultural activities, belonging to cultural and creative industries, are understood as all types of activities based on cultural values and/or artistic expressions. Cultural activities include market or non-market orientated activities, with or without a commercial meaning and carried out by any type of producers and structure (individuals, organizations, businesses, groups, amateurs or professionals). As a consequence, ESSnet-Culture proposes to put in the definition of the CCIs only activities included in the framework for cultural statistics and recommends when speaking about CCIs, to clearly mention the sectors that are covered, so that the scope be clearly indicated for objectives of comparability. On cultural employment, TF3 followed the approach already proposed by the previous European working group, which defined cultural employment as the ‘all people having either a cultural profession or working in an economic unit of the cultural sector’. On the one hand, it studied employment in entities carrying out their activity in a cultural domain and, on the other hand, it examined employment in occupations involved in cultural domains.

ESSnet‐CultureFinalReport
- 33-
TF3 focused its work on finding an agreement on the cultural occupations based on the International Standard Classification of Occupations (ISCO-08). Finally a list of cultural occupations at 4- and 3-digit (for the restricted use) level was elaborated. The ISCO nomenclature does not allow distinguishing all cultural occupations at the 4-digit level. One of the most important and time consuming efforts of TF3 was the proposal of relevant indicators and their exact descriptions. A list of key indicators is proposed, related to entrepreneurship, employment, import and export of the cultural goods as well as ICT in the cultural sector. Recommendations
1) ESSnet-Culture recommends a better coverage of culture in the SBS survey,
on 4 digit level in particular to cover divisions 90 and 91 of the NACE Rev.2 (‘Creative, arts and entertainment activities’ and ‘Libraries, archives, museums’).
2) ESSnet-Culture recommends to request a more detailed level of classifications
(NACE, ISCO) in the harmonised LFS survey: 3 digits for the NACE-08 and 4 digits for the ISCO-08.
3) ESSnet-Culture recommends Eurostat to carry out a technical assessment on
the cultural employment matrix and on its production process in order to be able to ensure a perennial annual production of data on cultural employment in Europe.
Summary of the work of the Task Force ‘Cultural practices and social aspects’ (TF4) Coordinated by the Dutch Ministry of Education, Culture and Science (NL), the TF4 was in charge of developing a methodology to study cultural practices in Europe and the development of social indicators. It brought together 17 countries, 7 participants (BE, DK, EE, FI, FR, SE and NL) and 10 members (CH, ES, HU, IT, LU, LV, MT, PL, SI and TR). The objective of TF4 was to analyse cultural participation in the 27 Member States of the EU and the connections between cultural participation and other aspects of social life. First of all the group was supposed to continue the harmonisation work for statistics on cultural participation in order to produce reliable and timely data and a set of indicators for describing the different national situations and comparing the cultural participation in the Member States. To face the lack of data, the TF4 was asked to study should have studied the possibility of using the new European surveys (like AES) as a main source of comparable data, but it should also have evaluated the possibility of using available harmonized national surveys. The Task Force also worked on non harmonised surveys to learn more about the problems encountered and the solutions taken into account. It also considered the methodologies used and tried to figure out why these surveys could not be harmonized. The

ESSnet‐CultureFinalReport
- 34-
Task Force worked on a core of indicators and questions to be integrated in the future in the possible European survey. Moreover it was of major importance to analyse the links between cultural participation and familial and socio-economic characteristics on one hand and those between cultural participation and the civil society (voluntary work, political participation etc.) on the other hand. Findings Social research of cultural practices of the population becomes more relevant for policy makers, at national and on European level. There is a growing need, on national level, to assess the results of cultural policies, especially policy measures aimed at reducing inequalities in access to culture. A population survey on participation in cultural activities is an important tool to evaluate the outcome of such measures. The growing political interest, at European level, for quality of life and well-being calls for broader measures of social progress which include, inter alia, cultural and civic participation. The best way to measure this progress would be a common European survey on participation in culture, sports and social and civic participation. This survey should be repeated periodically. The participants and members of TF4 realized that such a large survey will not be realised in the near future. Nevertheless a pilot project could be carried out by a limited number of interested Member States with the support of the European Commission. The comprehensive questionnaire on cultural practices, included in this report, can be used for this survey. Cultural practices themselves are changing. The distinction between ‘traditional’ and ‘popular’ culture is losing its significance as a growing number of people include the two types of culture in their own menu. The rise of information and communication technology, and especially the new possibilities offered by the Internet, has a profound impact on cultural practices. Research on cultural practices should take such changing patterns into consideration. The changes are not restricted to visits of cultural manifestations and media habits, but have a bearing on all activities connected with cultural participation. The ICET-model (Information, Communication and community, Enjoyment and expression, Transaction), introduced in the report, seems very well suited for studying the changing cultural practices. This model should be put to a test, preferably in a follow-up of national surveys on cultural participation. TF4 hopes that a number of Member States would be interested in carrying out this experiment and that the European Commission would be prepared to support it. A number of European surveys conducted until now contained questions on cultural practices. The results of these surveys are however neither reliable nor comparable. The results of the Eurobarometer systematically overestimated the national ones in many countries. The so called ‘output harmonization’ applied in the EU-SILC and in the AES brought about many implausible results. In particular, the fact that the questions are not phrased in an identical manner, had a negative impact on the findings and the across country comparisons. To achieve comparable results, the wording of questions is a crucial issue. The translation of a model questionnaire (usually formulated in English and/or French) should be done with the outmost care. Data collection modes used in the different Member States should be harmonized as much as possible. Preferably Computer-Assisted Personal Interviews (CAPI)

ESSnet‐CultureFinalReport
- 35-
should be used, eventually in combination with Computer-Assisted Telephone Interviews (CATI). The sample should be representative for the whole population, ideally of 6 years and older. The sample should be large enough to allow analysis of specific target groups. The new ‘ad-hoc module’ of EU-SILC, which was planned for 2014, offers a new chance to collect reliable and comparable data on cultural and civic participation in the European Union. To ensure reliability and comparability, ‘input harmonization’ should be used in this survey and the data collection modes used in different Member States should be harmonized as much as possible. Experts who were part of TF4 - be it as participants or as members - should be involved in the preparation of ad-hoc module EU-SILC. To get a reliable picture of cultural practices, as well as social and civic activities of the European population, there are hardly any alternatives to an EU-wide sample survey. Even if the subject matter of cultural participation is restricted to a few well-chosen questions - as it probably will be the case in the new EU-SILC ahm - such a survey can be an important instrument to assess the contribution of culture to the implementation of the Europe 2020 strategy. Recommendations
1) ESSnet-Culture recommends a common European survey on participation in
cultural activities to be repeated periodically, for instance every five years, to measure social progress in EU-27.
2) ESSnet-Culture recommends to include the ICET model in the national surveys
on cultural participation in order to test it. ESSnet-Culture hopes that a number of States Member would be prepared to carry out this experiment and that the European Commission could support it.
3) In the framework of the new ad-hoc module of EU-SILC -Statistics on Income and
Living Conditions, 2014- , in order to produce reliable and comparable data on cultural and social participation in the European Union, ESSnet-Culture recommends the use of ‘input harmonization’, the harmonization of the data collection modes used in Member States and the involvement of the TF4 experts in the preparation of this survey.
4) ESSnet-Culture recommends to integrate the issue of culture in the European
works on the development of social and well-being indicators, and to continue the research on the cultural indicators carried out successively by the working groups of the LEG-Culture, of Eurostat and of the ESSnet-Culture.

ESSnet‐CultureFinalReport
- 36-
LEGAL FRAMEWORK OF THE ESSnet-CULTURE
Treaty on the Functioning of the European Union, Tittle XIII, Article 167
Council Resolution of 20 November 1995 on the promotion of statistics on culture and economic growth (OJ C327, 7.12.1995, p.1-1)
Resolution of the Council of 16 November 2007 on a European Agenda for Culture (OJ C287, 29.11.2007, p.1-4)
Conclusions of thw Council and of the Representatives of the Governments of the Member States, meeting within the Council, on the Work Plan for Culture 2008-2010 (OJ C143, 10.6.2008)
Decision n°1578/2007/CE of the European Parliament and of the Council of 11 December 2007 on the Communauty Statistical Programme 2008 to 2010 (OJ L344, 28.12.2007, p.15-43)

ESSnet‐CultureFinalReport
- 37-
TASK FORCE 1
FRAMEWORK FOR CULTURAL STATISTICS AND DEFINITIONS
1. The challenges of updating the European statistical framework
Technological changes that have taken place in recent years particularly affect cultural activities: digitization not only leads to changes in innovation and industrial processes (with impacts upon the creation, production and dissemination of cultural goods of various branches) but also in cultural practices (equipment and uses, social networks, consumption etc.) mixing the role of producers and consumers, of amateurs and professionals. Furthermore, new technologies have led to changes in the economies of cultural sectors (organization of production and distribution models) as well as to considerations of new public policies (copyrights, funding of culture, access to digital society, education and social cohesion etc.). Last but not least, some statistical tools have also evolved, with new versions of statistical classifications, for example. It is therefore necessary to update the European framework for cultural statistics previously defined in 2000 by the LEG-Culture. The first step to provide European statistics with a sound and common framework is to define a commonly agreed scope of culture bearing in mind the ultimate aim – which is to produce comparable European data, while taking into account the UNESCO framework 2009. The work undertaken by the Task Force ‘Framework for cultural statistics and definitions’ (TF1) is also connected to the current general European policy context. On the one hand, the demand of policy makers for statistical information on culture was confirmed in the EU Work plan for Culture 2011-2014, which identifies cultural statistics as one of its six priority areas(7):‘Priority area F: Culture Statistics’. On the other hand, the new economic strategy ‘Europe 2020’ of the European Union - a strategy for a smart, sustainable and inclusive growth - promotes growth based primarily on knowledge and innovation, and favours social cohesion and sustainable development (see the conclusions from the Budapest European Council, 20 May 2011). It calls for more measurability to see the progress achieved towards identified goals. Defining and measuring culture is widely recognized as a difficult task. The development of a renewed and common framework for producing comparable data at EU level is therefore fundamental in order to respond to the need for more and better information in the cultural field, to conduct studies and to help decision makers. This was a challenge that TF1 had to meet.
(7) Conclusions of the Council and of the Representatives of the Governments of the Member States, meeting within the Council, on the Work Plan for Culture 2011-2014 (2010/C 325/01), http://eur-lex.europa.eu/LexUriServ/LexUriServ.do?uri=OJ:C:2010:325:0001:0009:EN:PDF

ESSnet‐CultureFinalReport
- 38-
TF1 had to define and structure the framework of cultural activities, to choose those activities that would be considered as cultural and to organise them into a conceptual matrix. This was its main objective and - as the project needed general agreement – outcomes were presented to different groups (within ESSnet-Culture, participants and members as well as to steering committee members, at ‘Eurostat Working Group on Culture’ meetings and in other European meetings - e.g. at EU presidencies meetings). Although not an obvious task, the choice to include or exclude activities in/from the framework was also based on practical grounds, mainly on the existence of codes in statistical classifications corresponding to these activities. The challenge was indeed to avoid proposing new definitions of culture, adding to a variety of concepts already existing. ESSnet-Culture was not meant to propose a contemporary version of Clyde Kluckhohn and Alfred Kroeber’s ‘Culture: A Critical Review of Concepts and Definitions’ who reviewed more than 160 definitions of culture in 1952. The second objective of the ESSnet-Culture was to propose a framework that would allow for the production of regular comparable statistics on culture at a European level. In that sense, the use of existing tools and sources (harmonized surveys for their legal feature, hence their quality) was preferred. Moreover, considering the absence of data in cultural fields, it was important to avoid further broadening the gaps. Once the activities were selected and organised into a framework, TF1 identified European sources available for the collection of data, as well as lack of sources. Whenever European harmonised data collections were missing, other possible data gathering sources/institutions were examined, bearing in mind that the objective was quality and comparability.
2. The situation in the early work Despite the difficulties in defining culture, the European Union adopted its first statistical information system on culture with the Leadership European Group on cultural statistics (LEG-Culture, 1997-2000) - (cf. ‘Cultural statistics in the EU: Final report on the LEG’, Eurostat working papers n° 3/2000/E/N°1): it was therefore clear for the ESSnet-Culture that it had to structure its new framework on this earlier, recognized and approved LEG-Culture heritage. With the LEG-Culture as its starting point, TF1 looked for a general definition corresponding to the 2000 European statistical framework on Culture but no definite one had been drafted at that time, due to it being such a complex task. The LEG-Culture delineated cultural domains (e.g. visual arts, museums, libraries, theatres) but no general concepts. Within that scope, eight domains and six functions were kept by the LEG in order to dispose of a common and practical basis for measuring culture: ‘The inclusion or exclusion of certain areas in the LEG's common field was only partly a matter of theory. The first target was to select real cultural "domains" which could not only be analysed and compared but, more importantly, inserted into an operational framework which national and European policymakers could use immediately’. (Eurostat Working papers n°3/2000/E/N°1, page 6). This conclusion and this approach was maintained by TF1, that used the LEG-Culture domains and functions as the starting point of its work.

ESSnet‐CultureFinalReport
- 39-
The LEG-Culture ‘domain’ covers different modes of expression, of which the LEG-Culture listed eight, namely: heritage, archives, libraries, books and press, visual arts, architecture, performing arts, audio/audiovisual and multimedia. Cultural activities for each domain were then established according to their economic function. Admittedly, this economically based approach to culture may appear reductive, but its aim is to respond to the demand for cultural statistical analysis in Europe. The economically-based approach is moreover the one taken by UNESCO in the scope of its new cultural field in 2009. Besides domains, the LEG-Culture cycle was based on six functions: preservation, creation, production, dissemination, trade and education. Another framework was at the root of the ESSnet-Culture work: in 2009, UNESCO updated its framework, the new Framework for Cultural Statistics (2009 FCS)(8). When comparing the 2000 LEG-Culture framework and the 2009 FCS, it appears that the activities that are usually considered as core cultural activities are included in the two frameworks: heritage, performance, books and press, audiovisual, visual arts, design and architecture. Yet, their gathering into conceptual groupings is often different since LEG-Culture and UNESCO definitions of the first unit differ. In the 2009 FCS, the unit mixes domains (e.g. fine arts) with activities (e.g. architectural services) and products (videogames). On top of a minimum set of 6 core domains, UNESCO also defines cross-sector domains (equipment, archiving and preserving, ICH) and related domains (tourism, sports and recreation). In conclusion, regarding the cultural breadth, the 2009 FCS includes the 8 LEG-Culture domains, and, due to its broader status, goes beyond them by adding natural heritage, crafts trade in general, interactive media and telecommunications (from software to web portals) and creative service activities such as advertising(9). The 2009 FCS also includes notions of related domains, whose primary component is not cultural: leisure, sports and tourism activities (‘Sports and Recreation and Tourism are not always considered cultural activities; however, they do contain cultural elements. In other words, they represent activities that may have a cultural character but their main component is not cultural’, 2009 FCS p.28). Finally, the creation of so-called ‘transversal domains’ in the 2009 FCS recognizes another cultural area: intangible heritage. This notion of cross-sector domain was also used for Education, Archiving, and Equipment in the 2009 FCS. In the LEG-Culture framework, the status of Archives is different, it is one of the cultural domains and Education is a ‘function’. The LEG-Culture framework defined six functions that meet the cultural cycle of the 2009 FCS. UNESCO presents a whole cultural cycle covering the interconnections of five processes going from creation, production, dissemination, exhibition/reception/transmission to consumption/participation. Moreover, the processes of the 2009 FCS are understood in a broad economic sense so that they lead to extended forms of activities and not only cultural ones (manufacturing and wholesale, for instance). On the contrary, the LEG-Culture framework did not use the concept of supply and demand cycle but clearly emphasized specific cultural functions (creation, production, dissemination but also preservation and education as well as trade) thus allowing cultural activities to be chosen.
(8) The 2009 UNESCO Framework for cultural statistics replaces the 1986 UNESCO Framework for Cultural Statistics (1986 FCS), http://www.uis.unesco.org/Library/Documents/FCS09_EN.pdf (9) The LEG-Culture did not incorporate advertising as central activities, however advertising services were later considered, e.g. by the Expert Report that followed the publication of Eurostat first pocketbook on cultural statistics in 2007.

ESSnet‐CultureFinalReport
- 40-
This last point is the one that was also favoured by ESSnet-Culture, as the importance of functions(10) is linked with the necessity and choice of structuring a framework of cultural activities that can be measured and compared (this choice will be developed in the following chapters). As for equipment and supporting materials, the 2009 FCS defines this cross-sector domain as the ‘tools of cultural products and activities’ to distinguish them from cultural products (‘equipment and supporting materials are related to the supporting industries, as well as ancillary services -even if only partially cultural in content’, 2009 FCS p.28). Durable goods were only considered in the LEG-Culture approach from the perspective of household expenditure. Therefore, the differences between the 2000 LEG-Culture and the 2009 FCS are minimal and are mainly due to the international status of UNESCO framework and its focus on diversity, leading to openits field to various sectors and several economic markets. The differences are of two kinds:
o related/transversal groups that UNESCO itself does not really label as cultural (‘In other words, they represent activities that may have a cultural character but their main component is not cultural’ 2009 FCS, p.28): equipment and supporting materials, tourism, sports and leisure;
o detailed sub-domains: natural heritage, traditional heritage, general craft products, fairs and feasts, printed matter in general, podcasts, social networks and internet portals, software, and advertising.
These differences will fuel the works of ESSnet-Culture TF1 for constructing the new 2011 European framework, a framework that must allow measurement and comparability.
Figure 2 – Cultural domains and sub-domains: the LEG-Culture framework compared to the 2009 FCS
(10) Along with functions, ESSnet-Culture considers ‘dimensions’ that are specific areas of cultural statistics allowing analyses of culture from different points of view (and studied within the other task forces) - financing and consumption, economic indicators and employment, cultural practices.

ESSnet‐CultureFinalReport
- 41-
3. Methodological issues
3.1. Work plan: one process for measuring culture
In order to make the production of comparable data possible for a common knowledge of the cultural sector in Europe, a conceptual framework for culture must be agreed upon. Should we completely rethink the debate about culture, and start with the question: What is culture? As said before, for ESSnet-Culture objectives the answer to this is ‘no’. Obviously, culture cannot simply be defined as a homogenous, logical and clearly defined sector, which could moreover be described by statistics.
o Culture is not the outcome of an economic sector which gathers products or services, either in terms of production or dissemination. Cultural activities often cross several economic sectors (e.g. industry, services, communications and trade sectors etc.).
o Culture encompasses various social practices currently recognised as cultural within a specific group and even these social conventions are evolving. It represents the values of individuals, their own aesthetic and philosophical representations and, at a more collective level, all the ways of understanding a people’s identity.
Cultural activities are very diverse and depending on divergent national institutional policies. For academic issues, it is interesting to carry out empirical research but for the methodological work on statistics, TF1 privileged already existing notions and intuitive acceptance of culture. What then are the concepts of culture?
The UNESCO definition states that ‘Culture should be regarded as the set of distinctive spiritual, material, intellectual and emotional features of society or a social group, and that it encompasses, in addition to art and literature, lifestyles, ways of living together, value systems, traditions and beliefs’ (UNESCO, 2001). The ‘Expert report on sources’ (2008) lists the main criteria used to define the cultural feature.
The ‘creativity’ criterion – in the sense of the ability to create or invent – would seem too broad, since any kind of innovation implies by definition a measure of creativity, so that any industry whatsoever would qualify as being ‘creative’. The criterion of creativity would need to be further defined before it could be used.
The notion of ‘intellectual property’ (IP): it is intended to ensure legality in the
use of certain cultural goods which can easily slip into the public domain, such as music via the Internet, books and films.
However, intellectual property is divided into two categories:
a) industrial property, which includes patents, trademarks, industrial designs and geographic indications of source;
b) copyrights also referred to as ‘author’s rights’, which includes literary and artistic works such as novels, poems and plays, films, musical works, artistic works such as drawings, paintings, photographs and sculptures, and architectural designs.
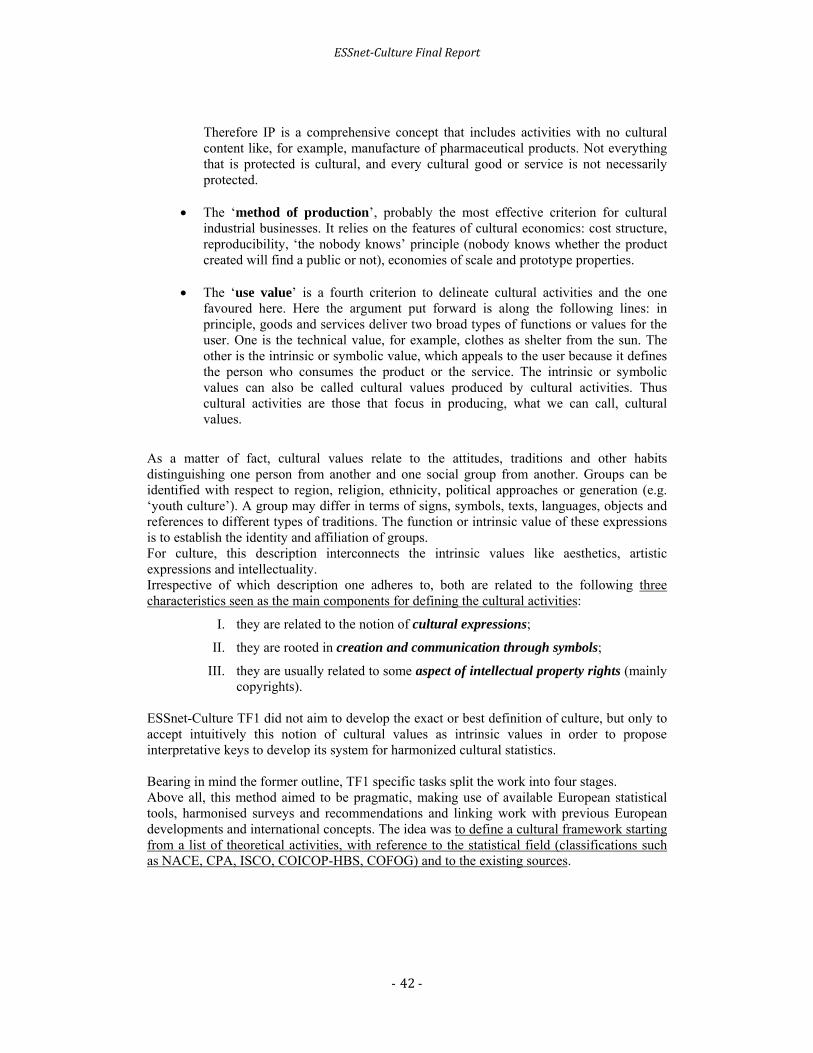
ESSnet‐CultureFinalReport
- 42-
Therefore IP is a comprehensive concept that includes activities with no cultural content like, for example, manufacture of pharmaceutical products. Not everything that is protected is cultural, and every cultural good or service is not necessarily protected.
The ‘method of production’, probably the most effective criterion for cultural
industrial businesses. It relies on the features of cultural economics: cost structure, reproducibility, ‘the nobody knows’ principle (nobody knows whether the product created will find a public or not), economies of scale and prototype properties.
The ‘use value’ is a fourth criterion to delineate cultural activities and the one
favoured here. Here the argument put forward is along the following lines: in principle, goods and services deliver two broad types of functions or values for the user. One is the technical value, for example, clothes as shelter from the sun. The other is the intrinsic or symbolic value, which appeals to the user because it defines the person who consumes the product or the service. The intrinsic or symbolic values can also be called cultural values produced by cultural activities. Thus cultural activities are those that focus in producing, what we can call, cultural values.
As a matter of fact, cultural values relate to the attitudes, traditions and other habits distinguishing one person from another and one social group from another. Groups can be identified with respect to region, religion, ethnicity, political approaches or generation (e.g. ‘youth culture’). A group may differ in terms of signs, symbols, texts, languages, objects and references to different types of traditions. The function or intrinsic value of these expressions is to establish the identity and affiliation of groups. For culture, this description interconnects the intrinsic values like aesthetics, artistic expressions and intellectuality. Irrespective of which description one adheres to, both are related to the following three characteristics seen as the main components for defining the cultural activities:
I. they are related to the notion of cultural expressions;
II. they are rooted in creation and communication through symbols;
III. they are usually related to some aspect of intellectual property rights (mainly copyrights).
ESSnet-Culture TF1 did not aim to develop the exact or best definition of culture, but only to accept intuitively this notion of cultural values as intrinsic values in order to propose interpretative keys to develop its system for harmonized cultural statistics. Bearing in mind the former outline, TF1 specific tasks split the work into four stages. Above all, this method aimed to be pragmatic, making use of available European statistical tools, harmonised surveys and recommendations and linking work with previous European developments and international concepts. The idea was to define a cultural framework starting from a list of theoretical activities, with reference to the statistical field (classifications such as NACE, CPA, ISCO, COICOP-HBS, COFOG) and to the existing sources.

ESSnet‐CultureFinalReport
- 43-
3.2. To define the theoretical cultural activities by crossing domains and functions
This approach starts with the previous European LEG-Culture framework which is compared with the 2009 Framework of UNESCO so that delineation of general outlines can be decided, to include or to exclude activities and to identify debates at national level. To structure the new European framework for cultural statistics, it was necessary to consider technological advances that lead to changes in society, in economy and in cultural practices, as well as improvements of statistical observation systems (e.g. the NACE Rev.2 takes better into account cultural activities). Are there new domains that are now to be thought about (see internet and new telecommunications), that can now be measured, or domains that were not part of LEG-Culture but of the 2009 FCS (intangible heritage, landscapes, crafts, advertising, software etc.) and should be included? As a matter of fact, sequences of the production cycle have undergone numerous changes and the models of economies, functions tend to mingle and interconnect themselves. For instance, creation and production converge and may be carried out with the internet by the same actor, not necessarily a professional. The threshold to publish texts has decreased, as exemplified by blogs. Furthermore, it is possible to start an internet magazine/fanzine or even a streaming media radio station with very small means. To produce music you do not need facilities, which demand huge investments as was the case in the 1970s or 1980s. Cultural products are also more and more accessible via digital outlets and this has had consequences on physical trade and distribution of cultural goods, thus questioning the value of the individual shop as the digital distribution cost may now be close to zero. With the internet and social networks, production and consumption are not separate anymore: individuals can co-create or consume/produce in an ‘integrated’ way. However, in what way does all this affect the general scheme of structure based on cultural domains and cultural functions? It seems that cultural theoretical activities still exist and correspond to their definition: it still remains the act of creating cultural pieces, as well as producing and disseminating them (whether with physical outlets or by the internet). Numerous changes modify the functions all along the line but there is no new function, just an adaptation to new tools (creation of music with a violin or with virtual software is still a creation). It is also important to see how the updated statistical tools for measuring these new cultural digital creations enable to modify the matrix of cultural activities. If we think about podcasts or on-line functions: which statistical codes reflect these products and their activities, are they operational in surveys, are they proportionally representative, are they to be analysed from an economic side (production? dissemination?) or from a social one (practices?) or other? Facing these new issues, it seems that the LEG-Culture approach may be adhered to because its structure remains operational. The LEG-Culture created a common observational reference system based on cultural domains and cultural functions: the unit of the framework is a cultural activity, which is at the crossing between a given domain and a given function.
There are of course some exceptions within this system:
archives are a domain but are quite close to a function-Preservation;
heritage and its various subdivisions do not exactly follow the sequence of the LEG-Culture functions as their purpose is more linked to conserving than to producing;

ESSnet‐CultureFinalReport
- 44-
architecture, subject of a lengthy LEG-Culture debate, is included as a domain as it is part of an artistic tradition, although only a small proportion of architectural activity could be seen as cultural (activities of architectural design), whilst the production side of it (activities of construction) should not be considered as such.
Nevertheless, this system enables correspondence with statistical classifications for comparative purposes: it is therefore proposed to update the LEG-Culture framework whilst maintaining its structure based on domains, functions and activities. The LEG’s content remains the basis of the discussions: TF1’s first objectives were therefore to include/exclude activities and to restructure the framework. ESSnet-Culture proposes an updated European statistical framework organized in ten cultural domains and six cultural functions:
Compared with the LEG-Culture framework, two new domains are added to the European statistical framework.
o ‘Advertising’ - is included by the UNESCO and favored by 13 other international frameworks (see 2009 FCS, 2007 draft version; on 14 reviewed international frameworks, Europe was the only one to not use it in 2007). Just like architectural creation is included in the ESSnet-Culture framework, the activities of advertising are observed from the creation function on account of their real potentiality for artistic creation: therefore neither the production of advertising material nor the promoting aspect of marketing are considered.
10 cultural domains 6 functions
Heritage (Museums, Historical places, Archaeological sites, Intangible heritage)
Archives Libraries Book & Press Visuals arts (Plastic arts, Photography, Design)
Performing arts (Music, Dance, Drama, Combined arts and other live show) Audiovisual & Multimedia (Film, Radio, Television, Video, Sound recordings, Multimedia works, Videogrames) Architecture Advertising Art crafts
Creation Production/Publishing Dissemination/Trade Preservation Education Management/Regulation

ESSnet‐CultureFinalReport
- 45-
o ‘Art crafts’ are an important part of traditional heritage (linked with intangible heritage) and were elected by Member States. Art crafts stand for the creation of original cultural products.
As said before, ESSnet-Culture TF1 decided to keep the LEG-Culture approach and did not describe a cultural cycle from supply to demand but clearly emphasized specific cultural functions (creation, production, dissemination & trade, preservation, education and administration) allowing to pick out and measure cultural activities. This is at the base of a first layer of cultural activities: ESSnet-Culture kept the functions of the previous LEG-Culture and added a new one - ‘Management & regulation’. The function ‘Management & regulation’ refers mainly to public institutions that finance, regulate and structure culture. It also introduces the supporting activities of private organizations that become vital for cultural activities (as private management tends to develop, as a need for new regulation arises with the new dissemination networks and eventually as cultural actors need more and more professional support for their cultural activities, their administrative works etc.). The absence of some functions, especially from the manufacturing side, was highly debated: some country representatives requested the introduction of an industrial function, considering it as essential for the achievement of final cultural products and services, and with the objective to collect all stages of the production chain. However, the aim of this ESSnet reaffirmed that its first objective was to delineate the field of cultural activities rather than to build a global accounting system. Manufacturing was not included as a cultural function because its characteristics are only partly cultural, much more industrial and hardly measurable by statistical classifications when the cultural content of the manufacturing activity is just marginal. Nevertheless some manufacturing activities related very closely to the cultural products of books, press or recorded media are added as related activities: these related activities do not give a cultural value to the product but they make it possible to mass reproduce cultural goods for wider consumption. They include the printing of books and newspapers and the reproduction of recorded media(11). The manufacturing activities of ancillary products (such as audio-visual or optical equipment, and musical instruments) were the second highly debated item. Some wanted their inclusion pointing at the fact that they facilitate the use and enjoyment of cultural goods and services. Just like the production of e-books could hardly be considered as a cultural activity, it seems difficult to include manufacturers of camera, of television etc. in a framework on culture, all the more so since the statistical classifications do not allow to isolate the cultural part that could be included. It was nonetheless decided to include as a related activity the manufacture of musical instruments whose statistical code can be seen with the NACE class level (NACE Rev.2, class-32.20) keeping in mind that estimates would be necessary for production of cultural aggregates on these printing and manufacturing activities. It is important to remember that the objective of the European framework for cultural statistics is to produce data on cultural activities. When the related activities mentioned above (see also Annex 1) are added to the basic framework, it should always be clearly indicated, as these activities are optional to be included. This limit is yet to offer a framework on culture that will be easy to implement by the EU-27 and suitable for quality aggregates and indicators for assessment and comparability.
(11) Enclosed among the statistical classification, NACE Rev.2, Division 18 - Printing and reproduction of recorded media.

ESSnet‐CultureFinalReport
- 46-
The ESSnet-Culture framework rests on two important characteristics.
It does not prioritise the cultural domains: one domain is not more central than another. As is often the case in theories in which cultural domains, in particular those of the classical arts, would be more in the heart of creativity. These theories would imply criteria (of what nature, aesthetics? sociological? political? economic? etc.) to organize a hierarchy in which one domain is compared to another (e.g. is creation more creative in dance than in cinema, or in advertising design or in architecture?). The objective of a statistical analysis can only be agnostic in that regard.
The representation of this new framework is based on the articulation of sequenced
functions that put artistic creation at the core of the statistical framework: the creation is in fact the first feature and even the domains of heritage are no exception because their activities are dependent upon previous creations.
The function of creation must not be confused with the concept of creativity, widely used and debated in the ‘Cultural and Creative Industries’ (CCIs)(12). The concept of creative industries is a very vague concept that is not clearly defined in the various documents referring to it, and covers different realities and different practical cultural sectors in academic or national strategies (and even in lexical and linguistic difference)(13). The varieties of sectors (from fine arts to telecommunications and software) included in the CCIs lead to a variety of figures that do not favour comparability and that lead to a mix up of cultural activities with industrial ones. Starting from a core set of quite basic cultural fields and enlarging it to peripheral fields, the CCIs notion often seems broad and generic, and does not only include cultural/artistic creation. The assumption of a stronger creative content in these cultural sectors as compared to non-cultural sectors is not established (a painter is not necessarily more creative than an engineer or a sportscaster) and consider it as culture takes away cultural specificities. Most of all, creativity is not statistically measurable: no sound tool refers to creativity. To sum up, it must be said that the creative concepts often have an economic justification for enlarging the cultural sectors to other sectors, which is not the objective of a statistical framework on culture. When key harmonized data on culture are already missing for Europe (no data on performing or visual arts, no data on non-market sector etc.) ESSnet-Culture´s goal is to above all bring the present situation to light and to propose practical and clear solutions. ESSnet–Culture recommends strongly when speaking about cultural and creative industries, to clearly mention the sectors that are covered, so that the scope is clearly indicated for the sake of comparability. The absence of hierarchy among cultural domains and the creation-based feature allows the display of a clear and sound framework and avoids the risks of drowning culture in any other sector. Moreover, it is compatible with future updating, with future inclusions of new cultural domains. The inclusion of cultural activities requires artistic creation and cultural values as the dominant components. That being said, visual matrices are used to present the whole ESSnet-Culture framework with its different dimensions:
the 1st layer describes the primary cultural activities based on the six functions;
(12) See part II, ‘Concepts of creative industries and creative economies: what are the issues?’ (13) The term ‘industry’ can refer either to an economic sector (the production of an economic good, either material or a service, within an economy) or to the manufacturing activity generating reproducible goods.

ESSnet‐CultureFinalReport
- 47-
other layers describe other cultural dimensions, allowing taking into account needs for specific analyses of culture from an economic and a social point of view: the employment dimension, the financing dimension, the consumption and the social dimension (cultural practices and participation).
All dimensions cover the common basis - the ten cultural domains - and they capture all aspects of the ESSnet-Culture framework. However they should be separated as they use different tools for being measured (specific statistical classifications, ad-hoc terminology and instruments or surveys etc.). Indeed, to propose and produce indicators on financing, the breakdown by domains may not be adequate (other approaches are more appropriate, by operator for instance - see Task Force 2 on financing). The same happens with cultural participation and practices where domains represent the general scope on which practices take place but that are not significant for producing relevant measure on that matter (see Task Force 4 and the distinction by visits, uses and practices as leisure and amateur practices, for instance).
Figure 3 – ESSnet-Culture framework: the different dimensions of culture

ESSnet‐CultureFinalReport
- 48-
The first layer therefore consists of the general theoretical cultural activities based on the ten domains and six functions. This first layer represents the economic activities of the framework on culture as domains crossed with functions enable, in a second step, the correspondence with statistical economic activities.
Figure 4 – ESSnet-Culture framework: cultural activities
N.B.: This visual matrix of culture is of course a digest representation whose aim is to give a general view of the system. It is, however, not possible to list all the cultural activities in that layout. For a detailed list of cultural
activities, further tables are presented. The 10 cultural domains are divided into sub-domains when it is appropriate to specify them for practical reasons (already recognized divisions in the LEG-Culture framework, usual divisions of sectors, existence of specific codes from the statistical classifications). All the domains and their sub-domains are equally placed on the matrix. The creation function is reaffirmed as central for the framework on culture, both with its position at the centre of the matrix and its darker colour. Functions are in sequence: Creation

ESSnet‐CultureFinalReport
- 49-
is followed by Production-Publishing and then by Dissemination-Trade, this triangle function forms the dynamic for the three other functions that support them: Preservation, Education and Management-Regulation. From Creation to Education-Training-Management, the colours become lighter. Only cultural activities are to be considered in the framework on culture, this is why some junctions of domains/functions remain blank:
o in advertising, only the creation of original advertising design is considered as cultural, thus the production of advertising is not represented in the matrix (production of campaigns, marketing etc.) as it is not considered as cultural. The preservation activities of advertising are also left blank, the reason being that they do not really exist in the advertising domain but are often included within graphical arts;
o in architecture, production is neither cultural;
o it also occurs with creation for heritage, archives or libraries for which the creation functions are scarce whereas their inherent status conveys them towards preservation and safeguarding. The constitutions of collection for museums or for archives are closer to a production activity.
Finally, the importance of new technologies are assessed by the stripes on each cell: whether it be for creation and production which uses digital devices, the internet medium, the social networks etc., for dissemination with the digital outlets or virtual museums, for preservation with digitization of all cultural products, for education with e-learning etc.
3.3. Delimitation of the framework for cultural statistical
The decision to include or exclude some cultural activities in/from de framework causes restrictions. This may appear dissatisfying but the limits are mainly intrinsic with classifications and availability of data, leading to restrict the content of the statistical framework. As said before, preparation for the production of comparable data was the main objective of the ESSnet-Culture. For this to be achieved, the ESSnet-Culture framework adopted a minimal but solid and realistic approach based on common standards and existing classifications among which the economic one - NACE - predominates as it is the most commonly used. The main new inclusions, compared with the previous LEG-Culture framework, concern the domains of advertising and of arts and crafts, as well as the function of management & regulation.
o Intangible cultural heritage (which encompasses languages and all living expressions and traditions): The activities of the intangible cultural heritage are not mapped as ‘domain’ or as ‘function’ for several reasons: intangible heritage above all fits as an economic activity linked with preservation (‘inherited from our ancestors and that have to be transmitted to our descendants’). Its attachment to the heritage domain neither means that intangible cultural heritage only affects one kind of activities nor that it is dead. Just like museums exist on all kinds of sciences and include contemporary art. Most of all, the difficulties for measuring intangible

ESSnet‐CultureFinalReport
- 50-
heritage under all functions and all domains lead to a focus on practical proposals(14) (see also the chapter on intangible cultural heritage, partII).
o A specific inclusion concerns social networking and podcasting: An approach in cultural practices and social participation better suits than a quantification under economic activities.
o Some sectors are not considered in the framework of cultural activities but their related professions can be considered (as partly cultural) under a cultural employment approach (e.g., web and multimedia developers).
As to the exclusions, they are firstly justified by the fact that the framework, besides its symbolic focus on the cultural field, has to be practical (measurable) and sufficiently useful for producing comparable European data. While there is a lack of harmonized data even in several core domains (see Heritage, Visual Arts, Performing Arts, Art Crafts), it would be a challenge to develop a methodology for estimates on new subjects and define an EU quality aggregate. The ESSnet-Culture framework for cultural statistics excluded some activities bearing in mind the primary criteria used for defining cultural activity (artistic and cultural expressions and values) as well as the need for quality and availability of data (within statistical classifications). In order to settle a common and coherent European list of cultural activities, borders had to be fixed.
In general, manufacturing is not a cultural activity in itself but an industrial one that benefits from culture (as regards some cultural industrial businesses of reproducible goods such as books, press, audiovisual recordings). The decision to exclude the activity of manufacturing of ancillary products (equipment in general, computers, cameras, TV etc.) and also the one useful for creating/producing cultural goods (goods that are not at the core of the cultural domain but ancillary to it, such as tints for painters or cameras for photographs etc., they may either be professional tools or leisure equipment) was due to the impossibilities of measuring them from a cultural angle. What is the cultural relevancy of such products?
Printing activities were also questioned: they are upstream industrial activities that occur for the primary production of cultural goods but they are not cultural activities in their own right. Moreover, it is not statistically possible to estimate the cultural part in these activities (see the NACE code 18.12 ‘Other printing’ that includes printing of magazines and books along printing of maps, advertising catalogues, prospectuses, albums, calendars, personal stationery etc. or printing directly onto textiles, plastic etc.). Reproduction activities are not cultural activities in themselves as only production of original material are considered as cultural activities. This fact is also observed by the 2009 UNESCO framework which states ‘Printing is not normally included in cultural classifications, or in definitions of cultural industries, and is not a cultural activity in its own right. However, according to the production cycle model, printing would be included as part of the production function of the publishing industry. In this way, the FCS includes printing activities that have a predominantly cultural end use. The difficulty arises when attempting to distinguish
(14) The 2009 UNESCO Framework also acknowledges the difficulties in measuring intangible heritage and the need to develop new instruments.

ESSnet‐CultureFinalReport
- 51-
between these printing activities using the existing statistical classification systems’ (2009 FCS, p.27). On the basis of that statement, the manufacturing of cultural products in their strict sense: the activities for the mass production of primary cultural products such as the printing of books and press, the reproduction of recorded media and the manufacture of musical instruments were considered within the ESSnet-Culture framework and they were added as related cultural activities.
General system software or applications software activities: They are broader than cultural and artistic activities. The software industry and computer economy is a sector with high economic importance but it can not be treated as a cultural sector.
Information activities (telecommunications) are excluded for the same reasons. These sectors are new fields of activities that are rather attached to the concept of creative industries which gives, as said above, a larger vision of the economy taking into account new technologies and computers. To quote the 2009 UNESCO framework: ‘While many interactive media products and services have a cultural end use (computer and video games, interactive web and mobile content), the same cannot be said for the software industry’ (2009 FCS, p.25).
Leisure activities (games, entertainment activities, gambling etc.) are not cultural activities but firstly leisure ones. Recreational activities and products (among which amusement parks, gambling activities, toys) are not to be considered as cultural for their very rare cultural/artistic content.
In the UNESCO 2007 draft cultural framework paper, on the 14 international frameworks reviewed, only five included gambling and visitor attractions (Australia, New Zealand, Taiwan, Finland and the United Kingdom) and only two included toys and games (Colombia and World Intellectual Property Organization).
Cultural tourism: there is no clear definition of it and even less a statistical one. It is not an identifiable activity but rather a grouping of several cultural experiences that visitors may get: it may be regarded within heritage, performing arts and cultural participation (visits of museums and cultural sites, attendance of performance etc.).
Natural reserves, zoos or botanical gardens are also considered as non-cultural domains. Nature is a sector in its own and the preservation of fauna and flora is far from the cultural creation.
Manufacturing of ornamental products (ceramics, jewelry etc.) are not included in cultural domains because only original art crafts are cultural ones.
Some activities were not listed in the framework of cultural activities because their whole content and its attached meaning often go beyond cultural values; moreover they are often difficult to collect and quantify. Nonetheless they are considered with regards to their detailed activities.
- Research in general, which is more connected to research than to culture (even if the two are not exclusive) is not included, apart from applied technical research (necessary for archaeology).
- Education in general has a scope too large and is not relevant. Cultural education, however, should be included (even if it can hardly be identified in statistics).

ESSnet‐CultureFinalReport
- 52-
- Activities of membership organizations in general exceed culture but services provided by cultural and recreational associations are relevant.
Table 1 – ESSnet-Culture framework for cultural statistics: cultural activities by fonction
CR
EA
TIO
N
PR
OD
UC
TIO
N
/ P
UB
LIS
HIN
G
DIS
SEM
INA
TIO
N
/ T
RA
DE
PR
ESE
RV
AT
ION
ED
UC
AT
ION
MA
NA
GE
ME
NT
/
RE
GU
LA
TIO
N
HERITAGE
-Museums
-Historical places
-Archeological sites
-Museums sciences activities (constitution of collections) -Recognition of historical heritage
-Museums exhibitions
-Museography and scenography activities
-Art galleries activities (incl. e-commerce) -Trade of antiquities (incl. e-commerce)
-Operation activities for historical sites -Preservation of intangible cultural heritage - Restoring of museums collections
- Restoring of protected monuments -Archeological activities -Applied research and technical preservation activities
-Formal and non formal: artistical, cultural teaching activities
-Administrative management (State, local or other bodies)
ARCHIVES -Acquisition of
documents -Consultation of archives
-Archives exhibitions
-Archiving activities (incl. Digitization)
-Formal and non formal: artistical, cultural teaching activities
-Administrative management (State, local or other bodies)
LIBRARIES -Acquisition and
organizations of collections
-Lending activities -Preservation activities
-Formal and non formal: artistical, cultural teaching activities
-Administrative management (State, local or other bodies)
BOOKS & PRESS -Creation of literary works
-Writing of cultural articles for newspapers and periodicals
-Translation and interpretation activities
-Publishing of books (incl. by Internet)
-Publishing of newspapers and magazines (incl. by Internet)
-News agency activities
-Organization of book conventions and event-organizing activities, promoting services -Galleries & other temporary exhibitions -Trade of books an press (incl. e-commerce)
-Protection activities for books and newspapers -Restoring of books
-Formal and non formal: artistical cultural teaching activities
-Supporting activities for managing rights and royalties -Administrative management (State, local or other bodies) -Artistic agents and engagement agencies
VISUAL ARTS
-Plastic/Fine arts
-Photography
-Design
-Creation of graphical & plastic art works -Creation of photographical works -Design creation
-Production of visual art works -Publishing of photographical works
-Organization of visual arts conventions and event-organising activities
-Galleries & other temporary exhibitions
-Trade of visual arts works/Art market (incl. e-commerce)
-Protection activities for visual arts works -Restoring of visual arts
-Formal and non formal: artistical, cultural teaching activities
-Supporting activities for managing rights and royalties
- Administrative management (State, local or other bodies)
PERFORMING ARTS
-Creation of musical, choreographic,
-Performing arts production & organization
-Live presentation activities -Booking services
-Restoring of musical instruments
-Formal and non formal: artistical,
-Supporting activities for managing rights

ESSnet‐CultureFinalReport
- 53-
-Music
-Dance
-Drama
-Circus
-Cabaret
-Combined arts
-Other live shows
lyrical, dramatic works and other shows -Creation of technical settings for live performance
-Support and technical activities for producing live performance
cultural teaching activities
and royalties -Administrative management (State, local or other bodies) -Artistic agents and engagement agencies
AUDIOVISUAL & MULTIMEDIA
-Film
-Radio
-Television
-Video
-Sound recordings
-Multimedia works (incl. videogames)
-Creation of audiovisual works
-Creation of multimedia works
-Motion picture, video and audiovisual programme production -Television programme production (incl. Internet) -Publishing of sound recordings, films, videotapes (incl. by the internet)
-Publishing of multimedia works -Publishing of computer games
-Radio programme production
-Audiovisual post-production activities
-Organization of film/video conventions and event-organising activities -Radio and TV broadcasting
(incl. by internet) -Film projection
-Film/video distribution
-Renting of video tapes and disks -Trade of audiovisual works (incl. e-commerce)
-Temporary audiovisual exhibitions
-Protection activities for audiovisual and multimedia works
-Restoring of audiovisual and multimedia works
-Formal and non formal: artistical, cultural teaching activities
-Supporting activities for managing rights and royalties
-Administrative management (State, local or other bodies) -Artistic agents and engagement agencies
ARCHITECTURE -Architectural creation
-Temporary architectural exhibitions
-Galleries exhibitions
-Architectural preserving activities
-Formal and non formal: artistical, cultural teaching activities
-Administrative management (State, local or other bodies)
-Supporting activities for managing rights and royalties
ADVERTISING -Creation of advertising works
-Distribution of advertising designs
-Formal and non formal: artistical, cultural teaching activities
-Supporting activities for managing rights and royalties
ART CRAFTS -Artistic crafts creation
-Production of artistic craft
-Artistic craft exhibitions and trade (incl. e-commerce)
-Restoring of art crafts
-Formal and non formal: artistical, cultural teaching activities
-Administrative management (State, local or other bodies)

ESSnet‐CultureFinalReport
- 54-
Comparison of UNESCO framework and European framework
If every cultural activity of the ESSnet-Culture framework matches the ones of the 2009 FCS, the UNESCO framework is largest because it has to correspond to worldwide issues. ‘This new framework aims to be flexible and not prescriptive, but promotes comparability. The FCS intends to help countries build their own cultural framework by selecting the major domains that form part of their cultural statistics. In addition, each country, by adopting the relevant FCS definitions by domain, will permit the international comparability of their own data’ (2009 FCS).
Figure 5 – Comparison of cultural domains covered by European and UNESCO frameworks for cultural statistics
LEG-Culture ESSnet-Culture UNESCO, 2009 FCS
o Historical monuments o Museums o Archeological sites o Archives o Libraries o Books & Press o News agencies o Visual arts (incl. design) o Photography o Architecture o Performing arts o Films o Radio o Television o Video o Audio records o Multimedia
+
+
Advertising Art crafts Intangible heritage
Natural heritage Craft in general Software industry and
telecommunications activities General printing activities Equipment and supporting
material Tourism Sport and Recreation

ESSnet‐CultureFinalReport
- 55-
3.4. Definitions of key concepts of the ESSnet-Culture framework
The ESSnet-Culture framework rests on three key concepts which together structure is:
o cultural domain o function o dimension
The CULTURAL DOMAIN consists of a set of practices, activities or cultural products centred around a group of expressions recognized as artistic ones. The cultural domains are common to each dimension studied (economic, social etc.).
Ten cultural domains are proposed.
o Heritage o Archives o Libraries o Book & Press o Visuals Arts o Performing Arts o Audiovisual & Multimedia o Architecture o Advertising o Art crafts
The FUNCTIONS used for the general ESSnet-Culture framework for cultural statistics are the main functions considered for mapping cultural activities and identifiable with existing economic and statistical classifications. The functions are sequenced functions (from creation to dissemination, along with training or support functions) but, as already said before, they do not aim at representing the whole economic cycle. They follow an economic approach and a practical one simultaneously, with the final objective being the production of sound cultural data. Functions are connected with domains so as to define cultural activities. Six functions are proposed.
Creation: the function of creation concerns the activities related to the elaboration of artistic ideas, contents and original cultural products. In certain cases such as heritage, the creative function is less evident, being more commonly manifested through dissemination. For instance scenography, the art of designing and organizing space for exhibitions or performance, aims at disseminating heritage and arts but is based on creation (the art of matching together volume, objects, colours, light with technical and artistic skills)(15).
Production/Publishing: the production of cultural goods and services relates to activities, which help turn an original work into an available work. Production and publishing are connected to the same stage of the cycle, but production is linked to non-reproducible products when publishing is linked to reproducible ones. Production
(15) The activities of scenography are included into class NACE Rev.2 - 90.02 ‘Support activities to performing arts’.

ESSnet‐CultureFinalReport
- 56-
and publishing involve different formats and methods: the paper edition of a book is a publishing matter; so is the production of electronic books. Sometimes the production function exists in economic statistics but is not considered as a cultural matter, as for example in architecture, a domain in which production is tantamount to the non-cultural activity of construction; the printing activities are also part of the cycle but they are not considered as core cultural activities. Sometimes, the production function is made up of services activities, like the activities necessary for setting up a collection (museums or libraries science).
Dissemination/Trade: the dissemination function corresponds to making created and produced work available; dissemination includes the acts of communicating and broadcasting content so as to make cultural goods and services available to consumers (exhibitions, galleries). It does not operate in the same way as trade activities in which the commercial side is put forward. Cultural trade activities are those, which involve buying cultural products from a third party in order to sell them with no (or very little) transformation. The cultural trade activities are sometimes only partly cultural statistical classes (e.g. the sale of newspapers linked with stationery), sometimes entirely considered as cultural (e.g. the sale of books). Distribution networks are undergoing huge transformations with the advent of electronic trading and on-line trade is included within the concept of cultural activities.
These first three key functions, along with technologically related changes, are not necessarily separate. Thus, the creation and dissemination of a cultural product (music, for example) can be done simultaneously by the same person (whether professional or amateur) and with the same media, the internet being an example in which this action is quite simple.
Preservation: preservation includes all activities that conserve, protect, restore and maintain cultural heritage. Digitization is considered mainly as part of preserving activities, even if it also has a function of dissemination.
Education: education is understood as formal and non-formal education in the field of culture. It allows the development and transfer of skills within recognized cultural activities, as well as an awareness-raising function within cultural domains. Cultural education therefore includes all cultural activities, which can bring together professionals, practicing amateurs and participative citizens/consumers. Formal education in cultural fields can be identified only in statistics on education coming from administrative data sources using the International Standard Classification of Education (ISCED). Unfortunately, it is not possible to distinguish cultural educational activities within formal education in economic statistical classifications as NACE.
Management/Regulation: the management function relates to activities carried out by institutional, public or private organizations whose mission is to offer the means and a favorable environment for cultural activities, operators and spaces. This includes administrative activities and technical support activities to support culture. Regulation is necessary to both encourage cultural activities and to define and confer copyrights.

ESSnet‐CultureFinalReport
- 57-
The DIMENSIONS: other approaches of culture such as the demand side of the cultural cycle or the social functions are called dimensions (they are analysed in specific Task Forces, see following chapters). A dimension refers to a specific approach on culture: economy, employment, consumption, financing, practices and social participation. These dimensions bring into play different tools and have different objectives, and therefore deserve special treatment. Other specific terms or concepts are introduced into European framework for cultural statistics
Cultural activities are understood as all types of activities based on cultural values and/or artistic expressions. Cultural activities include market- or non-market-orientated activities, with or without a commercial meaning and carried out by any type of producers and structure (individuals, organizations, businesses, groups, amateurs or professionals). Cultural activities represent the general conceptual framework, one cultural activity is carried out within a cultural domain and according to the function necessary for its achievement. For the production of data and measurement, cultural activities are described theoretically and then put into correspondence with statistical classifications, mainly economic classifications NACE Rev.2 (2008). Cultural activities described in the framework according to the NACE codes, represent the cultural sector. The cultural sector is therefore made of cultural economic activities. In national accounts, a differentiation exists between market and non-market sectors. Market producers are producers that sell their output at economically significant prices. Non-market producers are producers that provide most of their output to others for free or at prices that are economically insignificant. Moreover, the European System of Accounts (ESA95) provides additional rules for the distinction between market and non-market producers, and the criterion to calculate if sales cover more than 50 % of production costs(16). It is not always possible to distinguish market activities from non-market ones in European sources. Structural Business Statistics (SBS) are supposed to cover only market-oriented enterprises but some evaluation should be done on the implementation of this concept in each EU Member State. In the EU-LFS, there is no possibility to distinguish between the private and the public sector of employment. Moreover, the status of units in national sources may be handled in different ways (for instance, national museums or national theatres may be public institutions with profits for sources of income). Distinction and comparisons are therefore uneasy. Nonetheless the differentiation between market and non-market remains essential as it is used in business registers and systems of accounts and as it covers different structures and types of economic models. The concept of Creative and Cultural Industries (CCIs) is often used by different stakeholders, especially by policy makers (in different fields of economic or social policy) and, in particular when economic data on CCIs are presented. The concept is used in various documents and it is not standardized. It also extends to different realities (creative industries, creative goods, creative economy, creative cities, creative regions, creative class etc.) and covers different cultural sectors in academic documents or national strategies. Starting from a core set of relatively basic cultural fields (heritage and fine arts in general) and broadening it to wider activities (publishing, audiovisual, design, architecture) and peripheral fields
(16) See Eurostat : http://circa.europa.eu/irc/dsis/nfaccount/info/data/esa95/en/een00126.htm

ESSnet‐CultureFinalReport
- 58-
(software, telecommunications, ICT), the CCIs notion often seems generic and broad and does not merely include cultural/artistic creation.
Consider the non-market
According to national contexts, the non-market sector covers very different realities in EU-27, both in terms of legal forms, in terms of links with government or according to the type of activities developed. To start with different terminologies are used in Europe: social economy, third sector, non profit sector etc.(17). Non-market oriented activities are activities carried out by non market producers whose primary motives is to serve members’ needs or a broader public interest instead of maximizing and distributing profits. Non-market oriented structures supply goods or services free or at prices that are not economically significant. Non-market producers may be public institutional units or private structures with legal forms such as non-profit bodies, foundations, associations, co-operatives etc. producing goods and services. Their status either does not permit the unit to be a source of income, profit or other financial gain for itself or for the units that establish, control or finance it. Or their income is not covered at 50 % by their sales and they must rely on funds or subsidies other than receipts from sales to cover their costs of production or other activities. Eventually, private non-profit institutions serve households but economic cultural activities may also be produced by the household economy: households produce for their consumption or for others, outside the production market. As a matter of fact, household activities or volunteering activities and amateurs may also be included in non-market production of cultural goods and services. E.g. when individuals volunteer to support festivals, they produce a non-market labor. Another example is linked with new technologies: citizens, amateurs engaged via social networks (Facebook, Twitter, Youtube etc.) to distribute cultural goods (writings, visual works etc.) act as economic producers. The non-market services provided by general government, by private non-profit institutions or by households are in that sense particularly important in recreational and cultural activities (libraries, public archives, museums, cultural goods in general etc.) and they are included as part of ESSnet-Culture cultural activities(18). However, data collection of non-market cultural services is not harmonized at European level and even barely effective at national levels, unlike market-oriented activities. At international level, the Johns Hopkins Comparative Nonprofit Sector Project (CNP)(19) tried to analyse the scope, structure, financing, and impact of the non-profit activity throughout the world. The project sought to develop a common base of data on this area and asked 28 countries (among which 13 European countries) to participate in a programme on data collection. Edith Archambault presented in 2001 the results of the Johns Hopkins’ programme and continued her research work on the European non-profit sector (that she grouped under four models: German or corporatist, Anglo-Saxon or free-market, Scandinavian or social-democratic, and Mediterranean or emerging)(20).
(17) See sources: - Social economy in Europe (http://www.socialeconomy.eu.org/spip.php?rubrique171); - CEDAG- European Council for Non-profit organisations (http://www.cedag-eu.org); - The Johns Hopkins Comparative Nonprofit Sector Project. (http://www.ccss.jhu.edu/index.php?section=content&view=9&sub=3) (18) Their statistical identification is possible either by 2008 CPA codes (94.99.16 Services provided by cultural and recreational associations, linked with NACE Rev.2 class 94.99 Services furnished by other membership organisations n.e.c.), either by the legal status of the units (such as publicly-owned enterprises, co-operatives, non profit bodies, sole proprietorship). (19) CNP Methodology and data sources : http://www.ccss.jhu.edu/pdfs/CNP/CNP_Methodology.pdf (20) E. Archambault, ‘Is there a European model of the non-profit sector?’ (2001), ‘The Third sector in Europe: Does it exhibit a converging movement?’ (2008), on EePEc (Research Papers in Economics, http://ideas.repec.org/e/par141.html).

ESSnet‐CultureFinalReport
- 59-
Not only the notion of ‘creativity’ can not be statistically measured but also the notion of ‘industries’ has different meanings, ESSnet-Culture strongly recommends when speaking about creative and cultural industries, to clearly mention the sectors that are covered.
4. The measuring of cultural activities within activities included in statistical classifications
To fulfill the objective of collecting reliable data for the production of comparable results, it is necessary to rely on operational tools: measurement must be as objective as possible, thus allowing comparisons between Member States as well as assessment of culture for decisions-makers.
Figure 6 – The statistical scope in terms of classifications and statistical sources of the framework for cultural statisitics
TF1 proposed to link cultural activities of the ESSnet-Culture framework with economic statistical activities, primarily using the Statistical Classification of Economic Activities in the European Community (NACE), the standard classification used in harmonised EU surveys. As already stated, this is also the approach taken by UNESCO in the scope of its new cultural field in 2009. NACE is the standard tool for both organising and standardising information, a common language which is moreover used in non-statistical domains such as social and fiscal regulation, tariff systems, trade agreements etc. Moreover, NACE acts as a blueprint for the International Standard Industrial Classification of All Economic Activities (ISIC), with NACE being locally adapted for Member States’ own national classification systems. The study of national classification systems is interesting

ESSnet‐CultureFinalReport
- 60-
insomuch as it reveals how more detailed content allows better observation of cultural activities. NACE’s inherent economic statistical unit (enterprise and institutional units) does not hinder social observation (the individual, whether engaged in ‘amateur’ practice or the consumption of goods; see Task Force 2 for indicators on consumption and Task Force 4 for social indicators and cultural practices). Moreover, taking the NACE approach does not mean examining the issue purely from the point of view of legal status: the inclusion of voluntary, non-market and institutional bodies is linked to survey methodologies (sampling, selecting variables such as legal status) and not to statistical activities. The NACE classification was revised in 2008: the new NACE Rev.2 gives greater visibility to the activities of information and communication as well as those of cultural services. Culture benefits from these improvements, for example with the new activities included in the NACE Rev.2: design, editing, computer games, cultural education and also by distinguishing activities previously embedded in groups (museums, sites and monuments; creation in visual arts, support to performing arts). Cultural sectors are better taken into account, in particular with the creation of the new section J - Information and Communication that gathers Publishing activities (division 58), including software publishing, Motion picture and sound recording activities (division 59), Radio and TV broadcasting and programming activities (division 60) and Other information service activities (division 63). Telecommunications and Information technology activities (division 61 and 62) are not included in the ESSnet framework on culture. Another section, R – Arts, entertainment and recreation services, comprises major cultural activities linked with arts and heritage: Creative, arts and entertainment activities (division 90) and Libraries, archives, museums and other cultural activities (division 91). The section M – Professional, scientific and technical activities is also related to culture by 3 divisions: Architectural and engineering activities; technical testing and analysis (division 71), Advertising and market research (division 73) and Other professional, scientific and technical activities (division 74). Other classifications are also useful for picking out cultural activities, the first one being the products classification directly connected to NACE - the Statistical Classification of Products by Activity in the European Economic Community (CPA). Furthermore, cultural activities can be measured by the occupations of those who perform them. The International Standard Classification of Occupations (ISCO) is thus the second central classification system used for describing culture. Other thematic approaches are possible with the use of specific classifications: foreign trade with the Combined Nomenclature (CN), consumption with the Classification of Individual Consumption by Purpose Adapted to the Needs of Harmonized Indices of Consumer Prices, (COICOP/HICP) etc. Other aspects would need to be complemented: it would be interesting to use the intellectual property rights that are a genuine component of cultural sectors. However the lack of European methodological tools, the fact that few sources exist on that subject, except data produced by the World Intellectual Property Organization (WIPO) but on a limited cultural scope(21), lead to recommend further analyses of that point. For instance, future projects could
(21) The WIPO database contains data on patents, utility models, trademarks, industrial designs and microorganisms. No results on copyrights are available at present time. The WIPO Standing Committee on Copyright and Related Rights (SCCRR) is presently working on discussing issues such as limitations and exceptions, the protection of audiovisual performances and the protection of broadcasting organizations, the improvement of data collection on ‘creative products’ (original symbolic products). See http://www.wipo.int/copyright/en

ESSnet‐CultureFinalReport
- 61-
be organised in cooperation with WIPO to consider the coverage of all cultural domains, based on the ESSnet framework. Unfortunately, statistical classifications often prevent cultural activities from being precisely measured (grouping of activities prevent specific distinction of cultural activities). Non-market and social cultural activities are not included in main harmonized surveys. Economic classifications do not include social activities, however they allow the comparison of cultural activities with other activities of the whole economy and to present many important data on culture. When juxtaposing cultural activities with statistical activities, it shows that most theoretical activities are scattered in several NACE classes. Furthermore, a single NACE class may cover not only cultural activities but also non cultural ones. There are few pure conformities between a cultural theoretical activity and its NACE class, even at detailed levels (4-digit): publishing of books (58.11); publishing of newspapers (58.13); publishing of periodicals (58.14); publishing of computer games (58.21); post-production activities (59.12); motion picture projection activities (59.14); live presentations facilities (90.04). The other 4-digit NACE classes usually mix several cultural activities or functions: both the cultural activities of ‘Creation of plastic art works’ and ‘Creation of literary works’ cannot be strictly identified for they are gathered in the same NACE class (90.03) (see Annex 2 - Correspondence table of cultural activities with NACE Rev.2 classes by function). National expansions, on the contrary, improve the spotting of cultural activities as they use a more detailed level (e.g., Germany measures activities of composers, of visual artists, of writers; Italy details design; etc.). At European level, numbers of digits are therefore to be taken into consideration for cultural activities: when the 4-digit NACE class ‘Architectural activities’ (71.11) addresses the cultural activity of ‘Architectural creation’, the 3-digit division ‘Architectural and engineering activities and related technical consultancy’ (71.1) is too large as it also includes non cultural activities of engineering. After analysis of several sections of the NACE Rev.2, 29 4-digit classes are acceptable to collect European economic data on cultural activities, among which 22 are entirely cultural in content while 7 others exceed culture (see Table 2 - Cultural domains by statistical activities, NACE Rev2). The 22 NACE classes (at 4-digit) considered as entirely cultural are following: book publishing (58.11); publishing of newspapers (58.13); publishing of journals and periodicals (58.14); publishing of computer games (58.21); motion picture, video and television programme production activities (59.11); motion picture, video and television programme post-production activities (59.12); motion picture, video and television programme distribution activities (59.13); motion picture projection activities (59.14); sound recording and music publishing activities (59.20); radio broadcasting (60.10); television programming and broadcasting activities (60.20); news agency activities (63.91); architectural activities (71.11); specialised design activities (74.10); cultural education (85.52); performing arts (90.01); support activities to performing arts (90.02); artistic creation (90.03); operation of arts facilities (90.04); library and archives activities (91.01); museums activities (91.02); operation of historical sites and buildings and similar visitor attractions (91.03). The partly cultural activities at 4-digit level of the NACE classes, for example 73.11 – Advertising (for which only creation is considered) or 74.20 - Photographic activities (which includes not only photographic creation and production but also film processing, photo laboratories etc.) require estimates to distinguish the relevant cultural part for producing data on culture.

ESSnet‐CultureFinalReport
- 62-
At 3-digit level, only six NACE Rev.2 groups cover entirely cultural activites: Creative, arts and entertainment activities (90.0), Specialised design activities (74.1), Motion picture, video and television programme activities (59.1), Sound recording and music publishing activities (59.2), Radio broadcasting (60.1), Television programming and broadcasting activities (60.2). The other ones are only ‘partly’ cultural because their description covers activities that are not included in the ESSnet framework: for example, the 58.2 group ‘Software publishing’ covers not only the publishing of computer games, but other software publishing that are not kept for the ESSnet framework on cultural statistics. When looking at figures of annual detailed enterprise statistics for services in 2008 (NACE Rev.2, 2008, SBS source), the proportion of German entreprises publishing computer games (58.21) represent 34% of the whole software publishing (58.2) while this proportion is of 10% in the United Kingdom, 4% in Italy and 2% in Poland. Another example to illustrate the difference between NACE 4-digit level as compared to the 3-digit level is given for architecture: architectural activities (71.11) are numbered by 292 082 firms in EU-27, which represent 34% of firms in the whole EU-27 architectural and engineering activities and related technical consultancy (71.1) and 17% in terms of turnover. This average hides very different realities from one country to another: in Belgium architectural activities account for 74% of the number of firms and 40% of turnover of all architectural and engineering activities and related technical consultancy; in Spain these figures are respectively 57% and 22% while in Sweden they are 11% and 8%. At 2-digit level, only three divisions of the NACE Rev.2 are entirely cultural: 59- Motion picture, video and television programme production, sound recording and music publishing activities, 60- Programming and broadcasting activities and 90- Creative, arts and entertainment activities. In order to maintain the best relevance and accuracy of the framework for cultural statistics, the conceptual ESSnet framework was elaborated at the more detailed level of NACE Rev.2, the 4-digit level: this is the prerequisite to produce relevant data on cultural activities. At a more aggregated level (3-digit), figures would cover e.g. activities of botanical and zoological gardens, publishing of directories and mailing lists, films processing, engineering activities, software publishing, market research and placement of advertising campaigns. ESSnet acknowledges the fact that sample size in national surveys and excessive burden on national statistical institutions do not allow them to focus their surveys on cultural activities which are, it has to be said, not considered as priorities. Methodologies for allocating the right estimate of cultural content are quite difficult to implement due to the lack of data. Furthermore we notice that some theoretical cultural activities cannot be statistically picked out from the NACE classes but can be distinguished from the products classifications by activity (CPA 2008), the common European classification for the comparison of statistical data on products (goods and services) whose structure (6-digit numerical level) is more detailed than the NACE stucture. The CPA is also more interesting for an approach on branches, as well as on trade as it is linked with the Harmonized System (HS) and Combined Nomenclature (CN) classifications. This approach of the CPA led to stamp a rank at the NACE classes: ‘cultural’ or ‘not cultural’ ranks attached to the 4-digit NACE classes are deducted at the same time from the content of statistical activities (see the previous list of Cultural domains by statistical activities) and from the choices to exclude activities from a cultural framework. The content of each 4-digit NACE class and its detailed 6-digit CPA codes were analysed and 3 cultural ranks were proposed: ‘Totally/Mainly/Partly cultural’ (see Annex 1 - NACE Rev.2 economic activities and their cultural rank). The concept is based on the fact that a NACE class may include a greater or lesser proportion of theoretical cultural content (i.e.: theoretical cultural activities
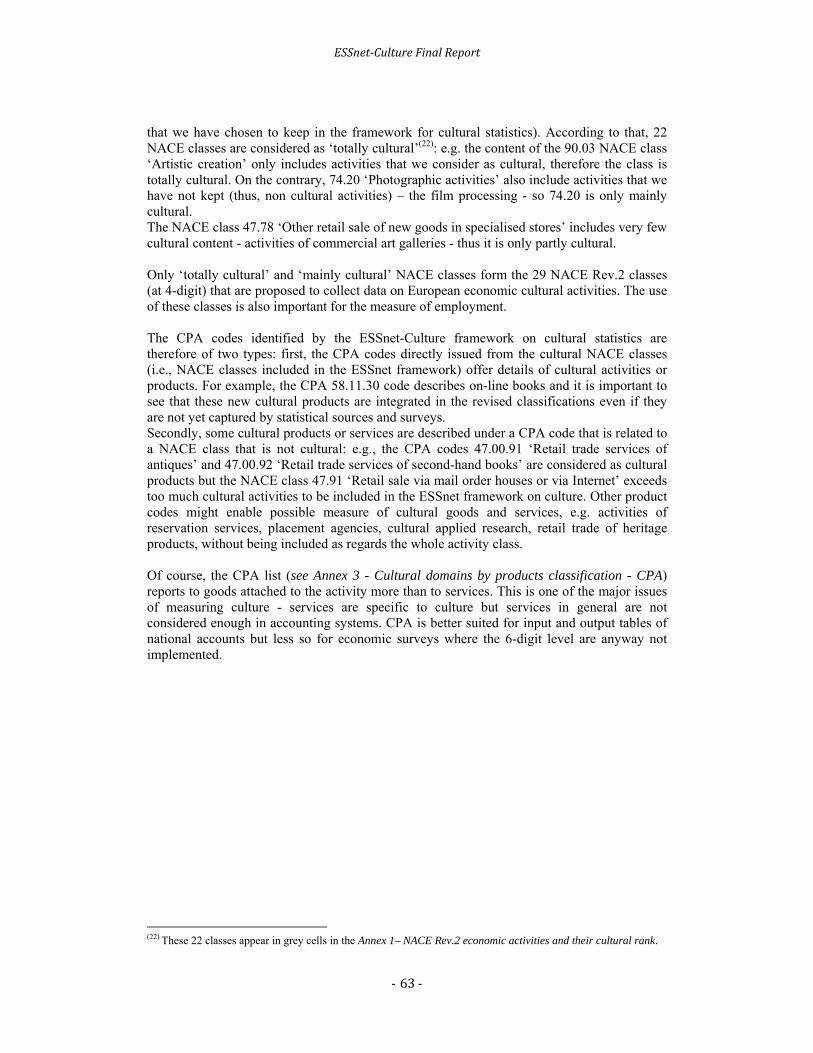
ESSnet‐CultureFinalReport
- 63-
that we have chosen to keep in the framework for cultural statistics). According to that, 22 NACE classes are considered as ‘totally cultural’(22): e.g. the content of the 90.03 NACE class ‘Artistic creation’ only includes activities that we consider as cultural, therefore the class is totally cultural. On the contrary, 74.20 ‘Photographic activities’ also include activities that we have not kept (thus, non cultural activities) – the film processing - so 74.20 is only mainly cultural. The NACE class 47.78 ‘Other retail sale of new goods in specialised stores’ includes very few cultural content - activities of commercial art galleries - thus it is only partly cultural. Only ‘totally cultural’ and ‘mainly cultural’ NACE classes form the 29 NACE Rev.2 classes (at 4-digit) that are proposed to collect data on European economic cultural activities. The use of these classes is also important for the measure of employment. The CPA codes identified by the ESSnet-Culture framework on cultural statistics are therefore of two types: first, the CPA codes directly issued from the cultural NACE classes (i.e., NACE classes included in the ESSnet framework) offer details of cultural activities or products. For example, the CPA 58.11.30 code describes on-line books and it is important to see that these new cultural products are integrated in the revised classifications even if they are not yet captured by statistical sources and surveys. Secondly, some cultural products or services are described under a CPA code that is related to a NACE class that is not cultural: e.g., the CPA codes 47.00.91 ‘Retail trade services of antiques’ and 47.00.92 ‘Retail trade services of second-hand books’ are considered as cultural products but the NACE class 47.91 ‘Retail sale via mail order houses or via Internet’ exceeds too much cultural activities to be included in the ESSnet framework on culture. Other product codes might enable possible measure of cultural goods and services, e.g. activities of reservation services, placement agencies, cultural applied research, retail trade of heritage products, without being included as regards the whole activity class. Of course, the CPA list (see Annex 3 - Cultural domains by products classification - CPA) reports to goods attached to the activity more than to services. This is one of the major issues of measuring culture - services are specific to culture but services in general are not considered enough in accounting systems. CPA is better suited for input and output tables of national accounts but less so for economic surveys where the 6-digit level are anyway not implemented.
(22) These 22 classes appear in grey cells in the Annex 1– NACE Rev.2 economic activities and their cultural rank.

ESSnet‐CultureFinalReport
- 64-
Table 2 – Cultural domains by economic activities, NACE Rev.2
Cultural domain
NACE 2008 Section
NACE 2008 Group
NACE 2008 Class
NACE Class Label
Content Comments
HERITAGE ARCHIVES LIBRARIES
R Arts, entertainment and recreation services
910p 9101 Library and archives activities
This class includes: documentation and information activities of libraries of all kinds, reading, listening and viewing rooms, public archives providing service to the general public or to a special clientele, such as students, scientists, staff, members as well as operation of government archives: organisation of a collection, whether specialised or
not cataloguing collections lending and storage of books, maps, periodicals,
films, records, tapes, works of art etc. retrieval activities in order to comply with
information requests etc. stock photo and movie libraries and services
Excl. 9104 Botanical and zoological gardens, nature reserves.
9102 Museums activities
This class includes: operation of museums of all kinds: art museums, museums of jewellery, furniture,
costumes, ceramics, silverware natural history, science and technological museums,
historical museums, including military museums other specialised museums open-air museums
9103 Operation of historical sites and buildings and similar visitor attractions
This class includes: operation and preservation of historical sites and buildings.
BOOKS & PRESS
J Information and Communication
581p 5811 Book publishing
This class includes the activities of publishing of books in print, electronic (CD, electronic displays etc.) or audio form or on the Internet. Included are: publishing of books, brochures, leaflets and similar publications, including publishing of dictionaries and encyclopaedias publishing of atlases, maps and charts publishing of audio books publishing of encyclopaedias etc. on CD-ROM
Excl. 5812 Publishing of directories and mailing lists. Excl. 5819 Other publishing activities.
5813 Publishing of newspapers
This class includes the publishing of newspapers, including advertising newspapers, appearing at least four times a week. Publishing can be done in print or electronic form, including on the Internet.
5814 Publishing of journals and periodicals
This class includes the publishing of periodicals and other journals, appearing less than four times a week. Publishing can be done in print or electronic form, including on the Internet. Publishing of radio and television schedules is included here.
639p 6391 News agency activities
This class includes: news syndicate and news agency activities furnishing news, pictures and features to the media.
6391 concerns both the Books and Press domain and the Audiovisual one. Excl. 6399 Other information service activities n.e.c..
G Wholesale and Retail trade; Repair of motor vehicles and motorcycles
476p
4761p Retail sale of books in specialised stores
This class includes retail sale of books of all kinds. Excl. Recreation goods of: 47.64 Sporting equipment; and 47.65 Games and toys 4762p Retail sale of
newspapers and stationery in specialised stores
This class also includes: Retail trade services of newspapers and magazines, and also: retail sale of office supplies such as pens, pencils, paper etc.

ESSnet‐CultureFinalReport
- 65-
M Professional, Scientific and Technical activities
743p 7430p Translation and interpretation activities
Translation and interpretation activities Translation and interpretation activities are grouped: interpretation activities apply to all cultural domains.
VISUAL ARTS R Arts, entertainment and recreation services
900 9003 Artistic creation This class includes: activities of individual artists such as sculptors, painters, cartoonists, engravers, etchers etc. activities of individual writers, for all subjects including fictional writing, technical writing etc. activities of independent journalists restoring of works of art such as paintings etc.
Includes artistic originals; Includes museum type restoration. 9003 marginally also concern Books and Press (writers and journalists).
M Professional, Scientific and Technical activities
742p 7420p Photographic activities
This class includes: commercial and consumer photograph production: portrait photography for passports, schools,
weddings etc. photography for commercials, publishers, fashion,
real estate or tourism purposes aerial photography videotaping of events: weddings, meetings etc.
film processing: developing, printing and enlarging from client-taken
negatives or cine-films film developing and photo printing laboratories one hour photo shops (not part of camera stores) mounting of slides copying and restoring or transparency retouching in
connection with photographs
activities of photojournalists
Film processing activities, plates and films are not cutural activities (CPA level 74.20.1x, 74.20.31).
741 7410 Specialised design activities
This class includes: fashion design related to textiles, wearing apparel, shoes, jewellery, furniture and other interior decoration and other fashion goods as well as other personal or household goods industrial design, i.e. creating and developing designs and specifications that optimise the use, value and appearance of products, including the determination of the materials, mechanism, shape, colour and surface finishes of the product, taking into consideration human characteristics and needs, safety, market appeal in distribution, use and maintenance activities of graphic designers activities of interior decorators
ARCHITECTURE M Professional, Scientific and Technical activities
711p 7111 Architectural activities
This class includes: architectural consulting activities: building design and drafting town and city planning and landscape architecture
Excl. 7112 Engineering activities and related technical consultancy.
PERFORMING ARTS
R Arts, entertainment and recreation services
900
9001 Performing arts This class includes: production of live theatrical presentations, concerts and opera or dance productions and other stage productions: activities of groups, circuses or companies,
orchestras or bands activities of individual artists such as actors, dancers,
musicians, lecturers or speakers
9001 marginally also concerns Audiovisual (television presenters).
9002 Support activities to performing arts
This class includes: support activities to performing arts for production of live theatrical presentations, concerts and opera or dance productions and other stage productions: activities of directors, producers, stage-set designers
and builders, scene shifters, lighting engineers etc. This item also includes: activities of producers or entrepreneurs of arts live events, with or without facilities.
Includes management services for rights attached to artistic, literary, musical works (CPA 90.02.19).

ESSnet‐CultureFinalReport
- 66-
9004 Operation of arts facilities
This class includes: operation of concert and theatre halls and other arts facilities.
AUDIOVISUAL & MULTIMEDIA
J Information and communication
591 5911 Motion picture, video and television programme production activities
This class includes: production of motion pictures, videos, television programmes (televisions series, documentaries etc.), or television advertisements.
5912 Motion picture, video and television programme post-production activities
This class includes post-production activities such as editing, film/tape transfers, titling, subtitling, credits, closed captioning, computer-produced graphics, animation and special effects, developing and processing motion picture film, as well as activities of motion picture film laboratories and activities of special laboratories for animated films. This class also includes: activities of stock footage film libraries etc.
5913 Motion picture, video and television programme distribution activities
This class includes: distributing film, video tapes, DVDs and similar productions to motion picture theatres, television networks and stations, and exhibitors. This class also includes: acquiring film, video tape and DVD distribution rights.
5914 Motion picture projection activities
This class includes: activities of motion picture or video tape projection in cinemas, in the open air or in other projection facilities activities of cine-clubs.
582p 5821 Publishing of computer games
This class includes: publishing of computer games for all platforms.
Excl. 5829 Other software publishing.
592 5920 Sound recording and music publishing activities
This class includes the activities of production of original (sound) master recordings, such as tapes, CDs; releasing, promoting and distributing sound recordings to wholesalers, retailers or directly to the public. These activities might be integrated or not with the production of master recordings in the same unit. If not, the unit exercising these activities has to obtain the reproduction and distribution rights to master recordings. This class also includes sound recording service activities in a studio or elsewhere, including the production of taped (i.e. non-live) radio programming.
601 6010 Radio broadcasting
This class includes: activities of broadcasting audio signals through radio broadcasting studios and facilities for the transmission of aural programming to the public, to affiliates or to subscribers This class also includes: activities of radio networks, i.e. assembling and transmitting aural programming to the affiliates or subscribers via over-the-air broadcasts, cable or satellite radio broadcasting activities over the Internet (Internet radio stations) data broadcasting integrated with radio broadcasting
602 6020 Television programming and broadcasting activities
This class includes the creation of a complete television channel programme, from purchased programme components (e.g. movies, documentaries etc.), self produced programme components (e.g. local news, live reports) or a combination thereof. This complete television programme can be either broadcast by the producing unit or produced for transmission by a third party distributor, such as cable companies or satellite television providers. The programming may be of a general or specialised nature (e.g. limited formats such as news, sports, education or youth oriented programming). This class includes programming that is made freely available to users, as well as programming that is available only on a subscription basis. The programming of video-on-

ESSnet‐CultureFinalReport
- 67-
demand channels is also included here. This class also includes data broadcasting integrated with television broadcasting.
AUDIOVISUAL & MULTIMEDIA
G Wholesale and Retail trade; Repair of motor vehicles and motorcycles
476p 4763p Retail sale of music and video recordings in specialised stores
This class includes: retail sale of musical records, audio tapes, compact discs and cassettes retail sale of video tapes and DVDs This class also includes: retail sale of blank tapes and discs.
N Administrative and Support service activities
772p 7722p Renting of video tapes and disks
This class includes: renting of video tapes, records, CDs, DVDs etc.
ADVERTISING M Professional, Scientific and Technical activities
731p 7311p Advertising agencies
This class includes the provision of a full range of advertising services (i.e., through in-house capabilities or subcontracting), including advice, creative services, production of advertising material, and buying. It includes: creation and realisation of advertising campaigns: creating and placing advertising in newspapers,
periodicals, radio, television, the Internet and other media
creating and placing of outdoor advertising, e.g. billboards, panels, bulletins and frames, window dressing, showroom design, car and bus carding etc.
aerial advertising distribution or delivery of advertising material or
samples creation of stands and other display structures and
sites conducting marketing campaigns and other advertising services aimed at attracting and retaining customers promotion of products point-of-sale marketing direct mail advertising marketing consulting
Only the creation of advertising, writing of scenarii and design of campaigns are cultural.
Direct marketing and direct mailing services and other advertising services (73 11 12/19) are not cultural activities.
TRAINING P Education 855p 8552 Cultural education
This class includes provision of instruction in the arts, drama and music. Units giving this type of instructions might be named ‘schools’, ‘studios’, ‘classes’ etc. They provide formally organised instruction, mainly for hobby, recreational or self-development purposes, but such instruction does not lead to a professional diploma, baccalaureate or graduate degree. This class includes: piano teachers and other music instruction art instruction dance instruction and dance studios drama schools (except academic) fine arts schools (except academic) performing arts schools (except academic) photography schools (except commercial)
CULTURAL CLASSES
6 classes 3-digit
22 classe
s 4-digit

ESSnet‐CultureFinalReport
- 68-
5. Recommendations for future European works In conclusion, the Task Force 1 had to define a European framework for cultural statistics (rooted on cultural domains and functions) and achieved to identify a set of minimum statistical activities that can be proposed for producing European data on culture. The specificity of culture was reaffirmed after having gone through the existing economic classifications: culture and the cultural products are often drowned in larger groups and are therefore difficult, if not impossible, to identify. Moreover, culture has integrated many of the new technological assets, whether in its content or in its cycle, and these new changes are still to be integrated in statistics. The main objective being European comparability, TF1 focused on the existing European data sources, and also got to the conclusion that the coverage of cultural domains is too limited in EU harmonized data collections. All these factors lead to a lack of quality data on culture. To allow a better development of the production of cultural statistics, ESSnet-Culture proposes a series of important recommendations for the future. AS REGARDS THE ORGANIZATION
For the further development of cultural statistics, it is important to put in place mechanisms and actions to ensure the continued development of the results and the synergies created by the ESSnet-Culture project.
1) ESSnet-Culture recommends that Eurostat proposes, as soon as possible, a
solid programme of actions and developments in order to rely on the involvement and the expertise of Member States in the future development of European cultural statistics.
Eurostat should equip itself with adequate resources to fully ensure the coordination of cultural statistics at the European level, by the way of:
o centralising, using and developing cultural data available within Eurostat that is collected through different harmonised European surveys (employment, household expenditures, business etc.), in ensuring cooperation between different statistical units of Eurostat;
o ensuring the centralisation of available national data on culture;
o coordinating present and future work on EU cultural statistics;
o ensuring regular production and dissemination of European data (for example, on cultural employment etc.).
2) If the creation of a specific unit for the cultural statistics is not possible for the moment, ESSnet recommends that Eurostat creates a permanent full-time post dedicated to cultural statistics to ensure the adequate follow-up of the European developments in the domain of cultural statistics.

ESSnet‐CultureFinalReport
- 69-
Other themes (than those treated by the four TFs) could also be explored by ESSnet-Culture. It would be appropriate that European resources be made available to deepen studies and to take advantage of the present synergies among Member States. Analysis, comparisons of national situations and proposals for developments (such as methodologies on estimates) are easier when a network is settled. For that purpose, the setting-up of Task Forces on specific themes, coordinated by Eurostat, would be appropriate.
3) ESSnet-Culture recommends the establishment of Task Forces on specific
topics related to cultural statistics, under the coordination of Eurostat. These TFs could concentrate on the following themes that have been highlighted by the ESSnet-Culture experts as being of prior importance.
These topics could be:
- cultural employment: updating of the matrix needs important methodological and statistical developments;
- trade in cultural goods and services;
- indicators on copyrights that represent crucial intangible assets for culture but whose measure is delicate;
- small-sized and non-market oriented enterprises active in cultural sectors; the non-market sector is particularly important for the social economy;
- satellite accounts on culture as a way to consider the whole economic chain; it is a solution that would make it possible to establish the strong interrelation of culture with other sectors of the economy.
The search for the available national statistical sources, realized at the beginning of
the project, showed the multiplicity of ‘administrative surveys’. These national administrative surveys, a characteristic of the cultural field, mobilize different actors (public administrations, professional organisations etc.), resort to various methods of production and are conducted according to a very variable regularity. If these sectoral surveys are very important for the production of European cultural statistics, they answer to different concepts from one country to another, which prevents all comparisons, and they do not cover the whole of the cultural activities, or only in a partial way.
4) Following the example of the works of the Libecon project on the public libraries or ongoing work of the EGMUS group on museums, ESSnet-Culture recommends to put in place a network of thematic working groups to work on the harmonization of the concepts and the methods of the sectoral administrative surveys, in order to produce harmonized statistics on heritage, libraries, visual arts or performing arts.

ESSnet‐CultureFinalReport
- 70-
The call for European and national policies to take into account the ESSnet-Culture conceptual framework was already included in the Conclusions adopted by the Council of Culture Ministers of the EU in May 2011, ‘invit[ing] the Members States and the Commission, within their respective competences, to: deploy the statistical framework being developed by ESSnet-Culture with a view to producing reliable, comparable and up-to-date information on the social and economic impact of culture and work on future priorities on the basis of recommendations issued by ESSnet-Culture etc.’.(23) AS REGARDS METHODS AND TOOLS, it is essential for ESSnet-Culture to develop standard norms for European cultural statistics:
to define common EU standards is the first step and this is why the approval of this framework is necessary.
to improve existing tools at the EU-level (surveys, classifications) by taking more into account cultural sector (cultural activities, occupations and products).
In SBS, the use of the new NACE Rev.2 enables to better identify culture (e.g. audiovisual). However, this data collection does not yet cover a very important cultural sector – sector R, where classifications would allow a good coverage even at an aggregated level: the new 2008 NACE 3-digit level (group 900, Creative, arts and entertainment activities) and even the 2-digit level (division 90, Creative, arts and entertainment activities) are entirely cultural and represent an important part of cultural creation (Performing and Visual arts) that could be explored by European statistics.
5) ESSnet-Culture recommends to provide a better coverage of the cultural sector in the EU harmonised surveys (covering all cultural classes of the NACE Rev.2).
6) ESSnet-Culture recommends to request a more detailed level of classifications (at least 3-digits of NACE, 4-digits for ISCO) in harmonized surveys (e.g. in the EU-LFS) so that cultural activities and cultural occupations may be better identified.
(23) See http://register.consilium.europa.eu/pdf/en/11/st09/st09057.en11.pdf

ESSnet‐CultureFinalReport
- 71-
6. Annexes TF1
Annex 1 Table 3 – NACE Rev.2 economic activities and their cultural rank
NACE Class Totally cultural Mainly Partly
47.61 Retail sale of books in specialised stores
47.62 Retail sale of newspapers and stationery in specialised stores
47.63 Retail sale of music and video recordings in specialised stores
47.78 Other retail sale of new goods in specialised stores (incl. art galleries)
47.79 Retail sale of second-hand goods in stores (antiquities)
47.89 Retail sale via stalls and markets of other goods (incl. books, video & music recordings)
47.91 Retail sale via mail order houses or via Internet
58.11 Book publishing
58.13 Publishing of newspapers
58.14 Publishing of journals and periodicals
58.21 Publishing of computer games
59.11 Motion picture, video and television programme production activities
59.12 Motion picture, video and television programme post-production activities
59.13 Motion picture, video and television programme distribution activities
59.14 Motion picture projection activities
59.20 Sound recording and music publishing activities
60.10 Radio broadcasting
60.20 Television programming and broadcasting activities
63.91 News agency activities
71.11 Architectural activities
73.11 Advertising agencies
73.12 Media representation
74.10 Specialised design activities
74.20 Photographic activities
74.30 Translation and interpretation activities
74.90 Other professional, scientific and technical activities n.e.c.(books, artistic works placement)
77.22 Renting of video tapes and disks
78.10 Activities of employment placement agencies
79.90 Other reservation service and related activities
84.11 General public administration activities
84.12 Regulation of the activities of providing health care, education, cultural services and other social services, excluding social security
85.31 General secondary education
85.32 Technical and vocational secondary education
85.41 Post-secondary non-tertiary education
85.42 Tertiary education
85.52 Cultural education
85.59 Other education n.e.c.
90.01 Performing arts
90.02 Support activities to performing arts
90.03 Artistic creation
90.04 Operation of arts facilities
91.01 Library and archives activities
91.02 Museums activities
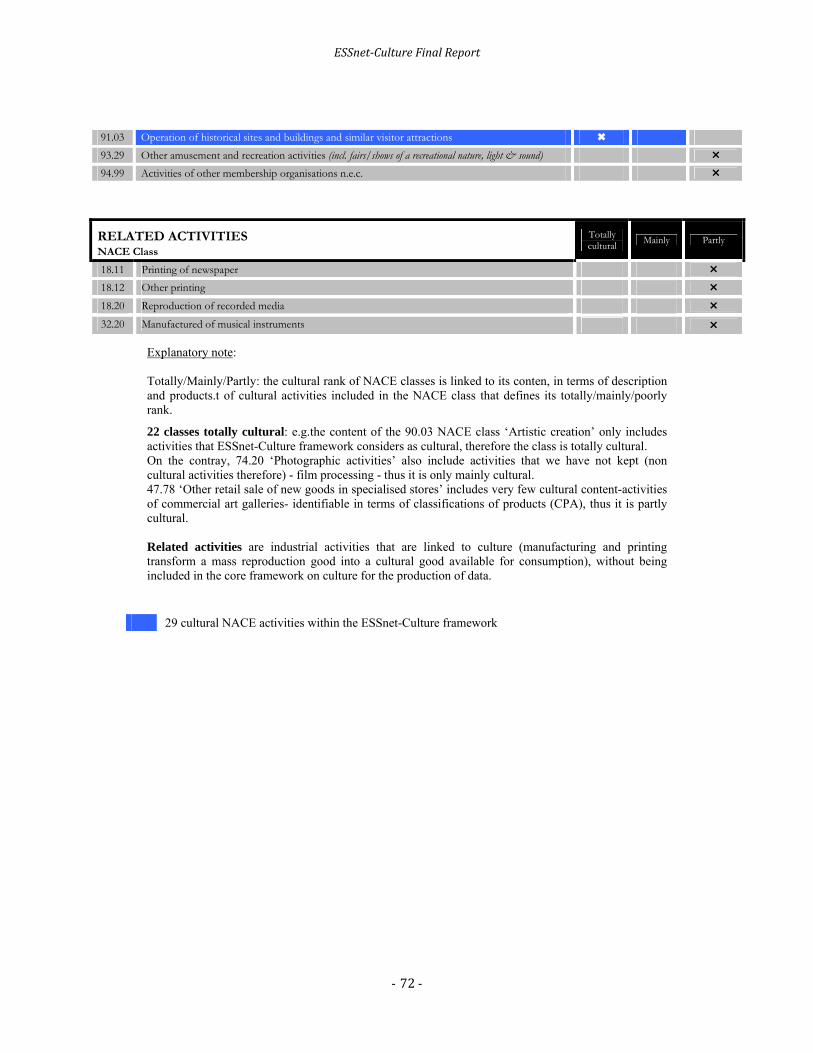
ESSnet‐CultureFinalReport
- 72-
91.03 Operation of historical sites and buildings and similar visitor attractions
93.29 Other amusement and recreation activities (incl. fairs/shows of a recreational nature, light & sound)
94.99 Activities of other membership organisations n.e.c.
RELATED ACTIVITIES NACE Class
Totally cultural
Mainly Partly
18.11 Printing of newspaper
18.12 Other printing
18.20 Reproduction of recorded media
32.20 Manufactured of musical instruments
Explanatory note: Totally/Mainly/Partly: the cultural rank of NACE classes is linked to its conten, in terms of description and products.t of cultural activities included in the NACE class that defines its totally/mainly/poorly rank.
22 classes totally cultural: e.g.the content of the 90.03 NACE class ‘Artistic creation’ only includes activities that ESSnet-Culture framework considers as cultural, therefore the class is totally cultural. On the contray, 74.20 ‘Photographic activities’ also include activities that we have not kept (non cultural activities therefore) - film processing - thus it is only mainly cultural. 47.78 ‘Other retail sale of new goods in specialised stores’ includes very few cultural content-activities of commercial art galleries- identifiable in terms of classifications of products (CPA), thus it is partly cultural. Related activities are industrial activities that are linked to culture (manufacturing and printing transform a mass reproduction good into a cultural good available for consumption), without being included in the core framework on culture for the production of data.
29 cultural NACE activities within the ESSnet-Culture framework

ESSnet‐CultureFinalReport
- 73-
Annex 2
Table 4 – Correspondence table of cultural activities with NACE Rev.2 classes, by function
Functions List of theoretical cultural activities Identifiable within
NACE 2008
CREATION
Creation of literary works 90.03 Writing of cultural articles for newspapers and periodicals
90.03 74.20
Translation and interpretation activities 74.30 Creation of graphical and plastic art works 90.03 Creation of photographical works 74.20 Design creation for graphical works 74.10 Design creation for interiors 74.10 Design creation (for industrial products and fashion) 74.10 Creation of musical, choreographic, lyrical, dramatic works
90.01 90.03
Creation of technical settings for live performance 90.02 Creation of audiovisual works 59.11
Creation of multimedia works 59.11 90.03
Architectural creation 71.11 Advertising creation 73.11 Artistic craft creation -
PRODUCTION & PUBLISHING
Museums science activities (constitution of collections) 91.02 Recognition of historical heritage 91.03 Archives' activities (incl. organisation of a collection) 91.01 Archival processing 91.01 Activities of libraries for all kinds of libraries 91.01 Publishing of books (incl. on-line) 58.11 Publishing of newspapers of all types (incl. on-line) 58.13 Publishing of magazines of all types (incl. on-line) 58.14 Creation activities of news agency 63.91 Production of visual art works 90.03 Performing arts production 90.01 Supporting activities for producing performing arts 90.02 Motion picture production for cinema 59.11 Video and audiovisual programmes productions 59.11 Television programmes production 59.11 Publishing of sound recordings (incl. downloads) 59.20 Publishing of videos and audiovisual programs (incl. downloads) 59.11
Publishing of multimedia works 59.11 Publishing of computer games (incl. on-line) 58.21 Radio programme production 60.10 Audiovisual post-production activities 59.12 Artistic craft production -
DISSEMINATION & TRADE
Museums exhibitions (visuals arts, books photography) 91.02 Other temporary exhibitions (for any cultural domain) 91.02 Creation of museography and scenography works 91.02
Art galleries activities 47.78nc 47.79nc
Consultation of archival material 91.01 Libraries lending activities 91.01

ESSnet‐CultureFinalReport
- 74-
Organisation of conventions and event-organising activities (for any cultural domain) 93.29nc
Live presentation activities 90.04 Booking services 79.90nc Renting of video tapes and disks 77.22 Motion picture projection 59.14 Radio broadcasting (incl. on-line) 60.10 Television broadcasting (incl. on-line) 60.20
Visual arts works trading activities 47.78nc 47.79nc
Antiquities trading activities 47.79nc Book trading activities 47.61 Newspapers and periodicals trading activities 47.62
Photographical works trading activities 47.78nc 47.79nc
Music and video recordings trading activities 47.63 Audiovisual and films trading activities 47.63
Multimedia works trading activities 47.63 47.41nc
Advertising campaigns trading activities 73.11 Artistic craft trading activities -
PRESERVATION
Preservation activities for historical sites 91.03 Preservation of intangible heritage - Conservation activities of archives (incl. digitization) 91.01 Conservation of libraries’ collections 91.01 Archeological activities 91.03 Protection activities for books 91.01 Protection activities for newpapers and periodicals 91.01 Protection activities for visual art works 90.03 Protection activities for photographical works 90.03 Restoring of protected monuments 41.20nc Restoring of visual arts and museum collections 90.03 Restoring of books - Restoring of photographicals works 74.20 Restoring of music recordings - Restoring of of audiovisual material 59.12 Applied research for cultural preservation 72.19nc
EDUCATION
Artistical education 85.52 Adult artisitic education 85.59nc Other cultural education 85.52 Independent teaching activities (for any cultural domain) 85.52 Awareness-raising actions in culture 94.99nc
MANAGEMENT & REGULATION
Administration of the State 84.11nc 84.12nc
Administration of local bodies 84.11nc 84.12nc
Administrative management of other organizations 94.12nc
Supporting activities for managing rights and royalties
59.13 59.20
69.10nc 90.02
Artistic agents 74.90nc Legend:
nc non cultural NACE (excluded from measure of cultural activities) - not identified in NACE
111B

ESSnet‐CultureFinalReport
- 75-
Annex 3
Table 5 – Cultural domains by products classification (CPA)
CULTURAL DOMAIN
CPA 2008 Description
HERITAGE ARCHIVES LIBRARIES
91 01 11 Libraries services: Collection, cataloguing, conservation and retrieval services of books and the like; Lending services of books and records; Stock photo and movie library services.
91 01 12 Archive services: Operation (collection, cataloguing, conservation and retrieval) services of public archives, including digital archives; Operation services of historical archives, including digital archives.
91 02 10 Museum services: Display services of collections of all kinds (art, science and technology, history); Management and conservation services for the collections; Organisation of travelling collection exhibitions.
91 02 20 Museum collections: collections and collectors' pieces of historical, ethnographic, zoological, botanical, mineralogical, anatomical or numismatic interest.
91 03 10 Operation services of historical sites and buildings, and similar visitor attractions: Operation of, and access and visiting services to historical sites, monuments and buildings; Preservation services for historical sites, monuments and buildings.
47 00 68 Retail trade services of stamps and coins47 00 69 Retail trade services of souvenirs and arts
*47 00 91 Retail trade services of antiques (incl.retail trade services via auctioning houses) *71 20 19 Other technical testing and analysis services (certification and authentication of works of
art) *72 19 13 Research and experimental development services in physical sciences
BOOKS & PRESS
58 11 11 Printed educational textbooks (workbooks, teachers manuals, ressource materials, interactive materials).
58 11 12 Printed professional, technical and scholarly books. 58 11 13 Printed children books. 58 11 14 Printed dictionaries and encyclopaedias. 58 11 15 Printed atlases and other books with maps.58 11 16 Printed maps and hydrographic or similar charts, other than in books form.58 11 19 Other printed books, brochures, leaflets and the like (literary fiction and
non-fiction; poetry and drama; religious books, bibles and hymnals; nonfiction such as history, political, biographies, home and garden, how-to books, cook books, travel guides,et
58 11 20 Books on disk, tape or other physical media.58 11 30 On-line books. 58 11 41 Advertising space in books, printed.58 11 42 Advertising space in books, electronic.58 11 50 Publishing of books on a fee or contract basis. 58 11 60 Licensing services for the right to reproduce, distribute or incorporate
literary originals such as books, brochures, leaflets, maps and the like. 58 13 10 Printed newspapers.58 13 20 On-line newspapers. 58 14 11 Printed general interest journals and periodicals. 58 14 12 Printed business, professional and academic journals and periodicals.58 14 19 Other printed journals and periodicals. 58 14 20 On-line journals and periodicals. 58 14 31 Advertising space in journals and periodicals, printed. 58 14 32 Advertising space in journals and periodicals, electronic.

ESSnet‐CultureFinalReport
- 76-
58 14 40 Licensing services for journals and periodicals.63 91 11 News agency services to newspapers and periodicals: gathering,
investigating and supply services of news in the form of manuscripts or of news pictures to printed media businesses such as newspapers, periodicals and books.
74 30 11 Translation services *18 14 10 Binding and related services
47 00 61 Retail trade services of books 47 00 62 Retail trade services of newspapers nad magazines
*47 00 92 Retail trade services of second-hand books (incl.retail trade services via auctioning houses)VISUAL ARTS 90 03 11 Services provided by individual artists (such as composers, sculptors,
painters, cartoonists, engravers, etchers etc.), individual writers (for all subjects, including fictional and technical writing), independent journalists and other artists except perf
90 03 12 Original works of authors, composers and other artists (except performing artists, painters, graphical artists and sculptors).
90 03 13 Original works of painters, graphical artists and sculptors (paintings, drawings and pastels; original engravings, prints and lithographs; original sculptures and artistic statuary, in any material).
74 20 21 Portrait photography services (in studios or other locations, e.g. studio fashion photos).
74 20 22 Advertising and related photography services.74 20 23 Event photography and event videography services (photographing or
videotaping live events, such as weddings, graduations, conventions, receptions, fashion shows, sports and news events).
74 20 24 Aerial photography services.74 20 29 Other specialised photography services (using special apparatus or
techniques, e.g. underwater photo). 74 20 32 Restoration and retouching services of photography (old photograph
restoration, retouching and other special photographic effects). 74 10 11 Interior design services.74 10 12 Industrial design services (creating and developing designs and
specifications). 74 10 19 Other specialised design services (harmonising aesthetic considerations with
technical and other requirements, for furniture, jewellery, aesthetic designs, graphic desings etc.).
74 10 20 Design originals (original design concepts, produced on own account; intellectual property product typically produced with the intent to sell or license the information to others).
85 52 13 Fine arts schools and arts instruction services .ARCHITECTURE 71 11 10 Plans and drawings for architectural purposes.
71 11 21 Architectural services for residential building projects. 71 11 22 Architectural services for non-residential building projects. 71 11 23 Historical restoration architectural services .71 11 24 Architectural advisory services. 71 11 31 Urban planning services. 71 11 32 Rural land planning services.71 11 33 Project site master planning services. 71 11 41 Landscape architectural services. 71 11 42 Landscape architectural advisory services.
PERFORMING ARTS
90 01 10 Services of performing artists (actors, readers, singers, musicians, dancers, stunt people, television personality hosts/presenters, lecturers, speakers, circus artists and other performing artists, independent models).
90 02 11 Performing arts event production and presentation services. 90 02 12 Performing arts event promotion and organisation services.

ESSnet‐CultureFinalReport
- 77-
90 02 19 Other performing arts support services ( management services for rights attached to artistic, literary, musical works).
90 04 10 Arts facility operation services (operation services of concert halls, theatres, opera houses, music halls, including ticket services; operation services of multipurpose centres and similar facilities with a cultural predominance).
85 52 11 Dancing schools and dance instructors services. 85 52 12 Music schools and music instructors services.
*79 90 39 Reservation services for event tickets, entertainment & recreational services *93 29 21 Firework and "light and sound" shows services.
AUDIOVIISUAL & MULTMEDIA
59 11 11 Motion picture production services.59 11 12 Promotional or advertisement motion picture and video production
services. 59 11 13 Other television programme production services. 59 11 21 Motion picture, video and television programme originals. 59 11 22 Cinematographic film. 59 11 23 Films and other video content on disk, tape or other physical media. 59 11 24 Films and other video downloads.59 11 30 Sale of advertising space or time in motion picture, video and television
products. 59 12 11 Audio-visual editing services. 59 12 12 Transfers and duplication of masters services.59 12 13 Colour correction and digital restoration services. 59 12 14 Visual effects services. 59 12 15 Animation services.59 12 16 Captioning, titling and subtitling services. 59 12 17 Sound editing and design services. 59 12 19 Other motion picture, video and television programme post-production
services. 59 13 11 Licensing services for film rights and their revenues. 59 13 12 Other motion picture, video and television programme distribution services.59 14 10 Motion picture projection services.58 21 10 Computer games, packaged.58 21 20 Computer games downloads. 58 21 30 On-line games.58 21 40 Licensing services for the right to use computer games. 59 20 11 Sound recording services. 59 20 12 Live recording services. 59 20 13 Sound recording originals.59 20 21 Radio programme production services. 59 20 22 Radio programme originals. 59 20 31 Printed music.59 20 32 Electronic scores (musical compositions in electronic form). 59 20 33 Musical audio disks, tapes or other physical media. 59 20 34 Other audio disks and tapes.59 20 35 Music downloads. 59 20 40 Licensing services for the right to use acoustic originals. 60 10 11 Radio programming and broadcasting services. 60 10 12 Radio broadcasting originals.60 10 20 Radio channel programmes. 60 10 30 Radio advertising time.60 20 11 On-line television programming and broadcasting services, except by
subscription.

ESSnet‐CultureFinalReport
- 78-
60 20 12 Other television programming and broadcasting services, except by subscription.
60 20 13 On-line television subscription programming and broadcasting services. 60 20 14 Other television subscription programming and broadcasting services. 60 20 20 Television broadcasting originals.60 20 31 Television channel programmes, except for subscription television.60 20 32 Subscription television channel programmes. 60 20 40 Television advertising time.63 91 12 News agency services to audio-visual media: gathering, investigating and
supply services of news (manuscripts, photos, images) to radio or television stations and movie companies.
47 00 64 Retail trade services of music and video recordings 77 22 10 Rental services of video tapes and disks
*62 01 21 Computer games software originals ADVERTISING 73 11 11 Full service advertising services (among others: design of advertisements,
writing of scenarios). 73 11 13 Advertising design and concept development services.
INTER-DISCIPLINARY PRODUCTS FOR SEVERAL DOMAINS
74 30 12 Interpretation services. *74 90 20 Other professional, technical and business services (incl. Engagements in motion pictures,
theatre or other entertainment; placement of books, artworks etc.) *84 11 1_ General (overall) public services*84 12 14 Administrative recreational, cultural and religious services
85 52 19 Other cultural education services. *94 99 16 Services provided by cultural and recreational associations.
Legend:
Included products from non-cultural activities (*)

ESSnet‐CultureFinalReport
- 79
TASK FORCE 2
FINANCING AND EXPENDITURE ON CULTURE
Culture traditionally ranks among the sectors that are partially neglected, particularly with regards to the allocation of societal resources. This claim has general and possibly multinational validity and becomes evident in the fact that cultural goods and services are placed last in relevant international classifications (NACE, COFOG, COICOP etc.).
The increasing importance of social aspects of life in today’s society becomes more and more apparent, focusing not only on issues and requirements, such as a need for higher educational and cultural levels, but also on the coexistence of different ethnic and religious groups of people within our countries in today’s globalized world.
In accordance with the first European Agenda for culture proposed by the European Commission in May 2007 and endorsed by the Council of the EU in November 2007, European institutions, EU Member States and the cultural sector should particularly contribute to the following three main objectives:
promotion of cultural diversity and intercultural dialogue;
support of culture as a catalyst for creativity within the Lisbon Strategy;
promotion of culture as a vitally important element in the EU international relations.
The importance of monitoring and evaluating the economic dimension of culture is gaining importance, especially following the current increased emphasis on a long-term balanced management of public finances.
EU countries are thus newly reinforcing the challenges to better monitor financial inputs and outputs in relation to cultural institutions, for example through the drawing up of satellite accounts in the field of culture, similar to the ones that are being compiled in other areas of social interest (health service, social security, tourism, environment,...).
Needless to say, the questions of statistical coverage of the economic dimension of culture are very difficult. Arriving at a purely theoretical definition of culture - what is part of it and what is beyond its boundaries - is associated with many difficulties. Quantitative coverage of economic phenomena, which is usually based on accounting or statistical methods, is necessarily linked with an institutionalization of a particular subject of research. It may reflect the economic variables of the relevant cultural institution or organization - possibly the field of cultural activity or the whole sector - with more or less accuracy (with the exception of phenomena such as lifestyle, customs and traditions). Culture is such a complicated and vast area, that we need to use a quantitative approach in full extent, with all imaginable effort. Economic data, indicating the significance or weight of culture in the economy, will therefore never be fully complete.
Unlike other activities or services of a social nature (education, health service, social welfare etc.), culture can hardly be reduced to one field or sector of the economy. Compared with the above services, cultural services and goods are of a larger scale, they are realized in a national, regional and local context, and are touching every member of society. Cultural
ESSnet‐CultureFinalReport
- 80
services and goods become an integral part of national wealth in a materialized or other tangible form. This is why cultural services and goods are very much associated with public interest and support, without which their development would not have been imaginable.
1. Background
1.1. Public expenditure on culture
Public expenditure (and within it the expenditure of State budgets) has, if not a primary position, then surely a unique role in the financing of culture. Public expenditure in this context means the expenditure of institutional sectors (see European system of accounts, ESA 95(24)): sector S.13 (General government) and sub-sectors S.11001 (Non-financial public corporations), S.121 (Central bank), S.12201 (Other public monetary financial institutions), S.12301 (Other public financial intermediaries, except insurance corporations and pension funds), S.12401 (Public financial auxiliaries), S.12501 (Public insurance corporations and pension funds). From the point of view of the volume of allocated sources and at the same time from the aspect of assessment of the level of public assistance, the most significant in this context is sector S13 - General government.
We basically distinguish three sub-sectors of Government: o Central; o Regional; o Local.
In order to monitor government expenditure on culture within EU countries, it is appropriate to stick to these three sub-sectors, regardless of size and political order and administrative organization of the Member States. An exception would be large countries, in which case it will be possible to merge ‘medium levels’ into one (called Regional or State). In terms of the method to be used for collecting the data on public expenditure on culture, it is based on the principle of data, reflecting real drawing on the basis of accountancy books (financial reporting) in the reference year (given the levels of government – the sector S.13). These should be available as administrative data, in particular within the ministries of Finance and Culture, respectively within government offices of lower level or within other ministries (under the terms of the financing of the national culture). Public expenditure on culture in other sectors should be available in financing institutions of the given sectors. These data can eventually be obtained by means of statistical surveys within cultural institutions, which would concern financial amounts received. It means that if other public institutions (besides government institutions) support culture their expenditure is included in other public expenditure. In this context it is noteworthy that a significant part of cultural institutions are allowance organizations (whose relationship to the appropriate sector of government is a budgetary relation and not a contractual one) and non-governmental, non-profit organizations (civic associations, foundations and endowment funds, corporate associations, voluntary associations of municipalities etc.). The statistical surveys conducted at the level of these institutions are characterized by a higher response rate than is the case for private cultural (24) European system of accounts, ESA 95, http://circa.europa.eu/irc/dsis/nfaccount/info/data/esa95/esa95-new.htm

ESSnet‐CultureFinalReport
- 81
institutions. Statistical surveys for the collection of data are necessary in any case (imputation of non-response items and at the same time realization of a sampling frame). Statistical surveys of cultural institutions, including data on income from public funds, may be obtained through administrative sources (drawn from the state budget). Information as identified in the final ‘consumer’ should avoid double-counting the same amounts of money (due to transfers etc.).
1.1.1. Inventories’ work at the beginning of the activity of TF2 The TF2 started its works with the area of public expenditure and direct receipts, which is generally considered to be much more fundamental than the area of HBS expenditure (seen as a meaningful part of private expenditure on culture). Therefore, TF2 made an inventory on the organization of public expenditures and the available data in the Member States. This inventory work was carried out on the basis of one questionnaire and two tables.
Questionnaire, containing 10 crucial questions and reflecting the particular situation in a given country. They were focused e.g. on the application of the degrees of the COFOG classification, number of the levels of government, procedures related to the consolidation of public expenditure on culture, existence of the survey of so called ‘direct receipts’, existence of data time series etc. (see Annex 1).
Table of availability of data - Public Expenditure on Culture - at 3 levels (central, regional and local of governmental expenditure) divided into capital expenditure and current expenditure (furthermore subdivided into goods and services, personnel expenditure and others) + Public institutions and COFOG codes (see Annex 2).
Table of availability of data - Financial sources of Culture - Receipts -also at 3 levels (central, regional and local governmental receipts) + private sources, non-profit institutions and donors (see Annex 3).
Due to the fact that there was only one participant in TF2, all documents (the questionnaire and the two tables of availability of data) were distributed to all TF2 members, who participated in the ESSnet-Culture launching conference (held from 7. to 8.12.2009), with a request to provide the TF2 leader with answers to the questionnaire together with completed tables, accompanied by and comments. In this context it is necessary to highlight that the abovementioned documents - completed by all TF members - were several months later sent to all remaining EU countries, which are not members of the ESSnet-Culture project, as well as to Switzerland (as a non-EU member) and Turkey (as a candidate country), which were willing to provide TF2 with requested information. All in all, the answer rate was approximately 86%. After going through all completed questionnaires and tables we eliminated, in cooperation with relevant countries, all unclear or confused answers or data from the tables. This information was incorporated into a pre-compiled overall overview of the outputs, resulting from the questionnaires and, separately, from the tables completed with information about relevant applications (not with figures).

ESSnet‐CultureFinalReport
- 82
In short, the answers to the questionnaire show that:
- 9 countries do not apply the COFOG classification at all or use a national version of it.
- regarding the COFOG digit level used for data collection: 6 countries use 2 digit levels 4 countries use 3 digit levels 5 countries use 4 digit levels
- regarding the numbers of the level of government for which data are collected: 13 countries collect on 2 levels 9 countries collect on 3 levels countries collect on 4 levels
- regarding the breakdown of direct government expenditure on culture: 12 countries have a breakdown into 3 basic categories – current,
capital and transfers 4 countries have a breakdown into just 1 category – current 7 countries have a breakdown into more than 3 basic categories.
- only two countries do not have data time series. Regarding the specification of negative phenomena and various constraints for international comparability of data, the following comments can be made.
Joint collection of data on public expenditure on culture (within the EU) may be hindered by various obstacles jeopardizing the comparability of data, either in time or in space. These obstacles particularly consist in the different approaches adopted by countries.
Some of the expenditure and incomes do not arise from the purchase or sale of services or raw materials, energy, goods, etc., but from transfer funds, which are usually one-way. Clear definition and separate monitoring of these transfers are of great importance in order to avoid possible double-counting of relevant financial resources and to work only with the so-called consolidated data.
Another practical problem, connected with the classification used and the breakdown of budgeted items, is that the data of the Ministries of Finance, drawn from the State budget, may also include in the data for culture information about other sectors (e.g. Church, sports and political parties). The problem of counting data of other sectors into culture (or vice versa) should also be kept in mind if the institutions conducting their activities both within culture and beyond are included in statistical surveys.
It turns out that considerable divergences exist among countries in the application of COFOG classification. More than a third of countries do not apply the mentioned classification at all and other countries apply it at different levels of detail (2, 3 or 4 digit level).
The degree of breakdown of cost items within public expenditure on culture also differs in some countries according to the cultural domain.
A clear definition of the domains belonging to culture is advisable. The practice of countries differs as well in this regard.

ESSnet‐CultureFinalReport
- 83
Many countries have not been surveying so-called direct receipts in connection with public expenditure and moreover probably no country is able to quantify the so-called indirect public expenditure (tax and other allowances), which however occur very often.
Inconsistent approach in obtaining data on culture is also evidenced by the fact that some countries carry out statistical surveys only in the case of public cultural institutions.
Finally, the comparability of long-term time series (when available) has been permanently impaired by the frequent methodological, organizational and accounting changes.
Table 6 – Overall overview of the questionnaires ‘Public expenditure and direct receipts’
Questions
Number of answers YES
Number of answers NO
Comments within(outside)
ESSnet-Culture within(outside)
ESSnet-Culture
1. To what degree (extent) is the Classification COFOG applied in your country, it is made some national adjustment and if yes, could you describe it?
10(5) 6(3)
NO: Denmark, France, Germany, Luxembourg, Poland, Sweden (Hungary, Finland, UK) - some of them use ‘national adaptation’ YES: 6x2, 4x3 and 5x4 digit levels
2. Which bodies of the government sector are participating in public expenditures on culture (number of levels of government, ministries and what sort of, mutual financial relationships – transfers etc.)?
16(8) 0(0)
13x2 levels - Bulgaria, Romania, Luxembourg, Portugal, Slovenia, Turkey (Cyprus, Latvia, Malta, Estonia, Hungary, Finland, UK) 9x3levels - most of countries, participating in the project (incl.Slovakia) 2x4 levels - France, Poland
3. Are other institutions involved in public expenditures on culture (associations, unions etc., partly or fully joined state budget)?
14(5) 2(3) NO - Romania and Belgium (Slovakia, Malta, Hungary)
4. Which the breakdown of direct government expenditures on culture we can obtain from you (current and capital, only “salaries - staff costs” and “others”, or even more items incl. capital and in this case what type of these)?
16(7) 0(1)
Most frequent breakdown (12x) is into 3 fundamental categories : 1.Current, 2.Capital, 3.Transfers 7x more than 3 categories: Austria, France, Poland, Belgium (Cyprus, Malta, Hungary) 4x only current category : Denmark, Sweden, Turkey (Estonia) No distinction : Finland (even between capital and current is not made)
5. What procedure do you apply, in order to ensure a consolidation of public expenditures on culture (elimination, exclusion of transfers and double-counting)?
12(7) 4(1)
YES : countries apply either method of elimination or method of exclusion of transfers and double-counting Clear NO : 2x - Bulgaria, Luxembourg Not unambiguous NO : 3x - France, Sweden (UK)
6. Does exist in you country indirect government expenditures (tax allowances, lower rates of VAT etc.) and would be possible in this case to quantify them?
15(7) 1(1) Note: in any case is not possible quantification (if YES - only very rough) NO: Romania (Cyprus)
7. Are in your country so called “mixed” institutions at different levels of government, operating across a lot of domains (cultural houses and the like)?
14(7) 2(1) YES: very often without nearer specification NO: Romania and Switzerland, but the latter - they do not know exactly (Malta)
8. Do you survey and how so called direct receipts (the receipts of cultural institutions, coming from households and private entities) and furthermore the receipts of cultural institutions, coming from governmental sector (at these institutions)?
11(7) 5(1) NO: Denmark, France, Portugal, Turkey, Romania (Latvia)

ESSnet‐CultureFinalReport
- 84
9. Do you have at a disposal a time series of data, relating to public expenditures, if yes - from what time and which indicators are involving in the scope of them?
14(7) 2(1)
NO: Turkey and Romania (Hungary - for reason of very high level of aggregation and only partial consistency with the COFOG classification system). Note 1: the beginning of time series monitoring is various (from Finland - 1970 and Sweden - 1975 up to Bulgaria and Spain - 2000; or Belgium - 2004 on the basis of 3 digits unlike 2 digits until then); Note 2: in most cases the respondents did not specify type of monitored indicators.
10. Could you specify an another meaningful circumstance, connecting with your data system, which could have an influence, impact on international comparability of statistical results of public expenditures on culture, and if yes state concrete examples?
6(3) 10(5)
YES : many different reasons - e.g. : the public expenditure on radio, architecture and educational activities are not included in the Public expenditure on culture (Portugal, Spain), very different accounting in the municipalities (Denmark), Compendium project (Austria), different concepts and measurements (Germany, Estonia), reference on easy comparability in case of institutional sectors within the ESA 95
Moving to a shared collection of comparable data on public expenditure on culture implies the gradual elimination of the different approaches followed by European countries in this area. The problem is that some divergences are based on legislative arrangements (with more or less legal power) and unification in this direction will require significant time and effort. For the time being it seems to be an acceptable starting point to proceed from a common minimum of collected data (attainable by all countries) and after a certain period of time to further intensify joint approaches towards the determined target level. This proposal is reflected in two tables.
o Table ‘Gross consolidated public expenditure’ represents the initial state of attainable common minimum of data on public expenditure (see Annex 5).
o Table ‘Gross consolidated public expenditure and direct receipts’ challenging the target state (see Annex 6).
Differences between tables refer only to the sorting aspects (variables) specified within individual columns. The tables are designed to collect data from individual countries. In coming years, the countries could be invited to fill in the table ‘Gross consolidated public expenditure’, an initial simpler version. A first attempt was realized in March and April 2011 in the form of a ‘pilot survey’ (the outputs of this survey were compiled and analyzed, and lead to relevant conclusions – see results in Annex 9, ‘Results of the pilot survey – Gross consolidated public expenditure on culture’). At a later stage, it would be possible to proceed to the collection of a larger and more detailed dataset, using the table ‘Gross consolidated public expenditure and direct receipts’. The specification of cultural domains and sub-domains results from the recommendations of TF 1 and is identical in both tables. In an initial stage, we used the domains and sub-domains arising from the NACE, Rev.2 (2008) and the CPA (2008) classifications. It is obvious that the data within the table used for the pilot survey (table ‘Gross consolidated public expenditure’) will never be completed for all domains, because differences will result from the level of application of the COFOG classification and from the budget structure of each country. In connection with the ‘target’ table (‘Gross consolidated public expenditure and direct receipts’) data for all cultural domains should be submitted as a result of additional

ESSnet‐CultureFinalReport
- 85
adjustments, respectively a corresponding deepening of the COFOG classification. But it will be a long-distance run. The time schedule of the transition to the target state, through the unification of data production and collection, should ensue from an agreement by the EU Member States, taking into account the possibilities of each of them to make the necessary changes required for its factual implementation.
1.1.2. Summary evaluation of the pilot survey on public expenditure on culture
The main objective of the work of TF2 was to produce harmonized data on public financing of culture for some European countries. The pilot survey was aimed at and sent to 29 countries (27 EU countries, Turkey and Switzerland), but only 23 countries provided TF2 with outputs. TF2 received the requested tables with concrete numerical data but the actual data were not what mattered at that moment as the main issue was data availability. Some countries were concerned about potential publishing of their data. The main results of this pilot survey are presented together in the annex of this chapter, ‘Results of the pilot survey – Gross consolidated public expenditure on culture’ (see Annex 9).
1.1.2.1. Concrete ascertainments, outputs Reference period: the available data, requested for the year 2009, were sent by almost all countries (14 in total); exceptions were: year 2008 – Cyprus, England(25), Finland, Netherlands, Spain and Switzerland; year 2007 – Germany; year 2006 – France and Luxembourg. Problems with an application of the COFOG
o Countries not applying the COFOG codes for a compilation of the public expenditure – Denmark, Poland and Sweden.
o Countries applying the COFOG codes with some exceptions – Belgium and Cyprus.
o Specific situation in France – the breakdown of domains and sub-domains comes from the LEG-Culture classification.
o Countries with the available data only in the frame of the code COFOG 08 as a whole (i.e. altogether culture, recreation and religion) – Belgium and Romania.
Data consolidation: Not consolidated data exist only in the Netherlands. Governmental level of expenditure
o Central level of government: availability in all countries but in several countries only for ‘Current expenditure’ (not for ‘Capital’) – England, Estonia, Finland, the Netherlands and Sweden (France being the exception as it is impossible to break down the expenditure into these 2 basic categories, only the total is available).
(25) Only the data of England were indicated for UK

ESSnet‐CultureFinalReport
- 86
o Regional level: not applicable in Cyprus, England, Finland, Hungary, Latvia, Lithuania, Luxembourg, Malta, Netherlands and Slovenia.
o Local level: not applicable in England and Latvia. Other public expenditure: this category was filled in only by the following countries (Luxembourg, Malta and Sweden). Domains (and sub-domains): see table of the pilot survey outputs, the last line ‘Comments in general’ (see Annex 9). Special comments to the outputs: see table of the pilot survey outputs, the last line ‘Comments in general’ (see Annex 9).
1.1.2.2. Conclusions It emerges from the pilot survey on public expenditure outputs that the situation across European countries is not homogeneous. For the future it would be required to progress in the harmonisation of these statistics starting from an investigation on how data on cultural government expenditure is gathered in the various countries and what is the comparability of data collected by Eurostat in this domain.
1.2. Households expenditure on culture
Household expenditure for cultural goods and services holds an important place in the financing of culture. In the context of institutional sectors (see European system of accounts -ESA 95) they are part of the expenditure sector S.14- Households. Data on household expenditure on culture are obtained from the Household Budget Surveys (HBS). These surveys allow to measure of cultural consumption of the households with respect to their total consumption. This statistical instrument has a relatively long-lasting tradition within some of the EU countries. Statistical offices have been using the uniform classification COICOP-HBS (Classification of individual consumption by purpose) to carry it out and moreover EUROSTAT has been trying to coordinate this survey by means of methodological recommendations. This makes data collection on household expenditure on culture simpler than data collection on public expenditure. Household Budget Surveys are harmonized throughout Europe. They are used to establish consumer price indexes and as building blocks for national accounts. They are an important and precious source of data for the analysis of households’ living conditions. On the one hand, the goods and services nomenclatures that are used can serve to build a detailed picture of consumer spending (classification of individual consumption by purpose COICOP- HBS). On the other hand, the numerous variables available in these surveys allow analysing consumption via key socio-demographic characteristics such as age, socio-professional category of head of household, type of household, class of income. As a result, they can constitute a precious tool in the description of cultural consumption and locate it within the overall consumption of households.

ESSnet‐CultureFinalReport
- 87
The collection of information on the realization of the national household budget survey and the use of the classification COICOP have enabled TF2 to identify the main difficulties to build comparable statistics on the cultural expenditure of households in Europe, due to methodological difficulties. It is important to look at some key methodological questions such as the main sampling strategy, the frequency of HBS, the application of COICOP, the levels of the expenditure items monitoring, the use of a national itemization (deeper than at the COICOP-HBS) etc. (see Annex 4). In the case of the area of HBS expenditure it is also necessary to point out that the information resulting from the questionnaires completed by all TF2 members was later completed by the outputs coming from all remaining EU countries, which are not members in the ESSnet-Culture project as well as Switzerland (as a non-EU member) and Turkey (as a candidate country). The answer rate was approximately 93% (to be specific 26 countries out of a total number of 28) were willing to provide us with the requested information. In its analysis of all completed questionnaires, TF2 had also to ensure, in collaboration with the relevant countries, that all questions were correctly understood. After clarifications TF2 was able to complete a predefined overview of established information. From this evaluation it results that:
the frequency of the HBS survey is not the same in all the countries (mostly a 1-year period, in 5 countries a 5-year period);
every country are using the COICOP within the HBS;
the main sampling strategy is mostly a combination of 2 or 3 random, stratified and multistage.
Table 7 – Overall overview of the questionnaires on HBS expenditure
Questions
Number of
answers YES
Number of
answers NO Comments
ESSnet-Culture
ESSnet-Culture
1. Is the Household Budget Survey (hereafter HBS) being under way in your country every year? If not, how frequent is the HBS being conducted?
14(7) 2(3)
NO : Austria, France (Cyprus, Malta, Finland) - HBS is in these cases being conducted in 5-years period Despite the fact, that (Lithuania) stopped the HBS in 2009, we are stating all information within this overview in relation to the year 2008
2. What is the main sampling strategy within the HBS? At this question we can not get simple sum of 26 countries (the sum is 48), because : - 4 countries : Denmark, France, Sweden (Malta) use only ‘Random’ - 2 countries : (Slovakia, Finland) use only ‘Stratified’ - 2 countries : (Estonia, Netherlands) use only ‘Multistage’ - 2 countries : Czech Republic, Germany use only ‘Quota sampling/Non-random’ - 16 remaining countries use the combination of 2 or 3 from these sampling strategies : ‘Random, Stratified and Multistage’
2.1. Random? 11(5)
2.2. Stratified? 10(7)
2.3. Multistage? 8(5)
2.4. Quota sampling/Non-random? 2(0)

ESSnet‐CultureFinalReport
- 88
3. How long is the reference period of a finding in the scope of the households within the HBS?
16(10) 0(0) Answer YES means ‘All year’
4. Do you apply within the HBS the Classification of Individual Consumption by Purpose (hereafter COICOP)?
16(10) 0(0) -
5. In the case of not applying the HBS, do you consider the application of the HBS into the future?
0(1) 16(9)
NO: basically means ’not relevant’ (in connection with previous answers) at all countries with exception of Germany (without any answer probably means that existing state is meeting the requirements) YES: is concerning Lithuania (after termination in 2009)
6. In the case of applying the HBS, do you monitor the expenditure items in the frame of the group “09 Recreation and Culture”, subdivided into 4th levels in accordance with the document COICOP-HBS, coming from 2003 year?
15(8) 1(2)
In spite of the fact, that Germany does not apply the classification COICOP, this country is declaring a possibility of a breakdown of the expenditure items (within the group "09 Recreation and Culture") into 4th levels (in the frame of national classification) NO is belonging to Belgium (Malta + Estonia) Belgium - they use 2 types of classifications : INS (national) and COICOP-HBS (both-5 digits); but they are preparing new classification COICOP-HBS-BE from 2012
7. Unless you monitor the expenditure items in a detail above mentioned (the question 6.), what is the level of monitoring according to the COICOP, at which you are able to distinguish the expenditure items within the group “09 Recreation and Culture”?
1(2) 15(8)
NO: basically means ‘not relevant’ (in connection with previous answers) at all countries with exception of Germany, which is however conceding the possibility of a breakdown of the expenditure items into 4th levels YES: i.e. Belgium into 5th levels (Malta into 3rd levels + Estonia into 6th levels)
8. Are you using at some expenditure items, belonging to the expenditure group “09 Recreation and Culture”, a retrospective inquiry? If yes, at which items?
3(4) 13(6)
In terms of items, at which is used retrospective inquiry (answer YES): Luxembourg referred to their websites Portugal: stated the items from 09.1. up to 09.6. Slovenia: stated many items (Cyprus): stated that the majority of the data are collected this way (Malta):stated the items from 09.1.1 up to 09.6.0 (Lithuania): stated many items (UK): they did not state at which items
9. Do you make use of a national itemization, deeper (finer) than at the COICOP-HBS?
9(5) 7(5) -
10. Could you specify some another meaningful circumstance, which could have an influence (impact) on international comparability of statistical results of the HBS expenditure on culture? If yes, state please concrete examples.
4(2) 12(8)
Bulgaria: proposal is to use the data of the group 09 only into 3rd levels, because of low statistical accuracy at 4th level Poland: national itemization (BBR/SRN), applied until 1998, is only partly comparable with COICOP, applicable since 1998 Spain: HBS, applied until 2005, is comparable with difficulties with HBS, applicable since 2006 Belgium: they pointed out that the HBS surveys have some problems with harmonization at Eurostat, using various methods to collect and treat data (Malta): all reported figures are in accordance with Eurostat HBS recommendations and ESA 95 definitions for final consumption expenditure
The principal constraints identified for the international comparability of the data are as follows.
The household budget survey does not lead to a unification of data collection. Conditions are different from one country to the other. That is not only true in terms of size of population, but also in terms of the financial resources made available to statistical offices. It is more costly to have statistical surveys than to use administrative data, and this is doubly true for those sample surveys carried out in households. The problems lie in financial intensity and at the same time in the little willingness of some households to monitor in detail and provide sensitive information about their management.

ESSnet‐CultureFinalReport
- 89
From the perspective of international data comparability one of the crucial problems is the fact that some countries apply a random sample for household selection, while other countries apply various modifications of a random sample. Households of some social groups (usually with very high or very low incomes) often refuse to be involved in the household survey, or are not able to participate in it (in the case of households with relatively low incomes).
A relatively large sample size is very important in order to get relatively reliable data, especially in various sorting methods and in case a detailed breakdown of the COICOP classification is applied (more than half of the countries). The sample size requirement is very closely linked to the financial burden implied by the survey.
The comparison of results over time is influenced by the fact that not all countries carry out household budget surveys every year. There are even cases where surveys are only carried out every five years. The periods covered by data collection on households may also vary, and this has an impact in terms of the frequency of consumption of various goods and services as well as on the prices.
Unlike public expenditure on culture, the unification of the approaches for data collection on household expenditure would not be so demanding and take so much time. On one hand it is entirely within the competences of the national statistical offices (of European countries) and coordinated by Eurostat but on the other hand a lack of financial resources may be a stumbling block. Without resources it will be almost impossible to make the necessary changes across all EU countries (random selection, adequate sample size, frequency of the survey).
As is the case for public expenditure, there is a possibility to have a rough comparison of household expenditure on culture by using the results of annual statistical surveys on receipts of cultural institutions. This is particularly the case for the receipts from entrance fees, the receipts for purchases of goods of cultural nature, financial donations and contributions of individuals, TV and radio license fees etc. However, this approach is considerably more complicated. The problem is that the financial resources of non-public (private) expenditures on culture are more diverse than resources of public expenditure. Along with households, foreign visitors or legal and other persons of all institutional sectors (except the sector S.13 – General government) come into play. But their expenditure would necessarily be strictly separate from non-public expenditure by means of well-chosen, sophisticated calculating procedures.
2. Methodology of improving the statistics on Public and Households expenditure on culture
Data collection within the meaning of these guidelines is based on the long-term needs of European institutions to compare expenditure on culture among the EU Member States (or in a wider international context). The desire to have comparable data on culture is indeed long lived. To achieve this aim it is important to have a shared set of definitions and concepts of what is meant by culture and by public (and private) spending on it. TF2 has created a draft framework for this purpose.

ESSnet‐CultureFinalReport
- 90
Harmonised data collection, coming from the EU Member States, should be organised by the EC and has - as its main objective - to provide information on all EU countries (possibly also on other European countries, non-members of the EU but willing to participate in the survey), concerning the area of expenditure on culture. The data would not be collected directly, but vould be delivered by representatives of the participating EU countries. Monitored data will reflect both the area of public expenditure and a substantial part of private expenditure in the form of household expenditure. Expenditure from enterprises and private institutions, which deliver cultural goods and services, are not considered for this initial phase.
2.1. A centralized methodologic model
2.1.1. Data sources Data sources are in principle twofold, namely:
statistical - based in particular on the relevant EU regulations and legal national rules and in the case of expenditure on culture concerning mainly household expenditure;
administrative - based primarily on national budget and in the case of expenditure on culture concerning mainly public expenditure.
In the case of statistical data, collection should take particular care to minimize non-response and qualitative grossing up (imputation) of data recorded in a sampling frame (basic population). Utilization of the administrative data has to be based on consolidated data, excluding the possibility of multiple counting of expenditures at different levels of the government.
2.1.2. Respondents and the person responsible Respondents in this context would be each individual EU country (respectively other States, which will eventually participate in the survey in question). One person should be responsible for the data provided. In most cases the representatives of the EU Member States will be the employees of the national statistical offices or other governmental institutions.
2.1.3. Types of questionnaires The common gathering information on the public expenditure on culture is designed in two phases. The first phase is expected to use simpler tables (at initial level), which the Member States would complete and then submit to Eurostat, completed within 15 months following the relevant reference year. In a second phase, a more elaborate table would be used to include detailed information (at target level): the period of its application and the submission deadline would be based on a agreement among Member States and the EU.

ESSnet‐CultureFinalReport
- 91
TF2 proposes two kinds of questionnaires to collect data on public expenditure and on household expenditure:
o Simplified questionnaires
Public expenditure = Table ‘Gross consolidated Public Expenditure on Culture’ (see Annex 5)
Households expenditure = Table ‘Households Expenditure on Culture, narrower version’ (see Annex 7)
o Detailed questionnaires
Public expenditure = Table ‘Gross consolidated Public Expenditure and Direct Receipts on Culture’ (see Annex 6)
Households expenditure = Table ‘Households Expenditure on Culture, broader version’ (see Annex 8)
The countries will present the data in the questionnaires for a period always determined in advance by Eurostat (usually corresponding to the calendar year).
2.1.4. Dates for submission of questionnaires The questionnaires would principally be PC processed and delivered in an electronic form to the Eurostat authorized person who will be responsible for the factual control of sent questionnaires and their further processing. The ‘simplified questionnaires’ would always be delivered within 15 months, following the relevant reference period. We understand this data collection to be as the pilot data collection, which would be based on voluntary participation of the EU Member States. A first pilot data collection within the area of public expenditure on culture was carried out in the scope of ESSnet-Culture on a trial basis for the reference year 2009 (or 2008, 2007, if the data for 2009 was not available) in March - April 2011. The next deadlines for sending completed questionnaires would be determined by Eurostat within an adequate time span.
2.1.5. Assimilation of collected information Established figures could be used by Eurostat and by other European and international institutions for analytical purposes. They might also be used by policy-markers of relevant countries in macroeconomic decision-making processes concerning the cultural sector in a European or international context.
2.1.6. Application of main cultural domains In relation with the work undertaken by TF1, TF2 proposes a set of cultural domains (incl. sub-domains) selected from the set of all domains. The domains (respectively sub-domains) in connection with public or households expenditure that will be corvered by data collections (and - consequently - the relevant variables or indicators) are:

ESSnet‐CultureFinalReport
- 92
Classification of the cultural domains proposed for the area of public expenditure
1. CULTURAL HERITAGE, ARCHIVES AND LIBRARIES
Heritage (museums, gallery collections and services etc.) Libraries services Archives services Other, not specified
2. BOOKS AND PRESS
Books Press Other, not specified
3. VISUAL ARTS
Original works + services Photography services Design services Other, not specified
4. PERFORMING ARTS
Performing arts events production and services Dancing and music schools Other, not specified
5. AUDIOVISUAL / MULTIMEDIA
Film Radio TV Audio-video Sound recordings Multimedia Other, not specified
6. ARCHITECTURE
7. ADVERTISING
8. ART CRAFTS
9. INTER-DISCIPLINARY
10. OTHER CULTURAL ACTIVITIES, NOT SPECIFIED ABOVE
The earlier mentioned list of cultural domains arises from the NACE-Rev.2 (2008) and CPA (2008) classifications.

ESSnet‐CultureFinalReport
- 93
In the case of cultural domains and sub-domains not having a corresponding breakdown of data within a given accountancy, we generally cannot avoid that a limited estimate of data is applied
Cultural domains proposed for the area of households expenditure
1. Equipment for reception, recording and reproduction of sound
2. TV sets, video-cassette players and recorders
3. Photographic and cinematographic equipment
4. Information processing equipment
5. Recording media for pictures and sound
6. Repair of audiovisual, photographic and information processing equipment
7. Musical instruments
8. Cinemas, theatres, concerts
9. Museums, zoological gardens and the like
10. TV and radio taxes and hire of equipment
11. Other services
12. Books
13. Newspapers
14. Stationery and drawing materials
15. Other cultural activities, not specified above
The above stated list of the cultural domain comes from the COICOP – HBS classification. In the case of cultural domains not receiving a corresponding breakdown of data from the HBS, we generally cannot avoid that a limited estimate of data is being applied.
2.2. Methodology of applicable sorting aspects, variables and indicators
2.2.1. The area of public expenditure
There are two types of public expenditure.
Government expenditure: the providers of this expenditure are identical with general government of public service; government can be seen on different levels, i.e. central, regional and local.
Other public expenditure: the providers of which are the entities outside the realm of government institutions, subsidizing the area of culture - these bodies are represented for example by different financial institutions (see ESA 95).

ESSnet‐CultureFinalReport
- 94
A summary of both types of public expenditure provides an overview of the structure of public expenditure as a whole. Collected data concern (without exceptions) the actual expenditure, not the planned expenditure, fixed on a budgetary basis; these two mentioned values are in practice considerably different especially with regards to capital expenditure.
Figure 7 - Financial flows (Direct expenditure/Receipts + Transfers)
Indirect expenditure, if it presents a loss for the treasury, will not be taken into account and incorporated in the data collection in this context, with indirect subsidies to the cultural sector (tax allowances, tax privileges, reduced rate of VAT, exemptions of the prescribed tax burdens etc.). Transfers of resources of the revenues from radios and TV license fees cannot be regarded as public expenditure and will be incorporated in household expenditure, although these fees are in many countries included in the budgets for the relevant year (see ESA 95).
2.2.1.1. Structure of public expenditure
The basic structure of public expenditure (government + other public) is as follows:
PUBLIC EXPENDITURE Current Capital
DIRECT
1. Goods and Services
2. Staff
3. Other
Investments
Central Government– Ministries – (S1311)
European Commission (S21)
Other public Institutions (S11, S12)
Regional Government(S1312)
Public central institutions’ expenditure
Local Government (S1313)
Direct Receipts (box office incomes, sponsoring, contributions, etc)
Non-profit or allowance institutions, Foundations,
Associations, etc (S15)
Households, Entrepreneurs, Corporations, etc (S11, S12, S14,)
Legend:
Direct Receipts
Transfers
Direct Expenditure
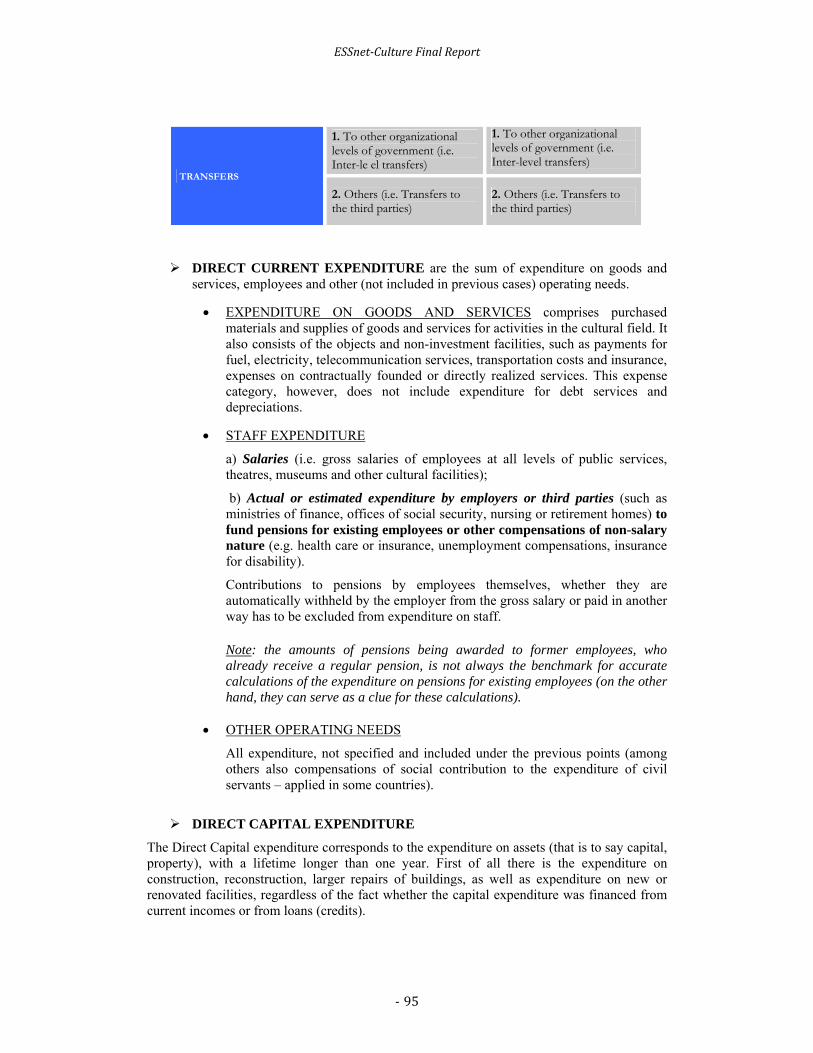
ESSnet‐CultureFinalReport
- 95
TRANSFERS
1. To other organizational levels of government (i.e. Inter-le el transfers)
1. To other organizational levels of government (i.e. Inter-level transfers)
2. Others (i.e. Transfers to the third parties)
2. Others (i.e. Transfers to the third parties)
DIRECT CURRENT EXPENDITURE are the sum of expenditure on goods and
services, employees and other (not included in previous cases) operating needs.
EXPENDITURE ON GOODS AND SERVICES comprises purchased materials and supplies of goods and services for activities in the cultural field. It also consists of the objects and non-investment facilities, such as payments for fuel, electricity, telecommunication services, transportation costs and insurance, expenses on contractually founded or directly realized services. This expense category, however, does not include expenditure for debt services and depreciations.
STAFF EXPENDITURE
a) Salaries (i.e. gross salaries of employees at all levels of public services, theatres, museums and other cultural facilities);
b) Actual or estimated expenditure by employers or third parties (such as ministries of finance, offices of social security, nursing or retirement homes) to fund pensions for existing employees or other compensations of non-salary nature (e.g. health care or insurance, unemployment compensations, insurance for disability).
Contributions to pensions by employees themselves, whether they are automatically withheld by the employer from the gross salary or paid in another way has to be excluded from expenditure on staff.
Note: the amounts of pensions being awarded to former employees, who already receive a regular pension, is not always the benchmark for accurate calculations of the expenditure on pensions for existing employees (on the other hand, they can serve as a clue for these calculations).
OTHER OPERATING NEEDS
All expenditure, not specified and included under the previous points (among others also compensations of social contribution to the expenditure of civil servants – applied in some countries).
DIRECT CAPITAL EXPENDITURE
The Direct Capital expenditure corresponds to the expenditure on assets (that is to say capital, property), with a lifetime longer than one year. First of all there is the expenditure on construction, reconstruction, larger repairs of buildings, as well as expenditure on new or renovated facilities, regardless of the fact whether the capital expenditure was financed from current incomes or from loans (credits).

ESSnet‐CultureFinalReport
- 96
2.2.1.2. Transfers
Transfers to other organizational levels of government, i.e. inter-level transfers, are the transfers of financial resources earmarked for the government department of culture, running among the different levels of public service management. A clear definition of such earmarked funds (in so-called consolidated form) is very important in order to avoid duplication, namely earmarking relevant financial resources for more than one destination. All amounts, occurring as transfers from one to another level of management of public service, should be reported as a receipt, at the level receiving funds, and vice versa as an expense at the management level, which is a provider of just mentioned financial resources. In this respect it is crucial that the transfer is marked as an inter-governmental transfer (as a prerequisite to be able to consolidate it).
Unspecified inter-level transfers (e.g. shares in yields, compensatory subsidies or
distribution of tax yields from the central level to the lower management level of a state or to other states) are not included in this economic category, even if such transfers are the resource that subsidizes funds of regional and local public bodies, which are earmarked for the financing of culture.
Other transfers (i.e. transfers to third parties) are any public subsidisations, targeted
at supporting cultural institutions (either public ones with a self-governing status or private ones) and their activities, or the transfers to individual artists. They are realized in the form of payments of government agencies to non-profit institutions which are responsible for purchases respectively for acquisition of cultural resources (e.g. the existence of state subsidizations or financial aids earmarked for theatres with a self-governing status. The theatres then use these financial aids towards paying salaries to employees and to purchase resources for cultural activities. The same subsidizations are intended for non-profit museums).
2.2.1.3. Receipts On one hand we take into account the direct receipts of those institutions, whose budget is part of the corresponding budgetary public-administrative level, and on the other hand the transfers from other levels of public service management.
Direct receipts
The direct receipts can be raised from households resources, from the resources of other private entities, EU funds, and eventually from other previously unspecified sources. One of the main components of the category of direct receipts are however the receipts of cultural facilities (theatres, cinemas, museums etc.), coming from individuals and institutions, and the contributions from sponsors.
2.2.1.4. Calculation of gross and net expenditure In order to determine net expenditure, we can see from following connections that the breakdown by an economic nature of expenditure on current and capital mingles with a further breakdown of direct expenditure and transfers:

ESSnet‐CultureFinalReport
- 97
GROSS EXPENDITURE = Current + Capital expenditure resp. = Direct expenditure (current + capital)
+ Transfers (current + capital) DIRECT EXPENDITURE = Gross expenditure – Transfers NET EXPENDITURE = Direct expenditure – Direct receipts
A fundamental analysis will always be carried out on a net expenditure basis. Unless the available data on direct receipts are based on net expenditures, the estimates should be taken from receipts coming from entrance fees and other direct receipts (especially for cultural fields, significantly affecting the total outputs). At the same time direct receipts from non-profit cultural institutions should not be included (because non-profit organizations complement their financial resources from the state budget).
Figure 8 - Calculation (structure) – Gross and net expenditure
Gross
Govern.exp.I.
II.
III.
Gross Gov.exp. (Direct Exp.+Transf.)
Net (Direct)Expenditure
Capital Current
Direct Expenditure
Capital Current
Transfers
Direct Receipts
Capital Current
Calculation (structure) – Gross and Net Expenditure
To the part I.D (Annex 1)
(box office incomes, sponsoring,contribution)
(Capital and Current)
2.2.1.5. Levels of general government The only levels of general government taken into account are the ones under direct responsibility of the legitimate government and with relevant management tools such as the annual budget, tax system; as well as the executive and elected bodies of state power. All expenditure on culture, realized at all levels of general government, have to be taken into account in accordance with a breakdown of domains or sub-domains, proposed in the individual rows of relevant tables. On the other hand, institutions playing the role of mediators between the administrative institutions in the process of allocating funds for culture will not be taken into account.

ESSnet‐CultureFinalReport
- 98
Expenditure, receipts and transfers should be classified into 3 consecutive levels of general government (these levels may be resulting from the NUTS classification).
1. CENTRAL National Usually corresponds to the NUTS 1
2. REGIONAL Region-province, territory-region resp. county, country...
Usually corresponds to the NUTS 2 & NUTS 3
3. LOCAL City, district, community... Usually corresponds to the NUTS 4 & NUTS 5
The data matrix should be submitted for each level of General government with data available and corresponding to the relevant level of management.
2.2.1.6. Sorting aspect The separate monitoring of receipts and expenditure components is the fundamental sorting aspect, which assesses the economic efficiency of cultural services along with basic economic indicators within the area of culture.
a) Public expenditure, already defined within previous chapters, are further broken down into current and capital by the level of General government, incl. all follow-up connections.
b) The providers of cultural services compose the area of receipts, in addition to the transfers from other levels of General government, of the direct receipts. These are following:
o receipts from households: they consist of financial resources from households, used in the area of culture and with a direct link to the HBS;
o receipts from other private entities: financial resources spent by private entities within the area of culture (e.g. tickets for theatres, concerts etc. by enterprises and institutions for their employees; donations from the enterprises);
o rubsidisations from earmarked EU funds: this specific resource is used primarily for the realization of the reconstruction, renovation and maintenance of historical buildings and to the implementation of important cultural events of international significance. These funds are always subjected to certain conditions for their release;
o receipts or subventions from other resources: the last resource is given to those cases, not covered by the previous 3 types of direct receipts.
c) Grand totals, at issue are the sums of relevant figures in individual rows and
columns of a corresponding table.

ESSnet‐CultureFinalReport
- 99
2.2.2. The area of households expenditure
It is important to note in an introduction that it is not the whole area of private expenditure on culture that is being monitored, but only a fundamental part in the form of household expenditure. The main reason for this is that we can only base the monitoring of households on a relatively reliable source tool, in the form of a household budget survey. Its reliability for comparable data is only relative, because the sample of households varies very significantly from country to country (the number of households investigated ranges from 1,500 to tens of thousands).
2.2.2.1. Basic characteristics of the household budget survey (HBS) The HBS monitors and provides information on the amount of spending as well as the structure of consumption, and it is the only source of information on the household expenditure in relation to the income. The range of usage of the HBS is very broad and it mainly serves as a basis for strategic decisions in the implementation of states social policy, for social and economic research and for international comparison. The sample unit and respondent unit is a household (housekeeping, managing) consisting of a group of people living together and sharing basic expenses (livelihood, household, maintenance of a flat etc.). The core of these households is usually a family, but it may be an individual or a group of individuals. The object of interest of the HBS is the spending and consumption habits of all household members. Such surveys usually also monitor other information on households (e.g. composition, income, furnishings).
2.2.2.2. Breakdown by basic variables We describe below basic variables, through which we are able (together with the determined indicators, using the outputs of the basic variables) to assess and subsequently compare the expenditure of household on culture internationally. We can even indirectly approach a participation of households (respectively their members) in cultural events. 5 variables are at issue:
o disposable (net) household income
To find out the disposable income, we need to subtract the following from the gross income: income tax, deductions for health insurance, contributions on social insurance of employees, self employed people and unemployed people (if legally obligatory), contributions on social insurance of employers and payments among households.
Of the 5 quintiles of completed data within relevant tables, only the marginal quintiles, i.e. the lowest and highest quintile, are of the main interest (note: one quintile is one fifth of the whole, i.e. 20%).

ESSnet‐CultureFinalReport
- 100
o working activities of household members
According to the working status of household members, households can be divided into two basic categories, namely:
a) households with working people - these are the households with at least one working person;
b) households without working people - household without a single working person. There may be noticeably different combinations of non-working members within the households; specifically for students without fixed income, pensioners or unemployed persons, regardless of the fact whether they receive job seekers' allowance or not).
o age of reference person
The reference person is the person with the most substantial contribution to the household income, and also usually completes the required information for the relevant household. This is the age of a reference person during the reference year, in which the survey is under way. Three different aggregated age groups could be considered (0 to 29, 30-64, 65+) which are often used in analysis of other surveys. The last two intervals were proposed with the assumption that 65 years will be the retirement age in most EU countries in the future.
o educational attainment of the reference person
This is the highest level of education, which the reference person has successfully completed at the time of the survey. The relevant level of education is based on the international classification ISCED.
3 aggregated ISCED levels of educational attainment are usually used in analysis:
Primary and lower secondary education (ISCED 1 and 2);
Upper and post secondary education (ISCED 3 and 4);
Tertiary education (ISCED 5 and 6).
o family size / number of children within household
In order to define the family structure the following categorization could be used:
Single person household - a person without other people sharing the same household;
Adult person with children - a parent or other person, who takes care of one or more children;
Two people (couple) with children - married or unmarried couple caring for one or more children;
Two people (couple) without children - married or unmarried couple without children;
Other family type - type of family, which does not fit into any of the preceding 4 groups (i.e. more than 2 adults sharing the same household and jointly caring for one or more children).
ESSnet‐CultureFinalReport
- 101
2.3. Indicators of public and households expenditure on culture
The submitted indicators can be derived from various data and calculated for the needs of individual countries as well as for international comparison and evaluation of development of expenditure on culture. Calculated indicators, taken from the TF2 questionnaires, can be created on a relatively large extent, depending on the availability of data and analytical needs. Of course, the practical usefulness of the indicators depends on the available data in the questionnaires (the data for individual domains or sub-domains will most likely create the greatest problems).
If the high-quality price index of cultural goods and services is available, the possibilities of indicators can extend by real dimension (in addition to the nominal dimension).
2.3.1. Public expenditure on culture In the initial version of the table ‘Gross consolidated Public Expenditure on Culture’ (see Annex 5) the following indicators can particularly be monitored and evaluated:
shares of government expenditure levels (broken down into current and capital) in total or within relevant domain;
relation between governmental expenditure and total public expenditure (again by type of expenditure or domains).
In the case of the target version of the same table (see Annex 6) the following options can be considered:
structure of current expenditure by levels of the government or by domains;
structure of direct expenditure and their relation to public expenditure (governmental and other public);
calculation of so-called net public expenditure on culture.
From the information, resources contained in the different tables (see annexes 5, 6, 7 and 8), can be monitored and evaluated:
relations of the total (respectively of the net public expenditure) and household expenditure (after adjusting to the whole population) on culture or more precisely expenditure by domains;
relation between direct expenditure (coming from private sources) and households expenditure (in total or by domains).
If other (economic) data on culture is at disposal (e.g. coming from compiled cultural accounts of the country), the following indicators can be monitored and evaluated:
public expenditure (overall or in a different classification) related to the total expenditure on culture, respectively to the total income of culture (or also by domains);

ESSnet‐CultureFinalReport
- 102
governmental public expenditure of personal nature in relation to staff expenditure from the cultural account (in total or by domains) or related to the number of employees in culture;
governmental or public capital expenditure to the total capital expenditure on culture coming from the cultural account (in total or by domains);
relation of governmental expenditure on goods and services, and staff expenditure to the added value, generated in the area of culture within results of the cultural account.
In relation to the data at macro level the following can be monitored and evaluated:
governmental or public expenditure (respectively net expenditure) in total or by domains per capita;
governmental or public expenditure (respectively net expenditure) in total or by domains in relation to the GDP;
governmental or public expenditure (respectively net expenditure) in total or by domains in relation to the state budget;
governmental or public capital expenditure in relation to the capital expenditure of the state budget.
2.3.2. Households expenditure on culture In the case of the narrower version of the table ‘Household Expenditure on Culture’ (see Annex 7) the following indicators can be monitored and evaluated:
relations of the expenditure among groups of households (broken down by the amount of disposable income - the first and fifth quintile, the age of reference person or educational attainment of reference person) in total and respectively for relevant domains;
relations of the expenditure of above mentioned groups of households to the total households expenditure (incl. the expenditure by domains);
dispersion of expenditure values within the relevant groups of households, both in total expenditure and by domains;
share of the households expenditure on culture in the total household expenditure respectively the relation to other types of expenditure (education, health, recreation, purchasing goods etc.);
average expenditure on culture per household. In the case of the broader version of the same table (see Annex 8), another option (beyond the above mentioned indicators) can be considered:
relation of the household expenditure can be similarly calculated by category related to working members and by the size of household
If other (economic) data on culture is at disposal (e.g. coming from compiled cultural accounts of the country), after adjusting the data from the average of one person to the household in total the following indicators can be monitored and evaluated:

ESSnet‐CultureFinalReport
- 103
relation of household expenditure on culture to the total expenditure on culture or to the incomes coming from culture (respectively by relevant domains);
relation of income on culture coming from households to the income on culture coming from other financial resources;
relation of household expenditure on culture to the total household income (by category related working and non-working);
relation of income on culture coming from household to the total household savings or to the GDP.
2.3.3. International comparaisons of indicators For the needs of international comparisons of indicators at EU level two types of indicators may be appropriate. The indicators of structural or relative nature are at issue (enabling a comparison of the problems associated with different monetary units), connected or not with the macroeconomic values, as well as the indicators reflecting the overall level of expenditure per unit of quantity (being related to the amount of the relevant expenditure). Within the first group the relation of public expenditure on culture to the total expenditure on culture and their share in GDP can be classified. Furthermore, the relation between public capital expenditure on culture and the total capital expenditure of the state budget; between the share of household expenditure on culture and the total household expenditure; between the relation of household expenditure on culture and other forms of household expenditure or dispersion of expenditure values on culture within the relevant groups of households. The second group of indicators suitable for international comparisons comprises the indicators per capita or per employee etc., such as public expenditure on culture per capita, public expenditure on personnel, or household expenditure per capita respectively household members (this data is directly resulting from the relevant tables). In addition to the above mentioned proposals it is possible to internationally compare data coming from Eurostat data collection on government expenditure by function (see part II, ‘Classification of functions of Government and analysis of the public expenditure of the culture’). (http://epp.eurostat.ec.europa.eu/portal/page/portal/government_finance_statistics/data/database)
3. Recommandations for future European works For future data collection and their international comparability it would be obviously useful to have a common definition of culture (cultural activities), to be respected by all EU countries and enabling a uniform approach within the EU. However, some leeway should be left for national decisions about the domains individual countries want to extend this minimal definition to (so as to respond to better fit their needs).
3.1. Public expenditures on culture
Public financial data are very important for the analysis of the national cultural policies but also to ensure a better follow up of the European Community support programmes to culture.

ESSnet‐CultureFinalReport
- 104
Despite the work and the recommendations of the former Task Force on financing culture in 2004, the availability of data on public financing remains always particularly problematic. The pilot survey conducted by TF2 on public expenditure shows that the data are frequently unobtainable or not comparable and that for some domains, the data are almost impossible to obtain, for example for architecture. To improve the aggregate data of Eurostat on cultural expenditure of the
public administrations
Within the framework of the procedure of notification of the excessive deficits (EC n°3605/93), Eurostat annually centralizes the budgetary data of the public administrations, including the expenditure of the public administrations assigned to culture. In order to ensure the comparability of the statistics on public finances of Member States, the National Statistic Institutes (NSI) collect and convert the financial data of the operating accounts of public administrations (central and local administrations) according to the classification of reference with regards to public finance, the Classification of the Functions of Government (COFOG). If the COFOG makes it possible to distinguish, in a consolidated way, central and local public expenditures, as well current and capital expenditures, its codes remains nevertheless too aggregated which complicates any analysis of the public expenditures by cultural domains of intervention. If a production of harmonized data on public finance of culture is possible through the European System of Accounts in order to evaluate the importance of culture compared to other fields of intervention of public policies and to evaluate its weight in public finances of the Member States of the UE27, then its use as a ‘operational statistical tool’ requires imperatively.
a) To assess the quality, the sources and the methods of transmission of the data on cultural expenditure of public administrations submitted by the INS to Eurostat, because it is essential to examine under which conditions the INS convert the data collected among national public administrations.
1) ESSnet-Culture recommends Eurostat to proceed to the assessment of the quality and comparability of statistics concerning culture, gathered through harmonised data collection on public finance (budgetary data on culture expenditure of the public administration).
b) To improve the level of aggregation of available data. In 2014, all Members States of the EU-27 will have the obligation to provide data at the 2 digits level of COFOG. Nevertheless this level (2 digits) is at present insufficient to identify public cultural expenditure because of the low number of headings which are entirely cultural, and the existence of headings which include simultaneously cultural, recreation and religion expenditure.
2) For the next revision of the COFOG, ESSnet-Culture recommends that Eurostat supports a better coverage of culture by COFOG through the adoption of more detailed cultural categories.

ESSnet‐CultureFinalReport
- 105
To improve the availability and collection of national data on cultural expenditures
In spite of the recommendations of the LEG-Culture (2000) and of Task Force of Eurostat on public finance of culture (2004), the work undertaken by TF2 shows, once more, that the availability of data on public expenditure on culture remains largely insufficient. Among many obstacles, we can observe the following:
o Joint collection of data on public expenditure on culture (within the EU) may be hindered by various obstacles jeopardizing the comparability of data, either in time or in space. These obstacles particularly consist in the different approaches adopted by the various countries;
o Another practical problem, connected with the classification used and the breakdown of budgeted items, is that the data of the ministries of Finance, drawn from the State budget may also include - in the data for culture - information regarding other sectors (e.g. Church, sports and political parties);
o It turns out that considerable divergences exist among countries in the application of COFOG classification. More than a third of countries do not apply this classification at all while other countries apply it in different depth (2-4 digit level);
o The degree of breakdown of cost items within public expenditure on culture also differs in some countries according to cultural domains. A clear definition of the domains belonging to culture is advisable. National practices differ as well;
o Many countries have not been surveying so-called direct receipts in connection with public expenditure and furthermore probably no country is able to quantify the so-called indirect public expenditure (tax and other allowances), which however occur very often;
o The comparability of long-term time series (when available) has been permanently impaired by frequent methodological, organizational and accounting changes;
o For some countries, national cultural expenditure are only limited to the expenditure of the culture ministries and don't include the expenditure by other ministries.
The data collection on national budgetary expenditure is essential to measure the weight and the evolution of the public expenditure in each European country, but also to evaluate the share of the public expenditure devoted to heritage, the museums, the libraries or to the performing arts. These financial data offer a level of detail which is impossible to reach at the time being with the use of the COFOG classification only.
3) The gathering of data requires well-coordinated and systematic methods to allow
meaningful comparisons. ESSnet-Culture recommends that Eurostat intensifies its efforts to allow data collection on public expenditures, allocated by the various levels of government to the various cultural domains, using the methodology, developed by TF2.

ESSnet‐CultureFinalReport
- 106
To study the conditions of development of satellite accounts on the culture
The experience of Spain and Finland with regards to the implementation of satellite accounts for culture made it possible for these countries to measure the economic importance of culture compared to other economic sectors. Nevertheless, the development of satellite accounts on culture requires important conceptual and empirical works.
4) ESSnet-Culture recommends to put in place a Task Force with the aim of
establishing necessary requirements and standards for the development of satellite accounts on culture in Europe. This Task Force would bring together experts in cultural statistics and national accounting.
3.2. Household expenditure on culture The harmonization of household budget surveys has not led yet to a unification of data collection at the EU-level. From the perspective of international data comparability one of the crucial problems is that some countries apply a random sample for household selection, while other countries apply various modifications of a random sample. A relatively large sample size is very important in order to get relatively reliable data, especially in various sorting methods and in case a detailed breakdown of COICOP classification is applied. The sample size requirement is very closely linked with the financial burden implied by the survey. The periodicity of the surveys varies as well among countries and comparaison of results over time is influenced by methodological changes.
5) The works of the TF2 showed how interesting the European survey on the
household budget (HBS) is to determine the level of cultural expenditures by individuals. ESSnet-culture recommends a greater harmonisation of the national surveys on the households’ budget and a better coverage of culture by using the most detailed level of the COICOP classification.

ESSnet‐CultureFinalReport
- 107
4. Annexes TF2 Annex 1
Table 8 – Overall overview of the questionnaires: public expenditure and direct receipts
Czech Republic
Austria Bulgaria Denmark France Luxemburg Poland Portugal Slovenia Spain Sweden Switzerland Turkey
1. Application of the COFOG
National version CZ-COFOG from 1997; main fields: 080+0802+0803
It is applied for budgeting process to the 3 digit levels; main fields: 08.20+08.30
So called ‘bridge tables’ link National Budget Classification with COFOG at 2 digit levels
It is applied for describing of the national Accounts at national level (the code 08), but for public expenditure have not been using up to now
It is applied only ex post, but not for cultural domains up to now (no national adjustment)
Is not used for the budgetary analysis of the public expenditure; It is not applied, but a national classification is used: Cofog benelux.
It is not applied, but a national classification is used; public expenditure is classified according to the 5 digits codes in 2 main fields (921 and 925)
It is applied in National Accounts to the 4 digit levels; main field : 08.02
It is applied (no national adjustment) and main fields : 08 - 08.2 and 08.3
It is applied (no national adjustment) and main fields : 08.2.0 and 08.3.0
It is applied for describing of the national Accounts at national level (the code 08), but for public expenditure have not been using up to now
It is applied since 2008, using 4 main fields (stated : degrees?), but they will be defined in a near future
It is appliedsince 2005; 1 main field - the first two digits are coded and the rest of all 4 are not coded
2. Levels of government sector on public expenditure
3 levels (central, regional + local)
3 levels (central, provincial + local)
2 levels (central = Ministry of Culture and Finance + local = municipalities)
3 levels (central, regional + local)
4 levels (central, regional, sub-regional and local)
2 levels (central + local)
4 levels -ministry, regional, poviat (=1.local) and gmina (=2.local)
2 levels (central + local)
2 levels (central + local)
3 levels (central, regional + local)
3 levels (central, regional + local)
3 levels (central, regional + local)
2 levels (central + local)
3. Other participating institutions in public expenditure
Exist (associations, unions etc.)
Exist (association of banks, union etc.)
Exist - by transfers from all government levels to these types of institutions
Exist (without nearer specification) - by means of transfers
Exist (without nearer specification) - by means of transfers
Exist (without nearer specification) - by means of transfers through ordinary, extraordinary or additional budgets
Exist - by means of transfers to private entities (e.g. Non-governmental organizations - Polish Film Institute)
Exist (without nearer specification) - by means of transfers
Exist -associations, unions etc.
Exist (without nearer specification) - by means of transfers
Exists - there has been since 1994 a foundation, funding projects in cultural domain (but formally closed in 2008)
Exist (without nearer specification) - by means of transfers
Exist - many institutions (see our questionnaire)
4. Breakdown of the direct government expenditure
1.current 2.capital 3.transfers
1.personnel 2.current goods +services 3.transfers 4.capital (exceptionally)
1.current (personnel, goods and services and other), 2.capital (direct, financial liabilities and other) 3.transfers
Only current. Comment - for some of the state-owned institutions (archives, national libraries etc.) exist details on receipts from all governmental levels
Different for central level (only personnel + other expend.) and for next 3 levels (current and capital expend. - nearer specification : questionnaire)
1.current (personnel etc.) 2.capital (investments, purchasing of collections and works of arts) 3.transfers
1.current 2.capital 3.subsidies and subventions 4.provisions for natural persons 5.project co-financed by the EU 6.transfers
For each domain and sub domain exist: 1.current (personnel, other); 2.capital; 3.transfers.
1.current 2.capital 3.transfers (comment : for some domains exist personnel expenditure, not always)
1.current (personnel, goods and services and other), 2.capital (direct, financial liabilities and other) 3.transfers
Only current. Comment - for some of the public institutions (museums, libraries, some theatres etc.) exist details on receipts from all governmental levels
1.current (personnel, goods and services and other), 2.capital (own investment, loans and participations) 3.transfers
Only current(personnel, goods and services, financial and current transfers)
5. Procedure, leading to consolidation of public expenditure
Exists - double counting eliminated
Exists - double counting eliminated
Any consolidation among central and local levels
Exists - double counting eliminated
No consolidation among central and other 3 levels; consolidation is only among levels regional, sub-regional and local, but only for the last survey 2006
Any consolidation between central and local level, but ministry of Culture establishes comparison tables and tries to eliminate double-counting
Exists - double counting eliminated
Exists - double counting eliminated
Exists - double counting eliminated
Exists - double counting eliminated
It is not quite unambiguous: - at central level - consolidated - at regional and local levels (by means of surveys) - there are only supposed to be net sums (by asking for that)
Exists - double counting eliminated
Exists - double counting eliminated
4. An
nexes T
F2

ESSnet‐CultureFinalReport
- 108
6. Existence of the indirect government expenditure
Exist - many types of tax allowances, incl. exemption from taxation (VAT) for several commodities
Exist - lower tax rates (e.g. VAT) for several commodities
Exist - tax allowances and lower rates of VAT (with the exception of books)
Exists - a zero-rate of VAT on newspapers and museums entrance
Exist - tax allowances and lower rates of VAT
Exist - tax allowances and lower rates of VAT
Exist - e.g. publishers are exempt from the VAT
Exist - lower rates of several taxes (e.g. VAT)
Exist - several types : 1.in the scope of VAT 2.donations, patronat and sponsoring 3.tax incentives for artists
Exist - lower rates of several taxes (e.g. VAT)
Exist - different kinds of lower rates of VAT
Exists - special VAT rate for cultural activities
Exist - lower rates of several taxes (e.g. VAT)
7. Existence of the mixed institutions
Exist - so called cultural houses or centers at regional and local level
Exist - funded at each of the 3 levels
Exist (without nearer specification)
Exist (without nearer specification)
Exist - cultural houses and the like
Exist -multidisciplinary cultural centers, operating on both public levels
Exist - cultural houses, centers, clubs etc. (financed from government budgets at different levels)
Exist (without nearer specification)
Exist (without nearer specification)
Exist - cultural houses and the like
Exist (without nearer specification)
They do not know exactly - it will be founding out in the future
Exist (without nearer specification)
8. Existence of the surveys on receipts (direct or of cultural institutions)
Exist within 11 surveys - 6 types of receipts (revenues, contributions, grants, subsidies etc.)
Exist - provided to individual persons or institutions
Exists - survey of household budget for total expenditure (there are also the data for receipts of the cultural institutions from governmental sector)
Does not exist (are not collected)
Does not exist (are not collected)
Exist - the institutions operating direct receipts use these incomes to enlargement of cultural offer
Exist - as for public cultural institutions with own legal status (about 25% of all institutions included in the survey)
Does not exist (are not collected)
Exist within 8 surveys - many types (own sources, sources from internal sponsors and donators, foreign sources, internal budgets, EU financial sources)
Exists - survey "Statistics on Public Expenditure and Financing on Culture" reports direct receipts of cultural institutions of the governmental sector
Exist - data collection from museums, libraries, some theatres, dance and/or music institutions
Exist - from governmental sector each year - the amounts coming from private entities, plus household expenditure
Does not exist (are not collected)
9. Existence of time series -public expenditure
Exist - related to government institutions (from 1995), to Ministry of Culture (from 2003) and to regionally autonomous complexes (from 2001)
Exist - since 1995 to2007; indicators for total public + sub domains + per head + others
Exist - COFOG data from 2000 year
Exist about 30years, but in consequence of the changes in the scope of state accounting system in 2007 is not possible to make comparisons.
Exist, but differently : a) as for central level - yearly estimation since 2000, b) as to other 3 levels - available databases are for years 1993,1996,2002,2006
Exist - since 1995 limited data collection, however from 2003 to 2006 completed data collection (a lot of indicators incl. special funds = investment funds, special laws etc. and incl. transfers to local authorities)
Exist - since 1995
Exist - since 1996, but only for local expenditure; main indicator is Local Public Expenditure on Culture (total, current and capital)
Exist -depending on level : - since 1997 at Ministry of Culture - since 2001 at governmental level - since 2006 at local level
Exist - since 2000 (last data for 2007); main indicator is Public expenditure on culture, provided by each level + indicators derived from expenditure
Exist - since 1975; the main indicators have varied through the years
Exist - since 1990 (until 2002 many indicators within our questionnaire), since 2003 the same indicators, enriched by 2 new - amounts of the expenditure in % of GDP + by type of expendit.
Do not exist
10. Specification of meaningful circumstances with an impact on public expenditure
No answer Compendium project (organized by Council of Europe+ERICArts)
No answer Very different accounting in the municipalities, especially on the housing (in some cases the rent for theatres is included into expenditure, in other cases is not)
No answer No available information
No answer The public expenditure on radio, architecture and educational activities are not included in the Public Expenditure and Financing on Culture
No answer The public expenditure on radio, architecture and educational activities are not included in the Public Expenditure and Financing on Culture
No answer They answered "to be discussed"
The main problem is to decompose cultural expenditure and receipts by macro domains and sub-domains + solution of coding of the third and fourth level

ESSnet‐CultureFinalReport
- 109
Annex 2
Table 9 – Table of availability of data: public expenditures on culture
Domains (and subdomains) COFOG code
GOVERNMENT LEVEL PUBLIC
INSTITUTIONS
Central Regional Local Current expend.
Capital expend. Current
expend. Capital expend.
Current expend.
Capital expend.
Current expend.
Capital expend.
CULTURAL HERITAGE - Historical monuments - Museums - Archeological activities (sites) - Other
ARCHIVES
LIBRARIES
BOOKS & PRESS - Books - Press
VISUAL ARTS - Visual arts (incl. design) - Photography - Multidisciplinary
ARCHITECTURE
PERFORMING ARTS - Music - Dance - Musical theatre - Theatre - Multidisciplinary - Other performing arts
AUDIOVISUAL & MULTIMEDIA - Film - Radio - TV - Video - Sound recording - Multimedia
OTHER RELATED AREAS
Notes: 1) All transfers should be excluded (in order to have consolidated data) 2) Do not feed any figures into table, only in case of occurrence of available data source put into relevant cell a cross (= letter ‘X’) 3) In case of the other related areas, if they are existing, specify them and put into relevant cell a cross as well

ESSnet‐CultureFinalReport
- 110
Annex 3 Table 10 – Table of availability of data: financial sources of culture - Receipts
Domains (and subdomains)
GOVERNMENT LEVEL
PRIVATE
SOURCES
NON-PROFIT
INSTITUTIONS
AND DONORS Central Regional Local
Currentreceipts
Capitalreceipts
Currentreceipts
Capitalreceipts
Current receipts
Capital receipts
CULTURAL HERITAGE - Historical monuments - Museums - Archeological activities (sites) - Other
ARCHIVES
LIBRARIES
BOOKS & PRESS - Books - Press
VISUAL ARTS - Visual arts (incl. design) - Photography - Multidisciplinary
ARCHITECTURE
PERFORMING ARTS - Music - Dance - Musical theatre - Theatre - Multidisciplinary - Other performing arts
AUDIOVISUAL & MULTIMEDIA - Film - Radio - TV - Video - Sound recording - Multimedia
OTHER RELATED AREAS
Notes: 1) All transfers should be excluded (in order to have consolidated data) 2) Private sources: receipts from the market incl. households (e.g. entrance fees) 3) Do not feed any figures into table, only in case of occurrence of available data source put into relevant cell a cross (= letter ‘X’) 4) In case of the other related areas, if they are existing, specify them and put into relevant cell a cross as well

ESSnet‐CultureFinalReport
- 111
Annex 4
Table 11 – Overall overview of the questionnaires: HBS expenditure
Czech Republic
Austria Bulgaria Denmark France Germany Luxembourg Poland Portugal Slovenia Spain Sweden Switzerland Turkey
1. Every year frequency of the HBS realization
Yes No (5 years
period) Yes Yes
No (5 years period)
Yes Yes Yes Yes Yes Yes Yes Yes Yes
2. Main sampling strategy within the HBS :
- Random - Yes - Yes Yes - Yes Yes - Yes Yes Yes Yes Yes
- Stratified - Yes Yes - - - Yes Yes Yes Yes Yes - Yes Yes
- Multistage - Yes Yes - - - - Yes Yes Yes Yes - - Yes
- Quota sampling/Non-random Yes - - - - Yes - - - - - - - -
3. Reference period All year All year All year All year All year All year All year All year All year All year All year All year All year All year
4. Application of the COICOP Yes Yes Yes Yes Yes
National classification
is close to the COICOP
Yes Yes Yes Yes Yes Yes Yes Yes
5. Consideration of the HBS into the future (in the case of not application of the HBS)
Not relevant Not relevant Not relevant Not relevant Not relevant Not quite relevant
Not relevant Not relevant Not relevant Not relevant Not relevant Not relevant Not relevant Not relevant
6. Monitoring of the expenditure items of the group 09 into 4th levels (according to COICOP - HBS 2003)
Yes Yes Yes Yes Yes
A breakdown into 4th levels is possible
Yes Yes Yes Yes Yes Yes Yes Yes
7. The level of monitoring according to the COICOP (in the case of not monitoring of the expenditure as stated at question 6.)
Not relevant Not relevant Not relevant Not relevant Not relevant Not quite relevant
Not relevant Not relevant Not relevant Not relevant Not relevant Not relevant Not relevant Not relevant
8. Application of the retrospective inquiry at some expenditure items (within group 09)
No No No No No No Yes No Yes Yes No No No Yes
9. Making use of a national itemization, deeper than at the COICOP - HBS
Yes No No Yes Yes Yes No No Yes Yes No Yes No Yes
10. Specification of meaningful circumstances with an impact on private expenditure
0 0
Proposal is to use the data of the group 09 only into 3rd levels (because of low statistical accuracy at 4th levels)
0 0 0 0
National itemization (BBR/SRN), applied until 1998, is only partly comparable with COICOP, applicable since 1998
0 0
HBS, applied until 2005, is comparable with difficulties with HBS, applicable since 2006
0 0 0

ESSnet‐CultureFinalReport
- 112
Annex 5 Table 12 – Gross consolited public expenditure on culture, Initial version
In thousand of national currency or EUR
Domains (and subdomains)
GOVERNMENTAL LEVEL OF EXPENDITURE OTHER PUBLIC EXPENDITURE TOTAL PUBLIC EXPENDITURE
Central (C) Regional (R) Local (L) Total (C+R+L)
Current Capital Current Capital Current Capital Current Capital Current
+ Capital
Current Capital Current
+ Capital
Current Capital Current
+ Capital
CULTURAL HERITAGE, ARCHIVES & LIBRARIES - Heritage(1) - Libraries services - Archives services - Other, not specified BOOKS & PRESS - Books - Press - Other, not specified VISUAL ARTS - Original works + services - Photography services - Design services - Other, not specified PERFORMING ARTS - Performing arts events production & services - Dancing and music schools - Other, not specified AUDIOVISUAL & MULTIMEDIA - Film - Radio - TV - Audio-video - Sound recording - Computer games - Other, not specified ARCHITECTURE ADVERTISING ART CRAFTS INTER-DISCIPLINARY OTHER CULTURAL ACTIVITIES (2)
TOTAL VALUES
(1) Heritage: museum and gallery collections and services etc. (2) Other cultural activities not specified above.

ESSnet‐CultureFinalReport
- 113
Annex 6 Table 13 – Gross consolited public expenditure and direct receipts on culture, Target version
In thousand of national currency or EUR
Domains (and subdomains)
GOVERNMENT LEVEL OF EXPENDITURE OTHER PUBLIC
EXPENDITURE TOTAL PUBLIC
EXPENDITURE DIRECT RECEIPTS
Central (C) Regional (R) Local (L) Total (C+R+L)
Curent
Cap
ital
Current
Cap
ital
Current
Cap
ital
Cur
rent
Cap
ital
Cur
rent
+ C
apita
l
Cur
rent
Cap
ital
Cur
rent
+ C
apitt
l
Cur
rent
Cap
ital
Cur
rent
+ C
apita
l
Pri
vate
sou
rces
EU
fou
nds
Oth
er s
ourc
es
Tot
al
Goo
ds &
se
rvic
es
Per
sonn
el
Oth
ers
Goo
ds &
se
rvic
es
Per
sonn
el
Oth
ers
Goo
ds &
se
rvic
es
Per
sonn
el
Oth
ers
CULTURAL HERITAGE, ARCHIVES & LIBRARIES - Heritage - Libraries services - Archives services - Other, not specified BOOKS & PRESS - Books - Press - Other, not specified VISUAL ARTS - Original works + services - Photography services - Design services - Other, not specified PERFORMING ARTS - Performing arts events production & services - Dancing and music schools - Other, not specified AUDIOVISUAL & MULTIMEDIA - Film - Radio - TV - Audio-video - Sound recording - Computer games - Other, not specified ARCHITECTURE ADVERTISING ART CRAFTS INTER-DISCIPLINARY OTHER CULTURAL ACTIVITIES
TOTAL VALUES

ESSnet‐CultureFinalReport
- 114
124BAnnex 7 Table 14 – Households expenditure on culture, Narrower version
Annual average per person (in national currency units or EUR)
Domains
HOUSEHOLDS EXPENDITURE SUBDIVIDED BY BASIC VARIABLES
HOUSEHOLDS TOTAL
Households by level of disposal icome (quintiles)
Households by age of reference person Households by attained education of
reference person
Lowest 20%
Highest 20%
Under 29 30-64 65 and over Primary +
lower secondary
Upper + Post
secoundary Tertiary
Equipment for reception, recording and reproduction of sound
Television sets, video-cassette players and recorders
Photographic and cinematographic equipment
Information processing equipment
Recording media for pictures and sound
Repair of audiovisual, photographic and information processing equipment
Musical instruments
Cinema, theatres, concerts
Museums, zoological gardens and the like
Television and radio taxes and hire of equipement
Other services
Books
Newspapers
Stationery and drawing materials
Other cultural activities, not specified above
TOTAL VALUES
Note: Primary and lower secondary (ISCED 1+2), Upper and post secondary (ISCED 3+4), Tertiary (ISCED 5+6)

ESSnet‐CultureFinalReport
- 115
Annex 8 Table 15 - Households expenditure on culture, Broader version
Annual average per person (in national currency units or EUR)
Domains
HOUSEHOLDS EXPENDITURE SUBDIVISED BY BASIC VARIABLES
Households total
Households by level of disposal income (quintiles)
Households byworking activities
of household members
Households by age of reference person
Households by attained education of reference person
Households by family size / number of children
Lowest 20%
Highest 20%
With working persons
Without working persons
Under 29
30-64 65 and over
Primary + lower
secondary
Upper + Post
secoundary Tertiary Person
alone
Adult with
children
Couple with
children
Couple without children
Another type of
household
Equipment for reception, recording and reproduction of sound
Television sets, video-cassette players and recorders
Photographic and cinematographic equipment
Information processing equipment
Recording media for pictures and sound
Repair of audiovisual, photographic and information processing equipment
Musical instruments
Cinema, theatres, concerts
Museums, zoological gardens and the like
Television and radio taxes and hire of equipement
Other services
Books
Newspapers
Stationery and drawing materials
Other cultural activities, not specified above
TOTAL VALUES
Note: Primary and lower secondary (ISCED 1+2), Upper and post secondary (ISCED 3+4), Tertiary (ISCED 5+6)

ESSnet‐CultureFinalReport
- 116
126BAnnex 9 Table 16 – Results of the pilot survey - Gross consolidated public expenditure on culture
Domains & sub-domains
AUSTRIA BULGARIA
Government level of expenditure Other public expenditure
Government level of expenditure Other public expenditure Central (C) Regional (R) Local (L) Central (C) Regional (R) Local (L)
Current Capital Current Capital Current Capital Current Capital Current Capital Current Capital Current Capital Current Capital
Cultural heritage - Heritage - Libraries services - Archives services - Other
Books & Press -Books
- Press - Other Visual arts - Original works - Photogrphy services - Design services - Other
Performing arts - Performing arts events - Dancing and music schools - Other
Audiovisual & multimedia
- Film - Radio
- TV - Audio-video - Sound recordings - Multimedia - Other
Architecturre
Advertising
Art crafts
Interdisciplinary
Orther cultural activities
Reference period (data availability) 2009 2009
Problems with application of the COFOG
The COFOG classification is applied for the Public Expenditure only in accordance with S13 of the ESA 95; for other economic sectors in link with S 21, S 11, S12, S14, S15 of the ESA 95 exist only partial data within the tables on Belgian national accounts.
-
Comments in general !!! The data are available only within the code 08 and moreover as a whole, i.e. together Culture, recreation and religion, broken down further into 3 levels of governmental expenditure (then each of them into ‘current’ and ‘capital’)
Legend: = data available None = data do not exist

ESSnet‐CultureFinalReport
- 117
Domains & sub-domains
CYPRUS CZECH REPUBLIC
Government level of expenditure Other public expenditure
Government level of expenditure Other public expenditure Central (C) Regional (R) Local (L) Central (C) Regional (R) Local (L)
Current Capital Current Capital Current Capital Current Capital Current Capital Current Capital Current Capital Current Capital
Cultural heritage
- Heritage
- Libraries services
- Archives services
- Other
Books & Press
-Books - Press - Other
Visual arts - Original works - Photogrphy services - Design services - Other
Performing arts - Performing arts events - Dancing and music schools - Other
Audiovisual & multimedia - Film - Radio - TV
- Audio-video - Sound recordings - Multimedia - Other Architecturre
Advertising
Art crafts
Interdisciplinary Orther cultural activities Reference period (data availability) 2008 2009
Problems with application of the COFOG
Cyprus is applying the COFOG classification, but with some exceptions.
-
Comments in general The regional level of governmental expenditure is not applicable (it is out of the question).

ESSnet‐CultureFinalReport
- 118
Domains & sub-domains
DENMMARK ENGLAND
Government level of expenditure Other public expenditure
Government level of expenditure Other public expenditure Central (C) Regional (R) Local (L) Central (C) Regional (R) Local (L)
Current Capital Current Capital Current Capital Current Capital Current Capital Current Capital Current Capital Current Capital
Cultural heritage - Heritage - Libraries services - Archives services - Other
Books & Press None None None None None None None None-Books None None None None None None None None- Press None None None None None None None None- Other None None None None None None None None
Visual arts
- Original works - Photogrphy services - Design services - Other
Performing arts - Performing arts events - Dancing and music schools - Other
Audiovisual & multimedia - Film - Radio - TV - Audio-video - Sound recordings - Multimedia - Other
Architecturre None None None None None None None None
Advertising None None None None None None None None
Art crafts
Interdisciplinary
Orther cultural activities
Reference period (data availability) - 2008
Problems with application of the COFOG
They do not apply the COFOG codes for a compilation of the Public expenditure on Culture
-
Comments in general No delivery of the pilot survey despite a lot of reminders
England: not all United KingdomDomain Curtural heritage, archives and libraries - sub-domain Other, not specified includes ‘Heritage and Historic Environment’; Domain Visual arts includes ‘Performing Arts’ and ‘Art crafts’, which are further within the domains structure the indipendant domains; Last category Other cultural activities, not specified above includes 'Regional cultural consortium’ .

ESSnet‐CultureFinalReport
- 119
Domains & sub-domains
ESTONIA FINLAND
Government level of expenditure Other public expenditure
Government level of expenditure Other public expenditure Central (C) Regional (R) Local (L) Central (C) Regional (R) Local (L)
Current Capital Current Capital Current Capital Current Capital Current Capital Current Capital Current Capital Current Capital
Cultural heritage - Heritage - Libraries services - Archives services - Other
Books & Press -Books - Press - Other
Visual arts - Original works - Photogrphy services - Design services - Other
Performing arts - Performing arts events - Dancing and music schools - Other
Audiovisual & multimedia - Film - Radio - TV - Audio-video - Sound recordings - Multimedia - Other
Architecturre
Advertising
Art crafts
Interdisciplinary
Orther cultural activities
Reference period (data availability) 2009 2008
Problems with application of the COFOG - -
Comments in general Domain Curtural heritage, archives and libraries - sub-domain Other, not specified includes ‘Protection of national heritage (Muinsuskaitse)’; Domain Books and press - sub-domain Other, not specified includes ‘Broadcasting and publishing services’; Domain Performing arts - sub-domain Dancing and music schools includes also ‘Children's music and art schools’.
The regional level of governmental expenditure is not applicable (it is out of the question); They are not able to calculate consolidated expenditure, it means expenditure at ‘net’ level; The data are available from Finnish Cultural satellite.

ESSnet‐CultureFinalReport
- 120
Domains & sub-domains
FRANCE GERMANY
Government level of expenditure Other public expenditure
Government level of expenditure Other public expenditure Central (C) Regional (R) Local (L) Central (C) Regional (R) Local (L)
Current Capital Current Capital Current Capital Current Capital Current Capital Current Capital Current Capital Current Capital
Cultural heritage - Heritage - Libraries services - Archives services - Other
Books & Press -Books - Press - Other
Visual arts - Original works - Photogrphy services - Design services - Other
Performing arts - Performing arts events - Dancing and music schools - Other
Audiovisual & multimedia - Film - Radio - TV - Audio-video - Sound recordings - Multimedia - Other Architecturre
Advertising
Art crafts
Interdisciplinary Orther cultural activities Reference period (data availability) 2006 2007
Problems with application of the COFOG
Annual administrative source about expenditure and incomes exists, but the breakdown is by the domains and sub-domains coming from the LEG classification - therefore is not possible in most cases fill in the data within determined structure of the domains and sub-domains.
-
Comments in general France has the available data only at Total values and of it the total expenditure within the only domain ‘Cultural heritage, archives and libraries’ at all 3 levels (central, regional and local), but without a break down of the expenditure at central level into ‘current’ and ‘capital’.
Domain Cultural heritage, archives and libraries - sub-domain Heritage includes data of the ‘Visual arts’ and sub-domain Other, not specified includes data of ‘Libraries and archives services’; Domains Performing arts and Audiovisual/Multimedia includes within sub-domains Other, not specified the expenditure, which are not available separately (i.e. at Performing arts – ‘Theatres, dance, music and music schools’ and at Audiovisual/Multimedia – ‘Radio and TV broadcasting’); Domain Interdisciplinary includes the expenditure for art colleges (Kunsthochschulen); Last category Other Cultural activities, not specified above includes the expenditure of ‘Books and Press’ and ‘Cultural administration, foreign affairs and promotion of literature’.

ESSnet‐CultureFinalReport
- 121
Domains & sub-domains
HUNGARY LATVIA
Government level of expenditure Other public expenditure
Government level of expenditure Other public expenditure Central (C) Regional (R) Local (L) Central (C) Regional (R) Local (L)
Current Capital Current Capital Current Capital Current Capital Current Capital Current Capital Current Capital Current Capital
Cultural heritage - Heritage - Libraries services - Archives services - Other
Books & Press -Books - Press - Other
Visual arts - Original works
- Photogrphy services - Design services - Other
Performing arts - Performing arts events - Dancing and music schools - Other
Audiovisual & multimedia - Film - Radio - TV - Audio-video - Sound recordings - Multimedia - Other
Architecturre
Advertising
Art crafts
Interdisciplinary
Orther cultural activities
Reference period (data availability) 2009 2009
Problems with application of the COFOG
- -
Comments in general The regional level of governmental expenditure is not applicable (it is out of the question).Domain Cultural heritage, archives and libraries - sub-domain Heritage includes also ‘Zoological and botanical gardens’ and sub-domain Other, not specified includes ‘Cultural centres and halls, amusement parks and other community centre activities’; Domain Books and press - sub-domain Books includes ‘Sound recordings’.
Latvia has not available data at ‘Local level’ of govermental expenditure (and ‘Regional level’ is out of the question), but the given data at ‘Local level’ are the data only as ‘Total values’ (separately for ‘current’ and ‘capital’), which are not furter broken down into relevant domains. Domain Visual arts - sub-domain Other, not specified includes ‘Art school’; Domain Performing arts - sub-domain Other, not specified includes also the expenditure of ‘Original works and services, which not available separately’; Domain Audiovisual/Multimedia - sub-domain Other, not specified includes the expenditure of ‘Radio and TV branch, which has not split between radio and TV’.

ESSnet‐CultureFinalReport
- 122
Domains & sub-domains
LITHUANIA LUXEMBOURG
Government level of expenditure Other public expenditure
Government level of expenditure Other public expenditure Central (C) Regional (R) Local (L) Central (C) Regional (R) Local (L)
Current Capital Current Capital Current Capital Current Capital Current Capital Current Capital Current Capital Current Capital
Cultural heritage - Heritage - Libraries services - Archives services - Other Books & Press -Books - Press - Other
Visual arts - Original works - Photogrphy services - Design services - Other
Performing arts Performing arts events Dancing and music schools - Other
Audiovisual & multimedia - Film - Radio - TV - Audio-video - Sound recordings - Multimedia - Other Architecturre
Advertising
Art crafts
Interdisciplinary
Orther cultural activities
Reference period (data availability) 2009 2006
Problems with application of the COFOG
- -
Comments in general Lithuania has not available data at ‘Regional level’, which are out of the question. Domain Audiovisual/Multimedia - sub-domain Other, not specified includes the expenditure of ‘Radio and TV branch, which has not split between radio and TV’.
Domain Cultural heritage, archives and libraries - sub-domain Heritage includes the expenditure of ‘Historical monuments’ and sub-domain Other, not specified involves the expenditure of ‘Luxemburgish language’; Domain Interdisciplinary includes the expenditure of ‘Sociocultural and interdiciplinary activities’; Part of ‘Other public expenditure’ includes "National Cultural Funds expenses (FOCUNA), supplied by sponsorship and the revenues from the state lottery".

ESSnet‐CultureFinalReport
- 123
Domains & sub-domains
MALTA NETHERLANDS
Government level of expenditure Other public expenditure
Government level of expenditure Other public expenditure Central (C) Regional (R) Local (L) Central (C) Regional (R) Local (L)
Current Capital Current Capital Current Capital Current Capital Current Capital Current Capital Current Capital Current Capital
Cultural heritage - Heritage - Libraries services - Archives services
- Other
Books & Press -Books - Press - Other
Visual arts - Original works - Photogrphy services - Design services - Other
Performing arts Performing arts events Dancing and music schools - Other
Audiovisual & multimedia - Film - Radio - TV - Audio-video - Sound recordings - Multimedia - Other
Architecturre
Advertising
Art crafts
Interdisciplinary
Orther cultural activities
Reference period (data availability) 2009 2008
Problems with application of the COFOG
- -
Comments in general Malta has not available data at ‘Regional level’, which are out of the question. Part of Other public expenditure involves ‘Public Broadcasting Authority’ and ‘Mediterranean Conference Centre’ (both entities are publicly owned and they are classified outside the General Government Sector).
At issue are not consolidated data (the transfers among relevant levels of government are not excluded!). The Netherlands has not available data at ‘Regional level’, which are out of the question. All expenditure (without exception), within relevant domains and sub-domains, cannot be divided into requested parts ‘current’ and ‘capital’ and therefore total expenditure are stated within ‘current’ expenditure (at ‘central’ and ‘local’ level as well). Domain Other cultural activities, not specified above includes ‘Art accommodations, art education and other arts’.

ESSnet‐CultureFinalReport
- 124
Domains & sub-domains
POLAND PORTUGAL
Government level of expenditure Other public expenditure
Government level of expenditure Other public expenditure Central (C) Regional (R) Local (L) Central (C) Regional (R) Local (L)
Current Capital Current Capital Current Capital Current Capital Current Capital Current Capital Current Capital Current Capital
Cultural heritage
- Heritage
- Libraries services
- Archives services
- Other
Books & Press -Books - Press
- Other
Visual arts
- Original works
- Photogrphy services
- Design services - Other
Performing arts Performing arts events
Dancing and music schools
- Other
Audiovisual & multimedia
- Film
- Radio
- TV
- Audio-video
- Sound recordings - Multimedia - Other
Architecturre
Advertising
Art crafts
Interdisciplinary
Orther cultural activities
Reference period (data availability) 2009 2009
Problems with application of the COFOG
They do not apply the COFOG codes for a compilation of the Public expenditure on Culture -
Comments in general
‘Regional level’ of the governmental expenditure is corresponding to the autonomous region of Madeira (at this time the expenditure of autonomous region of Azores are not available). Domains Inter-disciplinary and Other cultural activities, not specified above involve ‘Socio-cultural activities’ (supports to cultural associations, traditional crafts etc.), ‘Cultural infrastructures’ (Cinema, Theatre and Other cultural infrastructures) and ‘Other cultural expenditure’ (Administration and other related activities).

ESSnet‐CultureFinalReport
- 125
Domains & sub-domains
ROMANIA SLOVENIA
Government level of expenditure Other public expenditure
Government level of expenditure Other public expenditure Central (C) Regional (R) Local (L) Central (C) Regional (R) Local (L)
Current Capital Current Capital Current Capital Current Capital Current Capital Current Capital Current Capital Current Capital
Cultural heritage
- Heritage
- Libraries services
- Archives services
- Other
Books & Press -Books - Press
- Other
Visual arts - Original works
- Photogrphy services
- Design services - Other
Performing arts Performing arts events
Dancing and music schools - Other
Audiovisual & multimedia
- Film
- Radio
- TV - Audio-video - Sound recordings - Multimedia - Other
Architecturre
Advertising
Art crafts
Interdisciplinary
Orther cultural activities
Reference period (data availability) 2009 2009
Problems with application of the COFOG
- -
Comments in general The data are available only within the code 08 as a whole, i.e. together Culture, recreation and religion.
Slovenia has not available data at ‘Regional level’, which are out of the question.

ESSnet‐CultureFinalReport
- 126
Domains & sub-domains
SPAIN SWEDEN
Government level of expenditure Other public expenditure
Government level of expenditure Other public expenditure Central (C) Regional (R) Local (L) Central (C) Regional (R) Local (L)
Current Capital Current Capital Current Capital Current Capital Current Capital Current Capital Current Capital Current Capital
Cultural heritage - Heritage - Libraries services - Archives services - Other
Books & Press -Books - Press - Other
Visual arts - Original works
- Photogrphy services - Design services - Other
Performing arts Performing arts events
Dancing and music schools - Other
Audiovisual & multimedia - Film - Radio
- TV
- Audio-video - Sound recordings - Multimedia - Other
Architecturre
Advertising
Art crafts
Interdisciplinary
Orther cultural activities
Reference period (data availability) 2008 2009
Problems with application of the COFOG
- They do not apply the COFOG codes for a compilation of the Public expenditure on Culture.
Comments in general The most substantial is the fact, that Spanish source ‘Statistics on Public Expenditure and Financing on Culture (Ministry of Culture)’ does not include ‘Public expenditure on radio and TV’ (moreover public expenditure on design services, architecture, advertising, art crafts and educational activities in the different sectors). Domain Visual arts - sub-domain Other, not specified includes the expenditure of ‘Combined exhibitions of painting and photography’; Domain Audiovisual/Multimedia - sub-domain Other, not specified involves the expenditure of ‘Combination film, audio or video’, not included into previous relevant sub-domains; Domain Inter-disciplinary includes the expenditure of ‘Cultural promotion, diffusion and cooperation, and administration and general services’.
Part of Other public expenditure includes ‘Licence fees for public radio and TV’ (it is not possible to involve relevant expenditure connected with public radio and TV into domain Audiovisual/Multimedia and its sub-domain Radio or TV, because these are mainly founded through obligatory licence fees from the public) and so called ‘Popular education’ (it is not possible to involve it into relevant domains or sub-domains at some levels of governmental expenditure - it means e.g. Higher education in the cultural field).

ESSnet‐CultureFinalReport
- 127
Domains & sub-domains
SWITZERLAND TURKEY
Government level of expenditure Other public expenditure
Government level of expenditure Other public expenditure Central (C) Regional (R) Local (L) Central (C) Regional (R) Local (L)
Current Capital Current Capital Current Capital Current Capital Current Capital Current Capital Current Capital Current Capital
Cultural heritage
- Heritage
- Libraries services
- Archives services
- Other
Books & Press -Books - Press
- Other
Visual arts
- Original works
- Photogrphy services
- Design services
- Other
Performing arts Performing arts events
Dancing and music schools
- Other
Audiovisual & multimedia
- Film
- Radio
- TV
- Audio-video
- Sound recordings
- Multimedia
- Other
Architecturre
Advertising
Art crafts
Interdisciplinary
Orther cultural activities
Reference period (data availability) 2008 2009
Problems with application of the COFOG
- -
Comments in general Expenditure connected with Domain Books and press are the part of the Domain Audivisual/Multimedia (of totals).
Turkey has not available data at ‘Regional level’, which are out of the question. Domain Performing arts - sub-domain Dancing and music schools is part of ‘Cultural education’.


ESSnet‐CultureFinalReport
- 129-
TASK FORCE 3
CULTURAL INDUSTRIES
At the launch of the ESSnet-Culture project, one of the Task Forces was named ‘Cultural industries’, and its aim in grant agreement was formulated as follows:
The focus of the Task Force will be on the framework of the domain and the elaboration of definitions, delimitations, criteria and recommendations, taking into consideration work that already has been achieved on this specific subject.
The aim of the Task Force on cultural industries is the preparation of proposal for production of a core data set concerning the cultural/creative industries, including cultural employment.
The long term objective of the Task Force is to prepare the right track for a regular periodical production of coherent and comparable indicators on the level and the characteristics of cultural industries, which are comparable for all EU Member States.
The exchange of good practices and experiences as well as a close collaboration with the other task forces and international bodies is the guaranty for the realization of these goals.
1. Policy needs In 2010, the European Commission released the Green Paper ‘Unlocking the potential of cultural and creative industries’(26) that explored ways to reinforce international or regional cooperation and develop efficient activities in the so-called cultural and creative industries sector. The Green Paper launched a consultation whose objective was ‘to gather views on various issues impacting the cultural and creative industries in Europe, from business environment to the need to open up a common European space for culture, from capacity building to skills development and promotion of European creators on the world stage’(27). While thinking about an EU strategy for the sector we must admit that the potential and heterogeneity of the sector is considerable. This also means that the way the sector is mapped and covered with statistical tools or indicators varies between Member States. One of the conclusions of the Green Paper is that the cultural and creative industries sector has a potential that can contribute to achieving the challenges of the EU2020 strategy and reinforce the competitiveness of the European economy. It is thereby important to elaborate some internationally comparable evidence-based arguments and, to do that, to create a way to evaluate how statistics could support our common goals today and what could be the most relevant guidelines in the nearest future.
(26) http://ec.europa.eu/culture/our-policy-development/doc/GreenPaper_creative_industries_en.pdf (27) http://ec.europa.eu/culture/our-policy-development/doc2577_en.htm

ESSnet‐CultureFinalReport
- 130-
The first question to ask is how we can measure cultural impacts in different economic activities. The last decade offered some widely used theoretical frameworks to describe and structuralize the characteristics of the cultural sector. Despite the empirical theoretical effort one question still remains the same. What kind of data and evaluation systems provide us with the necessary information we need to measure different kinds of cultural impacts and spill-over effects? It is very important to recognize the importance of this work because in the context of the EU but also at national and regional level, measuring the impact of supporting mechanisms has become essential. The question of impacts and mapping spill-over effects or practices is equally important to entrepreneurs, investors and policy framework providers. But cultural impacts are not the only dimension to keep in mind. It is also crucial to have an overview of the situation and evolution of different sub-fields. We today still miss some detailed information about sub-fields that quite often expect flexible and operational reaction. More detailed and systematically updated figures are one of the key elements in the process of better and more efficient policies. We should observe economic characteristics of the cultural sector. The Study on the economy of culture in Europe, conducted by KEA (2006)(28) is a good and one of the most often quoted example of how to present the current situation in EU Member States. The study gives an overview about the contribution of the sector to the general economy, cultural consumption, cultural employment and data about productivity and profitability of the sector as well as various additional aspects. While describing the methodological challenges and data availability the authors nevertheless admit that the situation regarding statistical data is not optimal and that its improvement needs a revision requiring international cooperation. The latest initiative to fill that gap is this project ESSnet-Culture(29) which among other tasks also analyzes statistical sources that describe culture, cultural industries, cultural employment as well as other dimensions (expenditure on culture, cultural practices) (see work of other Task Forces). One of the most relevant issues today concerns employment. In a period of economic crisis, the question of jobs is in the spotlight of different policies. The KEA study referred earlier says that in year 2004 the employment in the cultural sector (including the cultural tourism sector) amounted to 5,885 million people in the EU (3,1% of the employed population). Keeping in mind the global nature of culture and the mobility aspects, it is very important to observe developments in the labour market and provide necessary support to the entrepreneurs in order to raise their competitiveness and position in the market. We also need to know relations between the educational systems and expectations of employers in the cultural sector. If we want to gather statistics about the mobility and results of horizontal business environment measures including finding qualified labour force, then it is more realistic to raise international potential of the sector. And finally there is the issue of the comparability of data. Cultural and creative industries can be defined in many ways. It is possible to structure them by using sub-fields but we can also observe different functions or the ways how entrepreneurs position themselves. There is also a variety of approaches regarding understanding what is and what is not a sub-field of the sector. So any kind of general indicators (e.g. % of GDP) needs some additional background information before reaching any final conclusion. On the other hand, this variety is not necessarily a negative aspect because different cultural traditions and consumption practices will always affect that kind of overviews. The challenge is more to find some critical factors
(28)http://ec.europa.eu/culture/keydocuments/doc873_en.htm#bad_nodepdf_word/economy_cult/executive_summary.pdf (29)http://www.essnet-portal.eu/culture-1

ESSnet‐CultureFinalReport
- 131-
that need to be compared in order to create EU mechanisms leading to quality results. These indicators don’t have to cover the whole sector across the EU. What is important is that they give us some classifications and figures which are interpreted in a synchronized way. ESSnet-Culture is one of these methods to provide such kind of concepts. Speaking about the policy needs, the EU2020 strategy(30) has also to be kept in mind as it sets the targets of development in Europe for the next decade. There are five general targets in the EU2020 strategy and for each of them it would be useful to see the contribution of the cultural sector:
o Employment - What is the share of the cultural sector and the cultural occupations in total employment? What is the role cultural sector on engaging people with higher skills and education as well as improving balance between various social groups (e.g. gender);
o R&D/innovation - How does culture contribute to the economic growth and competitiveness of Europe? The study made within the ESSnet-Culture on spillover effect indicators also refers to the potential of innovative ideas in the cultural sector that contributes to the research and development as well as innovation in other sectors;
o Climate change/energy: lowering greenhouse gas emissions, renewable energy implementation, energy efficiency increase - Culture’s contribution to climate change is mainly about how culture does help to disseminate the ideas of sustainable growth and development as well as lowering green gas emission and promoting energy saving and renewable energy use;
o Education: Reducing early leaving from education and training, increasing the percentage of 30-34 -year-olds with tertiary education - the role of culture in education and lifelong learning is also a topic of growing interest;
o Poverty/social exclusion: reducing the people in or at risk of poverty and growing social inclusion - The role of culture in promoting social inclusion is a topic that concerns culture in several different dimensions e.g. employment and social participation.
As the result of outstanding experience and cooperation between Member States and Eurostat, we already have today a number of European harmonised sources of data on cultural sector (e.g. LFS). It is now the time to improve these statistics and to create an enhanced evidence-based platform for better and efficient policy framework.
(30) http://ec.europa.eu/europe2020/targets/eu-targets/index_en.htm

ESSnet‐CultureFinalReport
- 132-
2. Cultural and creative industries from a statistical point of view
2.1. The role of cultural and creative industries in current debates
Reflecting on the scope of ‘Cultural and Creative Industries’ is not a strategically neutral endeavour. For political actors, the cultural and creative industries have gradually become ‘strategic activities for modern post-industrial societies, based on knowledge and experience’. All these activities are more promising in terms of growth and employment compared to numerous other activity sectors, while also strengthening the principles of identity and cultural diversity. Since the end of the 20th century, an increasing number of countries have developed policies to promote these industries. It was however the UK that invented the expression ‘creative industries’ to provide economic legitimacy for cultural policies that favoured creativity from an economic point of view. The approach developed by the Department for Culture, Media and Sport (DCMS) in 1998 and in 2001 is thus based on a definition of creative industries as activities having ‘their origin in individual creativity, skill and talent, and which have a potential for wealth and job creation through the exploitation of their intellectual property’. From a semantic point of view, various definitions of the cultural economy and the field of so-called cultural or creative industries exist, depending on whether a statistical, economic, sociological, or political approach is chosen(31). Thus, depending on the chosen approach, one speaks of artistic industries, arts industries, arts and cultural industries, arts and entertainment industries, audiovisual industries, knowledge industries, content industries, entertainment industries, imagination industries, leisure industries, media industries, industries based on artistic or literary property, and copyright-based or copyright industries. As for defining the scope of sectors, we observe that the limits of cultural and/or creative industries remain vague, and vary according to the definitions and approaches used. At an international level, we can thus favour certain criteria over others, just as the World Intellectual Property Organization (WIPO) bases the scope of cultural industries on the criteria it is responsible for, i.e. copyrights and the protection of authors’ rights. The WIPO thus defines creative/cultural industries as copyright-based industries. Similarly, we can adopt a very wide scope as UNESCO does, which favours cultural products and services that are part of international commerce, or advocate the approach taken by the OECD, which places content industries and the information economy at the heart of its definition. We also take note of national approaches, where States favour specific fields of cultural activities according to their own economic sectors or cultural traditions. Some of the most representative approaches are:
o the British approach, which advocates the economic concept of ‘The Creative Industries’ in which creativity is placed at the heart of production processes, and which considers the products as intellectual property (and not only as copyrights);
(31) K. Segers, E. Huijgh ‘Clarifying the complexity and ambivalence of the cultural industries’, Gent: Re-creatief Vlaanderen, working paper 2006-02, 2006, http://www.vub.ac.be/SCOM/cemeso/download/cemeso-08-complexity%20ambivalence%20cultural%20industries.pdfH

ESSnet‐CultureFinalReport
- 133-
o the French ‘Cultural industries’ approach - also referred to as the "content industry" - which is both economic and statistical, and which is based on mass reproduction and copyrights;
o the Scandinavian economic approach, ‘The Culture and Experience Economy’, which is largely based on technological progress such as the internet that facilitate access to and the distribution of cultural products.
Table 17 - Summary of the national approaches of the Creative and Cultural Industries
‘Creative industries’ approach
‘Copyright industries’ approach
‘Experience economy’ approach
‘Sector’ approach, Cultural industries or sector specific studies
Austria Flemish Community
of Belgium Denmark (2000) Estonia Latvia (2005) Lithuania Sweden (2002) Romania Bulgaria United-Kingdom
Denmark (2006) Finland Hungary Latvia (2005) Norway
Sweden (2004) Denmark (2003)
French Community of Belgium
France Ireland Luxembourg Poland Portugal Slovak Republic Spain
Source: KEA, ESSnet-Culture process In his contribution ‘Concepts of creative industries and creative economies: What are the issues?’(32), Philippe Bouquillon shows that the profusion of definitions and approaches remains an issue if the economic contribution of this field is to be examined and measured. Just like the European statistical framework, the cultural and creative industries require a practical approach based on clear and quantifiable concepts that can lead to consensus at the EU level.
2.2. Definition of cultural and/or creative industries as part of TF3
In recent years, the economic sector of cultural and creative industries has aroused much attention from many European countries. The number of countries and regions concerned is continually increasing, despite the fact that the sector - in its complexity - is by no means easy to comprehend, due to its heterogeneous nature and increasing fragmentation, not to mention the specific economic plans that have been successfully introduced in the culture and creative industries. Different Directorates General of the EU Commission have recently broached the issue of the cultural and creative industries. As part of the follow-up to the above-mentioned Green Paper, the discussion about suitable measures has for example led to the creation of a ‘European Creative industries Alliance’, whose aim is to involve all key stakeholders on both a European and a Member State level. The European cultural and creative industries debate has also (32) See Part II : Specific developments

ESSnet‐CultureFinalReport
- 134-
benefited from an important strategic impetus provided by the Commission’s recent competitiveness report(33). The report highlights the innovative capacity of these industries and argues the sector’s case as one of Europe’s leading industries. Such an appraisal of the matter is always a pleasure to read. More importantly, however, it calls for the development of a clear, evidence-based foundation for the cultural industries.
2.2.1. Existing working definitions of the cultural industries In the attempt to develop a standardised pan-European definition of the cultural industries, it makes sense to find a common denominator which can be used by all relevant European stakeholders. This common denominator must allow for the necessary statistical uniformity while respecting current regionally diverse approaches. A pragmatic approach would help here; enabling us to describe the core elements of the cultural industries is a plausible way, and thus meeting with the approval of the many professional, political, economic and scientific stakeholders concerned. Before discussing the methodical way of systematically defining both the concept and the boundaries of these industries, we should firstly introduce and evaluate three of the most important current working definitions used in Europe.
a) Cultural and creative industries according to the Green Paper The Commission Green Paper defines the cultural and creative industries as follows:
“‘Cultural industries’ are those industries producing and distributing goods or services which at the time they are developed are considered to have a specific attribute, use or purpose which embodies or conveys cultural expressions, irrespective of the commercial value they may have. Besides the traditional arts sectors (performing arts, visual arts, cultural heritage – including the public sector), they include film, DVD and video, television and radio, video games, new media, music, books and press. This concept is defined in relation to cultural expressions in the context of the 2005 UNESCO Convention on the protection and promotion of the diversity of cultural expressions. ‘Creative industries’ are those industries which use culture as an input and have a cultural dimension, although their outputs are mainly functional. They include architecture and design, which integrate creative elements into wider processes, as well as subsectors such as graphic design, fashion design or advertising”. (34)
The Green Paper is primarily based on the above-mentioned KEA study. However, contrary to the KEA study, which focuses on the economic impact of the entire cultural industries, the Green Paper takes the culture sector as a whole and refers to it as the ‘cultural and creative industries’. In so doing, the Green Paper conveniently classes the artistic branches, such as the visual and performing arts for example, under the umbrella of the cultural industries. The KEA study, however, does not consider either of these vulnerable artistic branches as belonging to the cultural industry sector.
(33) European Competitiveness Report 2010 - Innovation and the creative industries in the EU. (34) EU Commission (2010): Green paper. Unlocking the potential of cultural and creative industries, p5.
ESSnet‐CultureFinalReport
- 135-
As a result of this affiliation of predominantly public-funded branches of the cultural industries, the authors of the Green Paper needed to assimilate both the corporate and public sector organisations into the conceptual definition of the cultural and creative industries. However, this amalgamation of market economy and public sector cultural organisations within the definition may lead to profound structural problems in the field of cultural policy. Theatres, museums and libraries etc. that have been publicly funded and financed in the past, will now find themselves together with commercial organisations under the concept of ‘cultural industries’. This can be somehow problematic. The working definition of the Green Paper should probably be accompanied by some additional explanation on the complexity of the content of this concept. In particular, it would be useful to draw a clear distinction between public and market economy activities and analyse the relationship between these two e.g. whether the publicly funded sub-sector produce innovations that the market-based sub-sector takes advantage of, or vice versa.
b) Creative and cultural industries according to the European Cluster Observatory
The European Cluster Observatory (ECO), which is also funded by the EU, produced an up-to-date study on Europe’s creative and cultural industries with the aim of identifying the fundamental creative industry clusters existing in all of the 27 Member States. This empirical study defines the creative and cultural industries using the following terms:
‘For the purposes of this report we use the following definition of creative and cultural industries: those concerned with the creation and provision of marketable outputs (goods, services and activities) that depend on creative and cultural inputs for their value’.(35)
The study places the term ‘creative industries’ first and foremost to underline the market economy perspectives of the industry as a complex whole. The particular economic activities that are considered by the authors as tending more towards a cultural nature, such as libraries, museums or cultural heritage for example, are purposefully excluded in the conceptual definition, so as to minimise the amalgamation with cultural structures of the more publicly-funded culture segments. Excluding the cultural segments from the creative industries debate makes it clear in which conflictual area the creative industries as a whole are caught up. Whilst the definition should consider those commercial activities that can be more easily associated with creative activities in the general sense or with distinctly commercial activities within the cultural industries, those segments that cannot easily be described as commercial activities should, as far as possible, be excluded. The appraisal of the ECO study illustrates the opposing position of the authors of the Green Paper. Whilst the working definition of the Green Paper brings the commercial and public culture sectors together under one umbrella, the ECO authors separate the different parts of the potentially commercial cultural activities without any prior assessment. Bringing together these two definitions highlights the debate which surrounds the cultural industries. The following section aims to situate the notion of the ‘cultural industries’ within
(35) Priority Sector Report: Creative and Cultural Industries - Methodological Appendix; Dominic Power, Uppsala University, Tobias Nielsén, Volante QNB Research, March 2010 - deliverable D9-1; Conceptual definition, p.3.

ESSnet‐CultureFinalReport
- 136-
the conflictual situation of the culture sector and advance towards a composite definition of the concept in clear, economic terms.
2.2.2. Notes about the definition of boundaries The NACE classification system of economic activities is a tool that allows the entire economic structure within the European Union to be assessed and categorised according to systematic characteristics. The classification system provides all Member States with a specific degree of economic activities (the so-called four-digit level). Other European States (for example, Switzerland and Turkey etc.) have also latched on to the NACE classification model. The most important economic activities in relation to the statistical definition of the boundaries of the cultural industries can be found in the two NACE sections ‘J - Information and communication’ and ‘R - Arts, entertainment and recreation’. In addition, certain economic activities can be found isolated within other sections. Because these sections contain many economic activities that are not of a cultural nature, for example, the telecommunications industry or recreation, a higher range of economic activities specifically concerned with cultural industries is required. The NACE classification model typically distinguishes between the more general and the more specific levels: sections and divisions (one and two-digit levels), groups (three-digit level) and classes (four-digit level). Contrary to the traditional activities of the car, chemical and machine-building industries, which can be statistically represented in their own sections or divisions, the economic activities of the cultural industries are spread out within different sections, divisions, group and classes, which very often mix cultural and non-cultural activities. As a rule, it is therefore necessary to go to a high level of detail (at least four-digit level) in the classification in order to capture these activities from a statistical point of view. The range of economic activities that are connected to the cultural industries must be expressed in terms of the smallest units, and classified in the economic activities or in the terms of the classification model, using the so-called classes with their 4-digit codes. According to the TF1 framework on cultural statistics, the following 30 or so economic activities that can be entirely or predominantly considered as activities relating to the cultural industries have therefore been assigned to the core area of the cultural industries at the four-digit level. The compilation of the list of the 30 or so economic activities is the second step necessary in defining the cultural industries, without fully or adequately defining it as a market-oriented or commercial segment. This is due to the fact that the key statistical concept of ‘economic activities’ in the NACE classification model does not exclusively equate to market-oriented or commercial activities. The concept of ‘economic activities’ also has a strong focus on the activities of the non-profit and non-commercial markets. For example, the economic activities of theatres and museums comprise all commercial, public and not-for-profit organisations and institutions.

ESSnet‐CultureFinalReport
- 137-
Selection of statistical data sources for the cultural industries The statistical classification system of economic activities (NACE) leaves no scope for differentiating between profit and not-for-profit activities. Both the structural business statistics (SBS) and labour force survey (LFS) serve as key data sources at the EU-level. In addition, the short-term business statistics (STS) and national accounts (NA) provide sources of raw data. The latter two data sources should be considered rudimentary references for the analysis of the cultural industries as they are limited to the 2-digit level, rather than the in-depth 4-digit level required. The two most important data sources, the SBS and the LFS, will be discussed below in terms of their usefulness within the cultural industries. The following characteristics apply to the SBS data source.
The SBS is a predominantly market-oriented statistical reference that, on the European front, contains an adequate degree of classification at the four-digit level, and can therefore be used when defining the boundaries of economic activities within the cultural industries.
However, the SBS’s use is limited due to the fact that only two-thirds of the 30 or so core economic activities of the cultural industries are covered. The remaining eight economic activities predominantly belong to section R which is not covered by the SBS regulation.
All of the following sub-segments and market segments can be classed as cultural industries markets according to the SBS: publishing industry, film/video industry, sound recording industry, broadcasting industry, news agencies, architectural market, advertising market, design, photographic and translation activities, retail sale of books, newspaper, music and video recordings.
The market segments of performing arts, artistic creation, library and archives activities, museums activities and historical heritage cannot be analysed using the SBS data source. A larger analysis (taking into account e.g. public or subsidised institutions) requires consultation of national data sources (mainly the Member States’ business registers).
The SBS provides a database that can be used as an unambiguous statistical reference with a clear focus on market-oriented activities, and which covers most part of the cultural industries. The market segments that are not covered by the SBS need to be completed with national statistics, which as a rule, are provided by the corresponding national business registers. It is important to bear in mind that even the national business registers don't always make a clear distinction between profit and non-profit activities. The following characteristics apply to the LFS data source.
The EU-LFS provides, at the best, a three-digit level of NACE Rev.2 and, therefore, cannot be easily linked to the four-digit level of the cultural industries concept.
An analysis of the cultural industries must therefore pool the national LFS data into a common data bank. An estimated value for four-digits codes could be provided to those Member States that only possess three or two-digit levels, based on four-digit data existing some other countries.

ESSnet‐CultureFinalReport
- 138-
Contrary to the SBS, the EU-LFS is not a statistical reference for only marked-oriented sector. It covers all of the economic activities, including both market- and non-market -oriented activities;
The EU-LFS is of limited use for the analysis of the employment characteristics of the cultural sector due to its limitation to the three-digit level. If it were possible to raise the member states’ existing databases up to the four-digit level, it would be possible to analyse the culture industry for the majority of the member states.
2.2.3. Conclusion Any future methodological evolution of the cultural industries concept needs to lend consideration to at least four additional tasks.
1. Maintaining the open conceptual definition with the acceptance of new sub-markets and market segments.
2. Developing the degree of classification from a 4-digit to a 5-digit level structure, which is often possible on a national level within the Member States. This will allow a description of the relevant economic sub-sectors.
3. Reconsolidating economic activities to a 2-digit level is possible without having any serious impact on the number of economic activities in the reclassification model, currently numbering around 30. This consolidation model is necessary, in order to allow smaller member states and Interreg regions a clear and comparable statistical baseline for the cultural industries.
4. Extending the notion of the cultural industries to include specific creative sectors, so as to remain part of the international creative industries debate.
The particular impact that the cultural industries concept has on the development of clear, political strategies and measures is critical for the entire European culture sector, in terms of both the cultural and economic policies of the future. ESSnet-Culture observes that there are various concepts on Cultural Industries in Europe, very difficult to move closer, and that the term of Cultural and Creative Industries (CCIs) is very widely used in the EU-policy, it is thus necessary to find a consensus for the economic study of the cultural sector. So, ESSnet-Culture suggests defining statistically the particular concept of Cultural and Creative Industries by the only activities included in the framework for cultural statistics, defined by the TF1. The CCIs as defined by the ESSnet-Culture framework on culture include ten cultural domains (Heritage, Archives, Libraries, Books and Press, Visual Arts, Performing Arts, Audiovisual & Multimedia, Architecture, Advertising, Art & Crafts) based on the economic functions of creation, production & publishing, dissemination & trade, preservation, education, management & regulation. With this approach, software and ICT sectors are not included in the cultural and creative industries. Finally, if the concept of cultural and creative industries covers the market activities and the non-market activities of the cultural sector, it replies as well to the possibilities of coverage of statistics: EU-LFS does not allow distinction of market and non-market sector, whereas SBS

ESSnet‐CultureFinalReport
- 139-
describe only market. ESSnet-Culture strongly recommends when speaking about ‘Cultural Industries’ and ‘CCIs’, to clearly mention the sectors that are covered and sources of data used.
3. Cultural employment The initial work on cultural employment that the LEG-Culture conducted from 1997 to 1999 demonstrated the importance of culture for the European economy, and led to a set of specific recommendations aiming to measure and study cultural employment. Task Force 3 has developed the methodology of the cultural employment to the next level, bringing together cultural occupations as well as cultural economic activities and creating possibility to analyse these on four digit level of ISCO and NACE. The Eurostat will use the recommendations of the Task Force 3 as a base to produce regularly cultural employment statistics that is harmonised on European level. This method for assessing cultural employment uses the results of the EU Labour Force Survey (LFS), which is based on a sample of households in all EU Member States (as well as in the candidate countries and the EFTA), and is structured around two reference classifications: the NACE (‘Nomenclature générale des Activités économiques dans les Communautés Européennes’) which classifies the employer’s main activity, and the ISCO (‘International Standard Classification of Occupations’) which classifies occupations. This methodology leading to an estimation of cultural employment covers cultural sector and cultural occupations. It provides the possibility to compare the data with other sectors (mainly within services) and with overall employment in Europe. The results from the EU-LFS allow to characterize cultural employment by different variables such as gender, age, employment status, working time, educational attainment, permanency of jobs, the (non-)existence of a secondary professional activity, work at home etc. Successive numerical assessments of cultural employment from 2004 to 2007 have demonstrated a relatively stable proportion of cultural employment in the whole employment in the EU (approximately 2,5% of cultural jobs in total employment), with some differencies between countries. The Pocketbook on cultural statistics published in 2011 used another methodological approach as concerns cultural employment and 2009 data can not be compared with those from the previous years. In fact, the matrix of cultural employment elaborated in 2003 based on classification versions in force in the years following 2000 – namely on NACE Rev.1 and ISCO-88 - can no longer be used, as these versions are now outdated. The NACE and the ISCO have undergone a major revision, and their new versions have progressively been implemented in the Labour Force Surveys (NACE Rev.2 was introduced in 2008 and the ISCO-08 will be introduced from 2011). Therefore it is now imperative that the matrix of cultural employment be updated for the production of regular statistics. Awaiting this update, cultural employment data for 2009 was produced via a ‘transitional production method’. The transitional method does not completely cover the cultural sphere, and can thus only provide an estimation of the cultural employment in Europe. The method is based on a selection of cultural sectors and professional groups, identified by 2 digits for the NACE Rev.

ESSnet‐CultureFinalReport
- 140-
2, and by 3 digits for the ISCO-88 (e.g. code 91 of the NACE Rev.2 ‘Libraries, archives, museums and other cultural activities’ and code 245 of the ISCO-88 ‘Writers and creative or performing artists’). The difference in method, and in coverage of the cultural sphere, provides an explanation for the reduction in cultural employment observed in the year 2009. Faced with this break in the chronological series on cultural employment, the matrix of cultural employment needs to be urgently redefined, in order to produce statistics on cultural employment that cover the entire cultural sphere at the European level, and therefore render this important production tool operational in the long-term. While TF3 was entrusted with the responsibility of producing the methodology regarding employment, it was not possible for it to examine the impact of the development in tools (the introduction of the NACE Rev.2, the ISCO-08 and yearly averages in the LFS), nor to reflect on the possible technical improvements to the cultural matrix within the short duration of the project. Nevertheless, while making a point of conducting its work in the more general context of an update to the European framework for cultural statistics and an enlargement of the field to encompass new activities (advertising, crafts etc.) as defined by TF1, TF3 has devoted itself in particular to:
reaffirming the conceptual basis and the definition of the scope of cultural employment;
deploying the updates of the reference classifications for the ‘culture matrix’, by including or excluding the cultural field in/from the activities in the NACE Rev.2, and the professions in the ISCO-08.
3.1. Defining the scope of cultural employment
Task Force 3 followed the approach already proposed by the previous European TF on cultural employment - ‘The Task Force, in tackling the subject of cultural employment, decided to take two different (but equally important) approaches. On the one hand, it studied employment in companies practising an activity in the cultural domain, and, on the other, it examined employment in cultural occupations’- and took into account the definition of cultural employment, which is defined as the ‘whole of the credits having either a cultural profession, or working in an economic unit of the cultural sector’. Cultural employment arises in 3 types of situations.
1) The working population that both exercises a cultural occupation and works in the cultural sector (e.g. a ballet dancer in a ballet company or a journalist in a daily newspaper).
2) The working population that exercises a cultural occupation outside of the cultural sector (e.g. a designer in the automobile industry).
3) The working population that exercises a non-cultural occupation in the cultural sector (e.g. an accountant in a publishing house).

ESSnet‐CultureFinalReport
- 141-
Figure 9 – Definition of cultural employment
ACTIVITY
SECTORS
Cultural sector
Other sectors
OCCUPATIONS
Cultural occupations 1 2
Other occupations 3
To assess cultural employment, we take into account all the employment in cultural activities, as well as all the cultural occupations in companies whose main activity is not cultural. This estimation is made possible by the use of the NACE and ISCO classifications, which make it possible to intersect data, and to thus estimate the proportion of cultural employment, based on LFS surveys. But before calculating the cultural coefficients from the intersections of NACE and ISCO, the set of inclusions and exclusions with regards to the cultural sphere must be defined, by activity and by profession.
3.1.1. Employment in cultural activities Employment in cultural activities is defined as all cultural and non-cultural employment of economic units (companies, organisations, self-employed persons etc.) whose activities fall under the cultural sphere. The revision of the reference classification of economic activities (NACE) significantly changed its structure. The NACE Rev.2 makes an improved identification of cultural sectors possible, thanks to the addition of two new sections that are dominantly cultural, and within which cultural groups can be more readily identified:
o J: Information and Communication;
o R: Arts, Entertainment and Recreation. TF3 worked closely with the TF1 ‘Framework and definitions’ to define which activities should be included or excluded into/from the cultural sphere. TF3 thus defined the list of activities that are to be included in the assessment of cultural employment, as per the activity categories of the new European cultural field that TF1 defined. These cultural activities are spread out over several NACE Rev.2 sectors which can either consist solely of cultural activities or mix cultural activities with non-cultural activities.
TF3 identified 29 activity sectors with 4-digits concerning cultural employment, and grouped them into two separate categories:
22 sectors of the NACE Rev.2 composed solely of cultural activities;
7 sectors of the NACE Rev.2 including both cultural and non-cultural activities.

ESSnet‐CultureFinalReport
- 142-
Table 18 – List of activity sectors composed of cultural activities only (NACE Rev.2, 4-digits)
NACE Rev.2 4-digits level
Class
58.11 Book publishing
58.13 Publishing of newspapers
58.14 Publishing of journals and periodicals
58.21 Publishing of computer games
59.11 Motion picture, video and television programme production activities
59.12 Motion picture, video and television programme post-production activities
59.13 Motion picture, video and television programme distribution activities
59.14 Motion picture projection activities
59.20 Sound recording and music publishing activities
60.10 Radio broadcasting
60.20 Television programming and broadcasting activities
63.91 News agency activities
71.11 Architectural activities
74.10 Specialised design activities
85.52 Cultural education
90.01 Performing arts
90.02 Support activities to performing arts
90.03 Artistic creation
90.04 Operation of arts facilities
91.01 Library and archives activities
91.02 Museums activities
91.03 Operation of historical sites and buildings and similar visitor attractions

ESSnet‐CultureFinalReport
- 143-
Table 19 – List of activity sectors partially composed of cultural activities (NACE Rev.2, 4-digits)
NACE Rev.2 4-digits level
Class
47.61 Retail sale of books in specialised stores
47.62 Retail sale of newspapers and stationery in specialized stores
47.63 Retail sale of music and video recordings in specialized stores
73.11 Advertising agencies
74.20 Photographic activities
74.30 Translation and interpretation activities
77.22 Renting of video tapes and disks
3.1.2. Cultural occupations While employment in cultural occupations is defined as all people who exercise these occupations in economic units of the cultural sectors and also in other sectors (such as a designer in the automobile sector), the definition of what constitutes a cultural occupation is a particularly difficult task. The cultural occupation is of a complex and varied nature - it covers very diverse functions and tasks and calls on very different skills which can be used in diverse sectors. In the absence of any classification specific to cultural occupations, the ISCO-08 international classification of occupations(36) is the main tool available that we can use to identify them. However, cultural and artistic occupations are spread out in the ISCO-08, and as there is no single code with which they can be identified, they have to be identified via specific criteria, and the most detailed level must be used (4-digits). And sometimes even the most detailed level is too aggregate to distinguish cultural professions from non-cultural ones. In its conclusions, the LEG-Culture listed at great length all the difficulties encountered in defining a cultural occupation (the diversity of national definitions, the wide range of criteria and categories of occupations, the constant evolution of the cultural sector which is accompanied by the emergence of new occupations). Nevertheless, the LEG-Culture does suggest a statistical definition of a cultural profession based on three criteria. The appropriation of this definition by LEG-Culture in its subsequent work proves that this definition is sound. However, TF3 did consider it necessary to reflect on this definition and redefine the criteria proposed by the LEG-Culture, in order to take into account more fully the developments that have taken place in the cultural sphere over the past ten years.
TF3 defines a cultural occupation in this way: Cultural occupations include occupations involved in the creative and artistic economic cycle i.e. creation, production, dissemination
(36) ISCO: International Standard Classification of Occupations. The ISCO classification is based on 2 concepts: job and skill. Job is defined in the ISCO-08 as a ‘set of tasks and duties carried out, or meant to be carried out, by one person for a particular employer, including self-employment’. Skill is defined as ‘the ability to carry out the tasks and duties of a given job’ (ILO, 2008).

ESSnet‐CultureFinalReport
- 144-
and trade, preservation, education, management and regulation, as well as heritage collection and preservation. These occupations involve tasks and duties undertaken:
a) for the purpose of artistic expression (e.g. visual arts, performing arts, audiovisual arts etc.);
b) to generate, develop, preserve, reflect cultural meaning;
c) to create, produce or disseminate cultural goods and services, generally protected by copyright.
With the three criteria that were retained, over 120 cultural occupations were surveyed (see Annex 2 – Cultural employment list) and cultural occupations in 48 4-digit professional groups of the ISCO-08 were identified (as opposed to 24 groups in the ISCO-88):
32 professional groups in the ISCO-08 (4 digits) solely composed of cultural occupations;
14 basic groups from the ISCO-08 (4 digits) partially composed of cultural occupations (groups that mix cultural and non-cultural occupations).
Table 20 - List of occupational groups composed of cultural occupations only (ISCO-08, 4-digits)
ISCO-08 4-digits level
Units group
2161 Building architects
2162 Landscape architects
2163 Product and garment designers
2166 Graphic and multimedia designers
2354 Other music teachers
2355 Other arts teachers
2621 Archivists and curators
2622 Librarians and related information professionals
2641 Authors and related writers
2642 Journalists
2643 Translators, interpreters and other linguists
2651 Visual artists
2652 Musicians, singers and composers
2653 Dancers and choreographers
2654 Film, stage and related directors and producers
2655 Actors
2656 Announcers on radio, television and other media
2659 Creative and performing arts artists not elsewhere classified

ESSnet‐CultureFinalReport
- 145-
3431 Photographers
3432 Interiors designers and decorators
3433 Gallery, museum and library technicians
3435 Other artistic and cultural associate professionals
3521 Broadcasting and audio-visual technicians
4411 Library clerks
7312 Musical instrument makers and tuners
7313 Jewellery and precious-metal workers
7314 Potters and related workers
7315 Glass makers, cutters, grinder and finishers
7316 Sign writers, decorative painters, engravers and etchers
7317 Handicraft workers in wood, basketry and related materials
7318 Handicraft workers in textile, leather and related materials
7319 Handicraft workers not elsewhere classified
Table 21 – List of occupational groups partially composed of cultural occupations (4 digits, ISCO-08)
ISCO-08 4 digits level
Class
1222 Advertising and public relations department managers Advertising manager (art manager)
1349 Professional services managers not elsewhere classified Archives manager, art gallery manager, library manager, museum manager Managers of cultural enterprises and institutions
1431 Sports, recreation and cultural centre managers Cinema manager, theatre manager, concert hall manager, manager of cultural center
2164 Town and traffic planners Town planner (only if related to architecture)
2310 University and higher education teachers Arts teachers
2320 Vocational education teachers Arts teachers
2330 Secondary education teachers Arts teachers
2341 Primary school teachersArts teachers
2513 Web and multimedia developersWebdesigners
2632 Sociologists, anthropologists and related professionals Researchers related to cultural heritage (archaeologist etc.)

ESSnet‐CultureFinalReport
- 146-
2633 Philosophers, historians and political scientists Researchers related to cultural heritage (semiotic etc.)
3339 Business services agents not elsewhere classified Literary agent, theatrical agent
5113 Travel guides Museum guide, art gallery guide
7522 Cabinet-makers and related workers Handicraft workers
3.2. Defining cultural occupation: a complex task
The conditions for elaborating the list of cultural occupations that would be an important component of the cultural employment methodology were as follows:
a. the list has to follow the same theoretical framework as the one proposed by TF1 i.e. it has to correspond to the same domains and functions that are included in this framework;
b. occupations have to correspond to at least one criterion for the cultural occupations definition proposed by TF3;
c. occupations have to be generally accepted by participants of the TF3 as cultural occupations;
d. the methodology of the cultural employment has to be as comprehensive as possible and stated unambiguously so that it could be easily reproduced by anyone who has access to the database of the LFS.
At the beginning of the project, proposals regarding cultural occupations were collected and these were divided into ‘core cultural occupations’ and ‘culture related occupations’. Both groups were divided into ‘fully cultural occupations’ i.e. all occupations under ‘fully cultural codes’ are cultural occupations and ‘partly cultural occupations’ i.e. codes that according to the definition of the occupations include both cultural and non-cultural occupations and that are inseparable on the 4-digit level of ISCO-08. The solution for taking into account the cultural occupations of ‘partly cultural codes’ was:
either to use the accurate proportion of these occupations for those countries who can provide data on a 5- or higher digit level;
or to use the approximate rule of 50% i.e. include groups of occupations with a minimum 50% of cultural occupations.
To keep the methodology as simple as possible, it was proposed to use only one list of cultural occupations and not use the list of culture related occupations. At the end of the project it appeared that all the cultural occupations that were proposed by members of TF3 cannot be included in the list of cultural occupations due to their incompatibility with the framework (e.g. as manufacturing was taken out of the core framework and considered as a related activity, the manufacturing occupations such as book printers etc. had also to be removed from the list of cultural occupations). That is why it appeared necessary to have also a list of culture related occupations, which is outside the framework of cultural statistics defined by TF1, but still is considered as informative showing connection with some other economic sectors.

ESSnet‐CultureFinalReport
- 147-
During the progress of the work, some methodological problems appeared.
The first problem was how to make the agreed field of culture correspond to the nomenclatures defining exactly the statistical data that are going to be collected. Although statistical nomenclatures have developed a lot during the last decades there are still insufficiencies that do not allow collecting the data exactly as one would like to:
o the problem with nomenclatures is that they do not cover all the fields that are considered to be cultural economic activities, cultural occupations or cultural products and services. Nomenclature NACE Rev.2 does not cover e.g. arts craft activities;
o some definitions of the classes are too wide to distinguish cultural part of it: e.g. ISCO-08 defines ‘University and higher education teachers’ under code 23.10 but it is impossible to distinguish the part of ‘arts professors’.
Cultural definitions are spread under different classes and sub-classes. That makes it impossible to collect exact data on 2- or 3- (sometimes also on 4-) digit level. So if there are some data that are being collected and published on at 2- or 3-digit level they may also include occupations that are not considered as cultural. E.g. including ‘Security guards’ (as it was proposed with the view to include museum guards) in cultural occupations would result in including also ‘Protective services workers not elsewhere classified’, ‘Police officers’, ‘Prison guards’ on the 3-digit sub-classes level of ISCO-08. The second set of problems concerns data availability.
o There are only few sources of harmonised data available and the number of harmonised variables is limited. E.g. there are no data on average salary in Labour Force Survey, which is harmonised by regulation at EU level(37). Some indicators proposed in the Annex may therefore not be available from all countries at the present time.
o Data in existing databases are mostly available on a lower level of classification which does not allow collecting data exactly on cultural topics. As a consequence, very often, either something that is cultural has to be left out (because including it would mean including also – and to too great an extent – something which is not cultural) or something that is non cultural has to be included. E.g. including ‘Library clerks’ in cultural occupations mean also including on a 3-digit level of ISCO-08 ‘Mail carriers and sorting clerks’, ‘Coding, proof-reading and related clerks’, ‘Scribes and related workers’, ‘Filing and copying clerks’, ‘Personnel clerks’, ‘Clerical support workers not elsewhere classified’.
3.3. Instructions of cultural employment estimate
For the purpose of assessing cultural employment, all jobs in cultural activities as well as cultural jobs in entities whose core activity is not cultural are considered. The estimate is reached by crossing ISCO occupations and NACE activities (as declared by the population surveyed in the Labour Force Surveys) and calculating the proportion of cultural jobs within the cross-matches.
(37) http://eur-lex.europa.eu/LexUriServ/LexUriServ.do?uri=OJ:L:2008:114:0057:0084:EN:PDF

ESSnet‐CultureFinalReport
- 148-
Once the most refined posts are filled in (at the 4-digit ISCO x 3-digit NACE level), it is simple to make an estimate of cultural jobs. Let us take the example of a single country where information is available at the ISCO-4 x NACE-3 levels. 92.1 is the cultural activity sector, 92.6 a non-cultural activity sector, 3131 a cultural occupation, 3139 a non-cultural occupation. A, B, C, D are the segments of employment. Cultural employment to be measured equals (A+C)+B, which is to say all the employment in the cultural activities (A+C), plus the cultural employment in non-cultural activities (B). NACE 3
Cultural employment equals (A + C) + B The most refined level (ISCO4*NACE3) is obtainable from only a few countries. From this came the idea of calculating cultural coefficients from the available data and transposing them to each country at NACE2*ISCO3 level, which is the level most widely applied at present. The earliest system for calculating cultural coefficients was devised by the DEPS (French ministry of Culture and Communication) as part of its 2003 Eurostat-sponsored study. The available country data were NACE(Rev.1)3*ISCO(-88)3 at a minimum and NACE2*ISCO4. The aim was to build a matrix of cultural coefficients which would show the estimated proportion of cultural jobs in each NACE2*ISCO 3 pairing. The estimate was obtained by applying the coefficient in each pairing to the pairing's total employment figure. Data from the Labour Force Surveys that are sent currently to Eurostat must adhere to the compulsory level of detail: 2 characters for the classification of activity (NACE) and 3 characters for the classification of occupations (ISCO). More detailed information is transmitted to Eurostat on the voluntary basis. Based on the information collected in 2011 on the level of classification used in national LFSes that the countries sent to Eurostat (cf. Annex 1), we note that:
19 EU-MS send NACE data with 3-character codes (Austria, Czech Republic, Germany, Estonia, Greece, Spain, Finland, France, Lithuania, Luxembourg, Hungary, Malta, the Netherlands, Poland, Portugal, Romania, Slovakia, Sweden, the United Kingdom) as well as Iceland, Norway, Switzerland and Croatia.
We have been informed that 5 other countries could probably be in a position to send NACE data with at least 3-characters to Eurostat (Belgium, Bulgaria, Denmark, Italy and Latvia).
15 EU-MS send 4-character ISCO codes to Eurostat (Austria, Czech Republic, Estonia, Finland, Lithuania, Luxembourg, Hungary, Malta, the Netherlands, Poland,
A B
C D
ISCO 4 Cultural occupations 31.31
Non-cultural occupations 31.39
Cultural activities92.1
Non-cultural activities 92.6

ESSnet‐CultureFinalReport
- 149-
Romania, Slovenia, Slovakia, Sweden, United Kingdom) as well as Iceland, Norway, Switzerland and Croatia.
According to the information collected, 4 additional countries could be in a position to send ISCO data at a more detailed level to Eurostat (Bulgaria, Denmark, France and Italy).
3.3.1. The necessity of updating production tools Based on the consensus reached by ESSnet-Culture on the production of more detailed reference classifications for cultural activities and cultural occupations, i.e. 4-digits for the NACE Rev.2 and 4-digits for the ISCO-08, TF3 has defined:
the divisions for entirely cultural activities and the cultural activity groups; the groups of entirely cultural professions.
This inclusion process involves 2- to 3-digits for the NACE Rev.2, and 3-digits for ISCO-08 (see Annexes 3 and 4). It is a prerequisite to the relaunch of data production from the overall matrix of cultural coefficients. It constitutes a basic response to the strong need to update the matrix of cultural employment in the near future.
Table 22 - Cultural activities NACE Rev.2 on 3-digit level
NACE Rev.2 3-digits
Description
59.1 Motion picture, video and television programme activities
59.2 Sound recording and music publishing activities
60.1 Radio broadcasting
60.2 Television programming and broadcasting activities
74.1 Specialised design activities
90.0 Creative, arts and entertainment activities
Table 23 - Cultural occupations ISCO-08 on 3-digit level
NACE Rev.2 3-digits
Description
216 Architects, planners, surveyors and designers
235 Other teaching professionals
262 Librarians, archivists and curators
264 Authors, journalists and linguists
265 Creative and performing artists
343 Artistic, cultural and culinary associate professionals
352 Telecommunications and broadcasting technicians

ESSnet‐CultureFinalReport
- 150-
Global matrix of cultural coefficients: explanation of the original method(38)
Crossing the most refined levels, i.e. NACE3*ISCO4(39), would yield the desired real number of cultural jobs. Depending on country, however, job figures are available in NACE3*ISCO3 (yielding the two totals ‘A+C’ and ‘B+D’ only, without the detail provided by a NACE3*ISCO4 pairing) or in NACE2*ISCO4 (giving only the two totals ‘A+B’ and ‘C+D’, without the detail), or merely in NACE2*ISCO3. In 2004, only six countries could provide data at the most refined level. The NACE3*ISCO3 and NACE2*ISCO4 pairings were subsequently used for producing an estimate in NACE2*ISCO3. The system suggested to Eurostat - and already used to estimate cultural job numbers – consisted in aggregating the data from all the countries reporting at NACE3*ISCO3 level. Within each aggregated NACE3*ISCO3 pairing the size (weight) of cultural activities in NACE2 was calculated, giving â. For those countries providing information in NACE2*ISCO4, the data were aggregated and the size (weight) of cultural occupations in ISCO3 was calculated, giving p. Where the ISCO*NACE pairings did not contain any cultural occupation, the share size of cultural activities was applied as coefficient. Conversely, where the ISCO*NACE pairings did not contain any cultural activity, the share size of cultural occupations was applied. Where the pairings contained neither cultural activity nor cultural occupation, the coefficient was zero. Last, where the NACE*ISCO pairings included both cultural jobs and cultural activities (e.g. NACE 92 and ISCO347), the cultural coefficient applied to them was taken to be the average of the two coefficients: (â + p)/2, â being the share of cultural activities in the NACE2 activity and p the share of cultural occupations in the ISCO3.
3.3.2. Recommendations for improving estimation of cultural employment The authors of the Expert Report on Sources, written in 2008 at the request of Eurostat, recommended improvement of calculation of the estimate of cultural employment, which is still valid. Step I
It is suggested that, instead of the average, the greater of the two coefficients Max(â, p) be used. This coefficient would be applied to population T, that is, NACE2*ISCO3 in estimating job numbers. In an ISCO3 x NACE3 pairing, Max(â, p) would enable at least all the cultural NACE3 jobs (namely A+C) to be counted, the cultural jobs in the non-cultural NACE3 not being known. Conversely, in ISCO4 x NACE2, all the cultural occupations (A+B) would be retrieved, the non-cultural jobs in cultural activities not being known.
(38) Expert Report on Sources, The Collection of Cultural Statistics in Europe, Ministry of Culture and Communication (France), 2008 (39) See NACE Rev.1 and ISCO-88

ESSnet‐CultureFinalReport
- 151-
Step II
All countries considered, distributions can vary from one to the other. Since Max coefficients are sensitive to extreme values, it is proposed that the ‘weight’ of each country’s cultural positions (âi, pi) be noted and compared with the average coefficients (â, p). The largest of the three values would be retained and applied.
o In NACE3 x ISCO3, the estimator would be Max (âi, â, p).
o In NACE2 x ISCO4, the estimator would be Max (pi, â, p). Step III
It would be assumed that:
o working from NACE3*ISCO3, in non-cultural activities there is about the same proportion of cultural occupations as in cultural activities;
o working from NACE2*ISCO4, in non-cultural occupations, there is about the same proportion of cultural activities as in cultural occupations.
These assumptions would then be applied to countries having NACE3*ISCO3 and NACE2*ISCO4 distributions respectively. In the case of countries presenting the NACE3 x ISCO3 distribution, a country by country approach would be taken. All the country’s cultural activity jobs would be retrieved, and to them would be added the cultural occupation jobs in non-cultural activities, estimated by multiplying the pairing's non-cultural activity jobs by the average ‘weight’ of cultural occupations p (observed as an average across those countries where calculation is possible, i.e. those in NACE2*ISCO4). This would give (A+C)i + p x (B+D)i. Step IV
The assumptions of the foregoing step could be further refined if the NACE3*ISCO4 of a certain number of countries were available for inclusion. This would provide an idea of the proportion of cultural occupations in non-cultural activities and enable this new coefficient to be applied to jobs. Likewise in NACE2 x ISCO4, the coefficient would be adjusted by that of the share of cultural activities in non-cultural occupations.
4. Key indicators Indicators are proposed to meet the main policy needs for cultural statistics. This selection of indicators could be the base for a statistical data collection. Most of the indicators are created on the basis of already existing statistical data sources of Eurostat, such as Structural Business Statistics (SBS), EU-Labour Force Survey (LFS), database containing detailed international trade data for the EU and its Member States (Comext) and data of the business registers. Some indicators are also proposed as possible future developments for statistics on cultural industries and may not be available yet in all the Member States. There are two main types of indicators included in this document: key indicators and spillover indicators. While key indicators describe the economics of culture or its direct impact on the

ESSnet‐CultureFinalReport
- 152-
economy, the aim of the second set of indicators is to describe its indirect influence on other economic sectors (i.e. spillover effect). TF3 proposes a short list of 10 key indicators related to entrepreneurship, employment, import and export of the cultural goods as well as ICT in the cultural sector.
NAME OF THE INDICATOR PURPOSE
ENTREPRENEURSHIP
SHARE OF THE CULTURAL ENTERPRISES
IN THE OVERALL ECONOMY To compare the cultural sector with the overall
economy
SHARE OF THE CULTURAL ENTERPRISES’ TURNOVER IN THE OVERALL ECONOMY’S
TURNOVER
To compare the economy of the cultural sector with the overall economy
SHARE OF MICRO-ENTERPRISES IN
CULTURAL SECTOR COMPARED TO SHARE
OF MICRO- ENTERPRISES IN OVERALL
ECONOMY
To assess the infrastructure of the European enterprises in cultural sector and test if this sector is similar to the rest of the enterprises in the economy or if it differs
SHARE OF THE VALUE ADDED
PRODUCED BY CULTURAL SECTOR
COMPARED TO THE OVERALL ECONOMY
To measure the contribution of the cultural sector to the overall economy
EMPLOYMENT
TOTAL CULTURAL EMPLOYMENT
To compare the amount of people employed in the cultural employment with the overall employment.
To compare the evolution, from one year to the other, of these shares.
TOTAL EMPLOYMENT OF THE CULTURAL
OCCUPATIONS
To compare the amount of people employed in the cultural occupations with the overall employment. For a given year, to compare the share of persons employed with the cultural occupations in cultural or non-cultural sector in every Member State of the European Union.
To compare the evolution, from one year to the other, of these share.
(absolute figures and % of total employment)
SHARE OF NON-NATIONALS IN ARTIST
OCCUPATIONS
To assess the number of non-nationals among artists in a given country against the total number of persons in artistic occupations
To gain some idea of the cultural diversity and ethnic variety of the artistic labour force in a given country.
IMPORT AND EXPORT OF THE CULTURAL GOODS
SHARE OF CULTURAL GOODS IN TOTAL
IMPORT
To compare the ratio of the cultural goods import in total import of the goods (by country and from the EU area).

ESSnet‐CultureFinalReport
- 153-
SHARE OF CULTURAL GOODS IN TOTAL
EXPORT
To compare the ratio of the cultural goods export in total export of the goods (by country and from the EU area).
ICT IN CULTURAL SECTOR
SHARE OF THE CULTURAL SECTOR IN THE
TOTAL E-COMMERCE TURNOVER
To compare the volume of the cultural sectors e-commerce turnover with the total turnover e-commerce.
Full list of 28 key indicators and their exact descriptions is available in the Annex 6 of TF3 ‘Cultural industries indicators manual’ and in Part II - ‘Creative industries spillovers’.
5. Recommendations During the work of TF3, it appeared that it was necessary to promote further developments regarding the statistics on cultural employment and economic statistics for the cultural sector. Proposals for future work concern further steps on harmonisation of cultural statistics, developments of statistics on external trade of cultural goods and services, cultural satellite accounts, cultural clusters, proposals for enhancing the nomenclatures related to cultural statistics, research for the needs and use for statistics of the cultural market-oriented enterprises and organisations, for strengthening the collaboration and making more analyses on cultural statistics. The SBS survey represents the main source of data on the economy of culture in Europe, and on cultural and creative industries in particular. Even though use of the NACE Rev.2 by the SBS survey makes possible today to better identify culture, such as for example audiovisual activities, many cultural activities are not currently covered by the SBS (for example, activities of the performing arts).
1) ESSnet-Culture recommends a better coverage of culture in the SBS survey, at 4-digit level (at the European and national level), and in particular to cover divisions 90 and 91 of the NACE Rev.2 (‘Creative, arts and entertainment activities’ and ‘Libraries, archives, museums’)
The European method for assessing cultural employment uses the results of the European Labour Force Survey (LFS), structured on two references classifications: the NACE, which classifies the employer’s main activity, and the ISCO, which classifies occupations. Currently, data from the Labour Force Surveys that are sent to Eurostat must adhere to a minimum level of detail of two characters for the classification of activity (NACE) and three characters for the classification of occupations (ISCO).

ESSnet‐CultureFinalReport
- 154-
2) ESSnet-Culture recommends requesting a more detailed level of classifications (NACE, ISCO) in the harmonized LFS survey: 3-digits for the NACE Rev.2 and 4-digits for the ISCO-08.
While TF3 was entrusted with the responsibility of producing the methodology regarding cultural employment, it was not possible for it to examine the impact of the development in tools of production (introduction of the NACE Rev.2 and of the ISCO-08, yearly averages in the LFS), not to think about the possible technical improvements to the matrix of cultural employment.
3) ESSnet-Culture recommends that Eurostat carries out a technical assessment on the cultural employment matrix and on its production process in order to ensure a perennial annual production of data on cultural employment in Europe.

ESSnet‐CultureFinalReport
- 155-
6. Annexes TF3
Annex 1
Table 24 - Classifications levels (NACE and ISCO) used by countries in national Labour Force Surveys (LFS) and transmitted to Eurostat
Countries
National Labour Force Surveys(40)
EUROSTAT (LFS)
NACE Rev.2
ISCO-88 NACERev.1
ISCO-88 NACE Rev.2
ISCO-08
UE 27
AT–Austria 4 4 3 4 3 4BE–Belgium 3 3 2 3 2 3 BG–Bulgaria 4 4 2 3 2 3 CY–Cyprus 2 3 2 3 2 3CZ–Czech Republic 2 2 3 4 3 4DK–Denmark 5 4 2 3 2 3DE–Germany 3 3 3 3 3 3 EE–Estonia 3 4 3 4 3 4IE–Ireland … … 2 3 2 4EL–Greece … … 3 3 3 3ES–Spain 3 3 3 3 3 3FI–Finland 5 4 3 4 3 4FR–France 5 4 3 3 3 4IT–Italy 5 4 3 3 3 3LV–Latvia 4 1 2 3 2 3LT–Lithuania 3 4 3 4 3 4 LU–Luxembourg 5 4 3 4 3 4 HU–Hungary 4 4 3 4 3 4MT–Malta 4 4 3 4 3 4NL–Netherlands 5 4 3 4 3 4PL–Poland 3 4 3 4 3 4 PT–Portugal 4 3 3 3 3 3 RO–Romania 4 4 3 4 3 4SI–Slovenia 2 4 2 4 2 4SK–Slovakia 2 3 3 4 3 4SE–Sweden 5 4 3 4 3 4 UK–United Kingdom 5 4 2 4 3 4
Other countries
CH–Switzerland 5 4 3 4 3 4HR–Croatia - - 3 4 3 4IS–Iceland 4 4 3 4 3 3LI–Liechtenstein … … - - - - MK–Former Yugoslav Republic of Macedonia
- - 3 4 3 4
NO–Norway … … 3 4 3 4TR–Turkey 4 4 2 3 2 -
Legend: “3” (i.e. figures in italics in table above): Discrepancy identified (discrepancy which in most cases is due to confusion between the level and the number of digits).
(40) Beginning from 2011 EU-MS use ISCO-08 version.

ESSnet‐CultureFinalReport
- 156-
Annex 2
Table 25 - List of cultural occupations (ISCO-08)
Cultural occupations ISCO-08
- Advertising managers 1222 Advertising and public relations department mangers
- Archives manager, art gallery manager, library manager, museum manager
- Managers of cultural enterprises and institutions
1349 Professional services managers not elsewhere classified
- Cinema manager - Theatre manager - Concert hall manager - Manager of cultural centre
1431 Sports, recreation and cultural centre managers
- Building architect - Interior architect
2161 Building architects
- Landscape architect 2162 Landscape architects
- Costume designer - Fashion designer, - Industrial designer, - Jewellery designer
2163 Product and garment designers
- Town planner 2164 Town and traffic planners
- Digital artist - Graphic designer - Illustrator - Multimedia designer - Publication designer - Web designer
2166 Graphic and multimedia designers
- Arts teachers 2310 University and higher education teachers
- Arts teachers 2320 Vocational education teachers
- Arts teachers 2330 Secondary education teachers
- Arts teachers 2341 Primary school teachers
- Guitar teacher, piano teacher , singing teacher, violin teacher (=Private tuition)
2354 Other music teachers
- Dance teacher, drama teacher, painting teacher, sculpture teacher (=Private tuition)
2355 Other arts teachers
- Archivist - Art gallery curator, museum curator - Records manager - Health information manager
2621 Archivists and curators
- Librarian - Cataloguer
2622 Librarians and related information professionals
- Archaeologist 2632 Sociologists, anthropologists and related
professionals - Author - Book editor
2641 Authors and related writers

ESSnet‐CultureFinalReport
- 157-
- Interactive media writer - Playwright - Writer - Script writer - Technical writer - Journalist - Copy editor - News media interviewer - Newspaper editor - Newspaper reporter - Sub editor - TV/radio news reporter
2642 Journalists
- Translator-reviser 2643 Translators, interpreters and other linguists
- Comics artist, cartoonist - Ceramic artist - Commercial artist - Picture restorer - Portrait painter - Sculptor
2651 Visual artists
- Band leader - Composer - Instrumentalist - Music conductor - Night club musician - singer - Orchestrator - Singer - Street musician - singer
2652 Musicians, singers and composers
- Choreographer - Dancer ballet - night-club –street
2653 Dancers and choreographers
- Documentary director - Film edition, motion picture director - Photography director - Stage director, stage manager - Technical director - Technical television or radio director, - Theatre producer
2654 Film, stage and related directors and producers
- Actor - Mime artist - Story-teller
2655 Actors
- Radio announcer, television announcer - News anchor - Sports announcer
2656 Announcers on radio, television and other media
- Acrobat, aerialist - Clown - Magician - Stand-up comedian - Ventriloquist
2659 Creative and performing artists not elsewhere classified
- Agents and promoters related to cultural activities (literary agent, theatrical agent etc.)
3339 Business services agents not elsewhere classified
- Press photographer - Advertising photographer - Photo-journalist - Photographic artist
3431 Photographers

ESSnet‐CultureFinalReport
- 158-
- Display decorator - Interior decorator - Set designer
3432 Interior designers and decorators
- Gallery technician, library technician, museum technician
3433 Gallery, museum and library technicians
- Floor manager (broadcasting) - Lighting technician - Program co-ordinator (broadcasting) - Script - Special effects technician, - Stage manager - Stage technician - Stunt co-ordinator, - Theatre technician, - Theatrical dresser
3435 Artistic and cultural associate professionals not elsewhere classified
- Audio-visual operator, - Broadcasting equipment operator, - Broadcast technician, - Cameraman (motion picture, video), - Production assistant (media)
3521 Broadcasting and audio-visual technicians
- Library clerk - Library filer
4411 Library clerks
- Museum guide, art gallery guide 5113 Travel guide
- Brass instrument repairer - Piano tuner - Stringed instrument maker - Woodwind instrument maker
7312 Musical instrument makers and tuners
- Enameller, jewellery - Goldsmith - Jeweller - Gem setter - Silversmith
7313 Jewellery and precious-metal workers
- Pottery and porcelain caster - Pottery and porcelain modeller - Potter - Abrasive Wheel Moulder
7314 Potters and related workers
- Glass blower - Glass cutter - Glass finisher - Glass grinder
7315 Glass makers, cutters, grinders and finishers
- Glass engraver - Glass etcher - Glass enameller - Decorative painter - Sign-writer
7316 Sign writers, decorative painters engravers and etchers
- Reed weaving handicraft worker - Stone articles handicraft worker - Wooden articles handicraft worker - Basket maker - Brush maker - Wicker furniture maker
7317 Handicraft workers in wood, basketry and related materials
- Carpets handicraft worker - Leather Handicraft worker - Textiles handicraft worker
7318 Handicraft workers in textile, leather and related materials

ESSnet‐CultureFinalReport
- 159-
- Textile fibre comber - Textile fibre drawer - Textile fibre rover - Knitter - Thread and yarn spinner - Loom threader - Carpet weaver - Weaver cloth - Metal toymaker 7319 Handicraft workers not elsewhere classified
- Wood patternmaker 7522 Cabinet-makers and related workers

ESSnet‐CultureFinalReport
- 160-
Annex 3 Table 26 - Inclusion of cultural activities in NACE Rev.2
NACE Rev.2 2-digits
NACE Rev.2 3-digits
NACE Rev.2 4-digits
Inclusion NACE Rev.2
4-digits
47 Retail trade, except of motor vehicles and motorcycles
47.6 Retail sale of cultural and recreation goods in specialized stores
47.61 Retail sale of books in specialised stores Partly
47.62 Retail sale of newspapers and stationery in specialised stores
Partly
47.63 Retail sale of music and video recordings in specialised stores
Partly
47.64 Retail sale of sporting equipment in specialised stores
Out
47.65 Retail sale of games and toys in specialised stores
Out
58 Publishing activities
58.1 Publishing of books, periodicals and other publishing activities
58.11 Book publishing Fully
58.12 Publishing of directories and mailing lists Out
58.13 Publishing of newspapers Fully
58.14 Publishing of journals and periodicals Fully
58.19 Other publishing activities Out
58.2 Software publishing
58.21 Publishing of computer games Fully
58.29 Other software publishing Out
59 Motion picture, video and television programme production, sound recording and music publishing activities
59.1 Motion picture, video and television programme activities
59.11 Motion picture, video and television programme production activities
Fully
59.12 Motion picture, video and television programme post-production activities
Fully
59.13 Motion picture, video and television programme distribution activities
Fully
59.14 Motion picture projection activitie Fully
59.2 Sound recording and music publishing activities
59.20 Sound recording and music publishing activities Fully
60 Programming and broadcasting activities
60.1 Radio broadcasting 60.10 Radio broadcasting Fully
60.2 Television programming and broadcasting activities
60.20 Television programming and broadcasting activities Fully
63 Information services activities
63.9 Other information services activities
63.91 News agency activities Fully 63.99 Other information service activities n.e.c.
Out
71 Architectural and engineering activities; technical testing and analysis
71.1 Architectural and engineering activities and related technical consultancy
71.11 Architectural activities Fully
71.12 Engineering activities and related technical
Out

ESSnet‐CultureFinalReport
- 161-
consultancy73 Advertising and market research
73.1 Advertising73.11 Advertising agencies Partly
73.12 Media representation Out
74 Other professional, scientific and technical activities
74.1 Specialised design activities
74.10 Specialised design activities Fully
74.2 Photographic activities 74.20 Photographic activities Partly 74.3 Translation and interpretation activities
74.30 Translation and interpretation activities Partly
74.9 Other professional, scientific and technical activities n.e.c.
74.9 Other professional, scientific and technical activities n.e.c.
Out
77 Rental and leasing activities 77.2 Renting and leasing of personal and household goods
77.21 Renting and leasing of recreational and sports goods Out
77.22 Renting of video tapes and disks Partly
77.29 Renting and leasing of other personal and household goods
Out
85 Education 85.5 Other education
85.51 Sports and recreation education Out
85.52 Cultural education Fully
85.53 Driving school activities Out 85.59 Other education n.e.c. Out
90 Creative, arts and entertainment activities
90.0 Creative, arts and entertainment activities
90.01 Performing arts Fully
90.02 Support activities to performing arts Fully
90.03 Artistic creation Fully
90.04 Operation of arts facilities Fully
91 Libraries, archives, museums and other cultural activities
91.0 Libraries, archives, museums and other cultural activities
91.01 Libraryand archives activities Fully
91.02 Museums activities Fully
91.03 Operation of historical sites and buildings and similar visitor attractions
Fully
91.04 Botanical and zoological gardens and nature reserves activities
Out

ESSnet‐CultureFinalReport
- 162-
Annex 4 Table 27 - Inclusion of cultural occupations in ISCO-08
ISCO-08 3-digits
ISCO-08 4-digits
Inclusion ISCO-08 4-digits
122 Sales, marketing and development managers
1221 Sales and marketing managers Out
1222 Advertising and public relations managers Partly
1223 Research and development managers Out
134 Professional services managers
1341 Child care services managers Out
1342 Health services managers Out
1343 Aged care services managers Out
1344 Social welfare managers Out
1345 Education managers Out
1346 Financial and insurance services branch managers Out
1349 Professional services managers not elsewhere classified
Partly
143 Other services managers
1431 Sports, recreation and cultural centre managers Partly
1439 Services managers not elsewhere classified Out
216 Architects, planners, surveyors and designers
2161 Building architects Fully
2162 Landscape architects Fully
2163 Product and garment designers Fully
2164 Town and traffic planners Partly
2165 Cartographers and surveyors Out
2166 Graphic and multimedia designers Fully
231 University and higher education teachers 2310 University and higher education teachers Partly
232 Vocational education teachers 2320 Vocational education teachers Partly
233 Secondary education teachers 2330 Secondary education teachers Partly
234 Primary school and early childhood teachers2341 Primary school teachers Partly
2342 Early childhood educators Out
235 Other teaching professionals 2351 Education methods specialists Out

ESSnet‐CultureFinalReport
- 163-
2352 Special needs teachers Out
2353 Other language teachers Partly
2354 Other music teachers Fully
2355 Other arts teachers Fully
2356 Information technology trainers Out
2359 Teaching professionals not elsewhere classified
Out
251 Software and applications developers and analysts
2511 Systems analysts Out
2512 Software developers Out
2513 Web and multimedia developers Partly
2514 Applications programmers Out
2519 Software and applications developers and analysts not elsewhere classified
Out
262 Librarians, archivists and curators 2621 Archivists and curators Fully
2622 Librarians and related information professionals Fully
263 Social and religious professionals
2631 Economists Out
2632 Sociologists, anthropologists and related professionals Partly
2633 Philosophers, historians and political scientists Partly
2634 Psychologists Out
2635 Social work and counselling professionals Out
2636 Religious professionals Out
264 Authors, journalists and linguists
2641 Authors and related writers Fully
2642 Journalists Fully
2643 Translators, interpreters and other linguists Fully
265 Creative and performing artists
2651 Visual artists Fully
2652 Musicians, singers and composers Fully
2653 Dancers and choreographers Fully
2654 Film, stage and related directors and producers Fully
2655 Actors Fully
2656 Announcers on radio, television and other Fully

ESSnet‐CultureFinalReport
- 164-
media2659 Creative and performing artists not elsewhere classified
Fully
333 Business services agents
3331 Clearing and forwarding agents Out
3332 Conference and event planners Out
3333 Employment agents and contractors Out
3334 Real estate agents and property managers Out 3339 Business services agents not elsewhere classified
Partly
343 Artistic, cultural and culinary associate professionals
3431 Photographers Fully
3432 Interior designers and decorators Fully
3433 Gallery, museum and library technicians Fully
3434 Chefs Out
3435 Other artistic and cultural associate professionals
Fully
352 Telecommunications and broadcasting technicians
3521 Broadcasting and audio-visual technicians Fully
3522 Telecommunications engineering technicians Out
441 Other clerical support workers
4411 Library clerks Fully
4412 Mail carriers and sorting clerks Out
4413 Coding, proof-reading and related clerks Out
4414 Scribes and related workers Out
4415 Filing and copying clerks Out
4416 Personnel clerks Out
4419 Clerical support workers not elsewhere classified Out
511 Travel attendants, conductors and guides
5111 Travel attendants and travel stewards Out
5112 Transport conductors Out
5113 Travel guides Partly
731 Handicraft workers
7311 Precision-instrument makers and repairers Out
7312 Musical instrument makers and tuners Fully
7313 Jewellery and precious-metal workers Fully
7314 Potters and related workers Fully

ESSnet‐CultureFinalReport
- 165-
7315 Glass makers, cutters, grinders and finishers Fully
7316 Sign writers, decorative painters, engravers and etchers Fully
7317 Handicraft workers in wood, basketry and related materials Fully
7318 Handicraft workers in textile, leather and related materials Fully
7319 Handicraft workers not elsewhere classified Fully
732 Printing trades workers
7321 Pre-press technicians Partly
7322 Printers Partly
7323 Print finishing and binding workers Partly
752 Wood treaters, cabinet-makers and related trades workers
7521 Wood treaters Out
7522 Cabinet-makers and related workers Partly
7523 Woodworking-machine tool setters and operators
Out

ESSnet‐CultureFinalReport
- 166-
Annex 5 – Employment vocabulary, concepts and definitions
Employment
http://circa.europa.eu/irc/dsis/employment/info/data/eu_lfs/index.htm Persons in employment
Persons in employment are those aged 15 year and over (16 and over in ES, UK and SE (1995-2001); 15-74 years in DK, EE, HU, LV, FI, NO and SE (from 2001 onwards); 16-74 in IS) who during the reference week did any work for pay or profit, or were not working but had jobs from which they were temporarily absent. Family workers are included. ‘Work’ means any work for pay or profit during the reference week, even for as little as one hour. Pay includes cash payments or ‘payment in kind’ (payment in goods or services rather than money), whether payment was received in the week the work was done or not. Also counted as working is anyone who receives wages for on-the-job training which involves the production of goods or services (European System of Accounts 11.13 f). Self-employed persons with a business, farm or professional practice are also considered to be working if one of the following applies:
1) A person works in his own business, professional practice or farm for the purpose of earning a profit, even if the enterprise is failing to make a profit.
2) A person spends time on the operation of a business, professional practice or farm even if no sales were made, no professional services were rendered, or nothing was actually produced (for example, a farmer who engages in farm maintenance activities; an architect who spends time waiting for clients in his/her office; a fisherman who repairs his boat or nets for future operations; a person who attends a convention or seminar).
3) A person is in the process of setting up a business, farm or professional practice; this includes the buying or installing of equipment, and ordering of supplies in preparation for opening a new business. An unpaid family worker is said to be working if the work contributes directly to a business, farm or professional practice owned or operated by a related member of the same household.
Active population (labor force) comprises employed and unemployed persons (LFS). Total employment = Employees + Non-employees
Total employment covers all persons aged 15 years and over (16 and over in ES and UK; 15 74 years in DK, EE, HU, LV, FI, NO and SE; and 16-74 in IS) who, during the reference week, performed work, even for just one hour a week, for pay, profit or family gain or were not at work but had a job or business from which they were temporarily absent because of, e.g., illness, holidays, industrial dispute and education and training. Employees are defined as persons who work for a public or private employer and who receive compensation in the form of wages, salaries, fees, gratuities, payment by results or payment in kind; non-conscript members of the armed forces are also included.

ESSnet‐CultureFinalReport
- 167-
Non-employees comprise employers, self-employed and family workers. Employers employing one or more employees are defined as persons who work in their own business, professional practice or farm for the purpose of earning a profit, and who employ at least one other person. Self-employed persons not employing any employees are defined as persons who work in their own business, professional practice or farm for the purpose of earning a profit, and who employ no other persons. Family workers are persons who help another member of the family to run a farm or other business, provided they are not classed as employees. Employees with temporary contracts are those who declare that they have a fixed-term employment contract or a job which will terminate if certain objective criteria are met, such as completion of an assignment or return of the employee who was temporarily replaced. Unemployed persons are persons aged 15-74 who were without work during the reference week, were currently available for work and were either actively seeking work in the past four weeks or had already found a job to start within the next three months. Full-time/part-time job: This variable refers to the main job. The distinction between full-time and part-time work is based on a spontaneous response by the respondent (except in the Netherlands, Iceland and Norway, where part-time employment refers to fewer than 35 usual weekly working hours, and full-time employment refers to 35 hours or more; and in Sweden where this criterion is applied to the self-employed). It is impossible to establish a more precise distinction between full-time and part-time employment, since working hours differ from one Member State to the next and from one branch of activity to the next. Cultural employment: sum of 3 types of situations.
1) The working population that both exercises a cultural occupation and works in the cultural sector (e.g. a ballet dancer in a ballet company or a journalist in a daily newspaper).
2) The working population that exercises a cultural occupation outside of the cultural sector (e.g. a designer in the automobile industry).
3) The working population that exercises a non-cultural occupation in the cultural sector (e.g. an accountant in a publishing house).
Employment in the cultural sector: the whole employment (in cultural or not cultural occupations) in cultural economic activities, as defined by the ESSnet-Culture (in terms of NACE Rev.2 codes). This employment concerns all types of economic units - companies, organisations, self-employed persons etc.

ESSnet‐CultureFinalReport
- 168-
Employment in cultural occupations: all persons who exercise occupations defined by the ESSnet-culture as cultural (in terms of ISCO-08 codes). These occupations can be found in economic units of the cultural sectors but also in other sectors (e.g. a designer in the automobile sector). Cultural occupation (definition proposed by ESSnet-Culture): Cultural occupations include occupations involved in the creative and artistic economic cycle i.e. creation, production, dissemination and trade, preservation, education, management and regulation, as well as heritage collection and preservation. These occupations involve tasks and duties undertaken:
a) for the purpose of artistic expression (e.g. visual arts, performing arts, audiovisual arts etc.);
b) to generate, develop, preserve, reflect cultural meaning;
c) to create, produce or disseminate cultural goods and services, generally protected by copyright.

ESSnet‐CultureFinalReport
- 169-
Annex 6 – Cultural industries indicators manual
Introduction Aim of this document is to gather and harmonise the information concerning the cultural economic statistics in Europe. The chapters are intended to formulate the concept of the cultural industries which is mainly based on the European economic conceptions and that it could be used by all users who are interested in cultural industries and its statistics. Beyond statistics on cultural industries, chapters are explicitly written on cultural employment. Indicators are proposed to meet the main policy needs for cultural statistics: this selection of indicators could be the base for statistical data collection. Most of the indicators are created on the basis of already existing statistical data resources of Eurostat, such as Structural Business Statistics (SBS), Community Labour Force Survey (LFS) databases, also database containing detailed international trade data for the EU and its Member States (Comext) and data of the business registers. Some indicators are also proposed as possible future developments of the cultural industries statistics and may not be available yet in all the Member States. There are two main topics of the indicators included in this document, there are key indicators and there are spillover indicators. When key indicators are describing economics of the culture or its direct impact to the economy, then aim of the second set of indicators is to describe the indirect influence to the other economic sectors, also named as spillover effect. Last chapters are describing the matrix of the cultural sector, cultural occupations and cultural products.
1. Policy needs
1.1. Cultural statistics in the spotlight of EU policy frameworks
In 2010 European Commission released the Green Paper ‘Unlocking the potential of cultural and creative industries’(41) that explored different ways how to empower international or regional cooperation and mutually efficient activities in the so-called cultural and creative industries sector. The objective of the consultation was ‘to gather views on various issues impacting the cultural and creative industries in Europe, from business environment to the need to open up a common European space for culture, from capacity building to skills development and promotion of European creators on the world stage’(42). While thinking about EU strategy planning in the sector we must admit that the capacity and variety of the sector is considerable. It also means that the way the sector is mapped and covered with the statistical mechanisms or indicators varies between Member States. One of the conclusions of the Green Paper concludes that the cultural and creative industries sector has a potential that responds to the challenges of EU 2020 strategy and supports competitiveness of European economy. It is thereby important to search some internationally comparable evidence-based arguments that create a possibility to evaluate in what way the statistics support our common goals today and what are the most relevant guidelines for the nearest future.
(41) http://ec.europa.eu/culture/our-policy-development/doc/GreenPaper_creative_industries_en.pdf (42) http://ec.europa.eu/culture/our-policy-development/doc2577_en.htm

ESSnet‐CultureFinalReport
- 170-
1.2. What’s behind policy decisions?
The first question to ask is how do we measure economical impact of the cultural activities. Last decade has offered some widely used theoretical frameworks to describe and structuralize the characteristics of the cultural sector. Despite the empirical theoretical effort one question still remains the same. What kind of data and evaluation systems provide us the necessary information to measure different kind of cultural impacts and spill-over effects? It is very important to recognize the importance of this work because in the context of EU supporting mechanisms it is not possible to underestimate these aspects. The question of impacts and mapping spill-over effects or practices is equally important to entrepreneurs, investors and policy framework providers. But cultural impacts are not the only side to keep in mind. It is also crucial to follow overviews about the current situation of different sub-fields. The experience of designing different programs and measures for the sector is not yet much helpful since the policy framework in its modern structure was established quite recently compared to some more traditional concepts. In that sense we today still miss some detailed information about sub-fields that quite often expect flexible and operational reaction. More detailed and systematically updated figures are one of the key elements in the process of better and more efficient policies.
1.3. Economical side of culture
We can also observe some economical characteristics of cultural sector. Study on the economy of culture in Europe, conducted by KEA (2006)(43) is a good and one of the most often quoted example of presenting the recent situation in EU Member States. The study consist of overviews about the contribution of the sector to the general economy, about cultural consumption, cultural employment and also about productivity and profitability of the sector plus various additional aspects. While describing the methodological challenges and data availability, the authors nevertheless admit that the current situation needs revision that requires an international cooperation. The latest initiative to fill that gap is this project ESSnet-Culture which among other tasks also analyzes statistical sources that describe cultural industries, cultural employment as well as other dimensions (expenditure on culture, cultural practices). One of the most relevant issues today concerns employment. In the period of crises and economical difficulties the question of jobs raises to the spotlight of different politics. The KEA study referred earlier says that in year 2004 the employment in the cultural and cultural tourism sector involved 5,885 million people (3,1% of the active employed population). Keeping in mind the global nature of culture and the mobility aspects it is very important to observe developments in the job market and provide necessary support to the entrepreneurs to raise their competitiveness and position in the market. We also need to know relations between the educational framework and expectations of related employers. If we want to gather statistics about the mobility and results of horizontal business environment measures including finding qualified labour force, then it is more realistic to raise international potential of the sector.
(43)http://ec.europa.eu/culture/keydocuments/doc873_en.htm#bad_nodepdf_word/economy_cult/executive_summary.pdf

ESSnet‐CultureFinalReport
- 171-
1.4. Common ground
And finally there is comparability of data. Cultural and creative industries can be defined in many ways. It is possible to structure it by using sub-fields but we can also observe different functions or the ways how entrepreneurs position themselves. That also means the variety in understanding what is and what is not a sub-field of the sector. So any kind of general indicators (e.g. % of GDP) needs some additional background information before final conclusions. On the other hand this kind of variety is not necessarily a negative aspect because different cultural traditions and consumption practices always affect that kind of overviews. The challenge is to find some critical factors that need to be compared to create EU mechanisms with an efficient and synergy based results. These indicators don’t have to cover the whole sector across EU. It is more important that they give us some figures which are interpreted in a synchronized way. ESSnet-Culture is one of the methods to provide methodological background for statistics. As a result of outstanding experience and cooperation between Member States and Eurostat, we already today have a number of data sources widely in use ( SBS, LFS, etc). Now it is time to create a more synchronised evidence-based platform for better and efficient policy framework.
2. General conception of the employment and economic characteristics of the cultural sector
The general aim of Task Force 3 was to find a proper methodology to measure the economic effect of culture. On creating the comparable methodology of the employment and economic characteristics of the cultural sector there are several factors among which it should be found balance. These factors are theoretical area of the culture i.e. human activities that constitute the cultural sector on which there is a desire to have statistical data. Secondly there are nomenclatures, the statistical classifications that make the comparable statistical data collection possible. The third factor that affects the methodology is the data availability.
Culture (desired statistics)
available data
nomenclatures

ESSnet‐CultureFinalReport
- 172-
2.1. Relation to the general framework of cultural statistics
For defining the cultural sector TF3 uses the framework and definitions of the domains of ESSnet-Culture elaborated by TF1 which divides the field of culture (or cultural sector) by ten domains (Heritage, Archives, Libraries, Books and Press, Visual arts, Performing arts, Audiovisual and Multimedia, Architecture, Advertising and Art Crafts) that can be analysed according to six functions (Creation, Production/Publishing, Dissemination/Trade, Preservation, Training, Management/Regulation). All the domains and functions are represented in the methodology of the employment and economic characteristics of the cultural sector equally. Employment and economic characteristics are described visually as different layers of the cultural statistics.
2.2. Concept of ‘Market oriented cultural enterprises and organisations’
Market oriented enterprises are those whose income is at least 50% earned by selling their own products and services. This definition includes all possible ways of cultural and creative expression as well as its industrial dimension. With this definition it is possible to distinguish enterprises and organisations where cultural and economical creativity have met and this synergy is describable with statistics. This definition is also flexible for the future developments of the list of cultural economic activities. Adding new activities to the framework of culture, they can be automatically included in cultural industries statistics. Although this data may not be available at the moment in databases, it is theoretically possible to collect such data using already implemented data collection tools.. Longer definition of market oriented enterprises can be found in European System of Accounts market oriented enterprises are differentiated by 50% criterion. In ESA95, economically significant prices are defined as prices that generate sales covering more than 50% of production costs.
In distinguishing market and other non-market producers by means of the 50% criterion, ‘sales’ and ‘production costs’ are defined as follows:
a) ‘sales’ exclude taxes on products but include all payments made by general government or the Institutions of the European Union and granted to any kind of producer in this type of activity, i.e. all payments linked to the volume or value of output are included, but payments to cover an overall deficit are excluded.
b) ‘production costs’ are the sum of intermediate consumption, compensation of employees, consumption of fixed capital and other taxes on production. For this criterion other subsidies on production are not deducted. To ensure consistency of the concepts sales and production costs when applying the 50% criterion, the production costs should exclude all costs made for own-account capital formation.
The 50% criterion should be applied by looking over a range of years: only if the criterion holds for several years or holds for the present year and is expected to hold for the near future, should it be applied strictly. Minor fluctuations in the size of sales from one year to another do not necessitate a reclassification of institutional units (and their local KAUs and output).
The 50% criterion decides also when a government unit can be treated as a quasi-corporation (owned by the government): a quasi-corporation can be created only if it meets the 50% criterion.

ESSnet‐CultureFinalReport
- 173-
If a public unit is mainly financed by the general government according to its costs or to global budget negotiations focusing on several factors (final output, maintenance of buildings, investment in technical equipment, payment for compensation of employees etc.), the public institutional unit has to be classified in the general government sector because this financing does not correspond to sales. To check the nature of these payments, it could be useful to check whether general government systematically covers the unit’s deficit (44).
More research on need and use of the proposed concept of the market oriented cultural economic activities has to be made in the future.
3. List of definitions related to the methodology of the employment and economic characteristics of the cultural sector
3.1. Definitions of the economic characteristics of the cultural sector Cultural sector: All the cultural statistical activities defined in the ESSnet-Culture framework of cultural activities according to the economic activities of NACE Rev.2. The cultural sector is the statistical field where cultural values are produced. Market oriented enterprises and organisations: All market oriented enterprises and organisations in the cultural economic activities defined by the ESSnet-Culture framework. Market oriented enterprises are those whose income is at least 50% earned by selling their own products and services. Economic activity: The classification used for economic activities is the Statistical Classification of Economic Activities (NACE - from 2005 NACE Rev.1.1 ,from 2008 NACE Rev.2). Cultural economic activity: Economic activities that are defined in the ESSnet-Culture framework of cultural activities according to the NACE Rev.2. Cultural enterprises and organisations: All enterprises and organisations in the cultural sector (as defined by ESSnet-culture); all enterprises and organisations involved in the cultural economic activities.
3.2. Definitions related to employment Task Force 3 followed the approach already proposed by previous European working group(45): ‘The Task Force, in tackling the subject of cultural employment, decided to take two different (but equally important) approaches. On the one hand, it studied employment in
(44) Manual on Government Deficit and Debt, Implementation of ESA95 (p.14) http://epp.eurostat.ec.europa.eu/cache/ITY_OFFPUB/KS-RA-09-017/EN/KS-RA-09-017-EN.PDF (45) See the Working Group Cultural statistics, Task Force on Cultural Employment Statistics, DOC/ESTAT/E3/2001/CULT02

ESSnet‐CultureFinalReport
- 174-
enterprises practising an activity of cultural domains and, on the other, it examined employment in occupations involved in cultural domains’. Since LEG-Culture, the ISCO nomenclature has been renewed. One of the tasks of the TF3 has been also refreshing the list of cultural occupations according to ISCO-08 nomenclature. List of the cultural occupations has been renewed also according to the other developments that have been passed since last project. There have been added cultural occupations that according to the framework elaborated during this project had to be added. There are two statistical fields where cultural occupations are present: there is a cultural sector i.e. cultural economic activities according to the framework of ESSnet-Culture (Cultural occupations A) and there are other sectors outside the cultural sector (Cultural occupations B). There are some parts of the nomenclatures that are overlapping and some that are not. This schema tries to illustrate the fact that some theoretically cultural activities (e.g. handicraft) is not represented in NACE nomenclature yet. This is why in the cultural employment matrix proposed by TF3 is using both nomenclatures: NACE and ISCO. This solution is the way to cover cultural areas that are uncovered by the NACE (i.e. little part of the section B outside the frame of the NACE Rev.2). And it gives from the other side possibility to include non-cultural occupations that are actually workers of the cultural sector (e.g. museum guards, covered by section C - other occupations in the cultural sector). Employment(46): A person is considered as having an employment if he or she did any work for pay or profit during the reference week ‘Work’ means any work for pay or profit during the reference week, even for as little as one hour. Pay includes cash payments or ‘payment in kind’ (payment in goods or services rather than money), whether payment was received in the week the work was done or not. Also counted as working is anyone who receives wages for on-the-job training which involves the production of goods or services (ESA 11.13 f). Self-employed persons with a business, farm or professional practice are also considered to be working if one of the following applies:
(46) The European Union Labour Force Survey, http://epp.eurostat.ec.europa.eu/cache/ITY_OFFPUB/KS-BF-03-002/EN/KS-BF-03-002-EN.PDF
All occupations (ISCO-08)
Cultural sector (NACE Rev 2)
All economic activities (NACE Rev 2)
Cultural occupations (ISCO-08) A
Cultural occupations (ISCO-08) B
Other occupations in Cultural sector (ISCO-08) C

ESSnet‐CultureFinalReport
- 175-
a) a person works in his own business, professional practice or farm for the purpose of earning a profit, even if the enterprise is failing to make a profit;
b) a person spends time on the operation of a business, professional practice or farm even if no sales were made, no professional services were rendered, or nothing was actually produced (for example, a farmer who engages in farm maintenance activities; an architect who spends time waiting for clients in his/her office; a fisherman who repairs his boat or nets for future operations; a person who attends a convention or seminar);
c) a person is in the process of setting up a business, farm or professional practice; this includes the buying or installing of equipment, and ordering of supplies in preparation for opening a new business. An unpaid family worker is said to be working if the work contributes directly to a business, farm or professional practice owned or operated by a related member of the same household.
Cultural employment: total cultural employment is the sum of employed employers, self-employed, employees and family workers in the fields A, B and C i.e. the sum of the all employed (cultural and non cultural occupations) in the cultural sector and employed of the cultural occupations in other sectors. Employment in the cultural sector: all the employed (in the fields A and C i.e. representatives of both cultural (A) and non-cultural occupations (C) in the cultural sector as defined in the framework. Employment in cultural occupations: is the sum of employed on the fields A and B i.e. the representatives of the cultural occupations, working in cultural sector or/and outside it. Employment of the cultural occupations in the cultural sector: is the employed on the field A i.e. only representatives of the cultural occupations in the cultural sector. Occupation: The classification used for occupation is the International Standard Classification of Occupations (ISCO-88, ISCO-08) Cultural occupation: Definition proposed by Task Force 3: Cultural occupations include occupations involved in the creative and artistic economic cycle i.e. creation, production, dissemination and trade, preservation, training, management and regulation, as well as heritage collection and preservation. These occupations involve tasks and duties undertaken:
a) for the purpose of artistic expression (e.g. visual arts, performing arts, audiovisual arts etc.);
b) to generate, develop, preserve, reflect cultural meaning;
c) to create, produce or disseminate cultural goods and services, generally protected by copyright.
Partly cultural occupation: ISCO-08 nomenclature contains at 4-digit level some occupation codes that include both cultural and non-cultural occupations. These are marked as partly cultural. On the matrix of cultural employment these should be included either according to the estimations of the countries or according to the rough estimation i.e. include only 50 per cent of the employed of these occupation codes.

ESSnet‐CultureFinalReport
- 176-
Employers employing one or more employees are defined as persons who work in their own business, professional practice or farm for the purpose of earning a profit, and who employ at least one other person. Self-employed persons not employing any employees are defined as persons who work in their own business, professional practice or farm for the purpose of earning a profit, and who employ no other persons. Employees are defined as persons who work for a public or private employer and who receive compensation in the form of wages, salaries, fees, gratuities, payment by results or payment in kind; non-conscript members of the armed forces are also included. Family workers are persons who help another member of the family to run a farm or other business, provided they are not classed as employees. Employed: i.e. person in work/in employment are: aged 15 year and over (16 and over in ES, UK and SE (1995-2001); 15-74 years in DK, EE, HU, LV, FI and SE (from 2001 onwards); 16-74 in IS and NO), and living in private households, who during the reference week did any kind of work for pay or profit for at least one hour, or persons who were not working but had jobs from which they were temporarily absent because of, e.g., illness, holidays, industrial dispute or education and training. Full-time/part-time: This variable refers to the main job. The distinction between full-time and part-time work is based on a spontaneous response by the respondent (except in the Netherlands, Iceland and Norway where part-time is determined if the usual hours are fewer than 35 hours and full-time if the usual hours are 35 hours or more, and in Sweden where this criterion is applied to the self-employed). It is not possible to establish a more precise distinction between full-time and part-time employment, since working hours differ between Member States and between branches of activity. This variable refers to the main job. The distinction between full-time and part-time work is based on a spontaneous response by the respondent (except in the Netherlands, Iceland and Norway where part-time is determined if the usual hours are fewer than 35 hours and full-time if the usual hours are 35 hours or more, and in Sweden where this criterion is applied to the self-employed). It is not possible to establish a more precise distinction between full-time and part-time employment, since working hours differ between Member States and between branches of activity. Employees with fixed-term contracts: In the majority of Member States, most jobs are based on written work contracts. In some countries, however, contracts of this type are concluded only in specific cases (e.g. for public-sector jobs, apprentices or other trainees within an enterprise). Given these institutional discrepancies, the concepts of ‘temporary employment’ and ‘work contract of limited duration’ (or ‘permanent employment’ and ‘work contract of unlimited duration’) describe situations which, in different institutional contexts, may be considered similar. Employees with a limited duration job/contract are employees whose main job will terminate either after a period fixed in advance, or after a period not known in advance, but nevertheless defined by objective criteria, such as the completion of an assignment or the period of absence of an employee temporarily replaced.(47)
(47) http://epp.eurostat.ec.europa.eu/portal/page/portal/employment_unemployment_lfs/methodology/definitions

ESSnet‐CultureFinalReport
- 177-
4. Methodology of the employment and economic characteristics of the cultural sector
4.1. Methodology of the economic characteristics of the cultural sector
All ‘totally cultural’ statistical activities are in the matrix of the cultural economic
characteristics, which is used to distinguish cultural sector from the overall economy. ‘Mainly cultural’ activities have to be included partially either according to proportion estimations of the countries (i.e. institutions that are responsible for the business statistics on the national level, possibly using 5 or more digit level of the national version of NACE nomenclature) or on lacing data according to the rough estimation, which could be e.g. 50 per cent of the partly cultural activities. The statistics made at 4-digit level of NACE nomenclature are recommended for their accuracy level. List of 22 activity sectors composed of cultural activities only (4-digit level NACE Rev.2) are 5811, 5813, 5814, 5821, 5911, 5912, 5913, 5914, 5920, 6010, 6020, 6391, 7111, 7410, 8552, 9001, 9002, 9003, 9004, 9101, 9102, 9103. List of 7 activity sectors partially composed of cultural activities (4-digit level, NACE Rev.2) are 4761, 4762, 4763, 7311, 7420, 7430, 7722.
Fully cultural economic activities on the 3-digit level of NACE are a part of cultural
sector. Following fully cultural codes: 5811, 5813, 5814, 5821, 6391, 7111, 8552, 9101, 9102, 9103 and partly cultural codes: 4761, 4762, 4763, 7311, 7420, 7430, 7722 are excluded from the list. Using fully cultural economic activities at 3-digit level, it should be mentioned that it is not the whole cultural sector. Cultural activities at 3-digit level (NACE Rev.2) are 591, 592, 601, 602, 741, 900.
Culture related activities on 4-digit level (NACE Rev.2) are 1811, 1812, 1820 and
3220. Related activities are industrial activities that are linked to culture, without being included in the core framework on culture for the production of data.
4.2. Methodology of the cultural employment In the creation of the matrix of the cultural employment, the cultural occupations should be observed in conjunction with the list of cultural economic activities elaborated by Task Force 1 of the ESSnet-culture. All the employed in cultural economic activities (NACE Rev.2) together with employed of the cultural occupations (ISCO-08) in other economic activities should be included in the concept and statistics of cultural employment.
All the employed of the cultural sector according to the list of cultural economic activities are in the matrix of the cultural employment. List of 22 activity sectors composed of cultural activities only (4-digit level NACE Rev.2) are 5811, 5813, 5814, 5821, 5911, 5912, 5913, 5914, 5920, 6010, 6020, 6391, 7111, 7410, 8552, 9001, 9002, 9003, 9004, 9101, 9102, 9103. Partly cultural economic activities have to be included either according to proportion estimations of the countries (i.e. institutions that are responsible for the business statistics on the national level, possibly using 5 or more digit level of the national version of NACE nomenclature) or on lacing data according to the rough estimation, which is 50 per cent of the employed of the partly cultural activities. The statistics

ESSnet‐CultureFinalReport
- 178-
made on 4-digit level of NACE nomenclature are recommended for their accuracy level. List of 7 activity sectors partially composed of cultural activities (4-digit level, NACE Rev.2) are 4761, 4762, 4763, 7311, 7420, 7430, 7722.
Fully cultural economic activities on the 3-digit level of NACE are a part of cultural
sector. Following fully cultural codes: 5811, 5813, 5814, 5821, 6391, 7111, 8552, 9101, 9102, 9103 and partly cultural codes: 4761, 4762, 4763, 7311, 7420, 7430, 7722 are excluded from the list. Using fully cultural economic activities at 3-digit level, it should be mentioned that it is not the whole cultural sector. Cultural activities on 3-digit level (NACE Rev.2) are 591, 592, 601, 602, 741, 900.
At 4-digit level of ISCO all fully cultural occupations are included in the matrix of
cultural employment. Fully cultural occupations at 4-digit level (ISCO-08) are 2161, 2162, 2163, 2166, 2354, 2355, 2621, 2622, 2641, 2642, 2643, 2651, 2652, 2653, 2654, 2655, 2656, 2659, 3431, 3432, 3433, 3435, 3521, 4411, 7312, 7313, 7314, 7315, 7316, 7317, 7318, 7319. Partly cultural occupations have to be included either according to proportion estimations of the countries (i.e. institutions that are responsible for the Labour Force Survey on the national level, possibly using 5 or more digit level of the national version of ISCO nomenclature) or on lacing data according to the rough estimation, which is 50 per cent from the employed of the partly cultural occupations. The statistics made at 4-digit level of ISCO nomenclature are recommended for their accuracy level. Partly cultural occupations at 4-digit level (ISCO-08) are 1222, 1349, 1431, 2164, 2310, 2320, 2330, 2341, 2513, 2632, 2633, 3339, 5113, 7522.
At 3-digit level of ISCO nomenclature only the fully cultural occupation codes have
to be included in the matrix of the cultural employment, except the code 441 ‘Other clerical support workers’ (which is fully cultural at 4-digit level, 4411 ‘Library clerks’) due to its disproportionate expansion for non-cultural codes. Employment statistics made at the 3-digit level of ISCO nomenclature is a rough approximation. It is less accurate, because partly cultural occupations (1222, 1349, 1431, 2310, 2320, 2330, 2341, 2513, 2632, 2633, 3339, 5113, 7522) are excluded. At 3-digit level is impossible to distinguish between cultural and some non-cultural occupations (2165, 2351, 2352, 2353, 2356, 2359, 3434, 3522, 7311) that are included. Using ISCO cultural occupations at 3-digit level, its low accuracy has to be mentioned. Cultural occupation codes on (ISCO-08) 3-digit level are 216, 235, 262, 264, 265, 343, 352, 731.
Cultural occupations cannot be distinguished at 2-digit group level of ISCO-08
nomenclature.
Cultural employment matrix is suggested to be used in the following combinations of the NACE and ISCO nomenclatures:
a) list of cultural economic activities (NACE Rev.2) at the 4-digit level, together with the list of cultural occupations (ISCO-08) at the 4-digit level;
b) list of cultural economic activities (NACE Rev.2) at the 3-digit level, together with the list of cultural occupations (ISCO-08) at the 3-digit group level.
Preferable is the combination (a) (List of cultural economic activities (NACE Rev.2)
at the 4-digit level, together with the list of cultural occupations (ISCO-08) at the 4-

ESSnet‐CultureFinalReport
- 179-
digit level) Combination (b) has to be considered as approximation of the cultural employment.
All the different levels of the nomenclatures on (4-, 3-, and 2-digit level) and combinations of the nomenclatures have to be considered as the different methodologies, which have to be also mentioned together with the output tables either on the websites, printed publications or other possible publication forms. To avoid confusion all the data in the same publication has to follow the same methodology.
All the different estimation methods have to be considered as the different methodologies, which also have to be mentioned together with the output tables either on the websites, printed publications or other possible publication forms. Different estimation methods may reduce the data comparability and give misleading results.
In the same output tables cannot be used data that are produced using different methodology e.g. one country uses nomenclatures atthe 4-digit level and other country uses nomenclatures at the 3-digit level. Different methodologies make comparison of the data impossible.
4.3. Definition proposed by Task Force 3
Cultural occupations include occupations involved in the creative and artistic economic cycle i.e. creation, production/publishing, dissemination/trade, preservation, training and management/regulation. These occupations involve tasks and duties undertaken:
1. for the purpose of artistic expression (e.g. visual arts, performing arts, audiovisual arts etc.);
2. to generate, develop, preserve, reflect cultural meaning;
3. to create, produce or disseminate cultural goods and services, generally protected by copyrights.
4.4. Methodological problems
The first problem that is being faced is that how to fit the agreed field of culture to the nomenclatures that define exactly the statistical data that is going to be collected. Although statistical nomenclatures have developed a lot during the last decades there are still insufficiencies that do not allow collecting the data exactly the same way that is desired. Problem with nomenclatures is that they do not cover all the fields that are considered to be cultural economic activities, cultural occupations or cultural products and services. Nomenclature NACE Rev.2 does not cover e.g. Arts craft activities. There are following problems with the nomenclatures that were found during this work.
Some definitions of the classes are too wide to distinguish cultural part of it (e.g. ISCO defines University and higher education teachers under code 2310 but it is impossible to distinguish arts professors from it). Problem is also that occupations do not indicate to the institution where exactly the work is being done E.g. security guards or cleaning service undertakers who are outsourced to the cultural sector. Some of those workers may actually do their work in the cultural institutions but they are inseparable from those who work outside the cultural sector (unless of course

ESSnet‐CultureFinalReport
- 180-
their salary is being paid by some cultural institutions). E.g. if some persons (e.g. security guards) of the non-cultural enterprise work for different enterprises or organisations (department stores, hospitals etc.) and also for cultural institutions then it is impossible to differentiate those people (security guards) who work in cultural institutions e.g. in museum. That is why the ISCO-08 nomenclature does not allow differentiating people who may actually do their work in cultural institutions if they are outsourced. The solution for that would be to ask in LFS where exactly does respondent work, in addition to the questions in what firm (under which economic activity) he/she works or what is his/her occupation. Another possibility would be of course to add an extra category (definition) of museum guards in the ISCO nomenclature).
Cultural definitions are spread under different classes and subclasses. That makes impossible to collect exact data on 2- or 3- (sometimes also on 4-) digit level. So if there is some data that is being collected and published on 2- or 3-digit level may include unwillingly definitions that are not considered as cultural. E.g. if to include ‘Security guards’ in cultural occupations, then on the 3-digit subclasses level (ISCO-08) it will include also ‘Protective services workers not elsewhere classified’, ‘Police officers’, ‘Prison guards’.
The second set of problems concerns the data availability.
There are only few sources of harmonised data available and the number of harmonised variables is limited. E.g. there are no data on average salary in Labour Force Survey database which is harmonised by regulation of European Commission(48). For harmonisation of the databases we need more regulations. Some proposed indicators may not be available from all the countries at the present time.
The data in existing databases is mostly available on wider level of nomenclature, which does not allow collecting data exactly on cultural topics. Something that is cultural has to be left out (otherwise it would include too many non-cultural objects) and something that is non-cultural has to be included. E.g. including ‘Library clerks’ in cultural occupations will include on 3-digit level of ISCO-08 also ‘Mail carriers and sorting clerks’, ‘Coding, proof-reading and related clerks’, ‘Scribes and related workers’, ‘Filing and copying clerks’, ‘Personnel clerks’, ‘Clerical support workers not elsewhere classified’.
As a conclusion: the limits in nomenclatures and in availability of data in harmonized sources are recognized by TF3. Nonetheless, the harmonized sources remain the preference for comparability.
(48) http://eur-lex.europa.eu/LexUriServ/LexUriServ.do?uri=OJ:L:2008:114:0057:0084:EN:PDF

ESSnet‐CultureFinalReport
- 181-
5. Key indicators of the employment and economic characteristics of the Cultural sector
5.1 List of key indicators
N° Name of the indicator
1 Entrepreneurship
1.1 Share of the cultural enterprises in the overall economy 1.2 Share of the cultural enterprises in the service sector 1.3 Share of the cultural enterprises’ turnover in the overall economy’s turnover 1.4 Share of the cultural enterprises’ turnover in the service sector’s turnover 1.5 Share of the micro-enterprises (by employment size) in the cultural sector 1.6 Share of micro-enterprises (by employment size) in cultural sector compared to
share of micro-enterprises in overall economy 1.7 Share of cultural micro-enterprises (by employment size) in cultural sector
compared to the share of micro-enterprises in the service sector 1.8 Share of self-employed without employees in the total employment of cultural
sector 1.9 Share of the value added produced by cultural sector compared to the overall
economy 1.10 Share of the market oriented (‘turnover over 50% earned by selling own
products or services’ criteria) cultural enterprises compared to the total cultural sector
2 Employment
2.1 Total cultural employment (absolute figures and % of total employment) 2.2 Total employment of the cultural occupations (absolute figures and % of total
employment) 2.3.1 Total employment in the cultural sector (absolute figures and % of total
employment) 2.3.2 Total employment of the market oriented enterprises and organisations in the
cultural sector (absolute figures and % of total employment) 2.4.1 Percentage of employed in cultural occupations working in cultural sector 2.4.2 Percentage of employed of the cultural occupations working in market oriented
enterprises of the cultural sectors 2.5 Share of employees in cultural employment 2.6 Share of persons employed with temporary contract in the cultural sector 2.7 Cultural employment by gender (percentage of women in cultural employment) 2.8 Share of persons with tertiary education in cultural employment 2.9 Share of non-nationals in artist occupations
2.10 Quintiles of the net salary of persons with tertiary education - in cultural employment compared to the same indicator in total in total employment
3 Import and export of the cultural goods
3.1 Share of cultural goods in total import 3.2 Share of cultural goods in total export 3.3 Share of cultural services in total export
4 ICT in cultural sector
4.1 Share of the cultural sector in the total e-commerce turnover 4.2 Main cultural products sold in e-commerce

ESSnet‐CultureFinalReport
- 182-
5.2. Descriptions of the key indicators
1.1. Share of the cultural enterprises in the overall economy
Definition: A count of the enterprises and organizations of the cultural sector divided with the total count of enterprises and organizations and multiplied by one hundred. Purpose: To compare the cultural sector with the overall economy.
Research question: What is the share of cultural enterprises and organizations in overall economy?
Data requirement: Total number of the enterprises and organizations in cultural sector, total number of enterprises and organizations in overall economy
Data sources: Eurostat, SBS
Method of collection: National data from the Member States. SBS regulation - this instrument aims to provide a common framework for the collection and transmission of data.
Formula: NCS/NOE*100 NCS = total number of cultural enterprises and organizations (i.e. enterprises and organizations of the cultural sector) NOE= total number of enterprises and organizations
Analysis and interpretation: High value of the indicator would indicate the higher influence of the cultural sector in the overall economy. Indirectly it shows the higher level of supply and demand of the cultural products and services in area. Low value of the indicator would indicate the lower influence of the cultural sector to the overall economy in the area. It may indicate to the low demand or supply of the specific goods, poor economic climate for the cultural industries etc. Methodological and definition issues or operational limitations: On analyzing data of cultural enterprises and organizations, the differences between the countries have to be taken into account. Data provided by the countries into the structural business database may have differences in their methodology. Structural business database may not cover all the economic activities of the cultural sector by each country but only the market oriented enterprises and organizations according to the national criteria.
1.2. Share of the cultural enterprises in the service sector
Definition: A count of the enterprises and organisations of the cultural sector divided with the total count of enterprises and organisations in service sector and multiplied by one hundred. Purpose: To compare the cultural sector with the service sector.
Research question: What is the share of cultural enterprises and organisations in the service sector?
Data requirement: Total number of the enterprises and organisations in cultural sector, total number of enterprises and organisations in the service sector.
Data sources: Eurostat, SBS
Method of collection: National data from the Member States. SBS regulation - this instrument aims to provide a common framework for the collection and transmission of data.
Formula: NCS/NSE*100 NCS = total number of cultural enterprises and organisations NSE= total number of enterprises and organisations in the service sector

ESSnet‐CultureFinalReport
- 183-
Analysis and interpretation: High value of the indicator would indicate the higher influence of the cultural sector in the service sector. Indirectly it shows the higher level of supply and demand of the cultural products and services in area. Low value of the indicator would indicate the lower influence of the cultural sector to the service sector in the area. It may indicate to the low demand or supply of the specific goods, poor economic climate for the cultural industries etc. Methodological and definition issues or operational limitations: On analysing data of cultural enterprises and organisations, the differences between the countries have to be taken into account. Data provided by the countries into the structural business database may have differences in their methodology. Structural business database may not cover the entire cultural sector by each country but only the market oriented enterprises and organisations according to the national criteria.
1.3. Share of the cultural enterprises’ turnover in the overall economy’s turnover
Definition: A total turnover of the cultural sector divided with the total turnover of enterprises and organizations, multiplied by one hundred. Purpose: To compare the economy of the cultural sector with the overall economy.
Research question: What is the share of cultural sector in the total turnover of the overall economy?
Data requirement: Total turnover of the enterprises and organizations in cultural sector, total turnover of the overall economy
Data sources: Eurostat, SBS
Method of collection: National data from the Member States. SBS regulation - this instrument aims to provide a common framework for the collection and transmission of data
Formula: TCS/TOE*100 TCS = total turnover of cultural enterprises and organizations (i.e. enterprises and organizations of the cultural sector) TOE= total turnover of the overall economy
Analysis and interpretation: High value of the indicator would indicate the higher activity of the cultural sector compared to the overall economy. Indirectly it shows the higher level of supply and demand of the cultural products and services in the area. Low value of the indicator would indicate the lower activity of the cultural sector in the overall economy in area. It may indicate to the low demand or supply of the specific goods, poor economic climate for the cultural industries etc. Methodological and definition issues or operational limitations: On analyzing data of cultural enterprises and organizations, the differences between the countries have to be taken into account. Data provided by the countries into the structural business database may have differences in their methodology. Structural business database may not cover the entire cultural sector by each country but only the market oriented enterprises and organizations according to the national criteria.
1.4. Share of the cultural enterprises’ turnover in the service sector’s turnover
Definition: A total turnover of the cultural sector divided with the total turnover of the service sector, multiplied by one hundred. Purpose: To compare the economy of the cultural sector
Research question: What is the share of cultural sector in the total

ESSnet‐CultureFinalReport
- 184-
with the service sector. turnover of the service sector? Data requirement: Total turnover of the enterprises and organisations in cultural sector, total turnover of enterprises and organisations in the service sector.
Data sources: Eurostat, SBS
Method of collection: National data from the Member States. SBS regulation - this instrument aims to provide a common framework for the collection and transmission of data
Formula: TCS/TSE*100 TCS = total turnover of the cultural enterprises and organisations TSE= total turnover of the enterprises and organisations in the service sector
Analysis and interpretation: High value of the indicator would indicate the higher activity of the cultural sector compared to the service sector. Indirectly it shows the higher level of supply and demand of the cultural products and services in the area. Low value of the indicator would indicate the lower activity of the cultural sector in the service sector in area. It may indicate to the low demand or supply of the specific goods, poor economic climate for the cultural industries etc.Methodological and definition issues or operational limitations: On analysing data of cultural enterprises and organisations, the differences between the countries have to be taken into account. Data provided by the countries into the structural business database may have differences in their methodology. Structural business database may not cover the entire cultural sector by each country but only the market oriented enterprises and organisations according to the national criteria’s.
1.5. Share of the micro-enterprises (by employment size) in the cultural sector
Definition: Total number of the micro-enterprises divided with the total number of the enterprises and organisations of the cultural sector, multiplied by one hundred. Micro enterprises are those which employ less than 10 people. The number of employees in the enterprises. This include the total number of persons who work in the enterprises (inclusive of working proprietors, partners working regularly in the unit and unpaid family workers), as well as persons who work outside the unit who belong to it and are paid by it. These also include par-time workers, seasonal workers, apprentices, and home workers on the payroll. The data about Number of enterprises by employment (micro) can be broken down by NACE (NACE Rev.2 B-N). Purpose: To assess the infrastructure of the European enterprises and test if the cultural industries is similar to the rest of the enterprises in the economy or if they differ.
Research question: What is the share of the micro enterprises in the cultural sector?
Data requirement: The number of employees in the enterprises. Number of the enterprises and organisations in the cultural sector.
Data sources: Eurostat, SBS
Method of collection: National data from the Member States. SBS regulation - this instrument aims to provide a common framework for the collection and transmission of data.
Formula: NMCS/ NCS*100 NMCS = total number of micro enterprises and organisations in cultural sector NCS = total number of cultural enterprises and organisations
Analysis and interpretation: Higher number of micro or small enterprises in the cultural sector than in the overall economy would
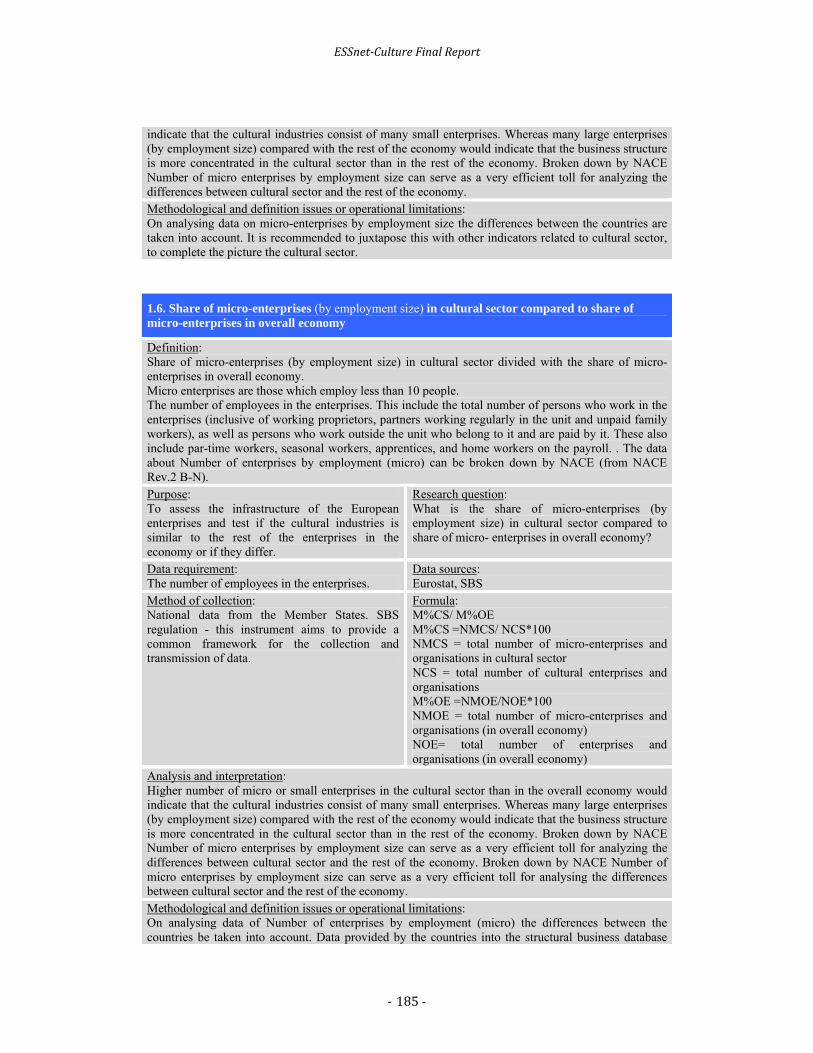
ESSnet‐CultureFinalReport
- 185-
indicate that the cultural industries consist of many small enterprises. Whereas many large enterprises (by employment size) compared with the rest of the economy would indicate that the business structure is more concentrated in the cultural sector than in the rest of the economy. Broken down by NACE Number of micro enterprises by employment size can serve as a very efficient toll for analyzing the differences between cultural sector and the rest of the economy. Methodological and definition issues or operational limitations: On analysing data on micro-enterprises by employment size the differences between the countries are taken into account. It is recommended to juxtapose this with other indicators related to cultural sector, to complete the picture the cultural sector.
1.6. Share of micro-enterprises (by employment size) in cultural sector compared to share of micro-enterprises in overall economy
Definition: Share of micro-enterprises (by employment size) in cultural sector divided with the share of micro- enterprises in overall economy. Micro enterprises are those which employ less than 10 people. The number of employees in the enterprises. This include the total number of persons who work in the enterprises (inclusive of working proprietors, partners working regularly in the unit and unpaid family workers), as well as persons who work outside the unit who belong to it and are paid by it. These also include par-time workers, seasonal workers, apprentices, and home workers on the payroll. . The data about Number of enterprises by employment (micro) can be broken down by NACE (from NACE Rev.2 B-N). Purpose: To assess the infrastructure of the European enterprises and test if the cultural industries is similar to the rest of the enterprises in the economy or if they differ.
Research question: What is the share of micro-enterprises (by employment size) in cultural sector compared to share of micro- enterprises in overall economy?
Data requirement: The number of employees in the enterprises.
Data sources: Eurostat, SBS
Method of collection: National data from the Member States. SBS regulation - this instrument aims to provide a common framework for the collection and transmission of data.
Formula: M%CS/ M%OE M%CS =NMCS/ NCS*100 NMCS = total number of micro-enterprises and organisations in cultural sector NCS = total number of cultural enterprises and organisations M%OE =NMOE/NOE*100 NMOE = total number of micro-enterprises and organisations (in overall economy) NOE= total number of enterprises and organisations (in overall economy)
Analysis and interpretation: Higher number of micro or small enterprises in the cultural sector than in the overall economy would indicate that the cultural industries consist of many small enterprises. Whereas many large enterprises (by employment size) compared with the rest of the economy would indicate that the business structure is more concentrated in the cultural sector than in the rest of the economy. Broken down by NACE Number of micro enterprises by employment size can serve as a very efficient toll for analyzing the differences between cultural sector and the rest of the economy. Broken down by NACE Number of micro enterprises by employment size can serve as a very efficient toll for analysing the differences between cultural sector and the rest of the economy. Methodological and definition issues or operational limitations: On analysing data of Number of enterprises by employment (micro) the differences between the countries be taken into account. Data provided by the countries into the structural business database

ESSnet‐CultureFinalReport
- 186-
may have differences in their methodology. Structural business database may not cover the entire cultural sector by each country but only the market oriented enterprises and organisations according to the national criteria’s.
1.7. Share of cultural micro-enterprises (by employment size) in cultural sector compared to the share of micro-enterprises in the service sector (proposal for the future)
Definition: Share of micro-enterprises (by employment size) in cultural sector divided with the share of micro- enterprises in overall economy. Micro-enterprises are those which employ less than 10 people. The number of employees in the enterprises. This include the total number of persons who work in the enterprises (inclusive of working proprietors, partners working regularly in the unit and unpaid family workers), as well as persons who work outside the unit who belong to it and are paid by it. These also include par-time workers, seasonal workers, apprentices, and home workers on the payroll. . Purpose: To assess the infrastructure of the European enterprises in cultural sector and test if it is similar to the rest of the enterprises in the economy or if it differ.
Research question: What is the share of micro-enterprises (by employment size) in cultural sector compared to share of micro- enterprises in overall economy?
Data requirement: The number of employees in the enterprises.
Data sources: Eurostat, SBS
Method of collection: National data from the Member States. SBS regulation - this instrument aims to provide a common framework for the collection and transmission of data.
Formula: M%CS/ M%OE M%CS =NMCS/ NCS*100 NMCS = total number of micro-enterprises and organizations in cultural sector NCS = total number of cultural enterprises and organizations M%OE =NMOE/NOE*100 NMOE = total number of micro-enterprises and organizations (in overall economy) NOE= total number of enterprises and organizations (in overall economy)
Analysis and interpretation: Higher number of micro or small enterprises in the cultural industries than in the rest of the economy would indicate that the cultural industries consist of many small enterprises whereas many large enterprises by employment compared with the rest of the economy would indicate that the business structure is more concentrated in the cultural industries than in the rest of the economy. Broken down by NACE Number of enterprises by employment (micro) can serve as a very efficient toll for analyzing the differences between cultural sector and the rest of the economy. Methodological and definition issues or operational limitations: When analyzing data of number of enterprises by employment (micro) the differences between the countries should be taken into account. Data provided by the countries into the structural business database may have differences in their methodology. Structural business database may not cover the entire cultural sector by each country but only the market oriented enterprises and organizations according to the national criteria.
1.8. Share of self-employed without employees in the total employment of cultural sector
Definition: The count of self-employed (SE) entrepreneurs without employees in the cultural sector (SEC) in

ESSnet‐CultureFinalReport
- 187-
relation to the count of total employment (total ‘in work’) in the cultural sector (IWC). In work is the labour status in LFS of having work for pay, profit or family gain in the reference week. Self-employed is the professional status of being self-employed without employees. Purpose: To compare the characteristics of the labour market between the member states.
Research question: How large is the fraction of freelancers in the cultural sector?
Data requirement: Total number in work (LFS labour status=in work) in the cultural sector Total number of entrepreneurs without employees in the cultural sector All individuals classified according to NACE rev 2 4 digit level Cultural sector definition according to ESSnet-Culture
Data sources: Eurostat, Community Labour Force Survey (LFS)
Method of collection: Sample survey
Formula: (SEC/IWC)*100
Analysis and interpretation: This variable indicates the importance of self-employed in the cultural sector. Methodological and definition issues or operational limitations: Labour market regulation and the opportunities of larger scale projects influence the indicator. If unemployment benefits is coupled to employment but not free lancing this might reduce the indicator. The indicator is also probable negatively correlated with the average size of the firm in the cultural sector.
1.9. Share of the value added produced by cultural sector compared to the overall economy
Definition: Value added of the cultural sector divided with the total value added, multiplied by one hundred. Value added of the cultural sector calculated by the enterprises selected on 2- (3-, 4-, 5-) digit level of the nomenclature NACE Rev.2. Purpose: To measure the contribution of the cultural sector to the overall economy
Research question: What is the contribution of the cultural sector to the overall economy?
Data requirement: Value added of the cultural sector on 2- (3-, 4-, 5-) digit level of NACE Rev.2. Total value added of the overall economy
Data sources: SNA, Cultural satellite accounts
Method of collection: Administrative
Formula: VAcs/VA*100 VAcs = Value added of the cultural sector VA = Total value added of the overall economy
Analysis and interpretation: High value of the indicator refers to the higher importance of the cultural sector in the gross domestic product. Indirectly it shows the higher level of supply and demand of the cultural industries products and services in the area. Low value of the indicator would indicate the lower importance of the cultural sector in the gross domestic product. It may indicate to the low demand or supply of the specific goods, poor economic climate for the cultural industries etc. Methodological and definition issues or operational limitations: When analyzing data of cultural industries enterprises, the specificities of the countries (e.g. different taxation and restrictions as well as possible support or subsidies of the cultural products) must be taken into account.

ESSnet‐CultureFinalReport
- 188-
1.10. Share of the market oriented (‘turnover over 50% earned by selling own products or services’ criteria) cultural enterprises compared to the total cultural sector
Definition: Total number of the market oriented enterprises and organisations divided with the total number of the enterprises and organisations in cultural sector, multiplied by one hundred. Purpose: To measure the share of the market oriented enterprises and organisations in the cultural sector.
Research question: What is the contribution of the market oriented enterprises and organisations to the cultural sector?
Data requirement: Total number of market oriented enterprises and organisations, total number of cultural enterprises and organisations.
Data sources: Data availability is unknown. Needs analyses on national level.
Method of collection: Unknown. Needs analyses on national level.
Formula: NCI/ NCS*100 NCI = total number of market oriented enterprises and organisations of the cultural sector NCS = total number of cultural enterprises and organisations
Analysis and interpretation: High value of the indicator would indicate the high number of the market oriented enterprises and organisations (which is a economically more significant part of the cultural sector) compared to the all total number of cultural enterprises and organisations. Indirectly it shows the good climate for the market oriented enterprises and organisations, higher level of supply and demand of the market oriented enterprises and organisations products and services in cultural sector. Low value of the indicator would indicate the poor climate for the market oriented enterprises and organisations of the cultural sector and poor productivity of those enterprises and organisations. It may indicate to the low demand or supply of the specific goods etc. Methodological and definition issues or operational limitations: On analysing data of market oriented cultural enterprises and organisations, the specialities of the countries (e.g. different taxation and restrictions as well as possible support or subsidies of the cultural products) must be taken into account. No data available at the moment. A national practice is the topic for future analysis’s. Data of the market oriented enterprises according to European System of Accounts 50% criteria is currently not available. Indicator should be seen as theoretically important research area, to distinguish and characterise economically significant part of the cultural sector.
2.1. Total cultural employment (absolute figures and % of total employment)
Definition: Total cultural employment covers persons aged 15 years and over and living in private households who, during the reference week, did any kind of work in a cultural sector or any kind of work defined as a cultural occupation (whether their sector were cultural or not), for pay or profit, for at least one hour, or persons who were not working but had non-cultural jobs in a cultural sector or cultural jobs (whether their sector were cultural or not). Employment covers all types of professional status (employers, employees, self-employed and family workers). Purpose: To compare the amount of people employed in the cultural employment with the overall employment. For a given year, to compare the share of persons employed in the cultural sector or having cultural
Research question: What is the total number of persons concerned with cultural employment? What is the share of cultural employment in overall employment?

ESSnet‐CultureFinalReport
- 189-
occupations in a non-cultural sector in every Member State of the European Union. To compare the evolution, from one year to the other, of these shares. Data requirement: Total number of persons in cultural employment, total number of persons in overall employment.
Data sources: Eurostat, LFS
Method of collection: Household sample survey
Formula: CEmp CEmp/OEmp*100 CEmp = Total number of cultural employment OEmp = Total number of overall employment
Analysis and interpretation: High value of the indicator refers to the higher importance of the cultural employment in the total employment. Indirectly it shows e.g. the higher level of supply and demand of the cultural sector’s products and services in the area. Low value of the indicator would indicate the lower importance of the cultural employment in the overall employment. It may indicate to the low demand or supply of the specific goods, poor economic climate for the cultural industries etc. Methodological and definition issues or operational limitations: When analyzing data of cultural employment, the specificities of the countries (e.g. differences of the labor market policies as well as its measures and possible restrictions or support (probable subsidies) related to cultural products and services must be taken into account.
2.2. Total employment in cultural occupations (absolute figures and % of total employment)
Definition: Total employment in cultural occupations covers persons aged 15 years and over and living in private households who, during the reference week, did any kind of work defined as a cultural occupation (whether their sector were cultural or not), for pay or profit, for at least one hour, or persons who were not working but had jobs defined as a cultural occupation (whether their sector were cultural or not). Employment covers all types of professional status (employers, employees, self-employed and family workers). Purpose: To compare the amount of people employed in the cultural occupations with the overall employment. For a given year, to compare the share of persons employed with the cultural occupations in cultural or non-cultural sector in every Member State of the European Union. To compare the evolution, from one year to the other, of these shares.
Research question: What is the total number of persons having a cultural occupation? What is the share of persons having a cultural occupation in total employment?
Data requirement: Total number of employed incultural occupations, total number of the overall employment
Data sources: Eurostat, Community Labour Force Survey (LFS)
Method of collection: Household sample survey
Formula: ECO ECO/OEmp*100 where : ECO = total employment of the cultural occupations OEmp = overall employment
Analysis and interpretation:

ESSnet‐CultureFinalReport
- 190-
High value of the indicator refers to the higher importance of the cultural occupations in the overall employment. It can be juxtaposed also with the employment of the cultural sector. Low value of the indicator would indicate the lower importance of the cultural occupations in the overall employment. It may indicate to the low demand or supply of the specific goods, poor economic climate for the culture related products etc. Indicator is the part of the total cultural employment. Methodological and definition issues or operational limitations: On analysing data of cultural occupations, the specialities of the countries (e.g. differences of the labour market policies as well as its measures and possible restrictions or support (probable subsidies) related to cultural products and services must be taken into account.
2.3.1. Total employment in the cultural sector (absolute figures and % of total employment)
Definition: Total employment in the cultural sector covers persons aged 15 years and over and living in private households who, during the reference week, had any kind of work in a cultural sector (whether their occupation were cultural or not), for pay or profit, for at least one hour, or persons who were not working but had a job (whether their occupation were cultural or not) in a cultural sector. Employment covers all types of professional status (employers, employees, self-employed and family workers). Purpose: To compare the amount of people employed in the cultural sector with the overall employment. For a given year, to compare the share of persons employed in the cultural sector in every Member State of the European Union. To compare the evolution, from one year to the other, of this share.
Research question: What is the total number of persons employed in the cultural sector? What is the share of persons employed in the cultural sector in total employment?
Data requirement: Total number of employed in cultural sector, total number of the overall employment
Data sources: Eurostat, Community Labour Force Survey (LFS)
Method of collection: Household sample survey
Formula: ECS ECS/OEmp*100 where : ECS = total employment of the cultural sector OEmp = overall employment
Analysis and interpretation: High value of the indicator refers to the higher importance of the cultural sector’s employment in the overall employment. Low value of the indicator would indicate the lower importance of the in the cultural sector’s employment in the overall employment. It may indicate to the low demand or supply of the specific goods, poor economic climate for the culture related products etc. Indicator is the part of the total cultural employment. Methodological and definition issues or operational limitations: On analysing data of employment in the cultural sector, the specialities of the countries (e.g. differences of the labour market policies as well as its measures and possible restrictions or support (probable subsidies) related to cultural products and services must be taken into account.

ESSnet‐CultureFinalReport
- 191-
2.3.2. Total employment of the market oriented enterprises and organisations in the cultural sector (absolute figures and % of total employment)
Definition: Total employment in the cultural industries covers persons aged 15 years and over and living in private households who, during the reference week, had any kind of work in a cultural industry (whether their occupation were cultural or not), for pay or profit, for at least one hour, or persons who were not working but had a job (whether their occupation were cultural or not) in a cultural industry. Employment covers both employees and self-employed persons. Purpose: To compare the amount of people employed in the cultural industries with the overall employment. For a given year, to compare the share of persons employed in the cultural industries in every Member State of the European Union. To compare the evolution, from one year to the other, of this share.
Research question: What is the total number of persons employed in the cultural industries? What is the share of persons employed in the cultural industries in total employment?
Data requirement: Total number of the employment of the cultural industries, total number of the overall employment
Data sources: Data availability is unknown. Needs analyses on national level.
Method of collection: Household sample survey
Formula: ECI ECI/OEmp*100 where : ECI = total employment of the cultural industries OEmp = overall employment
Analysis and interpretation: High value of the indicator refers to the higher importance of the market oriented enterprises and organisations in the cultural sector’s employment. It refers to the good health of the economically more significant part of the cultural sector. Low value of the indicator would indicate the lower importance of the market oriented enterprises and organisations in the cultural sector’s employment. It may indicate to the low demand or supply of the specific goods, poor economic climate for the culture related products etc. Methodological and definition issues or operational limitations: On analysing data of the employment of the market oriented enterprises and organisations in the cultural sector as well as cultural sector itself, the specialities of the countries (e.g. differences of the labour market policies as well as its measures and possible restrictions or support (probable subsidies) related to cultural products and services must be taken into account. Indicator should be seen as theoretically important research area, to distinguish and characterise economically significant part of the cultural sector. National practices is the topic for future analysis’s.
2.4.1. Percentage of employed in cultural occupations working in cultural sector
Definition: Persons employed in cultural occupations working in cultural sector are those, aged 15 years and over and living in private households who, during the reference week, did any kind of work defined as a cultural occupation in a cultural sector, or who were not working but had a job defined as a cultural occupation in a cultural sector. Employment covers all types of professional status (employers, employees, self-employed and family workers). Purpose: To measure the share of people employed in the
Research question: What is the share of cultural occupations in the

ESSnet‐CultureFinalReport
- 192-
cultural occupations in the total employment of the cultural sector.
total employment incultural sector?
Data requirement: Total number of employed in cultural occupations, total employment in the cultural sector
Data sources: Eurostat, Community Labour Force Survey (LFS)
Method of collection: Household sample survey
Formula: ECOCS / ECS*100 where : ECS = total employment incultural sector ECOCS = total employment in cultural occupations in cultural sector
Analysis and interpretation: High value of the indicator refers to the higher importance of the cultural occupations in the cultural sector. Low value of the indicator would indicate the lower importance of the cultural occupations in the cultural sector. It refers to the need of specialized workers in the sector. Methodological and definition issues or operational limitations: On analysing data of cultural occupations in the cultural sector, the specialities of the countries (e.g. differences of the labour market policies as well as its measures and possible restrictions or support (probable subsidies) related to cultural products and services must be taken into account.
2.4.2. Percentage of employed of the cultural occupations working in market oriented enterprises and organisations of the cultural sector
Definition: Persons employed in cultural occupations working in cultural industries are those, aged 15 years and over and living in private households who, during the reference week, did any kind of work defined as a cultural occupation in a cultural industry, or who were not working but had a job defined as a cultural occupation in a cultural industry. Employment covers both employees and self-employed persons. Purpose: To measure the share of the cultural occupations in the total employment of the cultural industries.
Research question: What is the share of cultural occupations in the total employment of the cultural industries?
Data requirement: Total number of the employment of the cultural occupations in the cultural industries, total number of the employment in the cultural industries
Data sources: Data availability is unknown. Needs analyses on national level.
Method of collection: Household sample survey
Formula: ECOCI / ECI*100 where : ECI = total employment of the cultural industries ECOCI = total employment of the cultural occupations in the cultural industries
Analysis and interpretation: High value of the indicator refers to the higher importance of the cultural occupations in market oriented enterprises and organisations of the cultural sector. Low value of the indicator would indicate the lower importance of the cultural occupations in the market oriented enterprises and organisations of the cultural sector. It refers to the need of highly qualified specialists in the economically more significant part of the cultural sector. It may refer indirectly to need of cultural professionals outside the cultural sector. Methodological and definition issues or operational limitations: On analysing data of cultural occupations in market oriented enterprises and organisations of the cultural sector, the specialities of the countries (e.g. differences of the labour market policies as well as

ESSnet‐CultureFinalReport
- 193-
its measures and possible restrictions or support (probable subsidies) related to cultural products and services must be taken into account. Indicator should be seen as theoretically important research area, to distinguish and characterise economically significant part of the cultural sector. National practices is the topic for future analysis’s.
2.5. Share of the employees in cultural employment (employed in cultural sector and employed in cultural occupations in non cultural sectors)
Definition: Persons culturally-employed are those, aged 15 years and over and living in private households, who during the reference week did any kind of work for pay or profit for at least one hour, or persons who were not working but had jobs from which they were temporarily absent, in a cultural sector or having a cultural occupation in a non-cultural sector. Employees are all those workers who hold the type of job defined as paid employment jobs. Employees with stable contracts are those employees who have had, and continue to have, an explicit (written or oral) or implicit contract of employment, or a succession of such contracts, with the same employer on a continuous basis. On a continuous basis implies a period of employment which is longer than a specified minimum determined according to national circumstances (if interruptions are allowed in this minimum period, their maximum duration should also be determined according to national circumstances). Regular employees are those employees with stable contracts for whom the employing organization is responsible for payment of relevant taxes and social security contributions and/or where the contractual relationship is subject to national labour legislation. Non-employees gather employers, self-employed workers and family workers. Purpose: For a given year, to compare the share of employees among persons culturally-employed in the countries of the European Union. For a given country, to compare the evolution, from one year to the other, of this share.
Research question: What is the share of employees in total cultural employment ?
Data requirement: Number of employees in cultural employment, a given year in a given country, for all the countries in the European Union.
Data sources: Eurostat, Community Labour Force Survey (LFS)
Method of collection: Household sample survey
Formula: SCEEt,c = CEEt,c / (CEEt,c + CENEt,c), where : SCEEt,c is the share of employees among the persons culturally-employed, the year t in the country c, CEEt,c is the number of employees culturally-employed, the year t in the country c, CENEt,c is the number of non-employees culturally-employed, the year t in the country c; CENEt,c = (ECSt,c + ECOt,c) - CEEt,c, where ECSt,c is the total number of persons employed in a cultural sector, the year t in the country c and ECOt,c is the total number of persons having a cultural occupation in a non-cultural sector, the year t in the country c.
Analysis and interpretation: An employer-employee relationship exists when there is an agreement, which may be formal or informal, between an enterprise and a person, normally entered into voluntarily by both parties, whereby the person works for the enterprise in return for remuneration in cash or in kind. The part of non-employees among persons employed in the cultural and creative industries’ sector gives

ESSnet‐CultureFinalReport
- 194-
an hint of the ‘independent part’ of cultural employment in a given area: that part may vary widely from one cultural industry (for instance, architectural activities) to another (audiovisual industries). Methodological and definition issues or operational limitations:1 This measurement occurs in volume: while comparing one geographical area’s volume to another, the total numbers of employees and non-employees of the areas must be taken into account.
2.6. Share of persons employed with temporary contract in the cultural sector
Definition: The count of employees with temporary contract in relation to the count of all employees in the cultural sector (IWc). In work is the labour status in LFS of having work for pay, profit or family gain in the reference week. Temporary contract is defined as in the LFS as ‘person has temporary job/work contract of limited duration’. Purpose: To compare the characteristics of the labour market between the MS.
Research question: How large is the percentage of employees with temporary contract among all employees in cultural sector?
Data requirement: Total number of employees in the cultural sector (IWc). Total number of employees with temporary contract in the cultural sector (IWTc). Cultural sector definition according to ESSnet-Culture.
Data sources: Eurostat, Community Labour Force Survey (LFS).
Method of collection: Household sample survey.
Formula: (IWc)/IWC)*100
Analysis and interpretation: This variable indicates whether the employment within the cultural sector in the MS is characterised by a large amount of temporary contracts. Methodological and definition issues or operational limitations: On analysing data of cultural employment, the specialities of the countries (e.g. differences of the labour market policies as well as its measures and possible restrictions or support (probable subsidies) related to cultural products and services must be taken into account. Labour market regulation affects the amount of temporary contracts in the way that such contract is more common in institutional settings with high costs for the employer to dismiss employees.
2.7. Cultural employment by gender (Percentage of women in cultural employment)
Definition: This indicator is the same indicator as indicator 2.1 distributed on gender Purpose: To assess the gender distribution within the total cultural employment
Research question: How large is the proportion of females in the cultural employment?
Data requirement: Total employment in the cultural sector, by gender Total employment in cultural occupations outside the cultural sector, by gender Cultural occupations according to ESSnet-Culture TF3 definition Cultural sector according to ESSnet-Culture TF1
Data sources: Eurostat, Community Labour Force Survey (LFS)

ESSnet‐CultureFinalReport
- 195-
definition Method of collection: Household sample survey
Formula: (IWc FEM)/IWC)*100
Analysis and interpretation: The indicator refers to the gender equality. On comparison with the overall employment it refers to the better or worse situation of the gender equality in the sector. Methodological and definition issues or operational limitations: On analysing data of cultural employment, the specialities of the countries (e.g. differences of the labour market policies as well as its measures and possible restrictions or support (probable subsidies) related to cultural products and services must be taken into account.
2.8. Share of persons with tertiary education in cultural employment
Definition: This indicator is the same indicator as indicator 2.1 distributed by educational attainment. The count of total cultural employment where the first digit in the ISCED-97 code equals 5 or 6 (CEHE), in relation to total cultural employment (CE) Purpose: To assess higher education attainment in the cultural employment
Research question: How large is the proportion of higher educated in the cultural employment?
Data requirement: Total employment in the cultural sector, by educational attainment Total employment in cultural occupations outside the cultural sector, by educational attainment Cultural occupations according to ESSnet-Culture TF3 definition Cultural sector according to ESSnet-Culture TF1 definition
Data sources: Eurostat, Community Labour Force Survey (LFS)
Method of collection: Household sample survey
Formula: (CEHE)/CE)*100
Analysis and interpretation: The share of persons with tertiary education in cultural employment in juxtaposition with the same indicator of the overall employment refers to the level of need of highly qualified and educated persons in the sector. Methodological and definition issues or operational limitations: On analysing data of cultural employment, the specificities of the countries (e.g. differences of the labour market policies as well as its measures and possible restrictions or support (probable subsidies) related to cultural products and services must be taken into account.
2.9. Share of non-nationals in artist occupations
Definition: Number of people with foreign nationality employed in artist occupations divided by the total number persons employed in artistic occupations; the sum multiplied by 100. ‘Artist occupations’ are defined as persons in the employed labour force with their main job in one of the following occupations (ISCO-08): 2161 Building architects, 2162 Landscape architects, 2163 Product and garment designers, 2164 Town and traffic planners, 2166 Graphic and multimedia designers, 2431 Advertising and marketing professionals, 2513 Web and multimedia developers, 2641 Authors and related writers, 2642 Journalists, 2651 Visual artists, 2652 Musicians, singers and composers, 2653 Dancers and choreographers, 2654 Film, stage and related directors and producers,

ESSnet‐CultureFinalReport
- 196-
2655 Actors, 2656 Announcers on radio, television and other media, 2659 Creative and performing artists not elsewhere classified, 3431 Photographers, 3432 Interior designers and decorators, 3435 Other artistic and cultural associate professionals, 3521 Broadcasting and audio-visual technicians, 7312 Musical instrument makers and tuners, 7313 Jewellery and precious-metal workers, 7314 Potters and related workers, 7315 Glass makers, cutters, grinders and finishers, 7316 Sign writers, decorative painters, engravers and etchers, 7317 Handicraft workers in wood, basketry and related materials, 7318 Handicraft workers in textile, leather and related materials, 7319 Handicraft workers not elsewhere classified, 7522 Cabinet-makers and related workers. The criterion used here is function ‘creation’ in the ESSnet-Culture list of cultural occupations. ‘Employed’ refers to the LFS definition of employment that covers all persons who worked at least one hour for pay or profit during the reference week of the survey or were temporarily absent from such work. Purpose: To assess the number of non-nationals in the total number of persons in artistic occupations. To measure (approximately) the (inbound) mobility of artists in the Member States. Also to gain some idea of the cultural diversity and ethnic variety of the artistic labour force in a given country.
Research question: What proportion of persons working as artists in a given country have a foreign nationality?
Data requirement: Number of foreign citizens employed in artist occupations in the country. Number of persons employed in artist occupations in the country.
Data sources: Eurostat, Community Labour Force Survey (LFS)
Method of collection: The LFS is a rotating random sample survey of persons in private households. For details see Council Regulation (EC) No 577/98 of 9 March 1998 on the organisation of a labour force sample survey in the Community (OJ No L 77/3).
Formula: 100*(E/P) E = Total number of non-nationals holding artist occupations in the employed labour force P = Total number of employed labour force in artist occupations
Analysis and interpretation: High value of the indicator could suggest the attractiveness of the country as a working environment for artists. Indirectly the indicator may also be interpreted to give information on the efforts of host countries to attract artists. Low value of the indicator would need to be interpreted against background data on the artistic labour market in the country in question as well as the geography of the art world. On the one hand, it could be a sign of a non-energetic cultural life with a limited number of job opportunities and funding sources. On the other, it may be affected by the attractiveness of particular global art centres. Methodological and definition issues or operational limitations: The proposed indicator is limited in its ability to depict the mobility of artists directed towards the EU countries. The LFS takes into account relatively long periods of employment, while leaving out short visits which are common among artists. Value of the indicator may be influenced by the general proportion of the non-nationals in the country. The comparison of the share of non-nationals in artistic occupations with that observed in total employment would provide relevant information as well. According to the Council Regulation of the LFS, the survey should be carried out in each Member State in a sample of households or of persons residing in the economic territory of that State at the time of the survey (see http://eur-lex.europa.eu/LexUriServ/site/en/oj/1998/l_077/l_07719980314en00030007.pdf). In practice, to be counted in the population frame for the LSF in a given country, quite permanent residence is needed; depending on the country, at least one year is required. In Finland, for instance, the population frame for the LFS consists of people who are included in the Finnish Population Register and have been assigned a Finnish social security number. If sample size allows, the indicator could be refined to divide non-nationals into those who are citizens of other member states and those who come outside the EU.

ESSnet‐CultureFinalReport
- 197-
The LFS provides other variables besides nationality that could be used to capture mobility from different angles: country of residence one year before the survey, years of residence in the country and country of birth. The reliability of such data (sample size) should be examined. The Eurostat Pocketbook Cultural Statistics (2007) includes a similar indicator concerning the whole cultural labour force (a cross-tabulation of cultural industries and cultural occupations), see pp. 52 and 70. See also the recommendations concerning statistics by the OMC working group on the mobility of artists and culture professionals in Final report and recommendations to the Cultural Affairs Committee on improving the conditions to support the mobility of artists and culture professionals, June 2010, pp. 5 and 33 (http://ec.europa.eu/culture/key-documents/doc/MOC_final_report_en.pdf)
2.10. Deciles of the net salary of employees with tertiary education – in cultural employment compared to the overall employment
Definition: Deciles of the net salary of employees with tertiary education in cultural employment divided by the deciles of the net salary of all employees with tertiary education Net salary is simplified term for the EU-LFS variable ‘The monthly (take-home) pay’ – it is the pay after (provisional, subject to revision later) deduction of income tax and National Insurance Contributions. It includes regular overtime, extra compensation for shift work, seniority bonuses, regular travel allowances and per diem allowances, tips and commission, compensation for meals. Tertiary education is defined by ISCED-97 (levels 5-6). Purpose: For a given year, to compare the distibution of the deciles observed in cultural employment (employees with tertiary education) with the distribution of the deciles observed in overall employment. To compare the evolution, from one year to the other, of this number.
Research question: What are the deciles of net salaries of employees with tertiary education observed in cultural employment, compared with the deciles observed in overall employment?
Data requirement: Deciles of net salaries of employees with tertiary education – for overall employment and cultural employment.
Data sources: Eurostat, LFS
Method of collection: Household sample survey
Formula: TCEmplower decile/TOEmplower decile TCEmphigher decile/TOEmphigher decile TCEmp = Employees with tertiary education in cultural employment TOEmp = Employees with tertiary education in overall employement
Analysis and interpretation: Higher percentage of employees with tertiary education observed in the higher deciles of net salaries than that observed in the lower deciles, compared with the same indicator in overall employment, refers to the higher demand of the professionals with tertiary education in the cultural sector. Methodological and definition issues or operational limitations: On analysing data of cultural employment, the specificities of the countries (e.g. differences of the labour market policies as well as its measures and possible restrictions or support (probable subsidies) related to cultural products and services must be taken into account.

ESSnet‐CultureFinalReport
- 198-
3.1. Share of cultural goods in total import
Definition: Value of the imported cultural goods divided with the value of total import, multiplied by one hundred. Purpose: To compare the ratio of the cultural goods import in total import of the goods.
Research question: What is the share of cultural goods’ in total import in the country (area)?
Data requirement: Total value of the imported cultural goods in the country (area). Total value of the whole import of goods in the country (area).
Data sources: Eurostat, Comext
Method of collection: Administrative
Formula: (Icg/I)*100 Icg = Total value of the imported cultural goods in the country (area). I= Total value of the whole import of goods in the country (area).
Analysis and interpretation: High value of the indicator would indicate the good availability of the imported cultural goods in the area. Indirectly it shows the higher level of the demand of the imported cultural goods in the area. Low value of the indicator would indicate the poor availability of the imported cultural goods. It may indicate to the low demand of the specific goods also the higher level of the taxes or possible restrictions for importing cultural goods. Methodological and definition issues or operational limitations: When analyzing data of retail trade enterprises the specialties of the countries (e.g. different taxation and restrictions as well as possible support or subsidies of the cultural products) must be taken into account. The concentration of the retail trade enterprises may also be affected by the density of the population in the area.
3.2. Share of cultural goods in total export
Definition: Value of the exported cultural goods divided with the value of total export, multiplied by one hundred. Purpose: To compare the ratio of the cultural goods export in total export of the goods by country (area).
Research question: What is the share of cultural goods’ in total export in the country (area)?
Data requirement: Total value of the exported cultural goods in the country (area). Total value of the whole export of goods in the country (area).
Data sources: Eurostat, Comext
Method of collection: Administrative
Formula: (Ecg/E)*100 Ecg = Total value of the exported cultural goods in the country (area). E = Total value of the whole export of goods in the country (area).
Analysis and interpretation: High value of the indicator would indicate the good availability of the exported cultural goods abroad. Indirectly it shows the higher level of the demand of the exported cultural goods abroad. Low value of the indicator may indicate to the low demand of the specific goods abroad, also the higher level of the taxes or possible restrictions for exporting cultural goods. Methodological and definition issues or operational limitations:

ESSnet‐CultureFinalReport
- 199-
When analyzing data of retail trade enterprises the specialties of the countries (e.g. different taxation and restrictions as well as possible support or subsidies of the cultural products) must be taken into account. The concentration of the retail trade enterprises may also be affected by the density of the population in the area.
3.3. Share of cultural services in total exports (goods and services)
NB: This indicator is a proposal for the future as the currently available data seem inadequate and have to be explored further. The definition of cultural services also needs to be elaborated to accord with the ESSnet-Culture framework for cultural statistics consisting of a matrix of six cultural domains and ten functions. Definition: Cost of the exported cultural services divided with the cost of total export, multiplied by one hundred. Cultural services: UNESCO’s recent work on cultural statistics gives a starting point for the EU definition of cultural services. In the UNESCO Framework for Cultural Statistics (2009), cultural services are defined as those activities that are aimed at satisfying cultural interests or needs. They do not represent cultural material goods in themselves but facilitate their production and distribution. They typically consist of licensing activities and other copyright-related services, audiovisual distribution activities, the promotion of performing arts and cultural events, as well as cultural information services and the preservation of books, recordings and artefacts (in libraries, documentation centres, museums). (The 2009 UNESCO Framework for cultural statistics, UNESCO Institute for Statistics, 2009, p. 87; see also International Flows of Selected Cultural goods and Services, 2005, p. 14.) The UNESCO FCS is both wider (a higher number of cultural domains) and deeper (longer value chains) than the one proposed by the ESSnet-Culture project. This affects both the theoretical definition of cultural services and the identification of cultural services from the existing classifications of services. Purpose: To assess the importance of cultural services in the total exports (goods and services) of each EU country and the EU area as a whole.
Research question: What is the percentage of cultural services in the total exports (goods and services) of the country in question (and the EU area as a whole)?
Data requirement: 1) The value of exported cultural services (€); 2) the total value of all exported goods and services (€)
Data sources: 1) Eurostat, Balance of Payments (BoP)/ International Trade in Services Statistics (export of services); 2) Comext/BoP (total exports in goods and services)
Method of collection: 1) The BoP data are collected through national surveys, business declarations and administrative sources, 2) statistics on the export of goods are based on customs declarations.
Formula: (ECS/E)*100 ECS = Total cost of exported cultural services E = Total cost of the exports (goods and services)
Analysis and interpretation: High value of the indicator would indicate the good availability of the exported cultural services abroad. Indirectly it shows the higher level of the demand of the exported cultural services abroad. Low value of the indicator may indicate to the low demand of the specific services abroad, also the higher level of the taxes or possible restrictions for exporting cultural services. Methodological and definition issues or operational limitations: The main methodological references used for the production of statistics on international trade in services are the International Monetary Fund (IMF)’s fifth balance of payments manual (BPM5) and the United Nations’ Manual on statistics of international trade in services. The transmission of data on international trade in services to Eurostat is covered by Regulation (EC) No 184/2005 of the European Parliament and of the Council. The breakdown of Eurostat statistics on international trade in services includes three main sub-items: transport, travel, and other services.

ESSnet‐CultureFinalReport
- 200-
Transport covers all transport services that are provided by residents of one economy for those of another and that involve the carriage of passengers, the movement of goods (freight), rentals (charters) of carriers with crew, and related supporting and auxiliary services. All modes of transport are considered including sea, air, space, rail, road, inland waterway, and pipelines, as are other supporting and auxiliary services (such as storage and warehousing). Travel covers primarily the goods and services acquired from an economy by travellers during visits of less than one year to that economy. The goods and services are purchased by, or on behalf of, the traveller or provided, without a quid pro quo (that is, are provided as a gift), for the traveller to use or give away. The transportation of travellers within the economies that they are visiting, where such transportation is provided by carriers not resident in the particular economy being visited, as well as the international carriage of travellers are excluded; both are covered in passenger services under transport. Also excluded are goods purchased by a traveller for resale in the traveller’s own economy or in any other economy. Travel is divided in two subcomponents: business travel and personal travel. Other services comprise external transactions not covered under transport or travel, specifically: communications services, construction services, insurance services, financial services, computer and information services, royalties and license fees, other business services, personal, cultural and recreational services, and government services. (http://epp.eurostat.ec.europa.eu/statistics_explained/index.php/International_trade_in_services) The Balance of Payments (BoP) is a statistical statement that summarizes transactions between residents and non-residents during a period. Data on the international trade in services are a component of BoP current account. BoP data for the EU countries are available on line at the Eurostat site. The member states are requested to provide Eurostat with service trade data classified by type according to the Extended Balance of Payments Services Classification (EBOPS) from 2002. This extension of the BPM5 classification was developed to fulfill the data needs generated from the General Agreement on Trade in Services (GATS) that became effective in 1995. The EPOBS provides a more extensive breakdown of cultural activities than the BPM classification. NB: EU data on external trade are compiled according to EU guidelines and may therefore differ from national data published by Member States. Unsolved: The BoP data are coded by EBOPS only. The service data (architectural, photographic etc.) coded by CPA 2008 in the Comext database do not derive from BoP statistics –> where do they come from? The main interest in the collection of BoP data on services however lies in the overall flows rather than in the types of services exported and imported. The main result is usually reported in the form of net balance between total exports (credits) and total imports (debits). The member states gather the data on international trade in services mainly through surveys of enterprises. For purposes of selection and sampling, the enterprises are classified according to NACE Rev.2. The data on trade of services are however not reported according to NACE. The UN Manual on Statistics of International Trade in Services (2002) was revised in 2010 (http://unstats.un.org/unsd/publication/Seriesm/series_m86rev1e.pdf). Changes to the EBOPS classification were also proposed as part of the process. The revised classification will be adopted in the EU in 2014 (with data from 2013). There is a correspondence between EBOPS 2002 and CPC version 1.1, and the correspondence between EBOPS 2010 and CPC version is being currently prepared by UNSD, WTO and OECD. If adopted at a detailed level, the renewed EBOPS classification may result in better measurement of cultural services. The UNESCO FCS 2009 contains a list of cultural services based on a draft for the revised EBOPS from June 2009 (p. 39). UNESCO Institute for Statistics used the BoP data to measure international trade in cultural services in the report ‘International flows of selected cultural goods and services, 19942003’ (2005). UNCTAD also relies on the same source in its Creative Economy Reports from 2008 and 2010. Both UIS and UNCTAD noted several problems when using the BoP data. To start with, the currently used classifications of services are not sufficiently detailed to identify cultural items. These may be aggregated in the same class with non-cultural ones, or items falling into several cultural domains have been grouped together. The classes for copyright royalties and license fees contain both industrial property and intellectual and artistic property. At the international level, one of the problems in using the BoP data is that countries do not disaggregate types of services at a level that would be desirable for identifying cultural items. The

ESSnet‐CultureFinalReport
- 201-
UNESCO report on the international flows of cultural goods and services (2005) proposed that countries should be encouraged to provide a greater range of data to illustrate the evolution of cultural services (p. 49). In the Eurostat Pocketbook on Cultural Statistics (2011) no information on the trade in cultural services is given. The omission is based on the ‘Expert Report of Sources’ (2008) that was compiled by the French Ministry of Education and helped in the compilation of the first edition of the Pocketbook (2007). The report assessed the existing service trade data and the classifications used in them finding them inadequate for the purposes of cultural statistics. The report nevertheless concluded that ‘[i]t could be very useful to have knowledge of literary and artistic property rights [EBOPS 2002 codes 891 and 892], and to evaluate the item on audiovisual and performing arts-related services [code 288]’ (p. 41). Currently audiovisual services are the category of cultural services where enough coverage appears to be available based on balance of payments data. The actual formation of the contents of this category in each country however needs to be explored before publishing any figures based on these data. Problems in the identification of cultural services reflect in part the general problems in the statistical depiction of services. The existing statistical classifications and schemes are still based on the model of industrial production of tangible goods. Services are becoming economically more and more important. At the same the notion of services is blurring. The currently available trade in services data relate chiefly (?) to the 1) cross-border supply of services where both the supplier and the consumer remain in their respective countries and the services cross the border. The General Agreement on Trade in Services (GATS) identifies three other modes through which services may be internationally traded: through, 2) consumption abroad (the consumer goes abroad to consume a cultural service), 3) commercial presence (the service supplier from abroad is established in the country of the consumer in order to supply the service) and the, 4) presence of natural persons (an individual enters the country of the consumer to provide a service). The second and the fourth modes of service supply mentioned above are connected to cultural tourism and the short-term mobility of artists and cultural workers. In the latter case, it is important to make a distinction between service provision and provision of labour. Payments for the use of labour do not count as trade in services. Demarcation problems are also posed by intellectual property rights and e-commerce. Intellectual property rights may be rolled up in the material goods, or the two elements may be separated from each other. Charges for electronically delivered products are included in services, and the same goes for software products that are supplied across the border if they are obtained with a non-perpetual license to use. The above mentioned examples also show that in the technical sense used in trade statistics the concept of cultural services somewhat differs from the cultural policy conception of cultural services. Bibliography EUROSTAT: Ministry of Culture and Communication (France) (2008). Expert Report of Sources. The Collection of Cultural Statistics in Europe. Luxembourg: Eurostat.
OECD: OECD Statistics on International Trade in Services: Volume I - Detailed Tables by Service Category, 2000-2008, 2010 Edition http://www.oecd.org/document/43/0,3746,en_2649_34243_1898539_1_1_1_1,00.html
UNCTAD: Creative Economy Report (2010). UNCTAD http://www.unctad.org/Templates/WebFlyer.asp?intItemID=5763&lang=1
UNESCO: International flows of selected cultural goods and services 1994–2003. Defining and capturing the flows of global cultural trade. (2005). Montreal: UNESCO Institute for Statistics. http://www.uis.unesco.org/template/pdf/cscl/IntlFlows_EN.pdf The 2009 UNESCO Framework for Cultural Statistics (2009). Quebec: UNESCO Institute for Statistics. http://www.uis.unesco.org/template/pdf/cscl/framework/FCS_2009_EN.pdf WTO:
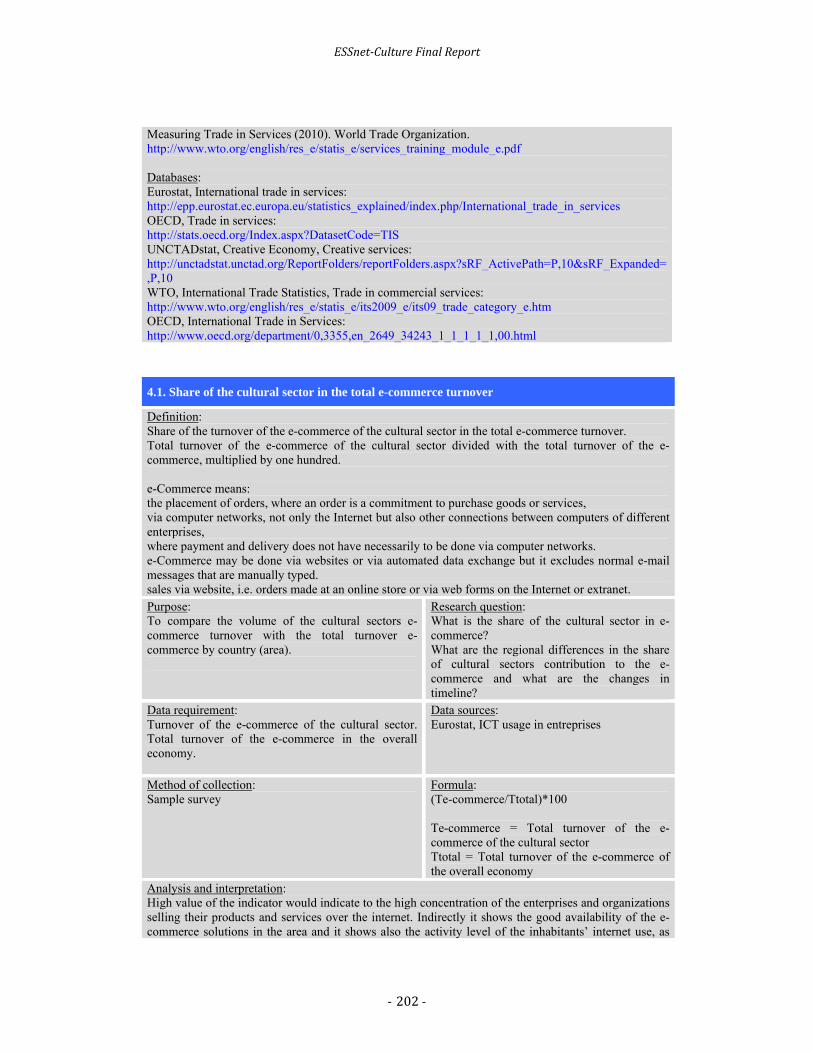
ESSnet‐CultureFinalReport
- 202-
Measuring Trade in Services (2010). World Trade Organization. http://www.wto.org/english/res_e/statis_e/services_training_module_e.pdf Databases: Eurostat, International trade in services: http://epp.eurostat.ec.europa.eu/statistics_explained/index.php/International_trade_in_services OECD, Trade in services: http://stats.oecd.org/Index.aspx?DatasetCode=TIS UNCTADstat, Creative Economy, Creative services: http://unctadstat.unctad.org/ReportFolders/reportFolders.aspx?sRF_ActivePath=P,10&sRF_Expanded=,P,10 WTO, International Trade Statistics, Trade in commercial services: http://www.wto.org/english/res_e/statis_e/its2009_e/its09_trade_category_e.htm OECD, International Trade in Services: http://www.oecd.org/department/0,3355,en_2649_34243_1_1_1_1_1,00.html
4.1. Share of the cultural sector in the total e-commerce turnover
Definition: Share of the turnover of the e-commerce of the cultural sector in the total e-commerce turnover. Total turnover of the e-commerce of the cultural sector divided with the total turnover of the e-commerce, multiplied by one hundred. e-Commerce means: the placement of orders, where an order is a commitment to purchase goods or services, via computer networks, not only the Internet but also other connections between computers of different enterprises, where payment and delivery does not have necessarily to be done via computer networks. e-Commerce may be done via websites or via automated data exchange but it excludes normal e-mail messages that are manually typed. sales via website, i.e. orders made at an online store or via web forms on the Internet or extranet. Purpose: To compare the volume of the cultural sectors e-commerce turnover with the total turnover e-commerce by country (area).
Research question: What is the share of the cultural sector in e-commerce? What are the regional differences in the share of cultural sectors contribution to the e-commerce and what are the changes in timeline?
Data requirement: Turnover of the e-commerce of the cultural sector. Total turnover of the e-commerce in the overall economy.
Data sources: Eurostat, ICT usage in entreprises
Method of collection: Sample survey
Formula: (Te-commerce/Ttotal)*100 Te-commerce = Total turnover of the e-commerce of the cultural sector Ttotal = Total turnover of the e-commerce of the overall economy
Analysis and interpretation: High value of the indicator would indicate to the high concentration of the enterprises and organizations selling their products and services over the internet. Indirectly it shows the good availability of the e-commerce solutions in the area and it shows also the activity level of the inhabitants’ internet use, as
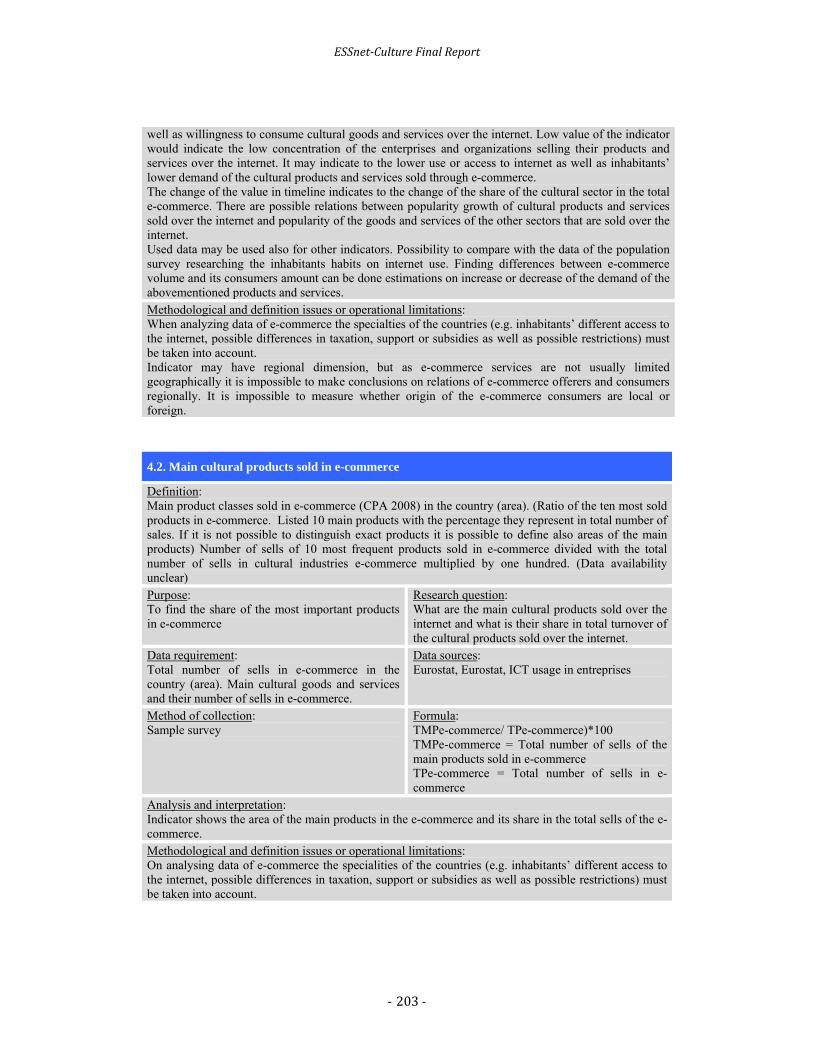
ESSnet‐CultureFinalReport
- 203-
well as willingness to consume cultural goods and services over the internet. Low value of the indicator would indicate the low concentration of the enterprises and organizations selling their products and services over the internet. It may indicate to the lower use or access to internet as well as inhabitants’ lower demand of the cultural products and services sold through e-commerce. The change of the value in timeline indicates to the change of the share of the cultural sector in the total e-commerce. There are possible relations between popularity growth of cultural products and services sold over the internet and popularity of the goods and services of the other sectors that are sold over the internet. Used data may be used also for other indicators. Possibility to compare with the data of the population survey researching the inhabitants habits on internet use. Finding differences between e-commerce volume and its consumers amount can be done estimations on increase or decrease of the demand of the abovementioned products and services. Methodological and definition issues or operational limitations: When analyzing data of e-commerce the specialties of the countries (e.g. inhabitants’ different access to the internet, possible differences in taxation, support or subsidies as well as possible restrictions) must be taken into account. Indicator may have regional dimension, but as e-commerce services are not usually limited geographically it is impossible to make conclusions on relations of e-commerce offerers and consumers regionally. It is impossible to measure whether origin of the e-commerce consumers are local or foreign.
4.2. Main cultural products sold in e-commerce
Definition: Main product classes sold in e-commerce (CPA 2008) in the country (area). (Ratio of the ten most sold products in e-commerce. Listed 10 main products with the percentage they represent in total number of sales. If it is not possible to distinguish exact products it is possible to define also areas of the main products) Number of sells of 10 most frequent products sold in e-commerce divided with the total number of sells in cultural industries e-commerce multiplied by one hundred. (Data availability unclear) Purpose: To find the share of the most important products in e-commerce
Research question: What are the main cultural products sold over the internet and what is their share in total turnover of the cultural products sold over the internet.
Data requirement: Total number of sells in e-commerce in the country (area). Main cultural goods and services and their number of sells in e-commerce.
Data sources: Eurostat, Eurostat, ICT usage in entreprises
Method of collection: Sample survey
Formula: TMPe-commerce/ TPe-commerce)*100 TMPe-commerce = Total number of sells of the main products sold in e-commerce TPe-commerce = Total number of sells in e-commerce
Analysis and interpretation: Indicator shows the area of the main products in the e-commerce and its share in the total sells of the e-commerce. Methodological and definition issues or operational limitations: On analysing data of e-commerce the specialities of the countries (e.g. inhabitants’ different access to the internet, possible differences in taxation, support or subsidies as well as possible restrictions) must be taken into account.
ESSnet‐CultureFinalReport
- 204-
6. Selection of statistical data sources for the cultural industries Preliminary remark: Due to the fact that the statistical classification system of economic activities leaves no scope for differentiating between profit and not-for-profit activities, this condition must be addressed with a relevant statistical data source. Both the structural business statistics (SBS) and labour force survey (LFS) serve as key data sources at the EU-level. In addition, the short-term business statistics (STS) and national accounts (NA) provide sources of raw data. The latter two data sources should be considered as rudimentary references for the analysis of the cultural industries as they are limited to the 2-digit level, rather than the in-depth 4-digit level required. The two most important data sources, the SBS and the LFS, will be discussed below in terms of their usefulness for statistics on cultural industries. The following characteristics apply to the SBS data source:
The SBS is a predominantly market-oriented statistical reference that contains an adequate degree of classification at the 4-digit level, and can therefore be used when defining the boundaries of economic activities within the cultural industries.
However, the SBS's use is limited due to the fact that only two-thirds of the 30 or so core economic activities of the cultural industries can be evaluated. The remaining 8 economic activities predominantly belong to section R which is not covered by the SBS regulation.
The broadcasting activities class is also restricted. This lists the privatised, economic broadcasting activities alongside those that are public and regulated by public law. This class can only be assigned to the cultural industries proportionately based on its estimated value.
All of the following sub-segments and market segments can be classed as cultural industries markets according to the SBS: publishing industry, film/video industry, sound recording industry, broadcasting industry (without public activities), news agencies, architectural market, advertising market, design, photographic and translation activities, retail sale of books, newspaper, music and video recordings
The sub-segments and market segments of performing arts, artistic creation, library and archives activities, museums activities and historical heritage cannot be analysed using the SBS data source. This analysis requires consultation of national data sources (mainly the Member States’ business registers).
The SBS provides a database that can be used as an unambiguous statistical reference with a clear focus on market-oriented activities, and which covers the most part of the cultural industries. The sub-segments and market segments that are not covered by the SBS need to be completed with national statistics, which as a rule, are provided by the corresponding national business registers. It is important to bear in mind that even the national business registers don't always make a clear distinction between profit and non-profit activities. If this is the case, either the market-oriented activities need to be estimated or further national industry statistics that include this important distinction should be used.

ESSnet‐CultureFinalReport
- 205-
The following characteristics apply to the LFS data source:
The EU-LFS provides information on cultural employment, at the best at 3-digit level of NACE Rev.2 and, therefore, cannot be easily linked to the 4-digit level of the cultural industries concept. Having said this, the LFS is conducted in all Member States where sufficient 4-digit NACE level often exists.
An analysis of the cultural industries must therefore pool the national LFS data into a common data bank. An estimated value could be provided to those Member States that only possess 3- or 2-digit levels, based on data from countries collecting information at 4-digit level.
Contrary to the SBS, the LFS is not a reference for statistics concerning market-oriented activities. It covers all economic activities, including both market- and non-market-oriented activities (no distinction possible).
As a consequence, the economic activities and market segments, some of which are listed above and include theatres, museums, libraries, archives, broadcasting and cultural heritage, could be estimated on the basis of national statistics on market-oriented activities.
The European LFS is of limited use for the analysis of the employment characteristics of the cultural sector due to its limitation to the 3-digit level. If it were possible to raise the Member States' existing databases up to the 4-digit level, it would be possible to analyse better cultural employment in the majority of the Member States. But limitations exist to capture employment in market-oriented economic activities. Conclusion
The description of the methodical ways to reach the purpose constitutes a first step towards a better understanding of the concept of the cultural industries. The first step entailed the classification of the culture sector as a whole and the identification of the cultural industries as a domain in its own right. The cultural industries differ from other sub-sectors of the culture sector due to its key market economy focus. During the second step, the use of the classification system of economic activities and definition of boundaries lends an evidence-based foundation to the definition of the cultural industries. The reclassification of the 30 or so economic activities has provided statistical categories that enable a clear, initial definition of the boundaries of the cultural industries' core existence to be made. The third and final step must use market-based statistics to further outline the term ‘economic activities’ used within the classification system of economic activities. In addition, the structural business statistics (SBS) represent an extensive database for economic or commercial activities, which are considered sub-activities of the wider economic activity. Further statistics, such as the labour force survey (LFS) or the national business registers are complementary sources of statistical information. Any future methodical evolution of the cultural industries concept needs to lend consideration to at least four additional tasks.
o Maintaining the open conceptual definition with the acceptance of new sub-markets and market segments.

ESSnet‐CultureFinalReport
- 206-
o Developing the degree of classification from a 4-digit to a 5-digit level structure, which is often possible on a national level within the member states. This will allow a description of the relevant economic sub-sectors.
o Reconsolidating economic activities to a 2-digit level is possible without having any serious impact on the number of economic activities in the reclassification model, currently numbering around 30. This consolidation model is necessary, in order to allow smaller member states and Interreg regions a clear and comparable statistical baseline for the cultural industries.
o The notion of the cultural industries should be extended to include specific creative sectors, so as to remain part of the international creative industries debate.
The particular impact that the cultural industries concept has on the development of clear, political strategies and measures is critical for the entire European culture sector, in terms of both the cultural and economic policies of the future.

ESSnet‐CultureFinalReport
- 207-
Annex 7 - Data availability of the economic and employment characteristics of the cultural sector
AUSTRIA
EU Labour Force Survey (EU-LFS) Version and precision level of the Statistical Classification of Economic Activities in the European Community (NACE) collected by country’s Labour Force Survey:
NACE Rev. 2 ; 4 digit level
Version and precision level of International Standard Classification of Occupations (ISCO) used in country’s Labour Force Survey since 2011:
ISCO-08 ; 4 digit level
Business Register Version and precision level of the NACE used in the country's Business Register (or similar institution):
NACE Rev. 2 (national version) ; 5 digit level
Version and precision level of the ISCO used in the country's Business Register (or similar institution):
Not available Country's others employment and business data collections where the respondents’ status has been mapped using either NACE or ISCO:
Adult Education Survey (AES): NACE 2-digit, ISCO 2-digit; EU-SILC: NACE 2-digit, ISCO 2-digit; Structure of Earnings Survey (SES): NACE 2-digit, ISCO 2-digit. Other data collections concerning country's employment and economic characteristics of the cultural sector:
None (as regards official statistics) Other information:
Information on 4-digit level is normally not published since the sample size is usually too small; Detailed data might also be subject to confidentiality.
Contact person: Wolfgang Pauli, [email protected]
BELGIUM
EU Labour Force Survey (EU-LFS) Version and precision level of the Statistical Classification of Economic Activities in the European Community (NACE) collected by country’s Labour Force Survey:
NACE Rev. 2 ; 3 digit level
Version and precision level of International Standard Classification of Occupations (ISCO) used in country’s Labour Force Survey since 2011:
Belgian nomenclature ; 3 digit level
Business Register Version and precision level of the NACE used in the country's Business Register (or similar institution):
NACE Rev. 2 (national version) ; 5 digit level
Version and precision level of the ISCO used in the country's Business Register (or similar institution):
Not available Country's others employment and business data collections where the respondents’ status has been mapped using either NACE or ISCO:
SILC, GGPS (Gender General Panel Study), SBS (Structural Business Statistics), Enquête cinéma, Enquête salaire, (une fois tous les quatre ans). Other data collections concerning country's employment and economic characteristics of the cultural sector:
No specific data collection/surveys in the cultural/creative sector Other information:
-
Contact person: Vincent Coutton, [email protected]

ESSnet‐CultureFinalReport
- 208-
BULGARIA
EU Labour Force Survey (EU-LFS) Version and precision level of the Statistical Classification of Economic Activities in the European Community (NACE) collected by country’s Labour Force Survey:
NACE Rev. 2 ; 4 digit level
Version and precision level of International Standard Classification of Occupations (ISCO) used in country’s Labour Force Survey since 2011:
ISCO-08 ; 4 digit level
Business Register Version and precision level of the NACE used in the country's Business Register (or similar institution):
NACE Rev. 2 ; 4 digit level
Version and precision level of the ISCO used in the country’s Business Register (or similar institution):
Not available Country's others employment and business data collections where the respondents’ status has been mapped using either NACE or ISCO:
Population Census 2001 In the Population Census 2001, the National Classification of Occupation NCO-1996 was used. Data were coded at 4-digit level (unit group). Data at national and regional level by occupations were published in specialized publications with the Population Census results at 3-digit (minor group) level of NCO. Data by occupations were sent to Eurostat at 3 digit (minor group) level of ISCO-88. Labour Force Survey The Labour Force Survey has been carried out since 1993. The National Classification of Occupation (version 1996) was used from 1997 to 2005, and the National Classification of Occupation and Duties (2005) has been used since 2006. Data on occupation were collected and coded at 4 digit level for: - Main current job (for employed persons); - Last job (for persons not in employment during the reference period). Quarterly and annual data on employment by occupational classes (1- digit level) were published in a specialized publication ‘Employment and Unemployment’. Quarterly micro-data from the Labour Force Survey were transmitted to Eurostat at 3-digit level of ISCO-88(COM). Annual Enterprise Survey on the Number of Employed Persons, Wages and Salaries and Other Labour Costs The National Classification of Occupation has been used since 1996. Aggregated data on employment and wages by occupational classes (1- digit level) were collected from the enterprise. Data on employment by occupational classes were published in the Statistical Yearbook and in the publication ‘Bulgaria – Social Economic Development’. Annual data on the number of employees and average annual wages by occupational classes (1- digit level) were transmitted to Eurostat. Structure of Earnings Survey The Structure of Earnings Survey (SES) is a four-yearly survey. The objective of this survey is to provide detailed and comparable at European Union level information on distribution and relationship between the level of remuneration, the individual characteristics of employees and their employer. The National Classification of Occupation were used: version of NCO-1996 in 2002 and version NCOD-2005 in 2006 surveys. Data were collected from the enterprise but refered to individuals. In 2002, the survey data were coded at 4-digit level of NCO-1996, but 3-digit codes were also accepted. In 2006, survey 4-digit codes by NCO-1996 or 8-digit codes by NCOD-2005 were required. The 2006 was a transition period for the enterprises to move to the revised classification. The SES data by occupations were published at 1-st digit level in the specialized publications ‘Structure of Earning Survey 2002’, ‘Structure of Earning Survey 2006’ and on the NSI website. SES micro-data were transmitted to Eurostat coded at 3-digit level of ISCO-88 (COM).

ESSnet‐CultureFinalReport
- 209-
Household Budget Survey (HBS) The National Classification of Occupations – 1996 was used up to 2004 and since 2006 – the National Classification of Occupations and Duties – 2005. (Data on occupations are coded at 2-digit level). Data by occupation were not published and delivered to Eurostat. Time Use Survey The survey was carried out in 2001. The National Classification of Occupation (Version 1996) was used. Data were coded and provided to Eurostat at 3-digit level of NCO (1996). No data by occupations were published. Survey on Careers of Doctorate Holders The survey was carried out in 2007. Data were coded at 3-digit level of the National Classification of Occupations and Duties - 2005. Adult Education Survey (AES) AES was carried out in 2007. The National Classification of Occupations and Duties – 2005 was used according to the Eurostat requirements for coding the following variables: - Occupation at the main job - at 2-digit level (for employed); - Occupation one year before the survey - at 2-digit level (everybody); - Main occupation of the father when the interviewee was between the ages of 12 and 16 - at 1-digit level (everybody); - Main occupation of the mother when the interviewee was between the ages of 12 and 16 - at 1-digit level (everybody). Micro-data were delivered to Eurostat in a format according to the requirements, and also data on occupations in the way described above. EU SILC EU SILC was carried out for the first time in 2006. The National Classification of Occupations and Duties - 2005 was used for coding the current occupation of employed and for the last job of persons. Data were coded at 4-digit level. Data by occupation were not published. Data on occupations were delivered to Eurostat at 2-digit level. Multi-topic Household Survey Multi-topic Household Survey was carried out in 2003. The National Classification of Occupations - 1996 was used for coding the occupation at 4-digit level. Data by occupation were not published. Information and Communication Technologies Usage by Households and Individuals Survey (ICT Usage by Households and Individuals) The National Classification of Occupations and Duties - 2005, was used in 2007 in the ICT Usage by Households and Individuals Survey for coding the occupation of employed persons. Coding was done according to the Eurostat requirements - at 3-digit level and at 4-digit level only for some ICT specialists. In the same way data were delivered to Eurostat. Data by occupation were not published. Implementation of the European Core Health Interview Survey In 2006, a pilot survey was carried out under the 2003 PHARE Multi-beneficiary Statistical Co-operation Programme. The National Classification of Occupations and Duties - 2005 was used for coding the occupation of employed persons and for the occupation on the last job. Data on occupations were coded at 2-digit level. In the same way data were delivered to Eurostat.
Other data collections concerning country's employment and economic characteristics of the cultural sector:
No specific data collection/surveys in the cultural/creative sector Other information: Data are collected with the following surveys on the NSI:

ESSnet‐CultureFinalReport
- 210-
Annual reports of corporate non - financial enterprises;Statistical annex for ratail trade; Sample survey through statistical questionnaire ‘Survey on the activities of libraries with collection over 200,000’; Comprehensive survey through statistical questionnaire ‘Survey on the activities of cinemas’; Comprehensive survey through statistical questionnaire ‘Survey on film production’; Comprehensive survey through statistical questionnaire ‘Survey on the radio programme activities of the Bulgarian National Radio, licensed and registered radio operators’; Comprehensive survey through statistical questionnaire ‘Survey on the TV programme activities of the Bulgarian National Television, licensed and registered TV operators’; Comprehensive survey through statistical questionnaire ‘Survey on the activities of theaters, operas, operettas, circus and musical formations’; Comprehensive survey through statistical questionnaire ‘Survey on the activities of the museums’ The National Library ‘St. St. Cyril and Methodius’ is source of the data on publishing activities. Data are published in: Electronic publication ‘Book publishing and press’,the specialized publications and on the NSI Website: www.nsi.bg Contact person: Julia Petrova, [email protected]
CZECH REPUBLIC
EU Labour Force Survey (EU-LFS) Version and precision level of the Statistical Classification of Economic Activities in the European Community (NACE) collected by country's Labour Force Survey:
NACE Rev. 2 ; 2 digit level
Version and precision level of International Standard Classification of Occupations (ISCO) used in country's Labour Force Survey since 2011:
ISCO-08; 2 digit level
Business Register Version and precision level of the NACE used in the country's Business Register (or similar institution):
NACE Rev. 2 (national version); 5 digit level
Version and precision level of the ISCO used in the country's Business Register (or similar institution):
Not available Country's others employment and business data collections where the respondents’ status has been mapped using either NACE or ISCO:
None Other data collections concerning country's employment and economic characteristics of the cultural sector:
Survey named ‘Kult’ (annually), organised by Ministry of culture and Czech Statistical Office (our office is responsible for radio and TV broadcasting) Other information:
-
Contact person: Josef Kotýnek, [email protected]
CYPRUS
EU Labour Force Survey (EU-LFS) Version and precision level of the Statistical Classification of Economic Activities in the European Community (NACE) collected by country's Labour Force Survey:
NACE Rev. 2 ; 2 digit level
Version and precision level of International Standard Classification of Occupations (ISCO) used in country's Labour Force Survey since 2011:
ISCO-08; 3 digit level

ESSnet‐CultureFinalReport
- 211-
Business Register Version and precision level of the NACE used in the country's Business Register (or similar institution):
NACE Rev. 2 (national version); 5 digit level
Version and precision level of the ISCO used in the country's Business Register (or similar institution):
Not available Country's others employment and business data collections where the respondents’ status has been mapped using either NACE or ISCO:
Employment survey; Labour Cost survey; Survey on ICT usage (in households and in enterprises); Adult Education Survey; Household Budget Survey; EU SILC; Services survey; Constructions survey; National Accounts; Wholesale and retail survey. Other data collections concerning country's employment and economic characteristics of the cultural sector:
Cultural/creative industries are covered by the business register. No published data are availble. Other information:
-
Contact person: Maria Hadjiprokopi, [email protected]
DENMARK
EU Labour Force Survey (EU-LFS) Version and precision level of the Statistical Classification of Economic Activities in the European Community (NACE) collected by country's Labour Force Survey:
NACE Rev. 2 (national version); 6 digit level
Version and precision level of International Standard Classification of Occupations (ISCO) used in country's Labour Force Survey since 2011:
ISCO-08; 6 digit level
Business Register Version and precision level of the NACE used in the country's Business Register (or similar institution):
NACE Rev. 2 (national version); 6 digit level
Version and precision level of the ISCO used in the country's Business Register (or similar institution):
ISCO-08; 6 digit level Country's others employment and business data collections where the respondents’ status has been mapped using either NACE or ISCO:
e.g. Research, Development and innovation private businesses (sample size 5,000); Research, Development and innovation (public institutions census); Industrial accounts statistics (sample size 9,000). Other data collections concerning country's employment and economic characteristics of the cultural sector:
Cultural/creative industries are covered by the business register. No published data are availble. Other information:
-
Contact person: Beri Taul, [email protected]

ESSnet‐CultureFinalReport
- 212-
ESTONIA
EU Labour Force Survey (EU-LFS) Version and precision level of the Statistical Classification of Economic Activities in the European Community (NACE) collected by country's Labour Force Survey:
NACE Rev. 2; 3 digit level
Version and precision level of International Standard Classification of Occupations (ISCO) used in country's Labour Force Survey since 2011:
ISCO-08; 4 digit level
Business Register Version and precision level of the NACE used in the country's Business Register (or similar institution):
NACE Rev. 2 (national version); 5 digit level
Version and precision level of the ISCO used in the country's Business Register (or similar institution):
Not available Country's others employment and business data collections where the respondents’ status has been mapped using either NACE or ISCO: e.g. Adult Education Survey (AES); Continuing Vocational Training Survey (CVTS); European Social Survey (ESS); Household Budget Survey (HBS); Harmonised European Time Use Survey (HETUS); Census. Other data collections concerning country's employment and economic characteristics of the cultural sector:
Surveys are available on the following link http://www.loomemajandus.edicypages.com/uuringud Other information:
-
Contact person: Kutt Kommel, [email protected]
FINLAND
EU Labour Force Survey (EU-LFS) Version and precision level of the Statistical Classification of Economic Activities in the European Community (NACE) collected by country's Labour Force Survey:
NACE Rev. 2 (national version); 5 digit level
Version and precision level of International Standard Classification of Occupations (ISCO) used in country's Labour Force Survey since 2011:
ISCO-08 ; 4 digit level
Business Register Version and precision level of the NACE used in the country's Business Register (or similar institution):
NACE Rev. 2 (national version); 5 digit level
Version and precision level of the ISCO used in the country's Business Register (or similar institution):
Not available Country's others employment and business data collections where the respondents’ status has been mapped using either NACE or ISCO: Annual Employment Statistics - covers the total population (used for the census of population as well) - based mainly on register data - NACE and ISCO at five digit levels - NACE rev. 2 transition in 2009, with data from 2007 - Classification of Occupations 2001, based on ISCO 88 (COM) (not totally compatible) - Current classification of industries (TOL 2008) corresponds to NACE rev 2 up to the 4-digit level; the 5th level is national. Other data collections concerning country's employment and economic characteristics of the cultural sector: Statistics Finland, with special funding from the Finnish Ministry of Education and Culture, has calculated and published culture satellite accounts based on the national accounts. The data series covers now the years 1990-2007; the 2008 data will be available in early 2011. See http://tilastokeskus.fi/til/klt/index_en.html

ESSnet‐CultureFinalReport
- 213-
The Ministry of Employment and the Economy has carried out projects on the Creative Industries as well. Contact person Ms Petra Tarjanne ([email protected]). The ‘Luova Suomi’ - Creative Industries in Finland project has also compiled and published information on this sector, see http://www.creativeindustries.fi/index.php/information and http://www.creativeindustries.fi Assessments on the economic importance of the copyright industries have been conducted since the 1980s at odd intervals. The most recent publication, covering the period from 2000 to 2005, was published by the Finnish Copyright Institute. Statistics Finland publishes annually data on the development of the mass media market.
See http://tilastokeskus.fi/til/jvie/index_en.htmlOther information:
-
Contact person: Sari Karttunen, [email protected]
FRANCE
EU Labour Force Survey (EU-LFS) Version and precision level of the Statistical Classification of Economic Activities in the European Community (NACE) collected by country's Labour Force Survey:
NACE Rev. 2; 5 digit level
Version and precision level of International Standard Classification of Occupations (ISCO) used in country's Labour Force Survey since 2011: ISCO-88*; 4 digit level *No information on version change.
Business Register Version and precision level of the NACE used in the country's Business Register (or similar institution):
NACE Rev. 2 (national version) ; 5 digit level
Version and precision level of the ISCO used in the country's Business Register (or similar institution): ISCO-88*; 4 digit level *No information on version change.
Country's others employment and business data collections where the respondents’ status has been mapped using either NACE or ISCO: Regarding cultural occupations: DADS: all the jobs occupied by employees (census, ISCO 4-digit-level and NACE 5-digit-level) Population Census: main job, (ISCO 4-digit-level and NACE 5-digit-level). Other data collections concerning country's employment and economic characteristics of the cultural sector:
Cultural practicises survey (last edition : 2009) Other information:
-
Contact person: Marie Gouyon, [email protected]
GERMANY
EU Labour Force Survey (EU-LFS) Version and precision level of the Statistical Classification of Economic Activities in the European Community (NACE) collected by country's Labour Force Survey:
NACE Rev. 2; 3 digit level
Version and precision level of International Standard Classification of Occupations (ISCO) used in country's Labour Force Survey since 2011:
ISCO-08; 3 digit level

ESSnet‐CultureFinalReport
- 214-
Business Register Version and precision level of the NACE used in the country's Business Register (or similar institution):
NACE Rev. 2; 4 digit level
Version and precision level of the ISCO used in the country's Business Register (or similar institution):
Not available
Country's others employment and business data collections where the respondents’ status has been mapped using either NACE or ISCO: None Other data collections concerning country's employment and economic characteristics of the cultural sector:
Several ongoing activities. Different publications you will find under www.kulturpolitik-kulturwirtschaft.de > Links > Kulturwirtschaftsberichte Other information:
-
Contact person: Andreas Buedinger, [email protected]
HUNGARY
EU Labour Force Survey (EU-LFS) Version and precision level of the Statistical Classification of Economic Activities in the European Community (NACE) collected by country's Labour Force Survey:
NACE Rev. 2; 4 digit level
Version and precision level of International Standard Classification of Occupations (ISCO) used in country's Labour Force Survey since 2011:
ISCO-08; 4 digit level
Business Register Version and precision level of the NACE used in the country's Business Register (or similar institution):
NACE Rev. 2; 4 digit level
Version and precision level of the ISCO used in the country's Business Register (or similar institution):
ISCO-08; 4 digit level Country's others employment and business data collections where the respondents’ status has been mapped using either NACE or ISCO: None Other data collections concerning country's employment and economic characteristics of the cultural sector:
None Other information:
-
Contact person: Monika Bardosi, [email protected]
ICELAND
EU Labour Force Survey (EU-LFS) Version and precision level of the Statistical Classification of Economic Activities in the European Community (NACE) collected by country's Labour Force Survey:
NACE Rev. 2; 4 digit level
Version and precision level of International Standard Classification of Occupations (ISCO) used in country's Labour Force Survey since 2011:
ISCO-08; 4 digit level
Business Register Version and precision level of the NACE used in the country's Business Register (or similar institution):
-
Version and precision level of the ISCO used in the country's Business Register (or similar institution):
- Country's others employment and business data collections where the respondents’ status has been mapped using either NACE or ISCO:

ESSnet‐CultureFinalReport
- 215-
Statistics Iceland collects regularly various business and enterprise information derived i.e. from Tax reports, VAT reports, annual accounts, and by special surveys e.g. for the industrial commodity statistics etc. Other data collections concerning country's employment and economic characteristics of the cultural sector:
Hitherto no regular studies have been implemented specially covering the cultural/creative industries. Other information:
-
Contact person: Ragnar Karlsson, [email protected]
ICELAND
EU Labour Force Survey (EU-LFS) Version and precision level of the Statistical Classification of Economic Activities in the European Community (NACE) collected by country's Labour Force Survey:
NACE Rev. 2; 4 digit level
Version and precision level of International Standard Classification of Occupations (ISCO) used in country's Labour Force Survey since 2011:
ISCO-08; 4 digit level
Business Register Version and precision level of the NACE used in the country's Business Register (or similar institution):
-
Version and precision level of the ISCO used in the country's Business Register (or similar institution):
- Country's others employment and business data collections where the respondents’ status has been mapped using either NACE or ISCO: Statistics Iceland collects regularly various business and enterprise information derived i.e. from Tax reports, VAT reports, annual accounts, and by special surveys e.g. for the industrial commodity statistics etc. Other data collections concerning country's employment and economic characteristics of the cultural sector:
Hitherto no regular studies have been implemented specially covering the cultural/creative industries. Other information:
-
Contact person: Ragnar Karlsson, [email protected]
IRELAND
EU Labour Force Survey (EU-LFS) Version and precision level of the Statistical Classification of Economic Activities in the European Community (NACE) collected by country's Labour Force Survey:
NACE Rev. 2; 2 digit level
Version and precision level of International Standard Classification of Occupations (ISCO) used in country's Labour Force Survey since 2011:
ISCO-08*; 3 digit level Up until the end of 2010 occupations were coded using the UK
Business Register Version and precision level of the NACE used in the country's Business Register (or similar institution):
NACE Rev. 2; 4 digit level
Version and precision level of the ISCO used in the country's Business Register (or similar institution):
Not available Country's others employment and business data collections where the respondents’ status has been mapped using either NACE or ISCO: The following enterprise surveys use NACE coding from the Business Register in Ireland: Access to Finance; Annual Services; BERD;

ESSnet‐CultureFinalReport
- 216-
Building; Business Energy Use/BEU Survey; Business Profile; Business Register Births Inquiry; Business Register Profile Inquiry; CIP Enterprise; CIP Local Unit; CIS; Census of Industrial Production; E-commerce; EHECS; FAT's outwards; ICT Survey; Import Prices Index; Intrastat Exports; Intrastat Imports; Labour Costs Survey; Monthly Index of Employment in Construct; Monthly Production; Monthly Services (Turnover) Inquiry; National Employment Survey; Prodcom; Quarterly Accounts Inquiry to Industry; Quarterly Assets Inquiry; Quarterly Earnings and Hours Worked in C; Quarterly Industry and Services; Quarterly Stocks and Investments; Quarterly Survey of Construction (QSC); Retail Sales; Road Freight Transport; Services Producer Prices; Wholesale Prices; The following surveys collect information from individuals on NACE and ISCO: Survey on Income and Living Conditions (SILC); Household Budget Survey (HBS); National Employment Survey (NES); Census. Other data collections concerning country's employment and economic characteristics of the cultural sector. National Employment Survey (NES); Earnings Hours and Employment Costs Survey (EHECS); Both are available on the Central Statistics Office website (http://www.cso.ie). Other information:
-
Contact person: Edel Flannery, [email protected]
ITALY
EU Labour Force Survey (EU-LFS) Version and precision level of the Statistical Classification of Economic Activities in the European Community (NACE) collected by country's Labour Force Survey:
NACE Rev. 2 (national version); 5 digit level
Version and precision level of International Standard Classification of Occupations (ISCO) used in country's Labour Force Survey since 2011:
ISCO-08; 4 digit level

ESSnet‐CultureFinalReport
- 217-
Business Register Version and precision level of the NACE used in the country's Business Register (or similar institution):
NACE Rev. 2 (national version); 5 digit level
Version and precision level of the ISCO used in the country's Business Register (or similar institution):
ISCO-08; 4 digit level Country's others employment and business data collections where the respondents’ status has been mapped using either NACE or ISCO: Several statistical surveys (both economic and social) make use of national standard classifications, i.e. 5th digit (ATECO ref. NACE Rev.2 and CP2011 ref. ISCO-08). Other data collections concerning country's employment and economic characteristics of the cultural sector:
White Paper on Creative Industries, 2008; National Commission on Creative Industries (Ministry of Cultural Heritage)
‘L'occupazione culturale in Italia’, 2009; F. Angeli, MilanoOther information:
-
Contact person: Annalisa Cicerchia, [email protected] Piro Dishnica, [email protected]
LATVIA
EU Labour Force Survey (EU-LFS) Version and precision level of the Statistical Classification of Economic Activities in the European Community (NACE) collected by country's Labour Force Survey:
NACE Rev. 2; 4 digit level
Version and precision level of International Standard Classification of Occupations (ISCO) used in country's Labour Force Survey since 2011:
ISCO-08; 1 digit level
Business Register Version and precision level of the NACE used in the country's Business Register (or similar institution):
NACE Rev. 2; 2 digit level
Version and precision level of the ISCO used in the country's Business Register (or similar institution):
Not available Country's others employment and business data collections where the respondents’ status has been mapped using either NACE or ISCO: Quaterly Survey on Labour - NACE Rev.2 - 2 digit level, ISCO-88 - 1 digit level; Structure of Earnings Survey - once in four years, NACE 2 digit level, ISCO-88 - 2 digit level. Other data collections concerning country's employment and economic characteristics of the cultural sector:
No specific survey has been implemented in our country. Data on culture/creative industries has been obtained from existing surveys. Other information:
-
Contact person: Anita Švarckopfa, [email protected]
LITHUANIA
EU Labour Force Survey (EU-LFS) Version and precision level of the Statistical Classification of Economic Activities in the European Community (NACE) collected by country's Labour Force Survey:
NACE Rev. 2; 3 digit level
Version and precision level of International Standard Classification of Occupations (ISCO) used in country's Labour Force Survey since 2011:
ISCO-08*; 4 digit level *Starting from 2012

ESSnet‐CultureFinalReport
- 218-
Business Register Version and precision level of the NACE used in the country's Business Register (or similar institution):
NACE Rev. 2 (national version); 5 digit level
Version and precision level of the ISCO used in the country's Business Register (or similar institution):
ISCO-08 ; 4 digit level Country's others employment and business data collections where the respondents’ status has been mapped using either NACE or ISCO: Adult education survey (sample size 7,000 respondents); Income and living conditions survey (sample size 6,300). Other data collections concerning country's employment and economic characteristics of the cultural sector:
None Other information:
-
Contact person: Valentina Samiene, [email protected]
LUXEMBOURG
EU Labour Force Survey (EU-LFS) Version and precision level of the Statistical Classification of Economic Activities in the European Community (NACE) collected by country's Labour Force Survey:
NACE Rev. 2 (national version); 5 digit level
Version and precision level of International Standard Classification of Occupations (ISCO) used in country's Labour Force Survey since 2011:
ISCO-08; 4 digit level
Business Register Version and precision level of the NACE used in the country's Business Register (or similar institution):
NACE Rev. 2 (national version); 5 digit level
Version and precision level of the ISCO used in the country's Business Register (or similar institution): ISCO-88*; 3 digit level *No information on version change.
Country's others employment and business data collections where the respondents’ status has been mapped using either NACE or ISCO: None Other data collections concerning country's employment and economic characteristics of the cultural sector:
None Other information:
-
Contact person: Philippe Robin, [email protected]
MALTA
EU Labour Force Survey (EU-LFS) Version and precision level of the Statistical Classification of Economic Activities in the European Community (NACE) collected by country's Labour Force Survey:
NACE Rev. 2; 4 digit level
Version and precision level of International Standard Classification of Occupations (ISCO) used in country's Labour Force Survey since 2011:
ISCO-08; 4 digit level
Business Register Version and precision level of the NACE used in the country's Business Register (or similar institution):
NACE Rev. 2; 4 digit level
Version and precision level of the ISCO used in the country's Business Register (or similar institution):
Not available Country's others employment and business data collections where the respondents’ status has been mapped using either NACE or ISCO:

ESSnet‐CultureFinalReport
- 219-
Survey on Income and Living Conditions (NACE and ISCO);Structure of Earnings Survey, Job Vacancy Survey, Accidents at work statistics (NACE and ISCO); Labour Cost Survey (NACE); Direct Reporting Survey (NACE); Household Budgetary Survey (NACE and ISCO); Census of Population and Housing (NACE and ISCO); Lifestyle Survey (ISCO); Survey on Production (NACE); Survey on Stocks (NACE); Manufacturing Survey (NACE); Wholesale and Retail Survey (NACE); Services Survey (NACE); Construction Survey (NACE); Producer Price Index Survey (NACE); Business, Research and Development Survey (NACE); Innovation Survey (NACE); Structural Business Statistics (NACE); Business Register (NACE); Access to Finance (NACE); Information Communication and Technology – Households (NACE and ISCO); Information Communication and Technology – Enterprises (NACE). Other data collections concerning country's employment and economic characteristics of the cultural sector:
Kultura 2000; Band Clubs; Dance Schools; Theatres; Sports Organisations; Museums and Historical Sites. All these surveys are published in the form of a News Release/Publication and can be found on our National Institute Website http://www.nso.gov.mt Other information:
-
Contact person: Joanne Agius, [email protected]
NETHERLANDS
EU Labour Force Survey (EU-LFS) Version and precision level of the Statistical Classification of Economic Activities in the European Community (NACE) collected by country's Labour Force Survey:
NACE Rev. 2 (national version); 5 digit level
Version and precision level of International Standard Classification of Occupations (ISCO) used in country's Labour Force Survey since 2011:
ISCO-88*; 4 digit level *No information on version change.
Business Register Version and precision level of the NACE used in the country's Business Register (or similar institution):
NACE Rev. 2 (national version); 5 digit level
Version and precision level of the ISCO used in the country's Business Register (or similar institution):
ISCO-88*; 4 digit level *No information on version change
Country's others employment and business data collections where the respondents’ status has been mapped using either NACE or ISCO: None Other data collections concerning country's employment and economic characteristics of the cultural sector:
Statistics on Libraries, museums, performance art and art education, http://www.cbs.nl Other information:

ESSnet‐CultureFinalReport
- 220-
-
Contact person: Jamilja van der Meulen, [email protected]
POLAND
EU Labour Force Survey (EU-LFS) Version and precision level of the Statistical Classification of Economic Activities in the European Community (NACE) collected by country's Labour Force Survey:
NACE Rev. 2; 3 digit level
Version and precision level of International Standard Classification of Occupations (ISCO) used in country's Labour Force Survey since 2011:
ISCO-08 (COM) ; 4 digit level
Business Register Version and precision level of the NACE used in the country's Business Register (or similar institution):
NACE Rev. 2 (national version); 5 digit level
Version and precision level of the ISCO used in the country's Business Register (or similar institution):
ISCO-88 (COM)* ; 4 digit level *No information on version change
Country's others employment and business data collections where the respondents’ status has been mapped using either NACE or ISCO: The Polish classification PKD, compatible with NACE, is used in many other surveys conducted by the Central Statistical Office. All data collected by section of Employment and Wages in Labour Statistics Division of Central Statistical Office are collected according to NACE. Data are presented by NACE sections, divisions and selected groups. There are annual surveys conducted by Industry Division: - survey on economic activity of entities with 10 and more persons employed (legal persons - also entities with up to 9 persons employed) Nace Rev.2 - divisions 59, 90, 91, level of detail - division (census); - survey on economic activity of entities with up to 9 persons employed (with exclusion of legal person), level of detail - aggregated divisions 90, 91, 92, 93 and separately division 59 (sample survey) Other data collections concerning country's employment and economic characteristics of the cultural sector:
Works are underway to work out methodology and implement surveys to collect comprehensive data on creative industries. So far mostly data on the functioning of mostly government-funded cultural institutions is collected (theatres, cinemas, museums etc.) - available at http://www.stat.gov.pl - Regional Data Bank, published regularly. Other surveys: Sample survey - Structure of earnings by occupation survey (SES) - publication htpp://www.stat.gov.pl This survey covers: NACE Rev1 and 2 (1 digit level) and ISCO 88 (4 digit level). Publications on enterprises: - Financial results of economic entities (by NACE sections) - Activity of non-financial enterprises (by NACE sections) Other information:
-
Contact person: Małgorzata Krywult, [email protected]
PORTUGAL
EU Labour Force Survey (EU-LFS) Version and precision level of the Statistical Classification of Economic Activities in the European Community (NACE) collected by country's Labour Force Survey:
NACE Rev. 2; 4 digit level
Version and precision level of International Standard Classification of Occupations (ISCO) used in country's Labour Force Survey since 2011:
ISCO-08; 3 digit level

ESSnet‐CultureFinalReport
- 221-
Business Register Version and precision level of the NACE used in the country's Business Register (or similar institution):
NACE Rev. 2; 4 digit level
Version and precision level of the ISCO used in the country's Business Register (or similar institution):
ISCO-88*; 3 digit level *No information on version change
Country's others employment and business data collections where the respondents’ status has been mapped using either NACE or ISCO: None Other data collections concerning country's employment and economic characteristics of the cultural sector: Specific data collections of Cultural/Creative Industries come from the LSF and Business Statistics. Other information:
-
Contact person: Teresa de Sousa, [email protected]
ROMANIA
EU Labour Force Survey (EU-LFS) Version and precision level of the Statistical Classification of Economic Activities in the European Community (NACE) collected by country's Labour Force Survey:
NACE Rev. 2; 4 digit level
Version and precision level of International Standard Classification of Occupations (ISCO) used in country's Labour Force Survey since 2011:
ISCO-08; 4 digit level
Business Register Version and precision level of the NACE used in the country's Business Register (or similar institution):
NACE Rev. 2 (national version); 5 digit level
Version and precision level of the ISCO used in the country's Business Register (or similar institution):
Not available Country's others employment and business data collections where the respondents’ status has been mapped using either NACE or ISCO: Time Use Survey (NACE and ISCO); Household Budget Survey (NACE and ISCO); Census of Population and Housing (NACE and ISCO); Adult Education Survey (NACE and ISCO); Labour Force Survey (NACE and ISCO); Health Interview Survey (NACE and ISCO).Other data collections concerning country's employment and economic characteristics of the cultural sector: National Institute of statistics conduct yearly the exhaustive survey regarding the activity of: libraries (infrastructure, collections, users (reader) etc, museums (infrastructure, collections, visitors), the institutions and companies of shows and concerts (infrastructure, shows/concerts, audience), newspapers and periodicals publishing houses. The results of these surveys are published yearly in ‘Activity of cultural-art units’. Other information: Classifications NACE and ISCO in LFS are on four digits level for data processing but are published on one digit level because the figures are very small.
Contact person: Georgeta-Marinela Istrate, [email protected]

ESSnet‐CultureFinalReport
- 222-
SLOVAKIA
EU Labour Force Survey (EU-LFS) Version and precision level of the Statistical Classification of Economic Activities in the European Community (NACE) collected by country's Labour Force Survey:
NACE Rev. 2; 2 digit level
Version and precision level of International Standard Classification of Occupations (ISCO) used in country's Labour Force Survey since 2011:
ISCO-08; 3 digit level
Business Register Version and precision level of the NACE used in the country's Business Register (or similar institution):
NACE Rev. 2 (national version); 5 digit level
Version and precision level of the ISCO used in the country's Business Register (or similar institution):
ISCO-88*; 3 digit level *No information on version change.
Country's others employment and business data collections where the respondents’ status has been mapped using either NACE or ISCO: Business register NACE, 2 digit level; SILC: ISCO main job, 3 digit level code; TUS: ISCO main job, 3 digit level code; HBS: ISCO main job, since 2009 year, 2 digit level; AES: ISCO main job 2 digit level parents 1 digit level; EHIS: ISCO main job, 2 digit level; Cenzus 2001: ISCO main job, 2 digit level. Other data collections concerning country's employment and economic characteristics of the cultural sector: There have been no specific data collections/surveys implemented in Slovakia for covering the cultural/creative industries. Other information:
- Contact person: Vladimír Kacvinský, [email protected]
SLOVENIA
EU Labour Force Survey (EU-LFS) Version and precision level of the Statistical Classification of Economic Activities in the European Community (NACE) collected by country's Labour Force Survey:
NACE Rev. 2; 2 digit level
Version and precision level of International Standard Classification of Occupations (ISCO) used in country's Labour Force Survey since 2011:
ISCO-08; 4 digit level
Business Register Version and precision level of the NACE used in the country's Business Register (or similar institution):
NACE Rev. 2 (national version); 5 digit level
Version and precision level of the ISCO used in the country's Business Register (or similar institution):
No ISCO is used; 4 digit level Country's others employment and business data collections where the respondents’ status has been mapped using either NACE or ISCO: Statistical Register on Employment (total coverage) Other data collections concerning country's employment and economic characteristics of the cultural sector: Surveys of: - publishing - production of films - distribution of films - tv and radio organizations - cinames - theaters - orchestra and choirs - museums and galleries - cultural homes

ESSnet‐CultureFinalReport
- 223-
Data are published on: http://www.stat.siOther information:
- Contact person: Nadja Svetlin Kastelic, [email protected]
SPAIN
EU Labour Force Survey (EU-LFS) Version and precision level of the Statistical Classification of Economic Activities in the European Community (NACE) collected by country's Labour Force Survey:
NACE Rev. 2; 3 digit level
Version and precision level of International Standard Classification of Occupations (ISCO) used in country's Labour Force Survey since 2011:
ISCO-08; 3 digit level
Business Register Version and precision level of the NACE used in the country's Business Register (or similar institution):
NACE Rev. 2; 2 digit level
Version and precision level of the ISCO used in the country's Business Register (or similar institution):
Not available Country's others employment and business data collections where the respondents’ status has been mapped using either NACE or ISCO: Central Companies Directory (NSI); Surveys on Industrial, Commerce and Service companies (NSI). Other data collections concerning country's employment and economic characteristics of the cultural sector: Not available Other information: Data available on economic activities depends on the survey and the economics activities. We think that this problem could be the same for other countries. The minimum level available is on 2 digit level, but in many cases data is available on higher level of NACE.
Contact person: Maria Angeles Perez, [email protected]
SWEDEN
EU Labour Force Survey (EU-LFS) Version and precision level of the Statistical Classification of Economic Activities in the European Community (NACE) collected by country's Labour Force Survey:
NACE Rev. 2 (national version); 5 digit level
Version and precision level of International Standard Classification of Occupations (ISCO) used in country's Labour Force Survey since 2011:
ISCO-88* ; 4 digit level *ISCO-08 will be applied in 2014.
Business Register: The Business Register in Sweden is a register of all enterprises, government offices, and organisations as well as their workplaces. More information at Statistics Sweden http://www.scb.se/Pages/Product____299124.aspx
Version and precision level of the NACE used in the country's Business Register (or similar institution): NACE rev 2 5 digit level):
-
Version and precision level of the ISCO used in the country's Business Register (or similar institution): Sweden collects ISCO data at finest level annually for all employees in public sector and with a rotating panel the private sector is covered in every three years. As register data lags at least 2 years this is still collected by the means of ISCO88

ESSnet‐CultureFinalReport
- 224-
nomenclature 4 digits. Besides this ISCO08 –data is collected in the LFS since 2011 at 4-digit level
- Country's others employment and business data collections where the respondents’ status has been mapped using either NACE or ISCO: None Other data collections concerning country's employment and economic characteristics of the cultural sector: Data from Statistics Sweden, published by The Swedish Agency for Growth Policy Analysis (Growth Analysis). Other information:
- Contact person: Lars Bager-Sjogren, [email protected]
SWITZERLAND
EU Labour Force Survey (EU-LFS) Version and precision level of the Statistical Classification of Economic Activities in the European Community (NACE) collected by country's Labour Force Survey:
NACE Rev. 2 (national version); 5 digit level
Version and precision level of International Standard Classification of Occupations (ISCO) used in country's Labour Force Survey since 2011:
ISCO-08; 4 digit level
Business Register Version and precision level of the NACE used in the country's Business Register (or similar institution):
NACE Rev. 2 (national version); 5 digit level
Version and precision level of the ISCO used in the country's Business Register (or similar institution):
ISCO-88*; 4 digit level *No information on version change.
Country's others employment and business data collections where the respondents’ status has been mapped using either NACE or ISCO: Etude sur les pratiques culturelles en Suisse, enquête 2008. Other data collections concerning country's employment and economic characteristics of the cultural sector: Financement de la culture par les entreprises privées, enquête sur les dépenses culturelles des entreprises en Suisse en 2001 (publiée en 2003). Cette étude sera reprise en 2013/14 en parallèle avec une enquête similaire sur les organisations à but non lucratif (fondations, associations etc.). Other information:
- Contact person: Umberto Tedeschi, [email protected]
TURKEY
EU Labour Force Survey (EU-LFS) Version and precision level of the Statistical Classification of Economic Activities in the European Community (NACE) collected by country's Labour Force Survey:
NACE Rev. 2; 4 digit level
Version and precision level of International Standard Classification of Occupations (ISCO) used in country's Labour Force Survey since 2011:
ISCO-88*; 4 digit level *No information on version change.
Business Register: Commercial Registry Version and precision level of the NACE used in the country's Business Register (or similar institution):
NACE Rev. 2; 4 digit level
Version and precision level of the ISCO used in the country's Business Register (or similar institution):
ISCO-88*; 4 digit level *No information on version change.
Country's others employment and business data collections where the respondents’ status has been mapped using either NACE or

ESSnet‐CultureFinalReport
- 225-
ISCO: None Other data collections concerning country's employment and economic characteristics of the cultural sector: No information Other information:
- Contact person: Ercument Toka, [email protected]
UNITED KINGDOM
EU Labour Force Survey (EU-LFS) Version and precision level of the Statistical Classification of Economic Activities in the European Community (NACE) collected by country's Labour Force Survey:
NACE Rev. 2 (national version); 5 digit level
Version and precision level of International Standard Classification of Occupations (ISCO) used in country's Labour Force Survey since 2011:
ISCO-08; 4 digit level
Business Register: Commercial Registry Version and precision level of the NACE used in the country's Business Register (or similar institution):
NACE Rev. 2 (national version); 5 digit level
Version and precision level of the ISCO used in the country's Business Register (or similar institution):
Not available. Country's others employment and business data collections where the respondents’ status has been mapped using either NACE or ISCO: Many other statistics also map respondents using NACE Rev. 1 or Rev. 2, often using the Business Register as a sampling frame. These are a mixture of statistics produced by the ONS, and statistics produced by other government departments and organisations. Given the number and range of these, it is not practical to list them all here. Other data collections concerning country's employment and economic characteristics of the cultural sector: DCMS produces economic estimates each year for the Creative Industries. These are based on Office for National Statistics (ONS) data sources including the Annual Business Survey, Inter-Departmental Business Register and Labour Force Survey. The statistics are published on the DCMS website: http://www.culture.gov.uk/what_we_do/research_and_statistics/4848.aspx Other information:
- Contact person: Christopher McKee, [email protected]


ESSnet‐CultureFinalReport
- 227-
TASK FORCE 4
CULTURAL PRACTICES AND SOCIAL ASPECTS OF CULTURE
1. Introduction Cultural practices of the population are, without doubt, the most important dimension of the cultural sector(49). Performing arts without an audience; music without listeners; museums without visitors or books without readers will all lose their ‘raison d’être’ and soon cease to exist. A delineation of cultural participation is not an easy task. To begin with, there are various cultural practices that may be very popular in one country, but unknown in others. The popularity of the zarzuela in Spain, the tango (sung in Finnish) in Finland, or the cabaret (which is usually a one man or one woman show) in the Netherlands and Flanders are examples of such ‘national’ practices. Technological inventions and innovations can have profound effects on cultural participation and mostly have. This is not only true for the ICT but practically for all inventions of the 20th century. The rise of radio and film changed theatre from popular entertainment attracting blue and white collar workers alike into an art form which appeals to a selective audience. Art films and art film houses would probably not exist if there was no television broadcasting mainstream films day in day out. Young people in different countries – such as the Netherlands – nowadays tend to spend more time on being online on the Internet than on watching television. Cultural practices can also change as a consequence of societal transformations. Perhaps the best known example is the rise of a global ‘youth’ culture that can be seen as a result of a democratisation process of Western societies which took place in 1960’s and 1970’s. In spite of the scepticism of some high brow critics, this culture was not a passing fad or fashion, but, as the young grew older, became ‘popular’ culture which appeals to people of all ages. A substantial part of the audience of rock concerts or festivals, for instance, consists of middle aged (or even older) visitors. To cover the wide range of activities which could be considered for cultural participation, Task Force 4 has chosen the framework designed by Task Force 1 as the point of departure. This framework includes eight broad domains: Visual Arts, Advertising, Performing Arts, Audiovisual, Books and Press, Heritage, Architecture, Arts and Crafts. One of these domains - Advertising - has obviously a little significance for cultural participation. While designing an advertisement is a creative and, in some cases, an artistic activity, reading, listening to or watching an advertisement is usually not considered to be a
(49) The terms ‘cultural practices’, ‘cultural participation’ and ‘participation in cultural activities’ will be used as synonyms in this report.

ESSnet‐CultureFinalReport
- 228-
cultural practice. The same is true of some sub-domains of the framework, such as sound recording. Nevertheless, the framework includes practically all forms of culture which are covered in international, European and national surveys on cultural participation. Three kinds of cultural practices could be distinguished: visits to cultural venues, monuments, manifestations and events; media uses or habits and practicing the arts as a leisure pursuit or amateur practices.
2. Cultural participation and cultural policy In most Member States the cultural sector depends strongly on public financing. Without government financing - be it by the State, by regional or municipal government - art forms such as symphonic music or opera would become so expensive that only a handful rich people could afford them. A substantial amount of the taxpayer’s money is spent on cultural provision: 352 Euro per capita per year in Denmark, 220 in Sweden, 197 in France, 189 in the Netherlands, 175 in Estonia, 167 in Finland. Although these figures may not be comparable – due to the different scope of cultural policies in these countries and the fact that the figures are from different years - they nevertheless illustrate the importance of public funding of culture.(50) A ministry of Culture, a regional authority or a municipal government spending public finances on culture hope that many citizens from all social classes will benefit from cultural offerings that are being subsidized. Sociological research, however, mostly shows that interest in arts and culture in general - and the traditional or ‘high brow’ culture in particular - is closely related to socio-demographic characteristics such as gender, age and – above all – educational attainment. As the education level usually results in higher income, there is a risk that predominantly the affluent people in the society will profit from subsidized cultural provisions. Many European countries have established policies to foster public interest in arts and culture. Children and young people, as well as people with low income, can get a ticket at reduced prices or even a free access to many cultural venues all over Europe. In Austria people with low income, refugees and students can apply for a special pass which gives them free access to many museums, theatres and music halls(51). A similar scheme was introduced in the French speaking community of Belgium(52). Pupils in secondary schools in France, Finland, The Netherlands and Slovakia receive a voucher which can be used for free access to theatres, music halls, cinemas and other cultural institutions. So-called open museums days and museums nights became popular all over Europe and offer free access to whole population. Interest in the arts and culture is largely a matter of acquired taste. Social research shows that many people tend to retain artistic and cultural preferences which they learned in their youth. Socialisation at home is especially important but cultural education at school also matters. That’s why many European countries stimulate cultural education at school. Some of these programmes are not restricted to cultural education alone. A well-know example is the English programme Creative Partnerships, which ‘brings creative workers such as artists,
(50) The figures are from the Compendium on Culture Policy and Trends in Europe, http://www.culturalpolicies.net (51) This action is called ‘Hunger auf Kunst’ (Hunger for the Art). (52) By an association called Article 27.

ESSnet‐CultureFinalReport
- 229-
architects and scientists into schools to work with teachers to inspire young people and help them learn’. More than one million children participated in this programme since 2002(53). The Norwegian programme The Culture Backpack which runs in all primary and secondary schools in Norway is another example. The intention of this project is to compensate for ‘inequality due to the pupils social background’ and thus to compensate a lack of cultural socialisation in the family. Some measures which foster cultural participation aim at reducing inequalities in access to culture among adult population. Sweden has established special institutions to facilitate this access, such as Skadebanan (performing arts) or Konstfrämjadet (visual arts). The Netherlands ministry of Education, Culture and Science established in 2009 the Foundation for Cultural Participation (Fonds voor Cultuurparticipatie) for this goal, it not only designs and runs its own programmes but also coordinates the effort of the three levels of government - State, provinces and municipalities - in this domain. There is even a law on cultural participation (Participatiedecreet) in the Flemish community of Belgium. This law distinguishes five ‘disadvantaged groups’ (Kansgroepen): poor people, handicapped people, migrants, detainees and large families. Projects that aim at increasing the participation of members of these groups in art and culture, sports and youth activities qualify for a grant from the Flemish government. The best way to assess the outcome of such efforts is a population survey on participation in cultural activities. To measure the effects one needs a time series to see the development in cultural practices among the different target groups. And, indeed, most countries concerned have an ongoing survey that includes cultural practices. It can be expected that the results of the national population surveys will become even more important for cultural policy in the years to come. In the wake of the world wide credit crunch, many European countries took – or are taking – austerity measures that also concern the government expenditure on culture. Baltic countries, severely hit by the economic recession were the first to take draconian measures: Latvia diminished its culture expenditure by 42% in 2009, Estonia by 30%. Many West-European countries are following this example now or will do so in the next years: there will be cut of 20% in the budget for culture of the Netherlands Ministry of Education, Culture and Science by 2014 and 25% in the budget of the British Department for Culture, Media and Sport. It could be expected, therefore, that the so called ‘evidence based policy’ will become more important in the cultural policy of many European countries. The rationale of this policy is, to put it simple, to finance only those measures and project that have proven to be effective and efficient in yielding the intended results. Evaluation and assessment are at the heart of evidence based policy. It thus means that results of national - and hopefully also European - surveys on cultural participation will gain significance for national and international cultural policies. The economic crisis did have some other positive consequences as well. One of these consequences, which has its bearing on the work of Task Force 4, is “a shift of emphasis from a ‘production-oriented’ measurement system to one focused on the well-being of current and future generations, i.e. toward broader measures of social progress”(54).
(53) See http://www.creative-partnerships.com (54) Joseph E. Stiglitz, Amartya Sen and Jean-Paul Fitoussi, Report by the Commission on Measurement of Economic Performance and Social Progress http://www.stiglitz-sen-fitoussi.fr (p.10).

ESSnet‐CultureFinalReport
- 230-
The concept of quality of life that includes heath care, activities in leisure time (including visits to cultural venues, media habits and practicing the arts as leisure pursuit), social and civic participation, is attracting the attention of policy makers at national and European level. In reaction to the Stiglitz report, the European Commission sent a policy paper to the European Council and the European Parliament GDP and beyond, Measuring progress in a changing world (20.8.2009), which pleads for a better measurement of the quality of life. Following this paper Eurostat ‘has carried out feasibility study on well-being indicators. This study shows that data at European Union level are available for most of the drivers of well-being. About one third of the data are collected by Eurostat (mostly through EU-SILC) and one other third comes from the European Social Surveys’(55). Some Member States already conducted a research on this subject. Some yearly reports of the Luxembourg Statistical Office - Travail et cohésion sociale au Luxembourg - include participation in cultural activities, or media habits such as the use of the Internet(56).
3. Situation at the start of Task Force 4
3.1. Leadership Group on Culture Statistics (LEG-Culture)
Part of the work of the LEG-Culture (1997-2000) concerned the cultural participation through the Task Force ‘Participation in cultural activities’. The general aims of the Task Force on cultural participation were:
- achieving more comparability in the statistical data on participation in cultural activities in the different Member States;
- harmonizing these data with Eurostat needs, custom and practice ;
- producing information relevant to policy making and policy evaluation in the European Union. (p.143)
The Task Force on cultural participation, which in fact was also named Task Force 4, decided to carry out detailed comparison of four domains: visiting museums, reading books, visiting cinemas and visiting theatre. The data from the national surveys of the five participating countries - Belgium, Finland, Italy, Luxembourg, the Netherlands and Spain - were compared. As could be expected, there appeared to be a lot of variation in phrasing the questions in national surveys. The design, the sample size, the scope and the years in which the surveys carried out also varied. Subsequently the data from the five countries were not fully comparable. Existing problems of comparability were traced and analysed. The Task Force did an extensive inventory of the research on cultural participation in all Member States (15 at that time). This inventory contained information about survey instruments and methodologies, questionnaires and demographic variables used in reports and analyses of the results.
(55) Measuring More than ‘just’ Economic Development in: Sigma. The Bulletin of European Statistics, 2010/02, See:http://epp.Eurostat.ec.europa.eu/statistics_explained/index.php/Measuring_more_than_'just'_economic_development (56) See: http://www.statistiques.public.lu/catalogue-publications/cahiers-economiques

ESSnet‐CultureFinalReport
- 231-
The work of the Task Force resulted in a fairly extensive questionnaire which also constituted the basis for indicators on participation in cultural activities to be used for comparison between the Member States. Building on the work already done the Task Force recommended the establishment of a documentation centre on cultural participation in Luxembourg. The main task of this centre - or documentation point, as the Task Force called it - should be building, maintaining and updating a European database of surveys on cultural participation with all the results, questionnaires, information about methodological aspects. Member States should provide all relevant material translated into English or French. The Task Force also formulated concise methodological recommendations to achieve comparable statistics on cultural participation in the EU concerning methodology, including background characteristics to be taken into account. To achieve better comparability the implementation of national surveys should also be synchronised in time. The Task Force advised the formation of a European Working Group on cultural participation that, with support of the Member States, Eurostat and then DG X of the European Commission should take the first steps towards synchronisation. The participants in the Task Force were quite optimistic in expecting that: ‘the harmonization and synchronisation of the existing national surveys could… be achieved in the immediate future’ (p.181). Nevertheless, ‘in absence of surveys on participation in cultural activities in a considerable number of Member States etc., let alone the description of cultural participation in the Central European countries that will join the EU in the coming years… it will still be impossible to obtain a complete picture of cultural participation’(in the EU) (p.181). “All of these problems could be solved by means of a common ‘European survey on participation in cultural activities’ to be repeated periodically, for instance every five years. The participants in Task Force 4 invite all Member States to agree on the principle of such a survey. It should start in foreseeable future, preferably before or in the year 2005.”(p.181-182).
3.2. Eurostat Working Group on culture statistics
The effort to harmonize cultural statistics in the EU continued with the establishment of Eurostat Working Group on culture statistics in 2002. The four Task Forces of this group were identical to those of the LEG-Culture. Their main task was to progress with the initiatives started in the LEG-Culture. The coordinators of the Task Forces in the LEG-Culture remained in charge. The main aims of the Task Force on cultural participation were:
to improve and update the harmonised list of questions, with the following objectives: to advance towards a cultural survey (cultural dimension) and to establish significant links to the ‘lifelong learning’ dimension;
to carry out an in-depth study of the 2003 LFS ad hoc module on lifelong learning, with the aim to analyse the impact of structural variables on informal learning attitude;
to establish strong linkage to the Eurostat Task Force on the Adult Education Survey;
to update data coming from the National Statistical Institutes or other official sources at national level;

ESSnet‐CultureFinalReport
- 232-
to analyse the Eurobarometer experiment on cultural participation (see below). To study, together with Eurostat, new possibilities for the improvement of data quality, possibly with the involvement of the NSIs (National Statistical Institutes).
The Task Force went on with an inventory of national surveys on cultural participation, compared the available national figures on indicators drafted by the LEG-Culture and proposed indicators for social and civil activities. It also compared the figures from the Eurobarometer on cultural participation with the results of the Italian national survey which were conducted in the same year (2001). In the meantime culture statistics had become ‘a negative priority’ within the Eurostat, so the Eurostat has suspended the Working Group on cultural statistics in 2004.
3.3. Existing European surveys
Even if the Task Force on cultural participation of the LEG-Culture and its successor of the Working Group on Cultural Statistics didn’t succeed in convincing Eurostat or the NSIs of the Member States to implement at least some of their recommendations - which, frankly speaking, were quite ambitious - they did succeed in putting, as it were, the topic of cultural practices on the agenda of European statistics. The common European survey on participation in cultural activities was not realised. But, instead, two Eurobarometers on cultural participation were carried out: one in the 15 ‘old’ Member States and one in the new Member States and Candidates: Europeans’ Participation in Cultural Activities (2001) and New Europeans and Culture (2003). Both Eurobarometers used a questionnaire developed by the LEG-Culture Task Force. Although the results differed considerably from the results of national surveys it was, nevertheless, the first time that all then Member States of the EU researched cultural practices of their population. Questions concerning cultural participation were also included in the Eurobarometer European Cultural Values (2007) and in the Survey on Income and Living Conditions (SILC) in 2006 and the Adult Education survey (AES) in 2007(57). Both editions of the pocket book Cultural Statistics (2007 and 2011) published by Eurostat include sections on cultural participation. Contrary to the surveys on cultural practices, there already exists a harmonized European time use survey: HETUS. The first edition of the HETUS guidelines was published in 2000 and updated in 2009. As a time use survey includes media habits, this means that there already is an established European instrument to measure those habits. For cultural participation purposes the HETUS measurement is, however, very rough. It does not tell anything about the content of preferences, only the total amount of time given to reading or watching television. An additional limitation comes from the fact that most of the radio listening happens as a secondary activity, this also applies to watching television. There is an ongoing research on European level on the use on ICT by households and individuals. Questions on social and civic participation have been used in a number of European surveys; inter alia SILC, AES and ESS. These developments made the work of Task Force 4 a bit easier. Avoiding unnecessary double work, the Task Force concentrated its efforts on elements that are not yet sufficiently
(57) For a methodological analysis of the EU surveys see paragraph 7: Analysis of national surveys on cultural participation.

ESSnet‐CultureFinalReport
- 233-
covered, by using existing EU surveys, modules and questionnaires. Therefore it mainly worked on visits to cultural venues, monuments and manifestations, including direct broadcasts and records; and amateur practices, including use of the Internet.
3.4. UNESCO
The 2009 UNESCO Framework for Cultural Statistics includes a section on Measuring Cultural Participation (p. 44-46). This section is partly based on Guidelines for Measuring Cultural Participation written by Adolfo Morrone in Commission of the UNESCO Institute for Statistics in 2006. A. Morrone uses the experience of the LEG-Culture and the Eurobarometer experiment, research of cultural participation of ethnic minorities in Europe (which was in statu nascendi, when he wrote the report), research in New Zealand and three non-western countries to formulate general guidelines for survey of cultural participation which could be applied in and outside the Western world. In 2010, the UNESCO Institute for Statistics commissioned a consultant to write a manual on measuring cultural participation but unfortunately the manual was not yet published.
4. Changing cultural landscape The debate on changing patterns of cultural practice focuses on the connection between social class and culture. Bourdieu’s critical theory on cultural capital and social reproduction has become canonical – at least among sociologists. Cultural capital seems to be the pivotal element in the social stratification of contemporary Western European societies. The nature of the cultural capital, however, underwent a change. Bourdieu’s triple distinction between ‘le goût de liberté’ (bourgeoisie), ‘le goût modeste’ (middle class) and ‘le goût de nécessité’ (working class) is no longer sufficient. Published in 1979, La distinction is mainly based on research conducted in the1960s. Since then, cultural practices of individuals in higher social strata became wider than those in lower social strata. “It comprises not only more ‘high-brow’ culture, but also more ‘middle-brow’ and more ‘low-brow’ culture, while the consumption of individuals in lower social strata tends to be largely restricted to more popular cultural forms. The crucial distinction, therefore, is not between elite and mass but rather between cultural omnivores and cultural univores”(Chan and Goldthorpe, 2005). There is, meanwhile, ample empirical evidence for the omnivore/univore hypothesis. Tak Wing Chan and John Goldthorpe, for instance, proved its validity for music consumption and the attendance of theatre, dance and cinema in England (ibid.), although their findings are criticised by Richard Peterson who introduced the ‘snob to omnivore’ argument (1996, 2007). Using data from the recurrent Amenities and Services Utilisation Survey, Koen van Eijck, Jos de Haan and Wim Knulst demonstrated that the cultural practices of more highly educated Dutch people became more omnivore between 1983 and 1999 (Van Eijck, De Haan and Knulst, 2002). Technical innovations, in particular the rise of information and communication technology, make this picture even more complex. The Internet has not only opened new venues for professional and amateur artists; it also created a new world-wide forum for lovers, fans and admirers of cultural and artistic styles or movements as well as of individual artists.

ESSnet‐CultureFinalReport
- 234-
Irrespective of how exceptional one’s cultural preferences may be; one will always find kindred souls on the Internet who share one taste and who he or she can join. To get a clearer picture of the effects of social and technological changes on cultural practices and the consequences for the research of cultural participation, Task Force 4 commissioned Jos de Haan and Andries van den Broek from the SCP/Netherlands Institute for Social Research to carry out a short study. De Haan and Van den Broek are in charge of the section on cultural participation in the aforementioned Amenities and Services Utilisation Survey. This survey - or AVO to use the Dutch acronym - usually has a sample of some 15,000 respondents and is held every fourth year from 1979 onwards. In their study Nowadays Cultural participation: An Update of What to look for and Where to look for It, De Haan and Van den Broek regard ‘the opening of cultural boundaries and the widening of digital opportunities’ as ‘a challenge for research’. To us, the key questions are which activities to look for in measuring cultural participation and where to look for those activities. New activities came to the scene and more often than before cultural activities happen outside the walls of traditional art institutions. Community centres, festivals and self organized parties form locations for cultural activities. Also the Internet offers platforms for new activities and is in itself a new location to experience both high and low arts. To allow for an understanding of the broadening of the cultural field, we will make two differentiations, one between the receptive and the active modes of cultural participation (attending vs. practising culture), the other between real life, mediated and digital participation (p. 3-4).
4.1. Societal changes
Developments mentioned above are not an isolated phenomenon. They reflect, and are part of a changing society. In their description of the main changes De Haan and Van den Broek share the view of the Dutch sociologist Paul Schnabel. According to Schnabel the development of contemporary Western societies can be characterised by five ‘i-trends’: ‘individualisation (diminished importance of traditional dependencies), informalisation (looser ties and looser interaction), intensification (growing importance of one’s own experience), internationalisation (growing importance of the international component)’ and informatisation (use of ICT and in particular Internet) (p.5). Contrary to what some sociologists believe (see for instance Beck, 1992) individualisation does not mean that individual behaviour and attitudes have become strictly particular and thus unpredictable. Research conducted in the Netherlands and Belgium shows that nowadays the correlation between individual behaviour and attitudes at the one hand, and background variables such as gender, age and educational attainment at the other is even stronger than it used to be twenty or thirty years ago. That is why the term ‘de-traditionalisation’ coined by the Flemish sociologist Mark Elchardus offers a better explanation of this process than individualisation. ‘De-traditionalisation’ is at the core of Elchardus’ symbolic society: ‘Collective identities such as gender, age, social class (socio-economic condition) can remain important but the way in which they influence the thinking, feeling and acting of people has changed. Their relationship with tastes, attitudes, practices and behaviour will not so much be due to self evident tradition, religiously or philosophically inspired ethical conceptions, or material conditions, but to the effects of differentiation in socializing practices, such as tracking in schools and market segmentation of the media. The differentiation of the educational system and the segmentation and the system of goods become important device to encode gender, class and other collective identities into the late modern selves. It therefore

ESSnet‐CultureFinalReport
- 235-
becomes important to devise detailed measures of the various types of schooling, media use and media preference, as well as measures of variations in the way people are confronted with the system of goods’ (Elchardus, 2009). According to Elchardus, taste, cultural practices and media preference have become much more important for identity building and interpersonal relations than they used to be some decades ago. For instance: readers of the popular right-wing newspaper De Telegraaf were much more discontented with present Dutch society than readers of other newspapers; even if the results were controlled for background characteristics, such as educational attainment (Dekker, Van der Meer, Schyns and Steenvoorden, 2009). No research is needed to predict that readers of The Sun will not easily mix with readers of The Guardian, even if they belong to the same socio-economic class; or youngsters who prefer hip hop with their peers who are fond of the mainstream pop and rock music, even if they attend the same school. That’s why measuring cultural and media preferences, in other words surveys of cultural practices and media habits, have become much more relevant for the study of behavioural patterns and attitudes. ‘What do the processes of individualisation (de-traditionalisation), informalisation and intensification boil down to in the cultural domain? In short: to the opening of cultural boundaries. Or, to put it less neutrally: to the ascent of popular culture, not only as an integral part of leisure repertoires, but also as a legitimate part of the cultural field. In relative terms, if not in absolute ones, this implies the descent of canonized cultural participation and the ascent of cultural participation in other spheres than those inherited from the 19th century and canonized in the early 20th century. New cultural domains emerged, both in terms of the content being created and consumed, as well as in terms of the locations where this takes place etc. This happened also among the higher status groups, where more people started mixing more diverse forms of cultural consumption in their cultural repertoires. Because of their inclination to enjoy both high arts as well as popular arts, they were coined the omnivores, as opposed to univores (or snobs) who more selectively chose to stick to a menu of high arts only (Peterson 1992)’ (p.5). ‘Cultural boundaries were opened not only because of this erosion of the frontier between high and popular arts, but also because of completely different processes of internationalisation. Again this relates to frontiers, international ones this time. The common denominator is the greater exchange across borders, both of cultural expressions as well as of people. Key observations here are the internationalisation of genres and of populations etc. This process that expressions cross borders was fuelled by people doing so, both as tourists and as immigrants, among whom many who have their roots in other than Western cultures. The latter is of great importance for the cultural landscape, in especially in the bigger cities in Western nations, as those are typically the places where immigrants concentrate. Once present in sufficient numbers, immigrants bring forth a cultural life of their own. This tends to happen outside the temples of the canonized Western culture, due to mutual unfamiliarity. To make that part of the cultural landscape visible on the radar of cultural statistics, those radars need to be made sensitive to spotting other forms of cultural expressions being presented and consumed in other venues. In this respect, the three processes of individualisation, informalisation and intensification on the one hand and the multi-layered process of internationalisation on the other hand share a common denominator. That is the opening of cultural boundaries, which for research into cultural participation implies the necessity to rethink which activities to look for and where to look for them.’ (p. 5-6)

ESSnet‐CultureFinalReport
- 236-
4.2. Informatisation: The rise and increase of Internet use
It is almost impossible to exaggerate the importance of the information and communication technology (ICT) for contemporary societies: ‘The growing importance of ICT is recognized in concepts characterizing these societies as an information society (Webster 2002), knowledge society (UNESCO 2005) or network society (Castells 1996)’ (p.7). ‘The new technologies have given media users more and more control over the selection of news, programmes and other content. More time on the Internet runs at the expense of time spent watching television, listening to the radio and reading printed media. However, newspapers are also read on the Internet, while listening to the radio and watching television via the Internet have been growing strongly in popularity in recent years. Because of this convergence of media, the same content is being offered via different channels, including mobile media’ (p.7). “Digitisation of information and convergence of media mean that media users today can draw on an enormous reservoir of content. Cross-medialisation of information output in turn means that this content can be accessed via a range of platforms (newspapers, radio, television, Internet, pc, mobile phone). This gives rise to a ‘convergence culture’ (Jenkins 2006) in which patterns of media use are merging. Convergence represents [...] a move from medium-specific content toward content that flows across multiple media channels, toward the increased interdependence of communications systems, toward multiple ways of accessing media content, and toward ever more complex relations between top-down corporate media and bottom-up participatory culture.” (Jenkins 2006: 243) (p.7-8). ‘Virtual cultural participation has become possible thanks to the rapid rise of the Internet and smartphones, the digitisation and online availability of cultural content and the digital skills amongst populations to take advantage of these new opportunities. As more and more people take up these new opportunities it becomes clear that a new dimension has been added to the concept of cultural participation’. (p.8)
4.3. Mapping the challenge
According to De Haan and Van den Broek ‘opening of cultural boundaries’ and the ‘widening of digital opportunities’ present a major challenge for the research of cultural participation: ‘The key questions then are which activities to look for and where to look for them. To break down the problem, we make three differentiations, one between receptive and active cultural participation (i.e. attending vs. practising culture), a second between direct and digital participation, and a third between high arts and popular arts etc. Thus, the mapping results in the three columns below, where the cells printed in italics represent the (relatively) new fields that, as yet, tend to be underrepresented in research: the popular arts and the digital ways of relating to the arts.’

ESSnet‐CultureFinalReport
- 237-
4.4. The ICET-Model
Speaking about cultural practices, we usually refer to a restricted range of activities: visiting cultural venues, manifestations or institutions; media habits and practicing arts as amateur. De Haan and Van den Broek use a much broader concept of cultural participation and include all activities which are connected to visits, habits and amateur practices. They distinguish four kinds of participation:
Information: to seek, collect and spread information on culture;
Communication and community: to interact with others on cultural issues and to participate in cultural networks;
Enjoyment and expression: to enjoy exhibitions, art performances and other forms of cultural expression, to practice the arts for leisure, and to create online content;
Transaction: to buy art and to buy or reserve tickets for shows. To use this model for analysing the participation in the high (or traditional) culture, popular culture and practicing the arts for leisure (or amateur practices), it is necessary to go through the following steps. When it comes to information, a distinction will be made between informing oneself about the practicalities of some cultural activity (where? what time? what costs?) versus informing oneself about its cultural content (who exactly are performing? who is author/artist? what did critics say?). In talking about communication, we shall distinguish communicating with other members in the audience from communicating with artists, performers or venues. Enjoyment relates to consuming a cultural event or a cultural expression but also to practicing a discipline for leisure. Transaction can entail buying tickets, buying cultural content (books, CDs or other works of art) and buying merchandise (copyrighted material related to an event or venue, such as t-shirts of either rock bands or the Scala in Milan etc.) (p. 9-10).
Table 28 – ICET at work: points taken into account discussing each mode of cultural participation
Information Practical information and information about cultural content
Communication Communication with other members of audience and communication with artists
Enjoyment/Expression Consumption and production of art for leisure
Transaction Tickets, content (e.g.: books, CDs, other art works) and merchandise
4.5. Cultural practices, Internet and ICT
Using their ICET-model and starting from studies published in the Netherlands and elsewhere De Haan and Van den Broek give a concise picture of the effects on ICT in general and the Internet in particular for cultural participation. The consequences appear to vary in different sorts of arts and culture.

ESSnet‐CultureFinalReport
- 238-
o Information
‘The Internet is used in the cultural heritage and arts sector mainly as an information medium. Virtual users are primarily in search of practical information (e.g. opening hours and accessibility). Information on cultural content is sought for less often etc. By 2007, information on theatres was just as often or even more frequently sought via the Internet than via the old media(58). Everyone who obtains information via the Internet also uses another medium. The Internet is partially replacing other media, but is not reaching a new audience for cultural heritage (De Haan and Adolfsen 2008)’ (p.12). People in their teens and 20s are able to find information about music, movies and stars easily via the Internet and consult information on the Web about cinema agendas and concerts more often than older people. The Internet rapidly becomes an important source of information for both old and new forms of popular culture. However, the most important source of information is still advice from friends (De Haan and Adolfsen 2008) (p.14). ‘It can be argued that the greater availability of information on the Internet furnishes the empowerment of arts-for-leisure practitioners, making them less dependent on local shops, teachers, institutions and associations’ (p.17).
o Communication
The communication about traditional arts and culture on the Internet is rather an exception: ‘Notwithstanding the popularity of online communication, communication and the formation of communities are still rare in the sectors of cultural heritage and the traditional arts. However they are likely to become more important in the near future’(p.13). ‘…communication and the formation of communities are common with popular culture. The adding of information by users (creation or user-generated content) in the form of audiovisual material also tends to be concentrated around popular music and self-made film clips… There are various possibilities for users to add information on culture (creation or user-generated content). They can comment on news articles about cultural topics, write blogs, join culture groups on social networking sites, post audiovisual material on for example YouTube or make a website. These new forms of communication are closing in to the heart of cultural life and deserve attention of research’ (p.15). The Internet has become ‘a major platform of communication’ for the arts practitioners. ‘Most noteworthy here is the fact that several social media sites developed into platforms for one discipline or the other, such as http://www.myspace.com (for musicians), http://www.flickr.com (for photos) and http://www.youtube.com (film). Less well known among the general audience, but possibly all the more meaningful to their dedicated users, are the more specialized sites… Here people can not only find information, watch demos, download software and, especially since the 2.0 turn to interactivity, communicate with each other etc. It seems unlikely that this will not affect the ways in which learning and doing are organized’ (p.17).
o Enjoyment/Expression
Although the traditional arts and culture are represented on the Internet and their presentation has been improved - offering opportunities ‘to virtually walk through a museum, to listen to classical music concert in far away places or to see a reconstruction of buildings at archaeological sites’ - the interest of the audience for such digital presentations seems to be rather limited. It could, however change in the near future: ‘Such opportunities with the additional advantage of more background information might attract more and more virtual visitors’ (p.13).
(58) This refers to the situation in the Netherlands.

ESSnet‐CultureFinalReport
- 239-
The Internet offers new opportunities to enjoy popular culture. This is not only true for the already established forms, such as rock music or movies, but also for new forms of cultural expression, such as urban culture (street dance, break dance, rap and hip-hop). These new forms are not only presented in the streets or outside the traditional cultural venues, but also online. The use of the Internet for downloading or streaming music, clips and movies is growing rapidly. As has been already mentioned above, the Internet offers new possibilities not only for professionals, but also for amateur artists to present their work not only to the general audience, but also to their fellow-artists, to communicate with them and to learn from the experience.
o Transaction
Online ordering and paying for the tickets is still relatively rare in the traditional arts and culture and more usual in popular culture. Although the sale of music records has declined since the 1990s, ‘the worldwide decline in cd-sales is compensated by a much bigger increase in online and mobile purchases’ (p.16). The Internet begins to provide a growing number of possibilities for learning to play a musical instrument, to sing or to paint: ‘The first commercial music schools are presenting themselves on the Internet. It still is in the stars, but chances are we witness the unfolding of a new market for lessons in artistic disciplines’ (p.18).
4.6. Conclusion
Questions about visits to cultural institutions and amateur practices are not sufficient to keep track of the changes in the cultural landscape. The questions must concern all the activities included in the ICET-model. De Haan and Van den Broek present examples of such questions for traditional arts, popular arts and amateur practices. It would be, however, impossible to extend a questionnaire on cultural participation in such way that all the ICET activities will be included. A survey using such questionnaire would be very time-consuming and very expensive. One would need to restrict the questionnaire to a few disciplines, i.e. one for the participation in traditional culture, one for the popular culture and one for amateur practices. Moreover, it makes little sense to include questions on information, communication and transaction to all respondents. For instance: to ask respondents who don’t visit museums, how they select exhibitions or pay for their tickets. Therefore the questions about ICET activities apply mostly to people who already have a certain interest in art or a cultural practice; for instance people who visit classical or rock concerts, play a musical instrument or paint in their leisure time. These questions are therefore suited for a follow-up of a national survey on cultural participation. Such a research project should be restricted to those respondents from the national survey who already showed interest in the art disciplines or practices under review. Task Force 4 would suggest that if one or more Member States that will conduct a cultural participation survey in the near future, would be prepared to carry out such a follow-up study and if the European Commission would be prepared to support this initiative(59).
(59) De Haan and Van den Broek already designed a model questionnaire that can be used in such survey. See Part II, Nowadays cultural participation.

ESSnet‐CultureFinalReport
- 240-
5. A framework for cultural practices Task Force ‘Framework for cultural statistics and definitions’ (TF1) decided not to include cultural practices in the first layer which combines ten domains (heritage, archives, libraries, books and press, visual arts, performing arts, audiovisual & multimedia, architecture, advertising and arts & crafts) with six functions (creation, production/publishing, dissemination/trade, preservation, education and management/regulation). Instead Task Force 1 proposed to create specific layers for other dimensions of culture: to take into account needs for specific analyses of culture from an economic and social point of view: the employment dimension, the financing dimension, the consumption and the social dimension (cultural practices and participation). All dimensions cover the common basis - the ten cultural domains - and they capture all aspects of culture. However they require to be separated as they use different tools for being measured (specific statistical classifications, ad hoc terminology and instruments or surveys etc.). Indeed, to propose and produce indicators on financing, the breakdown by domains may not be adequate (other approaches are more appropriate, by operator for instance, see Task Force 2 on financing). The same happens with cultural participation and practices where domains represent the general scope on which practices take place but that are not significant for producing relevant measure on that matter. Following this proposal, and in cooperation with Task Force 1, the participants of Task Force 4 agreed on a framework for cultural practices that fits in the general framework designed by Task Force 1. This ‘layer’ of the general framework distinguishes three dimensions of cultural practices:
amateur practices, i.e. practicing the arts leisure;
attending/receiving, i.e. visits to cultural events and following artistic and cultural broadcasts of all kind of media;
social participation/volunteering, i.e. being a member of a cultural group and association, doing voluntary work for a cultural institution etc.
Task Force 4 tried to include all the activities which could be considered as cultural practices in the framework. We realized that some of the activities could be very rare and sometimes difficult to distinguish from others. There are - for instance - not many people who design their own house and it would be difficult to sort out ‘making films as an artistic hobby’ from ‘making video as an artistic hobby’.
The activities listed in the framework were used as the starting point for designing the comprehensive questionnaire and the list of indicators.
DOMAIN PRACTICING AS AMATEUR
ATTENDING/RECEIVING SOCIAL PARTICIPATION/VOLUNTEERING
Books and Press
Writing in leisure time: Fiction and non-fiction, on paper or in digital form (including weblogs).
Reading in leisure time: books newspapers, magazines either in printed or in digital form.
Publishing all kinds of pamphlets; letters to editors of newspapers and magazines; blogs, e-zines and another publications on the Internet.

ESSnet‐CultureFinalReport
- 241-
Libraries Collecting books, having a library at home.
Visiting libraries (actually and virtually.
Working as a volunteer in a library.
Archives Being an amateur researcher (genealogist, local history etc).
Visiting archives (actually and/or virtually
Being a member of a historical association, group or club (local history, genealogy etc.). Volunteering for or donating to such associations, groups or clubs.
Museums Being a collector.
Visiting museums (actually and/or virtually).
Working as a volunteer in a museum. Being a member of an association, group or club connected to a museum (such as ‘friends of the museum’). Donating to a museum.
Monuments Not relevant. Visiting monuments (actually and/or virtually).
Being member of an association, group or club for the preservation of monuments and heritage. Volunteering for or donating to such associations, groups or clubs.
Archaeology Being an amateur archaeologist.
Visiting archaeological sites (actually and/or virtually).
Being a member of an association, group or club for the preservation of (archaeological) monument and heritage. Volunteering for or donating to such associations, groups or clubs.
Architecture Designing own house or house for others
Visiting architectural exhibitions (actually and/or virtually). Visiting monuments (actually and/or virtually).
Being a member of an association, group or club for the preservation of monuments and heritage. Volunteering for or donating to such associations, groups or clubs.
Arts & Crafts
Making pottery, glass, jewels, textile work etc.
Visiting arts and crafts fairs (actually and/or virtually). Visiting museums (actually and/or virtually).
Having classes. Being a member of a club or a group. Showing own work in exhibitions and/or on the Internet.
Visual arts Painting, drawing, graphical works (by hand), sculpturing.
Visiting arts exhibitions, museums and galleries (actually and/or virtually).
Having classes. Being a member of a club or a group. Showing own work in exhibitions and/or on the Internet.
Photography Making photos as an artistic hobby.
Visiting photographic exhibitions, museums and galleries (actually and/or virtually).
Having classes. Being a member of a club or a group. Showing own work in exhibitions and/or on the Internet.
Design Not relevant. Visiting exhibitions, museums and galleries (actually and/or virtually).
Not relevant.
Advertising Not relevant. Not relevant. Not relevant.
Drama Acting in an amateur theatre company. Directing an amateur theatre company. Acting as a cabaret artist or stand-up comedian.
Visiting theatre plays cabarets and stand-up comedies; viewing direct broadcasts of theatre plays cabarets and stand-up comedies. Viewing recorded theatre plays, cabarets and stand-up comedies in audiovisual media (TV, video, Internet).
Having classes. Being a member of a club or a group. Showing own performances on the Internet.
Dance Dancing ballet or modern dance, ballroom dance, Latin
Visiting dance performances viewing direct broadcasts of dance performances. Viewing recorded dance performances in
Having classes. Being a member of a club or a group. Showing own performances on the Internet.

ESSnet‐CultureFinalReport
- 242-
American dance, jazz dance, hip-hop, break dance, street dance folk dance, etc.
audiovisual media (TV, video, Internet)
Music Singing: alone, in a choir, a vocal ensemble, opera or operetta troupe, pop- or rock band, rapping, etc. Playing a musical instrument.
Visiting operas and operettas, performances, concerts of all kinds, musical festivals and feasts of all kinds; viewing direct broadcasts of operas, operettas, concerts, festivals and feasts. Viewing and listening to recorded operas and operettas and recorded music of all kinds in audiovisual media (radio, cd, mp3 player, tv, video, Internet etc).
Having classes. Being a member of a club or a group. Showing own performances on the Internet.
Radio Being an amateur broadcaster
Listening to radio broadcasts. Doing voluntary work for (non-professional) radio stations.
Television Being an amateur broadcaster
Viewing television broadcasts Doing voluntary work for (non-professional) television stations.
Film Making films as an artistic hobby.
Visiting cinema (and/or film festivals); viewing recorded films in audiovisual media (tv, video, Internet).
Having classes. Being a member of a club or a group. Making films for a civic association or pressure group. Showing own films on the Internet.
Video Making videos as an artistic hobby.
Viewing videos. Having classes. Being a member of a club or a group. Making videos for a civic association or pressure group. Showing own videos on the Internet.
Multimedia Designing for the Internet (for instance games or websites) as a hobby.
Using the Internet for cultural purposes in a cross-sector function and thus not restricted to the web and/or the game designers.
Not relevant.
6. The European surveys on cultural participation: a methodological overview
6.1. Introduction: Eurobarometer versus national surveys
As participation to cultural activities is considered an individual’s right and wider participation a worthy goal of national policy (Agilis, 2006), information on this topic is quite important. As a result, statistics on cultural participation are collected in most European countries (e.g. Belgium, Denmark, the Netherlands, Spain, Italy, France, Sweden, Estonia, Finland, Greece, Germany, the United Kingdom, Austria and Norway). Next to these stand the national surveys on their own, a questionnaire on cultural participation was included in the Eurobarometer surveys (EU and AC/CC) to collect harmonised data on Europeans’

ESSnet‐CultureFinalReport
- 243-
participation in cultural activities. In 2006 national methodologies and results were compared with those of the Eurobarometer surveys to reveal the impact of methodological aspects for cultural participation statistics (Agilis, 2006). The main differences will be presented here. First of all, the statistics on cultural participation in the Eurobarometer surveys are collected in isolation, while most national surveys have a broader scope. They also offer information on other leisure time activities, use of social services and social participation. Because of this, the relationships with cultural participation can be determined which is interesting for both scientists and policy makers. Second, there are some differences in the target population and frame between the various surveys. Some national surveys have chosen to include children while others, including the Eurobarometer surveys, have a threshold of 15 years of age. Persons living in prisons, old people’s homes and other institutions are generally excluded from most surveys. The treatment of immigrant and ethnic groups varies from excluding them to oversampling them. Population registers were mostly used as a sampling frame. Other frames used were statistics of new buildings, labour force surveys, postal registers and postcode address files. Also the Eurobarometer survey made use of addresses but this could be postal addresses or maps. Third, most European countries made use of a multistage sampling method or a simple random sampling. Only a few employed a clustered sampling method or an independent quota sampling method. More differences were found in the sample size. The sample size was much larger in the national surveys than in the Eurobarometer. No national survey had a sample size less than 1,500 respondents (median sample size was 4,650), whereas the sample size of the Eurobarometers was mainly 1,000 respondents per country. Fourth, as to the data collection, the national surveys were conducted between 1998 and 2004 and the Eurobarometer in 1999/2000 (and 2003 for new Member States). There was also quite some variation in the periodicity of the national surveys, ranging from yearly to every 10 years. Some countries did not report a specific time period or reported that the periodicity of the survey was irregular. Data collection was mostly done through face-to-face (paper and pencil and CAPI) interviews. Some countries made use of telephone interviews (CATI), sometimes in combination with a mailed questionnaire. The reference period was generally the 12 months before the survey. In some countries the reference period depended on the type of the question. The highest response rate in a national survey on cultural participation was 80% and the lowest 19%. The response rate of the Eurobarometer is unknown and impossible to count due to the sampling system that allows replacing the respondent if he or she refuses to answer the questions. This can happen several times depending on the country and can cause a bias of selecting those respondents who are especially interested in the item. Fifth, all countries made use of a weighting factor in order to make sure that the sample characteristics are similar to the entire population. However there are some differences in the variables that were selected for weighting. All countries used age and gender for weighting, but there is some variation in the usage of the variables region, level of educational attainment, citizenship, marital status and household size. Further, the AC/CC Eurobarometer used a wider weighting than the EU-15 Eurobarometer.

ESSnet‐CultureFinalReport
- 244-
6.2. The problem of output harmonisation
The results reported by the Eurobarometer and those produced by the national surveys significantly differ. For some countries the results of the Eurobarometer systematically overestimate the national ones. This might be explained by the differences described above. In order to get internationally comparable statistics, a common reference population, reference period, mode of data collection, sample size and set of weighting variables is recommended. So, in order to produce comparable statistics, it is vital to capture the same information across countries. Therefore, Eurostat supplies all participating countries with common guidelines, detailing the output requested, such as the measured concepts and the variables (Clémenceau, Museux & Bauer, 2006). However, the manner in which the data is gathered - for example the way questions are framed or the data collection mode - may differ between countries. Obviously, differences in phrasing the questions will likely limit the possibilities for comparisons across countries. This concerns not only the distributions of the social and cultural characteristics, but also the defined correlations with various background characteristics, such as age, gender, educational attainment and disposable income. Besides problems related to the phrasing of the questions, other cross-country design variations are likely to cause problems in the comparability of the results. In some countries the data is collected by a telephone-interview, whereas others make use of a face-to-face interview or a mail survey. Furthermore, other differences may have an impact on the difficulties in the cross-country comparisons, such as the allowance of interviews by proxy, response rates and non-response bias.
6.3. The EU-Statistics on Income and Living Conditions (EU-SILC)
Two papers (Schmeets & Huynen; Schmeets, Kloosterman & Huynen) have demonstrated that some results from the ad-hoc module on social and cultural participation in the 2006 EU-SILC are implausible. This is mainly caused by the framing of the questions. One example is participation in religious organisations: this varies from 1% in France, 10% in the UK, 45% in the Netherlands to 87% in Cyprus. Various other examples are included in the aforementioned papers. In fact, hardly any cross-country comparisons are valid due to the differences in framing the questions. However, it is not only the questions that might create a problem. This is also true for the data-collection method. The most common modes in survey research are CAPI, CATI, PAPI, mail and web surveys. In recent years, mainly in an attempt to reduce survey costs, mixed-mode surveys for data collection are getting more and more popular. According to the guidelines provided by Eurostat, an interviewer should collect the data. There is a substantial variation in the data-collection modes across countries in the EU-SILC. In the northern countries the information on social and cultural participation was mainly collected by CATI. This was not feasible in most other countries. Here CAPI was mostly used. Some countries made use of a mixed CAPI/CATI design, PAPI or a mail survey. The CATI-countries show substantially higher participation rates on all social and cultural activities in comparison to the PAPI/CAPI-countries. This is particularly true for the questions related to participation in associations. This is also the case in an across country comparison of countries with identical questions (ruling out possible framing effects).

ESSnet‐CultureFinalReport
- 245-
6.4. Adult Education Survey (AES)
The pilot AES (‘wave 2007’) covers participation in education and life long learning activities. It was recommended to the countries to include some information on social and cultural participation. The variables on social participation measure the difficult area of social capital and provide information on the relationship between social activity and learning activity. However, six EU Member States decided not to include the questions on social and cultural participation in their AES questionnaire. Furthermore, the design of the AES is - in line with EU-SILC - based on output harmonisation. The question phrasing differed between countries which makes it difficult to compare results. Moreover, it was recommended to use CAPI as the mode of data-collection, but not all Member States adhered to this guideline. It was applied by six countries only. Twelve countries opted for PAPI. The others combined modes (CAPI + CATI, CAPI + PAPI or PAPI + web survey). In five countries proxy interviews were allowed. In these interviews the information collected for the respondent is taken from another person that answers the questionnaire instead of the respondent. This could lead to inaccurate responses. Finally, the timelines of the AES differed between the participating EU Member States. Some countries started the fieldwork in the beginning of 2006, while others started in the beginning of 2008.
6.5. Comparison EU-SILC and AES
Both EU-SILC (2006) and AES (2007) included questions on cultural participation, but to what extent are the results of these two surveys comparable? Overall, the level of cultural participation is higher in AES then in EU-SILC. For instance, according to AES, about 60% of the Cyprian people attended live performances at least once in the last twelve months. In EU-SILC, this is 42%. As to the attendance of cultural sites, AES reports that 70% of the Slovakian people attended a cultural site in the last twelve months, in comparison to 45% in EU-SILC. So, the differences in outcomes between the two surveys are substantial. These discrepancies can be (partly) explained by the fact that the questions on culture differ between the two surveys. Figure 10 - Attended live performances (at least once) in the last twelve months (age 25-64),
SILC 2006 - AES 2007 %
0
10
20
30
40
50
60
70
80
90
100
IS NO FI SE DK AT EE NL LU UK DE SK FR IE BE LT PT LV CY SI ES CZ EL HU IT PL MT BG GR HR
SILC
AES

ESSnet‐CultureFinalReport
- 246-
Figure 11 - Attended cultural sites (at least once) in the last twelve months (age 25-64), SILC 2006 - AES 2007
%
0
10
20
30
40
50
60
70
80
90
100
FI SE DK DE UK LU NL IS FR ES CZ BE SK AT SI HU IE LV EE PT PL LT CY IT MT EL BG GR HR NO
SILC
AES
6.6. European Social Survey (ESS)
Comparability was also a major concern when designing the European Social Survey (ESS). It is designed to chart and explain the interaction between Europe’s changing institutions and the attitudes, beliefs and behaviour patterns of its diverse populations. The first round started in 2002. In 2010, the fifth round of the ESS was conducted in some 30 countries. From the outset, the ESS was set up as a model following input harmonisation. As Stoop (2009) puts it: ‘In the European Social Survey a strict model of input harmonisation has been implemented. This means, for instance, that survey modes and question phrasing is identical across countries, which should prevent major differences in social statistics from being mainly due to differences in the wording of the question’. However, even under strong – input harmonised – conditions, the across country comparability of the ESS is not without problems. In the ESS the same questions and data-collection mode (CAPI), and a 70% response target should ensure high quality and comparable findings across countries. However, input harmonisation is not the only solution when it comes to ‘high quality’ data. Even within the ESS, there are many problems to solve. For example, a comparison of the official turnout rates with the reported turnout rates reveals that the discrepancies between the figures are large. For example in Romania the discrepancy is 29% (39% official turnout versus 68% reported). The variation across countries is substantial: in two countries - Czech Republic and Turkey - the official result is even higher compared to the reported turnout figure. Obviously, many of the social and political participation variables included in the ESS will be biased as well. This is in particularly true for the characteristics which are highly correlated with political participation, such as social and political trust and volunteering work. Probably, there remains only one solution to tackle this problem in order to make a more appropriate comparison of the results across countries: reweighing the data by including turnout in the weighting models (for the Netherlands, see Schmeets, 2010). Input harmonisation is not a guarantee for high quality. The example demonstrates that it is difficult to assess whether it will be feasible to make a proper comparison of social and cultural participation between countries. The non-response bias varies across the countries, which makes it problematic to define - for example - the share of volunteers across countries as well as other characteristics such as social contacts, social trust and trust in (political)

ESSnet‐CultureFinalReport
- 247-
institutions, conventional and unconventional political participation (for an overview of the ESS findings in 2008, see Linssen and Schmeets, 2010).
6.7. The ICT-survey (ICT) and Time Use Survey (TUS)
The aim of the European ICT surveys, starting in 2005, is to collect and disseminate harmonised and comparable information on the use of information and communication technologies in households and by individuals as well as in enterprises at European level. In the light of the aforementioned plea for a more input harmonised approach, it is worthwhile to note that this is not the case for the ICT survey. In contrast to the ad hoc module on social and cultural participation, the framings of the questions are harmonised. However, that is not true for the data collection mode. Most countries collected the data via a face-to-face interview, in others telephone interviewing was also a common technique, and mail surveys were used by two countries. This might cause a bias when it comes to an across country comparison. For most EU countries, the final or net sample size was between 3,000 and 6,000 persons. In the working paper (Eurostat, 2008) on the harmonisation of the TUS it is stated that as to the design ‘The chosen approach is a mix of input and output harmonisation. On the input side, a diary format, certain procedures for data collection and a common activity coding list are strongly recommended. The time diary is self-administered, with fixed 10-minute intervals to be filled in during randomly designated diary days. The respondents record what they are doing in their own words. Diary instructions and examples are recommended for use in national Time Use Surveys, and a set of common questions are recommended for the interview questionnaires. Most of these questions are used in other surveys, e.g. the LFS, or have been recommended by the Task Force on Core Social Variables. Other aspects of survey design and practice are left up to the National Statistical Institutes, giving them the opportunity to use best possible practices for survey organisation and data collection efforts at national level’. Obviously, a TUS is very sensitive for variations in the design, and the framing of the questions, the provided examples to the categories. Even a very slight change may cause a strong impact on the distribution of time spent during the day, even within one country in two consecutive surveys (Exel, 1991). It is also very likely that variation in the data-collection mode across country will create difficulties when it comes to an interpretation of the results. Apart from the mode, the national samples are not uniform as some countries drew household samples, while others used the individual as sampling unit. In addition, all members of the sampled households or the other members of the sampled persons’ households may or may not be included in the sample. So, sample designs will differ between countries in other respects too. Further research is needed to investigate more in detail such effects, along the lines of the analyses based on the EU-SILC findings.
6.8. Conclusion and discussion
The EU-SILC builds on the experience of the EU-Household Panel (ECHP). In the ECHP the comparability was achieved by common concepts, definitions, classifications and a ‘blue-print’ questionnaire. In addition, other design aspects were harmonised, such as sampling, data-processing and data-analysis. In EU-SILC and the AES, output harmonisation was introduced. This has resulted in many implausible results. In particular, the lack of phrasing the questions in an identical manner has an impact on the findings and the cross country

ESSnet‐CultureFinalReport
- 248-
comparisons. In addition, the variation in the data-collection mode makes is problematic for making comparisons. The question arises whether it is still feasible to re-introduce input harmonization. It is our belief that this is the case. From 2002 onwards, on a 2-years base, the European Social Survey (ESS) has been conducted. The ESS is an example of an input harmonised survey, with identical questions, sampling, and response targets. Why should that not be possible for EU-SILC, and other EU-surveys such as the AES, as well? Moreover, the ICT survey demonstrates that it is possible harmonising the framing of the questions, although the data-collection mode varies across countries. However, input harmonisation is not the only solution when it comes to ‘high quality’ data. Even within the ESS, there are many problems to solve. For example, a comparison of the official turnout rates with the reported turnout rates reveals that the discrepancies between the figures are large. This indicates that the non-response bias will also vary substantially. However, using output harmonisation will create even more problems. It should be possible that not only the concepts, but also the phrasing of the questions are identical across the countries. However, it will not be easy to include the data collection mode in the recommendations or even in regulations. CAPI is not very cost-effective there is a strong pressure from Member States to allow for other data-collection modes. For example a mixed-mode design, starting with the cheapest modes (web and mail), followed by the CATI and PAPI, and to use CAPI as the last option. When introducing a module on cultural participation one should be aware that allowing various data collection modes will make it very difficult to compare the results across countries.
7. Analysis of national surveys on cultural participation (60)
7.1. Methodological analysis
There as been a strong need for reliable and comparable information on participation in cultural activities for years. Already in 1997 a Leadership group on cultural statistics (LEG-Culture) was established by the European Commission and Eurostat. This was in response to a request from Member States to build up a system of comparable cultural statistics. Although the LEG-Culture group delivered important pioneer work and published a first report in 2000, the existence of reliable harmonised data remained problematic (see considerations under paragraph 3: Situation at the start of Task Force 4). In this 2000 report an attempt was made to harmonize the information gathered on cultural participation for 7 countries in the EU (European Commission, 2004). The exercise showed very big differences for the participation in several cultural activities. However, it seemed very unlikely that these differences reflected actual differences in participation between the countries. Many methodological issues could have exacerbated these discepancies. Differences in sample size and sampling method, target population, data collection, question wording and scope of the survey can all have a devastating influence on the comparability of the results. Therefore it is almost impossible to put together a table with comparable figures (60) For the complete results of the methodological survey conducted by Task Force 4: http://circa.europa.eu/Members/irc/dsis/culturestatistics/library?l=/working_groups/essnet_-_culture_1/task_forces/task_force_4/working_documents/questionnaires_country&vm=detailed&sb=Title

ESSnet‐CultureFinalReport
- 249-
on the basis of national surveys that are very often completely different in concept, development and background. The LEG-Culture group was well aware of this problem and recognised the necessity to define a common basic framework to measure cultural participation. It goes without saying that due to different traditions and connotations in the participating countries this was not an easy task to accomplish. But in the end the LEG-Culture group proposed a general framework that leads to the design of a harmonised set of questions and indicators to measure cultural participation in Europe. The European Commission asked Eurobarometer to implement these set of questions into two surveys (in 2001 for the then Member States and 2003 for the candidate countries). The aim was to finally collect some basic harmonised data on the participation of Europeans and to test the applicability of the module constructed by the LEG-Culture. It is important that one should not forget that these first implementations were seen as a pilot project to test the applicability of the questionnaire. Of course this brought some limitations to the conclusions that can be drawn out of the analysis of these surveys. General comparisons between countries can be made. Analysis of socio-demographic variables is, due to the limited sample size in each country, only possible at the general European level (Morrone, 2006). But maybe more important than the results of these surveys, that were not undisputed, are the learning points that can be distilled out of this process. The strongest point of the two Eurobarometer surveys was undoubtedly that there was a strong form of input harmonisation. The basic sample design, questionnaire, interview method and weighting procedure were similar across countries. Despite this considerable advantage the data on cultural participation showed huge differences across countries and also huge differences with data collected on national level. This was thoroughly investigated in a report of the European Commission (Aegilis, 2006). The conclusion was that there were significant differences between the results reported by the Eurobarometer and those reported by national surveys for at least half of the variables. In many countries there was a trend for overestimation of the national results and also variable-wise there existed for several indicators a trend for overestimation by Eurobarometer. Italy, one of the countries with very large and systematic discrepancies between the national results and the Eurobarometer results did some research on the causes behing such an important dissimilarity. Their main conclusion was that in the Eurobarometer sample, young educated people were over-represented, which led to a positive bias for all indicators of cultural participation (Morrone, 2006). This example also shows the level of non-response or, to be more correct, systematic non-response that can have an impact on the reliability of the results and therefore also on the comparability between countries. In fact there are big differences in the non-response across countries. Consequently, we can presume that there are differences in the representativeness of the sample across countries. However, this is not necessarily so. In fact a lower response rate with a non-systematic non-response can generate a more representative sample than a higher response rate with a systematic drop-out. But it seems reasonable to assume that the large differences in response rate between countries are a strong indication for differences in the representativeness of their samples. In this way differences in participation can be increased. It is clear that there are many pitfalls in the process of gathering comparable data. In another chapter of this report it is also shown that other European surveys have difficulties in gathering comparable data. Not only for those surveys that use output harmonisation like

ESSnet‐CultureFinalReport
- 250-
SILC but also when input harmonisation is used as in Eurobarometer. Even for the ESS-survey, that uses strong input harmonisation, there are problems with the comparability between countries. Despite using the same questions and data collection mode and setting a 70% response target there remain problems with the comparability of the results across countries in the ESS-survey. Of course using the same questions and data collection mode in all countries is a very interesting option but it is only effective if all countries involved have the same experience and competence with the method. One should not forget that there are different research traditions across countries. Forcing a data collection method therefore could lead to differences in the non-response and the non-response bias. And that is of course a threat to the comparability of results. The recent literature about construct equivalence gives interesting insights in this respect. When dealing with equivalence, the focus is on giving the same stimulus to each respondent in all countries rather than using exactly the same question wording (among others Billiet & Welkenhuysen-Gybels, 2004). For example, a question that works perfectly in a mail survey could be prone to a socially desirable answer in a face to face survey (Segers, 1999) and vice versa. So using exactly the same questions is only useful if it is feasible to implement the same data collection mode in all countries. The above clearly shows that choosing the best path to follow is not easy. The comparability of results is influenced by many factors and the right balance between all these aspects should be found. A view on the methodological aspects of the national surveys and their differences on these aspects can be helpful for this exercise.
Task Force 4 recognised this need. A questionnaire about the methodological aspects of national surveys was sent to all Member States. The response to this questionnaire was quite good:
o 17 countries provided information on their national surveys on cultural participation;
o 6 countries sent information about AES or SILC; o only 4 countries did not respond.
Since the methodology aspects of the AES-survey and the SILC-survey are discussed elsewhere in this report, the paragraphs below are restricted to the results of the national surveys. The results can be divided in three main groups: topics covered, survey characteristics and information on the sample. The following conclusions relate to the topics discussed:
most countries distinguish between visits to different kinds of performing arts in their national surveys. Visits to (different kinds) of museums, libraries and cinema are also recorded;
most national surveys include amateur practices as well as visits to ‘informal’ cultural events;
media habits (watching television and recorded images, listening to radio and recorded sound, reading in leisure time, using Internet for cultural purposes) are not always included in the national surveys on cultural participation. Some countries use TUS (Time Use Survey) for measuring media habits;
several national surveys on cultural participation also include questions on civic participation.

ESSnet‐CultureFinalReport
- 251-
The table below gives a complete overview of the topics covered in the different national surveys on cultural participation.
Table 29 - Overview of the topics covered in the different national surveys
DE
NM
AR
K
EST
ON
IA
CZ
EC
H R
EP
UB
LIC
FIN
LA
ND
FL
AN
DE
RS
(BE
LG
IUM
)
FR
EN
CH
SP
EA
KIN
G
CO
MM
UN
ITY
(B
EL
GIU
M)
GE
RM
AN
SP
EA
KIN
G
CO
MM
UN
ITY
(B
EL
GIU
M)
FR
AN
CE
GE
RM
AN
Y
HU
NG
AR
Y
IT
AL
Y
MA
LT
A
NE
TH
ER
LA
ND
S
PO
LA
ND
SPA
IN
SW
ED
EN
SW
ITZ
ER
LA
ND
TU
RK
EY
UN
ITE
D K
ING
DO
M
Visits to different kinds of performing arts distinguished
× × × × × × × × × × × × × × × ×
Visits to cinema × × × × × × × × × × × × × × × × ×
Visits to museums and galleries × × × × × × × × × × × × × × × × × ×
Visits to libraries × × × × × × × × × × × × × × × × × ×
Amateur practices × × × × × × × × × × × × × × ×
Participation in ‘informal’ cultural events × × × × × × × × × × ×
Reading in leisure time × × × × × × × × × × × × × × × ×
Watching television and recorded images × × × × × × × × × × × × × × × × ×
Listening to radio and Recorded sound × × × × × × × × × × × × × × × ×
Using internet for cultural purposes × × × × × × × × × × × × × × ×
Other activities in leisure Time (sport, hobbies) × × × × × × × × × × × × ×
Voluntary work, donating × × × × × × × ×
Helping behaviour × × × × ×
Participation in political parties and trade unions × × × × × × × ×
Participation in religion and ideological organisations
× × × × ×
Participation in pressure groups × × × × × × ×
Participation in cultural associations × × × × × × × ×
Participation in other associations × × × × × × × × × ×
In general one could say that there is some consensus on the core topics that should be covered dealing with cultural participation. However, in the Task Force 4 there was a lot of discussion about e.g. whether civic participation should be included or not. The table below shows that the topic is quite important in a lot of countries. Also from a policy side this is an important issue. It is directly linked to the discussion about the importance of social capital. The very high expectations that policymakers attach to the stimulation of social cohesion and social capital are remarkable. It is presented as a solution for social problems like feelings of insecurity, intolerance and acidification of society. Social cohesion is seen as an important catalyst in the process of creating a warm and caring society. So there is a strong belief in the

ESSnet‐CultureFinalReport
- 252-
social relevance of this theme. Also the importance assigned to cultural participation by government is linked to the social benefits it generates. Because of their growing policy interest, themes like the impact of cultural participation on norms and values, the competence in other civil fields and the contribution of cultural participation to an open and diverse society should not be overlooked. Even if at a first glance there is unity in the topics covered, this does not mean that putting them into operation is straightforward. Very often in the past, lower or higher participation rates were said to be related to translation problems, other connotations or other definitions of culture in the various countries. It is important to avoid this kind of problem of interpretation otherwise even a strongly harmonised approach could give a disappointing result from the point of view of the representativeness of the results. Using the exactly the same questions is also only useful if all countries use the same data collection mode (and even then the possibility for a different connation or interpretation should be avoided). If using the same data collection mode is for some reason not feasible (budget, available capacity, available staff, etc.), it is more adequate to aim for construct equivalence. If using a different collection mode, it is in the first place important to offer the same stimulus to all respondents. A certain question can work completely differently in a face to face interview then in a mail survey. A uni-mode approach is often said (De Leeuw, 2005) to be not feasible and could even enhance differences across countries. For instance a lower response rate for a telephone survey in the UK compared with some other countries was said (Nicolaas & Lynn, 2002) to be caused by a rather limited training of the interviewers. Indeed the lack of sufficiently experienced, trained staff and other specific conditions for certain survey-methods can make the introduction of a uni-mode system for international comparison problematic. Apparently non-equivalence of design can sometimes be a bigger issue than mixed-mode. There is a good chance that allowing countries to use the mode they are the most experienced in, will render smaller differences than the obligation to use a method they are not used to. This of course does not take away that some methods in general tend to be more vulnerable to selectiveness of non-response than others, but even that can alter between countries. The use of a generalised mode design where one aims at presenting the same/equivalent stimulus in each mode rather than the same question could therefore be the most beneficial. For the translation of a questionnaire this means for instance that a literal translation is not applied, but translation of concepts is the key. For instance, cultural participation could well lead to higher construct equivalence. A look at the survey characteristics across countries can give us some indications about what is realistic. Apparently face to face interviewing (CAPI) is quite well spread across countries. So experience and sufficient knowledge of this method is available in a lot of countries. Nevertheless, this method is rather costly and it is the question if all countries are prepared to go for this method. As illustrated in abundance above, this is the crucial point to know when working out guidelines for the questions to use.

ESSnet‐CultureFinalReport
- 253-
The table below gives an overview of some of the national survey characteristics.
Table 30 – Survey characteristics
Country Survey type
Periodicity Survey period
CZECH REPUBLIC Post/Internet Yearly Jan-March
DENMARK Telephone interview/Internet/postal irregular May-August
ESTONIA Face to face once in 10 years entire year
FINLAND CAPI once in 10 years Sept-Jan
FLANDERS (BELGIUM) CAPI Yearly April-July
FRENCH SPEAKING COMMUNITY (BELGIUM) CAPI irregular Aug-Dec
GERMAN SPEAKING COMMUNITY (BELGIUM)
Telephone interview Unclear Unclear
FRANCE CAPI once in 10 years Nov-Feb
GERMANY (TUS) Self-administered mail survey variabable variabable
HUNGARY Face to face irregular Unclear
ITALY Partly face to face once in 5 year May
MALTA Face to face irregular more than a year
NETHERLANDS Face to face/mail survey once in 4 years Sept-Dec
POLAND Face to face once in 5 years January
SPAIN Face to face once in 4 years Jun-Sept Dec-Feb
SWEDEN Face to face once in 8 years unclear
SWITZERLAND CATI once in 10 years Sept-Nov
TURKEY no information no information no information
UNITED KINGDOM Face to Face Yearly April-April
Finally the information on the sample shows a lot of differences between countries. Using different sampling methods can however cause huge aberrations in the response rate and representativeness of the sample. It is therefore quite essential that all countries use the same method of random sampling. Methods seen as quota-sampling that are very prone to self selection are not acceptable. The response rate is quite high in most countries but selectiveness in the non-response or coverage errors are at least as important. A lower response rate with minor bias can therefore be preferable over a higher response rate that is biased considerably. Also noteworthy is that most national surveys are dedicated surveys (stand alone), and only a few countries have a module embedded in an existing survey. Of course it is important for comparability that this aspect is the same across countries, albeit because it can have quite an impact on the social desirability bias in the answers (Billiet & Waege).

ESSnet‐CultureFinalReport
- 254-
Table 31 - Samples
Country Gross sample size Net sample size Unit Response Rate
CZECH REPUBLIC 10,000 individuals 8,000 individuals 80%
DENMARK 2,888 individuals 1,830 63%
ESTONIA 7,225 Individuals the data registration is in process
the data registration is in process
FINLAND 4,650 individuals 3,355 individuals 73,30%
FLANDERS (BELGIUM)
2,321 individuals 1,500 individuals 66,50%
FRENCH SPEAKING COMMUNITY (BELGIUM)
2,000 individuals quota sample quota sample
GERMAN SPEAKING COMMUNITY (BELGIUM)
10,000 individuals unclear unknown
FRANCE 5,004 individuals quota sample quota sample
GERMANY (TIME USE SURVEY)
5,400 households with nearly 12,600 individuals no information no information
HUNGARY 12,000 individuals the data registration is in process
the data registration is in process
ITALY 24,000 individuals 19,000 individuals 80,50%
MALTA 970 individuals 800 individuals 82,40%
NETHERLANDS 10,861 households 9.892 households 72,6% (household level)
POLAND 4,702 households 10,881 individuals
4,551 households 9,354 individuals
96.8% household level 86% individual level
SPAIN approximately 16,000 individuals
approximately 14,500 individuals
approximately 90%
SWEDEN 3,583 individuals 2,699 individuals 75%
SWITZERLAND 6,564 households 4,346 individuals 66.2%
TURKEY no information no information no information
UNITED KINGDOM complex information complex information 60%
Choosing a design or system is in reality always a complicated trade-off between coverage error, non-response error, measurement error, comparability and cost. In the case of the ESS-Culture project one should not forget that the comparability across European countries is crucial. Therefore maximising the comparability between countries should be a top priority. It is important to be aware that all steps taken in the process have their consequences and implications on the rest of the process. For instance, in making good standard questions it is very important to know if it is realistic to use the same data collection mode in all countries. If not, one ought to prepare better and try to achieve as good construct equivalence as possible. To give good methodological guidelines for obtaining comparable data one should know what the practical and budgetary possibilities are.

ESSnet‐CultureFinalReport
- 255-
7.2. Comparison of national questionnaires
As already said in the last paragraph, there is not much difference between the topics of national surveys on cultural participation. Most questionnaires include visits to arts, heritage and amateur practices. There is, however, a considerable variation in the scope of cultural practices recorded. As could be expected, recent surveys contain more and also more detailed questions on the use of the Internet than surveys that were conducted five or ten years ago. This of course is hardly surprising. The main divergences can be summarised as follows:
a number of national questionnaires make a difference between visits to professional and visits to amateur performances;
some national questionnaires distinguish between visits in own country and abroad;
there is considerable variation in the questions about visits to performing arts. Visits to opera, operetta and musical are in some questionnaires included in the visits to theatre, while in other questionnaire listed under music;
questions about listening to music and visiting concert show much disparity. This is not only true for different sorts of popular music, but for classical music as well Some national questionnaires divide classical music in contemporary, ancient, sacred, vocal, etc.;
questions about festivals and open air manifestations also vary;
a general question on visits to museums is missing in some questionnaires, which only contain questions on visits to different kinds of museums and galleries. Visit to exhibitions - outside museums - are sometimes included and sometimes excluded. It is not always clear whether questions on gallery visits concern the art museums only or include commercial galleries as well;
some questionnaires include visits to archaeological sites in the questions on visiting monuments, others do not;
there is considerable variation in the questions about amateur practices. Some questionnaires group painting, drawing and sculpturing together, while others have separate questions. Questions about playing a musical instruments and singing range from general to detailed;
although questions about public libraries mostly concern visits, some countries only have questions about membership. Some questionnaires include visiting libraries via the Internet;
some questionnaires have questions about reading books in leisure time only, or readings books for pleasure and entertainment only; others include all reading of books;
a number of questionnaires have an extensive section on media habits. These questionnaires usually stem from countries that do not have a separate time use survey.

ESSnet‐CultureFinalReport
- 256-
8. Module on cultural practices
8.1. Introduction
Both the Stiglitz report and the policy paper GDP and beyond. Measuring progress in a changing world, which represents the main reaction of the European Commission to this report, plea for a shift from a measurement of economic parameters to broader measures suited to capture non-economic aspects, such as quality of life and social well-being. It goes without saying that the concepts of quality of life or social well-being are not restricted to health care or social and civil participation, but also include all leisure time activities; thus cultural practices, sports and tourism. The recommendation of the LEG-Culture report to start ‘a common European survey on participation in cultural activities to be repeated periodically, for instance every five years’ is still very timely. The questionnaire of the survey could be included inside a survey covering sports, social and civic participation. If repeated periodically such survey would indeed be the best way to measure progress in a changing Europe. It would be unrealistic to expect that a fully fledged survey on culture, social and civic practices will be carried out in the EU in the near future. The best we can hope for is a pilot project carried out by a limited number of Member States with the support of the European Commission. A module on cultural participation, containing a limited number of questions can, however, be included in one of the upcoming EU surveys. If the questions are chosen carefully, even a short module can yield data for valuable comparison of cultural participation in different European countries. A limited number of questions can serve as an indicator for the participation in the traditional and popular arts and culture as well as practicing the arts for leisure. The interest for a certain art or a certain form of culture is rarely an isolated phenomenon, but usually a part of a pattern. For instance: the audience of classical music concerts also includes opera and ballet audience: a visitor who visits concerts of classical music may also visit opera and/or ballet performance; mostly once or twice a year. A question, which is useful as an indicator, should refer to a practice that is fairly common, yet distinctive enough. It would - for instance - make little sense to ask respondents if they watch films on television, as almost everyone does. One of the objectives of Task Force 4 was to ‘elaborate a proposal for the questionnaire of the module for the European Household Survey (EHS) dedicated to culture, if relevant’. Meanwhile it became clear that Eurostat would not hold the EHS survey in a near future. Instead a new ad-hoc module of EU-SILC survey (ahm) is planned for 2014. According to the information provided by Eurostat there is the possibility to include some questions on cultural practices in this ahm of EU-SILC. The participants and members of Task Force 4 welcome this opportunity. To allow a reliable comparison of cultural and civic participation in the Member States the so called ‘input harmonization’ should be used in this survey and the data collection modes used in different Member States should be harmonized as much as possible. Moreover, Eurostat should involve the experts of the National Statistical Institutes and Ministries of Culture who were participants and/or members of Task Force 4 in the preparation of EU-SILC. As it is not clear how many and what kind of questions could be included in the new EU-SILC, Task Force 4 decided not to restrict the module to a few questions, but to present a full fledged questionnaire. As already said, it is possible - and relatively speaking easy - to choose a number of questions from this module in such a way that these questions not only serve as

ESSnet‐CultureFinalReport
- 257-
indicators for the participation in traditional and popular arts and culture as well as amateur practices, but are also related to the main subject matter of the survey. This chapter proposes a module questionnaire as a tool for measuring cultural participation and methodological guidelines to smooth differences between data collections carried out in different countries and on EU level. Finally it proposes a list of harmonised indicators which should be calculated using this module. The module focuses on seven domains of cultural participation: performing arts, architecture, visual arts and crafts, heritage, books and press, libraries, film and video, radio, television and Internet and for each domain three aspects are taken into account attending/receiving, amateur practices, social participation/volunteering. Questions about social aspects of culture - such as membership of a group of amateur artists, or donating to and doing voluntary work for cultural institutions and organisation - are only partially covered in the module. Such questions are often included in European surveys on political, social or civic participation. Such surveys - for instance the European Social Survey (ESS) which is co-financed by the European Commission - are the ideal vehicle for a Module on Cultural Practices. The inclusion of this module would allow not only to compare cultural participation with political or social participation, but also to study the relations between different kinds of participation and the impact they have on the civil society. ICT and Internet substantially improved the possibilities for direct broadcasts of artistic and cultural manifestations and events. It is possible nowadays to watch a direct broadcast of an opera performance or a rock concert in cinemas all over Europe and - in some cases - even on the PC. One may say that following such broadcasts has become a new kind of cultural practice. That is why we propose to include this aspect in the module as well.
8.2. Methodological guidelines
The methodology generally adopted to collect information on cultural participation is the sample survey on households and individuals. This collection method can be expensive if faced with data obtained from registers, but it is the only tool that can provide information necessary to produce indicators on this phenomenon. Usually data from administrative sources do not have structural information on the person like gender, age or nationality. For example, when we buy a ticket at cinema, no information is collected about our gender, age and so on. The phenomenon cannot be analysed according to individual structural information and, by consequence, it is impossible to use register data to answer key policy questions such as who in a given society is participating in what aspects of culture and why. Moreover, it is difficult to build indicators on cultural participation because it is quite difficult to define the reference population. For example, it is impossible to use the number of ticket sold to access museums in Italy to build an indicator like the percentage of Italians going to museums because we don’t know how many tickets are sold to tourists from abroad. This section focuses on general questions concerning survey methodology necessary to collect information on cultural participation. It intends to give useful guidelines for countries that want to implement a data collection on cultural participation.

ESSnet‐CultureFinalReport
- 258-
Definition of population
A survey on cultural participation should give information on this subject in a very broad sense. This means that the survey should cover the population as a whole and not concentrate on specific social groups such as the labour force, the unemployed and so on. To have a complete picture of the situation in a country a survey should cover the widest population possible. In Italy, for example, cultural participation data covers population of 6 years and over and by consequence it is possible to compare the cultural participation level of very different age groups. More importantly, it is possible to compare the cultural participation patterns of young and elderly people who are involved in very different cultural activities. The ideal situation is to focus on the 6 years and over population. However, considering that this is an ambitious target, the recommendation is to focus at least on the population of 15 year olds and over or alternatively the population of 15-75 year olds. This would be the core sample, which all participating countries should use but every country is free to widen the age bands if possible. Residents of institutions (like old people’s homes, prisons etc.) are usually excluded. Reference period
Generally, estimations on cultural participation are produced using a reference period of 12 months. Such a period is adopted in different surveys and therefore it is recommended for reporting participation on cultural activities. In alternative, the previous calendar year could be used. A shorter reference period could lead to a better recall of cultural activities but there are serious disadvantages to such a solution as most respondents would probably not have participated in any activity over this period, limiting the analytical potential of the data, while the results would be strongly influenced by seasonal effects. However, it is possible to use shorter reference periods for specific cases (e.g. for very frequent cultural activities like watching TV or listening to the radio). A harmonised reference period is a key element to make possible comparison between countries. It is easier to compare data collected in different years but with the same reference period than data collected in the same year but with very different reference period. For example it is possible to compare data on cultural participation collected in different years but with the same 12 months reference period while it is practically impossible to compare results based on a 12 months reference period with those based on a weekly reference period. Method of data collection
With a dedicated survey it will be possible to cover more of the variables known or suspected to be correlated to participation in cultural activities. The ideal proposal is to use the same data collection method in all countries in order to avoid possible effects of the method on the comparability of results. Face-to-face interviews should be used as this would produce better data on participation in cultural activities (and related issues) than other data collection methods. Visual support such as show cards in face-to-face interviews would help answering complex questions.

ESSnet‐CultureFinalReport
- 259-
Computer-Assisted Telephone Interview (CATI) and Computer-Assisted Personal Interviews (CAPI) should be used whenever possible. However CATI are increasingly affected by systematic distortions of the sample due to the increasing share of households without a fixed telephone line, while CAPI is a very expensive data collection method. A CATI-CAPI mixed data collection method could be the best way to reduce the distortion of the sample and reduce the costs of data collection. Computer-assisted interviews make it possible to collect information with multiple response pathways, complex flows and built-in edits and checking rules. The use of computer assistance may require more time to plan and execute than traditional paper and pencil methods. However the data check and validation would be significantly shortened. Proxy interviews should be avoided as much as possible in cultural participation surveys because proxy answers on participation in cultural activities underestimate the phenomenon as the respondent does not know all the cultural activities carried on by all the other members of the household. Sampling design
It is recommended that the final sampling unit should be individual and each participating country should design its sample selection according to what is most relevant to that country. It is possible to use a sample based on individuals as primary sampling units or a sample where the primary sampling units are represented by households. The second sampling units are all the actual components belonging to each household included in the sample. The survey should be based on a probability sample from which results representative of the population at agreed age ranges can be derived. The recommendation is to use a stratified sample of individuals, at least according to age, gender and educational attainment. It is also recommended that the survey should be carried out in all national languages or in the languages that cover the wide majority of the population. Sample size
Calculation of sample sizes should take into account that this should be a survey with multiple objectives. It has to ensure representative results for all the estimates produced. In particular, calculation of sample size should take into account that each statistic has to be tabulated by age, gender, educational attainment level, employment status and degree of urbanisation. As budgets are limited, the design of the survey involves making trade-offs along various dimensions. Larger samples make it possible to analyse sub-groups in depth but every interview increases the cost of the survey. The sample size should take into account the coverage of specific groups which would be the targets for analysis, like for example unemployed persons on various levels of educational attainment or gender or age. The proportion of those sub-groups in the population should be taken into account. However, as it is difficult to take into account the possible non-response
ESSnet‐CultureFinalReport
- 260-
rates in different countries in advance, a target of received responses (completed questionnaires) could be set. The calculation of sample sizes should be based on precision requirements. On this basis countries should decide on sample design and calculate the sample sizes in order to receive estimates with sufficient quality. However, considering the experience of the Adult Education Survey (AES) it is possible to have reliable estimates at a national level for most of the European countries with sample not greater than 5,000 individuals. On the basis of previous considerations, it is suggested to adopt a mixed view, based on both cost and organisational criteria and on an evaluation of the sample errors of the main estimates on a national level, with reference to each of the territorial domains and of the breakdown variables of interest. Measurement errors
Measurement errors can be reduced by ensuring that the questions are easily understood and that interviews are carried out in a consistent standardised manner. Therefore testing and piloting of the questionnaire should be conducted in as many countries as possible. Cognitive research methods such as focus groups (8-10 persons) and qualitative interviews can be used (even in countries which cannot do piloting because of time or other constraints) for better understanding of the ways respondents comprehend survey instructions and questions, recall requested information, and how the word and question order can affect responses. In this context, an agreement is necessary on the kind of cognitive, pre-testing and piloting methods to be used for the development of the outline of national questionnaires. Another key element affecting the quality of the data is the fieldwork. Each country should strive to get experienced high quality interviewers. It is suggested that a common outline training manual and common interviewer instruction should be developed. Finally it is crucial is that the wording of the questions of the module questionnaire and the routing of the filters is respected as much as possible. Clearly the model questionnaire needs to be adapted in the national language(s) of the participating countries but this work should be done carefully respecting the meaning of the original model question. For this purpose it will be very useful to take into account the questionnaires of the Special Eurobarometer Survey on Cultural Participation which are available for all the countries of the European Union.
8.3. List of indicators on cultural participation and level of priority
This is a first draft of a list of indicators which should be measured using the model questionnaire. The list is a preliminary attempt, based on previous documents and experiences, to define indicators which could be relevant for the analysis of the phenomenon and for the policy process.

ESSnet‐CultureFinalReport
- 261-
Indicators are ranked according to their level of priority.
Table 32 - List of indicators of cultural participation by level of priority
CULTURAL PARTICIPATION INDICATORS
LEVEL OF PRIORITY
1 2 3PERFORMING ARTS
Percentage of persons who have carried out at least one artistic activity the last 12 months (F
61F
) ×
Percentage of persons who have played musical instruments ×
Percentage of persons who have sung ×
Percentage of persons who have danced (dance, ballet) ×
Percentage of persons who have made theatre ×
Percentage of persons who have done other artistic activities ×
Percentage of persons who have visited live arts performances in the last 12 months ×
Percentage of persons who have visited theatres in the last 12 months ×
Percentage of persons who have visited opera performances in the last 12 months ×
Percentage of persons who have visited ballet/dance performances in the last 12 months ×
Percentage of persons who have visited other live arts performances in the last 12 months ×
Percentage of persons who have visited live music concerts in the last 12 months ×
Percentage of persons who have visited classical concerts in the last 12 months ×
Percentage of persons who have visited pop rock concerts in the last 12 months ×
Percentage of persons who have visited other concerts in the last 12 months ×
Percentage of persons who have visited other kind of actual music concerts in the last 12 months by type of concert
×
Percentage of persons who have viewed direct broadcast outside home of cultural performances in the last 12 months
×
Percentage of persons who have listened or viewed recordings of artistic performances ×
Percentage of persons who have listened or viewed recordings of theatres in the last 12 months ×
Percentage of persons who have listened or viewed recordings of opera performances in the last 12 months ×
Percentage of persons who have listened or viewed recordings of ballet/dance performances in the last 12 months
×
Percentage of persons who have listened or viewed recordings of classical concerts in the last 12 months ×
Percentage of persons who have listened or viewed recordings of pop rock concerts in the last 12 months ×
Percentage of persons who have listened or viewed recordings of other concerts in the last 12 months ×
ARCHITECTURE, VISUAL ARTS AND CRAFTS
Percentage of persons who have done at least one artistic activity among those listed in Q6 in the last 12 months ×
Percentage of persons who have painted or have drawn ×
Percentage of persons who have made photographs ×
Percentage of persons who have practiced other visual art activity (making pottery, restoration..) ×
Percentage of persons who were member of an association, a club or a group of amateur artists or craftsmen in the last 12 months ×
Percentage of persons who presented own work in an exhibition in the last 12 months ×
Percentage of persons who followed lessons for their artistic or creative activity in the last 12 months ×
Percentage of persons who uploaded images of their work on the internet in the last 12 months ×
Percentage of persons who viewed paintings, drawings, graphical works, photos, and sculptures, products of crafts or virtual exhibitions of visual arts or crafts (on the internet or other media) in the last 12 months
×
Percentage of persons who view or listen to a programme about visual arts and crafts in the last 12 months ×
HERITAGE
Percentage of persons who were member of a cultural association (among those listed in Q10) in the last 12 months ×
Percentage of persons who did voluntary work for a cultural association (among those listed in Q10) in the last 12 months ×
Percentage of persons who have visited museums and publics galleries in the last 12 months ×
(61)This indicator can be calculated using the set of items in Q1 of the module questionnaire or with a single question asking if the respondent participated in at least one of the activities listed in Q1.

ESSnet‐CultureFinalReport
- 262-
Percentage of persons who have visited museums and publics galleries in the last 12 months by type ×
Percentage of persons who have visited monuments, archaeological sites in the last 12 months ×
Percentage of persons who have visited monuments, archaeological sites in the last 12 months by type ×
Percentage of persons who have viewed virtual exhibitions of art or any kind of museum objects in the last 12 months
×
Percentage of persons who have viewed monuments, historical or artistic places, buildings or sites (on the internet or other media) in the last 12 months
×
Percentage of persons who have viewed or listened to a programme about museums (on television, radio, video, DVD, internet or other media) in the last 12 months
×
Percentage of persons who have viewed or listened to a programme about monuments, historical or artistic places, buildings or sites (on television, radio, video, DVD, internet or other media) in the last 12 months
×
BOOKS AND PRESS
Percentage of persons who wrote poetry, prose, fiction or non-fiction in leisure time in the last 12 months ×
Percentage of households with no books at home ×
Percentage of persons who have read books in the last 12 months (both printed or ebooks) ×
Percentage of persons who have read books printed book in the last 12 months ×
Percentage of persons who have read books in digital form in the last 12 months ×
Percentage of persons who have read books in the last 12 months by kind of books read ×
Percentage of persons who have read between 1-3 books in the las t 12 months ×
Percentage of persons who have read between 4-6 books in the last 12 months ×
Percentage of persons who have read more than 6 books in the last 12 months ×
Percentage of persons who read newspapers at least once a week ×
Percentage of persons who read magazines and periodicals at least once a month ×
Percentage of persons who read online newspapers at least once a week ×
Percentage of persons who read magazines and periodicals online at least once a month ×
ARCHIVES AND LIBRARIES
Percentage of persons who have visited an archive in the last 12 months ×
Percentage of persons who have consulted archival records online in the last 12 months ×
Percentage of persons who have visited libraries or have accessed libraries via Internet in the last 12 months ×
Percentage of persons who have visited libraries in the last 12 months ×
Percentage of persons who have accessed libraries via Internet in the last 12 months ×
FILM & VIDEO
Percentage of persons who have made at least one film or one video as an artistic hobby in the last 12 months
×
Percentage of persons who followed lesson for film or video making in the last 12 months ×
Percentage of persons who have visited cinemas in the last 12 months ×
Percentage of persons who watch videos al least once a week ×
Percentage of persons who downloaded films from the Internet ×
RADIO, TELEVISION AND INTERNET Average time spent listening to the radio in the average week ×
Average time spent listening to the radio via Internet in the average week ×
Average time spent watching television in the average week ×
Average time spent watching television via Internet in the average week ×
Average time spent on the Internet in the average week ×
Average time spent on social network in the average week ×
Percentage of persons who designed something for the Internet in the last 12 months ×
All these indicators could be analised by background characteristics of the person, using the core social variable foreseen to be implemented in all European social surveys, in particular: age, gender, country of citizenship/country of birth, educational attainment, employment status, income, degree of urbanization.

ESSnet‐CultureFinalReport
- 263-
8.4. Comprehensive questionnaire of cultural practices
A. PERFORMING ARTS
Amateur practices Q1. Have you done any of the following activities as a hobby during the past 12 months?
Once a week or
more often
2 or 3 times a month
Once a month or less
Never
Acted in a theatre play 1 □ 2 □ 3 □ 4 □ Directed a theatre play 1 □ 2 □ 3 □ 4 □Performed as a stand-up comedian 1 □ 2 □ 3 □ 4 □Sung in a choir, a vocal ensemble, opera/operetta/musical troupe, pop- or rock band, rapped 1 □ 2 □ 3 □ 4 □
Played a musical instrument 1 □ 2 □ 3 □ 4 □Composed music or performed as DJ 1 □ 2 □ 3 □ 4 □ Danced (ballet or modern dance, ballroom dance, Latin American dance, jazz dance, hip hop, break dance, street dance, folk dance)
1 □ 2 □ 3 □ 4 □
Did choreography for a dance performance 1 □ 2 □ 3 □ 4 □
Social participation/ volunteering
Q2. During the last 12 months…
Yes No
Did you voluntary work for your company, ensemble or group? (This also includes taking care of logistics, requisites, costumes, lights, sound etc.) 1 □ 2 □
Did you follow lessons for your activity? 1 □ 2 □
Did you upload either your own performance or performance of your company, ensemble or group on the internet? 1 □ 2 □
Attending/ receiving
Q3. How often did you visit one of the following performances in your own country or abroad (including festivals and other events) during the last 12 months?
More
than 12 times
7-12 times
4-6 times
1-3 times Never
A theatre play 1 □ 2 □ 3 □ 4 □ 5 □ A cabaret, or a stand-up comedy 1 □ 2 □ 3 □ 4 □ 5 □ A ballet or a modern dance 1 □ 2 □ 3 □ 4 □ 5 □ A concert of classical music 1 □ 2 □ 3 □ 4 □ 5 □ An opera 1 □ 2 □ 3 □ 4 □ 5 □ A musical 1 □ 2 □ 3 □ 4 □ 5 □ A pop or rock concert 1 □ 2 □ 3 □ 4 □ 5 □A jazz or blues concert 1 □ 2 □ 3 □ 4 □ 5 □A folk music concert 1 □ 2 □ 3 □ 4 □ 5 □A world music concert 1 □ 2 □ 3 □ 4 □ 5 □A concert or a party of urban (rap, hip-hop) 1 □ 2 □ 3 □ 4 □ 5 □ A dance feast or a house party 1 □ 2 □ 3 □ 4 □ 5 □

ESSnet‐CultureFinalReport
- 264-
A concert of popular national or local music 1 □ 2 □ 3 □ 4 □ 5 □ A concert of a singer/songwriter or a chansonnier 1 □ 2 □ 3 □ 4 □ 5 □ A concert of other music 1 □ 2 □ 3 □ 4 □ 5 □ Q4. How often did you view direct broadcast outside home (for instance in open air, a cinema, a public library or another venue) during the last 12 months of:
More
than 12 times
7-12 times
4-6 times
1-3 times Never
A theatre play 1 □ 2 □ 3 □ 4 □ 5 □A cabaret, or a stand-up comedy 1 □ 2 □ 3 □ 4 □ 5 □A ballet or a modern dance 1 □ 2 □ 3 □ 4 □ 5 □A concert of classical music 1 □ 2 □ 3 □ 4 □ 5 □ An opera 1 □ 2 □ 3 □ 4 □ 5 □ A musical 1 □ 2 □ 3 □ 4 □ 5 □ A pop or rock concert 1 □ 2 □ 3 □ 4 □ 5 □ A jazz or blues concert 1 □ 2 □ 3 □ 4 □ 5 □ A folk music concert 1 □ 2 □ 3 □ 4 □ 5 □ A world music concert 1 □ 2 □ 3 □ 4 □ 5 □A concert or a party of urban (rap, hip-hop) 1 □ 2 □ 3 □ 4 □ 5 □A dance feast or a house party 1 □ 2 □ 3 □ 4 □ 5 □A concert of popular national or local music 1 □ 2 □ 3 □ 4 □ 5 □A concert of a singer/songwriter or a chansonnier 1 □ 2 □ 3 □ 4 □ 5 □ A concert of other music 1 □ 2 □ 3 □ 4 □ 5 □ Q5. How often, in the last 12 months, did you view and/or listen to the recordings of:
Every day or almost every
day
Few times a week
Few times a month
Less than once a month Never
Theatre plays 1 □ 2 □ 3 □ 4 □ 5 □Cabarets, or a stand-up comedies 1 □ 2 □ 3 □ 4 □ 5 □Ballets or a modern dance 1 □ 2 □ 3 □ 4 □ 5 □Classical music 1 □ 2 □ 3 □ 4 □ 5 □Opera 1 □ 2 □ 3 □ 4 □ 5 □Musical 1 □ 2 □ 3 □ 4 □ 5 □ Pop or rock 1 □ 2 □ 3 □ 4 □ 5 □ Jazz or blues 1 □ 2 □ 3 □ 4 □ 5 □ Folk music concert 1 □ 2 □ 3 □ 4 □ 5 □ World music 1 □ 2 □ 3 □ 4 □ 5 □ Urban (rap, hip-hop) 1 □ 2 □ 3 □ 4 □ 5 □Dance or house 1 □ 2 □ 3 □ 4 □ 5 □Popular national or local music 1 □ 2 □ 3 □ 4 □ 5 □A singer/songwriter or a chansonnier 1 □ 2 □ 3 □ 4 □ 5 □Other music 1 □ 2 □ 3 □ 4 □ 5 □

ESSnet‐CultureFinalReport
- 265-
B. ARCHITECTURE, VISUAL ARTS AND CRAFTS
Amateur practices
Q6. Have you done any of the following artistic or creative activities as a hobby during the past 12 months?
Once a week or more often
2 or 3 times a month
Once a month or less Never
Made paintings, drawings, graphical works (by hand) 1 □ 2 □ 3 □ 5 □
Made photographs as an artistic hobby (excluding family and/or holiday pictures)
1 □ 2 □ 3 □ 5 □
Made sculptures 1 □ 2 □ 3 □ 5 □ Made pottery, glass 1 □ 2 □ 3 □ 5 □ Made jewels 1 □ 2 □ 3 □ 5 □ Made textile works 1 □ 2 □ 3 □ 5 □
Social participation/ volunteering
Q7. During the last 12 months…
Yes No
Were you a member of an association, a club or a group of amateur artists or craftsmen? 1 □ 2 □ Did you voluntary work for this association, club or group? 1 □ 2 □
Did you present – alone or with others - own work in an exhibition? 1 □ 2 □Did you follow lessons for your artistic or creative activity? 1 □ 2 □Did you upload images of your work on the internet? 1 □ 2 □
Attending/ receiving (F
62F
)
Q8. During the last 12 months…
More than
12 times
7-12 times
4-6 times
1-3 times Never
Did you view paintings, drawings, graphical works, photos, and sculptures, products of crafts or virtual exhibitions of visual arts or crafts (on the internet or other media) ?
1 □ 2 □ 3 □ 4 □ 5 □
Did you view or listen to a programme about visual arts and crafts (on television, radio, video, DVD, internet or other media) during the last 12 months?
1 □ 2 □ 3 □ 4 □ 5 □
(62) Questions on visits see under Heritage

ESSnet‐CultureFinalReport
- 266-
C. HERITAGE
Amateur practices
Q9. During the last 12 months…
Once a week
or more often
2 or 3 times a month
Once a month or less
Never
Did you collect any kind of objects as a hobby? 1 □ 2 □ 3 □ 4 □ Did you search in archives and/or online for genealogical or historical records?
1 □ 2 □ 3 □ 4 □
Did you conduct excavations yourself and/or participate in excavations conducted by professional or other amateur archaeologists?
1 □ 2 □ 3 □ 4 □
Social participation/ volunteering
Q10. During the last 12 months…
Yes No
Were you a member of an association, a group or a club, which supports museum(s)? 1 □ 2 □Were you a member of a historical or genealogical association, club or group? 1 □ 2 □Were you a member of an association, club or group for preservation of monuments and heritage?
1 □ 2 □
Did you voluntary work for or donated to a museum? 1 □ 2 □Did you voluntary work for or donated to a historical or genealogical association, club or group? 1 □ 2 □
Did you voluntary work for or donated to of an association, club or group for preservation of monuments and heritage? 1 □ 2 □
Attending/receiving
Q11. During the last 12 months?
More than
12 times
7-12 times
4-6 times
1-3 times Never
Did you visit a museum in your own country or abroad? 1 □ 2 □ 3 □ 4 □ 5 □
Did you visit galleries or exhibitions in your own country or abroad?
1 □ 2 □ 3 □ 4 □ 5 □
IF YES…
Q12. What kind of museums, galleries or exhibitions did you visit? (Tick all that apply) Art Archaeology and history Natural history and natural science Science and technology Ethnography and anthropology General, mixed Other

ESSnet‐CultureFinalReport
- 267-
Q13. During the last 12 months…
More than
12 times
7-12 times
4-6 times
1-3 times Never
Did you visit monuments, historical or artistic places, famous buildings or archaeological sites in your own country or abroad? 1 □ 2 □ 3 □ 4 □ 5 □
IF YES…
Q14. What kind of monuments, places, buildings or sites did you visit? (Tick all that apply)
Historic sites (old quarter, monumental city etc.) Monumental and/or famous buildings Archaeological sites Cultural itinerary Other
Q15. During the last 12 months…
More
than 12 times
7-12 times
4-6 times
1-3 times Never
Did you visit an archive your own country or abroad? 1 □ 2 □ 3 □ 4 □ 5 □ Did you consult archival records online? 1 □ 2 □ 3 □ 4 □ 5 □Did you view virtual exhibitions of art or any kind of museum objects (on the internet or other media)? 1 □ 2 □ 3 □ 4 □ 5 □
Did you view monuments, historical or artistic places, buildings or sites (on the internet or other media)? 1 □ 2 □ 3 □ 4 □ 5 □
Did you view or listen to a programme about museums (on television, radio, video, DVD, internet or other media)?
1 □ 2 □ 3 □ 4 □ 5 □
Did you view or listen to a programme about monuments, historical or artistic places, buildings or sites (on television, radio, video, DVD, internet or other media) during the last 12 months?
1 □ 2 □ 3 □ 4 □ 5 □
D. BOOKS AND PRESS
Amateur practices
Q16. During the last 12 months…
Once a week or
more often
2 or 3 times a month
Once a month or less
Never
Did you write any poetry, prose, fiction or non-fiction in your leisure time? 1 □ 2 □ 3 □ 4 □
Did you have a blog or an own website on the internet? 1 □ 2 □ 3 □ 4 □

ESSnet‐CultureFinalReport
- 268-
Social participation/ volunteering
Q17. During the last 12 months…
Yes No
Were you a member of an association, a group or a club of (amateur) writers or journalists?
1 □ 2 □
Did you follow lessons on (creative) writing? 1 □ 2 □ Did you send at least one letter to the editor of a newspaper or a magazine? 1 □ 2 □ Did you publish your own work on paper? 1 □ 2 □ Did you publish own work in whatever form on the internet (thus including weblogs, e-zines and other internet publications)? 1 □ 2 □
Did you attend a reading circle or a book club? 1 □ 2 □Did you participate in a reading circle or a book club on the internet? 1 □ 2 □ Q18. Approximately, how many books do you have at home?
None 1-25 26-50 51-100 101-200 201-400 More than 400
Attending/receiving
Q19. During the last 12 months…
Yes No
Did you read a printed book in your leisure time? 1 □ 2 □
Did you read a book in digital form (i.e. on the internet, downloaded from the internet) in your leisure time? 1 □ 2 □
IF YES…
Q20. Which kind of books did you read? (tick all that apply) Literature & Novels Science Fiction & Fantasy Mystery & Thrillers History Biographies Health, Mind & Body Other kind of boos

ESSnet‐CultureFinalReport
- 269-
Q21. How many books, approximately did you read? |_|_|
At least
five times a week
Every week or almost
every week
Few times a months
Once a months
Less often
Never
Do you read printed magazines and/or periodicals in your leisure time? 1 □ 2 □ 3□ 4 □ 5 □ 6 □
Do you read magazines and/or periodicals in digital form (i.e. on the internet, downloaded from the internet) in your leisure time?
1 □ 2 □ 3 □ 4 □ 5 □ 6 □
Do you read printed newspapers? 1 □ 1 □ 2 □ 3 □ 4 □ 5 □
Do you read newspapers in digital form (i.e. on the internet, downloaded from the internet)?
1 □ 2 □ 3 □ 4 □ 5 □ 6 □
E. LIBRARIES
Social participation/volunteering Yes No
Did you voluntary work for a library during the last 12 months? 1 □ 2 □
Attending/receiving Q22. During the last 12 months…
F. FILM AND VIDEO
Amateur practices
Once a week or
more often
2 or 3 times a month
Once a month or less
Never
Did you make at least one film or one video as an artistic hobby (thus excluding family and holidays films or videos) during the last 12 months?
1 □ 2 □ 3 □ 4 □
More than
12 times
7-12 times
4-6 times
1-3 times Never
How often did you visit a library in your own country or abroad? 1 □ 2 □ 3 □ 4 □ 5 □
How often did you visit a library online and/or search for literature and other material available in a library on the internet?
1 □ 2 □ 3 □ 4 □ 5 □

ESSnet‐CultureFinalReport
- 270-
Social participation/ volunteering Q23. During the last 12 months…
Yes No
Were you a member of an association, group or club that makes films or videos (including video clips)? 1 □ 2 □
Did you voluntary work for or donated to such association, group or club? 1 □ 2 □Did you follow lesson for film or video making? 1 □ 2 □Did you show own film(s) or video(s) to an audience? 1 □ 2 □Did you uploaded own film(s) or video(s) or films or video of the association, group or club you are a member of on the internet?
1 □ 2 □
Attending/ receiving
More than
12 times
7-12 times
4-6 times
1-3 times Never
Did you go to the cinema or a film festival in your own country or abroad during the last 12 months? 1 □ 2 □ 3 □ 4 □ 5 □
Every day
or almost every day
Few times a week
Few times a month
Less than once a month
Never
Do you watch films on television, video, DVD or other media?
1 □ 2 □ 3 □ 4 □ 5 □
Do you download films from the internet? 1 □ 2 □ 3 □ 4 □ 5 □
G. RADIO, TELEVISION AND INTERNET
Attending/ receiving Q24. On an average week day how long:
Hours Minutes
Do you listen to radio (at your home, in your car or elsewhere)? |_|_| |_|_|Do you listen to internet radiobroadcasts (using PC, mp3 player, mobile phone or other media)? |_|_| |_|_|
Do you watch television? |_|_| |_|_|Do you watch internet television broadcasts (using PC, mp3 player, mobile phone or other media)?
|_|_| |_|_|
Do you use internet during your leisure time? |_|_| |_|_|

ESSnet‐CultureFinalReport
- 271-
Amateur practices Q25. During the last 12 months…
Once a week or
more often
2 or 3 times a month
Once a month or less
Never
Did you design anything for the internet – i.e. a website, a game, or a blog – as a hobby?
1 □ 2 □ 3 □ 4 □
Social participation/ volunteering Q26. On an average week day how long:
Hours Minutes
Do you use the social media such as Facebook, My Space, LinkedIn, or Twitter?
|_|_| |_|_|
9. Culture and civil society Most of cultural practices - such as visits to cultural venues, or amateur practices - have a clear social character. When we speak about the social aspects of culture, however, we do refer to this aspect of cultural participation or the correlation between cultural preferences and demographic characteristics, such as age, gender or educational attainment, but to the social impact of cultural practices in general, and the contribution these practices can render to the civil society in particular. Helmut Anheier defines civil society as ‘the sphere of institutions, organisations and individuals located between the family, the State and the market, in which people associate voluntarily to advance common interests’. (Anheier, 2004: 22) Robert Putnam distinguishes two functions of the social networks which make up the civil society: bonding (maintaining and strengthening existing social relations) and bridging (establishing new social relations that did not exist before) (Putnam, 2007). As many European countries are facing the challenge to integrate large immigrant communities into the society, the second function - bridging - became very timely and relevant. As highlighted in the European Agenda for Culture in a Globalizing World, published in 2007, the European Commission expects that culture can fulfil such function and thus contribute to the task of integration. On the occasion of the publication of this Agenda, the President of the Commission, José Manuel Barroso, declared that culture is an important driver, not only of personal development, but also of social cohesion and intercultural dialogue(63). Many policy documents published by the Commission or different EU Council committees since then have repeated the expectation that cultural activities can contribute to what is called ‘inclusive growth’: social cohesion and community development, intercultural dialogue and cultural diversity, as well as participation of all citizens in the social, cultural and economic life.
(63) Toute première stratégie européenne de la culture: contribuer à la croissance économique et la compréhension interculturelle, Europa Press releases Rapid, 10 mai 2007.

ESSnet‐CultureFinalReport
- 272-
The results of some national surveys do indeed indicate that cultural participation could have a positive social impact. A Flemish study of the relation between social and cultural participation discovered that people who frequently visit cultural venues were less ethnocentric and more tolerant than the rest of the population (Claes, Elchardus and Vandenbroeck, 2007). The beneficial effect of cultural participation on tolerance was confirmed in a German sample survey on cultural participation of the youth. Young people in Germany who were interested in traditional culture appeared not only to be more tolerant and more open to non-western cultures, but also more interested in current social and political developments than their peers (Keuchel and Wiesand, 2006:161). A Dutch PhD thesis found that cultural participation has more capacity to bind people with diverse backgrounds, and subsequently is better at bridging, than sports (Van der Meulen, 2007: 123). In spite of these few indications, the social impact of cultural practices is still a terra incognita because hardly any empirical research has been done to compare the social impact of cultural participation to that of other voluntary social activities. The empirical evidence for the alleged contribution of culture to inclusive growth is missing until now. Ongoing European surveys offer opportunities to put expectations about this contribution to a test. The new ad-hoc module of EU-SILC, planned for 2014, seems especially suit for such a test. Provided that the so called ‘input harmonization’ is used in this survey; the data collections modes are harmonized as much as possible; and the questions on cultural practices are well-chosen (including not traditional, but also popular culture as well as amateur practices) the results of this survey would not only allow a comparison of social impact of cultural practices with that of other social and civic activities, but also make it clear if and how these practices contribute to the aims of the European cultural policy, such as the advancement of social cohesion, community development, intercultural dialogue or cultural diversity.

ESSnet‐CultureFinalReport
- 273-
10. Conclusions and recommendations As already mentioned in this report, there is a growing political interest all over Europe in understanding the connection between well-being and progress of societies. This implies questions of democracy, equity, civil society, social capital and people’s opportunities to participate in the society in general, and policy measures which could be put in place to foster societal progress in particular.
1) Since cultural practices are an important part of well-being, ESSnet-Culture
strongly support the recommendation already included in the LEG-Culture report, namely to start ‘a common European survey on participation in cultural activities to be repeated periodically, for instance every five years’. The questionnaire of the survey could be included within a survey covering also sports, social and civic participation. If repeated periodically such a survey will be the best way to measure social progress in the EU. The participants and members of Task Force 4 realise that such a large survey can not be implemented in a near future. Nevertheless a pilot project could be carried out by a limited number of interested Member States with the support of the European Commission
The patterns of cultural practice have changed considerably. The distinction between ‘high-brow’ and ‘low-brow’ arts and culture has lost its significance as the traditional ‘cultural elite’ - i.e. people from higher social strata nowadays also participate in popular cultural forms and ‘high culture’ is more easily available thanks to new technologies. The crucial distinction, therefore, is not between elite and mass but rather between cultural omnivores and cultural univores. Technical innovations, in particular the rise in information and communication technology, make this picture even more complex. The Internet has not only opened new venues for professional and amateur artists; it also created a new world-wide forum for lovers, fans and admirers of cultural and artistic styles or movements as well as of individual artists. Irrespective of how exceptional one’s cultural preferences may be, one will always find kindred souls on the Internet who share one taste and who he or she can join. Research on cultural practices should take such changing patterns into consideration. The changes are not restricted to visits of cultural manifestations and media habits, but have bearing on all activities connected with cultural participation. The ICET-model (information, communication and community, enjoyment and expression, transaction) developed by Jos de Haan and Andries van den Broek seems very well suited for the study of changing cultural practices.
2) ESSnet-Culture recommends including the ICET model in the national
surveys on cultural participation in order to test it. ESSnet-Culture hope that a number of Member States would be prepared to carry out this experiment and that the European Commission could support it

ESSnet‐CultureFinalReport
- 274-
European surveys on participation in cultural activities conducted until now did not yield reliable and comparable results. The results of the Eurobarometer systematically overestimated the national ones in many countries. The so called ‘output harmonization’ applied in the EU-SILC and in the AES brought about many implausible results. In particular, the lack of phrasing the questions in an identical manner, has an impact on the findings and the across country comparisons. To achieve comparable results, the wording of questions is a crucial issue. The translation of a model questionnaire (usually formulated in English and/or French) should be done with the outmost care. Data collection modes used in the different Member States should be harmonized as much as possible. Computer-Assisted Personal Interviews (CAPI) should preferably be used, eventually in combination with Computer-Assisted Telephone Interviews (CATI). The sample should be representative of the whole population, ideally from the age of six years and older. The sample should be large enough to allow analysis of specific target groups. Theoretically, all Eurostat core social variables should be covered: gender, age, country of birth, country of citizenship, legal marital status, de facto marital status, household composition, country of residence, region of residence, degree of urbanisation, status in employment, occupation in employment, economic sector, highest level of education and net monthly income. As the statistical representation of all these groups will require a very large sample and thus will be very expensive, the possibilities to conduct such a survey of cultural participation will be rather limited. It is therefore more realistic to expect a smaller sample (about 5,000 respondents at its best) and therefore limited possibilities for analysis. National surveys of cultural practices show that gender, age, educational attainment and - sometimes - degree of urbanisation are the most important variables to explain patterns of cultural participation.
3) The new ad-hoc module of EU-SILC, which is planned for 2014, offers a new
chance for the collection of reliable and comparable data on cultural and social participation in the European Union. To ensure reliability and comparability, ESSnet-Culture recommends (1) using ‘input harmonization’ in this survey, (2) harmonizing the data collection modes used in Member States and (3) involving the TF4 experts in the preparation of this survey
In 2009, the report Stiglitz-Sen-Fitoussi presented tracks to improve the measurement of the economic growth and to correct the deficiencies of the Gross Domestic Product. With the reason that the economic indicators cannot measure everything, the authors of the report preached the development of a series of indicators having in common to focus on the measurement of the ‘well-being’ in the economic statistics. This question of the development of social indicators is not new, it appears as of the Sixties with the will to counterbalance the influence of the economic quantification on the public decision. Put at evil by the economic crises of 1974 and 1979, the question of the social indicators or of the ‘well-being’ re-emerges during the last decade, and integrates the question of the environment into the more traditional questions of education, health or work. Whereas the importance of culture for the society is recalled constantly through university work or political discourses, it is paradoxical to observe the absence of the question of the culture in the creation of social indicators or those on well-being.

ESSnet‐CultureFinalReport
- 275-
Pionner in the installation of a true regional survey on cultural practices (see 2001 and 2002 Eurobarometer surveys on the cultural participation), and rich of the tools at its disposal and the expertise of its working groups dedicated to cultural practices, Europe has the means of thinking of the integration of culture in the social indicators, as well as the environment or tourism. For example, it would be possible even to think of the creation of a ‘synthetic indicator of cultural behavior’ which could in particular explain the commitment in so-called ‘traditionnal’ cultural practices like the reading, the practices as an amateur of artistic activities or the visits to cultural equipment. At the European level, this indicator would bring the tools necessary to draw up a chart of the global behaviors (and thus to carry a new lighting on the geographical differences upposed between north and south, west and east) and to follow in time the global evolution of the traditional cultural practices. This synthetic indicator would be based on the results of a future survey or a specific module to the cultural practices within the EU-27, renewed at regular intervals.
4) The ESSnet-Culture recommends to integrate the question of culture in the
European works on the development of social and well-being indicators and to continue the research on cultural indicators carried out by the TFs of the LEG-Culture, of Eurostat and of the ESSnet-Culture
The list of indicators on cultural participation formulated in this report can be used to compare cultural practices in different European countries. However, the demographic composition of the 27 Member States varies considerably. It makes therefore little sense to compare the population of the Member States as a whole. The comparison could be focused on comparable groups within the population; for instance people with the same level of educational attainment. As far as research of cultural practices of the population is concerned, there are hardly any alternatives for a nation wide sample survey. Statistics on visits to cultural venues and manifestations - and especially frequency - could provide relevant information about the development of cultural practices in a country. However many problems have to be solved to make these statistics comparable within the EU. One of the major problems is harmonization of national definitions and concepts. The experience of the European Group on Museum Statistics - that among other things tries to harmonize figures on museum visits in Europe - shows that this is anything but an easy task. The meeting of the EU Council on Education, Youth, Culture and Sport, held in Brussels on 19th and 20th May 2011, adopted a number of conclusions regarding the contribution of culture to the implementation of the Europe 2020 strategy. These conclusions are relevant for the ESSnet-Culture in general and for Task Force 4 in particular. The Council not only underlines the important role of cultural and creative industries for economic growth in Europe but also stresses the importance of culture for so called inclusive growth: ‘Culture can contribute to inclusive growth through promoting intercultural dialogue in full respect for cultural diversity. Cultural activities and programmes can strengthen social cohesion and community development as well as enable individual or a community to fully engage in the social, cultural and economic life’. Member States and the Commission are invited to ‘deploy the statistical framework being developed by ESSnet-Culture with a view to producing reliable, comparable and up-to-date

ESSnet‐CultureFinalReport
- 276-
information on the social and economic impact of culture and work on future priorities on the basis of recommendations issued by ESSnet-Culture’. Social research can answer the question if - and under which conditions - cultural activities do indeed strengthen social cohesion and contribute to community development. One must therefore hope that the Commission and many Member States will follow the invitation of the Council. That will - inter alia - substantially increase the possibilities for research of cultural practices at European level.

ESSnet‐CultureFinalReport
- 277-
PART II. SPECIFIC DEVELOPMENTS
This section brings together contributions from specialists (researchers, sociologists, statisticians etc.), as well as research work aiming to enrich the work of the ESSnet-Culture project, and to shed light on a particular subject, theme or domain.
The contributions in this second part are direct extensions of the work led by the four Task Forces that was presented in the first part of the report.


ESSnet‐CultureFinalReport
- 279-
REVIEW OF THE CULTURAL DOMAINS
The following paragraphs deal with sectoral approaches to cultural domains and summarize the content of each domain, the available sources to measure it and the detailed statistical codes embracing it. Data on cultural sectors are often missing due to the insufficient coverage of cultural sectors by surveys as well as the lack of coverage of non-market activities that are quite important in some cultural domains (in particular in performing arts). As such other sources were sought, taking into account their limitations in terms of scope, quality, regularity and comparability. The ten following domains are included in the scope of the ESSnet-Culture framework: Heritage, Archives, Libraries, Books & Press, Visual Arts, Performing Arts, Audiovisual & Multimedia, Architecture, Advertising, Art Crafts. The following chapters review each of the ten domains, firstly by defining their cultural content and secondly by listing the possible classifications (mainly economic ones, for activities, products and employment) used for collecting data on the cultural domain; and thirdly by summarising the relevant existing sources to illustrate the domain with comparable and regular data collected in the EU-27. The cultural domain, which consists of a set of practices, activities or cultural products centred on artistic expressions, is difficult to define, especially since one domain can combine several types of artistic expression. In this context of statistical methodological work, it would seem impractical to wait for detailed academic definitions and ask questions such as ‘what is a book?’. Whether a codex book better corresponds to a definition of a book than a digital pad or an Internet screen is very interesting for sociological issues of analysis on uses, but quite irrelevant for our statistical objective. Furthermore, text is only attached to format (printed paper, screen-images, animated publication etc.) for its layout and for the skills required to create it (literary skills, web skills, journalistic skills, graphical skills etc.): format is not essential for measuring the product as long as that product is incorporated within the framework and classifications. And of course, our reasoning includes new forms of books such as e-book. The question of definition is legitimate for measuring cultural practices, for which formats may have consequences on uses. And, supposing it was easy and relevant, what would be the advantage of defining a book by listing for instance the genres considered as cultural books (fiction but not educational books? etc.) knowing that the economic measure is bound by the existing classifications and sources? The museums’ case, thoroughly considered by the EGMUS(64) group, shows that definitions among European countries vary widely and that methodologies are influenced by national particularities. (64) ‘Notwithstanding the agreement on definitions, the presentation of the data itself still requires quite a lot of explanatory remarks. The source of these data, national statistics and surveys, still vary considerably. The main reason for these differences are differences in the scope of these sources. For instance, some national statistics only cover museums which are financed by the state, or professionally-run, while other statistics omit certain aspects of the museums such as staff, income or expenditure’. (EGMUS, Definitions & Explanations), http://www.egmus.eu

ESSnet‐CultureFinalReport
- 280-
Given these considerations and questions, a pragmatic approach is set up to define each cultural domain: this method favors the use of the structural framework, crossing each domain with each of the six functions, in order to structure cultural sectoral activities.
Only the economic functions are used for the description of the theoretical activities, mainly because it consists in a coherent dimension of the cultural framework that is measurable with the existing statistical classifications. This economic approach follows a practical method as well as the requested one for producing data. Nevertheless, the social dimension is well included in the ESSnet-Culture cycle but is analysed in depth by the Task Force ‘Cultural practices and social participation’. This is the same for consumption which was treated by the Task Force ‘Financing and expenditure’. As for employment, some data illustrates the domains but the comprehensive report on cultural employment is valued by the Task Force ‘Cultural industries’.
The content of each domain is therefore rooted in the cultural activities put into practice for creating cultural products, goods or services - for producing, disseminating and preserving them. The importance of functions vary from one domain to another, some activities may be lacking because of the inner characteristics of the domain, for instance creation is missing from the heritage domain whose feature is above all to identify and protect for the transmission of past creations to future generations. Interdisciplinary activities – in education, administration, regulation and financing - fit into any domain, they would be quoted as being necessary and therefore integrated in any domain. The content of each cultural domain is reviewed on Table – ESSnet framework on culture: cultural activities (see chapter ‘Framework for cultural statistics and definition’). After describing its content, the connection with statistical classifications gives a list of the technical scope to be used for collecting data on each domain. In the absence of an ad hoc nomenclature for culture, it is necessary to use the available classifications, mainly the Statistical Classification of Economic Activities in the European Community NACE Rev.2 (2008). The Statistical Classification of Products by Activity in the European Economic Community (CPA, with a 6-digit level) is proposed as a major tool for measuring cultural activities. The CPA is relevant for the knowledge of the NACE’s content, even if the details of the CPA are yet too limited when they refer to cultural goods and services. Moreover the approach is more product-oriented and less precise with services. To conclude, most available data sources do not provide data at this level of detail, therefore CPA categories cannot be measured in practice. Other European classifications may also be used for: foreign trade (Combined Nomenclature, CN), occupations (International Standard Classification of Occupations, ISCO), consumption (Classification of Individual Consumption by Purpose Adapted to the Needs of Harmonized Indices of Consumer Prices, COICOP/HICP) etc. For each domain, the availability of classifications is set out in relation to its contents, its limits and its potential uses. Only classification codes linked with services or products directly issued from the cultural activities of the domain are kept. Essentially, each part aims

ESSnet‐CultureFinalReport
- 281-
at avoiding the issue of overlapping and double counting, as well as expansion towards what would be related to cultural items and would lead to inflated aggregated data.
When the NACE 90.03 ‘Artistic creation’ incorporates individual artists from the visual arts (sculptors, painters, cartoonists, engravers, etchers etc.) and individual writers from Books and Press or Performing arts (authors, composers), this NACE class is only referred to into Visual arts as a domain, which is its main component; the CPA codes 90.03.11 (composers, writers etc.), 90.03.12 (authors, composers) and 90.03.13 (painters etc.) are all described into Visual Arts for simplification;
Some products may have links with a domain but are not its core-items: e.g. the tints
for painters, cameras for photographers, musical instruments for musicians (considered as related) etc. are upstream devices and equipment and as such not core and final goods attached to the cultural domain, which in this case are paintings, photos, songbooks or performance. The ESSnet-Culture position was that the equipment codes do no meet the actual objective of cultural activities included in the framework for cultural statistics. Thus, the field of goods and services do not adopt a broad approach such as, the approach acknowledged by the United Nations Conference on Trade and Development (UNCTAD).
The two functions ‘Education’ and ‘Management/regulation’ have a different status: they are interdisciplinary and they mainly apply to all domains. For instance, educational activities are integrated in the 85.52 class which contains instruction in music as well as in performing arts or visual arts, at least at NACE 4-digit level. In theory, details at the CPA 6-digit level could be found for some educational services (fine arts schools, dancing schools, music schools) but CPA has no sufficient coverage in harmonized surveys. For general public management, the 84.12 class ‘Regulation of the activities of providing health care, education, cultural services and other social services, excluding social security’ requires estimates for the cultural part. And specific management for domains (e.g. management of audiovisual rights, licensing services for music) is most of the time lost in general classes. Chapter on each cultural domain presents the possible sources that can be used for producing statistics. The figures are extracted from recent European sources, they may be commented upon but they are not evaluated by ESSnet-Culture. An emphasis is placed on European harmonized sources which are the official statistics validated by Eurostat and the most easily available ones. They are reliable and better for comparability among European countries. Nonetheless, interests or limits of each European source are summarized, with possible recommendations such as the widening of their scope to cultural sectors. The main harmonized statistical sources at EU-level for cultural statistics are:
Structural Business Statistics (SBS)
The objective of the Council Regulation (EC, Euratom) No 58/97 of 20 December 1996 (and amendments No 295/2008) concerning structural business statistics is to establish a common framework for the collection, compilation, transmission and evaluation of community statistics on the structure, activity, competitiveness and performance of businesses in the community. Indicators include business demographic variables, financial variables (turnover, value added, capital input), labour variables, sectoral concentration and size class breakdown.

ESSnet‐CultureFinalReport
- 282-
Structural business statistics (SBS) cover market-oriented businesses of industry, trade and services. They describe the behaviour (structure, conduct and performance) of businesses across the European Union (EU) - data is available for the EU-27 and for all Member States. The statistics can be broken down to a very detailed sectoral level (several hundred economic activities). A subset of the SBS information is also available for European regions, as well as according to the size of enterprises. The information contained within SBS is therefore more detailed than national accounts (which contain information by branch with a quarterly and an annual frequency). The main indicators within SBS are generally collected and presented as monetary values, or as numbers (for example, numbers of enterprises or persons employed); this is in contrast to short-term business statistics, where the data is presented as indices (generally in relation to a base year of 2005=100). SBS regulations covers all market activities in Sections B to N and P to S of the NACE Rev.2. At present, cultural heritage, archives, libraries, performing arts, artistic creation, art crafts and cultural education are not covered by SBS. With regards to visual arts, photographic creation is integrated among all photographic activities (including laboratories, films processing etc) and requires estimates, just like advertising creation. Thus, data immediately available for cultural activities from NACE Rev.2 concern books and press, audiovisual, architecture and design, as well as retail sale of books, press and music.
Short-Term Statistics (STS)
Short-term business statistics (STS) are defined in the Council regulation (EC) No 1165/98 of 19 May 1998 and its amendment in NACE Rev.2 by the Regulation (EC) No 1893/2006: the series cover the European countries together with totals for the euro area and the EU-27. STS indicators allow the rapid assessment of the economic climate within an economy. STS are a key resource for those who follow developments in the business cycle or for those who wish to trace recent developments within a particular industry, construction or service. STS do not provide information on levels (in other words, the monetary value of output, the number of persons employed etc.), STS indicators provide monthly, quarterly or annual indices for turnover, labour input and producer prices. For STS, the cultural sectors are covered at levels of division. Yet, as said before, only 3 divisions of the 2-digit level NACE Rev.2 are entirely cultural: 59- Motion picture, video and television programme production, sound recording and music publishing activities, 60- Programming and broadcasting activities and 90- Creative, arts and entertainment activities. Unfortunately, division 90 is not integrated in the STS data collection. As such STS is not really operational for cultural activities in general.
European external trade statistics (Comext)
External trade statistics measure the value and quantity of goods traded between the Member States of the European Union (known as intra-EU trade or Intrastat) and goods traded by Member States of the EU with third countries (known as extra-EU trade or Extrastat). They are the official harmonised source of information about imports, exports and trade balance of the EU and its Member States, as well as of the Euro area. One important use of international trade statistics in the majority of countries is to provide a data source for the estimation of those components of the balance of payments and the national accounts which relate to trade in goods.

ESSnet‐CultureFinalReport
- 283-
Statistics on trade between the Member States of the European Union are based on a European Parliament and Council Regulation (EC) No 638/2004 of 31st March 2004 and statistics on the European Union’s trade with non-member countries are based on Council Regulation (EC) No. 1172/95 (consolidated version) of 22nd May 1995. The Comext database offers a breakdown (e.g. size of entreprise) and of the products that are available according to several classifications, not only by CN 8-digit (Comext was first coded by means of the CN) but also by CPA 2008 for instance (allowing the connection with services which is relevant for domains where products are not measurable, for instance activities of performing arts or heritage). However, as CPA is only available at aggregated level and just for service-embedded goods, the results are often broader than just cultural ones. Therefore the measure of flow of cultural goods and services remains within the limits of classifications, as well as the refinement of sources regarding culture. To conclude, these statistics concern only tangible goods and do not include external trade in licences or copyrights, although such intellectual property rights are very important in the literary, musical and audiovisual fields. Unfortunately, data on trade in licences and copyrights is not available, and the balance of payments does not allow a distinction between industrial patents, franchises, copyrights and licences. The three aforementioned European sources, conclusions and recommendations are detailed in a summary of coverage by domain. Other existing harmonized sources (Labour Force, Time Use Survey, Household Budget Survey, Survey on Income and Living Conditions etc.) are not described below because they are conducted by specific analysis. It is important to underline that to quantify the activities of every cultural domain is difficult because the cultural domains are often strictly connected. This is particularly true with employment: on the one hand, some occupations are relevant in several domains, e.g. ‘graphic and multimedia designers’ or ‘other artistic and cultural associate professionals’ belong to several cultural domains. The risk of double counting leads to privilege a global approach rather than a sectoral one. On the other hand, the indicators on employment are of different types: data may be produced for employment on cultural sectors but also for cultural employment. The use of the NACE classes regarding their cultural rank (cultural classes or non cultural classes, see Annex 1 TF1, Table 3 – NACE Rev. 2 economic activities and their cultural rank) need specific analysis that is not done below where only cultural classes are considered. For this reason, an aggregate on cultural employment is proposed, interlinking employment in cultural sectors with employment of cultural occupations outside cultural sectors. Eventually, other questions will need further consideration (see. cultural practices etc). It should be added that the Compendium(65), Compendium of Cultural Policies and Trends in Europe initiated in 1998 by the Council of Europe and the European Institute for Comparative Cultural Research (ERICarts), ‘…helps to inform decision-making processes, to conduct comparative policy research and analyses, to maintain data collections and to disseminate good practice examples’. The ‘Countries’ section of the Compendium website gives information on each country as well as weblinks to national cultural institutions on which national database, yearbooks, research works on cultural domains are accessible.
(65) See Hhttp://www.culturalpolicies.net/web/index.php

ESSnet‐CultureFinalReport
- 284-
To conclude, whenever European sources do not exist, other sources are recommended (national or international) to introduce possible steps to be developed. International sources contain comprehensive statistical data (e.g., the Interactive database of the United Nations Conference on Trade and Development (UNCTAD)(66)). But international sources are often difficult to use for European comparisons, in terms of coverage of cultural domains, or in terms of the units included (selected samples are often based on affiliated members of some international sources), or in terms of geography (missing EU-27 Member States), or in terms of data frequency (irregular surveys or reports).
(66) See http://www.unctad.org/Templates/Page.asp?intItemID=1584&lang=1

ESSnet‐CultureFinalReport
- 285-
1. CULTURAL HERITAGE
The cultural domain of Cultural Heritage consists of museums, historical places and archeological sites. It includes the activities consisting in producing, disseminating and preserving the heritage, as well as the activities of education and management/regulation that are attached. I. These activities mainly cover
o Activities of production for the upkeep of collections for museums and the recognition of the historical feature of places (monuments, sites or buildings).
o The preservation activities are vital for the heritage, whose goal is to preserve for transfer and dissemination.
Preservation activities are especially significant for archeology and for intangible heritage. Archeology is the buried remains of past human activity that need to be studied for the knowledge of human history and heritage. Archeology uses scientific and technical methods (applied research) for studying and preserving. Intangible heritage(67) is considered within the preservation function: it represents the needs for safeguarding as it encompasses all living expressions and traditions that were inherited from our ancestors and that have to be transmitted to our descendants. Included in intangible heritage are languages, as part of the identity of communities
o The interdisciplinary activities of education (that enables creation and is sensitive to cultural activities) and administration as well as the financing activities are the support activities linked to all sectoral domains. The participative side (social participation and cultural practices) represents the final aim for any cultural content.
II. International references and classifications as work tools
o UNESCO, UIS 2009 (p.23)(68): ‘The domain Cultural and Natural Heritage includes the following activities: Museums, Archaeological and Historical Places (including archaeological sites and buildings), Cultural Landscapes, and Natural Heritage. Cultural Heritage includes artifacts, monuments, and groups of buildings and sites that have a diversity of values including symbolic, historic, artistic, aesthetic, ethnological or anthropological, scientific and social significance’.
o UNESCO, Convention 1972(69): ‘The following shall be considered as cultural heritage:
(67) See Intangible heritage by Adolfo Morrone ‘Is it possible to measure intangible cultural heritage: an update of what and where to look for it’, Italian National Statistical Office (ISTAT). (68) See http://www.uis.unesco.org/template/pdf/cscl/framework/FCS_2009_EN.pdf (69) See http://whc.unesco.org/archive/convention-en.pdf

ESSnet‐CultureFinalReport
- 286-
- monuments: architectural works, works of monumental sculpture and painting, elements or structures of an archaeological nature, inscriptions, cave dwellings and combinations of features, which are of outstanding universal value from the point of view of history, art or science;
- groups of buildings: groups of separate or connected buildings which, because of their architecture, their homogeneity or their place in the landscape, are of outstanding universal value from the point of view of history, art or science;
- sites: works of man or the combined works of nature and man, and areas including archaeological sites which are of outstanding universal value from the historical, aesthetic, ethnological or anthropological point of view’. (Article 1)
For measuring cultural heritage, some NACE classes fully cover theses activities: they are the NACE codes related to the museums activities (4-digit class 91.02) and to historical monuments (4-digit class 91.03) - see Table – Cultural domains by statistical activities, NACE Rev.2 (2008).
NACE Rev.2 (2008)
91.02
Class includes operation of museums of all kinds:o Art museums, museums of jewellery, furniture, costumes, ceramics, silverware o Natural history, science and technological museums, historical museums,
including military museums o Other specialized museums o Open-air museums.
91.03 Class includes operation and preservation of historical sites and buildings.
85.52 Class for Cultural Education is interdisciplinary, it covers every cultural domain.
The CPA 2008 level enables the link between cultural activities with official nomenclatures, however, the difficulty is that such detailed levels are often absent from the available sources and are therefore not measurable. For instance, it is irrelevant to include in the domain such activities as ‘47.78 Other retail sale of new goods in specialized stores’ or ‘47.79 Retail sale of second-hand goods in stores’ because it concerns various products and services and not only cultural ones; nonetheless, to quote the CPA level 47.00.68/47.00.69 and 47.00.91 it is relevant as they are linked to cultural heritage. Therefore, the NACE classes 47.78, 47.79, 33.19, 71.20 or 72.19 related to the above mentioned CPA are not considered as cultural but the CPA are quoted to suggest the possible economic measure of cultural heritage products, by improvement of surveys with detailed classification.
CPA
91.02.10 Museum services: Display services of collections of all kinds (art, science and technology, history); Management and conservation services for the collections; Organisation of travelling collection exhibitions.

ESSnet‐CultureFinalReport
- 287-
91.02.20 Museum collections: collections and collectors’ pieces of historical, ethnographic, zoological, botanical, mineralogical, anatomical or numismatic interest.
91.03.10 Operation services of historical sites and buildings, and similar visitor attractions: Operation of, and access and visiting services to historical sites, monuments and buildings; Preservation services for historical sites, monuments and buildings.
47.00.68 Retail trade services of stamps and coins
47.00.69 Retail trade services of souvenirs and arts
47.00.91 * Retail trade services of antiques (incl. retail trade services via auctioning houses)
71.20.19 * Other technical testing and analysis services (certification and authentication of works of art)
72.19.13 * Research and experimental development services in physical sciences
Note: * included products from non cultural activities Several codes such of the International Standard Classification of Occupations (ISCO-08) are considered for the measurement of employment in the Cultural Heritage domain (see details in works of Task Force 3).
o Only one code is strictly attached to the Cultural Heritage domain: 3433-Gallery, museum and library technicians.
o Other ISCO codes are relevant for several cultural domains, e.g. 2621-Archivists and curators, 2622-Librarians and related information professionals, 4411-Library clerks.
Once more, this overlap leads to prefer a general quantitative approach rather than a sectoral one. The ISCO codes are used along the NACE classes for measuring cultural employment, with the NACE classes of the general framework being the basic codes for picking up the cultural jobs. The Combined Nomenclature (CN) is classification of goods used within the EU for the purposes of foreign trade statistics. Some products of the CN 2011 may be used for the Cultural Heritage domain, in particular for museums as they concern collections of products with historical value. However the CN classification’s interest is limited for Cultural Heritage.
Nota bene: the choice is made to maintain under the Visual arts domain the CN codes 9701, 9702 and 9703 (paintings, engravings, sculpture and statuary) which also may include goods of historical value linked to Cultural heritage.
CN - Chapter 97 Works of art, collectors’ pieces and antiques
9705 00 00 Collections and collectors’ pieces of zoological, botanical, mineralogical, anatomical, historical, archaeological, paleontological, ethnographic or numismatic interest
9704 00 00 Postage or revenue stamps, stamp-postmarks, first-day covers, postal stationery (stamped paper), and the like, used or unused, other than those of heading 4907, and if unused, not of current or new issue in which they have, or will have, a recognised face value
9706 00 00 Antiques of an age exceeding 100 years

ESSnet‐CultureFinalReport
- 288-
Just like the CN classification is not relevant for cultural services, the Classification of Individual Consumption by Purpose Adapted to the Needs of Harmonized Indices of Consumer Prices (COICOP/HICP) is too large and does not define services or products of the Cultural Heritage. Chapter 09 ‘Recreation and culture’ from the 2000 COICOP-HBS includes the 4-digit level 09.4.2 for ‘Cultural services’ which groups all the services provided at the same time by television and radio, heritage and photography, as well as services from non-cultural domains (natural heritage and hiring of equipment). IV. Illustrated sources
a) European sources
No harmonized sectoral and economic statistics are available for the domain of Cultural Heritage: the Structural Business Statistics (SBS) and the Short-term business statistics (STS) do not include the 91 NACE Rev.2 code.
Labour statistics
The Labour Force Survey uses the division group of the NACE Rev.2 classification: this level not only aggregates the Cultural Heritage domain with the Libraries and Archives, but also takes into account the non cultural domain of Botanical, zoological, nature reserves.
Table 33 - Number of persons employed in Libraries, archives, museums and other cultural activities by age group, 2009 (in 1,000s)
From 15 to 24 years
From 25 to 24 years
From 50 to 59 years
From 50 to 64 years
65 years or over
EU-27 38.9 345.7 154.2 190.8 :
Scope: Total employment, NACE Rev.2 =91 Source: LFS, Eurostat
External trade
Heritage is more concerned with services than with products, therefore cultural heritage trade is centred on some specific products. For example works of art (paintings, sculptures etc.) are considered among visual arts. The Comext database gives data for EU-27 external trade (imports and exports) with some selected partners (outside EU-27, inside EU-27, USA, China, Brazil), by CN 8-digit with:

ESSnet‐CultureFinalReport
- 289-
Table 34 - EU-27 external trade by CN, Jan-Dec 2009 (value in euros)
Country
Postage or revenue stamps, stamp-
postmarks, first-day covers, postal
stationery, stamped paper and the like, used,
or if unused, not of current or new issue in
which they have, or will have, a recognised face
value
Collections and collector’s pieces of
zoological, biotanical, mineralogical,
anatomical, historical, archeological,
palaentological, ethnographic or
numismatic interest
Antiques of > 100 years old
TOTAL
EU-27_EXTRA IMPORT 31 561 631 334 495 274 244 312 959 610 369 864EXPORT 37 643 645 137 111 226 471 370 916 646 125 787
EU-27_INTRA IMPORT 25 245 896 20 017 553 39 983 127 94 046 576EXPORT 16 853 361 26 720 340 93 509 720 137 083 421
UNITED STATES IMPORT 5 483 593 172 305 041 153 956 275 331 744 909EXPORT 12 437 555 61 052 268 253 108 813 326 598 636
CHINA IMPORT 244 754 1 551 311 7 040 037 8 836 102EXPORT 2 106 291 345 730 10 187 105 12 639 126
BRAZIL IMPORT 34 341 176 606 62 169 273 116EXPORT 22 859 215 790 2 581 780 2 820 429
Source: Comext database
Other European sources
European Group on Museum Statistics (EGMUS, http://www.egmus.eu)
Since 2002, EGMUS has been the central base for statistical data on museums. The main objective of EGMUS is the collection and publication of comparable European statistical data. To reach this objective, EGMUS developed the standard questionnaire for the individual countries to include in their national surveys. Common definitions and key indicators are presented to reach real comparability and harmonized information. Data is available on 37 topics (e.g.: most visited, museums, ownership, management, number of visits, admissions, income, expenditure, use of computers, participation etc.), by country (28 including Switzerland) and by year. Data collected come from national administrative sources. Apart from the difficulties raised by standardization of definitions, the availability of data is also at stake: the newest data are for 2009 but are available only for 8 countries.
European Commission – DG Education and Culture
The European Heritage Label list(70): ‘The general objectives of the European Heritage Label are to strengthen European citizens’ sense of belonging to the European Union, based on shared elements of history and heritage, as well as an appreciation of diversity, and to strengthen intercultural dialogue.’ To date, a total of 64 sites have obtained the Label. The European Capitals of Culture(71): In June 1985, the European City of Culture project was launched – by Resolution of the EU Culture Ministers – with the aim of helping to bring the people of Europe closer together.
b) National sources
For the majority of the time, cultural heritage is covered by administrative or statistical national surveys/data collection. The national collections often result in statistical yearbooks.
(70) See http://ec.europa.eu/culture/our-programmes-andactions/doc2519_en.htm (71) See http://ec.europa.eu/culture/our-programmesand-actions/doc413_en.htm

ESSnet‐CultureFinalReport
- 290-
However, the national data (whatever the cultural domain) need thorough analysis in considering their comparability.
c) International sources
The main international source for Cultural Heritage is UNESCO whose lists of heritage gives general information on monuments and sites.
UNESCO World Heritage List, http://whc.unesco.org/fr/list/stat#s1
The World Heritage List contains statistics by:
- Number of World Heritage properties by region; - Number of World Heritage properties by region; - Number of World Heritage properties inscribed by each State Party; - States parties with no properties inscribed on the World Heritage List; - Number of World Heritage properties Inscribed each year; - Number of World Heritage properties inscribed each year by region; - Number of World Heritage properties inscribed and areas each Year - Total number of properties inscribed per pear (cumulative); - List of World Heritage in Danger by Year; - List of World Heritage in Danger by Region.
Table 35 - Geographical breakdown of the list present European data either grouped with Europe and North America, or detailed by each of the 151 State Parties
Regions Cultural Mixed (incl. natural)
Total % States Parties with inscribed
properties
Africa 42 4 78 9% 30
Arab States 61 1 66 7% 15
Asia and the Pacific 138 9 198 22% 31
Europe and North America 377 10 445 49% 50
Latin America and the Caribbean 86 3 124 14% 25
Total 704 27 911 100% 151
Source: UNESCO 2011
Several European web portals on Cultural Heritage give documentary information or reports on thematic issues (digital museums, for instance) but contain no statistical data.
Just to quote the two below:
the Voice of Cultural Heritage in Europe, http://www.europanostra.org (see in particular the Europa Nostra Awards for European Union Prize for Cultural Heritage)
Europeana: think culture, http://www.europeana.eu/portal/aboutus.html
ESSnet‐CultureFinalReport
- 291-
2. ARCHIVES
Archival documents, public or private, are original documents whose value is permanent for they are relevant for history even if they were not intended to write it. They are produced by a person or an institution because they are necessary to its business. Archival records are in that sense different from the documents found in libraries (multiple copies written to be used and stored). I. The cultural domain of Archives includes:
o the activities of collecting documents for the selection of documents and the constitution of collections;
o the preventive activities of conservation for the preservation of documents (digitization);
o the activities of disseminating archival material (archives centres or online);
The activities of Archives thus transcend the sole functions of preservation: the process of selecting documents for the constitution of archives is vital, just like the function of making them available to public is. Digitization and online access enhance heritage value by facilitating access to documents while avoiding their deterioration.
o the interdisciplinary activities of education (training to archival techniques and technical tools) and administration as well as the financing activities are the support activities linked to all sectoral domains.
Such is the participative side (social participation and cultural practices) which represents the final aim for any cultural content. II. International references and classifications as work tools UNESCO, FCS 2009 (p.27): ‘Archiving represents the collection and repository of cultural forms (movable objects and intangible) for the purposes of preserving for posterity, exhibition and re-use (e.g. the preservation of historic sites and buildings, sound archives and picture libraries). Archiving and preserving activities can take place in each of the cultural domains (an author’s manuscript, the first performance of a work, a concert/exhibition programme). Archival material is also a reference point, which can serve as inspiration for new creation’. Only one NACE Rev.2, 2008 class 4-digit covers the activities of Archives: 91.01 -‘Libraries and Archives activities’. However, even at this most detailed level, the class remains still too aggregated grouping archives and libraries.

ESSnet‐CultureFinalReport
- 292-
The 91.01 class includes:
a) documentation and information activities of libraries of all kinds, reading, listening and viewing rooms, public archives providing service to the general public or to a special clientele, such as students, scientists, staff, members as well as operation of government archives:
organisation of a collection, whether specialised or not; cataloguing collections; lending and storage of books, maps, periodicals, films, records, tapes,
works of art etc.; retrieval activities in order to comply with information requests etc.
b) stock photo and movie libraries and services. Then again, the CPA classification is necessary for measuring the Archives’ content: 91.01.12 -Archive services = Operation (collection, cataloguing, conservation and retrieval) services of public archives, including digital archives; Operation services of historical archives, including digital archives. However the CPA code for Archives is based on a cultural service and services are not well taken into account in sources. The 2621 ‘Archivists and curators’ code, from the International Standard Classification of Occupations’ codes, ISCO-08, clearly defines the main occupation of the Archives domain. III. Illustrated sources
a) Harmonized European sources
No harmonized sectoral and economic statistics are available for the domain of Archives: the Structural Business Statistics (SBS) and the Short-term business statistics (STS) do not include the 91 NACE Rev.2 code.
Labour statistics The LFS survey uses the division group of the NACE Rev.2 classification: this level not only aggregates the Cultural Heritage domain with the Libraries and Archives ones but also takes into account the non cultural domain of botanical, zoological, nature reserves.
b) Other European sources
Several European web portals on heritage give documentary information or specific issues, such as digitalization which is much at stake:
Web portal MICHAEL, http://www.michael-culture.org: Michael is a multilingual online service providing quick and simple access to the digital collections of museums, libraries, archives of European institutions:
ENRICH, http://www.manuscriptorium.com/?q=fr: European Networking Resources and Information concerning Cultural Heritage, a consortium to develop access to distribute information about manuscripts and rare old printed books in Europe on the Manuscriptorium platform.

ESSnet‐CultureFinalReport
- 293-
Manuscriptorium project is creating a virtual research environment providing access to all existing digital documents in the sphere of historic book resources (manuscripts, incunabula, early printed books, maps, charters and other types of documents).
c) National sources
60 % of EU Member States have national administrative or survey source on Archives.
d) International sources
No specific statistical international source on archives exists but mainly resource centres. The issues related to Archives are often linked with the Libraries’ones.
UNESCO Archives portal, http://www.unesco-ci.org: an international gateway to information for archivists and archives users
UNESCO Memory of the World: UNESCO's programme aiming at preservation and dissemination of valuable archive holdings and library collections worldwide.
IFLA/UNESCO Survey on digitization and preservation: one of Memory of the World action, but the survey dates back from 1998.
International Council on Archives (ICA - http://www.wien2004.ica.org): resource centre to promote the preservation and use of archives around the world. Documentary references
‘Charter on the Preservation of the Digital Heritage’, UNESCO 2003: ‘As a key element of national preservation policy, archive legislation and legal or voluntary deposit in libraries, archives, museums and other public repositories should embrace the digital heritage.’

ESSnet‐CultureFinalReport
- 294-
3. LIBRARIES
Libraries are spaces, either physical or digital, that collect, preserve and transmit documents. Libraries may be public, private, academic, specialized etc. and they can collect written documents such as books and periodicals as much as discs, films, videotapes, educational games, graphics etc. I. The cultural domain of Libraries includes
o the activities of acquisition and organisation of collections in order to preserve and disseminate information and knowledge;
o the activities of lending documents and promoting reading;
o the interdisciplinary activities of education (training for librarians) and administration as well as the financing activities are the support activities linked to all sectoral domains;
o such is the participative side (social participation and cultural practices) which represents the final aim for any cultural content.
II. International references and classifications as work tools
UNESCO, UIS Public report(72): ‘Libraries: Irrespective to its title, any organized collection of printed books and periodicals or of any other graphic or audio-visual materials, and the services of the staff to provide and facilitate the use of such materials as are required to meet the informational, research, educational or recreational needs of its users’. Just like for Archives, the NACE Rev.2 class 4-digit that covers the activities of libraries is the 91.01 code ‘Libraries and Archives activities’. At this most detailed European level, the class remains still too aggregated grouping archives and libraries. The CPA classification details the 91.0.111 code: Libraries services: Collection, cataloguing, conservation and retrieval services of books and the like; Lending services of books and records; Stock photo and movie library services. Two codes from the International Standard Classification of Occupations (ISCO-08) define the main occupations of the Libraries domain: 2622-Librarians and related information professionals; 4411-Library clerks. The International Organization for Standardization could also be quoted as it is an interesting tool for some technical fiels, such as Libraries. For libraries, the ISO 2789:2006, provides guidance and specifies rules for the library and information services community on the collection and reporting of statistics: for the purposes of international reporting; to ensure conformity between countries for those statistical measures that are frequently used by library
(72) See http://stats.uis.unesco.org/unesco/ReportFolders/ReportFolders.aspx

ESSnet‐CultureFinalReport
- 295-
managers but do not qualify for international reporting; and to encourage good practice in the use of statistics for the management of library and information services. A new revision of the standard is under progress. III. Illustrated Sources
a) Harmonized European sources
As said before, no harmonized sectoral and economic statistics are available for the domain of Libraries: the Structural Business Statistics (SBS) and the Short-term business statistics (STS) Regulations do not include the 91 NACE Rev.2 code.
Labour statistics The LFS survey uses the division group of the NACE Rev.2 classification: this level not only aggregates the Cultural Heritage domain with the Libraries and Archives ones but also takes into account the non cultural domain of botanical, zoological, nature reserves.
b) Other European sources
Europeana, http://europeana.eu: the digital library Europeana enables people to explore the digital resources of Europe's museums, libraries, archives and audiovisual collections.
c) National sources
The inventory conducted among ESSnet-Culture states that all Member States have organise a collection of statistical data on Libraries, either from national administrative source or with surveys.
d) International sources
LIBECON and UNESCO offers statistical data on Libraries but they are not regular nor up-to-date and missing values are numerous:
LIBECON, http://www.libecon.org: the research study into international library economics ambitioning the creation of a statistical database, funded by the Directorate General for the Information Society of the European Commission (see the ‘Telematics for Libraries’ programme). Numerous economic indicators were collected from 1997 to 2001 (and archived data from 1991), including 15 European countries. Data were collected from national administrative sources and customized tables as well as comparative ones are easy to create. Unfortunately, this compendium has not been continued.
UNESCO/IFLA Pilot survey on library statistics: one of Memory of the World action, the survey dates back from 1998. Available data are for 1995-1999 and for individual countries or groups (for instance for Europe with customized tables could be built from the access data centre). Several resource centres also give documentary information and reports on Libraries
UNESCO Libraries portal: An international gateway to information for librarians and library users.
UNESCO Memory of the World: UNESCO's programme aiming at preservation and dissemination of valuable archive holdings and library collections worldwide.

ESSnet‐CultureFinalReport
- 296-
International Federation of Library Associations and Institutions (IFLA), http://www.ifla.org: leading international body representing the interests of library and information services and their users.

ESSnet‐CultureFinalReport
- 297-
4. BOOKS AND PRESS
The cultural domain of Books and Press includes the activities consisting in creating, editing, publishing and distributing books, periodicals, magazines and newspapers, whether printed or digital. I. These activities are made of…
o On the one hand, activities related to artistic and literary books and periodicals creation. Creation activities in a broad sense include the activities of translation. Only the creation of the written part is included in that domain, even if the composition of a book also implies visual creations: these will be integrated at the crossing of Creation with Visual arts domain (physical book) or Creation with Audiovisual domain (ebook with multimedia parts).
o On the other hand, the activities of production and publishing of books and
periodicals, as well as their distribution (trade, whether physical or online); the activities of news agencies (gathering of information and writing of articles to provide the press with content) are also part of the primary sectoral activities for measuring the Book and Press domain.
o Other activities are connected to Books and press: activities of preservation
(included digitization and restoring); activities of disseminating (thematic exhibitions, galeries, promoting).
o The interdisciplinary educational activities (that enables the creation of books and press, and sensitizes to cultural activities of writing etc.), the administrative ones, as well as the financing activities are the support activities linked to all sectoral domains. Such is the practising side (reading books and press) which represents the final aim for any cultural content.
II. International references and classifications as work tools
UNESCO, FCS 2009 (p. 25): ‘This category represents publishing in all its various formats: Books, Newspapers, and Periodicals. This category remains the same as in FCS 1986 (UNESCO, 1986) but it also includes the electronic or virtual forms of publishing such as online newspapers, ebooks and the digital distribution of books and press materials. Libraries, both physical and virtual, are included in this domain as are Book fairs’. Some NACE classes fully cover the activities of Books and press, they are the NACE Rev.2 related to the editing industry (4-digit classes 58.11, 58.13, 58.14) and sales (47.61, 47.62). These classes are the ones to fit the strict sectoral approach for Books and press: they are to be privileged for a relevant measurement of the Books and press domain.

ESSnet‐CultureFinalReport
- 298-
Table 36 – Coverage of book and press through the classifications NACE and CPA
NACE-08Group
Group label NACE-08
Class Class label CPA 2008 CPA 2008 label
581p Publishing of books, periodicals and other publishing activities
5811 Book publishing 58 11 11 Printed educational textbooks (workbooks, teachers manuals, resource materials, interactive materials).
58 11 12 Printed pro fissional, technical and scholary books.
58 11 13 Printed children books.
58 11 14 Printed dictionaries and encyclopaedias
58 11 15 Printed atlaes and other books with maps
58 11 16 Printed maps and hydrographic or similar charts, other than in books form.
58 11 19 Other printed books, brochures, leaflets and the like (literary fiction and non-fiction; poetry and drama; religious books, bibles and hymnals; nonfiction such as history, political, biographies home and garden, how-to-books, cook books, travel guides etc.).
58 11 20 Books on disk, tape or other physical media.
58 11 30 On-line books.
58 11 41 Advertising space in books, printed.
58 11 42 Advertising space in books, electronic.
58 11 50 Publishing of books on a fee contract basis.
58 11 60 Licensing services for the right to reproduce, distribute or incorporate literary originals such as books, brochures, leaflets, maps and the like.
5813 Publishing of newspapers
58 13 10 Printed newspapers.
58 13 20 On-line newspapers.
5814 Publishing of journals and periodicals
58 14 11 Printed general interest journals and periodicals.
58 14 12 Printed business, professional and academic journals and periodicals.
58 14 19 Other printed journals and periodicals.
58 14 20 On-line journals and periodical
58 14 31 Advertising space in journals and periodicals, printed.
58 14 32 Advertising space in journals and periodicals, electronic.
58 14 40 Licensing services for journals and periodicals.
476p Retail sale of cultural and recreation goods in specialised stores
4761p Retail sale of books in specialised stores
47 00 61 Retail trade services of books
4762p Retail sale of newspapers and stationery in specialised stores
47 00 62 Retail trade services of newspapers and magazines
Note: p: for a NACE class only partly cultural

ESSnet‐CultureFinalReport
- 299-
Some NACE codes have a very small proportion of cultural content, identifiable only at a detailed level, the products of the CPA. To quote the CPA level enables to link the cultural activities with official nomenclatures: however, these detailed levels are most of the times absent from the available sources and therefore are not measurable. For instance, it seems too irrelevant to include such activities as 47.79 ‘Retail sale of second-hand goods in stores’ 47.91 ‘Retail sale via mail order houses or via Internet’ because it concerns various products and not only cultural ones. Now we quote the CPA 47.00.92 that has to do with the books and press domain and which is also linked with the activity NACE 47.91 digital trade.
The following NACE classes related to the CPA* are not considered as cultural:
6391 News agency activities 63 91 11
Mews agency services to newspapers and periodicals: gathering, investigating and supply services of news in the form of manuscripts or of news pictures o printed media businesses such as newspapers, periodicals, and books.
4761p Retail sale of books in specialised stores 47 00 61 Retail trade services of books
4762p Retail sale of newspapers and stationary in specialised stores
47 00 62 Retail trade services of newspapers and magazines
7430p Translation and interpretation activities 74 30 11 Translation services
Note: *: CPA from non cultural activities
*47 00 92 Retail trade services of second-hand books
*74 90 20
Other professional, technicaland business services (incl. Engagements in motion pictures, theatre or otherentertainment, placement of books, artworks etc.)
*18 14 10 Binding and related services
The products of the Combined Nomenclature 2010 included in cultural domain Books and Press are identified as follow:
CN - Chapter 49: Printed books, newspapers, pictures and other products of the printing industry; Manuscripts, typescripts and plans
4901 10 00 Printed books, brochures and similar printed matter, in single sheets, whether or not folded (excl. periodicals and publications which are essentially devoted to advertising)
4901 91 00 Dictionaries and encyclopaedias, and serial instalments thereof
4901 99 00 Printed books, brochures and similar printed matter (excl. those in single sheets; dictionaries, encyclopaedias, periodicals and publications which are essentially devoted to advertising)
4902 10 00 Newspapers, journals and periodicals, whether or not illustrated or containing advertising material, appearing at least four times a week
4902 90 00 Newspapers and other periodicals, whether or not illustrated or containing advertising material (excl. those appearing at least four times a week)

ESSnet‐CultureFinalReport
- 300-
The Classification of Individual Consumption by Purpose adapted to the needs of Harmonized Indices of Consumer Prices (COICOP/HICP) is relevant for measuring the Books and Press domain:
09- Recreation and culture
09.5.1- Books
09.5.2- Newspapers and periodicals The following International Standard Classification of Occupations’ codes (ISCO-08) are considered for the measure of employment in the Books and Press domain:
2641 Authors and related writers
2642 Journalists
2643 Translators, interpreters and other linguists The International Organization for Standardization (ISO 9707:2008 code) gives guidance on the keeping of national statistics to provide standardized information on various aspects of the production and distribution of printed, electronic and micro-publications (essentially books, newspapers and periodicals). In addition, ISO 9707:2008 provides recommendations on subject classification. III. Illustrated sources
a) European sources
For the production of economic statistics on Books and Press, the SBS Regulation is to be favoured because of the 4-digit NACE availability. SBS Regulation allow to describe the sectoral economy of the business units (the enterprise) editing books and press. The Comext database, by the Combined Nomenclature, allows the measure of foreign trade for the refined products of books and press.
Table 37 – Coverage of books and press by economics European statistics
Division 2008
Group 2008
Class 2008
Class label SBS Regulation Comext STS Regulation
58p Publishing activisties
5811 Book publishing
*4-digit NACE Class Structural data; Accounting data; Capital account; Employment;
Annual data.
*8-digit CN for detailed products Foreign trade abd customs objectives: flow of goods flow (import, export and balance);
Value (in euro or in national currency), quantity, seasonally and working day adjusted value, unit value and volume index;
Monthly, annual data.
*2-digit NACE Division 58 Turnover (in value); Labour input indicators (Nb of Persons Employed); Producer prices (Output prices); Monthly, quaterly, annual.
5813 Publishing of newspapers
5814 Publishing of journals and periodicals
47p Retail trade, except or motor vehicles and motorcycles
4761p Retail sale of books in specialised stores
*2-digit NACE Division 47 Volume of sales (deflated turnover); Turnover (in value); Labour input indicators (Number of persons employed); Monthly, quaterly, annual.
4762p Retail sale of newspapers and stationary in specialised stores

ESSnet‐CultureFinalReport
- 301-
Conclusion Good coverage of the 3 editing sectors and 2 retail trades ones.
Good coverage of the books and press products for foreign trade.
Recommendation More detailed data by 4-digit
sectors is needed, at least for one index (turnover).
Comment
Data 2008 are missing for some Member states, availability of data is to be improved.
Limited to the measure of goods of foreign trade.
Table 38 - Enterprises statistics for books and press - main indicators, 2008 (Euros unit=EUR million)
NACE-08 Class
Country Number of enterprises
Turnover (EUR million)
Value added at factor cost
5811-Book publishing EU-27 25 225 30 291.21 10 177.44
Belgium 351 676.2 216.9
Bulgaria 252 58.8 19.6
Denmark 456 474.4 145.2
Germany 1 703 4 929.1 1 986.4
Estonia 146 34.7 12.8
Italy 2 229 3 154.3 629.9
Cyprus 21 2.4 0.8
Latvia 121 36.4 16.6
Lithuania 182 72 24.1
Luxembourg 21 1 0.4
Hungary 1 326 306.1 100
Netherlands 1 435 : :
Austria 333 288.5 108.9
Poland 3 035 1 157.7 486.9
Portugal 415 404 104.2
Slovenia 190 107.9 33
Slovakia 71 43.1 13.8
Finland 336 371.9 119.3
Sweden 1 945 776,8 245.1
United Kingdom 2 555 5 317.9 2 227.3
Croatia 529 182.5 69.1
5813-Publishing of newspapers
EU-27 8 634 45 036.39 17 896.03
Belgium 165 1 086.6 317
Bulgaria 190 79.1 20.5
Denmark 54 927.9 391.9
Germany 1 044 12 328.7 5 632.8
Estonia 21 73.4 31.2
Italy 431 3 091.8 1 026.2
Cyprus 12 58.9 26.8
Latvia 34 44 21.4
Lithuania 96 90.4 23.4
Luxembourg 11 : :
Hungary 136 270 97
Netherlands 309 : :
Austria 151 1 281.3 361.2
Poland 743 702.5 347.4
Portugal 361 329.4 112
Slovenia 60 171.6 59.5
Slovakia 28 31.2 14
Finland 247 1 364.3 543.4

ESSnet‐CultureFinalReport
- 302-
Sweden 484 2 145.2 679.7
United Kingdom 512 8 005.8 3 532.2
Norway 326 1 921.3 826.3
Croatia 163 315.6 89,7
5814 - Publishing of journals and periodicals
EU-27 22 527 40 975.36 15 567,09
Belgium 258 677.5 204.9
Bulgaria 198 68.9 20.1
Denmark 315 1 046.8 425.2
Germany 11 838 7 602.5 3 310.2
Estonia 59 42.1 14.2
France 3 605 6 882.1 2 029.9
Italy 2 842 4 452.1 1 012.6
Cyprus 54 22 8.2
Latvia 165 71.9 35
Lithuania 172 75.7 18.1
Luxembourg 41 25.7 8.7
Hungary 1 105 392.1 114.8
Netherlands 881 : :
Austria 359 713.9 214.1Poland 944 879.1 309.8
Portugal 555 425 146.1
Slovenia 140 77.9 18.2
Slovakia 153 170.4 63.2
Finland 312 912.3 329.4
Sweden 834 1 180.9 367.7
United Kingdom 2 420 8 767.7 4 433.5
Norway 394 934 316.4
Croatia 232 126.1 39.9
Note: Germany, including former GDR from 1991 Scope : Nace 2008, Classes 5811-5813-5814
Source: SBS database, Eurostat
Table 39 – SBS data on retail sale of books and press - main indicators, 2008
Country Retail sale of books in specialised stores Retail sale of newspapers and stationary in specialised stores
Number of entreprises
Turnover (EUR million)
Value added at factor cost
Number of entreprises
Turnover (EUR million)
Value added at factor cost
EU-27 : : 3 000 99 382 25 245,48 4 756.43
Belgium : : : 4 458 2 124.8 421.4
Bulgaria 534 47.3 6.0 1 441 180.8 26.9
Czech Republic : : : : : :
Denmark 341 363.3 84.0 27 14.9 4.0
Germany 4 097 3 557.3 918.2 7 303 2 836.7 607.8
Estonia 40 : 33 : :Ireland 238 477.3 94.7 : : :
Spain 6 543 1 448.9 272.2 17 547 2 378.0 433.9
France : : : : : :
Italy 3 644 1 767.3 340.5 29 585 4 829.0 793.2
Cyprus 203 42.1 10.7 44 27.1 5,6
Latvia 70 39.2 9.4 130 110.7 14.4
Lithuania 98 35.0 5.1 115 67.9 12.4
Luxembourg 29 43.2 8.0 98 125.0 10.2
Hungary 909 271.5 44.8 1 731 246.0 33.7
Netherlands 493 : : 1 114 : :

ESSnet‐CultureFinalReport
- 303-
Austria 518 767.3 184.0 540 320.7 76.0
Poland 1 601 641.8 138.8 6 165 795.9 107.4
Portugal 636 140.9 24.8 6 654 768.5 68.8
Romania 242 132.6 24.2 1 496 336.9 60.1
Slovenia 35 83.0 18.4 201 100.7 16.3
Slovakia 62 88.6 11.0 50 67.5 7.9
Finland 234 204.4 43.9 194 127.1 33.1Sweden 575 363.0 88.1 485 125.9 28.4
United Kingdom 1 315 1 516.1 292.8 4 149 4 208.2 949.1
Norway 263 606.8 132.3 26 3.5 1.1
Croatia 22 30.1 8.7 264 : :
Note: Germany: including former GDR from 1991 Source: SBS database, Eurostat
For the Books and Press sectors, the STS covers an aggregated level at 2-digit level Division 58 (including some non-cultural activities – e.g. publishing of directories).
Table 40 - Publishing activities: Index of turnover (2005=100)
Country October 2010 January 2010
EU-27 : :
EU-15 : :
Euro area (16 countries) + Estonia : :
Belgium : :
Czech Republic 102.29 68.40
Denmark 104.40 96.30
Spain 87.47 73.62
France : 96.70
Luxembourg : 107.59
Portugal 80.00 55.70
Slovenia : 116.40
Finland : 101.60
United Kingdom : 83.81
Scope: Nace Rev.2, Division 58 Source: sts_setu_m
The European database Comext contains information on the books and press trade: data by detailed CN products from Section X – chapter 49 (4901 1000, 4901 9100, 4901 9900, 4902 1000, 4902 9000) are available. Data from CPA exist but they are more aggregated: the 4-digit codes 5811, 5813, 5814 include for instance maps and atlases, or advertising space that are not taken into consideration when measuring the trade of books and press by CN. The differences are displayed in table 24 and 25: CPA results in value are inflated (from 3% to 6% for EU-27 Intra and Extra trade, and around 15% with a specific partner, China). However, in volume, the Books and press results from CN or CPA are similar: 1% of EU-27 Export with China and 25% (CN) to 27% (CPA) of EU-27 Import with China.

ESSnet‐CultureFinalReport
- 304-
Table 41 - EU-27 External trade by CPA, 2009 (in euros)
CPA 2008 CN - CHINA EU-27, EXTRA EU-27, INTRA
1 - IMPORT 2 - EXPORT 1 - IMPORT 2 - EXPORT 1 - IMPORT 2 - EXPORT
5811 – Book publishing services 529 507 172 40 032 830 1 764 382 658 2 309 609 625 3 509 563 026 4 049 687 732
5813 – Publishing services of newspapers 33 881 218 363 26 853 692 73 350 194 321 360 660 218 815 473
5814 – Publishing service//periodicals 906 658 5 058 746 168 848 497 645 797 221 2 075 421 818 2 084 040 455
TOTAL 530 447 711 45 309 192 1 960 084 847 3 028 757 040 5 906 345 504 6 352 543 660
Scope: EU-27 Source: Comext database
Table 42 - EU-27 proportion of external trade with China, by CN and by CPA, 2009
CN & CPA 2008 EU-27
Import with China
EU-27 Export to China
By CN (Products 490111000, 49019100,49019900, 49021000, 49029000, 49029010, 49029030)
25 % 1%
By CPA (5811, 5813, 5814) 27 % 1%
Scope: EU-27 Source: Comext
Table 43 - Consumer prices of books and press, 2009 Consumer prices for books and press, 2009 average index (2005= 100)
Country All-Items Books Newspapers
and periodicals
EU-27 109.63 105.47 113.94
Netherlands 106.57 86.42 115.97
France 106.93 103.92 110.38
Ireland 107.1 104.3 118.6
Germany 107.2 100.3 113.2
Portugal 107.36 111.82 112.77
Austria 107.71 98.21 114.13
Denmark 108.4 111.4 118.5
Finland 108.66 103.49 117.50
Sweden 108.72 111.07 115.25
Italy 108.8 106.0 111.9
Belgium 108.86 108.11 112.86
Cyprus 109.22 97.86 134.40
Luxembourg 110.02 99.52 117.80
Malta 110.12 94.37 117.87
Spain 110.64 109.48 108.64

ESSnet‐CultureFinalReport
- 305-
Source: HICP, Eurostat
b) Other European sources
The Books and press domain is quite well covered with the harmonized European sources, in terms of economic data. Other sources do not offer neither better coverage, nor more recent data.
c) International sources
International sources are quite difficult to be used: they contain information on Books and press whose scope is always limited, either in terms of the units included (selected sample made of members), in terms of geography (only a few Member States of EU-27), or in terms of data frequency (irregular surveys or reports). Therefore, they should not be preferred to European sources.
The following sources are just quoted for information.
UNESCO/UIS, International newspaper survey, http://www.uis.unesco.org UNESCO/UIS, Statistics on Books production, http://www.uis.unesco.org Federation of European Publishers (FEP), annual report, http://www.fep-fee.be European Federation of Magazine Publishers (FAEP) European Council of literary Translators’ associations (CEATL), irregular
thematic surveys, http://www.ceatl.eu LibEcon, data on libraries, http://www.libecon.org
Documentary references:
‘A Methodology to Collect International Book Statistics’ - UNESCO, 2009, http://unesdoc.unesco.org/images/0018/001824/182475e.pdf
United Kingdom 110.8 111.4 120.7
Slovakia 111.43 113.38 116.14
Czech Republic 112.4 110.5 118.6
Greece 112.40 109.44 115.01
Poland 112.6 110.2 95.9
Slovenia 113.25 107.60 122.32
Estonia 123.56 116.28 139.93
Hungary 123.85 130.16 120.37
Lithuania 127.09 121.28 110.30
Romania 127.43 115.60 153.28
Bulgaria 132.56 126.07 111.17
Latvia 139.62 152.84 152.55

ESSnet‐CultureFinalReport
- 306-
5. VISUAL ARTS
The domain of Visual Arts centers on the activities of creating, producing and distributing works of the plastic arts(73), photography and design. For each cultural domain, with their specific production activities and end products (goods or services), the ESSnet-Culture framework for cultural statistics aims to cover the whole ‘cultural cycle’ from the original act of creation up to the processes of participation and consumption. I. In the domain of Visual Arts, the main activities are:
o creation – the process of creating works of visual arts;
o production – the production of printed reproductions of works of visual arts, the production of sculpture casts etc.;
o dissemination /trading – distribution, exhibition and trade in works of visual arts; e.g. activities of art galleries and artotheques;
o preservation – preservation, protection, conservation and restoration (including digitization) of works of visual arts;
o education – this includes any type of education/training (which enables creation or sensitizes to visual arts);
o management/regulation – management and regulation activities that relate to visual arts.
Creation, production and dissemination/trading are the primary activities used to measure the domain of Visual Arts. Design is included in the framework principally as a service. Trade in unique design objects is included but trade in manufactured designed objects is not. The framework of ESSnet-Culture excludes manufacturing activities. In addition to economic matters, the ESSnet-Culture framework looks into employment, financing and cultural practices/participation related to the visual arts. II. International references and classifications as work tools
o The preceding LEG-Culture (2000) labelled one of the main cultural domains as Visual Arts and defined its content in a more or less similar manner. Visual Arts was divided into three sub-domains that were called Visual Arts, Photography and
(73) The Visual Arts domains include all fine arts (non-literary, non-musical): as a matter of fact the term ‘plastic arts’ also has a specific meaning referring to art forms which involve physical manipulation of a plastic medium by moulding or modelling such as sculpture or ceramics.

ESSnet‐CultureFinalReport
- 307-
Multidisciplinary. Design was included in the first sub-domain. (Cultural Statistics in Europe 2000, p.23).
o The UNESCO, FCS 2009 separates design from Visual arts:
The domain ‘Visual Arts and Crafts’ (C) consists of three sub-domains: fine arts, photography and crafts. ‘Visual arts are art forms that focus on the creation of works, which are visual in nature. They are intended to appeal to the visual sense and can take many forms. The Visual Arts and Crafts domain includes Fine Arts such as paintings, drawings, sculpture; and Photography. Commercial places where the objects are exhibited, such as commercial art galleries, are also included in this domain’. (p.26) The FSC adopts the International Trade Center and UNESCO (1997) definition for the Crafts, or artisanal products (p.26). The domain ‘Design and Creative Services’ (F) includes the activities, goods and services resulting from the creative, artistic and aesthetic design of objects, buildings and landscape. The domain consists of Fashion, Graphic and Interior Design, Landscape Design, Architectural and Advertising Services. (p.28)
As regards the economic classifications for measuring Visual arts, there is only one NACE class that consists entirely of Visual arts activities: 74.10 ‘Specialized design activities’. Capturing the creation of plastic arts and photography is more problematic through NACE Rev.2. The plastic arts are placed in NACE class 90.03 ‘Artistic Creation’ which contains Books and Press activities as well. The creation of photography can be found in class 74.20 ‘Photographic activities’ which consists mostly but not totally of activities falling under the ESSnet-Culture definition of culture, photography processing services being considered as non-cultural in the ESSnet-Culture framework. NACE classes and CPA codes consisting entirely of core visual arts activities
74.10.1: Specialized design activities
74 10 11 Interior design services
74 10 12 Industrial design services (creating and developing designs and specifications)
74 10 19 Other specialised design services (harmonising aesthetic considerations with technical and other requirements, for furniture, jewellery, aesthetic designs, graphic designs etc.)
74 10 20 Design originals (original design concepts, produced on own account; intellectual property product typically produced with the intent to sell or license the information to others)
NACE classes consisting partially of core visual arts activities
74.20p*: Photographic activities
74.20.21 Portrait photography services (in studios or other locations, e.g. studio fashion photos)
74.20.22 Advertising and related photography services

ESSnet‐CultureFinalReport
- 308-
74.20.23 Event photography and event videography services (photographing or videotaping live events, such as weddings, graduations, conventions, receptions, fashion shows, sports and news events)
74.20.24 Aerial photography services
74.20.29 Other specialised photography services (using special apparatus or techniques, e.g. underwater photo)
74.20.32 Restoration and retouching services of photography (old photograph restoration, retouching and other special photographic effects)
90.03*: Artistic creation
90.03.11* Services provided by individual artists (such as composers, sculptors, painters, cartoonists, engravers, etchers etc.), individual writers (for all subjects, including fictional and technical writing), independent journalists and other artists except performing artists
90.03.13 Original works of painters, graphical artists and sculptors (paintings, drawings and pastels; original engravings, prints and lithographs; original sculptures and artistic statuary, in any material)
Note: p = Only part of the code contents are cultural activities. * = Only part of the code contents are visual arts activities. The NACE classes associated with CPA categories below are not considered as cultural. The CPA category contents in this case relate to the trade of visual arts (e.g. sale and display services furnished by commercial art galleries). The corresponding NACE class is the wide-embracing 47.78 ‘Other retail sale of new goods in specialised stores’. NACE 47.79 ‘Retail sale of second hand goods in stores’ contains auction houses. The corresponding CPA class 47.00.9 ‘Retail trade services of second-hand goods’ is however too wide to assist in identifying art auction houses. The CPA is used in EU statistics on production, consumption and external trade. At the six-digit level, the CPA classification is able identify a few products – goods and services – connected to visual arts activities. The CPA code 47.00.69 ‘Retail trade services of souvenirs and arts overlaps with Cultural Heritage’. Once again the emphasis is stressed on the risk of double counting when presenting statistics for the total cultural sector. In addition, we could use CPA 85.52.13 ‘Fine arts schools and arts instruction services’ to pick out training in visual arts. The Combined Nomenclature (CN) is classification of goods used within the EU for the purposes of external trade statistics. This eight-digit nomenclature is updated annually and is very detailed for many types of raw materials and industrial products. Many goods needed in the creation of works of visual art may be captured through the CN classification, e.g., digital cameras. These do not, however, fall under the ESSnet-Culture framework for cultural statistics.

ESSnet‐CultureFinalReport
- 309-
Nonetheless, the CN identifies a number of Visual arts creations in all of the three sub-fields. However, it appears somewhat outdated and limited in its conception of visual arts.
Chapter 97: Works of art, collectors’ pieces and antiques
9701 10 00 Paintings, drawings and pastels
9701 90 00 Other
9702 00 00 Original engravings, prints and lithographs
9703 00 00 Original sculptures and statuary, in any material
Chapter 49: Printed books, newspapers, newspapers, pictures and other products of the printing industry; manuscripts, typescripts and plans
4911 91 00* Pictures, designs, photographs (this subheading includes products of heading 3703 which have been exposed and developed. This subheading also includes artistic screen prints (art serigraphy), even if signed and numbered by the artist)
The Classification of Individual Consumption by Purpose Adapted to the Needs of Harmonized Indices of Consumer Prices (COICOP/HICP) does not identify the Visual arts in a satisfactory manner. Services related to the Visual arts may be found in chapter 09 ‘Recreation and culture’ in the 2000 COICOP. The 4-digit level code 09.4.2 ‘Cultural services’ includes museums, art galleries and exhibitions as well as services of photographers.
09.4.2: Cultural services, provided by:
- cinemas, theatres, opera houses, concert halls, music halls, circuses, sound and light shows;
- museums, libraries, art galleries, exhibitions;
- historic monuments, national parks, zoological and botanical gardens, aquaria;
- hire of equipment and accessories for culture, such as television sets, video cassettes etc.;
- television and radio broadcasting, in particular licence fees for television equipment and subscriptions to television networks;
- services of photographers such as film developing, print processing, enlarging, portrait photography, wedding photography etc.
Works of the plastic arts, which are considered to be durables, could also be found in the broad CN code number 05.1.1 ‘Furniture and furnishings’ but they are drowned with other non-cultural durables. Works of art acquired primarily as stores of value are excluded from the classification since they are considered to represent capital formation.
05.1.1: Furniture and furnishings
- pictures, sculptures, engravings, tapestries and other art objects including reproductions of works of art and other ornaments;
but also:
- beds, sofas, couches, tables, chairs, cupboards, chests of drawers and bookshelves;

ESSnet‐CultureFinalReport
- 310-
- lighting equipment such as ceiling lights, standard lamps, globe lights and bedside lamps;
- screens, folding partitions and other furniture and fixtures. From the 2008 International Standard Classification of Occupations (ISCO-08), 5 codes are linked with occupations of visual arts:
2163 Product and garment designers
2166 Graphic and multimedia designers
2651 Visual artists
3431 Photographers
3432 Interior designers and decorators The Graphic and multimedia designers could also be relevant for the Audiovisual domain which includes multimedia works: then once again, the publishing of sectoral data show its limits. III. Illustrated sources
a) Harmonized European sources
o For the production of economic statistics on Visual Arts, the SBS Regulation is to be favoured because of the 4-digit NACE availability.
o The SBS Regulation allow to describe the sectoral economy of the business units (the enterprise) carrying out photographic activities and design activities.
o The Comext database, by the Combined Nomenclature, allows the measurement of foreign trade in works of the plastic arts. The CPA provides information on trade in photographic services.
Table 44 - Coverage of Visual Arts by economic European statistics
NACE-08 Division
NACE-08 Group
NACE-08 Class
Class label SBS
Regulation Comext
STS Regulation
74p 74.1 74.10 Specialized design activities
4-digit NACE available
2-digit NACE division not sufficient for identifying visual arts
74p 74.2p 74.20p Photographic creation
4-digit NACE available but includes non-cultural activities
4-digit CPA for Photographic services
90 90.0 90.03 Artistic creation No coverage with SBS
8-digit CN for the products of Plastic Arts
Conclusion
Overall coverage of the domain of Visual Arts relatively poor as SBS gives usable data solely on design
Total coverage of the domain relatively poor

ESSnet‐CultureFinalReport
- 311-
activities
Recommendation
More consistence in usage of classifications; more attention to design activities
More detailed data (4-digit level) is needed
Comment Attention if using these sources: the data derived from these sources needs to be assessed thoroughly (e.g. the criteria for inclusion in business survey populations).
The Structural Business Statistics (SBS) offer data on the business units (enterprises) carrying out photographic activities (NACE 7420 partially) as well as those providing design services (NACE 7410). The survey does not cover enterprises listed under Division 90 which would contain such areas of the plastic arts as painting, sculpture etc.
Table 45 - SBS statistics for Design Activities and Photographic Activities - main indicators, 2008
NACE-08 Class
Country Number of enterprises
Turnover (EUR million)
Value added at factor cost
(EUR million)
Number of employees in
full time equivalent units
7410-Specialized design activities
EU-27 100 000 17 194.3 8 045.3 :
Belgium 1 801 355.0 76.6 701.0
Bulgaria 315 14.0 4.2 441.0Czech Republic : : : :
Denmark 2 391 630.6 194.8 2 380.0
Germany 14 295 1 919.7 1 069.3 9 272.0
Estonia 344 19.0 7.2 614.0
Spain 6 967 901.2 388.3 6 073.0
France : : : :
Italy 26 347 4 174.6 2 120.6 11 456.0
Cyprus 145 9.0 5.5 120.0
Latvia 244 34.1 7.6 517.0
Lithuania 128 11.4 3.9 357.0
Luxembourg 113 24.1 11.3 :
Hungary 393 29.2 9.4 332.0
Netherlands 4 164 : : 2 547.0
Austria 1 237 133.1 61.2 565.0
Poland 5 150 330.5 124.6 :
Portugal 2 282 121.4 45.2 6.0
Slovenia 557 34.6 12.2 :
Slovakia 90 33.0 12.4 31.0
Finland 1 711 165.9 73.5 864.0
Sweden 10 909 1 194.2 483.0 5 591.0
United Kingdom 13 727 4 476.6 2 200.7 30 052.0
Norway 3 654 346.0 145.2 1 494.0
Croatia 527 54.3 16.0 770.0
7420 * - Photographic activities
EU-27 86 349 10 643.6 4 646.8 :
Belgium 2 042 262.9 109.1 798.0
Bulgaria 583 15.4 6.2 1 108.0
Czech Republic : : : :
Denmark 1 323 203.8 91.2 888.0
Germany 7 238 1 568.7 865.2 10 331.0
Estonia 146 10.5 4.0 375.0
Spain 11 551 916.6 364.1 9 052.0
France 8 971 1 710.4 619.8 8 861.0

ESSnet‐CultureFinalReport
- 312-
Italy 14 622 1 541.2 562.8 4 025.0
Cyprus 256 28.6 16.1 437.0
Latvia 182 12.0 4.3 535.0
Lithuania 529 13.9 4.9 577.0
Luxembourg 65 6.2 2.8 :
Hungary 1 700 54.7 14.4 1 280.0
Netherlands 4 996 503.6 210.0 2 166.0Austria 1.491 205.4 94.0 1 350.0
Poland 5 149 382.6 147.3 :
Portugal 2 237 89.4 34.4 14.0
Slovenia 303 30.8 12.2 :
Slovakia 76 40.0 12.9 125.0
Finland 992 145.6 60.8 926.0
Sweden 6 220 368.5 163.5 2 020.0
United Kingdom 9 030 1 870.2 1 001.4 18 838.0
Norway 2 345 196.0 89.7 758.0
Croatia 480 24.5 9.0 745.0
Source: SBS database, Eurostat Providing data on the 2-digit level of NACE Rev.2, the STS is unable to identify activities falling under Visual arts. The STS provides no information on Division 90 and does not disaggregate Division 74 so that design and photographic activities could not be picked out. At the 2-digit level, Division 74 ‘Other professional, scientific and technical activities’ includes other cultural as well as totally non-cultural activities. For visual arts trade, Comext provides data by detailed CN products from Section XXI ‘Works of art, collectors pieces and antiques’ (9701 1000, 9701 9000, 9702 0000, 9703 0000)’. Data from CPA exist but they are limited to photographic services (7420). Table 46 - EU-27 external trade in Visual Arts/Plastic Arts, by CN 2009, January - December
2009 (value in Euros)
CN CN - CHINA EU-27, EXTRA EU-27, INTRA
1 - IMPORT 2 - EXPORT 1 - IMPORT 2 - EXPORT 1 - IMPORT 2 - EXPORT
9701 10 00 Paintings, drawings and pastels 28 754 262 4 222 125 1 153 378 176 1 741 189 807 187 882 663 217 168 399
9701 90 00 Other 4 609 166 177 251 27 214 275 38 432 262 16 455 381 12 456 461
9702 00 00 Original engravings, prints and lithographs
254 969 633 412 47 602 429 54 238 373 7 038 837 11 623 858
9703 00 00 Original sculptures and statuary, in any material
7 746 558 1 880 071 242 813 486 538 879 110 62 416 100 71 643 017
TOTAL 41 364 955 6 912 859 1 471 008 366 2 372 739 552 273 792 981 312 891 735
Source: Comext database
Table 47 - EU-27 external trade in Visual Arts/Photography, by CPA 2008, January - December 2009 (value in Euros)
CPA CN - CHINA EU-27, EXTRA EU-27, INTRA
1 - IMPORT 2 - EXPORT 1 - IMPORT 2 - EXPORT 1 - IMPORT 2 - EXPORT
74.20 Photographic services
171 367 481 772 34 522 745 28 140 296 55 634 210 106 000 754
Source: Comext database

ESSnet‐CultureFinalReport
- 313-
The Labour Force Survey uses the division group (2-digit) of the NACE 2008 classification. This level is not satisfactory for identifying occupations of Visual Arts.
b) Other European sources
National administrative and statistical sources In the LEG final report (2000, 34 & 55–59) it was noted that there are great variations in national definitions of visual arts as a statistical category. The report also observed that the visual arts are in rapid flux; their boundaries are constantly shifting and difficult to map. New areas are also emerging that are connected not only to the visual arts but also to several other cultural domains making their placement difficult in the statistical framework, e.g., web design and game industry. All in all, it was difficult for the LEG-Culture to find a universally acceptable definition for the domain. Based on a data collection exercise carried out among the participant countries, it was actually suggested that a special working group be set up for tackling the problem. (Cultural Statistics in the EU 2000, p. 45) In most countries that compile cultural statistics, the plastic arts (painting, sculpture, art graphics) form the core of visual arts, but practices differ when it comes to the inclusion of architecture, crafts, design, film and photography. In some cases they are all merged in one category labelled as visual arts, while it is also possible to deal separately with each of them. Between these ultimate choices, various types of combinations exist.
c) International sources
In the domain of visual arts, there exist some global trade statistics. For instance, Artprice provides statistics on art auctions annually (http://www.artprice.com). Also TEFAF, (The European Fine Art Foundation), publishes information on the global art markets at regular intervals (http://www.tefaf.com/DesktopDefault.aspx?tabid=1). The United Nations Conference on Trade and Development (UNCTAD - http://unctadstat.unctad.org) compiles, validates and processes a wide range of data collected from national and international sources. The data may be accessed freely through its data dissemination system, UNCTADstat. UNCTAD’s Creative Economy database contains information on world trade in the broad field of creative industry products (goods and services)(74). Data on the visual arts can be obtained from the UNCTAD files.
(74) See http://unctadstat.unctad.org/TableViewer/tableView.aspx?ReportId=728, and see also Barbara Murray’s paper ‘Visual arts as a vector for development’, http://www.culture-dev.eu/www/colloque/Culture-Dev.eu-theme2-en.pdf

ESSnet‐CultureFinalReport
- 314-
6. PERFORMING ARTS
Performing is a presentation of live art before a live audience(75). Included forms of performing arts are music, theatre, dance, musical cabaret, doll theatre, performances by comics, ventriloquists, jugglers, actors that play roles for courses, the performance of music for films as long as it is live etc. Contemporary performing art also includes any activity in which the artist's physical presence acts as the medium. Thus it encompasses, mime, face or body painting, and the like. Feast and fairs are included in the ESSnet-Culture definition as long as they entail one or more forms of performing arts(76). One can speak of performing whenever an artist, whether a professional or amateur, reaches an artistic accomplishment that can be followed directly by the public. Festivals are a form of displaying performing arts. It is a series of performances of different productions and groups on one or more days, that is presented as an indoors or outdoors event where you generally but not necessarily pay a fee for access. I. The cultural domain of Performing arts includes
o On the one hand, activities related to the creation of performing arts. Creation activities in a broad sense includes covers, remakes and education within the following main artistic genres: music (from classical to rave music, through lyrical, rock, jazz, pop, world etc.) dance, drama, circus, cabaret, combined arts and other live shows (street shows, one man show etc.).
N.B.: only the creation of the performance (theatre, musical pieces etc.) is included in that domain, even if its representation also implies other creations (e.g. music video’s, these will belong to the Audiovisual domain).
It is important here to note the strong cross-domain linkages between Performing arts and the Audiovisual domains, principally through the use of digital forms of data storage of Performing arts, which obviously depends on the cycle performing arts can go trough. In the ESSnet-Culture definition the electronic or digital version of performing arts is not included in the Performing arts section but included in the Audiovisual.
o On the other hand, the production activities of performing arts (producing a show for
stage, performing in theatres, on podia, festivals etc.), of live shows as well as the support activities for producing live shows (stage-set design, promoting activities, technical and administrative support); and the activities for operating live shows halls.
o The education, preservation and management of the information about live
performances (dance schools etc., preservation by restoring musical instruments or when recording a live perfomance, administration and protection by copyrights).
(75) The ESSnet framework for cultural statistics for the domain of Performing arts, constricts itself to live performing arts; if recorded or displayed on a screen, a performance falls under the Audiovisual domain. (76) Feasts and fairs are to be understood as cultural events where a form of performing arts takes places (on the contrary of fairs as conventions, for instance).

ESSnet‐CultureFinalReport
- 315-
II. International references and classifications as work tools
The 2009 FCS of the UNESCO gives this definition (p.24): ‘Performance and Celebration include all expressions of live cultural events. Performing Arts includes both professional and amateur activities, such as theatre, dance, opera and puppetry. It also includes the celebration of cultural events – Festivals, Feasts and Fairs – that occur locally and can be informal in nature. Music is defined in this domain in its entirety, regardless of format. As such, it includes live and recorded musical performances, music composition, music recordings, digital music including music downloads and uploads, and musical instruments’. The ESSnet-Culture and the UNESCO differently considers recorded music, either as an Audiovisual product (ESSnet-Culture), either as a Performance and Celebration outcome (UNESCO). As regards the economic classifications for measuring Performing arts, 3 of the 4-digit NACE Rev.2 fully cover the activities of performing arts. They are the NACE activities related to organisation of performing arts and arts facilities: 90.01, 90.02, 90.04.
The 90.01 NACE class includes:
Production of live theatrical presentations, concerts and opera or dance productions and other stage productions:
activities of groups, circuses or companies, orchestras or bands activities of individual artists such as actors, dancers, musicians, lecturers
or speakers
The 90.02 NACE class includes:
Support activities to performing arts for production of live theatrical presentations, concerts and opera or dance productions and other stage productions activities of directors, producers, stage-set designers and builders, scene
shifters, lighting engineers etc.
This item also includes: activities of producers or entrepreneurs of arts live events, with or without facilities.
The 90.04 NACE class includes:
Operation of concert and theatre halls and other arts facilities When considering the previous definitions of NACE classes, questions raise: the stage, on which a performance is presented, exists in different varieties. A performance can take place in a theatre, an opera or music hall, a cafe, a festival terrain, a school stage, the youth hall and even on the street. In cultural economic sense the stage, which is on average not free, accessible and build for making performing arts publicly available, is important. Economic activities like the theatres, the opera or music halls and other stages are mainly incorporated in NACE-code 90.04, the Arts facility operation services. As such they fall under the statistical cultural definition of Performing arts and allow to produce data on the general live creations and equipment. However, one specific performing arts genre is difficult to be measured: the festivals.

ESSnet‐CultureFinalReport
- 316-
The economy of festivals form a special group within the economic activities that make performing arts accessible for the public. This is for two reasons.
o These enterprises organise a festival by hiring several other parties, like tent builders, caterers, sanitation builders, road instruction builders, light and other effects specialist etc. The occupations approach include some of them (technicians) but the activities are not incorporated as cultural enterprises. In the case of the festival this is disputable. The line-up, determined by the organiser of the festival, is not the only thing necessary for making the performance accessible, you need the festival terrain, the tent and its stage etc. In a way the economic activities necessary to have a festival, are the arts facility operation service.
o The feasts (and to a lesser extent the fairs) are in many cases public events and in those cases often organised by local or federal government. As such the economic value/costs of (organising) performing arts will not be exclusively found among enterprises classified in the cultural NACE-codes 90.01, 90.02 and 90.04. Above shows, that it is difficult to lay boundaries, even if necessary to identify culture.
Table 48 – Coverage of performing arts through the classifications NACE and CPA
NACE-08
Section
NACE-08
Group Group label
NACE-08 Class
Class label CPA 2008
sub-category
CPA 2008 Comments
900
9001 Performing arts 90 01 10 Services of performing artists (actors, readers, singers, musicians, dancers, stunt people, television personality hosts/presenters, lecturers, speakers, circus artists and other performing artists, independent models).
90 01 10 Services of performing artists (actors, readers, singers, musicians, dancers, stunt people, television personality hosts/presenters, lecturers, speakers, circus artists and other performing artists, independent models).
9002
Support activities to performing arts
90 02 11 Performing arts event production and presentation services.
90 02 11 Performing arts event production and presentation services.
90 02 12 Performing arts event promotion and organisation services.
90 02 12 Performing arts event promotion and organisation services.
Incl. management services for rights attached to artistic, literary, musical works, except cinema & audio-visual works.
90 02 19 Other performing arts support services.
90 02 19 Other performing arts support services.
9004 Operation of arts facilities
90 04 10 Arts facility operation services (operation services of concert halls, theatres, opera houses, music halls, including ticket services; operation services of multipurpose centres and similar facilities with a cultural predominance).
90 04 10 Arts facility operation services (operation services of concert halls, theatres, opera houses, music halls, including ticket services; operation services of multipurpose centres and similar facilities with a cultural predominance).

ESSnet‐CultureFinalReport
- 317-
Other NACE codes are partly related to Performing arts: they cover several cultural domains at the same time (for example, schools for performing arts - 85 code- etc.):
85 52 11 Dancing schools and dance instructors services. 85 52 12 Music schools and music instructors services.
At last, some NACE codes have a very small proportion of cultural content, identifiable only at a detailed level, the products of the CPA (the NACE classes connected to these CPA are not cultural activities):
74 90 20 Other professional, technical and business services (including engagement in motion pictures, theatre or other entertainment)
79 90 39 Reservation services for event tickets, 93 29 21 Firework and ‘light and sound’ shows services.
The occupations, from the International Standard Classification of Occupations (ISCO-08) at 4 digit-level, entirely related to Performing arts are:
2354 Other music teachers 2652 Musicians, singers and composers 2653 Dancers and choreographers 2655 Actors 2659 Creative and performing artists not elsewhere classified
The produced goods necessary for Performing arts, such as scenery, music instruments etc. are not included in the Performing arts domain. They are either considered to belong to the domain of Visual arts or to be manufactured goods (ancillary products), the latter are not included in the cultural NACE or CPA codes (just like we do not aim at measuring the production of cultural products such as ink for the writer’s pen, nor the paper pulp for his sheet, nor his computer etc.). However, seven 4-digits codes from the European external trade classification (CN, Combined Nomenclature,) would allow to find and demarcate the musical instruments, in the Chapter 92 (92.01, 92.02, 92.05, 92.06, 92.07, 92.08, 92.09)(77). III. lllustrated sources
a) European sources
The Performing arts are poorly studied at European level: there are standard Labour force surveys but there is no standard European business survey. The economic dimension of Performing arts (though an economic sector of genuine importance among national policies) is not covered (except for employment) by EU surveys, and it is all the more unfortunate since the missing NACE 3-digit level (group 900, Creative, arts and entertainment activities) and even the 2-digit level (division 90, Creative, arts and entertainment activities) are entirely cultural (the group and the division cover both Performing and Visual arts).
(77) 92.01-Pianos, including automatic pianos; harpsichords and other keyboard stringed instruments; 92.02-Other string musical instruments; 92.05-Other wind musical instruments; 92.06-Percussion musical instruments; 92.07-Musical instruments, the sound of which is produced, or must be amplified, electrically; 92.08-Musical boxes, fairground organs, mechanical street organs, mechanical singing birds, musical saws and other musical instruments not falling within any other heading of this chapter; decoy calls of all kinds; whistles, call horns and other mouth–blown sound signalling instruments; 92.09-Parts and accessories.

ESSnet‐CultureFinalReport
- 318-
The Structural Business Statistics (SBS) embrace the business units (market-oriented). The survey does not cover enterprises listed under Division 90 which would contain the domains of Performing arts. The Short Term Business Statistics (STS) provide data on the 2-digit level of NACE which is not sufficient for identifying activities falling under Performing arts. The STS provides no information on Division 90. The Comext database provides information on external trade by product for the European countries. In the trade statistics, cultural products may be identified through two classifications, either CN at eight-digit level or CPA at four-digit level. When it comes to the latter, the Comext gives no information on Performing arts.
b) Other European sources
National administrative and statistical sources
Most European Member States are able to provide information on a high level of aggregation. Whether information on the level of the Performing arts can be compiled needs further investigation. This depends on the survey samples used in this research in the Member States (scope, level of accuracy etc.).
c) International sources
No real quantitative international database exists on Performing arts. The European Network of Information Centres for the Performing Arts (ENICPA, http://www.enicpa.net) is a portal whose main goal is to spread information for the professionals of Performing arts so that to encourage international mobility. The European Festivals Association (EFA, http://efa-aef.eu/en/activities) represents in particular festivals in the international cultural debate and publishes researches on festivals.

ESSnet‐CultureFinalReport
- 319-
7. AUDIOVISUAL & MULTIMEDIA
The Audiovisual domain includes radio, television, film, video, multimedia (including video games) and sound recording. Multimedia is in itself a cultural product whose status implies several cultural domains, Audiovisual but also graphics and designs of Visual arts and Advertising. UNESCO defines mutimedia as ‘A publication in which images, sound and text are integrated’. Multimedia may therefore be used in the following: Video games, Advertising, Films and animations, Artworks, Presentations. I. The ESSnet-Culture framework is interested in all types of activity that
relate to audiovisual:
o creation - the process of creating audiovisual works;
o production - For radio, television and film, this includes production and post-production activities. For video, multimedia and sound recording, this includes editing and publishing;
o creation and production are the primary activities used to measure the Audiovisual
domain;
o dissemination/trading - this includes broadcasting, distribution, projection, exhibition and trade;
o preservation - this includes preserving, protecting, restoring and digitising content;
o education/management & regulation – this includes any type of education/training
(which enable creation) or management activities that relate to these sectors. II. International references and classifications as work tools ‘The 2009 FCS of the UNESCO creates the Audio-visual and Interactive Media as such: The core elements of this domain are Radio and Television broadcasting (including Internet live streaming), Film and Video, and Interactive Media. Interactive Media covers video games and new forms of cultural expressions that mainly occur through the Web or with a computer. It includes online games, web portals, websites for activities (e.g. social networks such as Facebook), and Internet podcasting such as YouTube. However, Internet software and computers are considered to be infrastructure or tools and, for the production of interactive media content and should be included in the transversal domain Equipment and Supporting Materials. Interactive media and software are important fields of activity. While many interactive media products and services have a cultural end use (computer and video games, interactive web and mobile content), the same cannot be said for the software industry. Interactive Media is considered by the FCS to be part of the Audio-visual and Interactive
ESSnet‐CultureFinalReport
- 320-
media domain. In practice, this will depend on the classification system used and its ability to separate interactive media activities discretely from mainstream software and telecommunications activities. The Central Product Classification (CPC) allows for some, but not all, interactive media activities to be identified. When activities cannot be identified discretely in the CPC, or in other classification systems, these activities should be included as part of the transversal domain Equipment and Supporting Materials’. Under the UNESCO framework, audiovisual and interactive media are placed together in the same category. The ESSnet-Culture framework does the same but just call the domain ‘Audiovisual, Multimedia’. Audiovisual has gone under huge technological changes these last years and the interactivivity is indeed a very present concept, especially for cultural practices (e.g., the videogames went from individual game plays to the now social multiplayers on-line games or simulation life games, or even serious games just like in India where they are used for national healthcare prevention). The interactive media is thus a digital tool that transforms any domain, it is used everywhere (see interactive films, interactive museums, interactive art etc. to entertain, to engage, to educate at everyones’s own pace etc.). Besides the UNESCO concept is a broader concept including software in its Audiovisual domain. The Multimedia concept, as intended in the ESSnet-Culture framework, may also be interactive but not necessarily (an artwork made of sound, text and images do not necessarily request engagement from the audience). For measuring Audiovisual/Multimedia, some NACE classes consist entirely of audiovisual activities. These are mainly the NACE activities relating to production, distribution, publishing and broadcasting. They fully cover the activities of Audiovisual/Multimedia, even at the aggregated division (2-digit) and group levels (3-digit) of the NACE Rev.2:
59. Motion picture, video and television programme production, sound recording and music publishing activities
59.1 Motion picture, video and television programme activities (detailed by 4 NACE classes: 59.11, 59.12, 59.13,59.14);
59.2 Sound recording and music publishing activities (59.20).
60. Programming and broadcasting
60.1 Radio broadcasting (60.10); 60.2 Television programming and broadcasting activities (60.20);
The 58.21 class, Publishing of computer games, is an entirely cultural class from the Audiovisual/Multimedia domain. Apart from these 8 4-digit NACE classes that fit the strict sectoral approach of Audiovisual/Multimedia domain, 2 classes linked to dissemination are to be considered: 47.63- Retail sale of music and video recordings in specialised stores and 77.22- Rental of video tapes and disks. The NACE 63.91, News agency activities, concerns both Books & Press and Audiovisual with 2 distincts CPA codes: the one related to Audiovisual is the 63.91.12 code for News agency services to audio-visual media: gathering, investigating and supply services of news (manuscripts, photos, images) to radio or television stations and movie companies.

ESSnet‐CultureFinalReport
- 321-
Table 49 – Coverage of audiovisual and multimedia through the classifications NACE and CPA
NACE-08 Group
NACE-08 Class
Class label CPA 2008 sub-category
CPA 2008
591
5911 Motion picture, video and television programme production activities
59 11 11 Motion picture production services.
59 11 12 Promotional or advertisement motion picture and video production servives.
59 11 13 Other television programme production services.
59 11 21 Motion picture, video and television programme originals.
59 11 22 Cinematographic film.
59 11 23 Films and other video contant on disk, tape or other physical media.
59 11 24 Films and other video downloads.
59 11 30 Sale of advertisingspace or time in motion picture, video and television products.
5912 Motion picture, video and television programme post-production activities
59 12 11 Audio-visual editing services.
59 12 12 Transfers and duplication of masters services.
59 12 13 Colour correction and digital restoration services.
59 12 14 Visual effects services.
59 12 15 Animation services.
59 12 16 Captioning, titling and subtitling services.
59 12 17 Sound editing and design services
59 12 19 Other motion picture, video and television programme post-production services.
5913 Motion picture, video and television programme distribution activities
59 13 11 Licensing services for film rights and their revenues.
59 13 12 Other motion picture, video and television programme distribution services.
5914 Motion picture projection activities
59 14 10 Motion picture projection services.
582p 5821 Publishing of computer games
58 21 10 Computer games, packaged.
58 21 20 Computer games downloads.
58 21 30 On-line games.
58 21 40 Licensing services for the right to use computer games.
592 5920 Ound recording and music publishing activities
59 20 11 Sound recording services.
59 20 12 Live recording services.
59 20 13 Sound recording originals.
59 20 21 Radio programme production services.
59 20 22 Radio programme originals.
59 20 31 Printed music.
59 20 32 Electronic scores (musical compositions in electronic form).
59 20 33 Musical audio disks and tapes or other physical media.
59 20 34 Other audio disks and tapes.
59 20 35 Music downloads.
59 20 40 Licensing services for the right to use acoustic originals.
601 6010 Radio broadcasting
60 10 11 Radio programming and broadcasting services.
60 10 12 Radio broadcasting originals.
60 10 20 Radio channel programmes.
60 10 30 Radio advertising time.
602 6020 Television programming and broadcasting activities
60 20 11 On-line television programming and broadcasting services, except by subscription.
60 20 12 Other television programming and broadcasting services, except by subscription.

ESSnet‐CultureFinalReport
- 322-
60 20 13 On-line television subscription programming and broadcasting services.
60 20 14 Other television subscription programming and broadcasting services.
60 20 20 Television broadcasting originals.
60 20 31 Television channel programmes, except for subscription television.
60 20 32 Subscription television channel programmes.
60 20 40 Television advertising time.
476p 4763p Retail sale of music and video recordings in specialised stores
47 00 64 Retail trade services of music and video recordings.
772p 7722p Renting of video tapes and disks 77 22 10 Rental services of video tapes and disks.
Some NACE codes have a very small proportion of cultural content which can only be identified using the detailed CPA. Unfortunately, most available data sources do not provide data at this level of detail, and so these categories cannot be measured. The NACE classes associated with CPA categories below are not considered as cultural:
62 01 21 Computer games software originals 74 90 20 Other professional, technical and business services (incl. engagements in
motion pictures, theatre or other entertainment; placement of books, artworks etc.)
The following ISCO-08 codes are considered as entirely belonging to the Audiovisual domain:
2654 Film, stage and related directors and producers 2656 Announcers on radio, television and other media 3521 Broadcasting and audio-visual technicians
III. lllustrated sources
a) European sources
A good measurement of the audiovisual businesses is possible with the European statistics.
For the production of economic statistics on the Audiovisual domain, the SBS can be used because with 4-digit NACE codes.
The Comext database allows the measure of foreign trade of goods from the audiovisual domain.
Table 50 – Coverage of audiovisual and multimedia by economic European statistics
NACE-08 Division
NACE-08 Group
NACE-08 Class
Class label SBS
Regulation Comext STS Regulation
58p 582p 5821 Publishing of computer games
4-digit NACE data available on the following areas: number of employees, turnover, value added at factor cost. Data available
8-digit CN data for detailed products available (imports, exports, balance) in terms of value and quantity. Data availableannually and montly. 4-digit CPA data also
2-digit NACE data is apparently available on: turnover, labour input indicators, volume of sales (where applicable).
59 591 5911
5912
5913
Motion picture, video and television programme production activities

ESSnet‐CultureFinalReport
- 323-
5914 Motion picture, video and television programme post-production activities Motion picture, video and television programme distribution activities Motion picture projection activities
annually. available on foreign trade. Data available annually, quaterly and monthly.
592 5920 Sound recordin and music publishing activities
60 601 6010 Radio broadcasting
602 6020 Television programming and broadcasting ctivities
47p 47p 4763p Retail sale of music and video recordings in specialised stores
77p 772p 7722p Renting of video tapes and disks
Conclusion
Good coverage of all audiovisual NACE classes. But missing data from some Member States.
Good coverage of audiovisual CN categories. Reasonable coverage of foreign trade for some audiovisual CPA categories
No STS data on turnover for audiovisual categories.
Recommendation
Better coverage of audiovisual CPA categories needed in Comext.
Comment
Improve availability of national data for producing a quality aggregate.
Need better coverage of other audiovisual coes. Many 4-digit audiovisual CPA codes do not have foreign trade data in Comext.
The STS covers an aggregated level (2-digit Division 58, including non cultural sectors-publishing of directories and other activities).

ESSnet‐CultureFinalReport
- 324-
Table 51 – SBS data for the Audiovisual sector - main indicators, 2008 (unit=EUR million)
NACE Rev.2, Class 60.10 – Radio Broadcasting NACE Rev.2, Class 60.20 – TV programming & broadcasting activities
Country Number of enterprises
Turnover
Value added at
factor cost
Country Number
of enterprises
Turnover
Value added at
factor cost
Belgium : : : Belgium : : :
Bulgaria 84 16.6 5.7 Bulgaria 211 213.3 73.2
Czech Republic : : : Czech Republic : : :
Denmark 79 39.4 -19.1 Denmark 83 1 362.2 516.2Germany 291 2 194.3 1 420 Germany 140 1 0825.4 3 648.1
Estonia 28 11.9 3.3 Estonia 15 29.4 6.3
Spain 1 175 856.6 505.4 Spain 965 4 994.6 1 385.4
France 326 1 391.3 675.8 France 182 8 582.0 2 784.7
Italy 1 037 574.3 222.8 Italy 537 9 599.8 3 441.4
Cyprus 46 20.1 9.3 Cyprus 20 121.1 65.3
Latvia 42 20.1 9.3 Latvia 59 51 30.2
Lithuania 31 9.5 3.6 Lithuania 40 84.8 40.3
Luxembourg 8 : : Luxembourg 7 : :
Hungary 451 42.7 -7.8 Hungary 828 440.3 97.6Netherlands 91 : : Netherlands 36 : :
Austria 43 64.1 26.5 Austria 35 1 142.9 354.5
Poland 355 312.6 177.7 Poland 544 2 601.1 1 492.8
Portugal 276 72.1 38.8 Portugal 44 700.4 270.8
Slovenia 131 33.7 11.1 Slovenia 103 25.5 4
Slovakia 9 0.8 0.1 Slovakia 29 141.4 52.6
Finland 37 53.4 24.8 Finland 23 892 325.9
Sweden 65 : : Sweden 47 : :
UK 1 012 1 307.3 798 UK 1065 8 848.3 3 840.6
Norway 141 87.4 39.5 Norway 50 1 040.2 484.9
Croatia 187 : : Croatia 54 : :
NACE Rev.2, Class 59.11 – Motion picture, video and television programme production activities
NACE Rev.2, Class 59.12 – Motion picture, video and television programme post-production activities
Country Number of enterprises
Turnover
Value added at
factor cost
Country Number
of enterprises
Turnover
Value added at
factor cost
Belgium 1 453 839.3 269.7 Belgium 375 163.8 77.7
Bulgaria 228 56 14.2 Bulgaria 100 13.6 5.8
Czech Republic : : : Czech Republic : : :
Denmark 1 113 569.4 214.4 Denmark 108 48.6 21.5
Germany 3 981 3 748.6 1 729.9 Germany 966 311.6 172.9
Estonia 157 20.2 10.4 Estonia 11 : :
Spain : : : Spain : : :
France 7 409 5 534.1 3 578.2 France : : :
Italy 4 592 3 179.3 1 051.2 Italy 485 292.6 77.7
Cyprus 66 11.5 5.4 Cyprus 0 0 0
Latvia 112 21.1 7.7 Latvia 23 0.4 0.1
Lithuania 74 17 3.2 Lithuania 2 : :Luxembourg 103 47,2 9.2 Luxembourg 14 7.1 3.4
Hungary 2 925 264.9 34.2 Hungary 194 24.3 7.4
Netherlands 980 : : Netherlands 186 : :
Austria 1 222 377.2 135.4 Austria 77 12.2 6.4

ESSnet‐CultureFinalReport
- 325-
Poland 4 320 631.1 82.7 Poland 765 71.9 24.9
Portugal 1 371 407 98.3 Portugal 195 14 7
Slovenia 317 97.3 31.9 Slovenia 27 3.2 1
Slovakia 115 33.5 13.5 Slovakia 59 40.8 14.2
Finland 761 206.8 100.3 Finland 55 22.7 13.7
Sweden 4 391 1 471.5 386.6 Sweden 247 60.7 24
UK 9 382 9 998 -856.4 UK 2 316 1 438 741.6Norway 1 771 352.6 117.4 Norway 232 31.4 17
Croatia 393 58 18.2 Croatia 3 : :
NACE Rev.2, Class 59.13 – Motion picture, video and television programme distribution activities
NACE Rev.2, Class 59.14 – Motion picture projection
Country Number of enterprises
Turnover
Value added at
factor cost
Country Number
of enterprises
Turnover
Value added at
factor cost
Belgium 62 302.2 56.4 Belgium 76 197.9 68.7
Bulgaria 49 10.9 1.8 Bulgaria 20 6.8 1.4
Czech Republic : : : Czech Republic : : :
Denmark 60 249.2 50.8 Denmark 117 160.9 51.7
Germany 327 1 329 412.5 Germany 726 939.3 452.2
Estonia 0 0 0 Estonia 2 : :
Spain : : : Spain : : :
France : : : France : : :
Italy 328 1 466.7 711.2 Italy 981 719.5 163.4
Cyprus 7 1.3 0.7 Cyprus 9 13.8 6.2
Latvia 16 : : Latvia 10 : :
Lithuania 11 7.9 1.3 Lithuania 10 : :
Luxembourg 19 : : Luxembourg 4 : :
Hungary 169 329.3 23.1 Hungary 59 28.8 5.7
Netherlands 24 : : Netherlands 97 210.5 83Austria 81 68.2 18.9 Austria 123 142.5 39.6
Poland 232 159.7 86.9 Poland 172 233.7 85.3
Portugal 167 155.7 28.4 Portugal 152 93.9 24.4
Slovenia 23 12 1.7 Slovenia 20 22.5 7.7
Slovakia 12 21 6.9 Slovakia 7 5.6 0.3
Finland 32 145.5 16.8 Finland 65 75.6 22.3
Sweden 196 554.8 74.5 Sweden 107 164.6 53.4
UK 496 3 858.6 1 746.7 UK 225 1 432.7 461.2
Norway 31 242.3 64.4 Norway 141 134.2 40.4
Croatia 104 37.5 12 Croatia 35 : :
NACE Rev2., Class 58.21 – Publishing of computer games
NACE Rev.2, Class 59.20 – Sound recording and music publishing
Country Number of enterprises
Turnover
Value added at factor cost
Country Number of enterprises
Turnover
Value added at factor cost
Belgium 87 42.9 19.7 Belgium 830 194.2 73.7
Bulgaria 8 0 0 Bulgaria 102 7.5 2.5
Czech Republic : : : Czech Republic 1 148 80.3 27.1
Denmark 22 63.2 36 Denmark 342 96.6 29.2
Germany 119 312.9 104.1 Germany 1 845 1 467.3 660.1
Estonia 0 0 0 Estonia 75 5.9 1.7
Spain : : : Spain 660 244.1 86.8

ESSnet‐CultureFinalReport
- 326-
France : : : France 2 844 1 121.8 377.2
Italy 24 10.7 4.5 Italy 986 512.6 129.1
Cyprus 3 10 7.1 Cyprus 13 2.2 1.3
Latvia 3 : : Latvia 73 3.3 1.4
Lithuania 4 0.6 0.1 Lithuania 59 10.9 2
Luxembourg 2 : : Luxembourg 20 2.3 1.1
Hungary 3 1.2 0.3 Hungary 464 66.7 10.8Netherlands 0 0 0 Netherlands 597 : :
Austria 10 19.5 5.3 Austria 525 90.4 35.1
Poland 59 8.4 3.9 Poland 516 320 114.5
Portugal 17 0.7 0 Portugal 996 64.8 18.8
Slovenia 2 : : Slovenia 94 18.2 6.6
Slovakia 0 0 0 Slovakia 44 10.8 3.3
Finland 10 : : Finland 565 103.4 32.9
Sweden 172 218 84.3 Sweden 3 217 375.8 102.6
UK 256 612.5 55.2 UK 2 159 1 091.5 375
Norway 22 24.4 18 Norway 527 121.8 26.3
Croatia 0 0 0 Croatia 124 : :
Source: SBS database, Eurostat
Table 52 – SBS data for Retail sale of audiovisual goods - main indicators, 2008
NACE Rev.2, Class 47.63 – Retail sale of music and video recordings in specialised stores
Country Number of enterprises
Turnover
Value added at factor cost
EU-27 : : :Belgium : : :Bulgaria 129 5.4 0.3Czech Republic : : :Denmark 58 100.1 17.1Germany 198 138.3 30.1Estonia 32 6 0.9Irland : : :Spain : : :France : : :Italy 1 566 270.5 23.3Cyprus 39 5.2 1.1Latvia 23 5.6 1.2Lithuania 17 3.5 0.9Luxembourg 14 5.6 0.7Hungary 46 13.2 2.3Netherlands 357 445.1 67.2Austria 122 24.9 5.6Poland 1 050 220.6 29.2Portugal 239 30.2 7Romania 54 6.8 1.2Slovenia 7 0.3 0.1Slovakia 6 6.4 7Finland 75 19 3.8Sweden 342 65.4 7UK 682 2 211.8 337.4Norway 174 175.6 35.5Croatia 3 : :
Source: SBS database, Eurostat

ESSnet‐CultureFinalReport
- 327-
Table 53 - EU-27 External trade by CPA, 2009
CPA 2008 CN - CHINA EU-27, EXTRA EU-27, INTRA
1 - IMPORT 2 - EXPORT 1 - IMPORT 2 - EXPORT 1 - IMPORT 2 - EXPORT
59.11 – Motion picture, video and TV programme production activities
10 504 046 25 581 510 228 435 490 697 390 891 3 283 119 755 3 509 187 345
59.20 – Sound recording and music publishing
4 814 844 2 751 875 114 283 225 290 845 985 148 705 639 951 794 904
Source: Comext database (Data not available for other audiovisual categories)
Table 54 - Number of persons employed (in 1000's) in Audiovisual (production and
programming), by age group, 2009
From 15 to 24 years
From 25 to 24 years
From 50 to 59 years
From 50 to 64 years
65 years or over
EU-27 38.9 345.7 154.2 190.8 :
Scope: Total employment, NACE Rev.2 =59 & 60 Source: EU-LFS, Eurostat
b) Other European sources
Cinema and Television are 2 audiovisual sectors that are covered by national sources. Undoubtfully, this is not sufficient for the whole Audiovisual sector and specific comparisons on national methodologies are requested as in all sectors for expertise of comparability.
European Audiovisual Observatory, http://www.obs.coe.int/index.html.en –produces a yearbook on film, television and video in Europe. However, this does not cover other audiovisual areas, and comparable data is not available across other cultural sectors.
Media Salles, http://www.mediasalles.it – produce a European cinema yearbook, containing comparisons of cinema across Europe, and some data on digital cinema worldwide. However, this is limited to cinema only, and no comparable data source is put together for other audiovisual/culture sectors.
c) International sources
UNESCO/UIS - Feature Film Statistics Survey. Whilst useful to compare film in European countries, this does not cover other audiovisual areas, or offer comparable data across the wider cultural sector.

ESSnet‐CultureFinalReport
- 328-
8. ARCHITECTURE
In the report from the LEG culture project (2000), ‘The Task Force began by reviewing several issues connected with demarcating the field. On the basis of a working paper presented in Amsterdam and subsequent national contributions, it was agreed: to include the domain "architecture". This was the subject of lengthy debate, but the conclusion was that creative architectural activities (the work of architects) should be included,(…)’. I. International references and classifications as work tools The renewed UNESCO framework for cultural statistics (2009) defines architecture in domains F, Design and Creative Services (p.26): ‘The Design and Creative Services domain did not exist in the 1986 FCS from UNESCO, (1986). This domain covers activities, goods and services resulting from the creative, artistic and aesthetic design of objects, buildings and landscape. The domain includes Fashion, Graphic and Interior Design, Landscape Design, Architectural and Advertising Services. Architecture and Advertising are part of the core cultural domains, but only as services. The primary purpose of architectural and advertising services is to provide a creative service, or an intermediary input, into a final product that is not always cultural. For example, the final product of creative advertising services may be a commercial advertisement, which is not a cultural product itself, but is generated by some creative activity. In order to avoid double counting, decisions are made to categorize some design activity into other categories rather than in domain F. For example, all buildings that are included as part of heritage are already considered in the domain A, Cultural and Natural Heritage, while Interactive design media content is included in Domain E, Audio-visual and Interactive Media’. In the ESSnet-Culture framework, architecture activities are included as a part. Both the 2000 LEG-Culture and the 2009 UNESCO frameworks considered architecture as a cultural activity. However it is important to delimit these activities to the ones of design and architectural counseling with respect to the design. Construction and engineering activities are not considered as cultural ones by the ESSnet-Culture. Creative architectural activities (the work of architects) were already included in the LEG-Culture framework even if statistical classifications at that time did not allow to distinguish architectural services from technical engineering ones. This has been changed since then (with NACE Rev.2). Included in these architectural activities are architectural also design services of landscapes or landscaping. For architecture, the identified functions of the ESSnet-Culture framework that are considered relevant are the function of creation, of dissemination (exhibitions), of preservation as well as the interdisciplinary activities of education and administration. When measuring cultural activities different indicators can be used. The primary classifications to identify cultural activities by domains (let aside the detailed indicators on employment, financing, consumption or participation that are considered within other chapters) are NACE Rev.2, CPA and ISCO-08.
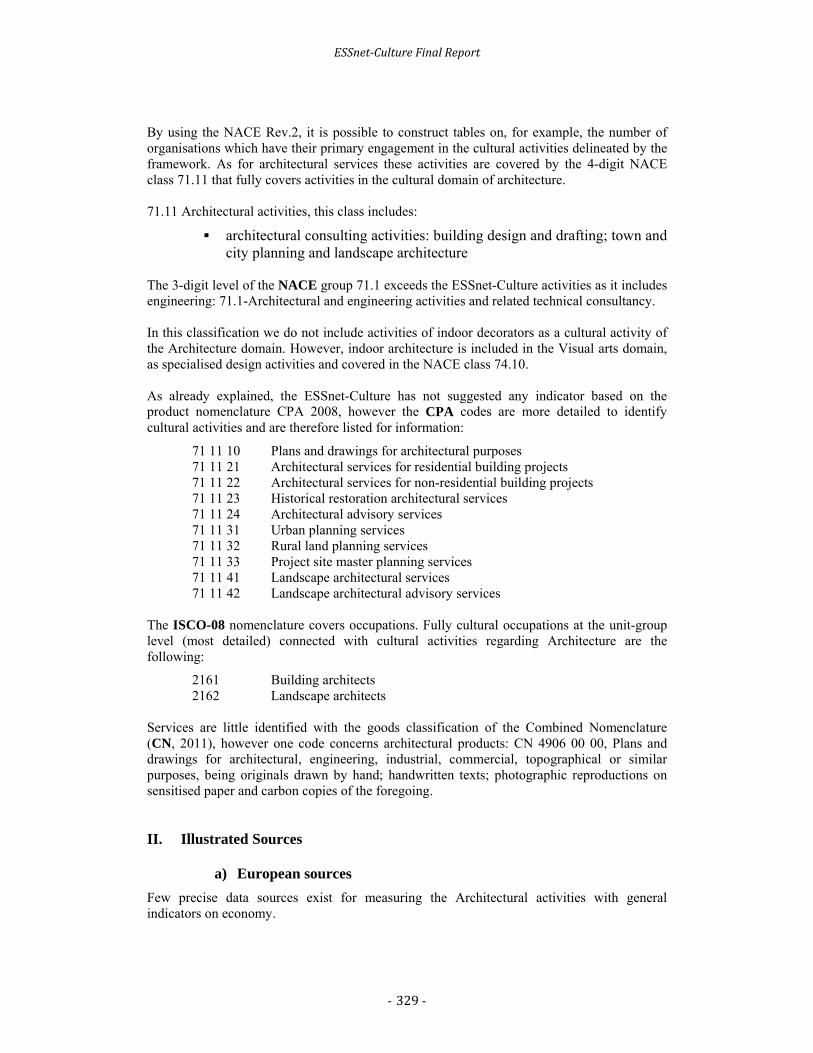
ESSnet‐CultureFinalReport
- 329-
By using the NACE Rev.2, it is possible to construct tables on, for example, the number of organisations which have their primary engagement in the cultural activities delineated by the framework. As for architectural services these activities are covered by the 4-digit NACE class 71.11 that fully covers activities in the cultural domain of architecture. 71.11 Architectural activities, this class includes:
architectural consulting activities: building design and drafting; town and city planning and landscape architecture
The 3-digit level of the NACE group 71.1 exceeds the ESSnet-Culture activities as it includes engineering: 71.1-Architectural and engineering activities and related technical consultancy. In this classification we do not include activities of indoor decorators as a cultural activity of the Architecture domain. However, indoor architecture is included in the Visual arts domain, as specialised design activities and covered in the NACE class 74.10. As already explained, the ESSnet-Culture has not suggested any indicator based on the product nomenclature CPA 2008, however the CPA codes are more detailed to identify cultural activities and are therefore listed for information:
71 11 10 Plans and drawings for architectural purposes 71 11 21 Architectural services for residential building projects 71 11 22 Architectural services for non-residential building projects 71 11 23 Historical restoration architectural services 71 11 24 Architectural advisory services 71 11 31 Urban planning services 71 11 32 Rural land planning services 71 11 33 Project site master planning services 71 11 41 Landscape architectural services 71 11 42 Landscape architectural advisory services
The ISCO-08 nomenclature covers occupations. Fully cultural occupations at the unit-group level (most detailed) connected with cultural activities regarding Architecture are the following:
2161 Building architects 2162 Landscape architects
Services are little identified with the goods classification of the Combined Nomenclature (CN, 2011), however one code concerns architectural products: CN 4906 00 00, Plans and drawings for architectural, engineering, industrial, commercial, topographical or similar purposes, being originals drawn by hand; handwritten texts; photographic reproductions on sensitised paper and carbon copies of the foregoing. II. Illustrated Sources
a) European sources
Few precise data sources exist for measuring the Architectural activities with general indicators on economy.

ESSnet‐CultureFinalReport
- 330-
The ESSnet-Culture suggests the use of the NACE class at the 4-digit level (71.11), because the 3-digit level (and above) leads to over-coverage and overestimation of cultural activities. It is important in order to follow and respect the framework for cultural activities that the resolution in the specific data content is correct. The SBS regulation produce data for the architectural activities of the NACE class 71.11. However, the results need further expertise, in particular as concerns confidential data (see the following table and questions on values). The production of STS indices are based on an aggregated level, the 2-digit Division 71, including non-cultural sectors of engineering activities; technical testing and analysis.
Table 55 – SBS data on architectural services, 2008
Country Number of enterprises
Turn-over (EUR millions)
Value added at factor cost
(EUR millions)
EU-27 292,082 46,637.72 2,6651.18
Belgium 13,228 2,261.9 877.6
Bulgaria 2,516 171.6 89.8
Czech Republic : : :
Denmark 2,005 1,030.5 527.6
Germany 31,308 7,334.1 5,067.6
Estonia 369 52.6 28.8
Ireland 2,425 1,069.6 700.9
Spain 64,804 5,822.8 3,352.7
France : : :
Italy 70,084 3,814.8 2,721.1
Cyprus 398 72.8 56.4
Latvia 603 156.0 67.3
Lithuania 797 160.9 75.9
Luxembourg 514 211.1 125.7
Hungary 4,847 408.4 111.5
Netherlands 3,085 1,928.6 1,076.2
Austria 5,268 1,595.4 934.2
Poland 15,082 2,176.4 740.3
Portugal 10,403 586.6 233.0
Romania 2,020 378.4 166.6
Slovenia 1,276 270.0 91.6
Slovakia 481 181.4 96.9
Finland 1,628 363.8 247.6
Sweden 3,413 697.9 437.2
United Kingdom 9,499 7,094.8 4,437.1
Norway 1,860 698.2 442.4
Croatia 716 67.6 35.4
Source: SBS database, Eurostat
b) Other European sources
According to the Inventory on national sources, only around 20 % of Member States have administrative sources or national surveys on architecture.

ESSnet‐CultureFinalReport
- 331-
c) International sources
The Architects' Council of Europe (ACE, http://www.ace-cae.org)
The European Council of Interior Architects (ECIA, http://www.ecia.net)
The European Federation for Landscape Architecture (EFLA, http://europe.iflaonline.org)

ESSnet‐CultureFinalReport
- 332-
9. ADVERTISITING
The 2000 LEG-Culture did not include advertising while the renewed 2009 UNESCO framework did it and expressed the Creative-Cultural debate as: “Many countries have used the term ‘creative’ to describe these industries, but many industries within a creative ‘sector’ may not be creative. The definition and measurement of creativity is in itself subject to much debate. Creative industries usually cover a broader scope than traditional artistic domains with the inclusion, for example, of all ICT industries or research and development. The framework addresses this issue by allowing the inclusion of some specific creative industries (design and advertising) as a separate domain”(p.19). I. International reference and classifications as work tools The domain F ‘Design and Creative Services’ did not exist in the 1986 FCS of UNESCO. This domain covers activities, goods and services resulting from the creative, artistic and aesthetic design of objects, buildings and landscape. The domain includes fashion, graphic and interior design, landscape design, architectural and advertising services. Architecture and advertising are part of the core cultural domains but only as services. The primary purpose of architectural and advertising services is to provide a creative service, or an intermediary input, into a final product that is not always cultural. For example, the final product of creative advertising services may be a commercial advertisement which is not a cultural product itself, but is generated by some creative activity. In order to avoid double counting, decisions are made to categorize some design activity into other categories rather than in domain F. After comparison with the UNESCO FCS 2009, ESSnet-Culture has proposed to change the original LEG-framework (LEG 2000) and include the advertising activities. As a matter of fact, UNESCO includes advertising in its new framework (along with design and architecture) and in its 2007 draft cultural framework paper, recorded that 13 out of 14 international reviewed frameworks also included advertising within culture. The ESSnet-Culture insists on the creation function as being the core of cultural activities and therefore do not include the production of advertising material (whatever material, stands, printed material etc.), the conducting of marketing campaigns or other promotional activities. The advertising activities centered on creation of original works (writing of scenarios and creation of designs as well as counseling services) are included on account of its real potentiality for artistic creation(78). The promoting aspect (see marketing) would not be considered as a cultural activity.
The domain of advertising is based on two main activities:
o activities of creation of original works; o activities of disseminating these works (mainly exhibitions).
(78) See Essnet-Culture TF1: General definitions and functions, 07/2010

ESSnet‐CultureFinalReport
- 333-
The interdisciplinary activities of education (training to advertising techniques and tools) and administration as well as the financing activities are the support activities linked to all sectoral domains. By using the statistical classifications NACE Rev.2 it is possible to construct a table on, for example, the number of organisations which have their primary engagement in the cultural activities delineated by the framework. In the NACE Rev.2 advertising activities can be found in the 4-digit class 73.11- Advertising agencies. According to the documentation this class includes the provision of a full range of advertising services (i.e., through in-house capabilities or subcontracting) including advice, creative services, production of advertising material, and buying. However, besides activities as creation of advertising campaigns, it also includes the implementation of advertising campaigns which imply the inclusion of activities which are not by the ESSnet-Culture to be considered as cultural activities. Therefore, the 73.11 code is not entirely cultural. Example of the mixing of activities in 73.11:
Creation and realisation of advertising campaigns:
o creating and placing advertising in newspapers, periodicals, radio, television, the Internet and other media;
o creating and placing of outdoor advertising, e.g. billboards, panels, bulletins and frames, window dressing, showroom;
o design, car and bus carding etc.; o a-erial advertising; o distribution or delivery of advertising material or samples; o creation of stands and other display structures and sites; o conducting marketing campaigns and other advertising services
aimed at attracting and retaining customers; o promotion of products; o point-of-sale marketing; o direct mail advertising; o marketing consulting.
The above classification includes both the creation of advertisement and the ‘placing’ of this in media. Advertisement indicators based on the NACE Rev.2 can thus only be considered as partly cultural activities in the ESSnet-Culture perspective. The product classification, CPA 2008, offers the opportunity to delimit the NACE code 73.11 somewhat by focusing on two classes of products. 7311p Advertising agencies:
73 11 11: Full service advertising services. As provision of the full range of advertising services, including planning, creation and execution services, such as: selection of media to be used , design of advertisements, illustrations, posters etc., writing of scenarios for advertising movies, placement in media, planning (without production) of advertising objects or films and organisation of direct marketing or direct mail advertising campaigns.
73 11 13: Advertising design and concept development service. includes: creating the basic idea for an advertisement, drafting the words, designing the layout for a print advertisement, illustration, poster and writing of scenarios for advertising movies

ESSnet‐CultureFinalReport
- 334-
Albeit this delimitation there will be some overcoverage of activities not considered as cultural ones. However by using this delimitation of advertising activities these could be accounted for as fully cultural activities, vigilance is therefore necessary. The ISCO-08 nomenclature covers occupations. There is no specific fully cultural occupations described for advertisers at the unit-group level (most detailed) connected with cultural activities regarding the creation in Advertising. And Advertising design activities here defined can neither be identified within the Combined Nomenclature (CN8) or Standard Industrial Trade Classification (SITC rev 3). II. Illustrated Sources
a) European sources
No harmonized sectoral and economic statistics are available for the domain of Advertising as the NACE 73.11 class is too broad and needs to be estimated for the cultural part from the Structural Business Statistics (SBS) and the Short-term business statistics (STS)(79).
b) International sources
The International Advertising Association (IAA, http://www.iaaglobal.org): information and promotion of advertising and marketing among professionals
The European Association of Communications Agencies (EACA, http://www.eaca.be): only figures on advertising expenditure by economic sector
European Interactive Advertising Association (EIAA, http://www.eiaa.net): centred on interactive media, gives information, do research work on online advertising as a medium
(79) When 185 865 firms in the EU are numbered in the 2008 annual detailed entreprise statistics (SBS, class 73.11 of NACE Rev.2), only assessment by branches and estimates could define the cultural activities of units working on advertising creation.

ESSnet‐CultureFinalReport
- 335-
10. ART CRAFT
Neither the 2000 LEG Framework nor the 1986 UNESCO one included art crafts in the cultural field. The 2009 UNESCO changed this position and included crafts as artisanal products, considering them as a significant side of traditional knowledge and important source of income in many countries. The 2009 UNESCO framework places crafts either within Visual arts and Crafts (traditional crafts) or within Design and creative services (for contemporary crafts). The ESSnet-Culture framework acknowledges the artistic and cultural importance of crafts in general (for preserving diversity of traditions and know-how, for encouraging creation, for local economies, trade and tourism etc.) and proposes to add artistic crafts and create a new cultural domain ‘Art crafts’: the ESSnet-Culture restricts its approach to original artistic and cultural products. Just like for advertising, the Art crafts domain is understood as the creation of one-off production, industrial crafts are therefore not included. The artistic craftwork essentially comes under the creation function. Art crafts require traditional skills, technical and complex know-how to transform materials and produce unique pieces or small series whose artistic feature is real. Art crafts are often classified by types of materials (wood, textiles, leather, ceramics etc.) or by domains in which art crafts are essential (see the connection of cultural domains with art crafts, e.g. wardrobe for performing arts, restoration of engravings for visual arts etc.). The creation function is the main function of art crafts and the whole organization of art crafts originate from creation. The artistic creation may relate to individual artisans or small-size structures that follow an artistic conduct (just like other independent artists, writers, visual artists, dancers etc.). It may also be constructed around contemporary and public spaces (art crafts for customizing interior design, for architecture, for public equipment etc.). And it has also its ‘raison d’être’ within heritage and preservation, for example by creating stained glass windows for the restoring of a church, or with the handicrafts workshops of museums to restore heritage furniture etc. The function of production is closely linked with the function of creation, the creator being quite often the same actor. In that sense, creation in art crafts and new artistic creation with digital forms have similar structures and mix the sequences of creation, production and dissemination. The interdisciplinary activities of education, of administration and regulation, as well as the financing activities are the support activities linked to all sectoral domains. I. International references UNESCO, FCS 2009 (p.26): “The FCS adopts the International Trade Center (ITC) and UNESCO definition of Crafts, or artisanal products, described as ‘those produced by artisans, either completely by hand or with the help of hand-tools or even mechanical means, as long as the direct manual contribution of the artisan remains the most substantial component of the finished product. The special nature of artisanal products derives from their

ESSnet‐CultureFinalReport
- 336-
distinctive features, which can be utilitarian, aesthetic, artistic, creative, culturally attached, decorative, functional, traditional, religiously and socially symbolic and significant’ (UNESCO and ITC, 1997). UNESCO (UNESCO and ITC, 1997) has identified six broad categories of artisanal products based on the materials used: Baskets/wickers/vegetable fibre-works; Leather; Metal; Pottery; Textiles and Wood. The guide also identifies complementary categories comprising materials in craft production that are either very specific to a given area, or rare, or difficult to work, such as stone, glass, ivory, bone, shell, mother-of-pearl etc. Extra categories are also identified when different materials and techniques are applied at the same time and refer to decorations, jewellery, musical instruments, toys, and works of art. Many crafts objects are produced industrially; nevertheless, FCS considers the products, which have a traditional character (pattern, design, technology or material) as part of the FCS. Contemporary crafts are not in Visual Arts and Crafts, but are included in Domain F, the Design and Creative Services domain”. The art crafts sector is an informal economic sector and European statistical classifications do not take into account art crafts activities as specific ones. Distinction between handcrafted products or machine-made crafts does not appear (except for two products, handmade lace (CN 5804 3000) and hand-woven tapestries (CN 5805 00 00): it is therefore not possible to identify the traditional activities related to art crafts within the NACE classification (only industrial activities are listed). The products classification, CPA, does not neither allow to distinguish the method of production used (hand-made as compared to industrial). The measure of activities and products of art crafts is impossible but by estimating within each industrial activity the proportion of traditional ones. The occupations nomenclature (ISCO-08) covers and offers the possibility to pick out occupations described for handicraft workers:
7312 Musical instrument makers and tuners 7313 Jewellery and precious-metal workers 7314 Potters and related workers 7315 Glass makers, cutters, grinders and finishers 7316 Sign writers, decorative painters, engravers and etchers 7317 Handicraft workers in wood, basketry and related materials 7318 Handicraft workers in textile, leather and related materials 7319 Handicraft workers not elsewhere classified
II. Illustrated sources
a) European sources
No harmonized source is available for producing overall statistics on Art crafts.
b) International sources
International networks for collecting and disseminating data to produce statistics on crafts are absent. Nonetheless, some documentary networks are identified:
The European Association of Craft, Small and Medium-sized Enterprises (UEAPME), http://www.ueapme.com

ESSnet‐CultureFinalReport
- 337-
Documentary reference:
UNESCO ‘Methodological Guide to the Collection of Data on Crafts’ (1997)


ESSnet‐CultureFinalReport
- 339-
IS IT POSSIBLE TO MEASURE INTANGIBLE CULTURAL HERITAGE?
AN UPDATE OF WHAT AND WHERE TO LOOK FOR IT
By Adolfo Morrone, Culture, leisure and new technologies - Italian National Statistical Office –ISTAT (Italy)
Intangible heritage is defined in UNESCO’s Convention for the Safeguarding of the Intangible Cultural Heritage (hereafter ICH Convention) as ‘the practices, representations, expressions, knowledge, skills – as well as the instruments, objects, artefacts and cultural spaces associated therewith – that communities, groups and, in some cases, individuals recognize as part of their cultural heritage’ (Article 2.1).(80) The ICH is defined as a transversal category in UNESCO’s Framework for Cultural Statistics (FCS), which specifies that ‘ICH can only be defined as such when a community recognises it as part of its heritage. In other terms there is nothing intrinsic in the expression or practise itself that would allow outsiders (governments, statisticians, researchers) to define it as ICH. The identification as well as definition of ICH therefore rests with the community, groups, individuals that create, maintain and transmit such heritage’. Starting from the UNESCO definition, the paper tries to ascertain if any kind of statistical or economical value can be added to the intangibility of a practice or skill. Furthermore, the paper considers the possibility to single out the tangible materiality of the associated crafts and cultural spaces, which are usually counted elsewhere. This document aims to give an overview of some methods to measure ICH in the EU countries and it is intended as a contribution to the TF1 of the ESSnet on Culture.
1. Defining the field of study
The UNESCO Intangible Heritage Lists(81) includes three different lists:
o the list of Intangible Heritage in need of urgent safeguarding which came into being in Abu Dhabi and includes 12 elements;
o the Representative List which includes 166 elements inscribed according to criteria defined in the operational directives of the Convention;
o the register of safeguarding programmes, projects and activities that are considered to reflect the principles and objectives of the Convention.
(80) UNESCO (17 October 2003), Convention for the Safeguarding of the Intangible Cultural Heritage, Paris, http://unesdoc.unesco.org/images/0013/001325/132540e.pdf (81) http://www.unesco.org/culture/ich/en/lists

ESSnet‐CultureFinalReport
- 340-
Table 35 shows the distribution by country of the thirty European ICH, amongst those in the UNESCO databases(82). Two ICH are in need of urgent safeguarding, one of best practice and 27 ICH expressions from the Representative List. It is important, however, to underline that these lists are not exhaustive. UNESCO itself recognises that its ICH lists shouldn’t be considered comprehensive or prescriptive and insists that forms of ICH are defined by the communities that participate in them.
Table 56 - ICH expression in Europe
Country Urgent
safeguarding list
Representative list
Best practices
Belgium - 3 - Bulgaria - 2 - Cyprus - 1 - Czech Republic - 1 - Estonia - 3 - France 1 4 - Hungary - 1 -Italy - 2 - Latvia 1 1 - Lithuania - 2 - Romania - 2 - Slovakia - 1 - Spain - 4 1
Total 2 27 1
Source: UNESCO The ICH exhibits a range broadly consistent with the FCS typology, which can be categorised under the headings of: oral traditions and expressions including language; performing arts; social practices, rituals and festive events; traditional craftsmanship. In the FCS, ICH is categorised as a transversal domain ‘to reflect the uniqueness of this category. Intangible heritage can be reflected for example in crafts or performing arts. Intangible cultural heritage can be expressed through social practices, rituals […]’ (FCS 2009, p. 27). This diplomatic statement does not help statisticians who are faced with the task of measuring ICH. It hides two crucial issues. Firstly, the problem of defining and identifying the ICH expressions and who should be the object of statistical measurement. Secondly, these processes and practices generally produce tangible cultural products or services, which are likely to be accounted for elsewhere in the framework. The challenge then becomes not only how to measure the intangible process, but also how to clean up these tangible results from other statistical categories in order to avoid double counting. To illustrate which statistical problem will face researchers who want to measure ICH, Italy’s Festival of the Ceri in Gubbio could be taken as an example. The event itself is a religious festival which is likely to be categorized under domain B, Performance & Celebration. The accompanying relics and artefacts will be counted in domain A, Cultural & Natural Heritage. Moreover, the participants are volunteers who take time away from their primary occupation to participate in the festival, so their activities are likely to not be captured at all by the
(82) Some ICH are counted twice because they are present in more than one countries.

ESSnet‐CultureFinalReport
- 341-
international standard measures, such as ISCO, which are used in the FCS. These issues apply to many forms of ICH, and present real barriers to collecting reliable statistics about them (Singh et al., 2009). Some might argue that the value of the intangible heritage itself might be exclusive of the tangible cultural expressions but this is misleading; the importance of ICH outperform the value of the tangible products: ‘to carry the Cero is a very important act in the life of an eugubino, almost like a qualifying badge’(83). This sense of belonging, which is not captured by the tangible products of the festival nor by the data on economic input driven by the event, is the intangible quid which transforms a cultural practise into an ICH expression. The FCS acknowledges this limitation noting that ‘new instruments need to be developed to capture all cultural phenomena especially the social dimension such as measuring intangible heritage’ (FCS 2009, p. 31). The question arises why the Ceri in Gubbio could be considered as part of ICH while the Techno parade in Paris most likely will not? Following the definitions for ‘intangible cultural heritage’ provided by several countries(F84F), ICH is often identified with the notion of folklore, tradition and identity. Therefore it is possible to say that ICH deals with traditional expressions of folklore, which are relevant for the cultural identity of a nation, a community or a specific group of the population. Nevertheless what is really crucial in the ICH definition is the fact that ICH must be identified as such by a specific community or population group. This means, and the UNESCO definition is very clear on this point, that there is no possibility to decide a-priori what is ICH and what is not. This means that before even starting a discussion on how to measure ICH it is necessary to identify ICH expressions at national level.
2. Identification and measurement of ICH expressions
2.1 Identification ICH resides everywhere and yet, within any given region, is often invisible. Sometimes ICH is located in specific physical location, as for example communities sharing an endangered language and specific traditions, but it is quite different from the tangible cultural heritage, which is often ‘frozen’ in collections of different kinds. ICH, on the other hand, exists in both formal and informal contexts, which are often highly localised geographically. Specialised knowledge may be retained as an oral tradition only by small subgroups of specific regional or ethnic minorities. Measurement of ICH cannot then avoid a preliminary work of identification of relevant expressions. The huge diversity, multiple scales and geographical range of examples of ICH expressions render the scoping and mapping for inventory purposes a significant challenge. What is required is to devise a method or methods, which can efficiently and cost effectively capture examples whether near or far from the mainstream, and from the margins of each and every community culture. Sources of data in themselves may be less important than finding secure access routes to practitioners and knowledge that is the focus of primary attention for accessing and living ICH. Approaches can therefore be categorised on the basis of ‘sources’ on the one hand, and ‘routes’ towards knowledge, or data held for a variety of policy support purposes on the other (McCleery et al. 2008).
(83) http://www.ceri.it/ceri_eng/figures/index.htm (84) http://www.unesco.org/culture/ich/doc/src/00078-EN.pdf

ESSnet‐CultureFinalReport
- 342-
Sources include gathering data by questionnaire surveys, standard search and reference tools such as Google, local newspapers, national bodies and some existing data collections. Routes include the support of ethnic minority community organisations and local authorities. The results of the data collection should be organised in a database designed to be easy-to-use and flexible across categories and over time.
2.2 Mesurrement Starting from an existing database of ICH expressions it is possible to collect statistical information using different methods.
The first method for estimating the value of intangible expressions is the Contingent Valuation Method (CVM) - a survey conducted on a simple random sample of direct, indirect, and non-users where participants are asked their willingness to pay (WTP) for a certain good and their willingness to accept a decrease in said good to determine the consumer surplus (Cuccia, T., 2003).
Second, a stated preferences questionnaire could be sent to experts on the particular ICH expression or to community leaders to measure their attitudes towards preservation and valuation.
Third, to supplement the first two methods, an institutional valuation - carried out through public and private cultural policy institutions, if they exist - could be calculated using the cost of maintaining the ICH expression and the opportunity cost of the leisure time visitors and participants spend engaging with the cultural space.
Fourth, another way of measuring revealed preferences is through a social participation survey. The amount of time and money that users spend in order to consume the ICH expression says a lot about their WTP for such a good. A social participation survey should ask users to name the activities they engage in, how much time they spend on each activity, and why these are important to the community within the cultural space. A social participation may also measure averting behaviour, or the amount of time and money users spend to avoid the loss of the cultural space - this may include non-commercial activities such as engaging in voluntary community expressions, passing traditions down to subsequent generations, and taking the time and energy to preserve a language.
The following table summarises the pro and cons of the four methods.
Contingent valuation
method Specific questionnaire to community Institutional valuation Social participation
survey
Advantages Eco approach Allows a precise overview of the ICH expressions in a specific community. Useful to build databases of ICH
It is possible to have an harmonised data collection at national level
Use existing survey (e.g. Time use)

ESSnet‐CultureFinalReport
- 343-
Disadvantages Subjective value measured Small size sample
Difficult to translate into specific indicators comparable at international level
Public and private cultural policy institutions often have an incomplete idea of the ICH expressions in their countries.
Difficult to distinguish between ICH and non-ICH expressions.
In the framework of the ESSnet the main issue is to evaluate how these methods can be applied to different ICH expressions and, in particular, if it is possible to define general harmonised indicators of ICH. To simplify the task, this paper follows - with some changes -the classification proposed by Singh et al. which divides ICH in:
cultural Spaces
oral tradition and expressions o traditional know-how; o language.
performances: o performing arts; o social practises o rituals; o festive events.
procedures: o Traditional craftsmanship
3. Cultural spaces It is possible to assess the total economic value of a cultural space from the UNESCO list of intangible cultural heritage, which currently lists 10 such spaces. This includes the value of preserving the cultural space for future generations and the sum of all the services provided within the given space. Demand for these often-esoteric intangible cultural spaces is not necessarily a good indicator of value, so a more holistic valuation method must be used. The benefits derived from a given cultural space can be measured by its influence on the users and the non-users.
a) Users include both direct users such as members of the community, scholars, and cultural tourists and indirect users such as those who enjoy reading about the cultural space and/or watching documentaries about it.
b) Non-users include those who do not interact with the cultural space in any way but
would be willing to pay for its preservation so that others may use it and so that it may be a bequeathed to future generations of consumers who are not able to express their preferences.
The most useful method in this case is the contingent valuation method, which asks a sample of both users and non-users for their willingness to pay for the preservation of the cultural space. However, only two of the thirteen international cultural spaces are in the EU and therefore this domain is not of crucial relevance in this framework.

ESSnet‐CultureFinalReport
- 344-
4. Oral tradiotion and expressions This domain encompasses an enormous variety of spoken forms including proverbs, riddles, tales, nursery rhymes, legends, myths, epic songs and poems, charms, prayers, chants, songs, dramatic performances and more. Oral traditions and expressions are used to pass on knowledge, cultural and social values and collective memory. They play a crucial part in keeping cultures alive. Measuring these aspects, however, is a daunting task and, in the framework of the ESSnet-Culture, it is not feasible to propose a harmonised data collection on oral tradition and expressions. Nevertheless it is possible to collect proxy information focused on languages, which underpins the intangible heritage of many communities and is included in Article 2 of the Convention as a means of transmitting intangible cultural heritage. A good starting point could be the UNESCO database of endangered languages which, continually updated by a growing network of experts and community members, provides state-of-the-art knowledge on this issue. It would also be useful to review the existing national policies for the safeguarding of linguistic diversity in order to verify which languages are recognised as protected languages (if any) by national laws.(85) Many countries already collect language data as part of a census, which may prove to be an excellent source of data on endangered languages. Moreover, in countries where the education system guarantees courses in specific protected languages it could be possible to use administrative sources to publish data on the number of pupils who follow courses in protected languages or the number of hours of training.
5. Performances ICH performances include performing arts, which range from vocal and instrumental music, dance and theatre to pantomime, sung verse and beyond. They include numerous cultural expressions that reflect human creativity and that are also found, to some extent, in many other intangible cultural heritage domains. Social practices, rituals and festive events which are habitual activities that structure the lives of communities and groups and that are shared by and relevant to many of their members. They are significant because they reaffirm the identity of those who practice them as a group or a society and, whether performed in public or private, are closely linked to important events. Social, ritual and festive practices may help to mark the passing of the seasons, events in the agricultural calendar or stages of a person’s life. They are closely linked to a community’s worldview and perception of its own history and memory. They vary from small gatherings to large-scale social celebrations and commemorations. Scarcity is an important factor to consider when placing value on ICH performances. Scarcity with intangible cultural heritage has some similarities and some differences to scarcity in traditional economics. In both cases, the more scarce an item, the more value should be placed on it. However, with ICH performances, scarcity does not necessarily drive up the market value of that performance, unlike when scarcity drives up the price of gold or other precious metals. When placing value on intangible cultural heritage performances using scarcity, it is important to think of it in terms of how much will be lost if that performance disappears forever.
(85) In Italy, for example, the following languages are protected by law: Albanian, Catalan, Croatian, French, Friulian, Germanic, Greek, Ladino, Occitan, Sardinian and Slovene.

ESSnet‐CultureFinalReport
- 345-
In order to understand the scarcity of intangible cultural heritage performances and use it to help determine value, a record must be kept of statistics for the event. It is necessary to create a record of how many people are involved in the performance, and if applicable, how many people are being trained to carry on the tradition. Nevertheless, the scarcity or uniqueness of the performance doesn’t mean that it doesn’t attract a wide public. On the contrary, the performance can be widely popular and, if popular with tourists, intangible cultural heritage performances could bring in lots of revenue for the community, even if the performances are free. Tourists will pay money to stay in hotels or eat in restaurants in the community, and this revenue should be considered when determining the value of intangible cultural heritage performances. Any of these exercises might involve a mix of valuation mechanisms mentioned above such as contingent valuation, institutional valuation, or social participation surveys. The CVM can be used to calculate worth. The ICH procedure must be considered valuable by at least one and up to three of the following: locals, experts, and tourists. A contingent valuation would take the form of a survey conducted on a sample of locals, experts, and tourists where participants are asked their willingness to pay for a certain good and their willingness to accept a decrease in said good to determine the consumer surplus. As with cultural spaces, this should be executed through a double-bounded method. The main problem is that CVM should be targeted at specific performances and cannot be applied for ICH performances in general.
6. Process ICH procedures include crafts, systems, and methods of a culture. There is some overlap with the ICH Performance category, an example being Italy’s ‘Opera dei Pupi’, Sicilian Puppet Theatre. While this process concludes with a performance, constructing the puppets themselves is an intangible procedure. Because they often produce a tangible product, the value of the procedure is somewhat easier to measure than that of an oral expression or of a performance. We can calculate the value of the materials and tools used in a procedure and, if the product is for sale, revenue generated from its sale. However, one of the intrinsic problems of ICH is that demand is rarely indicative of overall value. Additional factors must be taken into account. In many cases, carrying out the ICH procedure would be a secondary occupation for the craftsman. We should therefore include the value of the working hours spent on the ICH procedure instead of at a person's primary occupation. If the production of ICH is in fact a person's primary occupation, then we should instead calculate the value of lost leisure time. Many of these procedures would be carried out in a space specific to the procedure. Where this is the case, we should determine the cost of maintaining the workspace as well as the property value if used for other purposes. In some cases, the procedure would be carried out in an official ‘cultural space’ and so the valuation mechanisms would overlap further. As with performances, scarcity is an issue. This can mean that there are only a few people who can complete the procedure, which no similar procedure exists anywhere else in the world, or that only the procedure remains of a cultural group that no longer exists. Similar statistics to those of performances could be kept. To monitor scarcity, we should keep track of how many people can currently carry out the process and how many people are being trained to carry out the procedure.

ESSnet‐CultureFinalReport
- 346-
7. Conclusions and proposals All these measures require a significant investment in specific methods of data collection, as these measures are difficult to gather using existing surveys and mechanisms. These surveys are admittedly very costly in terms of both human and financial resources but the specificity of intangible heritage and the overlap this category has within the other domains of the FCS make it unlikely that cheaper or simpler methods will provide the level of information necessary to measure the value of ICH. It is evident that specific research work - such as the one conducted in Scotland (McCleery et al., 2008) - should be conducted to create a robust model, which statistical organizations could adapt to meet their needs. In the framework of the ESSnet on Cultural Statistics this represents a challenge, which cannot be matched. Considering the financial constraint facing NSI and the narrowing political interest on Cultural Statistics it is impossible to suggest new specific surveys for measuring ICH at European Level. Nevertheless, following the methods proposed in this document, it is possible to suggest some ‘quick and dirty’ proxies of the importance of the ICH at national level which could be used to complement the existing cultural statistics. Three domains are promising.
Collect information on endangered languages at European level using data from Census and, if available, administrative data. However it would be necessary to assess which countries have programmes or law to identify endangered (or protected) languages and which countries have data on this subject.
Collect statistics on voluntary work spent to organise or sustain ICH processes or practices. The TF1 and the TF4 could evaluate the possibility on including some indicators using data on the Time Use survey as well as administrative data if available. However it is necessary to assess if it is possible to single out voluntary work spent to organise or sustain ICH processes or practices from voluntary work spent to organise or sustain other processes and practises.
Complement the cultural participation surveys with a few questions on the importance of specific tradition for the sense of cultural belongings. In the World Value Survey there is a set of questions on whether if people are proud of the history and culture of their country. These questions could be adapted to measure the sense of belonging that comes out from particular cultural practices. While the cultural practices could be recorded elsewhere, the sense of belonging and people’s attachment to particular practices could be used as a proxy of the general level of ICH in a country.
These suggestions have to be discussed. The method proposed in the previous paragraph are more accurate but the major problem is that they must be applied to specific events in order to be sure that they are measuring ICH. For example, CVM would be a very effective tool to collect information on the WTP for preserving the ‘Palio di Siena’ if applied to a sample of people from Siena and tourists visiting Siena to assist the Palio. The problem is that the use of general social surveys for collecting data makes it is impossible to ask for this level of detail. A way to of dealing with this problem could be to include in every national survey, a list of relevant ICH expressions and then ask how important these expressions are for the sense of belongings of the interviewed and his/her willingness to pay for the protection and the preservation of these and other similar cultural expressions. However, it is important to underline that using a general indicator of the sense of cultural belongings and of the willingness to preserve ICH based on a simple list of ICH expressions can solve some

ESSnet‐CultureFinalReport
- 347-
problems, but there is no general agreement that we are measuring the value of ICH and not other dimensions.


ESSnet‐CultureFinalReport
- 349-
ISSUE OF CULTURAL DIVERSITY
The question of preserving cultural differences, rooted in national and local heritage, has been at stake of European policies for a long time. The question of cultural diversity is dual: while the aim of European actions is to highlight a common and shared space vital for the construction of the European Community, it is also to respect differences and particularities, most of all cultural national identities, in order for them to be respected and protected. There are in fact many objectives of this ‘unity in diversity’, in particular the promotion of cultural diversity to create intercultural dialogue in Europe for the benefit of an open and dynamic society, but also to face globalisation and to enable economic development with a knowledge-based and inclusive society where, for example, creativity and mobility of artists may be encouraged. Moreover, apart from the ethnic and social approach of cultural diversity, the concept of cultural diversity refers to cultural goods and services whose protection is sought against mass culture. Diversity is central to economy, for demand as well as for supply, to permit choices in consumption and to ensure competition in production and avoid concentration. Cultural diversity embraces many components but the main ones include minority groups, linguistic diversity, diversity of cultural expressions, diversity of values, diversity of representations, pluralism of cultural productions. With the internet, the phenomenon of cultural diversity tends to expand as the construction of groups are facilitated as well as the dissemination of various cultural products. Although generally considered as difficult to define and tackle, cultural diversity is analysed in most documents and concepts within this dual definition: the protection of traditional values and societies, as well as the protection of cultural goods and services in terms of trade, employment and economy as a whole. Cultural diversity appears as a major tool for social development and local recognition, as well as for economic growth. Cultural diversity was established at international level by the UNESCO Convention (86) on the Protection and Promotion of the Diversity of Cultural Expressions, which was adopted on 20th October 2005 and implemented on 18th March 2007. The Convention reaffirms the sovereign right of states to protect and promote the diversity of cultural expressions that convey identities, values and meanings. Article 4 of the Convention states that ‘Cultural diversity refers to the manifold ways in which the cultures of groups and societies find expression. These expressions are passed on within and among groups and societies. Cultural diversity is made manifest not only through the varied ways in which the cultural heritage of humanity is expressed, augmented and transmitted through the variety of cultural expressions, but also through diverse modes of artistic creation, production, dissemination, distribution and enjoyment, whatever the means and technologies used’. Although its definition is quite wide, the UNESCO Convention is an important legal instrument to acknowledge cultural diversity and give foundations for setting appropriate (86) http://www.unesco.org/new/en/culture/themes/cultural-diversity/2005-convention/the-convention/convention-text

ESSnet‐CultureFinalReport
- 350-
definitions for constructing an information system (Article 9 - Information sharing and transparency). Statistical information is also quoted in Article 19 ‘to exchange information and share expertise concerning data collection and statistics’. The new 2009 framework for cultural statistics of UNESCO refers again to the Convention on cultural diversity and stresses the need of considering diversity as a major element for cultural dynamism and positive impact on economies and territorial development (see UIS, FCS 2009, p. 13). Nonetheless, the issue is now to make measurement possible, for observation and comparisons between states and for implementing policies. The UNESCO Institute for Statistics organized an expert group that held two meetings in 2007 and 2008. The complexity of the task was asserted: how to measure with sound statistics facts that are to be interpreted (what aspects of cultural diversity do we have to consider?), and second what data is to be constructed (rarity of data, necessary review of current statistics available)? To conclude, quantification of cultural diversity is very complex, not only for methodological reasons but also for political ones (see debate on identities and protection of individual statistics). For the time being, the UIS expert group has reached no conclusions but the last discussions took into account the three dimensions of diversity, based on the Andrew Stirling model:
- the variety (that refers to the number of classes and genres in which a quantity may be separated);
- the balance (the pattern in the distribution, in production or consumption, of that quantity);
- the disparity (the cultural distance or dissimilarity between existing genres). Cultural diversity is proposed as a mix of these 3-criteria: the greater the variety, balance and disparity of a system, the larger its diversity. This model can, in principle, be applied to products as well as to social diversity. Equality - or inequality - is the point. Applicability of the model designed by Andrew Stirling was tested (see in the French publishing industry, by Françoise Benhamou and Stéphanie Peltier; the French television sector by Joëlle Farchy and Heritiana Ranaivoson) and show that it seems difficult to enrich all criteria of diversity at the same time (diversity may increase in one of the three criteria but decrease in another one). An Indicators Matrix was also proposed as a starting point (e.g. how many books are written, published, sold and read? How many languages are used to write, to publish, to make available, to be spoken or read?). To conclude, methodologies for measuring cultural diversity need to be explored, bearing in mind the challenges that it brings for social objectives as much as for economic ones.

ESSnet‐CultureFinalReport
- 351-
EXPERIENCE FEEDBACK OF THE SATELLITE ACCOUNTS ON CULTURE
By Noemí Villazán-Pellejero y Rosario Garcia-Ajofrin, Area Manager Cultural Statistics
Division - Ministry of Culture (Spain)
Katri Soinne, Project Manager, Cultural Satellite Pilot Project - Statistics Finland (Finland)
Context In recent years it has been highlighted the need to develop and strengthen statistical methodologies to measure the impact and contribution of culture in the economy. The essential objective of a Satellite Account on Culture (SAC) is to provide an economic information system related to culture, designed as the satellite of the System of National Accounts (SNA) to enable the impact of culture on the economy as a whole to be estimated. The choice of the SNA as research framework reflects its undoubted importance as a mechanism, which offers a complete, reliable and systemically quantified representation of the functioning of the economy as a whole. Preparation of the Satellite Account on Culture in accordance with its methodological principles is considered the most suitable instrument for conducting a comprehensive assessment of the sector's economic dimension and its evolution. At the European level Spain and Finland have been experiencing the development of Satellite Accounts on Culture, the main methodological aspects along with a summary of results of which is presented below. Other European countries have also shown particular interest in the development of Satellite Accounts on Culture.
Satellite account on culture in Finland and Spain The essential aim of Satellite Account on Culture in Spain is to provide a set of accounts and tables based on the methodological principles of the Spanish National Accounts, which presents, through statistical indicators, the production structure of activities related to culture and the relevance of the sector in the whole Spanish economy and specifically the contribution of the cultural sector to the Gross Domestic Product of the economy. In Spain the work has prioritized the perspective of the supply due to the availability of the sources needed in the development of the research. From this perspective, the macroeconomic variables considered as a priority have been the components of the Production Account: intermediate consumption, gross value added at basic prices, output at basic prices and, mainly, the contribution of culture to Gross Domestic Product of the Spanish economy. There are also indicators related to employment.
ESSnet‐CultureFinalReport
- 352-
In Finland, calculations were made both for supply and demand, although the coverage for sources of supply is better. In the Finnish calculations, output and gross value added at basic prices, employees as well as private and public consumption were made. Also the contribution to GDP is calculated. The elaboration of the SAC is not free from complications: these arise especially from the strong interrelation of the sector with other areas of the economy, which is sometimes very difficult to delimit, the shortage of information, or difficult correspondence with certain classifications. In any case, the SAC must be considered a work open to continuous development and improvement in line with the evolution of the sector, especially due to the impact of the new technologies, including the progress and development of internationally agreed methodologies in line with this evolution. It is important to note that the analysis of culture in the economy and society requires taking into account also the main indicators of cultural habits and practices, because a significant economical contribution of culture does not automatically correspond with a large culture participation. Both analysis of the economic contribution and the cultural participation have to be complemented if we don´t want to have a wrong vision. In the theoretical delimitation of the cultural scope, the methodological studies conducted by the Statistics Office of the European Union (EUROSTAT) from 1997 have been taken into consideration as a starting point. One of the main objectives was to define a common area of culture, insofar as possible, for all European countries. In the near future the industries included in the SAC will be revised in accordance with the decisions of the Working Group on Culture (EUROSTAT). In Finland, also the earlier work by UNESCO was taken into account. For the elaboration of the Satellite Account on Culture, in each industry the delimitation of those activities, which are considered as cultural, requires a second dimension to be observed: the situation of each activity subject to study in the cultural goods and services production chain. In this regard it should be noted that the development of the Satellite Account on Culture requires taking into account every function of the production chain. The exclusion of any of these functions would break the cycle of activities required to make available a cultural good or service(87). Once the theoretical cultural field has been delimited it is necessary to translate this field to statistical language and the official classifications in order to set the presence of culture in the official classifications of economic activities and products existing in the reference period. In Spain, classifications used in an exhaustive analysis of the presence of the culture in the official classifications of economic activities and products were National Classification of Economic Activities (CNAE-93.Rev1.1); National Classification of Products by Activities (CPA-02); List of Products of the European Community (PRODCOM); Classification of the Functions of Government (COFOG); Classification of Individual Consumption by purpose (COICOP/HBS); Combined Nomenclature (CN); Classification of activities in the Economic
(87) Probably one of the issues that has aroused more debate in the delimitation of the cultural framework has been the inclusion of the Manufacturing and Auxiliary Activities in this framework. Beyond the decisions taken in the future, it is important to highlight that the development of a Satellite Account on Culture requires taking into account each and every one of the functions in the production cycle.

ESSnet‐CultureFinalReport
- 353-
Activities Tax for the Tax Statistics (IAE). The SAC is being updated based on updates in classifications. In Finland, the classifications used were national version of NACE, Classification of Sectors, COICOP and COFOG. Also in Finland the satellite is being revised based on updated classifications. The strong interrelation of the sector with other areas of the economy, which is sometimes very difficult to delimit, the shortage of information, or the difficult correspondence with certain classifications are issues that, although they have been a great encouragement in the research work, should not be forgotten when assessing the work The Satellite Account on Culture in Spain is an Annual Statistical Synthesis Operation included in the National Statistics Programme of Spain. The results of the official statistical operations are disseminated annually since 2009(88). The methodology and main results are available on the website of the Ministry of Culture of Spain (http://www.mcu.es). The pilot project (both the methodology and the results for years 1995-2005) was published in Finland in 2008, and since then the latest figures are calculated annually. The report of the pilot project is available in also in English in the website of the Ministry of Education and Culture (http://www.minedu.fi) and the yearly figures at the website of Statistics Finland (http://www.stat.fi). The average contribution of cultural GVA to the Spanish economy as a whole during the 2000-2008 period was 3,2%. Taking into account the set of activities related to intellectual property, this figure rises to 4,1%. Participation in GDP is a little below these figures, due to the fact that taxes on cultural products are slightly lower than in the economy as a whole. Between Spain and Finland, there are some differences between decisions made, for example on industries included in the SAC(89), but mainly they are the same. Also the results are quite close, so that in Finland the average contribution of cultural GDP during the 1995-2008 period is 3,3%. The changes in different industries during this period is mainly quite slow, but the trend is that the share of art and design is getting bigger and the share of printing and other manufacturing industries is getting smaller. The SAC gives comparable information between years (and at its best also between countries), although it is only one view of culture, which one needs to bear in mind. Finland tries to make clear that culture is a much wider concept than SAC, and also reminds that an analysis with data like, for example turnovers of enterprises, leaves out the governmental activities as well as activities of non-profit institutions, which are quite important in culture. Before the setting-up of SAC, Finland did not have any view of the size of the cultural activities compared to the other activities in the economy, and now SAC allows Finland to know that the share of cultural activities is higher than in tourism or agriculture. In Spain, comparing the results of SAC with other sectors of the economy, it can be seen that the cultural sector have a greater weight than the GVA generated by Energy, and for Agriculture,
(88) The results of the pilot project were disseminated in 2007. (89) In Finland, it is included also for example architecture, design and advertising on the other hand, Spain has more activities that are educational. In Spain it is considered architecture restricted to the creative work of architects, it is only included the part of the design incorporated in the cultural product, and the advertising is studied separately within activities related to intellectual property.

ESSnet‐CultureFinalReport
- 354-
Livestock and Fishing during the last year analysed. The results show that cultural activities have a very significant weight in Spain's economy.

ESSnet‐CultureFinalReport
- 355-
CLASSIFICATION OF THE FUNCTIONS OF GOVERNMENT (COFOG) AND ANALYSIS OF
THE PUBLIC EXPENDITURE OF THE CULTURE
By Brigita Lipovšek, Ministry of Culture (Republic of Slovenia) Results of statistical pilot survey accomplished by the Task Force ‘Financing and expenditure on culture’ proved that there are significant differences among methodologies for statistical following of public expenditure on culture in countries that participated in the survey. It also showed that there are some fields for which data on public expenditure are mostly unobtainable at present (such field is architecture, for example). For obtaining data on public expenditure on culture on the level of cultural domains on the EU level and wider, it is inevitable to make a special statistical survey for this purpose. There are two possible approaches for performing such survey. The first is, to use in a survey all the domains defined by Cultural Statistics Working Group as cultural domains. And the other is, to incorporate international public expenditure on culture in the system of international public expenditure. Benefit of the first approach, it means of the approach to use all the domains defined by Cultural Statistics WG as cultural in a survey, is that culture is surveyed as it is defined. It means that efforts are maid to get data for all the domains that are defined as cultural. Challenges of this approach are double. First challenge is connected to the quality of data. It is obvious that none of European and other countries would ever change its entire method of national statistical following of public financing only because of cultural statistics. So each statistical survey on the field of public expenditure of culture would be a try to use as adequate as possible the existing national, regional and local data. Each reporting point would explain itself the methodology in a bit different way (and each country report would be a combination of several reporting points). Besides this, after obtaining the data for each administrative level additional effort would be needed on the national level to consolidate the data (to avoid double counting). Second challenge of this approach is a problem of making comparisons. Culture is in its significant part horizontal. It means that it is incorporated also in other fields, such as education for example (cultural education). So if culture is from the view of public expenditure observed in its entire definition, comparisons of culture to other fields (as education, for example) are not possible. The second approach for statistical following of international public expenditure on culture is to incorporate international public expenditure on culture in the international system of public expenditure. It means that culture is observed as any other public domain that create public budget: culture, education, health, economic affairs etc. International classification for public expenditure is the classification of United Nations COFOG (Classification of the Functions of Government). On its 1st level culture is observed in the division 08 - Recreation, culture and religion. On the 2nd level it is observed in the groups 08.2.0 - Cultural services and 08.3.0 - Broadcasting and publishing services. Present data obtained on the basis of COFOG are too

ESSnet‐CultureFinalReport
- 356-
aggregated for the purpose of statistical following of public expenditure of culture. So the suggestion is to use COFOG groups as a frame in which cultural domains (such as Books, Press, Radio, Film, Libraries services...) are incorporated and surveyed. Challenges of this approach are the following. Firstly, definition of culture in the framework of COFOG differs in some extent to the definition of culture prepared by the Cultural Statistics WG. It means that taking COFOG as a frame for international statistical following of public expenditure on culture would mean that a piece of information on culture would be lost (for example information on public expenditure on cultural education – but this problem could be in the future maybe solved on the % basis, taking COFOG Education into account). At the same time, some domains incorporated in the COFOG definition of culture can be a matter of discussion (zoological and botanical gardens, for example). Secondly, COFOG classification will not change in the near future, so present definition will stay as it is so as the level of aggregation of data. The third problem is that especially data on the second level of COFOG are in some countries not sufficiently harmonized yet. But this problem will have to be solved in the near future any way, because in 2014 all EU member states will have to report on the 2nd level of COFOG to Eurostat. Benefits of proposed approach are that COFOG is international classification for public expenditure and that in the near future all the EU member states will have data on the 2nd level of COFOG. According to the COFOG classification the data are available for current and capital expenditure and at the same time for central, regional and local level of administration. And what is also important: COFOG data are consolidated. 2nd level of COFOG could represent for public expenditure on culture a benchmark. So what COFOG offers is a promise of better data because of benchmarks between cultural domains and it would give us also the possibility to make comparisons: comparisons in the framework of time scales (majority of countries already have them on the cited levels), comparisons between different fields (culture, education, social protection…), between different levels of administration (central, regional, local) and between different EU countries and also wider, because it is United Nations classification. For more that decade we are trying to find the way for statistical following of public expenditure on culture on the EU level. Progress had been achieved, but we still do not have reliable and relevant data at our disposal. So our proposal for pragmatic solution is to incorporate international public expenditure of culture into the system where it belongs: to the system of international public expenditure. It means that each member state would have two sets of data on national public expenditure on culture. The first set of data would be the same as it already has: the data, obtained according to its national public financing system. And the second set of data would be the data for international comparisons, where the frame into which cultural domains would be incorporated would be COFOG groups Cultural services and Broadcasting and publishing services.

ESSnet‐CultureFinalReport
- 357-
10B
CONCEPTS OF CREATIVE INDUSTRIES AND CREATIVE ECONOMIES: WHAT ARE THE
ISSUES?
By Philippe Bouquillion
Professor of information and communication sciences at University of Paris 8 (France),
Co-author: Jean-Baptiste Le Corf, PhD student in information and communication sciences Paris 8 (France).
In Europe or Australia and New Zealand, and from now on in China and India, but also, although to a lesser extent, in the continent of America, the concepts of creative industries and a creative economy raise high hopes. According to those who are promoting the idea, these activities would be based on complex knowledge and know-how, connected to creativity, creative industries would present a strong territorial foothold, produce an important added value and finally, create many jobs. The idea of creative economics, in itself, means the extension to almost all of the economy, of socio-economic processes, in particular, the organisation of labour or creative means, to work in creative industries. In the former industrialised countries, where the cost of labour is high, creative industries are envisaged as an essential vehicle for ‘emerging from the crisis’. They would constitute a new area of economic specialisation, which cannot easily be relocated in the context of the globalized economy at the time when manufacturing activities, emerging from the first and second industrial revolutions are relocated towards emerging countries. At the same time, creative industries are also considered as important factors of development for so-called emerging countries, in particular by the United Nations, Educational, Scientific and Cultural Organization (UNESCO) or the United Nations Conference on Trade and Development (UNCTAD). In this way, creative industries or the creative economy are seen as new vehicles of growth and competition, from geopolitical contexts to socio economic situations and yet they are very different, even opposite. The lack of precision and the malleable, vague and progressive characteristics of the ideas of creative industries and creative economy contribute, without doubt, to their success in such diverse latitudes and they are also faced with competing notional proposals - all more or less clearly linked to information and communication technologies (ICT) - such as the society of information, knowledge and understanding or, even the virtual economy. Therefore what reasons lie behind the success of these ideas? In order to reply to this question, we will try to retrace the major stages of their development, not in a genealogical perspective that would imply an exploration of several decades of social thinking and work in human and social sciences, linked to the many ancestors of these concepts (in particular, problems linked to culture, creativity, innovation, ICT etc) but, in a more restricted manner, by connecting the thinking and work on creative industries and creative economy to the succession of various socio economic issues since the 1990s, in particular in the United Kingdom, the historic birthplace of these two sets of themes.

ESSnet‐CultureFinalReport
- 358-
In the first part, emphasis will be placed on initial attempts at constructing the idea of creative industries and on the reactions it provokes. Then, in the second part, the challenges of this idea of profit, particularly of that of the creative economy will be examined and finally, in the third part, we will present work and reflections carried out in Europe by public authorities, from the European Union or by groups of experts, particularly in the context of official reports. To begin with, from the second half of the 1990s, ideas of creative industries and economies were built in parallel and they appeared as direct descendants of debates and proposals linked to ICT. After New Labour came to power, the term of creative industries seemed to replace, at least in official reports, that of cultural industries. This movement is studied in particular by Nicolas Garnham (2001). According to this author, the roots of this set of ideas are connected to the unfolding of neo-liberal perspectives in the United Kingdom in the decades of the 1980s and 1990s, brought about by the development of ICT: ‘The use of the term creative industries can only be understood in the context of Information Society Policy. It draws its political and ideological power from the prestige and economic importance attached to concepts of innovation, information, information workers and the impact of Information and Communication Technologies drawn from Information Society theory’ (Garnham, 2001). In 1998, when there was a risk of decline in activities linked to the City (which represents 7% of British GDP) on the world financial scene, the Creative Britain report clearly shows the connection between the development of ICT and that of creative industries so that a leap in growth can be seen from an equivalent thrust from these industries, providing one includes sport, tourism, leisure parks etc. The principle is that when creative industries join up with digital technology, they become an essential source of jobs and creativity for the whole economy. This concept, developed in the Conservative think-tanks, is taken up again by New Labour, since Making a business of Information (1983) appears as the first official report announcing the thinking on creative industries, a theme that will emerge as such around fifteen years later. This report states that industries linked to ICT and to creativity are the sectors bringing most growth and furthermore, it underlines that the two priorities for public action must be, firstly, to promote training and efficiency of creative workers and, secondly, to have laws on intellectual property observed, an essential condition, sine qua non, to increasing the value of products and services provided through digital networks. Particularly in the sector of telecommunications and media and strengthening of intellectual property laws, with new contributors, an issue of urban and territorial renovation is going to be added to this initial issue of economic liberalisation. The notional construction and unfolding of economic strategies and public policies act just as much at both national level and local level. Communications agencies and British consultants play a fundamental role in the emergence of the idea and plans for ‘creative towns’. This term was created or, at least installed in the thinking behind international urban development following proposals from the Comedia agency and its figurehead founder, Charles Landry, who published a reference work in 2000, Creative City: A Toolkit for urban innovators. Some authors, such as Richard Florida, then supported this idea, developed it and built on the theoretical level. In 2002, Florida thus states in The Rise of the Creative Class that the economic and social dynamism of a territory is linked as much to the presence of very broad creative professional classes of artists, writers, actors, designers or architects, as to that of scientists, engineers, lawyers and intellectuals and, consequently, towns should be provided with the best equipment and infrastructures, putting them in a position to attract all these types of socio professional categories. The presence of these creative classes would bring about the development of a new economic cycle, that of creativity, which is based on 3 factors, the three ‘Ts’, Culturenamely ‘Technology’ (innovation and high technology), ‘Talent’ (level of education)

ESSnet‐CultureFinalReport
- 359-
and ‘Tolerance’ (cultural diversity). The idea of creative territories sometimes hybridizes with that of ‘territories 2.0’, in particular at the behest of consultants. Bernard Guesnier states that ‘territories encourage citizens to explode with creativity in all areas: artistic (contemporary art, street art etc.), culinary (regional flavours), craftsmanship (supported by a heritage policy), natural (parks, gardens etc.), entrepreneurial (new activities linked to ICT, to biotechnologies, to high tech industries)’. From this perspective, social creativity would be one of the linchpins of economic expansion connected to creative industries and the creative economy, when ICT and creativity come together. The idea of creative industries is also to be asserted and made more widespread by means of definitions that are gradually being proposed at that time. Between 1998 and 2001, the Department of Culture, Media and Sports (DCMS) produced documents that classify creative industries into thirteen distinct areas: advertising, architecture, art and antiques, crafts, design, designer fashion, film and video, interactive leisure software, music, performing arts, publishing, software and computer services, television and radio. John Howkins, a British consultant, having put a lot of work into the defence of intellectual property rights, whilst publishing his symbolic work, The Creative Economy: How People Make Money From Ideas, will use practically the same outline to define the creative economy. In 2001, the DCMS defines creative industries in this way:‘those industries which have their origin in individual creativity, skill and talent and which have a potential for wealth and job creation through the generation and exploitation of intellectual property’. At the same time, the economist David Throsby (2001) describes the creative economy as a succession of concentric circles at the heart of which the arts and creative industries are to be found, then, in the next circles, other activities are placed depending on the greater or lesser relationship they have with creativity. Creative workers, in particular artists, are then considered as agents who spread creativity into the rest of the economy. These approaches and visualisations will serve as models for reflection generated by these sets of concepts, that will then begin to be developed outside the United Kingdom. In this way, UNCTAD, in 2004, defines creative industries as ‘Tany economic activity producing symbolic products with a heavy reliance on intellectual property and for as wide a market as possible’. In the same way, besides the network of creative towns, a UNESCO publication, ‘Understanding Creative Industries - Cultural statistics for public policy-making’, presents attempts at defining, at mapping, and at establishing guides for unfolding creative industries led in Asia, in particular in China, in India as well as in Latin America. In April 2008, UNCTAD published a document aimed at measuring the degree of development of the creative economy in the world. Various researchers are to vehemently criticise the concept of creative industries at the time when they are asserting themselves, in particular in the reflections and publications of official bodies. The results, in particular, statistics from the majority of work carried out by UNESCO or UNCTAD, have been contested, in particular by Gaëtan Tremblay (2008), who points out the lack of rigour in the figures produced (which are often based on state declarations). Gaëtan Tremblay underlines the fact that these figures embody very different realities. The same author notes that the question of creative industries is inseparable from a desire to defend intellectual property rights and, even to extend them into areas that previously could not benefit from them. Gaëtan Tremblay writes: ‘Including cultural and other industries like software and design in the same universe presents a two-fold advantage. On the one hand, it allows all the intended activities to benefit from the prestige that surrounds artists’ work and secondly, it allows for an exceptional volume of business and an exceptional rate of growth to be displayed, attributable in particular to the area of software and video games’ (Tremblay, 2008, p.76). On the subject of the international extension of the theme of creative industries he notes: ‘Beyond the feel good factor, the aim of this initiative is also to extend and reinforce

ESSnet‐CultureFinalReport
- 360-
recognition of intellectual property and to incite the various government departments to have the payment of copyright or industrial property rights respected. An inclusive strategy to have the rules of the game respected, including by countries that reproduce more than they create’ (2008, p.80). He takes up and extends the statement formulated by Nicholas Garnham about the British case. As for Bernard Miège, he wonders about what has not been reflected upon within the action and public and official thinking: ‘What are the connections between creative industries and cultural industries? Do the first include the second? Or, is it the opposite, are they made to merge with cultural industries, which have the advantage of being older and being structured according to more homogeneous and lasting channels than those of creative industries? Unless they are to be considered as distinct from each other, whilst at the same time having some shared borders? It must be recognised that, until now, the decision makers have hardly concerned themselves with this problem. Without any apparent difficulty they bring together for example the activity of an award winning restaurateur and a fashion designer with that of someone who writes novels, a team that produces films or television series and musicians living on earnings from their performances and recordings of their musical work on various media’ (Bouquillion, Miège, Mœglin, 2009). This author considers that cultural and creative industries present significant differences in at least three dimensions: management of creativity, the place of the brand in strategies for constructing market value and the ability to be reproduced (a concern that is more constant within cultural industries than within creative industries). In short, should we consider finally that the theme of creative industries is reduced to an ideological movement? Philip Schlesinger writes: ‘the doctrine of creativity is now (in the UK) an animating ideology for the so-called digital age… (and) may be seen as the latest attempt to rationalize interdepartmental cooperation, to make effective the flow of business intelligence, to encourage networking, to bring together dispersed creative clusters and to foster talent’ (p.387). Cautiously, Pierre Mœglin remarks : ‘It would be too early to predict a less than brilliant outcome for this matter: integration of artistic, intellectual and cultural practices in an economically and industrially organised body, of which they formed only a part until now, the expansion of demands for management of creativity, up to and including in cultural and information industries, and the adaptation and diversion of counter-cultural tendencies used for the relaunch of economies, hit hard by the crisis, constitute political and ideological objectives that are too important for the supporters of creative industries to surrender them readily. Let us bet, on the contrary, that, according to a phenomenon that is recurrent in France, we will call upon creative industries all the more intensely as their reality will be less visible’ (Bouquillion, Miège, Mœglin, 2009). Moreover, bringing into question once more the idea of creative industries shows that this is not without consistency, nor strong political issues. During a second period, that starts in the United Kingdom in 2005, the idea of creative industries is brought back under the spotlight in aid of the single idea of a creative economy. A copy of the magazine ‘International Journal of Cultural Policy’, appeared in 2009, and entitled ‘After the Creative Industries’, analyses the strategy of British public powers and specialist institutions, including academic and expert establishments, that consists of substituting the idea of a creative economy, indeed also the idea of creative innovation, with the theme of creative industries. Mark Banks and Justin O’Connor (2009, p.365) consider that creative industries must no longer be supported by public policies for these industries would be in the throes of ‘dissolution’ in a new market form (social network market) and that one must not go against this tendency. Creative industries would then become a source of innovation and of creativity and an input for the whole of the economy (Banks, O’Connor, 2009, p.369). Justin O’Connor states that the social network market, which is built through ICT-enabled interactions between agents, constitutes in itself the system for producing innovation. It is not a system that, from the outside, would come to make its mark on cultural

ESSnet‐CultureFinalReport
- 361-
activities but it is the device by which cultural values are created, which makes creative industries the engine for development of knowledge, societies and human evolution (O’Connor, 2009, pp.387-388). Then creative industries would be connections and games between agents on a social network market where ‘new things’ are produced and kept for the purposes of production and consumption. Web 2.0 plays a central role in this type of market. O’Connor brings up the figure of the creative consumer-citizen. In this perspective, the attention of those involved in research, as well as the public decision makers, must no longer be drawn to the question of (creative) industry but to an innovative system on the scale of the whole economy. In the same way, emphasis should be placed on markets and consumption and no longer on producers (O’Connor, 2009, p.388). This approach goes even further than the desire to overtake creative industries with the creative economy since it is about ‘merging’ culture and market. Some authors, such as Scott Lash and Celia Lury (2006), with the idea of ‘global cultural industry’, insist on the double process of culturization of the economy and reification of culture. In this perspective, cultural creations become the archetype of the product in the contemporary economy. At the centre of this conception is the idea of merchandise being overtaken by the ‘brand’, which is characterised by a set of connections; a history, a memory and an ‘identity’. Contrary to cultural merchandise, at least to the representation that Lash and Lurry give of it, the ‘brand’ produces the differentiation. Cultural goods would henceforth no longer be ‘dead’ merchandise but virtual objects, which access reality by means of their transit to the heart of the social imagination. The social imagination then becomes the engine of structural transformations of the ‘global cultural industry’. Other works that do not touch directly on creative industries contribute, in fact, towards setting up the idea of creative economy to the detriment of the theme of creative industries. As well as reflections on the ‘virtual economy’, it is the case of works on globalization. For example, the approach of the economist Tyler Cowen (2002), according to whom ‘cultural trade increases the menu of choice available for each of the societies engaged in the exchange, but diminishes the difference between menus of choice of these two societies’, leads us to formulate such a wide definition of culture that it includes a vast set of supposedly creative products, including, in particular, foodstuffs. New intellectual categories assert themselves, academic and political debates are moving from cultural industries and a cultural economy towards the creative economy and creative industries. From that point on, drowned in such a vast group, cultural productions no longer seem to constitute a specific category to justify the implementation of specific public policies. The desire of some countries, including France, to defend their national productions is to a greater or lesser degree disqualified. Kate Oakley (2009, p.402), very critical of these perspectives, underlines that they correspond to a deepening of the liberalisation of the economy and, more specifically, to the questioning once more of public strategies towards culture and creation. The continuity that existed between policies in favour of cultural industries and those led in favour of creative industries would be broken when the themes of creativity and innovation were developed. According to this same author, Richard Florida’s proposals have played an important role in this regard. With his work published in 2002, there appeared two new elements that work towards dissociating the question of creativity from that of cultural industries. On the one hand, the idea of the creative class emphasises a wider dimension that touches upon creative territories, the creative economy and on the other hand the central question is no longer that of cultural creation but that of innovation, in particular technological innovation. Kate Oakley (2009, p.408) in this way underlines how much thinking on innovation reduces the share of art and culture to very little, namely, according to her, heritage and social missions, in particular education. Whereas perspectives in terms of cultural industries and even in terms of creative industries placed them at the heart of a growth sector, thinking on innovation terms puts them back in their ghetto. She adds that thinking on innovation in culture goes far beyond that held

ESSnet‐CultureFinalReport
- 362-
on creative industries, not only in affirming the economic dimension of culture, but because it separates supposedly innovative cultural activities from those that concern heritage and education (p.411). It appears that reflections on concepts are quite divided with, on one side, some proposals on creativity and the creative economy, often coming from consultants, and which are often directly reasserted in official reports and reflections from public or supranational institutions and, on the other side, scientific work, such as that of Richard Caves (2000) or David Hesmondalgh (2002), who question more precisely the socio economic specifics of creative industries. The work of Richard Caves, which joins theoretical proposals and empirical verifications together, does not lend itself to the same ideological developments and is therefore much less quoted in official reasoning. Official reasoning makes endless reference to creativity without ever defining it, which moreover allows justification to be made of a great number of their recommendations of public policies, including the questioning of employment law or defence of intellectual property rights. On the other hand, Caves tends to identify the precise characteristics of these so-called creative products, including the uncertainty surrounding their increase in value; the central character of the personality of the creators in the value of the products and the hierarchy between creators ; the creators’ attachment to their activity – he then raises the matter of the tension between those taking part in the creation-production process, whose concerns are mainly artistic or intellectual, and other agents more interested in the process of adding value; the complexity of the process of joining different parties to the production process - from where comes the recourse to contract theory; the sustainability of some inputs, in particular those protected by Copyright, which are therefore income factors. Furthermore, this last element leads to the question of unconditional defence of intellectual property rights. For our part, we pursue this perspective of socio economic comparison between cultural industries, (the four main strands: press and information, books, recorded music, cinema and audiovisual) and some areas of creative industries (video games, design and fashion). In order to do this, we propose eight indicators (Bouquillion, 2010). The use of links between cultural industries and creative industries is inseparable from movements towards links between cultural industries and communications industries (telecommunication industries, the Web and IT and electronic hardware for the public). The hypothesis that we present is that of a possible dissociation between the falling and rising stages of the strands. This dissociation would be accompanied by maintenance, indeed the paradoxical strengthening, of the importance of creative activities for the positioning of players at two opposite levels of the strand, downwards and upwards. In this perspective, the idea of creative industries would be taken seriously but it remains to be built etc. In terms of contributions to the construction/deconstruction of the concepts of creative industries, work and official reports produced in Europe deserve to be presented. The European Union does not escape from this trend of creative industries according to a progressive politico-administrative strategy. On one side, the European Commission ensures the negotiation of the Agreement on promotion and diversity, taking care to use a definition that is probably wide, but is such that it will distinguish the cultural field from the rest of the economy. On the other side, the DG Culture takes part in this movement in favour of creative industries, seeking to measure their economic impact, in order that this field is well-integrated first of all in 2000 in the Lisbon strategy (make Europe ‘the world’s most dynamic and competitive knowledge-based economy’), then in Europe 2020(90).
(90) ‘Europe 2020: A strategy for intelligent, sustainable and inclusive growth’, COM (2010), 2020. Europe 2020 presents three priorities which are mutually reinforcing: intelligent growth: to develop an economy based on knowledge and innovation; sustainable growth: to promote an economy that uses its resources more efficiently, that is more green and more competitive; inclusive growth: to encourage an economy with high levels of employment favouring social and territorial cohesion.

ESSnet‐CultureFinalReport
- 363-
In this way the following reports have been published successively.
European Parliament resolution of 10 April 2008 on cultural industries in Europe, (http://www.europarl.europa.eu/sides/getDoc.do?pubRef=-//EP//TEXT+TA+P6-TA-2008-0123+0+DOC+XML+V0//EN), (2007/2153(INI), ‘(…) whereas cultural industries are industries that give intellectual works additional economic value and at the same time generate new values for individuals and society; whereas those cultural industries include traditional industries such as the film, music and publishing industries, the media and industries in the creative sector (such as fashion and design), tourist, arts and information industries’;
Green paper on cultural and creative industrie (http://ec.europa.eu/culture/our-policy-development/doc/GreenPaper_creative_industries_en.pdf), ‘Release the potential of cultural and creative industries’ (COM(2010) 183/3) : ‘Cultural industries’ are those industries producing and distributing goods or services which at the time they are developed are considered to have a specific attribute, use or purpose which embodies or conveys cultural expressions, irrespective of the commercial value they may have. Besides the traditional arts sectors (performing arts, visual arts, cultural heritage – including the public sector), they include film, DVD and video, television and radio, video games, new media, music, books and press. ‘Creative industries’ are those industries which use culture as an input and have a cultural dimension, although their outputs are mainly functional. They include architecture and design, which integrate creative elements into wider processes, as well as subsectors such as graphic design, fashion design or advertising.
All the European documents ask the same question, regarding the place of creation, of creativity and creative industries in countries where labour costs are high. The reports also deal with thinking on links between creative industries and the territories and proposals for transforming public policies. Creative industries are described as producing symbolic goods that are not easily substituted. Many products in contemporary economies would therefore become products with a value that would be less ‘functional’ than ‘symbolic’. In particular, it is noted that goods with an essentially symbolic value can be sold at relatively high prices, bearing no relation to production costs and they offer the consumer a unique experience. Property Rights must therefore be protected in order to guarantee maintaining this position within the hands of those players who have been able to acquire them. Similarly, creative industries are presented as ‘trans-sectoral’ activities. They would form a sort of ‘driving belt’ of creativity towards other sectors of the economy. Design plays a particular role in this regard. It is both a sector in itself and a ‘distributor’ of creativity. In fact, design contributes towards the organisation of ideas according to new architectures. In the same way, it helps with decision, with collective awareness, in particular by the graphic representation of social issues and it takes part in the ‘distribution’ of ideas. According to these representations and whether it would be as a completely independent sector or as a tool for distributing creativity, creative industries and the creative economy would mean that many jobs could be created, in particular because the model based on employees is not dominant within them, and because these jobs would remain locally established. Creative workers would be growing in number. However, it has to be said that empirical proof to validate this hypothesis is lacking. Sets of economic and political ideas intersect. Creative territories are presented as territories of cultural tolerance, open to immigration, its openness being presented as a condition for renewal of the ‘talents’ as understood by Florida. This territorial marketing is a relatively new point, at least in France.

ESSnet‐CultureFinalReport
- 364-
The unfolding of creative industries would suppose an adaptation of public policies. Three major trends are common to the different reports. First and foremost, the majority of reports insist on the central role of local authorities. In almost all European countries, it is at local and not national level that the first initiatives are developed. Local and regional authorities are at the same time close to the productions and are, in many European countries, in a better position to intervene legally and in budgetary terms. However, the writing of official reports shows a desire from national hierarchies to tackle these questions, at least partially, as coordinators, rather than financiers. The development of concepts about creative industries at international ranks of states and no longer only in local and regional territories, as well as the rise in initiatives from the European Union on the matter, can explain this movement. Next, some actions of liberalisation are recommended. In order to favour job creation, but also to allow ‘creativity’ to become a factor of production, it would be necessary to make employment law more flexible and favour a spirit of enterprise within creative workers and companies of the sector. The redirection of cultural policies in favour of creative industries and more marketable objectives, favouring industrial sectors and joint public/private ventures, must work towards it. Similarly, rather than launching broad action plans, national authorities should facilitate the access of entreprises from creative industries to programmes on research, innovation and creativity, as well as to the financial system. It is essentially because, within creative industries, the idea of innovation has a very specific meaning, the creative industries find it difficult to finance themselves, both with financial players and with public incentive. Some public communication actions, coordinated at national level, around the socio economic specifics of creative industries, and aimed in particular at financial players, are also recommended. More generally speaking, this liberalisation movement must be extended to the whole of the economy and society. A better link for university and education, described as being at the heart of the creative economy, with the world of business. Finally, with the aim of transforming ‘ideas’ into tangible goods or at least, into marketable products, the reports insist on the defence of intellectual property rights. That would be all the more important since the businesses’ economic activity, their ability to raise funds, and start up collaborations are linked to the assessment of their value and the protection of it. The principle of protection of intellectual property, designed with reference to the former supports, must be extended to the new ones. Nevertheless, the possibility and opportunity to continue to apply the same model of protection of intellectual property rights are brought into question. It would be suitable, according to this reasoning, to favour the rapid distribution of innovation to consumers, without discouraging innovators by depriving them of income connected to their innovations. The liberal dimension lives alongside respect for ownership rights and also alongside a market environment. For over ten years, the ideas of creative industries and economies have concerned experts, decision makers and academic circles. Debates have been very lively. It is true that through these issues, the questions often asked since the 1980s and 1990s still remain, particularly as regards the place of culture in the economy and public policies, but also making the labour market flexible and defending intellectual property rights. But will creative industries and the creative economy keep their promises, in particular will they contribute towards preserving the position of the former industrialised countries in the new international division of labour generated by globalization?

ESSnet‐CultureFinalReport
- 365-
13B
CREATIVE INDUSTRIES SPILLOVERS
By Estonian Institute for Futures Studies - Tallinn (Estonia)
Creative industries are characterised as an important part of contemporary economies and their significant and varied impact has been widely discussed. It is still rather challenging to accurately measure their diverse impact. The accurate measurement of the diverse impact is still a rather challenging issue, although several attempts to estimate the overall size of the creative economy have been made. The significance of creative industries’ spillovers has only recently begun to be recognised. So far, the spillover effects of culture and creativity have been brought without a well-defined conceptual background, and have in general remained a rather unexplored topic. It is a relevant claim that the importance of creative industries’ spillovers has also reached policy level discussions, indicating the need for the culture 3.0 phase (Sacco, 2011):
A clear signal that there is a widely felt need to overcome the traditional Culture 2.0 focus on the mere sectorial growth of cultural and creative industries is that, in making cases for the developmental role of this macro-sector, increasing attention is being paid to the effects that it may produce in terms of creative spillovers positively affecting other sectors /…/ Reasoning on the basis of the Culture 2.0-3.0 transition, it becomes easier to explain why and how culture matters for the general economy. (Ibid., 5)
The current study focuses on conceptualising the measurement of creative industries’ spillovers. There have been only single studies concentrating on the spillovers of creative industries (e.g. Creative Industry …, 2009; Chapain et al., 2010; Bakshi et al. 2009; De Propris et al. 2009). More developed examples can be found in the field of measuring the (economic) impact of cultural and creative events (see e.g. Janeczko et al. 2002; Hackbert, College, 2009; Crompton, McKay, 1994; Gursoy et al. 2004). However, the majority of this kind of study is related to evaluating the impact on the event organisers themselves or the directly related beneficiaries - such as enterprises, service providers etc., who have contractual relations with the event. Altogether, we may claim that there is a clear shortage in methodological approaches concerning the measurement of CI spillovers. The issue is even more complicated because the practice of measurement of secondary impacts of creative industries is also far from being established. However, it has been repeatedly recognised that “the traditional” quantitative macro-economic indicators are insufficient for evaluating the diverse impact of creative industries (Creative economy..., 2010, 77). The general aim of the study is to measure the inputs of the cultural/creative sector into the wider economy so as to catch the spillover effects in terms of creativity and innovation. The report is compiled as part of the work of the ESSnet-Culture network, which works on proposing the new European framework for cultural statistics. In the current study we reviewed the literature relating to existing approaches to CI spillovers and the possibilities of the measurement of spillovers. In addition, we organised round-table

ESSnet‐CultureFinalReport
- 366-
discussions for to examine possible alternatives in measuring CI spillovers and brainstormed about suitable indicators. The report is compiled by the researchers of Tallinn University Estonian Institute for Futures Studies: Külliki Tafel-Viia, Andres Viia, Erik Terk, Aado Keskpaik and Georg Lassur. Alari Purju from Tallinn University of Technology was involved as an external expert professor. In addition, for developing the methodological approach the following experts with different areas of knowledge were involved: Jaanika Meriküll (Bank of Estonia), Rünno Lumiste (Tallinn University of Technology), Kutt Kommel (Statistics Estonia). We express our gratitude to all of them for sharing their valuable comments and making useful suggestions. The report is structured as follows. In part 1, we explain the need for analysing the spillover of creative industries. Part 2 concentrates on defining the spillover effect in general and in the context of creative industries. In part 3 we propose a methodology for measuring spillover in creative industries and offer possible indicators for measuring spillovers in different contexts and domains.
1. The need for analysing the creative industries spillover - framing of the topic
The many-sided effects of creative industries are widely and increasingly emphasised when referring to CI contributions to economic, social and cultural development in many different ways: producing economic and employment benefits in related services and manufacturing sectors, promoting economic diversification, revenues, trade and innovation, playing an important part in regeneration and revitalisation of cities and regions, attracting and retaining skilled labour etc. (Creative economy..., 2010, 23-26; Cardiff’s 2006, 5). It has been recognized that ’the traditional’ quantitative macro-economic indicators are insufficient for evaluating the diverse impact of creative industries. In general, three degrees of creative industries’ economic impacts can be distinguished (Creative economy..., 2010, 77). Firstly, primary economic impact which is the CIs’ direct contribution to the economy: GDP, Employment etc. The majority of methodologies for measuring the economic impact of the arts and creative industries have generally focused on evaluating the primary economic impact of CI: measuring CI outputs relating to employment, turnover, also number and size of enterprises etc. (Reeves 2002, 50). Secondly, secondary economic impact, often described in terms of ‘multiplier effect’ referring to indirect quantifiable contribution of CI, which is a result from activities in the creative industries by inducing activities in other sectors(91)F CI sector may also lead to a multiplier effect as growth in the sector stimulates local demand (Lee 2010, 2). And, thirdly, tertiary economic impacts, which are indirect impacts and referred to as spillover effects. We may highlight the following arguments, which indicate the importance of studying creative industries spillover. Firstly, it is widely acknowledged that the creative industries are an important bridge to the wider economy. Creative industries themselves are represented by the model of concentric circles (Throsby, 2008). The perimeter of the circles represents creativity in the wider
(91) Multiplier: An estimate of the number of times that a dollar changes hands within the community before it leaks out of the community (for example, the theater pays the actor, the actor spends money at the grocery store, the grocery store pays its cashier, and so on). This estimate is quantified as one number by which all expenditures are multiplied. (Arts..., 2009, 25)

ESSnet‐CultureFinalReport
- 367-
economy, and the linkages that exist between it and the creative industries. (Staying..., 2007, 106) The outer layer of the concentric circles makes clear that the creative industries do not work in isolation (Staying..., 2007, 108). For example CI statistics of the UK show that 55 per cent of creative products supplied to the economy are used as intermediate input to other industries (purchased by other businesses), including other creative businesses (Creativity..., 2005, 19). It is also argued that CI close supply chain links with firms in the wider economy, which means that it has an indirect impact on employment and output as well as a direct impact to value added and employment (Staying..., 2007, 108). Secondly, and directly linked with the previous argument, solely measuring the CI sector will only get us some way towards an overall value and impact of CI (NESTA 2007). Unavoidably, more simple economic measurements omit broader impacts of CI. In comprehending the total size of CI it is not enough to calculate the volumes of CI sub-sectors (turnovers, number of employees etc.). There is increasing evidence that creative industries provide benefits to the economy far beyond their size (DCMS 2007). Creative activities are deeply embedded in the economy, with many individuals working in creative jobs outside the creative industries (Investing..., 2009, 29). For example, there are more creative specialists working outside the creative industries than within them, suggesting that the creative industries are making a contribution to ‘spillovers’(92)(Investing..., 2009, 29). Thirdly we may argue that spillovers are substantively linked to creative industries. It is claimed that being more innovative than other sectors CI generates more knowledge, network and product spillovers for other sectors (Booth 2008, 10). Creative industries highlight not just the economic value of creativity and origination, for example entrepreneurial artistry and vice versa, but also the significant economic value created from the re-use of ideas in general and copyrighted material in particular. This argument is underlined by the modern economic growth theory and the spillovers from new ideas (Montgomery, Potts, 2007, 11). On the other hand, the creative industries are also identified as early adopters of innovation – this also has potential to ‘spillover’ to other industries (Investing..., 2009, 29). And last, but not least, the need to study CI spillovers is due to the fact, that these have not been sufficiently explored. Despite the acknowledged influence of CIs- to date, little is known and there is insufficient evidence about the impact of the creative industries on the wider economy, particularly their spillovers into other segments of the economy (Bakshi et al. 2008; Creative Economy..., 2008, 41). Unlike other parts of the economy, our understanding of the creative industries’ linkages is comparatively weak, made worse by poor statistics or sometimes no statistics at all (Staying..., 2007, 106).
(92) Proceeding from UK statistics, then 54 percent of creative specialists are employed in businesses outside the creative industries (Investing..., 2009, 29).

ESSnet‐CultureFinalReport
- 368-
2. The concept of spillover and its measurement
2.1. Defining the spillover: the concept and different categories
The concept of spillover is conceptualised in the economic sciences, in particular within the theoretical and empirical literature on the economics of innovation and technological change (Wölfl 1998, 5). The importance of spillover effects is underlined by the proponents of the new growth theory - endogenous technological change, accumulation of human capital and openness to international trade and investment - who particularly emphasise the importance of indirect effects (spillovers) on economic growth and development in the long run (Aghion and Howitt, 1990; Coe and Helpman, 1995; Lucas, 1988; Romer, 1990; Gachino 2010, 193-194). In economics the term ‘spillover’ is used to capture the idea that some of the economic benefits of activities accrue to economic agents other than the party that undertakes these activities (Jaffe 1997). Spillovers are regarded as the conditions in which firms or consumers benefit from knowledge, market opportunities, innovations, or skilled employees that they have not paid for directly (Staing..., 2007, 111). The spillovers are approached as positive externalities – the concept of which is very closely related to those of ‘public goods’ and ‘market failure’. Specifically speaking, this means that the activity generates sufficient benefit to the party undertaking it that market forces generate some, but not enough, of the activity (Jaffe 1997). However, it is argued that from the viewpoint of the single firm, spillovers may be judged negatively as the individual firm fears that competitors use its internal research results and thus probably increase their profits without having to bear the expenses. From the viewpoint of social welfare, there is nevertheless reason enough to promote spillovers, since they spur the dissemination of new knowledge available for the whole society. (Wölfl 1998, 5). This argument can be supported by the fact that most innovations developed for a specific purpose end up having numerous other uses. This is as old as the varied uses of wood and bones in weapons, tools, jewelry and housing or the uses of fire in lighting, cooking, heating, as a weapon and to clear up land (Desrochers, Leppälä, 2010, 6). Among well-known recent examples are Post-it Notes (developed from a weak glue without any initial useful application); tea bags (first used as packaging for loose tea samples); Teflon (mechanical lubricant); and microwaves(unexpected discharge from a radar system) (Berkun, 2010, 41, 42). In the literature different types of spillovers are distinguished.
One concept is called a vertical, welfare, pecuniary, or rent spillover, which occurs when research performed in one firm (seller) can benefit another firm (buyer) because the quality improvement embodied in inputs is often not appropriated fully by the seller because of competition (Koo 2005, 101). Similarly, Jaffe (1997) discusses market spillovers that occur when the operation of the market for a new product or process causes some of the benefits thereby created to flow to market participants other than the innovating firm. There are productivity spillovers which occur when backward linkages result in productivity benefits to suppliers that are located within the city. An example of a productivity spillover might be technological innovations arising from firm competition within the urban cluster. (Poon and Lai 2008, 2275) The second concept is called a horizontal, knowledge, nonpecuniary, or technological spillover. This is basically a question of knowledge transmission: research performed in one

ESSnet‐CultureFinalReport
- 369-
firm stimulates the creation of new knowledge or the realisation of previous ideas in another firm. In this case, new knowledge is taken from new goods and becomes part of a general pool of knowledge and subsequent innovations are built upon this disembodied pool of knowledge. (Koo 2005, 101). There is a widespread consensus around the propulsive role of ‘knowledge’ for innovative performance (Cohen and Levinthal, 1989; Cohen and Levinthal, 1990) and, the concept of absorptive capacity and knowledge spillovers has been widely employed at the level of firms and sectors, regions and nations (Abreu et al. ..., 2008, 8). The ‘innovative milieu’ emphasized by the concepts of innovation system (Lundvall, 1992) benefits from knowledge spillovers effects between firms and local institutions. Jaffe (1997) argues that knowledge spillovers can happen in numerous ways. On the one hand, they are particularly likely to result from basic research and the spillover beneficiary may use the new knowledge either to copy or imitate the commercial products or processes of the innovator, or may use it as an input to a research process, thus leading to other new technologies. This is what Halpern and Muraközy (2007, 783) call ‘imitation’ and consider being the classic form of horizontal spillover. On the other hand, in some circumstances the creation of knowledge spillovers is intentional on the part of the innovator - e.g. the publication of scientific papers is, at least in part, intended to spread new knowledge so that it can be used by the widest possible audience (Jaffe 1997). Knowledge spillovers also occur when researchers leave a firm and take a job at another firm (or start their own). Halpern and Muraközy (2007, 783) consider the acquisition of human capital as the second important channel of horizontal spillover. Since foreign firms need more skilled workers to operate the more sophisticated technology, they have to invest in training. When these workers move from foreign to domestic firms, they may create productivity improvement for the latter (Halpern and Muraközy 2007, 783). But, more generally, commercial development and use of new knowledge will tend to cause it to spread, despite any desire of the inventor to prevent such spread. The spread of knowledge is greatly affected by the commercial use of new technology; accordingly the market mechanisms have a great role to play in the spread of new technology (Jaffe 1997). The studies on knowledge spillovers contain two contrasting hypotheses. The specialisation hypothesis argues that innovation tends to be industry-specific. Consequently, innovation is expected to arise between firms within the same industry and can only be supported by regional concentrations of similar industries. The alternative hypothesis meanwhile asserts that knowledge spills over between complementary rather than similar industries (van der Panne and van Peers, 2006, 879). According to Jacobs (1969) the exchange of complementary knowledge across diverse firms and economic agents facilitates innovation. This is the discussion in the economic literature on spillovers about the interplay between Marshallian externalities which flow from industry to industry, and Jacobs externalities, through which a diversity of sectors can cross-pollinate ideas in each other, thus increasing aggregate levels of innovation (Lee 2010, 5). In general we can say that knowledge spillovers are more related to tacit knowledge, informal networks and knowledge exchange, which are more sensitive to distance. Geographical proximity between the actors makes these kinds of knowledge flow easier (Onsager et al. 2010, 29). Jaffe (1997) also introduces a third type of spillovers - network spillovers. These result when the commercial or economic value of a new technology is strongly dependent on the development of a set of related technologies. An example of network spillovers exists among all of the different developers of application software for use with a new operating system platform. If one firm develops a particular application, people will buy it only if many other

ESSnet‐CultureFinalReport
- 370-
firms develop other sufficient applications so that the platform itself is attractive and widely used (Jaffe 1997).
2.2. Measurement of spillover effect It is broadly acknowledged that a major problem with the handling of spillovers in empirical investigations is that they cannot be measured exactly (Kaiser 2002, 126). As Krugman (1991) (p. 53) notes: ‘Knowledge flows (…) are invisible; they leave no paper trail which may be measured and tracked, and there is nothing to prevent the theorist from assuming anything about [it] that she likes’. In general, two lines in measuring spillovers effect can be distinguished (Wölfl 1998). Firstly there is macro-level perspective, which focuses on examining how spillover effects account for differences in growth of productivity. Secondly there is micro-econometric analysis, which reviews the spillover effect on the firm level. One possibility is to follow the technology flow approach that uses input-output linkages to position a firm or an industry in the technology space and to examine technology spillover patterns from an R&D-performing firm or industry to the remaining firms or industries. An alternative option is to use the cost function approach which focuses on cost reduction, the most common and important benefit of technology spillovers, and uses econometric techniques that estimate the cost-reducing effects of technology spillovers (Koo 2005, 102, 103). The third option is to proceed from the production function approach that also uses econometric models and focuses on the influence of technology spillovers on productivity or innovation (Koo 2005, 104). Jaffe (1997) has admitted that there are limitations in terms of econometric measurement of spillover effects, which leaves us to focus on rather indirect evidence. In addition to economic (econometric) measurement, recent studies have increasingly paid attention to spatial aspects in spillovers. The studies in this field have shown that the productivity enhancing effects of R&D diminish as both geographic and technological distance increase (Koo 2005, 104). In particular, spatial aspects are emphasized in the context of knowledge spillovers. Geographic proximity (geographical clusters more than scattered locations) facilitates the transmission of knowledge as face-to-face communication as well as social bonds and other kinds of personal interaction are important to this process (Halpern, Muraközy, 2007, 785; Breschi, Lissoni 2001, 978). Specifically speaking, it is claimed that the employees and managers of firms near to universities (where leading-edge research is carried out), as well as close to a number of other innovative firms, will be the first to be acquainted to the results of important discoveries, or to obtain the accessory knowledge that is necessary to exploit those discoveries commercially, thus gaining an innovative edge over distant rivals (Breschi, Lissoni, 2001, 979). When analyzing the effects of spillovers, one has to rely more or less on crude proxy variables. Many of these are based on measurements of ‘proximity’ or ‘technological distance’ between firms, sectors or regions (Kaiser 2002, 126).

ESSnet‐CultureFinalReport
- 371-
3. Creative industries and spillovers effect
3.1. Creative industries There are at least two issues which frame the discussion of measuring creative industries’ spillover effect. Firstly, the existence of several approaches to creative industries, which indicate that the object with which spillovers we are analysing cannot be unambiguously defined. Secondly, creative industries consist of the spectrum of different fields, which indicates that measuring CI spillover encompasses not only CI sector as whole, but also analysing the importance of CI sub-sectors to generate spillover effect. Regarding different approaches to CI, it is important to bring out the following.
CI can be approached as group of sectors - this approach sees that certain sectors constitute the spectrum of CI (Howkins 2002; Scott 2001). We may consider that here CI is approached as ‘just another industry’ (Potts, Cunningham, 2008, 236).
CI can be approached as group of certain occupations - this approach is reflected mostly in the concept of ‘creative class’ (Florida 2002) where the field of CI is based on occupations or fields of activity (Florida 2002, p. 68).
CI can be approached as holistic urban development - that can be associated with the concept of ‘creative city’ (Landry 2000), which captures different kinds of fields related to urban development under the concept of creative city.
CI can be approached as an underlying or important part of wider economic system - here CI is seen as central field that supports the new economy and ‘is constituted as a constellation of workers, firms, institutions, infrastructures, communication channels, and other active ingredients’ Scott (2006, 15).
What is important to conclude in regard to different approaches of CI is that it cannot just be approached as a sector or field; there are also other types or forms of practices in which CI ‘takes place’ such as creative networks, creative linkages, creative spaces, events etc. As CI consists of a spectrum of different fields, there are several methods to differentiate and group different sub-fields of creative industries. The main issue that makes creative industries a very diverse complex of activities is that it encompasses traditional art and other cultural fields as well as those creative fields, which are business and production-based in its nature. Based on the KEA study (2006, 53) the creative industries can be divided into three groups:
- the arts field which is constituted of non-industrial cultural products - e.g. visual arts, performing arts, heritage;
- cultural industries, which include industries whose outputs are exclusively cultural - e.g. film and video, television and radio, music, books and press;
- the creative industries and activities whose outputs are functional but who incorporate elements from the two previous layers into the production process, such as design, architecture or advertising.
The characteristics of production and distribution mechanisms vary among different branches of creative industries - from freelancers and micro enterprises to large scale firms, from non-industrial activities to industrial activities aimed at massive reproduction, from face-to-face based networking to large scale distribution channels etc. (The Economy..., 2006; Rutten,

ESSnet‐CultureFinalReport
- 372-
2006; Our..., 2005). The differences in the nature of the sub-fields of CI indicate that different branches of CI generate different kinds of spillover effects. At the same time, different CI branches share several common characteristics, such as:
The impact of CI is especially seen in their ability to power the growth of other sectors (Potts and Cunningham 2008, 238). Creative industries can be presented via concentric circles (Throsby, 2008) where the perimeter of the circles represents creativity in the wider economy, and the links that exist between it and the creative industries (Staying..., 2007, 106).
Additionally, creative industries are more open to collaboration with other sectors. There is evidence from studies in the Netherlands and the UK that collaboration with creative industries increases levels of innovation in other sectors (Stam, de Jong et al. 2008; Bakshi and McVittie 2009). Analysis of artistic activities in mid-sized or second-tier US cities has shown that arts-rich cities stimulate inter-firm links through localised economies (Markusen and Schrock, 2006).
There is evidence that CI tend to concentrate (Evans 2009a, b; Lazzeretti et al., 2008) and locate close to each other even more so than most other sectors (Chapain et al. 2010, 8). The scale of concentration, in which CI enterprises are often located streets or even short blocks away from each other, or in creative ‘quarters’, strongly suggests a clustering effect - concentration caused by interconnection (Freeman 2010, 12).
Creative industries have somewhat different types of structures and practices; especially the importance of non-hierarchic and informal relations and structures (Lash, Urry 1994; Neff, Stark 2003) has been recognized. Furthermore, a high level of freelancers, short-term contracts, part-time working etc. is characteristic to CI (Adapting..., 2001, 6; Marcus 2005, 8). This indicates the importance of networks and other forms of interaction as well as CI flexibility.
CIs have a capacity to shape the image of a city or country, making it a more attractive location for firms in other sectors (Creative..., 2009b, 3). This is in line with the dominant interpretation of Richard Florida’s (2002) work on the ‘Creative Class’. According to this view, the creative industries act as providers of cultural amenities and services that make certain cities attractive to a ‘creative class’ of knowledge workers and their innovative employers (Chapain et al. 2010, 8, 9). Similarly, the practices from different countries and cities have shown that cultural and creative events have a capacity to strengthen local identity, increase the attractiveness for tourists, businesses, markets, improving the basic facilities of the area, which, again, could have long-term effects on development: accommodation, transport, culture, sport, the quality of life, and so on(93) (Barget, Gouget 2007, 167, 168).
We can claim that these characteristics support the generation of spillovers by the creative industries.
(93) One of the most convincing examples on the European level is certainly the organisation of the Barcelona Olympics in 1992. New trunk roads, new districts, the renovation of old districts, and so on all helped to reduce the generalised overcrowding of the town and to restore its public image. These induced effects are likely, in the long term, to be much more important than short-term economic effects by themselves, as they can be measured by a multiplier (Barget, Gouget 2007, 168).

ESSnet‐CultureFinalReport
- 373-
3.2. Spillovers of creative industries The topic of creative industries spillovers was raised by the scholars of cultural economy arguing that cultural products are quasi-public and non-rival goods: they are difficult to turn into exclusive private property, their use gives rise to significant positive externalities, and consumption by one consumer does not hinder others from enjoying the same creative product (Handke 2006, 4). In general, CI spillovers are part of the discussion about whether the arts produce collective benefits. It is argued that although art confers private benefits on those who consume it (Heilbrun, Gray 2004, 226), it also provides externalities or spillover benefits to those who are not involved in the transaction (Globerman 1987, 16). The beneficial externalities can be considered as ‘unintended side effects or spillovers, which are nevertheless beneficial (or costly) to those who experience them’ (Throsby 2001, 35, 38). Similarly to other fields there are also different types of spillover effects related to creative industries. Drawing parallels with discussions in the economic literature we may distinguish three main types of spillovers: production spillover, knowledge spillover and network spillover. They are described in more detail below.
(a) Production spillovers happen as CI foster growth in other sectors through their role in production processes (Potts and Cunningham 2008; Bakshi and McVittie 2009; Evans 2009). On the other hand, we may talk about demand spillovers – as activities (businesses) in the creative industries generate demand spillovers for complementary products in other industries. (Staying..., 2007, 113; Reid et al. 2010) Accordingly, two different types of spillovers are most likely to arise.
Market expanding spillovers or intra-market spillovers – one firm’s development of a product expands the market for a whole range of complementary products. It is claimed that one of the most exciting features of the CI is their ability to generate new and innovative products. One of the benefits that these new products bring is that they can substantially expand or create markets for complementary products. The makers of the complementary products therefore benefit hugely from the results of creative firms’ labour. (Creative..., 2009a, 4; Creative..., 2009b, 10) This can be seen in the example of complementary accessories for the Apple iPod, only some of which are licensed by Apple; moreover the iPod itself has genuinely created new demand for recorded music (Staying..., 2007, 113). Disney film is another example which generates additional revenues through the sale of merchandise and toys (Chapain et al. 2010, 25). It is argued that not only music, software and design, but also film industries have an ability to expand markets for complementary products (Creative..., 2009a, 4).
Market making spillovers or inter-market spillovers - the development of a product in one market develops a new market for other products. One example of this kind of spillover can be illustrated with the impact of the designer fashion industry on high street retail. Fashion designers’ lifeblood is the invention of new styles and designs and the innovative and creative use of different fabrics and materials. For most consumers, the closest they get to these products is on the pages of a fashion magazine. (Creative..., 2009a, 5) Furthermore, creative industries are often at the forefront of applying new technological devices, particularly in the area of information and communication technologies (ICT). Their demand for new applications can provide a major stimulus for innovation at the side of the technology producer (Müller, et al., 2009, 150-151).

ESSnet‐CultureFinalReport
- 374-
(b) CI generates knowledge spillovers if firms in other sectors benefit from new ideas, discoveries, or processes developed by CI and which are applied and commercialised in other sectors of the economy without compensation (Creative economy..., 2010, 80; Potts and Cunningham 2008; Bakshi and McVittie 2009; Evans 2009). For example, the use of social networking features was originally developed by digital media companies to manage communications in businesses and is now widely used by other sectors (Chapain et al. 2010, 24). In the context of CI, we may distinguish different ways how CI can generate knowledge spillovers.
Organisational knowledge spillovers - if we follow the hypothesis that creative industries organise themselves differently, then these ideas can spillover to the wider economy. In the case of creative industries, it is argued that many creative businesses organise their productive and innovative activities using open and collaborative models which are more suitable for highly dynamic competitive environments, and that these models can spread to those businesses in other sectors that engage with them; Potts and Cunningham (2008) refer to this as a creative ‘nudging of innovation’. It is also argued that the creative industries are more likely to engage in collaboration with other organisations (other firms in their supply chain, universities, trade bodies etc.) and this supports the hypothesis that creative industries may generate knowledge spillovers (The Creative Economy..., 2007, 27). Many creative businesses specialise in project-based work where teams form and develop their products in intense outbursts of creative activity, before dissolving and reforming around new projects. This kind of model is increasingly relevant to innovation in other sectors of the economy and creative enterprises and may serve as role models to other businesses. (Staying..., 2007, 112);
Experiential knowledge spillovers - the provision of so-called experiential services is a specific area where firms in the wider economy may draw on creative business models. In these services, the focus is on the whole experience of the customer when interacting with the organisation, rather than just the functional benefits following product or service delivery. It is argued that many lead innovators in the experiential services area look consciously outside their own industry for inspiration, including the creative industries. (Stayng..., 2007, 112);
Entrepreneurial knowledge or job mobility spillovers - knowledge spillovers can also be embodied in labour flows. Job mobility spillovers happen when labour that is trained in one industry moves to another; in particular when people find new jobs outside the creative industries and take their ideas, knowledge and creative potential with them and use it in other industries; or via transfer of tacit knowledge - skilled and talented people are a key element for a firm’s potential to absorb external knowledge (Müller et al. 2009, 151). Creative professionals such as designers, advertisers, software developers, but also professionals in film and television industries may be employed outside the creative industries, bringing with them new techniques, ideas and ways of working. Or, they may start spin-off companies in a different sector (Chapain et al. 2010, 25; Staying..., 2007, 112). It is argued that this is one of the most potent ways the creative industries can create spillovers (Müller et al. 2009, 151; Staying..., 2007, 113). Cunningham and Higgs (2009, 197) have indicated that the embedding of creative activities across the economy, raise the possibility of cross-industry linkages and ‘technology transfer’ due to creative workers; and this means that the creative sector may be significantly more involved in the innovation system of national and regional economies than has previously been recognised. It is also claimed that creative and arts professionals have skill sets that can induce innovation in the organisations that employ them (Oakley et al. 2008). Evidence from

ESSnet‐CultureFinalReport
- 375-
UK studies shows that six months after graduation, only around one-third of art and design graduates in the UK had secured work in sectors directly related to their degrees; second jobs between sectors also appear to be more prevalent in the arts than in non-arts sectors (Staying..., 2007, 113).
Interdisciplinary knowledge spillovers - creative industries have a culture of interdisciplinary working and this can be passed onto firms in other sectors (Reid et al. 2010, 13). Here it refers to examples such as biomimetic applications in architecture; drawing from nature and used in building design (e.g. the air filtration system works as a human lung). It is argued that spillovers from innovations, which create new disciplines, may be very significant, for example the explosion in applications of nano-technology. (Staying..., 2007, 112)
(c) Network spillovers happen where firms gain benefits from other firms that are located nearby, (Creative economy..., 2010, 80). Three types of network spillovers can be distinguished:
Agglomeration spillovers - these occur when firms choose to locate together due to a common supply or customer base. This may lead to making a place become more attractive because individuals value easy access to these firms; or an area becomes more attractive because the concentration of firms alters its image. This results in a situation where other firms benefit from attracting customers, suppliers or employees more readily (Creative..., 2009b, 13). It is also argued that creative activities (e.g. performing arts) need to be produced close to customers, which leads to their dispersion across the national urban system (Krugman and Venables, 1995).
Cluster spillovers - Porter (1998) defines clusters as ‘a geographically proximate group of interconnected companies and associated institutions in a particular field, linked by commonalties and complementarities’. Cluster spillovers then occur when firms locate close to another and start to interact and share knowledge. Each firm benefits from sharing its ideas with other firms and overall the firms are better off than if they had developed their ideas individually (Creative..., 2009b, 16). Regarding creative industries, it is considered inherently common to them that their activities tend to cluster (Creative..., 2005).
Attractive milieu spillovers - these are explained by the approaches of creative milieu and ‘quality of place’ and are closely related to Florida’s (2002) approach of creative class and its impact on urban growth. It is argued that the existence of creative industries (in the city, region etc.) may also signal the presence of a ‘creative milieu’, which attracts other individuals (McGranahan and Wojan 2007; Wedemeier 2010). According to Florida (2002, 2005) a diverse composed of professions ranging from R&D professionals to artists are key to contemporary urban economic growth. This means that cities with large ‘bohemian’ populations - artists, musicians and other artistic occupations - will be more likely to experience growth in their highly skilled populations (Lee 2010, 7). Other discussions also indicate that the creative industries make areas more attractive to outsiders - e.g. tourists, foreign investors (Pratt 2009).

ESSnet‐CultureFinalReport
- 376-
4. Measurement of CI spillovers We propose the following approach to map the main choices and possibilities in the process of measuring CI spillovers. It is a process model which contains three stages (see also Figure 1):
o pre-stage for measuring spillover;
o defining the object and the spillover effect for measurement;
o selection of suitable measurement method and indicators.
Below is a description of the three stages in more detail:
4.1. Pre-stage We presume that before measuring a CI spillover the indicators evaluating the general situation and amount of creative industries need to be calculated beforehand (for instance, we cannot evaluate CI sector impact on city’s attractiveness or on other sectors if the CI sector in given city is practically non-existent). The high value of these indicators suggests the greater importance of a CI sector and can be considered as (additional) justification for exploring CI spillover. Pointing out the general indicators, we follow the list of key indicators proposed in the frame of the ESSnet-Culture project. These are associated with evaluating the general amount of entrepreneurship, employment, export and import of CI:
o Share of the CI enterprises in the overall economy;
o Share of the CI enterprises turnover in the overall economy’s turnover;
o Share of the value added produced by CI sector compared to the overall economy;
o Share of employment in a CI sector in the total employment;
o Share of CI goods in total import;
o Share of CI goods in total export;
o Share of CI services in total import (recommendation for the future);
o Share of CI services in total export (recommendation for the future). In respect to measuring certain regions or specific cases there may also be a need for more specific background data. In exploring certain localities the following indicators can be exploited, e.g. critical mass of cultural, creative events in a given region (Landry, Matarasso, 2001; Bianchini, Landry, 1994), amount of cultural institutions (theatres, cinemas etc.) and other cultural, creative centres; share of foreigners in artist occupations etc. The relevance of different background indicators depends on the type of measurement and on the specifics of the category of CI (CI sector, branch, creative event etc.) needed to measure.

ESSnet‐CultureFinalReport
- 377-
Figure 12 - The process model for measuring CI spillover
“PRE” STAGE: Analysis of the context: overview of CI sector by general indicators
WHICH IMPACT WE NEED TO MEASURE
constant activity of sole CI branch, sub-sector constant activity of complex of CI branches
(which are permanently connected (via common space))
sole CI branch related to single or pulsating
activity (e.g. event related to CI branch or sub-sector)
complex of CI sectors engaged in single or
pulsating activity
WHAT IS THE EXTENT OF CI SPILLOVER EFFECT
impact of one CI branch to other CI branches
impact of CI on other related sectors
CI wider impacts on various fields in various
contexts
WHAT IS THE TYPE OF TRANSFER MECHANISM AND SPILLOVER EFFECT
via common networks/relationships –
spillover effect occurs due to the existence of network relationship between CI sector and other sectors (production and demand spillover, knowledge spillover, job mobility spillover);
via common space – spilover effect occurs due to the spatial proximity of different actors (network spillover);
via undetermined circumstances/contingencies – spillover effect occurs whithout any (explicit) causal or spatial relatioships between CI sector and other fields (knowledge spillover).
KEY ISSUES IN THE MEASUREMENT OF CI SPILLOVER
SELECTION OF SUITABLE MEASUREMENT METHODS AND INDICATORS

ESSnet‐CultureFinalReport
- 378-
169B4.2. Defining the object and the spillover effect for measurement
We may distinguish three main issues which need to be determined for measurement of spillover effect.
Firstly, it is the question of defining the CI activity which spillover we need to measure. Four possible categories can be distinguished:
(1) constant activity of sole CI branch or sub-sector - here CI is approached as a field of activity which is defined as statistical category. Following the division determined by ESSnet-Culture the following sub-sectors are important: heritage (museums, historical places and archeological sites), archives, libraries, books and press, visual arts (incl. plastic arts, photography), performing arts (incl. music, dance, drama, circus, cabaret, combined arts, other live shows), audiovisual & multimedia (film, radio, television, video, sound recordings, multimedia), design, architecture, advertising, art crafts.
(2) constant activity of complex of CI branches which are permanently connected - here CI is approached as a group of activities which are somehow, but permanently related. This category encompasses following forms of CI activities: creative district, cultural/creative centre, cultural quarter, creative incubator, culture cauldron etc.
(3) sole CI branch related to single or pulsating activity (‘ephemeral’ activity) - here CI is approached as an activity which occurs in form of single or certain regular event; and we measure the impact of an event related to single CI branch or sub-sector (e.g. guitar festival, graphic exhibition etc.).
(4) complex of CI sectors engaged in single or pulsating activity (‘ephemeral’ activity) - here CI is also approached as an activity which occurs in form of single or certain regular event; the difference from the previous is that the event encompasses various CI branches or subsectors (e.g. medieval days festival, cultural festivals, events related to European Capital of Culture etc.).
Secondly, it is the question in which fields or sectors the CI spillover effect may occur - the extent of the spillover effect. In general, these can be divided into three:
(1) impact of one CI branch to other CI branches. Close connectedness and mutual interdependences of CI sectors widely recognized characteristic of CI and therefore we may presume that spillover effects occur among CI sector - between different branches.
(2) impact of CI on other related sectors. It is widely argued that CI activities are strongly related to other activities of other sectors by giving important input, added value etc. The central question here is to define the key sectors which are influenced by the CI sector the most;
(3) CI wider impacts on various fields in various contexts. Creative industries have wide and many-sided effects in the fields of economy, social sphere and revitalization and development of (urban) space -e.g. contribution to quality of life, cultural identity, pluralism).

ESSnet‐CultureFinalReport
- 379-
The third issue concerns the type of transfer mechanism via which the spillover effect is occurring. Based on the types of spillover effect three main transfer mechanisms may be distinguished:
(1) joint/common networks/relationships - spillover effect occurs due to the existence of network relationship between CI sector and other sectors. For instance, the creative industries may increase productivity in other sectors; spillover effect may be happen due to CI’s important role in part of the production chain etc. In this case we may identify production and demand spillover, knowledge spillover and job mobility spillovers.
(2) common space - spillover effect occurs due to the spatial proximity of different actors. This follows the understanding of CI’s important role in spatial (re)generation and its ability to increase space attractiveness; and on the other hand, that proximity of actors fosters the knowledge flows between them. Accordingly, this case is about network and knowledge spillovers.
(3) undetermined circumstances/contingencies - spillover effect occurs without any (explicit) causal or spatial relationships between CI sector and other fields. It happens if creative ideas and products spill over into other sectors. In this case we talk about identifying first and foremost knowledge spillovers.
4.3. Selection of suitable measurement methods and indicators
The selection of suitable measurement instrument depends on the purpose what has been set for the study. We propose three possible approaches for exploring the spillover effect, by distinguishing macro, meso and micro level measurement. As follows the three approaches are described in more detail. In regard of each approach we: (a) specify which CI activity categories can be encompassed; (b) evaluate whether different types of spillover effects can be identified and (c) indicate to the methodological limitations and interpretations of the measurement. It is important to emphasize that the ‘notion’ indicator is understood differently in different approaches, it may be understood as: (a) residual component which reveals the existence of spillover effect (approach 1A and 1B); (b) parameter for the basis of comparison of different countries or regions (approach 1C and 2) - spillover effect is measured based on the comparison of certain ratios of different countries; (c) indicator which measures certain type of spillover effect, mechanism, intensity etc. (approach 3). APPROACH 1: Measurement of CI spillover based on macro level aggregated parameters This approach to spillover measurement lies in exploring the statistical relationship between CI general indicators (e.g. the amount of CI sector in terms of CI sector turnover, number of employees and enterprises etc.) and the economic integral output indicators (e.g GDP per capita, GDP dynamics etc.). This is macro-level assessment where the underlying assumption is that certain part of the value creation is created due to impact of the CI. Spillover measurement in this approach means identifying (the importance of) indirect impact of CI on economic performance. Three alternatives in applying macro-level analysis can be

ESSnet‐CultureFinalReport
- 380-
distinguished: (a) demand side estimation, (b) supply side estimation and (c) comparative approach.
a) Demand side estimation
Here the spillover of CI on the GDP is approached through consumption of outputs of CI. It is assumed that people make their decision on working time on the basis of comparison of marginal utility of labour time with marginal utility of leisure time. They increase of number of working hours (and decrease of number of leisure time up to the proportion of time use when marginal utility of the last hour of work is equal to the last hour of leisure time). Wage is equal to marginal utility of working hours. As according to our assumption the marginal utility of (last) working hour is equal to the (last) unit of leisure time. For that reason it is possible to use working time wage as an equivalent for leisure time, part of which is used for consumption of CIs products. For this calculation, only this time of leisure is used which is dedicated to consumption of the CI products. The impact of CI on the GDP is received aggregating number of hours spent with consuming outputs of CI in working time equivalent (hourly wage). It is clear that such aggregation would work only on the level of national economy as a whole because the GDP per capita or hourly wage in different industries depend also on other circumstances like the market structure (are there competitive markets or monopoly…). The analogy of this type of calculations can be drawn from ‘happiness research’ (see Box 1).
BOX 1
The analogy with results of the “happiness research” outcomes could be used here. According to the results of these studies, which is called as Easterlin Paradox, the substantial real income growth in Western countries over the last fifty years did not bring any corresponding rise in reported happiness level. It has been argued that there is a strong correlation between material well-being and “effective happiness” up to the level on annual income up to 10000 USD and after that level, there has been practically no impact. The reason for this is that once an individual rises above a poverty line or “subsistence level”, the main source of increased well-being is not income but rather friends and good family life (Clark et al 2008). That argument has been used in different studies, which tried to estimate similar relationships in different countries with different living standards. The question was that how general is this result has a common feature for different societies.
Steps to calculate CI spillover to total output are following: all calculations are made on the basis of the worked hours in different industries consisting proportion of the CI output. Then, the all worked hours with different fraction of CI is aggregated together. The fraction of output of CI is derived as a proportion of output of CI in total output on countries with different level of output per capita.
b) Supply side estimation
Supply side indirect estimation assumes that the GDP production would require input which could be achieved through consumption (existence) of certain knowledge (experience), which is an output of CI. We could assume that such knowledge is important for production activities like technological progress (knowledge) in production function. Above certain income level (10,000 USD per year), first of all this knowledge makes possible further

ESSnet‐CultureFinalReport
- 381-
increase of income level (economic growth), or will be a factor making possible substantial part of this increase. The relative measurement exercise, based on assumption that difference in GDP per capita level between countries have statistically related to the (relative) size of their CI. In other words, that approach assumes that without the outputs of CI part of the GDP would not be created. It is possible to put these estimates into context of deriving imputed rental payments, as the contribution of other production factors (first of all, labor) would be possible on particular level of productivity only if the CI output have been available. Here the analogy concerns endogenous economic growth theory, which emphasized the role of the exchange of ideas in stimulating technological innovation (see Box 2).
BOX 2
Edwards has proposed a model linking productivity increase with innovation and stock of accumulated knowledge (1) and (2): Yt=Atf(Kt, Lt) (1), t t At
* = A0∏Θτ +∏ωτ(Wτ-Aτ)/Aτ (2). τ=0 τ=0
Yt stands for GDP, A*t for the stock of knowledge (technology) or total factor productivity, Kt for physical capital and Lt of labor. In formula (2) At
* stands for the stock of knowledge accumulated for the year t, Θτ is the domestic rate of innovation in the year τ during the period 0 to t, ωτ is the ability of the country to absorb external knowledge, and Aτ and Wτ refer to the stock of knowledge arising in the year τ in the country and in the World, respectively. The world knowledge is growing at the rate gτ (where gτ ≥ Θτ). The stock of knowledge is related to capability of absorbing the results of technological progress of leading countries. (Edwards 1998)
The indirect calculation consists following steps: first, the proportion of direct value of output of CIs in GDP is calculated. Then, the respective proportion is used as a fraction of value of a unit of GDP on different level of GDP per capita. Then the different levels of GDP units (with different fraction of impact of CI) are aggregated together.
c) Comparative approach
This approach explores the relationship between CI and economic performance based on the comparison of the volumes of GDP in different regions and countries. Option one is to compare regions or countries with (high importance of) CI and those regions or countries where CI sector is marginal or nonexistent. This type of study presumes that large amount of regions or countries are involved and that the regions or countries explored are as identical as possible. The second option is to use the temporal dynamics for the basis of comparison. This option presumes that long-term time-series for certain region or country are available. The spillover effect is evaluated based on the retrospective comparison of different years in terms of the change in the volume of GDP and in the amount of CI sector. In order to identify the spillover effect from other (indirect) impacts, it is very important to engage different control variables into the analysis (variables need to be specified according to certain to the needs of the measurement excercises).

ESSnet‐CultureFinalReport
- 382-
The complexity of the first type of study lies in the capability of identifying the spillover effect among other impacts (including differentiating the direct impacts and spillover effects). Otherwise the data is easy to misinterpret. Regarding methodological limitations identifying spillover effect is constrained to the regions/countries with certain level of GDP where we can assume that the GDP production requires input which is achieved through consumption (existence) of certain knowledge (experience), which is an output of CI. In case of the comparative approach, the key importance lies in identifying the identical regions/countries and also the availability of long-term data for the same regions and countries in order to guarantee the adequate interpretations about CI’s impact on economic development. In this type of study different types of spillover (knowledge, production etc.) cannot be distinguished (but this isn’t also the aim of the study). Regarding the interpretation of the indicators, then the evaluation is based on the comparison between the countries/regions or with other parameters. High value of the indicator suggest to the high impact of CI to the rest economy in certain regions/countries. Low value of the indicator would be interpreted against the background data on the geographical concentration of CI sector in certain country. It could be a sign of uneven distribution of CI sector in the country (which very often could be the case, as geographical concentrations is one of the characteristics of CI) and therefore there is a need for region-based assessment of CI spillovers (see also type 2). APPROACH 2: Measurement of CI spillover on meso level Similarly to the first approach the measurement of CI spillover effect lies in identifying the relationship between CI sector contribution and general output indicators. But differently from the first approach the meso level data of CI and the general output indicators are compared. This means that regarding integral output indicators regional and sectoral statistics are applied and also that more specific CI activity categories (incl. CI branch, group of CI activities, CI events) can be used. Accordingly, type 2 contains two alternative approaches for measuring CI spillovers: (a) region-based approach and (b) sector-based approach.
a) Region-based approach
In this case the relationship between CI and the integral output indicators of a region are explored. This approach proceeds from an understanding that CI tend to concentrate to certain regions and creative people, enterprises etc. tend to locate close to each other (more than in most other sectors). The assumption is that CI concentration in a region leads to the improved economic performance of that region. Proceeding from regional statistics enables to identify more detailed statistical patterns and trends than national data. For defining the ‘region’ NUTS classification(94) can be followed where for socio-economic analyses the regions are divided into three: major socio-economic regions (NUTS 1), basic regions for the application of regional policies (NUTS 2) and as small regions for specific diagnoses (NUTS 3). In the frame of this approach the overall impact of CI clustering (concentration) on economic performance in a given region(s) is explored. This may be calculated using different CI output
(94) The Nomenclature of territorial units for statistics, abbreviated as NUTS is a geographical nomenclature subdividing the territory of the European Union (EU) into regions at three different levels (NUTS 1, 2 and 3, respectively, moving from larger to smaller territorial units). Above NUTS 1 is the 'national' level of the Member State. NUTS areas aim to provide a single and coherent territorial breakdown for the compilation of EU regional statistics. The current version of NUTS (2006) subdivides the territory of the European Union and its 27 Member States into 97 NUTS 1 regions, 271 NUTS 2 regions and 1303 NUTS 3 regions, (Eurostat, http://epp.eurostat.ec.europa.eu).

ESSnet‐CultureFinalReport
- 383-
indicators (similar to those used on macro level): turnover, number of employees and enterprises in CI sector or in certain branches, amount of CI occupations, existence of CI events etc. and comparing those indicators with different regional statistics’ indicators. In order to identify the spillover effect from other (indirect) impacts, it is again very important to engage different control variables into the analysis (variables need to be specified according to certain needs of the measurement excercises).
b) Sector-based approach
In this case the relationship between CI and the output indicators of other sectors are explored. The approach bases on the overall assumption about the linkages between CI and other sectors which support the argument that CI has ability to power the growth of other sectors. Thus, we may presume that the change in outputs of CI sector leads to the change in the outputs of other sectors. This approach contains two options for measuring CI spillover.
o One option is to evaluate the relative importance of CI sector or selected in other sectors’ innovation capability. Here we use the argument about CI potential to support innovation in other sectors. This may happen through the spillover of knowledge and organisational practices, and also through the interdependences of CI and other sectors’ products and services. Spillover effect in this case is calculated on the bases of the proportion of new products and services, new organisational practices etc. which are influenced by the input from CI sector.
o Another option is to employ the job mobility parameter and assess the changes in other sector’s outputs proceeding from the peoples’ mobility from CI sector to other sectors. This option is supported by the assumptions that CI sector can be characterized by relatively high mobility rate and, on the other hand, that the knowledge of CI sector is applicable and also needed by other sectors.
In case of both approaches the spillover effect is explored by comparing respectively different regions or observing the dynamics of the same area, or on the other hand, comparing different sectors and the dynamics of the sectors. Regarding both approaches the methodological limitations lie in distinguishing the spillover effect (indirect impact) from direct impacts. Concerning the regional approach the calculation of spillover depend on the availability of long-term regional data and the existence of CI concentration indicators in particular. In case of comparative study the complexity lies also in determining the regions as well as the ratios of concentrations that are to compare because these may vary to large extent in different countries. Regarding sector-based approach the problematic issue concerns the respondent-enterprises for whom it may be difficult to distinguish the innovation linkages with CI sector from other sectors and this may also lead to underestimating the importance of CI sector in their innovation capability. Regarding the interpretation of the indicators, the evaluation is based on the comparison between sectors or regions (including international comparison). High value of the indicator suggest to the high impact of CI to the other sectors and/or in given cities/regions. Regarding sector-based approach low value of the indicator would need to be interpreted against background data of the overall innovation potential of enterprises as well as the overall mobility rate. In case of region-based approach the low value could be a sign of weak connection between CI concentration and region’s economic performance; but this would also need to be interpreted

ESSnet‐CultureFinalReport
- 384-
against background data of the overall economic structure and the relative importance of CI in it. APPROACH 3: Measurement of the causalities and character of the CI spillover This approach focuses on exploring the chain of impact of CI and/or the causalities of the relationship between CI and other fields. The bases for this approach are different theoretical explanations about the forms of expression of spillover effect. It proceeds from raising the questions about which type of impact is occurring, where (in which type of relationships) it appears, what factors have induced and facilitated it etc. Here we approach to spillover measurement on micro level and apply those kinds of parameters which help to identify do different types of spillovers and the forms of appearance described theoretically reveal also in real situations. The measurement of spillover effect is approached via exploring individual cases, given sectors, spheres etc. Here two alternatives for measuring spillover can be distinguished:
a) Firstly, identifying possible chains of impacts (relationships) between CI and other fields. This option is based on assumption that spillover effect occurs due to the interdependences between CI sector and other sectors. These mutual interdependences lead to different forms of spillover effect, e.g. production and demand spillover, knowledge spillover, job mobility spillover. It is presumed that other sectors or fields are somehow benefitting from CI or there have been some kind of positive effect – e.g. increase in demand, raise in attractiveness of certain area, the scope of activities have emerged etc. For measuring the spillover effect we start from raising a hypothesis that CI sector or certain CI branch(es) have an impact to other spheres, fields or areas. Based on the previous studies we may claim that: (a) all CI branches may benefit from spillover effect from all other CI branches; (b) concerning other sectors then it is possible to divide CI branches into groups based on which other sectors may benefit from spillover effect; e.g. we may argue that visual arts and (arts) crafts may give spillover effect to the same sectors, but the sectors which are benefitting from the spillovers of advertising sector are (completely) different. In table 1 the most probable other sectors which may benefit from CI spillovers have been brought out.
b) Secondly, exploring local CI complexes (‘hubs’) where the actors (in CI and other sectors) are related via common space. This proceeds from the hypothesis that spillover effect occurs due to the spatial proximity of different actors (network spillover). This approach lies in exploring the spillovers of the complexes of CI branches (CI clusters, quarters etc.) and also CI events. Concerning the complexes of CI branches - CI clusters, quarters, districts etc. then the spillover effect may occur among the CI branches in the cluster/quarter etc. and, on the other hand, the creative cluster/quarter etc. may generate spillovers to other sectors. On the one hand we may proceed from the assumption that CI clusters, quarters etc. generate spillovers to service and trade sectors located nearby. It may be assumed that the participants of CI cluster, quarter etc. use the services of these sectors or they may also have common customers and CI cluster, quarter etc. may attract new customers. On the other hand we may presume that CI clusters, quarters etc. may enhance the attractiveness of the place in general which results in terms of attracting new citizens or helping to support to retain the existing citizens; it may also lead to the raise in household spending and increase in local government revenue; also, this may result in increase of investments influx and foster commercial activity in the region.

ESSnet‐CultureFinalReport
- 385-
The similar logic can be applied in regard of CI events. Respectively, one option for exploring the spillover effect is via service and trade sectors in the area. CI events may raise the turnovers of other businesses due to the expenditures made by visitors of the event; same applies on the increase of demand for other sectors products and services. Another approach is to proceed from the assumption that spillover effect of CI events appears in terms of enhancing the attractiveness of the place in general. The spillover effect may be expressed in terms of attracting new citizens or helping to support to retain the existing citizens; this may lead to rise in household spending and increase in local government revenue; also, this may result in increase of investments influx and foster commercial activity in the region. In this approach we can develop indicators which directly measure the spillover effect: the existence of spillover, the strength of the impact etc. The indicators developed are (generally) case specific and depend on certain study. Due to the countless number of different cases and situations it is impossible to predetermine all the possible channels and all kinds of impacts which are important to explore. However, we may define the general logic of the process of measuring spillover: (a) Identifying the existence of touch points between given CI branch, quarter, event etc. and other sectors; (b) Assessing the existence of influence of CI branch, quarter etc.; (c) Identifying the benefits from the relationship with CI branch, quarter etc.; (d) Evaluating the nature and scope of the impact (spillover). Regarding the methodology this approach presumes specific studies or case studies. Specific and targeted questionnaires can be considered the most appropriate tool for measuring the spillover effect. Spillover effect can be measured by developing specific polls or surveys. Similarly to previous two approaches the indicators of the third approach can be compared with general output indicators (e.g. turnover, GDP etc.) of the region or also with the general indicators of CI sector. The comparative study can also be applied in the context of the third type of study. If comparable regions (city districts, countries, regions etc.) can be identified the study may encompass large amount of different areas. Applying this approach for measuring CI spillovers it is unable to make conclusions about how CI sector or given CI sub-sector indirectly increases the overall GDP, living standard etc. of given country, region or city. The fact that the overall spillover of CI cannot be evaluated is the main methodological limitation of this type of approach. The other limitation concerns the subjectivity of assessment. In case of this approach the spillover effect is often measured by using opinions and by giving evaluations on different impacts: e.g. assessing the strength of the spillover in comparison with other impacts, assessing the importance of spillover in given chains of impacts etc. Regarding these evaluations the result of the measurement is dependent on the subjective perception of given respondent. Methodological and operational difficulties of this type of studies are also that they are time and resource consuming due to the case-specific approach. The usage of more specific CI activity categories presumes that these should be determined beforehand; e.g. defining cultural quarter, creative district, CI cluster, the scale of festivals (local, international etc.). From methodological point of view this may become a problematic issue as there are several parallel definitions available and different cities and regions proceed from different definitions. Furthermore, statistical categories for CI cluster, cultural quarter etc. have also not yet defined. Regarding interpretations of this type of studies, then making broader generalizations may be complicated and also limited. We may still claim that high value of the indicator suggest to the high impact of CI in given locality or on other spheres or fields. Differently from two previous approaches the high value of the indicator represents rather clear sign of the strong

ESSnet‐CultureFinalReport
- 386-
importance of CI. As the indicators can be associated with concrete cases it has important practical value in regard of development of certain areas or fields; and therefore, can be also used as benchmarks in developing local policies.
Group of CI sub-sectors Related sectors which may benefit from spillover effect from CI sectors
Heritage tourismb ICT trade branches located nearby manufacturing of machinery and equipment
Archives, Libraries ICT trade branches located nearby education sector
Visual arts and (art) Crafts
publishingb real estate tourism ICT education sector
Performing arts trade catering health services (incl. music therapy) other personal services tourism ICT trade branches located nearby
Architecture real estateb construction branches ICT tourism KIBS (testing equipment, measuring, manufacture of process equipment)a
Design All sectors may benefit from spillovers from design sector Advertising ICT
KIBS (computer manufacturing, market research, database consulting)a Audiovisual and multimedia (radio, television etc.)
ICTb tourism education sector manufacture of machinery and equipment
Books and press ICT education sector manufacture of computing machinery
Note: KIBS – knowledge intensive business services a based on NESTA co-location study b CI probably has direct impact on this sector in addition to spillover effects
Source: Study on the potential of creative industries carried out in Estonia (2009); Creative Clusters and Innovation, NESTA (2010), Florida (2002), Creative Industry Spillovers, Frontier Economics (2010)
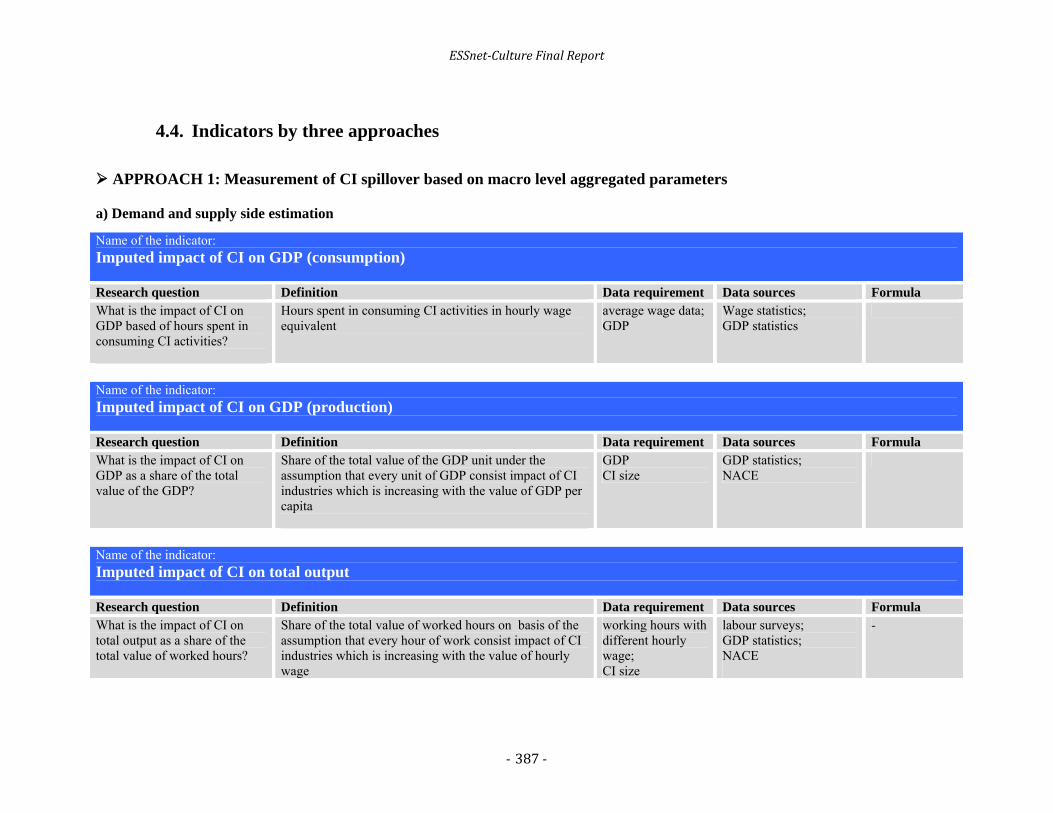
ESSnet‐CultureFinalReport
- 387-
4.4. Indicators by three approaches
APPROACH 1: Measurement of CI spillover based on macro level aggregated parameters a) Demand and supply side estimation
Name of the indicator: Imputed impact of CI on GDP (consumption) Research question Definition Data requirement Data sources Formula What is the impact of CI on GDP based of hours spent in consuming CI activities?
Hours spent in consuming CI activities in hourly wage equivalent
average wage data; GDP
Wage statistics; GDP statistics
Name of the indicator: Imputed impact of CI on GDP (production) Research question Definition Data requirement Data sources Formula What is the impact of CI on GDP as a share of the total value of the GDP?
Share of the total value of the GDP unit under the assumption that every unit of GDP consist impact of CI industries which is increasing with the value of GDP per capita
GDP CI size
GDP statistics; NACE
Name of the indicator: Imputed impact of CI on total output Research question Definition Data requirement Data sources Formula What is the impact of CI on total output as a share of the total value of worked hours?
Share of the total value of worked hours on basis of the assumption that every hour of work consist impact of CI industries which is increasing with the value of hourly wage
working hours with different hourly wage; CI size
labour surveys; GDP statistics; NACE
-

ESSnet‐CultureFinalReport
- 388-
b) Comparative approach (measuring spillover presumes comparing the indicators between many different countries or based on long time-series)
Name of the indicator: Turnover of CI sector on economic performance Research question Definition Data requirement Data sources Formula What is the impact of CI on economic performance investigated through turnover of CI sector?
Turnover of CI sector compared to: (a) GDP (b) GDP per capita
turnover of CI sector; GDP or GDP per capita; different control variables
NACE; GDP statistics
- d
Name of the indicator: Share of people at CI occupations in total employment Research question Definition Data requirement Data sources Formula What is the impact of CI on economic performance investigated through the share of people at CI occupations in total employment
Share of people at CI occupations in total employment compared to: GDP GDP per capita
number of people at CI occupations; total employment data; GDP or GDP per capita; different control variables
ISCO classifier; Tax Board data; GDP statistics
-
Name of the indicator: Share of people working in CI sector in total employment Research question Definition Data requirement Data sources Formula What is the impact of CI on economic performance investigated through the share of people working in CI sector in total employment
Share of people working in CI sector in total employment compared to: GDP GDP per capita
number of people working in CI sector; total employment data; GDP or GDP per capita; different control variables
NACE; Central Commercial Register data; GDP statistics
-

ESSnet‐CultureFinalReport
- 389-
APPROACH 2: Measurement of CI spillover on meso level a) Regional (comparative) approach (measuring spillover presumes comparing the indicators between many different countries or based on long time-series)
Name of the indicator: Turnover of CI sector or CI branch in regional economic performance Research question Definition Data requirement Data sources Formula What is the impact of CI or CI branch on regional economic performance investigated through the turnover of CI sector or CI branch?
Turnover of CI sector or given CI branch compared to: regional GDP regional GDP per capita
turnover of CI sector or CI branch; regional GDP or regional GDP per capita; different control variables
NACE; GDP statistics
-
Name of the indicator: Share of people at CI occupations in regional total employment Research question Definition Data requirement Data sources Formula What is the impact of CI on regional economic performance investigated through the share of people at CI occupations in total employment?
Share of people at CI occupations in total employment compared to: (a) regional GDP (b) regional GDP per capita
number of people at CI occupations; total employment data; regional GDP or regional GDP per capita; different control variables
ISCO classifier; Tax Board data; GDP statistics
-

ESSnet‐CultureFinalReport
- 390-
Name of the indicator: Share of people working in CI sector in regional total employment Research question Definition Data requirement Data sources Formula What is the impact of CI on regional economic performance investigated through the share of people working in CI sector in total employment
Share of people working in CI sector in total employment compared to: regional GDP regional GDP per capita
number of people working in CI sector; employment data; regional GDP or regional GDP per capita; different control variables
NACE; Central Commercial Register data
-
Name of the indicator: Share of additional expenditures related to visiting CI events Research question Definition Data requirement Data sources:
Formula
What is the share of additional expenditures related to visiting CI events? Question in questionnaire: How big are your additional expenditures when visiting CI events (e.g. festivals)?
Additional expenditures related to visiting CI events compared to: average income in region regional GDP (demand spillover)
additional expenditures related to visiting CI events; average income or regional GDP
Citizen surveys; Labour force surveys; Household Budget Survey; Foreign visitors surveys; Wage statistics; GDP statistics
100*(E/P) E = additional expenditures related to visiting CI events P = average income / regional GDP

ESSnet‐CultureFinalReport
- 391-
b) Sector-based approach
Name of the indicator: Mobility rate of people from CI sector to other sectors Research question Definition Data requirement Data sources Formula Does the mobility of people from CI sector to other sectors influence turnover of other sectors?
Number of people from CI sector moved to other sectors divided by the turnover of other sector; the sum multiplied by 100. (job mobility spillover)
number of people from CI sector moved to other sector; sector turnover
ISCO classification; Tax Board data
100*(E/P) E = Number of people from CI sector moved to other sector P = Other sector turnover
Name of the indicator:
Share of new products and services influenced by the input from CI sector Research question Definition Data requirement Data sources Formula What is the share of new products and services which are influenced by the input from CI sector or given CI branch (Innovation capability)
Share of new products and services that: base on the knowledge /invention of CI sector (knowledge spillover) are produced due to the new services and products in CI sector (product spillover) are produced due to the increased demand which is induced by CI sector (demand spillover) divided by the total number of new products and services; the sum multiplied by 100.
Number of new products and services which are influenced by the input from CI sector or given CI branch; Total number of new products and services in the enterprises explored
New question into Community Innovation Survey (CIS)
100*(E/P) E = new products and services which are influenced by the input from CI sector P = Total number of new products and services in the enterprises explored

ESSnet‐CultureFinalReport
- 392-
Name of the indicator: Share of CI related information sources (for innovation activities) Research question Definition Data requirement Data sources Formula What is the share of CI sector among the sources of information for innovation activities? (Innovation capability) A list of CI related sources should be defined (e.g. fashion shows, design festivals etc.)
Share of CI sector among the sources of information for innovation activities divided by the share of other information sources for innovation; the sum multiplied by 100. (knowledge spillover)
Share of CI related information sources for innovation; Share of other information sources for innovation in the enterprises explored
New question into Community Innovation Survey (CIS)
100*(E/P) E = Share of CI related information sources for innovation P = Share of other information sources for innovation in the enterprises explored
Name of the indicator: Share of new employees hired from CI sector Research question Definition Data requirement Data sources Formula What is the share of new employees hired from CI sector? Question in the questionnaire: Have you hired new employee from CI sector?
Number of employees hired from CI sector divided by the total number of new employees; the sum multiplied by 100. (knowledge spillover)
Number of employees hired from CI sector; Total number of new employees in the enterprises explored
New question into Community Innovation Survey (CIS)
100*(E/P) E = Number of employees hired from CI sector P = Total number of new employees in the enterprises explored

ESSnet‐CultureFinalReport
- 393-
APPROACH 3: Case specific approach
Examples how to measure spillover of cluster:
Name of the indicator: Share of certain CI clusters among information sources for innovation activities
Research question Definition Data requirement Data sources Formula
What is the share of certain CI clusters among the sources of information for innovation activities? (Innovation capability)
Share of certain CI clusters as information sources for innovation divided by share of other information sources for innovation; the sum multiplied by 100. (knowledge spillover)
Share of certain CI clusters as information sources for innovation; Share of other information sources for innovation
Enterprise surveys; Case study
100*(E/P) E = Share of certain CI clusters as a information sources for innovation P = Share of other information sources for innovation
Name of indicator: Changes in prices of the real estate (located nearby CI cluster, quarter etc.)
Research question Definition Data requirement Data sources Formula
How the prices of the real estate have changed due to the proximity of the new CI cluster, quarter?
Prices of the real estate located nearby compared with the prices before new cluster, quarter etc. (demand spillover)
Average real estate prices
Case study; Real estate statistics
Case specific
Name of indicator: Influence of CI cluster on citizens
Research question Definition Data requirement Data sources Formula How has CI cluster: influenced citizens’ consumption of culture; helped to retain the existing population; increased the attractiveness of space (for new citizens)
Case specific
Qualitative Case study; Visitor surveys
Case specific

ESSnet‐CultureFinalReport
- 394-
Examples how to measure spillover of the CI events: Name of indicator: Additional expenditures related to visiting CI event Research question Definition Data requirement Data sources Formula How big are additional expenditures related to visiting certain CI event? Event need to be specified in each case
€ (network spillover)
additional expenditures related to visiting certain CI event
visitor surveys
-
Name of indicator: Main areas of expenditures related to visiting CI events Research question Definition Data requirement Data sources Formula What are the main areas of additional expenditures related to visiting certain CI event? A list of spheres should be defined (e.g. costs related to transport, food, accommodation etc.)
€ per areas (network spillover) Case specific
visitor surveys Case study; Statistics of accommodation
Case specific
Name of indicator: Share of turnover (of other sectors or enterprises located nearby) related to CI event Research question Definition Data requirement Data sources Formula How much given CI event has increased turnover of other sectors (enterprises located nearby) Event need to be specified in each case
Turnover related with event divided by the total turnover; the sum multiplied by 100. (demand spillover)
enterprises in certain sector or located nearby
Enterprise surveys; Case study; Statistics of accommodation
Case specific

ESSnet‐CultureFinalReport
- 395-
Name of indicator: Share of new investments related to CI event
Research question Definition Data requirement Data sources Formula Has the CI event increased investments into the region/city/etc.? Event and region need to be specified in each case.
Event related investments divided by the total investments; the sum multiplied by 100. (network spillover)
Event related investments; Total investments
case study (local public sector representatives)
100*(E/P) E = Event related investments P = Total investments
Name of indicator: Share of visits related with CI event
Research question Definition Data requirement Data sources Formula Are visits related to certain CI event in the region/city/etc.? Event and region need to be specified in each case.
Number of visits related to certain CI event divided by the total visits; the sum multiplied by 100. (network spillover)
Number of visits related to certain CI event; Total visits
foreign visitors survey
100*(E/P) E = Number of visits related to certain CI event P = Total visits
Name of indicator: Share of expenditures of foreign visitors related to CI event
Research question Definition Data requirement Data sources Formula What is the share of expenditures of foreign visitors related to CI event? Question in questionnaire: How much do you plan to spend or spent during your stay which is related to cultural/creative event in the region/city/etc.? Event and region need to be specified in each case.
Expenditures related certain CI event divided by the total expenditures; the sum multiplied by 100. (network spillover)
Expenditures related to certain CI event; Total expenditures of given visit
foreign visitors survey
100*(E/P) E = Expenditures related certain CI event P = Total expenditures of given visit

ESSnet‐CultureFinalReport
- 396-
Name of indicator: Future visits related to CI event Research question Definition Data requirement Data sources Formula Are the visits in the future related to certain CI event? Question in questionnaire: Are you planning another visit in the next 3 years related to certain CI event?
Number of visits in the future related to certain CI event
visitors survey -
Name of the indicator: The relative importance of CI related factors in choosing the place for living Research question Definition Data requirement Data sources Formula What is the importance of CI factors among other factors that influence choosing the place for living? A list of possible factors list should be defined.
Case specific
Qualitative Citizen surveys Case study
-
ESSnet‐CultureFinalReport
- 397-
NOWADAYS CULTURAL PARTICIPATION An update of what to look for and where to look for it
By
Jos de Haan, SCP /Netherlands Institute for Social Research (Netherlands)
Andries van den Broek, SCP/ Netherlands Institute for Social Research (Netherlands)
Major changes in society – steady societal change on the one hand and the rapid adoption of IT on the other – profoundly affect the nature of cultural participation. New forms of cultural expression are developed and gradually became recognized as such. New ways of relating to such expressions came into being, both physical and digital. As such, the landscape of cultural participation is changing to such an extent that, to put it sharply, merely measuring physically attending canonised cultural institutions misses an increasing part of the picture. Research into cultural participation needs to adapt in order to trace these developments. In this paper we offer short overviews of the aforementioned changes and of their impact on cultural participation. Then we devise a scheme we consider to be helpful in subdividing the full scope of the field into manageable subsections. Next we propose a perspective from which to analyse those subsections. We then scrutinize a number of those subfields and our main findings in the concluding paragraph. An extensive appendix details some of the new suggestions to be considered.
1. The challenge Studies of the public interest in arts and cultural heritage have long been biased towards the ‘high arts’. Ever since the very first studies into cultural participation, this focus has led to the outcome that the higher circles of society stand out as more culturally interested than other parts of society, an outcome so well-established that it became one of the few ‘golden rules’ in sociology. The explanation behind this mechanism is the two-edged theory of competence and distinction. While individuals from higher status groups might be better equipped to understand and appreciate high arts through the process of socialisation (esp. transmission of cultural capital), they also tend to affirm and express their belonging to higher circles by embracing those arts so as to distinguish themselves through their cultural preferences from those less refined (e.g. Bourdieu 1984). Two developments in the past decades urge for a broader and more up-to-date outlook on cultural participation: the on-going changes in society and the proliferation of new media. With the democratization of society at large, and of culture in particular, boundaries between leisure activities of different status groups started to erode. This was not only because of a rise of the masses (so to speak), but also because higher status groups showed less restraint in engaging in forms of leisure and culture other than the high arts (e.g. Peterson 1992, Peterson and Rossman 2007). The first reading of this process was a move among the better-off in society from snobs to omnivores, i.e. from valuing only the high arts (highbrow univores) to

ESSnet‐CultureFinalReport
- 398-
valuing both high arts as well as, to put it neutrally, ‘other’ forms of cultural expression (omnivores combining highbrow and lowbrow). In his later reading of this process, Peterson went one step further by identifying the ascent of the ‘nobrows’ among higher status groups, univores again, but this time with an appetite only for the lower rather than only for the higher arts. A further complication stems from the influx of people from different cultural backgrounds into European societies. Their cultural preferences and practices are not automatically the same as those of people indigenous to the Old World. This line of reasoning will be developed in some detail below (section 2), along the lines of the processes of individualisation, intensification, informalisation and internationalisation, four of the five ‘i’-trends proposed to capture the major societal developments in Western nations (Schnabel 2000). The other major development has to do with the proliferation of new media, or informatisation (the fifth ‘i’-trend distinguished by Schnabel). In the course of the 20th century, audio and video based media (radio, TV, various types of recordings) developed in addition to the existing print media. Radio and television soon became more important ‘venues’ for the arts than traditional institutions such as museums and concert halls (a point that was often overseen in research). At the end of the 20th century, the digital media took to the stage. Its spread is especially significant because of its reciprocal character (web 2.0), allowing individuals to talk back, to exchange opinions, produce content and to form communities (section 3). The opening of cultural boundaries and the widening of digital opportunities present a challenge for research. To us, the key questions are which activities to look for in measuring cultural participation and where to look for them. New activities come to the scene and more often than before cultural activities take shape outside the walls of traditional art institutions. Community centres, festivals and self-organized parties form locations for cultural activities. Also the Internet offers platforms for new activities and is in itself a new location to experience both high and low arts. To allow for an understanding of the broadening of the cultural field, we will make two differentiations, one between the receptive and the active modes of cultural participation (attending vs. practising culture), the other between real life, mediated and digital participation (section 4). Cultural participation may encompass various activities. Here we try to capture all of those in the ICET-model, where I stands for information, C for communication and community, E for entertainment and expression and T for transaction (section 5). Guided by this model, we scrutinize each of the three modes of cultural participation (participation in the high arts in section 6, participation in the popular arts in section 7 and practicing the arts for leisure in section 8) in order to check out what the ‘knowledge implications’ of the changes mentioned are, the guiding question being “What more needs to be known?’. In section 9 we briefly summarize the outcomes of our study of the field.
2. Societal changes As mentioned above, the major societal changes in Western countries at the start of the new century were summarised in five ‘i’-trends (Schnabel 2000), four of which guide this section, the fifth being dealt with in the next one. The four trends elaborated here are: individualisation (diminished importance of traditional dependencies), informalisation (looser ties and looser interaction), intensification (growing importance of one’s own experience) and internationalisation (growing importance of the international component). These were formulated in an attempt to come to grips with current societal change at large, but they fit

ESSnet‐CultureFinalReport
- 399-
very nicely by way of sketching the broader context in which changes in the cultural domain are unfolding. Individualisation is a term used quite often these days, though not always in the same way. In fact, two interpretations of that term can be distinguished, a radical and a moderate one. In its radical guise, individualisation ‘only’ refers to the diminishing importance of traditional dependencies, without questioning whether other dependencies take their place. Individualisation then highlights the broadening opportunities of individuals to continuously make their very own and highly individual choices. This interpretation is challenged by drawing attention to new dependencies that might replace the traditional ones. In effect, this does not so much imply lesser dependencies, but different ones. Influences mentioned here are media in general, and advertisement in particular. These might explain why all the highly individualised choices cumulate into collective choices after all (‘choosing for the crowd’, Duyvendak en Hurenkamp 2004). This second interpretation was therefore labelled de-traditionalisation (Elchardus 2002), a a less catchy expression, but possibly better apt to define what is happening in the cultural domain. Before turning to the cultural implications of individualisation as de-traditionalisation, we first introduce the closely related concepts of informalisation and intensification, as the three together impact the cultural field in roughly similar ways. Informalisation refers to the loosening of formal norms that guide preferences, behaviour and ways of organising. In a way, intensification points at the other side of the same coin, by drawing attention to the growing importance of individual experience as the gauging rod for evaluating leisure time pursuits, if not life in general. Taken together, individualisation, informalisation and intensification have led to the increasing importance of (believed to be) highly individual choices and experiences, to the detriment of more traditional and formal ways of behaviour and appreciation. This is exemplified in the importance greater weight of the leisure domain in people’s individual identity. Paraphrasing Weber and Marx, this was summarised by stating that the position in the consumption process is challenging (Campbell 1987) or even replacing (Bocock 1993) the position in the production process as the key defining element of who one is. A study of personal ads in the Netherlands illuminates how rapidly the leisure repertoire, including cultural preferences, came to the fore as an (if not the most) important identity marker in the final decades of the last century (Zeegers 1998). What do the processes of individualisation (de-traditionalisation), informalisation and intensification boil down to in the cultural domain? In short: to the opening of cultural boundaries. Or, to put it less neutrally: to the ascent of popular culture, not only as an integral part of leisure repertoires, but also as a legitimate part of the cultural field. In relative terms, if not in absolute ones, this implies the descent of canonized cultural participation and the ascent of cultural participation in other spheres than those inherited from the 19th century and canonized in the early 20th century. New cultural domains emerged, both in terms of the content being created and consumed, as well as in terms of the locations where this takes place. New forms of cultural expression emerged (strips, movies, video art, game design, rock and popular music), that are enjoyed in places other than 19th century institutions such as museums, theatres and music halls. In short, high arts or canonized arts lost their aura as the only legitimate cultural pastime. This happened also among the higher status groups, where more people started mixing more diverse forms of cultural consumption in their cultural repertoires. Because of their inclination to enjoy both high arts as well as popular arts, they were coined the omnivores, as opposed to univores (or snobs) who more selectively chose to stick to a menu of high arts only (Peterson 1992). Cultural boundaries were opened not only because of this erosion of the frontier between high and popular arts, but also because of completely different processes of internationalisation. Again this relates to frontiers, international ones this time. The common denominator is the greater exchange across borders, both of cultural expressions as well as of people. Key

ESSnet‐CultureFinalReport
- 400-
observations here are the internationalisation of genres and of populations. Numerous formerly national genres gained ground in other countries, if not universally. Tango, salsa, flamenco, country and cajun are just a few of the many cultural expressions that gained popularity and recognition across the globe, as are musical instruments like bandoneon, cajon, djembé, saz and sitar. This process that expressions cross borders was fuelled by people doing so, both as tourists and as immigrants, among whom many have their roots in cultures other than Western cultures. The latter is of great importance for the cultural landscape especially in the bigger cities in Western nations, as those typically are the places where immigrants concentrate. Once present in sufficient numbers, immigrants bring forth a cultural life of their own. This tends to happen outside the temples of the canonized Western culture, due to mutual unfamiliarity. To make that part of the cultural landscape visible on the radar of cultural statistics, those radars need to be made sensitive to spotting other forms of cultural expressions being presented and consumed in other venues. In this respect, the three processes of individualisation, informalisation and intensification on the one hand and the multi-layered process of internationalisation on the other hand share a common denominator. That is the opening of cultural boundaries, which for research into cultural participation implies the necessity to rethink which activities to look for and where to look for them.
3. Informatisation: the rise and increase of internet use Information and communication technology (ICT) has become indispensable in Western societies. Different aspects of our lives have become interwoven with and dependent upon computers and the Internet. In these societies the diffusion of computers in households started in the 1980s, followed by the spread of Internet access in the 1990s. At the end of this decade the mobile phone started its rapid spread. In some countries such as the Netherlands and the Scandinavian countries these diffusion processes have almost been completed, giving almost all citizens access to unlimited amounts of information and a wide variety of applications for online communication. With the further development of infrastructure for mobile communication and the rise of smartphones and other mobile communication equipment, people can access information and communicate with each other in any place. The growing importance of ICT is recognised in concepts characterising these societies as an information society (Webster 2002), knowledge society (UNESCO 2005) or network society (Castells 1996). These technological innovations stimulate the increase in the production of information. According to Castells (1996: 32) there is ‘a cumulative feedback loop between innovation and the uses of innovation’. Individuals and organisations produce more and more information which is made available online. This availability increases the attractiveness for more users and for technological innovators to design new applications. Cultural organisations have also found their way to the Internet. Almost all institutions have a website, offering at least a cultural agenda but also an increasingly cultural content. The flow of information is connecting people in networks. New means have been created for personal communication bringing people together that are geographically separated. First there was e-mail and chat, later to be followed by instant messaging (MSN), social networks (like Facebook) and blogs. For organisations this meant new tools to present themselves to audiences and to interact with them. This started with the design of websites, which looked like digital flyers in the way the first cars looked like horseless carriers. Cultural institutions too found new ways to communicate with their audiences.

ESSnet‐CultureFinalReport
- 401-
The new technologies have given media users more and more control over the selection of news, programmes and other content. More time on the Internet runs at the expense of time spent watching television, listening to the radio and reading printed media. However, newspapers are also read on the Internet, while listening to the radio and watching television via the Internet have been growing in popularity in recent years. Because of this convergence of media, the same content is being offered via different channels, including mobile media. Digitisation of information and convergence of media mean that media users today can draw on an enormous reservoir of content. Cross-medialisation of information output in turn means that this content can be accessed via a range of platforms (newspapers, radio, television, Internet, PC, mobile phone). This gives rise to a ‘convergence culture’ (Jenkins 2006) in which patterns of media use are merging. Convergence represents [...] a move from medium-specific content toward content that flows across multiple media channels, toward the increased interdependence of communications systems, toward multiple ways of accessing media content, and toward ever more complex relations between top-down corporate media and bottom-up participatory culture (Jenkins 2006: 243). This burgeoning information landscape quickly raises questions as to the extent to which the audience (or, given their increasingly participatory role: ‘the people formerly known as the audience’) have adapted their media use. Media users are moreover not only receivers of information, but are increasingly also information producers in their own right. The users are not a homogeneous group. Some have a preference of an abundant use of new media, while others stick to old media. Rogers (2003) distinguishes between five groups when describing the diffusion of innovation: ‘innovators’, ‘early adopters’, ‘early majority’, ‘late majority’ and ‘laggards’. This breakdown into groups brings differences in ownership, motivation, use and skills in relation to new media applications into much sharper relief than socio-demographic characteristics such as sex, age and education level. Leaders in the diffusion process (innovators and early adopters) more often own and use various forms of new media (Internet, digital TV, digital peripherals or hard disk recorders built into the television, various forms of gaming computers, portable DVD and music players and smartphones) than followers (early majority and late majority) and laggards. Besides, leaders in the field of new media also show more interest in culture than the followers, and often use the Internet to inform themselves about culture and to buy tickets for concerts and performances (Huysmans and De Haan 2010). Participation in a knowledge society requires adequate digital skills. Increasingly, the possession of these skills is a condition for pursuing a successful education career, finding work and progressing in one’s career, and also for maintaining social contacts in our private lives. However, Dutch citizens differ in the extent to which they possess these digital skills. The elderly, people with less education, people who are economically inactive and members of ethnic minorities possess fewer of these skills (Van Ingen et al. 2007). Virtual cultural participation has become possible thanks to the rapid rise of the Internet and smartphones, the digitisation and online availability of cultural content and the digital skills amongst populations to take advantage of these new opportunities. As more and more people take up these new opportunities, it becomes clear that a new dimension has been added to the concept of cultural participation.
4. Mapping the challenge The societal and technological changes mentioned above also affect the world of the arts, through the opening of cultural boundaries and the widening of digital opportunities. These imply a major challenge for research. As new cultural fields and new ways of relating to those

ESSnet‐CultureFinalReport
- 402-
fields arise, research has to shift or at least broaden its focus, at the risk of becoming short-sighted. The key questions then are which activities to look for and where to look for them. To break down the problem, we make three differentiations, one between receptive and active cultural participation (i.e. attending vs. practising culture), a second between direct and digital participation, and a third between high arts and popular arts. This latter distinction has not normally been made with reference to practising the arts, where being involved in one discipline or the other is not immediately followed by the question of whether that is in high or popular arts (what is thought to matter is, for instance, whether one plays guitar, not whether one plays Vivaldi or Velvet Underground). This explains the mapping results in the three columns below, where the cells printed in italics represent the (relatively) new fields that, as yet, tend to be underrepresented in research: the popular arts and the digital ways of relating to the arts. In this paper we focus on those fields in particular.
Figure 13 - Mapping the challenge
Attending the Arts
Practicing the Arts for Leisure
High Arts Popular Arts
Participation Physical Participation Physical Participation Physical Practicing
Media Mediated Participation Mediated Participation Mediated Practicing
IT Digital Participation Digital Participation Digital Practicing
We concentrate here on what we believe to be the two major changes reworking the landscape of cultural participation: opening cultural boundaries and widening digital opportunities. The former implies taking the column of the popular arts seriously, the latter implies taking the line of digital ways of participation seriously. Below, all three columns will be scrutinized using the ICET model to be introduced in the next section.
5. The ICET model Cultural participation can take shape in many different ways. In order to classify the various opportunities, we will build on a classification of internet use (Dialogic 2002) that distinguishes between information, communication, entertainment and transaction (ICET). In slightly adjusted form, this classification is relevant beyond the domain of internet use. Also outside of the virtual domain, people inform themselves about the cultural agenda, participate in networks of culture lovers, enjoy the performing arts or buy tickets for these performances. In order to include the broad spectrum of ‘real life’ cultural participation we propose to extend the ICET-model as follows, the four types of participation still being indicated by the same letter of ICET:
Information: to seek, collect and spread information on culture.
Communication and Community: to interact with others on cultural issues and to participate in cultural networks.

ESSnet‐CultureFinalReport
- 403-
Enjoyment and Expression: to enjoy exhibitions, art performances and other forms of cultural expression, to practise the arts for leisure, and to create online content.
Transaction: to buy art and to buy or reserve tickets for shows. Both in the online and offline world, processes of information exchange are central to human behaviour. Cultural life is firmly rooted in these communication processes. In face-to-face interaction people tell each other what exhibitions or concerts they saw, and few fail to conceal their opinion about these experiences. In modern societies the supply of information has become a key task of media. Newspapers, radio and television are keen to report on new events and to review what is going on in the cultural world. These media dominated the supply of cultural information for a long time. Since the 1990s the increasing use of the Internet provides a new source of cultural information. From the start, it appealed to users for the possibility of searching and finding information. Information retrieval is still one of its most popular functions. When cultural institutions found their way to the digital domain they started providing information mostly for practical purposes such as addresses and opening hours. Soon they also provided information on the real cultural content. The distinction between communication and one-way information supply was especially relevant in the age of mass communication. As communication assumes two-way traffic in the pre-internet era, only the telephone can be regarded as a proper communication tool. With the rise of the Internet this distinction tends to blur, since the Internet is a medium for both communication and information. So far cultural institutions tend to use the Internet predominantly for informational purposes and to a lesser extent to communicate with their audiences. If so, this is mostly through e-mail. Yet the formation and maintenance of communities is recognised as an important part of the virtual future of cultural institutions as more opportunities become available, such as social media. Cultural participation concerns the consumption of cultural expressions, either in cultural institutions or through media (enjoyment), but also their production for leisure (expression). Some people enjoy going to exhibitions, shows and concerts while others listen to recorded music, watch television or use the Internet. The term enjoyment is sometimes, and possibly incorrectly, associated with shallow entertainment. This is not implied here, the enjoyment of culture can indeed be part of a process of enlightenment. Neither is it necessarily receptive: some practice an artistic discipline (practicing the arts), sometimes producing content in digital form to be shared with others on the Internet (user generated content). Finally the economic transactions are part of the participation in cultural activities. Visitors pay for their tickets, their art courses and the instruments or materials they use. They pay for recorded music, sometimes also for downloaded music. They buy art objects and some of them become art collectors. Each of the three modes of cultural participation distinguished above – participation in the high arts, participation in the low arts and practising the arts for leisure – will now be scrutinized using this ICET-model. When it comes to information, a distinction will be made between informing oneself about the practicalities of some cultural activity (where? what time? at what cost?) versus informing oneself about its cultural content (who exactly is performing?, who is the author/artist?, what did critics say?). In talking about communication, we shall distinguish communicating with other members in the audience from communicating with artists, performers or venues. Enjoyment relates to consuming a cultural event, expression to practising a discipline for leisure. Transaction can entail buying tickets, buying cultural content (books, CDs or other works of art) and buying merchandise (copyrighted material related to an event or venue, such as T-shirts of either rock bands or the Scala in Milan).

ESSnet‐CultureFinalReport
- 404-
Figure 14 - ICET at work: points taken into account discussing each mode of cultural participation
Information Practical information and information about cultural content
Communication Communication with other members of audience and communication with artist
Enjoyment/Expression
The consumption and production of art for leisure
Transaction Tickets, content (e.g.: books, cd’s, other art works) and merchandise
6. Participation in the high arts Information in the arts and cultural heritage sectors (and also in library and broadcasting sectors) becomes available increasingly on websites. At the turn of the millennium, when the Internet started to reach the majority of population, the cultural institutions were still lagging behind. Most of the cultural heritage was still safely stored away in depots of museum and archives. The European Commission (EC) spoke about a ‘treasure chest of unique resources’ (European Commission 2002: 12) and the heritage institutions were assumed to hold the key to this chest. In the first decade of the 21st century these institutions started working hard to unlock the chest and make its content available to the public at large through digital channels. The performing arts institutions were to follow their example by recording shows and concerts and putting these recordings online, at least in part. These trailers more often serve the purpose of attracting a physical audience than being the means of participation itself. The fear of losing part of the audience is still being felt in the cultural sector. However, there is no doubt that the possibilities for cultural participation have been enlarged. Here we use the ICET-model to describe these new possibilities. The culture lovers seek, collect and also spread information on culture. They communicate with others on cultural issues and participate in cultural networks. In the virtual world they enjoy to look at digital representations of art and heritage objects, (parts of) exhibitions and other forms of cultural expression. Moreover they use the Internet to buy or reserve tickets for shows, concerts and exhibitions (transaction).
Information
The Internet is used in the cultural heritage and arts sector mainly as an information medium. Virtual users are primarily in search of practical information (e.g. opening hours and accessibility). Information on cultural content is sought for less often. The search usually begins with a search instruction in Google or another search engine. Heritage portals and websites are much less commonly consulted at the start of the search process. In the Netherlands, one of the leading countries with regard to Internet access, books/magazines and radio/TV were still more important sources of cultural information than the Internet in 2003. Since then, people have increasingly begun using the Internet for this purpose. By 2007, information on theatres was just as often or even more frequently sought via the Internet than via the old media. Everyone who obtains information via the Internet also uses another medium. The Internet is partially replacing other media, but is not reaching a new audience for cultural heritage (De Haan and Adolfsen 2008). When it concerns cultural heritage (museums, monuments, archives and archaeological sites) or high arts (classical music, opera,

ESSnet‐CultureFinalReport
- 405-
ballet, theatre, galleries) research into cultural participation might take into account the different ways (social contact, old and new media) in which people inform themselves.
Communication
The Internet has enlarged the possibilities for communication about the arts and cultural heritage. E-mail, social networking and instant messaging all offer new ways for art lovers to communicate with other like-minded people or with cultural institutions. Furthermore, there are various possibilities for users to add information on culture (creation or user-generated content) to the web. They can comment on news articles about cultural topic, write blogs, join forums on social networking sites, post audio-visual material on YouTube, for example or make a website. Apart from specific groups, such as amateur historians who present results of their work, there are only a few signs of heavy involvement in this way. Notwithstanding the popularity of online communication, communication and the formation of communities are still rare in the sectors of cultural heritage and the traditional arts. However, they are likely to become more important in the near future. Research on cultural participation should take these new opportunities into account.
Enjoyment
The spread of broadband Internet connections and the growth in online content has given a major boost to online cultural participation. More and more people are viewing audiovisual material online and enjoy or even study heritage objects. This increasing popularity fits within expanding patterns of Internet use in general. First people have to establish an Internet connection. After a phase of exploration they mostly expand the amount of time they spend online. This expansion is followed by an increase in the diversity of use: they start using the Internet for an increasing number of purposes. Consuming cultural content takes up more time than searching for specific information. But opportunities to virtually walk through a museum, or to listen to a classical music concert in far away places or to see a reconstruction of buildings at archaeological sites in augmented reality and layer technology on smartphones is on the rise. Such opportunities with the additional advantage of more background information might attract more and more virtual visitors. For all forms of participation in the high arts research should also inquire into the use of digital platforms.
Transaction
Although e-commerce is now well established among private users, online ordering and paying for tickets and cultural products is slow to get off the ground. To a large extent, this is due to the limited availability of such services. To have a richer view of the economic side of cultural participation, the e-commerce side should be taken into account.
A slow start
The relatively slow take-up of the new possibilities is partly due to the composition of the group of virtual cultural visitors. People aged over 50 generally display a good deal of interest in cultural heritage and the higher arts, but (as yet) express that interest relatively little via the Internet. People especially of 65 years and older can be considered as the laggards in the information society. Older people generally prefer other information sources. Television and newspapers are their favourite, but for real devotees their own book collection serves as the starting point for increasing their knowledge. For other characteristics there is no such difference in online and offline participation. The classification of adopter types by Rogers (2003) too is partly independent of those characteristics and also influences who is culturally active online. The innovators and early

ESSnet‐CultureFinalReport
- 406-
adopters are more active in the virtual cultural world than the early and late majority and the laggards, even after taking into account controlling for personal characteristics (Huysmans and De Haan 2010). So those with an affinity for technological innovations more often and more intensely use the new digital opportunities for cultural participation.
7. Participation in the Popular Arts Digital media surrounds young people nowadays from an early age and thus these forms of media have a very strong appeal to them. Several factors account for this popularity: the rise of communication services (such as instant messaging and social networks); the possibility of adding your own information to the web (web 2.0) (children can write their own articles online, upload photos or put films online); the convergence of internet, telephone and audiovisual media and the increasing availability of content (access to information and entertainment through various media, anytime and anywhere, thanks to the mobile media) (De Haan and Pijpers 2010). These developments give rise to a networked youth culture in which old cultural preferences (popular music, movies) find new platforms for expression. Listening to music online has been popular for some time, as has watching film clips and playing games. In recent years, wireless communication has emerged as the fastest growing communication technology ever. Diffusion of smartphones and forms of wireless Internet access (such as WiFi) have detached cultural consumption from fixed locations such as the home or cultural institutions. This has given rise to a global ‘mobile youth culture’. In this culture young people find ‘in mobile communication an adequate form of expression and reinforcement’ (Castells et al. 2007: 127). According to Castells (1996) this constitutes a new form of social order characterised by decentralised, flexible network nodes connected through technologies. Young people use mobile technology to manage peer group ties and build both individual and collective identities. Patterns of influence are changing because "these new technologies move young people away from the sphere of influence of traditional socialisation structures, such as the home, the educational system, and broadcast media, while providing an ever-widening range of socializing and identification options" (Castells et al. 2007: 141). Youth culture is not restricted to the age group of adolescents but reaches much further and includes all those grown-ups loyal to their youthful preferences and ambitions. It possibly excludes the elderly who are less inclined to use online communications tools and mobile telephony. Over the past decades more has happened than the rise of new technologies. Youth culture has always embraced the popular arts. So far the surveys might have asked for the attendance at pop and jazz concerts, musical, cabaret or cinema. Due to several societal changes as discussed in section 2, new forms of expression have entered the scene. New musical genres such as house, hip-hop and also tango and flamenco gained popularity. The new music scenes often organize meetings outside the traditional places of canonized culture. With house parties in old industrial buildings and flamenco nights in community centres we have to look at different places in order to localise these forms of participation. Cabaret is still often located in the main theatres but stand-up comedy more often finds its stages in cafés and bars. Different ethnic minority groups convene in other venues for their celebrations and parties, which are accompanied by live music.
Information
People in their teens and twenties are able to find information about music, movies and stars easily via the Internet and consult information on the Web about cinema agendas and concerts

ESSnet‐CultureFinalReport
- 407-
more often than older people. The Internet has soon become an important source of information for both old and new forms of popular culture. However, most important source of information is still the advice of friends (De Haan and Adolfsen 2008). Research on cultural participation needs to take into account which media channels (also including radio and television) people use to inform themselves about the popular arts of their preference. As the boundaries of popular culture become wider a broader range of activities needs to be studied.
Communication
The main theaters use mailing lists to inform registered users. Mails on concerts are being forwarded to friends, but this occurs much less than the exchange of information on concerts through face-to-face contact. Yet, communication and the formation of communities are common with popular culture. The adding of information by users (creation or user-generated content) in the form of audio-visual material also tends to be concentrated around popular music and self-made film clips. It is not just Internet users who share music via the Internet; musicians also offer samples of their music on the Net, or introduce themselves there. MySpace is a popular website where large numbers of users maintain weblogs and profiles. There are various possibilities for users to add information on culture (creation or user-generated content). They can comment on news articles about cultural topic, write blogs, join forums on social networking sites, post audio-visual material on YouTube or make a website. These new forms of communication are closing in to the heart of cultural life and deserve the attention of research.
Enjoyment
Next to the by now somewhat institutionalised forms of popular arts, such as rock and cabaret, typically performed in rock venues and theatres, other forms of popular arts have sprung up in other places. A new genre within the popular arts is that of urban culture (streetdance, breakdance, rap and hip-hop), largely a street scene but gradually making its way indoors. Rock music especially, but also cabaret, film and dance, are being staged also at outdoor festivals. In order to keep track of attendance at popular arts, one is well advised to keep track of developments in youth culture as well as of places where popular arts are being presented. The Internet also offers new opportunities to enjoy these new forms of cultural expression. Downloaded or streaming music, clips on YouTube, trailers of movies and to an increasing extent also download movies, to mention only a few of the new possibilities. A special case within the popular arts are cultural expressions by ethnic minority groups. By inquiring about high and popular arts in predominantly western terms, chances are that cultural practices of large numbers of people are left unseen and therefore missing in cultural statistics. It is a challenge as how to measure these practices, also technically (are people from those groups sufficiently present in research samples?, do questions need to be translated into their languages?, how to best formulate questions about their cultural practices?). General surveys among random samples will probably only tell part of the story, but may often be the best available, despite being unsatisfactory. In the Netherlands, the current way to enquire about cultural practices of immigrant groups is to ask whether they went to parties that included live performances of music, dance or theatre. It turned out to be the case that adding a general question along these lines to the questionnaire brought to light a considerable amount of cultural participation by those groups that was not reported by them in response to the more traditional questions asked a little earlier in that questionnaire (Van den Broek 2006).

ESSnet‐CultureFinalReport
- 408-
Transaction
In the days of the CD even young people paid for their music. After the download revolution, paying for music became a much more voluntary activity. Since the late 1990s record sales have decreased. However the worldwide decline in cd-sales is compensated by a much bigger increase in online and mobile purchases (IFPI 2007). Online ordering of tickets for movies and concerts is more established in the popular arts compared to the traditional arts.
8. Practicing the arts for leisure Many people cherish practicing the arts as one of their leisure pursuits. This may take the form of acting, singing, playing music, painting, drawing, writing, sculpturing, dancing and/or making photos or films. In the Netherlands, about a quarter of the population engages in such leisure activities weekly, another quarter occasionally, and one more quarter has done so in the past (Van den Broek 2010). This shows that practicing the arts for leisure is a major field of cultural participation, involving many people. In cultural statistics, however, it was not always among the main interests. Here we treat it as the third major perspective that an inclusive view of cultural participation should take into account. We mention the various disciplines, distinguish between doing and learning, and do so whilst focussing especially on the new possibilities in the digital era (Van den Broek 2010b).
Information
How to find out about possibilities to engage in practicing the arts for leisure? First of all it should be noted that for many, it is a solo endeavour engaged at alone at home. Experienced practitioners may not need any information at all. Others may depend on social contacts, mass media and/or IT for information on where to buy materials and/or instruments, how to use those, and/or where to find more information. With regards to digital opportunities, the Internet is obviously of growing importance. Shops, teachers, schools and institutions, whether in the private or (semi)public sphere, by now have websites on which they reveal where they are located, how they can be contacted and which goods and/or lessons they have on offer, especially with respect to learning how to master an artistic discipline, the internet opens up new possibilities. In the unlikely case, for instance, that someone wants to learn to play the accordion, a first step might be to spend time checking out the following site, among others: http://www.ehow.com/videos-on_5052_play-accordion.html It can be argued that the greater availability of information on the Internet furnishes the empowerment of arts-for-leisure practitioners, making them less dependent on local shops, teachers, institutions and associations. Research into the ways in which people seek information about materials, instruments, techniques and lessons should focus on the degree to which people depend on which sources of information.
Communication
People who are enthusiastic about their artistic pastime are often interested in communicating about it. This may take the form of face-to-face-contacts and of contacts using communication techniques. Of late, the Internet has quickly become a major platform of communication. Most noteworthy here is the fact that several social media sites developed into a platform for one discipline or the other, such as http://www.myspace.com (for musicians), http://www.flickr.com (for photos) and http://www.youtube.com (film). Less well known

ESSnet‐CultureFinalReport
- 409-
among the general audience, but possibly all the more meaningful to their dedicated users, are the more specialised sites such as http://www.demoscene.info, http://www.deviantart.com, http://www.makezine.com, http://www.3dhype.com and http://www.blender.org to mention just a few. Here people cannot only find information, watch demos, download software and, especially since the 2.0 turn to interactivity, communicate with each other. People cannot only ask others for person-to-person advice, but can also upload content they created themselves (recordings of music, pictures of paintings or sculptures, demo’s of films etc.) in order to expose and to invite criticism. It seems unlikely that this will not affect the ways in which learning and doing are organised. The possibilities for distant learning are greatly enhanced by IT-applications, either as the traditional classroom situation gets recorded and can be seen and heard again at home, or as such a classroom situation is replaced by digital exchange between student and teacher. Developments are moving fast, it is maybe good to memorise that YouTube only was started five years ago. So who knows which of the small initiatives at the moment may become mainstream five years from now. Chances are that a wide range of digital learning facilities will develop, either free or paid, which will affect learning practices (e.g. http://www.imusic-school.com). The domain of communities around a certain artistic hobby is relevant also for the way in which people organise their artistic pastime. Such communities fulfill part of the functions traditionally fulfilled by associations or informal groups, for instance. Enquiring about the social and digital context in which people live out their artistic pastime may enable cultural statistics to keep track of these developments.
Expression
Whether a person practices an artistic discipline for leisure can be asked straightforwardly: Did you over the past month take part in... (a discipline, e.g. painting and drawing) in your leisure time? This can be followed by a question about the frequency in which that was done, and also by questions about whether lessons were taken and about membership of associations and/or informal groups. Depending on space, many more details can in principle be asked, for instance about money spent, social contacts involved, level of ambition, former lessons, former disciplines taken up etc. A general distinction into six main disciplines suffices - fine arts, music & singing, theatre, dance, writing and photo, video & film - for a general overview, especially if newer branches to the trunk are included, such as digital versions of painting and creating music. In some cases, they should be considered separately, to have an idea of how many people practice them as on occasion it may be unclear which general category they belong to. Does urban (streetdance, breakdance, rap and hip-hop), for instance, belong to music or to dance? Apart from conventional ways of ‘coming out’ as an arts practitioner for leisure, such as taking part in performances, exhibitions and/or publications, the Internet too provides a platform to upload the results of leisure time artistic activities.
Transaction
Apart from buying goods and services from shops, schools and institutions, services are currently being developed on the Internet. The first commercial music schools are presenting themselves on the Internet. It is still in the stars, but chances are we will witness the unfolding of a new market for lessons in artistic disciplines.
Keeping track of new ways of practising the arts for leisure?
Without it necessarily being the case that ‘old school’ ways of practicing the arts and learning how to master the arts will vanish, the Internet clearly provides new digital opportunities for

ESSnet‐CultureFinalReport
- 410-
participating and learning the arts for leisure. Apart from informal groups, associations and institutions, this is a new major avenue to practicing the arts. Although probably too specific for general statistical overviews of cultural participation, it is an interesting question whether new ways of information, communication and transaction lead to a rise in a new ways of practicing the arts for leisure.
9. Conclusion Across the board, major changes have taken place during the last decades, changes that are both likely to continue and to have a profound impact. These changes include steady societal change on the one hand and the rapid adoption of IT on the other. They opened cultural boundaries and widened digital opportunities. New forms of cultural expression developed have become popular among broad population groups, often with the youth as the driving force of change. Gradually these new forms became recognised as such, sometimes deemed worthy for government funding and occasionally included in research on cultural participation. Ethnic minority groups brought their own traditions and forms of cultural expression to the countries of destiny. Some of these forms appealed to a wider audience. New ways of relating to cultural expressions came into being, both physical and digital. These changes affected the scope, nature and ways of cultural participation. As a result, the landscape of cultural participation is changing tremendously. By merely measuring physically attending canonised cultural institutions one misses an increasing part of the picture. Research into cultural participation needs to adapt in order to trace down these developments and include both new forms of cultural expression and new ways of enjoying such as the Internet. Research should re-focus, or at least broaden the focus, to make sure that the right indicators are used in covering the entire field. In this paper we device a scheme which we think is helpful in subdividing the full scope of the field into manageable subsectors. We distinguished first between receptive and active cultural participation (i.e. attending vs. practising culture), secondly between high arts and popular arts and thirdly between direct, mediated and digital participation. As shown in Table 1, nine subfields were distinguished. In order to account systematically for changes in cultural participation we used the ICET-model. In this model I stands for information, C for communication and community, E for entertainment and expression and T for transaction. For each of the three modes of cultural participation (participation in the high arts, in the popular arts and practising the arts for leisure) we described in this model which activities need attention and which locations need to be subject of research. We hope this framework will fuel the discussion of what changes need to be made in order to adapt research on cultural participation to the new century.

ESSnet‐CultureFinalReport
- 411-
10. Annexes: Examples of questions to be asked In three appendices, we give examples of survey-questions to be asked in order to learn more about the topics identified above as to keep track of the changing landscape of cultural participation. Well-established questions about topics already covered in research are assumed to be familiar and are not mentioned below (e.g. there are no questions on visiting museums etc).
Annex A: Participation in the High Arts As it is impossible to cover all high arts, theatre is chosen as an example. The following questions are about theatre. This includes plays, cabaret, stand-up-comedy, dance, ballet and musicals. Comparable questions may be asked about f.e.: Classical music Ballet Visual arts Cultural heritage Questions to be asked only after it has been established that a person likes/visits theatre: f.e.: Are you interested in the theatre?
1. Yes 2. No
Examples of question to be asked about information Below is a list of ways in which people can obtain information about a theatre performance. By 'obtaining information', we mean both looking for substantive information such as background information about the performance or actor, and looking for practical information, for example about ticket prices and theatre opening times. How often during the last 12 months have you used the following methods to obtain information about a theatre performance?
Newspaper, programme guides, flyers, books or magazines TV or radio Internet
Did you do that? Response categories in each case:
1. Never 2. Less than once a month 3. 1 - 3 times per month 4. Once a week or more

ESSnet‐CultureFinalReport
- 412-
You have indicated that you have obtained information about a theatre performance in the last 12 months from a newspaper, programme guides, flyers, books or magazines. Did you do this to obtain?
You have indicated that you have obtained information about a theatre performance in the last 12 months from the TV or radio. Did you do this to obtain? You have indicated that you have obtained information about a theatre performance in the last 12 months from the Internet. Did you do this to obtain?
Response categories in each case:
1. Substantive information 2. Practical information 3. Or both
Do you subscribe to or regularly read an artistic magazine? About theatre (stage, dance, cabaret, stand-up comedy)
1. Yes 2. No
Examples of question to be asked about communication During the last 12 months, have you posted reports about theatre, for example on an Internet forum, an e-mail group, a group on a social network site (like Facebook) or a Wiki site?
1. Yes 2. No
Have you done this rarely, sometimes or often?
1. Rarely 2. Sometimes 3. Often
Examples of question to be asked about enjoyment Have you attended a theatre performance in the last 12 months?
1. Yes 2. No
How many times did you do this? [1..97] How often have you attended a theatre performance in the last 12 months at a location other than a dedicated theatre (e.g. in a community centre or in a former church, office or factory building)?
1. Never 2. Once 3. 2-3 times 4. 4-11 times 5. Once a month or more

ESSnet‐CultureFinalReport
- 413-
There are several ways of watching recordings of theatre performances. Could you indicate how often you have made use of the following options? How often do you watch recordings of theatre performances via a TV broadcast. Do you do this:
Via a DVD or video? Via a culture-related website? Via another website? Via a computer (but not via the Internet)? Via a mobile telephone or other mobile hardware, e.g. an MP4 video player or gaming computer? Response categories in each case:
1. Never 2. Less than once a month 3. 1-3 times per month 4. Once a week or more
There are several ways of listening to recordings of theatre performances. Could you indicate how often you have made use of the following options? How often do you listen to recordings of theatre performances via a CD, LP, cassette or minidisc. Do you do this:
Via a standard radio? Via an Internet radio? Via a computer (but not via the Internet)? Via a mobile telephone or other mobile hardware, e.g. an MP3 player? Response categories in each case:
1. Never, 2. Less than once a month, 3. 1-3 times per month, 4. Once a week or more? 5. Not applicable; only interested in dance
Examples of question to be asked about transaction Have you bought or ordered tickets for the theatre during the last 12 months?
1. Yes 2. No
Did you buy/order these tickets: >>INTERVIEWER: more than one answer possible<<
1. From the box office or a sales outlet? 2. Via the Internet? 3. And/or by post, e.g. via an order form or subscription?
Which of these alternatives did you use most often?
1. Box office or sales outlet

ESSnet‐CultureFinalReport
- 414-
2. Internet 3. Post (order form/subscription) 4. Both/All three equally often
Have you purchased a recording of a theatre performance during the last 12 months; this may be a CD or DVD, but also an Internet download which you purchased?
1. Yes 2. No
Did you make this purchase all these purchases: >>INTERVIEWER: more than one answer possible<<
1. In a normal shop? 2. By downloading from the Internet? 3. From the Internet in some other way, e.g. postal delivery? 4. Or somewhere else?
Annex B: Participation in the Popular Arts Questions on popular arts are more or less similar as those under high arts. Some additional questions are formulated here. The following questions are about rock/pop music. Comparable questions may be asked about f.e.:
Worldmusic Urban (rap/hiphop) Dance/houseparty
Questions to be asked only after it has been established that a person likes/visits rock/pop music: f.e.:
Are you interested in rock/pop music?
1. Yes 2. No
Examples of question to be asked about information Are you a subscriber of : - magazine on rock/pop music
1. Yes 2. No
Examples of question to be asked about communication Are you a member a fan club of a rock/pop band?
1. Yes 2. No
Examples of question to be asked about enjoyment Not only asking about default locations for performances but:

ESSnet‐CultureFinalReport
- 415-
How often have you attended a rock/pop music in the last 12 months at a location other than a dedicated concert hall (e.g. in a community centre or in a former church, office or factory building; or at a party with musicians)? How often in the last 12 months did you go to: - Rock/ pop music festivals
1. Yes 2. No
Examples of question to be asked about transaction Did you you any merchandise of a rock/pop band?
1. Yes 2. No
Annex C: Practicing the Arts for Leisure Questions to be asked only after it has been established that a person does actually practise one (or more) of the arts disciplines as a leisure activity Examples of questions to be asked about information Below is a list of ways in which people can obtain information about practising an arts discipline themselves. By ‘obtaining information’, we mean both looking for substantive information (about materials, instruments, musical or stage performances etc.) and looking for practical information about a club, teacher or school. How often during the last 12 months have you used the following methods to obtain information about an arts discipline:
newspaper, programme guides, flyers, books or magazines. TV or radio. Internet
Response categories in each case: 1. Never 2. Less than once a month 3. 1-3 times per month 4. Once a week or more
You have indicated that you have obtained information about an arts discipline in the last 12 months from a newspaper, programme guides, flyers, books or magazines. Did you do this to obtain:->
You have indicated that you have obtained information about an arts discipline in the last 12 months from the TV or radio. Did you do this to obtain:->
You have indicated that you have obtained information about an arts discipline in the last 12 months from the Internet. Did you do this to obtain:->

ESSnet‐CultureFinalReport
- 416-
Response categories in each case:
1. Substantive information about the artistic hobby you pursue? 2. Practical information? 3. Or both?
Examples of questions to be asked about communication Have you taken part in an Internet discussion about an instrument, music school, course or workshop? Have you responded on the Internet to a piece of music uploaded by another fan? Has anyone responded on the Internet to piece of music that you had uploaded? Examples of questions to be asked about expression Have you done any of the following in the last 12 months in your free time (i.e. outside work or school hours) …
… drawing, painting or graphical work (not on a computer)?.. … graphic design on a computer? … sculpture, modelling, ceramics, making jewellery? … working with textiles (textile crafts)? … singing? … playing a musical instrument? … sampling, turntablism or other forms of playing records or DJ-ing? … taking part in a play, cabaret, stand-up comedy? … modern dance or ballet? … dance (folk dancing, tango, flamenco, ballroom dancing)? … street dance, breakdance, rap or hip-hop? … photography, film, video (not holiday/family snaps/film clips)? … writing poetry, columns, essays, stories and/or a novel? Were you enrolled with an institution for this activity in the last 12 months (e.g. a centre for the arts)? Yes/No
Have you taken part in lessons, exercises, rehearsals or courses for this activity in the last 12 months under the guidance of a teacher or professional, other than in an institution as referred to in the previous question? Yes/No
Were you a member of a society, club or community for this activity in the last 12 months? Yes/No
How much did you pay in membership, tuition or course fees for this activity in the last 12 months? (Do not include costs of materials)
How often have you exhibited, performed or shown films in the last 12 months? None / 1-5 times/6 times or more?
Do you ever use computers in composing, recording or editing music? If so:
1. Never or almost never? 2. Sometimes? 3. Or often?

ESSnet‐CultureFinalReport
- 417-
Do you ever upload music you have composed, recorded or edited onto the Internet? If so:
1. Never or almost never, 2. Sometimes, 3. Or often?
Examples of questions to be asked about transaction Have you purchased a musical instrument in the last 12 months? Where?
Have you purchased sheet music in the last 12 months? Where?
Have you taken part in a course, workshop or other form of lesson for which you had to pay in the last 12 months? Where purchased?
-Music shop -Music school -Internet -Other
If you would like to add any information after reviewing your own completed ICET questionnaire, please feel free.


ESSnet‐CultureFinalReport
- 419-
MEASURING SOCIAL AND CULTURAL PARTICIPATION IN EUROPEAN SURVEYS
Working Paper prepared for the Third Restricted Meeting of the Task Force
‘Cultural Practices and Social Aspects of Culture’ (95)
By Hans Schmeets, Rianne Kloosterman and Bart Huynen (Netherlands)
Eurostat is the Statistical Office of the European Communities. Its mission is to provide the European Union with high-quality statistical information. For that purpose, it gathers and analyses figures from the national statistical offices across Europe and provides comparable and harmonized data for the European Union to use in the definition, implementation, and analysis of Community policies (see http://ec.europa.eu/eurostat). The Labour Force Surveys, for example, should provide statistical comparable figures on the unemployment rates and other figures on the labour market in the EU. Comparability is - next to relevance, timeliness and punctuality, data accuracy, coherence with other statistics and over time, and accessibility and clarity - increasingly considered as a most central requirement of data quality (Verma, 2006). In order to produce comparable statistics, it is vital to capture the same information across countries. Therefore, Eurostat supplies all participating countries with common guidelines, detailing the output requested, such as the measured concepts and the variables (Clémenceau, Museux & Bauer, 2006). However, the manner in which data is gathered - for example the way questions are framed or the data collection mode - may differ between countries. Obviously, differences in phrasing questions will likely limit the possibilities for comparisons across countries. This concerns not only the distributions of the social and cultural characteristics, but also the defined correlations with various background characteristics, such as age, gender, education and disposable income. Besides problems related to the phrasing of the questions, other between-country design variations will likely also cause problems in the comparability of the results. In some countries data is collected via telephone-interview, whereas others make use of a face-to-face interview or a mail survey. Furthermore, other differences may have an impact on the difficulties in the between-country comparisons, such as the allowance of interviews by proxy, response rates and non-response bias. Stoop (2009) discusses four elements of data quality - relevance, coherence, clarity and comparability - and refers to the importance of metadata. She states that ‘[m]etadata make it possible to assess the accuracy, comparability and relevance of statistical data. For this purpose they ideally should give information on specific statistical issues (concepts, exact questions, date of data collection, response rate etc.) and not provide a very long list of non-specific information’ (Stoop, 2009, p.1). She also points at the importance of using the same
(95) This paper is a revised and extended version of the paper ‘Social and cultural participation in EU-SILC and the problem of output harmonization’ (Schmeets and Huynen, 2010) presented at Q2010 conference, Helsinki, Finland, May, 5, 2010.
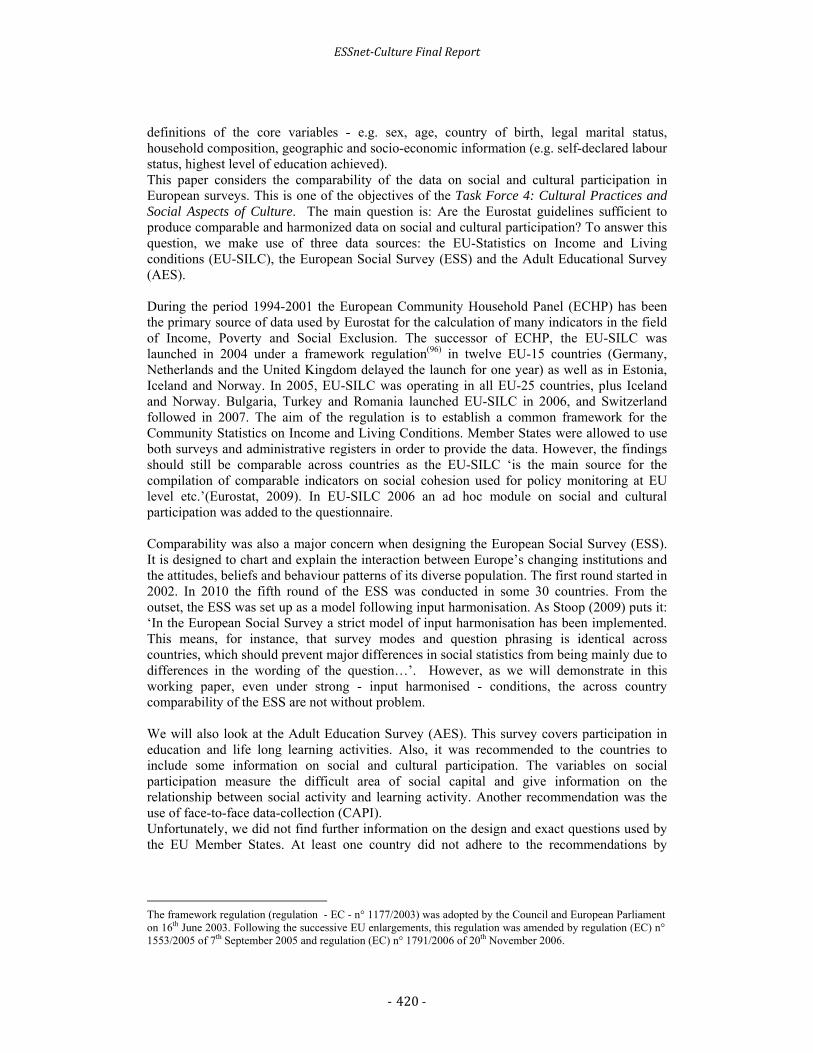
ESSnet‐CultureFinalReport
- 420-
definitions of the core variables - e.g. sex, age, country of birth, legal marital status, household composition, geographic and socio-economic information (e.g. self-declared labour status, highest level of education achieved). This paper considers the comparability of the data on social and cultural participation in European surveys. This is one of the objectives of the Task Force 4: Cultural Practices and Social Aspects of Culture. The main question is: Are the Eurostat guidelines sufficient to produce comparable and harmonized data on social and cultural participation? To answer this question, we make use of three data sources: the EU-Statistics on Income and Living conditions (EU-SILC), the European Social Survey (ESS) and the Adult Educational Survey (AES). During the period 1994-2001 the European Community Household Panel (ECHP) has been the primary source of data used by Eurostat for the calculation of many indicators in the field of Income, Poverty and Social Exclusion. The successor of ECHP, the EU-SILC was launched in 2004 under a framework regulation(96) in twelve EU-15 countries (Germany, Netherlands and the United Kingdom delayed the launch for one year) as well as in Estonia, Iceland and Norway. In 2005, EU-SILC was operating in all EU-25 countries, plus Iceland and Norway. Bulgaria, Turkey and Romania launched EU-SILC in 2006, and Switzerland followed in 2007. The aim of the regulation is to establish a common framework for the Community Statistics on Income and Living Conditions. Member States were allowed to use both surveys and administrative registers in order to provide the data. However, the findings should still be comparable across countries as the EU-SILC ‘is the main source for the compilation of comparable indicators on social cohesion used for policy monitoring at EU level etc.’(Eurostat, 2009). In EU-SILC 2006 an ad hoc module on social and cultural participation was added to the questionnaire. Comparability was also a major concern when designing the European Social Survey (ESS). It is designed to chart and explain the interaction between Europe’s changing institutions and the attitudes, beliefs and behaviour patterns of its diverse population. The first round started in 2002. In 2010 the fifth round of the ESS was conducted in some 30 countries. From the outset, the ESS was set up as a model following input harmonisation. As Stoop (2009) puts it: ‘In the European Social Survey a strict model of input harmonisation has been implemented. This means, for instance, that survey modes and question phrasing is identical across countries, which should prevent major differences in social statistics from being mainly due to differences in the wording of the question…’. However, as we will demonstrate in this working paper, even under strong - input harmonised - conditions, the across country comparability of the ESS are not without problem. We will also look at the Adult Education Survey (AES). This survey covers participation in education and life long learning activities. Also, it was recommended to the countries to include some information on social and cultural participation. The variables on social participation measure the difficult area of social capital and give information on the relationship between social activity and learning activity. Another recommendation was the use of face-to-face data-collection (CAPI). Unfortunately, we did not find further information on the design and exact questions used by the EU Member States. At least one country did not adhere to the recommendations by
The framework regulation (regulation - EC - n° 1177/2003) was adopted by the Council and European Parliament on 16th June 2003. Following the successive EU enlargements, this regulation was amended by regulation (EC) n° 1553/2005 of 7th September 2005 and regulation (EC) n° 1791/2006 of 20th November 2006.

ESSnet‐CultureFinalReport
- 421-
Eurostat. The Netherlands did not include the questions on social and cultural participation in their AES questionnaire, and they made use of a mail survey(97). So, basically, the only available source to make a comparison of cultural (and social) participation between European countries is EU-SILC. Consequently, this paper investigates the distributions of the concepts measured in the EU-SILC module on social and cultural participation for the different EU-countries. In addition, the correlations of the participation variables with various background variables, such as age, gender, education and disposable income, are examined. Explanations for the (in)comparability of the results between countries will be outlined. First, we will detail the exact formulation of the questions. In a second step we will look at the design of the surveys and the data collection mode in particular.
1. EU-SILC, ESS and AES: Design
1.1. Concepts and variables
The EU-SILC includes detailed questions on the labour market and income. In some Member States this information is partly available in other sources, such as tax-office registries. In the Netherlands, for example, most information could be compiled on the basis of register information on income from the Tax administration and information from the labour Force Survey(98). In these Member States it is possible to gather the (additional) EU-SILC information in a short interview (10 to 20 minutes). In 2006, the ad hoc module covered aspects of social and cultural participation. The main characteristics of this module are:
information is provided for all current household members, or if applicable for all selected respondents, aged 16 years and over;
only personal interviews (proxy interviews as an exception) or information extracted from registers are allowed;
the ‘last 12 months’ is the reference period for all activities, except for the ‘current’ ability to ask any relative, neighbour or friend for help;
definitions of the concepts for ‘relatives’, ‘friends’, ‘to get together’, ‘informal voluntary activities’ and ‘participation in cultural events’ are provided, including answer categories.
The following 16 social and cultural activities were included in this module, which can be grouped into four dimensions.
(A) Cultural participation: Going to cinema; Going to live performances; Visits to cultural sites; Attending sport events.
(B) Contacts with friends and family: Getting together with relatives; Getting together with friends; Contacts with relatives; Contacts with friends.
(97) Another source is the survey on ICT – but only questions are included related to orders of products such as books by the internet. (98) The EU-SILC sample was drawn on the respondents of the fifth LFS-wave. In doing so, a relatively short telephone-interview (on average 12 minutes) was sufficient to collect the additional EU-SILC information.

ESSnet‐CultureFinalReport
- 422-
(C) Informal help: Ability to ask help; Informal voluntary activities.
(D) Participation in associations: Political parties or trade unions; Professional organisations; Churches or religious organisations; Recreational groups; Charitable organisations; Other groups.
The ESS includes one question on social contact, referring to the number of contacts with family, friends or colleagues for ‘social reasons’. In addition, it includes information on volunteer work, social trust and trust in political institutions. In the AES it was recommended to include the following questions on cultural activities (incidence and frequency).
(1) How many times did you visit some of the following cultural events or institutions (concerts, opera, theatres, dance performances, cinema, museums, galleries) over the past 12 months?
(2) Do you practice some of the following cultural activities (play an instrument, compose music, sing, dance, act, have photography as a hobby, make video, draw, paint, carve or do other visual arts, write poems, short stories, fiction)?
(3) How many books did you read over the past 12 months?
(4) How often did you visit a library over the past 12 months?
1.2. Data-collection
The most common modes in survey research are CAPI, CATI, PAPI, mail and web surveys. In recent years, mainly in an attempt to reduce survey costs, mixed-mode surveys for data collection have become more and more popular. The table below shows that at least 8 different modes can be distinguished, of which four in the presence of an interviewer and four without the interference of an interviewer. According to the guidelines provided by Eurostat, an interviewer should collect the data. There is a substantial variation in the data-collection modes across countries in the EU-SILC. In the northern countries (the Netherlands, Norway, Sweden, Finland, Iceland and Denmark) the information on social and cultural participation was mainly collected by CATI(99). A short CATI-interview was an option, as other information, such as information on income, was available in registers. This was not feasible in most other countries. CAPI was mainly or completely used in the UK, Belgium, Cyprus, Estonia, Spain, France, Ireland, Malta, Austria, Portugal and Latvia. In Slovenia a mixed CAPI/CATI design was used. In Hungary, Italy, Luxembourg, Poland, Slovakia, Lithuania, Czech Republic and Greece the PAPI-mode was used. In Germany, the EU-SILC data were gathered by a mail Survey.
Data collection by
Interviewer Self
Laptop CAPI (Computer Assisted
Personal Interview) CASI (Computer Assisted
Self Interview)
Telephone CATI (Computer Assisted
Telephone interview) IVR (Interactive Voice
Response)
(99) In The Netherlands, the EU-SILC was based on the respondents in the Labour Force Survey - the additional data was collected after the fifth-wave by a short (13 minutes on average) CATI-interview.

ESSnet‐CultureFinalReport
- 423-
Mail PAPI (Paper and Pencil
Interview) Mail survey
Web CAWI (Computer Assisted
Web Interview) Web Survey
CAPI has been used in all countries as the data-collection mode for the ESS. The design of the AES is - in line with EU-SILC - based on output harmonisation. However, it was recommended to use CAPI as the mode of data-collection. Not all Member States adhered to this guideline. In the Netherlands, for example, the AES data was collected by means of a mail survey. We tried to figure out the data-collection mode used by the other Member States, but did not find a document in which this information was outlined. The best guess is to assume that the other Member States made use of the same data-collection mode as was used in the EU-SILC.
1.3. Effects of changing data collections modes in the Netherlands
Obviously, changing from one mode to another may introduce mode-effects. A striking example is the Continuous Survey on Living Conditions in the Netherlands among some 20,000 people. Since 1997 approximately 43 percent has been active as volunteers in organisations. In 2005 and 2006 the mode changed from CAPI into CATI - and the percentage of volunteers increased to 54 in both years. Thereafter, the data collection changed back again to CAPI. Consequently, the percentage of volunteers decreased to 43 (Schmeets, 2008). Although previous findings based on several experiments are mixed (Dillman and Christian, 2005), it can be argued that primacy and recency effects partly cause these change. Primacy effects - the first (Yes) answer category is more often considered than the last (No) answer option - may occur in CAPI interviews, whereas recency effects - the choice for the last answer option - is more likely to occur in CATI. However, the findings contradict such effects as CAPI results not in more, but in fewer volunteers. Apparently, other mechanisms will probably cause the differences between the CAPI and CATI-approach, such as coverage effects and non-response bias. In a CATI-approach, specific groups are under-represented in the sample. People without a fixed telephone line can often not be reached and this is more often the case among specific groups, such as ethnic minorities, younger and lower educated people. In addition, it is more difficult to contact such groups, even if they are in the possession of a fixed telephone line. In line with the Dutch results on volunteering participation, we might expect that the CATI-results show higher social and cultural participation rates in comparison to the CAPI and PAPI approaches.

ESSnet‐CultureFinalReport
- 424-
2. Results
2.1. Distributions
In order to compare different countries’ outcomes we start by looking at the frequencies of the 16 variables on social and cultural participation. By listing the information per country, considerable variation between countries is revealed(100). A wide variation in the four concepts of the dimension cultural participation is found. In Iceland 31 percent and in Denmark 36 percent did not visit the cinema versus 75 percent in Latvia and Lithuania. Similarly, large differences were noticed in ‘going to live performances’, ‘visits to cultural sites’ and ‘attending live sport events’. The distributions of the concepts ‘getting together with relatives’, ‘getting together with friends’, ’contacts with relatives ‘and ‘contacts with friends’ also vary. In Denmark on all four aspects of the dimension Contacts with friends and family no respondents chose the ‘never’ option. In most other countries the ‘never’ option was chosen by 1 to 3 percent (together with relatives), 2 to 4 percent (together with friends), 4 to 6 percent (contact with relatives) and 4 to 8 percent (contacts with friends). However, 14 percent in Portugal and 13 percent in Spain has never contact with friends. The third dimension concerns Informal help. The ability to ask for help from a relative, friend or neighbour varies from 98 percent in The Netherlands, Denmark and Iceland to 44 percent in the UK. Another example concerns the Informal voluntary activities. In Denmark and in the UK, 99 percent provided help to others such as friends, neighbours or relatives in a 12-month period. In other countries the participation rate is much lower: 4 percent in Czech Republic, 13 percent in Belgium, 14 percent in Lithuania, 17 percent in France and 19 percent in Greece. The final set of questions refers to Participation in associations. Again, we noticed sharp differences in the answer patterns. For example, the religious participation varied from 1 percent in France to 87 percent in Cyprus. On all aspects the participation of the French population is remarkably low: 3 percent in activities for political parties or trade unions, 1 percent in professional associations and 2 percent in charitable organisations. The results for Iceland are 16, 12 and 14 percent, for Finland 11, 8, 13 percent, for Luxembourg 5, 12, 17 percent, and for the Netherlands 4, 12 and 33 percent respectively.
2.2. Correlations
Apart from the distributions, the correlations between the participation and background characteristics are also relevant for our country comparison. Resources such as the level of education and disposable income are positively related to social and cultural participation. Likewise, age and gender are relevant background characteristics for the level of participation(101). An inspection of the correlations across countries reveals many implausible results. For example, the participation in informal volunteering activities is not correlated with gender in countries such as Belgium, Hungary, and France (Phi=0.02; 0.02; and 0.03, respectively), whereas particularly in Denmark, the Netherlands, the UK, Iceland and Italy (Phi>0.10) women employ such activities more often than men.
(100) In 2006, the EU-SILC was conducted in all 25 member states plus Norway and Iceland. However, the data in the User Database (udb_c06p_ver 2006-1 from 01-03-08.sav) were not available from Germany, Slovenia and Malta. Further information on the distributions is available on request. (101) Information on the correlations is available on request.

ESSnet‐CultureFinalReport
- 425-
In Poland, Norway and Cyprus, there is hardly any relationship between age and religious participation, whereas in Spain the religious involvement increases from 8 to 35 percent and in Ireland from 41 to 63 percent. Religious involvement is not related to education in most countries. Sweden is a clear exception with 13, 16 and 27 percent for the lower, middle and higher educated. The participation in professional associations is hardly related to education in Belgium and France, which is reflected in the percentages 6, 6, 10 percent and 0, 1, 2 percent for the three consecutive levels. In other countries the correlations are much stronger. One example concerns Iceland (3, 12, 32 percent), but also in neighbouring countries like Luxembourg (5, 14, 22 percent) and the Netherlands (5, 14, 17 percent) the correlation is substantially higher. The correlations between the social/cultural activities and disposable income are much weaker. As a general rule, we found higher participation rates amongst higher income groups. In Finland there is no correlation between income and the ability to ask a person for help (Cramers’ V=0.02), whereas in Latvia there is a moderate correlation (0.20). In another aspect, the informal volunteering activities in Latvia and Poland, no differences between income groups were found (0.03), whereas in Norway and Cyprus the correlation is 0.16.
3. Explanations
3.1. Correlations
Various discrepancies between the countries in terms of distributions and correlations are implausible. Furthermore, the patterns are not very consistent. Consequently, one obvious explanation is the framing of the questions. So, first we focused on how the questions were phrased and how this might lead to problems with respect to international comparability(102).
Only a few countries did provide a translated questionnaire (in English). Other questionnaires were not translated, so we had to do the translation ourselves. In the end, we succeeded to have the questionnaires translated from 15 EU-SILC countries. Table 1 shows that a maximum of 14 out of 15 identical questions were found for ‘going to cinema’, and a minimum of 4 identical questions for the concept ’ability to ask help’.
Figure 15 - Identical questions (in brackets) used by 15 EU-SILC countries of 16 social and
cultural activities
A. Cultural participation
Going to cinema (14); Going to live performances (10); Visits to cultural sites (7); Attending sport events (9)
B. Contacts with friends and family
Getting together with relatives (11); Getting together with friends (11); Contacts with relatives (10); Contacts with friends (8)
C. Informal help
Ability to ask help (4); Informal voluntary activities (6)
(102) We grouped the questions into four different dimensions; cultural participation (PS010-PS040), contacts with friends and family (PS050-PS090), (Informal) help (PS100&PS150) and participation in activities of political parties, churches, recreational organisations, professional associations and other groups or organisations (PS110- PS140& PS160).

ESSnet‐CultureFinalReport
- 426-
D. Participation in associations
Political parties or trade unions (10); Professional organisations (11); Churches or religious organisations (7); Recreational groups (12); Charitable organisations (13); Other groups (11).
Needless to say, we should be careful with such interpretations. Obviously, an extreme score in country X in question Q does not necessarily mean that there is a problem with the phrasing of the question or with other variations in the design, such as the data collection mode. However, in some cases differences are so extreme, that there has to be another explanation than - for example - cultural or economical differences. Furthermore, we lack exact information concerning interviewer instructions or interviewer training. It might therefore be the case that a specific sentence is not specified in the questionnaire, whereas the interviewer still has to read this particular question aloud from an instruction sheet. Consequently, questions could be more similar or more different than we point out in our analysis. For each of the four dimensions in the table we will discuss one or two problematic examples with respect to international comparability.
A. Cultural participation
The Number of times going to a live performance or a live sport event, refer to the number of times, the respondent went to any such event (performed by professionals or amateurs) during the last twelve months. Going to such events to watch one’s own children should be included, whereas respondents’ own participation should be excluded. A similar question was used in 10 out of 15 countries. France is a clear exception. In France the question includes the sentence ‘ne pas prendre en compte les compétitions ou les matchs d’école, de quartier, kermesse auxquels participent proches ou enfants’. This is in contrast with the original question as in the French question the visits to events in which respondent’s children participate should be excluded. Also in Finland, Norway and Austria other questions were used. In these three countries, many respondents answered with More than 12 times. Interestingly, the three countries mentioned are all countries in which this particular question was constructed out of sub-questions. In Austria, for example, the original question refers to ‘plays, concerts, operas, and ballet and dance performances’. The respondent is asked specifically whether he/she went to Volks- und Blasmusikkonzerte; Pop-, Rock, Jazzkonzerte und dergleichen; Musical, Ballett-, Tanzaufführungen, Klassische Konzerte, Opern-, Operettenaufführungen, Theateraufführungen (auch Kleinbühnen-, Kabarettveranstaltungen). By asking sub-questions (asking specifically about each individual possible live performance), more performances will be remembered resulting in an increase of the participation. Moreover, there is a large across country variation in the given examples.
B. Contacts with friends and family
In the questions concerning contacts and getting together with friends and family (face-to-face, via telephone or other communication means), contacts with family and friends in the same household should not be counted. Cyprus and Denmark are the only countries in which the sentence ‘only consider relatives who do not live in the same household as you’ has been left out of the question. Logically, this should bias the percentage in the Never category downward and/or should bias the percentage for the other categories upward. This is indeed what applies to Cyprus and Denmark. Denmark reports that none of the respondents opt for Never in this question. Cyprus shows a relatively large percentage of respondents who indicate to getting together with relatives Daily.

ESSnet‐CultureFinalReport
- 427-
C. Informal help
When asking for participation in informal voluntary activities, the original description of the concept refers to exclude any activity that a respondent undertakes for his or her household, in his or her work or within voluntary organisations. So, the question should refer to informal voluntary activities outside any organisation. However, this guideline is not adhered to in Belgium as one of the examples is an association de parents d’élève, which obviously is some kind of organisation. This probably (partly) explains the extreme low 13 percent in Belgium. This figure contradicts sharply with other results in the countries, such as over 50 percent in Norway, the Netherlands and Cyprus. In the UK (99 percent) and Denmark (100 percent), almost all citizens provide informal help – which is very implausible as the questions do not differ substantially from the questions used in for example Italy, Latvia and Austria. It seems unlikely that the phrasing of the question causes such differences. Possible mistakes in data processing will cause the incomparable findings in the UK and Denmark. Both in Cyprus and Norway it is unclear whether the question is about help that has been given privately. Those who engage in voluntary activities through an organisation might also answer this question with Yes, whereas this should not be the case. This could lead to the higher participation of 67 percent in Cyprus and 58 percent in Norway. France is the only country in which the respondent is asked to exclude any help given to members of the own family. Consequently, the 17 percent volunteers are much lower than on average. Another interesting example concerns the ability to ask for help. The original description of the concept is: ‘If the respondent has the ability to ask for help from any relative, friend or neighbour. The question is about ability for the respondent to ask for the help whether the respondent needed it or not, the potential of getting help even if the help actually has been received or not. Only relatives and friends (or neighbours) who do not live in the same household as the respondent should be considered’. For the UK, the concept is measured by two questions. The first question deals with ‘whether you would ask any of your neighbours for help, when you are ill in bed and need some help’ and the second with ‘whether you would ask any of your neighbours for help, when you are in financial difficulty and need to borrow some money to see you through the next few days’. Italy and France include ‘whether you would leave the house key during holidays or whether you have the possibility to borrow some kitchenware’. Obviously, one might feel more embarrassed when having to ask for financial support than to borrow some kitchenware, or for any of the other examples not cited here. Moreover, the questions in the UK only refer to possible help from neighbours and neglect friends and relatives. Therefore, it is much more likely that in the UK the answer will be No compared to other countries. The specific nature of the questions is probably the reason why the UK results in a high percentage of 56 percent that did not ask for informal help. Moreover, the variation between other countries is large. In Italy 16 percent did not receive informal help, in Latvia and France 11 percent, in Denmark and the Netherlands 2 percent.
D. Participation in associations
In general, the French questions referring to the participation in associations all have one specific problem. The questions start with the sentence Au cours des douze derniers mois…avez-vous été membre…, which basically implies whether a person was a member of a certain organisation or group during the last twelve months. However, in the description of the concept provided by Eurostat this should not be the case: ‘If the respondent, during the last twelve months, participated in activities related to churches, religious communions or

ESSnet‐CultureFinalReport
- 428-
associations. Attending meetings connected with these activities is included. Attending holy masses or similar religious acts or helping during these services is also included’. Since the question in France is so explicit about being a member of an organisation, it is not surprising that only a few people (1 percent) provide an affirmative answer. In Cyprus (87 percent), Ireland (48 percent) and the Netherlands (45 percent) high percentages were found.
3.2. The data-collection mode
The data-collection mode is the means of communication by which the questionnaire is presented to people in the sample and the registration of the answers. The data collecting varied among countries. Most countries used CAPI or PAPI: a face-to-face interview in the presence of an interviewer. Other, mainly the northern countries, conducted a short telephone interview (CATI) as a follow up to register information(103).
First, we looked at all figures and noticed that the CATI-countries - including Sweden, Norway, Denmark, Iceland, Finland and the Netherlandsm - show substantially higher participation rates on all 16 social and cultural activities in comparison to the PAPI/CAPI-countries. For the next step, we compared the 15 traditional EU-countries and excluded the mainly eastern European countries in the comparison with the northern/Scandinavian countries. However, again it reveals that the CATI-countries show higher participation rates. In the final step, we selected the countries with identical questions to rule out possible framing effects. Again, we found higher participation rates of the CATI-countries. This is particularly true for the participation in associations. For example, 25 percent of the CATI-countries Finland, the Netherlands and Denmark participated in activities of a charitable organisation, versus 8 percent in the nine CAPI/PAPI-countries (Austria, Belgium, Cyprus, Spain, Ireland, UK, Italy, Luxembourg and Latvia).
4. Input harmonization and beyond In this article we focussed on the comparison of the module on social and cultural participation in EU-SILC. We found many implausible results in the distributions of the 16 characteristics. In addition, we also found many variations in the associations with gender, age, education and disposable income across countries, including neighbouring countries. We do not have firm explanations for all the differences in the estimates and the correlations. However, one of the causes is certainly the variation in the framing of the questions. After translating 15 questionnaires, we found many differences, varying from using different wordings and categories, more than one question, the use of lead-in questions, and using showcards or not. But that is not the only explanation. A country comparison based on identical questions turned out to be difficult. Still, the variation revealed to be substantial. For the next step, a comparison was based on a division of the countries using identical data-collection modes: CATI, CAPI and PAPI. We expected higher rates of social and cultural participation in CATI countries. This result was found in all the 16 social and cultural activities, and that was true for a comparison based on all 23 countries as well as on the traditional 15 EU-states. In a third step, we made a mode-comparison of the countries using identical questions. Again, the CATI-countries showed the highest participation rates.
(103) However, for the EU-SILC the Netherlands is an exceptional case. In the Netherlands the first wave of information is gathered using CAPI. The information from this first wave also included (possibly undisclosed) phone numbers. If we exclude the Netherlands, the differences between CATI and CAPI/PAPI become more prevalent.

ESSnet‐CultureFinalReport
- 429-
Although we lack hard evidence, it is our belief that impure ‘mode-effects’ are the explanations for all these discrepancies between the countries. Selection effects from the outset will probably cause a substantial part of the differences. The CATI-approach will select people who are reached by telephone. People without a fixed landline and people with an undisclosed telephone number are less involved in society. Consequently, the CATI-countries will show higher participation rates. However, such country differences could also be partially real. Following this line of reasoning, the social and cultural participation in the northern countries would have been substantially higher compared to other countries. In terms of harmonisation of the surveys, we looked for comparisons between countries with identical questions and identical data-collection modes. In doing so, we were able to compare a maximum of 6 countries for the following three variables: going to the cinema, participation in recreational groups, and participation in charitable organisations. This approach is not very promising. However, a further step would be translating the 9 other questionnaires, which will certainly increase the number of comparable countries in terms of questions and interview-modes. But the question remains whether identical questions and modes are sufficient for an across-country comparability. For example the participation in charitable organisations in 6 CAPI-countries varies from 7 percent in Belgium and Austria, 8 percent in the UK, 11 percent in Spain, 16 percent in Cyprus to 24 percent in Ireland. Such variations are questionable and possibly other design differences should be taken into account. For example, in some countries interviewing by proxy was avoided, whereas it exceeds 30 percent in Spain and Ireland. Another example is the response rate, which varies from 12 percent in Greece to 52 percent in Belgium. In the ESS the same questions and data-collection mode (CAPI), and a 70 percent response target should ensure high quality and comparable findings across countries. However, input harmonisation is not the only solution when it comes to ‘high quality’ data. Even within the ESS, there are many problems to solve. For example, a comparison of the official turnout rates with the reported turnout rates reveals that the discrepancies between the figures are large (see table 2). For example in Romania the discrepancy is 29 percent (39 percent official turnout versus 68 percent reported). But also in Bulgaria, Switzerland, France, Croatia, Latvia, Poland, Finland, Hungary, Slovakia, and the Ukraine, the over reporting exceeds 15 percent. The variation across countries is substantial: in two countries – Czech Republic and Turkey – the official result is even higher compared to the reported turnout figure.
Figure 16 - Official and reported turnout figures most recent parliamentary elections, 2008
Country Official turnout Reported turnout Difference
Belgium 1 91.1 92.1 1.0
Bulgaria 55.8 72.8 17.0
Switzerland 48.3 64.5 16.2
Cyprus 89.0 93.5 4.5
Czech Republic 64.5 58.0 -6.5
Germany 77.7 83.7 6.0
Denmark 86.6 94.2 7.6
Estonia 61.9 64.7 2.8
Spain 75.7 81.9 6.2
Finland 65.0 83.2 18.2
France 60.2 77.6 17.4
United Kingdom 61.4 70.3 8.9

ESSnet‐CultureFinalReport
- 430-
Greece1 74.1 87.9 13.8
Croatia 59.6 78.9 19.3
Hungary 64.4 80.2 15.8
Latvia 46.1 62.9 16.8
Netherlands 80.4 86.1 5.7
Norway 77.4 85.7 8.3
Poland 53.9 72.8 18.9
Portugal 64.3 73.7 9.4
Romania 39.2 67.8 28.6
Sweden 82.0 91.1 9.1
Slovenia 63.1 72.6 9.5
Slovakia 54.7 77.8 23.1
Turkey 84.2 79.9 -4.3
Ukraine 62.2 80.8 18.6
1 Compulsory voting
Source: ESSnet-Culture, round 4, 2008 & Eurostat/ IDEA voter turnout database One explanation for the discrepancies could be the weighting of the results. However, the ESS figures in the table above are already calculated after reweighing them for gender, age and regional characteristics. Obviously, many of the social and political participation variables included in the ESS will be biased as well. This is particularly true for the characteristics, which are highly correlated with political participation, such as social and political trust and volunteering work. There probably remains only one solution to tackle this problem in order to make a more appropriate comparison of the results across countries: reweighing the data by including turnout in the weighting models (for the Netherlands, see Schmeets, 2010). Obviously, input harmonisation is not a guarantee for high quality. The example demonstrates that it is difficult to assess whether it will be feasible to make a proper comparison of social and cultural participation between countries. The non-response bias varies across the countries, which makes it problematic to define - for example - the share of volunteers across countries as well as other characteristics such as social contacts, social trust and trust in (political) institutions, conventional and unconventional political participation (for an overview of the ESS findings in 2008, see Linssen and Schmeets, 2010).
5. Conclusion The EU-SILC builds on the experience of the EU-Household Panel (ECHP). In the ECHP the comparability was achieved by common concepts, definitions, classifications and a ‘blue-print’ questionnaire. In addition, other design aspects were harmonised, such as sampling, data-processing and data-analysis. In EU-SILC and the AES, output harmonisation was introduced. As demonstrated - based on EU-SILC - this has resulted in many implausible outcomes. In particular, the lack of phrasing the questions in an identical manner has an impact on the findings and the across country comparisons. In addition, the variation in the data-collection mode probably makes it problematic for making comparisons. The question arises whether it is still feasible to re-introduce input harmonisation. It is our belief that this is the case. From 2002 onwards, on a 2-year basis, the European Social Survey

ESSnet‐CultureFinalReport
- 431-
(ESS) has been conducted. The ESS is an example of an input harmonised survey, with identical questions, sampling, and response targets. Why should that not be possible for EU-SILC, and other EU-surveys such as the AES, as well? However, input harmonisation is not the only solution when it comes to ‘high quality’ data. Even within the ESS, there are many problems to solve. For example, a comparison of the official turnout rates with the reported turnout rates reveals that discrepancies between the figures are large. This indicates that the non-response bias will also vary substantially. However, using output harmonisation will create even more problems, as demonstrated in this paper, based on EU-SILC. It should be possible that not only the concepts, but also the phrasing of the questions are identical across the countries. However, it will not be easy to include the data collection mode in the recommendations or even in the regulations. CAPI is not very cost-effective, there is strong pressure from Member States to allow for other data-collection modes. For example a mixed-mode design, starting with the cheapest modes (web and mail), followed by the CATI and PAPI, and to use CAPI as the last option. When introducing a module on cultural participation, we should be aware that allowing various data collection modes will make it very difficult to compare the results across countries.


ESSnet‐CultureFinalReport
- 433-
17BANNEXES
Annex 1: Classifications The classifications were mainly drawn up with a view to facilitating the structuring of economic and social data. In other words, their purpose is essentially of a statistical nature. The global classification system is based on an ‘interlocking’ concept. As a result, the European system of classifications that was established with the Common Market is a reflection of the international system.
The European classification of economic activities (Statistical Classification of Economic Activities in the European Community/“Nomenclature d’activités des Communautés européennes” - NACE) is precisely compatible with International Standard Industrial Classification (ISIC) of the United Nations.
The Classification of Products by Activity (CPA) is linked to the Central Product Classification (CPC) via a conversion table.
The European Combined Nomenclature (CN) is precisely compatible with the Harmonised System (HS) designed by the World Customs Organization.
The European classification or nomenclature system allows for national adaptations of the European classifications, all of which reinforces the hierarchy level through a finer breakdown of European categories.
Figure 17 - Network of economic nomenclatures
Economic activities
Products
Industrial
production Foreign
trade
Other classifications
World level
CITI
CPC
SH
COICOP
COFOG
UE level
NACE
CPA
PRODCOM
NC
COICOP-HBS
National level
National versions of
NACE
National versions of
CPA
National versions of
PRODCOM
National versions of COICOP
National versions of COFOG
Is the reference classification (Classifications are linked by the structure)
Is the reference classification (Classifications are linked by conversion table)
Classifications are linked by conversion tables

ESSnet‐CultureFinalReport
- 434-
1. Activity and product classifications
Activity and product classifications were mainly drawn up with a view to facilitating the structuring of economic and social data. In other words, their purpose is essentially of a statistical nature.
1.1. Statistical Classification of Economic Activities (NACE)
The Statistical Classification of Economic Activities in the European Community, abbreviated as NACE, designates the nomenclature of economic activities in the European Union. Various NACE versions have been developed since 1970. The term NACE is derived from the French “Nomenclature statistique des activités économiques dans la Communauté européenne”. It provides a reference framework for the production and the dissemination of statistics related to economic activities. Statistics produced on the basis of NACE are comparable at European level and, in general, at world level in line with the United Nations’ International Standard Industrial Classification of all Economic Activities (ISIC).
(see http://ec.europa.eu/eurostat/ramon)
NACE Rev.1.1 was implemented in 2003 with a four-digit level of detail. The first level consists of 17 sections identified by alphabetical letters from A to Q. The lowest four-digit level comprises 514 classes. In NACE Rev.1.1, cultural activities can be found under the sections: Manufacturing (D), Wholesale and retail trade; repair of motor vehicles, motorcycles and personal and household goods (G), Real estate, renting and business activities (K) and Other community, social and personal service activities (O). The detailed list of four-digit classes relating partly or wholly to cultural activities is as follows:
SECTION D: MANUFACTURING
Division Group Class Title DE22 Publishing, printing and reproduction of recorded media
DE22.1 Publishing DE22.11 Publishing of books DE22.12 Publishing of newspapers DE22.13 Publishing of journals and periodicals DE22.14 Publishing of sound recordings

ESSnet‐CultureFinalReport
- 435-
SECTION G: WHOLESALE AND RETAIL TRADE; REPAIR OF MOTOR VEHICLES, MOTORCYCLES AND
PERSONAL AND HOUSEHOLD GOODS
Division Group Class TitleGA52 Retail trade, except of motor vehicles and motorcycles; repair of
personal and household goods GA52.4 Other retail sale of new goods in specialised stores GA52.47 Retail sale of books, newspapers and stationery
SECTION K: REAL ESTATE, RENTING AND BUSINESS ACTIVITIES
Division Group Class TitleKA74 Other business activities
KA74.2 Architectural and engineering activities and related technical consultancy
KA74.20 Architectural and engineering activities and related technical consultancy
SECTION O: OTHER COMMUNITY, SOCIAL AND PERSONAL SERVICE ACTIVITIES
Division Group Class Title OA92 Recreational, cultural and sporting activities
OA92.1 Motion picture and video activities OA92.11 Motion picture and video production OA92.12 Motion picture and video distribution OA92.13 Motion picture projection OA92.2 Radio and television activities OA92.20 Radio and television activities OA92.3 Other entertainment activities OA92.31 Artistic and literary creation and interpretation OA92.32 Operation of arts facilities OA92.4 News agency activities OA92.40 News agency activities OA92.5 Library, archives, museums and other cultural activities OA92.51 Library and archives activities OA92.52 Museums activities and preservation of historical sites and
buildings
This list does not cover the cultural field exhaustively. Some cultural activities cannot be identified and measured. Either they are included in or hidden under a class at a higher level or they are distributed between several classes, e.g. the antiques trade. Some cultural activities are not classified at all in the NACE Rev.1 nomenclature, e.g. multimedia and video games. The new revised NACE Rev.2 nomenclature introduces a fuller list of cultural activities, thus offering better coverage of the cultural field.

ESSnet‐CultureFinalReport
- 436-
NACE Rev.2 was created to better reflect current economic trends, technological progress and to facilitate international comparisons. NACE Rev.2 has been implemented starting with the reference year 2008 and comprises 21 sections identified by alphabetical letters from A to U. The lowest four-digit level comprises 615 classes, one hundred more than NACE Rev.1.1. In NACE Rev.2, cultural activities can be found mainly under the sections: Wholesale and retail trade; repair of motor vehicles, motorcycles and personal and household goods (G), Information and Communication (J), Professional, scientific and technical activities (M), Administrative and support service activities (N), Education (P), Arts, entertainment and recreation (R). The list of four-digit classes of cultural activities will include mainly:
SECTION G: WHOLESALE AND RETAIL TRADE; REPAIR OF MOTOR VEHICLES AND MOTORCYCLES
Division Group Class TitleG47 Retail trade, except of motor vehicles and motorcycles
G47.6 Retail sale of cultural and recreation goods in specialised stores G47.61 Retail sale of books in specialised stores G47.62 Retail sale of newspapers and stationery in specialised stores G47.63 Retail sale of music and video recording in specialised stores
SECTION J: INFORMATION AND COMMUNICATION
Division Group Class Title J58 Publishing activities
J58.1 Publishing of books, periodicals and other publishing activities J58.11 Book publishing J58.13 Publishing of newspapers J58.14 Publishing of journals and periodicals J58.2 Software publishing 58.21 Publishing of computer games
J59 Motion picture, video and television programme production, sound recording and music publishing activities
J59.1 Motion picture, video and television programme activities J59.11 Motion picture, video and television programme production
activities J59.12 Motion picture, video and television programme post-production
activities J59.13 Motion picture, video and television programme distribution
activities J59.14 Motion picture projection activities J59.2 Sound recording and music publishing J59.20 Sound recording and music publishing
J60 Programming and broadcasting J60.1 Radio broadcasting J60.10 Radio broadcasting J60.2 Television programming and broadcasting activities J60.20 Television programming and broadcasting activities
J63 Information service activities J63.9 Other information service activities J63.91 News agency activities

ESSnet‐CultureFinalReport
- 437-
SECTION M: PROFESSIONAL, SCIENTIFIC AND TECHNICAL ACTIVITIES
Division Group Class TitleM71 Architectural and engineering activities; technical testing and
analysis M71.1 Architectural and engineering activities and related technical
consultancy
M71.11 Architectural activitiesM73 Advertising and market research
M73.1 Advertising M73.11 Advertising agencies
M74 Other professional, scientific and technical activities M74.1 Specialised design activities M74.10 Specialised design activities M74.2 Photographic activities M74.20 Photographic activities M74.3 Translation and interpretation activities M74.30 Translation and interpretation activities
SECTION N: ADMINISTRATIVE AND SUPPORT SERVICE ACTIVITIES
Division Group Class Title N77 Rental and leasing activities
N77.2 Renting and leasing of personal and household goods N77.22 Renting of video tapes and disks
SECTION P: EDUCATION
Division Group Class Title P85 Education
P85.5 Other education P85.52 Cultural education
SECTION R: ARTS, ENTERTAINMENT AND RECREATION
Division Group Class Title R90 Creative, arts and entertainment activities
R90.0 Creative, arts and entertainment activities R90.01 Performing arts R90.02 Support activities to performing arts R90.03 Artistic creation R90.04 Operation of arts facilities
R91 Libraries, archives, museums and other cultural activities R91.0 Libraries, archives, museums and other cultural activities R91.01 Libraries and archives activities

ESSnet‐CultureFinalReport
- 438-
R91.02 Museums activities R91.03 Operation of historical sites and buildings and similar visitor
attractions

ESSnet‐CultureFinalReport
- 439-
1.2. Statistical Classification of Products by Activity (CPA)
The Statistical classification of products by activity, abbreviated as CPA, is the classification of products (goods as well as services) at the level of the European Union. Product classifications are designed to categorize products that have common characteristics. They provide the basis for collecting and calculating statistics on the production, distributive trade, consumption, foreign trade and transport of such products. CPA product categories are related to activities as defined by the Statistical classification of economic activities in the European Community. Each CPA product - whether a transportable or non-transportable good or a service - is assigned to one single NACE activity. This linkage to NACE activities gives the CPA a structure parallel to that of NACE at all levels. The CPA is part of an integrated system of statistical classifications, developed mainly under the auspices of the United Nations Statistical Division. This system makes it possible to compare statistics across countries and in different statistical domains. CPA has a hierarchical structure with six levels, each identified with a specific code:
first level: 21 sections (alphabetical code);
second level: 88 divisions (two-digit numerical code);
third level: 261 groups (three-digit numerical code);
fourth level: 575 classes (four-digit numerical code);
fifth level: 1 342 categories (five-digit numerical code);
sixth level: 3 142 subcategories (six-digit numerical code).
see http://ec.europa.eu/eurostat/ramon (Eurostat’s Metadata Server) List cultural products identified in CPA Included products from non cultural activities (*)
Level 6 CPA 2008 - Description
18 14 10 * Binding and related services
33 19 10 * Repair services of other equipments (organs and other historical instruments).
47 00 61 Retail trade services of books
47 00 62 Retail trade services of newspapers nad magazines
47 00 64 Retail trade services of music and video recordings
47 00 68 * Retail trade services of stamps and coins
47 00 69 * Retail trade services of souvenirs and arts

ESSnet‐CultureFinalReport
- 440-
47 00 91 * Retail trade services of antiques
47 00 92 * Retail trade services of second-hand books
58 11 11 Printed educational textbooks (workbooks, teachers manuals, resources materials, interactive materials)
58 11 12 Printed professional, technical and scholarly books
58 11 13 Printed children books
58 11 14 Printed dictionaries and encyclopaedias
58 11 15 Printed atlases and other books with maps
58 11 16 Printed maps and hydrographic or similar charts, other than in books form
58 11 19 Other printed books, brochures, leaflets and the like (literary fiction and non-fiction; poetry and drama; religious books, bibles and hymnals; nonfiction such as history, political, biographies, home and garden, how-to books, cook books, travel guides
58 11 20 Books on disk, tape or other physical media
58 11 30 On-line books
58 11 41 Advertising space in books, printed
58 11 42 Advertising space in books, electronic
58 11 50 Publishing of books on a fee or contract basis
58 11 60 Licensing services for the right to reproduce distribute or incorporate literary originals such as books, brochures, leaflets, maps and the like
58 13 10 Printed newspapers
58 13 20 On-line newspapers
58 14 11 Printed general interest journals and periodicals
58 14 12 Printed business, professional and academic journals and periodicals
58 14 19 Other printed journals and periodicals
58 14 20 On-line journals and periodicals
58 14 31 Advertising space in journals and periodicals, printed
58 14 32 Advertising space in journals and periodicals, electronic
58 14 40 Licensing services for journals and periodicals
58 21 10 Computer games, packaged
58 21 20 Computer games download
58 21 30 On-line games
58 21 40 Licensing services for the right to use computer games
59 11 11 Motion picture production services
59 11 12 Promotional or advertisement motion picture and video production services

ESSnet‐CultureFinalReport
- 441-
59 11 13 Other television programme production services
59 11 21 Motion picture, video and television programme originals
59 11 22 Cinematographic film
59 11 23 Films and other video content on disk, tape or other physical media
59 11 24 Films and other video downloads
59 11 30 Sale of advertising space or time in motion picture, video and television products
59 12 11 Audio-visual editing services
59 12 12 Transfers and duplication of masters services
59 12 13 Colour correction and digital restoration services
59 12 14 Visual effects services
59 12 15 Animation services
59 12 16 Captioning, titling and subtitling services
59 12 17 Sound editing and design services
59 12 19 Other motion picture, video and television programme post-production services
59 13 11 Licensing services for film rights and their revenues
59 13 12 Other motion picture, video and television programme distribution services
59 14 10 Motion picture projection services
59 20 11 Sound recording services
59 20 12 Live recording services
59 20 13 Sound recording originals
59 20 21 Radio programme production services
59 20 22 Radio programme originals
59 20 31 Printed music
59 20 32 Electronic scores (musical compositions in electronic form)
59 20 33 Musical audio disks, tapes or other physical media
59 20 34 Other audio disks and tapes
59 20 35 Music downloads
59 20 40 Licensing services for the right to use acoustic originals
60 10 11 Radio programming and broadcasting services
60 10 12 Radio broadcasting originals
60 10 20 Radio channel programmes

ESSnet‐CultureFinalReport
- 442-
60 10 30 Radio advertising time
60 20 11 On-line television programming and broadcasting services, except by subscription
60 20 12 Other television programming and broadcasting services, except by subscription
60 20 13 On-line television subscription programming and broadcasting services
60 20 14 Other television subscription programming and broadcasting services
60 20 20 Television broadcasting originals
60 20 31 Television channel programmes, except for subscription television
60 20 32 Subscription television channel programmes
60 20 40 Television advertising time
63 91 11 News agency services to newspapers and periodicals: gathering, investigating and supply services of news in the form of manuscripts or of news pictures to printed media businesses such as newspapers, periodicals and books
63 91 12 News agency services to audio-visual media: gathering, investigating and supply services of news (manuscripts, photos, images) to radio or television stations and movie companies
71 11 10 Plans and drawings for architectural purposes
71 11 21 Architectural services for residential building projects
71 11 22 Architectural services for non-residential building projects
71 11 23 Historical restoration architectural services
71 11 24 Architectural advisory services
71 11 41 Landscape architectural services
71 11 42 Landscape architectural advisory services
71 20 19 * Other technical testing and analysis services (certification and authentication of works of art)
72 19 13 * Research and experimental development services in physical sciences
73 11 11 Full service advertising services (among others: design of advertisements, writing of scenarios)
73 11 13 Advertising design and concept development services
74 10 11 Interior design services
74 10 12 Industrial design services (creating and developing designs and specifications)
74 10 19 Other specialised design services (harmonising aesthetic considerations with technical and other requirements, for furniture, jewellery, aesthetic designs, graphic designs etc.)
74 10 20 Design originals (original design concepts, produced on own account; intellectual property product typically produced with the intent to sell or license the information to others)
74 20 21 Portrait photography services (in studios or other locations, e.g. studio fashion photos)
74 20 22 Advertising and related photography services
74 20 23 Event photography and event videography services (photographing or videotaping live events, such as weddings, graduations, conventions, receptions, fashion shows, sports and news events)

ESSnet‐CultureFinalReport
- 443-
74 20 24 Aerial photography services
74 20 29 Other specialised photography services (using special apparatus or techniques, e.g. underwater photo)
74 20 32 Restoration and retouching services of photography (old photograph restoration, retouching and other special photographic effects)
74 30 11 Translation services
74 30 12 Interpretation services
74 90 20 * Other professional, technical and business services (incl. Engagements in motion pictures, theatre or other entertainment; placement of books, artworks etc.)
77 22 10 Rental services of video tapes and disks
79 90 39 * Reservation services for event tickets, entertainment & recreational services
84 12 14 Administrative recreational, cultural and religious services
85 52 11 Dancing schools and dance instructors services
85 52 12 Music schools and music instructors services
85 52 13 Fine arts schools and arts instruction services
85 52 19 Other cultural education services
90 01 10 Services of performing artists (actors, readers, singers, musicians, dancers, stunt people, television personality hosts/presenters, lecturers, speakers, circus artists and other performing artists, independent models)
90 02 11 Performing arts event production and presentation services
90 02 12 Performing arts event promotion and organisation services
90 02 19 Other performing arts support services (management services for rights attached to artistic, literary, musical works)
90 03 11 Services provided by individual artists (such as composers, sculptors, painters, cartoonists, engravers, etchers, etc), individual writers (for all subjects, including fictional and technical writing), independent journalists and other artists except perf
90 03 12 Original works of authors, composers and other artists (except performing artists, painters, graphical artists and sculptors)
90 03 13 Original works of painters, graphical artists and sculptors (paintings, drawings and pastels; original engravings, prints and lithographs; original sculptures and artistic statuary, in any material)
90 04 10 Arts facility operation services (operation services of concert halls, theatres, opera houses, music halls, including ticket services; operation services of multipurpose centres and similar facilities with a cultural predominance)
91 01 11 Libraries services: Collection, cataloguing, conservation and retrieval services of books and the like; Lending services of books and records; Stock photo and movie library services
91 01 12 Archive services: Operation (collection, cataloguing, conservation and retrieval) services of public archives, including digital archives; Operation services of historical archives, including digital archives
91 02 10 Museum services: Display services of collections of all kinds (art, science and technology, history); Management and conservation services for the collections; Organisation of travelling collection exhibitions
91 02 20 Museum collections: collections and collectors’ pieces of historical, ethnographic, zoological, botanical, mineralogical, anatomical or numismatic interest
91 03 10 Operation services of historical sites and buildings, and similar visitor attractions: Operation of, and access and visiting services to historical sites, monuments and buildings; Preservation services

ESSnet‐CultureFinalReport
- 444-
for historical sites, monuments and buildings
93 29 21 * Firework and ‘light and sound’ shows services
94 99 16 * Services provided by cultural and recreational associations

ESSnet‐CultureFinalReport
- 445-
1.3. Combined nomenclature (CN)
When declared to customs in the Community, goods must generally be classified according to the Combined nomenclature or CN. Imported and exported goods have to be declared stating under which subheading of the nomenclature they fall. This determines which rate of customs duty applies and how the goods are treated for statistical purposes. The CN is a method for designating goods and merchandise which was established to meet, at one and the same time, the requirements both of the Common Customs Tarif and of the external trade statistics of the Community. The CN is also used in intra-Community trade statistics. The CN is comprised of the Harmonized System (HS) nomenclature with further Community subdivisions. The Harmonized system is run by the World Customs Organisation (WCO). This systematic list of commodities forms the basis for international trade negotiations, and is applied by most trading nations. The CN also include preliminary provisions, additional section or chapter notes and footnotes relating to CN subdivisions. Each CN subdivisions has an eight digit code number, the CN code, followed by a description. The basic regulation is Council Regulation (EEC) No 2658/87 on the tarif and statistical nomenclature and on the Common Customs Tariff. An updated version of the Annex I to the Combined Nomenclature Regulation is published as a Commission Regulation every year in the L-series of the Official Journal of the European Communities. Such updates take into account any changes that have been agreed at international level, either at the World Customs Organisation with regard to the nomenclature at HS level or within the framework of the WTO with regard to conventional rates of duty. Other changes may be required to reflect the evolution of, for example, commercial policy, technology or statistical requirements. CN is subject to annual revisions that insure it is kept up to date in the light of changes in technology or in international trade patterns. Based on CN2011, the following goods and products are indentified as cultural.
BOOKS AND NEWSPAPERS
Section Chapter Class Title
X Pulp of wood or of other fibrous cellulosic material; recorvered (waste and scrap) paper or paperboard; paper and paperboard and articles thereof
49 Print books, newspapers, pictures and other products of the printing industry; manuscripts, typescripts and plans
4901 Printed books, brochures, leaflets and similar printed matter, whether or not in single sheets
4902 Newspapers, journals and periodicals, whether or not illustrated or containing advertising material

ESSnet‐CultureFinalReport
- 446-
MUSICAL INSTRUMENTS
Section Chapter Class Title
XVIII Optical, photographic, cinematographic, measuring, checking, precision, medical or surgical instruments and apparatus; clocks and watches; musical instruments; parts and accessories thereof
92 Musical instruments; parts and accessories of such articles 9201 Pianos, including automatic pianos; harpsichords and other
keyboard stringed instruments 9202 Other string musical instruments (for example, guitars, violins,
harps) 9205 Other wind musical instruments (for example, clarinets, trumpets,
bagpipes) 9206 Percussion musical instruments (for example, drums, xylophones,
cymbals, castanets, maracas) 9207 Musical instruments, the sound of which is produced, or must be
amplified, electrically (for example, organs, guitars, accordions) 9208 Musical boxes, fairground organs, mechanical street organs,
mechanical singing birds, musical saws and other musical instruments not falling within any other heading of this chapter; decoy calls of all kinds; whistles, call horns and other mouth-blown sound signalling instruments
9209 Parts (for example, mechanisms for musical boxes) and accessories (for example, cards, discs and rolls for mechanical instruments) of musical instruments; metronomes, tuning forks and pitch pipes of all kinds
WORKS OF ART, COLLECTORS’ PIECES AND ANTIQUES
Section Chapter Class Title
XXI Works of art, collectors’ pieces and antiques 97 Works of art, collectors’ pieces and antiques 9701 Paintings, drawings and pastels, executed entirely by hand, other
than drawings of heading 4906 and other than hand-painted or hand-decorated manufactured articles; collages and similar decorative plaques
9702 Original engravings, prints and lithographs 9703 Original sculptures and statuary, in any material 9704 Postage or revenue stamps, stamp-postmarks, first-day covers,
postal stationery (stamped paper), and the like, used or unused, other than those of heading 4907
9705 Collections and collectors' pieces of zoological, botanical, mineralogical, anatomical, historical, archaeological, palaeontological, ethnographic or numismatic interest
9706 Antiques of an age exceeding 100 years

ESSnet‐CultureFinalReport
- 447-
2. Functional classifications
‘Functional classifications’ are intended to classify certain transactions conducted by producers, households, governments, and non-profit organisations serving households. They are called ‘functional’ because they identify ‘functions’ (in the sense of objects or objectives) in the pursuit of which these groups of operators perform certain transactions:
Functions of consumption (Classification of Individual Consumption According to Purpose - COICOP)
Functions of government (Classification of the Functions of Government - COFOG)
Expenditure functions of non-profit institutions (Classification of the Purposes of Non-Profit Institutions Serving Households - COPNI)
Expenditure functions of companies (Classification of the Outlays of Producters According to Purpose - COPP)
2.1. Classification of Individual Consumption According to Purpose (COICOP)
The classification of household consumption functions (Classification of Individual Consumption by Purpose - COICOP-HBS) is a functional nomenclature that is harmonised at 4 levels, and that describes all consumption of individual households. The COICOP-HBS is a European adaptation of the international COICOP classification, and is used for household budget surveys (HBS). Its first level is composed of 12 divisions.
COICOP-HBS 99
HE01 Food and non –alcoholic beverages HE02 Alcoholic beverages, tobacco and narcotics HE03 Clothing and footwear HE04 Housing, water, electricity, gas and other fuels HE05 Furnishings, household equipment and routine household maintenance HE06 Health HE07 Transport HE08 Communication HE09 Recreation and culture HE10 Education HE11 Restaurants an and hotels HE12 Miscellaneous goods and services
The divisions (1st level) are broken down into groups (2nd level, 3-digits), then into classes (3rd level, 4-digits), and then into sub-classes (4th level, 5-digits). Some Member States use more a detailed classification that extends to a 5th level (6-digits).

ESSnet‐CultureFinalReport
- 448-
The HE09 division ‘Recreation and culture’ specifically covers the cultural expenses of households. 15 sub-classes (5-digits) defined as totally cultural correspond to thus retained by the Eurostat Task Group in 2004.
HE09: RECREATION AND CULTURE
Group Class Sub-class Title
09.1 Audio-visual, photographic and information processing equipment
09.1.1 Equipment for the reception, recording and reproduction of sound and pictures
09.1.1.1 Equipment for the reception, recording and reproduction of sound
09.1.1.2 Television sets, video-cassette players and recorders
09.1.2 Photographic and cinematographic equipment and optical instruments
09.1.2.1 Photographic and cinematographic equipment 09.1.3 Information processing equipment 09.1.3.1 Information processing equipment 09.1.4 Recording media 09.1.4.1 Recording media for pictures and sound
09.1.5 Repair of audio-visual, photographic and information processing equipment
09.1.5.1 Repair of audio-visual, photographic and information processing equipment
09.2 Other major durables for recreation and culture 09.2.2 Musical instruments and major durables for indoor recreation 09.2.2.1 Musical instruments
09.4 Recreational and cultural services 09.4.1 Recreational and sporting services 09.4.1.1 Recreational and sporting services 09.4.2 Cultural services 09.4.2.1 Cinemas, theatres, concerts etc. 09.4.2.2 Museums, zoological gardens and the like 09.4.2.3 Television and radio taxes and hire of equipment 09.4.2.4 Other services
09.5 Newspapers, books and stationery 09.5.1 Books 09.5.1.1 Books 09.5.2 Newspapers and periodicals 09.5.2.1 Newspapers and periodicals 09.5.4 Stationery and drawing materials 09.5.4.1 Stationery and drawing materials

ESSnet‐CultureFinalReport
- 449-
2.2. Classification of Functions of Government (COFOG)
The Classification of the Functions of Government (COFOG) classifies government expenses by the purpose for which the funds were used.
(see http://ec.europa.eu/eurostat/ramon/index.cfm) The COFOG is used to assess public spending, and is structured into 10 divisions at the first level (1st level, 2 digits) and 68 groups on the second level (2nd level, 3 digits). Public spending on culture is assessed via division 08 ‘Recreation, culture and religion’ (level 1), and 4 spending groups (level 2):
2 groups of expenses are entirely cultural (08.2 and 08.3);
2 groups of expenses are partly cultural (08.5 and 08.6)
COFOG
Division Group Title 01 General public services 02 Defence 03 Public order and safety04 Economic affairs 05 Environmental protection 06 Housing and community amentities07 Healt 08 Recreation, culture and religion 08.2 Cultual services 08.3 Broadcasting and publishing services 08.5 R&D recreation, culture and religion 08.6 Recreation, culture and religion n.e.c.
09 Education10 Social protection
Division: 08 Recreation, culture and religion
Government outlays on recreation, culture and religion include expenditures on services provided to individual persons and households and expenditures on services provided on a collective basis. Individual expenditures are allocated to groups (08.1) and (08.2); expenditures on collective services are assigned to groups (08.3) to (08.6). Collective services are provided to the community as a whole. They include activities such as formulation and administration of government policy; formulation and enforcement of legislation and standards for providing recreational and cultural services; and applied research and experimental development into recreational, cultural and religious affairs and services.

ESSnet‐CultureFinalReport
- 450-
Group of expenses entirely cultural
Group: 08.2 Cultural services (IS)
-Provision of cultural services; administration of cultural affairs; supervision and regulation of cultural facilities; -Operation or support of facilities for cultural pursuits (libraries, museums, art galleries, theatres, exhibition halls, monuments, historic houses and sites, zoological and botanical gardens, aquaria, arboreta etc.); production, operation or support of cultural events (concerts, stage and film productions, art shows etc.); -Grants, loans or subsidies to support individual artists, writers, designers, composers and others working in the arts or to organizations engaged in promoting cultural activities.
Includes: national, regional or local celebrations provided they are not intended chiefly to attract tourists.
Excludes: cultural events intended for presentation beyond national boundaries (01.1.3); national, regional or local celebrations intended chiefly to attract tourists (04.7.3); production of cultural material intended for distribution by broadcasting (08.3.0).
Group: 08.3 Broadcasting and publishing (IS)
-Administration of broadcasting and publishing affairs; supervision and regulation of broadcasting and publishing services; -Operation or support of broadcasting and publishing services; -Grants, loans or subsidies to support: the construction or acquisition of facilities for television or radio broadcasting; the construction or acquisition of plant, equipment or materials for newspaper, magazine or book publishing; the production of material for, and its presentation by, broadcasting; the gathering of news or other information; the distribution of published works.
Excludes: government printing offices and plants (01.3.3); provision of education by radio or television broadcasting (09).
Group of expenses partly cultural
Group: 08.5 R&D Recreation, culture and religion (CS)
-Administration and operation of government agencies engaged in applied research and experimental development related to recreation, culture and religion; -Grants, loans and subsidies to support applied research and experimental development related to recreation, culture and religion undertaken by non-government bodies such as research institutes and universities.
Excludes: basic research (01.4.0). Group: 08.6 Recreation, culture and religion n.e.c. (CS)
-Administration, operation or support of activities such as formulation, administration, coordination and monitoring of overall policies, plans, programmes and budgets for the promotion of sport, recreation, culture and religion; preparation and enforcement of legislation and standards for the provision of recreational and cultural services; production and dissemination of general information, technical documentation and statistics on recreation, cultural and religion.
Includes: affairs and services relating to recreation, culture and religion that cannot be assigned to (08.1), (08.2), (08.3), (08.4) or (08.5).

ESSnet‐CultureFinalReport
- 451-
3. Other classifications
3.1. International Standart Classification of Occupation (ISCO)
The International Standard Classification of Occupations (ISCO) is one of the main international classifications for which the ILO (International Labour Organisation) is responsible. It belongs to the international family of economic and social classifications.
(see http://ec.europa.eu/eurostat/ramon/index.cfm)
ISCO-88 (COM) is the European Union variant of the International Standard Classification of Occupations. ISCO-88 (COM) should not be regarded as a different classification from ISCO-88, but rather as the result of a coordinated effort to implement ISCO-88 for census and survey coding purposes. There are 10 levels in the ISCO-88 (COM) classification and cultural classes can be found under levels 2 – ‘Professionals’ and 3 – ‘Technicians and associate professionals’. List of unit group (or classes) of occupations entirely cultural in ISCO-88:
MAJOR GROUP 2: PROFESSIONAL
Sub-Group
Unit group
Title
214 Architects, engineers and related professionals 2141 Architects, town and traffics planners
243 Archivists, librarians and related information professionals 2431 Archivists and curators 2432 Librerians and related information professionnals
245 Writters and crative or performing artists 2451 Author, journalists and other writers 2452 Sculptors, painters and related artists 2453 Composer, musicians and singers 2454 Choregraphers and dancers 2455 Film, stage and related actors and directors
MAJOR GROUP 3: TECHNICIANS AND ASSOCIATE PROFESSIONALS
Sub-Group
Unit group
Title
313 Optical and electronic equipment operators 3131 Photographers and image and sound recording equipment operators
347 Artistic, entertainment and sports associate professionals

ESSnet‐CultureFinalReport
- 452-
3471 Decorators and commercial designers 3472 Radio, television and other announcers 3473 Street, night-club and related musicians, singers and dancers 3474 Clowns, magicians, acrobats and related associate professionals
This list does not cover the cultural field exhaustively. Some cultural occupations cannot be identified and measured. Either they are distributed between several classes or they are included in or hidden under a class at a higher level. Filmproducers, for example, are included in class (or unit group) 1229 ‘Production and operationsmanagers not elsewhere classified’. Some cultural occupations are not classified at all in the ISCO-88 (COM) nomenclature (e.g. multimedia artists).
ISCO-08 - The ISCO has recently been updated to take into account developments in the world of works since 1998. This new version of the ISCO – ISCO-08 – was implemented in the EU surveys from 2011. The new list of the cultural occupations identified with the European level in ISCO-08 was proposed by ESSnet-Culture. The number of professional units group identified, made up entirely of cultural occupations, go from 13 under ISCO-88 to 33 under ISCO-08. List of unit group (or classes) of occupations entirely cultural in ISCO-88:
MAJOR GROUP 2: PROFESSIONALS
Sub-Group
Unit group
Title
216 Architects, planners, surveyors and designers 2161 Buildings architects 2162 Landscape architects 2163 Product and garment designers 2164 Town and traffic planners 2166 Graphic and multimedia designers
235 Other teaching professionals 2354 Other music teachers 2355 Other arts teachers
262 Librarians, archivists and curators 2621 Archivits and curators 2622 Librarians and related information professionals
264 Authors, journalists and linguits 2641 Authors and related writers 2642 Journalists 2643 Translators, interpreters and other linguists
265 Creative and performing artists 2651 Visual artists 2652 Musicians, singer and composers 2653 Dancers and choreographers 2654 Film, stage and related directors and producers 2655 Actors

ESSnet‐CultureFinalReport
- 453-
2656 Announcers on radio, television and other media 2659 Creative and performing artists not elsewhere classified
MAJOR GROUP 3: TECHNICIANS AND ASSOCIATE PROFESSIONALS
Sub-Group
Unit group
Title
343 Artistic, cultural and culinary associate professionals 3431 Photographers 3432 Interior designers and decorators 3433 Gallery, museum and library technicians 3435 Other artistic and cultural associate professionals
352 Telecommunications and broadcasting technicians 3521 Broadcasting and audio-visual technicians
MAJOR GROUP 4: CLERICAL SUPPORT WORKERS
Sub-Group
Unit group
Title
441 Other clerical support workers 4411 Library clerks
MAJOR GROUP 7: CRAFT AND RELATED TRADE WORKERS
Sub-Group
Unit group
Title
731 Handicraft workers 7312 Musical instrument makers and tuners 7313 Jewellery and precious-mettal workers 7314 Potters and related workers 7315 Glass makers, cutters, grinders and finishers 7316 Sign writers, decorative painters, engravers and etchers 7317 Handicraft workers in wood, basketry and related materials 7318 Handicraft workers in textile, leather an related materials 7319 Handicraft workers not elsewhere classified
This list does not cover the cultural field exhaustively. Some cultural occupations could not be identified and measured by ISCO-08.
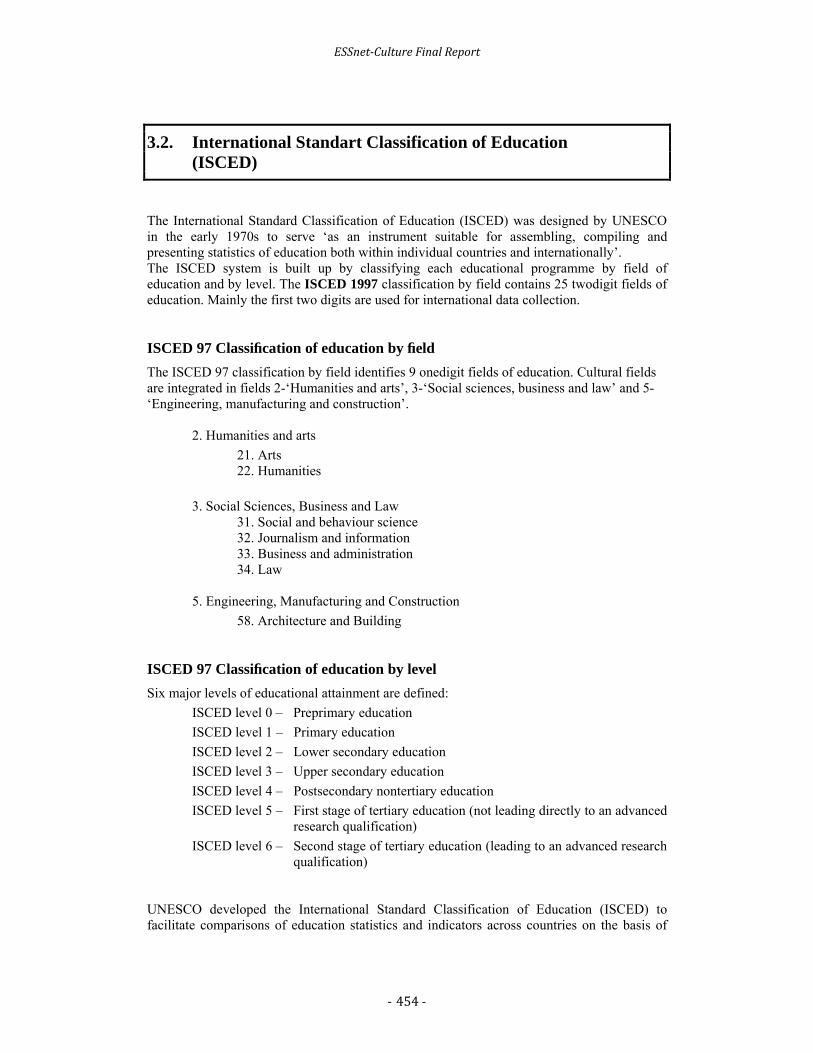
ESSnet‐CultureFinalReport
- 454-
3.2. International Standart Classification of Education (ISCED)
The International Standard Classification of Education (ISCED) was designed by UNESCO in the early 1970s to serve ‘as an instrument suitable for assembling, compiling and presenting statistics of education both within individual countries and internationally’. The ISCED system is built up by classifying each educational programme by field of education and by level. The ISCED 1997 classification by field contains 25 twodigit fields of education. Mainly the first two digits are used for international data collection. ISCED 97 Classification of education by field
The ISCED 97 classification by field identifies 9 onedigit fields of education. Cultural fields are integrated in fields 2-‘Humanities and arts’, 3-‘Social sciences, business and law’ and 5-‘Engineering, manufacturing and construction’.
2. Humanities and arts
21. Arts 22. Humanities
3. Social Sciences, Business and Law 31. Social and behaviour science 32. Journalism and information 33. Business and administration 34. Law
5. Engineering, Manufacturing and Construction
58. Architecture and Building ISCED 97 Classification of education by level
Six major levels of educational attainment are defined:
ISCED level 0 – Preprimary education
ISCED level 1 – Primary education
ISCED level 2 – Lower secondary education
ISCED level 3 – Upper secondary education
ISCED level 4 – Postsecondary nontertiary education
ISCED level 5 – First stage of tertiary education (not leading directly to an advanced research qualification)
ISCED level 6 – Second stage of tertiary education (leading to an advanced research qualification)
UNESCO developed the International Standard Classification of Education (ISCED) to facilitate comparisons of education statistics and indicators across countries on the basis of

ESSnet‐CultureFinalReport
- 455-
uniform and internationally agreed definitions. In 2011, a revision to ISCED was formally adopted by UNESCO Member States. The product of extensive international and regional consultations among education and statistical experts, ISCED 2011 takes into account significant changes in education systems worldwide since the last ISCED revision in 1997. A full listing of the classification and more details are available from the UNESCO website: http://www.uis.unesco.org/Education/Pages/international-standard-classification-of-education.aspx?SPSLanguage=EN

ESSnet‐CultureFinalReport
- 456-
3.3. Hetus coding list
The Time Use Survey does not operate with a harmonised classification but with an ‘Activity Coding List’ (ACL). The respondents record their activities in their own words in diaries. The coding process translates the respondent’s written descriptions of his/her activities into numeric codes. The ACL is recommended in order to have a lowest common denominator for coding the harmonised European Time Use Surveys. Countries that need more detailed categories can always extend the coding list to match their needs. The activity code is a hierarchical system with three levels. The first level includes ten main activities and the second and the third levels include the secondary activities. Cultural activites are integrated in main activities 5 -‘Social life and entertainment’, 7 -‘Hobbies and computing’ and 8 -‘Mass media’ and identified with the level 3. 12 secondary cultural activities are recognizable at the third level.
5. Social life and entertainment
51. Social life 52. Entertainment and culture
521. Cinema 522. Theatre and concerts 523. Library 529. Other or unspecified entertainment and culture
53. Resting – Time out
7. Hobbies and computing 71. Arts and hobbies
711. Arts (visual, performing, literary) 72. Computing
722. Information by computing 73. Games
733. Computer games
8. Mass media 81. Reading
811. Reading periodicals 812. Reading books 819. Other or unspecified reading
82. TV, video and dvd 821. Watching TV, video or dvd
83. Radio and recordings 831. Listening to radio or recordings
TUS coding: http://www.testh2.scb.se/tus/tus
87B

ESSnet‐CultureFinalReport
- 457-
Annex 2: European data sources The culture is not covered by a specific survey and thus the production of statsitic on the culture involves the use of several European surveys. Most of the European surveys (SBS, STS, COMEXT, LFS, HBS, SILC) are harmonized since they obey Community rules with which countries must comply when conducting their national surveys. These surveys presented with more details on the Eurostat Website:
http://epp.eurostat.ec.europa.eu/portal/page/portal/statistics/themes
Structural Business Statistics (SBS)
Statistics on enterprises in cultural sectors are available in the Eurostat Structural Business Statistics collection. SBS describe the structure, conduct and performance of economic activities, down to the most detailed activity level (several hundreds of sectors). A subset of the SBS information is also available for European regions, and according to the size of enterprises. SBS surveys are based upon the observation of enterprises. The data are collected according to the international classification of economic activities. NACE Rev.1.1 was used until reference year 2007 and NACE Rev.2 has been implemented from 2008 onwards, but the detailed results for the latter were not available at the time of writing of this pocketbook. As a consequence, in this publication the economic data for the publishing sector are presented for the latest available year (2007) and according to NACE Rev.1.1. In NACE Rev.1.1, SBS cover sectors C to K and some codes from the J group. SBS do not cover agriculture, forestry and fishing, nor public administration and (largely) non-market services such as education and health. For information on these areas of the economy, please refer to national accounts by branch.
http://epp.eurostat.ec.europa.eu/portal/page/portal/european_business/introduction
Short Term business Statistics (STS)
Short-term statistics provide information on trends observed in a wide range of economic activities. Index data (monthly, quarterly and annual) allow a rapid assessment of recent economic developments and reflect the general economic situation. Broken down by sectors of economy, STS provide, among others, turnover index, production index, labour input index etc. For the economic sectors, NACE Rev.2 was implemented in 2009 and the time series were back-cast to 2000. Simultaneously, a new base year (2005) for the indices was adopted.
http://epp.eurostat.ec.europa.eu/portal/page/portal/short_term_business_statistics/introduction

ESSnet‐CultureFinalReport
- 458-
Eurostat’s COMEXT
The ComExt database provides monthly, quarterly and annual statistics on the European Union’s external trade and trade between Member States. There are two underlying data sets: one for intra-EU trade, the other for trade with non-EU countries (extra EU-trade). Products are coded and described in accordance with the Combined Nomenclature. Codes can change from one year to another. For each product in this classification the statistics indicate the reference period, the reporting country (in EU-27), the partner country (any country in the world), the trade flow and the unit (euros or tonnes or sometimes number of items).
Extra-EU trade
Extra-EU trade statistics are collected on the basis of the statistical part of the single administrative document (SAD) provided by the customs authorities when transactions are above the extra-EU transaction threshold (1,000 EUR or 1,000 kg in net mass). Statistics on extra-EU trade record exports (outward flows of goods from an EU Member State to a non-EU country) and imports (inward flows of goods from a non-EU country to an EU Member State).
Intra-EU trade
Intra-EU trade statistics are collected on the basis of the Intrastat declarations provided by traders not exempt from the statistical obligation, i.e. legal or natural persons registered for VAT in the reporting Member State who have recorded annual intra-Community trade above the Intrastat exemption threshold during the previous year or reached the threshold during the current year. Statistics on intra-EU trade record outward flows of goods from one Member State to another, which are called ‘dispatches’, and inward flows of goods from one Member State to another, which are called ‘arrivals’.
http://epp.eurostat.ec.europa.eu/portal/page/portal/external_trade/introduction
Labour Force Survey (LFS)
Cultural employment is basedmainly on the results of the European Labour Force Survey (EU-LFS). The EU-LFS is a quarterly household sample survey carried out in the Member States of the European Union, candidate countries and EFTA countries (except Liechtenstein). It is themain source of information about the situation and trends on the labour market in the European Union. The survey’s target population are all persons in private households aged 15 years or older. In providing data on employment, unemployment and inactivity, the EU LFS is the most important source of information for labour market trends in the European Union. Various breakdowns are available — by age, sex, educational attainment, temporary employment, full-time/part-time employment and many other dimensions. The National Statistical Institutes are responsible for selecting the sample, preparing the questionnaires, conducting the direct interviews among households, and forwarding the results to Eurostat in accordance with the common coding scheme. The national Labour Force Surveys use the same concepts and definitions, follow the International Labour Organisation guidelines, use common classifications (NACE, ISCO, ISCED, NUTS) and record the same set of characteristics in

ESSnet‐CultureFinalReport
- 459-
each country. The EU LFS sample size amounts to approximately 1.5 million individuals each quarter.
http://epp.eurostat.ec.europa.eu/portal/page/portal/employment_unemployment_lfs/introduction
Households Budget Surveys (HBS)
The Household Budget Survey (HBS) is a sample survey of private households periodically carried out by the national statistics institutes of the EU-27 Member States, Norway, Switzerland, Croatia, Turkey and the former Yugoslav Republic of Macedonia. This survey was launched in most EU Member States in the early 1960s, and Eurostat has been collating and publishing HBS results every five years since 1988. The latest collection round was in 2005. The HBS essentially provides detailed information on household expenditure on goods and services, but also on income, possession of consumer durables, information on housing and many demographic and socio-economic parameters. Household Budget Surveys are voluntary and are not governed by EU regulation. Although there have been continuous efforts towards harmonisation, differences remain, in particular between successive survey rounds due to methodological changes. As detailed breakdowns cannot be compared over time, each wave should be considered separately. HBS data are collected according to the COICOP classification adapted to HBS needs (COICOP-HBS). In order to measure cultural expenditure at household level, several codes belonging to division HE09 ‘Recreation and culture’ identified as cultural were extracted and aggregated. This is why cultural expenditure from the 1999 and 2005 waves could not be compared.
http://epp.eurostat.ec.europa.eu/portal/page/portal/household_budget_surveys/introduction
Survey on Income and Living Conditions (SILC)
The EU-Statistics on Income and Living Conditions (EU-SILC) is a harmonised annual Eurostat survey aiming at collecting statistics on income, poverty and social exclusion. EU-SILC is based on the idea of a common ‘framework’ and no longer a common ‘survey’. The common framework defines the harmonised lists of primary (annual) and secondary (every four years or less frequently) target variables to be transmitted to Eurostat; common guidelines and procedures; common concepts (household and income) and classifications aimed at maximising comparability of the information produced. The reference population in EU-SILC includes all private households and their members aged 16 or above, residing in the territory of the countries at the time of data collection. In 2006, a special module on cultural and social participation was attached to the standard survey and collected some data on cultural participation, in particular:
Frequency of cinema attendance; Frequency of live performance attendance; Frequency of visits to cultural sites.
This additional module was mandatory and covered all EU Member States. The information was provided for all current household members, or if applicable for all selected respondents aged 16 or above.
http://epp.eurostat.ec.europa.eu/portal/page/portal/income_social_inclusion_living_conditions/methodology/list_of_variables
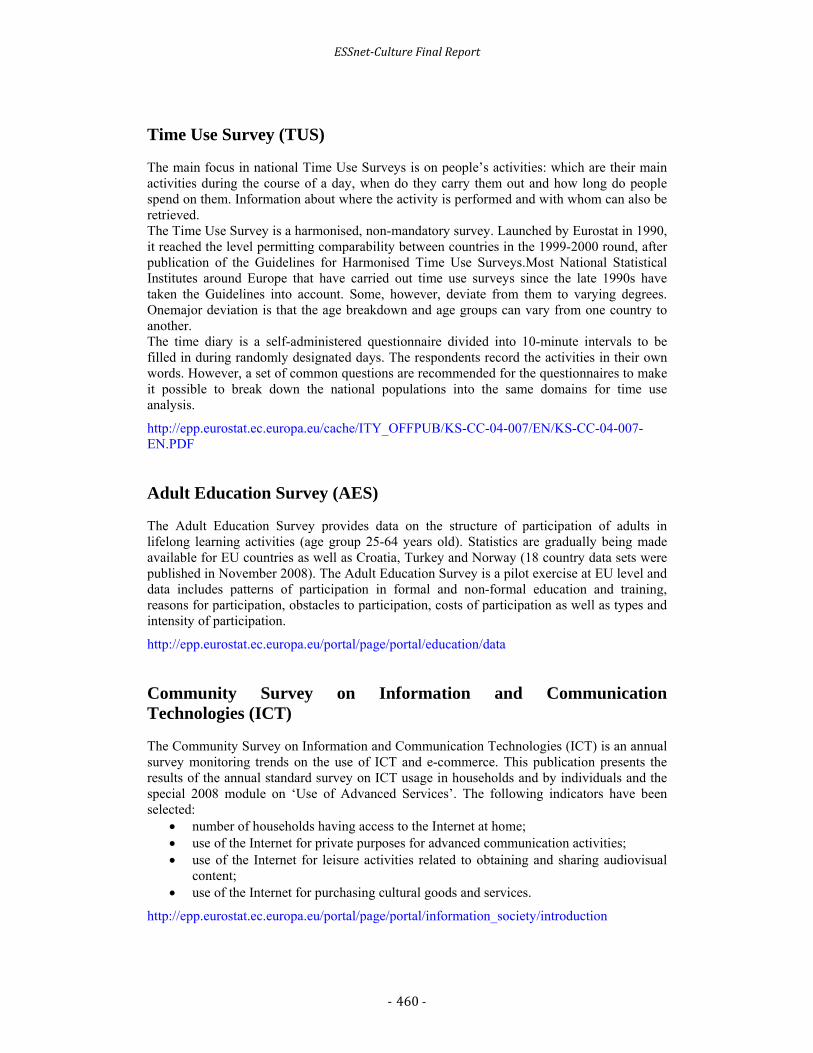
ESSnet‐CultureFinalReport
- 460-
Time Use Survey (TUS)
The main focus in national Time Use Surveys is on people’s activities: which are their main activities during the course of a day, when do they carry them out and how long do people spend on them. Information about where the activity is performed and with whom can also be retrieved. The Time Use Survey is a harmonised, non-mandatory survey. Launched by Eurostat in 1990, it reached the level permitting comparability between countries in the 1999-2000 round, after publication of the Guidelines for Harmonised Time Use Surveys.Most National Statistical Institutes around Europe that have carried out time use surveys since the late 1990s have taken the Guidelines into account. Some, however, deviate from them to varying degrees. Onemajor deviation is that the age breakdown and age groups can vary from one country to another. The time diary is a self-administered questionnaire divided into 10-minute intervals to be filled in during randomly designated days. The respondents record the activities in their own words. However, a set of common questions are recommended for the questionnaires to make it possible to break down the national populations into the same domains for time use analysis.
http://epp.eurostat.ec.europa.eu/cache/ITY_OFFPUB/KS-CC-04-007/EN/KS-CC-04-007-EN.PDF
Adult Education Survey (AES)
The Adult Education Survey provides data on the structure of participation of adults in lifelong learning activities (age group 25-64 years old). Statistics are gradually being made available for EU countries as well as Croatia, Turkey and Norway (18 country data sets were published in November 2008). The Adult Education Survey is a pilot exercise at EU level and data includes patterns of participation in formal and non-formal education and training, reasons for participation, obstacles to participation, costs of participation as well as types and intensity of participation.
http://epp.eurostat.ec.europa.eu/portal/page/portal/education/data
Community Survey on Information and Communication Technologies (ICT)
The Community Survey on Information and Communication Technologies (ICT) is an annual survey monitoring trends on the use of ICT and e-commerce. This publication presents the results of the annual standard survey on ICT usage in households and by individuals and the special 2008 module on ‘Use of Advanced Services’. The following indicators have been selected:
number of households having access to the Internet at home; use of the Internet for private purposes for advanced communication activities; use of the Internet for leisure activities related to obtaining and sharing audiovisual
content; use of the Internet for purchasing cultural goods and services.
http://epp.eurostat.ec.europa.eu/portal/page/portal/information_society/introduction

ESSnet‐CultureFinalReport
- 461-
Annex 3: Bibliography General bibliography ECE-CES (2008); Report for ECE-CES on cultural statistics.
[http://www.unece.org/fileadmin/DAM/stats/documents/ece/ces/bur/2008/3.e.pdf].
EUROSTAT (2000); Cultural Statistics in the UE- Final report of the LEG, Eurostat Working paper n°3/2000/E/N°1. [http://circa.europa.eu/Public/irc/dsis/culturestatistics/library?l=/public/leg_culture_report/_EN_1.0_&a=d].
EUROSTAT (2002); Cultural statistics in Europe, Part 1: Final Report, Working paper n°3/2002/E/N°18.[http://circa.europa.eu/Public/irc/dsis/culturestatistics/library?l=/public/statistics_2002pdf/_EN_1.0_&a=d].
EUROSTAT (2008); Expert report on source – The Collection of Cultural Statixitics in Europe, Doc.ESTAT/CULT/09/2008.
EUROSTAT (2004); Final Report - Task Force on Cultural Employment, ESTAT, Luxembourg, European Commission. [http://circa.europa.eu/Public/irc/dsis/culturestatistics/library?l=/public/employment_2004pdf/_EN_1.0_&a=d].
EUROSTAT (2004); Final Report - Task Force on Cultural Expenditure and Financing, Doc ESTAT/D5/2004-CULT-03-FIN-01-EN, Luxembourg, European Commission.[http://circa.europa.eu/Public/irc/dsis/culturestatistics/library?l=/public/cultural_expenditure/04_en_expenditure/_EN_1.0_&a=d].
EUROSTAT (2004); Final Report - Task Force on Cultural Participation,ESTAT/D5/2004-CULT-03-PART.01-EN, Luxembourg, European Commission.
EUROSTAT (2007); Cultural statistics, Eurostat Pocketbooks, Luxembourg, European Commission.[http://epp.eurostat.ec.europa.eu/cache/ITY_OFFPUB/KS-77-07-296/EN/KS-77-07-296-EN.PDF].
EUROSTAT (2011); Cultural statistics, Eurostat Pocketbooks, Luxembourg, European Commission.[ http://epp.eurostat.ec.europa.eu/cache/ITY_OFFPUB/KS-32-10-374/EN/KS-32-10-374-EN.PDF].
Proceedings of the International Symposium on Culture Statistics, Montréal, 21-23 October 2002.[http://www.colloque2002symposium.gouv.qc.ca].
UNESCO (2003); Proceedings of the International Symposium on Cultural Statistics - Montréal 21-23 October 2002, UNESCO Institute for Statistics. [http://www.uis.unesco.org/Library/Documents/culture02enfr.pdf].
UNESCO (2009); The 2009 UNESCO framework for cultural statistics, UNESCO Institute for Statistics.[http://www.uis.unesco.org/Library/Documents/FCS09_EN.pdf].

ESSnet‐CultureFinalReport
- 462-
Specific bibliography: Financing and expedenditure (TF2)
BEILBY-ORRIN (H.) and GORDON (J.) (dir) (2006); International Measurement of the Economic and Social Importance of Culture, Paris, OCDE.
[http://www.oecd.org/dataoecd/26/51/37257281.pdf].
ERIES (2004); Public Financing of Culture in Europe, Doc ESTAT SCEF-MI-2004-02, Luxembourg, European Commission.
ERIES (2004); Methodological Guidelines, Doc ESTAT, Luxembourg, European Commission.
EUROPEAN PARLIAMENT (2006); Financing the Arts and Culture in the EU, Bruxelles, European Parliament.
EUROPEAN PARLIAMENT (2009); The Status of Artists in Europe, Bruxelles, European Parliament.
EUROSTAT (1995); European System of Integrated Economic Accounts ESA 95, Luxembourg, European Commission. [http://circa.europa.eu/irc/dsis/nfaccount/info/data/esa95/en/esa95en.htm].
EUROSTAT (2001); Concepts and Definitions of the HBS in the EU, Methodology and Recommendations for Harmonization - Working Group on HBS, Luxembourg, European Commission.
EUROSTAT (2008); Meeting minutes of the Working Group on Cultural Statistics, Luxembourg, European Commission.
HOFECKER (F-O) (2008); How to start International Comparisons in Expenditure and Financing Art and Culture, Austria.
MINISTRY OF CULTURE (2009); Satellite Account on Culture in Spain, Madrid, Cultural Statistics Division. [http://www.mcu.es/estadisticas/docs/CSCE/advance_results_csce-2010.pdf].
MINISTRY OF EDUCATION (2009); Culture Satellite Account, Final Report of pilot project, Finland. [http://www.minedu.fi/export/sites/default/OPM/Julkaisut/2009/liitteet/opm13.pdf?lang=en].
UIS (2009); The 2009 Framework for Cultural Statistics (FCS), Montreal, UNESCO. [http://unesdoc.unesco.org/images/0019/001910/191061e.pdf].
Specific bibliography: Cultural industries (TF3)
AUSTRALIAN BUREAU OF STATISTICS (2006); Employment in Culture, Australia. [http://www.abs.gov.au/ausstats/[email protected]/mf/6273.0].
BAKHAHI (E.), HASAN (S.) and Mc VITTIE (J.) (2008); Creating Innovation, Do the creative industries support innovation in the wider economy, NESTA. [http://www.nesta.org.uk/library/documents/Report%20-%20Creative%20Innovation%20v5.pdf].
BEILBY-ORRIN (H.) and GORDON (J.) (dir) (2006); International Measurement of the Economic and Social Importance of Culture, Paris, OCDE.
[http://www.oecd.org/dataoecd/26/51/37257281.pdf].

ESSnet‐CultureFinalReport
- 463-
BOUQUILLION (P.) (2011); Concepts of creative industries and creative economies: what are the issues?
DCMS (2009); Investing in creative industries, A guide for local authorities. [http://www.lga.gov.uk/lga/aio/2204842].
EVANS (G) (2009); Creative Cities, Creative Spaces and Urban Policy. [http://usj.sagepub.com/content/46/5-6/1003.full.pdf+html].
FLORIDA (R.) (2002); The Rise of the Creative Class And How It’s Transforming Work, Leisure, Community and Everyday Life, New York.
FREEMAN (A.) (2010); London’s creative workforce: 2009 update, Greater London Authority. [http://legacy.london.gov.uk/mayor/economic_unit/docs/wp40.pdf].
GODIN (B.) (2009); The Making Of Science, Technology And Innovation Policy: Conceptual Frameworks As Narratives, 1945-2005, Centre Urbanisation Culture Société Institut national de la recherche scientifique, Montréal, Canada. [http://www.csiic.ca/PDF/TheMakingOfScience.pdf].
GROWTH ANALYSIS (2010); The role of cultural industries in the economy at regional and national level, Swedish Agency for Growth Policy Analysis. [http://tillvaxtanalys.se/tua/export/en/filer/reports/Report_2010_10.pdf].
HANDKE (C.) (2006); Surveying Innovation in the Creative Industries. [http://www.business.mmu.ac.uk/emaee/papers/26Handke.pdf].
HESMONDHALGH (D.) (2007); The Cultural Industries, SAGE Publications LTD.
HOWKINS (J.) (2007); The Creative Economy. How People Make Money from Ideas, Penguin Books.
KEA (2006); The Economy of Culture in Europe. [http://ec.europa.eu/culture/key-documents/doc873_en.htm].
OAKLEY (K.), SPERRY (B.) and PRATT (A.) (2008); The art of innovation. How fine arts graduates contribute to innovation, London, NESTA. [http://www.nesta.org.uk/library/documents/Report%2016%20%20Art%20of%20Innovation%20v11.pdf].
ONSAGER (K.), ASLESEN (H.), GUNDERSEN (F.), Isaksen (A.) and LANGELAND (O.) (2010); City regions, advantages and innovation, Oslo, Norwegian Institute for Urban and Regional Research. [http://www.nibr.no/uploads/publications/f1fcfca6cdf727353a4f99114e1b6f9e.pdf].
POWER (D.) and NIELSÉN (T.) (2010); Priority Sector Report, Creative and Cultural industries, European cluster Observatory. [http://uppsala.academia.edu/DominicPower/Papers/610090/Priority_Sector_Report_Creative_and_Cultural_Industries].
Proposals concerning cultural occupations within ISCO, OECD and UNESCO Institute for Statistics. [http://www.oecd.org/dataoecd/35/57/38455994.doc]
REID (B.), ALBERT (A.) and HOPKINS (L.) (2010); A Creative Block? The Future of the UK Creative Industries - A Knowledge Economy & Creative Industries report, London, Work Foundation. [http://www.theworkfoundation.com/assets/docs/publications/277_A%20creative%20block.pdf].

ESSnet‐CultureFinalReport
- 464-
ROY-VALEX (M.) and POIRIER (C.) (2010) ; L’économie créative : Bilan scientifique et analyse des indicateurs de la créativité, Institut national de la recherche scientifique Centre - Urbanisation Culture Société.
RUTTEN (P.) (2006); Culture & Urban Regeneration. Cultural Activities & Creative Industries. A Driving Force for Urban Regeneration. Finding & conclusions on the economic perspective. [http://urbact.eu/fileadmin/general_library/ConclusionsUC-English.pdf].
SACCO (P.L.) (2011); Culture 3.0: A new perspective for the EU 2014-2020 structural funds programming, Produced for the OMC Working Group on Cultural and Creative Industries.
SCOTT (A.), (2001); Capitalism, cities, and the production of symbolic forms, Transactions of the Institute of British Geographers.
Staying ahead: the economic performance of the UK’s creative industries (2007). [http://www.theworkfoundation.com/assets/docs/publications/176_stayingahead.pdf].
SÖNDERMANN (M.) and FESEL (B.) (2007); Culture and Creative Industries in Germany, German Commission for UNESCO. [http://www.unesco.de/fileadmin/medien/Dokumente/Bibliothek/culture_and_creative_industries.pdf].
UNITED NATIONS (2008); Creative Economy Report, The Challenge of Assessing the Creative Economy: towards Informed Policy-making, United Nations. [http://www.unctad.org/en/docs/ditc20082cer_en.pdf].
UNITED NATIONS (2010); Creative Economy Report, Creative Economy: A Feasible Development Option, United Nations. [http://www.unctad.org/en/docs/ditctab20103_en.pdf].
Specific bibliography: Cultural practices and social aspects of culture (TF4)
BILLIET (J.) and WELKENHUYSEN-GYBELS (J) (2004); Assessing cross-national
construct equivalence in the ESS: the case of religious involvement, Paper presented at the Sixth International Conference on Social Science Methodology; Recent Developments and Applications in Social Research Methodology, August 17-20 2004, Amsterdam.
BILLIET (J.) and WAEGE (H.) (2001); Een samenleving onderzocht, Methoden en technieken van sociaal wetenschappelijk onderzoek; Antwerpen, De Boeck.
BÍNA (V.) (2010); Een blik over de grens.
BOURDIEU (P.) (1979); La distinction, Critique social du jugement, Paris: Minuit.
CASTELLS (M.) (1996); The information age. Economy, society and culture, part 1. The rise of the network society, Oxford: Blackwell.
CHAN (T.W.) and GOLDTHORPE (J.T.) (2005); The Social Stratification of Theatre, Dance and Cinema Attendance - ‘Cultural Trends’, 14(2005); 193-212.
CHAN (T.W.) and GOLDTHORPE (J.) (2007), Social stratification and cultural consumption: Music in England, ‘Poetics’, 35; 168-190.

ESSnet‐CultureFinalReport
- 465-
CHAN (T.W.) and GOLDTHORPE (J.) (2007); Social stratification and cultural consumption: The visual arts in England. ‘Poetics’, 35: 168-190.
CLÉMENCEAU (A.), MUSEUX (J.M.) and BAUER (M.) (2006); EU-SILC (Community statistics on income and living conditions) - Issues and Challenges - Presentation at the Eurostat and Statistics Finland International Conference on Comparative EU Statistics on Income and Living Conditions: Issues and Challenges, November 6-8, Helsinki, Finland.
DE HAAN (J.) and ADOLFSEN (A.) (2008); De virtuele cultuurbezoeker; publieke belangstelling voor cultuur websites, Den Haag: SCP.
DE LEEUW (E.D.) (2005); To mix or not to mix data collection models in surveys. ‘Journal of official statistics 21’, 233-255.
DEKKER (P.), VAN DER MEER (T.), SCHYNS (P.) and STEENVOORDEN (E.) (2009); Crisis in aantocht? Verdiepingsstudie Continu Onderzoek Burgerperspectieven 2008. Den Haag: SCP.
DILLMAN (D.) and CHRISTIAN (L.M.) (2005); Survey Mode as a Source of Instability in Responses across Surveys, ‘Field Methods’ 17, p. 30-52.
EIJCK (K.), DE HAAN ( J.) and KNULST (W.) (2002); Snobisme hoeft niet meer: de interesse voor hoge cultuur in een smaakdemocratie, ‘Mens en Maatschappij’ 77, No. 2.
ELCHARDUS (M.) (2009); Self-Control as Social Control, The Emergence of a Symbolic Society, ‘Poetics’ 37, No 2:146-161.
EUROSTAT Income, Social Inclusion and Living Conditions (EU-SILC). [http://epp/eurostat.ec.europa.eu/portal/page/portal/living_conditions_and_social_protection_introduction/income_social_inclusion_living_conditions].
JDENS (T.I), VAN HOORN (M.), VAN DEN BROEK (A.) and HIEMSTRA (T.) (Ed) (2010); Jaarboek actieve cultuurparticipatie 2010. Bijdragen over kennis en beleid, Utrecht: Fonds voor Cultuurparticipatie, 152-163.
JENKINS (H.) (2006); Convergence culture, Where old and new media collide, New York/ London: New York University Press.
LINSSEN (R.) and SCHMEETS (H.) (2010); Participatie en vertrouwen in Europa, In: Schmeets, H. (red.) ‘Sociale Samenhang: Participatie, Vertrouwen en Integratie’ Den Haag/Heerlen: CBS, Pp 129-145.
MORRONE (A.) (2006); Guidelines for measuring cultural participation, Montreal: Unesco Institute for Statistics.
PETERSON (R.A.) (1992); Understanding audience segmentation: From elite and mass to omnivore and univore, In: ‘Poetics’, 21, No 4: 243-258.
PETERSON (R.A.) and KERN (R.) (1996); Changing Highbrow Taste: From Snob to Omnivore, ‘American Sociological Review’, 61(1996), No. 5: 900-907.
PETERSON (R.A.) (2007); Comment on Chan and Goldthorpe: Omnivore, what’s in a name, what’s in a measure?, ‘Poetics’, 35: 301-305.
SCHMEETS (H.) (2008); Social cohesion: an integrated empirical approach - Paper presented at the International Conference On Theoretical Perspectives On Social Cohesion and Social Capital; Brussels, 15 May 2008 (revised version submitted to be published in proceedings of the Conference).

ESSnet‐CultureFinalReport
- 466-
SCHMEETS (H.) (2010); Increasing response rates and its consequences for the Dutch parliamentary Election Study, ‘Field Methods 22’, No.4, 391-412.
SCHMEETS (H.) and HUYNEN (B.A.E) (2010); Social and cultural participation in EU-SILC and the problem of out harmonization - Paper presented at the Q010 conference, May, 5, 2010 Helsinki, Finland.
SEGERS (J.) (1999); Methoden voor de maatschappijwetenschappen; Assen: Van Gorcum.
STOOP (I.) (2009); Beyond Silos: Social Policy, Official Statistics, and Social Science, Den Haag: SCP, Paper presented at the DGINS 2009, Malta.
UNESCO (2005); Towards knowledge societies, Paris, UNESCO.
VERMA (V.) (2006); in data quality and comparability in EU-SILC, In: Comparative EU statistics on income and living conditions: issues and challenges; Proceedings of the EU-SILC Conference, November 2006 Helsinki, Finland.
Specific bibliography: Concepts of creative industries and creative economies: what are the issues?
Academic or expert references BANKS (M.) and O’CONNOR (J.) (2009); After the creative industries, ‘International
Journal of Cultural Policy’, Vol. 15, No. 4, November, pp. 365-373.
BANKS (M.) and HESMONDHALGH (D) (2009); Looking for work in creative industries policy, ‘International Journal of Cultural Policy’, Vol. 15, No. 4, November, 415-430;.
BOUQUILLION (P.) (2010) ; Industries, économie créatives et technologies d'information et de communication, ‘TIC&Société’, Volume 4-2010, 35 pages.
BOUQUILLION (P.) and LE CORF (J-B.) (2010) ; Les industries créatives et l’économie créative dans les rapports officiels en Europe, ‘Rapport remis au Département des Etudes, de la Prospective et des Statistiques du ministère de la Culture et de la Communication’, Paris, 43 pages.
BOUQUILLION (P.) MIEGE (B.) and MŒGLIN (P.) (2009) ; La question des industries créatives en France, ‘Economia della Cultura’ - Rivista dell'Associazione per l'Economia della Cultura revue italienne d’économie de la culture, marzo, pp.35-48.
CAVES (R.) (2000); Creative Industries: Contracts between Art and Commerce, Cambridge, Harvard University Press.
Conférence des Nations Unies sur le Commerce et le Développement (2004); E-commerce and Development Report. [http://www.unctad.org/Templates/Webflyer.asp?intItemID=3356]
Conférence des Nations Unies sur le Commerce et le Développement (2008) ; Creative Economy Report. The challenge of assessing the creative economy: Towards informed policy making. [http://www.unctad.org/en/docs/ditc20082cer_en.pdf]
COOKE (P.) and LAZZERETTI (L.) (2008); Creative cities, cultural clusters and local economic development, Cheltenham, UK, Edward Elgar.

ESSnet‐CultureFinalReport
- 467-
CUNNINGHAM (S.) and al. (2008); Cultural economy: the shape of the field, In: H. Anheier and R. Isar, eds. The cultural economy, London, Sage, pp. 15-26.
CUNNINGHAM (S.) (2009); Trojan horse or Rorschach blot? Creative industries discourse around the world, International Journal of Cultural Policy, Vol. 15, No. 4, November, pp. 375-386.
FLORIDA (R.) (2002); The rise of the creative class, New York, Basic Books.
GARNHAM (N.) (2001); The UK Cultural Sector, profile a policy issues, in Selwood S. (ed.), London, pp. 445-458.
GARNHAM (N.) (2005); From cultural to creative industries: an analysis of the implications of the ‘creative industries approach to arts and media policy making in the United Kingdom. International journal of cultural policy, 11 (1), 15-29.
HOWKINS (J.) (2001); The creative economy: how people make money from ideas, London, Penguin.
LASH (S.) and LURY (C.) (2007); Global Cultural Industry, Cambridge, Polity Press.
LE CORF (J-B.) (2011) ; L’expérimentation de la plate-forme d’innovation numérique et sociale de la rive droite de Bordeaux : projet de mutualisation emblématique d’une idéologie du réseau?, Etudes de communication, n°37.
OAKLEY (K.) (2009); The disappearing arts: creativity and innovation after the creative Industries, International Journal of Cultural Policy, Vol. 15, No. 4, November, pp. 403-413.
O’CONNOR (J.) (2009); Creative industries: a new direction? International Journal of Cultural Policy, Vol. 15, No. 4, November, pp. 387-402.
SCHLESINGER (P.) (2007); Creativity: from discourse to doctrine? Screen, Oxford University Press, 48, 3, autumn, pp. 377-387.
THROSBY (D.) (2001); Economics and culture, Cambridge, Cambridge University Press.
TREMBLAY (G.), Industries culturelles, économie créative et société de l’information, ‘Global Media Journal - Canadian Edition’, Volume 1, Issue 1, pp. 65-88 ; 2008.
WYSZOMIRSKI (2008); The local creative economy in the United States of America. In: H.K. Anheier and Y.R. Isar, eds. The cultural economy: the cultures and globalization series 2, London, Sage, pp. 199-212.
Official reports Conférence canadienne des arts (2009) ; De l’économie à l’écologie : Un cadre stratégique
pour la main d’œuvre créative.
DEPARTMENT FOR CULTURE, MEDIA AND SPORT (2008); Creative Britain: New Talents for the New Economy, UK.
DUTCH MINISTRY OF ECONOMIC AFFAIRS ET MINISTRY OF EDUCATION, CULTURE AND SCIENCE (2005); Culture & Economy, Our Creative potential, Netherland.
EUROPEAN COMMISSION (2006); The economy of culture in Europe.

ESSnet‐CultureFinalReport
- 468-
FEDERAL MINISTRY OF ECONOMICS AND TECHNOLOGY AND FEDERAL GOVERNMENT COMMISSIONER FOR CULTURE AND THE MEDIA (2009); Culture and Creative Industries in Germany, ‘Research Report’.
KEA (2009); The impact of culture on creativity, Study for European Commission.
NORDIC INNOVATION CENTRE (2007); Creative economy green paper for the Nordic region.
SANTAGATA (W.) (2009); White paper on creativity: Towards an Italian model of development.
WORLD INTELLECTUAL PROPERTY ORGANIZATION and MINISTRY OF CULTURE OF THE REPUBLIC OF BULGARIA (2007); Wipo study of the economic contribution of the copyright-based industries in Bulgaria.
Specific bibliography: Issue of cultural diversity
BENHAMOU (F.) and PELTIER (S.); ‘How should cultural diversity be measured? An application using the French publishing industry', Paris-Sorbonne.
COMPENDIUM OF CULTURAL POLICIES AND TRENDS IN EUROPE; Themes ‘Cultural diversity’.[http://www.culturalpolicies.net/web/cultural-diversity.php].
LIIKKANEN (M.); Convention on the Protection and Promotion of the Diversity of Cultural Expressions: Possible Statistical Implications? Statistics Finland.
STIRLING (A.); On the Economics and Analysis of Diversity, University of Sussex.
UNESCO; Portal on cultural diversity [http://portal.unesco.org/culture/en/ev.phpURL_ID=34321&URL_DO=DO_TOPIC&URL_SECTION=201.html]
UNESCO; Measuring the diversity of cultural expressions, UNESCO Institute for Statistics, [http://www.uis.unesco.org/ev.php?ID=7061_201&ID2=DO_TOPIC]
Specific bibliography: Experience feedback of the satellite accounts
on culture MINISTRY OF CULTURE (2009); Satellite Account on Culture in Spain - Methodology;
Spain. [http://www.mcu.es/estadisticas/docs/CSCE/Satellite_Account_on_Culture_in_Spain_Methodology.pdf]
MINISTRY OF CULTURE (2010); Satellite Account on Culture in Spain - Advance of results 2000-2008, Spain. [http://www.mcu.es/estadisticas/docs/CSCE/advance_results_csce-2010.pdf]
MINISTRY OF EDUCATION AND CULTURE (2009); Culture Satellite Account - Final report of pilot Project, 1995-2005, Finland. [http://www.minedu.fi/OPM/Julkaisut/2009/culture_satelite.html?lang=en&extra_locale=en]

ESSnet‐CultureFinalReport
- 469-
Specific bibliography: Is it possible to measure intangible cultural heritage?
CUCCIA (T) (2003); Contingent Valuation, In Ruth Towse (Ed.), A Handbook of Cultural
Economics, Cheltenham, Edward Elgar.
MCCLEERY et al. (2008); Scoping and Mapping Intangible Cultural Heritage in Scotland, Napier University, Centre for Cultural and Creative Industries.
SINGH et al. (2009); Measurement and Definition of Intangible Cultural Heritage: Recommendations from the Existing Literature, Prepared for UNESCO Institute for Statistics, Montreal.
UNESCO (2009); The 2009 UNESCO Framework for Cultural Statistics, UNESCO Institute for Statistics (UIS), Montreal.
Specific bibliography: Creative industries spillovers ABREU (M.), GRINEVICH (V.), KITSON (M.) and SAVONA (M.) (2008); Absorptive
Capacity and Regional Patterns of Innovation; [http://www.regionalinnovation.org.uk/object/download/2360/doc/DIUS-RR-08-
11.pdf]
Adapting in the Creative Industries (2001); Birmingham: ADAPT Support Unit, [Hhttp://www.isaacsuk.co.uk/resource_bank/documents/ADAPTingintheCreativeIndustriesnetgain.pdf]
AGHION (P.) and HOWITT (P.) (1990); A model of growth through creative destruction, Economica, 60, 323-51.
Arts & Economic Prosperity (2009); The Economic Impact of Nonprofit Arts and Culture Organizations and Their Audiences, III. [http://www.artsusa.org/pdf/information_services/research/services/economic_impact/aepiii/national_report.pdf]
BAKHSHI (H.) and MCVITTIE (E.) (2009); Creative supply-chain linkages and innovation: Do the creative industries stimulate business innovation in the wider economy?, Innovation: management, policy & practice, 11, 169–189.
BAKHSHI (H.), Mc VITTIE (E.) and SIMMIE (J.) (2008); Creating Innovation. Do the creative industries support innovation in the wider economy? UK: NESTA.[http://www.nesta.org.uk/library/documents/Report%20%20Creative%20Innovation%20v5.pdf]
BARGET (E.) and GOUGUET (J.-J) (2007) ‘The Total Economic Value of Sporting Events Theory and Practice’, Journal of Sports Economics, 8 (2), 165–182.
BERKUN (S.) (2010); The Myths of Innovation, O’Reilly Media.
BIANCHINI (F.) and LANDRY (C.) (1994); The Creative City, ‘Working Paper 3: Indicators of a Creative City. A Methodology for Assessing Urban Viability and Vitality’. [http://www.comedia.org.uk/pages/pdf/downloads/viability_indicators.pdf]
BOOTH (J.) (2008); Skills for the 21st. century region’s creative and cultural sectors, East Midlands AVSA Group.

ESSnet‐CultureFinalReport
- 470-
BRESCHI (S.) and LISSONI (F.) (2001); Knowledge Spillovers and Local Innovation Systems: A Critical Survey, ‘Industrial and Corporate Change’, 10 (4), 975-1005.
CHAPAIN (C.), COOKE (P.), DE PROPRIS (L.), MACNEILL (S.) and MATEOS-GARCIA (J.) (2010); Creative clusters and innovation, Putting creativity on the map. UK: NESTA.
CLARK, (A.), FRIJTERS (P.) and SHIELDS (M.) (2008); Relative Income, Happiness and Utility: An Explanation for the Easterlin Paradox and Other Puzzles, ‘Journal of Economic Literature’, 46 (1), 95-144.
COE (D.) and HELPMAN (E.) (1995); International R&D spillovers, ‘European Economic Review’, 39, 859-87.
COHEN (W.) and LEVINTHAL (D.) (1989); Innovation and Learning: The Two Faces of R&D, ‘The Economic Journal’, 99 (397), 569-596.
COHEN (W.) and LEVINTHAL (D.) (1990); Absorptive Capacity: A New Perspective on Learning and Innovation, ‘Administrative Science Quarterly’, 35 (1), 128-152.
Creative sector, 1992-2003. Extract taken from United Kingdom Input-Output Analyses, 2005 Edition (2005). [http://www.statistics.gov.uk/articles/economic_trends/Creative_Sector.pdf]
Creativity, Design and Business Performance (2005), DTI ECONOMICS PAPER No 15.
CURSOY (D.), KIM (K.) and UYSAL (M.) (2004); Perceived impacts of festivals and special events by organizers: an extension and validation, ‘Tourism Management’, 25, 171-181.
CROMPTON (J.) and Mc KAY (S.) (1994); Measuring the economic impact of festivals and events: some myths, misapplications and ethical dilemmas, ‘Festival and Event Management’, 2, 33-43.
CUNNINGHAM (S.) and HIGGS (P.) (2009); Measuring creative employment: Implications for innovation policy, ‘Innovation: Management, Policy & Practice’, 11, 190-200.
DEPARTMENT FOR CULTURE, MEDIA AND SPORT (DCMS) (2007); The Creative Economy Programme: A summary of projects commissioned in 2006/7, London: The Stationery Office.
EDWARDS (S.) (1998); Openness, Productivity and Growth: What Do We Really Know? ‘Economic Journal’, 108 (447), 383–398.
EVANS (G.) (2009); From cultural quarters to creative clusters - creative spaces in the new city economy. [http://www.londonmet.ac.uk/londonmet/fms/MRSite/Research/cities/079- cultural_quarters_and_urban_regeneration-090722-evans.pdf]
EVANS (G.) (2009); Creative Cities, Creative Spaces and Urban Policy, ‘Urban Studies’ 46(5/6), 1003-1040.
FLORIDA (R.) (2002); The Rise of the Creative Class. And How It’s Transforming Work, Leisure, Community and Everyday Life. New York: Basic Books.
FREEMAN (A.) (2010); London’s creative workforce, UK: Greater London Authority.
FRONTIER ECONOMICS (2009); Creative Industry spillovers, April.
FRONTIER ECONOMICS (2009); Creative Industry spillovers - understanding their impact on the wider economy, April.

ESSnet‐CultureFinalReport
- 471-
GACHINO (G.) (2010); Technological spillovers from multinational presence : towards a conceptual framework, ‘Progress in Development Studies’, 10 (3), 193-210
GLOBERMAN (S.) (1987); Culture, Governments and Markets: Public policy and the culture industries. Vancouver: The Fraser Institute.
HACKBERT (P.) and COLLAGE (B.) (2009); Economic impacts of appalachian festivals, ‘Proceedings of ASBBS’, Volume 16, Number 1.
HALPERN (L.) and MURAKÖZY (B.) (2007); Does distance matter in spillover?, ‘Economics of Transition’, 15(4), 781-805.
HANDKE (C.) (2006); Surveying Innovation in the Creative Industries. [http://www.business.mmu.ac.uk/emaee/papers/26Handke.pdf].
HOWKINS (J.) (2002); The Creative Economy. How People Make Money from Ideas, London: Penguin Books.
Investing in creative industries, A guide for local authorities (2009).[http://www.lga.gov.uk/lga/aio/2204842]
JACOBS (J.) (1969); The Economy of Cities, Random House: New York.
JANECZKO (B.), MULES (T.) and RITCHIE (B.) (2002); Estimating the economic impacts of festivals and events: a research guide, Australia: CRC Sustainable Tourism.
KAISER (U.) (2002); Measuring knowledge spillovers in manufacturing and services: an empirical assessment of alternative approaches, ‘Research Policy’, 31, 125-144.
KEA (2006); The Economy of Culture in Europe.
KOO (J.) (2005); Tehnology Spillovers, Agglomeration, and Regional Economic Development, ‘Journal of Planning Literature’, 20 (2), 99-115.
KRUGMAN (P.) (1991); Geography and Trade, Cambridge: MIT Press.
LANDRY (C.) (2000); The Creative City: A Toolkit for Urban Innovators, London: Earthscan.
LAZZERETTI (L.), BOIX (R.) and CAPONE (F.) (2008); Do creative industries cluster? Mapping Creative Local Production Systems in Italy and Spain’, ‘Working Paper’ 08.05. Departament d’Economia Aplicada, UAB. 01/03/2008. Barcelona: Universitat Autònoma de Barcelona.
LEE (N.) (2010); Growth sector, creative spillovers or urban amenity? The creative industries and urban economic growth in the UK.
LUCAS (R.) (1988); On the mechanics of economic development, ‘Journal of Monetary Economics’, 22, 3-42.
MARCUS (C.) (2005); Future of Creative Industries, Implications for Research Policy, Foresight working document series, Brussels: European Commision, Directorate-General for Research.
MARKUSEN (A.) and SCHROCK (G.) (2006); The Artistic Dividend: Urban Artistic Specialisation and Economic Development Implications, ‘Urban Studies’, 43 (10), 1661-1686.
Mc GRANAHAN (D.) and WOJAN (T.) (2007); Recasting the Creative Class to Examine Growth Processes in Rural and Urban Counties, ‘Regional Studies’, 41.2, 197-216.

ESSnet‐CultureFinalReport
- 472-
MONTGOMERY (L.), POTTS (J.) (2007); Global reuse and adaptation in the creative industries - Three further arguments against intellectual property based on lessons from China, Birkbeck conference paper on IP & innovation in creative industries.
NATIONAL ENDOWMENT FOR SCIENCE, TECHNOLOGY AND THE ARTS (NESTA) (2007); Entrepreneurship Education for the Creative Industries, London: NESTA.
OAKLEY (K.), SPERRY (B.) and PRATT (A.) (2008); The art of innovation. How fine arts graduates contribute to innovation, London: NESTA.
ONSAGER (K.), ASLESEN (H.), GUNDERSEN (F.), ISAKSEN (A.) and LANGELAND (O.) (2010); City regions, advantages and innovation, Oslo: Norwegian Institute for Urban and Regional Research.
POON (J.) and LAI (C.) (2008); Why are Non-profit Performing Arts Organisations Successful in Mid-sized US Cities? ‘Urban Studies’, 45(11), 2273-2289.
POLICY & ECONOMIC DEVELOPMENT CARDIFF COUNCIL (2006); Cardiff’s creative industries sector, Cardiff.
POTTS (J.) and CUNNINGHAM (S.) (2008); Four models of the creative industries, ‘International Journal of Cultural Policy’, 14(3), 233-247.
REEVES (M.) (2002); Measuring the economic and social impact of the arts: a review, UK: Arts Council of England.
REID (B.), ALBERT (A.) and HOPKINS (L.) (2010); A Creative Block? The Future of the UK Creative Industries, ‘A Knowledge Economy & Creative Industries report’, London: Work Foundation.
RUTTEN (P.) (2006); Culture & Urban Regeneration. Cultural Activities & Creative Industries. A Driving Force for Urban Regeneration. Finding & conclusions on the economic perspective.
SACCO (P.) (2011); Culture 3.0: A new perspective for the EU 2014-2020 structural funds programming, Produced for the OMC Working Group on Cultural and Creative Industries, April 2011.
SCOTT (A.) (2001); Capitalism, Cities, and the Production of Symbolic Forms, ‘Transactions of the Institute of British Geographers’, New Series, Vol. 26, 1, pp. 11-23.
STAM (E.), DE JONG (J.) and MARLET (G.) (2008); Creative industries in the Netherlands: structure, development, innovativeness and effects on urban growth, ‘Geografiska Annaler: Series B, Human Geography’, 90 (2), 119-132.
Staying ahead: the economic performance of the UK’s creative industries (2007). [http://www.theworkfoundation.com/assets/docs/publications/176_stayingahead.pdf]
THROSBY (D.) (2001); Economics and Culture, UK: Cambridge University Press.
THROSBY (D.) (2008); The concentric circles model of the cultural industries, ‘Cultural Trends’, 17(3), 147-164.
UNITED NATIONS (2008); The Challenge of Assessing the Creative Economy: towards Informed Policy-making, ‘The Creative Economy Report’. [http://www.unctad.org/en/docs/ditc20082cer_en.pdf].
UNITED NATIONS (2010); Creative Economy: A Feasible Development Option, ‘The Creative Economy Report’.[http://www.unctad.org/en/docs/ditctab20103_en.pdf].

ESSnet‐CultureFinalReport
- 473-
WEDEMEIER (J.) (2010); The Impact of the Creative Sector on Growth in German Regions, ‘European Planning Studies’, 18 (4), 505-520
WÖLFL (A.) (1998); Spillover Effects – an Incentive to Cooperate in R&D? ‘Discussion Papers’, No 79, Halle Institute for Economic Research.
Specific bibliography: Nowodays cultural participation BOCOCK (R.) (1993); Consumption, London: Routledge.
BOURDIEU (P.) (1984); Distinction - A social critique of the judgement of taste, London: Routledge.
CAMPBELL (C.) (1987); The romantic ethic and the spirit of consumerism, Oxford: Blackwell.
CASTELLS (M.) (1996); The information age. Economy, society and culture, part 1. The rise of the network society. Oxford: Blackwell.
CASTELLS, FERNANDEZ-ARDEVOL (M.), LINCHUAN QIU (J.) and SEY (A.) (2007); Mobile Communication and Society: A Global Perspective, Cambridge: MIT Press.
DE HAAN (J.) and ADOLFSEN (A.) (2008). De virtuele cultuurbezoeker; publieke belangstelling voor cultuur websites. Den Haag: SCP.
DE HAAN (J.) and PIJPERS (R.) (2010); Contact! Children and new media, Houten: Bohn Stafleu van Loghum.
DIALOGIC (2002); Breedband en de gebruiker 2001, Utrecht: Dialogic.
DUYVENDAK (J.) and HURENKAMP (M.) (2004); Kiezen voor de kudde. Lichte gemeenschappen en de nieuwe meerderheid, Amsterdam: Van Gennip.
ELCHARDUS (M.) (2002). Op in rook? In: M. Elchardus and I. Glorieux (eds.). De symbolische samenleving. Een exploratie van nieuwe sociale en culturele ruimtes (7-30). Tielt: Lannoo.
EUROPEAN COMMISSION (2002); The digicult report. Technological landscapes for tomorrow’s cultural economy. Unlocking the value of cultural heritage, Luxembourg: Office for Official Publications of the European Communities.
HUYSMANS (F.) and DE HAAN (J.) (2010); Alle kanalen staan open. De digitalisering van mediagebruik, Den Haag: SCP.
IFPI (2007); Digital Music Report 2007.[http://www.ag-rapportenservice.nl/digital-music-report-2007.5681.lynkx?RapportPointer=9-18227-18229-100270].
JENKINS (H.) (2006); Convergence culture. Where old and new media collide, New York/ London: New York University Press.
PETERSON (R.) (1992); Understanding audience segmentation: From elite and mass to omnivore and univore, In: Poetics, vol. 21, nr. 4, p. 243-258.
PETERSON (R.) and ROSSMAN (G.) (2007); Changing Arts Audiences: Capitalizing on Omnivorousness, In: B. Ivey and S. Tepper (eds.). Engaging Art, the next great transformation of American cultural life, New York: Routledge.
ROGERS, E. (2003); Diffusion of innovations (fifth ed.), New York: Free Press.
SCHNABEL (P.) (2000); Een sociale en culturele verkenning voor de lange termijn. In: P.

ESSnet‐CultureFinalReport
- 474-
SCHNABEL and DON (H.) (eds.). Trends, dilemma’s en beleid. Essays over ontwikkelingen op langere termijn (11-27), Den Haag: SCP/CPB.
UNESCO (2005); Towards knowledge societies, Paris: Unesco.
VAN DEN BROEK (A.) (2006); Comparing Cultural Practices: Content and Context of Cultural Activities of Ethnic Groups in the Netherlands. Paper presented at 2006 Conference of the ESA Research Network for the Sociology of Culture, Changing Cultures: European Perspectives, November 15-17 2006, Gent.
VAN DEN BROEK (A.) (2010a); FAQs over kunstbeoefening in de vrije tijd, Den Haag: SCP.
VAN DEN BROEK (A.) (2010b); Toekomstverkenning kunstbeoefening in de vrije tijd, Den Haag: SCP.
VAN INGEN (E.), DE HAAN (J.) and DUIMEL (M.) (2007); Achterstand en afstand; digitale vaardigheden van ouderen, laagopgeleiden, inactieven en allochtonen, Den Haag: SCP.
WEBSTER (F.) (2002); Theories of the information society (second edition), London/New York: Routledge.
ZEEGERS (W.) (1998); Op zoek naar een kanjer. Contactadvertenties in Nederland, Amsterdam: Bert Bakker.
Specific bibliography: Measuring social and cultural participation in European surveys
CLEMENCEAU (A.), MUSEUX (J.M.) and BAUER (M.) (2006); EU-SILC (Community
statistics on income and living conditions) Issues and Challenges. Presentation at the Eurostat and Statistics Finland International Conference on Comparative EU Statistics on Income and Living Conditions: Issues and Challenges, November 6-8, Helsinki, Finland.
DILLMAN (D.) and CHRISTIAN (L.) (2005); Survey Mode as a Source of Instability in Responses across Surveys, Field Methods, (17) 1, p. 30-52.
EUROSTAT (2009); Income, Social Inclusion and Living Conditions (EU-SILC). [http://epp/eurostat.ec.europa.eu/portal/page/portal/living_conditions_and_social_protection/introduction/income_social_inclusion_living_conditions].
LINSSEN (R.) and SCHMEETS (H.) (2010); Participatie en vertrouwen in Europa. In: Schmeets (H.) (red.) Sociale Samenhang: Participatie, Vertrouwen en Integratie, Den Haag/Heerlen: CBS, 129-145.
SCHMEETS (J.) (2008); Social cohesion: an integrated empirical approach, Paper presented at the International Conference On Theoretical Perspectives On Social Cohesion and Social Capital, Brussels, 15 May 2008 (revised version submitted to be published in proceedings of the Conference).
STOOP (I.) (2009); Beyond Silos: Social Policy, Official Statistics, and Social Science. Den Haag: SCP. Paper presented at the DGINS 2009, Malta.
SCHMEETS (J.) and HUYNEN (B.) (2010); Social and cultural participation in EU-SILC and the problem of out harmonization, Paper presented at the Q010 conference, May, 5, Helsinki, Finland.

ESSnet‐CultureFinalReport
- 475-
SCHMEETS (H.) (2010); Increasing response rates and its consequences for the Dutch parliamentary Election Study, Field Methods, 22(4), 391-412.
VERMA (V.) (2006); Issues in data quality and comparability in EU-SILC. In: Comparative EU statistics on income and living conditions: issues and challenges, Proceedings of the EU-SILC Conference, November 2006. Helsinki, Finland.


ESSnet‐CultureFinalReport
- 477-
89B
Country Politic system Central ministry with cultural competence
Local level of government with cultural competence
Main organisation in charge of the cultural statstistics
Other organisation in charge of the cultural statistics/study of the cultural field
Austria Federal system (decentralised politic system)
State Secretary for Arts and Media Bundesländer Statistics Austria
-
Belgium Federal system (decentralised politic system,)
No central ministry, decentralization of cultural competences at the Communities
Flemish, French and German Communities
Studiedienst van de Vlaamse Regering (SVR- Flemish Community) Service de la recherche du Ministère de la Communauté française Wallonie-Bruxelles (French community) Infocenter der DG-Deutschprachige Gemeinschaft (German community)
Direction Générale Statistique Information Economique (DGSIE)
Bulgaria Centralised system (Moving towards decentralisation)
Ministry of Culture Councils on culture (municipal level)
National Statistical Institute of Bulgaria -
Cyprus Centralised system Ministry of Education and Culture
Municipalities (festivals, libraries) Statistical Service of Cyprus
-
Czech Republic Centralised system Ministry of Culture Municipalities Czech Statistical Office (CZSO)
National Information and Consulting Centre for Culture (NIPOS)
Denmark Centralised system Ministry of Culture Municipalities County Councils
Danish Agency for Libraries and Media (agency under the Ministry of Culture)
Statistics Denmark
Germany Federal system (decentralised politic system, )
No ministry, full decentralisation in Länder
Länder
Federal Statistical Office (Destatis) & Statistical Office of the State of Hesse (Hessisches Statistisches Landesamt representing the statistical offices of the Länder)
Statistical Offices of the Länder
Estonia Centralised system Ministry of Culture Municipalities Statistics Estonia -
Greece Centralised system Ministry of Culture Local government National Statistical Service of Greece (ESYE)
An
nex 4: O
rganisation
of the p
ub
lic adm
inistration
respon
sible for
cultu
re and
of the d
evelopm
ent of th
e cultu
ral statistics

ESSnet‐CultureFinalReport
- 478-
Spain Decentralised system
Ministry of Culture and Education
Autonomous communities (CCAA) and municiplaities
Cultural statistics division of the ministry of Culture
National Statistics Institute (INE)
Finland Bi-polar centralised system : State + municipalities
Ministry of Education and Culture
Municipalities Statistics Finland -
France
Centralised system (Moving towards decentralisation: administrative regions and departments)
Ministry of Culture and Communication
Regions, Departments and Communes (municipalities)
Department for studies, strategics forsight and statistics of the Ministry of Culture and Communication (DEPS), ministerial statistics service.
National Insitute of Statistics and Economic Studies (INSEE)
Italy Centralised system (with developing a federal approach)
Ministry of Heritage and Cultural activities
Regions, Provinces and Municipalities National Institute of Statistics (ISTAT)
-
Iceland Centralised system Ministry of Education, Science and Culture
Municipalities Statistics Iceland -
Latvia Centralised system (with tendance to decentralisation)
Ministry of Culture Counties and Municipalities Ministry of Culture Central Statistical Bureau of Latvia (CSB)
Lithuania Centralised system Ministry of Culture Counties and Municipalities Statistics Lithuania -
Luxembourg Centralised system Ministry of Culture Communes (municipalities)Cultural statistics and accounting department of the Ministry of Culture (CoStac), ministerial statistics service.
National Insitute of Statistics and Economic Studies (STATEC)
Hungary Decentralised system
Ministry of Education and Culture
Local authorities Ministry of Education and Culture Hugarian Central Statistical Office (Common responsibility)
-
Malta Decentralised system
Ministry of Education, Culture, Youth and Sport
Local authorities National Statistical Office (NSO) -
Norway Centralised system Ministry of Culture Local authorities Statistics Norways -
Netherlands Centralised system Ministry of Education, Culture and Science
Provinces and Municipalities
Ministry of Education, Culture and Science Statistics netherlands (CBS) (Common responsibility)
-

ESSnet‐CultureFinalReport
- 479-
Poland Decentralised system
Ministry of Culture and National Heritage
Régions, Provinces and Municipalities
Central Stastisical Office -
Portugal Centralised system Ministry of Culture Municipalities Statistics Portugal (INE) -
Romania Centralised system Ministry of Culture and National Heritage Municipalities
Ministry of Culture and National Heritage National Institute of Statistics (Common responsibility)
-
Slovenia Centralised system Ministry of Culture Municipalities Statistical Office of the Republic of Slovenia
-
Slovekia Centralised system Ministry of Culture - Ministry of the Culture Statistical Office of the Slovak Republic
Sweden Centralised system Ministry of Education, Research and Culture
Regions Swedish Art Council (Government authority)
-
United Kingdom Centralised system Department for Culture, Media and Sport
Local authorities Department for Culture, Media and Sport (DCMS)- (Government authority)
-
Switzerland Confederation (decentralised politic system,)
Federal Office of Culture Cantons and Communes Federal Statistical Office (OFS)
-
Turkey Centralised system Ministry of Culture and Tourism - Turkish Statisticak Institute (TurKstat) -
Source: ESSnet-Culture & European parlement (ESSnet-Culture process)


ESSnet‐CultureFinalReport
- 481-
Annex 5: National website's references for culture statistics
Country National website Direct link
Austria http://www.statistik.at http://www.statistik.at/web_en/statistics/education_culture/culture/index.html
Belgium Federal level: Flemish Community: French Community: German-speaking Community:
http://statbel.fgov.be
http://www4.vlaanderen.be
http://www.opc.cfwb.be
http://www.dgstat.be
http://www4.vlaanderen.be/dar/svr/Cijfers/Pages/Excel.aspx
http://www.opc.cfwb.be/index.php?id=3581
http://www.dgstat.be/desktopdefault.aspx/tabid-2360//5057_read-33849/
Bulgaria http://www.nsi.bg http://www.nsi.bg/otrasalen.php?otr=34
Cyprus http://www.mof.gov.cy http://www.mof.gov.cy/mof/cystat/statistics.nsf
Czech Republic
http://www.czso.cz http://www.nipos-mk.cz
http://www.czso.cz/eng/redakce.nsf/i/culture_lide http://www.nipos-mk.cz/?cat=54
Estonia http://www.stat.ee http://www.stat.ee/culture
Finland http://www.tilastokeskus.fi http://www.tilastokeskus.fi/til/klt_en.html
France http://www.statistique-publique.fr http://www.statistique-publique.fr/index.php?php_action=DOMAINES_selectDomaine&idDomaine=2
Germany https://www.destatis.de https://www.destatis.de/DE/ZahlenFakten/GesellschaftStaat/BildungForschungKultur/Kultur/Kultur.html
Greece http://www.statistics.gr http://www.statistics.gr/portal/page/portal/ESYE/PAGE-themes?p_param=A1802
Hungary http://portal.ksh.hu http://portal.ksh.hu/culture_sport
Iceland http://www.statice.is http://www.statice.is/Statistics/Culture
Italy http://www.istat.it http://culturaincifre.istat.it
Latvia http://www.csb.gov.lv http://www.csb.gov.lv/en/statistikas-temas/culture-key-indicators-30642.html
Luxembourg http://www.mc.public.lu
Malta http://www.nso.gov.mt

ESSnet‐CultureFinalReport
- 482-
Norway http://www.ssb.no http://www.ssb.no/english/subjects/07/media_en
Poland http://www.stat.gov.pl http://www.stat.gov.pl/gus/8790_ENG_HTML.htm
Portugal http://www.ine.pt
http://www.ine.pt/xportal/xmain?xpid=INE&xpgid=ine_pesquisa&frm_accao=PESQUISAR&frm_show_page_num=1&frm_modo_pesquisa=PESQUISA_SIMPLES&frm_modo_texto=MODO_TEXTO_ALL&frm_texto=culture&frm_imgPesquisar=++&xlang=en
Romania
http://www.culturadata.ro http://www.insse.ro
http://www.culturadata.ro/en/index.php?option=com_content&view=article&id=172:completed-research&catid=52:english http://www.insse.ro/cms/rw/pages/chest_cultura.ro.do
Slovakia http://www.culture.gov.sk http://www.culture.gov.sk/ministerstvo/infoteka/statistika-kultury
Slovania http://www.stat.si http://www.stat.si/eng/tema_demografsko_kultura.asp
Spain http://www.mcu.es http://www.mcu.es/estadisticas/index.html
Sweeden http://www.scb.se http://www.scb.se/Pages/SubjectArea____10149.aspx
Switzerland http://www.bfs.admin.ch http://www.bfs.admin.ch/bfs/portal/fr/index/themen/16.html
Turkey http://www.turkstat.gov.tr http://www.turkstat.gov.tr/PreTablo.do?tb_id=15&ust_id=5
United-Kingdom http://www.ons.gov.uk
Source: ESSnet-Culture

ESSnet‐CultureFinalReport
- 483-
90B (Overview achieved on July 2010)
199B1. Historical monuments and Archaeological sites
Country Level
Name of the administrative or statistical national survey/data collection
Organisation in charge Periodicity Last year of data
available
Name of the last publication of data available on this domain (paper or Internet)
AT Statistics on protected historic monuments Federal Office for the Care of Monuments Yearly 2008 http://www.statistik.at/web_de/statistiken/bildung_und_kultur/kultur/baukulturelles_erbe/index.html
BE Fed - - - - -
BE C.Fl SCV-survey, participation data for the Flemish community
Centre de recherche du Gouvernement flamand (SVR-Studiedienst van de Vlaamse Regering)
Yearly 2009 VRIND 2009, http://www4.vlaanderen.be/dar/svr/Cijfers/Pages/Excel.aspx
BE C.Wa Collecte de données liées aux fréquentations
Commissariat général du Tourisme de la Région wallonne
Monthly 2009 …
BG - - - - -
CY Services Survey Statistical Service of Cyprus Yearly 2007 Economic statistics on other social and personal service activities
CZ Survey on historical monuments (except the archaeological sites)
NICCC Yearly 2008 http://www.nipos-mk.cz/?cat=126
DK - - - - -
EE Data of National Heritage Board National Heritage Board - 2009 http://www.muinas.ee/413
FI ? National Board of Antiquities Yearly 2010 Alueiden kulttuurit [Culture in the regions] 2009. Helsinki: Statistics Finland, http://www.stat.fi
FR
Base des monuments protégés (base Mérimée) et Base administrative des monuments nationaux
-Ministère de la culture et de la communication (MCC) -Centre des monuments nationaux (CMN)
Yearly 2008
Chiffres clés 2009 : rubrique Patrimoine et architecture (parution année chaque AAAA début T2) (version papier ou téléchargement pdf par thème : http://www.culture.gouv.fr/nav/index-stat.html)
Sites archéologiques: Base administrative “application Patriarche”
MCC Yearly 2007 Chiffres clés 2009 : rubrique Archéologie
DE - - - - -
GR ? General Secretariat of the National Statistical Service of Greece (ESYE)
Monthly 2009
Statistical database) Dataset selection) Culture-leisure) Archaelogical sites - admissions and receipts http://www.statistics.gr/portal/page/portal/ESYE/PAGE-database
An
nex 6: O
verview of n
ational su
rveys

ESSnet‐CultureFinalReport
- 484-
HU - - - - -
IS - - - - -
IT “Visitatori e introiti di Musei, Monumenti e Aree Archeologiche Statali”
Ministry of Heritage and Cultural Activities (State owned monuments)
Yearly 2008 http://www.sistan.beniculturali.it/Rilevazioni.htm
LU Enquête sur le patrmoine fortifié Ministry of Culture (CoStac) Yearly 2009 http://www.mc.public.lu
LV Statistics on historical monuments and archaeological sites
State Inspection for Heritage Protection Constantly
updated 2008
Statistics of historical monuments : http://www.mantojums.lv/?cat=592&lang=lv (in Latvian) The Annual Report of the State Inspection for Heritage Protection http://www.mantojums.lv/_rict_text/docs/Parskats_2008.doc (in Latvian)
MT Museums and Historical Sites questionnaire
NSO Biannal 2007 News Release – Museums and Historical Sites 2006-2007 http://www.nso.gov.mt/statdoc/document_file.aspx?id=2366
NO Statistical exploitation of the administrative database of heritage
The Directorate of Cultural Heritage Database
Yearly 2008 Culture statistics 2008 (Paper and internet http://www.ssb.no/english/subjects/07/nos_cultural
PL Statutory activity National Heritage Board of Poland Continuously 2009 Data available at: http://www.kobidz.pl/idm,45.html
PT Administrative data IGESPAR - Instituto de Gestão do Património Arquitectónico e Arqueológico
Yearly 2008 - Culture Statistics 2008 (paper and Internet http://Hwww.ine.pt) - (data frames on cultural statistics accessible via Internet)
RO
The List of Historical Monumen National Institute for Patrimony http://www.inp.ro
The List of Historical Monuments http://www.cultura.ro/Documents.aspx?ID=89
Determining a target audience regarding national cultural heritage
Center for Research and Consultancy on Culture
2007
200BThe target audience for an advertising campaign backed by the Ministry of Culture and National Heritage, http://www.culturadata.ro/Cercetari%20finalizateEN.html
Data on Cultural and Touristic Potential of Romanian Settlements: historical monuments
Data on Cultural and Touristic Potential of Romanian Settlements, http://www.culturadata.ro/Cercetari%20finalizateEN.html
Number of archaeological sites in the National Archaeological Record
CIMEC-Institute for Cultural Memory http://www.cimec.ro
201BRAN Database online http://www.cimec.ro
SK KULT (MKSR) 1-01 MK SR Yearly 2008 Cultural Statistics 2008 (http://www.culture.gov.sk)
SI - - - - -

ESSnet‐CultureFinalReport
- 485-
ES
Statistical exploitation of the administrative database of heritage
Ministry of Culture of Spain Yearly 2008
-Yearbook on Cultural Statistics 2009 (paper and Internet http://www.mcu.es) -CULTURAbase (database on cultural statistics accessible via Internet http://www.mcu.es/culturabase/cgi/um?L=0
Survey on cultural habits and practices in Spain
Ministry of Culture of Spain
Every four years
2006-2007
-Survey on Cultural habits and Practices in Spain 2006-2007 (paper and Internet http://www.mcu.es) -Yearbook on Cultural Statistics 2009 (paper and Internet http://www.mcu.es) -CULTURAbase (database on cultural statistics accessible via Internet http://www.mcu.es/culturabase/cgi/um?L=0)
SE
A lot of data is collected and electronic retrievable from the web page of the National Heritage Board Hhttp://www.raa.se/cms/extern/informationstorg/sokhjalpmedel_riksantikvarieambetets_digitala_kallor.html But there has not been any publication (print or digital) since 1996
- - - -
CH - - - - -
TR Administrative record of General Directorate of Cultural Heritage and Museums.
Turkish Statistical Institute Yearly 2008 Cultural Statistics, 2008

ESSnet‐CultureFinalReport
- 486-
2. Museums
Country Level
Name of the administrative or statistical national survey/data collection
Organisation in charge Periodicity Last year of data
available
Name of the last publication of data available on this domain (paper or Internet)
AT Statistics on museums and exhibitions Statistics Austria Yearly 2007 http://www.statistik.at/web_de/statistiken/bildung_und_kultur/kultur/museen_und_ausstellungen/index.html
BE Fed bEGMUS (European Group on Museum Statistics – EGMUS en Belgique)
Service d’information scientifique et technique (SIST)
Biannual 2006 http://digipat.stis.fgov.be/digipat.asp?id=40;20&lang=FR
BE C.Fl SCV-survey, participation data for the Flemish community
Centre de recherche du Gouvernement flamand (SVR-Studiedienst van de Vlaamse Regering)
Yearly 2009 VRIND 2009, http://www4.vlaanderen.be/dar/svr/Cijfers/Pages/Excel.aspx
BE C.Wa
Enquête portent sur quatre aspects : organisation générale, offre culturelle, estimation du nombre des visiteurs et flux financiers (assez rudimentaire pour ce 4e aspect)
Réseau européen EGMUS, relayé en Belgique par un groupe coordonné par le Service d’Information Scientifique et Technique (SIST, fédéral).
Biannual 2006 « Statistiques des musées belges » http://www.stis.fgov.be/stis.asp
BG Survey on the activities of Museums National Statistical Institute Yearly
Annual data are available for 2008.
Data are published on Internet page http://www.nsi.bg/otrasal.php?otr=24
CY Services Survey Statistical Service of Cyprus Yearly 2007 Economic statistics on other social and personal service activities
CZ Survey on museum NICCC Yearly 2008 http://www.nipos-mk.cz/?cat=126
DK Museumsstatistikken (Statistics on museums)
Statistics Denmark Yearly 2008 1. Nyt fra Danmarks Statistk (i.e News from Statistics Denmark) 2.Statistik Efterretning 3. One table in the statbank (also in english)
EE Museum survey Statistics Estonia Yearly 2008 http://pub.stat.ee/px-web.2001/I_Databas/Social_Life/01Culture/12Museums/12Museums.asp
FI Museum Statistics National Board of Antiquities Yearly 2008 Finnish Museum Statistics 2008. Helsinki: National Board of Antiquities. http://www.museotilasto.fi
FR Enquête Muséostat : dispositif sur la fréquentation
MCC Yearly 2007 Chiffres clés 2009 : rubrique Musées
DE Museumsstatistik Institut für Museumsforschung, Berlin Yearly 2008 Statistische Gesamterhebung an den Museen der Bundesrepublik Deutschland http://www.smb.spk-berlin.de/ifm

ESSnet‐CultureFinalReport
- 487-
GR ? General Secretariat of the National Statistical Service of Greece (ESYE)
Monthly 2009
Statistical database) Dataset selection) Culture-leisure) Museums - admissions and receipts http://www.statistics.gr/portal/page/portal/ESYE/PAGE-database
HU Museums', show places' and other collections' data Survey from the exhibitions
Ministry of Educational and Culture Yearly 2008
Hungarian Statistical Yearbook (paper+cd) Stadat statistical databases http://portal.ksh.hu/portal/page?_pageid=38,593328&_dad=portal&_schema=PORTAL MEC database
IS Survey on museums and related activities Statistics Iceland Yearly ? Data on Web, http://www.statice.is
IT “Visitatori e introiti di Musei, Monumenti e Aree Archeologiche Statali”
Ministry of Heritage and Cultural Activities (State owned museums)
Yearly 2008 http://www.sistan.beniculturali.it/Rilevazioni.htm
LU Enquête nationale sur les musées Ministry of Culture (CoStac) Yearly 2009 http://www.mc.public.lu
LV Pārskats par muzeju darbību, 1-muzejs As from the middle of 2010: Cultural Digital Map of Latvia
Central Statistical Bureau of Latvia, Ministry of Culture of Latvia
Yearly 2008 http://www.csb.gov.lv
MT Museums and Historical Sites questionnaire
NSO Biannual 2007 News Release – Museums and Historical Sites 2006-2007 http://www.nso.gov.mt/statdoc/document_file.aspx?id=2366
NO
Statistics on museums and museums collections
The Norwegian Archive, Library and Museums Authorit
Yearly 2008
Culture statistics 2008(Paper and internett http://www.ssb.no/english/subjects/07/nos_cultural/ and the Norwegian Archive, Library and Museums Authority (http://www.abm-utvikling.no)
Survey on cultural habits and practices in Norway
Statistics Norway
Every four years
2008
Norwegian culture barometer 2008 (paper and Internet http://www.ssb.no/kulturbar_en/) Publication in Norwegian only. Culture statistics 2008 (Paper and internet http://www.ssb.no/english/subjects/07/
PL K-02 Museums Central Statistical Office, Statistical Office in Cracow
Yearly 2008 Data available in the Regional Data Bank at: http://www.stat.gov.pl/gus/index_ENG_HTML.htm
PT Survey to museums National Statistics Institute Yearly 2008 - Culture Statistics 2008 (paper and Internet http://www.ine.pt) - Portugal in figures 2007 (paper and Internet http://www.ine.pt)
RO
1. The activity of museums and public collections in year…… 2.1 Study on the state of the Romanian museums 2.2. Comparative Statistics on the Cultural Sector in Romania and other European Countries Museums and visitors 2.3. The evolution of the cultural sector in Romania: museums
1. National Institute of Statistics 2. Centre for Research and Consultancy on
Culture, Hhttp://www.culturadata.ro
1. Yearly
2. Yearly
1. 2008
2.1. 2007
2.2. 2007
2.3. 2005
1. The activity of cultural- artistic units – paper Romanian Statistical Yearbook
2.1. Study on the state of the Romanian museums- paper Cultural
Sector in Romania: Infrastructure. Resources. Consumption. 2.2. Comparative Statistics on the Cultural Sector in Romania and
other European Countries-paper Cultural Sector in Romania: Infrastructure. Resources. Consumption.
2.3. The evolution of the cultural filed in Romania (1995-2005)-paper Cultural Sector in Romania: Infrastructure. Resources.

ESSnet‐CultureFinalReport
- 488-
2.4. The Regional Indexes of the Cultural Sector: museums and visitors -Number of museums and collections in Romania -Museums and Collections from Romania
Institute for Cultural Memory Institute for Cultural Memory Hhtpp://www.cimec.roH
2.4. 2007
2010
2009
Consumption. 2.4. The Regional Indexes of the Cultural Sector-paper Cultural
Sector in Romania: Infrastructure. Resources. Consumption. http://ghidulmuzeelor.cimec.ro Database on Museums and Collections from Romania: http://ghidulmuzeelor.cimec.ro/
SK KULT (MKSR) 9-01 MK SR Yearly 2008 Cultural Statistics 2008 (http://www.culture.gov.sk)
SI Activity of museums and galleries or exhibition grounds
Statistical Office of the Republic of Slovenia Yearly 2008 Activity of museums and galleries or exhibition grounds, Slovenia, 2008
ES
Statistic on museums and museums collections Survey on cultural habits and practices in Spain
Ministry of Culture of Spain Ministry of Culture of Spain
Biannual
Every four years
2008
2006-2007
-Yearbook on Cultural Statistics 2009 (paper and Internet http://www.mcu.es) -CULTURAbase (database on cultural statistics accessible via Internet http://www.mcu.es/culturabase/cgi/um?L=0) -Survey on Cultural habits and Practices in Spain 2006-2007 (paper and Internet http://www.mcu.es) -Yearbook on Cultural Statistics 2009 (paper and Internet http://www.mcu.es) -CULTURAbase (database on cultural statistics accessible via Internet http://www.mcu.es/culturabase/cgi/um?L=0H)
SE Museer och konsthallar Arts Council Yearly 2008 Museer och konsthallar 2008 – Museums and Art Galleries 2008 http://www.kulturradet.se/Documents/Bilder/press/museer_konsthallar_2008_final.pdf
CH Statistique de fréquentation des musées Association des musées suisses Yearly 2008 http://www.museums.ch/
TR Administrative record of General Directorate of Cultural Heritage and Museums.
Turkish Statistical Institute Yearly 2008 Cultural Statistics, 2008

ESSnet‐CultureFinalReport
- 489-
3. Archives
Country Level
Name of the administrative or statistical national survey/data collection
Organisation in charge Periodicity Last year of data
available
Name of the last publication of data available on this domain (paper or Internet)
AT Statistics on archives Statistics Austria annual 2007 http://www.statistik.at/web_de/statistiken/bildung_und_kultur/kultur/archive/index.html
BE Fed Archives de l’Etat en Belgique Service public fédéral de Programmation Politique scientifique (SPP).
2009 http://digipat.stis.fgov.be/digipat.asp?id=10;20&lang=FR
BE C.Fl - - - - -
BE C.Wa - - - - -
BG - - - - -
CY Services Survey Statistical Service of Cyprus Annual 2007 Economic statistics on other social and personal service activities
CZ - - - - -
DK - - - - -
EE data of The National Archives of Estonia The National Archives of Estonia http://www.ra.ee
FI National Archives Yearly 2008 Arkistolaitos 2008. Helsinki: National Archives
FR Source administrative MCC Annuelle 2006 Chiffres clés 2009 : rubrique Archives
DE Archivstatistik Bundesarchiv, Koblenz Yearly 2008 Sonderauswertung für das Statistische Jahrbuch, Destatis
GR - - - - -
HU Survey on the archives Ministry of Educational and Culture annual 2008
Hungarian Statistical Yearbook (paper+cd) Stadat statistical databases http://portal.ksh.hu/portal/page?_pageid=38,593328&_dad=portal&_schema=PORTAL MEC database
IS - - - - -
IT “Archivi di Stato” Ministry of Heritage and Cultural Activities (State owned archives)
Annual 2008 http://www.sistan.beniculturali.it/Rilevazioni.htm
LU Enquête nationale sur les archives publiques
Ministry of Culture Biannual 2007 http://www.mc.public.lu

ESSnet‐CultureFinalReport
- 490-
LV Administrative data Directorate General of Latvia State Archives 1 year 2008
Annual statistics 2008: http://www.arhivi.lv/index.php?&25 (in Latvian) The Annual Report of the State Archival Institutions 2008 (in Latvian)
MT - - - - -
NO Archive Statistics The Norwegian Archive, Library and Museums Authority
Annual
2008 The Norwegian Archive, Library and Museums Authority http://www.abm-utvikling.no
PL Statutory activity The Head Office for the State Archives Continuously Databases available at: http://www.archiwa.gov.pl/lang-pl/bazy-danych.html
PT - - - - -
RO
- The archival treatment of fonds and collections in the year - Archival Publications - Exhibitions - Number of files studied in the lecture room
National Archives of Romania Hhttp://www.arhivelenationale.roH
Yearly 2008 2007
The National Archives’ Yearly Report
SK - - - - -
SI Ministry of Culture annual 2008 Statistical Yearbook 2009 (Republic of Slovenia)
ES
Archive Statistic Survey on cultural habits and practices in Spain
Ministry of Culture of Spain Ministry of Culture of Spain
Annual
Every four years
2008
2006-2007
-Yearbook on Cultural Statistics 2009 (paper and Internet http://www.mcu.es) -CULTURAbase (database on cultural statistics accessible via Internet http://www.mcu.es/culturabase/cgi/um?L=0) -Survey on Cultural habits and Practices in Spain 2006-2007 (paper and Internet http://www.mcu.es) -Yearbook on Cultural Statistics 2009 (paper and Internet H http://www.mcu.es) -CULTURAbase (database on cultural statistics accessible via Internet http://www.mcu.es/culturabase/cgi/um?L=0)
SE
Data on archive matters are published in the annual reports from the National Archives of Sweden, but there are no statistical publication dedicated to archives
- - - -
CH - - - - -
TR Administrative record of General Directorate of State
Turkish Statistical Institute Annualy 2008 Cultural Statistics, 2008

ESSnet‐CultureFinalReport
- 491-
4. Libraries
Country Level
Name of the administrative or statistical national survey/data collection
Organisation in charge Periodicity Last year of data
available
Name of the last publication of data available on this domain (paper or Internet)
AT Statistics on libraries Statistics Austria; Austrian Library Association
Yearly 2007 http://www.statistik.at/web_de/statistiken/bildung_und_kultur/kultur/bibliotheken/index.html
BE Fed - - - - -
BE C.Fl
1) SCV-survey, participation data for the Flemish community 2) Bios 2, administrative registration data about the supply and users
1) Centre de recherche du Gouvernement flamand (SVR-Studiedienst van de Vlaamse Regering) 2) Departement of Culture, Youth, Sports and Media
Yearly 1) 2009 2) 2007
1) VRIND 2009, http://www4.vlaanderen.be/dar/svr/Cijfers/Pages/Excel.aspx
2) http:// Hwww.bibliotheekstatistieken.be
BE C.Wa Les bibliothèques publiques en Communauté française de Belgique, en chiffres
Service de la Lecture publique du Ministère de la Communauté française
Non précisée
2008 http://www.bibliotheques.be/fr/enchiffres/
BG Survey on the activities of Libraries with collection above 200 000
National Statistical Institute Yearly Annual data are available for 2008
Data are published on Internet page http://www.nsi.bg/otrasal.php?otr=24
CY Services Survey Statistical Service of Cyprus Yearly 2007 Economic statistics on other social and personal service activities
CZ Survey on library NICC Yearly 2008 http://www.nipos-mk.cz/?cat=126H
DK Folke- og Forskningsbiblioteksstatistik (Statistics on Libraries)
Danish Agency for Library and Media Yearly 2008 Folke- og forskningsbiblioteksstatistik 2008 (both paper and Internet)
EE Library survey Statistics Estonia, National Library of Estonia Yearly 2008 http://pub.stat.ee/px-web.2001/I_Databas/Social_Life/01Culture/10Libraries/10Libraries.asp
FI Finnish Public Libraries Statistics Ministry of Education and Culture (public libraries) The National Library of Finland
Yearly 2008 http://tilastot.kirjastot.fi. (public libraries)
FR Enquêtes sur les bibliothèques municipales et départementales
MCC Yearly 2007 Chiffres clés 2009 : rubrique Bibliothèques
DE Bibliotheksstatistik Hochschulbibliotheks-system, Köln Yearly 2008 Bibliotheken – Online-Veröffentlichung Hhttp://www.hbz-nrw.de/angebote/dbs/
GR ? General Secretariat of the National Statistical Service of Greece (ESYE)
Every two Years
2006 Statistical themes) Culture-Entertainment) Entertainment) http://www.statistics.gr/portal/page/portal/ESYE/PAGE-themes?p_param=A1801
HU Survey on the libraries Ministry of Educational and Culture Yearly 2008 Hungarian Statistical Yearbook (paper+cd) http://portal.ksh.hu/portal/page?_pageid=38,593328&_dad=portal&_schema=PORTAL

ESSnet‐CultureFinalReport
- 492-
MEC database
IS
1) Public libraries 2) National library and university libraries
1) National Library of Iceland – University Library 2) Statistics Iceland
1) Yearly
2) Yearly
1) started again in
year 2010 after some
years break
2) 2008
Data on Web, http://www.statice.is
IT “Biblioteche Pubbliche Statali”
Ministry of Heritage and Cultural Activities (State owned libraries)
Yealy 2008 http://www.sistan.beniculturali.it/Rilevazioni.htm
LU Enquête nationale sur les bibliothèques de lecture publique
Ministry of Culture Yearly 2009 http://www.mc.public.lu
LV Pārskats par bibliotēkas darbību 1-bibliotēka
Central Statistical Bureau of Latvia, National Library of Latvia
Yearly 2008 http://www.csb.lv The Performance Results of Latvian Libraries: 2003-2007H (in English)
MT Information collected on libraries, library members, and related material
NSO Yearly 2009 News release on the occasion of World Book and copyright day 23rd April: http://www.nso.gov.mt/statdoc/document_view.aspx?id=2414
NO
1) Libraries Statistic 2) Survey on cultural habits and practices in Norway
1) The Norwegian Archive, Library and Museums Authority 2) Statistics Norway
1) Yealy
2) Every four years
1) 2008
2) 2008
1) Culture statistics 2008 (Paper and internet http://www.ssb.no/english/subjects/07/nos_cultural/) The Norwegian Archive, Library and Museums Authority (http://www.abm-utvikling.no) 2) Norwegian culture barometer 2008 (paper and Internet http://www.ssb.no/kulturbar_en/) Publication in Norwegian only. Culture statistics 2008 (Paper and internet http://www.ssb.no/english/subjects/07/
PL K-03 Public libraries, K-04 Specialist libraries
Central Statistical Office, Statistical Office in Cracow
Once a year or once in
two years
2008 Data available in the Regional Data Bank at: http://www.stat.gov.pl/gus/index_ENG_HTML.htm
PT - - - - -
RO
1. The activity of libraries in the year….. 2.1. Public libraries, books and consumption 2.2. Public libraries 2.3. Public libraries, libraries users 2.4. Public libraries
1. National Institute of Statistics 2. Centre for Research on Culture, http://www.culturadata.ro
1. Yearly 1. 2008
2.1.2007 2.2.2005 2.3. 2007 2.4.2005
1. The activity of cultural- artistic units – paper Romanian Statistical Yearbook 2. 1. Comparative Statistics on the Cultural Sector in Romania and other European Countries 2.2. The evolution of the cultural filed in Romania(1995-2005) 2.3. The Regional Indexes of the Cultural Sector 2.4. The evolution of cultural sector in developing regions (1995-2005) –paper Cultural Sector in Romania: Infrastructure. Resources. Consumption
SK KULT (MKSR) 10-01 MK SR Yearly 2008 Cultural Statistics 2008, http://www.culture.gov.sk

ESSnet‐CultureFinalReport
- 493-
SI National and University Library Yearly 2008 http://bibsist.nuk.uni-lj.si/statistika
ES
1) Libraries Statistic 2) Survey on cultural habits and practices in Spain
1) National Statistics Institute of Spain 2) Ministry of Culture of Spain
1) Biannual
2) Every four years
1) 2008
2) 2006-2007
-INEbase (database of the NSI of Spain accessible via Internet http://www.ine.es) -Yearbook on Cultural Statistics 2009 (paper and Internet http://www.mcu.es) -CULTURAbase (database on cultural statistics accessible via Internet http://www.mcu.es/culturabase/cgi/um?L=0) -Survey on Cultural habits and Practices in Spain 2006-2007 (paper and Internet http://www.mcu.es) -Yearbook on Cultural Statistics 2009 (paper and Internet http://www.mcu.es) -CULTURAbase (database on cultural statistics accessible via Internet http://www.mcu.es/culturabase/cgi/um?L=0)
SE Folkbibliotek Forskningsbibliotek
Arts Council/Royal Library Yearly 2008
Folkbibliotek 2008 – Public Librarues 2008 http://www.kulturradet.se/Documents/publikationer/2009/folkbibliotek/folkbibliotek_2008.pdf Forskningsbiblioteken 2008 – Research Libraries 2008 http://www.scb.se/Pages/PublishingCalendarViewInfo_259923.aspx?PublObjId=11323
CH Statistique suisse des bibliothèques Office fédéral de la statistique Yearly 2008 http://www.bfs.admin.ch/bfs/portal/fr/index/themen/16/02/02/data.html
TR
-Administrative record of : General Directorate of Libraries and Publications. -Ministry of National Education. -Presidency of National Library. -Compiled from faculty and high school libraries, through the rectories of universities.
Turkish Statistical Institute Yearly 2008 Cultural Statistics, 2008

ESSnet‐CultureFinalReport
- 494-
5. Books (edition, sale of books etc.)
Country Level
Name of the administrative or statistical national survey/data collection
Organisation in charge Periodicity Last year of data
available
Name of the last publication of data available on this domain (paper or Internet)
AT Austrian bibliography; Structural business statistics, Short term statistics
Austrian National Library; Statistics Austria
Yearly 2008 http://www.statistik.at/web_de/statistiken/bildung_und_kultur/kultur/buecher_und_presse/index.html
BE Fed Données d’enquête HBS (Household Budget Survey) sur les dépenses
Direction Générale Statistique Information Economique (DGSIE)
Annuelle depuis 1999
2007 http://statbel.preview.pr.belgium.be/fr/statistiques/chiffres/travailvie/revenus/index.jsp
BE C.Fl market research: sales of books TNS-media, Boek.be
Every 2 years
2007
BE C.Wa Le marché du Livre de langue française en Belgique
Service des Lettres et du Livre du Ministère de la Communauté française
En principe
annuel ou biannuel
2007 http://www.lettresetlivres.cfwb.be/fileadmin/sites/sgll/upload/sgll_super_editor/Rapport-Marche-Livre-2007OK.pdf
BG Publishing activities (Survey on books production only - not for sale of books)
National Statistical Institute Yearly
Annual data are available for 2008.
There is publication: Book publishing and press on CD
CY Wholesale and retail trade survey Statistical Service of Cyprus Yearly 2007 Wholesale and retail trade statistics
CZ Survey on periodical publications (no sale)
NICC Yearly 2008
http://www.nipos-mk.cz/?cat=126
DK Bogstatistikken (ie. Book Statistics) DBC Yearly 2008 Bogstatistikken (ie. Book Statistics)
EE Printed matter survey Statistics Estonia, National Library of Estonia Yearly 2008 http://pub.stat.ee/px-web.2001/I_Databas/Social_Life/01Culture/16Printed_matter/16Printed_matter.asp
FI ? The National Library of Finland The Finnish Book Publishers’ Association
Yearly 2008 Finnish Mass Media 2009. Helsinki: Statistics Finland. http://www.sky.fi
FR
Enquête sur la production de livres Enquête sur les entreprises éditeurs de livres
Syndicat national de l’édition Insee
Yearly
Yearly
2007
2007 Chiffres clés 2009 : rubrique Livre
DE Buchproduktion Börsenverein des Deutschen Buchhandels, Frankfurt
Yearly 2008 Buch und Buchhandel in Zahlen http://www.boersenverein.de/de/portal/index.html
GR ? National Book Centre of Greece (EKEBI) Yearly 2008
The Book Market in Greece, 2009 http://www.ekebi.gr/appdata/documents/pdfs/fakelosenglish.pdf Book Publishing in Greece, 2008

ESSnet‐CultureFinalReport
- 495-
http://www.ekebi.gr/appdata/documents/erevnes/TheGreekBookAugust08.doc
HU Survey on the data of the book publishing Hungarian Central Stastical Office
Yearly 2008
Hungarian Statistical Yearbook (paper+cd) Stadat statistical databases http://portal.ksh.hu/portal/page?_pageid=38,593328&_dad=portal&_schema=PORTAL Dissemination database http://statinfo.ksh.hu/Statinfo/themeSelector.jsp?page=2&szst=ZKZ
IS Survey on published books Statistics Iceland Yearly 2007 Data on Web, http://www.statice.is
IT Indagine sulla produzione libraria National Institute of Statistics - ISTAT Yearly 2007 http://www.istat.it/societa/cultura http://culturaincifre.istat.it
LU - - - - -
LV Pārskats par izdevējdarbību Central Statistical Bureau of Latvia, National Library of Latvia
Yearly 2008 http://www.csb.gov.lv http://www.lnb.lv/lv/izdevejiem/izdevejdarbibas-statistika/izdevejdarbiba-2008-gada (in Latvian)
MT
Imports/exports of books and related printed material, private financial expenditure on printed material; reading habits (occassionally in one-off surveys)
NSO Yearly 2009 News release on the occasion of World Book and copyright day 23rd April: http://www.nso.gov.mt/statdoc/document_view.aspx?id=2414
NO
1) Statistic on books from the database Norbok 2) Book Publishing Production Statistic 3) Survey on media habits and practices in Norway
1) The National Library in Norway 2) Norwegian Publishers’ Association 3) Statistics Norway
1)Yearly
2)?
3)?
1) 2008
2) 2008
3) 2008
1) Culture statistics 2008, Paper and internet http://www.ssb.no/english/subjects/07/nos_cultural 2)The yearbook of The Norwegian Publishers Association 3)Norwegian media barometer 2008 (paper and Internet) http://www.ssb.no/medie_en/ Publication in Norwegian only
PL Statutory activity Book Institute Yearly 2007 The Polish Book Market, available at: http://www.instytutksiazki.pl/pl,ik,site,9,13,22054.php
PT Integrated Business Accounts System
National Statistics Institute
Yearly 2007
-Culture Statistics 2008 (paper and Internet http://www.ine.pt) -Enterprises in Portugal (paper and Internet http://www.ine.pt) -Data frames on business statistics accessible via Internet
RO
1) Romanian National Library – Legal Deposit 2) Book industry
1) Romanian National Library – Legal Deposit – for edition, H http://www.bibnat.ro H 2)Centre for Research on Culture, subordinated to Ministry of Culture and National Heritage H http://www.cultura.roH
1) Yearly
2)?
1) 2008
2) 2008
1) The activity of cultural- artistic units – paper Romanian Statistical Yearbook 2) Draft for a policy aimed at stimulating creativity-paper The diagnosis of culture in urban space
SK KULT (MKSR) 4-01 MK SR Yearly 2008 Cultural Statistics 2008, http://www.culture.gov.sk

ESSnet‐CultureFinalReport
- 496-
SI Activity of publishing National and University Library, Statistical Office of the Republic of Slovenia
Yearly 2008 Activity of publishing, Slovenia, 2008
ES
1) Statistic on the spanish edition of ISBN books 2) Book Publishing Production Statistic 3) Survey on cultural habits and practices in Spain
1) Ministry of Culture of Spain 2) National Statistics Institute of Spain 3) Ministry of Culture of Spain
1) Yearly
2) Yearly
3) Every four years
1) 2008
2) 2008
3) 2006-2007
-Yearbook on Cultural Statistics 2009 (paper and Internet http://www.mcu.es) -CULTURAbase (database on cultural statistics accessible via Internet http://www.mcu.es/culturabase/cgi/um?L=0) -INEbase (database of the NSI of Spain accessible via Internet http://www.ine.es) -Yearbook on Cultural Statistics 2009 (paper and Internet http://www.mcu.es) -CULTURAbase (database on cultural statistics accessible via Internet http://www.mcu.es/culturabase/cgi/um?L=0) -Survey on Cultural habits and Practices in Spain 2006-2007 (paper and Internet http://www.mcu.es) -Yearbook on Cultural Statistics 2009 (paper and Internet H http://www.mcu.es) -CULTURAbase (database on cultural statistics accessible via Internet H http://www.mcu.es/culturabase/cgi/um?L=0H)
SE ? (Book production) Royal Library, (edition, sale) Swedish Publisher’s Association
Yearly 2008
Nationalbibliografin 2008 http://www.kb.se/Dokument/Soka/I%20Nationalbibliografin%20redovisad%20utgivning%202008.pdf Branschstatistik 2008 (data from members of Publisher’s Association only) http://forlaggare.se/media/10962/svfs_branschstatistik_2008web.pdf
CH - - - - -
TR Administrative record of General Directorate of Libraries and Publications.
Turkish Statistical Institute Yearly 2008 Cultural Statistics, 2008

ESSnet‐CultureFinalReport
- 497-
6. Newspapers
Country Level
Name of the administrative or statistical national survey/data collection
Organisation in charge Periodicity Last year of data
available
Name of the last publication of data available on this domain (paper or Internet)
AT ‘Press Statistics Magazine’; data on newspapers' circulation
Austrian Newspaper Association; Arbeitsgemeinschaft Media-Analysen
Yearly 2008 http://www.statistik.at/web_de/statistiken/bildung_und_kultur/kultur/buecher_und_presse/index.html
BE Fed Données d’enquête HBS (Household Budget Survey) sur les dépenses
Direction Générale Statistique Information Economique (DGSIE)
Annuelle depuis 1999
2007 http://statbel.preview.pr.belgium.be/fr/statistiques/chiffres/travailvie/revenus/index.jsp
BE C.Fl Market research: sales of books TNS-media, Boek.be
Every 2 years
2007 -
BE C.Wa La presse quotidienne imprimée en Communauté française – données et informations
OPC du Ministère de la Communauté française
? 2010 A paraître dans le courant du 1er trimestre 2010
BG Publishing activities (Survey on Newspapers production only)
National Statistical Institute Exhaustively Annual
Annual data are available for 2008.
There is publication: Book publishing and press on CD
CY Wholesale and retail trade survey Statistical Service of Cyprus Yearly 2007 Wholesale and retail trade statistics
CZ Survey on periodical press NICC Yearly 2008 http://www.nipos-mk.cz/?cat=126
DK - - - - -
EE Printed matter survey Statistics Estonia, National Library of Estonia year 2008 http://pub.stat.ee/px-web.2001/I_Databas/Social_Life/01Culture/16Printed_matter/16Printed_matter.asp
FI Finnish Newspapers Association Finnish Audit Bureau of Circulations Statistics Finland (Business Register)
Yearly 2008, 2009Finnish Mass Media 2009. Helsinki: Statistics Finland. http://www.sanomalehdet.fi http://www.levikintarkastus.fi
FR
1) Enquête sur les titres de presse 2) Enquête sur les entreprises de presse
1) MCC 2)Insee
1) Yearly
2) Yearly
1) 2006
2) 2007
Chiffres clés 2009 : rubrique Presse Tableaux Statistiques de la Presse (TSP) : http://www.ddm.gouv.fr/IMG/pdf/TSP_2007_avec_donnees_de_cadrage.pdf ?
DE - - - - -
GR ? General Secretariat of the National Statistical Service of Greece (ESYE)
Monthly 2009
Statistical themes) Culture-Entertainment) Entertainment) Press - Daily and periodical (journals & magazines) http://www.statistics.gr/portal/page/portal/ESYE/PAGE-themes?p_param=A1801

ESSnet‐CultureFinalReport
- 498-
HU Survey on the periodical press publishing Hungarian Central Stastical Office
Yearly 2008
Hungarian Statistical Yearbook (paper+cd) Stadat statistical databases http://portal.ksh.hu/portal/page?_pageid=38,593328&_dad=portal&_schema=PORTAL
IS Survey on newspapers Statistics Iceland Yearly 2008 Data on Web, http://www.statice.is
IT “La stampa in Italia 2006-2008” Federazione Italiana Editori Giornali – FIEG (Italian Newspaper Publishers' Association)
Yearly 2008 http://www.fieg.it/upload/studi_allegati/LaStampaInItalia2006-2008.pdf
LV Pārskats par izdevējdarbību National Library of Latvia, Department of Press Statistics
Yearly 2008 Annual collection of statistics 2008 : ‘Latvian Press’ http://www.csb.gov.lv
MT
Expenditure on newpapers monitored by National Accounts Unit. Estimates based on HBS which is carried out every 5 years in Malta.
NSO Yearly 2009
NO
1) Statistics on newspapers in Norway 2) Survey on media habits and practices in Norway
1) Avisåret, Volda University 2) Statistics Norway
1) Yearly
2) Yearly
1) 2008
2) 2008
Culture statistics 2008 (Paper and internet http://www.ssb.no/english/subjects/07/nos_cultural/) Norwegian media barometer 2008 (paper and Internet http://www.ssb.no/medie_en/ Publication in Norwegian only) http://www.ssb.no/english/subjects/07/
PL Statutory activity Association for the Control of Press Distribution
Once a month
2008 Data available at : Hhttp://www.zkdp.pl/index.php?d=1&p=3&t=96H
PT
1) Periodical Publication Survey 2) Integrated Business Accounts System
1) National Statistics Institute 2) National Statistics Institute
1) Yearly
2) Yearly
1) 2008
2007
-Culture Statistics 2008 (paper and Internet http://www.ine.pt) -(data frames on cultural statistics accessible via Internet) -Statistical Yearbook of Portugal 2008 (paper and Internet http://www.ine.pt) -Regional Statistical Yearbook 2008 (paper and Internet http://www.ine.pt) - Social Indicators 2008 (paper and Internet http://www.ine.pt) -Enterprises in Portugal (paper and Internet http://www.ine.pt) -Data frames on business statistics accessible via Internet
RO National Library of Romania National Library of Romania Yearly
2009
-ISSN Register - http://www.issn.org/2-22655-The-ISSN-Portal.php
SK The Registry of periodical Press) MK SR Yearly 2009 http://www.culture.gov.sk/pertlac/modul/tlac
SI Activity of publishing National and University Library, Statistical Office of the Republic of Slovenia
Yearly 2008 Activity of publishing, Slovenia, 2008
ES Survey on cultural habits and practices in Spain
Ministry of Culture of Spain
Every four years
2006-2007
-Survey on Cultural habits and Practices in Spain 2006-2007 (paper and Internet http://www.mcu.es) -Yearbook on Cultural Statistics 2009 (paper and Internet http://www.mcu.es) -CULTURAbase (database on cultural statistics accessible via Internet http://www.mcu.es/culturabase/cgi/um?L=0)
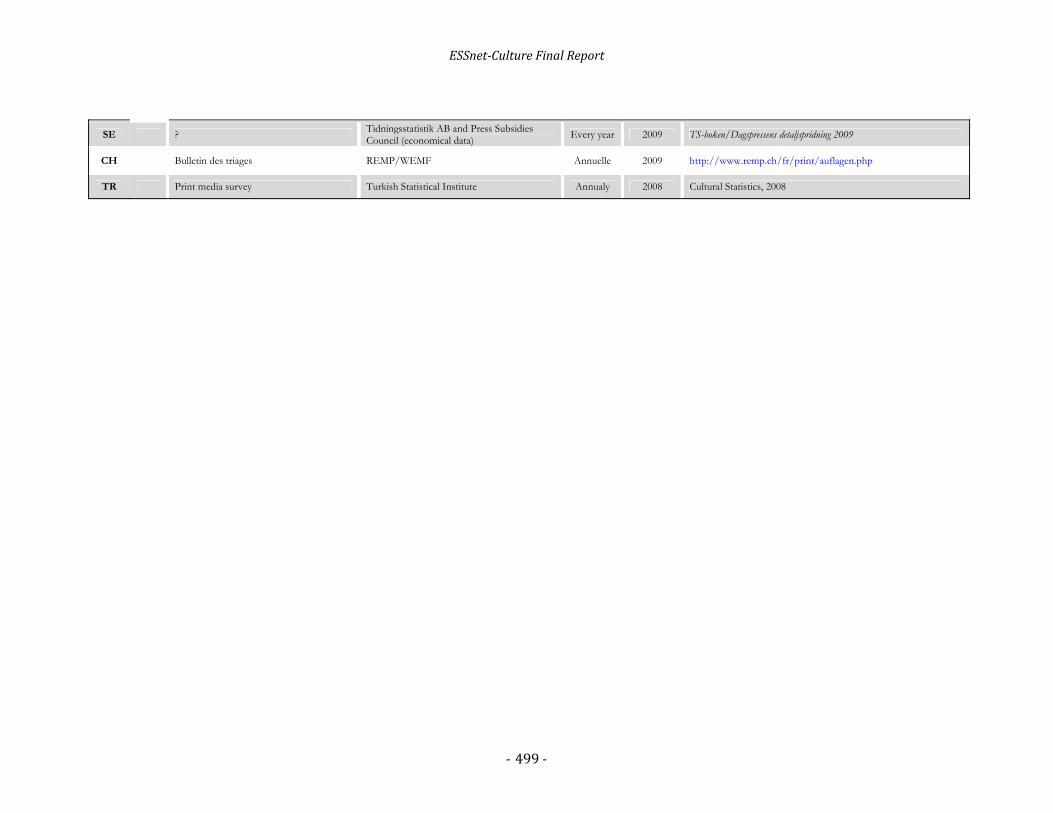
ESSnet‐CultureFinalReport
- 499-
SE ? Tidningsstatistik AB and Press Subsidies Council (economical data)
Every year 2009 TS-boken/Dagspressens detaljspridning 2009
CH Bulletin des triages REMP/WEMF Annuelle 2009 http://www.remp.ch/fr/print/auflagen.php
TR Print media survey Turkish Statistical Institute Annualy 2008 Cultural Statistics, 2008

ESSnet‐CultureFinalReport
- 500-
7. Architecture
Country Level
Name of the administrative or statistical national survey/data collection
Organisation in charge Periodicity Last year of data
available
Name of the last publication of data available on this domain (paper or Internet)
AT - - - - -
BE Fed - - - - -
BE C.Fl - - - - -
BE C.Wa - - - - -
BG - - - - -
CY - - - - -
CZ Survey on exhibition activity ( partly) NICC Yearly 2008 H http://www.nipos-mk.cz/?cat=126
DK Business services in the sector for Architectural services
Statistics Denmark Yerly 2007 Nyt fra Danmarks Statistk (i.e News from Statistics Denmark) Statistisk Efterretning 2 tables in the statbank (also in english)
EE - - - - -
FI Statistics Finland (Buildings and Dwellings) Association of Finnish Architects’ Offices Finnish Association of Architects
Yearly 2008 Alueiden kulttuurit 2009. Helsinki: Statistics Finland. Cultural Statistics 2007. Helsinki: Statistics Finland
FR Enquête sur les entreprises d’architecture Insee Yearly 2007 Chiffres clés 2009 : rubrique Patrimoine et architecture
DE - - - - -
GR - - - - -
HU - - - - -
IS - - - - -
IT - - - - -
LU - - - - -

ESSnet‐CultureFinalReport
- 501-
LV - - - - -
MT - - - - -
NO - - - - -
PL Statutory activity National Heritage Board of Poland Continuously 2009 Data available at: http://www.kobidz.pl/idm,45.html
PT Integrated Business Accounts System National Statistics Institute Yearly 2007 Culture Statistics 2008 (paper and Internet http://www.ine.ptH) Enterprises in Portugal (paper and Internet http://www.ine.pt H) Data frames on business statistics accessible via Internet
RO - - - - -
SK - - - - -
SI - - - - -
ES - - - - -
SE - - - - -
CH - - - - -
TR - - - - -

ESSnet‐CultureFinalReport
- 502-
8. Music (edition, concerts etc.)
Country Level
Name of the administrative or statistical national survey/data collection
Organisation in charge Periodicity Last year of data
available
Name of the last publication of data available on this domain (paper or Internet)
AT Statistics on theatres (including music production)
Statistics Austria Yearly 2008 http://www.statistik.at/web_de/statistiken/bildung_und_kultur/kultur/theater_und_musik/index.html
BE Fed Données d’enquête HBS (Household Budget Survey) sur les dépenses
Direction Générale Statistique Information Economique (DGSIE)
Annuelle depuis 1999
2007 http://statbel.preview.pr.belgium.be/fr/statistiques/chiffres/travailvie/revenus/index.jsp
BE C.Fl
1) SCV-survey, participation data for the Flemish community 2) IFPI
1) Centre de recherche du Gouvernement flamand (SVR-Studiedienst van de Vlaamse Regering) 2) IFPI
Yearly 2008 1) VRIND 2009, http://www4.vlaanderen.be/dar/svr/Cijfers/Pages/Excel.aspx 2) http://www.belgianentertainment.be/index.php/nl/muziek_marktinfo
BE C.Wa
Vade Mecum des Tournées Arts et Vie (destine aux artistes et aux programmateurs) Budgets, comptes et bilans des ‘petits lieux’ Panorama Danse-Dance 2007-2008 (destiné aux programmateurs professionnels)
Service des Arts de la scène du Ministère de la Communauté française
Yearly 2009 Les informations de nature diverses renseignées ici se trouvent sur http://www.artscene.cfwb.be
BG
Survey on the activities of theatres and other culture institutions (The National Statistical Institute conducts annual exhaustive surveys on the music and dance formations (philharmonic societies; ensembles for folk songs and dances). The survey provide data about the performances and the attendances (without edition)
National Statistical Institute Yearly
Annual data are available for 2008
Data are published on Internet page http://www.nsi.bg/otrasal.php?otr=24
CY Services Survey Statistical Service of Cyprus Yearly 2007 Economic statistics on other social and personal service activities
CZ Survey on orchestra, chorus and chamber ensemble
NICC Yearly 2008 http://www.nipos-mk.cz/?cat=126
DK
“Rapport om musikskolevirksomheden”. Statistics for the statutory music schools. Statistics for MGK – the basic music courses.
Arts Council ? ? ?
EE Music survey – will be started in 2010 Statistics Estonia, Ministry of Culture Yearly - -

ESSnet‐CultureFinalReport
- 503-
FI ? Association of Finnish Symphony Orchestras Finnish National Group of IFPI
Yearly 2008
Alueiden kulttuurit 2009. Helsinki: Statistics Finland. Finnish Mass Media 2009. Helsinki: Statistics Finland. Association of Finnish Symphony Orchestras, annual report 2008. http://www.sinfoniaorkesterit.fi/en/index.php?trg=statslist http://www.ifpi.fi
FR
1) Enquêtes sur la production phonographique 2) Enquête sur les entreprises d’enregistrements sonores
1) MCC 2) Insee
1) Yearly
2) Yearly
1) 2007
2) 2007
1) Chiffres clés 2009 : rubriques Disques / Théâtre et spectacles
DE Statistik der Musikschulen ? ? ? ?
GR
? ?
1) General Secretariat of the National Statistical Service of Greece (ESYE) 2)Nielsen Music Control
1) Yearly
2) Yearly
1) 2008
2) 2009
1) Statistical themes) Culture-Entertainment) Entertainment) Theatres and Orchestras - (State-Municipal) Hhttp://www.statistics.gr/portal/page/portal/ESYE/PAGE-themes?p_param=A1801 2) Nielsen Music Control Airplay Services http://www.nielsenmusiccontrol.com
HU Survey on concerts Ministry of Educational and Culture Yearly 2008
Hungarian Statistical Yearbook (paper+cd) Stadat statistical databases http://portal.ksh.hu/portal/page?_pageid=38,593328&_dad=portal&_schema=PORTAL MEC database
IS Survey on concerts of symphonic orchestras and main concert halls
Statistics Iceland Yearly Partial data only
Data on Web, Hwww.statice.is
IT “The Yearbook of the Entertainment Activity 2008”
SIAE Yearly 2008
http://www.siae.it/documents/Statistica_documentazione_AnnuarioDelloSpettacolo2008_EN.pdf http://www.siae.it/Edicola.asp?link_page=Siae_DatiEStatistiche.htm&click_level=0500.0400&level=0500.0400
LT Public concert organizations by activity Ministry of Culture Yeaty 2009 http://www.stat.gov.lt http://db1.stat.gov.lt/statbank/default.asp?w=1280
LU Enquête nationales sur les scenes culturelles (concerts…)
Ministry of Culture Yealy 2009 http://www.mc.public.lu
LV - - - - -
MT NSO plans to cover concerts and musical performances taking place outside theatres as well, as from this year.
NSO - - -
NO Survey on cultural habits and practices in Norway
Statistics Norway Every four
years 2008
Norwegian culture barometer 2008 (paper and Internet http://www.ssb.no/kulturbar_en/) Publication in Norwegian only. Culture statistics 2008 (Paper and internet http://www.ssb.no/english/subjects/07/
PL K-01 Artistic activity and entertainment Central Statistical Office, Statistical Office in Cracow
Yearly 2008 Data available in the Regional Data Bank at: http://www.stat.gov.pl/gus/index_ENG_HTML.htm
PT Live Shows Survey National Statistics Institute Yearly 2008
Culture Statistics 2008 (paper and Internet http://www.ine.pt) (data frames on cultural statistics accessible via Internet) Statistical Yearbook of Portugal 2008 (paper and Internet http://www.ine.pt)

ESSnet‐CultureFinalReport
- 504-
Regional Statistical Yearbook 2008 (paper and Internet http://www.ine.pt) Social Indicators 2008 (paper and Internet http://www.ine.pt) Portugal in figures 2007 (paper and Internet http://www.ine.pt)
RO
1) The activity of the institutions and companies of shows and concerts in the year….. 2) Music industry 3) National Library of Romania
1) National Institute of Statistics 2) Centre for Research on Culture, under the coordination of the Ministry of Culture and National Heritage Hhttp://www.culturadata.ro H 3) National Library of Romania
1) Yearly
2)?
3) Yearly
1) 2008
2) 2008
3) 2009
1) The activity of cultural- artistic units – paper Romanian Statistical Yearbook 2) Draft for a policy aimed at stimulating creativity-paper The diagnosis of culture in the urban space 3) National Bibliography of Romania – Printed and audio-video musical documents
SK KULT (MKSR) 5-01 MK SR Yearly 2008 Cultural Statistics 2008 (http://www.culture.gov.sk)
SI Musical activity Statistical Office of the Republic of Slovenia Yearly 2008 Musical activity, Slovenia, 2008
ES
1) Statistic on the edition in Spain of music with ISMN 2) Survey on cultural habits and practices in Spain
1) Ministry of Culture of Spain 2) Ministry of Culture of Spain
1) Yearly
2) Every four years
1) 2008
2006-2007
1) Yearbook on Cultural Statistics 2009 (paper and Internet http://www.mcu.es) CULTURAbase (database on cultural statistics accessible via Internet http://www.mcu.es/culturabase/cgi/um?L=0) 2) Survey on Cultural habits and Practices in Spain 2006-2007 (paper and Internet http://www.mcu.es) Yearbook on Cultural Statistics 2009 (paper and Internet http://www.mcu.es) CULTURAbase (database on cultural statistics accessible via Internet Hwww.mcu.es/culturabase/cgi/um?L=0)
SE ? Arts Council Yearly 2006
Musik 2006 (data from fund receivers, but not from private companies) http://www.kulturradet.se/Documents/publikationer/2008/Musik_2006.pdf
CH - - - - -
TR Administrative record of General Directorate of Fine Arts.
Turkish Statistical Institute Yearly 2008 Cultural Statistics, 2008

ESSnet‐CultureFinalReport
- 505-
9. Theatre
Country Level
Name of the administrative or statistical national survey/data collection
Organisation in charge Periodicity Last year of data
available
Name of the last publication of data available on this domain (paper or Internet)
AT Statistics on theatres (including music production)
Statistics Austria Yearly 2008 http://www.statistik.at/web_de/statistiken/bildung_und_kultur/kultur/theater_und_musik/index.html
BE Fed Données d’enquête HBS (Household Budget Survey) sur les dépenses
Direction Générale Statistique Information Economique (DGSIE)
Annuelle depuis 1999
2007 http://statbel.preview.pr.belgium.be/fr/statistiques/chiffres/travailvie/revenus/index.jsp
BE C.Fl -SCV-survey, participation data for the Flemish community
Centre de recherche du Gouvernement flamand (SVR-Studiedienst van de Vlaamse Regering)
Yearly 2009 VRIND 2009, http://www4.vlaanderen.be/dar/svr/Cijfers/Pages/Excel.aspx
BE C.Wa Base de données ARSENE portent sur les comptes annuels et les bilans, l’offre, ainsi que la frequentation
Observatoire des Politiques culturelles (OPC) du Ministère de la Communauté française
- 2008 Non disponible au public. Adresse OPC : http://www.opc.cfwb.be
BG Survey on the activities of theatres and other culture institutions
National Statistical Institute Yearly Annual data are available for 2008.
Data are published on Internet page http://www.nsi.bg/otrasal.php?otr=24
CY Services Survey Statistical Service of Cyprus Yearly 2007 Economic statistics on other social and personal service activities
CZ Survey on theatre NICC Yearly 2008 http://www.nipos-mk.cz/?cat=126
DK Teaterstatistikken (ie . Statistics on Theatres)
Statistics Denmark Yearly Season
2008/2009
1. Nyt fra Danmarks Statistk (i.e News from Statistics Denmark) 2. Statistik Efterretning 3. 4 tables in the stat bank (also in english)
EE Theatre survey Statistics Estonia, Estonian Theatre Agency Yearly 2008 http://pub.stat.ee/px-web.2001/I_Databas/Social_Life/01Culture/20Theatre/20Theatre.asp
FI ? Finnish Theatre Information Centre Dance Info Finland
Yearly 2008
Finnish Theatre Statistics 2008. Helsinki: Finnish Theatre Information Centre. http://www.teatteri.org/index-uusi.html Alueiden kulttuurit 2009. Helsinki: Statistics Finland.
FR Source administrative sur les scènes subventionnées : base Bravos.
MCC Annuelle 2008 Chiffres clés 2009 : rubrique Théâtre et spectacles
DE Theaterstatistik Deutscher Bühnenverein, Köln Yearly 2007/2008 Theaterstatistik 2007/2008 http://www.buehnenverein.de

ESSnet‐CultureFinalReport
- 506-
GR ? General Secretariat of the National Statistical Service of Greece (ESYE)
Yearly 2008
Statistical themes) Culture-Entertainment) Entertainment) Theatres and Orchestras - (State-Municipal) http://www.statistics.gr/portal/page/portal/ESYE/PAGE-themes?p_param=A1801
HU Survey on the theatres (opera) Ministry of Educational and Culture Yearly 2008
Hungarian Statistical Yearbook (paper+cd) Stadat statistical databases http://portal.ksh.hu/portal/page?_pageid=38,593328&_dad=portal&_schema=PORTAL MEC database
IS Survey on theatres, professional theatre groups and amateur theatres
Statistics Iceland Yearly 2008 Data on Web, http://www.statice.is
IT “The Yearbook of the Entertainment Activity 2008”
SIAE Yearly 2008 http://www.siae.it/documents/Statistica_documentazione_AnnuarioDelloSpettacolo2008_EN.pdf
LT 1) Public theatres by activity 2) Private theatres by activity (K-09)
1) Ministry of the Culture of the Republic of Lithuania 2) Statistics Lithuania
1) Yearly
2) Yearly
2009
2009
http://www.stat.gov.lt http://db1.stat.gov.lt/statbank/default.asp?w=1280
LU Enquête nationale sur les scenes culturelles (theâtre…)
Ministry of Culture Yearly 2009 http://www.mc.public.lu
LV Pārskats par teātra darbību 1-teātris
Central Statistical Bureau of Latvia, Ministry of Culture of Latvia
Yearly 2008 http://www.csb.gov.lv
MT Theatres 2008 questionnaire NSO Yearly 2008 News Release – Theatres: 2008 http://www.nso.gov.mt/statdoc/document_file.aspx?id=2512
NO
1) Statistical Exploitation of the administrative databases of performing arts resources 2) Survey on cultural habits and practices in Norway
1) Association of Norwegian Theatres and Orchestras 2) Statistics Norway
1) Yearly 1) 2008
2) 2008
1) Culture statistics 2008 (Paper and internet http://www.ssb.no/english/subjects/07/nos_cultural/) 2) Norwegian culture barometer 2008 (paper and Internet http://www.ssb.no/kulturbar_en/) Publication in Norwegian only. Culture statistics 2008 (Paper and internet http://www.ssb.no/english/subjects/07/)
PL K-01 Artistic activity and entertainment Central Statistical Office, Statistical Office in Cracow
Yearly 2008 Data available in the Regional Data Bank at: http://www.stat.gov.pl/gus/index_ENG_HTML.htm
PT Live Shows Survey
National Statistics Institute
Yearly 2008
Culture Statistics 2008 (paper and Internet http://www.ine.pt) (data frames on cultural statistics accessible via Internet) Statistical Yearbook of Portugal 2008 (paper and Internet http://www.ine.pt) Regional Statistical Yearbook 2008 (paper and Internet http://www.ine.pt) Social Indicators 2008 (paper and Internet http://www.ine.pt) Portugal in figures 2007 (paper and Internet http://www.ine.pt)

ESSnet‐CultureFinalReport
- 507-
RO
1) The activity of the institutions and companies of shows and concerts in the year…. 2.1) UNITER National Theatre Festival 2008-audience profile 2.2) UNITER National Theatre Festival 2009-audience profile 2.3) Performing arts
1) National Institute of Statistics 2) Centre for Research on Culture, subordinated to Ministry of Culture and National Heritage www.culturadata.ro
1) Yearly
2) ?
1) 2008
2.1) 2008
2.2) 2009
2.3) 2008
1) The activity of cultural- artistic units – paper Romanian Statistical Yearbook 2.1) UNITER National Theatre Festival 2008-audience profile-paper The diagnosis of culture in the urban space 2.2) UNITER National Theatre Festival 2009-audience profile 2.3) Draft for a policy aimed at stimulating creativity-paper The diagnosis of culture in the urban space
SK KULT (MKSR) 12-01 MK SR Yearly 2008 Cultural Statistics 2008 (http://www.culture.gov.sk)
SI Theatrical activity Statistical Office of the Republic of Slovenia Yearly 2008 Theatrical activity, Slovenia, 2008
ES
1) Statistical Exploitation of the administrative databases of performing arts resources Survey on cultural habits and practices in Spain
1) Ministry of Culture of Spain Ministry of Culture of Spain
1) Yearly 1) 2008
2) 2006-2007
1) Yearbook on Cultural Statistics 2009 (paper and Internet http://www.mcu.es) CULTURAbase (database on cultural statistics accessible via Internet http://www.mcu.es/culturabase/cgi/um?L=0) 2) Survey on Cultural habits and Practices in Spain 2006-2007 (paper and Internet http://www.mcu.es) Yearbook on Cultural Statistics 2009 (paper and Internet http://www.mcu.es) CULTURAbase (database on cultural statistics accessible via Internet http://www.mcu.es/culturabase/cgi/um?L=0)
SE ? Arts Council Every
year/Every second year
2006
Teater och dans 2006 – Theatre and Dance (data from fund receivers, but not from private companies) http://www.kulturradet.se/upload/kr/publikationer/2008/teater_och_dans_2006.pdf
CH Statistique des spectateurs et représentations théâtrales (par saison)
Union des Théâtres Suisses Annuelle 2007/2008 http://www.theaterschweiz.ch/index.php?id=362
TR
Administrative record of : Information on public theaters: Directorates of theaters through the General Directorate of State Theaters Information on official and private theaters: Directorates of theaters.
Turkish Statistical Institute Annualy 2008 Cultural Statistics, 2008

ESSnet‐CultureFinalReport
- 508-
10. Cultural events and infrastructure (concert halls, theatres, festivals etc.)
Country Level
Name of the administrative or statistical national survey/data collection
Organisation in charge Periodicity Last year of data
available
Name of the last publication of data available on this domain (paper or Internet)
AT Statistics on festivals Statistics Austria Yearly 2008 http://www.statistik.at/web_de/statistiken/bildung_und_kultur/kultur/festspiele_und_festivals/index.html
BE Fed - - - - -
BE C.Fl Cultuurdatabank (Cultuurnet), data on the number of preforming arts shows, data on cultural infrastructure
Ehsal (HUB) Irregular 2007 VRIND 2008
BE C.Wa
Cartographie des opérateurs culturels subventionnés en Communauté française Un projet de cartographie dynamique remis à jour en permanence est en cours de test (2010)
OPC du Ministère de la Communauté française
2010 2008 http://www.opc.cfwb.be/ en chantier : http://www.cartographie.cfwb.be
BG - - - - -
CY Services Survey Statistical Service of Cyprus Yearly 2007 Economic statistics on other social and personal service activities
CZ Survey on festivals ( no infrastructure) NICCC Yearly 2008 http://www.nipos-mk.cz/?cat=126
DK The intrastructures of the theatres is covered by the theatre statistics
Statistics Denmark Yearly Season
2008/2009Statistisk Efterretning
EE - - - - -
FI ? Finland Festivals individual cultural centres
Yearly 2009, 2010http://www.festivals.fi Alueiden kulttuurit 2009. Helsinki: Statistics Finland. http://www.stat.fi
FR
Source administrative sur les scènes subventionnées : base Bravos Base de gestion des licences d’entrepreneurs de spectacles : base Atalie
MCC Yearly 2008 Chiffres clés 2009 : rubriques Théâtre et spectacles / Art lyrique, musique et danse
DE - - - - -
GR - - - - -

ESSnet‐CultureFinalReport
- 509-
HU
Survey on Hungarian Circus and Variety Ltd. Activity, Survey on the dance ensembles Survey on the cultural institutes Survey on zoos, wildlife parks and cultural parks
Ministry of Educational and Culture Yearly 2008
Hungarian Statistical Yearbook (paper+cd) Stadat statistical databases http://portal.ksh.hu/portal/page?_pageid=38,593328&_dad=portal&_schema=PORTAL MEC database
IS - - - - -
IT ‘The Yearbook of the Entertainment Activity 2008’
SIAE Yearly 2008
http://www.siae.it/documents/Statistica_documentazione_AnnuarioDelloSpettacolo2008_EN.pdf http://www.siae.it/Edicola.asp?link_page=Siae_DatiEStatistiche.htm&click_level=0500.0400&level=0500.0400
LU
Enquête nationale sur les scenes culturelles Enquête sur les festivals et autres évènements
Ministry of Culture Yearly 2009 http://www.mc.public.lu
LV As from the middle of 2010: Cultural Digital Map of Latvia
Ministry of Culture of Latvia Yearly - -
MT - - - - -
NO Survey on cultural habits and practices in Norway
Statistics Norway Every four
years ?
Culture statistics 2008 (Paper and internet): http://www.ssb.no/english/subjects/07/nos_cultural/) Norwegian culture barometer 2008 (paper and Internet): http://www.ssb.no/kulturbar_en/) Publication in Norwegian only. Culture statistics 2008 (Paper and internet): http://www.ssb.no/english/subjects/07/
PL K-05 Exhibitions, K-07 Cultural centers and clubs
Central Statistical Office, Statistical Office in Cracow
Yearly 2008, 2007
(K-07) Data available in the Regional Data Bank at: http://www.stat.gov.pl/gus/index_ENG_HTML.htm
PT Cultural Precincts Survey National Statistics Institute Yearly 2008
Culture Statistics 2008 (paper and Internet http://www.ine.pt) (data frames on cultural statistics accessible via Internet) Statistical Yearbook of Portugal 2008 (paper and Internet http://www.ine.pt) Regional Statistical Yearbook 2008 (paper and Internet http://www.ine.pt) Social Indicators 2008 (paper and Internet http://www.ine.pt) Portugal in figures 2007 (paper and Internet http://www.ine.pt)
RO
UNITER National Theatre Festival 2008-audience profile UNITER National Theatre Festival 2009-audience profile Cultural activities in Romanian cities 2008 The cultural vitality of Bucharest public space, the spatial distribution of artistic
Centre for Research on Culture, subordinated to Ministry of Culture and National Heritage www.culturadata.ro
? 2008 2007 2006
UNITER National Theatre Festival 2008-audience profile-paper The diagnosis of culture in the urban space UNITER National Theatre Festival 2009-audience profile-paper The diagnosis of culture in the urban space The cultural vitality of Romanian cities 2008- paper The diagnosis of culture in the urban space Culture in the public space- paper The diagnosis of culture in the urban space

ESSnet‐CultureFinalReport
- 510-
events.
SK
KULT (MKSR) 5-01 KULT (MKSR) 12-01 KULT (MKSR) 16-01 KULT (MKSR) 17-01
MK SR Yearly 2008 Cultural Statistics 2008 http://www.culture.gov.sk
SI General overview of the Culture (different surveys)
Statistical Office of the Republic of Slovenia Yearly 2008 ?
ES Survey on cultural habits and practices in Spain
Ministry of Culture of Spain
Every four years
2006-2007
Survey on Cultural habits and Practices in Spain 2006-2007 (paper and Internet http://www.mcu.es) Yearbook on Cultural Statistics 2009 (paper and Internet http://www.mcu.es) CULTURAbase (database on cultural statistics accessible via Internet http://www.mcu.es/culturabase/cgi/um?L=0)
SE - - - - -
CH - - - - -
TR - - - - -
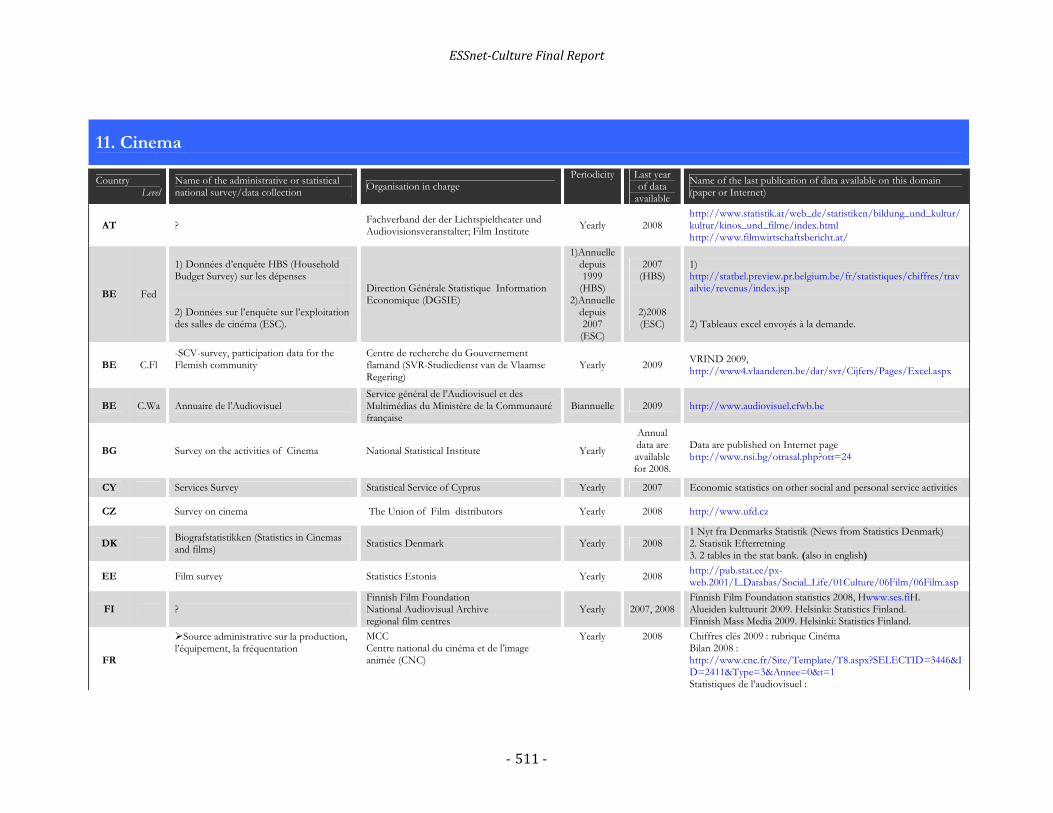
ESSnet‐CultureFinalReport
- 511-
11. Cinema
Country Level
Name of the administrative or statistical national survey/data collection
Organisation in charge Periodicity Last year
of data available
Name of the last publication of data available on this domain (paper or Internet)
AT ? Fachverband der der Lichtspieltheater und Audiovisionsveranstalter; Film Institute
Yearly 2008 http://www.statistik.at/web_de/statistiken/bildung_und_kultur/kultur/kinos_und_filme/index.html http://www.filmwirtschaftsbericht.at/
BE Fed
1) Données d’enquête HBS (Household Budget Survey) sur les dépenses 2) Données sur l’enquête sur l’exploitation des salles de cinéma (ESC).
Direction Générale Statistique Information Economique (DGSIE)
1)Annuelle depuis 1999
(HBS) 2)Annuelle
depuis 2007 (ESC)
2007 (HBS)
2)2008 (ESC)
1) http://statbel.preview.pr.belgium.be/fr/statistiques/chiffres/travailvie/revenus/index.jsp 2) Tableaux excel envoyés à la demande.
BE C.Fl -SCV-survey, participation data for the Flemish community
Centre de recherche du Gouvernement flamand (SVR-Studiedienst van de Vlaamse Regering)
Yearly 2009 VRIND 2009, http://www4.vlaanderen.be/dar/svr/Cijfers/Pages/Excel.aspx
BE C.Wa Annuaire de l’Audiovisuel Service général de l’Audiovisuel et des Multimédias du Ministère de la Communauté française
Biannuelle 2009 http://www.audiovisuel.cfwb.be
BG Survey on the activities of Cinema National Statistical Institute Yearly
Annual data are available for 2008.
Data are published on Internet page http://www.nsi.bg/otrasal.php?otr=24
CY Services Survey Statistical Service of Cyprus Yearly 2007 Economic statistics on other social and personal service activities
CZ Survey on cinema The Union of Film distributors Yearly 2008 http://www.ufd.cz
DK Biografstatistikken (Statistics in Cinemas and films)
Statistics Denmark Yearly 2008 1 Nyt fra Denmarks Statistik (News from Statistics Denmark) 2. Statistik Efterretning 3. 2 tables in the stat bank. (also in english)
EE Film survey Statistics Estonia Yearly 2008 http://pub.stat.ee/px-web.2001/I_Databas/Social_Life/01Culture/06Film/06Film.asp
FI ? Finnish Film Foundation National Audiovisual Archive regional film centres
Yearly 2007, 2008Finnish Film Foundation statistics 2008, Hwww.ses.fiH. Alueiden kulttuurit 2009. Helsinki: Statistics Finland. Finnish Mass Media 2009. Helsinki: Statistics Finland.
FR
Source administrative sur la production, l’équipement, la fréquentation
MCC Centre national du cinéma et de l’image animée (CNC)
Yearly
2008
Chiffres clés 2009 : rubrique Cinéma Bilan 2008 : http://www.cnc.fr/Site/Template/T8.aspx?SELECTID=3446&ID=2411&Type=3&Annee=0&t=1 Statistiques de l’audiovisuel :

ESSnet‐CultureFinalReport
- 512-
Enquête sur les entreprises de l’audiovisuel
Insee
Yearly
2007
http://www.cnc.fr/Site/Template/T6B.aspx?SELECTID=1724&id=121&t=1
DE Statistik der Filmwirtschaft Spitzenorganisation der Filmwirtschaft (SPIO), Wiesbaden, Filmförderungsanstalt, Berlin
Yearly 2008 Filmstatistisches Jahrbuch http://www.spio.de/index.asp?SeitID=1 http://www.ffa.de
GR ?
1)Hellenic Audiovisual Institute (IOM) 2)General Secretariat of the National Statistical Service of Greece (ESYE)
5 years
1) 2003
2) 2004
1) http://www.iom.gr 2) Statistical themes) Household budget and expenditure) Household budget survey http://www.statistics.gr/portal/page/portal/ESYE/PAGE-themes?p_param=A0801
HU
Survey on the cinemas, Survey on the monthly results of the distributed films Survey on finished films
Ministry of Educational and Culture Yearly 2008
Hungarian Statistical Yearbook (paper+cd) Stadat statistical databases http://portal.ksh.hu/portal/page?_pageid=38,593328&_dad=portal&_schema=PORTAL MEC database
IS Survey on films and cinemas Statistics Iceland Yearly 2008 Data on Web, http://www.statice.is
IT “The Yearbook of the Entertainment Activity 2008”
SIAE Yearly 2008
http://www.siae.it/documents/Statistica_documentazione_AnnuarioDelloSpettacolo2008_EN.pdf http://www.siae.it/Edicola.asp?link_page=Siae_DatiEStatistiche.htm&click_level=0500.0400&level=0500.0400
LT
Statistical survey on films exhibition (K-03) Statistical survey on films distribution (K-04)
Statistics Lithuania Yearly 2009 http://www.stat.gov.lt http://db1.stat.gov.lt/statbank/default.asp?w=1280
LU Enquête nationale sur l’exploitation des salles de cinéma
Ministry of Culture Yearly 2009 http://www.mc.public.lu
LV
Pārskats par kinoteātru darbību un kinoiekārtu izmantošanu 1-kino Pārskats par kinofilmu ražošanu 1-kinofilmu ražošana Pārskats par kinofilmu iznomāšanu 1-kinofilmu iznomāšana As from the middle of 2010: Cultural Digital Map of Latvia
National Film Centre of Latvia, Central Statistical Bureau of Latvia
Yearly 2008 http://www.nfc.lv/info/?mnu_id=24 (in Latvian) http://www.csb.gov.lv
MT
Cinema admissions published by a local film distributor in Malta and used by National Accounts Unit to estaimate financial performace of all cinemas.
NSO - - -
NO
1) Statistics on Cinema; production 2) Survey on media habits and practices in
1) Film & Kino 2) Statistics Norway
1) Yearly
2) Yearly
1) 2008 ?
1) Film & Kino: http://www.kino.no Culture statistics 2008 http://www.ssb.no/english/subjects/07/nos_cultural 2) Norwegian media barometer 2008

ESSnet‐CultureFinalReport
- 513-
Norway http://www.ssb.no/medie_en http://www.ssb.no/english/subjects/07/
PL K-08 Cinemas, K-06 Film production and services
Central Statistical Office, Statistical Office in Cracow
Yearly
2008, K-06 is
not published
Data available in the Regional Data Bank at: http://www.stat.gov.pl/gus/index_ENG_HTML.htm
PT
1) Exhibition: project of “box-office computerization” (Decree-Law No. 125/2003 of June 20). 2) Production: administrative data 3) Integrated Business Accounts System
1) Cinema and Audiovisuals Institute – Ministry of Culture 2)Cinema and Audiovisuals Institute – Ministry of Culture 3) National Statistical Institute
1)Monthl, quarterly
and Yearly
2) Yearly
3) Yearly
1) 2009
2) 2008
3) 2007
1) Culture Statistics 2008 (paper and Internet http://www.ine.pt) - (data frames on cultural statistics accessible via Internet) - Statistical Yearbook of Portugal 2008 (paper and Internet http://www.ine.pt) - Regional Statistical Yearbook 2008 (paper and Internet http://www.ine.pt) - Social Indicators 2008 (paper and Internet http://www.ine.pt) 3) Culture Statistics 2008 (paper and Internet http://www.ine.pt) - (data frames on cultural statistics accessible via Internet) - Enterprises in Portugal (paper and internet http://www.ine.pt)
RO
Film production, distribution, exhibition Video, DVD,CD,UMD,BD market Film festivals Cinema industry Cinematographers and public Cinematography consumption
National Institute of Statistics Ministry of Culture and National Heritage - National Centre of Cinematography Centre for Research on Culture, subordinated to Ministry of Culture and National Heritage H http://www.culturadata.ro H
Yearly 2008
The activity of cultural- artistic units - paper Romanian Statistical Yearbook Statistical Yearbook (Cinema) http://www.cncinema.ro Draft for a policy aimed at stimulating creativity-paper The diagnosis of culture in the urban space Comparative Statistics on the Cultural Sector in Romania and other European Countries paper Cultural Sector in Romania: Infrastructure. Resources. Consumption The evolution of the cultural filed in Romania (1995-2005)-paper Cultural Sector in Romania: Infrastructure. Resources. Consumption. The Barometer of Cultural Consumption: 2006, 2006, 2007, 2008, 2009: http://www.culturadata.ro/Cercetari%20finalizateEN.html
SK KULT (MKSR) 11-01 MK SR Yearly 2008 Cultural Statistics 2008 http://www.culture.gov.sk
SI Cinematic activity Statistical Office of the Republic of Slovenia Yearly 2008 Cinematic activity, Slovenia, 2008
ES
1) Statistics on Cinematography: Production, Exhibition, Distribution and Development
1) Ministry of Culture of Spain
1) Yearly
1) 2008
1) Yearbook on Cultural Statistics 2009 (paper and Internet http://www.mcu.es) - CULTURAbase (database on cultural statistics accessible via Internet http://www.mcu.es/culturabase/cgi/um?L=0) - Survey on Cultural habits and Practices in Spain 2006-2007 (paper and Internet http://www.mcu.es)

ESSnet‐CultureFinalReport
- 514-
2) Survey on cultural habits and practices in Spain
2) Ministry of Culture of Spain
Every four
years
2006-2007
2)Yearbook on Cultural Statistics 2009 (paper and Internet http://www.mcu.es) - CULTURAbase (database on cultural statistics accessible via Internet http://www.mcu.es/culturabase/cgi/um?L=0)
SE ? Swedish Film Institute Every year 2008
Filmåret i siffror 2008 (Facts and figures 2008) http://www.sfi.se/Documents/Dokument%20fr%c3%a5n%20Svenska%20Filminstitutet/Verksamhetsber%c3%a4ttelser/Verksamhetsber%c3%a4ttelse%202008.pdf
CH Statistique suisse du film et du cinéma Office fédéral de la statistique Yearly 2008 http://www.bfs.admin.ch/bfs/portal/fr/index/themen/16/02/01.html
TR Directorates of movie -houses. Turkish Statistical Institute Yearly 2008 Cultural Statistics, 2008

ESSnet‐CultureFinalReport
- 515-
12. Television
Country Level
Name of the administrative or statistical national survey/data collection
Organisation in charge Periodicity Last year of data
available
Name of the last publication of data available on this domain (paper or Internet)
AT Media research data Arbeitsgemeinschaft Teletest; Austrian Broadcasting Company (ORF)
Yearly 2008 http://www.statistik.at/web_de/statistiken/bildung_und_kultur/kultur/hoerfunk_und_fernsehen/index.html
BE Fed Données d’enquête HBS (Household Budget Survey) sur les dépenses
Direction Générale Statistique Information Economique (DGSIE)
Annuelle depuis 1999
2007 http://statbel.preview.pr.belgium.be/fr/statistiques/chiffres/travailvie/revenus/index.jsp
BE C.Fl SCV-survey, data on use and for the Flemish community
Centre de recherche du Gouvernement flamand (SVR-Studiedienst van de Vlaamse Regering)
Yearly 2009 VRIND 2009, http://www4.vlaanderen.be/dar/svr/Cijfers/Pages/Excel.aspx
BE C.Wa Annuaire de l’Audiovisuel Idem que ci-dessus Biannuelle 2009 http://www.audiovisuel.cfwb.be
BG
Survey on the Television programme activity (TV operators received programme licence and registration only)
National Statistical Institute Yearly
Annual data are available for 2008.
Data are published on Internet page http://www.nsi.bg/otrasal.php?otr=24
CY Services Survey Statistical Service of Cyprus Yearly 2007 Economic statistics on other social and personal service activities
CZ Survey on TV broadcasting CZSO Yearly 2008 http://www.czso.cz
DK Mediestatistikbanken (i.e. ‘Bank of Media Statistics’)
Agency for Library and Media -
2006-2009 depending on which table is used
Mediestatistikbanken (i.e. ‘Bank of Media Statistics’) http://www.bibliotekogmedier.dk/medieomraadet/statistik/
EE Broadcasting survey Statistics Estonia Yearly 2008 http://pub.stat.ee/px-web.2001/I_Databas/Social_Life/01Culture/04Broadcasting/04Broadcasting.asp
FI ? Finnish Broadcasting Company YLE Yearly 2008 Finnish Mass Media 2009, Helsinki Statistics Finland. YLE annual report 2008
FR
1) Enquête sur les entreprises de l’audiovisuel 2) Rapport du Conseil Supérieur de l’Audiovisuel (CSA)
1) Insee 2) Conseil Supérieur de l’Audiovisuel (CSA)
Annuelle
2006
2008
2008
1) Culture Chiffres-2008-4 : Statistiques d’entreprises des industries culturelles Chiffres clés de l’audiovisuel : http://www.csa.fr/upload/publication/Chiffres_cles_audiovisuel_1er_semestre_2008.pdf Guide des chaînes numériques 2009 http://www.csa.fr/upload/publication/guide_chaines_numeriques

ESSnet‐CultureFinalReport
- 516-
_2009.pdf
DE - - - - -
GR ?
Hellenic Audiovisual Institute (IOM) AGB Nielsen Media Research General Secretariat of the National Statistical Service of Greece (ESYE)
Yearly
Yearly
2003
2009
2007
http://www.iom.gr TV Yearbook 2007-2008 http://www.agbnielsen.net Statistical themes) Household budget and expenditure) Living conditions (EU-SILC) http://www.statistics.gr/portal/page/portal/ESYE/PAGE-themes?p_param=A0802
HU Survey on the television program service Survey on the radio program service
Hungarian Central Stastical Office Yearly 2008 Hungarian Statistical Yearbook (paper+cd)
IS Survey on television Statistics Iceland Yearly 2008 Data on Web, http://www.statice.is
IT “Indagine multiscopo annuale sulle famiglie” e “Dati sulla programmazione televisiva delle emittenti nazionali”
National Institute of Statistics - ISTAT Yearly 2008 http://www.istat.it http://culturaincifre.istat.it
LT Statistical survey on radio and television Statistics Lithuania Yearly 2009 http://www.stat.gov.lt http://db1.stat.gov.lt/statbank/default.asp?w=1280
LU - - - - -
LV
Pārskats par kabeļtelevīzijas darbību 1-kabeļu TV Pārskats par radio/televīzijas darbību 1-radio/TV
Central Statistical Bureau of Latvia Yearly 2008 http://www.csb.gov.lv
MT
Financial perfomance of television broadcasting companies monitored by National Accounts Unit using Structural Business Survey data, as basis. Moreover, NSO condcuts a continuous survey on television viewership on behalf of the Malta Broadcasting Authority.
NSO - - -
NO
1) The public broadcasters accounts 2) Survey on media habits and practices in Norway
1.1) The Norwegian Media Authority 1.2) Statistics Norway 2) Statistics Norway
Yearly 2008 1.1) Allmennkringkastingsrapporten, Norwegian Media Authority http://www.medietilsynet.no 1.2) Culture statistics 2008 (Paper and internet http://www.ssb.no/english/subjects/07/nos_cultural) 2) Norwegian media barometer 2008 (paper and Internet http://www.ssb.no/medie_en/

ESSnet‐CultureFinalReport
- 517-
Publication in Norwegian only) http://www.ssb.no/english/subjects/07/
PL Statutory activity National Radio and Television Board Yearly 2008
Reports and analyses published at: http://www.krrit.gov.pl/bip/Publikacje/Raporty/tabid/114/Default.aspx Culture in 2008 (publication of the Central Statistical Office)
PT Integrated Business Accounts System National Statistics Institute
Yearly 2007 Culture Statistics 2008 (paper and Internet http://www.ine.pt) Enterprises in Portugal (paper and Internet http://www.ine.pt) data frames on business statistics accessible via Internet
RO ?
National Institute of Statistics Romanian Society of Television - public sector television: H http://www.srtv.ro H National Centre of Audiovisual - for private sector monitoring: H http://www.cna.roH
Yearly 2008 The activity of cultural- artistic units - paper Romanian Statistical Yearbook
SK KULT (MKSR) 8-01 MK SR Yearly 2008 Cultural Statistics 2008 (http://www.culture.gov.sk)
SI Broadcasting activity Statistical Office of the Republic of Slovenia Yearly 2008 Broadcasting activity, Slovenia, 2008
ES Survey on cultural habits and practices in Spain
Ministry of Culture of Spain Every four
years 2006-2007
Survey on Cultural habits and Practices in Spain 2006-2007 (paper and Internet http://www.mcu.es) Yearbook on Cultural Statistics 2009 (paper and Internet http://www.mcu.es) CULTURAbase (database on cultural statistics accessible via Internet http://www.mcu.es/culturabase/cgi/um?L=0)
SE ? (number of viewers, viewing time etc.) MMS - Mediamätning i Skandinavien
Yearly 2009 Årsrapport 2009 – Annual report 2009 http://www.mms.se/_dokument/rapporter/ar/Årsrapport%202009.pdf
CH Activités de la population Suisse en matière d’utilisation Radio/TV
Mediapulse SA Yearly 2008 http://www.mediapulse.ch/fr/accueil.html
TR - - - - -
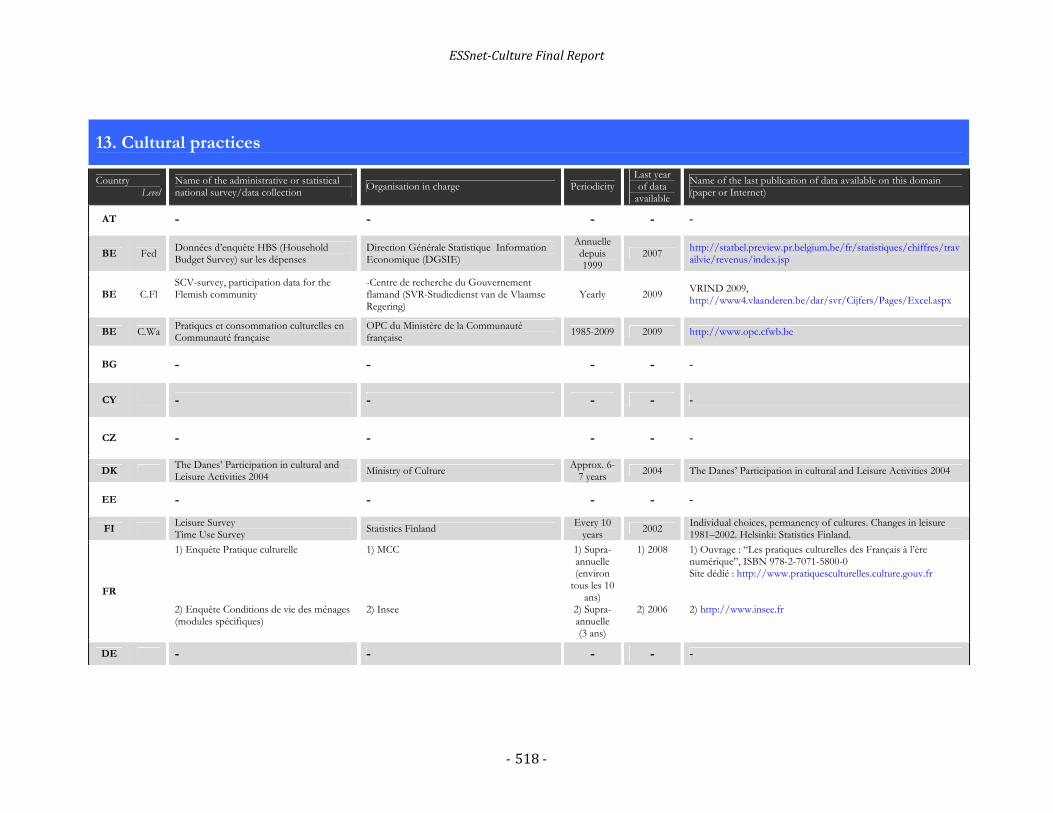
ESSnet‐CultureFinalReport
- 518-
13. Cultural practices
Country Level
Name of the administrative or statistical national survey/data collection
Organisation in charge Periodicity Last year of data
available
Name of the last publication of data available on this domain (paper or Internet)
AT - - - - -
BE Fed Données d’enquête HBS (Household Budget Survey) sur les dépenses
Direction Générale Statistique Information Economique (DGSIE)
Annuelle depuis 1999
2007 http://statbel.preview.pr.belgium.be/fr/statistiques/chiffres/travailvie/revenus/index.jsp
BE C.Fl SCV-survey, participation data for the Flemish community
-Centre de recherche du Gouvernement flamand (SVR-Studiedienst van de Vlaamse Regering)
Yearly 2009 VRIND 2009, http://www4.vlaanderen.be/dar/svr/Cijfers/Pages/Excel.aspx
BE C.Wa Pratiques et consommation culturelles en Communauté française
OPC du Ministère de la Communauté française
1985-2009 2009 http://www.opc.cfwb.be
BG - - - - -
CY - - - - -
CZ - - - - -
DK The Danes’ Participation in cultural and Leisure Activities 2004
Ministry of Culture Approx. 6-
7 years 2004 The Danes’ Participation in cultural and Leisure Activities 2004
EE - - - - -
FI Leisure Survey Time Use Survey
Statistics Finland Every 10
years 2002
Individual choices, permanency of cultures. Changes in leisure 1981–2002. Helsinki: Statistics Finland.
FR
1) Enquête Pratique culturelle 2) Enquête Conditions de vie des ménages (modules spécifiques)
1) MCC 2) Insee
1) Supra-annuelle (environ
tous les 10 ans)
2) Supra-annuelle (3 ans)
1) 2008
2) 2006
1) Ouvrage : “Les pratiques culturelles des Français à l’ère numérique”, ISBN 978-2-7071-5800-0 Site dédié : http://www.pratiquesculturelles.culture.gouv.fr 2) http://www.insee.fr
DE - - - - -

ESSnet‐CultureFinalReport
- 519-
GR ? National Book Centre of Greece (EKEBI) 5 years 2004
2nd Reading Behaviour and Cultural Practices Survey of the Greek Population, 2004 http://www.ekebi.gr/frontoffice/portal.asp?cpage=node&cnode=424 (in Greek) 1st Reading Behaviour and Cultural Practices Survey of the Greek Population, 1999 http://www.readingeurope.org/observatory.nsf?open
HU Time-use survey Hungarian Central Stastical Office ? 1999 Time use 1986 and 1999 autumn (paper)
IS - - - - -
IT Indagine multiscopo annuale sulle famiglie “Aspetti della vita quotidiana”
National Institute of Statistics - ISTAT Yearly 2009 http://www.istat.it
LT - - - - -
LU Enquête sur les pratiques culturelles (EPC) Ministry of Culture Every 10
years 2009 http://www.mc.public.lu
LV
Database of Central Statistical Bureau of Latvia As from the middle of 2010: Cultural Digital Map of Latvia
Central Statistical Bureau of Latvia, Ministry of Culture of Latvia
Yearly 2008 http://www.csb.gov.lv
MT - - - - -
NO Survey on cultural habits and practices in Norway
Statistics Norway Every four
years 2008
Culture statistics 2008 (Paper and internet http://www.ssb.no/english/subjects/07/nos_cultural/) Norwegian culture barometer 2008 (paper and Internet http://www.ssb.no/kulturbar_en/) Publication in Norwegian only. Culture statistics 2008 (Paper and internet http://www.ssb.no/english/subjects/07/)
PL DS-58 G,I Cultural participation of population
Department of Social Studies, Central Statistical Office
Every 5 years
2004 Cultural participation of population in 2004
PT Adult Education Survey
National Statistics Institute
Every five years
2007 - Culture Statistics 2008 (paper and Internet http://www.ine.pt) - (data frames on cultural statistics accessible via Internet)
RO The Barometer of Cultural Consumption Centre for Research on Culture, subordinated to Ministry of Culture and National Heritage H http://www.culturadata.ro H
Yearly 2009 202BThe Barometer of Cultural Consumption, http://www.culturadata.ro/Cercetari%20finalizateEN.html
SK KULT (MKSR) 3-01 MK SR Yeaely 2008 Cultural Statistics 2008 (http://www.culture.gov.sk)
SI - - - - -

ESSnet‐CultureFinalReport
- 520-
ES Survey on cultural habits and practices in Spain
Ministry of Culture of Spain Every four
years 2006-2007
-Survey on Cultural habits and Practices in Spain 2006-2007 (paper and Internet http://www.mcu.es) -Yearbook on Cultural Statistics 2009 (paper and Internet http://www.mcu.es) -CULTURAbase (database on cultural statistics accessible via Internet http://www.mcu.es/culturabase/cgi/um?L=0)
SE Undersökningarna av levnadsförhållanden (ULF)
Statistics Sweden / Swedish Arts Council Every
eighth year 2006/2007
Nya kulturvanor – New Cultural Habits http://www.kulturradet.se/sv/publikationer_/Nya-kulturvanor
CH Les pratiques culturelles en Suisse Office fédéral de la statistique 3 ans env. 2008 http://www.bfs.admin.ch/bfs/portal/fr/index/themen/16/02/03.html
TR Time use survey Turkish Statistical Institute Every five
years 2006 Participaton in and time spent on cultural activities, 2006
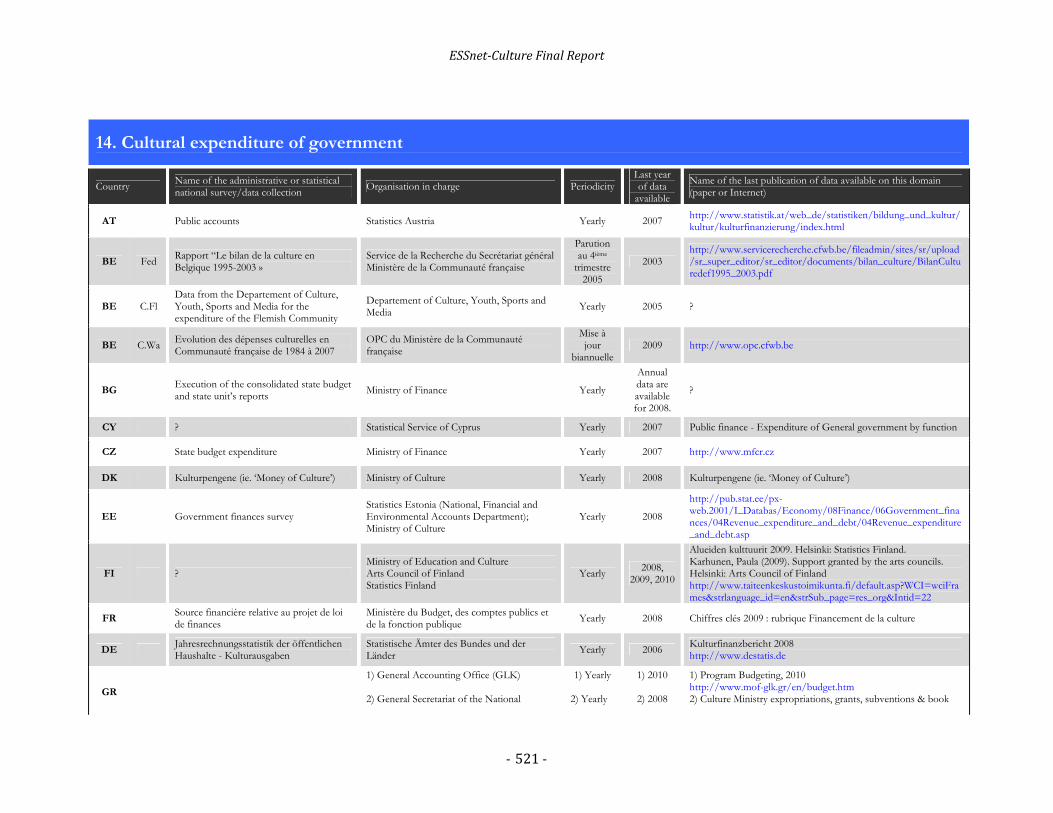
ESSnet‐CultureFinalReport
- 521-
14. Cultural expenditure of government
Country Name of the administrative or statistical national survey/data collection
Organisation in charge Periodicity Last year of data
available
Name of the last publication of data available on this domain (paper or Internet)
AT Public accounts Statistics Austria Yearly 2007 http://www.statistik.at/web_de/statistiken/bildung_und_kultur/kultur/kulturfinanzierung/index.html
BE Fed Rapport “Le bilan de la culture en Belgique 1995-2003 »
Service de la Recherche du Secrétariat général Ministère de la Communauté française
Parution au 4ième
trimestre 2005
2003 http://www.servicerecherche.cfwb.be/fileadmin/sites/sr/upload/sr_super_editor/sr_editor/documents/bilan_culture/BilanCulturedef1995_2003.pdf
BE C.Fl Data from the Departement of Culture, Youth, Sports and Media for the expenditure of the Flemish Community
Departement of Culture, Youth, Sports and Media
Yearly 2005 ?
BE C.Wa Evolution des dépenses culturelles en Communauté française de 1984 à 2007
OPC du Ministère de la Communauté française
Mise à jour
biannuelle 2009 http://www.opc.cfwb.be
BG Execution of the consolidated state budget and state unit’s reports
Ministry of Finance Yearly
Annual data are available for 2008.
?
CY ? Statistical Service of Cyprus Yearly 2007 Public finance - Expenditure of General government by function
CZ State budget expenditure Ministry of Finance Yearly 2007 http://www.mfcr.cz
DK Kulturpengene (ie. ‘Money of Culture’) Ministry of Culture Yearly 2008 Kulturpengene (ie. ‘Money of Culture’)
EE Government finances survey Statistics Estonia (National, Financial and Environmental Accounts Department); Ministry of Culture
Yearly 2008
http://pub.stat.ee/px-web.2001/I_Databas/Economy/08Finance/06Government_finances/04Revenue_expenditure_and_debt/04Revenue_expenditure_and_debt.asp
FI ? Ministry of Education and Culture Arts Council of Finland Statistics Finland
Yearly 2008,
2009, 2010
Alueiden kulttuurit 2009. Helsinki: Statistics Finland. Karhunen, Paula (2009). Support granted by the arts councils. Helsinki: Arts Council of Finland http://www.taiteenkeskustoimikunta.fi/default.asp?WCI=wciFrames&strlanguage_id=en&strSub_page=res_org&Intid=22
FR Source financière relative au projet de loi de finances
Ministère du Budget, des comptes publics et de la fonction publique
Yearly 2008 Chiffres clés 2009 : rubrique Financement de la culture
DE Jahresrechnungsstatistik der öffentlichen Haushalte - Kulturausgaben
Statistische Ämter des Bundes und der Länder
Yearly 2006 Kulturfinanzbericht 2008 http://www.destatis.de
GR
1) General Accounting Office (GLK) 2) General Secretariat of the National
1) Yearly
2) Yearly
1) 2010
2) 2008
1) Program Budgeting, 2010 http://www.mof-glk.gr/en/budget.htm 2) Culture Ministry expropriations, grants, subventions & book

ESSnet‐CultureFinalReport
- 522-
Statistical Service of Greece (ESYE) purchases.
HU ? Ministry of Finance ? 2008 Hungarian Statistical Yearbook (paper+cd)
IS Public finance (Central Government) Statistics Iceland Yearly 2008 Data on Web, http://www.statice.is
IT “Relazione sull’utilizzazione del Fondo Unico per lo Spettacolo”
Ministry of Heritage and Cultural Activities Yearly 2008 http://www.spettacolodalvivo.beniculturali.it/attivit%C3%A0/relfus/2008/relazione.asp
LT State budget expenditure on recreation, culture and religion
Statistics Lithuania Yearly 2009
Statistical Yearbook of Lithuania http://www.stat.gov.lt http://db1.stat.gov.lt/statbank/default.asp?w=1280
LU Centralisation de données budgétaires et financières de l’Etat sur la culture
Ministry of Culture Yearly 2006 http://www.mc.public.lu
LV Administrative data As from the middle of 2010: Cultural Digital Map of Latvia
Ministry of Culture of Latvia Yearly 2008 ?
MT
In all our culture related surveys, the government’s financial input is collected as one of the variables; Government financial transfers to government-funded cultural organisations, as well as their expenditure, is available as well
- - - -
NO Statistics on Public Expenditure and Financing
Ministry of Culture Norway Yearly 2008 Culture statistics 2008 (Paper and internet) http://www.ssb.no/english/subjects/07/nos_cultural/
PL Statutory activity Ministry of Culture and National Heritage Yearly 2009 Data available at: http://www.mkidn.gov.pl/ministerstwo/budzet_ministerstwa.html
PT ? Ministry of Culture Yearly 2009 Culture Statistics 2008 (paper and Internet http://www.ine.pt) data frames on cultural statistics accessible via Internet
RO State budget: Annual budget of the Ministry of Culture and National Heritage
Ministry of Culture and National Heritage H http://www.cultura.ro H
Yearly 2010
Annual budget of the Ministry of Culture and National Heritage – 2010 http://www.mfinante.ro/link.jsp?body=/buget/index2010.htm http://discutii.mfinante.ro/static/10/Mfp/buget2010_aprobat/27Ministerul_Culturii_si_Patrimoniului_National.pdf
SK
KULT (MKSR) 1-01 KULT (MKSR) 3-01 KULT (MKSR) 5-01 KULT (MKSR) 6-01 KULT (MKSR) 9-01 KULT (MKSR) 10-01 KULT (MKSR) 12-01 KULT (MKSR) 16-01 KULT (MKSR) 17-01
MK SR Yearly 2008 Cultural Statistics 2008 (http://www.culture.gov.sk)

ESSnet‐CultureFinalReport
- 523-
SI General overview of the Culture (different surveys)
Ministry of Culture of Republic of Slovenia Ministry of Finance Republic of Slovenia Statistical Office of the Republic of Slovenia
Yearly 2008 ?
ES Statistics on Public Expenditure and Financing on Culture
Ministry of Culture of Spain
Yearly 2007
-Yearbook on Cultural Statistics 2009 (paper and Internet http://www.mcu.es) -CULTURAbase (database on cultural statistics accessible via Internet http://www.mcu.es/culturabase/cgi/um?L=0)
SE ? Swedish Arts Council Every second
year 2006/2007
Kulturens finansiering – Cultural funding http://www.kulturradet.se/Documents/publikationer/2008/kulturens%20finansiering/kulturens_finansiering_2007.pdf
CH Statistique suisse des dépenses publiques pour la culture
Office fédéral de la statistique Yearly 2007 A paraître prochainement sur le site de l’OFS http://www.bfs.admin.ch/bfs/portal/fr/index/themen/16/02.html
TR Ministry of finance Turkish Statistical Institute Avail in
2011 - -

ESSnet‐CultureFinalReport
- 524-
15. Cultural public expenditure (Regional and local authorities)
Country Level
Name of the administrative or statistical national survey/data collection
Organisation in charge Periodicity Last year of data
available
Name of the last publication of data available on this domain (paper or Internet)
AT Public accounts Statistics Austria Yearly 2007 http://www.statistik.at/web_de/statistiken/bildung_und_kultur/kultur/kulturfinanzierung/index.html
BE Fed - - - - -
BE C.Fl - - - - -
BE C.Wa
Bilan de la Culture 1995-2003 – partie I Dépenses et recettes 2004-2005 des communes et des provinces en régions wallonne et bruxelloise
OPC et Service de la Recherche du Ministère de la Communauté française Service de la Recherche du Ministère de la Communauté française
Mise à jour et
réécriture tous les deux ans
2007
2009 http://servicerecherche.cfwb.be/
BG - - - - -
CY - - - - -
CZ State budget expenditure Ministry of Finance Yearly 2007 http://www.mfcr.cz
DK Kulturpengene (ie. ‘Money of Culture’) Ministry of Culture Yearly 2008 Kulturpengene (ie. ‘Money of Culture’)
EE Government finances survey Statistics Estonia (National, Financial and Environmental Accounts Department)
Yearly 2008
http://pub.stat.ee/px-web.2001/I_Databas/Economy/08Finance/06Government_finances/02Local_government_budgets/02Local_government_budgets.asp
FI ? Ministry of Education, Arts Council of Finland, Statistics Finland
Yearly 2008 Alueiden kulttuurit 2009. Helsinki: Statistics Finland.
FR Enquête nationale sur les dépenses culturelles des collectivités locales.
MCC / DEPS Supra-
annuelle (2-3 ans)
2006
Culture Chiffres-2009-3 : Les dépenses culturelles des collectivités locales en 2006 : près de 7 milliards d’euros pour la culture (http://www2.culture.gouv.fr/culture/deps/2008/pdf/Cchiffres09_3.pdf) Chiffres clés : rubrique Financement de la culture
DE Jahresrechnungsstatistik der öffentlichen Haushalte - Kulturausgaben
Statistische Ämter des Bundes und der Länder
Yearly 2006 Kulturfinanzbericht 2008 http://www.destatis.de
GR ? General Accounting Office (GLK) Yearly 2010 Program Budgeting, 2010 http://www.mof-glk.gr/en/budget.htm
HU ? Ministry of Finance ? 2008 Hungarian Statistical Yearbook (paper+cd)

ESSnet‐CultureFinalReport
- 525-
IS Public finance (Local Government) Statistics Iceland Annually 2008 Data on Web, http://www.statice.is
IT “Relazione sull’utilizzazione del Fondo Unico per lo Spettacolo”
Ministry of Heritage and Cultural Activities Yearly 2008 http://www.spettacolodalvivo.beniculturali.it/attivit%C3%A0/relfus/2008/relazione.asp
LT Municipal budget expenditure on recreation, culture and religion
Statistics Lithuania Yearly 2009 Statistical Yearbook of Lithuania http://www.stat.gov.lt http://db1.stat.gov.lt/statbank/default.asp?w=1280
LU Centralisation de données budgétaires et financières des communes sur la culture
Ministry of Culture Yearly 2006 http://www.mc.public.lu
LV As from the middle of 2010: Cultural Digital Map of Latvia
Ministry of Culture of Latvia Yearly - -
MT National data estimated by National Accounts Unit
- - - -
NO Statistics on Public Expenditure and Financing
Statistics Norway Yearly 2008
Culture statistics 2008 (Paper and internet) http://www.ssb.no/english/subjects/07/nos_cultural/ KOSTRA (database on local expenditures on cultural expenditure)
PL F-02dk Report on finances of cultural institutions
Central Statistical Office, Statistical Office in Cracow
Yearly 2008 Data available in the Regional Data Bank at: http://www.stat.gov.pl/gus/index_ENG_HTML.htm
PT Public financing to cultural activities by municipalities Survey
National Statistics Institute Yearly 2008
Culture Statistics 2008 (paper and Internet http://www.ine.pt) (data frames on cultural statistics accessible via Internet) Statistical Yearbook of Portugal 2008 (paper and Internet http://www.ine.pt) Regional Statistical Yearbook 2008 (paper and Internet http://www.ine.pt) Social Indicators 2008 (paper and Internet http://www.ine.pt)
RO - - - - -
SK - - - - -
SI - - - - -
ES Statistics on Public Expenditure and Financing on Culture
Ministry of Culture of Spain
Yearly 2007
Yearbook on Cultural Statistics 2009 (paper and Internet http://www.mcu.es) CULTURAbase (database on cultural statistics accessible via Internet http://www.mcu.es/culturabase/cgi/um?L=0)
SE ? Swedish Arts Council Every second
year 2006/2007
Kulturens finansiering – Cultural funding http://www.kulturradet.se/Documents/publikationer/2008/kulturens%20finansiering/kulturens_finansiering_2007.pdf

ESSnet‐CultureFinalReport
- 526-
CH Statistique suisse des dépenses publiques pour la culture
Office fédéral de la statistique Yearly 2007 A paraître prochainement sur le site de l’OFS http://www.bfs.admin.ch/bfs/portal/fr/index/themen/16/02.html
TR Household budget survey Turkish Statistical Institute Avail in
2011
Household budget survey
Turkish Statistical Institute

ESSnet‐CultureFinalReport
- 527-
16. Artistic and cultural education
Country Level
Name of the administrative or statistical national survey/data collection
Organisation in charge Periodicity Last year of data
available
Name of the last publication of data available on this domain (paper or Internet)
AT Music school statistics; University statistics
Konferenz der österreichischen Musikschulwerke; Statistics Austria
Yearly 2007 http://www.statistik.at/web_de/statistiken/bildung_und_kultur/kultur/ausbildung_weiterbildung/index.html
BE Fed - - - - -
BE C.Fl - - - - -
BE C.Wa Statistiques de l’enseignement ETNIC, sur base des informations fournies par les services de l’enseignement du Ministère de la Communauté française
Mises à jour
régulières, pas
toujours disponible
s au public.
2009 http://statistiques.cfwb.be/index.php
BG
The National Statistical Institute conducts yearly exhaustive surveys about activitys of the cultural educational institutions Education statistics includs the observation of art schools in secondary education with ‘Report about schools’. The survey provides data about students enrolled, teaching staff, new entrants, graduates students by specialities/fields of the International Standard Classification of Education - revision 1997 (ISCED - 97). Statistical survey of the higher education covers all art tertiary schools with ‘Report about Tertiary education for acquiring the qualification degrees ‘Professional Bachelor’, ‘Bachelor’ and ‘Master’ in colleges, universities and equivalent higher schools’.
National Statistical Institute Yearly 2008/2009
school year
Education in the Republic of Bulgaria 2009
CY Annual Survey on Education Statistical Service of Cyprus Yearly 2007/2008 Statistics of Education
CZ Survey of Ministry of education Institute for Information on Education Yearly 2007/2008 http://www.uiv.cz
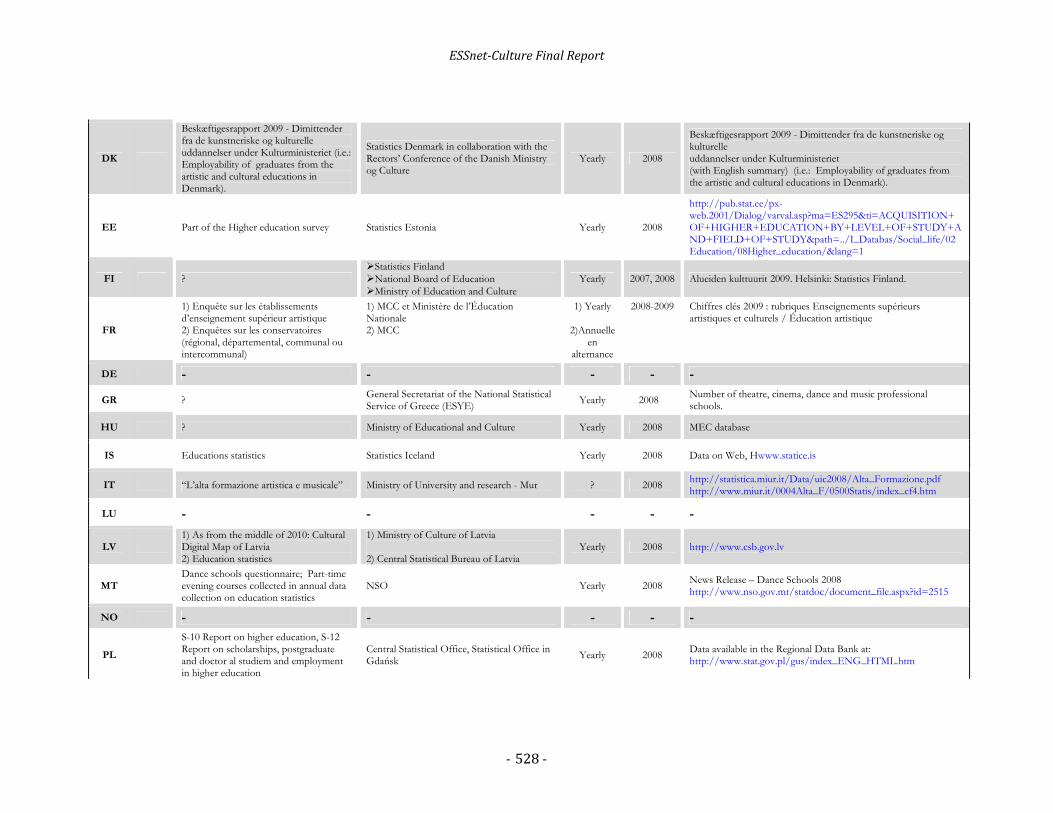
ESSnet‐CultureFinalReport
- 528-
DK
Beskæftigesrapport 2009 - Dimittender fra de kunstneriske og kulturelle uddannelser under Kulturministeriet (i.e.: Employability of graduates from the artistic and cultural educations in Denmark).
Statistics Denmark in collaboration with the Rectors’ Conference of the Danish Ministry og Culture
Yearly 2008
Beskæftigesrapport 2009 - Dimittender fra de kunstneriske og kulturelle uddannelser under Kulturministeriet (with English summary) (i.e.: Employability of graduates from the artistic and cultural educations in Denmark).
EE Part of the Higher education survey Statistics Estonia Yearly 2008
http://pub.stat.ee/px-web.2001/Dialog/varval.asp?ma=ES295&ti=ACQUISITION+OF+HIGHER+EDUCATION+BY+LEVEL+OF+STUDY+AND+FIELD+OF+STUDY&path=../I_Databas/Social_life/02Education/08Higher_education/&lang=1
FI ? Statistics Finland National Board of Education Ministry of Education and Culture
Yearly 2007, 2008 Alueiden kulttuurit 2009. Helsinki: Statistics Finland.
FR
1) Enquête sur les établissements d’enseignement supérieur artistique 2) Enquêtes sur les conservatoires (régional, départemental, communal ou intercommunal)
1) MCC et Ministère de l’Éducation Nationale 2) MCC
1) Yearly
2)Annuelle en
alternance
2008-2009 Chiffres clés 2009 : rubriques Enseignements supérieurs artistiques et culturels / Éducation artistique
DE - - - - -
GR ? General Secretariat of the National Statistical Service of Greece (ESYE)
Yearly 2008 Number of theatre, cinema, dance and music professional schools.
HU ? Ministry of Educational and Culture Yearly 2008 MEC database
IS Educations statistics Statistics Iceland Yearly 2008 Data on Web, Hwww.statice.is
IT “L’alta formazione artistica e musicale” Ministry of University and research - Mur ? 2008 http://statistica.miur.it/Data/uic2008/Alta_Formazione.pdf http://www.miur.it/0004Alta_F/0500Statis/index_cf4.htm
LU - - - - -
LV 1) As from the middle of 2010: Cultural Digital Map of Latvia 2) Education statistics
1) Ministry of Culture of Latvia 2) Central Statistical Bureau of Latvia
Yearly 2008 http://www.csb.gov.lv
MT Dance schools questionnaire; Part-time evening courses collected in annual data collection on education statistics
NSO Yearly 2008 News Release – Dance Schools 2008 http://www.nso.gov.mt/statdoc/document_file.aspx?id=2515
NO - - - - -
PL
S-10 Report on higher education, S-12 Report on scholarships, postgraduate and doctor al studiem and employment in higher education
Central Statistical Office, Statistical Office in Gdańsk
Yearly 2008 Data available in the Regional Data Bank at: http://www.stat.gov.pl/gus/index_ENG_HTML.htm

ESSnet‐CultureFinalReport
- 529-
PT Administrative data Ministry of Education Yearly 2008-2009 Culture Statistics 2008 (paper and Internet http://www.ine.pt) data frames on cultural statistics accessible via Internet
RO UOE data collection National Institute of Statistics Yearly 2008 Education System in Romania – syntetic data
SK - - - - -
SI Education statistics Statistical Office of the Republic of Slovenia
ES Statistical exploitation of several surveys on education
Ministry of Culture of Spain Organisation in charge of the surveys used for the statistical exploitation: National Statistics Institute, Ministry of Education and Science and Ministry of Labour and Inmigration of Spain
Yearly
2007-2008
Results from the statistical exploitation on the cultural field can be consulted in: Yearbook on Cultural Statistics 2009 (paper and Internet) http://www.mcu.es CULTURAbase (database on cultural statistics accessible via Internet), http://www.mcu.es/culturabase/cgi/um?L=0
SE Data ss included in annual report from the National Agency for Higher Education, but no separate publication
- - - -
CH - - - - -
TR Ministry of National Education Turkish Statistical Institute Avail in
2011 - -

ESSnet‐CultureFinalReport
- 530-
17. Cultural professions and cultural employment
Country Level
Name of the administrative or statistical national survey/data collection
Organisation in charge Periodicity Last year of data
available
Name of the last publication of data available on this domain (paper or Internet)
AT Labour Force Survey Statistics Austria Yearly 2008 http://www.statistik.at/web_de/statistiken/bildung_und_kultur/kultur/beschaeftigung_im_kulturellen_sektor/index.html
BE Fed - -
BE C.Fl RSZ, Direction générale Statistique et Information économique
RSZ, Direction générale Statistique et Information économique
Yearly 2007 -
BE C.Wa Statistiques de l’enseignement ETNIC, sur base des informations fournies par les services de l’enseignement du Ministère de la Communauté française
Mises à jour régulières,
pas toujoursdisponibles au public.
2009 http://statistiques.cfwb.be/index.php
BG Labour Force Survey
National Statistical Institute
Quarterly on a
continuous base.
Annual data are available for 2008.
There is no publication on cultural employment either printed or digital. Data are provided to users by request.
CY Employment Survey Statistical Service of Cyprus Yearly ? Labour Statistics
CZ Annualy surveys on cultural institutions NICCC Yearly 2008 http://www.nipos-mk.cz/?cat=126
DK
Beskæftigesrapport 2009 - Dimittender fra de kunstneriske og kulturelle uddannelser under Kulturministeriet (i.e.: Employability of graduates from the artistic and cultural educations in Denmark).
Statistics Denmark in collaboration with the Rectors’ Conference of the Danish Ministry og Culture
Yearly 2008
Beskæftigesrapport 2009 - Dimittender fra de kunstneriske og kulturelle uddannelser under Kulturministeriet (with English summary) (i.e.: Employability of graduates from the artistic and cultural educations in Denmark).
EE Labour force survey Statistics Estonia Yearly 2008 http://pub.stat.ee/px-web.2001/I_Databas/Social_life/09Labour_market/04Employed_persons/02Annual_statistics/02Annual_statistics.asp
FI ? Statistics Finland Ministry of Employment and the Economy Arts Council of Finland
Yearly 2007,
2008, 2009Alueiden kulttuurit 2009. Helsinki: Statistics Finland
FR 1) Enquête Emploi 2) Source administrative : déclarations annuelles de données sociales
1) Insee 2) Insee Yearly 2006 Chiffres clés 2009 : rubrique professions culturelles et emploi

ESSnet‐CultureFinalReport
- 531-
DE Mikrozensus Erwerbstätige in Kulturberufen
Statistische Ämter des Bundes und der Länder
Yearly 2008 Kulturindikatoren auf einen Blick – 2008 http://www.destatis.de
GR ? General Secretariat of the National Statistical Service of Greece (ESYE)
Quarterly 2008
Employment by Education, Occupation in last job, Permanent/temporary job, Reference Period, Sex, NUT II, Age Group, Economic activity, Professional status and Nationality http://www.statistics.gr/portal/page/portal/ESYE/PAGE-database
HU ? Ministry of Educational and Culture Yearly 2008 MEC database
IS Labour Force Survey Statistics Iceland Quarterly 2009 Data on Web, http://www.statice.is
IT - - - - -
LT Labour Force Survey Statistics Lithuania Yearly 2009 http://www.stat.gov.lt http://db1.stat.gov.lt/statbank/default.asp?w=1280
LU - - - - -
LV
1) Structure of Earnings Survey 2) Pārskats par darbu 2-darbs
1) Central Statistical Bureau of Latvia 1) Once for 4 years 2) Quarter,
year
1) 2006
2) 2009
1) http://www.csb.gov.lv Publication ‘Results of the survey of Earnings structure 2006’ 2) http://www.csb.gov.lv
MT
Official employment data collected from LFS; occupation coded by ISCO; economic activity of place of work coded by NACE; both codes sent to Eurostat at 4 digit level for ISCO and 3 digit level for NACE. Information from the LFS is published on quarterly basis at ISCO 1-digit level. Consequently extraction of this information is made available only through customised reports.
NSO Quarterly Q2/2009 News release - Labour Force Survey http://www.nso.gov.mt/statdoc/document_view.aspx?id=887
NO Register based employment statistics (only employment, not professions)
Statistics Norway Yearly 2008 Culture statistics 2008 (Paper and internet http://www.ssb.no/english/subjects/07/nos_cultural/
PL DG-1 Report on the economic activity Central Statistical Office, Statistical Office in Poznań
Once a month
November 2009
Data available in the Regional Data Bank at: http://www.stat.gov.pl/gus/index_ENG_HTML.htm
PT Labour Force Survey National Statistics Institute Yearly 2009 -Culture Statistics 2008 (paper and Internet http://www.ine.pt) -Data frames statistics accessible via Internet
RO Labour Force Survey National Institute of Statistics Yearly 2008 Labour Force in Romania: employment and unemployment
SK - - - - -

ESSnet‐CultureFinalReport
- 532-
SI General overview of the Culture (more surveys from the field of culture; LFS; Statistical data base of employeed)
Statistical Office of the Republic of Slovenia Yearly 2008 ?
ES Statistical exploitation of the Economically Active Population Survey
Organisation in charge of the exploitation: Ministry of Culture of Spain Organisation in charge of the survey used for the statistical exploitation: National Statistics Institute of Spain
Annual 2008
Results from the statistical exploitation on the cultural field can be consulted in: Yearbook on Cultural Statistics 2009 (paper and Internet http://www.mcu.es) CULTURAbase (database on cultural statistics accessible via Internet http://www.mcu.es/culturabase/cgi/um?L=0)
SE Is retrievable from Statistics Sweden, but is not published separately
- - - -
CH - - - - -
TR - - - - -

ESSnet‐CultureFinalReport
- 533-
18. Digitalization of the cultural heritage
Country Level
Name of the administrative or statistical national survey/data collection
Organisation in charge Periodicity Last year of data
available
Name of the last publication of data available on this domain (paper or Internet)
AT - - - - -
BE Fed
1) Plan de numérisation des ESF (Etablissements Scientifiques Fédéraux) et de la CRB (Cinémathèque Royale de Belgique) 2) Projet ‘NUMERIC’
1) Service d’information scientifique et technique (SIST) 2) Service d’information scientifique et technique (SIST)
Annuelle depuis 2005
-
2009
2008
http://digipat.stis.fgov.be/digipat.asp?id=10;20&lang=FR http://www.numeric.ws/framework/international.asp?catref=50&country=56
BE C.Fl Numeric Numeric-project - 2008 http://www.numeric.ws/uploaded_files/NUMERIC%20Newsletter%20Nov%202008%20Issue%204.pdf
BE C.Wa
1) Projet européen “NUMERIC” 2) Plan PEP’S (Plan de Préservation et d’Exploitation de Patrimoines)
1) Observatoire des Politiques culturelles 2) Délégation générale à la préservation et à l’exploitation des patrimoines (PEPs) du Ministère de la Communauté française
- -
2008 -
http://www.numeric.ws/framework/international.asp?catref=50&country=56 http://www.nuermiques.be
BG Digitalisation and Online accessibility ; Digital preservation
Ministry of Culture Every 2
years 2006-2007
http://www.minervaeurope.org/publications/globalreport/globalrepdf07/Bulgaria.pdf
CY - - - - -
CZ - - - - -
DK - - - - -
EE - - - - -
FI - - - - -
FR - - - - -
DE - - - - -
GR - - - - -
HU - - - - -
IS - - - - -

ESSnet‐CultureFinalReport
- 534-
IT - - - - -
LT Register of Cultural Properties of the Republic of Lithuania
Department of Cultural Heritage Annual 2009 http://www.stat.gov.lt http://db1.stat.gov.lt/statbank/default.asp?w=1280
LU - - - - -
LV
Latvian National Digital Library Joint Catalogue of National Holdings Virtual archival reading room ‘Raduraksti’ (Genealogy)
State Agency "Culture Information Systems" Ministry of Culture of Latvia National Library of Latvia Latvian State Historical Archives
Constantly updated
?
http://www.kis.gov.lv http://www.lnb.lv/en/digital-library http:///www.nmkk.lv http://www.lvva-raduraksti.lv/en.html
MT - - - - -
NO - - - - -
PL - - - - -
PT - - - - -
RO
203B1)? 204B2) Digitalization of cultural heritage in Europe 3)?
1) Romanian National Library H http://www.bibnat.ro H 2) Centre for Research on Culture, subordinated to Ministry of Culture and National Heritage H http://www.culturadata.ro H 3) CIMEC - Institute for Cultural Memory H http://www.cimec.roH
? ? ?
2008 ? ?
1)Digitalization of cultural heritage in Europe-paper 2) The diagnosis of culture in the urban space 3) Inventory of digitized documents in the National Libraries Systems http://www.bibnat.ro/Inventarierea-documentelor-digitizate-s160-ro.htm
SK - - - - -
SI - - - - -
ES - - - - -
SE - - - - -
CH - - - - -
TR - - - - -

ESSnet‐CultureFinalReport
- 535-
19. Cultural industries
Country Level
Name of the administrative or statistical national survey/data collection
Organisation in charge Periodicity Last year of data
available
Name of the last publication of data available on this domain (paper or Internet)
AT - - - - -
BE Fed Données de l’enquête ESE (Enquête sur la Structure des Entreprises)
Direction Générale Statistique Information Economique (DGSIE)
Annuelle depuis 1996
2006 http://statbel.preview.pr.belgium.be/fr/statistiques/chiffres/economie/entreprises/structure/index.jsp
BE C.Fl Research on behalf of the Departement of Culture, Youth, Sports and Media
Departement of Culture, Youth, Sports and Media
Irregular 2006, 2007
Drie sectoren in de Vlaamse Creatieve Industrie – De boekenindustrie, de muziekindustrie en de beeldende kunstenindustrie http://www.cjsm.vlaanderen.be/cultuurbeleid/themas/cultuurindustrie/index.html#wso
BE C.Wa - - - - -
BG Annual statistical survey by economic activities - reference for enterprise business activities
National Statistical Institute Yearly
Annual data are available for 2008
?
CY Business Register Statistical Service of Cyprus Yearly 2008 ?
CZ - - - - -
DK - - - - -
EE Analytical publication “Kultuur 1997-2007 Culture”
Statistics Estonia ? 2007 http://www.stat.ee/31386
FI Statistics Finland (Business Register; National Accounts)
Yearly 2007, 2008Alueiden kulttuurit 2009. Helsinki: Statistics Finland http://tilastokeskus.fi/til/klt/2007/klt_2007_2009-03-05_tie_001_en.html
FR
Industries culturelles : Enquête sur les entreprises des industries culturelles de l’écrit (livre, presse), du son et de l’image (enregistrements sonores, cinéma, radio, télévision, vidéo, jeux électroniques,) et des agences de presse
Insee Yearly 2006 Chiffres clés 2009 : rubriques Livre / Presse / Disques / Cinéma / Vidéo
DE - - - - -

ESSnet‐CultureFinalReport
- 536-
GR
General Secretariat of the National Statistical Service of Greece (ESYE)
Quarterly 2008 Statistical database (Dataset selection) Manufacturing & Trade - services http://www.statistics.gr/portal/page/portal/ESYE/PAGE-database
HU - - - - -
IS - - - - -
IT - - - - -
LT - - - - -
LU - - - - -
LV ? Ministry of Culture of Latvia
Update depending
on financial sources available
2006
Report 2008: Creative Industries in Latvia: Update of Statistical Data http://www.km.gov.lv/lv/doc/starpnozares/petijumi/RI_Datu_aktualizacija_par_2006.pdf (in Latvian)
MT - - - - -
NO Enterprises, turnover and employment in cultural industries
Statistics Norway Yearly 2008 Culture statistics 2008 (Paper and internet http://www.ssb.no/english/subjects/07/nos_cultural/
PL - - - - -
PT Integrated Business Accounts System National Statistics Institute Yearly 2007 Data frames on business statistics accessible via Internet
RO Draft for a policy aimed at stimulating creativity
Centre for Research on Culture, subordinated to Ministry of Culture and National Heritage H http://www.culturadata.ro H
? 2008 Paper ‘The diagnosis of culture in the urban space’
SK - - - - -
SI - - - - -
ES Statistical exploitation of several surveys on companies
Organisation in charge of the exploitation: Ministry of Culture of Spain Organisation in charge of the surveys used for the statistical exploitation: National Statistics Institute of Spain
Yearly 2008
Results from the statistical exploitation on the cultural field can be consulted in: Yearbook on Cultural Statistics 2009 (paper and Internet http://www.mcu.es) CULTURAbase (database on cultural statistics accessible via Internet http://www.mcu.es/culturabase/cgi/um?L=0)
SE Work in progress… - - - -

ESSnet‐CultureFinalReport
- 537-
CH - - - - -
TR - - - - -


ESSnet‐CultureFinalReport
- 539-
91BAnnex 7: Partners of ESSnet-Culture project I - General coordination of the ESSnet-Culture
Luxembourg
M. Guy FRANK
ESSnet-Culture Project Coordinator Ministry of Culture Finances and cultural statistics department (CoStac)
Email : [email protected]
M. Philippe ROBIN
Ministry of Culture Finances and cultural statistics department (CoStac)
Email: [email protected]
France
M. Philippe CHANTEPIE
Leader of the Task Force 1: ‘Framework for cultural statistics and definitions’ Ministry of Culture and Communication Department for studies, strategic foresight and statistics (DEPS) Email: [email protected]
Ms. Valérie DEROIN
Ministry of Culture and Communication - Department for studies, strategic foresight and statistics (DEPS) Email: [email protected]
Czech Republic
M. Josef KOTÝNEK
Leader of the Task Force 2 : ‘Financing and expenditure’ Czech Statistical Office (CSÚ) Email: [email protected]
M. Jaroslav NOVÁK
Czech Statistical Office - Education, Culture and Social Security Statistics Section
Email: [email protected]
Estonia Netherlands
M. Kutt KOMMEL
Leader of the Task Force 3 : ‘Cultural industries’ Statistics Estonia
Email: [email protected]
M. Vladimír BÍNA
Leader of the Task Force 4 : ‘Cultural pratices and social aspects of culture’ Ministry of Education, Culture and Science Email: [email protected]
European Commission - ESTAT
Ms. Marta BECK-DOMZALSKA
European Commission- Eurostat Unit F4 - Education, science and culture statistics
Email : [email protected]

ESSnet‐CultureFinalReport
- 540-
Other steering committee’s members of the project
European Commission - ESTAT European Commission – DG EAC
Ms. Christine COIN
European Commission- Eurostat Unit F4 - Education, science and culture statistics Email : [email protected]
M. Sylvain PASQUA
European Commission- Directorate General for Education and Culture Email: [email protected]
Spain
Ms. Maria Angeles PEREZ-CORRALES
Ministry of Culture Division of Cultural Statistics Email: [email protected]

ESSnet‐CultureFinalReport
- 541-
II - PARTICIPANTS AND MEMBERS OF THE ESSnet-Culture
TF1 - FRAMEWORK FOR CULTURAL STATISTICS AND DEFINITIONS
* participant
AT M. Franz-Otto HOFECKER *
University of Music and Performing Arts Vienna - Institute of Culture Management and Culture Studies
Email.: [email protected] (Until September 2010)
DK Ms. Randi SVENDSEN
Danish Agency for Libraries and Media
Email: [email protected]
FI Ms. Mirja LIIKKANEN
Statistics Finland - Unit for Culture, leisure studies, time use
Email: [email protected]
Ms. Sari KARTTUNEN
Finnish Foundation for Cultural Policy Research-CUPORE
Email: [email protected]
FR M. Philippe CHANTEPIE
Leader of the Task Force Ministry of Culture and Communication Department for studies, strategic foresight and statistics (DEPS)
Email: [email protected]
Ms. Valérie DEROIN *
Ministry of Culture and Communication - Department for studies, strategic foresight and statistics (DEPS)
Email: [email protected]
Ms. Chantal LACROIX
Ministry of Culture and Communication - Department for studies, strategic foresight and statistics (DEPS)
E-mail: [email protected]
EL M. Nikolaos NEMPARIS
National Statistical Service of Greece
Email: [email protected]
IT M. Piro DISHNICA
Istituto Nazionale di Statistica
Email: [email protected]
M. Adolfo MORRONE
Istituto Nazionale di Statistica - Culture, leisure and new technologies
Email: [email protected]

ESSnet‐CultureFinalReport
- 542-
LT Ms. Gaile DAPSIENE
Statistics Lithuania -Education and Culture Statistics Unit
Email: [email protected]
LU M. Guy FRANK
Ministry of Culture - Finances and cultural statistics department (CoStac)
Email : [email protected]
M. Philippe ROBIN *
Ministry of Culture - Finances and cultural statistics department (CoStac)
Email: [email protected]
NL Ms. Jamilja VAN DER MEULEN *
Statistics Netherlands
Email: [email protected]
PL Ms. Agnieszka CHOCHOROWSKA
Statistical Office in Krakow
Email: [email protected]
PT Ms. Teresa DE SOUSA
Statistics Portugal
Email: [email protected]
SK M. Vladimir KACVINSKY
Statistical Office of the Slovak Republic - Social Statistics department
Email: [email protected]
ES Ms. Noemi VILLAZAN PELLEJERO
Ministry of Culture - Cultural statistics division
Email: [email protected]
SE M. Lars BAGER-SJÖGREN *
Agency for Growth Policy Evaluations and Analyses
Email:[email protected]
Ms. Anne KOLMODIN
Agency for Growth Policy Evaluations and Analyses
Email: [email protected]

ESSnet‐CultureFinalReport
- 543-
UK Ms. Rubbina KARRUNA *
Department for Culture, Media and Sport - Evidence & Analysis Unit
Email:[email protected]
M. Ed PICKERING
Department for Culture, Media and Sport -Evidence & Analysis Unit
Email: [email protected]
CH M. Umberto TEDESCHI
Swiss Federal Statistical Office - Culture Statistics Unit
Email: [email protected]
TR M. Ercüment TOKA
Turkish Statistical Institute
Email: [email protected]
ESTAT Ms. Marta BECK-DOMZALSKA
Eurostat - Unit F4: Education, science and culture statistics
Email:[email protected]

ESSnet‐CultureFinalReport
- 544-
TF2 - FINANCING AND EXPENDITURE ON CULTURE
* participant
AT M. Franz-Otto HOFECKER *
University of Music and Performing Arts Vienna - Institute of Culture Management and Culture Studies
Email: [email protected] (Until September 2010)
BE M. Vincent COUTTON
Directorate General Statistics Belgium - D.G. Statistique et Information
Email: [email protected] (From June 2010)
BG M. Stoyan BAEV
National Statistical Institute of Bulgaria
Email: [email protected]
CZ M. Josef KOTÝNEK
Leader of the Task Force Czech Statistical Office (CSÚ)
Email: [email protected]
M. Jaroslav NOVÁK *
Czech Statistical Office (CSU) - Email: [email protected]
DK Ms. Randi SVENDSEN
Danish Agency for Libraries and Media
Email: [email protected]
FR M. Bruno DIETSCH
Ministry of Culture and Communication - Department for studies, strategic foresight and statistics (DEPS)
Email: [email protected]
DE M. Frank SCHULLER
Federal Statistical Office - Statistisches Bundesamt
Email: [email protected]
Ms. Silvia VOGEL
Federal Statistical Office - Statistisches Bundesamt
Email: [email protected]

ESSnet‐CultureFinalReport
- 545-
LT Ms. Gaile DAPSIENE
Statistics Lithuania - Education and Culture Statistics Unit
Email: [email protected]
LU M. Guy FRANK
Ministry of Culture - Finances and cultural statistics department (CoStac)
Email : [email protected]
M. Philippe ROBIN
Ministry of Culture - Finances and cultural statistics department (CoStac)
Email: [email protected]
PL Ms. Agnieszka CHOCHOROWSKA
Statistical Office in Krakow
Email: [email protected]
M. Krzysztof JAKOBIK
Statistical Office in Krakow
Email: [email protected]
PT Ms. Teresa DE SOUSA
Statistics Portugal
Email: [email protected]
RO Ms. Georgeta ISTRATE
National Institute of Statistics of Romania
Email: [email protected] (From June 2010)
SI Ms. Brigita LIPOVŠEK
Ministry of Culture
Email: [email protected]
ES Ms. Noemi VILLAZAN PELLEJERO
Ministry of Culture - Cultural statistics division
Email: [email protected]
SE M. Erik PEURELL
Swedish Agency for Cultural Policy Analysis
Email: [email protected]
CH Ms. Stéphanie TORCHE
Swiss Federal Statistical Office - Culture Statistics Unit
Email: [email protected]

ESSnet‐CultureFinalReport
- 546-
TR M. Ercüment TOKA
Turkish Statistical Institute
Email: [email protected]
ESTAT Ms. Marta BECK-DOMZALSKA
Eurostat - Unit F4: Education, science and culture statistics
Email: [email protected]

ESSnet‐CultureFinalReport
- 547-
TF3 - CULTURAL INDUSTRIES * participant
DK M. Berit TAUL *
Statistics Denmark
Email: [email protected]
EE M. Kutt KOMMEL
Leader of the Task Force 3 Statistics Estonia
Email: [email protected]
Ms. Marve RANDLEPP *
Statistics Estonia - Population and Statistics Service
Email: [email protected] (Until April 2010)
M. Jorma SARV *
Estonian Ministry of Culture - Development department
Email: [email protected] (From July 2010)
FI Ms. Sari KARTTUNEN *
Finnish Foundation for Cultural Policy Research-CUPORE
Email: [email protected]
FR Ms. Marie GOUYON *
Ministry of Culture and Communication - Department for studies, strategic foresight and statistics (DEPS)
Email: [email protected]
DE M. Andreas BÜDINGER
Hessisches Statistisches Landesamt Email: [email protected]
EL M. Nikolaos NEMPARIS
National Statistical Service of Greece
Email: [email protected]
IT M. Piro DISHNICA
Istituto Nazionale di Statistica
Email: [email protected]

ESSnet‐CultureFinalReport
- 548-
LT Ms. Gaile DAPSIENE
Statistics Lithuania - Education and Culture Statistics Unit
Email: [email protected]
Ms. Valentina SAMIENE
Statistics Lithuania - Education and Culture statistics Unit
Email: [email protected]
LU M. Guy FRANK
Ministry of Culture - Finances and cultural statistics department (CoStac)
Email : [email protected]
M. Philippe ROBIN
Ministry of Culture - Finances and cultural statistics department (CoStac)
Email: [email protected]
NL Ms. Jamilja VAN DER MEULEN *
Statistics Netherlands
Email: [email protected]
PL Ms. Agnieszka CHOCHOROWSKA
Statistical Office in Krakow
Email: [email protected]
Ms KRYWULT-ALBANSKA Malgorazata
Statistical Office in Krakow - Center for Cultural Statistics
Email: [email protected]
RO Ms. Georgeta ISTRATE
National Institute of Statistics of Romania
Email: [email protected] (From June 2010)
ES Ms. Noemi VILLAZAN PELLEJERO
Ministry of Culture - Cultural statistics division
Email: [email protected]
SE Ms. Cajsa ANUFRIJEFF RÖHR
Swedish Arts Council - Department of communication and development
Email: [email protected]
M. Lars BAGER-SJÖGREN
Agency for Growth Policy Evaluations and Analyses
Email: [email protected]
Ms. Elin JAKOBSSON
Swedish Arts Council - Department of communication and development
Email: [email protected] (Until November 2010)
Ms. Anne KOLMODIN
Agency for Growth Policy Evaluations and Analyses
Email: [email protected]

ESSnet‐CultureFinalReport
- 549-
CH M. Umberto TEDESCHI
Swiss Federal Statistical Office - Culture Statistics Unit
Email: [email protected]
ESTAT Ms. Marta BECK-DOMZALSKA
Eurostat - Unit F4: Education, science and culture statistics
Email:H [email protected]

ESSnet‐CultureFinalReport
- 550-
TF4 – CULTURAL PRACTICES AND SOCIAL ASPECTS OF CULTURE
* participant
BE M. Guy PAUWELS * SVR-Research Centre of the Flemish Government - Service of studies of the Flemish government
Email: [email protected]
DK Ms. Randi SVENDSEN * Danish Agency for Libraries and Media
Email: [email protected]
EE Ms. Kaisa ARGE * Statistics Estonia - Population and Statistics Service
Email: [email protected] (From April 2010)
Ms. Nele PEIL * Statistics Estonia - Population and Statistics Service
Email: [email protected] (Until March 2010)
FI Ms. Mirja LIIKANEN *
Statistics Finland - Unit for Culture, leisure studies, time use
Email: [email protected]
FR Ms. Nathalie BERTHOMIER *
Ministry of Culture and Communication - Department for studies, strategic foresight and statistics (DEPS)
Email:[email protected]
HU Ms. Monika BARDOSI
Hungarian Central Statistical Office
Email: [email protected]
IT M. Adolfo MORRONE
Istituto Nazionale di Statistica - Culture, leisure and new technologies
Email: [email protected]
LV Ms. Anita ŠVARCKOPFA
Central statistical bureau of Latvia - Social Statistics department
Email: [email protected]

ESSnet‐CultureFinalReport
- 551-
LU M. Guy FRANK
Ministry of Culture - Finances and cultural statistics department (CoStac)
E-mail : [email protected]
M. Philippe ROBIN
Ministry of Culture - Finances and cultural statistics department (CoStac)
Email: [email protected]
MT Ms. Sarah GUSMAN-BUTTIGIEG
National Statistics Office - Demographic, Social and Culture Statistics Unit
Email.: [email protected]
Ms. Mary Rose DEBONO
National Statistics Office - Demographic, Social and Culture Statistics Unit
Email.: [email protected] (From June 2011)
NL M. Vladimír BÍNA
Leader of the Task Force Ministry of Education, Culture and Science
Email: [email protected]
M. Hans SCHMEETS *
Statistics Netherlands
Email.: [email protected]
PL Ms. Agnieszka CHOCHOROWSKA
Statistical Office in Krakow
Email: [email protected]
M. Stanislaw RADKOWSKI
Central Statistical Office of Poland
Email: [email protected]
SI Ms. Nadja SVETLIN-KASTELIC Statistical Office of the Republic of Slovenia
Email: [email protected]
ES Ms. Noemi VILLAZAN PELLEJERO
Ministry of Culture - Cultural statistics division
Email: [email protected]
SE M. Erik PEURELL Swedish Agency for Cultural Policy Analysis
Email: [email protected]
CH Ms. Stéphanie TORCHE Swiss Federal Statistical Office - Culture Statistics Unit
Email: [email protected]
TR M. Ercüment TOKA Turkish Statistical Institute
Email: [email protected]

ESSnet‐CultureFinalReport
- 552-
ESTAT Ms. Marta BECK-DOMZALSKA Eurostat - Unit F4: Education, science and culture statistics
Email:[email protected]

ESSnet‐CultureFinalReport
- 553-
92BAnnex 8: List of tables
Table 1 - ESSnet-Culture framework for cultural statistics: cultural activities by fonction .....52
Table 2 - Cultural domains by economic activities, NACE Rev.2 ...........................................64
Table 3 - NACE Rev.2 economic activities and their cultural rank .........................................71
Table 4 - Correspondence table of cultural activities with NACE Rev.2 classes, by function 73
Table 5 - Cultural domains by products classification (CPA) ..................................................75
Table 6 - Overall overview of the questionnaires ‘Public expenditure and direct receipts’ .....83
Table 7 - Overall overview of the questionnaires on HBS expenditure ...................................87
Table 8 - Overall overview of the questionnaires: Public expenditure and direct receipts ....107
Table 9 - Table of availability of data: Public expenditures on culture ..................................109
Table 10 - Table of availability of data: Financial sources of culture - Receipts ...................110
Table 11 - Overall overview of the questionnaires: HBS expenditure ...................................111
Table 12 - Gross consolited public expenditure on culture, Initial version ............................112
Table 13 - Gross consolited public expenditure and direct receipts on culture, Target version ................................................................................................................................113
Table 14 - Households expenditure on culture, Narrower version ........................................114
Table 15 - Households expenditure on culture, Broader version ...........................................115
Table 16 - Results of the pilot survey - Gross consolidated public expenditure on culture ...116
Table 17 - Summary of the national approaches of the Creative and Cultural Industries ......133
Table 18 - List of activity sectors composed of cultural activities only .................................142
Table 19 - List of activity sectors partially composed of cultural activities ...........................143
Table 20 - List of professional groups composed of cultural occupations only .....................144
Table 21 - List of professional groups partially composed of cultural occupations ...............145
Table 22 - Cultural activities NACE Rev.2 on 3-digit level ...................................................149
Table 23 - Cultural occupations ISCO-08 on 3-digit level .....................................................149
Table 24 - Classifications levels (NACE and ISCO) used by countries in national Labour Force Surveys (LFS) and transmitted to Eurostat ..................................................155
Table 25 - List of cultural occupations (ISCO-08) .................................................................156
Table 26 - Inclusion of cultural activities in NACE Rev.2.....................................................160
Table 27 - Inclusion of cultural occupations in ISCO-08 .......................................................162
Table 28 - ICET at work: points taken into account discussing each mode of cultural participation............................................................................................................237
Table 29 - Overview of the topics covered in the different national surveys .........................251
Table 30 - Survey characteristics ...........................................................................................253

ESSnet‐CultureFinalReport
- 554-
Table 31 - Samples .................................................................................................................254
Table 32 - List of indicators of cultural participation by level of priority ..............................261
Table 33 - Number of persons employed in Libraries, archives, museums and other cultural activities by age group, 2009 (in 1,000s) ...............................................................288
Table 34 - EU-27 external trade by CN, Jan-Dec 2009 (value in euros) ................................289
Table 35 - Geographical breakdown of the list present European data either grouped with Europe and North America, or detailed by each of the 151 State Parties ..............290
Table 36 - Coverage of book and press through the classifications NACE and CPA ............298
Table 37 - Coverage of books and press by economics European statistics...........................300
Table 38 - Enterprises statistics for books and press - main indicators, 2008 ........................301
Table 39 - SBS data on retail sale of books and press - main indicators, 2008 ......................302
Table 40 - Publishing activities: Index of turnover (2005=100) ............................................303
Table 41 - EU-27 External trade by CPA, 2009 (in euros) ....................................................304
Table 42 - EU-27 proportion of external trade with China, by CN and by CPA, 2009 .........304
Table 43 - Consumer prices of books and press, 2009 ...........................................................304
Table 44 - Coverage of Visual Arts by economic European statistics ...................................310
Table 45 - SBS statistics for Design Activities and Photographic Activities .........................311
Table 46 - EU-27 external trade in Visual Arts/Plastic Arts, by CN 2009, January - December 2009 (value in Euros) .............................................................................................312
Table 47 - EU-27 external trade in Visual Arts/Photography, by CPA 2008, January - December 2009 (value in Euros) ............................................................................312
Table 48 - Coverage of performing arts through the classifications NACE and CPA ...........316
Table 49 - Coverage of audiovisual and multimedia through the classifications NACE and CPA ........................................................................................................................321
Table 50 - Coverage of audiovisual and multimedia by economic European statistics .........322
Table 51 - SBS data for the Audiovisual sector - main indicators, 2008 ...............................324
Table 52 - SBS data for Retail sale of audiovisual goods - main indicators, 2008 ................326
Table 53 - EU-27 External trade by CPA, 2009 .....................................................................327
Table 54 - Number of persons employed (in 1000's) in Audiovisual (production and programming), by age group, 2009 ........................................................................327
Table 55 - SBS data on architectural services, 2008 ..............................................................330
Table 56 - ICH expression in Europe .....................................................................................340

ESSnet‐CultureFinalReport
- 555-
93BAnnex 9: List of figures
Figure 1 - Overview of ESSnet-Culture network partners .......................................................27
Figure 2 - Cultural domains and sub-domains: the LEG-Culture framework compared .........40
Figure 3 - ESSnet-Culture framework: the different dimensions of culture.............................47
Figure 4 - ESSnet-Culture framework: cultural activities ........................................................48
Figure 5 - Comparison of cultural domains covered by European and UNESCO frameworks for cultural statistics .................................................................................................54
Figure 6 - The statistical scope in terms of classifications and statistical sources of the framework for cultural statisitics..............................................................................59
Figure 7 - Financial flows (Direct expenditure/Receipts + Transfers) .....................................94
Figure 8 - Calculation (structure) – Gross and net expenditure ................................................97
Figure 9 - Definition of cultural employment ........................................................................141
Figure 10 - Attended live performances (at least once) in the last twelve months (age 25-64), SILC 2006 - AES 2007 ..........................................................................................245
Figure 11 - Attended cultural sites (at least once) in the last twelve months (age 25-64), SILC 2006 - AES 2007 ....................................................................................................246
Figure 12 - The process model for measuring CI spillover ....................................................377
Figure 13 - Mapping the challenge .........................................................................................402
Figure 14 - ICET at work: points taken into account discussing each mode of cultural participation............................................................................................................404
Figure 15 - Identical questions (in brackets) used by 15 EU-SILC countries of 16 social and cultural activities ....................................................................................................425
Figure 16 - Official and reported turnout figures most recent parliamentary elections, 2008 429
Figure 17 - Network of economic nomenclatures ..................................................................433
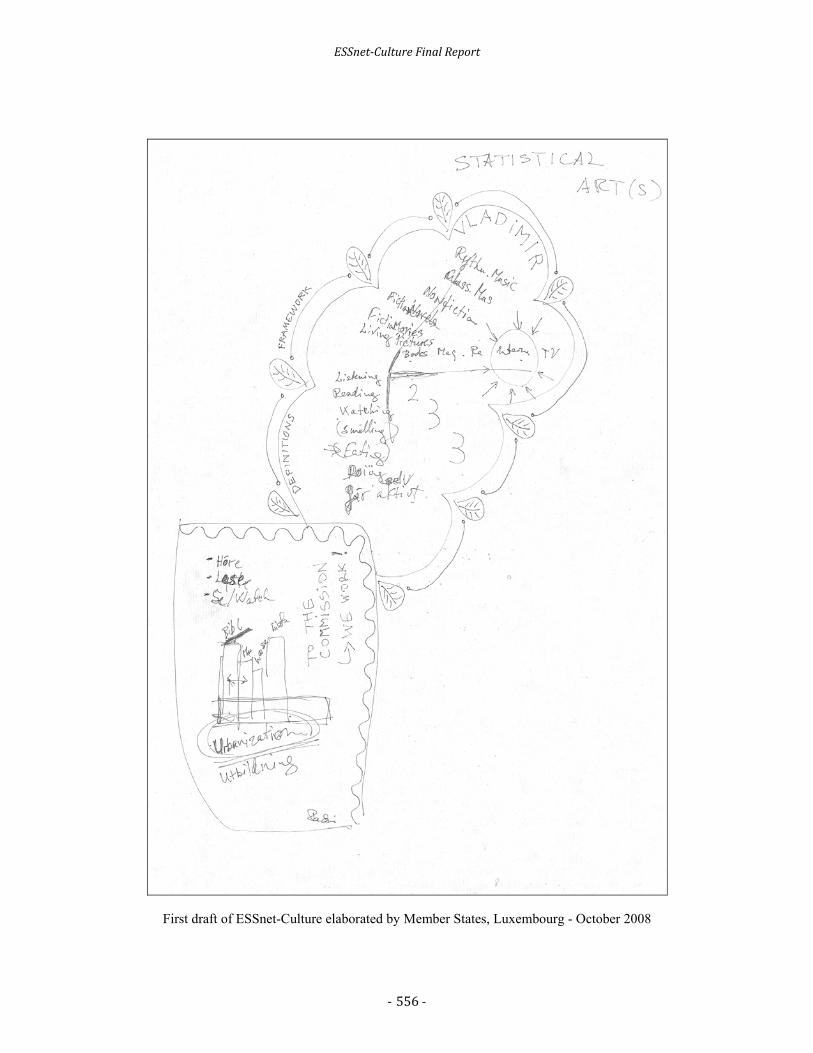
ESSnet‐CultureFinalReport
- 556-
First draft of ESSnet-Culture elaborated by Member States, Luxembourg - October 2008