TARGET MARKET: CHINA - European Commission
99
TARGET MARKET: CHINA MARKETING STRATEGIES FOR TOURISM DESTINATIONS A COMPETITIVE ANALYSIS
-
Upload
khangminh22 -
Category
Documents
-
view
0 -
download
0
Transcript of TARGET MARKET: CHINA - European Commission

Marketing Strategies for Tourism Destinations. Target market: CHINA
TARGET MARKET: CHINA
MARKETING STRATEGIES FOR TOURISM DESTINATIONS
A COMPETITIVE ANALYSIS

Marketing StrategiesFor Tourism Destinations
A Competitive Analysis
Target Market - China
A report produced for European Travel Commission (ETC)by Tourism Development International
Brussels, 2014
Marketing Strategies for Tourism Destinations. Target market: CHINA
Published and printed by:European Travel CommissionRue du Marché aux Herbes, 611000 Brussels, BelgiumWebsite: www.etc-corporate.orgEmail: [email protected]
This report was compiled and edited by:Tourism Development Internationalon behalf of the European Travel Commission.
The designations employed and the presentation of material in this publication do not imply the expression of any opinion whatsoever on the part of the European Travel Commission concerning the legal status of any country, territory, city or area, or of its authorities or concerning the delimitations of its frontiers or bound-aries.
Cover photo: Nanchang scenery, view from the Tengwang pavilion, China; Copy-right: chungking.
Marketing Strategies for Tourism Destinations. Target market: CHINA
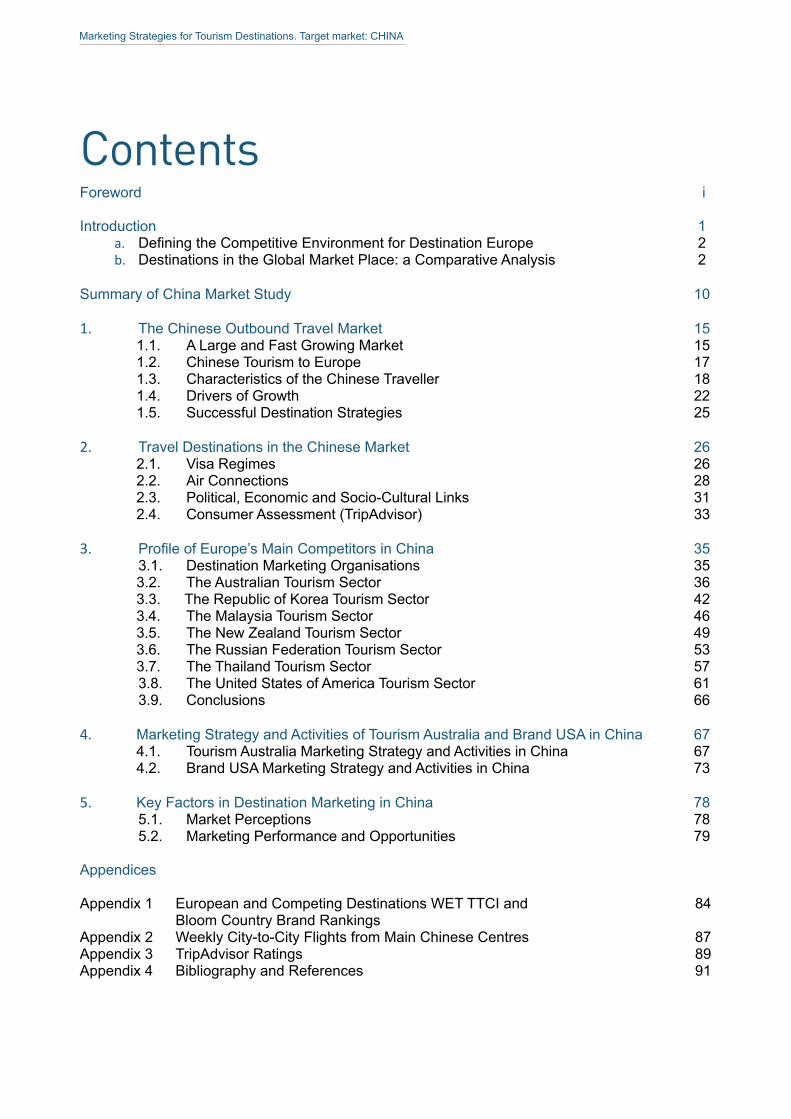
ContentsForeword i
Introduction 1a. DefiningtheCompetitiveEnvironmentforDestinationEurope 2b. Destinations in the Global Market Place: a Comparative Analysis 2
Summary of China Market Study 10
1. The Chinese Outbound Travel Market 151.1. A Large and Fast Growing Market 151.2. Chinese Tourism to Europe 171.3. Characteristics of the Chinese Traveller 181.4. Drivers of Growth 221.5. Successful Destination Strategies 25
2. Travel Destinations in the Chinese Market 262.1. Visa Regimes 262.2. Air Connections 282.3. Political, Economic and Socio-Cultural Links 312.4. Consumer Assessment (TripAdvisor) 33
3. ProfileofEurope’sMainCompetitorsinChina 353.1. Destination Marketing Organisations 353.2. The Australian Tourism Sector 363.3. The Republic of Korea Tourism Sector 423.4. The Malaysia Tourism Sector 463.5. The New Zealand Tourism Sector 493.6. The Russian Federation Tourism Sector 533.7. The Thailand Tourism Sector 573.8. The United States of America Tourism Sector 61 3.9. Conclusions 66
4. Marketing Strategy and Activities of Tourism Australia and Brand USA in China 674.1. Tourism Australia Marketing Strategy and Activities in China 674.2. Brand USA Marketing Strategy and Activities in China 73
5. Key Factors in Destination Marketing in China 785.1. Market Perceptions 785.2. Marketing Performance and Opportunities 79
Appendices
Appendix 1 European and Competing Destinations WET TTCI and 84 Bloom Country Brand Rankings
Appendix 2 Weekly City-to-City Flights from Main Chinese Centres 87Appendix 3 TripAdvisor Ratings 89Appendix 4 Bibliography and References 91
Marketing Strategies for Tourism Destinations. Target market: CHINA
AcknowledgmentsThis report was prepared by Peter Mac Nulty and Robert Cleverdon of Tourism Development International on commission to the European Travel Commission (ETC), and was carried out under the supervision of Ms Valeria Croce, Head, Research and Development Department at ETC.
Thereportispartofaseriesoffact-findingreportsonthetourismstrategyde-veloped by destinations competing with Europe in select long-haul markets. The project was realised as part of the European Commission and ETC joint initiative “Destination Europe 2020”.
We would like to acknowledge the support and contributions of the many ETC members, marketing organisations and tour operators associations who contrib-uted to the realisation of this report.
We also gratefully acknowledge the support of ETC partners, who committedly contributed to the realisation of this project. A special note of thanks to Mr Charlie Ballard, Director of Advertising Research at TripAdvisor, Mr Xu Jing, Regional DirectorforAsiaandthePacificatUNWTO,andMrDanielVelasco,Consultantat Amadeus Travel Intelligence Unit, for their contributions.
Marketing Strategies for Tourism Destinations. Target market: CHINA
i
ForewordIn an increasingly vibrant landscape, marked by new players, technological inno-vation and rapidly changing consumers, the need arises for European destina-tionstocloselymonitorothers’efforttowinmarketsharesintheglobaltourismmarket.
This compilation of best practice examples in tourism and promotion strategies is meant to provide insights relevant to ETC and its member countries through a better understanding of the environment in which they operate.
This series of reports provides insights into the strategic vision and the operation-al actions tourism destinations worldwide are developing to attract an increas-ingnumberofvisitorsfromthemostpromisingsourcemarkets.Thisfact-findingresearchoffersabird’s-eyeviewofthecompetitiveenvironment,andaportraitof the tourism strategy and marketing activities of competing destinations. Ref-erencestoofficialdocumentsandpubliclyavailablereportsfacilitateaccesstodetailed information, for those interested in achieving a higher level of knowl-edge.ForEurope’sstrongestcompetitors,portraitsareenrichedwithfirst-handinformation gathered through personal interviews with NTOs marketing directors, representatives of the travel trade and experts.
The common structure of reports facilitates cross-market comparisons. Key re-sults are synthesised in a highly visual executive summary, conceived for dis-semination to the public at large.
We trust these reports will become for ETC and its members an important tool to identify key opportunities and challenges, and to strengthen their comparative advantage in the global tourism market.
Executive UnitEuropean Travel Commission
Marketing Strategies for Tourism Destinations. Target market: CHINA
IntroductionThisreport’saimistocollectmeaningfulknowledgeaboutthetourismstrategyofdestinations competing with destinations in Europe in select long-haul markets. This study is part of a series of publications, which offer an overview of the en-vironment,inwhichEuropeantourismdestinationsoperate,andaprofileofthetourism strategy and marketing activities of competing destinations. A listing of officialdocuments,publiclyavailablereportsandmediafeaturesisprovidedinanappendix and through the footnotes to permit more detailed examination of the informationpresentedandissuesraised.Eachreportalsoprovidesfirst-handin-formation on a selection of competing destinations, gathered through interviews withNTOs’marketingdirectors,traveltradeandexperts.
This project focuses on countries competing with European destinations in high potential long-haul markets, namely Brazil, Canada, China, Japan, Russia and theUnitedStates.Inthisanalysis,Europeisdefinedasthe33countrieswhichare members of the European Travel Commission plus France, the Netherlands and the United Kingdom.
The analysis followed a three step approach.
ThefirststepwastoidentifythekeymarketsforEuropeandtheprimarydesti-nations competing with Europe in those markets. These markets are presented in Figure 1.
The second step consisted of assessing strengths and weaknesses of destina-tions,whicharesignificantcompetitorstoEuropeinthesixtargetmarkets.Theassessment has been based on the following indicators:
• the World Economic Forum Travel and Tourism Competitive Index (WEF TTCI),
• travel trade interviews and expert opinion,• visa regimes and other visitor entry requirements,• air connectivity and capacity,• price competitiveness,• political, economic and socio-cultural links,• destination tourism development policy, • destination tourism marketing strategy.
The third step consisted of identifying those destinations which are the strongest competitorsforEuropeineachmarket,i.e.destinationswhichattractsignificantvolumes of travellers and are actively investing in increasing their share in the market.Adetailedprofileof theorganisations inchargeofpromoting inboundtourism to these destinations has been compiled. Information about the strongest competitors has been collected by the means of personal interviews as well as from secondary sources.
Definingthecompetitive environment for Destination Europe
1

Marketing Strategies for Tourism Destinations. Target market: CHINA
a. Defining the Competitive Environment For Destination Europe Experts from the European Travel Commission (ETC) Executive Unit, Market Intelligence Committee and Operation Groups, as well as experts from Tourism DevelopmentInternational(TDI),wereinvolvedinatwo-stageprocesstodefinethe competitive environment, in which European destinations operate.
In the initial stage, those long-haul markets which show the best prospects for Europeasatourismdestinationwereidentified.Basedonacompoundanalysisof the relative importance of, and growth prospects for a large number of mar-kets,sixwereidentifiedasprioritiesforDestinationEurope. The experts were then asked to list countries which are actively targeting those marketsas tourismdestinations.Thesecompetingdestinationsaredefinedascountries which are currently investing in tourism promotion and which already receive considerable volumes of tourists from the selected markets. The outcome ofexperts’evaluationofthecompetitiveenvironmentisreportedinFigure1.
Figure 1: Market: Destination Pairings
MarketsCompetitor
1 2 3 4 5 6 7
Brazil USA Mexico Australia Russian Federation
Canada USA /USA large cities
Mexico China South Africa
China USA Australia Russian Federation
Rep of Korea
Thailand Malaysia New Zealand
Japan USA Rep of Korea
Thailand Malaysia
Russia Egypt China Dubai United States
Thailand
United States
China Brazil Australia USA large cities
South Africa
b. Destinations in the Tourism Global Market Place: a Comparative AnalysisAn overall assessment of the comparative resources and capabilities of the se-lected destinations was undertaken based on publicly available international indi-cators, which monitor aspects crucial to determine their strength and weakness-es as tourism destinations.
The World Economic Forum Travel and Tourism Competitiveness Index (WEF TTCI) provides a broad assessment of a large number of characteristics and fea-tures that facilitate the development and functioning of tourism in a country. The survey assembles results for 79 pillars under three main “sub-indexes”:
1. Travel & Tourism Regulatory Framework,2. Business Environment & Infrastructure, 3. Travel & Tourism Human, Cultural and Natural Resources.
Factors and policies conducive of
travel and tourism development
2
Marketing Strategies for Tourism Destinations. Target market: CHINA
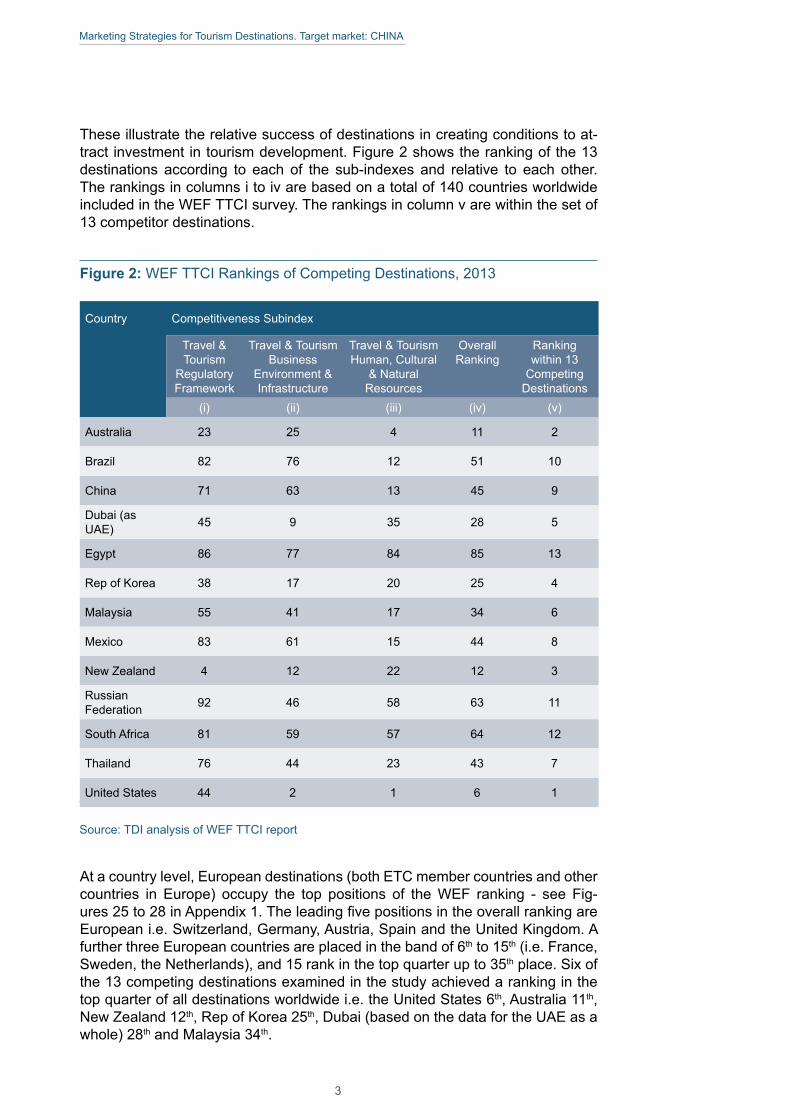
These illustrate the relative success of destinations in creating conditions to at-tract investment in tourism development. Figure 2 shows the ranking of the 13 destinations according to each of the sub-indexes and relative to each other. The rankings in columns i to iv are based on a total of 140 countries worldwide included in the WEF TTCI survey. The rankings in column v are within the set of 13 competitor destinations.
Figure 2: WEF TTCI Rankings of Competing Destinations, 2013
Country Competitiveness Subindex
Travel & Tourism
Regulatory Framework
Travel & Tourism Business
Environment & Infrastructure
Travel & Tourism Human, Cultural
& Natural Resources
Overall Ranking
Ranking within 13
Competing Destinations
(i) (ii) (iii) (iv) (v)
Australia 23 25 4 11 2
Brazil 82 76 12 51 10
China 71 63 13 45 9
Dubai (as UAE) 45 9 35 28 5
Egypt 86 77 84 85 13
Rep of Korea 38 17 20 25 4
Malaysia 55 41 17 34 6
Mexico 83 61 15 44 8
New Zealand 4 12 22 12 3
Russian Federation 92 46 58 63 11
South Africa 81 59 57 64 12
Thailand 76 44 23 43 7
United States 44 2 1 6 1
Source: TDI analysis of WEF TTCI report
At a country level, European destinations (both ETC member countries and other countries in Europe) occupy the top positions of the WEF ranking - see Fig-ures25to28inAppendix1.TheleadingfivepositionsintheoverallrankingareEuropean i.e. Switzerland, Germany, Austria, Spain and the United Kingdom. A further three European countries are placed in the band of 6th to 15th (i.e. France, Sweden, the Netherlands), and 15 rank in the top quarter up to 35th place. Six of the 13 competing destinations examined in the study achieved a ranking in the top quarter of all destinations worldwide i.e. the United States 6th, Australia 11th, New Zealand 12th, Rep of Korea 25th, Dubai (based on the data for the UAE as a whole) 28th and Malaysia 34th.
3

Marketing Strategies for Tourism Destinations. Target market: CHINA
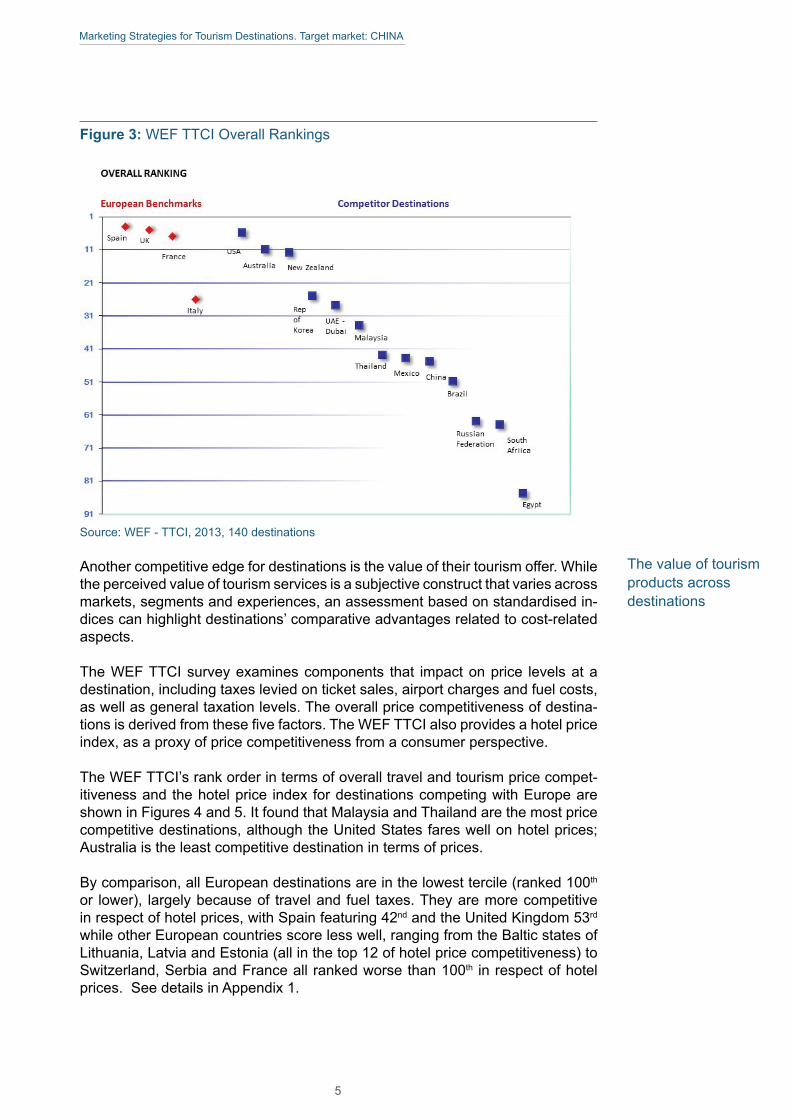
Figure 3 shows the overall ranking position for four European countries (France, Italy, Spain and the United Kingdom), selected as benchmarks, and the 13 com-peting destinations.
The comparative analysis of the resources and capabilities of the 13 destinations identifiedascompetitorsatsub-indexlevel(seeAppendix1)suggestswhatfol-lows:High ranking: United States, Australia and New Zealand. These countries show strengths in the following areas:
• New Zealand in respect of its travel and tourism regulatory framework,• the United States for the travel and tourism business environment and
infrastructure, and for travel and tourism human, cultural and natural resources,
• Australia for travel and tourism human, cultural and natural resources.
The United States fares less well in respect of the travel and tourism regulatory framework, and lower rankings (though still in the top 25 globally) are recorded by Australia in respect of the business environment and infrastructure, and the regu-latory framework, and by New Zealand for human, cultural and natural resources.
Mid ranking: Republic of Korea, Dubai (UAE), Malaysia, Thailand, Mexico, China, Brazil. Six of these seven destinations, the exception being Dubai, score more highly than their overall ranking in respect of human, cultural and natural resources. The weaknesses for this group of destinations are in the regulatory framework (i.e. Mexico, Brazil, Thailand, China) and the business environment and infrastructure (i.e. Brazil, China, Mexico).
Mid-to-low ranking: Russian Federation, South Africa. Bothcountries’rank-ings are pulled down by their low assessment in respect of travel and tourism regulatory framework. In the case of South Africa, this is due to low performance on safety and security, and health and hygiene; while for the Russian Federation, theweaknessesaremorewidespreadacrossfourofthefivepillarsinthesub-in-dex.
Low ranking: Egypt. Its weak positioning reveals in each of the three sub-in-dexessuggests that thisdestinationsdoesn’thaveanoverallcomparativead-vantage in respect todestinations inEurope,butmaybeattractive inspecificmarkets and segments.
4
Marketing Strategies for Tourism Destinations. Target market: CHINA
Figure 3: WEF TTCI Overall Rankings
Source: WEF - TTCI, 2013, 140 destinations
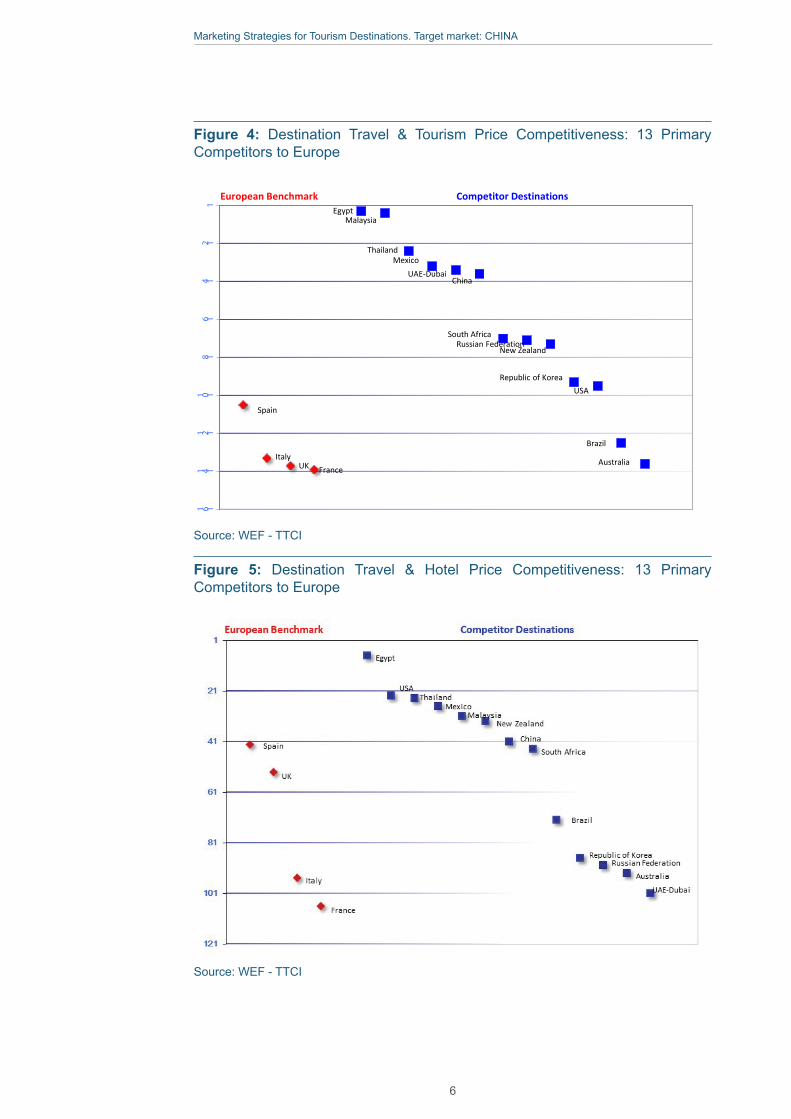
Another competitive edge for destinations is the value of their tourism offer. While the perceived value of tourism services is a subjective construct that varies across markets, segments and experiences, an assessment based on standardised in-dicescanhighlightdestinations’comparativeadvantagesrelatedtocost-relatedaspects.
The WEF TTCI survey examines components that impact on price levels at a destination, including taxes levied on ticket sales, airport charges and fuel costs, as well as general taxation levels. The overall price competitiveness of destina-tionsisderivedfromthesefivefactors.TheWEFTTCIalsoprovidesahotelpriceindex, as a proxy of price competitiveness from a consumer perspective.
TheWEFTTCI’srankorderintermsofoveralltravelandtourismpricecompet-itiveness and the hotel price index for destinations competing with Europe are shown in Figures 4 and 5. It found that Malaysia and Thailand are the most price competitive destinations, although the United States fares well on hotel prices; Australia is the least competitive destination in terms of prices.
By comparison, all European destinations are in the lowest tercile (ranked 100th or lower), largely because of travel and fuel taxes. They are more competitive in respect of hotel prices, with Spain featuring 42nd and the United Kingdom 53rd while other European countries score less well, ranging from the Baltic states of Lithuania, Latvia and Estonia (all in the top 12 of hotel price competitiveness) to Switzerland, Serbia and France all ranked worse than 100th in respect of hotel prices. See details in Appendix 1.
The value of tourism products across destinations
5
Marketing Strategies for Tourism Destinations. Target market: CHINA
Figure 4: Destination Travel & Tourism Price Competitiveness: 13 Primary Competitors to Europe
12 1
4 16 1
8 11 0 1
1 2 11 4 1
1 6 1
UK
Russian Federation
Malaysia
Thailand
New Zealand
European Benchmark Competitor Destinations
Source: WEF - TTCI
USARepublic of Korea
Australia
Egypt
South Africa
China
MexicoUAE-Dubai
Spain
France
BrazilItaly
Source: WEF - TTCI
Figure 5: Destination Travel & Hotel Price Competitiveness: 13 Primary Competitors to Europe
Source: WEF - TTCI
6

Marketing Strategies for Tourism Destinations. Target market: CHINA
The rating of a country as a brand in the perception of prospective visitors is an important travel decision making criterion in respect of choice of destination. The impressions created in the minds of consumers in travel markets around the worldarecreatedthroughalargenumberofinfluences.TheBloomConsultingGroup in its annual Country Brand Ranking1identifiesfourvariablesascontribut-ingtoadestination’simageandtherebyestablishingitstourismbrandrankingsi.e.
1. Tourismeconomicreceiptsandgrowth(afirstindicatorofacountry’sappeal),
2. The destination products and experiences researched online (meas-uring its online appeal),
3. Thecountry’sbrandstrategy(assessingtheaccuracyandeffective-ness of its communication efforts),
4. Officialwebsiteandsocialmediaperformance.The results of the 2013 Country Brand Ranking of 187 countries and territories are outlined in Figure 6. It shows that the United States has the strongest tourism brand followed by Thailand, Australia, China, Malaysia, the Republic of Korea and Mexico which all feature in the top 20 destinations. None of the 13 primary competitors to Europe across the six selected markets is ranked lower than 42nd (Brazil). Nine European countries are ranked in the leading 20 destinations, led by Spain, France, the United Kingdom and Italy. Full details for all European countries are presented in Appendix 1.
Figure 6: Country Tourism Brand Ranking: Primary Competitors to Europe
Source: Bloom Country Brand Ranking Tourism Edition 2013
1 Bloom Country Brand Ranking Tourism Edition 2013 http://bloom-consulting.com/sites/default/files/files/Bloom_Consulting_Country_Brand_Ranking_Tourism_2013.pdf
Country Brand Rankings
7

Marketing Strategies for Tourism Destinations. Target market: CHINA
The competitive strength of any country as a tourism destination is a combination ofmanyfactors,someofwhicharefixedorotherwisefactualwhileothersaresubjecttotheinfluenceofbothproductdevelopmentsandmarketingandpromo-tional activities. No destination is outstandingly strong or weak across all parame-ters. The strongest individual destination is the United States, rated as having the leading tourism brand and achieving 6th place in the global WEF TTCI survey of alltourismdevelopmentfactors(behindfiveEuropeancountries).
The power of strong tourism industries combined with market-driven tourism product/experience development and well-targeted marketing is illustrated by comparing rankings on the WEF TTCI broad tourism development and facilitation survey (that does not take account of destination marketing) and the Bloom Con-sulting Group destination brand ranking (which features destination marketing el-ements as a key criterion). This is borne out particularly in the cases of Thailand, China, Malaysia, Mexico, Egypt, South Africa and the Russian Federation where weaknesses in either or both of the regulatory framework, and business environ-ment and infrastructure, may be compensated for by price advantages and the appealofthecountries’tourismproductoffering.
Figure 7: Country Tourism Rankings
Country Bloom Country Brand Ranking
Overall WEF TTCI Ranking
Europe’sCompetitorsUnited States 1 6Thailand 6 43Australia 8 11China 10 45Malaysia 15 34Rep of Korea 18 25Mexico 19 44Egypt 22 85UAE - Dubai 25 28South Africa 28 64Russian Federation 30 63New Zealand 38 12Brazil 42 51European Benchmarks Spain 2 4Germany 3 2France 4 7United Kingdom 5 5Italy 7 26Austria 11 3Switzerland 14 1
Sources: WEF TTCI survey, and Bloom Country Brand Ranking Tourism Edition 2013
8

Marketing Strategies for Tourism Destinations. Target market: CHINA
Information Note - Exchange Rates The monetary values quoted in the report are taken from the sources referenced, including amounts stated in the source document in US dollars. In all cases, conversion has been made to Euros. The conversion rates used are the average rates across the year between the local currency (or US dollar where that is the currency stated in the source document) and the Euro for the year of the data. For future forecasts/targets, the rate between the local currency and the Euro as at June 2014 have been used.
9

Marketing Strategies for Tourism Destinations. Target market: CHINA
KEY DEMOGRAPHIC AND ECONOMIC DATA 2013
CHINA’S PERFORMANCE IN INTERNATIONAL TOURISM
OUTBOUND DESTINATIONS VISITED BY CHINESE
International arrivals generated
2012: 82mn2013 : 97.3mnup 18 to 19%
Expenditure
Population
1,351mn
$9,828 €7,280
GDP PPP per capita
Average annual GDP growth over past decade
1. Hong Kong
2. Thailand
3. South Korea
4. Macau
5. Taiwan
6,752,781
4,997,216
3,440,969
3,132,728
2,815,741
6. Singapore
7. Malaysia
8. Japan
9. Vietnam
10. France
1,563,044
1,476,636
889,847
682,053
648,376
Summary of China Market StudyOUTBOUND TRAVEL AND COMPETITIVE ENVIRONMENT
10
14 5
9
6
8
7
3
Leading outbound tourism country in terms of EXPENDITURE
CNY42,026 €5,075
GDP PPP per capita current prices2
Second largest outbound market in terms of OVERNIGHT STAYS in 20133
2012: $102bn (€78 bn)
2013: $120 – 130bn (€89 – 96 bn)
up 18 to 27% in dollar terms but slightly less in Euros (14 to 23%) as a result of the depreciation of the dollar against the Euro since 2012
2World Economic Outlook Database, October 2013, IMF. Euro values converted at average exchange rate for 2013. 3 World Travel Monitor 2013, IPK International
TOP destinations are Asian
Total trips to Europe:
3 million (first stop) with aggregate arrivals circa 5 million
10

Marketing Strategies for Tourism Destinations. Target market: CHINA
STRONG NON ASIAN GROWTH MARKETS GROWTH PER ANNUM 2005 - 2012
PURPOSE OF VISIT
30 29 29 20
United ArabEmirates
2000 2010
United States of America
Switzerland France
90
46
54
Private (leisure)Public (business, official)
Private (leisure)Public (business, official)
POSITIVE INFLUENCES ON GROWTH
Steadily developing economy
Easing of visa policies of foreign countries/regions
Increasing international flights
Expanding tourism consumption demand
Appreciation of Chinese currency
OUTBOUND TRAVEL AND COMPETITIVE ENVIRONMENT
Destination success in the Chinese tourism market from:
1. Understanding and catering for cultural needs, 2. Innovating, investing and working across sectors to deliver the right products/experiences, 3. Catering for increased FIT travel, 4. Focusing destination marketing on authentic features and offerings, 5. Incorporating China-friendly elements in the experiences offered, 6. Accurate product: market matching in line with the preferences and trends of the Chinese market, 7. Facilitating Chinese travellers to enter, travel around and obtain Chinese-oriented service.
Europe’s primary competitors across all aspects of tourism according to the WEF TTCI are other industrial-ised nations e.g. United States, Australia, New Zealand, Republic of Korea,
In terms of overall price competitiveness in travel and tourism, European destinations are among the world’s most costly,
The 2013 Bloom Consulting Country Brand Ranking rates the United States as the leading tourism destina-tion brand with Australia also in the top ten, while nine of the leading 20 tourism destination brands are European.
p.a. p.a. p.a. p.a.
11

Marketing Strategies for Tourism Destinations. Target market: CHINA
Seven destinations are shortlisted as significant competing destina-tions to Europe in the Chinese market: Australia, Malaysia, New Zealand, Republic of Korea, Russian Federation, Thailand and the USA,
All seven are making major efforts to support and increase the com-petitiveness of their travel and tourism industries by:
Australia and the USA are the most active and effective long haul competitors to Europe for the Chinese tourist,
Australia’s success in the Chinese markets is a result of:
PRINCIPAL COMPETING DESTINATIONS
COMPETING DESTINATION ORGANISATIONS
Europe’s primary competitors across all aspects of tourism according to the WEF TTCI are other industrialised nations e.g.
USA, Australia, New Zealand, Republic of Korea
In terms of overall price competitiveness in travel and tourism,
European destinations are among the world’s most costly
The seven countries competing with Europe for the Chinese tourist are pursuing marketing strategies that:
1. Seeking to develop new and improved infrastructure and tourism products/experiences across a broad range of visitor interests,
2. Focusing on delivering a high standard of tourism service,
3. Paying special attention to facilitating entry into their countries and targeting the Chinese tourist.
1. Stress the authenticity of their natural and cultural heritage in developing brand images and positioning,
2. Pay equal attention to established source markets and newly emerging ones to achieve a balanced set of markets,
3. Seek a market: product “matching” approach that provides high quality experiences based of detailed research into the needs and expectations of different market segment, with China a primary target market target,
4. Focus on a number of common segments across competitors e.g. MICE, medical tourism, shopping, festivals and events,
5. Pay special attention to attracting high value/affluent tourists,
6. Show a significant and continuing switch away from traditional advertising and promotional methods to electronic digital marketing.
1. Early awareness of China’s potential and the need to understand the Chinese traveller,
2. The necessity for a partnership approach to developing the Chinese market,
3. Substantive and sustained marketing campaigns targeted at affluent, urban Chinese who are experienced travellers,
4. Deploying marketing and promotional tools tailored to the needs and expectations of the Chinese traveller.
Brand USA’s achievement in only its third year of operation has been to translate interest and desire to visit the country into firm travel intentions – close to 60% of respondents intending to visit in the coming year,
The partnership approach is central to Brand USA’s marketing strategy and campaign components, giving a wide range of destination, travel trade and media partners the opportunity to piggyback on the digital and traditional marketing tools, public relations and promotional efforts developed and conducted by Brand USA,
In any destination marketing strategy based on partnerships, accountability to its partners is vital. Brand USA has a rigorous system of monitoring, assessing and evaluating its activities.
2World Economic Outlook Database, October 2013, IMF. Euro values converted at average exchange rate for 2013. 3 World Travel Monitor 2013, IPK International
Total trips to Europe:
3 million (first stop) with aggregate arrivals circa 5 million
12

Marketing Strategies for Tourism Destinations. Target market: CHINA
Traditionally-held perceptions of Europe, the United States and Australia in China are that Europe is rich in cultural heritage, tradition and luxury, The United States represents wealth, modernity and popular culture, and Australia offers a natural environment and a relaxed lifestyle,
Europe and the United States are top of the list in terms of choice as first time overseas destinations, while all three destinations can offer the range of attractions and activities to cater for the more experienced traveller seeking places to visit and things to do outside the normal tourist circuits,
All the three destinations have extensive Chinese language programmes – both in marketing campaigns in China, and in the delivery of tourism products and services in the destination. The United States has an advan-tage in that it is seen by the Chinese as being more attuned to Chinese tourists’ needs,
All have invested heavily and effectively in studies and surveys to better understand the attitudes, motivations, behaviour and characteristics of Chinese travellers in order to be able to design marketing and promotional strategies and campaigns to achieve the highest possible penetration of the China market,
The ETC is disadvantaged against Tourism Australia and Brand USA through a far smaller marketing budget in China,
The disparate and limited marketing activities of European countries, without a strong, financially-empowered coordinating mechanism, lead to the prevailing market perception of Europe of a collection of countries without a central theme. Competition can be fostered – indeed market competition is the essence of business in both Australia and the United States – by linking together on certain marketing activities, generating benefit to all, in the spirit of co-opetition (i.e. cooperation AND competi-tion) whereby the overall market is increased through working together enabling the destination’s individual marketing activities to compete for a larger total market. The strength of both Tourism Australia and Brand USA is their focus on the partnership approach to destination marketing,
Historical culture and heritage are Europe’s key assets in the current (unmanaged) positioning of Europe; but the challenge of any future marketing campaign will to shift this positioning to highlight Europe’s contemporary vibrancy, enterprise and innovation within tourism, and in particular to create knowledge about the rich and diverse tourism experi-ences that Europe can offer beyond the introductory tour of iconic sites and features.
COMPARATIVE ASSESSMENT: EUROPE, THE UNITED STATES, AUSTRALIA
The 2013 Bloom Country Brand Ranking rates the
USA as the leading tourism destination brand with Australia also in the top ten, while nine of the leading 20 tourism destination brands are European
13

Marketing Strategies for Tourism Destinations. Target market: CHINA
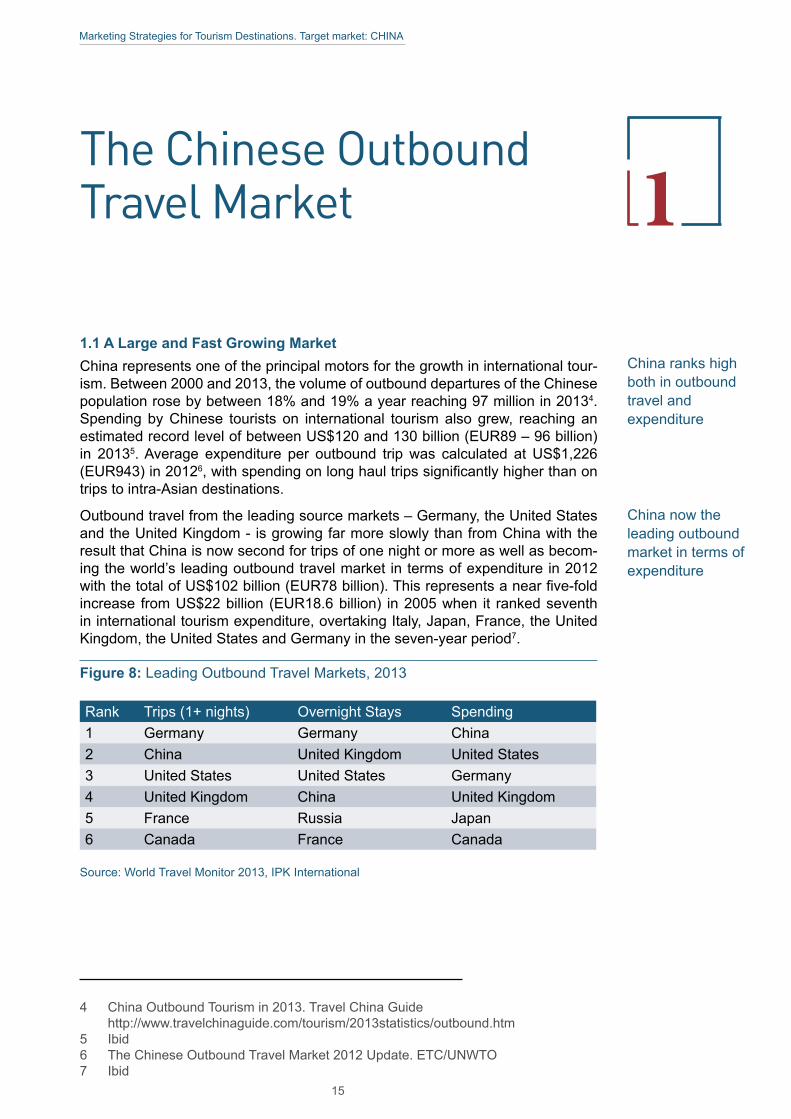
The Chinese Outbound Travel Market 11.1 A Large and Fast Growing Market China represents one of the principal motors for the growth in international tour-ism. Between 2000 and 2013, the volume of outbound departures of the Chinese population rose by between 18% and 19% a year reaching 97 million in 20134. Spending by Chinese tourists on international tourism also grew, reaching an estimated record level of between US$120 and 130 billion (EUR89 – 96 billion) in 20135. Average expenditure per outbound trip was calculated at US$1,226 (EUR943) in 20126,withspendingonlonghaultripssignificantlyhigherthanontrips to intra-Asian destinations.
Outbound travel from the leading source markets – Germany, the United States and the United Kingdom - is growing far more slowly than from China with the result that China is now second for trips of one night or more as well as becom-ingtheworld’sleadingoutboundtravelmarketintermsofexpenditurein2012withthetotalofUS$102billion(EUR78billion).Thisrepresentsanearfive-foldincrease from US$22 billion (EUR18.6 billion) in 2005 when it ranked seventh in international tourism expenditure, overtaking Italy, Japan, France, the United Kingdom, the United States and Germany in the seven-year period7.
Figure 8: Leading Outbound Travel Markets, 2013
Rank Trips (1+ nights) Overnight Stays Spending1 Germany Germany China2 China United Kingdom United States 3 United States United States Germany4 United Kingdom China United Kingdom5 France Russia Japan6 Canada France Canada
Source: World Travel Monitor 2013, IPK International
4 China Outbound Tourism in 2013. Travel China Guide http://www.travelchinaguide.com/tourism/2013statistics/outbound.htm
5 Ibid6 The Chinese Outbound Travel Market 2012 Update. ETC/UNWTO7 Ibid
China now the leading outbound market in terms of expenditure
China ranks high both in outbound travel and expenditure
15

Marketing Strategies for Tourism Destinations. Target market: CHINA
The main destinations for Chinese tourists are in Asia, with the Special Admin-istrative Regions (SAR) of Hong Kong and Macao attracting over 2/3 of total departures from China. In terms of arrivals of Chinese tourists, the top ten des-tinations are (2012 data): Hong Kong & Macau (China) 23 million, Rep of Korea 3.4 million, Thailand 2.8 million, Taiwan 2.6 million, Singapore 2.1 million, United States 1.6 million, Japan 1.5 million, Vietnam and Malaysia both 1.4 million. The trend towards intraregional travelwithinAsia reflects the continuedexpansionof the Chinese population able to travel abroad and who choose a nearby des-tination for their initial trip. In 2013, while total outbound trips rose 25%, Asian destinations recorded a rise of 31% while long haul trips grew by a lower 11%.
Intra-Asian destinations also dominate for Chinese outbound trip destinations organised through travel agencies, as illustrated in Figure 9.
Figure 9: Top 10 Outbound Destinations Visited by Chinese Tourists in 2013
1. Hong Kong
2. Thailand
6,752,781
4,997,216
3,440,969
3,132,728
2,815,7419. Vietnam
10. France
1,563,044
1,476,636
889,847
682,053
648,376
3. South Korea
4. Macau
5. Taiwan
6. Singapore
7. Malaysia
8. Japan
Source: China National Tourism Administration
Outside Asia, the strongest growth has been recorded to the United Arab Emir-ates (30% p.a. 2005-2012), the United States and Switzerland (both 29% p.a.), and France (20% p.a.). In the last two years Australia (+16% in 2012 to 0.6 mil-lion arrivals), and New Zealand (+48% to over 0.2 million) have been especially strong destinations for the Chinese. The United States, Europe, Australia and New Zealand have grown substantially in recent years, in response to easier travel regulations and increased promotional targeting.
Figure 10: Strong Non-Asian Growth Markets (% Growth Per Annum 2005-2012)
30
United ArabEmirates
29
United States of America
29
Switzerland
20
France
Source: Euromonitor International
Most travel from China remains
within Asia
Easing of travel regulations
contributing to growth outside of Asia
16

Marketing Strategies for Tourism Destinations. Target market: CHINA
Lookingahead,UNWTO forecasts thatAsiaand thePacificwill generate358million tourist arrivals in 2020 and 541 million tourist arrivals in 2030. Of these, nearly 20% will travel to destinations outside the region8. China will be the prime generator of Asian outbound travel. The forecast of 100 million Chinese trips abroad by 2020 made by UNWTO in the late 1990s9 will be achieved in 2014. While faster growth will remain for intraregional travel, demand for long haul trips willremainstrong,growingbybetween6.5%and7%ayearoverthenextfiveyears to exceed 35 million by 201910.
In terms of individual long haul destinations, Euromonitor International’s fore-casts for the period 2012 – 201711 see the strongest growth in Chinese visitors in Switzerland, Spain, the UAE, the United States (all more than doubling the level of arrivals), Italy, Austria, New Zealand and Australia.
1.2 Chinese Tourism to Europe Chinese tourism to Europe has grown at the rate of 18% a year between 2008 and 2013, reaching a level of 7,475,00012, following an annual rise of 11% in the previousfiveyears,illustratingthatChineseoutboundtravelgrowthwaslargelyunaffected by the global recession13. Despite this rapid growth, Chinese tourists comprised just 1.3% of total arrivals in Europe in 201314. As a proportion of all Chineselonghaultrips(definedasoutsideNortheastAsia),Europe’ssharehasfallen by over 9% between 2004 and 2014, now accounting for one-in-three such trips15.
The average expenditure of a Chinese visitor on a trip to European Union states was US$3,734 (EUR2,835) in 201116.
China was the 15th most important source market for European destinations in terms of international tourist arrivals in 2013, but the 2nd market from outside the region, after the United States.
The leading European destinations visited by the Chinese in 2012 were the Rus-sian Federation 0.8 million, France 1.3 million, Germany 0.8 million, Switzerland 0.7 million, Austria 0.4 million, Italy 0.3 million, United Kingdom 0.2 million17. In terms of regions within Europe, Chinese travellers primarily visit Western Europe-an and Central/Eastern European destinations, these two regions accounting for 55% and 20% respectively of Chinese arrivals in Europe in 201318.
8 Ibid9 Tourism 2020 Vision. 1997. UNWTO10 European Tourism in 2014: Trends and Prospects (Q1 2014). ETC.11 Euromonitor International
http://skift.com/2013/09/03/top-25-most-popular-destinations-for-chinese-tourists/12 ETC Dashboard13 European Tourism Portfolio Analysis: Market Share and Origin Market Growth.
ETC14 Ibid15 European Tourism in 2014: Trends and Prospects (Q1 2014). ETC.16 MarketProfileChina.December2013.ETC17 Euromonitor International
http://skift.com/2013/09/03/top-25-most-popular-destinations-for-chinese-tourists/18 European Tourism Portfolio Analysis: Market Share and Origin Market Growth.
ETC
China will be the prime generator of Asian outbound travel to 2020
China is the 2nd market for Europe from outside the region, after the United States
Western Europe accounts for over half of Chinese arrivals in Europe18
17
Marketing Strategies for Tourism Destinations. Target market: CHINA
Chinese trips to Europe are forecast to grow at an average annual rate of be-tween7.5%and8%overthenextfiveyears,resultinginareversalofthede-clineofEurope’smarketshareofChinese longhaul travel19. Total arrivals will approach 12 million by 2019.
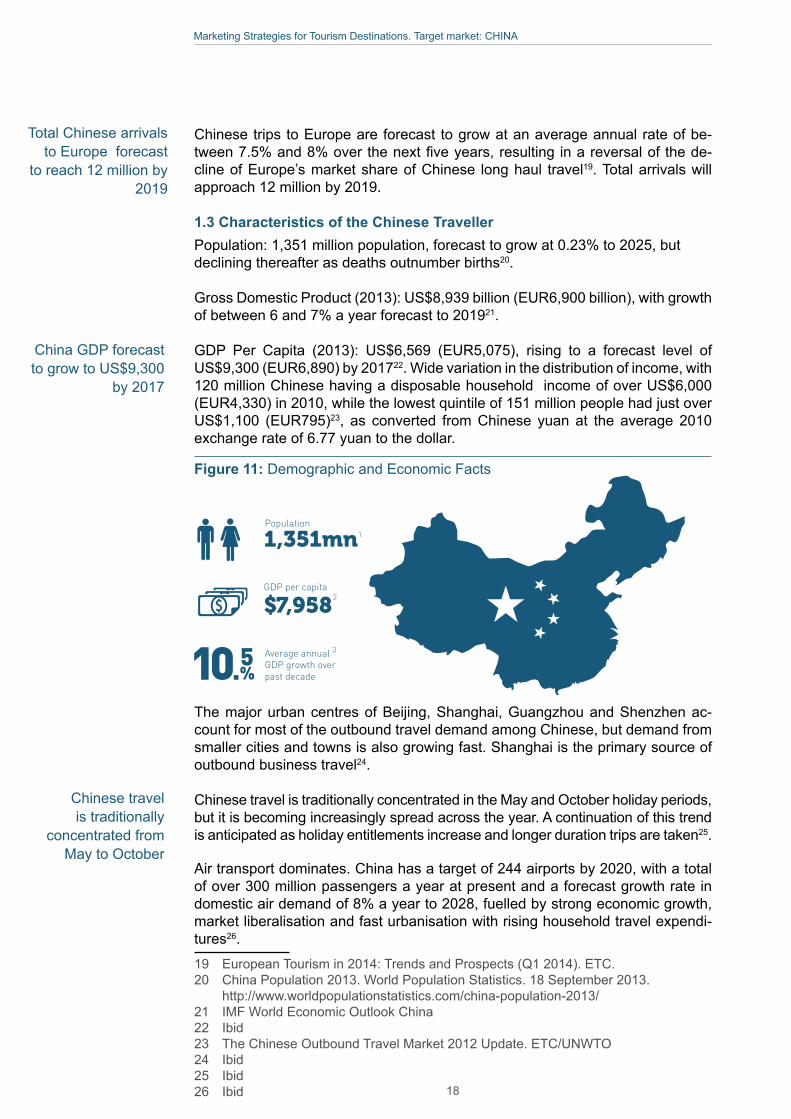
1.3 Characteristics of the Chinese Traveller Population: 1,351 million population, forecast to grow at 0.23% to 2025, but declining thereafter as deaths outnumber births20.
Gross Domestic Product (2013): US$8,939 billion (EUR6,900 billion), with growth of between 6 and 7% a year forecast to 201921.
GDP Per Capita (2013): US$6,569 (EUR5,075), rising to a forecast level of US$9,300 (EUR6,890) by 201722. Wide variation in the distribution of income, with 120 million Chinese having a disposable household income of over US$6,000 (EUR4,330) in 2010, while the lowest quintile of 151 million people had just over US$1,100 (EUR795)23, as converted from Chinese yuan at the average 2010 exchange rate of 6.77 yuan to the dollar.
Figure 11: Demographic and Economic Facts
Population
1,351mn
$7,958 GDP per capita
Average annual 3 GDP growth over past decade
1
2
The major urban centres of Beijing, Shanghai, Guangzhou and Shenzhen ac-count for most of the outbound travel demand among Chinese, but demand from smaller cities and towns is also growing fast. Shanghai is the primary source of outbound business travel24.
Chinese travel is traditionally concentrated in the May and October holiday periods, but it is becoming increasingly spread across the year. A continuation of this trend is anticipated as holiday entitlements increase and longer duration trips are taken25.
Air transport dominates. China has a target of 244 airports by 2020, with a total of over 300 million passengers a year at present and a forecast growth rate in domestic air demand of 8% a year to 2028, fuelled by strong economic growth, market liberalisation and fast urbanisation with rising household travel expendi-tures26.
19 European Tourism in 2014: Trends and Prospects (Q1 2014). ETC.20 China Population 2013. World Population Statistics. 18 September 2013. http://www.worldpopulationstatistics.com/china-population-2013/21 IMF World Economic Outlook China22 Ibid 23 The Chinese Outbound Travel Market 2012 Update. ETC/UNWTO24 Ibid25 Ibid26 Ibid
China GDP forecast to grow to US$9,300
by 2017
Total Chinese arrivals to Europe forecast
to reach 12 million by 2019
Chinese travel is traditionally
concentrated from May to October
18
Marketing Strategies for Tourism Destinations. Target market: CHINA
AsofSeptember2010,23airlinesoperated471weeklyflightsbetweenChineseand European airports, with a capacity of 140,000 seats27.
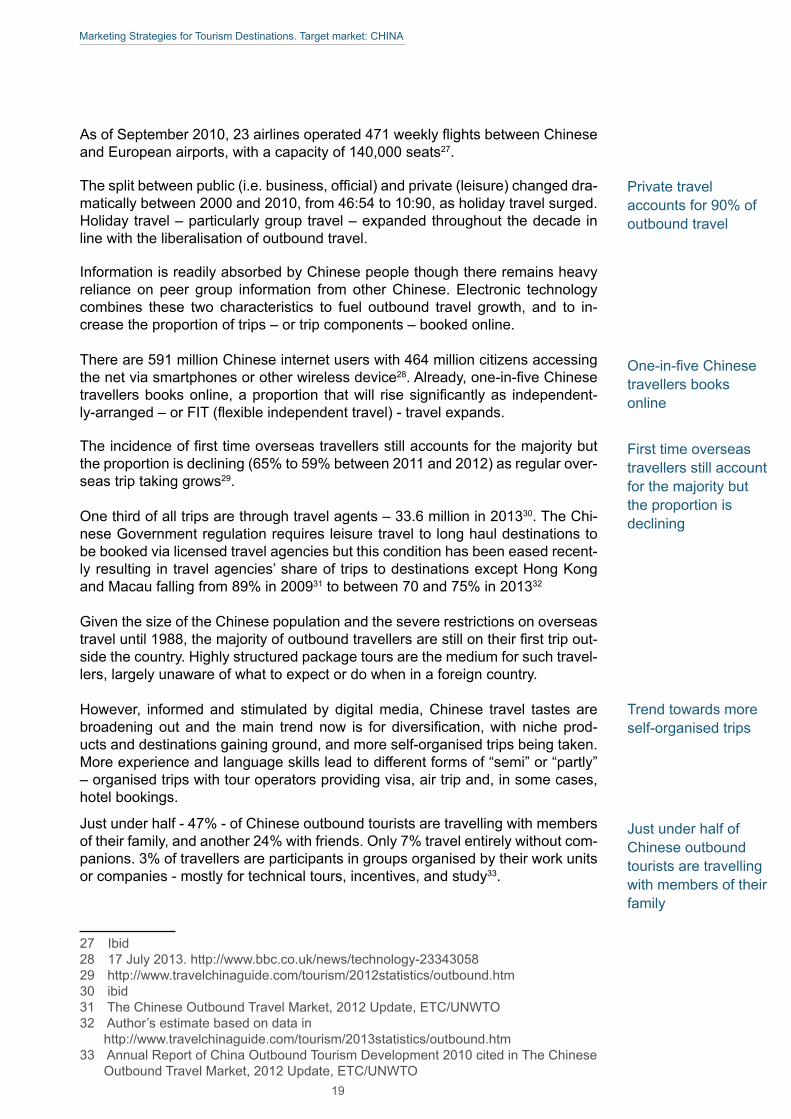
Thesplitbetweenpublic(i.e.business,official)andprivate(leisure)changeddra-matically between 2000 and 2010, from 46:54 to 10:90, as holiday travel surged. Holiday travel – particularly group travel – expanded throughout the decade in line with the liberalisation of outbound travel.
Information is readily absorbed by Chinese people though there remains heavy reliance on peer group information from other Chinese. Electronic technology combines these two characteristics to fuel outbound travel growth, and to in-crease the proportion of trips – or trip components – booked online.
There are 591 million Chinese internet users with 464 million citizens accessing the net via smartphones or other wireless device28.Already,one-in-fiveChinesetravellersbooksonline,aproportion thatwill risesignificantlyas independent-ly-arranged–orFIT(flexibleindependenttravel)-travelexpands.
Theincidenceoffirsttimeoverseastravellersstillaccountsforthemajoritybutthe proportion is declining (65% to 59% between 2011 and 2012) as regular over-seas trip taking grows29.
One third of all trips are through travel agents – 33.6 million in 201330. The Chi-nese Government regulation requires leisure travel to long haul destinations to be booked via licensed travel agencies but this condition has been eased recent-lyresultingintravelagencies’shareoftripstodestinationsexceptHongKongand Macau falling from 89% in 200931 to between 70 and 75% in 201332
Given the size of the Chinese population and the severe restrictions on overseas traveluntil1988,themajorityofoutboundtravellersarestillontheirfirsttripout-side the country. Highly structured package tours are the medium for such travel-lers, largely unaware of what to expect or do when in a foreign country.
However, informed and stimulated by digital media, Chinese travel tastes are broadeningoutand themain trendnow is fordiversification,withnicheprod-ucts and destinations gaining ground, and more self-organised trips being taken. More experience and language skills lead to different forms of “semi” or “partly” – organised trips with tour operators providing visa, air trip and, in some cases, hotel bookings.
Just under half - 47% - of Chinese outbound tourists are travelling with members of their family, and another 24% with friends. Only 7% travel entirely without com-panions. 3% of travellers are participants in groups organised by their work units or companies - mostly for technical tours, incentives, and study33.
27 Ibid28 17 July 2013. http://www.bbc.co.uk/news/technology-23343058 29 http://www.travelchinaguide.com/tourism/2012statistics/outbound.htm 30 ibid31 The Chinese Outbound Travel Market, 2012 Update, ETC/UNWTO32 Author’sestimatebasedondatain http://www.travelchinaguide.com/tourism/2013statistics/outbound.htm 33 Annual Report of China Outbound Tourism Development 2010 cited in The Chinese
Outbound Travel Market, 2012 Update, ETC/UNWTO
Private travel accounts for 90% of outbound travel
One-in-fiveChinesetravellers books online
First time overseas travellers still account for the majority but the proportion is declining
Just under half of Chinese outbound tourists are travelling with members of their family
Trend towards more self-organised trips
19

Marketing Strategies for Tourism Destinations. Target market: CHINA
The Chinese leisure market divides between the first time traveller attracted by:• doing lots of things in a short timeframe,• shopping for international brands,• good value-for-money,• findingfamiliarfoodsandinteractingwithChinesecommunities,• the prestige of visiting – and having photos taken in front of – iconic
sites, • a safe environment.
the more experienced traveller, still attracted by many of these features but also looking to travel as a means of:
• expressingincreasingself-confidenceandindividualism,• seeking an emotional connection with the destination, through authen-
ticity, clean air/blue skies, access to arts and culture etc.
The non-traditionalist Chinese tourists are fragmented into a range of sub-seg-ments or niches but even niche products have relatively large volume demand given the scale of the Chinese market34. Nonetheless, the greater segmentation ofthemarketmakesitmoredifficulttoachieveeconomiesofscaleintermsofcosts. This needs to be compensated for by using new online booking and sales concepts,making itpossible tospecificallyaddresscustomergroupseven forvery special interests and destinations.
Figure 12: Sophistication and Status for the Chinese Traveller
Source: Understanding Chinese Outbound Tourism: What the Chinese blogosphere is saying about Europe. UNWTO/ETC. 2012.
34 DestinationInvestment.NewNetworksforServingAffluentChineseVisitors.DrWolfgang Georg Arlt, COTRI – Chinese Outbound Travel Research Institute, IRB, March 2013.
Greater segmentation of the market will
require more effective online marketing
20

Marketing Strategies for Tourism Destinations. Target market: CHINA
The characteristics of the different “tribes” are summarised in Figure 13. Tra-ditionalists, estimated to still account for 70% of demand, travel predominantly for reasons of prestige and are in tour groups. The Wenyi youth and Experi-ence-centered tribes each account for 10%, with the remaining estimated 10% split between Connoisseurs (7%) and Hedonists (3%).
Figure 13: Characteristics of the Chinese Travel Tribes
Tribe Why They Travel
Mode of Travelling
With Whome
Brings on the Trip
Traditionalists Prestige Tour Groups Tour Groups Camera
Wenyi Youth Freedom, Uniqueness
Backpacking Alone or with Friends
Notebook, favourite book, mp-3 player, internet device
Experience – centered
Togetherness, curiosity
Backpacking or independent driving
Alone, with family or in ‘in-depth travel’tourgroups
Guidebook, phrasebook, electronic dictionary
Hedonists Pleasure City travel, shopping
With friends Their parents’credit card
Connoisseurs Aesthetics, knowledge
Independent driving
With partner or family
Camera with equipment, specialised guidebook, laptop
Source: Understanding Chinese Outbound Tourism: What the Chinese blogosphere is saying about Europe. UNWTO/ETC. 2012
ForthefirsttimeChineseoverseastraveller,thefocusisondoingasmuchaspossible. Trip durations are short – typically 4 days, each day packed with activi-ties, and duty free shopping is given the highest priority.
The more experienced Chinese traveller is increasingly seeking out sites and attractions away from the honeypot areas, seeking a more depth experience of the destinations visited. There is a trend towards “deep tours” focused on a single country, or two countries35.
35 The Chinese Outbound Travel Market, 2012 Update, ETC/UNWTO
ForthefirsttimeChinese overseas traveller, the focus is on doing as much as possible
21

Marketing Strategies for Tourism Destinations. Target market: CHINA
1.4 Drivers of GrowthIdealised as means to greater self-realisation, travel has become integral to the Chinese middle-class lifestyle36
There seems little doubt that outbound travel for both business and leisure pur-poses will continue to expand over the present decade and beyond given:
• the dynamics of the socio-demographic trends in China,• theChinesepopulation’srisingawarenessof,andinterestin,engag-
ing in foreign travel,• the greater ease of making foreign outbound travel arrangements aris-
ingfromtheChineseGovernment’scommitment tosupport tourism,improved connectivity and changes to visa regimes.
Though the Chinese population is forecast to grow at a low rate of 0.23% a year, thiswillstillrepresentanincreaseinthecountry’spopulationinexcessof3mil-lion people a year. By 2030, the Chinese will make up just under 20% of the world population37.
Key demographic trends with implications for travel and tourism are: the levelling out of fertility rates, large-scale urbanisation and the rapidly ageing population38. By 2030, the largest group in the Chinese population will be aged 60-64. An age-ingpopulationwithretireeshavingfinancialmeanstotravelwillboostoverseastravel. Increased and diversified leisure time, outside the prescribed “GoldenWeeks” will also serve to increase travel.
China’seconomicgrowth ratewill slowdownover thenextfiveyears,edgingdown from the 7.7% recorded in 2012 and forecast in 2013 to an annual rate of expansion of 6.5% by 201939. This is still above the rate of economic growth achieved elsewhere in the world. Income levels will continue to rise both in the medium and longer terms and will lead to growing numbers of middle class Chi-neseconsumerswithsufficientdisposableincometotravel.
At the centre of the growth of all forms of consumer spending and activity – in-cluding overseas travel and tourism - is the Chinese urban middle-class popula-tion. In 2000, only 4% of urban households in China were middle class; by 2012, that share had soared to over two-thirds; and by 2022, China’smiddle classshould number 630 million – that is, three-quarters of urban Chinese households and 45% of the entire population.40ThenumbersofaffluentmiddleclassChineseis forecast to rise from 175 million in 2011 to 1.4 billion by 203041.
36 The Chinese Outbound Travel Market 2012 Update. ETC/UNWTO.37 Demographic Change and Tourism. 2010. ETC & UNWTO.38 Ibid39 IMF World Economic Outlook China40 HalfaBillion:China’sMiddleClass-ClassConsumers.DBarton,McKinseyand
Company in The Diplomat, 30 May 2013 41 China Digital Times, 2011. Chinese Middle Class four times larger than America.
http://chinadigitaltimes.net/2011/09/within-a-generation-china-middle-class-four- times-larger-than-americas/
Travel has become integral to the
Chinese middle-class lifestyle
Ageing Chinese population will boost
overseas travel
22

Marketing Strategies for Tourism Destinations. Target market: CHINA
At present only about 7% of the Chinese have an annual income above US$15,000 (EUR11,000)andthecountry’stotalconsumptionexpenditureperhousehold–atUS$13,428 (EUR9,950) a year – is relatively low compared to other Asian coun-tries such as Japan and the Republic of Korea. The relatively small number of af-fluentChineseconsumerswillgrowandwillfollowthesamepatternofspendingon property, Western branded goods and luxury items, as well as travel. Given theyoungprofileoftheseconsumers,thisspendingtrendispredictedtocontinuefor the foreseeable future42.
The increasing urbanisation of the Chinese population will also be an important factorinstimulatingtravelandtourism.AlreadyhalfofChina’spopulationliveinCities, a proportion that will grow to two-thirds by 2030. Major cities like Beijing, Shanghai, Guangzhou and Shenzen will get bigger but the approximately 170 “second tier” cities, many of which were boosted through the Chinese stimulus package providing better transport infrastructure and services, will also represent large travel markets e.g. Chongqing (29 million population), Chengdu (14 mil-lion), Wuhan (8.3 million).
The increased rapid, recent and continuing urbanisation of the Chinese popu-lation has led to environmental problems of pollution in many cities leading to a desire to go to places without such issues. Worsening pollution and overcrowding will increasingly act as “push” factors for outbound tourism43. The impact of digital technology on Chinese travellers continues to be immense. The Chinese have over 600 million smartphone users, the largest in the world, with sales of 283 million smartphones (to 216 million new users) forecast in 201444. Two-thirds of Chinese blog/have a personal space, almost half use social networking sites and email and 83% use instant messaging45. More extensive uses of digital technology will be made both by destinations and travel organisa-tionssothat,combinedwiththeChinesepublic’sheighteneduseofsocialmedia,awareness of, interest in, and demand for travel will continue to grow.
This heightened understanding of tourist destinations around the world is giving rise to a growing sense of prestige among the Chinese about the type of trip – with package tours regarded as inferior to independently-organised travel – and destinations that have been little visited by the Chinese and/or which create a strong desire among the Chinese to visit through their marketing campaigns hav-ing a high prestige. The Chinese outbound market will increasingly fragment, with package tours gradually losing relative importance towards growing semi-pack-aged and fully independent travel arrangements.
42 ITB World Travel Trends Report 2013/2014. March 2014. IPK International reporting presentation of Chandrashekhar Singh Khangjrakpam, Centaur Research.
43 NineImportantDevelopmentsinChina’sOutboundTourism2013.WolfgangArlt,COTRI – China Outbound Tourism Research Institute http://www.forbes.com/sites/profdrwolfgangarlt/2014/01/01/nine-important-developments-in-chinas-outbound-tourism-2013/
44 Smartphone explosion in 2014 will see usership in India pass US. The Guardian – Global Development. 13 January 2014.
45 China Internet Network Information Center, 2013 cited in Chinese & Brazilian Outbound Tourism Markets and Netnography, Eduardo Santander, ETC. 7th UNWTO/PATA Forum on Tourism Trends and Outlook, October 2013
Increasing urbanisation of population will stimulate outbound travel from China
Environmental problems of pollution will stimulate desire to go to places without such issues
Digital technology crucial for Chinese travellers
23

Marketing Strategies for Tourism Destinations. Target market: CHINA
Two recent initiatives of the Chinese Government have served to increase travel and tourism by the Chinese population.
The first dates back to the early 1990swhen theChineseGovernment’sAp-proved Destination Status (ADS), a bilateral tourism agreement with – to date – 148 countries, was introduced to guarantee safe and reliable tourism services to Chinese travellers. It only concerns tour groups handled by assigned Chinese local travel agents who are allowed to promote and organise tourist groups to approved destinations, including visa application and payment of foreign curren-cy top foreign parties. Having ADS permits countries to undertake marketing in China. Chinese travellers wishing to travel independently can do so making their own visa and other arrangements. In October 2013, the China National Tourism Law was passed, making it illegal to sell tours below cost and to engage in the practice of “forced shopping”. This entails the operator taking the tourists only to those shops that provide the operator with concessions, thereby making up the shortfall on the low price of the tour that attracted the tourist to purchase it.
The second initiative is the introduction by the Communist Party General Sec-retary Xi Jinping in 2013 of the concept of the Chinese Dream. He describes it as “a national rejuvenation, improvement of people’s livelihoods, prosperity,construction of a better society and military strengthening.” He exhorts young people“todaretodream,workassiduouslytofulfilthedreamsandcontributetothe revitalisation of the nation”46
In consequence of these and other Chinese Government initiatives, trade has been increasingly liberalised and air routes increased, leading to large growth of: 1. international operations in China (many of which generate interest in visita-tion by the Chinese e.g. Swiss companies), 2. Chinese enterprises abroad, and 3. overseas travel and tourism by the Chinese.
The Chinese Government is actively supporting outbound tourism. In a January 2013 meeting with UNWTO Secretary General, Taleb Rifai, the Chairman of the ChinaNationalTourismAdministration(CNTA),ShaoQiwei,confirmedthattour-ismremainedoneoftheChineseGovernment’skeystrategicpillarsforeconomicgrowth,and thatoutbound tourismwill alsoboostChina’sdevelopment in thelongterm.Thepromotionofoutboundtourismisvaluedbecauseofthebenefitsofmutualcollaboration,thebenefitsofwhichwilleventuallyflowbacktoChina47.
The increase in air service connectivity between China and trading partners and tourism destinations in Asia and interregionally has been very strong and will con-tinuetoexertamajorinfluenceonChineseoutboundtouristflowsanddirections.Between2008/9and2013/4,scheduledservicecapacityfromChina’stwomaincities of Beijing and Shanghai grew by more than double to Thailand and the United States cities of Los Angeles and New York, and by close to double in the peak tourist season on the routes to Sydney (Australia) and Moscow (Russian Federation). The leading European destinations saw capacity increases over the period of up to a quarter, though new European routes were developed. Capaci-ties will continue to increase in line with demand.
46 ChineseDream.en.wikipedia.org/wiki/Chinese_Dream47 COTTM – China Outbound Travel and Tourism Market – April 2013. COTRI –
ChinaOutboundTourismResearchInstitute.www.slideshare.net/COTRI_Outbound/cotm-china-outbound-travel-and-tourism-market-presentation-april-2013
Liberalisation has led to expansion of air
routes
Chinese Government is actively supporting
outbound tourism
Recent policy initiatives contributed to increased travel by
Chinese
24

Marketing Strategies for Tourism Destinations. Target market: CHINA
Visa formalities are being eased across the world. While visas are still required for Chinese tourists to major destinations like the United States and Australia, the speeding up of processing is likely to serve to increase the numbers of Chinese FIT travellers.
Figure 14: NineImportantDevelopmentsinChina’sOutboundTourism2013
1Quantitative Growth
2New Push Factor
Pollution
3New Push Factor
Overcrowding
4Encouragement by new
Chinese Government
5Visa Policy Dominos
Starting to Fall
6Move Towards More Self
Organised Trips
7Move Towards New
Destinations
8Chinese Investors
Shopping Spree
9Major Players Enter the
Scene
1.5 Successful Destination Strategies Destination regions face increasing competition for the Chinese tourist. There are severalfactorsthatwilldeterminetheabilityofadestinationtoattractsignificantflowsofChinesetourists:
1. ExtenttowhichtheculturalinfluencesandspecificneedsofChinesetourists are understood and catered for,
2. The provision of the right combinations of travel offer to the groups of Chinese tourists being targeted48,
3. Recognition of the increased share of Chinese FIT travel,4. Developing tourist products and experiences in line with the needs
and expectations of the different Chinese market segments,5. Designing destination marketing to appeal to the Chinese desire for
authentic features and offerings,6. Degree to which China-friendly elements are built into the experienc-
es offered, 7. Facilitation of travel to and around the destination.
48 NewChineseTouristsinEuropefrom2017.TrendSurveybyZ_punktTheForesight Company in cooperation with the TUI Think Tank at TUI AG, 2012
25

Marketing Strategies for Tourism Destinations. Target market: CHINA
2Travel Destinations in the Chinese Market
Based on the investigations and research conducted into recent trends in Chi-nesevisitorflowsandthecomparativeassessmentthatintroducesthisreport,ashort list of seven destinations was selected for further examination in respect of the Chinese market. The seven – in alphabetical order - are:
1. ASEAN countries (Republic of Korea, Thailand, Malaysia),2. Australia,3. New Zealand,4. Russian Federation, 5. United States.
The remainder of this chapter illustrates the positioning of these countries in the Chinese market as compared to Europe. The positioning is assessed on factors thatfacilitatetourismflows,suchasvisaregimes,transportroutes,andthepo-litical, socio economic and cultural links existing between the market and each destination.
This section is enriched by an analysis of TripAdvisor ratings on accommodation, attractions and eateries, presented in Appendix 3. While not representative of Chinesetravellers,TripAdvisorratingsareusedasaproxyforconsumers’ap-preciation of key aspects of a holiday experience across competing destinations.
2.1 Visa Regimes The detailed comparison of visitor entry requirements for the selected 13 destina-tions competing with Europe considered three elements:
1. Whether the destination imposes a visa requirement for entry to the country,
2. The documentation and other details demanded for issuance of a visa,
3. A qualitative assessment of the “hassle” factor involved in obtaining the visa.
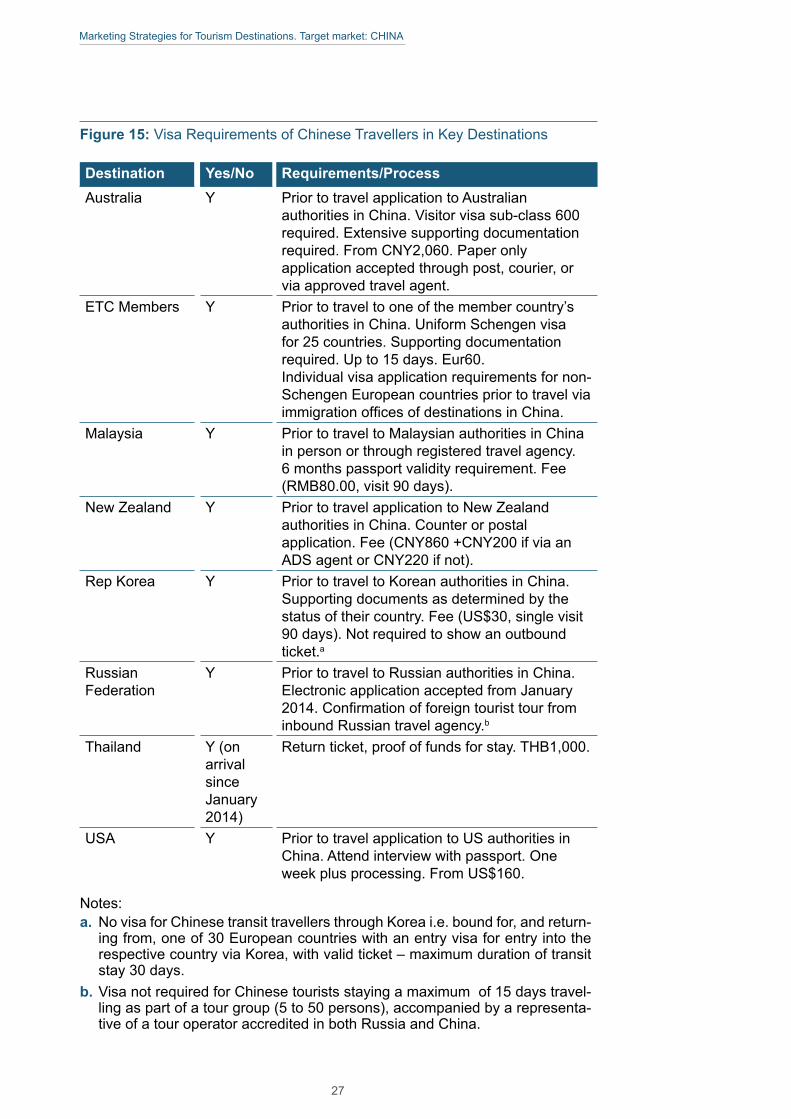
Among the seven countries selected as prime competitors to Europe in the Chi-nese market, all destinations (including ETC member countries) - with the single exception of Thailand, where visas are granted on arrival – require Chinese trav-ellers to obtain a visa ahead of travel.
26
Marketing Strategies for Tourism Destinations. Target market: CHINA
Figure 15: Visa Requirements of Chinese Travellers in Key Destinations
Destination Yes/No Requirements/ProcessAustralia Y Prior to travel application to Australian
authorities in China. Visitor visa sub-class 600 required. Extensive supporting documentation required. From CNY2,060. Paper only application accepted through post, courier, or via approved travel agent.
ETC Members Y Priortotraveltooneofthemembercountry’sauthorities in China. Uniform Schengen visa for 25 countries. Supporting documentation required. Up to 15 days. Eur60.Individual visa application requirements for non-Schengen European countries prior to travel via immigrationofficesofdestinationsinChina.
Malaysia Y Prior to travel to Malaysian authorities in China in person or through registered travel agency. 6 months passport validity requirement. Fee (RMB80.00, visit 90 days).
New Zealand Y Prior to travel application to New Zealand authorities in China. Counter or postal application. Fee (CNY860 +CNY200 if via an ADS agent or CNY220 if not).
Rep Korea Y Prior to travel to Korean authorities in China. Supporting documents as determined by the status of their country. Fee (US$30, single visit 90 days). Not required to show an outbound ticket.a
Russian Federation
Y Prior to travel to Russian authorities in China. Electronic application accepted from January 2014.Confirmationofforeigntouristtourfrominbound Russian travel agency.b
Thailand Y (on arrival since January 2014)
Return ticket, proof of funds for stay. THB1,000.
USA Y Prior to travel application to US authorities in China. Attend interview with passport. One week plus processing. From US$160.
Notes:a. No visa for Chinese transit travellers through Korea i.e. bound for, and return-
ing from, one of 30 European countries with an entry visa for entry into the respective country via Korea, with valid ticket – maximum duration of transit stay 30 days.
b. Visa not required for Chinese tourists staying a maximum of 15 days travel-ling as part of a tour group (5 to 50 persons), accompanied by a representa-tive of a tour operator accredited in both Russia and China.
27

Marketing Strategies for Tourism Destinations. Target market: CHINA
2.2 Air ConnectionsThescheduledaircapacityfromChina’stwoprincipalinternationalairgatewaystotheshortlisteddestinationscompetingwithEuropewasmonitoredonETC’sbehalf by Amadeus. Two points in the year were examined – week 24 in 2013 (broadly corresponding to high season) and week 6 in 2014 (low season), though this can only be taken as an approximate measure given the difference in north-ern and southern hemisphere climates at the different times of the year. Data for two years were considered in order to provide an indication of the trend in capacity on the various routes i.e. June 2008/June 2013, and February 2009/February 2014.
Thedestinationswith thegreatest frequencies fordirect flightsandcapacitiesare,astobeexpected,AsiandestinationsinvolvingshorterflighttimesthantoAustralia, New Zealand, the United States or Europe. The weekly capacity of directflightsfromthetwomainChineseairportstoSeoulisbetween46and47thousandonjustover200flights,withajourneytimeofaroundtwohours.ForBankgok, therearebetween28 thousand seats (on125 flights) and33 thou-sandseats(on140flights),dependingonseason,withjourneytimesofbetweenfour-and-a-halfandfive-and-a-halfhours.However,whereasdirectflightcapacityoverthefiveyearperiodtoBangkokrosebybetweenoneandone-and-a-halftimes, seats to Seoul showed little change. Capacity of direct air services from China’stwoprincipalairportstoKualaLumpuralmostdoubledovertheperiod.
JourneytimesondirectflightstotheRussianFederation–takingthecapitalcity,Moscow – range between 8 and over 10 hours. There is considerable seasonal variationinthevolumeofflightswithmorecapacityinJune(nearly13,000seatson45flightsinaggregatefromBeijingandShanghai)thaninFebruary(lessthan7,500seatson25flights).CapacityroseslightlyinthewinterperiodbutgrewbyoverahalfinJune2013comparedwiththesameweekfiveyearsearlier.
Flights from China to Australia also show considerable seasonal variation but in the reverse order with more seats in the southern hemisphere summer period (32flightswithcapacityofover10,000)thaninJune(23flightswith6,500seats).TherearenodirectflightsbetweenmainChineseairports to thewesternAus-traliancityofPerth.Directflightseatcapacityalmostdoubledoverthefiveyearperiod during the summer hemisphere months but by just under a half in June 2013 compared with the same month in 2008. Direct air capacity to New Zealand islimitedtoflightsbetweenShanghaiandAucklandwithadoublingofcapacityin the peak period, though this increase partly offset the withdrawal of direct air services from Beijing two years ago.
The three United States airports included in the present study are Los Angeles, New York and Miami. There are no direct scheduled air services from China to Miami.LosAngelesreceives35flightsaweekfromBeijingandShanghaiwith13,000seats.NewYorkhas32directflightsprovidingacapacityofover11,500.Directflightjourneytimesarearound12hourstoLosAngelesandbetween13.5and nearly 15 hours for New York.
Considerable seasonal variation in thevolumeofflights
from China
28

Marketing Strategies for Tourism Destinations. Target market: CHINA
Capacity increases to the United States airports have been extremely high: in the case of Los Angeles, the rise was three-and-a-half times in the week being stud-ied between June 2008 and 2013 and by almost double between February 2009 andthesameweek in2014.ForNewYork,directflightseatcapacitydoubledJune to June and one-and-a-half-times from February 2009 and February 2014.
The pattern for China-Europe direct air services is for modest growth except for those cities with low base volume in the initial year being examined. This pro-duces a high growth rate even though the number of seats is relatively small e.g. capacity to Madrid rose 88% between February 2009 and 2014 but still amounts to just over 1,000 seats a week.
The discrepancy between Europe and its competitors is less marked when con-nectingflightsareconsidered.ApartfromthefastestgrowthdestinationssuchasBangkok and New York, and newly emerging destinations with low base volumes ofconnectingflightsinthefirstofthetwoyearsexaminede.g.PerthandMiami,theincreaseinconnectingflightservicesisbroadlysimilarbetweentheEurope-an benchmark destinations and competitors. Figure 16: Changes in Weekly Direct Flight Seat Capacity from China (Beijing and Shanghai Aggregated) to Selected Destinations, June 2008-June 2013 and February 2009-February 2014
Source: TDI calculations based on data supplied by Amadeus
The analysis points to a comparative advantage of competing destinations in terms of air connections with China. Over the past five years, direct air capacity from China both to major short haul destinations (e.g. Thailand and Malaysia) and to long haul destination competing with Europe (i.e. Australia, Russian Fed-eration and, most significantly, the United States) has expanded more significant-ly than to Europe.
Fulldetailsofflights,capacitiesandflighttimefordirectandconnectingflightsfor a week in June 2008 and 2013, and a week in February 2009 and 2014 are shown in Appendix 1.
NOTE:figures infrontofbreak(/)relatetothefirstyear inthetimeseries i.e.June 2008, while those after the break are for the later year i.e. June 2013.
Significantcapacityincreases to the United States airports
More modest growth in China-Europe direct air services
Europe's competitors have a comparative advantage in terms of air connections with China
29

Marketing Strategies for Tourism Destinations. Target market: CHINA
Figure 17: Direct Flights CapacityTo
urism Strategy of Europ
e’s Main Co
mpe
titors – China
Rep
ort
0 5,
000
10,0
00
15,0
00
20,0
00
25,0
00
Beijing
–
Bang
kok
Beijing
– K
uala
Lu
mpu
r Be
ijing
– Seo
ul
Beijing
–
Sydn
ey
Beijing
–
Auc
klan
d
Beijing
-‐ Asia
Pacific
Feb-‐
09
Feb-‐
14
Jun-‐
08
Jun-‐
13
0 10
,000
20
,000
30
,000
40
,000
Shan
ghai
-‐ Ba
ngko
k Sh
angh
ai -‐
Kual
a Lu
mpu
r
Shan
ghai
-‐ Se
oul
Shan
ghai
-‐ Sy
dney
Sh
angh
ai -‐
Auc
klan
d
Shan
ghai
-‐ Asia
Pacific
Feb-‐
09
Feb-‐
14
Jun-‐
08
Jun-‐
13
0 2,
000
4,00
0 6,
000
8,00
0
Beijing
–
New
Yor
k Be
ijing
–
Los
Ang
eles
Beiji
ng -‐
USA
Feb-‐
09
Feb-‐
14
Jun-‐
08
Jun-‐
13
0 20
00
4000
60
00
8000
Shan
ghai
–
New
Yo
rk
Shan
ghai
-‐ Lo
s Ang
eles
Shan
ghai
-‐ USA
Feb-‐
09
Feb-‐
14
Jun-‐
08
Jun-‐
13
Figu
re 1
6 Di
rect
Flig
hts
Cap
acity
0 1,
000
2,00
0 3,
000
4,00
0 5,
000
6,00
0 7,
000
8,00
0 9,
000
10,0
00
Beijing
–
Am
ster
dam
Be
ijing
–
Lond
on
Beijing
–
Paris
Beijing
–
Rom
e Be
ijing
–
Mos
cow
Be
ijing
–
Mad
rid
Beiji
ng -‐
Euro
pe
Feb-‐
09
Feb-‐
14
Jun-‐
08
Jun-‐
13
0 1,
000
2,00
0 3,
000
4,00
0 5,
000
6,00
0 7,
000
8,00
0 9,
000
Shan
ghai
-‐ Am
este
rdam
Sh
angh
ai -‐
Lond
on
Shan
ghai
–
Paris
Shan
ghai
-‐ Ro
me
Shan
ghai
-‐ M
osco
w
Shan
ghai
-‐ Eu
rope
Feb-‐
09
Feb-‐
14
Jun-‐
08
Jun-‐
13
Beijing
Shan
ghai
Source: TDI calculations based on data supplied by Amadeus30
Marketing Strategies for Tourism Destinations. Target market: CHINA
2.3 Political, Economic and Socio-Cultural Links China has developed and maintains strong relations with each of the seven coun-tries under study, there remaining few barriers to the encouragement and facilita-tion of tourism to and from China.
4% of the Australian population – 0.9 million - are of Chinese ancestry49, with 319,000 having been born in Mainland China. Chinese Australians are now one of the most well-established immigrant ethnic groups in Australia. Chinese news-papers are published in Australia and three shortwave and longwave radio chan-nels broadcast in Mandarin and Cantonese while the Australian public broad-caster SBS also provides television and radio on weekends. Chinese Australian social websites like Xīn Zújì (新足迹, www.oursteps.com.au) and FREEOZ (www.freeoz.org) are popular.
The relationship between China and Australia has grown closer in recent years, both countries being actively engaged economically, culturally and politically through a number of regional bodies e.g. APEC, East Asia Summit, G20. China isnowAustralia’slargesttradingpartnerandhaslargeinvestmentsinAustralianmining companies. Diplomatic relations between China and the Republic of Korea were only estab-lished in 1992, following the latter’swithdrawal of recognition of theRepublicof China (Taiwan). Since then, their political, economic, diplomatic, and cultural relations have advanced with unprecedented speed and scope. Currently, China istheRepublicofKorea’slargesttradingpartnerwhileitisChina’sthirdlargest.Though there remain apprehensions on both sides – among the Koreans about China’srapidemergenceasaglobalpoweranditssupportfortheDemocraticPeople’sRepublicofKorea (NorthKorea),andamong theChineseabout theRepublicofKorea’sstrongalliancewiththeUnitedStates–thishasnotdeterredcontinued expansion of all aspects of trade (including tourism).
The Korean and Chinese people are knowledgeable about each other’s cul-ture and customs. Just over 1% of the Korean population is from China, though three-quarters of the 624,994 recorded in the 2009 census are ethnic Koreans50.
China and Malaysia have close and strong diplomatic relations. Chinese people are the second largest ethnic group in Malaysia making up 24.6% of the popula-tion51. They have been dominant in trade and business since the early 20th centu-ry.MalaysiahasbeenChina’stoptradingpartnerwithinASEAN(AssociationofSoutheast Asian Nations – ten member countries) since 2008.
China and New Zealand have maintained strong diplomatic relations since 1972, leadingin2008toNewZealandbeingthefirstdevelopedwesterncountrytoen-ter into a free trade agreement with China. In the six years since the arrangement came into place, which enabled New Zealand to secure a greater share of the rapidly expanding Chinese market as well as the potential for deeper bilateral relations, China has become an increasingly important trade partner of New Zea-land.In2013,NewZealand’sexportstoBeijingexceededNZD7billion(EUR4.3billion)and,inthefirstquarterofthatyear,ChinaovertookAustraliaasNewZea-land’stopexportmarket52.
49 2011 Census. Australian Bureau of Statistics50 More than 1 million foreigners line in Korea. The Chosunilbo. August 6 2009.51 Malaysian Population and Housing Census 2010.52 New Zealand between two great powers. Robert Patman, Fair Observer.
Relationship between China and Australia has grown closer in recent years
China is the RepublicofKorea’slargest trading partner
Chinese people are the second largest ethnic group in Malaysia
China is New Zealand’stopexportmarket
31

Marketing Strategies for Tourism Destinations. Target market: CHINA
The 171,000 strong Chinese community makes up 4% of the New Zealand popu-lation in 201353, having grown by 16% since the previous census in 2006.
2014 marks the 65th anniversary of diplomatic relations between China and Rus-sia, and bilateral relations are set to develop at a higher, faster and stronger rate, asevidencedby the fact that thePresidentsof the twonationshavemetfivetimes in the past year and established a close working relationship as well as a deepandvaluedpersonal friendship.ChinahasbeenRussia’s largest tradingpartner for four consecutive years. There is steady momentum on pragmatic and strategic cooperative projects, and people-to-people contacts are being further promoted through such programmes as the China-Russia Youth Friendly Ex-changes Year. Since 2006, the two countries have held reciprocal events, name-ly the Year of Russia in China in 2006, the Year of China in Russia in 2007, and language years in 2009 and 2010, followed by tourism years.
The most recent Tourism Year of China in Russia was opened in Moscow in March 2013. It is part of the China-Russia Tourism Year programme which began in 2012 with the Tourism Year of Russia in China to promote exchanges between the two countries. At the opening ceremony of Tourism Year of China in Russia, President Xi Jinping, urged both countries to take advantage of the “Tourism Year” to foster tourism cooperation into a new highlight in China-Russia strategic cooperation. Custom exchange programmes were organised serving to heighten theappreciationofeachother’scivilisationsandcultures54. The activities includ-ed self-driving tours from Moscow to Beijing and student exchange programmes.
Though the great majority of Chinese tourists travel to the cities of Moscow, as illustrated by the air capacity details in the preceding sub-section, and St Peters-burg, there are also substantial trading and other links between cities in the east of the Russian Federation and main centres in northern China. Direct or connect-ingflightsareoperatedbetweenBeijing,HarbinandDalianandtheRussiancitiesof Khaborovsk Novy, Khomutovo (Yuzhno-Sakhalinsk), Koltsovo (Yekaterinburg), Krasnoyarsk-Yemelyanovo, Novosibirsk Tolmachevo, Yakutsk and Vladivostok.
Ethnic Chinese numbers in the Russian Federation are disputed. The 2010 cen-susdidnotincludethecategory.Whiletheofficialnumberisaround35,000fromthe 2002 census, Russian demographers accept a level of between 0.2 and 0.4 million55. Temporary migration and cross-border trade not involving settling in Russia are prevalent. Most permanent Chinese residents are in Moscow.
Sino-Thai relations continue to develop as trade has become the dominant theme in bilateral relations. Thailand continues to support the One China Policy, though maintainingunofficialrelationswithTaiwan,helpingitgainaccesstocapitalandtheChinesemainlandmarket.ChinaisThailand’ssecondlargestexportmarket,whileChinaisthelargestsourceofThailand’simports.
23 February 2014. http://www.fairobserver.com/article/new-zealand-between-two-great-powers-02598 53 New Zealand 2013 Census. Statistics New Zealand54 PresidentXiJinping’sAddressattheOpeningCeremonyofTourismYearofChina
in Russia. March 2013. http://en.cnta.gov.cn/html/2013-6/2013-6-4-10-13-25919.html
55 http://en.wikipedia.org/wiki/Ethnic_Chinese_in_Russia#CITEREFLarin2008
China has been Russia’slargest
trading partner for four consecutive
years
“Tourism Year” fostering China-
Russia cooperation on Tourism
32

Marketing Strategies for Tourism Destinations. Target market: CHINA
Thailand has the largest overseas Chinese community – almost 10 million in 201256 - and is also the most successful case of full assimilation. For over 400 years, Thai-Chinese have largely intermarried and assimilated with their compatriots.
Though aspects of strategic distrust persist between China and the United States, never in history has a rising power and an established one had such intensive economicinteractionandinterdependence,somanyofficialbilateralinstitutions,and so much people-to-people engagement57.Chinaisthegreatestbeneficiaryof the existing international system, and has proposed a new type of great power relationswiththeUnitedStates,toreassureWashingtonofChina’scommitmentto peaceful development and constructive ties.
A total of 3.8 million Chinese Americans or American-born Chinese were record-ed in the 2010 United States census58. Chinese culture is widespread in a country renowned for its racial and cultural diversity. The principal centres of the Chinese community are in the greater city areas of New York, San Francisco and Los An-geles which, together, account for half the Chinese living in the country.
2.4 Consumer Assessment (TripAdvisor) This section presents an analysis of ratings provided by TripAdvisor users from China on three elements of a visitor experience: attractions, accommodation and eateries.WhilenotrepresentativeofChinesevisitors’behaviour,TripAdvisorrat-ings allow for cross-destination comparisons on components of a holiday experi-ence. The analysis covers the six destinations competing with Europe in China, and four European destinations used as benchmark in this study (France, Italy, Spain and United Kingdom). The results for European countries and competing destinations are presented in Appendix 3.
On average, TripAdvisor users from China positively rate accommodation in all selected destinations, with minor differences across destinations. In 2013, New Zealand accommodation (4.4) achieved the highest average review rating by Chinese TripAdvisor users, while the United States, the Russian Federation and Malaysia received a comparatively low average review rating (3.9). Compared to quality of accommodation in their own country (4.0), TripAdvisor users from Chi-naaremoresatisfiedwithaccommodationinItaly(4.2),Spain,RepublicofKo-rea, Thailand and United Kingdom (each at or close to 4.1). Australia and France perform marginally less well than local accommodation services.
Average ratings for all destinations in Europe suggest that TripAdvisor users from Chinawereingeneralsatisfiedwithaccommodation(4.2).Thesevisitorsweremostsatisfiedwiththelocationandcleanliness(bothat4.4)oftheaccommoda-tion they selected for their stay, while they tended to be slightly less positive when evaluating the quality and value for money of the rented room (4.1). Quality of sleep and staff and service were averagely positive (4.2).
56 CIA World Factbook57 China: US relations: the myth of the Thucydides Trap. Wei Zongyou, The Diplomat.
30 March 2014. http://thediplomat.com/2014/03/china-u-s-relations-the-myth-of-the-thucydides-trap/
58 Race reporting for the Asian population by selected categories, 2010. US Census Bureau.http://factfinder2.census.gov/faces/tableservices/jsf/pages/productview.xhtml?pid=DEC_10_SF1_QTP8&prodType=table
Thailand has largest overseas Chinese community
3.8 million Chinese Americans or American-born Chinese in US
TripAdvisor users from China were satisfiedgenerallywith accommodation in Europe
33

Marketing Strategies for Tourism Destinations. Target market: CHINA
Eateries seem not to be a distinctive trait of destinations for TripAdvisor users from China, as there are no major differences in ratings assigned to the desti-nations in the study, other than for the Russian Federation which received the high rating of 4.3. The Republic of Korea ranks next at 4.2. The United States, Thailand, Spain and Italy are rated in line with the average rating of Chinese eateries (4.08), while Australia, United Kingdom, Malaysia and France match the domestic benchmark (3.9).
TripAdvisor users from China assign the highest average ratings to attractions. Italy (4.5) scores highest in the evaluations posted in 2013 through the online platform, while Malaysia is associated with the lowest rating (4.0). Attractions in the Russian Federation, Spain and the United States each scored 4.4; while those in Australia, the United Kingdom and France achieved 4.3 (in line with the averageforalldestinations).Thailand’sratingwasslightlylowerbutstillabovetheChineseTripAdvisorusers’ratingforattractionsintheirowncountry(4.2),alevel than was matched by the Republic of Korea.
Figure 18: TripAdvisor Ratings of Tourism Services in Competing Destinations
TripAdvisor operates sites in 41 countries and 23 languages. TripAdvisor offers 150 million+ reviews and opinions on its site and receives 100+ user contribu-tions a minute. TripAdvisor covers 810,000+ hotels, B&Bs and specialty lodgings, 2.2 million+ restaurants and 420,000+ attractions worldwide.As the world’s largest travel site, with nearly 260 million unique monthly visitors*, TripAdvisor has valuable, global insights regarding travel patterns and trends. TripAdvisor data, such as user traffic patterns and average review ratings, can provide relevant insights for local hospitality and other travel industry businesses.
*Source: comScore Media Metric for TripAdvisor Sites, worldwide, Q1 2014.
High average ratings for attractions confirmtheir
importance for Chinese users
34

Marketing Strategies for Tourism Destinations. Target market: CHINA
Eateries seem not to be a distinctive trait of destinations for TripAdvisor users from China, as there are no major differences in ratings assigned to the desti-nations in the study, other than for the Russian Federation which received the high rating of 4.3. The Republic of Korea ranks next at 4.2. The United States, Thailand, Spain and Italy are rated in line with the average rating of Chinese eateries (4.08), while Australia, United Kingdom, Malaysia and France match the domestic benchmark (3.9).
TripAdvisor users from China assign the highest average ratings to attractions. Italy (4.5) scores highest in the evaluations posted in 2013 through the online platform, while Malaysia is associated with the lowest rating (4.0). Attractions in the Russian Federation, Spain and the United States each scored 4.4; while those in Australia, the United Kingdom and France achieved 4.3 (in line with the averageforalldestinations).Thailand’sratingwasslightlylowerbutstillabovetheChineseTripAdvisorusers’ratingforattractionsintheirowncountry(4.2),alevel than was matched by the Republic of Korea.
Figure 18: TripAdvisor Ratings of Tourism Services in Competing Destinations
TripAdvisor operates sites in 41 countries and 23 languages. TripAdvisor offers 150 million+ reviews and opinions on its site and receives 100+ user contribu-tions a minute. TripAdvisor covers 810,000+ hotels, B&Bs and specialty lodgings, 2.2 million+ restaurants and 420,000+ attractions worldwide.As the world’s largest travel site, with nearly 260 million unique monthly visitors*, TripAdvisor has valuable, global insights regarding travel patterns and trends. TripAdvisor data, such as user traffic patterns and average review ratings, can provide relevant insights for local hospitality and other travel industry businesses.
*Source: comScore Media Metric for TripAdvisor Sites, worldwide, Q1 2014.
3.1 Destination Marketing Organisations
Within each competing destination, tourism authorities responsible to promote theircountryas tourismdestination inChinahavebeen identified (Figure19).Information about these organisations has been collected from existing sources and, whenever possible, through personal interviews.
Figure 19: Listing of Competitor Destination DMOs and Tourism Representative Bodies
Competitor Destination
Destination Marketing Organisations
Australia Visit Australia http://www.australia.com Tourism Australia http://www.tourism.australia.comAssociation of Australian Convention Bureaux Inc. http://www.aacb.org.au Association of Australian Convention Bureaux Inc. http://www.aacb.org.au
Malaysia Tourism Malaysia http://www.tourism.gov.my/en/intl
New Zealand Tourism New Zealand http://tourismnewzealand.comTourism Industry Association of New Zealand http://tianz.org.nz
Rep of Korea Korea Tourism Organization http://www.visitkorea.or.kr/
Russia RussianNationalTouristOffice,FederalAgencyforTourismMinistryofCultureoftheRussian Federation http://www.russiatourism.ruRussian Union of Tourist Industry – RST http://www.rstnw.ruAssociation of Tour Operators of Russia – ATOR http://www.atorus.ru
Thailand Tourism Authority of Thailand http://www.tourismthailand.orgAssociation of Thai Travel Agents http://www.atta.or.th
USA Brand USA http://www.thebrandusa.com/USTOA – US Tour Operators Association http://www.ustoa.com
Source: TDI
Profile of Europe’s Main Competitors in China 3
35

Marketing Strategies for Tourism Destinations. Target market: CHINA
The AustralianTourism Sector
China is now 2nd most important
generating market for Australia
Australia, it is the 10th highest recipient of
tourist spending
Tourism provides direct employment
for half a million Australians
Australia received 6.5 million international tourist arrivals in 2013, a rise of 5.5% over 2012. Between 2008 and 2013, arrivals grew at the rate of just over 3% a year. Main markets are New Zealand, China, the United Kingdom, the United States and Japan. The increase in Chinese visitor arrivals in 2013 at 14.2% was considerably above the overall rise in that year, a total of 715,000 arrivals being recorded. Between 2008 and 2013, the share of Chinese arrivals grew from 6.4% to 11%. In consequence, China moved up from 5th most important generating market in 2008 to 2nd (after neighbouring New Zealand) in 2013.
Tourism receipts totaled AUD32.9 billion (EUR25.9 billion) in 2012, virtually the same as four years earlier expressed in local currency, but lower than the 2009 peak of AUD34.7 billion (EUR21.7 billion)59. However, because of the apprecia-tion of the Australian dollar against its United States counterpart over the peri-od60, and especially between mid 2008 and mid 2009, the 2012 level was higher in United States dollar and Euro terms than in earlier years.
Though there are over 40 countries around the world that receive more interna-tional tourists than Australia, it is the 10th highest recipient of tourist spending as a consequence of its long distance from generating markets leading to few low spending, cross border and other short duration visits.
Direct tourism GDP for 2012/13 amounted to AUD42.3 billion (EUR31.8 billion), up3.7%over thepreviousyear, fora2.8%shareof thecountry’sGDP.Tour-ism provided employment for 544,000 in 2012/1361. The Tourism 2020, Tourism Australia’s Journey 2010 to 2013 report concludes that tourism in Australia:
• generates AUD107 billion (EUR80 billion) in consumption62 ,• provides direct employment for half a million Australians,• representsthecountry’sleadingservicesexportsector,• contributes towards the funding of airports, roads, hotels and other
infrastructure,• assists in the economic development of regional Australia with 45
cents of every dollar being spent outside the major conurbations,• achieves a high multiplier – 91 cents generated for every tourist dollar.
59 OECD OECD Tourism Trends and Policies 2014. March 2014. OECD. http://www.keepeek.com/Digital-Asset-Management/oecd/industry-and-services/oecd-tourism-trends-and-policies-2014_tour-2014-en
60 Yearly Average Currency Exchange Rates. IRS. http://www.irs.gov/Individuals/International-Taxpayers/Yearly-Average-Currency-Exchange-Rates
61 Australian National Accounts: Tourism Satellite Account 2012-13. Australian Bureau of Statistics http://www.abs.gov.au/AusStats/[email protected]/MF/5249.0
62 Tourist Satellite Account, 2011-12, Australia Bureau of Statistics, 2013.36

Marketing Strategies for Tourism Destinations. Target market: CHINA
On 3 October 2013, responsibility for tourism policy, programmes and research transferred from the former Department of Resources, Energy and Tourism to Austrade(theAustralianTradeCommission).Australia’stourismmarketingau-thority, Tourism Australia, remains a separate statutory authority with primary re-sponsibility for the international marketing of Australian tourism, reporting to the Minister for Trade and Investment.
Tourism is one of four Australian National Investment Priorities. In recognition of the importance of high quality infrastructure, products and experiences, as a key componentofmaintaining thecountry’scompetitivenessasa tourismdestina-tion, Tourism Australia, the-then Department of Resources Energy and Tourism andAustradeofficiallycommencedafive-yearpartnership in2012 todrive in-vestment opportunities in tourism.
The National Long-Term Tourism Strategy, published in 2009, is the overar-ching Australia tourism industry strategy supported by federal, state and territory Tourism Ministers. The 2020 Tourism Industry Potential, published in 2010, explains what a successful Australian tourism industry will look like in 2020. The Tourism 2020 overview,publishedin2011,providesanoverviewofAustralia’snational strategy to enhance growth and competitiveness in the tourism industry.
The aims of Tourism 2020 are to achieve increases in:• overnight tourism spend from AUD70 billion (EUR44 billion) in 2009 to
between AUD115 billion and AUD140 billion (EUR80 to 97 billion) by 2020,
• tourism labour and skills,• accommodation rooms, particularly in capital cities,• international and domestic aviation capacity, • standards in industry quality and productivity.
Key targets for areas in which additional infrastructure investment and/or devel-opment is required are:
• increasing accommodation capacity by between 6,000 and 20,000 rooms,
• increasing international-operated and domestic aviation capacity over 2009 levels by up to 50% and 30% respectively63.
It focuses on 6 strategic areas:• grow demand from asia,• build competitive digital capability,• encourage investment and implement regulatory reform,• ensure tourism transport environment supports growth,• increase supply of labour, skills and indigenous participation,• build industry resilience, productivity and quality.
63 OECD Tourism Trends and Policies 2014. March 2014. OECD. http://www.keepeek.com/Digital-Asset-Management/oecd/industry-and-services/oecd-tourism-trends-and-policies-2014/australia_tour-2014-8-en#page6
The AustralianTourism Sector
Tourism Australia has primary responsibility for international marketing
Afive-yearpartnership to drive investment opportunities in tourism
37
Marketing Strategies for Tourism Destinations. Target market: CHINA
Initiatives included the release of a Tourism Investment Guide, a Tourism Invest-ment Monitor and investment opportunities database; identifying and targeting key overseas investors; and establishing close working relationships with tourism specialists in state and territory tourism investment agencies64.
In November 2012 the Australian Government launched the Tourism Major Proj-ect Facilitation service to assist new tourism investment in gaining development approvals.Acasemanagerisappointedtosignificantnewtourismprojectstopro-vide support and broker solutions to problems. 24 enquiries have been made to the TMPF scheme, four of which – involving investment of AUD2 billion (EUR1.4 billion) and the creation of 12,000 jobs – are being assisted through Australian Government approvals.
The 2020 Potential for the Business Events Sector, published in 2013, out-lineshowAustralia’sbusinesseventssectorhasthepotentialtodoubletheover-night expenditure by visitor delegates to between AUD15.8 billion and AUD16.0 billion (i.e. around EUR11 billion) to by 2020. Tourism 2020, Tourism Austra-lia’s Journey 2010 to 2013, published in October 2013, provides an update on TourismAustralia’s progress throughphaseoneof theTourism2020 strategyabout‘settingthefoundation’.
Tourism Australia is an Australian Government statutory authority and the Feder-al Government agency responsible for international and domestic tourism mar-keting, attracting international visitors to Australia and encouraging Australians to travel domestically, both for leisure and business events. Its purpose is to increasetheeconomicbenefitstoAustraliaof tourism.Todothis ithas imple-mented a new strategic approach – Tourism 2020 – aimed at growing overnight tourism expenditure to as much as AUD140 billion (EUR97 billion) by the end of the decade.
Asamarketingbody,TourismAustralia’sresourcesarededicatedtofacilitatingtrade marketing opportunities for established businesses that will generate high yielding, sustainable market opportunities. Critical to its global marketing effort is reaching the customers most likely to enjoy what Australia has to offer.
Tourism Australia is highly active in undertaking extensive research into tourist markets, trends and performance with the view to guiding future tourism devel-opment and marketing strategies. It disseminates such information widely to the private sector with which it has a number of partnerships and alliances to create demandforthedestinationusingthecurrentthemeof“There’sNothingLikeAus-tralia”.
UndertheTourismAustraliaAct(2004)TourismAustralia’sobjectivesare:• toinfluencepeopletravellingtoAustraliatoalsotravelthroughoutAus-
tralia,• to influenceAustralians to travel throughoutAustralia, including for
events,• to help foster a sustainable tourism industry in Australia, • tohelpincreasetheeconomicbenefitstoAustraliafromtourism.
64 Tourism2020,TourismAustralia’sJourney2010to2013,TourismAustralia,October 2013
1.1.1 Tourism Administration
Tourism Major Project Facilitation
service launched to assist tourism
investment
Resources are dedicated to facilitating
trade marketing opportunities
38

Marketing Strategies for Tourism Destinations. Target market: CHINA
Its outcome statement for 2013/14 as approved by the Government is to increase demand for Australia as a destination, strengthen the travel distribution system and contribute to the development of a sustainable tourism industry through con-sumer marketing, trade development and research activities.
TourismAustralia’scurrentsloganis“There’sNothingLikeAustralia”.
Tourism Australia receives AUD130 million (EUR90 million) in yearly funding, andtotaltourismfundinginthecountry(includingforAustrade’sTourismQualitygrants and the Tourism Industry Regional Development Fund) is about AUD185 million (EUR129 million). Three quarters of the marketing element of the 2013/14 appropriation for tourism is concentrated on category 1 and 2 markets, including GreaterChina.Thecountry’sfocusisasadestinationofleisure,events(includ-ing business events) and education.
TheAustralianCommissionofAudithasarguedthatthebenefitsoftheneartwo-thirdsofTourismAustralia’sbudgetdirectedtoadvertisingandotherpromotionalactivities accrue to tourism operators and, as such, address market failures with-in the tourism industry. The Commission proposed that marketing Australia as a destination for international tourists should be undertaken at a Commonwealth level rather than on a State-by-State level whereby grant funding for the tourism industrywouldceasesandTourismAustralia’sfundingreducedbyahalftofocuson international marketing, with the function incorporated into a commercial arm of the Department of Foreign Affairs and Trade65. The Government of Australia rejectedtheNationalCommissionofAuditproposalsandhasconfirmedthattheFederal Budget will include AUD130 million (EUR90 million) in base funding for Tourism Australia and AUD13.5 million (EUR9.4 million) towards the Asia Mar-keting Fund66.
Activities include advertising, Public Relations and media programmes, trade shows and industry programs, consumer promotions, online communications and consumer research.
Tourism Australia operates a 35 language website and uses digital marketing focused on personalising, socialising and mobilising its product offerings, en-ablingconsumerstosharetheirownstoriesandexperiences.TourismAustralia’sFacebook page exceeded 4.5 million fans worldwide in 2012–13. Tourism Aus-tralia launched its customised YouTube channel, youtube.com/Australia, in 16 countriesinNovember2012,thefirstfornationaltourismorganisationsandthetravel industry.
Tourism Australia is active in around 30 key markets including Australia, pro-moting the unique attributes which will entice people to visit and targeting those people who its research indicates will spend more and travel most widely.
65 National Commission of Audit Recommendations. http://www.ncoa.gov.au/report/phase- one/recommendations.html
66 Tourism Funding Safe in 2014/15 Budget. http://www.travelweekly.com.au/news/tourism-funding- maintained-in-2014-15-budget
Tourism Australia receives AUD130 million (EUR90 million) in funding annually
Digital marketing used to personalise tourism product offerings
39

Marketing Strategies for Tourism Destinations. Target market: CHINA
TourismAustralia’sKeyMarketRegionsare:• Australia (domestic),• Americas - United States of America, Canada and Brazil,• Europe - France, Germany, Italy and the United Kingdom,• Greater China - China and Hong Kong,• Japan and Korea,• New Zealand,• South and South East Asia - Singapore, Malaysia, India, Indonesia,
Vietnam and Gulf Countries.Key markets have been categorised by the potential of growth in visitor spend by 2020. Visitor spend, tracked by the International Visitor Survey refers to the amount of AUD spent by travellers in Australia (*denotes countries where Tour-ism Australia also targets Business Events in addition to leisure consumers):
• visitor spend by these markets has the potential to be worth over AUD5 billion (EUR3.4 billion) by 2020: Greater China* (China and Hong Kong), North America* (United States and Canada), United Kingdom*, Australia,
• visitor spend by these markets has the potential to be worth over AUD2.5 billion (EUR1.7 billion) by 2020: New Zealand*, Republic of Korea, Singapore, Malaysia,
• visitor spend by these markets has the potential to be worth over AUD1 billion (EUR0.7 billion) by 2020: Japan*, Indonesia*, India*, Germany, Middle East,
• fast emerging: Brazil, Vietnam,• high priority: Italy, France.
Ineachkeymarket,TourismAustraliatargetsspecificconsumersegmentswhichrepresent the best prospect for achieving the Tourism 2020 targets. Reaching thiscustomerisatthecoreofallofTourismAustralia’sconsumer,distributionandpartnership marketing activities.
• Youth - the youth segment isan important part ofAustralia’s visitormix. Youth contribute nearly AUD12 billion (EUR8.3 billion) annually in tourismspendingandrepresentaquarterofallAustralia’sinternation-al arrivals,
• Experience Seekers are, by definition, looking for unique, involvingand personal experiences from their holidays,
• The Cruise Industry - cruising is an important segment in Australia and onethatissignificanttoourtourismindustry,
• Aboriginal Tourism, • Luxury Tourism.
To do this they have gained greater insights in the past year to better understand what motivates their target customers to visit Australia through their Consumer Demand Research project, conducted in 11 key international markets plus Aus-tralia.
Youth market and experience seekers are key segments
40

Marketing Strategies for Tourism Destinations. Target market: CHINA
The research findings showed that potential visitors have high expectationsofAustralia, and for those considering a repeat visit the destination’s biggeststrengths are its world class beauty, safety and welcoming people. These insights willhelptofurthershapeandfinetuneTourismAustralia’smarketinginordertomaintain Australia as a compelling proposition for travellers.
Tourism Australia operates from its headquarters in Sydney and maintains over-seas offices inCanada,China, HongKong, India, Japan,Republic of Korea,Malaysia, New Zealand, Singapore, the United Kingdom (covering the United Kingdom, Ireland and Nordic countries) and the United States. It has represen-tativeofficesinBrazil,France,Germany(coveringContinentalEurope)andItaly.
Beauty, safety and welcome are primary motivators for repeat visitors
41
Marketing Strategies for Tourism Destinations. Target market: CHINA
In 2013, international tourist arrivals grew by 9.3% to reach 12.2 million. The average annual growth in arrivals has been strong between 2009 and 2013 at 11.7%, placing it just outside the top 20 in terms of worldwide destinations. In-ternational tourism receipts reached US$13.4 billion (EUR10.3 billion) in 201267, though the World Travel and Tourism Council (WTTC) study calculates visitor exports at KRW23,299 billion (US$21.5 billion, EUR16.0 billion) in 2012. This represents 18% of all service exports and 3% of all exports (including goods and services)68.
Each US$1 million (EUR0.7 million) in total travel & tourism spending in the econ-omy generates US$1.1 million (EUR0.8 million) in GDP. Travel and tourism con-tributed US$68 billion (EUR50 billion), representing 5.8% of the Republic of Ko-rea’seconomyin2013,andprovided1.6millionjobs,6.3%ofemployment.The2013WTTCreportfindsthatforeveryUS$1million(EUR0.7million)intravel&tourism spending, 25 jobs are supported69.
Following the election of a new government in February 2013, the Ministry of Culture, Sports and Tourism established a new Digital Content Industry Division. Within the Ministry, the Tourism Bureau has three divisions: Tourism Policy, Tourism Industry, and International Tourism. The Tourism and Leisure Planning Sub-Division comprises divisions for Tourism Development Planning, Tourism Development Support, and Tourism and Leisure Infrastructure. The Korea Tour-ism Organization is in charge of marketing.
67 OECD Tourism Trends and Policies 2014. March 2014. OECD http://www.keepeek.com/Digital-Asset- Management/oecd/industry-and-services/oecd-tourism-trends-and-policies-2014/korea_tour-2014-26-en#page3
68 Travel and Tourism Economic Impact 2013 Korea. WTTC. http://www.wttc.org/site_media/uploads/downloads/south_korea2013_2.pdf
69 RepublicofKorea’sTravel&Tourismsectorsettooutperformeconomyovernextten years, February 2014. http://www.wttc.org/news-media/news-archive/2014/south-koreas-travel-tourism-sector-set-outperform- economy-over-n/
The Republic of Korea Tourism Sector
International tourist arrivals grew by 9.3%
to reach 12.2 million in 2013
Travel & tourism spending represents
5.8% of GDP
42
Marketing Strategies for Tourism Destinations. Target market: CHINA
In July 2013, the Ministry introduced a set of initiatives and policy reforms to achieve its 2017 targets of 16 million international visitors and 60,000 new jobs in the industry i.e.
• increased visa facilitation – increase in multiple-entry visas for resi-dentsofBeijingandShanghai,andtostudentsatspecifiedChineseuniversities,
• replacement holiday plan giving Korean workers an average additional 1.1. vacation days in order to boost domestic tourism,
• hotel tax refund programme, whereby foreign visitors are reimbursed 10% value added tax on room charges,
• meeting, incentives, conventions, exhibitions (MICE) – additional financialandadministrativeresourcestoboostthesector,
• medical tourism - development of infrastructure and mechanisms to establish medical tourism clusters in the country,
• cruise ships – increased berths, • NationalPoliceAgency–TourismLiaisonOfficerProgrammetoover-
see tourist security and prevent exploitation of foreign tourists70.
The World Travel and Tourism Council (WTTC) study of tourism in the Republic of Korea, launched in February 2014, stresses the need for the country to continue tofocusonpolicieswhichsupportthetravelandtourismindustry’sstronggrowthpotential – assessed by the WTTC at 4.7% a year growth in its economic contri-butionoverthenextdecade,significantlyabovetheoverallannualgrowthinthecountry’seconomyof3.3%.
WTTC encourages the government of the Republic of Korea to further improve visa facilitation, in order to make it easier for travellers to visit the country for short periods of time71.
The Korea Tourism Organization (KTO) is responsible for international and do-mestic tourism marketing and promotion. It operates an international network of offices andenters into partnershipswith domestic and foreign operators (e.g.working with major tour operators to create a range of packages including special interest tours), as well as with organisations participating in events that can serve to promote tourism to the country. An example is its agreement with the Olympic gold-medal winning GB Taekwondo as the ‘Preferred Destination Partner’ for 2014. The year-long partnership will see KTO run a number of initiatives through-out the year, starting with a presence at the inaugural World Taekwondo Grand Prix.
TheKTO’smissionistopromotetheRepublicofKoreaasaworld-classtraveldestination, and spread awareness of Korean culture through the strengthening and development of the tourism industry. It is dedicated to spreading the unique heritage of Korea worldwide.
70 OECD Tourism Trends and Policies 2014. March 2014. OECD http://www.keepeek.com/Digital-Asset- Management/oecd/industry-and-services/oecd-tourism-trends-and-policies-2014/korea_tour-2014-26-en#page4
71 RepublicofKorea’sTravel&Tourismsectorsettooutperformeconomyovernextten years, February 2014. http://www.wttc.org/news-media/news-archive/2014/south-koreas-travel-tourism-sector-set-outperform- economy-over-n/
Target to generate 60,000 new jobs by 2017
WTTC calls for policies to support growth of tourist industry
KTO dedicated to spreading the unique heritage of Korea worldwide
43
Marketing Strategies for Tourism Destinations. Target market: CHINA
Of the total US$2.54 billion (EUR1.95 billion) allocated from the general fund in 2012 to support the development and assistance of tourism resources, cooper-ationininternationaltourism,officialdevelopmentassistanceintourismandtheestablishment of tourism and leisure cities, US$644 million (EUR495 million) was for tourism promotion and development covering:
• medical tourism and MICE industries,• tourist information centres and reporting centre management,• overseas promotion for Korean tourism,• tourism market research,• overseas marketing.
Its marketing directions are to focus both on individual and group tourism, to develop tourism products for the Chinese markets geared to the higher quality required by the new Chinese Government tourism law, maximising opportunities in the Russian market arising from the no visa arrangement and mutual visit year, supporttheMICEsector(maintainingKorea’spositionasthe5th leading desti-nation for international conferences), develop high value products such as for medical tourism, and enhance its use of online marketing72.
Recent initiatives by KTO have focused on the development of tourism technol-ogy as a means of further promoting and enhancing the reach of Korean pop culture (the Korean wave or hallyu) to boost its tourism.
In its 2014 Marketing Plan73, KTO outlines its market expectations as:• Japan–difficult tradingconditionsbecauseofKorea’s role indiplo-
matic discussions about the China: Japan territorial dispute, and the weakness of the Japanese yen,
• China – increasing demand for FIT due to improved Korean image and the fact that, as a short haul destinations, increasing numbers of Chinese can afford to travel to Korea,
• Asia and theMiddle East – positive influence of hallyu, increasing flights(MiddleEast)andintroductionofgroupvisasystem(Vietnam,Indonesia, Philippines),
• Long haul markets – increases stimulated by Korea-United States free trade agreement, and economic recovery, with growth in Russian visi-tors due to no-entry visa and the mutual visit year between Korea and Russia.
72 2014 Korea Marketing Plan (as provided directly by the KTO)73 2014 Korea Marketing Plan (as provided directly by the KTO)
Recent focus on the development of
tourism technology to promote Korean pop
culture
There is increasing demand for FIT from
China
44

Marketing Strategies for Tourism Destinations. Target market: CHINA
SpecificallyinrelationtotheChinesemarket,KTO’sinitiativesareto:• develop high quality products/experiences for VIP travellers,• promote shopping through international brand products,• publish a FIT handbook,• undertake joint promotions for FIT travel with renowned Chinese me-
dia and related organisations,• provide support for student groups visiting Korea,• create touring routes in the local regions with contents of interest for
Chinese visitors,• develop products related to local festivals and cultural tourism festivals, • undertake special promotions to boost off-season business e.g. spring
flowertour.
The KTO operates Korea Plazas - “one stop service centres - in Japan (2), China, HongKong,MalaysiaandSingapore.IthasofficesintheUnitedStates(2),theUnited Kingdom, Canada, Dubai, Australia and Turkey.
KTO to focus on developing high quality products/experiences
45

Marketing Strategies for Tourism Destinations. Target market: CHINA
International tourist arrivals in Malaysia in 2013 amounted to 25.7 million and receipts were Malaysian Ringgit (MYR) 65.44 billion (EUR15.3 billion)74. Growth hasbeensteadyoverthepreviousfiveyearswitha3%ayearriseinarrivalsanda growth in receipts in excess of 5% a year in Malaysian Ringgit terms, though lower in dollar terms as a result of the 5% depreciation of the Malaysian currency against the dollar between the end of 2008 and 2013.
Malaysia ranks as the 10th largest international tourist receiving country in terms of arrivals but slightly lower in respect of receipts.
Inbound tourist expenditure in Malaysia represented 8% of exports of merchan-dise and services in 201275, with tourism as the third largest earner of foreign exchange. The 2013 World Travel and Tourism Council report noted that tourism employs 1.7 million people, or 14% of all jobs, when taking into account positions indirectly supported by the industry75.
Tourism is administered through the Ministry of Tourism and Culture (MOTC), founded in 1987.
The policy for tourism development comprises:Vision: To promote Malaysia as a tourist destination with world class culture and build pride based on arts, culture and heritage,Mission: To drive tourism and culture as well as strengthen, preserve and con-servethenation’sart,cultureandheritage,Policy: To drive the tourism and culture of competitive and sustainable socio-eco-nomic development in the country.
Objectives:• empower arts, culture and heritage-based national cultural policy to-
wards strengthening national unity,• synergies and cooperation between tourism sector players and cultur-
al interests to make Malaysia a selected destination,• empowertourismandcultureinordertoimprovethecountry’secon-
omy,• promote the uniqueness of the art, culture and heritage as a major
catalyst for the growth of the tourism sector and national culture, • provide human capital knowledge, skills, creativity and innovation
in tourism and culture76.
74 TourismMalaysiahttp://corporate.tourism.gov.my/research.asp?page=facts_figures75 Malaysian Tourism Satellite Account 2005-2012. Department of Statistics,
Malaysia.December2013.http://www.statistics.gov.my/portal/images/stories/files/LatestReleases/account/SR_TSA2005-2012BI.pdf
76 OfficialPortalMinistryofTourismandCultureMalaysia http://www.motour.gov.my/en/ministrys-profile/policy-of-the-ministry.html
The Malaysia Tourism Sector
Malaysia ranks as the 10th largest
international tourist receiving country in
terms of arrivals
Tourism accounts for 14% of all jobs in
Malaysia
Vision is to promote Malaysia as a tourist
destination with world class culture
46

Marketing Strategies for Tourism Destinations. Target market: CHINA
In its country paper at the 2013 UNWTO Conference on Sustainable Tourism De-velopment77 Malaysia outlined its aspiration of becoming a high income country by 2020 through its Economic Transformation Programme. Tourism is one of the national key economic areas by which the country aims to achieve this econom-ic transformation. In this regard, the Malaysia Tourism Transformation Pro-gramme (MTTP) was formulated to achieve the targets of attracting 36 million international tourists and generating MYR168 billion (EUR39 billion) in terms of tourist receipts i.e. a threefold expansion of foreign exchange earnings, thus con-tributing MYR3 billion (EUR700 million) revenue per week in 2020. This strategic ambition will be achieved through, inter alia, the 12 Entry Point Projects proposed under the Tourism National Key Economic Area based on the themes of:
• affordable luxury,• family fun,• nature adventure,• business tourism, • international events, spa and sports.
Aspartofthecountry’seffortstopromoteadynamicandvibranttourismindustry,creative tourism products are being developed, including:
• shopping,• homestay,• parks and gardens,• contemporary art tourism, • shoe festival.
The former Tourist Development Corporation of Malaysia was incorporated within the MOTC and became the Malaysia Tourism Promotion Board (MTPB) through the Malaysia Tourism Promotion Board Act 1992. Popularly known as Tourism Malaysia, its full focus is on promoting Malaysia domestically and internationally.
Tactical advertising campaigns are conducted in collaboration with industry part-ners (i.e. travel agencies, local and international airlines, hotels and resorts) who usually bear the advertising costs or provide added value to the products adver-tised through special packages and discounts. 129 such campaigns were carried out in 2012 in the domestic and overseas markets78.
Malaysia is pursuing a strategy of collaborative/joint marketing targeted at long haul markets. It sees joint promotion as a cost-effective way to market multi-des-tination tourism packages, acknowledging that tourists do not wish to be con-strained in their choices by administrative boundaries. A “multi country – multi destination” joint promotion was carried out through the UNESCO 1-2-3 Pack-age initiative. This package provides an experience of visiting three heritage sites located in two countries, namely Malaysia and Indonesia. With the price of one package, a tourist gets to experience different cultural-mixes from three UNES-CO World Heritage sites, namely Borobudur in Indonesia, and Malacca and Pen-ang in Malaysia. It also can help to upgrade the livelihood of the local economies through sustainable tourism for both nations.
77 UNWTO 25th CAP-CSA and UNWTO Conference on Sustainable Tourism Development, April 2013
78 Tourism Malaysia Annual Report 2012 http://corporate.tourism.gov.my/annual_report/2012/index.html
The Malaysia Tourism Sector
Malaysia aspiring to achieve economic transformation through tourism
Creative tourism products are being developed
Strategy involved collaborative marketing targeted at long haul markets
47
Marketing Strategies for Tourism Destinations. Target market: CHINA
TourismMalaysia’smissionistomarketMalaysiaasadestinationofexcellenceand to make the tourism industry a major contributor to the socio-economic de-velopment of the nation.
Its objective is to promote Malaysia as an outstanding tourist destination, aiming to:showcaseMalaysia’suniquewonders,attractionsandcultures;developdo-mestictourismandenhanceMalaysia’sshareofthemarketformeetings,incen-tives, conventions and exhibitions (MICE).
Its ultimate goal is to increase the number of foreign tourists to Malaysia, extend theaveragelengthoftheirstayandsoincreaseMalaysia’stourismrevenue.
Tourism Malaysia aims to encourage tourism and its related industries in Malay-sia. It is hoped that this would help promote new investments in the country, as well as provide increased employment opportunities. The growth of tourism would also contributepositivelytothecountry’seconomicdevelopmentandqualityoflife79.
Tourism Malaysia conducts a wide ranging set of marketing and promotional ac-tivities across all regions of the world. All forms of advertising are used. It uses 17 prime satellite TV and online channels, targeting an audience of 2.8 billion and over 150 million online viewers80.TourismMalaysia’sCommunicationsandPublicity Division undertakes an extensive programme of media and public rela-tions activities, including the Malaysia Mega Familiarisation Programme through which 1,084 foreign guests were hosted in 2012 i.e. 347 travel agents, 622 media representatives and 115 representatives of foreign airlines81.
With around 75% of all arrivals coming from neighbouring states such as Singa-pore (alone accounting for over one-third of arrivals), Indonesia, Thailand, Brunei and the Philippines, many of whom are on short trips and spend relatively little, Malaysia is seeking to develop high-spending niche markets. Examples include the MICE sector, medical, spa and wellness tourism, as well as shopping and duty free sales.
In addition to medium and high income groups, its marketing campaigns target families, honeymooners, retired and senior citizens, special interest tourists and group tourists.
AtthebeginningofJanuary2013,TourismMalaysiahad44officesglobally,ofwhich38werefull-fledgedagencieswithstafffromtheheadquartersinMalaysia.At that time it announced a cost-cutting plan to reduce the numbers as well as turningsomeofthefull-fledgedofficesintomarketingagencies.TheTourismMa-laysiawebsitecurrentlylists35overseasofficesand8marketingrepresentativescovering a total of 33 countries.
The emphasis of marketing activities is being switched from traditional advertis-ing to online marketing, including with online agents using banner advertising. Thenetworkofoverseasofficesismaintainedfordealingswithagents,operatorsandwiththetravellingpublicinkeymarkets.Theseofficesruntacticalmarket-ing campaigns on a cooperative basis with agents, operators and airlines on a matching fund basis.
79 Tourism Malaysia http://www.tourism.gov.my/en/uk80 Tourism Malaysia Annual Report 2012
http://corporate.tourism.gov.my/annual_report/2012/index.html81 Ibid
Mission is to market Malaysia
as a destination of excellence
Malaysia is seeking to develop high-spending niche
markets
The emphasis is being switched from traditional
advertising to online marketing
48

Marketing Strategies for Tourism Destinations. Target market: CHINA
New Zealand recorded 2.72 million international visitor arrivals in 2013, repre-senting a 6% rise over 2012. China was the second largest source market (after Australia) with 231,000 arrivals, a rise of 18% over the preceding year. Between 2009 and 2013, international tourist arrivals grew by 2.5% a year.
Excluding international airfares international visitor spending for 2013 amounted to NZD6.67 billion (EUR4 billion), up 5% and with spending by Chinese tourists up by 7% to NZD732 million (EUR448 million)82.
Tourism directly contributes NZD7.3 billion (EUR4.5 billion), or 3.7%, to New Zealand’stotalGDP(yearendingMarch2013).AfurtherNZD9.8billion(EUR6billion), or 5.0%, is indirectly contributed. International tourist expenditure ac-counted for NZD9.8 billion (EUR6 billion), including international airfares paid to NewZealandcarriers,or16.1%ofNewZealand’stotalexportearnings.Tourismdirectly supports 110,800 full-time equivalent jobs (5.7% of the total workforce in New Zealand)83.
In 2012 four government ministries were merged to form the Ministry of Business, Innovation and Employment under the aegis of the Ministry of Tourism. This new ministry,positionedattheheartoftheGovernment’seconomicplanstodrivethebusiness growth agenda through integrated policies to build a more competitive and internationally-focused economy. The restructuring facilitates and encourag-es stronger cooperation between tourism and immigration. The Prime Minister also serves as the Minister of Tourism.
The Tourism Policy unit provides advice on how to create the right environment for increased productivity and growth, and the maximisation of the tourism sec-tor’scontributiontothecountry’seconomy.AspartoftheInternationallyFocusedGrowth Package, a new Tourism Growth Partnership has been created to drive some of the strategic changes required to overcome constraints to growth and lift the value of international tourism.
82 Key Tourism Statistics. Ministry of Business, Innovation and Employment January 2014 http://www.med.govt.nz/sectors-industries/tourism/pdf-docs-library/key-tourism-statistics/key-tourism-statistics.pdf
83 Ibid
The New Zealand Tourism Sector
China was New Zealand’ssecondlargest source market (after Australia)
Tourism contributes 3.7%, to New Zealand’sGDP
New Tourism Growth Partnership has been created to drive strategic changes
49

Marketing Strategies for Tourism Destinations. Target market: CHINA
The fund will co-invest in demand-led, commercially driven projects that meet one or both objectives of:
• boosting innovation in the tourism value chain to increase inter-national visitor spending,
• lifting tourism sector productivity.A major events development fund has been set up to enable the Government to investincooperationwiththeeventssectortosupportNewZealand’sdevelop-mentasadestinationformajoreventsofglobalsignificance.InMay2013,theGovernment signed an agreement with SkyCity to develop a NZD402 million (EUR246 million) international-standard convention centre in Auckland for 3,500 delegates scheduled for opening in 201784.
TheNewZealandTourismAssociation’sStrategy 2025 (which Tourism New Zea-land endorses) has the following priorities:
• to “prioritise insight”, to enable the sector to track its own performance, whichinturnwouldsupport theindustry’sdecision-makingtheneedtoincreasethecountry’sairconnectivity.Ninety-ninepercentofNewZealand’svisitorsarrivebyair,andTourism2025stressedtheneedfor“profitableinternationalanddomesticconnectivity”,
• the industry to target “high-value opportunities”, including source markets like China and sectors like international student family visits, which it said “remain a rich, largely untapped, source of value”,
• the need to provide an “outstanding visitor experience”, which in turn would drive repeat visits and word-of-mouth recommendations,
• theindustryto“focusonproductivityforprofit”–reducingseasonalityissues and encouraging wider regional dispersal of visitors. In line with this,it identifiedtheneedtotargetnewmarkets,suchascruiseandMICE, which would improve productivity.
The New Zealand Tourism Board, trading as Tourism New Zealand, was estab-lished to market New Zealand as an international visitor destination for the long termbenefitofNewZealand.TourismNewZealandaimstoimprovetourism’scontribution to economic growth in New Zealand by growing the value of inter-national visitors to New Zealand. It is a Crown Agent with the statutory functions under the New Zealand Tourism Board Act 1991 to:
• develop, implement and promote strategies for tourism, • advise the Government and the New Zealand tourism industry on
matters relating to the development, implementation and promotion of those strategies.
84 OECD Tourism Trends and Policies 2014. March 2014. OECD http://www.keepeek.com/Digital-Asset-Management/oecd/industry-and-services/oecd-tourism-trends-and-policies-2014/new-zealand_tour-2014-30-en#page5
New Zealand Strategy 2025 sets
out key priorities
50

Marketing Strategies for Tourism Destinations. Target market: CHINA
PartnershipsareakeypartofTourismNewZealand’smarketstrategy.Thoughbudget restrictions required these to be reduced earlier in the decade, travel part-nerships have secured some NZD20-25 million (EUR12.2-15.3 million) per year in co-marketing funds (cash and non-cash contributions) to promote New Zea-land85. In the 2014 to 2016 marketing plan, partnerships will be given increased emphasis. Commercial partnerships with the aviation industry, travel sellers and Regional Tourism Organisations will be created and further developed to extend marketing reach and strengthen conversion oriented activity. On-going activity will be delivered with aviation partners to maintain/grow air capacity supply. Em-phasis will be placed on motivating travel sellers to advocate for New Zealand and improve value86.
TourismNewZealand,asNewZealand’snational tourismorganisation, is theonly entity with the mandate and resources to promote New Zealand in inter-national visitor markets. Its work is carried out primarily through delivery of the ‘100%PureNewZealand’ campaign throughpaid,earnedandownedmedia.The campaign was conceived in 1999 and has evolved over the years to commu-nicate the combination of unique experiences available to people who visit New Zealand, the character of the people of New Zealand, and the spectacular New Zealand landscapes87.
Tourism New Zealand is charged with positioning the country as a high value des-tination to drive growth from:
• emerging markets e.g. India, Indonesia, Latin America,• business and incentives segment,• high spending traveller segments, • NewZealand’scurrentmainsourcemarkets.
Of the total 2013/14 budget of NZD129 million (EUR79 million), NZD113 mil-lion (EUR69 million) was allocated for destination promotion with an additional NZD158 million (EUR97 million), spread over four years, given for tourism as partoftheGovernment’sInternationallyFocusedGrowthPackage.TourismNewZealand’sbudgetwill increaseNZD29.5million(EUR18million), fromNZD83.8milliontoNZD113.4million(i.e.EUR51.3to69.4million),forthefinancialyearsFY14 and FY15, increasing to NZD115.8million (EUR70.8 million) in FY16 and FY17,enablingsignificantexpansiononTourismNewZealand’scurrentactivi-ty. This additional funding allows Tourism New Zealand to remain and in some casesincreaseitsactivityinNewZealand’scoremarkets,whilealsobeingableto focus on, and resource opportunities of, high value in emerging markets and high-value sectors88.
85 Tourism New Zealand Three Year Marketing Strategy FY14 – FY16. http://www.tourismnewzealand.com/media/1035612/tnz_three_year_strategy_fy14-fy16.pdf
86 Ibid87 Tourism New Zealand Statement of Intent 2013 – 2016. http://www.tourismnewzealand.com/media/1037749/tnz_statement_of_intent_- _amended_final_2_july_2013.pdf88 Tourism New Zealand Three Year Marketing Strategy FY14 – FY16. http://www.
tourismnewzealand.com/media/1035612/tnz_three_year_strategy_fy14-fy16.pdf
Partnerships are a key part of Tourism NewZealand’smarket strategy
‘100% Pure New Zealand’campaignwas conceived in 1999
Tourism New Zealand’sbudgetwillincrease to EUR70 million in 2016
51

Marketing Strategies for Tourism Destinations. Target market: CHINA
TourismNewZealand’s ‘foundation’ includes its successful and internationallyrecognisedmulti-channel‘100%PureNewZealand’campaign,itsdigitalmarket-ing programme which is driving over 12.8 million visitors a year to a re-vitalised newzealand.com and 1.8 million industry referrals from the site, and a well-devel-oped event leveraging programme which continues to capitalise on major sport-ing and cultural events, and strong travel partnerships89.
Priority 1 core markets: Australia, China, United States Priority 2 core markets: United Kingdom, Germany, JapanPriority 3 markets: Peninsula South East Asia, France, Rest of Europe, Republic of Korea, Canada Priority emerging markets: India, Indonesia, Latin America
TourismNewZealandhasofficesinAucklandandWellingtonaswellas11in-ternationalregionaloffices(inAustralia,theUnitedKingdom,theUnitedStates,Japan, China, Korea, India, Singapore and Thailand).
89 Tourism New Zealand Three Year Marketing Strategy FY14 – FY16. http://www.tourismnewzealand.com/media/1035612/tnz_three_year_strategy_fy14-fy16.pdf
Digital marketing campaign driving
12.8 million visitors a year to a re-vitalised
newzealand.com
52

Marketing Strategies for Tourism Destinations. Target market: CHINA
International tourist arrivals in the Russian Federation totalled 25.7 million in 2012, a rise of over 13% on 2011, with an average annual growth of close to 10%since2009,apattern thatpreliminaryfigures indicatewasmaintained in2013. The Russian Federation received the 9th largestinflowofforeigntouristsin 201290.
International tourism receipts reached US$11.2 billion (EUR8.6 billion) in 2012.By 2023, international tourist arrivals are forecast to total 52.5 million, generating expenditure of RUB1,002.3 billion (EUR21.5 billion), an average annual increase of 4.9%. Domestic travel is, however, the key segment in this vast country, both historically and into the future. Domestic tourism spending generated 76.0% of direct Travel & Tourism GDP in 2012 compared with 24.0% from international tourism receipts91.
Much inbound tourism is from the 20 countries that border Russia. Although out-bound tourism remained much larger in terms of number of trips, inbound tourism posted stronger growth in 2011 and 2012. This was driven by several factors, including the Domestic and Inbound Tourism Development federal programme, growing online tourism and upcoming sports events.
The direct contribution of tourism to GDP in the Russian Federation in 2012 was 2.3% while the total contribution to GDP was estimated at 6.3%. Tourism employ-ment in Russia is put at 1.8 million92.
Responsibility for the governance of tourism moved in 2012 from the Ministry forSports,TourismandYouthPolicytotheMinistryofCulturewhichdefinesthegeneral laws, regulations and policy lines for the industry. The Ministry incorpo-rates the Federal Agency for Tourism, set up in 2004, which is responsible for operational issues.
Since neither the Ministry nor the Federal Agency for Tourism has a territorial structure, local and municipal administrations are responsible for tourism issues within their territories. In most of the (over 80) regional administrations in the Russian Federation, there are ministries, agencies, committees and departments that have responsibilities for tourism issues. Federal governing bodies – the Min-istry and the Agency – co-ordinate efforts and co-operate with regional tourism authorities in the planning and administration of the industry.
90 UNWTO Tourism Highlights 2013 Edition. 91 WTTC92 OECD Tourism Trends and Policies 2014. March 2014. OECD.
http://www.keepeek.com/Digital-Asset-Management/oecd/industry-and-services/ oecd-tourism-trends-and-policies-2014/russian-federation_tour-2014-54-en
The RussianTourism Sector
Russian Federation recorded annual growth of 10% in international arrivals since 2009
53

Marketing Strategies for Tourism Destinations. Target market: CHINA
In recent years, the Russian government has taken a series of substantial mea-sures to speed up the development of tourism. In 1997, it adopted the Tourism Law of the Russian Federation, setting out the national policy for the development of tourism and the methods to make reasonable use of resources. In June 2007, the Basic Law on Tourism Business of the Russian Federation (Amendment) wasofficiallyputintoeffect.TheFederalTargetProgrammeforDevelopmentofDomestic and Inbound Tourism in the Russian Federation (2011-2018), which is currently in effect, set the target at “receiving 40 million foreign tourists and 50 million domestic (overnight) tourists by 2016”.
Though expansion of marketing through a special programme is being undertak-en, there is recognition that investment in infrastructure to create tourism hubs is alsoneeded,andthatvisaregulationshaveasignificantimpact.
The2011-18developmentprogramme’sprimaryfocusisonbuildingamoderntourism infrastructure with expansion of marketing activities a secondary priority. Infrastructure projects are being undertaken by regional and local administra-tions with solid tourism potential on a government-approved list assessed and evaluated by the government and public bodies for approval by the Coordination Commission. The programme involved 18 regions in 201293.
The draft State Programme “Development of Culture and Tourism” for the period 2013-2020hasitsmainpurposetheimplementationoftheState’sstrategicroleof culture as a spiritual and moral foundation of the development of the individual and the State and the unity of the Russian society.
Achieving this objective will be through the three interrelated and complementary tasks,reflectingtheestablishedpowersofpublicauthoritiesinthesphereofcul-ture and tourism: 1. Preservation of cultural and historical heritage of the people, ensuring cit-
izens’accesstoculturalvaluesandparticipationinculturallife,theimple-mentation of creative and innovative potential of the nation,
2. Improvingthequalityandaccessibilityofservicesinthefieldofdomesticand international tourism, tourism development as an effective educational tool for familiarising citizens with national cultural and natural heritage,
3. The creation of favourable conditions for sustainable development of cul-ture and tourism.
The Federal Agency for Tourism is responsible for marketing and promotion. It maintains a register of federal tour operators and works closely with them. Most practical alliances are with regions but increasing attention is being paid to es-tablishing partnerships. The organisation is relatively new whereas most Russian tour operators have been in business since the beginning of the 1990s and have officesacrossseveralregions.TheycooperatewiththeAgencywhentheyseespecificadvantage indoingso.Majorplayers include Intourist, InnaTour,TezTour, Natalie Tours and Nava International. The majority of travel agents and tour operators are based in Moscow and St Petersburg.
93 OECD Tourism Trends and Policies 2014. March 2014. OECD. http://www.keepeek.com/Digital-Asset-Management/oecd/industry-and-services/ oecd-tourism-trends-and-policies-2014/russian-federation_tour-2014-54-en#page4
The Russian government has taken measures
to speed up development of
tourism
Sustainable development of
culture and tourism is a strategic priority
54

Marketing Strategies for Tourism Destinations. Target market: CHINA
The principal aims of the Federal Agency are:• providing the state control of the activities in the tourism sphere,• legalregulationinthisfield,• promoting the tourist product on domestic and international markets,• establishing favourable conditions for the development of the tourist
infrastructure and for increasing the quality of tourist services,• international cooperation in the tourism sphere.
The Federal Agency for Tourism is monitoring visa facilitation programmes in cooperation with the Foreign Ministry. Draft legislation is under review for 72 hour visa-free visits.
The budget for the Federal Agency for Tourism in 2012 was RUB2,935 million (EUR72 million) of which RUB2,475 million (EUR61 million) was allocated for im-plementation of the 2012 schedule of the Federal Tourism Development Program 2011-2018. RUB3,708 million (EUR91 million) is allocated to marketing over the seven year programme94.
The principal Federal Agency for Tourism marketing and promotion activity is through participation at all major international trade and consumer tourism fairs, and facilitating business and trade missions.
The Agency focuses its marketing activity around:• developing a centralised information resource on tourist opportunities
in the Russian Federation on the Internet,• carrying out the awareness campaign and promoting social advertising
on tourism in Russia on TV, in electronic, print and out-of-home media,• holding press-tours, providing support for information centres and
rooms,• making competitive digital content,• organising and holding international, all-Russia, interregional tourist
forums, exhibitions and other events,• carrying out works and rendering services for introducing innovative
technologies and promoting the tourist project of the Russian Federa-tion on the world and domestic tourist markets.
Much activity is concentrated within Russia itself, but a series of roadshows and trade promotions are organised in target markets. For example, in Europe, the Agency undertakes roadshows to Berlin, Paris and London with representatives from tourism authorities of major destinations, hotels and tour operators in Rus-sia, travel trade, investors, media and partners.
These missions:• promote trade, investment and tourism opportunities of Russia,• build on international business partnerships,• benchmark best European practices.
94 Peculiarities of Marketing Promotion of the Russian Federation on Tourist Service Market: Problems and Solutions. Volkov, S. (2012). State University of Vladivostok.
Draft legislation is under review for 72 hour visa-free visits
Marketing activities are concentrated within Russia itself and European trade shows
55

Marketing Strategies for Tourism Destinations. Target market: CHINA
The Agency brings together the leading players in the Russian tourism industry based around the following themes for domestic and inbound tourism develop-ment within the following sections:
• “Promotion in Tourism” — PR in Russian Tourist products,• “Hunting for a Tourist” — how to make Russian tour-product saleable
and competitive on the world market,• “ConnectionsDecideEverything”—whatisrequiredfortheefficient
dialogue of state power and business on the event and business tour-ism development,
• Projects on Complex Territories Development— how to attract the in-vestor to the tourist infrastructure.
Familiarisation visits and industry forums are organised which bring together up to 500 professionals of the tourist industry from Germany, India, Austria, Finland, the Baltic States and a number of Russian Regions.
Emphasis has been placed on the Chinese market through the 2012 Tourism Year of Russia in China, and the reciprocal Tourism Year of China in Russia in 2013.According to the Federal Agency95,Russia’smainEuropeantargetmarketsare:
• Germany,• France,• United Kingdom,• Italy.
Elsewhere the most promising markets for Russia are China, India, Saudi Arabia, the Gulf States, the Republic of Korea, Turkey and Iran. However, it is recognised that problems with infrastructure hold back the development of these markets
Russia is positioned as a destination with rich cultural and natural heritage, as well as business and leisure destination to MICE (Meetings, Incentives, Confer-ences and Exhibitions), vastness and variety and as a welcoming destination for visitors and investors.
ThereareRussianNationalTouristOfficesintheUnitedKingdom,UnitedStatesand Greece. Russian private sector tourism companies also act as promoters of tourism to Russia.
95 http://russiaturforum.com/eng
Marketing emphasis has been placed on
the China market
56

Marketing Strategies for Tourism Destinations. Target market: CHINA
Thailand received a total of 26.7 million international visitor arrivals in 2013, ex-ceedingtheyear’soriginaltargetof26.1million,andrepresentinga19.6%in-crease over the 22.4 million attracted in 2012. China was the leading source market with 4.7 million arrivals, (a 69% rise over 2012). Thailand is now the 11th largest tourist receiving country. Between 2008 and 2013, the average rate of growth in arrivals was almost 14% a year, largely fuelled by the near sixfold in-crease over the period of Chinese visitors.
Receipts from international tourism rose by 23% in local currency terms in 2013 to reach US$42 billion (just under EUR32 billion), the largest increase of any destination in the year.Since2010,Thailand’s tourism receipts havedoubledrepresenting an average annual rise of 28% (in US dollar terms).
According to the World Travel and Tourism Council (WTTC), in 2012, travel andtourismmadeadirectcontributiontothecountry’sGDPofTHB826billion(EUR20.3 billion), 7% of total GDP, a level that rises to THB1.9 trillion (EUR46.8 billion), 16.7% of GDP, when indirect impacts are included. Travel and tourism employment amounts to 2 million direct jobs (5% of total employment) and 4.8 million total jobs (12% of all employment). By 2023, average annual increases of between6.5%and7%areforecastfortravelandtourism’seconomiccontributionwith employment rising by between 4% a year (direct and indirect) and 5% a year (direct). By 2023, 18% of jobs in Thailand will be in, or related to, the travel and tourism industry i.e. 7.5 million96.
The Ministry of Tourism and Sports of the Kingdom of Thailand has the primary responsibility over tourism and sports. Though it is charged with the promotion ofthetourismindustry,thisroleisfulfilledbytheTourismAuthorityofThailand.
Thailand’sNationalTourismDevelopmentPlan,approvedbyCabinet in2011,has theobjectiveofmovingThailand’s tourismcompetitivenessupat least15places,whichwouldputitamongthetopfivedestinationsinAsia.Theplanalsointendsto increasetourism incomebyat least5%during thefive-yearperiod,2011-16.
96 UNWTO World Tourism Barometer, August 2014.
The ThailandTourism Sector
With 4.7 million arrivals, China was Thailand’smainmarket
Travel and Tourism contributes to 7% of Thailand’sGDP
National Tourism Development Plan aims to increase tourism income by at least 5% during 2011- 2016
57

Marketing Strategies for Tourism Destinations. Target market: CHINA
Inordertoachievethisaim,fivestrategieshavebeensetforimplementation:• to develop infrastructure and logistics, linking with domestic and inter-
national tourism,• the development and rehabilitation of tourism sites and improvement
ofvariousrulesandregulationstoenhancethecountry’spotentialforaccommodating more tourist arrivals,
• the development of the creative economy, which is the focus in the 11th National Economic and Social Development Plan, 2012-2016. New products and services will be launched, while incentives for tourism trade and investment will be offered and human resource development will be emphasised,
• thecreationofconfidence inThailand’sgood imageamongvisitors,so that the country will welcome a greater number of tourists who will spend more in Thailand,
• the participation of the public sector, civil society, and local administra-tive organisations in tourism management97.
Akeyfocusofthecountry’stourismdevelopmentpolicyissustainabledevelop-ment through the integrating organisation DASTA (Designated Area for Sustain-ableTourismAdministration).ItwassetupinaccordancewiththeGovernment’spolicy to develop tourism in order to increase and distribute income to local com-munitieswiththerolesdefinedforDASTAas:
• integration of the administration and development of the selected ar-eas,
• central planning organisation,• coordination with localities to promote and develop areas with tourism
potential,• mobilise personnel, budgets and tools, as required, • promote the use of modern management methods98.
The Tourism Authority of Thailand (TAT) is the agency responsible for the mar-keting and promotion of tourism to Thailand, as well as domestic tourism. Estab-lished in 1980, TAT:
• supplies information and data on tourist areas to the public,• promotes travel to, in and around Thailand,• conducts studies to set development plans for tourist destinations, • co-operates with and supports the production and development of per-
sonnelinthefieldoftourism.
97 Thailand’sNationalTourismDevelopmentPlan.http://www.thaiembassy.sg/press_media/news- highlights/thailand%E2%80%99s-national-tourism-development-plan
98 Sustainable Tourism Development in Thailand. UNWTO Conference on Sustainable Tourism Development, April 2013 http://dtxtq4w60xqpw.cloudfront.net/sites/all/files/pdf/thailand_0.pdf
Government’spolicy is to distribute
tourism income to local communities
Tourism Authority of Thailand (TAT) is the
agency responsible for the marketing and promotion of
tourism to Thailand
58

Marketing Strategies for Tourism Destinations. Target market: CHINA
Ina2011TAT-Pacific-AsiaTourismAssociation(PATA)conferencefivekeyareasoffocuswereidentifiedforfuturebrandingcampaigns.Theseare99:
• Thainess as conveyed through the spirit of welcome, the celebration of festivals, and cultural products such as Muay Thai boxing and Thai food,
• wellness encompassing spas, health, rejuvenation and meditation as the main themes,
• natural environment featuring the mountain, jungle and beach landscapes as physical experiences,
• listing on the PATA Thailand Chapter online member directory,• support from a highly respected global organisation that stands up for
the travel and tourism industry in both the good times and bad,• value for money when it comes to the range of quality experiences that
Thailand offers.
TAT launched a new marketing strategy for the country in 2013, focused on driv-ing the tourism sector up the value chain and boosting revenues as much as attracting greater volumes of visitors. There is a renewed emphasis on Thai cul-ture and selling the country as a quality destination. The core theme of the strat-egyhasbeendubbed“HigherRevenuethroughThainess”.TAT’sUniqueSellingProposition(USP)isthe‘CharmofThainess,’especiallythe‘ThaiExperience,’‘ThaiWayofLife,’and‘ThaiCulture.’
ThemarketingbudgetforTATforfiscalyear2014isTHB1.5billion(EUR35mil-lion) though marketing activities are under review as a consequence of political uncertainties in the country100.
99 Thailand Tourism Marketing – Mapping the future forum provides insights into keeping Thailand competitive as a tourist destination http://www.pata-thailand.org/mappiing_future_keep_thailand_competitive.html
100 TAT adjusts tourism promotion distribution plan. January 2014. http://www.thaivisa.com/forum/topic/700315-tat-adjusts-tourism-promotion-budget-distribution-plan/
Branding campaigns to focus on Thai hospitality, consumer products, wellness and nature
The marketing budget for TAT for fiscalyear2014isEUR35 million
59

Marketing Strategies for Tourism Destinations. Target market: CHINA
The key elements of its 2014 policy and marketing plan are as follows101:• promote the tourism industry to be an important instrument in tackling
thecountry’seconomicproblem,creating jobs forpeopleaswellasincreasing income for the country, making tourism play a vital role in the development of the quality of life in all regions of Thailand in line with government policy,
• design and undertake proactive marketing strategies to increase both new markets and niche markets. This is in order to attract more quality tourists to visit Thailand. At the same time, domestic travel for Thais is being strongly encouraged,
• develop a clear positioning for Thailand as a tourism destination,• promote cooperation in all levels, domestically and internationally, on
promotion for the development of tourism markets. This aims to get rid of all hindrances in the tourism industry and pave the way for Thailand to be the tourism hub of Southeast Asia,
• aim at organisational and management development, as well as devel-opmentofthehumanresources’ability,andtocreateacapabledrivingforce in marketing tourism to Thailand,
• accelerate the development of a tourism technological system for ac-commodating business activities information (E-Tourism) on the Inter-net, including the conduct of electronic commerce and applying infor-mation technology in marketing.
TAT is aiming to increase the proportion of visitors in the US$20,000-to-$60,000 (EUR15,000 to 45,000) income range from 30% to 40% in 2014. To this end, it is developing more luxury tourism products and working to bring in more middle-to-high income visitors from growing markets such as Turkey, Eastern Europe, Africa and the Gulf, as well as building on core markets in Western Europe.
The fastest-growing tourism markets for Thailand in 2014 will be China and Rus-sia, with substantial populations that are increasingly keen to travel abroad. Most visitors from these countries tend to be in the low-to-medium-income tourism segments, and in order to boost arrival numbers and earnings, Thailand needs to start attracting more well off tourists from top emerging markets102.
Sincethe inceptionof thefirst localofficeofTATinChiangMai in1968,therearenow35regionalofficesthroughoutThailand.TAThasalsoestablishedmanyoverseasofficesthefirstbeinginNewYork,whichwasopenedin1965.Duringthepast30years,TAThasestablished15moreofficesindifferentpartsoftheworld.
101 TAT Policy and Marketing Plan http://www.tourismthailand.org/about-tat/policy-marketing-plan
102 Thailand targets new source markets for tourism. http://www.imtj.com/news/?entryid82=431371
Aim is to establish Thailand as a tourism
hub of Southeast Asia
Luxury tourism products being
developed to target middle and high
income international visitors
60

Marketing Strategies for Tourism Destinations. Target market: CHINA
The United States is the second largest tourist receiving country in the world (af-ter France) but the leading country for international tourism receipts – 14.5% of the world total in 2013.
It recorded 69.8 million arrivals in 2013. The average annual growth rate in inter-national arrivals between 2009 and 2013 was 6%, though the 5% fall in the level of arrivals in 2009 over 2008 reduces the annual growth rate to 3.7% over the extended period of 2008 to 2013.
International tourists spending in the United States amounted to US$173 billion (EUR130 billion) in 2013, making it the leading country in terms of tourism re-ceipts. The average annual growth between 2008 and 2013 was almost 10%.103
Tourism contributes 2.8% of GDP in the United States and generates 8 million jobs (of which 5.7 million are direct tourism sector jobs). Travel and tourism sales amount to US$1.51 trillion (EUR1.12 trillion), with US$900 billion (EUR667 bil-lion) being direct sales104.
The United States is highly decentralised with respect to travel and tourism, with public authorities managing it at national, regional, state and local levels. It is not federally regulated as a distinct industry though parts of it – e.g. transport –are.Theofficialsourceofstatisticsfortourismandtheroleofworkingfortheenhancement of the competitive position of the country in travel and tourism rest withtheNationalTravelandTourismOfficewithintheInternationalTradeAdmin-istration of the United States Department of Commerce.
The process of policy deliberation at the Department of Commerce includes the United States Travel and Tourism Advisory Board (made up of appointed travel and tourism private sector representatives) and the Tourism Policy Council (an interagency committee whose function is to coordinate national policies and pro-grammes relating to travel and tourism, recreation and national heritage resourc-es that involve federal agencies).
103 UNWTO Tourism Barometer, October 2010 and August 2014 104 Fast Facts: US Travel and Tourism Industry 2013. International Trade
Administration,IndustryandAnalysis,NationalTravelandTourismOffice.April2014http://travel.trade.gov/outreachpages/download_data_table/Fast_Facts_2013.pdf
The United StatesTourism Sector
USA is the leading country for international tourism receipts
Tourism in the USA generates 8 million jobs
61

Marketing Strategies for Tourism Destinations. Target market: CHINA
In January 2012, President Obama issued an Executive Order calling for a Task Force on Travel and Competitiveness charged with developing a National Travel and Tourism Strategy to be implemented through the Tourism Policy Council. The goals set are for 100 million international visitors spending US$250 billion (EUR185 billion) a year by 2021.The five key areas identified for theUnitedStates to address were:
• destination promotion,• enabling and enhancing travel and tourism to the United States,• providing world class customer services and visitor experiences,• coordinating across government, • conducting research and measuring results.
TheestablishmentofBrandUSAaddressesthefirstoftheareasidentifiedinthePresident’sExecutiveorder-detailsofBrandUSAaregiveninChapter4;whileimprovements to visitor entry arrangements are meeting the second issue e.g. new visa adjudicator positions have been established in key markets like China with expanded visa processing facilities so that 90% of applicants are interviewed within three weeks of applying105.
Brand USA is the Corporation for Travel Promotion of the United States, a pub-lic-private marketing entity, created in 2010 which began operations in May 2011. It works in close partnership with the travel industry to maximise the economic andsocialbenefitsoftravelincommunitiesaroundthecountry.Itspurposeistopromote travel to the United States from all over the world, and its mission is to stimulate increased international visitation to the United States, thereby growing thecountry’sshareoftheglobaltravelmarket.Throughitscall-to-action,Discov-er America, Brand USA seeks to encourage and inspire travellers to explore the United States.
The mission of Brand USA is to encourage increased international visitation to theUnitedStatesandtogrowAmerica’sshareoftheglobaltravelmarket.Indo-ing so, the aim is to bring millions of new international visitors who spend billions of dollars to the United States, creating tens of thousands of new American jobs.
TheCorporationforTravelPromotion/BrandUSAisanon-profitcorporationthatgeneratesitsincomeonamatchingfundingprinciple.Upuntiltheendoffiscalyear 2014/15 (i.e. ending September 2015), $10 out of every $14 dollars charged for Electronic System for Travel Authorisation paid by international travellers coming to the United States from countries under the Visa Waiver Programme is made available to the Corporation – up to $100 million, provided match-ing funds are forthcoming from travel and tourism sources. For the ESTA income tobecontinuedbeyondfiscal2014/15,reauthorisationwillberequiredfromtheUnited States Congress106.
105 OECD Tourism Trends and Policies 2014. March 2014. OECD. http://www.keepeek.com/Digital-Asset- Management/oecd/industry-and-services/oecd-tourism-trends-and-policies-2014/united-states_tour-2014-41-en#page5
106 OECD Tourism Trends and Policies 2014. March 2014. http://www.keepeek.com/Digital-Asset-Management/oecd/industry-and-services/oecd-tourism-trends-and-policies-2014/united-states_tour-2014-41-en#page4
Task Force goal to attract 100 million
international visitors a year by 2021
The mission of Brand USA is to
encourage increased international
visitation to the United States
Brand USA income is generated on a matching funding
basis
62

Marketing Strategies for Tourism Destinations. Target market: CHINA
BrandUSA’sfinancialbudgetforthe2014fiscalyearisbasedonprojectedoper-ating revenue of US$125 million (EUR93 million), made up of three components:
1. Travel fund proceeds (ESTA) US$100 million (EUR74 million),2. Cash contributions from partners US$20 million (EUR15 million),3. Sponsorship revenue US$5 million (EUR3.7 million).
The deployment of these funds is shown in Figure 20. The bulk of the budget is usedforactivitiesundertakenwiththeorganisation’spartners,withothermajorshare being for consumer advertising.
Figure 20: United States Budget Summary, 2014 Fiscal Year
Component US$ million % of budgetPartnership Services 52.7 42Consumer Advertising 35.0 28Global Partnerships 19.3 16Operations 12.2 10Marketing Research 3.0 2Communications and Public Policy 2.7 2
Total 124.8 100
Source: Brand USA
Research from Oxford Economics commissioned by Brand USA found that its activity had already led to an additional 1.1 million visitors to the United States in 2013 generating additional spending of US$3.4 billion (EUR2.5 billion). This represents a return-on-investment ratio of 47:1, with US$47 (EUR35) returning to United States businesses for every dollar spent on the marketing budget of US$72 million (EUR53 million). The arrivals increase amounted to a 2.3% increase over thegrowththatwouldhaveoccurredwithoutBrandUSA’sactivities107.
Alarmedbyresearchfindingsthat foundwidespreadperceptionsof theUnitedStates as an “arrogant, unwelcoming and predictable nation”, the Brand USA theme became the catalyst for creating the necessary shift to that of “a beckoning land of boundless possibilities”.
The brand strategy adopted is:
“The United States of Awesome Possibilities Welcomes Everyone”
The strategies being adopted as set out in Brand USA’s Marketing Plan FY2013108 are as follows:
• Relevance:IncreaserelevanceofBrandUSAasthenation’sDMO,• Leverage/Alignment:Leverageandaligntheindustry’sinternational
marketing efforts,• Return on Investment: Invest in programmes and allocate resources
on markets and initiatives that will maximise results,
107 The Return on Investment of Brand USA Marketing. 2013 Fiscal Year Analysis. http://thebrandusa.com/~/media/Files/Key%20Dox/2014/ROI%20Results/Brand%20USA%20ROI%20FY2013%20Final.pdf
108 Brand USA FY2013 Marketing Plan. February 2013. http://www.thebrandusa.com/~/media/Files/Key%20Dox/2013/021513%20
Brand%20USA%20Marketing%20Plan_February%202013.pdf
BrandUSA’sfinancialbudget for 2014 is US$125 million (EUR93 million)
A return-on-investment ratio of 47:1 has been achieved
Brand USA theme addresses negative perceptions of country
63
Marketing Strategies for Tourism Destinations. Target market: CHINA
• Growth: Attract partners and stakeholder participation/support to gen-erate cash and in-kind contributions that will fund the work of the or-ganisationtofulfilitsmandate,
• Collaborate: Collaborate on the development of programs with gov-ernment and industry stakeholders,
• Co-op: Develop co-op opportunities that add, create, or amplify value to stakeholders,
• Content: Develop unique content that inspires engagement and pro-motes travel to the United States and which can be repurposed by destinations and travel brands,
• Digital: Enhance the content, functionality, and user experience on all digital platforms ,
• Excellence: Build and organise a results-driven team and a culture that promotes inclusion and diversity, operates with integrity, and rec-ognises and rewards performance,
• Awareness: Increase awareness of Brand USA as both a high-value brand and premier travel destination.
ThepartnershipapproachistheessenceofBrandUSA’scampaigns.ItsfocusisonlinkingwithUnitedStatesagenciesandfirmstoassistintheirpenetrationofoverseas markets, using the following programmes:
• Discover America Global Inspiration Guide: language specificguides featuring sponsored content,
• DiscoverAmerica.com: global website with a variety of programmes designedtodrivetrafficandreferrals,
• media planning and buying: Brand USA works with each partner to determine which programmes can be maximised to extend its reach,
• Brand USA In-country Multi-channel Programmes: customised for each country to coincide with Brand USA consumer marketing cam-paigns using the channels that are most effective in driving prospec-tive travellers to partners,
• customised in-country marketing initiatives: partners plans devel-opedthroughBrandUSA’sinternationalrepresentativeoffices,
• media and travel trade outreach: through the Brand USA Travel Trade Network, assistance is provided to partners to enable them to target and connect with international travel media,
• USA Discovery Program: online training tool to equip source market industry to sell travel to the United States,
• international tradeshows and missions: partners can participate on United States Pavilions at Trade shows and on sales mission (e.g. to Hong Kong and China in Fiscal 2014, and China scheduled for Octo-ber 2014),
• in-kind support: promotion and contributions: e.g. inclusion of the Brand USA logo on partner advertising, website etc; provision of ad space to Brand USA; contribute airfare, accommodations etc to sup-port Brand USA events and activities.
Brand USA is executing a dynamic marketing programme that includes both con-sumer and travel trade marketing efforts. The international consumer campaign is comprised of television, out-of-home, and print advertising, public relations, and social media/digital efforts. The business to business marketing effort includes trade shows and sales missions, tour operator and travel agent outreach, and educational campaigns about United States entry policies. As part of the busi-
The partnership approach is the
essence of Brand USA’scampaigns
Co-operative programmes to
increase penetration in overseas markets
Marketing programme that
includes both consumer and travel
trade marketing efforts
64
Marketing Strategies for Tourism Destinations. Target market: CHINA
ness to business effort, Brand USA is establishing one of the largest networks of internationalrepresentationfirmstosupportitseffortsinternationally.
Brand USA undertakes a fully integrated, multi-channel campaign—comprised of TV advertising, out of home, print, and social media—plus direct in-market marketing throughaglobalnetworkof representationfirmsestablished in keyinternationalmarkets.Country-specificFacebookandTwitterpagesshowcasetargeted promotions and the Discover America.com is an information portal for trip planning. The key message in the campaign is to “Discover this land, like never before.” The second component of this central message is to spread the USA’swelcometorepeatvisitorsaroundtheworld,invitingtravellerstovisitthecountryagain“asifforthefirsttime”.
BrandUSA’sformulainthedeploymentofitsresourcesfortheconsumercam-paign follows the principle of maximising results, based on the evaluation of six key factors:
• volume – numbers of visitors from each source market,• value - the total revenue value of tourism from that country,• growth – year-on-year increase both in arrivals and revenue,• costs – media costs in the source markets,• easeofentry–assessmentofease/difficultyofprocedures i.e.visa
system, waiting time, political climate, • systemsand facilities influencing travel decisions -BrandUSA rep-
resentation and website presence, role and use of social media, strength of trade/media support.
In2013,BrandUSA’scampaignwasactiveinnineofthemarketsthatdrivethehighest level of visitation to, and spend in, the United States:
• Australia,• Brazil,• Canada,• China,• Germany,• India,• Japan,• Mexico,• the United Kingdom.
In total, these markets generate 75% of all international inbound visits to, and spend in, the United States equivalent to 50 million visitors and US$80 billion (EUR59 billion) in spending. Every 1% increase in visitation from these markets results in 500,000 more international travellers and US$800 million (EUR590 mil-lion) extra revenue for the United States109.
In-market representation is considered to be vital, as it permits Brand USA to gain importantmarket-specific intelligenceandtobegintoestablishstrongrelation-ships with the travel trade. In addition, prior to the consumer campaign launch, social media and website presence in the native language of the market are established.
109 http://www.thebrandusa.com/
DiscoverAmerica.com information portal for trip planning
BrandUSA’scampaign active in nine markets
65
Marketing Strategies for Tourism Destinations. Target market: CHINA
3.9 ConclusionsThe seven shortlisted destinations competing with Europe for the Chinese tourist are pursuing marketing strategies that:
• stress the authenticity of their natural and cultural heritage in develop-ing brand images and positioning,
• pay equal attention to established source markets and newly emerging ones to achieve a balanced set of markets,
• seek a market: product “matching” approach that provides high quality experiences in line with the needs and expectations of different market segments based on detailed research and analysis of such markets and segments, with the Chinese market being the primary target for all destinations studied,
• focus on a number of common segments across competitors e.g. MICE, medical tourism, shopping, festivals and events,
• payspecialattentiontoattractinghighvalue/affluenttourists,• showasignificantandcontinuingswitchawayfromtraditionaladver-
tising and promotional methods to electronic digital marketing systems and activities.
In selecting the destinations competing with Europe to be subject to detailed study in Chapter 5, consideration was given to:
• the recent growth trends in tourism from China,• entry requirements for Chinese visitors,• price levels,• airline connectivity,• political, economic and socio-cultural inks,• destination tourism policy development,• current and planned future destination marketing strategy and priority
given to the Chinese market, • the extent to which the destinations compete for the same/similar mar-
ket segments in the Chinese market as Europe does.
On this basis, two destinations are selected for full analysis and assessment in Chapter 4, namely:
AUSTRALIATHE UNITED STATES OF AMERICA
Europe’scompetitorsare adopting a market:product
matching approach
Europe’scompetitorsare switching to electronic digital
marketing systems and activities
66

Marketing Strategies for Tourism Destinations. Target market: CHINA
TheChairman’sReporttoTourismAustralia’s2012-13AnnualReportstressedboththegrowingsignificanceofAsiantravelmarketsforAustraliabutalsotheneed to keep a balance between traditional and new high growth markets.
“Three years ago, it was remarked that tourism was an industry in transition, from west to east, from traditional long-haul markets to fast-growing near-neighbour markets. As last year has shown us, that transition is well advanced. Responding to this transition, Tourism Australia shifted resources to capitalise on the growth in China, Indonesia, India and Malaysia, and the already well-established markets of Singapore, Japan and the Republic of Korea. However, the continued impor-tanceofAustralia’straditionalmarkets—ouroldesttourismfriends—isundeni-able. Tourism Australia maintains a balanced portfolio approach, and continues to invest heavily in markets such as the United Kingdom, France, Italy, Germany, the United States and Canada.”110
Tomakesignificantprogresstowardsthegoalofdoublingovernighttourismex-penditures in Australia between 2009 and 2020 to reach AUD140 billion (EUR97 billion), Tourism Australia is targeting consumers in 17 markets in 2013-14, with over three-quarters of its campaign investment being given to nine priority mar-kets i.e. Category 1 (estimated to be worth at least AUD5 billion (EUR3.4 billion) a year by 2020 to the Australian economy, which includes Greater China), and Category 2 with the potential to generate more than AUD2.5 billion (EUR1.7 bil-lion) a year.
110Chairman’sReporttoTourismAustralia’s2012-13Annualhttp://www.tourism.australia.com/documents/corporate/TACA7893_AnnualReport_2012_13.pdf
4Marketing Strategy and Activities of Tourism Australia and Brand USA in China
AustraliaTourism Australia maintains a balanced approach to traditional and emerging markets
67

Marketing Strategies for Tourism Destinations. Target market: CHINA
One of the principal strategic thrusts is continued implementation of the Tourism Australia China 2020 Strategic Plan announced in June 2011 by the Minister for Tourism at the inaugural Australia-China Tourism Summit. The Plan aims to ensure Australian tourism remains competitive in the fast growing market for out-bound travel from China. Developed by Tourism Australia in collaboration with industry and government stakeholders, the Plan underpins all of Tourism Austra-lia’sworkinChinaandidentifiesfivestrategicpillarscrucialtobeingcompetitiveand winning market share in China:
• knowing the customer,• ensuring a dedicated geographic strategy,• delivering quality Australian tourism experiences,• maintaining a healthy aviation development environment, • having strong partnerships between government and industry.
Aftertwoyears,theChina2020StrategicPlanhasdeliveredsignificantresults.In2012–13,ChinaovertooktheUnitedKingdomtobecomeAustralia’ssecondlargest inbound market by visitor arrivals, with 685,100 Chinese visitors to Aus-tralia.ChinaremainedAustralia’smostvaluable inboundmarket,withChinesevisitors contributing AUD4.5 billion to the Australian economy. In calendar 2013, visitor arrivals from China reached 709,000, an increase of 14.5% relative to 2012. The Tourism 2020 Strategy document estimates that China has the poten-tial to grow to between AUD7.4 billion and AUD9 billion (EUR5.1 to 6.3 billion) in total expenditure by 2020.
Aside from its 2013/14 operating budget of AUD160.6 million (EUR112 million), a further boost to realising the opportunities presented by Asian markets is the Asia Marketing Fund, a 2012 Australian Government initiative, to invest in new aviation routes between Asia and Australia, with Australian State and Territory Organisations, and airports, matching the Government funding. It pro-videsAUD48.5millionoverfouryearsandallowsTourismAustraliatosignificantlyincrease itsmarketing footprint inAsia and build on the “There’s nothing likeAustralia” campaign.
In Greater China, Tourism Australia focuses its activities in China and Hong Kong,managing its activities from offices in Shanghai (regional offices), Bei-jing, Guangzhou, Chengdu and Hong Kong.
Partnerships and relationships with both traditional and non-traditional distribu-tors are used to ensure the target customer can easily access quality Australian tourism products. Airline partnerships help to convert consumer desire to travel to Australia into travel bookings by combining destination and tactical price point marketing. For 2013/14, Tourism Australia partnered with 19 airlines in 16 mar-kets to promote Australia collectively spending more than AUD32 million (EUR22 million)internationallyonThere’snothinglikeAustraliacampaigns.ThetwomainChinese carriers accounted for almost a quarter of the revenue generated by co-operative partnerships, as shown in the chart which details the top 6 cooperative partnerships by revenue contribution.
The China 2020 Strategic Plan has
deliveredsignificantresults
Asia Marketing Fund is investing in new aviation routes
between Asia and Australia
Tourism Australia partnered with 19
airlines in 16 markets
68

Marketing Strategies for Tourism Destinations. Target market: CHINA
Figure 21: Top Six Co-operative Partnerships by Revenue Contribution
International airlines boost marketing presenceduring 2012–13, tourism australia partnered with 19 airlines in 16 international markets to promote australia, collectively spending more than $32 million internationally on There’s nothing like Australia campaigns. these partnerships enabled tourism australia to double its marketing investment in key markets.
the organisation signed new memoranda of understanding (mou) with china eastern, etihad, air china and air new Zealand.
TOP sIx CO-OPeRATIVe PARTneRsHIPs bY ReVenue COnTRIbuTIOn
Worked with 19 airlines1. air asia X
2. air canada
3. air china
4. air New Zealand
5. cathay Pacific
6. china eastern
7. china Southern
8. Delta airlines
9. emirates
10. etihad
11. Garuda
12. Japan airlines
13. Malaysian airlines
14. Qantas
15. Scoot
16. Sichuan airlines
17. Silk air
18. Singapore airlines
19. Virgin australia
Airlines Memoranda of Understanding (*new in 2012–13)
> air china* > Qantas > china southern
> air new Zealand* > emirates > singapore airlines
> china eastern* > etihad* > virgin australia
36 achieving tourism 2020
Source:TourismAustralia’s2012-13AnnualReport
A cornerstone of the China 2020 Strategy is putting the target customer at the centre of all that Tourism Australia does. This involves understanding their needs and desires, and sharing these insights so that the Australian tourism industry can tapintoChina’sfastgrowingandincreasinglyaffluentmiddleandupperclasses.
Consumerresearchundertakenin13ofChina’slargestandfastestgrowingcit-ies,andpublished in2012,producedthefollowingfindings:1. Who they are:
• experienced travellers,• men and women aged 30-49 years,• couples,• liveinfirstandsecondtiercities,• affluent.
2. Attitudes towards Australia• highly aspirational destination,• good offering – laid back and easy going holiday with unique and
iconic attractions,• accessible – visa system comparable to/easier than competing desti-
nations of the United States and Europe BUT journey time, distance and cost a negative,
• awarenesshigherinfirsttiercitiesthaninsecondtiercities.
3. Requirements from a long haul holiday• experience difference,• mix of natural environment, culture, history and development together
with good products and services for accommodation, eating out, dif-ferent cuisine options and local shopping,
• safety,• value-for-money,• welcoming and family friendly destination,
Understanding customer needs and desires is a cornerstone of China 2020 strategy
69

Marketing Strategies for Tourism Destinations. Target market: CHINA
• ability to see iconic and famous attractions,• easy visa application process,• accommodation options to include well-known international chains
and mi-level 3 star hotels,• chinese speaking tour guides,• access to Chinese food,• directflights,• local shopping,• gambling and luxury shopping.
4. Influencesontraveldecisionmaking• highlyinfluencedbytraditionaltraveladvertising,• experienced travellers inspired by travel programmes, TV shows
and magazine articles,• travel agents are an important source,• word-of-mouthrecommendationshighlyinfluential.
5. Researching and Booking• travel agents are key,• almost half target customers use internet for planning and research-
ing,• travel distribution systems still predominate.
6. Travel arrangements• with family/friends,• firsttimersaspartofgroup,• trend towards greater independence and free time.
InsightsfromtheresearchhavebeenusedtoprioritiseTourismAustralia’smar-keting activities in China and to implement a phased geographic expansion plan in China. Over the period 2012-2014 (Phase 1 of the China 2020 Strategy), con-sumer campaigns are being rolled out in eight second tier cities. Trade and distri-bution development is the initial focus in these cities to ensure consumers have access to Australian travel products and services. Tourism Australia is seeking to target consumers in up to 30 Chinese cities between now and 2020.
TheresponsetoTourismAustralia’sThere’snothinglikeAustraliacampaignhasbeen strongest in China with more than 90% of those who have seen the cam-paignconfirmingthattheystartedresearchingatriptoAustralia111.
A subsequent study – published in June 2013112 - investigated how international consumersin11ofAustralia’smostimportantinboundmarkets–includingChina- view Australia and the factors most likely to motivate them to visit the country.
111 China 2020 – Building the Foundations – Knowing the Customer. Tourism Australia, 2012.http://www.tourism.australia.com/documents/Markets/China2020-Building_the_Foundations.pdf
112 Understanding the Chinese Consumer. Tourism Australia. 2013. http://www.tourism.australia.com/documents/Markets/Factsheet_CDP_China_Jul13.pdf
Tourism Australia is seeking to target consumers in up to
30 Chinese cities
70
Marketing Strategies for Tourism Destinations. Target market: CHINA
ForChineserespondentsthetopfivemostimportantfactorsthatemergedintheselection of a holiday destination were:
• world class beauty and natural environment – 57% of respondents citing,
• a safe and secure destination – 57%,• good food, wine, local cuisine and produce – 42%,• friendly and open citizens, local hospitality – 41%,• native or cultural heritage or activities – 31%.
In terms of planning and booking holiday travel, the results of the earlier study are largelyconfirmedwith thegrowing importanceofonlinesystemsapparente.g. 74% choosing a general internet search when planning a holiday to Austra-lia, 66% a travel advice website, 55% a government tourism website and 53% a travelbookingwebsite.Thoughofflinetravelagentsarestillthepreferredmeansfor booking an Australian holiday – 63% citing – the use of online travel agents accounted for 30% of responses.
In comparison to other destinations, Australia scores well among Chinese con-sumers for
• world class beauty and natural environment, and coastal scenery – in both cases, 2nd to Hawaii,
• safety and security – 3rd behind Singapore and Germany,• friendly and open citizens – 3rd behind Hawaii and Brazil,• food and wine, clean cities and infrastructure, and native and cultural
activities – in each case in 4th place.
Australia fared poorly – 8th – in respect of history and heritage.
Main activities and achievements of Tourism Australia in the China market in 2012-13 included:
• a new Chinese consumer website, australia.cn, was launched provid-ing a tailored user experience and links to translated product informa-tion from the Australian Tourism Data Warehouse as well as key Chi-nese social media platforms. Tourism Australia consulted with target Chineseconsumersandwebdesignexpertsinthesite’sdevelopmentand implementation,
• Tourism Australia’s There’s nothing like Australia brand campaignreached 89% of the target audience in target cities and 97% took ac-tion in researching or planning an Australian holiday,
• partnership marketing campaigns were undertaken with States and Territory Tourism Organisations as well as all major airlines in China, collectively reaching more than 22 million Chinese consumers,
• TourismAustralia’sPublicRelationsandInternationalMediaHostingProgram generated more than 1,400 media stories in China, achieving an equivalent advertising value of AUD35.5 million (EUR26.5 million),
• Tourism Australia partnered with State and Territory Tourism Organisa-tions to deliver training to more than 4700 retail travel agents,
• marketing agreements were signed with China Southern Airlines, Chi-na Eastern Airlines, Air China, China UnionPay, and China Travel Ser-vice,
• leveraging the Asia Marketing Fund, Tourism Australia accelerated its geographic expansion strategy in China, commencing trade and consumer marketing activities in Chengdu, Chongqing and Qingdao.
74% of Chinese visitors use a general internet search when planning a holiday to Australia
Australia.cn was launched to provide a tailored user experience
71

Marketing Strategies for Tourism Destinations. Target market: CHINA
Business and trade development was the initial focus, the aim being to buildastrongfoundationofknowledgeableandqualifiedtravelagents,operators and airlines able to sell travel toAustralia.An officewasopened in Chengdu in October 2012 while activities included: face-to-face training, the roll-out of the Aussie Specialist Program, and a series of familiarisation programs for front-line agents and tourism decision makers.There’snothinglikeAustraliacampaignactivityincludedpart-neringwithfivePremierAussieSpecialistagenciesinthethreecitiesto promote Australian holiday experiences. A 10-week brand campaign that used television, digital, print and outdoor was undertaken during April and May 2013.
Otheractivities in theChinamarket includeshowcasingAustralia’s tourismat-tractions and facilities at the annual North Asia Showcase in Shanghai, and the holding inMay2013of thebiannualAustralianmeetingofTourismAustralia’sChina Industry Advisory Group (a body that meets every six months in China to discuss topics impacting Chinese tourism to Australia), with members touring popular holiday spots in South Australia in order to familiarise its members with theregion’snaturalfeaturesandattractions.
ThesignificantimpetusmadeinincreasingChinesetouristflowsandspendingin Australia can be attributed to a series of decisions and actions made by the Australian tourism authorities and implemented through Tourism Australia.
1. Awareness of China’s Potential and the Need to Understand the Chi-nese Traveller. Early recognition of the growth potential of the Chinese market followed up by a major and ongoing programme of research and analysis of the attitudinal, motivational and behavioural characteristics of Chineseconsumersinrespectofoutboundtravel,andAustralia’spositionwithin the mix of international destinations.
2. Partnership Approach. Creation of a wide spread of collaborative partner-ships: across all sub-sectors of travel and tourism in Australia, with govern-ment agencies, with international airlines and tour operators, and through the creation of specialist market groups comprised of members from the source markets e.g. China Industry Advisory Group.
3. Substantive and Sustained Marketing Campaigns. The detailed and extensive series of research studies into the Chinese market has enabled a focused marketing strategy to be developed, clear target markets to beidentifiedandmarketingcampaignstobedesigned.Mostimportantly,these campaigns have been implemented on a wide-ranging, continuing andprogressivewaythroughtheprovisionofsufficientfundsthroughtheGovernment of Australia.
4. Marketing and Promotional Activities Tailored to the Needs and Ex-pectations of the Chinese. The marketing and promotional activities un-dertaken in the Chinese market by Tourism Australia are geared to the spe-cificrequirementsandaspirationsofthetargetmarketsegments,makingfull use of Chinese language materials and digital marketing technology, including a dedicated website and social media.
Activities undertaken to showcase
Australia’stourismattractions
72

Marketing Strategies for Tourism Destinations. Target market: CHINA
The evolution of the Chinese outbound travel market is so rapid that research and analysis have to be continuous process to keep up with changes and devel-opments. Two important studies of China conducted over the past two years are:
1. 2012MarketProfile:China,OfficeofTravelandTourismIndustries113,2. MarketProfile:ChinainBrandUSA’sFiscal2014BusinessPlan114.
The2012study found that theproportionofChinesevisitorsmaking theirfirstinternational trip to the United States was falling – down from 55% in 2011 to 46% in 2012, illustrating the growing familiarity of the Chinese with overseas travel. In terms of activities in which they engaged, the top ten pursuits were dominated by shopping and sightseeing.
Figure 22: Most Popular Activities of Chinese Tourists in the USA, 2012
Activity Participation in the USA (%)
Shopping 87
Sightseeing 78
Experiencefinedining 47
National parks/monuments 36
Small towns/countryside 36
Amusement/theme parks 34
Art gallery/museum 33
Guided tours 27
Visit historical locations 23
Cultural/ethnic heritage sites 23
Source:2012MarketProfile:China,OfficeofTravelandTourismIndustries
113http://travel.trade.gov/outreachpages/download_data_table/2012_China_Market_Profile.pdf
114MarketProfile:ChinainBrandUSAFY2014BusinessPlan,pp80-81. http://www.thebrandusa.com/~/media/Files/Key%20Dox/2013/BrandUSA-BusinessPlan_Public-LIVE.pdf
Brand USA
Brand USA strategy in China based on market research
73
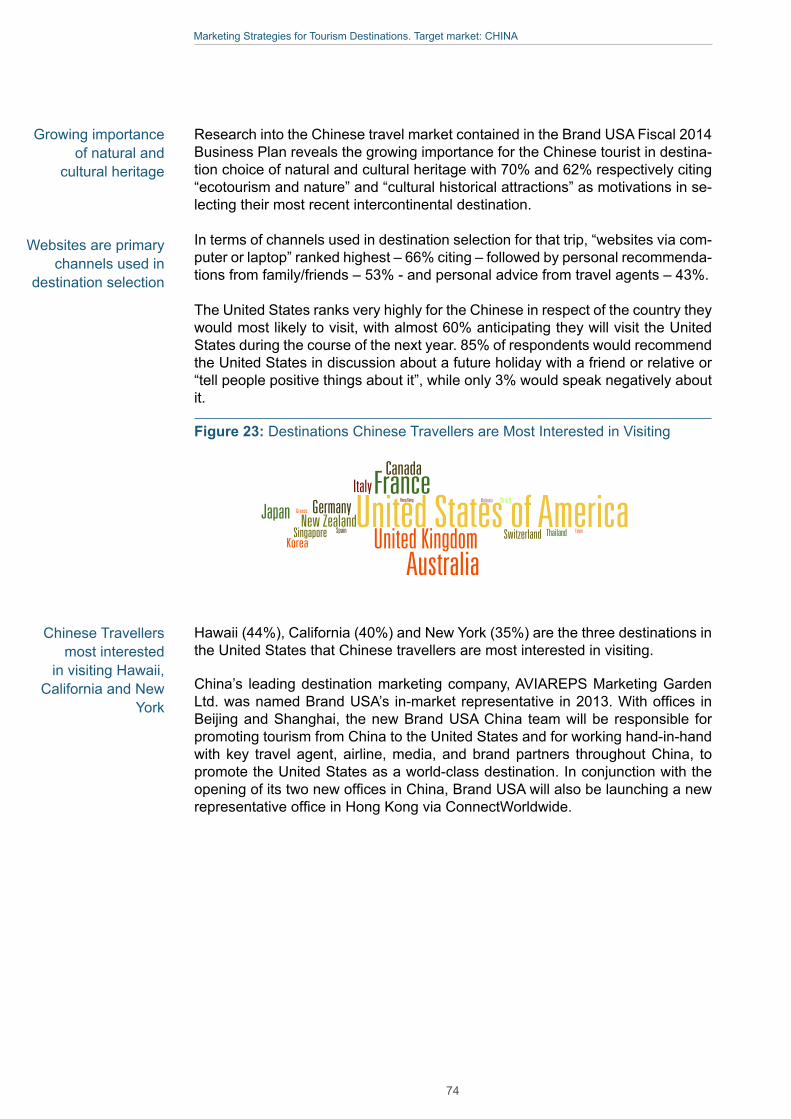
Marketing Strategies for Tourism Destinations. Target market: CHINA
Research into the Chinese travel market contained in the Brand USA Fiscal 2014 Business Plan reveals the growing importance for the Chinese tourist in destina-tion choice of natural and cultural heritage with 70% and 62% respectively citing “ecotourism and nature” and “cultural historical attractions” as motivations in se-lecting their most recent intercontinental destination.
In terms of channels used in destination selection for that trip, “websites via com-puter or laptop” ranked highest – 66% citing – followed by personal recommenda-tions from family/friends – 53% - and personal advice from travel agents – 43%.
The United States ranks very highly for the Chinese in respect of the country they would most likely to visit, with almost 60% anticipating they will visit the United States during the course of the next year. 85% of respondents would recommend the United States in discussion about a future holiday with a friend or relative or “tell people positive things about it”, while only 3% would speak negatively about it.
Figure 23: Destinations Chinese Travellers are Most Interested in Visiting
Bra
nd
US
A F
Y14
Bu
sin
ess
Pla
n •
80
M
AR
KE
T P
RO
FIL
ES
Source: Brand USA Proprietary Research unless otherwise noted.
Market Profile: ChinaTop 5 Motivations for Selecting Last
Intercontinental Destination
Motivation % Selected
Ecotourism and nature 70%
Cultural Historical Attractions 62%
Beaches/seaside attractions 60%
Urban attractions (Nightlife, City tours)
59%
Dining/Gastronomy 55%
Top 5 Strongest Impressions
of the USA
Impression % Selected
Diverse 52%
Energetic 49%
Open-minded 49%
Creative 43%
Trendy 35%
Question: What motivates your desire to visit that destination? Select all that apply. For each of the following countries, select which characteristics, if any, describe it as a holiday destina-
tion. Select all that apply.
Destination Decision and Air Booking Windows for Next Intercontinental Trip
DESTINATION DECISION AIR BOOKING
Question: How far in advance of your departure date did/will you decide on the destination? Please select one answer for each of the following questions. How far in advance of your
departure date did/will you book the travel products for this holiday? Select one option from the drop-down box
More than one year
6 to 12 months
3 to 5 months
1 to 2 months
3 to 4 weeks�
1 to 2 week�
2 to 6 days
1 day or less
I did/will not research/decide in advance 1%
2%
10%
18%
17%
30%
0%
16%
5%
More than one year
6 to 12 months
3 to 5 months
1 to 2 months
3 to 4 weeks�
1 to 2 week�
2 to 6 days
I did/will not research/decide in advance
1%
16%
28%
22%
24%
0%
7%
2%
Top 5 Channels Used in Destination
Selection for Last Intercontinental Trip
Channels % Selected
Websites via Computer or Laptop
66%
Personal Recommendations from Family and Friends
53%
Websites or applications via tablet
42%
Personal advice from travel professionals/travel agents
43%
Websites or applications via mobile phone
34%
Question: What sources of information did/will you use to select the destination for this
holiday? Select all that apply.
Countries travelers from China
would most like to visit
United States of AmericaFrance
GermanyGreece
KoreaSpain Egypt
BrazilMalaysiaHong Kong
Canada
JapanSingapore
New ZealandSwitzerland Thailand
Italy
AustraliaUnited Kingdom
2012 Arrivals 2012 Spending
1.47 million $8.8 billion
+35% v 2011 +14% v 2011
Rank: 7 Rank: 6
U.S. Department of Commerce, Office of Travel and Tourism Industries (OTTI)
Hawaii (44%), California (40%) and New York (35%) are the three destinations in the United States that Chinese travellers are most interested in visiting.
China’s leadingdestinationmarketingcompany,AVIAREPSMarketingGardenLtd.wasnamedBrandUSA’s in-marketrepresentative in2013.Withoffices inBeijing and Shanghai, the new Brand USA China team will be responsible for promoting tourism from China to the United States and for working hand-in-hand with key travel agent, airline, media, and brand partners throughout China, to promote the United States as a world-class destination. In conjunction with the openingofitstwonewofficesinChina,BrandUSAwillalsobelaunchinganewrepresentativeofficeinHongKongviaConnectWorldwide.
Growing importance of natural and
cultural heritage
Websites are primary channels used in
destination selection
Chinese Travellers most interested
in visiting Hawaii, California and New
York
1
74

Marketing Strategies for Tourism Destinations. Target market: CHINA
Figure 24:BrandUSA’sChinacountryprogrammes
Category Component
Brand USA Originals Multi Channel
Inspiration Guide
Go USA.cn
SEM
In-language content
BrandUSAAffinityPrograms Expedia/eLong/Hotels.com
Orbitz Worldwide/HotelClub
TripAdvisor/DaoDao
CTrip
MyWedding.com
Student Travel Association
MarketSpecificPrograms Market Entry Program
Sohu.com
Quanar.com
Missions Sales Mission in October
Tourism Fairs BITE
CITM
Source: Brand USA FY 2014 Business Plan
1
75

Marketing Strategies for Tourism Destinations. Target market: CHINA
Inaugural campaign scheduled for autumn 2014 will comprise:• 8-week digital campaign through a micro-site created and promoted
acrossWorldTravellerMedia’sfourdigitalplatforms(WorldTraveller’sWebsite, Weibo, Weixin, & EDM) - 4mn combined impressions,
• Television episodes (produced and grouped into themed or regional topics) with dedicated partner content produced and broadcast on over 30 television channels across China,
• Go USA print insert – polybagged with the World Traveller Magazine to the VIP subscriber list of 28 to-40 year olds in the emerging middle class,
• OOH – Metro LCD screens – partner content from television segments shown on LCD screens in China metro stations.
Search Engine Marketing is a key component of Brand USA’s international mar-keting efforts.
Print and digital versions of the Inspiration Guide will be available in several languages, including those for the Chinese markets, and be distributed through robust strategies targeting consumers and trade around the globe. Over 30 million banner impressions will be delivered through the digital version; and 575,000 copies of the printed guide will be distributed.
Chinese language site that provides navigation (by interest and geography) and interactivity features. It offers three customised package levels for destinations or brand partners.
Provided for USA Brand participating destinations to incorporate in their individ-ual promotions.
Authorised Brand USA Co-op marketing partners in China detailed in the FY2014 Business Plan are:ONLINE TRAVEL AGENCIES
• Expedia and ELong,• Orbitz Worldwide (Orbitz/Ebookers/Hotel Club/Cheaptickets),• TripAdvisor & Dao Dao MULTI MEDIA,• WAYN PRINT,• Essentially America.
MarketSpecificProgramsare launched in individualmarketsandfocusonat-tracting international travellers from specific markets, always customised tospeak to the international traveller of that market. A current Market Entry Pro-gram is available for China. Partners are now able to focus their co-op marketing effortswithprogrammesthathavebeendesignedtoreachspecificmarkets.Byworking directly with our in-country experts, and with just a small contribution into this programme, partners can launch or expand their marketing efforts in a variety ofgrowthmarkets.TurnkeyprogramsdevelopedbyBrandUSA’sin-countryrep-resentatives provide services to reach the travel trade industry; launch products; create awareness; participate in key in-market trade shows; introduce the des-tination or brand; participate in missions, roadshows and training seminars; and receiveone-on-oneconsultingsupporttosupportpartners’salesandmarketingteams.
Search Engine Marketing is a key
component of Brand USA’sinternational
marketing efforts
Market Entry Program
MarketSpecificPrograms launched
in individual markets
76

Marketing Strategies for Tourism Destinations. Target market: CHINA
Beijing International Tourism Expo (BITE) is an annual three-day tourism event, organised since 2003 and attended by over 50,000 in 2013, that provides a show-case for tourism destinations, attractions and travel-related goods and services to present to the Chinese tourism market.
The China International Travel Mart is a four-day annual trade show held alter-nately in Kunming and Shanghai and jointly organised by China National Tourism Administration, the Civil Aviation Administration of China and the government of the province in which the event is held. It attracts around 2,500 exhibitors, includ-ing up to 1,000 overseas destinations and operators.
The China Outbound Travel and Tourism Market, held in Beijing in April, is a busi-ness-to-business event that attracted over 8,000 attendees in 2012.
TheadventofBrandUSA’Smarketinginitiativeshasstirredupdestinationmar-keting throughout the world, with the greatest impact being in emergent travel markets, like China, with populations with a strong desire to participate in interna-tional travel that has been restricted until recently. In such markets, the consumer is highly receptive to destination marketing campaigns of the scale, breadth and specificityofBrandUSA’swhichcommunicatesdirectlytomanymillionsofChi-nese people in their own language.
The strategy of altering the perception of the United States from an arrogant and inhospitable country to a welcoming one has been effective judging by the highly positive perceptions now held by Chinese consumers of the Unites States and the desire of so many Chinese to visit the country in the next year, as reported in the preceding sub-section.
ThepartnershipapproachiscentraltoBrandUSA’smarketingstrategyandcam-paign components, giving a wide range of destination, travel trade and media partners the opportunity to piggyback on the digital and traditional marketing tools, public relations and promotional efforts developed and conducted by Brand USA. This is especially effective in a market like China where United States travel trade partner knowledge about Chinese consumer preferences and methods of researching and selecting travel choices is limited.
Given the high level of accountability to its partners, Brand USA has a rigorous system of monitoring, assessing and evaluating its activities. Brand USA is track-ing and measuring its success based on improvements and increases related to:
• awareness and image of the United States as a travel destination,• internationaltravellers’intenttotraveltotheUnitedStates,• international visitation and spending.
ThecommissioningoftheOxfordEconomics’studyTheReturnonInvestmentof Brand USA Marketing is an example of this rigorous system of performance reckoning.
BrandUSA’smarketing has stirred up destination marketing throughout the world
Strategy successful in altering the perception of the United States
Partnership approach is central to Brand USA’ssuccess
77

Marketing Strategies for Tourism Destinations. Target market: CHINA
5.1 Market PerceptionsThe USA represents wealth and popular culture, while Europe represents lux-ury and tradition. For Australia, the key motivator is the environment and life-style (Hangzhou travel agent quoted in China 2020 – Building the Foundations – Knowing the Customer. Tourism Australia, 2012).
Drawing on the various research studies conducted by ETC, and the Australian and United States tourism authorities and agencies, as well as the direct contacts made with DMOs and TOAs in the countries competing with Europe, it is clear that market perceptions among the Chinese population of competing long haul destinationsare rapidlyevolving.Thesearechanging from thesuperficialandtraditional based on historical events and the long-established tourist magnet sites and buildings to a more detailed awareness and knowledge of the other parts of the countries and their attractions. This change is equally marked for Europe, Australia and the United States.
Among those Chinese who have not travelled to long haul destinations or are makingtheirfirstsuchtrip,bothEuropeandtheUnitedStatesarefirstchoices,the former because Europe is seen as a “trip of a lifetime”, ideal for a honeymoon, the latter because it is viewed as being at the forefront of all new things new and has large Chinese communities. The danger for Europe in terms of marketing the region – as opposed to the individual countries within it – is that the image persists of “a heritage theme park”115 as against the United States perceived as “the future”.
For the more experienced outbound Chinese travellers, a wider range of destina-tions is considered, with travel away from the iconic sites and pursuing different themesandinterests,asconfirmedinbothETCandTourismAustraliastudies.Indeed,TourismAustralia’stargetmarketinChinaistheexperiencedtraveller116, in recognition of the combination of the following:
1. Australiadoesnotrankhighlyasafirsttimer’soverseasvisit,2. The appeal of a “laid back, easy-going holiday with unique and iconic
attractions” is strong among experienced travellers, 3. The experienced traveller is more adventurous in terms of the places
visited and experiences sought i.e. prepared to “go off-the-beaten-track”.
115 Megatrends: Ten new directions transforming our lives, 1982. Naisbitt, J.116 China 2020 – Building the Foundations – Knowing the Customer. Tourism Australia,
2012.http://www.tourism.australia.com/documents/Markets/China2020-Building_the_Foundations.pdf
Key Factors in Destination Marketing in China5
Market perceptions among the Chinese
population are rapidly evolving
First time Chinese travellers see Europe as a “trip of a lifetime”
Experienced Chinese travellers consider
a wider range of destinations
78

Marketing Strategies for Tourism Destinations. Target market: CHINA
Europe’sadvantagesare itshistoryandculturalheritage, richdiversityofcul-tures, iconic sites and structures, excellent shopping facilities and the blue sky factor (important for the Chinese urban dweller used to polluted environments). On the negative side are the perception of high prices, the complications of visa arrangements and inter-country travel, limited information on destinations and language barriers117.
TheUnitedStates’strengthsaremuchmoreaboutthecharacterofthedestina-tion and its people: diverse (52% citing as a strong impression of the country118), energetic, open-minded (both 49%), creative (43%) and trendy (35%). The neg-atives that prevailed prior to the launch of Brand USA of the United States being “arrogant, unwelcoming and predictable nation” seemed to have been largely dispelled among the Chinese consumer and, with a more positive attitude toward linguistic and pricing issues, and a heavy, fully coordinated and highly-targeted marketing campaign, the United States has clear advantages over Europe at present.
Awareness of Australia is less well-developed outside the major Chinese cities but it is a highly aspirational destination for active overseas Chinese who have travellers who are looking for a less restrictive travel and tour arrangement than the group tour which offers a mix of natural environment, culture, history and development togetherwith good products and services.Australia’s nature re-sources and lifestyle are key advantages that it holds above both Europe and the United States for experienced Chinese travellers.
Common factors in Chinese attitudes towards the three destinations are: visa andtravelarrangements,andlanguage.Nosignificantadvantageisheldbyanyof the destinations in respect of their visa regimes but recent actions to speed up and otherwise facilitate the process are viewed highly positively. The increase inflightconnectionsisalsoapositivedevelopment,commontoallthreeareas.
Each of the three destinations recognises and is implementing extensive Chinese language programmes – both in marketing campaigns in China, and in the de-livery of tourism products and services in the destination. The United States has an advantage in that it is seen by the Chinese as offering more ready access to Chinese speakers, cuisine etc with Europe less favourably viewed in this respect.
5.2 Marketing Performance and OpportunitiesRecognisingthesignificantdifferencesinChinesesocietyandculturefromwest-ern systems, each of the three competing long haul destinations have invested heavily and effectively in studies and surveys. The findings of such researchenables the destination marketing organisations to better understand the atti-tudes, motivations, behaviour and characteristics of Chinese travellers. This in-creased knowledge about the preferences of Chinese travellers, and trends in travel choices and patterns, leads to focused marketing strategies and the design of communications and promotional campaigns to achieve the highest possible penetration of the Chinese market.
117 Chinese and Brazilian Outbound Tourism Markets and Netnography, 7th UNWTO/PATA Forum on Tourism Trends and Outlook, October 2013, ETC
118MarketProfile:ChinainBrandUSAFY2014BusinessPlan,pp80-81.http://www.thebrandusa.com/~/media/Files/Key%20Dox/2013/BrandUSA-BusinessPlan_Public-LIVE.pdf
Europe’sadvantagesare its history and cultural heritage
Chinese language programmes are crucial
Competing long haul destinations have invested heavily and effectively in studies and surveys
79

Marketing Strategies for Tourism Destinations. Target market: CHINA
The analyses arising from these researches have enabled activities to be de-livered that resonate with the Chinese consumer and build awareness, interest and the desire to visit the destination. It is clear that marketing strategies are evidence-driven, indicating the vital importance of research as a key element in thedevelopmentofdestination’smarketingstrategy.
ETC/UNWTO research studies - Understanding Chinese Outbound Tourism: What the Chinese blogosphere is saying about Europe, and The Chinese Out-bound Travel Market, 2008 and 2012 update - identify key target markets in Chi-na for Europe.
The ETC blogger campaign targeting the young traveller market segment is a good example of using research to identify appropriate means of communicating with a target market. The value of research is also evident in the Brand USA study that showed that 82% of China respondents intended to visit the country within the next two years – with almost 60% planning to do within the next 12 months.
Both Brand USA and Tourism Australia are investing heavily through dedicated budgets to research/understand the Chinese market. These organisations then use this information to design communication messages and undertake market-ing and promotional activities to which the Chinese population is highly receptive.
While individual European countries have their own operations in, and activi-ties directed towards, Chinese consumers, these are not fully coordinated – for both competitive and administrative reasons. By contrast, the Australian and USA states and major cities and other tourism destinations all work with the national DMO and conduct their own marketing activities in China, using them to com-plement each other. The fact that this is not so advanced in respect of Europe undermines the effectiveness of marketing efforts undertaken by individual des-tinations.
The inevitable consequence of the disparate and limited marketing activities of Europeancountries,withoutastrong,financially-empoweredcoordinatingmech-anism, is that the predominant view of Europe is of a collection of countries with-out a central theme. That is not to conclude that competition should not be fos-tered – indeed market competition is the essence of business in both Australia and the United States – but by linking together on certain marketing activities, benefitcanaccruetoall,inthespiritofco-opetition (i.e. cooperation intertwined with competition) whereby the overall market is increased through working to-getherenablingthedestination’sindividualmarketingactivitiestocompeteforalarger total market. The strength of both Tourism Australia and Brand USA is their focus on the partnership approach to destination marketing.
Research reported on in Chapter 1, Figure 12 shows that, as FIT travel from Chi-na increases its share of the outbound travel market, Chinese travellers divide into “tribes”119 - according to level of sophistication and the importance attached tostatus.Thisenablesdestinationstocaterformoreofthetribesidentified,de-signing their product/experience offer appropriately, key priorities being to:
• “storify” the destination,• develop authentic products/experiences,• deliver China-friendly services.
119 Understanding Chinese Outbound Tourism: What the Chinese blogosphere is saying about Europe. UNWTO/ETC. 2012
European maketing operations are not
fully coordinated
Predominant view of Europe is of a collection of
countries without a central theme
80

Marketing Strategies for Tourism Destinations. Target market: CHINA
Brand USA addresses the high level of desire among all the Chinese travel tribes to visit the country by offering an extensive menu of travel products and expe-riences from which the different segments (or tribes) can pick and choose. Ex-amining the activities that Chinese visitors undertook on their visits to the United States,thefactthat“finedining”and“visitstosmalltownsandcountryside”wereplaced in the top ten activities (recording 47% and 36% respectively), alongside the traditional activities of shopping and sightseeing, suggests that Brand USA is actively attracting different segments of Chinese travellers.
This same type and level of opportunity is available to Europe since it has the natural and cultural resources, built environment, sophisticated urban facilities and unspoilt areas (the so-called blue sky effect, as Chinese seek to escape the pollution that envelops their major cities at times of the year120) to cater for the full range of Chinese travellers. To realise this potential, much of which will entail cross-border travel related to themed products and experiences, a Europe-wide marketing campaign can create awareness of the opportunities and facilitative measures (e.g. visa requirements, transportation options) that the European country DMOs – either individually or in small partnerships according to the opti-mal structure of the tour – can build on.
Historical culture and heritage do appear to emerge as a key asset in the cur-rent(unmanaged)positioningofEurope.ETC’sownresearchwithitsmembersindicates that Europe is perceived as historical and cultural experiences; part of Europe’sappeal is the richvarietyofcultures, landscapesandexperiences ina relatively small geographical area supported by a good travel infrastructure. The challenge of any future marketing campaign would probably be to shift this positioningtohighlightEurope’scontemporaryvibrancy,enterpriseandinnova-tion within tourism, and in particular to create knowledge about the far richer and more diverse tourism experiences that Europe can offer beyond the “ten cities in ten days” quick stop introductory tour.
120 What I wish for Chinese New Year. January 2014. http://usa.chinadaily.com.cn/epaper/2014-01/13/content_17232671.htm
Brand USA is actively attracting different Chinese segments
Opportunity is available to Europe to cater for full range of Chinese travellers
81


Marketing Strategies for Tourism Destinations. Target market: CHINA
Appendices

Marketing Strategies for Tourism Destinations. Target market: CHINA
Appendix 1 European and Competing Destinations WET TTCI and Bloom Country Brand Rankings
Figure 25: WEF TTCI and Bloom Country Brand Rankings of European Countries
Country
World Economic Forum Travel and Tourism Competitive Index 2013 (out of 140 countries)
Bloom Country Brand Rank (Out of 187 Countries/ Territories)
T & T Regulatory Framework
T & T Business Environment & Infrastructure
T & T Human, Cultural and Natural Resources
Overall Rank
Switzerland 1 1 2 1 14Germany 8 6 7 2 3Austria 2 11 9 3 11Spain 14 5 6 4 2United Kingdom 17 10 3 5 5France 9 7 11 7 4Sweden 12 23 8 9 29Netherlands 16 15 16 13 21Iceland 3 13 36 16 99Finland 5 22 24 17 46Belgium 18 26 18 18 34Ireland 7 19 40 19 37Portugal 20 27 19 20 23Denmark 25 16 26 21 45Norway 11 28 33 22 40Luxembourg 21 20 39 23 62Malta 15 14 49 24 53Italy 50 29 14 26 7Cyprus 22 21 46 29 65Estonia 10 30 51 30 57Czech Republic 28 37 28 31 36Greece 39 33 30 32 16Croatia 42 39 42 35 27Slovenia 33 35 52 36 48Hungary 26 49 54 39 39Montenegro 34 50 47 40 95Poland 49 58 32 42 32Turkey 64 52 27 46 9Latvia 35 40 77 48 80Lithuania 41 48 61 49 86Bulgaria 58 45 53 50 52Slovak Republic 43 60 55 54 60Romania 66 68 73 68 74Serbia 74 81 109 89 96Monaco - - - - -San Marino - - - - -
Source: WEF TTCI Survey and Bloom Country Brand Ranking, Tourism Edition 2013
84

Marketing Strategies for Tourism Destinations. Target market: CHINA
Figure 26: WEF TTCI Travel and Tourism Regulatory Framework
Source: WEF - TTCI, 2013, 140 destinations
Figure 27: WEF TTCI Business Environment and Infrastructure
Source: WEF - TTCI, 2013, 140 destinations
85

Marketing Strategies for Tourism Destinations. Target market: CHINA
Figure 28: WEF TTCI Travel and Tourism Human, Cultural and Natural Resources
Source: WEF - TTCI, 2013, 140 destinations
86
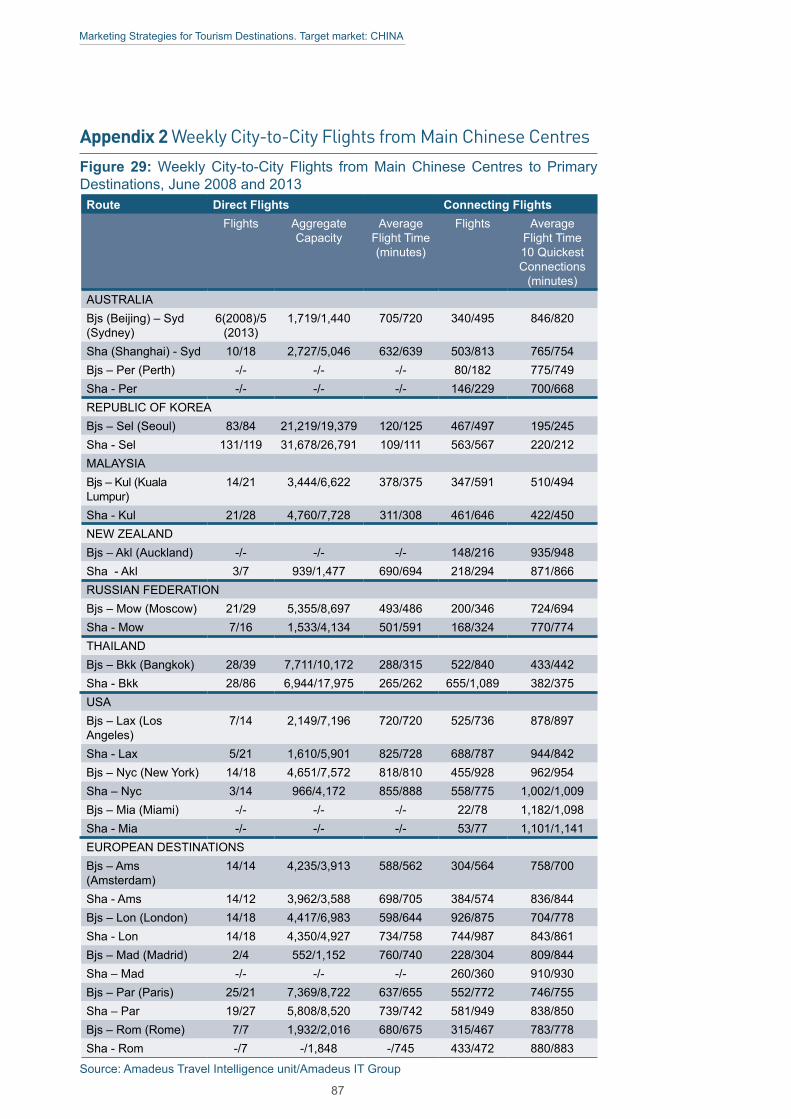
Marketing Strategies for Tourism Destinations. Target market: CHINA
Appendix 2 Weekly City-to-City Flights from Main Chinese CentresFigure 29: Weekly City-to-City Flights from Main Chinese Centres to Primary Destinations, June 2008 and 2013Route Direct Flights Connecting Flights
Flights Aggregate Capacity
Average Flight Time (minutes)
Flights Average Flight Time 10 Quickest Connections
(minutes)AUSTRALIABjs (Beijing) – Syd (Sydney)
6(2008)/5 (2013)
1,719/1,440 705/720 340/495 846/820
Sha (Shanghai) - Syd 10/18 2,727/5,046 632/639 503/813 765/754Bjs – Per (Perth) -/- -/- -/- 80/182 775/749Sha - Per -/- -/- -/- 146/229 700/668REPUBLIC OF KOREABjs – Sel (Seoul) 83/84 21,219/19,379 120/125 467/497 195/245Sha - Sel 131/119 31,678/26,791 109/111 563/567 220/212MALAYSIABjs – Kul (Kuala Lumpur)
14/21 3,444/6,622 378/375 347/591 510/494
Sha - Kul 21/28 4,760/7,728 311/308 461/646 422/450NEW ZEALANDBjs – Akl (Auckland) -/- -/- -/- 148/216 935/948Sha - Akl 3/7 939/1,477 690/694 218/294 871/866RUSSIAN FEDERATIONBjs – Mow (Moscow) 21/29 5,355/8,697 493/486 200/346 724/694Sha - Mow 7/16 1,533/4,134 501/591 168/324 770/774THAILANDBjs – Bkk (Bangkok) 28/39 7,711/10,172 288/315 522/840 433/442Sha - Bkk 28/86 6,944/17,975 265/262 655/1,089 382/375USABjs – Lax (Los Angeles)
7/14 2,149/7,196 720/720 525/736 878/897
Sha - Lax 5/21 1,610/5,901 825/728 688/787 944/842Bjs – Nyc (New York) 14/18 4,651/7,572 818/810 455/928 962/954Sha – Nyc 3/14 966/4,172 855/888 558/775 1,002/1,009Bjs – Mia (Miami) -/- -/- -/- 22/78 1,182/1,098Sha - Mia -/- -/- -/- 53/77 1,101/1,141EUROPEAN DESTINATIONSBjs – Ams (Amsterdam)
14/14 4,235/3,913 588/562 304/564 758/700
Sha - Ams 14/12 3,962/3,588 698/705 384/574 836/844Bjs – Lon (London) 14/18 4,417/6,983 598/644 926/875 704/778Sha - Lon 14/18 4,350/4,927 734/758 744/987 843/861Bjs – Mad (Madrid) 2/4 552/1,152 760/740 228/304 809/844Sha – Mad -/- -/- -/- 260/360 910/930Bjs – Par (Paris) 25/21 7,369/8,722 637/655 552/772 746/755Sha – Par 19/27 5,808/8,520 739/742 581/949 838/850Bjs – Rom (Rome) 7/7 1,932/2,016 680/675 315/467 783/778Sha - Rom -/7 -/1,848 -/745 433/472 880/883
Source: Amadeus Travel Intelligence unit/Amadeus IT Group
87

Marketing Strategies for Tourism Destinations. Target market: CHINA
Figure 30: Weekly City-to-City Flights from Main Chinese Centres to Primary Destinations, February 2009 and 2014Route Direct Flights Connecting Flights
Flights Aggregate Capacity
Average Flight Time
(minutes)
Flights Average Flight Time 10 Quickest
Connections (minutes)
AUSTRALIABJS (Beijing) – SYD (Sydney)
7(2009)/7 (2014)
1,809/3,598 718/700 414/514 822/836
SHA (Shanghai)- SYD 14/25 3,806/6,811 631/642 591/850 767/754BJS – PER (Perth) -/- -/- -/- 80/176 774/750SHA - PER -/- -/- -/- 121/246 714/720REPUBLIC OF KOREABJS – SEL (Seoul) 75/84 16,997/19,345 117/122 369/414 209/245SHA - SEL 117/119 24,461/27,981 112/110 591/489 240/254MALAYSIABJS – KUL (Kuala Lumpur)
14/21 3,444/6,503 388/392 327/578 470/511
SHA - KUL 18/32 4,538/8,293 325/329 421/654 452/449NEW ZEALANDBJS – AKL (Auckland) 2/- 626/- 780/- 162/255 945/990SHA - AKL 3/7 939/2,128 695/695 258/368 878/880RUSSIAN FEDERATIONBJS – MOW (Moscow) 18/14 4,633/4,218 496/509 151/254 778/755SHA - MOW 6/11 1,667/3,129 606/619 141/237 762/780THAILANDBJS – BKK (Bangkok) 28/46 6,997/13,861 308/318 456/1,137 439/445SHA - BKK 22/93 6,361/19,310 279/284 619/1,489 376/385USABJS – LAX (Los Angeles)
7/14 2,149/7,196 690/720 421/664 913/860
SHA - LAX 7/20 2,254/5,360 840/704 584/851 981/820BJS – NYC (New York) 11/18 3,562/7,579 814/820 311/774 981/973SHA – NYC 3/13 966/3,904 855/878 443/675 1,011/987BJS – MIA (Miami) -/- -/- -/- 18/87 1,133/1,069SHA - MIA -/- -/- -/- 39/66 1,095/1,132EUROPEAN DESTINATIONSBJS – AMS (Amsterdam) 11/13 3,308/3,288 617/636 234/370 769/775SHA - AMS 10/9 2,830/2,475 715/715 317/488 882/904BJS – LON (London) 12/14 3,552/5,320 668/659 509/750 780/788SHA - LON 14/19 4,254/5,062 780/782 607/808 858/697BJS – MAD (Madrid) 2/4 552/1,036 760/750 135/239 869/868SHA – MAD -/- -/- -/- 160/269 971/971BJS – PAR (Paris) 15/15 4,677/6,372 665/663 435/568 762/770SHA – PAR 19/24 5,826/7,494 758/756 479/679 856/904BJS – ROM (Rome) 5/7 1,411/1,813 680/680 241/327 810/810SHA - ROM -/5 -/1,320 -/795 308/343 924/949
Source: Amadeus Travel Intelligence unit/Amadeus IT Group
88

Marketing Strategies for Tourism Destinations. Target market: CHINA
Appendix 3 TripAdvisor Ratings (Source Market: China)
Figure 31: TripAdvisor Ratings of Tourism Services in Competing Destinations
Destination Country
Aspect Rating
2012 2013
Greece Accommodation 4.4* 4.4*
Eatery - 4.2*
Attraction - -
Switzerland Accommodation 4.0* 4.0*
Eatery - 3.9*
Attraction - -
Austria Accommodation - 4.0*
Eatery - -
Attraction - -
The Netherlands Accommodation - 3.9*
Eatery - 4.1*
Attraction - -
Czech Republic Accommodation - -
Attraction - -
Eatery - -
Portugal Eatery - -
Accommodation - -
Attraction - -
Russia Accommodation - -
Attraction - -
Eatery - -
Ireland Accommodation - -
Eatery - -
Attraction - -
Belgium Accommodation - -
Eatery - -
Attraction - -
Hungary Accommodation - -
Eatery - -
Attraction - -
Croatia Accommodation - -
Eatery - -
Attraction - -
Sweden Accommodation - -
Attraction - -
Eatery - -
Norway Accommodation - -
Eatery - -
Attraction - -
Destination Country
Aspect Rating
2012 2013
China Accommodation 3.9 4.0
Eatery 3.9 4.0
Attraction 4.1 4.2
Thailand Accommodation 4.1 4.1
Eatery 4.1 4.1
Attraction 4.2 4.3
United States Accommodation 3.9 3.9
Eatery 4.0 4.1
Attraction 4.4 4.4
United Kingdom Eatery 4.0 4.0
Accommodation 4.0 4.1
Attraction 4.5 4.3
Italy Accommodation 4.2 4.2
Eatery 4.0 4.1
Attraction 4.3 4.5
Australia Accommodation 3.9 4.0
Eatery 4.0 4.0
Attraction 4.4 4.4
Malaysia Accommodation 3.8 3.9
Attraction 4.1 4.0
Eatery 3.8* 4.0
France Accommodation 3.9 4.0
Eatery 4.0 3.9
Attraction 4.4* 4.3
Spain Eatery 4.1* 4.1
Accommodation 4.0 4.2
Attraction 4.4* 4.4*
Germany Accommodation 4.0 4.0
Eatery 4.0* 4.0
Attraction 4.4* 4.4*
New Zealand Accommodation 4.3 4.4
Eatery 4.2* 4.2*
Attraction 4.5* 4.5*
Rep. of Korea Accommodation 3.9 4.1
Attraction 4.0* 4.2*
Eatery - -
Turkey Accommodation 4.3* 4.4
Attraction 4.5* 4.4*
Eatery - 4.3*
Ratings are based on a minimum of 500 reviews per item/country/year.Ratings market with * are based on more than 200 reviews (but less than 500).
89

Marketing Strategies for Tourism Destinations. Target market: CHINA
Destination Country
Aspect Rating
2012 2013
Finland Accommodation - -
Eatery - -
Attraction - -
Iceland Accommodation - -
Attraction - -
Eatery - -
Denmark Accommodation - -
Attraction - -
Eatery - -
Poland Accommodation - -
Attraction - -
Eatery - -
Malta Accommodation - -
Eatery - -
Attraction - -
Estonia Accommodation - -
Eatery - -
Attraction - -
Romania Eatery - -
Accommodation - -
Attraction - -
Cyprus Accommodation - -
Eatery - -
Attraction - -
Latvia Accommodation - -
Eatery - -
Attraction - -
Destination Country
Aspect Rating
2012 2013
Slovenia Accommodation - -
Eatery - -
Attraction - -
Lithuania Accommodation - -
Eatery - -
Attraction - -
Slovakia Attraction - -
Eatery - -
Accommodation - -
Bulgaria Accommodation - -
Eatery - -
Attraction - -
Monaco Eatery - -
Accommodation - -
Attraction - -
Luxembourg Accommodation - -
Eatery - -
Attraction - -
Montenegro Accommodation - -
Eatery - -
Attraction - -
Serbia Accommodation - -
Attraction - -
Eatery - -
San Marino Eatery - -
Accommodation - -
Figure 31: TripAdvisor Ratings of Tourism Services in Competing Destinations (cont.)
Ratings are based on a minimum of 500 reviews per item/country/year.Ratings market with * are based on more than 200 reviews (but less than 500).
90

Marketing Strategies for Tourism Destinations. Target market: CHINA
Appendix 4 Bibliography and References
The following reports, plans and other documents have been consulted. Ref-erences are given as footnotes in the body of the text and are not reproduced below.
China• Chinese and Brazilian Outbound Tourism Markets and Netnography,
ETC, 7th UNWTO/PATA Forum on Tourism Trends and Outlook, Octo-ber 2013
• Destinations with ADS for Chinese outbound tourists, supplied by ETC• ShapingtheFutureofTravelinChina,AmadeusAsiaPacific,2013• Destination Investment.NewNetworks forServingAffluentChinese
Visitors. Dr Wolfgang Georg Arlt, COTRI – Chinese Outbound Travel Research Institute, IRB, March 2013
• How the Rise of Chinese Tourism will Change the Face of Europe-an Tourism. Blue Paper. Dr K Latham, School of Oriental and African Studies, University of London, 2012
• Outbound Travel and Outward Investment from China, Adam Wu, Chi-na Business Network, 2012
• China becomes a more Compelling International Tourist Destination, thanks to the Olympic Games, Nielsen, September 2008
• China Market Insights, Jan 2011. ETC• ITB World Travel Trends report, prepared by IPK, December 2011• CNTAandCNTOProfileinformation• China Outbound Tourism in 2013. Travel China Guide• The Chinese Outbound Travel Market (with special insight into the im-
age of Europe as a destination), 2008, UNWTO/ETC• The Chinese Outbound Travel Market, 2012 update, UNWTO/ETC• MOU between China and the Europe Community on Visas etc• Destinations with ADS for Chinese Outbound Tourists• NewChineseTourists inEurope from2017,Z_punktTheForesight
Company• Understanding Chinese Outbound Tourism, What the Chinese Blogo-
sphere is Saying about Europe, UNWTO & ETC, 2012• Nine Important Developments in China’s Outbound Tourism 2013.
Wolfgang Arlt, COTRI – China Outbound Tourism Research Institute• China Outbound Travel Monitor, 2008. Nielsen/PATA• HowtoenterChina’sTourismMarket,ProfArltforconsortiumofGer-
man and Slovak tourism interests, 2006• HalfaBillion:China’sMiddleClass-ClassConsumers.DBarton,McK-
insey and Company in The Diplomat, 30 May 2013• China Population 2013. World Population Statistics. 18 September 2013• China 2020 – Building the Foundations – Knowing the Customer. Tour-
ism Australia, 2012• Understanding the Chinese Consumer. Tourism Australia. 2013• The Return on Investment of Brand USA Marketing. Oxford Econom-
ics. February 2014• Brand USA FY 2014 Business Plan• Brand USA FY13 Marketing Plan
91
• Bloom Consulting Country Brand Ranking Tourism Edition 2013 • Statistics, reports and other data relating to all markets• OECD Tourism Trends and Policies 2014. March 2014. OECD• ScheduledairtrafficfromeachmarketintoEurope,2012,IATA• Scheduledair traffic fromallglobalorigins intoEurope,Jan–June
2014, IATA• ETCSurveyofMembers’Priorities:MarketsandProductsfor2014-15.
ETC• ETC Marketing Activity Report, 2013, ETC• Tourism Satellite Accounts in Europe, 2010, EUROSTAT Methodolo-
gies and Working Papers• ITB World Travel Trends Report, 2011/12. IPK Consulting• Europe, theworld’sNo1 touristdestination–anewpolitical frame-
work for tourism in Europe, June 2010, European Commission• The Travel and Tourism Competitiveness Report, 2013, World Eco-
nomic Forum• UNWTO World Tourism Barometer, Volume 12, January 2014• Tourism Towards 2030/Global Overview, UNWTO, October 2011• UNWTO 25th CAP-CSA and UNWTO Conference on Sustainable
Tourism Development, April 2013• 2011 Census. Australian Bureau of Statistics• Australian National Accounts: Tourism Satellite Account 2012-13. Aus-
tralian Bureau of Statistics • Tourist Satellite Account, 2011-12, Australia Bureau of Statistics, 2013• Tourism2020,TourismAustralia’sJourney2010to2013,TourismAus-
tralia, October 2013• Portfolio Budget Statements 2013-14 Budget Related Paper 1.16 Re-
sources, Energy and Tourism Portfolio. Tourism Australia Budget• TourismAustralia’s2012-13AnnualReport• Malaysian Population and Housing Census 2010• New Zealand 2013 Census. Statistics New Zealand• Key Tourism Statistics. Ministry of Business, Innovation and Employ-
ment, New Zealand, January 2014• Russian Tourism Policies and Trends. February 2011• Thailand’sNationalTourismDevelopmentPlan• Travel and Tourism Economic Impact 2013 Thailand. World Travel and
Tourism Council• Sustainable Tourism Development in Thailand. UNWTO Conference
on Sustainable Tourism Development, April 2013• TAT Policy and Marketing Plan• Fast Facts: US Travel and Tourism Industry 2013. International Trade
Administration, Industry and Analysis, National Travel and Tourism Of-fice.April2014
• CIA World Factbook• Race reporting for the Asian population by selected categories, 2010.
US Census Bureau• Megatrends: Ten new directions transforming our lives, 1982. Naisbitt,
J.