Essays on Political Dynasties - CORE
282
1 Essays on Political Dynasties: Evidence from Empirical Investigations By Ashikur Rahman A thesis submitted to the Department of Government of the London School of Economics and Political Science for the degree of Doctor of Philosophy London, April 2013
-
Upload
khangminh22 -
Category
Documents
-
view
0 -
download
0
Transcript of Essays on Political Dynasties - CORE
1
Essays on Political Dynasties: Evidence fromEmpirical Investigations
By
Ashikur Rahman
A thesis submitted to the Department of Governmentof the London School of Economics and Political Science
for the degree of Doctor of Philosophy
London, April 2013
2
Declaration
I certify that the thesis I have submitted for examination for the MPhil/PhD degree of
the London School of Economics and Political Science is solely a product of my
work. The copyright of this thesis rests with the author. Quotation from it is
permitted, provided full acknowledgement is made. This thesis may not be
reproduced without the prior consent of the author.
I warrant that this authorization does not, to the best of my knowledge, infringe the
right of any third party.
Word Count: 87210
3
Abstract
This thesis consists of four papers, each of which helps to understand certain
dynamics surrounding political dynasties. The first paper focuses on the role of
‘dynastic identity’ in influencing the behaviour of legislators from the political class
of Bangladesh. In particular, it analyses whether dynastic legislators behave
differently in comparison to non-dynastic legislators by examining their parliamentary
attendance level and the likelihood of them having a criminal profile. The findings
from the analysis suggest that ‘dynastic identity’ may influence a legislator’s
behaviour. The second paper investigates if there is a systematic relationship between
dynasty-politics and corruption in a cross-country empirical analysis. In doing so, the
paper produces multiple dynasty indices that try to capture the variation in dynasty-
politics across countries. The key findings from this scrutiny are indicative that
countries with greater prevalence of dynasty-politics are associated with higher levels
of corruption. In the third paper, I study the role of political assassination in
facilitating the rise of political dynasties in Bangladesh. More specifically, I construct
a data set of political leaders from Bangladesh who faced at least one assassination
attempt to exploit the randomness in the success or failure of assassination attempts to
identify assassination’s effect on the probability that a leader will start a political
dynasty. The results point out that successful assassination increases the likelihood
that a political leader will have a posterior relative in office. Lastly, the fourth paper
examines if political assassinations have facilitated the rise of political dynasties
across countries. To this end, the paper builds on the data used in Jones and Olken
(2009), which has information on leaders with at least one assassination attempt.
Thus, by comparing national leaders who barely survived an assassination attempt
with those who died, the effects of political assassinations on dynasty formation are
studied.

4
Acknowledgements
In writing this thesis, I have received essential support from a large number of people.
To begin, I would like to acknowledge the constant assistance I have received from
my supervisors Torun Dewan and Joachim Wehner. Over the course of last four
years, my supervisors have provided me invaluable feedback, rigorous scrutiny,
incisive guidance and enduring encouragement, for which I am thoroughly grateful.
Other members of staff at the LSE have also been kind enough to discuss various
aspects of the overall thesis and provide their constructive criticism. In particular, I
am thankful to Patrick Dunleavy, Vesselin Dimitrov, Ed Page, and John Sidel for
providing me valuable comments on early drafts of some of the essays in the thesis.
Moreover, during my pursuit of MPA at LSE, I greatly benefited from countless
discussions with Robin Burgess and Oriana Bandiera, which ultimately motivated me
to enrol for the doctoral programme at the LSE. I also benefited from the comments
on the drafts I have received from some friends, namely Klaus, Muntasir, Selim, Rafi,
Risdon, Sameer, and my father in law Mr Abul Kalam Azad. While undertaking this
research, I was fortunate enough to have help from Alam Raihan, Sheikh Farid and,
Kabir Bhai for compiling the data sets on Bangladesh, and for providing assistance on
various different aspects of the thesis. I also had the privilege of working alongside an
astounding group of fellow doctoral students at the Department of Government.
Among them, I am in gratitude to Mike, Jose, Stefan, Nick, Anar, Ninfa, Matthew,
Kathleen, Liela, Guy, Faheem, Ursula, Johanes, Baldwin, Eric, Kenneth, Outi, Ting,
Joyce,and Fabrizio, for their advice, support, humour and tolerance. Given that a large
number of commentators have shared their advice on this thesis, I have tried to
address their criticisms and concerns as much as possible. If the work still carries
some notable imperfection, then it is not for the lack of good advice.
On a personal note, I wish to express my undying gratitude to my Ma, brothers (Anjan
and Partho bhai), and my loving wife (Farhana) for their unconditional support and
love. Lastly, (and most importantly), I wish to dedicate this thesis to the memory of
my Baba, whose love, guidance and affection has made my life complete. If there is a
scope of any metaphysical existence in the afterlife, I hope he views my
accomplishment with some satisfaction.
5
Contents
Abstract............................................................................................................................................... 3
Acknowldgements .............................................................................................................................. 4
List of Tables ...................................................................................................................................... 7
List of Figures..................................................................................................................................... 9
List of Boxes....................................................................................................................................... 9
List of Maps...................................................................................................................................... 10
1. Introduction.................................................................................................................................. 11
1.1 Why understand the dynamics surrounding political dynasties ..................................... 11
1.2 What motivations govern the behaviour of dynastic politicians ...................................... 14
1.3 What facilitates the emrgence of political dynasties ......................................................... 20
1.4 Theme – I ............................................................................................................................. 23
1.5 Theme – II ............................................................................................................................ 27
1.6 Outline of the Thesis ........................................................................................................... 32
2. Motivations of Dynastic Leaders: An Emperical Investigation from Bangladesh ................ 33
2.1 Introduction: Why look into the motivations of dynastic leaders? ................................. 34
2.2 Literature Review and Theory ........................................................................................... 36
2.3 Historical Background, Data and Emperical Method...................................................... 45
2.4 Results and Interpretations................................................................................................. 56
2.5 Conclusion ............................................................................................................................ 64
3. Corruption and Dynasty Politics ................................................................................................ 86
3.1 Introduction: Is Corruption and Dynasty-Politics linked?.............................................. 87
3.2 Literature Review and Theory ........................................................................................... 89
3.3 Data and Methodology ........................................................................................................ 98
3.4 Results ................................................................................................................................ 108
3.5 Conclusion .......................................................................................................................... 120
6
4. The Comnposition of Political Class: The Role of Assassinations......................................... 144
4.1 Introduction: What factors hspe the composition of political class? ............................ 145
4.2 Literature Review ............................................................................................................. 147
4.3 The Composition of Political Class in Bangladesh.......................................................... 151
4.4 Identification Strategy an Results .................................................................................... 161
4.5 Conclusion and Caveats .................................................................................................... 171
5. Assassinationsand Political Dynasties ...................................................................................... 187
5.1 Introduction: Does political assassination matter?......................................................... 188
5.2 Literature Review and Theory ......................................................................................... 191
5.3 Data and Methodology ...................................................................................................... 196
5.4 Identification Strategy ...................................................................................................... 201
5.5 Extending the Analysis ...................................................................................................... 209
5.6 Conclusion and Caveats ................................................................................................... 211
6. Concluding Remarks ................................................................................................................. 227
6.1 Theme – I: What motivation govern the bahaviour of dynastic politicians? ............... 227
6.2 Theme – II: What facilitates the emrgence of poltical dynasties?................................. 233
6.3 Final Thought ..................................................................................................................... 240
Bibliography……………………………………………………………………………… ........... 241
Appendix…………………………………………………………………………………… ......... 258
7
List of Tables
Table 2.1A: Summary Statistics for MPs in the 9th National Parliament ......................................71
Table 2.1B: Summary Statistics for MPs in the 8th National Parliament.......................................72
Table 2.1C: Correlation between different dependent variables .....................................................73
Table 2.2: Base-Line Results.............................................................................................................74
Table 2.3A: Base-Line Results .............................................................................................................75
Table 2.3B: Base-Line Results .............................................................................................................76
Table 2.3C: Base-Line Results .............................................................................................................77
Table 2.4: Is the Effect Causal? ........................................................................................................78
Table 2.5A: Is the Effect Causal? ........................................................................................................79
Table 2.5B: Is the Effect Causal? ........................................................................................................80
Table 2.5C: Is the Effect Causal? ........................................................................................................81
Table 2.6: Legislator's in Government.............................................................................................82
Table 2.7: Key Dynasties are Excluded............................................................................................83
Table 3.1: Country List and Dynasty Index ..................................................................................123
Table 3.2A: Correlation coefficients between different measures of corruption..........................128
Table 3.2B: Summary statistics for the dependent variables .........................................................128
Table 3.3A: Re-examining Treisman (2000) findings......................................................................129
Table 3.3B: Re-examining Treisman (2000) findings ......................................................................131
Table 3.4A: Base-Line Regressions ...................................................................................................133
Table 3.4B: Base-Line Regressions ..................................................................................................134
Table 3.4C: Base-Line Regressions ...................................................................................................135
Table 3.5A: Role of Immediate Succession.......................................................................................136
Table 3.5B: Role of Immediate Succession .......................................................................................137
Table 3.5C: Heterogeneous Nature of Immediate Succession ........................................................138
Table 3.6: Role of Political Competition ........................................................................................140
Table 3.7A: Robustness Checks.........................................................................................................142
Table 3.7B: Robustness Checks for Immediate Succession ............................................................143
8
Table 4.1: Summary Statistics ........................................................................................................177
Table 4.2: Base-Line Results...........................................................................................................178
Table 4.3: Robustness Checks.........................................................................................................179
Table 4.4: Summary Statistics for Leaders with at least one Assassination Attempt ...............180
Table 4.5: Conducting pair-wise t-test to see group similarity....................................................181
Table 4.6: Testing Identification Assumption ...............................................................................182
Table 4.7: Are Assassination attempts mutually explosive? .........................................................183
Table 4.8: Does Assassination Facilitate Emergence of Political Dynasties? ..............................184
Table 4.9: Robustness Checks..........................................................................................................185
Table 4.10: Further Robustness ChecksRole of Immediate Succession ........................................186
Table 5.1: Base-Line Results............................................................................................................218
Table 5.2: Robustness Checks..........................................................................................................219
Table 5.3: Conducting pair-wise t-test to see group similarity.....................................................220
Table 5.4: Testing the Identification Assumption..........................................................................221
Table 5.5: Are assassination attempts mutually exclusive? ..........................................................222
Table 5.6: Identifying causal effect of political assassination .......................................................223
Table 5.7: Robustness Checks..........................................................................................................224
Table 5.8: Heterogeneous Nature of Dynastic Succession.............................................................225
Table 5.9: Is it a ‘Dying in Office’ Phenomenon? ..........................................................................226
9
List of Figures
Figure 2.1A: Composition of the 9th National ParliamentBy Dynastic Identity .........................69
Figure 2.1B: Composition of the 9th National Parliament By Number of Times MP ................69
Figure 2.1C: Composition of the 9th National Parliament By Profession....................................69
Figure 2.2A: Composition of the 8th National Parliament By Dynastic Identity ........................70
Figure 2.2B: Composition of the 8th National Parliament By Number of Times MP ................70
Figure 2.2C: Composition of the 8th National Parliament By Profession....................................70
Figure 3.1: Scatter Plot.......................................................................................................................127
Figure 4.1: Spatial Distribution of Dynastic Leaders ......................................................................176
Figure 4.1: Spatial Distribution of of Assassination Attempts and SuccessfulAssassinations in Post 1971 period ....................................................................................................176
Figure 5.1: Spatial Distribution of Dynastic Leadersand Assassinated Leaders for 65Countries..............................................................................................................................................214
List of Boxes
Box 2.1: Political Parties in the 9th National Parliament and the familyconnections of their Chairpersons.......................................................................................................67
Box 2.2: Low Attendance Records ......................................................................................................68
Box 2.3: Boycott of Parliament By Opposition Parties .....................................................................68
Box 4.1: Description of Families producing Three Generations of Leaders .................................174
Box 4.2: Politicians from the Sheikh Dynasty and their encounters with AssassinationAttempts...............................................................................................................................................175
Box 5.1: List of Assassinated Leaders Post 1950 from 65 Countries .............................................215
Box 5.2: Death in Office of National Leaders due to Natural Causes or Accidents Post1950.......................................................................................................................................................216
10
List of Maps
Map 2.1: Bangladesh ............................................................................................................................84
Map 2.2: Divisions of Bangladesh........................................................................................................85
\
11
1. Introduction
1.1 Why understand the dynamics surrounding political dynasties?
This thesis is about political dynasties. Yet, it is not about who they were, or how they have
influenced their respective political landscapes. While they are important historical questions on
their own, this scrutiny is about the motivations that govern the political life of dynastic leaders.
It’s also about the factors that have facilitated the emergence of political dynasties in diverse
political arenas. Political dynasties exist and have existed across both time and space in various
forms and degrees. At present, more than one-third of the world population entertains political
landscapes where dynastic politicians play a pivotal role in political decision making.1 From
polities governed by monarchies to authoritarian format of government, and from consolidated
democracies to volatile states, dynastic leaders have exerted their influence in almost all types of
polities.2Until now, within the discipline of political economy, there is a dearth of empirical
research on outcomes related to this particular socio-political phenomenon, and factors that have
facilitated the emergence of political dynasties. The main concern over political dynasties is that
it reflects inequality in the distribution of political power (Dal bo et al, 2009), and equilibrium
policies and institutions in a given polity is often a product of preference of groups with greater
political power (Acemoglu and Robinson, 2008). In addition, in recent times there is a growing
recognition that inequality in the distribution of political power can sow harmful seeds for long-
run development paths of economies (Acemoglu et al, 2008; Ferraz and Finan, 2010). This
makes it imperative to understand why such politically powerful groups emerge, and what exact
motivations shape their behaviour. More specifically, does the presence of political dynasties
merely reflect inequality in the distribution of political talent? In other word, do political
dynasties exist because some political families entertain relatively higher level of ability than
others? Or, is it also a product of idiosyncrasies associated with certain political events?
On this mentioned issue, classic elite theorist, such as Mosca (1966[1896]), argued that enduring
inequalities in political attainment can reflect hereditary inequalities in talent, which may have
beneficial consequences for citizens. In contrast, Dal bo et al (2009) points out that positive
1Chapter-3 provides a discussion about how political dynasties prevail at the national level across alarge set of countries.
2From the Gandhis in India, Bhuttos of Pakistan, Gloria Macapagal’s family in the Philippines,Duvalier family in Haiti, to the Bush family in United States, influential political dynasties exist in thepolitical arena of various countries in different forms and degree.
12
shocks to political power have persistent effects by facilitating de facto inheritance of political
positions. Besides, some reservations also exist concerning the effects of ‘dynastic identity’ on a
political leader’s behaviour in his or her respective political domain (Asaka et al. 2010)
Even if one casually reviews some cases of political dynasties across the globe, the opinion is
mixed. For example, in Burma, Aung San Suu Kyi – the daughter of the assassinated
revolutionary leader Aung San – has epitomized the movement for attaining democratic rights
for more than two decades (Wintle, 2007). On the other hand, the Bhutto dynasty of Pakistan,
which has produced three executive head of the state, has been accused of corruption and misuse
of power in both domestic and international media.3 On the role of a dynasty in changing
economic fortunes of a country, the Lee dynasty is often credited for the economic rise of
Singapore (Ghesquiere, 2006). Alternatively, Kim dynasty’s six decades of authoritarian rule of
North Korea has probably influenced its economic and humanitarian demise (Martin, 2004).
Thus, in this thesis, I address two important inquiries on political dynasties. First, given that
dynastic leaders are associated with diverse socio-economic outcomes, it is pertinent to ask: what
governs the motivations of dynastic politicians? The question, in effect, intends to disentangle
the possible incentives that can determine the behaviour of dynastic politicians, and verify
empirically the outcomes that are associated with the presence of political dynasties. Second, as
political dynasties have emerged in diverse political landscapes, the research aims to pinpoint the
factors that can facilitate the rise of political dynasties. In doing so, it analyses a specific political
event – political assassinations –to understand its effects on the composition of political class by
shaping the emergence of important political families.
Hence, to provide insights on the above mentioned issues, the thesis embodies two themes.
Theme-I presents papers that helps understand the motivations that govern the behaviour of
dynastic politicians. It undertakes two empirical investigations of the stated topic, both at the
‘sub-national’ and ‘cross-country’ levels. The work “Motivations of Dynastic Leaders: An
Empirical Investigation from Bangladesh” analyses the behaviour of dynastic parliamentarians
within the political realm of Bangladesh to see if they relatively work or shirk more in
comparison to non-dynastic parliamentarians. More explicitly, the paper studies parliamentary
3 For example, see: http://www.independent.co.uk/news/world/fall-from-grace-marks-the-last-hurrah-of-the-bhutto-dynasty-1350942.html

13
attendance records4 for the 8th and 9th National Parliament to point out if a leader’s dynastic
identity had any capacity in explaining its variation across parliamentarians. Furthermore, if any
notable relationship is identified between the variables of interest, then it will help isolate the
motivations that govern the behaviour of dynastic politicians. The paper “Corruption and
Dynasty Politics” investigates if there is a systematic relationship between dynasty-politics and
corruption in a cross-country empirical analysis. This is undertaken with the help of a dynasty
index, which is created by looking at the political history from 1950 to 2010, for a large cross-
section of countries. The purpose is to quantify the variation in the degree of dynasty-politics that
exists across different countries.5 Likewise, if any significant association is detected, then it will
offer some understanding about how dynastic politicians behave in their respective polities.
In Theme-II, two empirical examinations are provided, which try to identify factors that assist
the emergence of political dynasties. The paper “The Composition of Political Class in
Bangladesh: The Role of Assassinations” attempts to identify if assassinations of domestic
politicians have helped political dynasties to emerge and endure. As a result, the paper
documents the biographies of more than 500 leaders who were elected (at least once) to the
office of a Member of Parliament in the 8th or 9th National Parliament. The aim is to see if
dynastic descendants of assassinated political leaders are associated with a higher likelihood of
continuing a political dynasty. To address concerns on the causal role of assassination, the study
constructs an unique data set of political leaders with at least one assassination attempt to see if
those who died in comparison to those who barely survived have a higher likelihood of starting a
political dynasty. The paper “Assassinations and Political Dynasties” studies at a cross-country
level if political assassinations have fuelled the rise of dynastic leaders. To this end, the research
uses biographical data on 442 national leaders from 65 countries who have ruled (at least once)
as an executive head of their respective country in post 1950 period. The objective is to see if
assassination of a national leader is associated with a higher likelihood that a leader will start or
continue a political dynasty. In addition, to identify the possible causal effects of assassinations,
the paper employs the identification strategy and the data set of Jones and Olken (2009) to see if
political assassinations abet the rise of dynastic leaders across countries.
4 Other measures of legislator behaviour are also studied to address the mentioned question.
5 The paper borrows the data set from Treisman (2000) which undertakes a cross country analysis tolocate the possible determinants of corruption.
14
Overall, the four papers address inquiries on political dynasties at both cross-country and sub-
national level. This allows one to check whether a similar message on the addressed questions
emerge from both these settings. The thesis also employs five crucial data sets, out of which
three are compiled for undertaking this research, and two are used from the analysis of Treisman
(2000) and Jones and Olken (2009). Consequently, any consistency within the findings across all
the employed data sets will only minimize the risk that the key inferences I derive are sensitive to
a specific data set being used. In addition to this, given that the thesis solely relies on empirical
investigations of political dynasties, the findings will give key insights for future theoretical
developments on political dynasties, and will direct towards avenues where further empirical
examinations are desired.
In the next section, I render further discussion on the two principle questions that are examined
in the thesis. This is followed by basic findings that emerge from the four papers within the
mentioned themes. Lastly, section 1.6 provides an outline of the overall thesis.
1.2 What motivation governs the behaviour of dynastic politicians?
In traditional political economy, the assumption that political actors are driven by self-interest
has been well acknowledged. This approach, nonetheless, implicitly assumes that political actors
behave in a similar fashion, under certain institutional arrangements, no matter who they are or
what is their identity. In contemporary times, however, empirical literature in political economy
has taken some interest in isolating the role of leader-identity in determining the behaviour of
policymakers. For instance, Rehavi (2007) employs close election to pinpoint that women’s
representation affects policy formulation in U.S’s state legislatures. It is also reflected in the
findings of Chattopadhyay and Duflo (2004), which examines two Indian states – Rajasthan and
West Bengal. The authors highlight that the kind of issues favoured by women get more attention
when women leaders are selected. Likewise, Pande (2003) shows that reservation for scheduled
tribes and scheduled castes at the state level in India affected policies towards these groups. More
recently, Asaka et al (2010) studies the role of dynastic identity in influencing the behaviour of
dynastic legislators in Japan Diet between 1997 and 2007, and it finds that dynastic candidates
enjoy a higher probability of winning and larger vote share in comparison to non-dynastic
candidates. Besides, it also pinpoints that fiscal transfers initiated by dynastic politicians do not
necessarily result in higher economic performance. Thus, given that there is some support for the
15
idea that identity can matter, it remains interesting to ask: can a political leader’s dynastic
identity influence his or her behaviour?
To throw light on the question raised above, the thesis proposes that to understand the behaviour
of dynastic politicians, it is useful to assume that they have in their objective function a goal to
initiate a dynastic succession. That is, dynastic politicians aspire that their dynasty endures within
their respective political realm. If this holds true, then dynastic politicians will account for all
future consequences of their action on their welfare, and the likelihood that they will facilitate a
dynastic succession. Hence, this additional objective of dynastic politicians to ensure that their
dynasty endures can change their behaviour from others. This, in contrast, raises the question that
if dynastic politicians are affected by their desire of a future dynastic succession, then why will
non-dynastic politicians act otherwise, since they too can desire that their family will inherit their
political position.
A possible reason why this might not be the case is because dynastic politicians often enjoy two
issues - campaign advantage and brand-name advantage, as noted in Laband and Lentz (1985)
and Feinstein (2010). The former stems from the two particular factors – inherited human capital
and inherited financial capital. To be precise, inherited human capital refers to the familiarity a
dynastic politician has with key people in important positions within the party. This ‘connection’
is inherited due to his or her family’s long exposure to politics. This can also allow the dynastic
politician to ensure his or her potential dynastic successor is ‘picked up’ for lower level positions,
so that such political experience and exposure allows the potential dynastic successor to succeed
his or her dynastic parents electorally. For example, Sonia Gandhi – President of Indian National
Congress – facilitated her son Rahul Gandhi’s political career (after her alliance’s electoral
victory in 2004) by giving him the charge of the Youth Congress and the National Students
Union of India as part of the party’s reshuffle program in 2007. This raised speculation that such
a move was undertaken to ensure the political continuity of the Nehru-Gandhi dynasty in the
national political domain of India.6Even in non-democratic countries, such dynastic political
apprenticeship is often witnessed. The late Kim Jong-il ensured that his Kim Jong-un eventually
succeeds him by appointing him to the post of Vice Chairman of the Central Military
Commission in 2010. This dynastic appointment to the key military position is also speculated to
6For more recent developments on Rahul Gandhi’s political career, see:http://timesofindia.indiatimes.com/topic/Rahul-Gandhi; The example only casually supports thementioned political strategy, and no causal inference can be deduced from this discussion.

16
have facilitated the process that guided Kim Jong-un succession to the post of the ‘Supreme
Leader of North Korea’ after the demise of his father.7
Inherited financial capital refers, in essence, to the pre-established donor networks, which are
often available to the potential heir of a dynastic leader. Such network can make electoral
competition less costly for dynastic entrants in comparison to non-dynastic politicians. This
family connection allows second generation political leaders to reap the financial network that
the first generation political sowed. The Bush Family in United States, for example, created a
fundraising milestone during George W Bush’s two Presidential campaigns in 2000 & 2004.
More specifically, during his campaign for Republican Party Presidential nomination in 2000, he
acquired unprecedented funding which could have facilitated his eventual victory against the
twelve other contenders.8 It is also argued that the name recognition and political connection of
the Bush family allowed him to emerge as the early front-runner, even though veteran political
candidates such as John McCain were in the nomination race.9
Brand-name advantage, on the other hand, is determined by voters, who might have an additional
preference for dynastic candidates due to their family’s goodwill in their respective political
arena. Such an advantage emerges out of voter’s expressed preference for political legacies of a
dynasty, irrespective of the observable differences in leader quality between dynastic and non-
dynastic politicians. This concept is also suggestive that dynastic politicians can enjoy family
advantages beyond the human capital and financial advantage, as voters simply favour a name
that they recognize due to its association with important political events. In United States, for
example, Feinstein (2010) shows that for all open seat House contest between 1994 and 2006,
dynastic politician entertain significant “brand name advantage”. Moreover, this advantage
provides them a considerable edge over comparable non-dynastic opponents. Likewise, empirical
evidence from 1983 Congress of Argentina is indicative that legislators with longer tenure in
office have a higher of having posterior relative in office. This dynastic transmission of political
7 For more information, see: http://www.bloomberg.com/news/2011-12-19/north-korea-signals-kim-jong-un-succession-as-south-calls-police-for-duty.html
8For more information on George W Bush, see:http://www.encyclopedia.com/topic/George_Walker_Bush.aspx#2
9For more information on John McCain, see:http://www.biography.com/people/john-mccain-9542249?page=1
17
power is particularly aided by the fact that long tenure in office allows legislators to accumulate
assets in the form of name recognition (Rossi, 2010).
Cumulatively, both these factors can reduce the effort that is required by dynastic politicians to
promote a dynastic succession in comparison to the effort that is required by politicians who are
attempting to initiate their own dynasty. Additionally, political dynasties are often the outcomes
of historical events (like political assassinations10) which are difficult to replicate for individuals
attempting to start their own dynasty. This, at least, makes it pragmatic to argue that dynastic
politicians are likely to entertain some kind of political capital11 that is unique to them, and often
difficult to acquire over a short course of time.
Assuming that dynastic politicians are partially motivated by the desire to promote a dynastic
succession, the relationship between a legislator’s dynastic identity and his or her behaviour in
the political arena is (still) theoretically not clear. This is because their decision-making process
is likely to be affected by two opposing incentives. I call this the Reputation-Building incentive
and the Stockpiling-Wealth incentive. Reputation-Building incentive implies that when members
of political dynasties are in office, they will use this opportunity to build a positive reputation for
their family. In other words, they will abstain from behaviours that decrease their family’s
goodwill, as much as possible. This will allow them to signal voters that their family embraces a
vocation for public interest. Therefore, if dynastic politicians succeed in creating a positive
reputation for their family, then dynastic successions have a greater likelihood of being seen
legitimate and acceptable. As a result, if this line of reasoning holds, then one will expect
legislator with dynastic identity to be more benign in comparison to legislator of non-dynastic
identity.12
10 This issue is thoroughly addressed in Chapter-4 and Chapter-5 of the thesis.
11 This notion finds some support in recent empirical findings of Del Bo et al (2009). The authors arguethat political dynasties may entertain higher level of political capital (in the form of contacts with partymachineries and name recognition) which allows them to endure in their respective political arena. Inline with this, a recent model developed by Asaka et al (2010) to predict the behaviour of dynasticlegislators assumes that dynastic legislators have a higher bargaining advantage, since they are likelyto inherit personal ties with other key political figures, bureaucrats and special interest groups.
12In other words, if political positions are transferable from politicians to politician’s children, then thelast period enforcement problem (i.e. how one restricts politicians from shirking in the last period) issomewhat mitigated.
18
On the contrary, stockpiling-wealth incentive proposes that while dynastic politicians are in
office they will be tempted to amass a fortune so that their future generation can inherit their
political position on the basis of their financial and political capital. This, in essence, means that
dynastic politicians will appoint their preferred people in key positions in the government and
bureaucracy, and in the process accumulate financial and political capital so that the dynastic
succession is as smooth as possible. Now, if this incentive is strong then we will expect dynastic
politicians to have a greater tendency to misuse their authority (while they are in office) so that
they can promote a dynastic succession in their respective political arena. Similarly, a dynastic
politician often benefits from campaign advantage – that is a product of pre-established donor
network, which can make electoral competition less costly in comparison to a non-dynastic
legislator. Likewise, dynastic leaders can also enjoy brand-name advantage – that results from
additional electoral preference for politicians from certain family. Furthermore, both these factors
are likely to create barriers to entry for potential non-dynastic challenger. This, in theory, means
that incumbent dynastic politicians with inherited political capital can find it in their self-interest
to shirk more since it is relatively difficult for potential non-dynastic politicians to compete them
out of office. A very similar argument is discussed in Lott, (1986; 1987a & 1987b). The noted
papers argue that long exposure to political power creates a brand-name for an incumbent, which
is often non-transferable in nature. This brand name can produce greater popular support for
incumbent politicians who care about both “net-support” and “commission” that he or she
receives for transferring wealth. This additional level of support for politicians with brand-names
generates barriers to entry for potentially more competent entrants with no brand-names. As a
result, this can mean that that incumbent dynastic politician with brand-names can find it easier
to remain in office by restricting entrants even when there exists, more efficient, less recognised
candidate. Consequently, dynastic identity among politicians can promote more shirking as they
face lower levels of competition from their rival candidates.
The mentioned discussion, however, leaves some questions unanswered. To be specific, as stated
above, dynasty identity can either promote goodwill enhancing or asset accumulating mind-set,
as they are motivated by their desire to facilitate future dynastic succession. Yet, what is a
‘good-will’ enhancing or depleting behaviour in politics? Can such behaviour vary in nature
across countries? If so, what determines its variation? More importantly, if the tolerance of
“goodwill depleting act” varies across electoral populace of different polities, than can we infer
anything about the motivation of politician? For example, given extra-marital affairs of national
politicians are received with different intensity across nations, can we infer politicians involved

19
in such acts are not motivated to serve public interest?13While answering these questions at
length is not within the scope of this study, one can make some specific inferences with caution.
First, not all observable “goodwill depleting/enhancing” behaviour carries information about a
leader’s dedication to public cause. Second, while personal acts – such as sex scandals – might
have limited information about a leader’s commitment to public interest, actions which are
‘illegal as per the law of the land’ are more likely to carry information about a political leader’s
general respect for rule of law in his or her respective countries. As a result, while undertaking an
empirical analysis to understand the motivation of dynastic leaders, we need to observe a
phenomenon or behaviour that (i) varies across countries/leaders, (ii) carries information about
the motivation of political leaders, so that one can infer something about the role of dynastic
identity.
Thus, while conducting a cross-country analysis, I observe whether countries that were under
significant influence of political dynasties are perceived to be more or less corrupt.14 This focus
on corruption perception is important because, while the political action that is considered to be
corrupt might vary across countries, the perception that corruption involves political leaders
getting involved in an illegal conduct under the law of the land is almost universal by definition.
Therefore, if long exposure to dynastic rule at the national level is associated with higher levels
of perceived corruption across countries, then it is possible to pragmatically deduce that that there
is limited or no evidence in support of the idea that dynastic leaders are motivated by reputation-
building incentive.
On the other hand, to employ a sub-national scrutiny, a more direct measure of leader behaviour
is observed. To be specific, I see whether a legislator’s involvement in general legislative process
is determined by his or her dynastic identity. In addition, the study also checks if such identity
predicts the criminal profile of a legislator. The choice of these two criteria for examination is
influenced by two important rational. One, given that the sub-national analysis is done for the
legislators in Bangladesh, examining these dimensions allows the analysis to closely relate to the
theoretical discussion on dynastic identity’s possible role is shaping legislator behaviour. Two,
13John F Kennedy is acclaimed to be one of the most popular Presidents of United States. There are,however, many controversies that undermined his political life. For more discussion on this issue, see:Hersh (1997).
14 Corruption is defined as the misuse of public office for personal gains. For more information,see:Rose-Ackerman (2004).
20
since such measures are objective in construction, there is little room for measurement error to
affect our estimates.
Overall, as the discussion above points out, the net effect of dynastic identity on a leader’s
behaviour is ambiguous, as reputation-building and stockpiling-wealth incentive work in opposite
direction. Thus, the undertaken empirical examinations embody an effort to understand two
important issues: (i) Whether dynastic identity at all matters in shaping leader behaviour? (ii)
Which incentive on average dominates the behaviour of dynastic politicians?
1.3 What facilitates the emergence of political dynasties?
As noted earlier, influential political dynasties have emerged in almost all format of government.
Their presence and often long endurance is an enigma in political science. For example, what
unique factors allowed the Nehru-Gandhi Dynasty of India to produce five head of Indian
National Congress and three former Prime Ministers of India are still not clear.15 In United States
Congress, the Breckinridge dynasty has almost endured for two centuries (1789-1978), and has
produced 17 congressmen (Dal Bo et al, 2009). All this, and many other numerous cases, makes
it imperative to analyse and pinpoint some causative factors that can influence the rise of
dynastic politicians. On this, some qualitative investigations have isolated the forces that have
allowed political dynasties to emerge across countries. For instance, Ritcher (1990) and Mark R.
Thompson (2002) provide a comparative analysis to understand the rise of female dynastic
leaderships in South and Southeast Asia. The authors note that ‘martyrdom’ of their political
male counterpart (father or husband) has played a pivotal role in making them a symbol of
opposition struggle against autocratic regimes, and thereby promoting their emergence in their
respective political landscapes. On the role of certain political precedents and conditions,
Brownlee (2007) provides an insightful investigation of hereditary successions in modern
autocracies. More specifically, the research shows that whether elites will assist dynastic
succession depends on the precedent for leadership selection. That is, where rulers are predated
by parties, surrounding political elites will defer to the party as the recognized arbiter of
succession. Alternatively, where rulers predate their parties and political elites lack an
established precedent for an orderly transfer of power, hereditary succession offers a focal point
for reducing uncertainty, achieving consensus, and forestalling a power vacuum.
15 For more information, see: http://www.aicc.org.in/new/
21
Micro-level qualitative work on dynasty politics also exist, which tries to identify the conditions
in which dynastic successions are more likely. For example, Sidel (2004) in his comparative
analysis of ‘bossism” argues that, in Philippines, when the structure of the state apparatus allows
local leaders to enjoy monopolistic control over a state’s resources, and when such monopolistic
control is used by the leader to construct a solid base in propriety wealth outside the realm of the
state intervention, then a dynastic succession in local leadership is easier to implement. The
importance of propriety wealth in shaping political outcomes has also received some validation
in empirical research. For instance, Rossi (2011) uses an unique land experiment that occurred
during the foundation of Buenos Aires to understand the effects of exogenous change in wealth
on posterior political success. The paper examines if the distance of randomly allotted land to
Buenos Aires predicts the posterior political success of the land recipient families. The findings
of the study are suggestive that families who received land closer to Buenos Aires have a higher
likelihood of achieving political office, since such land were of more economic value. This
analysis also allowed the author to offer insights on how certain families got political
representation on the first place.
Empirical scrutiny of political dynasties also tries to pinpoint factors that facilitate the emergence
and endurance of political dynasties. Being specific, Dal Bo et al (2009) in its investigation of
political dynasties in U.S Congress, show that political power is self-perpetuating in nature. That
is, by comparing outcomes of close elections the study shows that holding power longer
increases the likelihood that one’s heirs attain political office in the future in spite of their
individual or family characteristics. The study also identifies that dynastic legislators are less
common in more politically competitive states. This, as argued by the authors, indicate that
dynastic legislators may rely on their familiarity with political machineries (in the form contacts
with party elites ant etc) to secure political positions in states where party safely controls the
political authority. Similarly, Querubin (2010) empirically examines the evolution of political
dynasties in the Congress of Philippines and identifies that non-dynastic candidates who win
their first election by narrow margin are four times more likely to have posterior relative in office
in comparison to those who lost their first election my a thin margin and never serve.
Additionally, evidence from 1983 Congress of Argentina is also suggestive that legislators with
longer tenure in office have a higher likelihood of having posterior relative in office (Rossi,
2010).
22
Taken as a whole, the discussed findings are indicative that positive exogenous shocks to a
leader’s time in power have persistent effects by facilitating the possibility of future dynastic
succession. Consequently, this paper contributes to the overall inquiry by looking at the role of
specific political events – political assassinations – in facilitating the emergence of political
dynasties. This specific focus on the causal role of political assassination is interesting because it
studies the effect of negative exogenous shock to a leader’s life on the likelihood of shaping
posterior dynastic attainment. Furthermore, given numerous national dynastic leaders across the
globe are descendants of assassinated politicians16, an empirical examination will allow us to
identify whether on average assassinations have a causal role in facilitating dynasty formation in
a given polity.
Nonetheless, as pointed out in details in the respective papers, identifying if political
assassination contributes towards the possibility that a leader will start a political dynasty is both
theoretically and empirically difficult. This is because assassination can hinder or facilitate the
likelihood that a leader will start a political dynasty, since the effect of political assassination
depends on two opposing forces. I call this the martyrdom-effect and the disruption-effect. The
martyrdom-effect suggests that political assassination can often create a martyr out of the
assassinated leader, and this can act as a political asset for the victim’s family for facilitating
dynastic successions.Conversely, the disruption-effect suggests that assassination might disrupt
the injection of dynastic successors into the political stream as the violent incident-the
assassination of the leader- might discourage potential biological heir from taking up political
life. Therefore, this theoretical ambiguity concerning the possible effects of assassination makes
it insightful to understand the net effect of political assassination on political dynasties.
The empirical difficultly of isolating the effects of assassination on the likelihood that a political
leader will start or continue a political dynasty stems from the scenario that the estimations might
suffer from individual heterogeneity. That is, political leaders with individual characteristics (like
charisma and etc) that are conducive to dynasty formation might attract assassination attempt. As
a result, to isolate the impact of assassinations, the papers employ a unique identification strategy
used in Jones and Olken (2009). More specifically, the paper compares leaders who barely
16 Additionally, some qualitative analysis (ex- Ritcher, 1990; Thompson, 2002) do argue thatassassination did in fact have facilitate the rise of female dynastic leader.
23
survived an assassination attempt in comparison to leaders who died to understand the role of
successful assassination in facilitating the rise of political dynasties.17
In the next two sections, I elaborate in details the empirical investigations undertaken in the four
papers. This is done with the objective to shed some light on these two essential questions on
political dynasties.
1.4 Theme-I
In this section, I present brief summaries of the papers on the motivational dynamics of dynastic
politicians. The empirical investigations aim to pinpoint if a leader’s ‘dynastic’ identity
determines his or her behaviour in a given polity, and highlight the social outcomes that are
associated with the prevalence of dynasty politics across countries.
1.4.1Motivations of Dynastic Leaders: An Empirical Investigation from
Bangladesh
This paper studies whether the motivations of dynastic leaders18 are similar or different from the
motivations of non-dynastic political leaders. In doing so, the paper examines the behaviour of
Member of Parliaments (MPs) from the 8th and 9th National Parliament19of Bangladesh to see if
‘dynastic-identity’ has any role in determining the level of shirking a parliamentarian exhibits.
Bangladesh provides an ideal case for this scrutiny for three reasons. First, in both 8th and the 9th
National Parliament, dynastic legislators occupy more than one sixth of the parliament. This is
complemented by the fact that the two key parties (Awami League [AL] and Bangladesh
Nationalist Party [BNP]) are led by two dynastic politicians (namely Sheikh Hasina Wajed and
Khaleda Zia). Second, individual level characteristics and political biographies of
parliamentarians are readily available. Third, almost all work on legislator behaviour primarily
focuses on North America, South America and Europe as their venue for investigation. Thus, by
17This empirical strategy is dependent on the identification assumption that conditional on trying to killa leader, whether a leader survives the assassination attempt or dies in it is a product of pure chance(For more information on this identification strategy, pleaser review the paper (Jones and Olken, 2009).
18 A leader is categorized as dynastic (Pre-Relative=1) if he is related to a past or present legislator whoentered office before him.
19 The 8th National Parliament is referring to government that was in office between 2001-06. The 9th
National Parliament is referring to the incumbent government, which was elected to office on the 29th
December, 2008.
24
focusing on Bangladesh, a new territory is opened for testing some of the findings that emerge
from the literature.
The paper starts by summarising the literature on political dynasties, and how it relates to the
body of work on political shirking. It highlights that existing work on ‘political shirking’ have
primarily focused on institutions, and how they change political behaviour. As a result, this work
contributes to this stream by examining the role of legislator identity in determining political
behaviour. This is done with the help of new data sets on all parliamentarians in the 8th and 9th
National Parliament of Bangladesh. To measure legislator behaviour, three measures are
constructed. The principal variable is the Parl-Attendance-Ratio which measures a
parliamentarian’s general involvement with the daily legislative business. For the 8th National
Parliament, the attendance ratio is computed by dividing the number of parliamentary days
attended by the number of days a legislator can attend in all 23 sessions. Moreover, for the 9th
National Parliament, the ratio is computed by repeating the same procedure for first five sessions
(given that this parliament is still in progress).20 This makes a score of one reflect that a
parliamentarian has not been absent for a single day in the parliament. For legislators in the 9th
National Parliament, it also computes two additional dependent binary variables Legal-Charges
and Corruption-Charges, which are equal to one if they have such charges before they contested
the 9th parliamentary elections. This is done with the intention to shed some light on a
parliamentarian’s criminal profile, and see if a legislator’s dynastic identity has any role in
predicting its variation.
Additionally, the base-line results indicate that dynastic legislators in 8th National Parliament one
average have lower levels of attendance. In terms of magnitude, the relevant coefficients are
indicative that offspring of past legislators on average have at least 6.5 percentage point lower
attendance than non-dynastic legislators. This relationship is robust for multiple changes and
restrictions to the key specification. Besides, the association of dynastic identity is particularly
strong when the analysis solely focuses on legislators from the incumbent party in the 8th
National Parliament. This relationship, however, is not significant for legislators in the 9th
National Parliament. Likewise, a legislator’s dynastic identity also fails to predict whether he
faced a legal or corruption charge before participating in the 9th National Parliament. On the
relevance of other factors, the study shows that a legislator’s experience is associated with lower
20This information is collected from the Legal Office of the National Parliament of Bangladesh.
25
levels of attendance. This is echoed in the contemporary findings of Besley et al (2011), which
notes that more experienced legislators in the British House of Commons tend to have lower
levels of attendance. Overall, the results provide some support to the idea that a legislator’s
dynastic identity can influence his or her behaviour, even though it only finds support from the
data set of the 8th National Parliament.
If one, now, views the key findings in light of the possible incentives that can affect a dynastic
politician’s behaviour, the results are difficult to square with the reputation-building hypothesis.
That is, the estimations fail to portray dynastic politicians as relatively more benign in
comparison to non-dynastic politicians, when they are solely judged by their general involvement
in everyday legislative business. This message is also, to an extent, in line with the recent
empirical evidence from Japan, which shows that dynastic legislators lower the rate of growth
enjoyed by Japanese municipalities (Asaka et al, 2010). Lastly, the paper acknowledges that by
solely focusing on a legislator parliamentary attendance and criminal profile, the evaluation of a
legislator’s motivation suffers from narrowness in scope.
1.4.3 Corruption and Dynasty Politics
The second paper focuses on the social outcomes associated with the prevalence of dynasty
politics across countries. In particular, this paper tries to pinpoint if there is a systematic
relationship between corruption and dynasty-politics. Corruption, defined as the misuse of public
office for personal gains, exists in diverse political arenas in different degrees. It has also been
blamed for the unimpressive performance of certain “developing” countries, and empirical
research supports the hypothesis that there is a link between higher perceived corruption and
lower investment and growth (Mauro 1995; World Bank 1997). It is, therefore, pertinent to
understand the factors that make some polities more corrupt than others. Moreover, scrutinizing
the possible link between the prevalence of influential political dynasties and the level of
corruption is imperative because political dynasties reflect inequality in the distribution of
political power. As a result, such a political phenomenon is likely to have some impact on certain
dimensions of governance (namely corruption) in a given political landscape. This motivates this
paper to focus on a specific question: can the prevalence of dynasty politics help explain the
variation in the level of perceived corruption across countries?
26
To address the above stated query, this paper builds on the data set used in Treisman (2000)
which finds six key determinants of corruption.21 The paper extends the data set by including
more countries, and uses more contemporary measures of perceived corruption. It is found that
some of the identified determinants of corruptions maintain their strong predictive capacity on a
larger data set. That is, for more than one hundred countries - protestant tradition, economic
development and long exposure to democracy explain significantly the variation in the level of
perceived corruption. Furthermore, in order to shed insights on the central question, the paper
constructs multiple dynasty indices to measure the variation in the prevalence of dynasty politics
across countries. The analysis starts by computing a dynasty-index DI which measures the
variation in the degree of dynasty-politics by examining each country’s exposure to members of
political dynasties in state power in last six decades. It then uses this measure to identify if
dynasty-politics helps explain the variation of corruption across countries. And, the key findings
suggest that there is a ‘weak’ correlation between dynasty-politics and corruption. In essence, it
notes that a higher degree of dynasty-politics is associated with a higher level of (perceived)
corruption. This correlation is, however, pointed out as ‘weak’ since it is only significant when
the sample is restricted by excluding monarchies and Singapore from the estimations.22
The paper also investigates a special kind of phenomenon associated with dynasty-politics –
immediate dynastic succession. The estimations show that countries with immediate dynastic
succession in their top political office are on average associated with higher levels of corruption.
This association remains strong and survives multiple robustness checks. The paper studies this
particular phenomenon (immediate dynastic succession) further by checking if any specific type
of immediate dynastic succession is associated with corruption. Additionally, the results pinpoint
that immediate dynastic successions following the assassinations of national leaders (example-
Indira Gandhi and Rajiv Gandhi of India) or immediate dynastic successions after the retirement
of national leaders (example- Nestor Kirchner and Cristina Kirchner) are the primary drivers of
the result.
To sum up, the paper supports the claim that countries with greater prevalence of political
dynasties are associated with higher levels of corruption, even though the relationship is not
21 Treisman (2000) pinpoints six key factors that helps explain the variation of corruption acrosscountries. These are, (I) Economic development, (II) Protestant tradition, (III) History of British rule(IV), Long exposure to democracy, (V) Federal States, and lastly (VI) Higher degree of openness.
22 This only results in a loss of three observations.
27
argued to be causal in any respect. This is because the results can suffer from endogeneity
stemming from both reverse causality and omitted factors. In other words, a higher degree of
corruption can itself allow national political leaders to start their dynasty by taking advantage of
the weak institutions due to corruption. Consequently, it is prudent to state that observed
evidence is basic. Nonetheless, the overall evidence provides motivation to investigate if in
future any causal inference merits this finding. Besides, given that higher prevalence of dynasty
politics is associated with higher levels of perceived corruption, the evidence fails to provide any
support for the reputation-building hypothesis. In other words, the cross country evidence
provides no strength to the idea that dynastic politicians with an additional objective to initiate
dynastic successions will devote their career to public interest so that it creates a reputational
capital which their offspring can inherit.
1.4.3 Key Message
The two papers collectively offer some empirical insights on the motivations of dynastic
politicians. The principle aim of the investigations in Theme-I is to see if dynastic identity has
any role in determining the behaviour of politicians. This is complemented through an inquiry of
socio-political phenomenon (in this case - corruption) that is associated with the prevalence of
dynasty politics across countries. The findings, taken together, suggest that dynastic identity can
make legislators relatively less benign, and on a cross-country level, the prevalence of dynasty
politics is associated with higher levels of corruption. In other words, the central message from
both these settings is consistent with a relatively ‘less-than-altruistic’ view of dynastic politicians
in comparison to non-dynastic politicians. These results are also difficult to square with the
reputation-building hypothesis, which suggests that dynastic politics will attempt to generate
goodwill to facilitate posterior dynastic attainment.
1.5 Theme-II
This section provides summaries of papers that investigate the factors that have facilitated the
rise of political dynasties. In particular, the papers look at political assassinations to see if such
events fuel the rise of dynastic leaders.
28
1.5.1 The Composition of Political Class in Bangladesh: The Role of
Assassinations
This paper examines if political assassinations across the political landscape have facilitated the
rise of political dynasties. Political assassination, which is generally defined as the murder of a
public figure, is often held responsible for disrupting state efficacy. However, what outcomes it
bears for the political class and the victim’s family is little scrutinized in political economy. More
specifically, it is interesting to examine if political assassinations ‘back-fire’ in the sense that it
re-imposes the moral authority of the deceased leader by making him a martyr. This later on (or
immediately) can be instrumental as a political asset for the victim’s family to initiate a dynastic
succession. Thus to identify the effects of political assassinations on the likelihood that a political
dynasty will emerge or endure, I investigate this specific relationship within the political
landscape of Bangladesh. In 1971, when Bangladesh emerged as a newly independent country,
the political and economic climate was volatile and political assassinations became a common
phenomenon within the political arena. The first president to suffer death in an assassination
attempt was Bangabandhu Sheikh Mujibur Rahman who is considered as the founding father of
the country.23 This was later followed by the assassination of President Zia ur Rahman in 1981 in
an aborted coup.24 Besides, qualitative analysis on the rise of female dynastic leadership in
South and Southeast Asia has argued that assassination of Bangabandhu Sheikh Mujibur Rahman
and Lt. General Zia ur Rahman is the triggering point in the rise of female dynastic leaders in
Bangladesh (Ritcher, 1990; Thompson, 2002).
As a result, to investigate this phenomenon, the paper employs two newly constructed data sets
to pinpoint if assassination on average facilitates the rise of political dynasties. The paper starts
by briefly scrutinizing the literature on the composition of political class with a specific focus on
political dynasties. This is followed by looking at studies on political identity, and the paper’s
broader contribution to the literature on political assassinations. In terms of the data sets, the
paper first uses a newly complied data set which constitutes biographical information on 536
leaders elected to the 8th or 9th National Parliament. The purpose is to isolate if dynastic
descendants of assassinated leaders or non-assassinated leaders are associated with a higher
23 For more information on Bangabandhu, see: http://www.rulers.org/indexr1.html#rahma
24For more information on Zia, see: http://www.rulers.org/indexr1.html#rahma

29
likelihood of having posterior relatives in office in comparison to leader who are non-dynastic.
Moreover, the baseline results show that both types of dynastic leaders (i.e. being descendant of
assassinated or non-assassinated leaders) matters for having relatives later in office. The findings
are also suggestive that the relationship is possibly stronger for descendants of assassinated
leaders.
It should be noted that the identification of a potential causal relationship between political
assassinations and the emergence of political dynasties is complicated. This is because political
traits, such as family connection, charisma, wealth or etc, which may allow leaders to facilitate
dynasty formation, can also in turn attract assassination attempts. That is individual heterogeneity
can determine the correlation that one witnesses between political assassination and dynasty
formation. Hence to address this issue, the paper employs an identification strategy used in Jones
and Olken (2009), which studies the effects of assassination on institutional transition and
intensity of war. The study suggests and supports that while assassination attempt on a national
leader is possibly endogenous, whether a leader barely survives or dies in attempt is a product of
chance. As a result, if one compares outcomes associated with leaders who barely survived an
assassination attempt with leaders who died, then the effects of political assassination can be
isolated. So, to employ this identification technique, this paper compiles a historical data set of
97 leaders from the political landscape of Bangladesh in post 1971 period who have faced at least
one serious assassination attempt on their life. Furthermore, the results show that the outcome of
an assassination attempt turns out to be factor in facilitating the likelihood that a leader will start
or continue a political dynasty. The coefficients indicate that successful assassination can
increase the likelihood of dynastic succession by 28 percentage point. This finding also remains
consistent when multiple robustness checks are performed.
On the whole, the empirical analysis is indicative that political assassinations in Bangladesh have
facilitated the de facto inheritance of political power. It is also in line with the idea that
martyrdom of assassinated leaders can play an instrumental role in facilitating dynastic
successions.
30
1.5.2 Assassinations and Political Dynasties
The fourth paper studies the role of political assassination in fuelling the emergence of political
dynasties across countries. In essence, it studies whether political assassinations across the globe
had a causal role in aiding the emergence of political dynasties through facilitating dynastic
successions at the highest executive political office. This is an interesting inquiry since political
assassinations of national leaders have often brought mixed fortunes for the victim’s family. To
be more specific, the assassination of Swedish Prime Minister Olof Palme in 1986 or Pakistani
Prime Minister Liaqat Ali Khan in 1951 have failed to trigger the rise of dynastic successors who
emerged as the executive head of the state for their respective countries. On the other hand, the
assassination of Philippines leader Benigno Aquino in 1983 or Sri Lankan Prime Minister
Bandaranaike in 1959 aided the rise of their widows as the premier of Philippines and Sri Lanka
respectively (Ritcher, 1990). Thus, a few important questions that follow are: does political
assassination on average increases the likelihood that a leader will start a political dynasty? If so,
are there conditions that make political assassination a triggering event for dynasty formation?
Lastly, are assassinations capable of promoting certain type of dynastic successions?
This paper provides an empirical examination at a cross country level to shed light on these
mentioned questions. In doing so, the analysis employs two new data sets. The first data set uses
biographical information on 442 national leaders from 65 countries who have governed (at least
once) as an executive head of their respective country during the period starting from 1950 to
2005.25 This is then empirically scrutinized to see if assassinated leaders are on average
associated with a higher likelihood of having a posterior relative in office. Furthermore, the base-
line results point out that assassinated leaders are on average associated with a higher likelihood
that they will later have a relative enter office. This association is robust for various changes in
the econometric specifications. Even so, it is not pragmatic to infer that the observed relationship
is in any respect causal. This is because the estimations might suffer from unobserved individual
or family heterogeneity of national leader.26
25 In order to establish a baseline list of national leader for each country post 1950, the work uses theArchigos dataset, v2.5 (Goemans et al, 2007), which identifies the primary national leader for eachcountry at each point in the mentioned time interval.
26 For example, national leader who are more likely to start a political dynasty (due to the politicalcapital endowment they entertain or etc) might also attract assassination attempt.
31
Hence, to address this identification problem, the paper employs the empirical strategy and the
data used in Jones and Olken (2009). The authors exploit the inherent randomness in the success
or failure of assassination attempts to pinpoint the potential impact of assassination on institution
and war. Additionally, the identification assumption is that, although attempts on a leader’s life
may be driven by political circumstances or individual ability, conditional on trying to kill a
national leader the failure or success of an assassination attempt can be treated as exogenous.27 In
other words, chance has a role in determining if a leader barely survives or dies in an
assassination attempt. Consequently, the second data set, which is studied in Jones and Olken
(2009), constitutes information on more than 190 national leaders with at least one assassination
attempt between 1875 and 2003. This allows the empirical examination to pinpoint that
conditional on an attempt taking place, whether or not the outcome of the attempt (which is a
product of chance) partially determines the likelihood that a leader will start or continue a
political dynasty. And, the primary results show that assassinations facilitate the likelihood that a
national leader will have a posterior relative in office. In particular, this effect is stronger for
leaders with a cumulative tenure of more than ten years. The findings also reflect that
assassinations are more likely to trigger immediate dynastic succession as means of aiding the
rise of national political dynasties. On the role of other factors, national leader with a longer
tenure are associated with a higher likelihood of starting (or continuing) a political dynasty. This
is in line with the notion that dynastic political power is self-perpetuating (Dal Bo et al, 2009).
Taken together, the estimations provide no support for the disruption-effect hypothesis, which
suggests that assassinations might hinder the likelihood that a national leader will have a
posterior relative in office. Alternatively, the results do indicate that assassinations facilitate the
rise of national political dynasties. This makes it probable to infer that martyrdom of assassinated
leader is likely to play an instrumental role in facilitating dynastic successions at the highest
political office
1.5.3 Key Message
The two papers in Theme-II pinpoint factors that facilitate the emergence of political dynasties.
In particular, the papers examine if assassination of politicians allow de facto inheritance of
27 For Example, Hitler’s early departure from the beer hall in 1939, which may have saved his life fromthe waiting bomb, came only because bad weather prevented him from flying back to Berlin, forcinghim to leave early for a train (see Jones and Olken (2009) for more examples).
32
political power by aiding dynastic successions in their respective political arenas. And, the core
results from both studies are consistent with the view that assassinations play a causal role in
increasing the likelihood that a political leader will start (or continue) a political dynasty. This
contributes to our understanding of dynasty formation, since existing empirical studies are
suggestive that positive exogenous shocks to a leader’s time in power can facilitate posterior
dynastic attainment (Dal Bo et al, 2009; Querubin, 2010; Rossi, 2010). On the other hand, this
thesis shows that even negative exogenous shocks to a leader’s life can have persistent effects by
aiding the rise of political dynasties. This brings to attention the context under which the shock to
political power was received, which can carry information about the roots of political dynasties.
This, nonetheless, remains an avenue for future research to explore. In addition, the results that
assassinations perpetuate dynastic rule is counterintuitive and it provokes deeper thought on the
effectiveness of violent strategies of displacing leaders. Lastly, it complements the existing
qualitative literature that identifies martyrdom of assassinated leaders as a crucial factor aiding
the formation of political dynasties.
1.6 Outline of the Thesis
The remainder of the thesis is structured as follows. The next section presents the paper which
looks at the motivation of dynastic leaders in the political arena of Bangladesh. Chapter 3
describes the cross-country evidence on the relationship between dynasty-politics and corruption.
Chapters 4 and 5 contain papers on the role of assassination in facilitating the rise of dynastic
leaders. More specifically, the papers provide evidence from both sub-national and cross-country
investigations on the stated topic. Lastly, chapter6 provides concluding remarks and identifies
important avenues for future investigations.
33
2. Motivations of Dynastic Leaders: An Empirical
Investigation from Bangladesh
Abstract
This research examines if ‘dynastic identity’ matters in influencing the behaviour of legislators
from the political class of Bangladesh. To this end, the paper uses data on all elected
parliamentarians from the 8th and 9th National Parliament to see if their attendance record or the
likelihood of having a legal or corruption charges is explained (partially) by their dynastic
identity while controlling for other relevant covariates. The base-line result suggests that for all
MPs in the 8th National Parliament, there is a negative association between an MP’s
parliamentary attendance level and his or her dynastic identity. On the other hand, no significant
association between an MP’s dynastic identity and the dependent variables are identified for the
data from the 9th National Parliament. To address the issue of causality, the paper looks into
individual relationship to exploit a more exogenous determination of one’s dynastic identity,
and conduct multiple robustness checks. The estimations, however, remain qualitatively similar
after all such checks. Thus, the results taken together make it pragmatic to argue that an MP’s
dynastic identity has some causal role in determining his or her subsequent behaviour. Overall,
the results are difficult to reconcile with reputation-building incentive, which proposes that MPs
with dynastic identity will relatively shirk less in order to create a positive reputation for the
family. Lastly, in line with Besley et al (2011), the paper finds that legislative experience is
negatively correlated with an MP’s legislative attendance level.
Key words: Dynastic Legislators, Parliamentary Attendance, Legal Charges, Corruption
Charges, Shirking
34
2.1 Introduction: Why look into the motivations of dynastic leaders?
The motivation of political actors has been a subject of both intrinsic and instrumental
importance within the discipline of political economy. The traditional view in the public
interest domain has been that political actors are motivated by their sense of duty while they
are in public office. This makes them altruistic in nature, and one can enhance their
competence if they are sufficiently professionalized. In contrast, the “rational choice”
literature argues that it is important to assume that individuals behave according to their own
self-interest (Edgeworth, 1881; Sen, 1977). This, in effect, means that politicians in office too
will prioritize their self-interest, but as they are elected and have to face re-election their
behaviour will take into account the possibility of being voted out of office if they fail to
satisfy the citizens. Hence, in the midst of this general debate about motivations of politicians
and standards in public life, some interesting and important questions are worth exploring. For
example, is it necessary to assume that all political actors are motivated by similar objective
functions? Is it possible that the “objective function” of political agents varies across
politicians of different types? Or in other words, can their identity matter in influencing their
behaviour?
In this paper, I attempt to throw light on a similar question. That is, this analysis aims to
understand whether the dynastic identity of political leaders has a modifying role in
determining their behaviour. This is crucial for two reasons. First, existence of political
dynasties reflects inequality in the distribution of political power. This makes it interesting to
see if dynastic politicians and non-dynastic politicians are driven by similar motivations,
given that dynastic leaders are more likely to entertain a higher level of political capital (Dal
Bo et al 2009). Second, on a global level, more than one third of world population lives in
political arenas where dynastic leaders play a pivotal role in shaping political outcomes.28
Even in Bangladesh, the current national parliament (and the preceding one) has more than
fifty lawmakers from important political families.29 As a result, an empirical scrutiny of the
behaviour of leaders with such identity will provide new insights on the governing dynamics
of political actors, and pinpoint the exact role of dynastic identity in determining their
respective motivations.
28For more information on political dynasties across countries, please review the paper in chapter-3:“Corruption and Dynasty Politics”, which is a key component of this thesis.
29 See - Figure- 2.1A & 2.2A
35
Theoretically, two principle incentives can determine the behaviour of dynastic leaders. To
begin with, dynastic legislators who are motivated by an objective to endure and facilitate
dynastic succession can be influenced by a ‘reputation-building’ incentive. That is, the
incentive will motivate dynastic legislators to be relatively more benign and abstain from
shirking (or corrupt activities) to signal voters that their family is in politics to serve the
common good. Accordingly, if this incentive is strong, then one can expect a legislator’s
dynastic identity to facilitate relatively less shirking among dynastic legislators to generate (or
maintain) goodwill for their family-name. Conversely, dynastic legislators can also be
motivated by what I term the ‘stockpiling-wealth’ incentive. This incentive suggests that
dynastic legislators will use their position for personal enrichment (in terms of accumulating
both financial and political capital) so that they can use their inherited and accumulated
political capital to ensure their political endurance. Hence, if this incentive dominates then it
is probable that dynastic identity will motivate legislator to be relatively less benign, and will
encourage greater levels of shirking. Besides, since both these incentives work in opposite
direction, the relationship between a legislator’s dynastic identity and his or her subsequent
behaviour remains a subject of empirical inquiry.
Therefore, to address this issue, I compile an individual level data set on all MPs present in
the 8th and 9th National Parliament of Bangladesh between 2001-06 and 2009-10, and pinpoint
if dynastic identity can help predict their behaviour on multiple dimensions once I control for
relevant covariates. In doing so, for all legislators in the 8th National Parliament, I examine
their parliamentary attendance records to construct a variable Parliamentary Attendance
Ratio, which equals to one if a parliamentarian has not been absent for a single day in all 23
sessions of parliament held between 2001-2006.30 This procedure is also followed for all
legislators in the 9th National Parliament. I then see if a legislator’s dynastic identity explains
the variation in Parliamentary Attendance Ratio when I control for relevant structural and
individual characteristics. For MPs in the 9th National Parliament, I also review the personal
affidavits of parliamentarians to construct two additional binary variables - Legal Charges &
Corruption Charges. This is done with the intention to see if a legislator’s dynastic identity
predicts if he or she has a criminal profile or not.
30 This variable ranges between zero and one.
36
The remainder of this paper is structured as follows. The following section, provides a
discussion on the related literature, and elaborates on the theoretical insights. In Section 2.3, I
discuss the background, data and the empirical methodology. Section 2.4 illustrates the results
and provides interpretation. Lastly, section 2.5 offers some concluding remarks.
2.2 Literature and Theory
2.2.1 Literature Review
The central aim of this paper is to improve our understanding of the factors that governs the
behaviour of politicians. In particular, this work tries to see if dynastic identity has any role in
determining legislator behaviour. Focusing on political dynasties is interesting because in
modern democracies these groups reflect inequality in the distribution of political power. This
makes it pertinent to explore numerous questions. For example, how do dynastic leaders
behave in their respective political avenues? Are they relatively more or less benign? What
factors facilitate their emergence? Finally, what is their relationship with electoral
competitiveness and policy formation? It is relevant to mention that very few empirical
studies touch these issues. Recently, Dal Bo et al. (2009) studied the evolution of political
dynasties in the United States Congress since its inception in 1789. With many other
interesting findings the authors found that legislators who serve for long tenures are
significantly more likely to have relatives entering Congress later. This, in essence, suggests
that existing democratic process allows for de facto inheritance of political power. On its
relationship with electoral competitiveness, Feinstein (2010) shows that dynastic leaders have
a higher likelihood of attaining electoral success due to their brand-name advantage. Likewise,
Asaka et al (2010) develops a simple model which predicts two phenomena. First, dynastic
leaders enjoy a higher probability of winning. And second, fiscal transfers delivered by
dynastic legislators do not necessarily result in higher economic performance. Furthermore,
their predictions find support in data on Japan Diet between 1997 and 2007.
Qualitative analysis of contemporary political dynasties also exists. For example, Brownlee
(2007) provides an interesting scrutiny of hereditary successions in modern autocracies. In
particular, the analysis shows that whether elites will abet dynastic succession depends on the
precedent for leadership selection. That is, where rulers are predated by parties, surrounding
political elites will defer to the party as the recognized arbiter of succession. On the other
hand, where rulers predate their parties and political elites lack an established precedent for an
37
orderly transfer of power, hereditary succession offers a focal point for reducing uncertainty,
achieving consensus, and forestalling a power vacuum. Other works have focused on the role
of political events (such as assassination) in facilitating the rise of female dynastic leaders in
South and South East Asia (Ritcher, 1990; Thompson, 2002). Descriptive and comparative
analysis have also scrutinized various issues concerning with political dynasties in different
regions (Schatz; 2004; Hess, 1997; Brandes et al, 1997; Camp 1982). Thus, by focusing on the
importance of dynastic identity in determining political behaviour, this work contributes to the
effort in literature to shed light on the dynamics surrounding political dynasties.
The nature of this investigation also makes the work closely related to the study of political
shirking. This literature on political shirking is diverse, and it constitutes multiple streams. To
begin with, there is an important strand within the literature on political shirking which
emphasizes on the role of institutional design to make legislators more effective. The focus on
the role of institution is important because institutions determine the level of shirking in a
given political arena in twofold ways. First, institutional arrangements shape the incentives of
political actors. They affect how legislators behave in the parliament, and decide on transfers,
taxes and public good provision towards specific groups of citizens.31 Second, institutions
determine the process through which political selection takes place in a given polity (Besley,
2005, Acemoglu, et al , 2008; Besley et al 2009). Selection of politicians also matters because
it affects their competence, honesty or motivation.32 Consequently, on the role of institution in
shaping incentives for politicians, Besley and Case (1995)identify that policies are different in
states when U.S. state Governors are barred by term limit to stand for re-election. Analysing
the effect of term limit is interesting because the prospect of facing re-election has been much
emphasized as the primary disciplining mechanism in a representative democracy.
In addition to this, Diermeier, Keane, and Merlo (2005)notes the effects of term limits in U.S.
Congress, and it highlights that term limits may discourage relatively ‘skilled’ and ‘policy
31Autocracies are more likely to be governed by groups of elite while representative democracies createincentive to appeal to important swing groups (for more information, please see Acemoglu et al (2005).In addition to this, institutions create the level of accountability a political arena exhibit, which inessence determines how politicians are punished for misdemeanors and rewarded for good behavior.
32Institutional arrangements in political arenas differ in the way they select their leaders. For example,military dictatorships tend to select leaders with good credentials from the armed forces. Monarchiesrely on hereditary norms in facilitating succession. Democratic institutions rely on how leaders appealto the mass electorate. It isalso important to mention that coalition formation can also differ betweenautocratic and democratic arrangements as highlighted by Acemoglu et al. (2008).
38
minded’ politicians from staying in Congress. The authors show that term limits might tend
to tilt the composition of Congress toward younger and less experienced politicians. Keane
and Merlo (2007) contribute to this line of inquiry by pointing out that term limits will
disproportionately reduce the continuation probabilities of members of the majority party.
Tituinik (2008) uses an unique randomized experiment in the state senates of Arkansas and
Texas to identify that senators serving shorter terms have higher abstention rates. On a similar
note, Dal Bo and Rossi (2008) focus on an experiment in the Argentine Senate to suggest that
longer terms enhance legislative productivity. Conversely, Smart and Sturm (2004) argue that
term limits can benefit voters (ex ante) by making politicians more truthful about their policy
preference, as it reduces the value of occupying public office. In the empirical literature,
democratic institutions are also examined to understand whether they enhance economic
performance (Przeworski and Limongi, 1993;Barro, 1996; Papaioannou and Siourounis, 2008;
Aghion et al, 2008; Besley et al 2010)
Institutions also determine the level of political shirking in a given political landscape by
guiding the process of political selection. More specifically, since any given polity will suffer
from incomplete contracts and limited commitment, adoption of a socially optimal policies
/behaviour will ultimately depend upon an incumbent leader’s capacity to use his or her
discretion effectively. Hence, selection of political leaders matter, and a handful of empirical
studies confirm this issue. For example, Rehavi (2007) uses close election to identify that
women’s representation affects policy formulation in U.Ss state legislatures. This is also
reflected in the findings of Chattopadhyay and Duflo (2004) which examine two Indian states
– Rajasthan and West Bengal. The authors show that the kind of issues favoured by women
get more attention when women leaders are selected. In line with this, Pande (2003) finds that
reservation for scheduled tribes and scheduled castes at the state level in India affected
policies towards these groups. These studies also collectively show that ‘leader’ identity plays
an instrumental role in altering leader behaviour in democratic policymaking process.
Some studies on political shirking relatively rely more on legislators as the unit of observation
to understand whether legislators are actually working or shirking. Two issues are mostly
studied to analyse shirking - namely voting patterns and expenses/monetary returns to a
political career. On the issue of voting, an interesting body of work has emerged focusing on
whether politicians behave differently after they have decided to retire from politics. This
focus is insightful because if a legislator is in politics to serve public interest then the decision
39
to retire will not affect his voting pattern in his last term. In contrast, if a legislator is governed
by any other motivation (self-interest), then it is likely that the voting pattern will change
when he decides to retire. However, empirical evidence on these competing views remains
mixed. For example, Lott (1987a)scrutinizes if a congressman’s decision to retire him alter
how he votes when he does vote.33 The author identifies that while congressmen do not vote
as regularly in their final term as they do otherwise, congressmen carry on voting in the same
way whenever they do vote. This finding is in line with the hypothesis that a legislator’s
personal ideology restricts shirking as they continue to vote for what they believe, but they do
less of it as they no longer face re-election. Similarly, Lot and Reed (1989) pinpoint that
congressmen in US miss more votes in their final term in office, even though no evidence
suggests that their voting patterns change significantly. In addition to this, Lott and Bronars
(1993) examine congressional voting pattern in the US between 1975-90, and point out no
significant change in voting behaviour in representative’s last term in congress. The authors
use this evidence to argue that selection works well for U.S. Congress, leading to a set of
politicians who are well aligned with the constituent interests.
On a slightly different note, McArthur and Marks (1988)study U.S Congressional behaviour
in lame duck sessions34, and identifies that retiring congressmen were significantly more
likely in 1982 to vote against automobile domestic content legislation than others. In more
contemporary times, Padro i Miquel and Snyder (2006) use subjective measure of legislative
performance in North Carolina to examine the effects of legislative tenure. The study suggests
that legislative performance increases with tenure, and it considers ‘learning-by-doing’ as a
possible explanation. Besley et al (2011), as well, examine the behaviour of lawmakers in the
British House of Commons between 2001 and 2004, and find that retiring MPs significantly
vote less than their non-retiring colleagues. Additionally, the authors also show that
experience and party affiliation are important predictors of parliamentary attendance. Thus,
my work controls for these factors while examining the role of dynastic identity in explaining
the variation in MPs’ attendance in the national parliament of Bangladesh.
33 Their sample was taken from the 94th and 95th Congresses in the U.S
34After an election, members who have not been re-elected are at times called upon to vote onlegislation before the new swearing in takes place.
40
Theoretical and empirical research on political shirking has also focused on the monetary
returns to holding office to shed light on the effects of remuneration on political behaviour,
and how private and public sector returns determine the decision to enter a political career. On
this, Caselli and Morelli, (2004) present a simple theory of the quality of elected officials.
Their work offers three main insights. Low-quality citizens have a ‘comparative advantage’ in
pursuing office, because their market wages are lower than those of high-quality citizens
(competence), and/ or because they reap higher returns from holding office (honesty). So,
voters may find themselves supply constrained of good candidates. Second, bad politicians
generate negative externalities for good ones, making their rewards from office increasing in
the average quality of office holders. This leads to multiple equilibrium in quality, since
individuals with high quality considers a career in politics more valuable only when other
high quality politicians are in politics. Third, incumbent policy makers can influence the
rewards of future policymakers, leading to path dependence in quality: low quality
governments sow the seeds for low quality bad governments.35 Besley (2004) contributes to
this line of inquiry by showing that wages plays an important role in aligning voter preference
and policy outcomes. As a result, it reduces turnover among first-term incumbents.
Furthermore, the study also highlights the fact that higher remuneration can also increase the
fraction of congruent politicians who will put themselves forward for office. This finding is
also upheld, to an extent, by Gagliarducci and Nannicini, (2009) who study Italian municipal
governments from 1993 and 2001 to find that increase in wages attract better educated
leaders. They also show that better paid politicians size down the government machinery by
improving internal efficiency. This is also reflected in the results of Feraz and Finan (2008).
The authors use a quasi-experimental set up to isolate that higher wages increases quality of
legislators and political competition in Brazilian municipal governments.
On the other hand, some argue that an increase in wages will not always play an efficiency
wage function in the political arena. For example, Mattozzi and Merlo (2008) lay out a
dynamic model where there are both individuals with “political career”, who stay in office to
signal their ability to the private sector, and “career politicians”, who stay in public sector till
retirement. Moreover, in their theoretical framework, an increase in wages results in lowering
the average quality of citizens who have political careers, since politics becomes a relatively
more attractive option for all levels of skills, and it has an ambiguous effect on the average
35 An interesting proposition of this paper is that bribes may actually increase the likelihood thattalented politicians run for office.

41
quality of career politicians, because incumbent politicians with high-ability are more willing
to stay in office. Besides, Gagliarducci, Nannicini and Naticchioni (2008) analyse the effect
of outside earnings on political selection. To state it otherwise, if political leaders can keep
private business while appointed and election boosts the private returns of high ability
citizens, then outside earning can induce equilibria with positive sorting, where a wage
increase will make the political office relatively more attractive for low ability citizens. On the
effects of wage reduction, Keane and Merlo (2007)stress that in the US Congress, a reduction
in congressional wage will induce more skilled politicians to exit Congress (where skills refer
to the ability to win elections), but this is not true for ‘achievers’.36
There is also a small body of work which tries to understand the market for political favours.
In other words, how politicians benefit from occupying public office by making useful
contacts with the private sector, and in the process enhancing their rewards from a post-
political career. Diermeier, Keane, and Merlo (2005), on this issue, provided the first
empirical scrutiny with political leaders as unit of o suggest that serving as a politician may
boost private sector earning after leaving office. The authors estimate a structural dynamic
model of congressional careers on all House and Senate members who entered Congress from
1947 to 1993, and they point out that congressional career significantly increase post-
congressional wages in the private sector. Similarly, Eggers and Hainmueller, (2009) estimate
the returns to serving in the British House of Commons in the post-war era, and they show
that serving in office almost doubled the wealth of Conservative MPs, but had no significant
financial benefits for Labour MPs.
To conclude, my paper contributes to this overall scrutiny on the behaviour of political leaders
by trying to see if dynastic identity matters in shaping political outcomes on a newly compiled
data set from Bangladesh. Since most of the existing works on this specific issue have used
countries in North America (and Asia), as their primary venue for investigation, Bangladesh
(to the best of my knowledge) becomes the first candidate from South Asia where an
empirical examination using parliamentarians as unit of observation has been conducted.
36Legislators are categorized as “achievers” if they perform very well in terms of legislative and policygoals.
42
2.2.2 Theory: Reputation Building versus Stock-piling Wealth
Almost all work on political agency assumes that political actors are driven by self-interest.
Yet, this assumption implicitly proposes that political leaders act in a similar fashion under
common institutional arrangements no matter who they are. This, to an extent, undermines the
possibility that individual traits (like identity) can play a crucial role in determining
behavioural outcomes. Nonetheless, some existing empirical work suggests that a political
leader’s identity (such as gender or caste) can have an important role in motivating policy
outcomes (Pande, 2003, Chattopadhyay and Duflo, 2004, Rehavi, 2007). Hence, in this
section, I provide a discussion on the possible ways through which a leader’s dynastic identity
might influence his or her behaviour. More specifically, I propose that in understanding the
behaviour of politician from dynasties, it is useful to assume that dynastic politicians have in
their objective function a goal to initiate a dynastic succession. If this is true, then not only
dynastic politicians will account for all the future consequences of their action on their
welfare, but they will also take into account how their personal and political behaviour affect
the probability of a dynastic succession within their respective political realm. As a result, this
additional objective of dynastic politicians to make sure that their dynasty endures can change
their behaviour from others. This, on the other hand, raises a concern that if dynastic
politicians are affected by their desire of facilitating future dynastic successions, then why
will non dynastic politicians act in any different way? This is because non-dynastic politicians
can too desire that their family members will inherit their political position or office, and in
the process set up their own political dynasty. A possible reason why this might not be the
case is because dynastic leaders might inherit political capital - in the form of key political
contacts, familiarity with pre-established donor network and etc – that is difficult to acquire
over a shorter time span. Additionally, access to such inherited political capital can allow
dynastic politicians to facilitate future dynastic succession with a relatively lower effort in
comparison to politicians who are attempting to start their own dynasty. Consequently, if this
line of reasoning holds, then it will not be surprising if dynastic politicians motivated partially
by the objective to promote a dynastic succession act in a different way than other non-
dynastic politicians.
Now, assuming that dynastic politicians are partially motivated by the desire to promote a
dynastic succession, the relationship between a legislator’s dynastic identity and his or her
behaviour in the political arena is still theoretically not clear. This is because their decision-
43
making process is affected by two opposing incentives. I call this the Reputation-Building
incentive and the Stockpiling-Wealth incentive. Reputation-Building incentive implies that
when members of political dynasties are in office, they will use this opportunity to build a
positive reputation for the family. That is, they will abstain from behaviours that decrease
their family’s goodwill, such as engaging in corruption or being ineffective in legislative
responsibilities, as much as possible. This will allow them to signal voters that their dynasty
embraces a vocation for public interest. Therefore, if dynastic politicians succeed in creating a
positive reputation for their family, then the dynastic succession (which by our assumption is
one of the objectives of a dynastic politician) has a greater likelihood of being seen legitimate
and acceptable.37Hence, if this line of reasoning holds and reputation-building incentive
dominates the behaviour of dynastic politicians, then one will expect legislator’s with dynastic
identity to be more benign in comparison to legislators of non-dynastic identity.38
In contrast, stockpiling-wealth incentive points out that dynastic politician will use their
inherited political capital to consolidate their financial and political strength. This, in essence,
means that dynastic politicians will appoint their preferred people to key positions in the
government and bureaucracy, and in the process accumulate more financial and political
capital so that future dynastic successions are achieved in a smooth manner. One can also
argue that they will misuse their authority to manipulate institutions (such as Election
Commission, Defence and so on) so that elections contested by their future generations are
rigged in their favour. And, if this incentive is strong, then one can expect dynastic politicians
will have a greater tendency to misuse their authority (while they are in office) so that they
can promote dynastic successions in their political arena. Likewise, Laband and Lentz (1985)
identify that children of national politicians are less likely to be opposed for re-election than
those who were not from a political dynastic lineage. The authors also opine that opponents of
the children of politicians spend more in losing campaigns than do those who run against
politicians from non-political family. This makes challenging incumbent dynastic politicians
37In practice, it can evoke a similar decision making scenario faced by a politician with term-limits incomparison to a politician without term-limits. That is, the incentive induced from the possibility offacing re-election can (in practice) be similar to one of dynastic politicians aiming to facilitate adynastic succession.
38In other words, if political positions are transferable from politicians to politician’s children, then thelast period enforcement problem (i.e. how one restricts politicians from shirking in the last period) issomewhat mitigated.
44
relatively difficult.39 Accordingly, if such scenarios prevail for legislators belonging to
prominent dynasties, then one can expect dynastic legislators to shirk relatively more in
comparison to legislators with non-dynastic identity.
On the whole, the discussion highlights that the reputation-building and the stockpiling-wealth
incentive work in opposite direction. This makes an empirical investigation essential for
isolating the possible net-effect of dynastic identity. Yet, empirically approaching this inquiry
in a sub-national data set of legislators is not straightforward. First, it is important to isolate
specific leader behaviour or characteristics which can carry information about a leader’s
motivational dynamics in the public sphere. The continuum of leader behaviour from which
one can infer some information about his or her respective motivation can include: (i) his or
her general attentiveness in the legislative process, (ii) his or her responsiveness to the acute
needs of the constituency in times of flood or drought, (iii) his or her leadership in national
issues or constituency development programme, or (iv) his or her having a criminal record.
Furthermore, within the political spectrum of Bangladesh, the choice of the dimension that is
ultimately scrutinized to understand the role of dynastic identity should keep the political
context of Bangladesh in the backdrop. That is, what is expected of legislators? What is a
goodwill enhancing behaviour in Bangladesh? Are there ways through which we can
accumulate information on a leader’s stockpiling-wealth mind-set?
Second, the measure of leader behaviour that the study uses must be objective in construction
and available across a large pool of legislators (if not all), so that the findings are not sensitive
to any change in sample size of the data. Lastly, the dependent variable measuring leader
behaviour must also minimize the scope of measurement error as it will reduce the possibility
of finding significant results due to larger standard error.
39 A very similar view is expressed in Lott, (1986) and Lott, (1987a & 1987b). More specifically, thestudies show that long exposure to political power (a trait very common among dynastic leaders) cangenerate a brand-name for an incumbent politician, which is often non-transferable in nature. Besides,such brand name can often result in greater popular support for politicians who care about both “net-support” and “commission” that he or she receives for transferring wealth. This additional level ofsupport for politicians with brand-names creates barriers to entry for potentially more competententrants with no brand-names. As a result, this can mean that that incumbent politician with brand-names can find it easier to remain in office by restricting entrants even when there exists, moreefficient, less recognised candidates.
45
2.3 Historical Background, Data and Empirical Method
Evidence for this study comes from Bangladesh, where dynastic leaders play an influential
role in political decision making at various political levels. To better understand the content of
the data a brief overview is provided.
2.3.1Historical Background of Political Elites in Bangladesh.
Political Dynasties are the modern day political elites of Bangladesh. Yet, the prevalence of
political elites is not a contemporary phenomenon. In colonial period, land lord elites –
zamindars - first received official recognition when the Permanent Settlement Act 1793 was
introduced by the British authority. This act allowed the zamindars to have absolute proprietor
rights over their land, which included their rights to transfer their land through sale, mortgage
or gift. These rights, on the other hand, were not available to raiyats – the subjects of the
zamindars which mostly constituted their tenant population engaged in peasantry. The
zamindars, however, were obligated to perform one principle duty. That is, zamindars were
compelled to prepare details of revenue assessment, collect rent from the peasants and remit it
to the British authorities. Furthermore, they were also required to support the imperial officers
in the peace-keeping of the locality and to supply troops whenever needed.40 In case of
default, the British authorities could auction the landed propriety of the zamindars to meet
their revenue expectation.41The idea behind this was to create landed aristocracy which was
supposed to be loyal to the British Raj. The arrangements of the Act also meant that
zamindars had to rigorously monitor their tenants in order to protect their rights, which fuelled
the growing discontent between the two groups of the people.
The second source of discontent emerged from the religious composition of the zamindari
class. More precisely, the majority of zamindars in East Bengal (now Bangladesh) during the
colonial period42 were Hindus, which created discomfort among the majority Muslim tenants
in East Bengal. In fact, this issue was so prominent during the colonial period that Mr Fazlul
40 This was required under the Permanent Settlement Act 1793.
41 This was required under the Revenue Sale Law 1793. Besides, the large territorial landlords oftenlost their lands to auctions, which created a new breed of small territorial landlords.
42 The British Colonial period of India ended in 1947. In 1947, East Bengal was renamed as EastPakistan, and it remained so until its independence as the People’s Republic of Bangladesh in 1971.
46
Huq43 - Chief Minister of undivided Bengal (1937–1943) – stated during his election
campaign in 1937 that, “...my fight is with landlords, capitalist, and holders of vested
interests. The landlords are 95 percent hindus, and...far from helping me, they are out to throw
obstacles in my way....As I have made it abundantly clear already, I am fighting for a
satisfactory solution of the bread problem or, in other words, of the “Dal Bhat” problem of
Bengal, and also for over hauling of the Tenancy Laws in Bengal so as to give some relief to
agriculturalist.”44Despite this rhetoric, which explicitly highlights his discomfort with the
zamindari class, the Cabinet of Mr Fazlul Huq included eleven members out of which ten
belonged to prominent zamindari family (Sen, 1986).
In the post-colonial period, however, the grip of the zamindari class45 in East Pakistan (and
now Bangladesh) diminished significantly after the enactment of the East Bengal State
Acquisition and Tenancy Act 1950. Under this Act, all holders of land emerged as the direct
tenants of the government. Besides, the new dynamics surrounding post-colonial politics in
East Pakistan opened up doors for Bengali Muslim professionals – lawyers, journalists,
teachers, etc -to organize movement for their political agendas under a new political outfit –
namely the Bangladesh Awami Legue. It must be noted here, however, that in the early years
of post-colonial period the Muslim League became the most prominent party in both West
Pakistan (now Pakistan) and East Pakistan Quaid-i-Azam Muhammad Ali Jinnah – the
founder of Pakistan – was the leader of the party and Governor General of the new country.
Nonetheless, due to the growing economic disparity between West and East Pakistan during
1947 and 1971, the Muslim League increasingly became alienated from the people of East
Pakistan (Choudhury, 1972). In addition, given the leadership of Muslim League mostly
constituted influential persons and families from West Pakistan (Pirs, Zamindars, Khans and
Nawabs), the party failed to address the sentiments concerning the socio-economic conditions
in East Pakistan.
Against this backdrop, Maulana Abdul Hamid Khan Bhasani formed the Awami League in
1949. Maulana Bhasani rose to political prominence during the 1930swhen he lead the
43 For more information on AK Fazlul Huq, see: http://www.bdlifeline.com/a-k-fazlul-huq/
44 This political speech was first published in the newspaper “The Amrit Bazar Patrika” (Calcutta), 11September 1936.
45Especially the role of the zamindari class that belonged to the Hindu community.
47
peasant movement in East Bengal and Assam. Other Bengali nationalist leaders including H.S
Suhrawardy – the former mayor of Calcutta - Ataur Rahman Khan, Shamsul Huq and
Bangabandhu Sheikh Mujibur Rahman occupied various posts in the new born party. The first
twelve-point programme initiated by the Awami League included the abolishment of the
Zamindari system.46 This ‘anti-zamindari’ stand was possible for Awami League to advocate
as it entertained a relatively non-elitist leadership composition. To be more precise, Maulana
AHK Bhasani himself came from a peasant background. Moreover, three Vice Presidents of
the party were lawyers with a non-landlord family lineage, and the General Secretary and the
Assistant Secretary of the party also belonged to middle income families. Bangabandhu
Sheikh Mujibur Rahman, who emerged as a party leader in the late sixties, also belonged to a
non-elitist background (Sen, 1986).
By the late 1960s, Awami League under the leadership of Bangabandhu Sheikh Mujibur
Rahman emerged as formidable political force in East Pakistan. This rise in political
popularity was a resultant effect of the disparity in economic and political power of West and
East Pakistan. More precisely, during Ayub Khan’s authoritarian rule of Pakistan between
1958 and 1968, the polity of Pakistan witnessed the emergence of an all-powerful ruling elite
– mostly comprised of senior bureaucrats, military personal and members of some prominent
families in West Pakistan. To some extent, it was a modernising oligarchy in which Bengalis
had no share (Rashiduszzaman, 1970; Sen 1986). Besides, the economic disparity between the
two wings also meant that intelligentsia of East Pakistan soon realised that secession from
West Pakistan was the only possible solution.47 These sentiments and the associated political
events between 1966 and 1971 triggered the war of liberation48, which facilitated the
emergence of Bangladesh as an independent country in December 1971.
With Bangladesh emerging as sovereign nation from a devastating liberation war,
Bangabandhu Sheikh Mujibur Rahman –the Prime Minister of Bangladesh – had a difficult
46 Details of the 12-point programme by Awami League in 1949 was publish in the newspaper “TheStatesman” (Calcutta), 26 June 1949.
47 For more discussion on the economic disparity between West and East Pakistan, see Khan (1999).
48 The liberation war was fought under the direct control of the Government in exile- comprising keyAwami League leaders. Bangabandhu Sheikh Mujibur Rahman was arrested and imprisoned by themilitary body of West Pakistan, and was only released when Bangladesh emerged as an independentcountry.
48
situation to administer. Additionally, Bangabandhu’s first Cabinet composed of thirteen
lawyers, four businessmen, three full-time politicians, one college teacher, one landlord and
an ex-army officer, were relatively inexperienced in state craft due their long exposure to
opposition politics. These issues together with the acute famine that took place in 1974
claiming thousands of lives49 left the political and economic very unstable. Ultimately, on the
15th August 1975, Bangabandhu and other important leaders of Awami League were
assassinated in a military coup, which triggered the rise of military rule that dominated the
Bangladeshi political arena between 1975 and 1991(Karim, 2005).
After a prolonged period of military regimes since 1975, democracy returned when military
strongman President HM Ershad decided to resign after a popular movement in 1991 (Baxter
and Rahman, 1991). The election was held on 27th February 1991 in which all parties
participated. Likewise, the Bangladesh Nationalist Party (BNP) led by Begum Khaleda Zia
(widow of the assassinated military leader General Ziaur Rahman50) won a simple majority,
and Mrs Zia was sworn in the Office of the Prime Minister on the 20th March 1991. On the
other hand, Sheikh Hasina Wajed – daughter of the founding father of Bangladesh
Bangabandhu Sheikh Mujibur Rahman51 – became the leader of the opposition in the
Parliament, a position she earlier held in 1986. Since then, both these leaders have succeeded
each other in every respective election to attain the top political office.52 At present, Sheikh
Hasina is the Prime Minister of Bangladesh, after Awami League won a landslide victory in
the ninth-parliamentary election on the 29th of December 2009. This election was preceded by
two years of emergency rule under the military backed interim caretaker government during
which numerous political leaders (including Sheikh Hasina and Khaleda Zia) were arrested
under charges of corruption (Alamgir, 2009).
49 For more discussion on the 1974 Famine, see Sen (1981).
50 General Zia was the de facto military ruler of Bangladesh between 1975 and 1981, during which heestablished the Bangladesh Nationalist Party [BNP].
51 For more information on Bangabandhu, see http://www.rulers.org/indexr1.html#rahma
52Khaleda Zia won the election held on the 15thFebruary 1996, giving her two successive victories. Thiselection, however, was boycotted by AwamI League and all other major political parties. As a result,the government only lasted a month, and in June the seventh national parliamentary elections tookplace in which Awami League was elected to govern with Sheikh Hasina as the Prime Minister.
49
It must be observed at this point, that the dynastic politicians who influence the political arena
of Bangladesh in contemporary times are descendants of key politicians who dominated
political scene in 1960s, 1970s and 1980s. Moreover, it is also important to recognise that
they are not small in proportion. For example, in both 8th and 9th National Parliament, more
than fifty dynastic political leaders (out of the 300 parliamentary seats) were elected to office.
In terms of the political rise of both Khaleda Zia and Sheikh Hasina – the two rival dynastic
leaders – it is argued that the martyrdom of Zia and Bangabandhu respectively have played
decisive role (Thompson, 2002).53 In effect, the Sheikhs and Zias remain the most influential
political dynasties within the political domain of Bangladesh, and their rivalry is a well noted
phenomenon in both domestic and international press.54 Bangabandhu Sheikh Mujibur
Rahman - the father of Sheikh Hasina- has a deep rooted legacy in the liberation struggle of
1971, and his charismatic leadership is often credited for the creation of Bangladesh (Jahan,
1973).55 Furthermore, when Bangabandhu was assassinated in 1975, the policy makers of the
Awami League chose Sheikh Hasina as its chairman in 1981, as it helped them achieve a
degree of continuity. Besides, the martyrdom of Bangabandhu allowed Hasina to a gather
popular support against the military regime of Ershad (Rahman, 1984; Thompson, 2002). This
also remains true for Khaleda Zia, whose husband’s regime immediately preceded Ershad’s
nine year-long military rule.
In terms of their origin, Sheikhs hail from the District of Gopalganj where Bangabandhu
Sheikh Mujibur Rahman was born. In the current national parliament, both Prime Minister
Sheikh Hasina and her cousin Sheikh FK Selim are MPs from Gopalganj-2 and Gopalganj-3
respectively. Sheikhs also have a stronghold on the District of Madaripur56 (which is adjacent
to the District of Gopalganj), where Sheikh Hasina’s nephew Noor-E-Alam Chowdhury is an
53 It is also interesting to note that, all Cabinet colleagues of Bangabandhu who were assassinated in1975 ended up having an eventual political dynastic successor.
54In international media, the rivalry between Sheikh Hasina and Khaleda Zia is dubbed as“the battle of the two Begums”. For more information on this, see:http://www.independent.co.uk/news/world/asia/battle-of-the-begums-brings-bangladesh-to-a-standstill-2148033.html; Their rivalry is also noted in the country profile of BBC.see:http://news.bbc.co.uk/1/hi/world/south_asia/country_profiles/1160598.stm.
55 In 2004, Bangabandhu was voted by the population of Bangladesh and West Bengal as the GreatestBengali of all time beating India’s Nobel winning playwright and poet Rabindranath Tagore. For moreinformation on this, see: http://news.bbc.co.uk/1/hi/world/south_asia/3623345.stm
56 Both the districts (Gopalganj and Madaripur) are within Dhaka Division.
50
MP. Zias, on the other hand, have strong holds in two non-adjacent districts- Feni57 and
Bogura.58 To be specific, Begum Khaleda Zia is from the District of Feni, where she is an MP
from the constituency Feni-1.
Apart from the Sheikhs and Zias, other political dynasties also play an influential role in
regional political arena of Bangladesh. For example, constituencies in the Faridpur district
have been under the influence of the Chowdhury dynasty for last seven decades.59 Yusuf Ali
Chowdhury, who was from Faridpur was a veteran politician in the then East Pakistan. He
belonged to the aristocratic zamindar family of Chowdhury Moyezuddin Biwshash who was a
patron of the Indian National Congress. Yusuf Ali was elected to the local assembly in the
1930s and was member of the provincial cabinet in the 1950s. Later, his children also
emerged as influential politicians in independent Bangladesh. His eldest son, Chowdhury
Kamal Ibne Yusuf was elected to the parliament for five times, and held cabinet positions in
all BNP tenures. His second son Chowdhury Akmal IbneYusf was also an MP in 2001.
Similarly, in the district of Sirajganj, the Monsur Ali60 dynasty produced four members of
parliament across three generations. In the southern district of Bhola, Naziur Rahman
Manjur’s oldest son Barrister Andaleeve Rahman is currently an MP. Manjur played an
instrumental role in the cabinet for Ershad during the 1980s61, and founded a new party –
Bangladesh Jaitiya Party (BJP), which is currently in the BNP-led Four Party
alliance.62Subsequently, given that dynastic leaders exist at both regional and national levels,
it will be interesting to examine if dynastic legislators behave any differently than non-
dynastic leaders. As discussed above, in theory dynastic leaders are motivated by two
57 District of Feni is within Chittagong Division.
58 District of Bogura is within Rajshahi Division.
59For a brief sketch of the life of Yusuf Ali Chowdhury,see:http://www.thedailystar.net/2004/12/04/d41204150392.htm
60Manusr Ali was assassinated in 1975, when Mujib’s government was overthrown on the 15th ofAugust 1975. His, two sons – Mohammed Nasim and Mohammed Selim – were later elected toparliament on numerous occasions. At present, his grandson, Tanvir Shakil Joy is a MP.
61 It is also argued that Naziur played a key role in the electoral victory of the BNP-led Four-Partyalliance in 2001. see: http://www.probenewsmagazine.com/index.php?contentId=1785&index=2
62Naziur is also married Bangabandhu Sheikh MujiburRahman’s niece Sheikh RebaRahman.: For moreinformation, see: http://www.thedailystar.net/newDesign/news-details.php?nid=31156; Naziur’s eldestson Andaleeve Rahman is also married to a member of the Sheikh Family, For more information onthis, see: http://groups.yahoo.com/group/khabor/message/29020
51
opposing incentives making the overall effect on legislator behaviour ambiguous. This calls
for a suitable empirical investigation of the topic, which I address in the following sections.
2.3.2 Data and Sources
In order to address the central question of the paper, a new data set is compiled on all elected
legislators in the 8thand 9th National Parliament of Bangladesh. In terms of administrative
structure, Bangladesh is a unitary parliamentary republic consisting of three hundred
parliamentary seats.63 These seats are located in six administrative Divisions, which in turn
are subdivided in sixty-four Districts.64 This means that each District constitutes one or more
seats, and each Division has more than one District.65 There is a unicameral parliament known
as the Jatiyo Sangsad. The database includes three measures of legislator behaviour. These
measures are chosen so that one can analyse to see if dynastic legislators are driven by
reputation-building incentive or stockpiling wealth incentive. Hence, to start with, I use Parl-
Attendance-Ratio to measure a legislator’s general involvement with the daily legislative
business. For the 8th National Parliament, the attendance ratio is computed by dividing the
number of parliamentary days attended by the number of days a legislator can attend in all 23
sessions. And, for the 9th National Parliament, the ratio is computed by repeating the same
procedure for first five sessions (given that this parliament is still in progress).66 This makes a
score of one indicating that the legislator has not been absent for a single day in the
parliament.
To provide more insights into the criminal profile of legislators, two additional dependent
variables are constructed for the analysis of the 9th National Parliament. I use information
provided by individual MPs in their personal affidavits to the Bangladesh Election
Commission [BEC] before they participated in the ninth parliamentary elections held on the
29th of December 2008. These affidavits were made available by the Bangladesh Election
Commission [BEC] in June 2009 under the Right to Information Act 2009, and I employ them
to construct two binary dependent variables - Legal Charges and Corruption Charges.
63An additional 45 seats are reserved for women. This is decided upon after an elected governmenttakes office.
64 For more information, see: http://www.discoverybangladesh.com/meetbangladesh/the_admin.html
65 Please see the Map- 2.1 & 2.2
66 This information is collected from the Legal Office of the National Parliament of Bangladesh
52
Moreover, two kinds of charges are categorized as corruption charges: (I) political leaders
charged under “Prevention of Corruption Act, 1947”, or (II) political leaders charged under
“Anti-Corruption Act 2004”. I also use the Annual Report 2007-08 published by Anti-
Corruption Commission [ACC] of Bangladesh to minimize the risk of any missing
information. It is important to mention, however, that in order to contest in the 8th National
Parliament it was not mandatory for MPs to submit personal affidavits. This made it not
feasible to obtain information on legal and corruption charges for legislators in the 8th
National Parliament. As a result, the data set is relatively more informative for the elected
parliamentarians in the 9th National Parliament in comparison to the elected legislators of the
8th National Parliament.
To characterize MPs from political dynasties, an indicator variable Pre-relative is created,
which is equal to one whenever a legislator has or had a relative67 entering office before he or
she did, and zero otherwise.68 This information is primarily taken from the Documentary on
the Parliament by Rashid and Feroz (2002) which provides detailed information on an MP’s
biological or social link with other politicians. Likewise, I have also engaged in a long series
of interviews to establish dynastic linkages between present and former parliamentarians. The
interviewees are mostly existing dynastic parliamentarians, relatives of politicians, reporters
etc. List of newspapers that were useful in noting dynastic linkages of parliamentarians is also
provided in Appendix- Box-2. Given that dynastic leaders often receive substantial media
attention within the political domain of Bangladesh, newspapers provide a very useful
medium for collecting biographical information on such leaders. In addition, before each
national parliamentary election, biographical profiles of important parliamentary candidates
for each parliamentary constituency are reported in the major newspapers. Thus, I have
examined all such coverage on each parliamentary constituency that preceded the 9th
Parliamentary election.69 This exercise (along with the information available in Rashid and
Feroz (2002)) allowed the data set to have a comprehensive biological profile of almost all
MPs in both 8th and 9th National Parliament.
67Anyone with a biological or social connection to the leader is considered a relative, For example-Wife, Brother, Son, Daughter, Cousin, Grandson, Son-in-Law, Brother-in-law, and etc.
68Dal Bo et al (2009) use a similar indicator variable to measure legislators with a dynastic identity. E-sources were also useful in establishing dynastic linkages.
69The 9th Parliamentary election that took place on 29th December 2008.

53
To study other characteristics, I use the Member Directory on the 9th National Parliament
produced by NDI70which provides useful information on the individual characteristics of
MPs. The following indicator variables are used. Female is an indicator variable equal to one
if a legislator is not a male individual, and zero otherwise. Num. of Time MP is the total
number of times a leader is elected to the office of an MP. Minister is an indicator variable
equal to one if the leader is in the cabinet of the present government (or was in the cabinet in
last government). Military is an indicator variable equal to one if a leader had a military career
at some point in his or her career. Lawyer is an indicator variable equal to one if the leader
had a law degree, and zero otherwise. Businessman is an indicator variable equal to one if the
leader is or was businessman by profession, and zero otherwise. The Non-Marginal Seat is a
binary variable equal to one if the legislator won the election by difference of more than
twenty percentage points, and zero otherwise. Valid-Voter is a constituency characteristic,
which represents the number of legal votes a parliamentary seat had in elections for the 8th and
9th National Parliament. This information is collected from the electoral records, which are
available from the Election Commission of Bangladesh. Lastly, Distance-from-Dhaka is
measure of distance in kilometres of constituencies from the district of Dhaka. This is used as
a crude proxy to measure how far a constituency is from the parliament, and this information
is collected from the Office of the Ministry of Communication, Government of Bangladesh.
Table-2.1A &2.1B provides summary statistics for all elected legislators in the 8th and the 9th
National Parliament. The mean value of Pre-relative is greater than 0.17 in both terms. This
indicates that roughly more than seventeenth percentage of all elected parliamentarians in the
8th and the 9th National Parliament are of dynastic identity. In the present government, six
elected members belong to the prominent Sheikh dynasty. Besides, from Box-2.1 we can see
that out of the eight political parties which have representation in the current national
parliament, four are chaired by members of prominent political dynasties.71 The summary
statistics also show that there is a noticeable variation in parl-attendance-ratio in both 8th and
70National Democratic Institute for International Affairs (NDI). For more information, seehttp://www.ndi.org/; The Member Directory project on the 9th National Parliament of Bangladesh waspartially funded by USAID.
71 Box-2.2 and Box-2.3 also shows some interesting phenomenon. First, Box-2 shows that dynasticparliamentarians are among individuals with the lowest attendance record. Second, Box-3 reflects theincreasing tendency of the principle opposition party to boycott parliament as means of expressingpolitical
54
9th National Parliament. And the mean parl-attendance-ratio for all elected parliamentarians
in both terms stands at 0.69 and 0.56 respectively. In terms of range, in both parliaments the
variation ranges between values less than ten percentage to values more than ninety
percentage, and dynastic legislators are among the four worst performers in both terms. This
makes it interesting to analyse if this variation is predicted by one’s dynastic identity once I
control for other important covariates. Similarly, a large number of parliamentarians in the 9th
National Parliament have criminal profiles. Being more specific, in the 9th National
Parliament, almost fifty percentage of all MPs have faced legal charges in their political
career. In Table-2.1C, one can see that there is positive correlation between the two
dimensions of criminal profile which are used as dependent variables (legal charges
&corruption charges). But most correlations are weak (less than 0.4), and also negative when
calculated against Par. Attendance Ratio. This indicates that these measures are proxying for
different attributes of legislator behaviour. In order to undertake the empirical examination in
the later stages, I have dropped MPs who have died (or was assassinated) before they finished
their respective tenure. I also excluded MPs who were elected in by-elections. This increases
the comparability of the unit of observations.
2.3.3 Empirical Methodology
The purpose of this analysis is to shed light on questions concerning the motivations of
dynastic politicians in Bangladesh. This is only possible when one carefully examines the
behaviour of such leaders in their political domain, which in practice is difficult. Rather, the
study has to rely on certain outcomes (as noted earlier) associated with each MP to infer
something about their motivations, and then find out whether their dynastic identity has any
role in explaining its variation within the sample. Therefore, a multiple regression framework
allows the study to see if there is a systematic relationship between the behaviour of MPs and
their dynastic identity. The multiple regression framework also allows us to control for
structural, individual and party characteristics that are identified in the literature as important
determinants of legislator behaviour. (Besley et al 2011; Eggers et al 2009; Gagliarducci et al
2008; Padro et al 2006)
To this end, I employ three base-line regressions. First, I try to model the variation in
parliamentary attendance of MPs with the econometric specification as mentioned below.

55
Parl.AttendanceRatioi, c = α+ µPre-Relativei,c+βXi,c,+δCc, +ζD+ έi, c (1)
Consequently, Parl. Attendance Ratio (as mentioned above)is a measure of attendance for an
MP [i] in constituency [c], and it takes the ratio between the number of parliamentary days
attended by a legislator and the number of days he can attend. This makes a score of one
indicate that the legislator was not absent for a single day in the parliament. Recall ,Pre-
relative which is equal to one whenever a legislator [i] from constituency [c] has or had a
relative entering office before he or she did, and zero otherwise. Xi,c, is a vector of individual
characteristics, and Cc, incorporates constituency level variables. I also include district
dummy variables ζD to account for basic regional differences, and εi is the random error term
Second, I use the specification in equation - (2) to see whether dynastic identity can predict
legal charges on MPs as mentioned in their respective personal affidavits submitted to
Bangladesh Election Commission. Hence, Legal Charges is a binary variable for an MP (i) in
constituency (c), which equals one if the candidate mentioned existing or past legal charges in
their personal affidavits, and zero otherwise.
Legal Chargesi, c = α + µPre-Relativei,c,+ βXi,c, +δCc,+ζD+έi, c(2)
Finally, the econometric model in equation-3 focuses on a specific kind of charge – corruption
charges. This explicit focus is interesting because it allows the study to relate closely to the
discussion in the theory section concerning dynastic politicians facing two opposing
incentives while they are in office – reputation-building versus stockpiling wealth.
Accordingly, Corruption Charges is an dummy variable for an MP (i) in constituency (c),
which equals one if the individual mentioned existing or past corruption charges in their
personal affidavits, and zero otherwise. In addition, the coefficient µhelps identify if dynastic
identity (at all) explains the variation in such charges.
Corruption Chargesi, c = α+ µPre-Relativei,c+βXi,c,+δCc+ζD+έi, c(3)
Now, it is essential to state that the empirical strategy will only allow us to detect a correlation
between the variables of interest, since the results might suffer from both omitted variable
bias. Even so, if the estimations produce a significant correlation between the variables of
56
interest, then this will provide adequate motivation for investigating a possible causal
relationship.
2.4 Results and Interpretations
The core results are presented and interpreted in section 2.4.1, while issues concerning
causality are addressed in section 2.4.2. Finally, I highlight some caveats of the present
analysis in section 2.4.3.
2.4.1 Base-line Results
2.4.1.1 Role of Dynastic Identity
Table 2.2 reports the regression results for all the MPs elected to the 8th National Parliament.
In particular, I examine whether the variation parliamentary attendance across MPs is
explained by their dynastic identity while I control for other important covariates. In column-
1-2, the specifications control for individual and constituency characteristics, and we can see
that the coefficient for Pre-relative is negative and significant at 10% in column-1, but fails to
attain significance in column-2. The explanatory power of the overall model is weak,
however. The R-square is less than 0.10in both columns indicating that the model fails to
explain even ten percentage variation in the parliamentary attendance ratio in all twenty-three
sessions of the 8th National Parliament. In column-3, I control for party fixed effects by
incorporating dummy variable for parties in the opposition (Awami League and Jatiya Party),
and this results in substantial improvement in the R-square. The model (with the party fixed
effects) now explains more than forty percentage variation in the dependent variable.
Interestingly, the coefficient for Pre-relative is negative and significant at 5%. The magnitude
of the coefficient is roughly (-) 0.067, which points out that legislators with dynastic identity
are on average associated with a six and a half percentage point less attendance than
legislators of non-dynastic identity.
For the mentioned results, I avoid a causal interpretation because under some circumstances
individual heterogeneity can create a spurious relationship between the variables of interest.
For example, if individuals who care about political status can marry into established
dynasties to benefit from political capital for other motives, and care less about parliamentary
performance, than such scenarios are likely to create a negative relationship between one’s
dynastic identity and his subsequent legislative performance measured in terms of attendance.
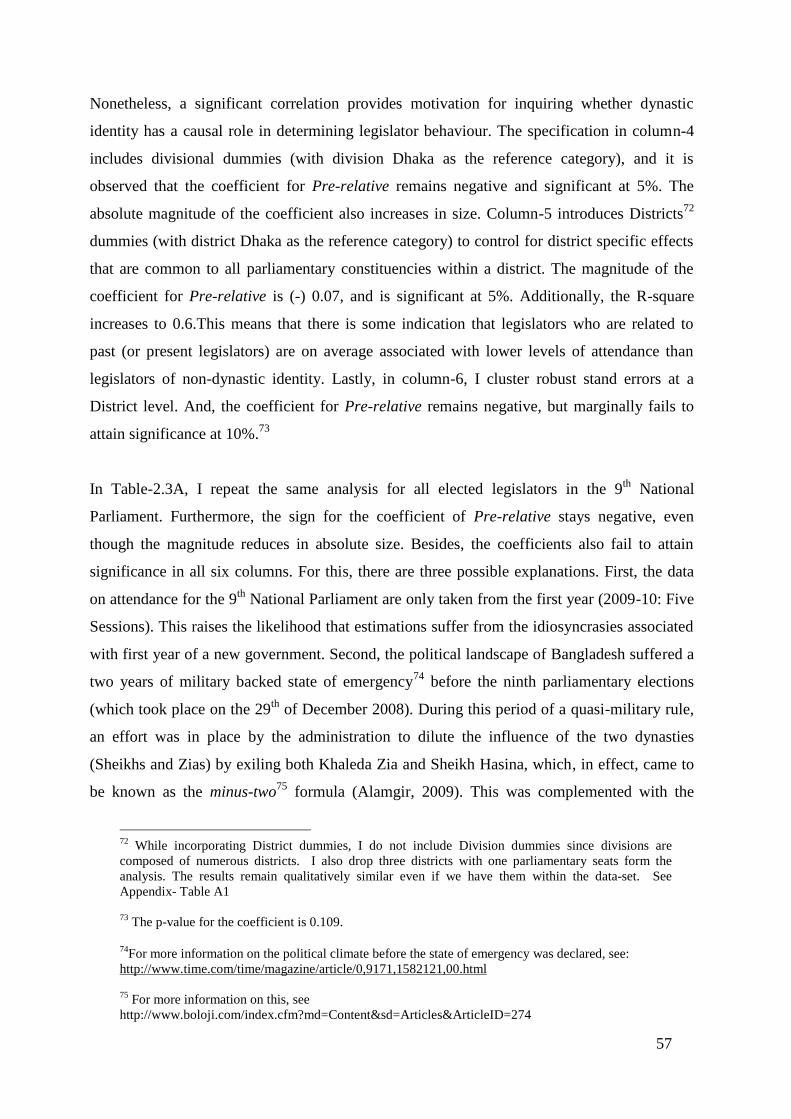
57
Nonetheless, a significant correlation provides motivation for inquiring whether dynastic
identity has a causal role in determining legislator behaviour. The specification in column-4
includes divisional dummies (with division Dhaka as the reference category), and it is
observed that the coefficient for Pre-relative remains negative and significant at 5%. The
absolute magnitude of the coefficient also increases in size. Column-5 introduces Districts72
dummies (with district Dhaka as the reference category) to control for district specific effects
that are common to all parliamentary constituencies within a district. The magnitude of the
coefficient for Pre-relative is (-) 0.07, and is significant at 5%. Additionally, the R-square
increases to 0.6.This means that there is some indication that legislators who are related to
past (or present legislators) are on average associated with lower levels of attendance than
legislators of non-dynastic identity. Lastly, in column-6, I cluster robust stand errors at a
District level. And, the coefficient for Pre-relative remains negative, but marginally fails to
attain significance at 10%.73
In Table-2.3A, I repeat the same analysis for all elected legislators in the 9th National
Parliament. Furthermore, the sign for the coefficient of Pre-relative stays negative, even
though the magnitude reduces in absolute size. Besides, the coefficients also fail to attain
significance in all six columns. For this, there are three possible explanations. First, the data
on attendance for the 9th National Parliament are only taken from the first year (2009-10: Five
Sessions). This raises the likelihood that estimations suffer from the idiosyncrasies associated
with first year of a new government. Second, the political landscape of Bangladesh suffered a
two years of military backed state of emergency74 before the ninth parliamentary elections
(which took place on the 29th of December 2008). During this period of a quasi-military rule,
an effort was in place by the administration to dilute the influence of the two dynasties
(Sheikhs and Zias) by exiling both Khaleda Zia and Sheikh Hasina, which, in effect, came to
be known as the minus-two75 formula (Alamgir, 2009). This was complemented with the
72 While incorporating District dummies, I do not include Division dummies since divisions arecomposed of numerous districts. I also drop three districts with one parliamentary seats form theanalysis. The results remain qualitatively similar even if we have them within the data-set. SeeAppendix- Table A1
73 The p-value for the coefficient is 0.109.
74For more information on the political climate before the state of emergency was declared, see:http://www.time.com/time/magazine/article/0,9171,1582121,00.html
75 For more information on this, seehttp://www.boloji.com/index.cfm?md=Content&sd=Articles&ArticleID=274
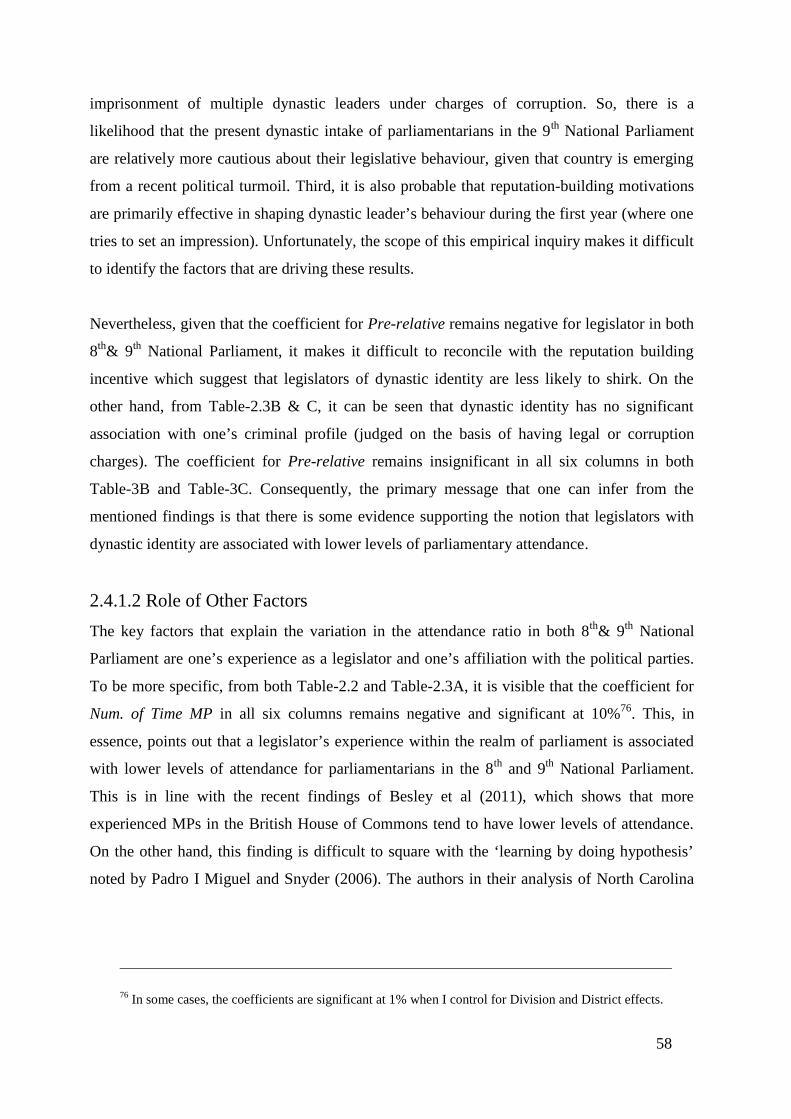
58
imprisonment of multiple dynastic leaders under charges of corruption. So, there is a
likelihood that the present dynastic intake of parliamentarians in the 9th National Parliament
are relatively more cautious about their legislative behaviour, given that country is emerging
from a recent political turmoil. Third, it is also probable that reputation-building motivations
are primarily effective in shaping dynastic leader’s behaviour during the first year (where one
tries to set an impression). Unfortunately, the scope of this empirical inquiry makes it difficult
to identify the factors that are driving these results.
Nevertheless, given that the coefficient for Pre-relative remains negative for legislator in both
8th& 9th National Parliament, it makes it difficult to reconcile with the reputation building
incentive which suggest that legislators of dynastic identity are less likely to shirk. On the
other hand, from Table-2.3B & C, it can be seen that dynastic identity has no significant
association with one’s criminal profile (judged on the basis of having legal or corruption
charges). The coefficient for Pre-relative remains insignificant in all six columns in both
Table-3B and Table-3C. Consequently, the primary message that one can infer from the
mentioned findings is that there is some evidence supporting the notion that legislators with
dynastic identity are associated with lower levels of parliamentary attendance.
2.4.1.2 Role of Other Factors
The key factors that explain the variation in the attendance ratio in both 8th& 9th National
Parliament are one’s experience as a legislator and one’s affiliation with the political parties.
To be more specific, from both Table-2.2 and Table-2.3A, it is visible that the coefficient for
Num. of Time MP in all six columns remains negative and significant at 10%76. This, in
essence, points out that a legislator’s experience within the realm of parliament is associated
with lower levels of attendance for parliamentarians in the 8th and 9th National Parliament.
This is in line with the recent findings of Besley et al (2011), which shows that more
experienced MPs in the British House of Commons tend to have lower levels of attendance.
On the other hand, this finding is difficult to square with the ‘learning by doing hypothesis’
noted by Padro I Miguel and Snyder (2006). The authors in their analysis of North Carolina
76 In some cases, the coefficients are significant at 1% when I control for Division and District effects.
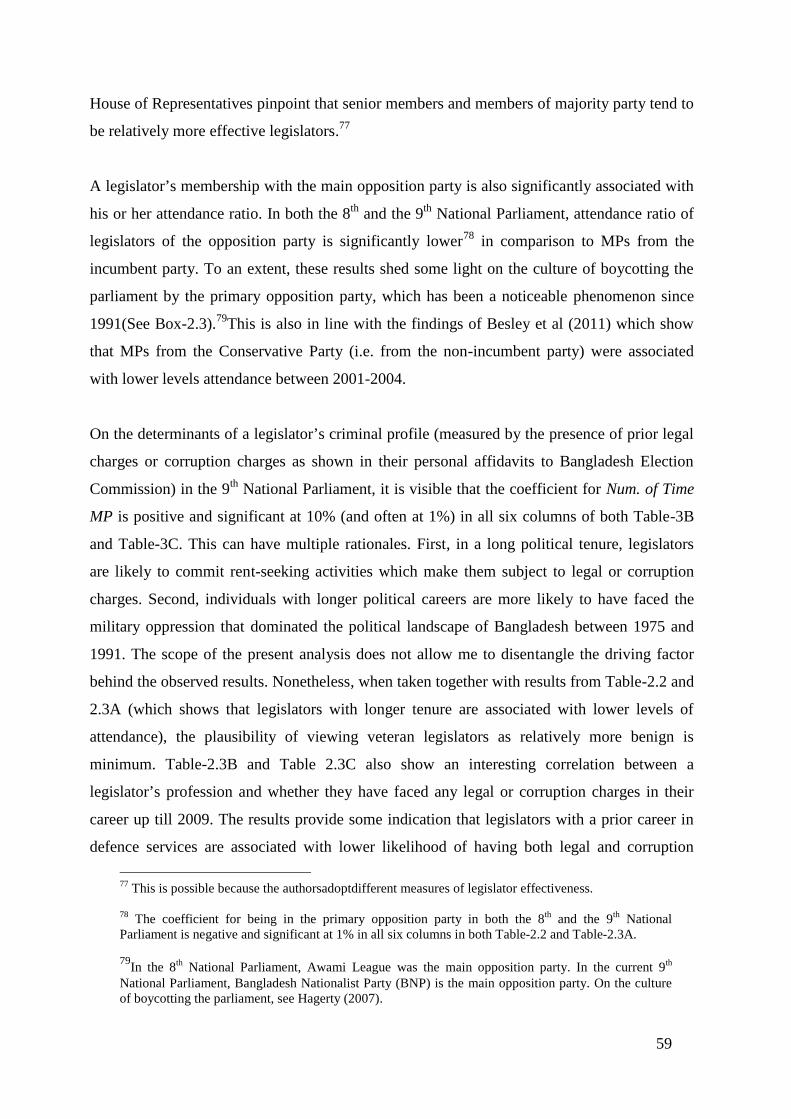
59
House of Representatives pinpoint that senior members and members of majority party tend to
be relatively more effective legislators.77
A legislator’s membership with the main opposition party is also significantly associated with
his or her attendance ratio. In both the 8th and the 9th National Parliament, attendance ratio of
legislators of the opposition party is significantly lower78 in comparison to MPs from the
incumbent party. To an extent, these results shed some light on the culture of boycotting the
parliament by the primary opposition party, which has been a noticeable phenomenon since
1991(See Box-2.3).79This is also in line with the findings of Besley et al (2011) which show
that MPs from the Conservative Party (i.e. from the non-incumbent party) were associated
with lower levels attendance between 2001-2004.
On the determinants of a legislator’s criminal profile (measured by the presence of prior legal
charges or corruption charges as shown in their personal affidavits to Bangladesh Election
Commission) in the 9th National Parliament, it is visible that the coefficient for Num. of Time
MP is positive and significant at 10% (and often at 1%) in all six columns of both Table-3B
and Table-3C. This can have multiple rationales. First, in a long political tenure, legislators
are likely to commit rent-seeking activities which make them subject to legal or corruption
charges. Second, individuals with longer political careers are more likely to have faced the
military oppression that dominated the political landscape of Bangladesh between 1975 and
1991. The scope of the present analysis does not allow me to disentangle the driving factor
behind the observed results. Nonetheless, when taken together with results from Table-2.2 and
2.3A (which shows that legislators with longer tenure are associated with lower levels of
attendance), the plausibility of viewing veteran legislators as relatively more benign is
minimum. Table-2.3B and Table 2.3C also show an interesting correlation between a
legislator’s profession and whether they have faced any legal or corruption charges in their
career up till 2009. The results provide some indication that legislators with a prior career in
defence services are associated with lower likelihood of having both legal and corruption
77 This is possible because the authorsadoptdifferent measures of legislator effectiveness.
78 The coefficient for being in the primary opposition party in both the 8th and the 9th NationalParliament is negative and significant at 1% in all six columns in both Table-2.2 and Table-2.3A.
79In the 8th National Parliament, Awami League was the main opposition party. In the current 9th
National Parliament, Bangladesh Nationalist Party (BNP) is the main opposition party. On the cultureof boycotting the parliament, see Hagerty (2007).
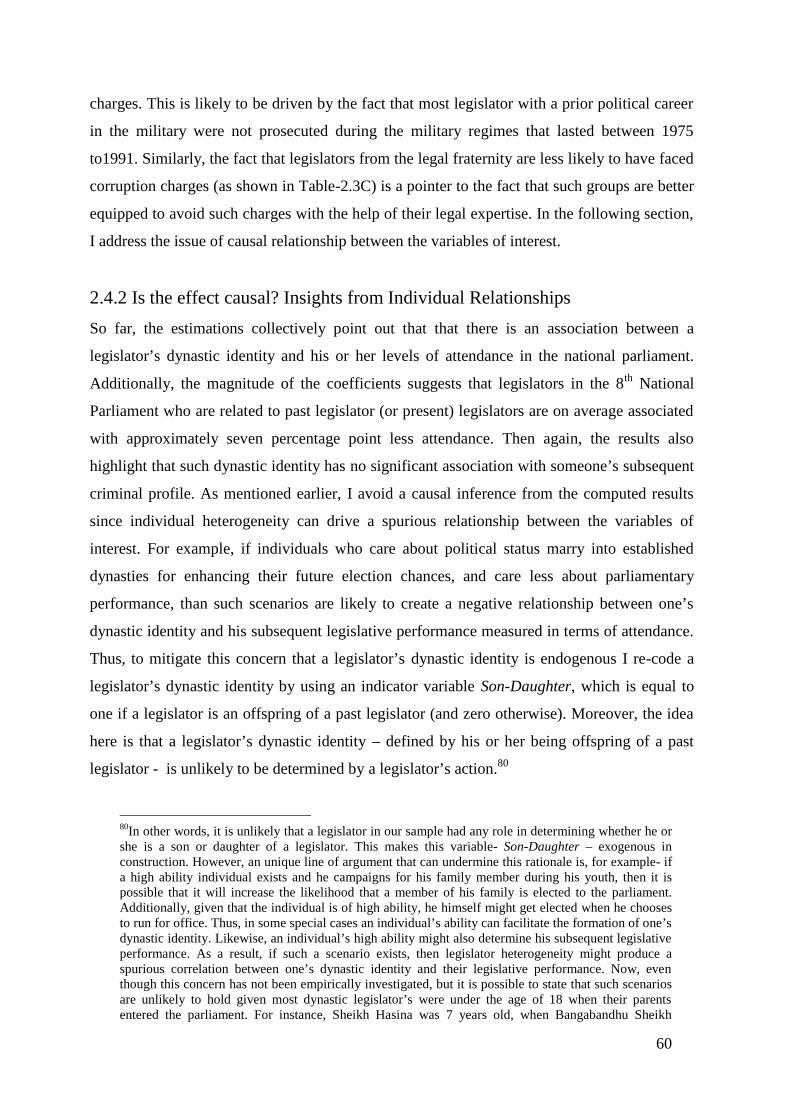
60
charges. This is likely to be driven by the fact that most legislator with a prior political career
in the military were not prosecuted during the military regimes that lasted between 1975
to1991. Similarly, the fact that legislators from the legal fraternity are less likely to have faced
corruption charges (as shown in Table-2.3C) is a pointer to the fact that such groups are better
equipped to avoid such charges with the help of their legal expertise. In the following section,
I address the issue of causal relationship between the variables of interest.
2.4.2 Is the effect causal? Insights from Individual Relationships
So far, the estimations collectively point out that that there is an association between a
legislator’s dynastic identity and his or her levels of attendance in the national parliament.
Additionally, the magnitude of the coefficients suggests that legislators in the 8th National
Parliament who are related to past legislator (or present) legislators are on average associated
with approximately seven percentage point less attendance. Then again, the results also
highlight that such dynastic identity has no significant association with someone’s subsequent
criminal profile. As mentioned earlier, I avoid a causal inference from the computed results
since individual heterogeneity can drive a spurious relationship between the variables of
interest. For example, if individuals who care about political status marry into established
dynasties for enhancing their future election chances, and care less about parliamentary
performance, than such scenarios are likely to create a negative relationship between one’s
dynastic identity and his subsequent legislative performance measured in terms of attendance.
Thus, to mitigate this concern that a legislator’s dynastic identity is endogenous I re-code a
legislator’s dynastic identity by using an indicator variable Son-Daughter, which is equal to
one if a legislator is an offspring of a past legislator (and zero otherwise). Moreover, the idea
here is that a legislator’s dynastic identity – defined by his or her being offspring of a past
legislator - is unlikely to be determined by a legislator’s action.80
80In other words, it is unlikely that a legislator in our sample had any role in determining whether he orshe is a son or daughter of a legislator. This makes this variable- Son-Daughter – exogenous inconstruction. However, an unique line of argument that can undermine this rationale is, for example- ifa high ability individual exists and he campaigns for his family member during his youth, then it ispossible that it will increase the likelihood that a member of his family is elected to the parliament.Additionally, given that the individual is of high ability, he himself might get elected when he choosesto run for office. Thus, in some special cases an individual’s ability can facilitate the formation of one’sdynastic identity. Likewise, an individual’s high ability might also determine his subsequent legislativeperformance. As a result, if such a scenario exists, then legislator heterogeneity might produce aspurious correlation between one’s dynastic identity and their legislative performance. Now, eventhough this concern has not been empirically investigated, but it is possible to state that such scenariosare unlikely to hold given most dynastic legislator’s were under the age of 18 when their parentsentered the parliament. For instance, Sheikh Hasina was 7 years old, when Bangabandhu Sheikh
61
Table-2.4 reports the regression results when I explore the variation in the parliamentary
attendance ratio for legislators in the 8th National Parliament. The specification in the first
column excludes Division and District fixed effects. Furthermore, the central message that
one can infer from the estimations is that a dynastic identity of a legislator is associated in
lower levels of parliamentary attendance. The absolute size of the coefficient for Son-
Daughter pinpoints that dynastic legislators have approximately nine percentage point less
attendance than non-dynastic legislators. This finding is robust to a number of legitimate
statistical concerns, and it even holds true when I cluster robust standard errors at District
level in column-4. Besides, in line with the previous results, a legislator’s experience and his
or party affiliation is strongly correlated to his or her attendance level. Similarly, from Table-
2.5A it can be seen that the coefficient relating a legislator’s dynastic identity and his or her
attendance level fails to attain significance once I employ the data set of legislator’s from the
9th National Parliament (although the coefficient remains negative once I control for District
fixed effects). Alternatively, results from Table-2.5A and Table-2.5B are suggestive that there
is no significant correlation between a legislator’s dynastic identity and his or her likelihood
of having a criminal profile. In Table-2.6, I check whether the results are qualitatively
different when I only explore the variation in attendance and criminal profile of legislators in
government (i.e. in the key ruling party) for both the 8th and 9th National Parliament. This is
done to address a rare scenario that dynastic legislators within the opposition are relatively
more likely to face government threats and this can constraint their performance in terms of
parliamentary attendance (or the likelihood of having legal or corruption charges). The results,
however, remain qualitatively similar.81 In Table-2.7, I address the concern that the computed
results are driven by the presence of legislators from the three key national political
dynasties.82 So, I check whether the key message is fundamentally altered when I drop
Mujibur Rahman was first elected to the Parliament in 1954. This makes it improbable that SheikhHasina had any role in Bangabandhu winning the election in 1954.
81From column-1, the results show that the absolute magnitude of the coefficient for Son-Daughter isapproximately (-)0.16. This is a substantial increment from the previous estimates, and it highlights thatdynastic identity (at least) mattered for the 8th National Parliament in determining parliamentaryattendance.
82 Being more precise, I drop all legislators from the 8th and 9th National Parliament who are in theSheikh, Zia or the Ershad dynasty. Now, it is important to mention that HM Ershad (the formerPresident) is not an offspring of a past legislator. Nonetheless, he did establish his dynasty as hisbrother GM Qader and wife Raushan Ershad have been elected in both the 8th and 9th NationalParliament.

62
legislators from the three key political dynasties.83 Nonetheless, the results remain similar and
that there is some evidence supporting the notion that dynastic identity can facilitate shirking
among legislator. Even so, it is still very difficult to rule out the role of omitted factors that
might be correlated with both shirking and being a descendant of a political leader.
On the whole, the over results from the stated analysis are not compatible with the reputation
building incentive. If anything, the result from Table 2.4, Table-2.6 and Table-2.7 are
indicative of the fact that a legislator’s dynastic identity may play a causal role in facilitating
behaviour that amounts to shirking. In the next section, I discuss some issues concerning the
analysis, and note some caveats of the mentioned scrutiny.
2.4.3Some Discussions and Caveats
An important caveat of the present empirical investigation is the narrowness of the perspective
that I have taken in terms of assessing legislator behaviour. By primarily focusing on
parliamentary attendance and the likelihood of having a legal or corruption charge, I have
implicitly raised the possibility that the employed evaluation is narrow in scope, and
consequently sheds little light on the motivations of dynastic legislator. This is because it is
arguable that there are other possible standards for evaluating MPs behaviour which are more
informative about their guiding motivations. For example, Sen (1981, 1984) and Ram (1991)
have shown that famines are less likely in functioning democracies with free media and open
election. Similarly, Besley and Burgess (2002) has used state level data from India to show
that governments are more responsive to falls in food production and flood damage via public
food distribution and calamity relief expenditure where newspaper circulation is higher and
electoral accountability is greater. This, in essence, highlights the chance that one can judge
legislators’ performance in terms of their responsiveness to acute needs of their constituencies
when they are facing phenomenon like drought, floods or famine. More specifically, in
Bangladesh where natural calamities like floods or land erosion84 are common, it is imperative
to state that any assessment of MP behaviour which measures how responsive legislators were
to acute needs is more informative than any measure which only focuses on legislative
83 In appendix Table -2.1A, report regressions results where district dummies and part dummies arerandomly chosen. These estimations also include districts with one parliamentary seat. I have alsocompute the adjusted R-square. Overall, the results echo the general findings mentioned above.
84 On the impact of floods in Bangladesh, see http://www.nytimes.com/1988/09/07/world/by-the-river-refuge-but-little-relief.html
63
performance. Unfortunately, due to the lack of quantifiable indicators which can measure the
responsiveness of legislators to such acute needs (due to famines or floods) of his or her
constituents, such dimension of legislator behaviour are not considered in the present study.
It is also arguable that there are better measures of parliamentary performance than one’s
focusing primarily on attendance. For example, Besley et al (2011) constructs a ‘cost per vote’
measure of parliamentary performance in the British House of Commons, which is basically a
ratio of allowance received by a legislator to the number of votes caste by him or her in a
given year. Regrettably, I have failed to replicate such a measure for the present study since
no data on allowances85 of legislators are provided by the Legal Office of the National
Parliament of Bangladesh.86 Besides, Article 70 in the Constitution of Bangladesh prohibits
legislators from voting against bills sponsored by their respective party. If the legislator’s do
so, however, then they will lose the membership of the house. This makes it irrelevant to
investigate voting patterns87 of legislator 88 as there are no cases where legislators have defied
their party’s decision in the 8th and 9th National Parliament. Even so, an advantage of the
employed measure is that it is simple and objective in construction. In addition, parliamentary
attendance is the minimum voters can expect from their MP. A measure of attendance can
also reflect a legislator’s general involvement with everyday legislative business, and an MP
can also use the parliament as a venue for appealing for greater development fund for their
respective constituencies. Thus, with these caveats and issues in mind, I proceed to the
conclusion
85Member of Parliament (MPs) in Bangladesh often claims medical and travelling expenses from theOffice of the Prime Minister or from the Office of the Speaker. Detailed information on suchprovisions are, however, not easily available to the ordinary public. Irregularities on such fronts havealso taken place in the past.For more information see: http://www.thedailystar.net/story.php?nid=83983
86I can compute a similar measure by dividing MP salary with parliamentary participation measure.Nonetheless, since MP salary is constant across all legislators, no added information will inferred fromsuch exercise. Furthermore, I tried accessing information on number of bill sponsored and floorspeeches made by individuallegislators. These measures are often used to see how term limits affectpolitical performance (For example Dalbo and Rossi, 2008). However, the paper was denied access tosuch information on grounds that such information can embarrass key figures in the incumbentgovernment.
87 Voting patterns are often investigated to see whether retiring legislators vote differently in their lastterm. See: Lott and Bronars (1993)
88For more clarity, see:http://www.commonlii.org/bd/legis/const/2004/part5.html#70. Additionally, forits subsequent effects ,read: http://www.sunday-guardian.com/analysis/article-70-guts-parliament
64
2.5 Conclusion
The principle aim of this paper is to isolate whether dynastic identity matters in influencing
the behaviour of politicians. This is important because dynastic politicians play a pivotal role
in the political landscape of various countries in different degrees and forms. In modern
democratic political process, their presence reflects inequality in the distribution of political
power (Dal Bo et al 2009), since they are likely to benefit from inherited political capital, As
it appears, very few systematic empirical analysis exists which investigates the motivations of
leaders with such identity. The only sub-national empirical study that attempts to pinpoint the
economic consequences of dynastic leaders is Asaka et al (2010), which notes that dynastic
legislators in Japanese Diet produces suboptimal economic allocation of resources. Thus, to
shed further insight on the possible role of dynastic identity in determining political
behaviour, the study compiles a new data set on all legislators in the 8th and 9th National
Parliament of Bangladesh. The polity of Bangladesh provides an excellent ground for
empirical examination because dynastic leaders play a fundamental role in determining
outcome within the political landscape of the country. To be more specific, the two main
political parties (Awami League and BNP) are chaired by dynastic leaders, and (as earlier
mentioned in the paper) their influence is felt at the both local and national levels. Besides,
almost all work on the legislative behaviour has focused on the polities of North America and
Europe to examine multiple hypotheses. This makes it interesting to empirically scrutinize
whether some of the findings are echoed in the data from a polity where democracy is still in
the process of consolidation.
To quantify legislator behaviour, I construct a dependent variable Parliamentary-Attendance-
Ratio for all legislators in the 8th and 9th National Parliament, which ranges between zero and
one. For legislators in the 9th National Parliament, I also compute two additional dependent
binary variables Legal-Charges and Corruption-Charges, which are equal to one if they have
such charges on their affidavits before they contested the 9th parliamentary elections. The
rationale for this is to shed some light on the criminal profiles of legislator. Furthermore, the
econometric methodology primarily tries to identify if a legislator’s behaviour (captured by
these dependent variable) is explained by a legislator’s dynastic identity once other structural
characteristic are controlled for within the analysis. To begin with, the paper starts by
discussing that it is theoretically ambiguous how a legislator’s dynastic identity should
65
influence his or her behaviour. This is because the behaviour of dynastic legislators can be
influenced by two opposing incentives, namely reputation-building incentive and stockpiling-
wealth incentive. And, as noted earlier, the overall results are difficult to square with
reputation-building incentive. The base line results from table-2 and table -3 (A, B & C) are
suggestive that dynastic legislators in the 8th National Parliament89 are associated with lower
levels of attendance. On the other hand, no significant relationship is identified between a
legislator’s dynastic identity and the likelihood of having legal or corruption charges. I
interpret these results as correlation, because under some rare circumstances an individual
dynastic identity can be endogenous in construction.90
In order to mitigate the role of omitted factor, the investigation looks at individual
relationships to reclassify dynastic leaders as legislators who are direct offspring of past
legislators. This minimizes the chance a legislator has in determining his or her dynastic
identity. And, the results from table-2.4 and table-2.5A are indicative that offspring of past
legislators (in the 8th National Parliament) have on average lower levels of attendance. The
results are consistent when I restrict the sample to legislator from government to address the
concern that dynastic legislators in the opposition are subject to relatively more threats from
incumbent government. I also see whether the results are driven by the presence of three key
national dynasties, and the estimations suggest that the key message remains robust even
when I drop these observations from the employed data set. Likewise, the magnitude of the
coefficient for the variable Son-Daughter ranges between (-)0.066 to (-) 0.15, which points
out that legislators who are offspring of past legislators on average have at least 6.5
percentage point lower attendance than non-dynastic legislators. This also makes the findings
difficult to reconcile with the reputation building hypothesis for dynastic politician.
Conversely, the results are (to an extent) in line with the findings of Asaka et al (2010) which
finds that dynastic legislators do not necessarily result in higher economic performance. On
the role of other factors determining legislative behaviour, the paper finds that legislators with
more experience (in both the 8th and the 9th National parliament) have lower levels of
attendance. This is in line with the recent findings of Besley et al (2011) which pinpoints a
89 The coefficients for Pre-Relative is negative for the legislators in the 9th National Parliament, eventhough they fail to attain significance at 10%.
90For example, individuals with political ambition can marry into political families to boost theirpolitical career. Such individuals might also not care about the parliamentary attendance level. Thismight create a spurious relationship between one’s dynastic identity and his or her subsequentlegislative performance.

66
similar phenomenon in the British House of Commons. This paper also provide some
evidence that legislators of certain professions (military and lawyer) have lower likelihood of
having criminal profile, even though dynastic identity plays no role in explaining its variation
Overall, the results taken together are indicative that dynastic identity can have a role in
determining the level of shirking a legislator exhibits in the 8th National Parliament. This has
an important implication. In other words, while modern democracies provide room for
dynastic transmission of political power, the leaders who avail such identity do not necessarily
act in public interest. This brings to attention some important unresolved issues, which future
studies can address. To start with, does dynastic identity also motivates sub-optimal behaviour
on other dimensions of public life? If so, what are these dimensions? Furthermore, what exact
combination of factor makes dynastic identity to matter? Is it their familiarity with pre-
established donor networks that gives them a competitive edge against their rivals? Or is it
their ‘brand-name’ which emerges from the electoral appeal of their family name that allows
them to restrict the entry of any potential competitor? In addition, given that dynastic
politicians often emerge at the national level of many countries, is it possible that such
‘identity’ can shape socio-political outcomes at the macro-level? More precisely, do countries
with a heavy influence of ‘dynasty politics’ at the national level benefit or suffer from better
or worse governance scenario?
To conclude, in contemporary times there is an increased interest in understanding the role of
identity (being female, or from the minority etc) in determining legislative behaviour, and
subsequently affecting policy choices (Rehavi, 2007; Chattopadhyay and Duflo, 2004; Pande
2003). The novelty of this paper, however, is that it focuses on the importance of dynastic
identity in determining legislator behaviour. Hence, future work on this topic can investigate
whether the observed relationship finds support in different political landscapes. Additionally,
it can scrutinize the potential mechanisms that allow dynastic identity to matter, and shed
more light on factors that makes such groups to emerge and endure in respective political
arenas.
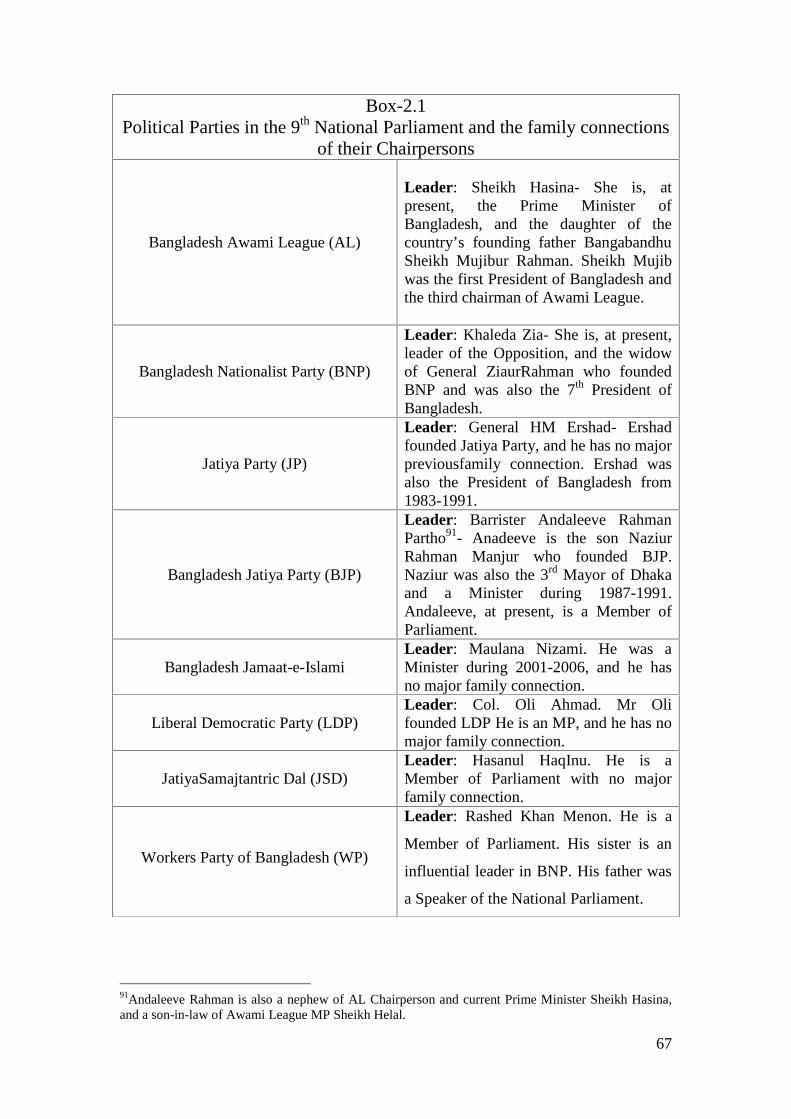
67
91Andaleeve Rahman is also a nephew of AL Chairperson and current Prime Minister Sheikh Hasina,and a son-in-law of Awami League MP Sheikh Helal.
Box-2.1Political Parties in the 9th National Parliament and the family connections
of their Chairpersons
Bangladesh Awami League (AL)
Leader: Sheikh Hasina- She is, atpresent, the Prime Minister ofBangladesh, and the daughter of thecountry’s founding father BangabandhuSheikh Mujibur Rahman. Sheikh Mujibwas the first President of Bangladesh andthe third chairman of Awami League.
Bangladesh Nationalist Party (BNP)
Leader: Khaleda Zia- She is, at present,leader of the Opposition, and the widowof General ZiaurRahman who foundedBNP and was also the 7th President ofBangladesh.
Jatiya Party (JP)
Leader: General HM Ershad- Ershadfounded Jatiya Party, and he has no majorpreviousfamily connection. Ershad wasalso the President of Bangladesh from1983-1991.
Bangladesh Jatiya Party (BJP)
Leader: Barrister Andaleeve RahmanPartho91- Anadeeve is the son NaziurRahman Manjur who founded BJP.Naziur was also the 3rd Mayor of Dhakaand a Minister during 1987-1991.Andaleeve, at present, is a Member ofParliament.
Bangladesh Jamaat-e-IslamiLeader: Maulana Nizami. He was aMinister during 2001-2006, and he hasno major family connection.
Liberal Democratic Party (LDP)Leader: Col. Oli Ahmad. Mr Olifounded LDP He is an MP, and he has nomajor family connection.
JatiyaSamajtantric Dal (JSD)Leader: Hasanul HaqInu. He is aMember of Parliament with no majorfamily connection.
Workers Party of Bangladesh (WP)
Leader: Rashed Khan Menon. He is a
Member of Parliament. His sister is an
influential leader in BNP. His father was
a Speaker of the National Parliament.

68
Box- 2.2
Low Attendance Records
9th National Parliament (Five Sessions)
Rank Name Par. Attendance Ratio Dynastic
1 Begum Khaleda Zia 0.03 Yes
2 KSMH Kaikobad 0.06 No
3 Barrister Andaleeve Rahman 0.07 Yes
4 Md BarkatUllah Bulu 0.08 No
8th National Parliament (Twenty Three Sessions)
Rank Name Dynastic
1 Altaf Hossain Goldaz 0.06 No
2 Dr Abdul Moyeen Khan 0.07 Yes
3 Sheikh Helal Uddin 0.08 Yes
4 Kazi Zafurullah 0.11 Yes
Box- 2.3
Boycott of Parliament By Opposition Parties
Parliament Ruling Party Main Opposition Total Working Days Total Days of
Opposition Boycott
1991-1996 BNP Awami League 400 118
1996-2001 Awami League BNP 383 156
2001-2006 BNP Awami League 373 223
Source: Moniruzzaman (2009)
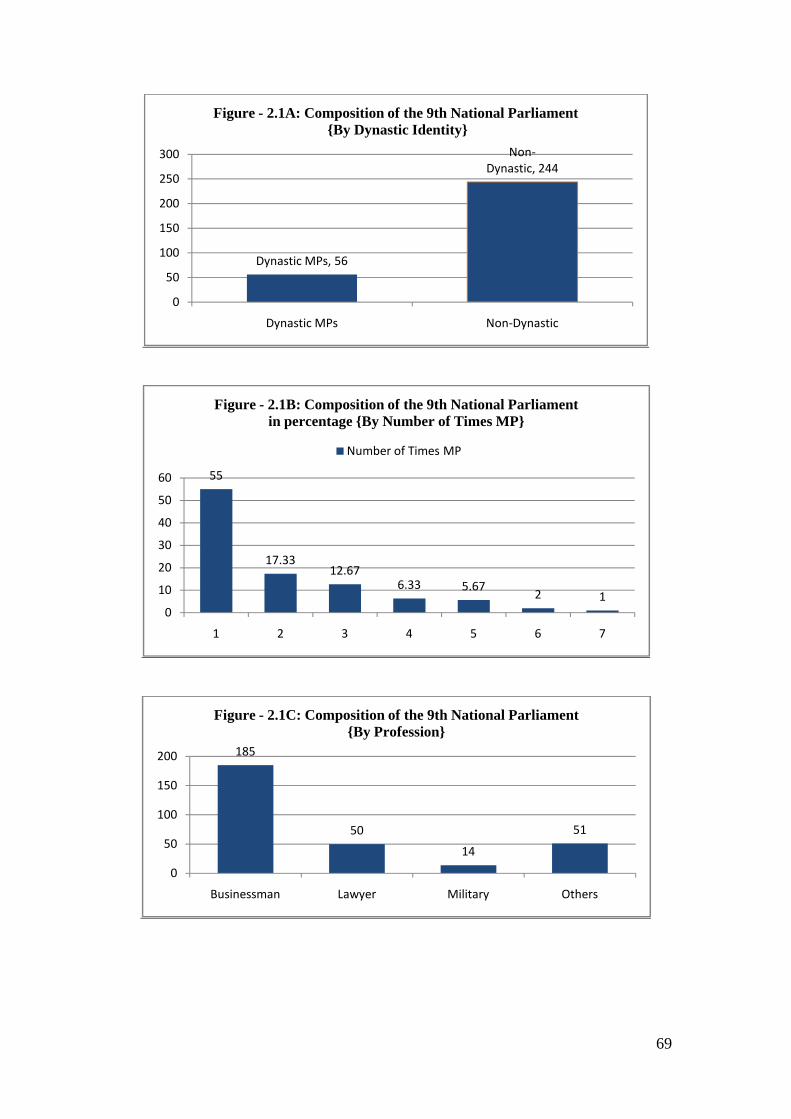
69
Dynastic MPs, 56
Non-Dynastic, 244
0
50
100
150
200
250
300
Dynastic MPs Non-Dynastic
Figure - 2.1A: Composition of the 9th National ParliamentBy Dynastic Identity
55
17.3312.67
6.33 5.67 2 10
10
20
30
40
50
60
1 2 3 4 5 6 7
Figure - 2.1B: Composition of the 9th National Parliamentin percentage By Number of Times MP
Number of Times MP
185
50
14
51
0
50
100
150
200
Businessman Lawyer Military Others
Figure - 2.1C: Composition of the 9th National ParliamentBy Profession

70
Dynastic MPs, 52
Non-DynasticMPs, 246
0
50
100
150
200
250
300
Dynastic MPs Non-Dynastic MPs
Figure - 2.2A: Composition of the 8th National ParliamentBy Dynastic Identity
25.5 25.85
19.1323.15
5.031
0
5
10
15
20
25
30
1 2 3 4 5 6
Figure - 2.2B: Composition of the 8th National Parliament inpercebtage By Number of Times MP
Number of Times MP
178
3515
72
0
50
100
150
200
Businessman Lawyer Military Others
Figure - 2.2C: Composition of the 8th National Parliament ByProfession
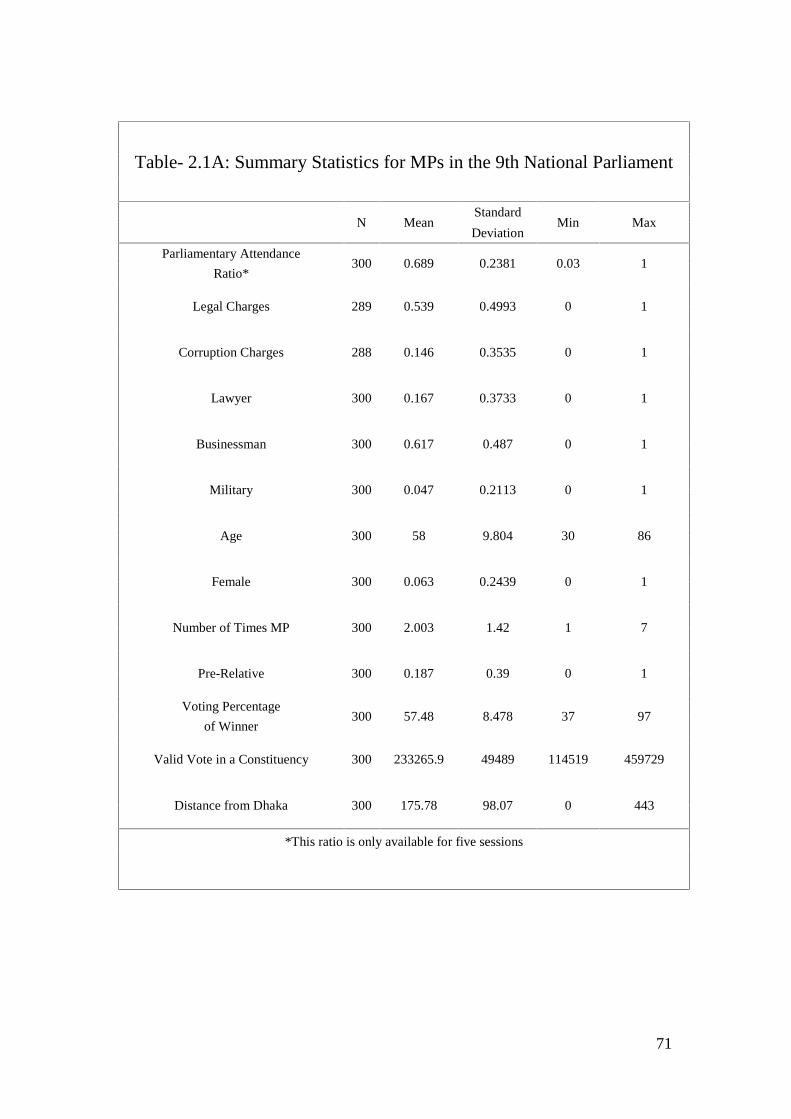
71
Table- 2.1A: Summary Statistics for MPs in the 9th National Parliament
N MeanStandard
Min MaxDeviation
Parliamentary Attendance300 0.689 0.2381 0.03 1
Ratio*
Legal Charges 289 0.539 0.4993 0 1
Corruption Charges 288 0.146 0.3535 0 1
Lawyer 300 0.167 0.3733 0 1
Businessman 300 0.617 0.487 0 1
Military 300 0.047 0.2113 0 1
Age 300 58 9.804 30 86
Female 300 0.063 0.2439 0 1
Number of Times MP 300 2.003 1.42 1 7
Pre-Relative 300 0.187 0.39 0 1
Voting Percentage300 57.48 8.478 37 97
of Winner
Valid Vote in a Constituency 300 233265.9 49489 114519 459729
Distance from Dhaka 300 175.78 98.07 0 443
*This ratio is only available for five sessions
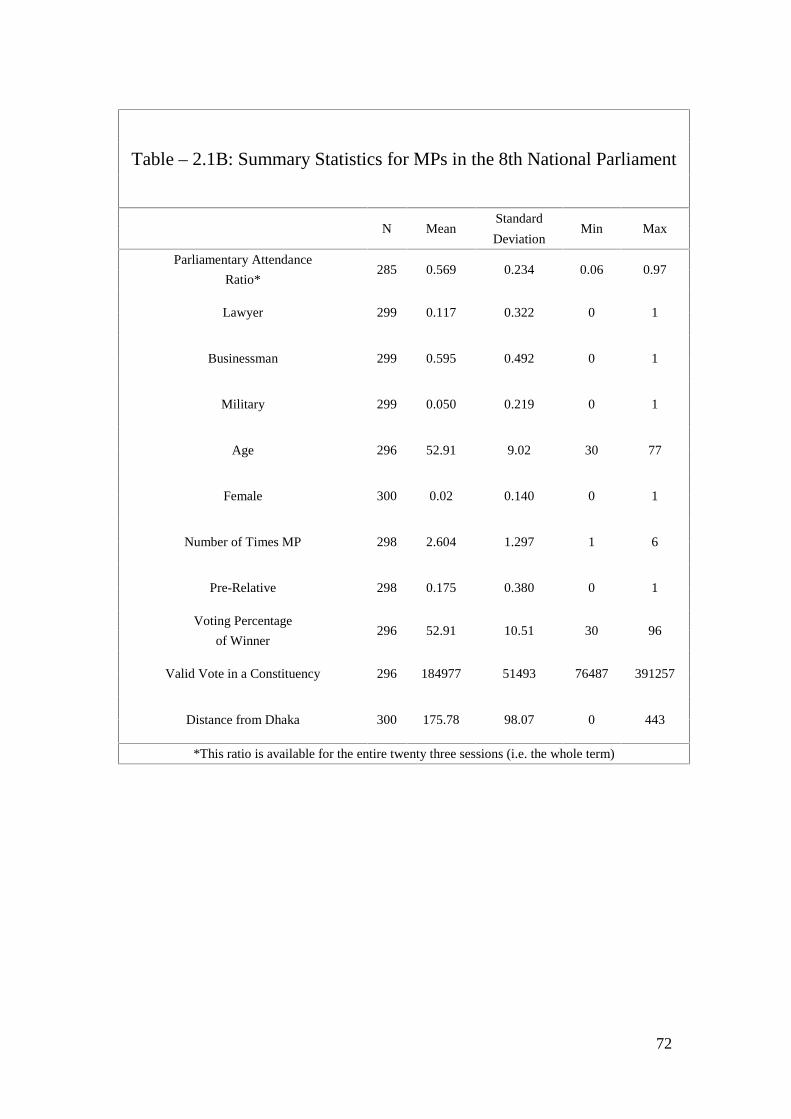
72
Table – 2.1B: Summary Statistics for MPs in the 8th National Parliament
N MeanStandard
Min MaxDeviation
Parliamentary Attendance285 0.569 0.234 0.06 0.97
Ratio*
Lawyer 299 0.117 0.322 0 1
Businessman 299 0.595 0.492 0 1
Military 299 0.050 0.219 0 1
Age 296 52.91 9.02 30 77
Female 300 0.02 0.140 0 1
Number of Times MP 298 2.604 1.297 1 6
Pre-Relative 298 0.175 0.380 0 1
Voting Percentage296 52.91 10.51 30 96
of Winner
Valid Vote in a Constituency 296 184977 51493 76487 391257
Distance from Dhaka 300 175.78 98.07 0 443
*This ratio is available for the entire twenty three sessions (i.e. the whole term)
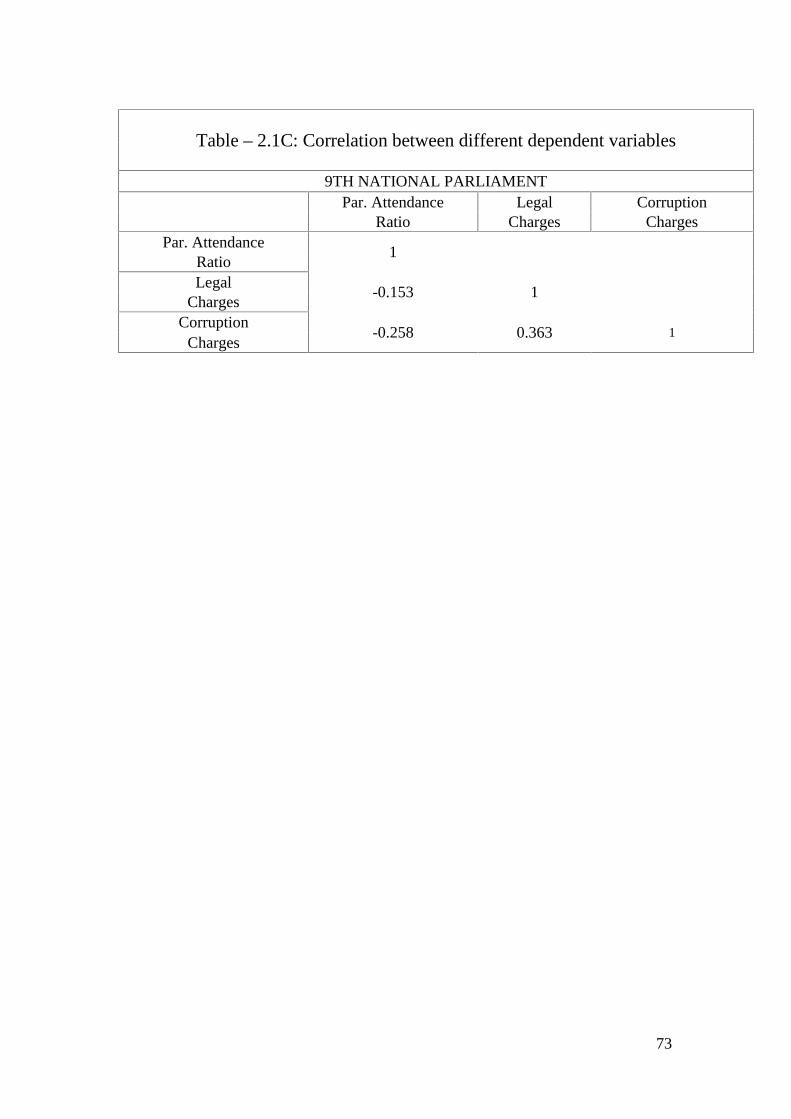
73
Table – 2.1C: Correlation between different dependent variables
9TH NATIONAL PARLIAMENTPar. Attendance Legal Corruption
Ratio Charges ChargesPar. Attendance
1RatioLegal
-0.153 1Charges
Corruption-0.258 0.363 1
Charges
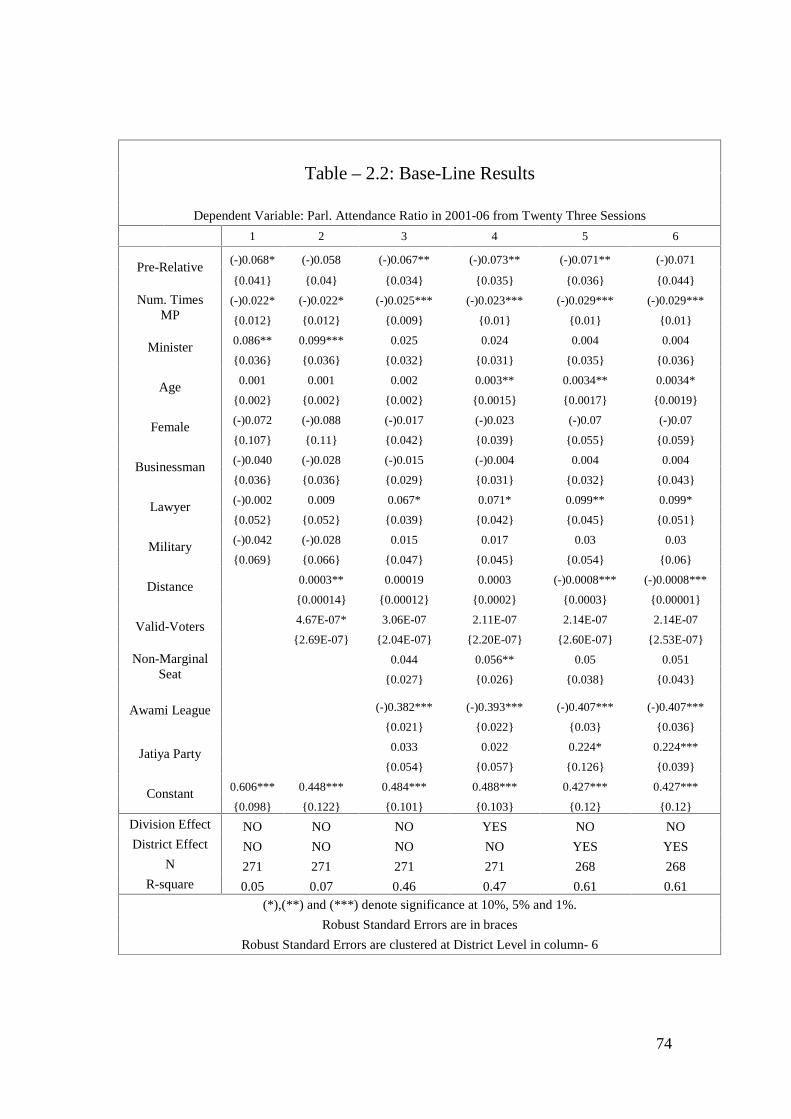
74
Table – 2.2: Base-Line Results
Dependent Variable: Parl. Attendance Ratio in 2001-06 from Twenty Three Sessions
1 2 3 4 5 6
Pre-Relative(-)0.068* (-)0.058 (-)0.067** (-)0.073** (-)0.071** (-)0.071
0.041 0.04 0.034 0.035 0.036 0.044
Num. TimesMP
(-)0.022* (-)0.022* (-)0.025*** (-)0.023*** (-)0.029*** (-)0.029***
0.012 0.012 0.009 0.01 0.01 0.01
Minister 0.086** 0.099*** 0.025 0.024 0.004 0.004
0.036 0.036 0.032 0.031 0.035 0.036
Age 0.001 0.001 0.002 0.003** 0.0034** 0.0034*
0.002 0.002 0.002 0.0015 0.0017 0.0019
Female (-)0.072 (-)0.088 (-)0.017 (-)0.023 (-)0.07 (-)0.07
0.107 0.11 0.042 0.039 0.055 0.059
Businessman (-)0.040 (-)0.028 (-)0.015 (-)0.004 0.004 0.004
0.036 0.036 0.029 0.031 0.032 0.043
Lawyer (-)0.002 0.009 0.067* 0.071* 0.099** 0.099*
0.052 0.052 0.039 0.042 0.045 0.051
Military (-)0.042 (-)0.028 0.015 0.017 0.03 0.03
0.069 0.066 0.047 0.045 0.054 0.06
Distance 0.0003** 0.00019 0.0003 (-)0.0008*** (-)0.0008***
0.00014 0.00012 0.0002 0.0003 0.00001
Valid-Voters 4.67E-07* 3.06E-07 2.11E-07 2.14E-07 2.14E-07
2.69E-07 2.04E-07 2.20E-07 2.60E-07 2.53E-07
Non-MarginalSeat
0.044 0.056** 0.05 0.051
0.027 0.026 0.038 0.043
Awami League (-)0.382*** (-)0.393*** (-)0.407*** (-)0.407***
0.021 0.022 0.03 0.036
Jatiya Party 0.033 0.022 0.224* 0.224***
0.054 0.057 0.126 0.039
Constant 0.606*** 0.448*** 0.484*** 0.488*** 0.427*** 0.427***
0.098 0.122 0.101 0.103 0.12 0.12
Division Effect NO NO NO YES NO NODistrict Effect NO NO NO NO YES YES
N 271 271 271 271 268 268R-square 0.05 0.07 0.46 0.47 0.61 0.61
(*),(**) and (***) denote significance at 10%, 5% and 1%.
Robust Standard Errors are in braces
Robust Standard Errors are clustered at District Level in column- 6
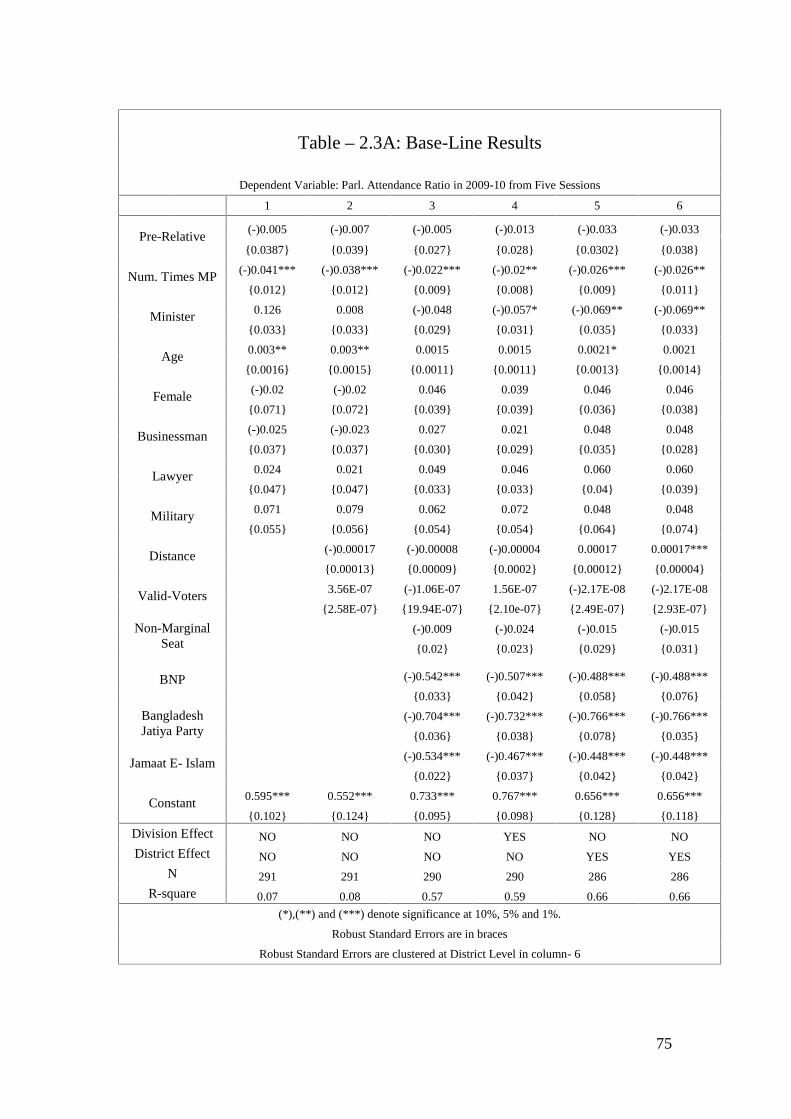
75
Table – 2.3A: Base-Line Results
Dependent Variable: Parl. Attendance Ratio in 2009-10 from Five Sessions
1 2 3 4 5 6
Pre-Relative(-)0.005 (-)0.007 (-)0.005 (-)0.013 (-)0.033 (-)0.033
0.0387 0.039 0.027 0.028 0.0302 0.038
Num. Times MP (-)0.041*** (-)0.038*** (-)0.022*** (-)0.02** (-)0.026*** (-)0.026**
0.012 0.012 0.009 0.008 0.009 0.011
Minister 0.126 0.008 (-)0.048 (-)0.057* (-)0.069** (-)0.069**
0.033 0.033 0.029 0.031 0.035 0.033
Age 0.003** 0.003** 0.0015 0.0015 0.0021* 0.0021
0.0016 0.0015 0.0011 0.0011 0.0013 0.0014
Female (-)0.02 (-)0.02 0.046 0.039 0.046 0.046
0.071 0.072 0.039 0.039 0.036 0.038
Businessman (-)0.025 (-)0.023 0.027 0.021 0.048 0.048
0.037 0.037 0.030 0.029 0.035 0.028
Lawyer 0.024 0.021 0.049 0.046 0.060 0.060
0.047 0.047 0.033 0.033 0.04 0.039
Military 0.071 0.079 0.062 0.072 0.048 0.048
0.055 0.056 0.054 0.054 0.064 0.074
Distance (-)0.00017 (-)0.00008 (-)0.00004 0.00017 0.00017***
0.00013 0.00009 0.0002 0.00012 0.00004
Valid-Voters 3.56E-07 (-)1.06E-07 1.56E-07 (-)2.17E-08 (-)2.17E-08
2.58E-07 19.94E-07 2.10e-07 2.49E-07 2.93E-07
Non-MarginalSeat
(-)0.009 (-)0.024 (-)0.015 (-)0.015
0.02 0.023 0.029 0.031
BNP (-)0.542*** (-)0.507*** (-)0.488*** (-)0.488***
0.033 0.042 0.058 0.076
BangladeshJatiya Party
(-)0.704*** (-)0.732*** (-)0.766*** (-)0.766***
0.036 0.038 0.078 0.035
Jamaat E- Islam (-)0.534*** (-)0.467*** (-)0.448*** (-)0.448***
0.022 0.037 0.042 0.042
Constant 0.595*** 0.552*** 0.733*** 0.767*** 0.656*** 0.656***
0.102 0.124 0.095 0.098 0.128 0.118
Division Effect NO NO NO YES NO NO
District Effect NO NO NO NO YES YES
N 291 291 290 290 286 286
R-square 0.07 0.08 0.57 0.59 0.66 0.66
(*),(**) and (***) denote significance at 10%, 5% and 1%.
Robust Standard Errors are in braces
Robust Standard Errors are clustered at District Level in column- 6
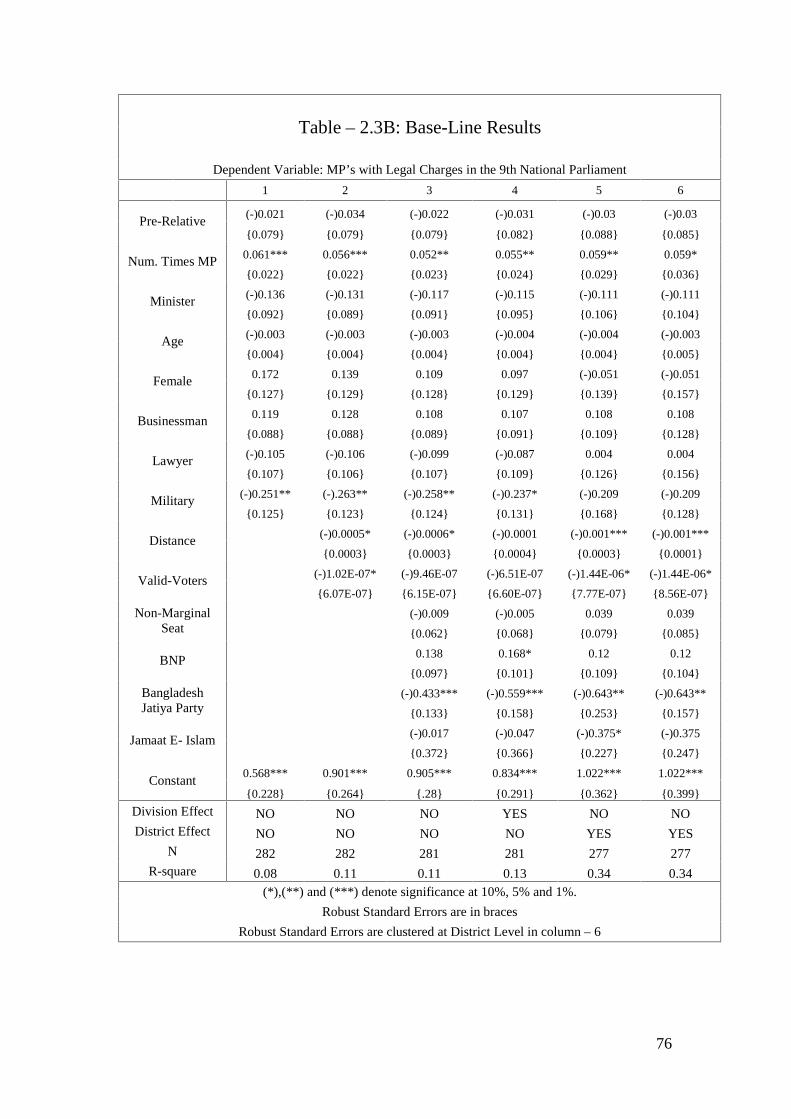
76
Table – 2.3B: Base-Line Results
Dependent Variable: MP’s with Legal Charges in the 9th National Parliament
1 2 3 4 5 6
Pre-Relative(-)0.021 (-)0.034 (-)0.022 (-)0.031 (-)0.03 (-)0.03
0.079 0.079 0.079 0.082 0.088 0.085
Num. Times MP 0.061*** 0.056*** 0.052** 0.055** 0.059** 0.059*
0.022 0.022 0.023 0.024 0.029 0.036
Minister (-)0.136 (-)0.131 (-)0.117 (-)0.115 (-)0.111 (-)0.111
0.092 0.089 0.091 0.095 0.106 0.104
Age (-)0.003 (-)0.003 (-)0.003 (-)0.004 (-)0.004 (-)0.003
0.004 0.004 0.004 0.004 0.004 0.005
Female 0.172 0.139 0.109 0.097 (-)0.051 (-)0.051
0.127 0.129 0.128 0.129 0.139 0.157
Businessman 0.119 0.128 0.108 0.107 0.108 0.108
0.088 0.088 0.089 0.091 0.109 0.128
Lawyer (-)0.105 (-)0.106 (-)0.099 (-)0.087 0.004 0.004
0.107 0.106 0.107 0.109 0.126 0.156
Military (-)0.251** (-).263** (-)0.258** (-)0.237* (-)0.209 (-)0.209
0.125 0.123 0.124 0.131 0.168 0.128
Distance (-)0.0005* (-)0.0006* (-)0.0001 (-)0.001*** (-)0.001***
0.0003 0.0003 0.0004 0.0003 0.0001
Valid-Voters (-)1.02E-07* (-)9.46E-07 (-)6.51E-07 (-)1.44E-06* (-)1.44E-06*
6.07E-07 6.15E-07 6.60E-07 7.77E-07 8.56E-07
Non-MarginalSeat
(-)0.009 (-)0.005 0.039 0.039
0.062 0.068 0.079 0.085
BNP 0.138 0.168* 0.12 0.12
0.097 0.101 0.109 0.104
BangladeshJatiya Party
(-)0.433*** (-)0.559*** (-)0.643** (-)0.643**
0.133 0.158 0.253 0.157
Jamaat E- Islam (-)0.017 (-)0.047 (-)0.375* (-)0.375
0.372 0.366 0.227 0.247
Constant0.568*** 0.901*** 0.905*** 0.834*** 1.022*** 1.022***
0.228 0.264 .28 0.291 0.362 0.399
Division Effect NO NO NO YES NO NODistrict Effect NO NO NO NO YES YES
N 282 282 281 281 277 277R-square 0.08 0.11 0.11 0.13 0.34 0.34
(*),(**) and (***) denote significance at 10%, 5% and 1%.
Robust Standard Errors are in braces
Robust Standard Errors are clustered at District Level in column – 6
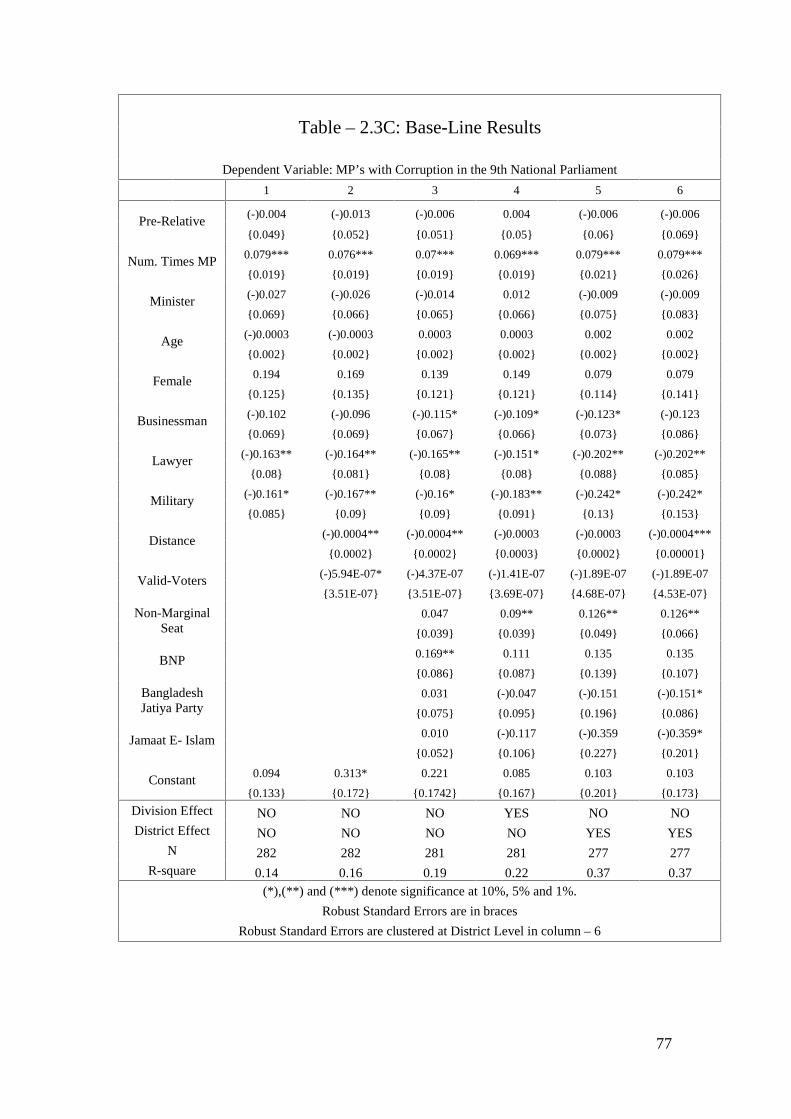
77
Table – 2.3C: Base-Line Results
Dependent Variable: MP’s with Corruption in the 9th National Parliament
1 2 3 4 5 6
Pre-Relative(-)0.004 (-)0.013 (-)0.006 0.004 (-)0.006 (-)0.006
0.049 0.052 0.051 0.05 0.06 0.069
Num. Times MP 0.079*** 0.076*** 0.07*** 0.069*** 0.079*** 0.079***
0.019 0.019 0.019 0.019 0.021 0.026
Minister (-)0.027 (-)0.026 (-)0.014 0.012 (-)0.009 (-)0.009
0.069 0.066 0.065 0.066 0.075 0.083
Age (-)0.0003 (-)0.0003 0.0003 0.0003 0.002 0.002
0.002 0.002 0.002 0.002 0.002 0.002
Female 0.194 0.169 0.139 0.149 0.079 0.079
0.125 0.135 0.121 0.121 0.114 0.141
Businessman (-)0.102 (-)0.096 (-)0.115* (-)0.109* (-)0.123* (-)0.123
0.069 0.069 0.067 0.066 0.073 0.086
Lawyer (-)0.163** (-)0.164** (-)0.165** (-)0.151* (-)0.202** (-)0.202**
0.08 0.081 0.08 0.08 0.088 0.085
Military (-)0.161* (-)0.167** (-)0.16* (-)0.183** (-)0.242* (-)0.242*
0.085 0.09 0.09 0.091 0.13 0.153
Distance (-)0.0004** (-)0.0004** (-)0.0003 (-)0.0003 (-)0.0004***
0.0002 0.0002 0.0003 0.0002 0.00001
Valid-Voters (-)5.94E-07* (-)4.37E-07 (-)1.41E-07 (-)1.89E-07 (-)1.89E-07
3.51E-07 3.51E-07 3.69E-07 4.68E-07 4.53E-07
Non-MarginalSeat
0.047 0.09** 0.126** 0.126**
0.039 0.039 0.049 0.066
BNP 0.169** 0.111 0.135 0.135
0.086 0.087 0.139 0.107
BangladeshJatiya Party
0.031 (-)0.047 (-)0.151 (-)0.151*
0.075 0.095 0.196 0.086
Jamaat E- Islam 0.010 (-)0.117 (-)0.359 (-)0.359*
0.052 0.106 0.227 0.201
Constant 0.094 0.313* 0.221 0.085 0.103 0.103
0.133 0.172 0.1742 0.167 0.201 0.173
Division Effect NO NO NO YES NO NODistrict Effect NO NO NO NO YES YES
N 282 282 281 281 277 277R-square 0.14 0.16 0.19 0.22 0.37 0.37
(*),(**) and (***) denote significance at 10%, 5% and 1%.
Robust Standard Errors are in braces
Robust Standard Errors are clustered at District Level in column – 6
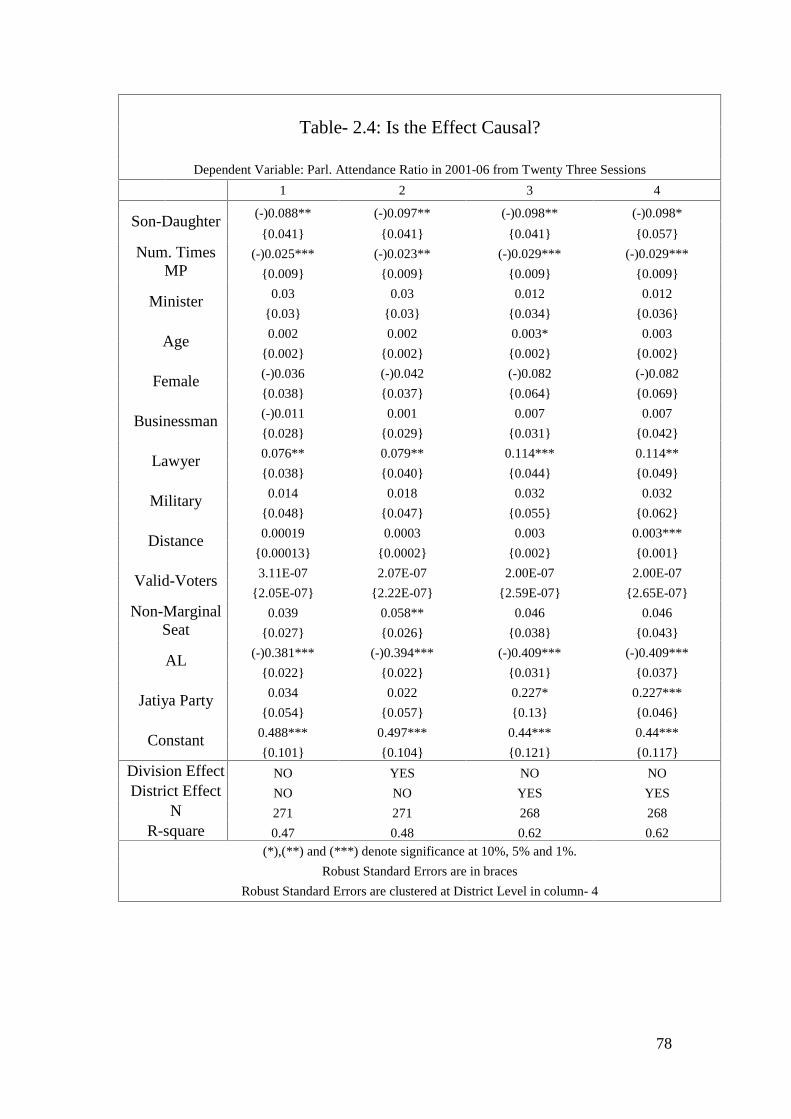
78
Table- 2.4: Is the Effect Causal?
Dependent Variable: Parl. Attendance Ratio in 2001-06 from Twenty Three Sessions
1 2 3 4
Son-Daughter(-)0.088** (-)0.097** (-)0.098** (-)0.098*
0.041 0.041 0.041 0.057
Num. TimesMP
(-)0.025*** (-)0.023** (-)0.029*** (-)0.029***
0.009 0.009 0.009 0.009
Minister 0.03 0.03 0.012 0.012
0.03 0.03 0.034 0.036
Age 0.002 0.002 0.003* 0.003
0.002 0.002 0.002 0.002
Female (-)0.036 (-)0.042 (-)0.082 (-)0.082
0.038 0.037 0.064 0.069
Businessman (-)0.011 0.001 0.007 0.007
0.028 0.029 0.031 0.042
Lawyer 0.076** 0.079** 0.114*** 0.114**
0.038 0.040 0.044 0.049
Military 0.014 0.018 0.032 0.032
0.048 0.047 0.055 0.062
Distance 0.00019 0.0003 0.003 0.003***
0.00013 0.0002 0.002 0.001
Valid-Voters 3.11E-07 2.07E-07 2.00E-07 2.00E-07
2.05E-07 2.22E-07 2.59E-07 2.65E-07
Non-MarginalSeat
0.039 0.058** 0.046 0.046
0.027 0.026 0.038 0.043
AL (-)0.381*** (-)0.394*** (-)0.409*** (-)0.409***
0.022 0.022 0.031 0.037
Jatiya Party 0.034 0.022 0.227* 0.227***
0.054 0.057 0.13 0.046
Constant 0.488*** 0.497*** 0.44*** 0.44***
0.101 0.104 0.121 0.117
Division Effect NO YES NO NO
District Effect NO NO YES YES
N 271 271 268 268
R-square 0.47 0.48 0.62 0.62(*),(**) and (***) denote significance at 10%, 5% and 1%.
Robust Standard Errors are in braces
Robust Standard Errors are clustered at District Level in column- 4
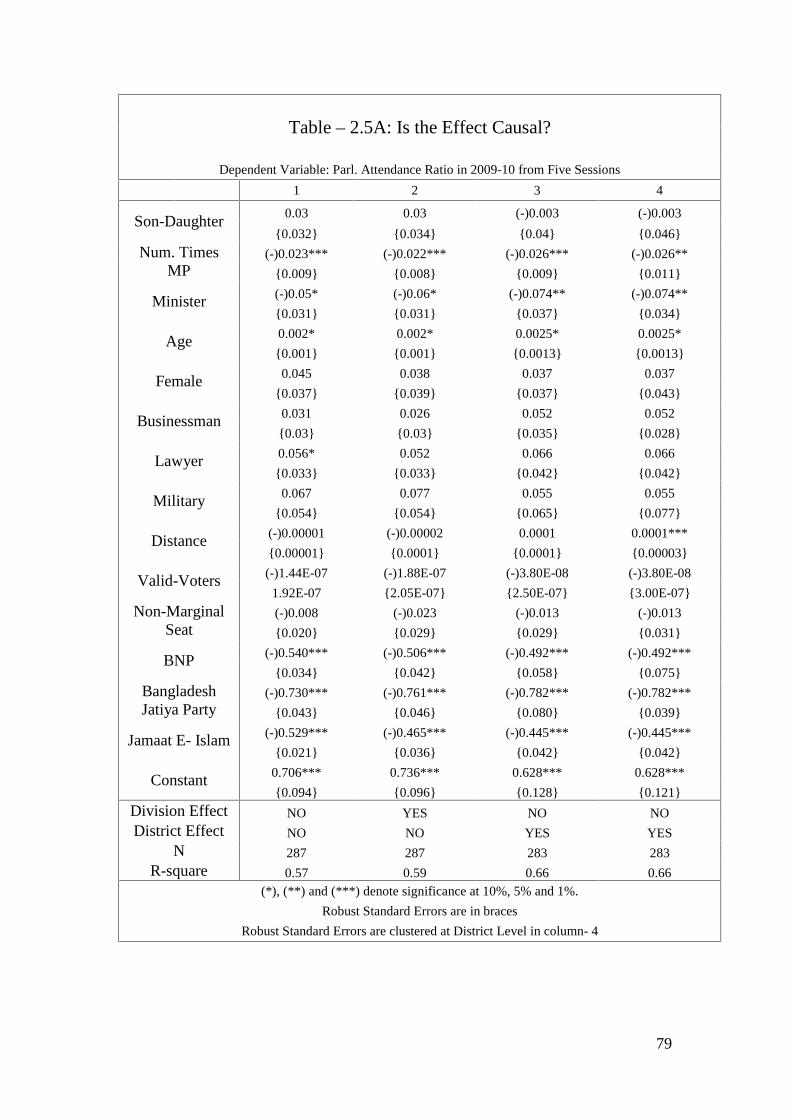
79
Table – 2.5A: Is the Effect Causal?
Dependent Variable: Parl. Attendance Ratio in 2009-10 from Five Sessions
1 2 3 4
Son-Daughter0.03 0.03 (-)0.003 (-)0.003
0.032 0.034 0.04 0.046
Num. TimesMP
(-)0.023*** (-)0.022*** (-)0.026*** (-)0.026**
0.009 0.008 0.009 0.011
Minister (-)0.05* (-)0.06* (-)0.074** (-)0.074**
0.031 0.031 0.037 0.034
Age 0.002* 0.002* 0.0025* 0.0025*
0.001 0.001 0.0013 0.0013
Female 0.045 0.038 0.037 0.037
0.037 0.039 0.037 0.043
Businessman 0.031 0.026 0.052 0.052
0.03 0.03 0.035 0.028
Lawyer 0.056* 0.052 0.066 0.066
0.033 0.033 0.042 0.042
Military 0.067 0.077 0.055 0.055
0.054 0.054 0.065 0.077
Distance (-)0.00001 (-)0.00002 0.0001 0.0001***
0.00001 0.0001 0.0001 0.00003
Valid-Voters (-)1.44E-07 (-)1.88E-07 (-)3.80E-08 (-)3.80E-08
1.92E-07 2.05E-07 2.50E-07 3.00E-07
Non-MarginalSeat
(-)0.008 (-)0.023 (-)0.013 (-)0.013
0.020 0.029 0.029 0.031
BNP (-)0.540*** (-)0.506*** (-)0.492*** (-)0.492***
0.034 0.042 0.058 0.075
BangladeshJatiya Party
(-)0.730*** (-)0.761*** (-)0.782*** (-)0.782***
0.043 0.046 0.080 0.039
Jamaat E- Islam (-)0.529*** (-)0.465*** (-)0.445*** (-)0.445***
0.021 0.036 0.042 0.042
Constant 0.706*** 0.736*** 0.628*** 0.628***
0.094 0.096 0.128 0.121
Division Effect NO YES NO NO
District Effect NO NO YES YES
N 287 287 283 283
R-square 0.57 0.59 0.66 0.66(*), (**) and (***) denote significance at 10%, 5% and 1%.
Robust Standard Errors are in braces
Robust Standard Errors are clustered at District Level in column- 4
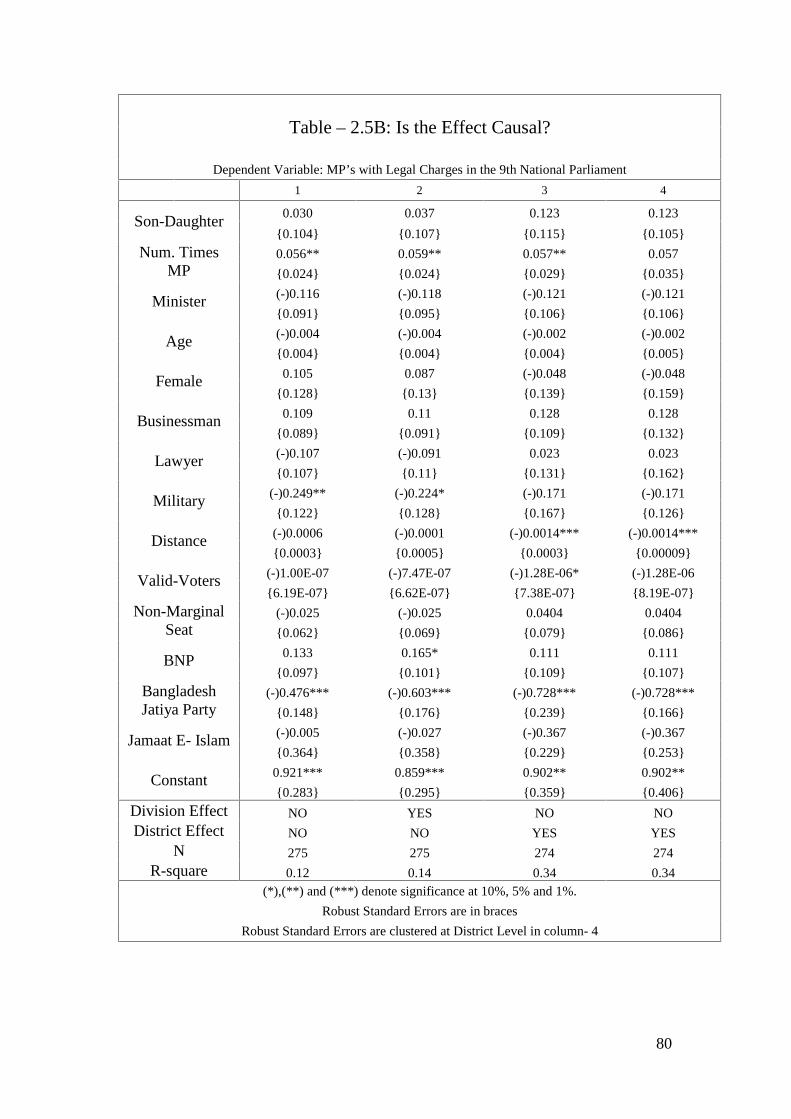
80
Table – 2.5B: Is the Effect Causal?
Dependent Variable: MP’s with Legal Charges in the 9th National Parliament
1 2 3 4
Son-Daughter0.030 0.037 0.123 0.123
0.104 0.107 0.115 0.105
Num. TimesMP
0.056** 0.059** 0.057** 0.057
0.024 0.024 0.029 0.035
Minister (-)0.116 (-)0.118 (-)0.121 (-)0.121
0.091 0.095 0.106 0.106
Age (-)0.004 (-)0.004 (-)0.002 (-)0.002
0.004 0.004 0.004 0.005
Female 0.105 0.087 (-)0.048 (-)0.048
0.128 0.13 0.139 0.159
Businessman 0.109 0.11 0.128 0.128
0.089 0.091 0.109 0.132
Lawyer (-)0.107 (-)0.091 0.023 0.023
0.107 0.11 0.131 0.162
Military (-)0.249** (-)0.224* (-)0.171 (-)0.171
0.122 0.128 0.167 0.126
Distance (-)0.0006 (-)0.0001 (-)0.0014*** (-)0.0014***
0.0003 0.0005 0.0003 0.00009
Valid-Voters (-)1.00E-07 (-)7.47E-07 (-)1.28E-06* (-)1.28E-06
6.19E-07 6.62E-07 7.38E-07 8.19E-07
Non-MarginalSeat
(-)0.025 (-)0.025 0.0404 0.0404
0.062 0.069 0.079 0.086
BNP 0.133 0.165* 0.111 0.111
0.097 0.101 0.109 0.107
BangladeshJatiya Party
(-)0.476*** (-)0.603*** (-)0.728*** (-)0.728***
0.148 0.176 0.239 0.166
Jamaat E- Islam (-)0.005 (-)0.027 (-)0.367 (-)0.367
0.364 0.358 0.229 0.253
Constant 0.921*** 0.859*** 0.902** 0.902**
0.283 0.295 0.359 0.406
Division Effect NO YES NO NO
District Effect NO NO YES YES
N 275 275 274 274
R-square 0.12 0.14 0.34 0.34(*),(**) and (***) denote significance at 10%, 5% and 1%.
Robust Standard Errors are in braces
Robust Standard Errors are clustered at District Level in column- 4
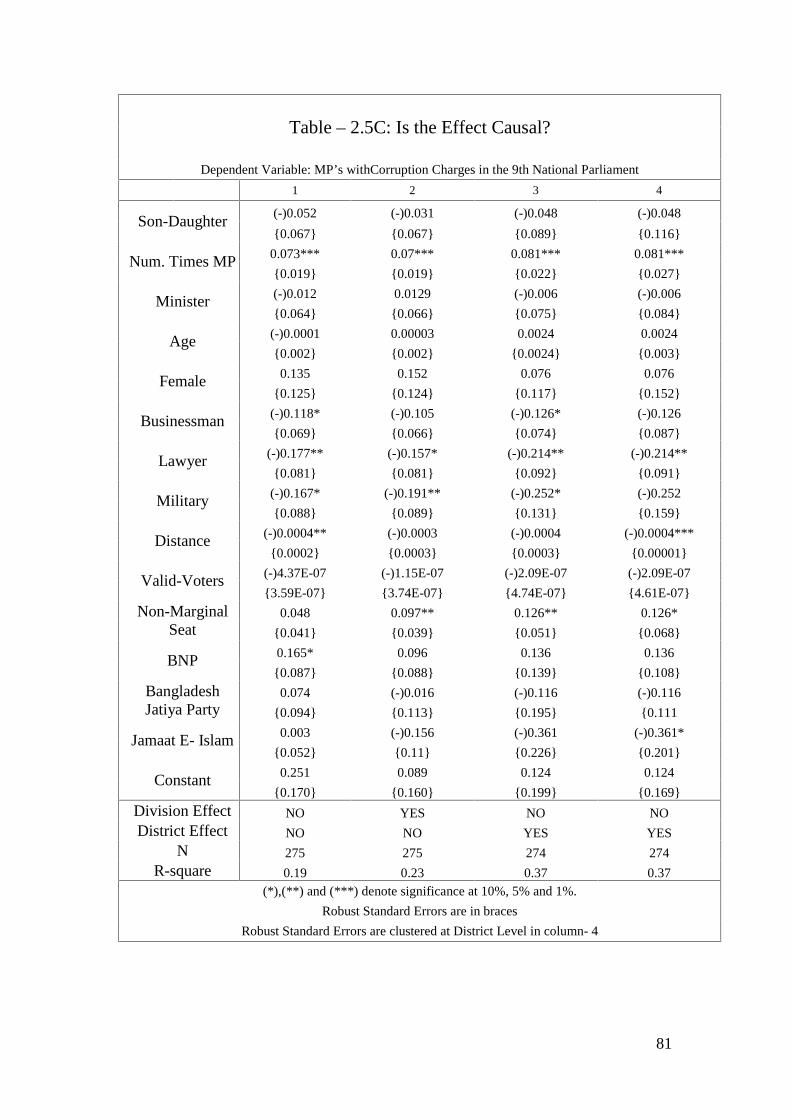
81
Table – 2.5C: Is the Effect Causal?
Dependent Variable: MP’s withCorruption Charges in the 9th National Parliament
1 2 3 4
Son-Daughter(-)0.052 (-)0.031 (-)0.048 (-)0.048
0.067 0.067 0.089 0.116
Num. Times MP 0.073*** 0.07*** 0.081*** 0.081***
0.019 0.019 0.022 0.027
Minister (-)0.012 0.0129 (-)0.006 (-)0.006
0.064 0.066 0.075 0.084
Age (-)0.0001 0.00003 0.0024 0.0024
0.002 0.002 0.0024 0.003
Female 0.135 0.152 0.076 0.076
0.125 0.124 0.117 0.152
Businessman (-)0.118* (-)0.105 (-)0.126* (-)0.126
0.069 0.066 0.074 0.087
Lawyer (-)0.177** (-)0.157* (-)0.214** (-)0.214**
0.081 0.081 0.092 0.091
Military (-)0.167* (-)0.191** (-)0.252* (-)0.252
0.088 0.089 0.131 0.159
Distance (-)0.0004** (-)0.0003 (-)0.0004 (-)0.0004***
0.0002 0.0003 0.0003 0.00001
Valid-Voters (-)4.37E-07 (-)1.15E-07 (-)2.09E-07 (-)2.09E-07
3.59E-07 3.74E-07 4.74E-07 4.61E-07
Non-MarginalSeat
0.048 0.097** 0.126** 0.126*
0.041 0.039 0.051 0.068
BNP 0.165* 0.096 0.136 0.136
0.087 0.088 0.139 0.108
BangladeshJatiya Party
0.074 (-)0.016 (-)0.116 (-)0.116
0.094 0.113 0.195 0.111
Jamaat E- Islam 0.003 (-)0.156 (-)0.361 (-)0.361*
0.052 0.11 0.226 0.201
Constant 0.251 0.089 0.124 0.124
0.170 0.160 0.199 0.169
Division Effect NO YES NO NO
District Effect NO NO YES YES
N 275 275 274 274
R-square 0.19 0.23 0.37 0.37(*),(**) and (***) denote significance at 10%, 5% and 1%.
Robust Standard Errors are in braces
Robust Standard Errors are clustered at District Level in column- 4
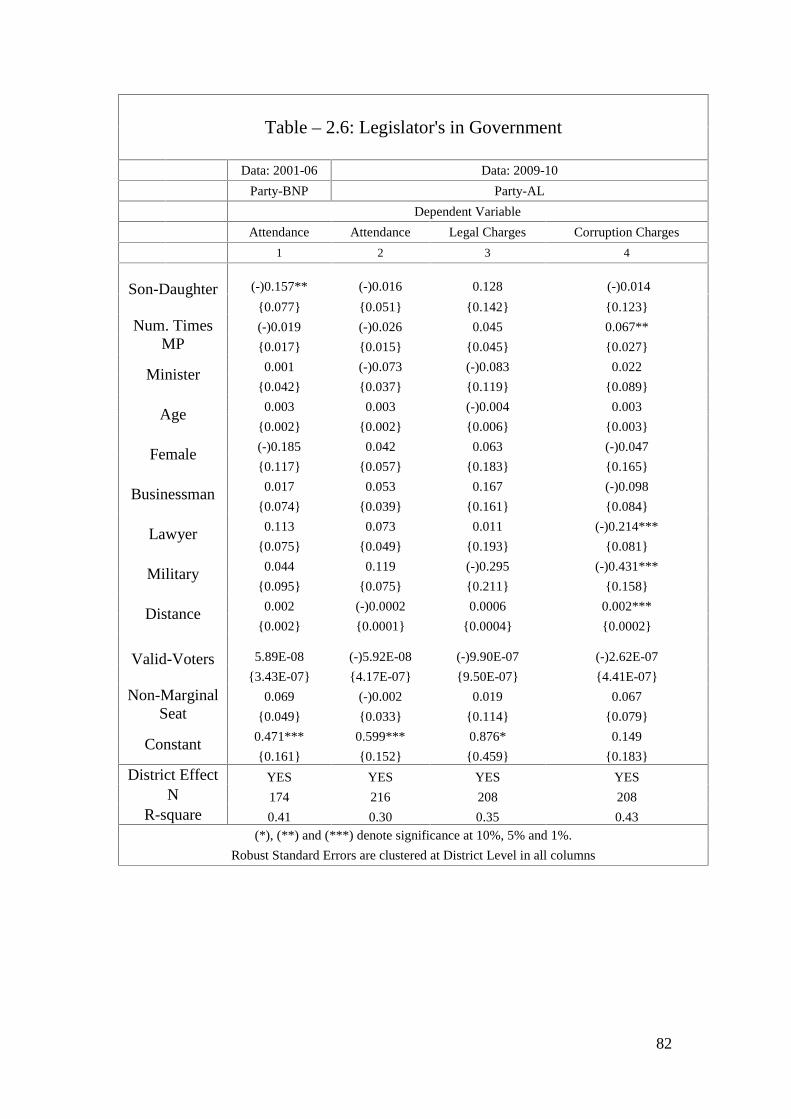
82
Table – 2.6: Legislator's in Government
Data: 2001-06 Data: 2009-10
Party-BNP Party-AL
Dependent Variable
Attendance Attendance Legal Charges Corruption Charges
1 2 3 4
Son-Daughter (-)0.157** (-)0.016 0.128 (-)0.014
0.077 0.051 0.142 0.123
Num. TimesMP
(-)0.019 (-)0.026 0.045 0.067**
0.017 0.015 0.045 0.027
Minister 0.001 (-)0.073 (-)0.083 0.022
0.042 0.037 0.119 0.089
Age 0.003 0.003 (-)0.004 0.003
0.002 0.002 0.006 0.003
Female (-)0.185 0.042 0.063 (-)0.047
0.117 0.057 0.183 0.165
Businessman 0.017 0.053 0.167 (-)0.098
0.074 0.039 0.161 0.084
Lawyer 0.113 0.073 0.011 (-)0.214***
0.075 0.049 0.193 0.081
Military 0.044 0.119 (-)0.295 (-)0.431***
0.095 0.075 0.211 0.158
Distance 0.002 (-)0.0002 0.0006 0.002***
0.002 0.0001 0.0004 0.0002
Valid-Voters 5.89E-08 (-)5.92E-08 (-)9.90E-07 (-)2.62E-07
3.43E-07 4.17E-07 9.50E-07 4.41E-07
Non-MarginalSeat
0.069 (-)0.002 0.019 0.067
0.049 0.033 0.114 0.079
Constant 0.471*** 0.599*** 0.876* 0.149
0.161 0.152 0.459 0.183
District Effect YES YES YES YESN 174 216 208 208
R-square 0.41 0.30 0.35 0.43(*), (**) and (***) denote significance at 10%, 5% and 1%.
Robust Standard Errors are clustered at District Level in all columns
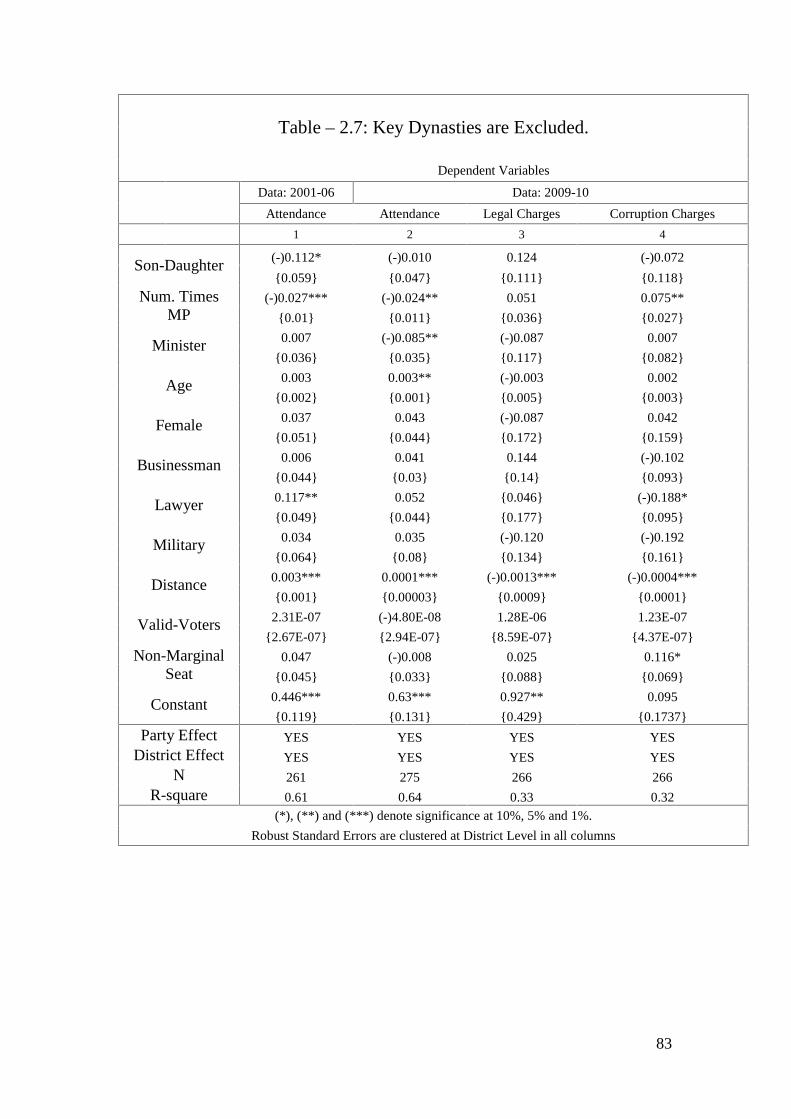
83
Table – 2.7: Key Dynasties are Excluded.
Dependent Variables
Data: 2001-06 Data: 2009-10
Attendance Attendance Legal Charges Corruption Charges
1 2 3 4
Son-Daughter (-)0.112* (-)0.010 0.124 (-)0.072
0.059 0.047 0.111 0.118
Num. TimesMP
(-)0.027*** (-)0.024** 0.051 0.075**
0.01 0.011 0.036 0.027
Minister 0.007 (-)0.085** (-)0.087 0.007
0.036 0.035 0.117 0.082
Age 0.003 0.003** (-)0.003 0.002
0.002 0.001 0.005 0.003
Female 0.037 0.043 (-)0.087 0.042
0.051 0.044 0.172 0.159
Businessman 0.006 0.041 0.144 (-)0.102
0.044 0.03 0.14 0.093
Lawyer 0.117** 0.052 0.046 (-)0.188*
0.049 0.044 0.177 0.095
Military 0.034 0.035 (-)0.120 (-)0.192
0.064 0.08 0.134 0.161
Distance 0.003*** 0.0001*** (-)0.0013*** (-)0.0004***
0.001 0.00003 0.0009 0.0001
Valid-Voters 2.31E-07 (-)4.80E-08 1.28E-06 1.23E-07
2.67E-07 2.94E-07 8.59E-07 4.37E-07
Non-MarginalSeat
0.047 (-)0.008 0.025 0.116*
0.045 0.033 0.088 0.069
Constant 0.446*** 0.63*** 0.927** 0.095
0.119 0.131 0.429 0.1737
Party Effect YES YES YES YES
District Effect YES YES YES YES
N 261 275 266 266
R-square 0.61 0.64 0.33 0.32(*), (**) and (***) denote significance at 10%, 5% and 1%.
Robust Standard Errors are clustered at District Level in all columns
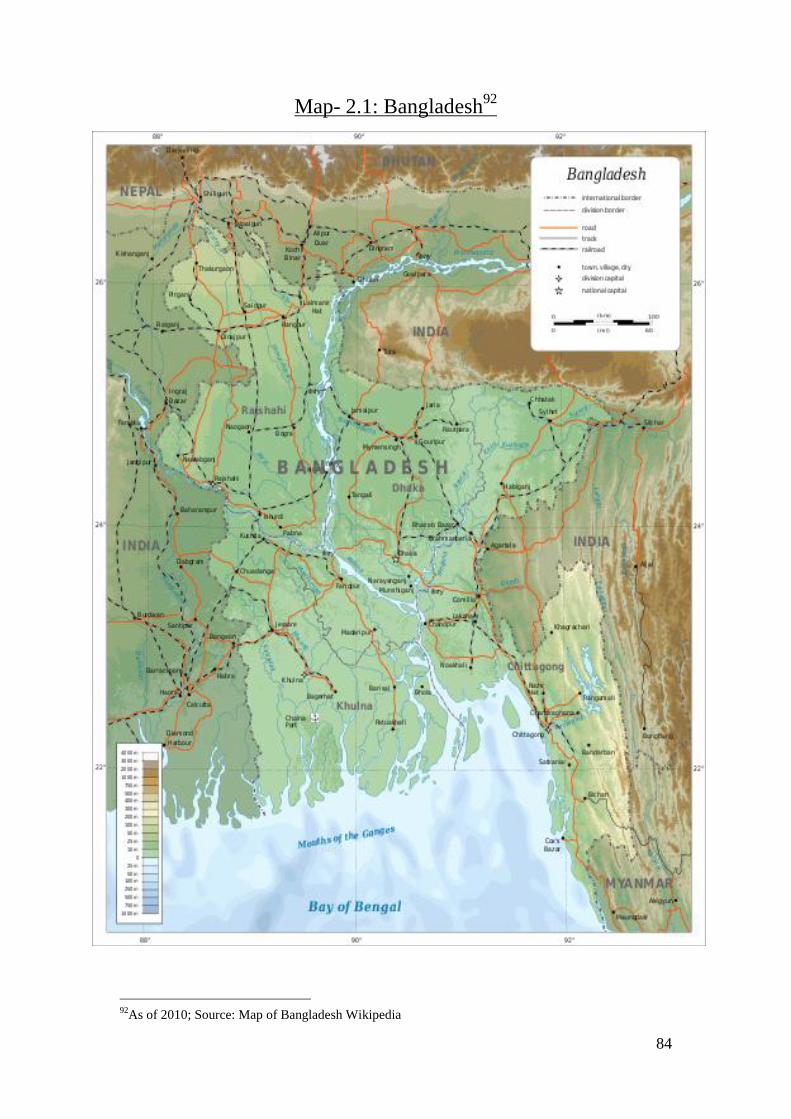
84
Map- 2.1: Bangladesh92
92As of 2010; Source: Map of Bangladesh Wikipedia

85
Map – 2.2: Divisions of Bangladesh93
93As of 2010; Source: Golbez Wikipedia
85
Map – 2.2: Divisions of Bangladesh93
93As of 2010; Source: Golbez Wikipedia
85
Map – 2.2: Divisions of Bangladesh93
93As of 2010; Source: Golbez Wikipedia
86
3. Corruption and Dynasty Politics
Abstract
This paper investigates whether there is a systematic relationship between dynasty-politics
and corruption in a cross-country empirical analysis. This is done with the help of a dynasty
index, which is created by looking at the political history from 1950 to 2010 for large cross-
section of countries, and it measures the variation in the degree of dynasty-politics that exists
across different countries. The overall findings suggest that a higher degree of dynasty-politics
is associated with a higher level of corruption when Singapore and monarchies are not
included in the sample. This association is robust for multiple measures of corruption and
remains significant when we control for important determinants of corruption. The paper also
investigates the phenomenon of immediate dynastic succession in the highest political office.
The results point out that countries which experiences immediate dynastic succession(s)at the
highest political office are strongly associated with having higher levels of perceived
corruption. Although I cannot rule out the possibility that the observed relationship is caused
by unobserved omitted factors, the overall pattern appear very robust. A disaggregate analysis
also reveals that this relationship is particularly strong for countries that experienced
immediate dynastic successions after an incumbent leader was assassinated or he or she
voluntarily stepped aside to facilitate the entry of the potential dynastic successor. In addition
to this, I check for the possibility that the association between dynasty-politics and corruption
is different in countries with higher level of political competition in comparison to countries
with lower levels of political competition. The evidence, however, does not support this line
of reasoning. Lastly, in line with Treisman (2000) I identify that economic development,
protestant tradition and uninterrupted democracy play a crucial role in explaining the cross
country variation in corruption.
Key words: Dynasty-Politics, Immediate Dynastic Succession, Corruption.

87
3.1 Introduction: Are Corruption and Dynasty-Politics linked?
This paper helps to understand if there is a systematic relationship between corruption and a
socio-political phenomenon, dynasty-politics. Corruption, defined as the misuse of public
office for personal gains, exists in every corner of the world in different degrees. Yet, the
exact combination of factors that makes some countries corrupt is little known. World Bank
Institute, recently, estimated that the total bribes exchanged in a year in the world economy
constitutes roughly an amount of $1 trillion (Rose-Ackerman 2004), Likewise, corruption has
also been blamed for the unimpressive performance of certain “developing” countries, and
recent empirical research supports the hypothesis that there is a link between higher
perceived corruption and lower investment and growth (Mauro 1995; World Bank 1997). In
some developing countries, such as Kenya and Democratic Republic of Congo, it probably
amounts to a large fraction of the Gross National Product. Developed countries too are in no
way immune to corruption. For instance, Credit Lyonnais, which was one of the largest
commercial banks in France, was sold to its founder (who was not the highest bidder) at a
quarter of the market price under government pressure when its losses amounted to $30
billion. The founder then turned out to be a close friend of the county’s President (Shleifer
and Vishny, 1998). Furthermore, according to Transparency International, the perception of
corruption in Italy is higher than that of Costa Rica in 2004, although Italy is much more
economically developed than Costa Rica. All these examples highlight the urgent need of
pursuing a better understanding of the causes of corruption.
Influential dynasties, on the other hand, dominate political atmosphere in various countries.
From the Gandhis in India, Bhuttos of Pakistan, Gloria Macapagal’s family in the
Philippines, Duvalier family in Haiti, to the Bush family in United States, influential political
dynasties exist in the political arena of various countries in different forms and degrees.
Nonetheless, very little is known of its possible role in political decision-making process, and
what consequences it bears for the idea of ‘good’ governance. This possible link between
corruption and dynasty-politics, an issue thoroughly addressed in this paper, is particularly
interesting since political dynasties reflect inequality in the distribution of political power
(Dal Bo, et al 2009). Besides, these groups are likely to benefit from inherited political
capital, which can increase their capacity for being agents for either ‘positive’ or ‘adverse’

88
outcomes. This makes it imperative to examine empirically how dynasty-politics is related
with corruption.
As I will argue below, theoretically the overall relationship between dynasty-politics and
corruption is ambiguous. More specifically, dynastic politicians who desire dynastic
succession at the highest political office can be influenced by what I call the ‘reputation-
building’ incentive. This incentive suggests that members of political dynasties, while they
are in office, will try to abstain from corrupt activities since they would want to create a
positive reputation for their family. Besides, this positive reputation will act as a signal to the
people that their family is in politics to serve the public interest. As a result, if this incentive
is strong, then it is likely that dynasty-politics is associated with lower levels of corruption
across countries.
In contrary to the reputation-building incentive, dynastic-politician can also be dominated by
the ‘stockpiling-wealth’ incentive. This incentive suggests that dynastic-politicians, while
they are in office, will use their position to amass a fortune so that their future generations
can ‘buy’ their way to office. They can also appoint their preferred people to key positions in
the government and bureaucracy (and in the process accumulate political capital) so that the
elections contested by their future generations are manipulated in their favour. Hence, if this
incentive dominates, then it is probable that countries with a greater prevalence of dynasty
politics are on average more corrupt. Since both these incentives (reputation-building vs.
stockpiling-wealth) works in opposite directions, the relationship between corruption and
dynasty-politics remains a subject of empirical investigation. Therefore, this paper
empirically investigates the possible relationship between corruption and dynasty-politics
across a large number of countries. This is done with help of two measures which quantifies
the variation in dynasty-politics across countries.
The paper is organised as follows. The next section gives an overview of the literature on
corruption and some studies on dynasty politics. It also discusses the mechanisms through
which dynasties can affect corruption. Section 3.3 provides a description of the data and the
empirical model which I have used in the analysis. Section 3.4 will present the results from
the base-line regressions and their interpretations. Lastly, section 3.5 concludes and provides
direction for future research.
89
3.2 Literature Review and Theory
3.2.1 Literature Review
Corruption in political economy has been a subject of deep intellectual interest. A common
definition of (public) corruption is the misuse of public office for private gain. Defined in this
way, the word ‘corruption’ will capture, for example, the sale of government property by
politicians in office, bribery, kickbacks in public procurement and embezzlement of
government funds. It can also mean politicians misusing their position to rig elections so that
they can be re-elected back into the office. Corruption, in a general sense, can also reflect
collusion between firms or misuse of corporate assets that imposes costs on investors or
consumers. In addition to this, some activities hover on a legal border line. For example,
legal payments that involve lobbying, campaign contributions or gifts can seem quite close to
illegal payments that constitute to bribery, or legal offers of ‘after-retirement’ jobs in private
sectors, etc. The focus here is on public corruption or, more specifically, the socio-political
factors that have the capacity to increase or decrease public corruption. World Bank, in a
recent report pointed out that the estimated cost of bribery is, at least, 3% of the world
income in 2002 (Kaufmann, 2003), and there is also a general consensus that corruption is
harmful for economic development (Mauro, 1995).
In contrast, a particular stream in the literature does point out what is known as the ‘efficient
corruption,’ which identifies bribes as ‘speed money’. As Huntington (1968) stated: ‘In terms
of economic growth, the only thing worse than a society with a rigid, over-centralized,
dishonest bureaucracy is one with a rigid, over-centralized, honest bureaucracy.’ In brief, this
highlights that bribery may allow firms to get things done in an economy plagued by
bureaucratic hold-ups and rigid laws (Leff, 1964; Huntington, 1968). Others argue that a
system built on bribery for allocating government licenses and contracts may produce an
outcome in which the most efficient firms will be able to afford to pay the highest bribes
(Lui, 1985).
Nevertheless, a fundamental drawback with the previous arguments is that they typically take
the distortions circumvented by the corrupt actions as given. In almost every case, corruption
and distortions are consequences or symptoms of the same set of underlying factors. As
pointed out by Myrdal (1968), corrupt officials may not circumvent distortions, but instead
90
actually cause greater administration delays to attract more bribes. Djankov, et al. (2002)
contributes to this point by empirically establishing in a cross-country study that greater
degree of corruption is associated with higher regulation of entry for new firms. This
provides evidence in support of the ‘toll-booth’ theory that argues that bureaucratic delays or
entry regulation is imposed not for addressing public interest, but for extracting rents from
the private sector. Other costs of corruption come from propping up of inefficient firms and
the allocation of talent, technology and capital away from their socially most productive uses
(Murphy, Shleifer and Vishny, 1991). Corruption also decreases the speed at which existing
firms expand their size and new firms enter since a portion of potential profits or actual
profits are taken away through corruption.
Additionally, it is also argued that corruption distorts the allocation of entrepreneurial skills.
When corruption is institutionalized and widespread, some firms may devote resources for
obtaining valuable licenses permits/licences and preferential market access (via which they
could enjoy market power), while others focus on improving productivity (Murphy, Shleifer
and Vishny, 1991). Sometimes, in extreme cases, for an entrepreneur it might be more
rewarding to leave the private sector altogether and instead become a corrupt public official.
This theoretical prediction has some support from micro and case study evidence, but the
macro evidence on this prediction is indecisive. For example, Bates (1981) pointed out that in
many sub-Saharan African countries, farmers avoided corruption by switching to subsistence
production with a subsequent fall in their productivity and living standard. On the other hand,
many formal sector firms specialized in securing special advantages that they were unable to
secure through competition in the market. De Sotto (1989) identifies similar effects in Peru,
where high initial start-up costs due to excess regulation and corruption, compelled
entrepreneurs to establish new firms underground and on a smaller scale.
As a result, the contemporary wisdom is that the early majority view among social scientists
and international development experts was correct and that corruption is harmful for
development due to its adverse impacts on the incentives, prices, and opportunities that
public and private agents face. Hence, it is important for us to identify the possible economic
and social-political determinants of corruption. In the existing literature, theories about the
determinants of corruption emphasize the role of structural and economic policies and the
role of institutions. These theories are best viewed as complementary, since the choice of
structural and economic policies are one way through which institutions influence corruption.
91
Countries with the highest level of corruption are mostly developing or transition economies
(Svensson, 2005). This means that these countries can afford ‘low’ quality institutions. This
results in even higher corruption (Shleifer, A and Vishny, R. 1993). This stream of argument
belongs to the first set of theories on institution which argues that institutional quality is
shaped by economic factors. In short, the theory states that institutions develop in response to
a country’s income level and differential needs (Lipset, 1960; Demsetz, 1967). A similar
view-the human capital theory- points out that growth in income and human capital causes
institutional development (Lipset, 1960; Glaeser et al 2004). Education and human capital,
for example, are required for courts and other institutions to operate efficiently, and misuse
of power by the government is likely to go unnoticed and unchallenged when the electorate is
not highly literate. Consequently, these theories suggest looking at income and education as
causes of corruption.
The second set of institutional theories emphasises more on a direct role of institutions, and
they argue in favour of the idea that institutions are inherited and persistent. Acemoglu,
Johnson and Robinson (2001), along these lines, state that in former colonies, the institutions
were set for the benefit of the colonizer and only when Europeans settled in large numbers
did this also result in institutions aimed at benefiting residents of the colony. Hence, the
disease environment which determined the mortality rates of the European settlers in the
colonies explain partially why Europeans in some cases have implanted institutions which
aim to benefit residents. So, according to them, corruption should be higher in colonies with
an inhospitable environment, since this would have motivated European settlers to implant
extracting institutions.
Alternatively, La Porta, Lopez-de-Silanes, Sheifer and Vishny (1999) focused on the identity
of the colonizer and, more particularly, the legal system transplanted from the colonizer to
the colonies. According to them, countries with English legal origin (as opposed to French
and Socialist legal origin) regulate less, and this leads to lower corruption. This means that
countries with ‘common-law’ as opposed to ‘civil-law’ will suffer from lesser degree of
corruption. In the view of the second set of theories, economic and political institutions
influence the extent of corruption, especially in the ways that they restrict market and
political competition. Furthermore, the variable that captures the restriction in the market
place includes openness to external competition from imports (Ades and Di Tella, 1999). On
the political side, an independent press provides greater information than a state-controlled
92
press to voters on government and public sector misbehaviour, which also includes public
corruption (Brunetti and Weder, 2003). The type of political institutions-presidential versus
parliamentary and federal versus majoritarian- can also have an impact on the level of
corruption as it influences the incentives of public sector decision-makers (or politicians) and
voter’s ability to hold them accountable for misuse of power (Person and Tabellini, 2004).
Recently, corruption has also been linked to religious decomposition and ethno-linguistic
diversity. Treisman (2002) demonstrated that countries with Protestant tradition performed
better in constraining corruption than countries with Muslim or Catholic tradition. The
rationale underlying this is that institutions of the Protestant church, which arose in part as an
opposition to state-sponsored religion may be more inclined to monitor and address abuses
by government officials. The paper also highlighted that a country’s experience with long
period of uninterrupted democracy is also detrimental to corruption.
Therefore, the recent trend in the literature is to relate corruption to colonial history, legal
origin and religious tradition. However, the possible effects of political dynasties – who are
likely to have significant role in country’s political process - on corruption has not yet
received much attention in empirical literature.
Dynasty-politics exists in the political arenas of numerous countries. Their existence and
self-perpetuation, to an extent, highlights imperfections in modern democratic
representations as they can reflect considerable inequality in the distribution of political
power. This can, in principle, also determine the quality of governance within a country’s
polity. In Haiti, for example, Francois Duvalier and son Jean-Cluade Duvalier occupied the
position of the president of Haiti for a total of approximately 29 years. What is more
interesting is that after the death of Francois Duvalier (who was initially elected but later
turned into a dictator), his son Jean-Claude Duvalier immediately succeeded him, although
he was only 19 years old at that time. Besides, both Duvalier regimes in Haiti were known
for their corrupt and autocratic nature (Metz, 1989). Similarly, in Togo Gnassingbé Eyadéma
(who ruled Togo for 38 years) was succeeded by his son Faure Gnassingbé after his death on
the 5thof February 2005.94 To be more precise, in December 2002, the Constitution of Togo
was changed and the term limits on the office of president was removed. Previously,
94 For more information, see http://www.britannica.com/EBchecked/topic/199240/Gnassingbe-Eyadema
93
presidents had been limited to two five-year terms, and this would have forced Eyadéma to
step down after the 2003 elections. With the removal of these constraints, Eyadéma was free
to stand for re-election and he did so, winning the elections on June1. Furthermore, another
change was introduced to reduce the minimum age of the President to 35 years, rather than
45. As Eyadéma's son Faure Gnassingbé was 35, many assumed that Eyadéma was opening
the way for dynastic succession should he die suddenly.95
Both these examples do reflect to some extent how executive head of states can use their
position to manipulate key institutions (such as defence) and law to promote dynastic
succession. But, since both Francois Duvalier of Haiti and Eyadéma of Togo belonged to an
corrupt autocratic regime, one can ask that whether such behaviour is only observed in
countries where the political arena is dominated by autocratic leaders, and therefore, in a
democratic political process such dynastic succession would not be possible. This is not true
since, for example, in India members from the Gandhi dynasty have been voted in and out of
power on numerous occasions. More specifically, after the assassination of Prime Minister
Indira Gandhi on the 31st of October 1984, her son Rajiv Gandhi was immediately sworn in
as the Prime Minister. The succession of Rajiv Gandhi was a product of a democratic
political process (where the senior leaders of the Indian National Congress pressurized him to
take up the post) and he was later (within 6 months) elected through a parliamentary election
to serve as Prime Minister for a full five years (Frank, 2002). This made him the youngest
Prime Minister that India has ever witnessed.
Stories of such dynastic succession exist in other countries too, such as Bangladesh where
both the former Prime Ministers Khaleda Zia96 and Sheikh Hasina are related to former
Presidents of Bangladesh. In July 2001, Indonesian people elected its first female President
Megawati Sukarnoputri97 who is also the daughter of the country’s first president Sukarno.98
Thus, while analysing these political dynasties, historians and political scientists have given
more weight on some than others. However, what historians and political scientist have not
95 For more information, see http://www.britannica.com/EBchecked/topic/1052895/Faure-Gnassingbe
96Khaleda Zia’s sons were imprisoned for corruption charges during the Care Taker Government led DrFakhruddin Ahmed from 2007-09. For more information,please see: http://www.thedailystar.net/newDesign/news-details.php?nid=166515
97 For more information, see: http://www.britannica.com/EBchecked/topic/572221/Megawati-Sukarnoputri
94
done is to provide us with a theoretical model that could probably explain the behaviour of
dynastic politicians and investigate empirically the possible links dynasty politics might have
with corruption.
Few studies which focused on the dynamics surrounding political dynasties includes that of
Camp (1982), who looked at Mexico’s political culture and pointed out that a high
percentage of political leaders from Mexico between 1935 and 1980 belonged to politically
established families. For the United States, Brandes Crook and Hibbing (1997) tried to
identify the impact of the election mode of Senators on a number a dimensions, including the
proportion of Senators coming from families that had placed a legislator. Along similar
lines, Dal Bo et al. (2009) recently studied the evolution of political dynasties in the United
States Congress since its inception in 1789. With many other interesting findings, the authors
found that legislators who serve for long tenures are significantly more likely to have
relatives entering Congress later. They also pointed out that an increase in political
competition is associated with fewer dynastic legislators. Similarly, Brownlee (2007)
provides a qualitative examination of hereditary succession in a large number of modern
autocracies and argues that whether elites will abet dynastic succession depends on the
precedent for leadership selection. In other words, where rulers are predated by parties,
surrounding political elites will defer to the party as the recognized arbiter of succession. On
the other hand, where rulers predate their parties and political elites lack an established
precedent for orderly transfer of power, hereditary succession offers a focal point for
reducing uncertainty, achieving consensus, and forestalling a power vacuum. These studies,
so far, have neither theoretically nor empirically linked dynasty politics with corruption. But,
as mentioned above, there are important theoretical channels through which one can relate
dynasty politics to corruption.
3.2.2 Theory: Stockpiling-Wealth versus Reputation-Building
The “rational choice” literature argues that it is important to assume that individuals behave
according to their own self-interest. This does not imply that individuals do not care for
others, but rather that people put their own interest ahead of others when these conflict.
Moreover, individuals pursue their goals in the most efficient manner given that gathering
and processing of information is costly. The assumption that obtaining information is costly
is important since it means that an individual can take his or her decisions under some
95
uncertainty as it might be too expensive to make fully informed decisions.99 This doctrine
also suggests that rational individuals will be forward-looking and will try to anticipate the
effects of their decision, and the decision of others, on their welfare. Thus, according to
rational choice, politicians (who we expect to serve public-interest) in office too will
prioritise their self-interest, but as they are elected and have to face re-election their
behaviour will take into account the possibility of being voted out of office if they fail to
satisfy the citizens. A key question that is now worth exploring is whether this behavioural
dynamic is different for dynastic politicians in comparison to non-dynastic politicians? I
propose that in understanding the behaviour of politician from dynasties, it is useful toassume
that dynastic politicians have in their objective function a goal to initiate a dynastic
succession. If this is true, then not only dynastic politicians will account for all the future
consequences of their action on their welfare, but they will also take into account how their
personal and political behaviour affects the probability of their future generation inheriting
their political position or office.
Hence this additional objective of dynastic politicians to make sure that their dynasty sustains
and prospers can change the behavioural dynamics of dynastic politicians from others. This,
on the other hand, raises the question that if dynastic politicians is affected by the desire of a
dynastic succession, then why will normal politicians (who are not members of dynasties) act
in a different way since they too could desire that their family members will inherit their
political position or office, and in the process set up their own political dynasty. A possible
reason why this might not be the case is that influential dynasties often have an appeal to
certain powerful sectors of the political arena. Their familiarity with the political machinery
can reduce the effort that is required by dynastic politicians to promote a dynastic succession
in comparison to the effort that is required by politicians who are attempting to set up their
own dynasty.100 Consequently, if this line of reasoning is true, then one can expect dynastic
identity to matter in altering the behavioural dynamics of politicians.
99 Standard Economic analysis suggests that individuals wanting to maximize their expected earningswill collect information until the expected value from a marginal increase in information equals themarginal cost. This can well lead to exhibit what seems like satisfactory behaviour (e.g., seeZeckhauser and Schaefer, 1968)
100 In recent empirical literature, Feinstein (2010) shows that dynastic politicians receive an additional4 percent increase in the two party vote share in congressional elections due their “brand-nameadvantage”. This might make it relatively easy for dynastic leaders to endure in office in comparison tonon-dynastic leaders.

96
Assuming that dynastic politicians are partially motivated by the desire to promote a dynastic
succession after they retire, the relationship between dynasty-politics and the level of
corruption is still theoretically not clear. This is because their decision-making process is
affected by two opposing incentives. As indicate, I call this the Reputation-Building
incentive and the Stockpiling-Wealth incentive.
Reputation-Building incentive implies that when members of political dynasties are in office,
they will use this opportunity to build a positive reputation for the family. This means that
they will abstain from behaviours that can decrease their family’s goodwill, such as engaging
in illegal activities as much as possible, so that they send a positive signal to the voters that
their dynasty is in politics to serve the public interest. At the national level, it can mean that
they will pursue a political cause (such as enhancing human rights, her commitment to the
idea of good governance, etc.)that attracts her admiration both within her country and across
borders. Therefore, if dynastic politicians succeed in creating a positive reputation for their
family, then the dynastic succession has a greater likelihood of being seen legitimate and
acceptable.101
In contrast, stockpiling-wealth incentive proposes the idea that while dynastic politicians are
in office they will be tempted to accumulate wealth through both legal and illegal means so
that their future generation can inherit their political position on the basis of their financial
and political capital. At the national level, this can also mean that dynastic politicians will
appoint their preferred people to key positions in the government and bureaucracy, and in the
process accumulate political capital so that future dynastic successions are easier to achieve.
To be precise, it is probable that dynastic politicians can use the inherited financial and
political capital to manipulate crucial institutions (such as Election Commission, Defence and
so on) so that electoral results are rigged in the favour of the potential dynastic successor.
For example, the electoral victory of Ali Ben Bongo in Gabon in 2009, who succeeded his
father Omar Bongo102, was termed by the opposition parties as an ‘electoral
101 In practice, it can evoke a similar decision making scenario faced by a politician with term-limits incomparison to a politician without term-limits. That is, the incentive induced from the possibility offacing re-election can be similar to one of dynastic politicians aiming to facilitate a dynasticsuccession.
102 Omar Bongo was the President of Gabon for more than 41 years. For a detailed analysis of his rule,please see Ngolet, (2000).
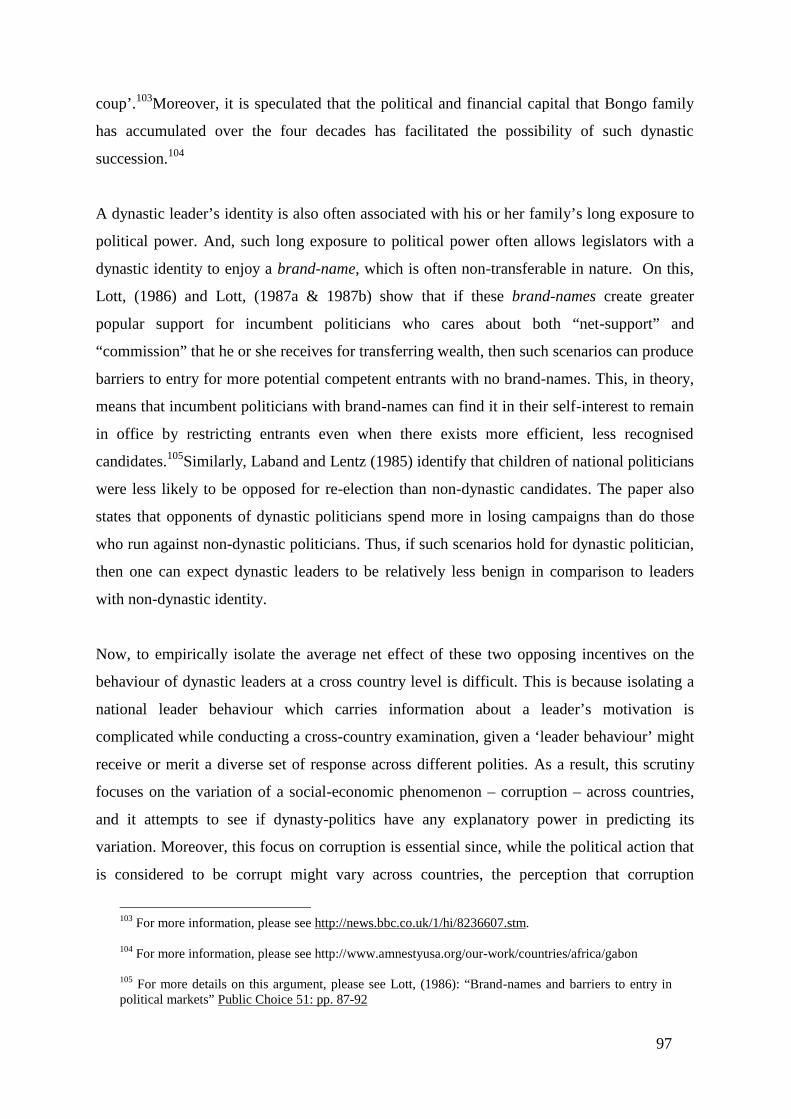
97
coup’.103Moreover, it is speculated that the political and financial capital that Bongo family
has accumulated over the four decades has facilitated the possibility of such dynastic
succession.104
A dynastic leader’s identity is also often associated with his or her family’s long exposure to
political power. And, such long exposure to political power often allows legislators with a
dynastic identity to enjoy a brand-name, which is often non-transferable in nature. On this,
Lott, (1986) and Lott, (1987a & 1987b) show that if these brand-names create greater
popular support for incumbent politicians who cares about both “net-support” and
“commission” that he or she receives for transferring wealth, then such scenarios can produce
barriers to entry for more potential competent entrants with no brand-names. This, in theory,
means that incumbent politicians with brand-names can find it in their self-interest to remain
in office by restricting entrants even when there exists more efficient, less recognised
candidates.105Similarly, Laband and Lentz (1985) identify that children of national politicians
were less likely to be opposed for re-election than non-dynastic candidates. The paper also
states that opponents of dynastic politicians spend more in losing campaigns than do those
who run against non-dynastic politicians. Thus, if such scenarios hold for dynastic politician,
then one can expect dynastic leaders to be relatively less benign in comparison to leaders
with non-dynastic identity.
Now, to empirically isolate the average net effect of these two opposing incentives on the
behaviour of dynastic leaders at a cross country level is difficult. This is because isolating a
national leader behaviour which carries information about a leader’s motivation is
complicated while conducting a cross-country examination, given a ‘leader behaviour’ might
receive or merit a diverse set of response across different polities. As a result, this scrutiny
focuses on the variation of a social-economic phenomenon – corruption – across countries,
and it attempts to see if dynasty-politics have any explanatory power in predicting its
variation. Moreover, this focus on corruption is essential since, while the political action that
is considered to be corrupt might vary across countries, the perception that corruption
103 For more information, please see http://news.bbc.co.uk/1/hi/8236607.stm.
104 For more information, please see http://www.amnestyusa.org/our-work/countries/africa/gabon
105 For more details on this argument, please see Lott, (1986): “Brand-names and barriers to entry inpolitical markets” Public Choice 51: pp. 87-92

98
involves political leaders getting involved in an illegal conduct under the law of the land is
almost universal by definition. Consequently, if long exposure to dynastic rule at the national
level is associated with higher or lower levels of perceived corruption across countries, then
it is possible to prudently acknowledge some information concerning the motivations that are
governing behaviour of dynastic politicians.
As the discussion above points out, reputation-building and stockpiling-wealth incentive
work in opposite direction. This implies that an empirical investigation will be instrumental
in understanding the overall relationship of dynasty politics with the level of corruption in a
country.
3.3Data and Methodology
3.3.1 Data: Sources of the variables and the Dynasty Index (DI)
3.3.1.1 Dynasty Index: Quantifying the variation in Dynasty Politics.
Dynasty politics exists in the political arena of numerous countries in various forms and
shapes. In India, for example, the national political arena is solely dominated by a unique
dynasty- the Nehru-Gandhi dynasty- which had three members who were ex-Prime Ministers
of India. These three members occupied the position of the executive head of state for
approximately a total of 36 years.106Conversely, in both Mauritius and Bangladesh two rival
dynasties compete in their respective political process to occupy the post of the executive
head of the state. Besides, there are numerous countries where in last six decades the
political arena never included families from which more than one member occupied the post
of the executive head. As a result, in order to quantify the variation in dynasty politics that
exists across the countries I primarily employ two measures. First, I classify a political family
(i) as a political-dynasty when at least two members from the family have occupied the
position of the executive head of a country.107 I then construct a Dynasty Index (DI) by
looking at the total time share that political dynasties were in power for each country. That is,
our measure of dynasty politics employs a very simple measure where:
106 Jawaharlal Nehru –his daughter Mrs Indira Gandhi – and grandson Rajiv Gandhi were all PrimeMinister’s of India.
107To pin point political-dynasties for each country post 1950, I use the Archigos dataset, v2.5(Goemans et al, 2007), which identifies the primary national leader for each country at each point intime from 1950 to 2004. This data set identify the manner by which rulers enter and leave politicalpower, the post-tenure fate of the ruler, as well as their biological relationship to other leaders.Numerous e-sources were also used to establish the biographical profiles of the national leaders.
99
60
TDI if the country gained independence
before 1950; T is Σ ti where (t) is the
total number of years dynasty (i)
was in office
OR
pendenceYearofInde
TDI
2010if the country gained independence
after 1950; T is Σ ti where (t) is the
total number of years dynasty (i)
was in office
Now, calculated in this way the Dynasty Index ranges from (0) to (1), where (1) represents a
very strong presence of dynastic influence in a country’s political arena and zero represents
absolute absence of it.
Table-3.1 presents the Dynasty Index (DI) for all countries in the sample. Besides, out of the
132 countries, DI is greater than zero for forty-nine countries. That is, according to the
indicator dynasty-politics exists in approximately every third country of the sample.
Likewise, it is trivial to mention that monarchies such as Jordan, Kuwait, Morocco and Saudi
Arabia have a DI equal to one, which reflects that they were under the authority of their
respective royal families for the entire period. In addition to this, North Korea has a dynasty
index equal to 1 (reflecting the extreme influence that the Kim dynasty exerts in North
Korea’s political arena) and is closely followed by Azerbaijan with a dynasty index equal to
0.89. One important thing to note, however, is that countries with similar DI score do not
necessarily indicate that their dynasties are homogenous in all dimensions or that they have
an equal amount of political strength in their respective national political arena.
For example- both India and Mauritius have a DI score of 0.57. Nevertheless, the dynamics
surrounding the political dynasties differ substantially. To elaborate further on the point, the
Nehru-Gandhi family produced three members (Nehru, Indira and Rajiv) who in total
occupied the highest political office for 34 years. Additionally, no other political family in
India could produce more than one member who occupied the office of the executive head of
100
the state. On the other hand, the political arena of Mauritius is influenced by two heavy
weight rival dynasties (Ramgoolams and Jugnauths), and their hostility is carried forward by
their next generation. Despite the fact that there are obvious differences between dynasty
politics of India and Mauritius - the dynasty index for them is 0.57. This, therefore, points
out the possibility that countries with a very similar dynasty-index can have dynasties which
are different in various dimensions. Thus, one needs to be cautious while interpreting the
results, which tries to understand how the variation in the degree of dynasty-politics affects
the level of corruption across countries.
Another possible caveat with this measure is that it can potentially underestimate the degree
of dynasty politics that a country’s political arena exhibits. This is because in some countries
an executive head appoints his or her family members in key positions of the government
while he/she is in power. This, to some extent, reflects the influence the family has in the
political arena of the country. This can also highlight the intention of the executive head of a
state to promote his or her family members as a future heir for the top position after
retirement. Nonetheless, this procedure of measuring the degree of dynasty politics fails to
take this into account since we do not control for such behaviour undertaken by any
executive head of a state. Thus, for example, a country such as China has a DI equal to zero
even though Mao’s 27 year rule was heavily influenced by his wife Jiang Qing108 (Short,
2001)
The second measure attempts to quantify a very special phenomenon associated with dynasty
politics – immediate dynastic successions. Although such types of political successions are
common among monarchies, they are found in modern democracies and autocracies (even in
contemporary times). For instance, in Argentina, President Nestor Kirchner voluntarily
stepped aside in 2007 to support the successful election bid of wife Cristina Fernandez
Kirchner, thereby becoming the only ‘First Gentleman’ in Argentina’s politic arena.109
Moreover, in autocracies like Gabon, immediate dynastic succession at the highest political
office took place when Omar Bongo died in office after being in power for more than four
108 It is pointed out that Jiang Qing along with her infamous ‘Gang of Four’ controlled the powerorgans of the Communist party during the Cultural Revolution. She was later sentenced to life-imprisonment after the death Mao in 1976.
109 For more information see: http://news.bbc.co.uk/2/hi/business/7069172.stm
101
decades.110 Immediate dynastic successions are also associated quite strongly with political
assassinations.111 To be more specific, after the assassination of Prime Minister Solomon
Bandranaike of Sri Lanka in 1959, his wife Sirimavo Bandranaike succeeded him within a
years after a brief political turmoil. This also made her world’s first female Prime
Minister.112In order to quantify this phenomenon, I use a simple binary variable Immediate
Succession which is equal to one for a country that has a political dynasty (i) where a
political succession between its members for the top political office took place within a year.
Thus, Table-3.1 shows that twenty five countries which experienced at least one immediate
dynastic succession at the top political office occurred in last 60 years. In other words, one in
every five country in the sample entertained such a political phenomenon.113
3.3.1.2 Data Analysis
Measuring the level of corruption across countries is a difficult, but an important task. This is
both due to the secretive nature of corruption and the variety of forms it takes. This study
primarily depends on three sources, which produces a measure of corruption across a large
sample of countries.
The first source is the index on corruption called ‘Control of Corruption114,’ that has been
produced by the World Bank since 1996 in its publication “Governance Indicators 1996-
110 For more information see: http://news.bbc.co.uk/2/hi/8235875.stm
111The thesis addresses this phenomenon in the article: “ Assassinations and Political Dynasties”
112 For more information see: http://www.independent.co.uk/news/world/asia/worlds-first-female-prime-minister-dies-634971.html
113 It is important to acknowledge here that immediate dynastic succession allows the analysis toclosely relate to the discussion in the theory section. More precisely, if dynastic leaders are driven by amotivation to facilitate future dynastic successions at the highest political office, then such factors arelikely to reduce the time lag that one witnesses between a dynastic leader leaving office and his or herdynastic successor occupying office. This makes ‘immediate dynastic succession’ more likely whensuch motivations are in function. On the other hand, when two members of a family occupy theposition of an executive head of the state but with a considerable time lag between, then it reduces thelikelihood that such dynastic succession have emerged from the direct motivations of a dynastic leader.For example, it is unlikely that Shigeru Yoshida [Prime Minister of Japan between 1948 and 1954] hadany ‘hands on’ role in fueling the political rise of his grandson Taro Aso [Prime Minister of Japanbetween 2008 and 2009].
114Control of Corruption index is available from the World Bank at:(http://info.worldbank.org/governance/kkz2002/tables.asp)
102
2005” (Kaufmann et al. 2006). I use this because they have a broader definition of corruption
and it takes into account most cross-country indices reporting ranking of countries on some
aspect of corruption. The indicator (Control of Corruption) is constructed in order to have a
standardised normal distribution across countries. Hence, it lies between -2.5 and 2.5 for
almost all countries, with highly corrupted countries scoring towards -2.5. As the primary
dependent variable, I have computed the country mean of Control of Corruption from 1996
to 2005. This is done with the intention to reduce the possibility that our results are affected
by an unusual corruption score (of any country) in any particular year. Figure-3.1 provides a
scatter plot between the ‘Dynasty Index’ and the” Average Control of Corruption 1996-
2005” for the entire sample. As it can be seen, there is a slight negative association between
the variables of interest, indicating that we might isolate that higher prevalence of dynasty
politics is associated with greater levels of corruption.115 In addition, as a second source, I
use the annual index of “Corruption Perception Index-CPI” produced by Transparency
International.116 This index ranges from 10 (representing least corrupt) to 0 (representing
most corrupt).
Nevertheless, a key question arises while using an index that measures perceived corruption
is: why should we take this measure seriously since it is based on perceptions rather than
some directly observable measure of corruption?117I find two convincing reasons. One,
perception of corruption may have serious consequences for economic growth as corruption
itself. For example, countries that are rated high on corruption by Transparency International
have tended to attract lower foreign investment (Wei. 1998). Besides, countries that are rated
115 To preview a more pronounced association, see Appendix figure 3.3 in page 272, which dropsmonarchies and Singapore from the analysis.
116For further information on Corruption Perception Index (CPI), see: www.transparency.org
117 The ‘Control of Corruption’ indicator is also depended on perceived corruption scores. As a result,the criticism is applicable to the first dependent variable as well. In addition, such aggregate compositecorruption indexes are often subject to sever criticism, which mainly stems from four issues. (I)Transparency in Construction: if some of the components of composite corruption index are notconstructed in a transparent manner, then the composite corruption index (CPI or Control ofCorruption) also suffers from such lack of transparency. (II) Conceptual Imprecision: since compositecorruption index aggregates component indexes which are constructed from a wide variety of sources,it enhances the possibility of suffering from conceptual imprecision. (III) Comparability across Time:as composite corruption indexes often use components indices that changes sample composition overtime, it makes comparison across time problematic. (IV) Interdependence of Source: compositecorruption index are often made of components that draws information from non-independent source.For example, when components use ‘expert opinion’ to measure corruption perception, it is probablethat these experts often consult each other before proving their opinion. For more discussion alongthese lines, see Knack, S (2006).
103
more corrupt by Business International had significantly lower levels of growth and
investment (Mauro 1995). Two, the ratings produced by Transparency International-and the
component surveys and ratings from which they are formed- turn out to be highly correlated
among themselves. Furthermore, ratings that are dependent on different methodologies, using
different inputs, and in different decades ended up with results that were very similar
(Treisman 2000).118 The consistency of such ratings across different techniques, source, and
time reduces the risk that one is depending on the guesses by any individual organization.
Hence, to construct a second dependent variable I compute the country mean of CPI from
2001 to 2009. Now, it is important to point out that in Treisman (2000), the analysis
undertaken is largely dependent on the CPI indexes for 1996, 1997 and 1998. Thus, this
paper can implicitly provide a robustness check for most conclusions drawn from the
Treisman (2000), since it uses a similar methodology on a more larger and contemporary
data set.
Lastly, as a third measure of corruption, I employ the variable “Corrupt” used by La Porta et
al (1999) to pinpoint the determinants of the quality of government in a large cross-section of
countries. The variable ranges between 0 and 10, where low scores indicate that “senior
government officials are likely to demand special payments” and “illegal payments are
generally expected in lower levels of government” in the form of “bribes connected with
imports and export licenses, exchange controls, tax assessment, policy protection, or
loans”.119
In Table-3.2A, the correlations between the three dependent variables are presented, and it
can be seen that there is a strong positive correlation between the three measures of
corruption. This, to some degree, is in line with findings of Treisman (2000), and it raises
confidence concerning the usefulness of the measures of corruption in this investigation.
118 It is also noted that while doing broad analysis, such as scrutinizing the relationship economicdevelopment and corruption, conceptual imprecision that is commonly associated with compositecorruption index is unlikely to be a problem Knack, (2006). Moreover, given the scope of this paper isalso broad – examining the overall cross-country relationship between dynasty-politics and corruption- possible conceptual imprecision in ‘CPI’ or ‘Control of Corruption’ is unlikely to be a problem.Likewise, as the study attempts to explain the spatial variation in corruption (and not over time),aggregate indices are not very harmful.
119For more information on this, please see: Political Risk Services - International Country Risk GuideEast Syracuse, NY: Political Risk Services Institutional Reform and Informational Sector.
104
In order to control for economic development, we used PPP GDP per capita as of 2000
produced by the Penn World Tables. The same source was also used to measure ‘openness’
to foreign trade.120 Data on ethno-linguistic fractionalization, which according to some is a
determinant of corruption, has been taken from Easterly and Levine (1997). The variable
‘ethno-linguistic fragmentation’ ranges from (0) to (1), where (0) reflects ethnically
homogeneous regions. Data on legal origin and religious affiliation, which identifies whether
a country has English legal origin or not and what percentage of population is Protestant, is
taken from La Porta et. al (1997, 1999). The one on colonial heritage was compiled mostly
from Horrabin (1937), Fieldhouse (1982) and Grier (1995). This identifies whether a country
was a former British colony or not.121 In order to control for ‘federal structure’ I used the data
that is analysed by Treisman (2000), and also constructed a dummy variable for countries
that are not covered by Treisman (2000) following the definition of federal state provided by
Elazar (1995) and Riker’s (1964, p.11).122
Finally, to control for democracy the paper experimented with multiple indicators. I start
initially with a measure of uninterrupted democracy (which is a dummy variable) for
countries that have witnessed an uninterrupted democratic political process from 1950 to
2009.123 This measure is based on a classification that is similar to the one provided by
Alvarez et al. (1996), where they consider a country to be democratic if: (i) the chief
executive is elected, (ii) the legislature (at least the lower house) is elected, (iii) [at least] two
party contests election.124A second measure of democracy is taken from Jaggers and
120 Openness is measured by sum of export and import as a share of GDP for the year 2000
121 Note: For countries for which the data was not available, I have looked into their political history tocategorize their colonial heritage.
122According to Elazar (1995) and Riker (1964) a country has federal structure if: (1) [at least] twolevels of government rule the same land and people, (2) each level has at least one area of action inwhich it autonomous, and (3) there is some guarantee of the autonomy of each government in its ownsphere. The implementation procedure is similar to the one that is used by Treisman (2000) to extendhis own data set.
123 If the country has received its independence post 1950, then I see whether it has had uninterrupteddemocracy since it independence to 2009.
124 I have extended the Alvarez et al (1996) data up to 2004, using the ‘Europa World Year Book2006’. Note: The definition provided by Alvarez et al (1996) focuses exclusively on the contestedelection of governments. According to this definition, a country is considered ‘democratic’ even if theleader imposes a state of emergency and suspends civil and political rights ( like Mrs Indira Gandhibetween 1975 and 1977) so long the leader was elected and does not change or violate the rules onholding new elections and leaving office. The 1975 Indian state of emergency was approved by both
105
Marshall (2000), which quantifies the degree of democracy entertained within political
arenas of various countries. In other words, I use the POLITY variable from the POLITY IV
dataset. The POLITY variable has 21 categories, ranging from -10 to +10, where -10 reflects
extreme autocracies. In the next section, I discuss the empirical methodology employed in
this paper.
3.3.2 Methodology: Simple OLS estimation technique employed.
As argued above, the relationship between corruption and dynasty-politics is essentially an
empirical question. This is because theoretically the overall impact of dynasty-politics on
corruption is ambiguous, as it depends on two opposing forces, namely reputation-building
and stockpiling wealth incentives. Hence, one needs to model the variation in corruption
across countries as a function of dynasty-politics and other established determinants of
corruption, so that the empirical scrutiny identifies the possible impact of dynasty-politics on
corruption. Therefore, we estimate the following base-line OLS regression:
iiii XDICorrupt )()(
Where Corrupti is our measure of corruption for country (i) taken from the mentioned
sources. DIi is the dynasty-index for country (i), which measures the variation in the degree
of dynasty politics that is/was present in the national political arena of all the countries that
we have in our sample. Xiis vector of other covariates, and εi is the random error term. The
key parameter of interest is β, which links corruption to dynasty-politics. In our base-line
specification, the vector Xi consists of a set of factors that are identified in the literature as
important determinants of corruption. These variables are:
(1) Economic development: I have controlled for level of economic development by taking
log of PPP GDP per capita as of 2000. Countries that are economically developed generally
have a lower degree of corruption. This is primarily due to the fact that richer economies
(and therefore richer governments) are able to afford stronger institutions and this allows
them to reduce corruption (Shleifer, A and Vishny, R. 1993).
Lok Sabha and Rajya Sabha (lower and upper houses of the legislature). Mrs Indira Gandhi did callelection in 1977, and she left the office constitutionally when she lost it.
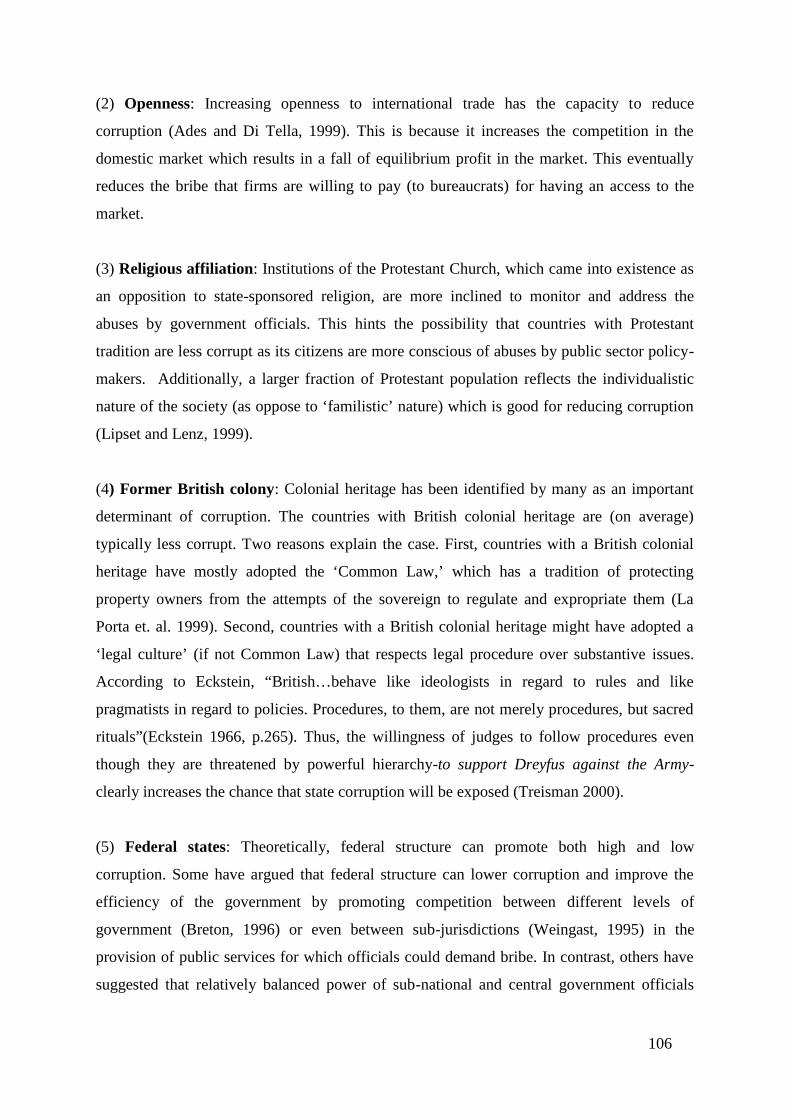
106
(2) Openness: Increasing openness to international trade has the capacity to reduce
corruption (Ades and Di Tella, 1999). This is because it increases the competition in the
domestic market which results in a fall of equilibrium profit in the market. This eventually
reduces the bribe that firms are willing to pay (to bureaucrats) for having an access to the
market.
(3) Religious affiliation: Institutions of the Protestant Church, which came into existence as
an opposition to state-sponsored religion, are more inclined to monitor and address the
abuses by government officials. This hints the possibility that countries with Protestant
tradition are less corrupt as its citizens are more conscious of abuses by public sector policy-
makers. Additionally, a larger fraction of Protestant population reflects the individualistic
nature of the society (as oppose to ‘familistic’ nature) which is good for reducing corruption
(Lipset and Lenz, 1999).
(4) Former British colony: Colonial heritage has been identified by many as an important
determinant of corruption. The countries with British colonial heritage are (on average)
typically less corrupt. Two reasons explain the case. First, countries with a British colonial
heritage have mostly adopted the ‘Common Law,’ which has a tradition of protecting
property owners from the attempts of the sovereign to regulate and expropriate them (La
Porta et. al. 1999). Second, countries with a British colonial heritage might have adopted a
‘legal culture’ (if not Common Law) that respects legal procedure over substantive issues.
According to Eckstein, “British…behave like ideologists in regard to rules and like
pragmatists in regard to policies. Procedures, to them, are not merely procedures, but sacred
rituals”(Eckstein 1966, p.265). Thus, the willingness of judges to follow procedures even
though they are threatened by powerful hierarchy-to support Dreyfus against the Army-
clearly increases the chance that state corruption will be exposed (Treisman 2000).
(5) Federal states: Theoretically, federal structure can promote both high and low
corruption. Some have argued that federal structure can lower corruption and improve the
efficiency of the government by promoting competition between different levels of
government (Breton, 1996) or even between sub-jurisdictions (Weingast, 1995) in the
provision of public services for which officials could demand bribe. In contrast, others have
suggested that relatively balanced power of sub-national and central government officials
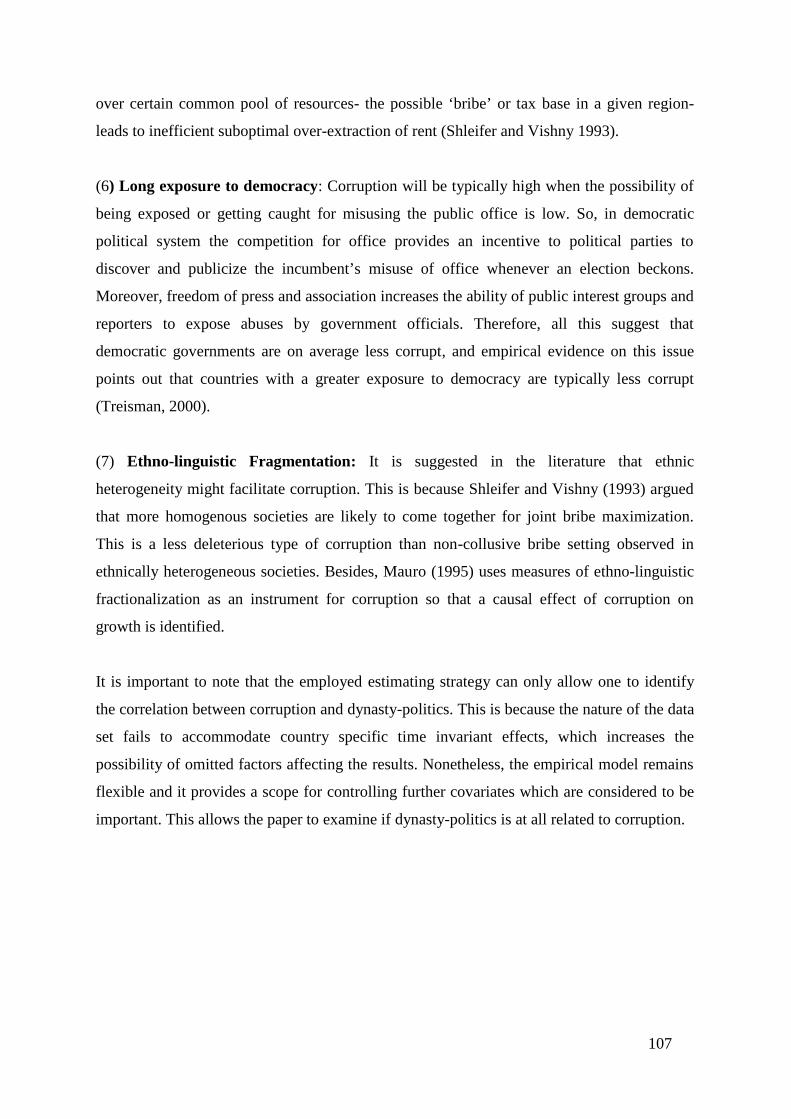
107
over certain common pool of resources- the possible ‘bribe’ or tax base in a given region-
leads to inefficient suboptimal over-extraction of rent (Shleifer and Vishny 1993).
(6) Long exposure to democracy: Corruption will be typically high when the possibility of
being exposed or getting caught for misusing the public office is low. So, in democratic
political system the competition for office provides an incentive to political parties to
discover and publicize the incumbent’s misuse of office whenever an election beckons.
Moreover, freedom of press and association increases the ability of public interest groups and
reporters to expose abuses by government officials. Therefore, all this suggest that
democratic governments are on average less corrupt, and empirical evidence on this issue
points out that countries with a greater exposure to democracy are typically less corrupt
(Treisman, 2000).
(7) Ethno-linguistic Fragmentation: It is suggested in the literature that ethnic
heterogeneity might facilitate corruption. This is because Shleifer and Vishny (1993) argued
that more homogenous societies are likely to come together for joint bribe maximization.
This is a less deleterious type of corruption than non-collusive bribe setting observed in
ethnically heterogeneous societies. Besides, Mauro (1995) uses measures of ethno-linguistic
fractionalization as an instrument for corruption so that a causal effect of corruption on
growth is identified.
It is important to note that the employed estimating strategy can only allow one to identify
the correlation between corruption and dynasty-politics. This is because the nature of the data
set fails to accommodate country specific time invariant effects, which increases the
possibility of omitted factors affecting the results. Nonetheless, the empirical model remains
flexible and it provides a scope for controlling further covariates which are considered to be
important. This allows the paper to examine if dynasty-politics is at all related to corruption.
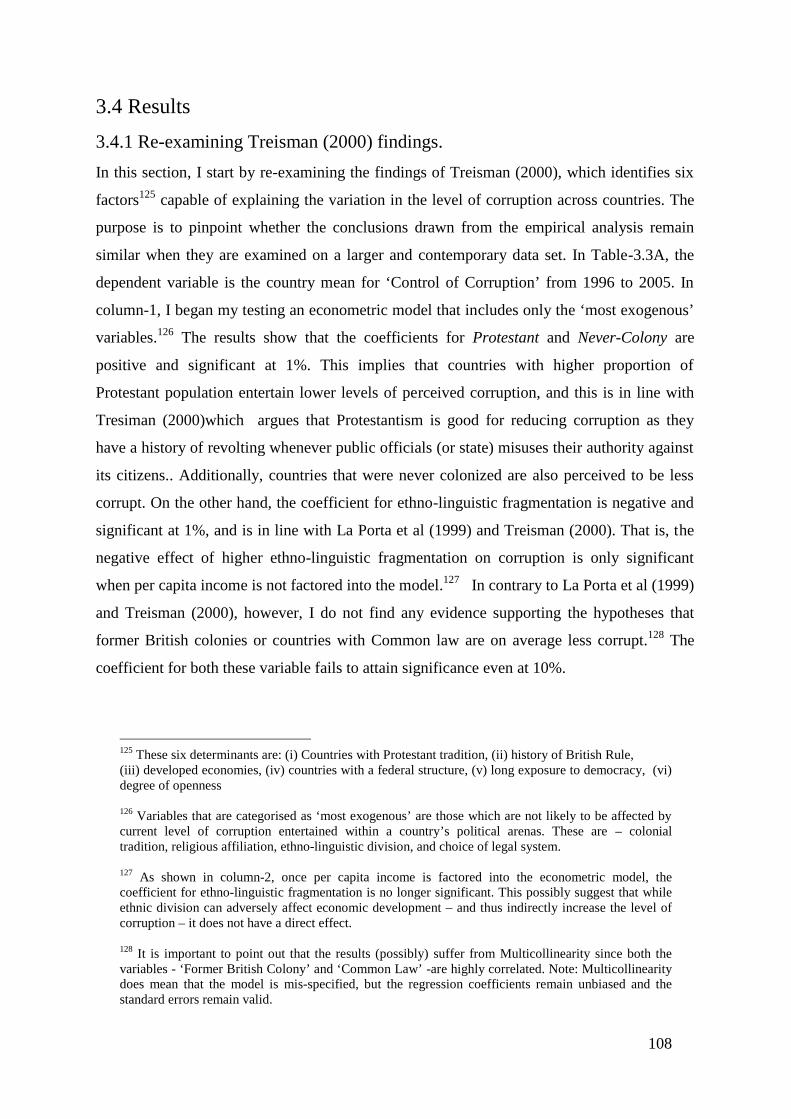
108
3.4 Results
3.4.1 Re-examining Treisman (2000) findings.
In this section, I start by re-examining the findings of Treisman (2000), which identifies six
factors125 capable of explaining the variation in the level of corruption across countries. The
purpose is to pinpoint whether the conclusions drawn from the empirical analysis remain
similar when they are examined on a larger and contemporary data set. In Table-3.3A, the
dependent variable is the country mean for ‘Control of Corruption’ from 1996 to 2005. In
column-1, I began my testing an econometric model that includes only the ‘most exogenous’
variables.126 The results show that the coefficients for Protestant and Never-Colony are
positive and significant at 1%. This implies that countries with higher proportion of
Protestant population entertain lower levels of perceived corruption, and this is in line with
Tresiman (2000)which argues that Protestantism is good for reducing corruption as they
have a history of revolting whenever public officials (or state) misuses their authority against
its citizens.. Additionally, countries that were never colonized are also perceived to be less
corrupt. On the other hand, the coefficient for ethno-linguistic fragmentation is negative and
significant at 1%, and is in line with La Porta et al (1999) and Treisman (2000). That is, the
negative effect of higher ethno-linguistic fragmentation on corruption is only significant
when per capita income is not factored into the model.127 In contrary to La Porta et al (1999)
and Treisman (2000), however, I do not find any evidence supporting the hypotheses that
former British colonies or countries with Common law are on average less corrupt.128 The
coefficient for both these variable fails to attain significance even at 10%.
125 These six determinants are: (i) Countries with Protestant tradition, (ii) history of British Rule,(iii) developed economies, (iv) countries with a federal structure, (v) long exposure to democracy, (vi)degree of openness
126 Variables that are categorised as ‘most exogenous’ are those which are not likely to be affected bycurrent level of corruption entertained within a country’s political arenas. These are – colonialtradition, religious affiliation, ethno-linguistic division, and choice of legal system.
127 As shown in column-2, once per capita income is factored into the econometric model, thecoefficient for ethno-linguistic fragmentation is no longer significant. This possibly suggest that whileethnic division can adversely affect economic development – and thus indirectly increase the level ofcorruption – it does not have a direct effect.
128 It is important to point out that the results (possibly) suffer from Multicollinearity since both thevariables - ‘Former British Colony’ and ‘Common Law’ -are highly correlated. Note: Multicollinearitydoes mean that the model is mis-specified, but the regression coefficients remain unbiased and thestandard errors remain valid.

109
In column-2, I introduce log (PPP) GDP per capita as of 2000, which proxies for economic
development, in the econometric model. The coefficient for the variable is positive and
significant at 1%. This highlights a strong positive association between economic
development and lower levels of ‘perceived’ corruption, and it sheds-light on the possible
two-way relationship between these two variables. Stated otherwise, richer economies are
better in controlling corruption since they can afford stronger institutions (Shleifer, A and
Vishny, R. 1993). Then again, Mauro (1995) provided empirical evidence that lower
corruption can in turn promote economic growth by increasing investment. Hence, the results
confirm the existing view that developed countries are on average less corrupt (Shleifer, A
and Vishny, R. 1993; Treisman, 2000; Svensson, 2005). In addition to this, the earlier
findings remains qualitative similar for most variables. The regression in column-3 controls
indicator variables for having a long exposure to democracy, and for being federal.
Consequently, the coefficients for both these variables are positive, but only significant for
Un-Interrupted Democracy at 1%. This provides some support to the hypothesis that
countries with a long exposure to democracy are on average associated with lower levels of
corruption.129 In contrast, political and economic theories (as mentioned above) proposing a
link between federal system and the degree of corruption are not supported by the data. In
column-4, I examine the proposition of Ades and Di Tella (1999) that increasing openness
results in lower level of corruption. The coefficient for Openness is positive and significant
at 10%, which (to an extent) provides some support to the mentioned proposition.
In estimations presented in column-5, I have redefined the democracy variable by controlling
for Polity score for individual countries for the year 2000. The idea here is to capture the
association that current degree of democracy has (as opposed to long exposure to democracy)
with the level of corruption across countries. The results point out that current degree of
democracy too has a positive association with lower corruption, but it is no longer
significant. This is suggested by Treisman (2000) who pointed out that only long exposure to
democracy matters, while the current degree of democracy is not significant in determining
the level of corruption across countries.
The issue of reverse causation between corruption and economic development is addressed in
Column-6. In this respect, a key objective of this research is to shed light on factors that are
129This was also identified in Treisman (2000).

110
capable in explaining the variation of corruption – economic development being one of them.
Nonetheless, existing literature does suggest that perceived corruption can reduce economic
growth (Mauro, 1995). So, to overcome this possible reverse causality, I use an instrumental
variable approach that was followed in Treisman (2000). More precisely,log (PPP) GDP per
capita is instrumented with latitudinal distance from the equator. The idea here is that a
country’s latitudinal distance from the equator is clearly not determined by its perceived (or
actual) level of corruption. Alternatively, some scholars do argue that physical closeness to
equator can result in lower growth130 (Sachs and Warner, 1997). Thus, if the mentioned
rationale holds, then an instrumental variable approach will help identify a causal
relationship between economic development and corruption. From the first stage131 we can
see that latitudinal distance from the equator is associated strongly with economic
development. Therefore, the positive and significant coefficient of instrumented log (PPP)
GDP per capita in column-6 is in line with (on a larger data set) the findings of Treisman
(2000) and Svensson (2005) - that economic development can, in fact, adversely affect the
level of perceived corruption.132
In column – 7 & 8, additional variables controlling for a country’s natural resource
endowment and the size of the public sector were factored into the regressions.
Consequently, it is observed that there has been some loss of observations. In addition, the
coefficients for both these variables are negative, but not significant even at 10%. This
provides limited support to the notion that countries with larger governments or high natural
resources are on average associated with high levels of perceived corruption. In table – 3.3B,
I re-estimate the regression with a new dependent variable, which is the country mean of CPI
from 2001 to 2009. This is undertaken to see if the findings are sensitive to other measures of
corruption. Nonetheless, the results remain qualitatively similar.
130It is argued that proximity to equator increases mortality due to greater tropical disease and loweragricultural yield. This, in turn can reduce economic growth.
131The first stage results are given in ‘Appendix Table-A2’.
132 This Instrumental Variable approach, however, has come under some criticism in recent times. Tobe specific, the instrument is unlikely to meet the exclusion restriction. This is because it is unlikelythat the sole mechanism through which latitudedistance from the equator can shape corruption outcomeis through its effect on economic development. In fact, La Porta et al (1999) shows that latitudinaldistance from the equator can have its own independent effect on corruption and governmentperformance.
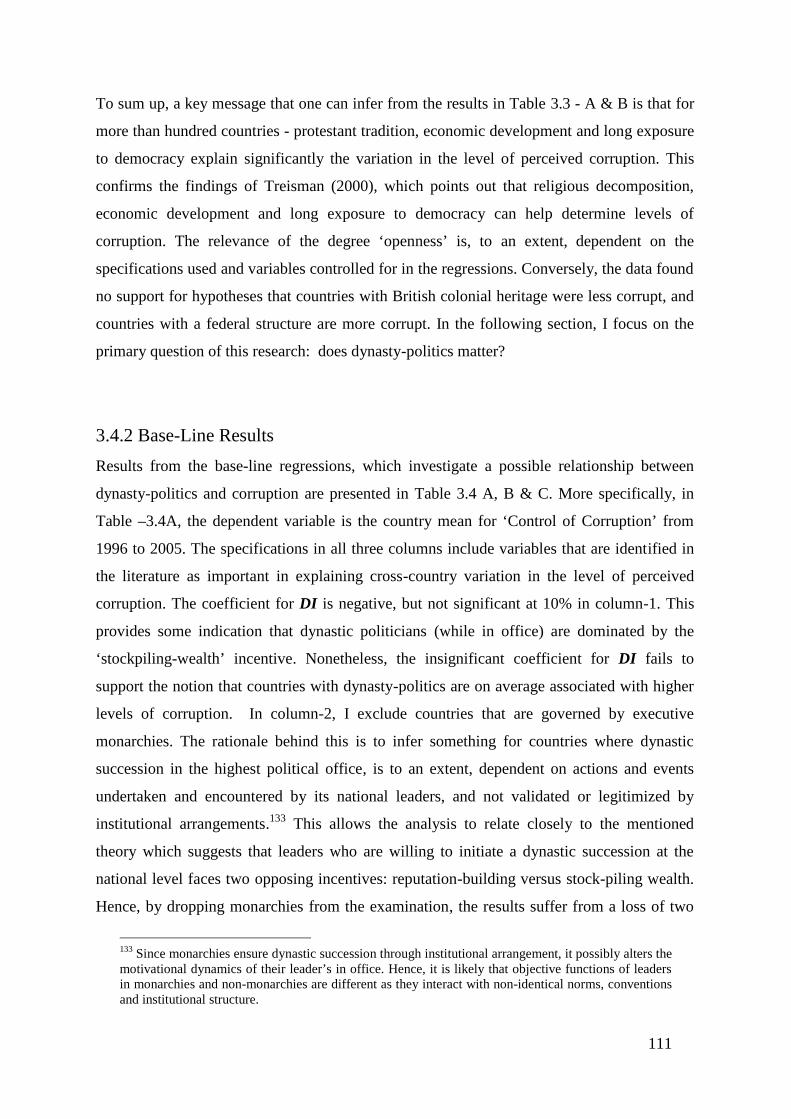
111
To sum up, a key message that one can infer from the results in Table 3.3 - A & B is that for
more than hundred countries - protestant tradition, economic development and long exposure
to democracy explain significantly the variation in the level of perceived corruption. This
confirms the findings of Treisman (2000), which points out that religious decomposition,
economic development and long exposure to democracy can help determine levels of
corruption. The relevance of the degree ‘openness’ is, to an extent, dependent on the
specifications used and variables controlled for in the regressions. Conversely, the data found
no support for hypotheses that countries with British colonial heritage were less corrupt, and
countries with a federal structure are more corrupt. In the following section, I focus on the
primary question of this research: does dynasty-politics matter?
3.4.2 Base-Line Results
Results from the base-line regressions, which investigate a possible relationship between
dynasty-politics and corruption are presented in Table 3.4 A, B & C. More specifically, in
Table –3.4A, the dependent variable is the country mean for ‘Control of Corruption’ from
1996 to 2005. The specifications in all three columns include variables that are identified in
the literature as important in explaining cross-country variation in the level of perceived
corruption. The coefficient for DI is negative, but not significant at 10% in column-1. This
provides some indication that dynastic politicians (while in office) are dominated by the
‘stockpiling-wealth’ incentive. Nonetheless, the insignificant coefficient for DI fails to
support the notion that countries with dynasty-politics are on average associated with higher
levels of corruption. In column-2, I exclude countries that are governed by executive
monarchies. The rationale behind this is to infer something for countries where dynastic
succession in the highest political office, is to an extent, dependent on actions and events
undertaken and encountered by its national leaders, and not validated or legitimized by
institutional arrangements.133 This allows the analysis to relate closely to the mentioned
theory which suggests that leaders who are willing to initiate a dynastic succession at the
national level faces two opposing incentives: reputation-building versus stock-piling wealth.
Hence, by dropping monarchies from the examination, the results suffer from a loss of two
133 Since monarchies ensure dynastic succession through institutional arrangement, it possibly alters themotivational dynamics of their leader’s in office. Hence, it is likely that objective functions of leadersin monarchies and non-monarchies are different as they interact with non-identical norms, conventionsand institutional structure.
112
observations – Jordan and Morocco. Even so, the coefficient for DI is negative but not
significant at 10%. Finally, in column–3, I drop Singapore from the regression estimations.
This is done for two primary reasons. First, Singapore has a mean ‘Control of Corruption’
score of 2.4. This makes it the least corrupt country in the sample. Moreover, Singapore also
has a very high DI score of 0.69, which is solely due to Lee134 dynasty’s influence in
Singapore’s political arena. This makes Singapore (to a degree) an outlier in the data set.135
Second, the analysis is done with and without Singapore. Thus, the conclusion drawn from
the overall empirical investigation is, in no way, biased from the presence (or absence) of
Singapore in the data.
The results from column – 3 point out that that countries with higher degree of dynasty-
politics are on average associated with higher levels of corruption. This is because the
coefficient for DI is negative and significant at 10%. In terms of magnitude, the coefficient is
-0.41, which means if Iceland was under dynastic control (i.e. DI=1), then it would have
failed to qualify as member of the ‘top ten’ least corrupt countries in 2000. Additionally, it is
important to note that after dropping Singapore, the standard errors for all variables
decreased in absolute size. This indicates that the precisions of the point estimates have
improved. In table-3.4B and table-3.4C, I repeat the previous analysis on different measures
of corruption. The country mean of ‘CPI 2001 to 2009’ is used as a dependent variable in all
regressions in table-3.4B. And, the variable ‘Corrupt’ (earlier used in La Porta et al (1999)) is
used as a dependent variable in table-3.4C. The idea here is to check whether the findings are
sensitive to multiple measures of corruption. The results from both these tables convey a
mixed message. To be more elaborative, in table - 4B, the coefficient for the DI is negative
but insignificant in all the three columns. On the other hand, in table-4C, the coefficient for
the dynasty-index is negative and significant at 5% for column-3 (i.e.- for the restricted
sample). This, to a degree, is similar to the findings in column-3 in table-4A. In terms of
the overall model fit, it is clear that R-square in table-4A and table-4B is greater than 0.8
inall columns.136 This suggests that our base-line specification accounts for more than eighty
134 Lee Kuan Yew and his son Lee Hsein Loong have dominated Singapore’s political landscape formore than three decades. See http://www.biography.com/people/lee-kuan-yew-9377339
135North Korea, on the other hand, has a dynasty index equal to one – representing the absolute of theKim dynasty. Furthermore, North Korea is also one of most corrupt countries in the sample.Nevertheless, North Korea is automatically not considered in the analysis since I have no measure ofethno-linguistic fragmentation for it in the data set.
136The adjusted R-square is above 0.8 as well for all estimation in Table-4A &B.
113
percent variation in the level of corruption in our sample. This is quite satisfactory for a
cross-sectional analysis. In contrast, the R-square for table - 4C is more than 0.5 for all three
columns, which is weaker than the previous estimations.
Thus, the results taken together can offer three key points. First, for a sample excluding
monarchies and Singapore, there is some association between dynasty-politics and the level
of corruption across countries. This, however, does not suggest that this relationship between
dynasty-politics and corruption is causal. This is because the results can potentially suffer
from endogeniety stemming from both omitted variable and possible reverse causality. To be
more specific, if the econometric model fails to control for a country specific time invariant
factor which is correlated with two of our variables of interest, then our coefficient will suffer
from omitted variable.137 For example, if a certain political culture exists in some countries
that promotes both a higher degree of dynasty-politics and a higher level of corruption, then
the results will be picking up the impact of such political culture on the level of corruption in
those countries. Besides, the problem of reverse causality emerges from the concern that state
of corruption in a country can also allow political dynasties to persist in power, and this
makes the country more prone to the influence of dynastic politics. Hence, the mentioned
results only point out a correlation between dynasty-politics and corruption. Second, the
findings are in line with Treisman (2000) and Svennson (2005), which highlight the role of
economic development, religious decomposition and long exposure to democracy in
explaining the cross-country variation in the level of corruption. Lastly, it identifies a new
factor for further scrutiny – the role of political dynasties which can potentially determine
something as fundamental as corruption.
3.4.3 Role of Immediate Dynastic Successions
So far, I have examined the relationship between dynasty-politics and corruption, where the
degree of dynasty- politics is measured by a dynasty’s exposure to state power in last six
decades.138 Yet, in this section the aim is to investigate the role of a very specific political
phenomenon associated with dynasty-politics – immediate dynastic successions. The purpose
here is to shed light on the question: Are immediate dynastic successions associated with
137 Time varying omitted factors are also troublesome for the analysis.
138 Countries gaining independence after 1950 are examined with their period of ‘self-rule’

114
higher (or lower) levels of perceived corruption across countries? This specific focus on
immediate dynastic succession is interesting because it allows the analysis to relate closely
the theoretical insights discussed previously. In short, I have discussed the possibility that
dynastic politicians have in their objective function a desire to initiate a dynastic succession.
This can motivate them to build a reputation for their family by serving public interest, which
in the process will help them succeed in achieving their objective. This will also result in
reducing corruption. In contrast, dynastic politicians while in office can use their position to
accumulate political and financial capital so that they can ensure a dynastic succession
through their sheer strength in the political arena. This will undermine the governance
scenario, and will probably result in facilitating corruption. Thus, immediate dynastic
succession can (in principle) result in either higher or lower level of perceived
corruption139as it is a direct outcome of actions and events undertaken and encountered by
national leaders. For this reason, an indicator variable Immediate Succession140 is used in this
section to see if such types of political successions are associated with the levels of
corruption across countries.
Table 3.5 A, B & C report the regression results. In Table – 3.5A, the analysis is conducted
on the total data set. The specification in all three columns incorporate variables that are
identified in the literature as imperative in explaining cross-country variation in the level of
perceived corruption. In column -1 the dependent variable is the country-mean for ‘Control
of Corruption’ from 1996 to 2005, and the estimations pinpoint some interesting findings.
First, countries with immediate dynastic succession are associated141with higher levels of
perceived corruption. The association is stronger than the findings in earlier sections as the
coefficient for the indicator variable Immediate Succession is negative and significant at 5%.
The coefficient is -0.28, which highlights that if Bangladesh had experienced an immediate
dynastic succession in its political landscape, it would have entertained more corruption than
139This obviously depends on which motivation (reputation-building versus stockpiling wealth) governsthe behavioral dynamics of dynastic politician.
140Immediate Succession is a binary variable which is equal to one for countries with political a dynasty(i) from which - (1) two members occupied the position of the executive head of the state (post 1950),and (2) where the second member succeeded the first member within one year of his or her retirementfrom the top political office.
141 As mentioned above, the results only pinpoint an interesting correlation and not a causalrelationship. This is because, higher levels of corruption can in turn also allow immediate dynasticsuccessions to take place by weakening

115
Democratic Republic of Congo in 2008.142 Column-2 also provides qualitatively similar
results on a different dependant variable. In contrast, in column-3, the coefficient for
Immediate Succession has a negative coefficient but not significant even at 10%. A possible
reason underlying this insignificant result is that the data in column-3 covers fewer countries.
Besides, the explanatory capacity of the overall model is weaker than before as indicated by
lower R-square of 0.56. Table-3.5B drops monarchies from the empirical analysis.143 This
is done to infer a possible relationship between immediate dynastic succession and corruption
in countries where dynastic succession in the top political office is not a product of norms,
conventions, and institutional arrangements. The results from column-1 and column-2
highlight a stronger association between the presence of immediate dynastic succession and
higher levels corruption. That is, the coefficient for the indicator variable is negative and
significant at 1% on both the columns. However, in column-3, the coefficient remains
negative but not significant.
On the whole, the estimations (so far) fail to find any support for reputation-building
incentive, which can potentially determine the behaviour of dynastic politicians. In particular,
the results identify that countries with immediate dynastic successions in their political arena
are associated with higher levels of corruption. In this respect, an interesting question that is
worth scrutinizing is: what kind of immediate dynastic successions is driving this result? This
is because immediate dynastic successions are often associated with various actions and
events, which makes them heterogeneous in nature. So, to address this concern, I categorize
immediate-dynastic-succession into three broad types. First, I construct an indicator variable
Retirement-IS144,which is equal to one when a leader voluntarily retires (or chooses not to
stand for re-election) in support of a member of the family for the top office. Second, I
construct a dummy variable Natural Death-IS145, which is equal to one for countries where
an immediate dynastic occurred after a leader died in office for natural causes. Lastly, a
142 The interpretation only hints the possible magnitude of the effect, even though no causal inference ismade from the overall analysis.
143 This results in a loss of two observations.
144 For example- In Cuba, Fidel Castro resigned from the Office of the President to pave way for hisyounger brother Raul Castro. See: http://www.biography.com/people/fidel-castro-9241487
145 For example- When Sir Milton Margai- the first Prime Minister of Sierra Leone – died in office, hisyounger brother Sir Albert Margai immediate succeeded him to the top office. See:http://www.britannica.com/EBchecked/topic/364553/Sir-Milton-Margai
116
binary variable Assassination-IS is constructed, which is equal to one when a country
entertains an immediate dynastic succession in the top political office after the
assassination of its leader.146 Consequently, with these three measures of immediate-
dynastic-succession, the paper presents a more disaggregated analysis in Table-3.5C.
From column-1, it can be seen that the coefficient for Retirement-IS is negative and
significant at 1%. This highlights that countries where immediate dynastic successions occur
after the voluntary retirement of a national leader from the office of the executive head of the
state – are on average more corrupt. Furthermore, this correlation is particularly interesting
for two reasons. One, it indicates that ‘reputation-building’ is unlikely to be the guiding
motivation of dynastic leaders while they are in office. Two, the specific nature of the
indicator variable- Retirement-IS- allows future studies to focus on such types of successions
to understand if the political process guiding it can facilitate corruption or not. In column-2,
the regression uses Natural Death-IS to see how such successions are associated with
corruption. The result suggests that such types of succession are not related with levels of
perceived corruption.147 The specification in column-3 uses Assassination-IS to quantify
dynastic succession associated with assassination of a national leader. In addition, the
coefficient points out that immediate dynastic succession of such nature are also associated
with higher levels of corruption. Lastly, in column-4, all three types of succession are
estimated simultaneously. Likewise, the estimations highlight that only Retirement-IS and
Assassination-IS are associated with higher levels of corruption - where as immediate
successions after the death of a national leader do not explain the variation of corruption
across countries in any significant degree. This conclusion also remains true when
monarchies are excluded from the estimations (as depicted in column-5-8).
3.4.4 Role of Political Competition.
In this section, I expand the present analysis to address a slightly different question. he paper
argued that dynastic politicians face two opposing incentives: ‘reputation-building’ vs.
‘stockpiling-wealth’. The idea here is to identify the incentive that on average dominates the
146For example- After the assassination of Mrs Indira Gandhi by her own bodyguards in 1984, her sonRajiv Gandhi immediately succeeded her to become India’s youngest Prime Minister. See:http://www.encyclopedia.com/topic/Indira_Gandhi.aspx
147 The relevant coefficient is negative but not significant at 10%.
117
behaviour of dynastic politicians. Besides, the results so far suggest that higher degree of
dynasty-politics is associated with greater levels of corruption, which lends some support to
the possibility that ‘stockpiling-wealth’ incentive dominates the behaviour of dynasty-
politicians. Nonetheless, an important question that I will address in this section is- what
conditions increase the possibility that the ‘stockpiling-wealth’ incentive will dominate the
‘reputation-building’ incentive or vice versa? More precisely, the objective is to pinpoint the
role of political competition in making any one incentive stronger than the other. This will
help understand whether dynasty-politics have a different association with corruption in
countries where political competition is high in comparison to countries where political
competition is low. If one expects that political dynasties in politically competitive countries
will be more dominated by reputation-building incentive in comparison to countries where
political competition is low, then one will expect dynasty-politics to have relatively lower
levels of association with corruption for countries that are politically more competitive. So,
to test these alternative possibilities, I augment the base-line specification by including an
interaction between dynasty-index and our measure of uninterrupted democracy.148
The new augmented specification is:
= + + + + ( ). ( ) +The results are shown in Table-6. From column-1, 3 and 5, it can be seen that coefficient for
dynastic-index is negative but not significant at 10%. On the contrary, results from column-2,
4 & 6 indicate that the coefficient for Immediate Succession is negative and significant at 5%,
which is in line with the earlier findings. Yet, the key parameter of interest here is θ. If this
coefficient is significantly different from zero, then the relationship between dynasty-politics
and corruption is different in countries with a higher degree of democracy in comparison to
countries with a lower degree of democracy. As shown, in all six columns, θ is negative but
not statistically significant. Hence, the overall analysis fails to find any solid evidence
suggesting a differential relation between dynasty-politics and corruption in countries with
higher political competition as opposed to countries with a lower level of political
competition.
148Countries with un-interrupted democracy post-1950 (or after their independence) are assumed tohave high political competition in comparison to countries with monarchy or periodic autocratic rule.

118
3.4.5 Robustness Check
As noted earlier, the results taken together are suggestive that dynasty-politics is associated
with higher levels of corruption. More specifically, the results point out that a higher degree
of dynasty-politics is associated with a higher level of corruption when Singapore and
monarchies are not included in the sample. This association is robust for multiple measures
of corruption and remains significant when important determinants of corruption are
considered. The paper also investigates the role of immediate dynastic succession in the
highest political office. This is done to capture an alternative phenomenon associated with
dynasty-politics. Besides, the results pinpoint that countries with immediate dynastic
successions are strongly associated with a greater likelihood of having higher levels of
perceived corruption. This correlation is also significant when I restrict the sample with
countries without any executive monarchies. The empirical analysis also attempted to
identify if the relationship between dynasty-politics and corruption is different for countries
with higher political competition in comparison to countries with lower political competition.
The results, however, did not support this possible differential relation between dynasty-
politics and corruption.
To scrutinize further, in this section I perform some additional robustness checks for the
existing results. In Table-3.7A, I check the strength of DI in explaining the variation of
corruption across countries when additional covariates are controlled in the regressions.
Column-1 of Table-7A, uses a binary variable DYNASTIC 149as an alternative measure of
dynasty-politics to see whether or not the association between dynasty-politics and
corruption remains significant. The result fails to find any significant association. In column-
2, I incorporate a measure for size of the government taken from La Porta et al (1999). This
is done for two reasons. First, in theory it is suggested to facilitate corruption (LaPolambara
1994). Second, empirical evidence (in contrary) show that larger governments are less
corrupt (La Porta et al 1999; Friedman et al 2000). The estimations show that the coefficient
for Public Sector Employment is positive but not significant. On the other hand, the
coefficient for DI indicates a significant association between dynasty-politics and higher
levels of corruption. The specification of the Column-3 includes a measure for natural
resource endowment taken from the data set of Treisman (2000). This is because Ades and
149 The DYNASTIC variable is equal to one of a country has a political dynasty (i) from which morethan two members occupied the position of the executive head of the state, and zero otherwise.
119
Di Tella (1999) suggests that countries with large endowments of natural resources are likely
to be more corrupt. As stated, the relevant coefficient is negative150 but not significant.
Additionally, the association between dynasty-politics and corruption is also not significant.
Lastly, in column-4 the regression controls for continent fixed effects by including dummy
variables for Asia, North America, South America, Africa, Europe and Asia. This makes the
continent Australia the reference category. Controlling for continent specific time invariant
effects allows the analysis to address less quantifiable factors151 that can make some
countries in a continent more prone to corruption. The findings show that continent specific
effects are not significant associated with corruption at 10%. The coefficient for
DIalsoremains insignificant, pinpointing no correlation between dynasty-politics and
corruption when we measure dynasty-politics by a dynasty’s exposure to state power in last
six decades.
In Table-3.7B, the robustness of immediate dynastic succession in explaining cross-country
variation in the level of corruption is examined. This is essential since earlier regression has
identified a strong association between the presence of immediate dynastic succession and
higher levels of perceived corruption. Thus, the specifications in column -1, 2, 3 & 4 provide
multiple checks to see whether the coefficient for Immediate Succession can survive the
inclusion of multiple covariates. As displayed below, the results remain qualitatively similar
to the ones computed earlier in Table 3.5 A, B & C. This strengthens the original finding that
immediate dynastic succession at the top political office is associated with higher levels of
corruption. This remains true even when monarchies are excluded from the analysis or when
continent specific time invariant effects are incorporated into the specification. In the next
section, I conclude with some direction for future research.
150The sign indicates some truth in the mentioned hypothesis. Besides, the coefficient is marginallymissing significance at 10%.
151 It is often argued that certain countries entertain a higher level of corruption because their culturemakes such behaviour acceptable. Some empirical work focusing using experimental techniques aretrying to shed light on such hypothesis. For more information see: Barr and Serra. (2006)

120
3.5 Conclusion and Caveats.
This paper sets out to examine whether there is a systematic relationship between dynasty-
politics and the level of corruption across countries. This focus is interesting because
dynasty-politics reflect a specific kind of inequality in the distribution of political power in a
country’s political landscape. So, to quantify such a political phenomenon, two primary
measures are adopted. First, I compute a dynasty-index DIwhich measures the variation in
the degree of dynasty-politics by examining each country’s exposure to members of political
dynasties in state power in last six decades. I then use this measure to identify if there is a
systematic relationship between dynasty-politics and corruption for more than one hundred
countries. As noted earlier, one can observe a ‘weak’ correlation between dynasty-politics
and corruption, which indicates that a higher degree of dynasty-politics is associated with a
higher level of (perceived) corruption. I state that this correlation is ‘weak’ because it is only
significant when the sample is restricted by excluding Singapore and monarchies from the
estimations152, and it remains sensitive to the inclusion of some important covariates. Second,
I use a binary variable to focus on a special kind of phenomenon associated with dynasty-
politics – the role of immediate dynastic succession Furthermore, the results point out that
countries with immediate dynastic succession in their top political office are on average
associated with higher levels of corruption. This association also remains robust for various
measures of corruption and is significant when we control for important determinants of
corruption.
As a result, the empirical analysis opens the possibility of one key inference. That is,
countries with influential political dynasties (or at least with immediate dynastic successions
at the highest political office) are on average more corrupt. Likewise, this message is difficult
to reconcile with the reputation-building story but it lends some support to stockpiling-wealth
incentive which suggests that dynastic politicians will pursue succession in the political arena
through developing political machineries and accumulating financial capital. This can result
in higher corruption. It is important to note, however, that the mentioned relationship
between dynasty-politics and corruption is, in no respect, causal. This is because our results
might suffer from an omitted variable as we fail to control for country specific time
152This, however, only results in a loss of three observations. It must also be noted that results are alsonot altered by the absence of North Korea, since it is automatically dropped from most estimations as itdoes not have a data value for ethno-linguistic fractionalization.
121
invariant(or variant) factors, which might determine both the degree of dynasty-politics and
the level of corruption that we witness across countries. In addition to this, the results can
also suffer from endogeneity stemming from reverse causality. In other words, a higher
degree of corruption can itself allow politicians to promote their dynasties since politicians in
office are able to take advantage of the weak institutions (due to corruption) in place to
promote a dynastic succession. Consequently, is it is pragmatic to state that observed
evidence is crude but provocative. This is because, the results are suggestive that while the
relationship between corruption and dynasty-politics is not noted to be causal, the evidence
does indicate that high perceived corruption is an important characteristics of polities under
the extreme influence of political dynasties. This provides sufficient encouragement for
future research to provide a detailed investigation to see if the observed correlation between
dynasty-politics and corruption is reflecting an underlying causal relationship. Future studies
can also explore the exact political process that guides immediate dynastic successions
(especially when such successions occur after the voluntary retirement of a national leader)
to isolate its role in facilitating corruption.
The paper also explores an interesting extension of the analysis by focusing onthe role of
political competition to understand the influence of certain conditions in facilitating a
differential relationship between corruption and dynasty politics. It seeks to understand
whether the association between dynasty-politics and corruption is different for countries
with high political competition in comparison to countries with low political competition.
This extension, in particular, allows the analysis to address questions such as: does
democratic consolidation make dynastic politicians relatively apt for more reputation-
building? The, results, however, do not support any differential relationship.
The overall results are also in line with Shleifer, A and Vishny, R. (1993), Treisman (2000)
and Svensson (2005), as I too noted that economic development, protestant tradition, and
long exposure to democracy have a strong positive relationship with lower levels of
corruption. On the other hand, unlike Ades and Di Tella, (1999) and Treisman (2000) I find
limited evidence supporting the claim that economic factors like- openness to foreign trade
plays an important role in explaining the cross-country variation in the level corruption. The
significance of such factor is sensitive to variables I control for in the regressions. This
makes me agnostic about its overall relevance. Similarly, in contrast to Mauro (1995), I fail
to support the claim that ethnically heterogeneous societies are per se more corrupt. The

122
results, however, are in line with La Porta et al (1999), which identifies that ethno-linguistic
fractionalization only explains government performance when economic development is not
factored into the econometric specification. Other than this, I find no evidence supporting
the hypotheses that federal states are more corrupt than non-federal states, and former British
colonies are less corrupt.
To sum up, this paper investigates an interesting link between dynasty-politics and
corruption. To my knowledge, this is the first systematic cross-country empirical analysis
that relates corruption with a socio-political phenomenon such as dynasty-politics. Up till
now, these two topics have been separately analysed by economists, political scientists and
historians. However, this paper is the first step towards understanding the possible
relationship between these two important socio-political outcomes, and it belongs to the
broader stream of the literature on political dynasties and corruption.
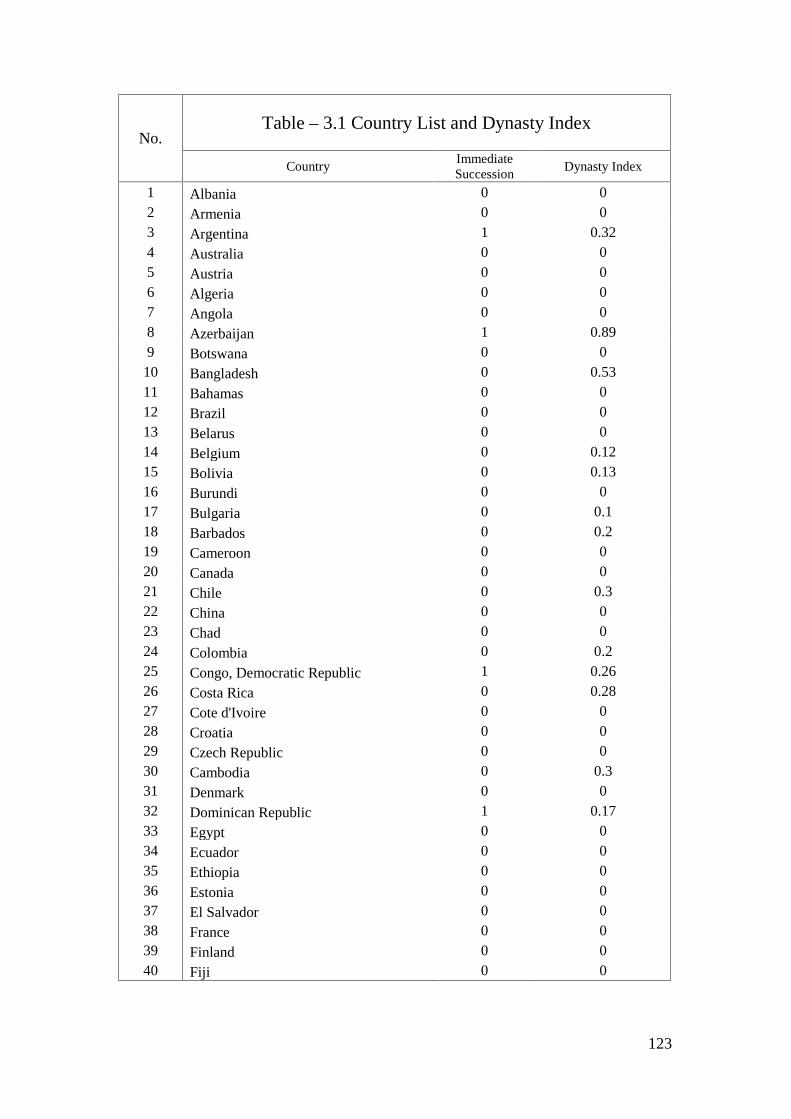
123
No.Table – 3.1 Country List and Dynasty Index
CountryImmediateSuccession
Dynasty Index
1 Albania 0 02 Armenia 0 03 Argentina 1 0.324 Australia 0 05 Austria 0 06 Algeria 0 07 Angola 0 08 Azerbaijan 1 0.899 Botswana 0 010 Bangladesh 0 0.5311 Bahamas 0 012 Brazil 0 013 Belarus 0 014 Belgium 0 0.1215 Bolivia 0 0.1316 Burundi 0 017 Bulgaria 0 0.118 Barbados 0 0.219 Cameroon 0 020 Canada 0 021 Chile 0 0.322 China 0 023 Chad 0 024 Colombia 0 0.225 Congo, Democratic Republic 1 0.2626 Costa Rica 0 0.2827 Cote d'Ivoire 0 028 Croatia 0 029 Czech Republic 0 030 Cambodia 0 0.331 Denmark 0 032 Dominican Republic 1 0.1733 Egypt 0 034 Ecuador 0 035 Ethiopia 0 036 Estonia 0 037 El Salvador 0 038 France 0 039 Finland 0 040 Fiji 0 0

124
No.Table – 3.1 Country List and Dynasty Index continued
Country Immediate Succession Dynasty Index
41 Germany 0 042 Gabon 1 0.8643 Gambia 0 044 Georgia 0 045 Ghana 0 046 Grenada 0 047 Guinea 0 048 Guinea-Bissau 0 049 Guyana 1 0.1850 Guatemala 0 051 Haiti 1 0.4852 Honduras 0 053 Hungary 0 054 Ireland 0 0.355 India 1 0.5756 Indonesia 0 0.3357 Iraq 1 0.0858 Israel 0 059 Italy 0 060 Iran 0 0.4861 Iceland 0 0.2762 Jordan 1 163 Japan 0 0.3564 Jamaica 0 065 Kazakhstan 0 066 Kenya 0 067 Kuwait 1 168 Liberia 0 069 Latvia 0 070 Luxemburg 0 071 Lebanon 1 0.172 Lithuania 0 073 Madagascar 0 074 Mexico 0 075 Mali 0 076 Mauritius 0 0.5777 Malawi 0 078 Malaysia 1 0.2679 Malta 0 080 Maldives 0 081 Mozambique 0 082 Morocco 1 1

125
No.Table – 3.1 Country List and Dynasty Index continued
Country Immediate Succession Dynasty Index
83 Netherland 0 084 New Zealand 0 085 Nepal 1 0.9586 North Korea 1 187 Niger 0 088 Norway 0 089 Nigeria 0 090 Nicaragua 1 0.4891 Namibia 0 092 Paraguay 0 093 Pakistan 0 0.294 Panama 0 0.3795 Peru 0 0.1896 Philippines 0 0.3297 Portugal 0 098 Poland 0 099 Russia 0 0100 Rwanda 0 0101 Romania 0 0102 Saudi Arabia 1 1103 Senegal 0 0104 Sierra Leone 1 0.12105 Singapore 0 0.69106 South Africa 0 0107 Syria 1 0.65108 Sweden 0 0.05109 Sri Lanka 1 0.53110 Switzerland 0 0111 Spain 0 0112 Slovakia 0 0113 Somalia 1 0.1114 Sudan 0 0115 South Korea 0 0
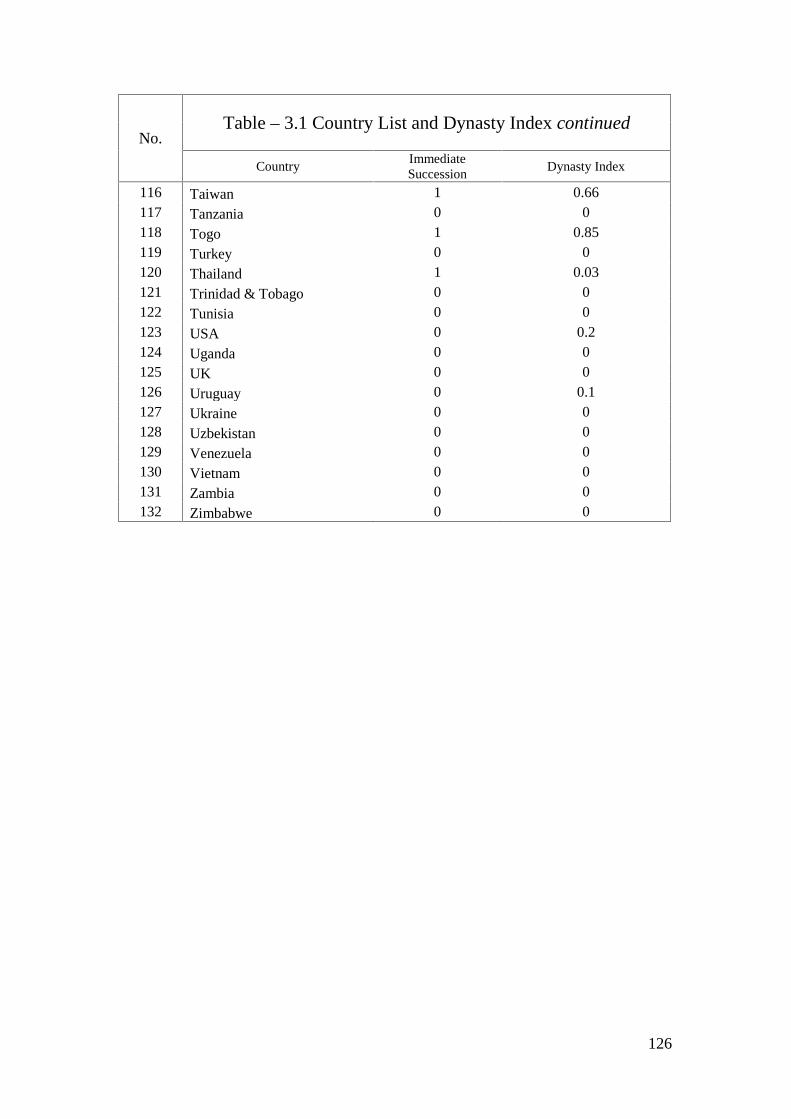
126
No.Table – 3.1 Country List and Dynasty Index continued
CountryImmediateSuccession
Dynasty Index
116 Taiwan 1 0.66117 Tanzania 0 0118 Togo 1 0.85119 Turkey 0 0120 Thailand 1 0.03121 Trinidad & Tobago 0 0122 Tunisia 0 0123 USA 0 0.2124 Uganda 0 0125 UK 0 0126 Uruguay 0 0.1127 Ukraine 0 0128 Uzbekistan 0 0129 Venezuela 0 0130 Vietnam 0 0131 Zambia 0 0132 Zimbabwe 0 0

127
Figure - 3.1 Scatter Plot
Note: To view scatter plots with more details, please see Appendix Figure – 3.1, Appendix Figure –
3.2, Appendix Figure – 3.3 (available in pages 270, 271 and 272);Source: Author’s Computation
-2
-1
0
1
2
3
0 .2 .4 .6 .8 1Dynasty Index
Avg. Control of Corruption Fitted values
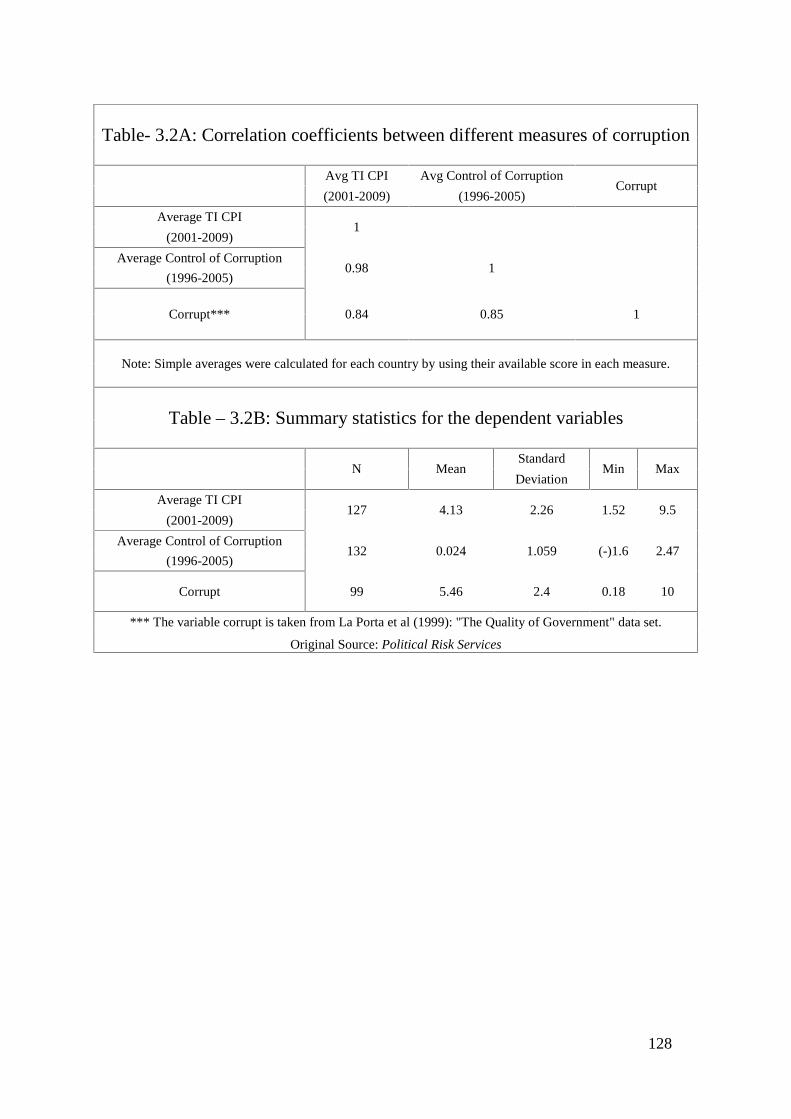
128
Table- 3.2A: Correlation coefficients between different measures of corruption
Avg TI CPI Avg Control of CorruptionCorrupt
(2001-2009) (1996-2005)
Average TI CPI1
(2001-2009)
Average Control of Corruption0.98 1
(1996-2005)
Corrupt*** 0.84 0.85 1
Note: Simple averages were calculated for each country by using their available score in each measure.
Table – 3.2B: Summary statistics for the dependent variables
N MeanStandard
Min MaxDeviation
Average TI CPI127 4.13 2.26 1.52 9.5
(2001-2009)
Average Control of Corruption132 0.024 1.059 (-)1.6 2.47
(1996-2005)
Corrupt 99 5.46 2.4 0.18 10
*** The variable corrupt is taken from La Porta et al (1999): "The Quality of Government" data set.
Original Source: Political Risk Services

129
Table – 3.3A: Re-examining Treisman (2000) findings
Dependent Variable: Average of 'Control of Corruption 1996-2005'
OLS OLS OLS OLS1 2 3 4
Common Law(-)0.063 (-)0.036 (-)0.134 (-)0.169
0.395 0.204 0.196 0.181
Former BritishColony
0.379 0.262 0.249 0.236
0.359 0.192 0.179 0.169
Never Colony1.035*** 0.481*** 0.413*** 0.447***
0.254 0.147 0.14 0.143
Protestant0.017*** 0.01*** 0.009*** 0.009***
0.004 0.002 0.002 0.002
Ethno-linguisticFrac.
(-)1.23*** (-)0.046 (-)0.062 (-)0.121
0.259 0.21 0.21 0.206
Log of GDP0.642*** 0.55*** 0.49***
0.061 0.082 0.049
Federal0.057 0.128
0.145 0.139
Un-interrupted Dem0.451*** 0.002***
0.176 0.0012
Openness0.002*
0.001
Constant(-)0.005 (-)5.665*** (-)4.93*** (-)4.59***
0.145 0.545 0.696 0.597N 113 113 113 113
R-square 0.49 0.79 0.81 0.82
(*), (**) and (***) denote significance at 10%, 5% and 1%. Robust Standard Error are in braces
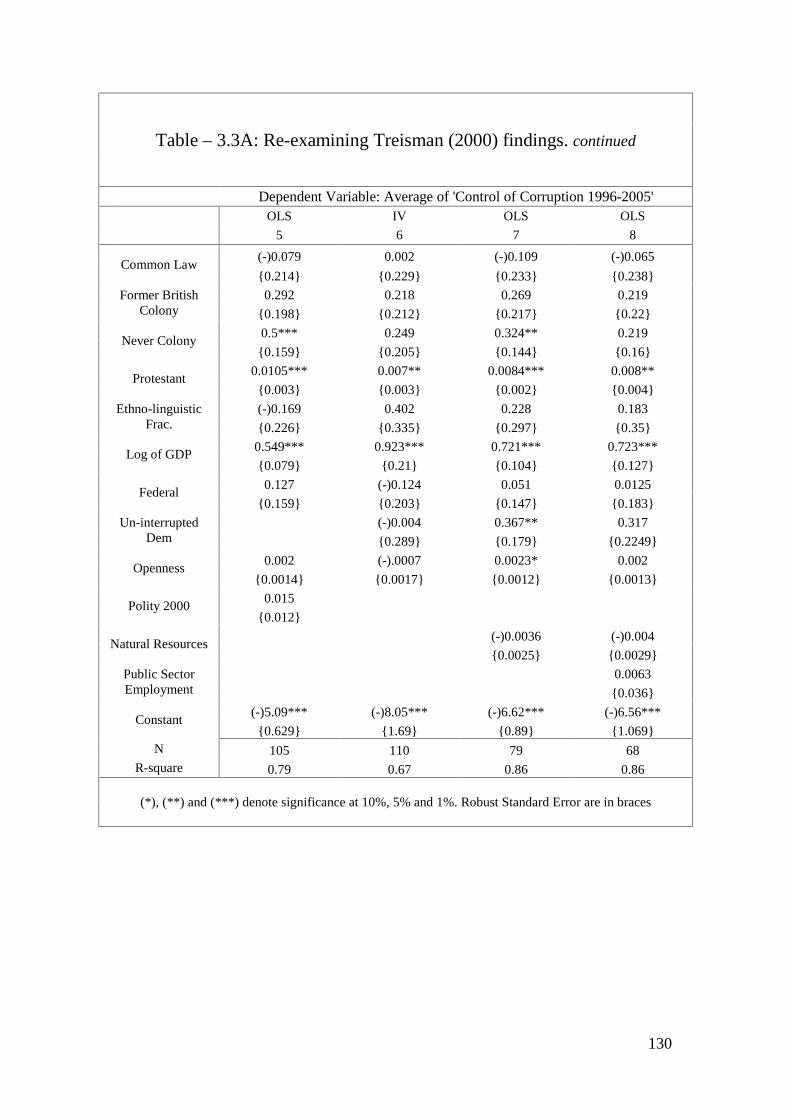
130
Table – 3.3A: Re-examining Treisman (2000) findings. continued
Dependent Variable: Average of 'Control of Corruption 1996-2005'OLS IV OLS OLS
5 6 7 8
Common Law(-)0.079 0.002 (-)0.109 (-)0.065
0.214 0.229 0.233 0.238
Former BritishColony
0.292 0.218 0.269 0.219
0.198 0.212 0.217 0.22
Never Colony0.5*** 0.249 0.324** 0.219
0.159 0.205 0.144 0.16
Protestant0.0105*** 0.007** 0.0084*** 0.008**
0.003 0.003 0.002 0.004
Ethno-linguisticFrac.
(-)0.169 0.402 0.228 0.183
0.226 0.335 0.297 0.35
Log of GDP0.549*** 0.923*** 0.721*** 0.723***
0.079 0.21 0.104 0.127
Federal0.127 (-)0.124 0.051 0.0125
0.159 0.203 0.147 0.183
Un-interruptedDem
(-)0.004 0.367** 0.317
0.289 0.179 0.2249
Openness0.002 (-).0007 0.0023* 0.002
0.0014 0.0017 0.0012 0.0013
Polity 20000.015
0.012
Natural Resources(-)0.0036 (-)0.004
0.0025 0.0029
Public SectorEmployment
0.0063
0.036
Constant(-)5.09*** (-)8.05*** (-)6.62*** (-)6.56***
0.629 1.69 0.89 1.069N 105 110 79 68
R-square 0.79 0.67 0.86 0.86
(*), (**) and (***) denote significance at 10%, 5% and 1%. Robust Standard Error are in braces

131
Table – 3.3B: Re-examining Treisman (2000) findings.
Dependent Variable: Average of 'TI CPI 2001-2009'
OLS OLS OLS OLS
1 2 3 4
Common Law(-)0.011 0.046 (-)0.146 (-)0.208
0.813 0.43 0.438 0.406
Former BritishColony
0.778 0.543 0.512 0.489
0.742 0.395 0.397 0.372
Never Colony2.24*** 1.063*** 0.939*** 1.002***
0.525 0.325 0.312 0.312
Protestant0.039*** 0.026*** 0.022*** 0.023***
0.008 0.005 0.0049 0.005
Ethno-linguistic Frac.(-)2.548*** (-)0.058 (-)0.089 (-)0.206
0.557 0.425 0.419 0.415
Log of GDP1.34*** 1.169*** 1.05***
0.124 0.168 0.142
Federal0.073 0.209
0.307 0.287
Un-interrupted Dem0.849** 0.929***
0.402 0.357
Openness0.004
0.003
Constant3.97*** (-)7.84*** (-)6.49*** (-)5.849***
0.301 1.08 1.42 1.16N 110 110 110 110
R-square 0.52 0.8 0.82 0.83
(*), (**) and (***) denote significance at 10%, 5% and 1%. Robust Standard Error are in braces
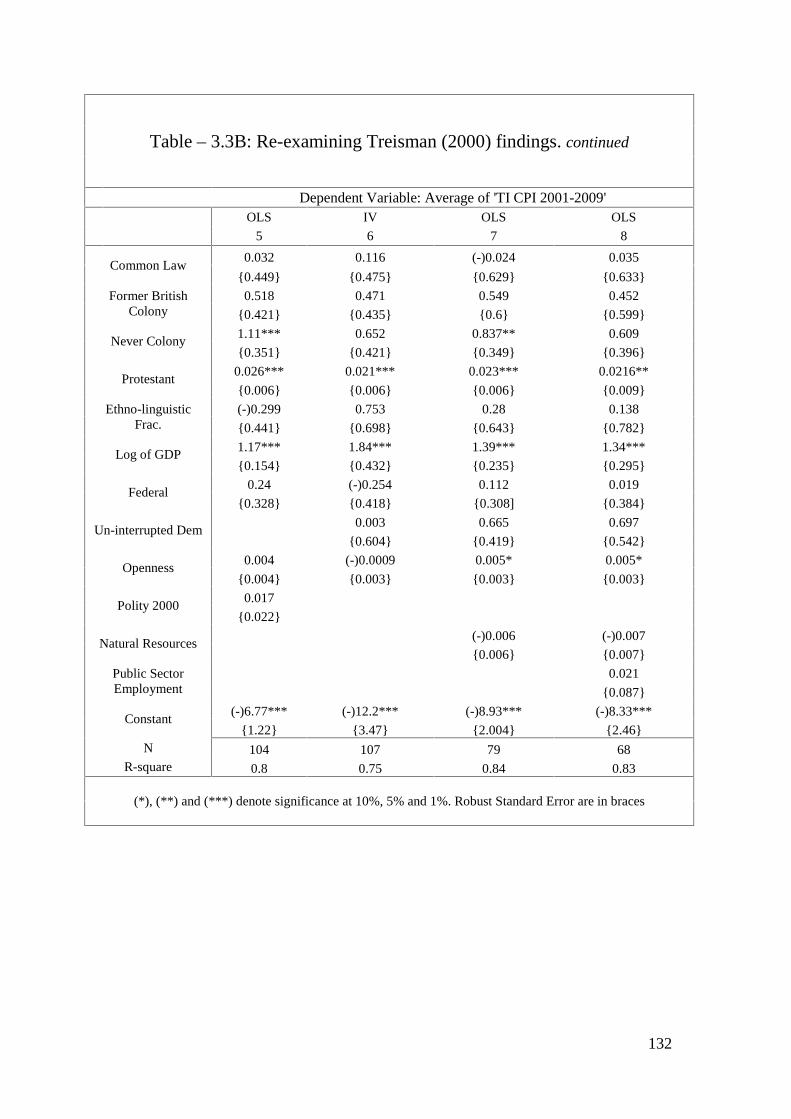
132
Table – 3.3B: Re-examining Treisman (2000) findings. continued
Dependent Variable: Average of 'TI CPI 2001-2009'OLS IV OLS OLS
5 6 7 8
Common Law0.032 0.116 (-)0.024 0.035
0.449 0.475 0.629 0.633
Former BritishColony
0.518 0.471 0.549 0.452
0.421 0.435 0.6 0.599
Never Colony1.11*** 0.652 0.837** 0.609
0.351 0.421 0.349 0.396
Protestant0.026*** 0.021*** 0.023*** 0.0216**
0.006 0.006 0.006 0.009
Ethno-linguisticFrac.
(-)0.299 0.753 0.28 0.138
0.441 0.698 0.643 0.782
Log of GDP1.17*** 1.84*** 1.39*** 1.34***
0.154 0.432 0.235 0.295
Federal0.24 (-)0.254 0.112 0.019
0.328 0.418 0.308] 0.384
Un-interrupted Dem0.003 0.665 0.697
0.604 0.419 0.542
Openness0.004 (-)0.0009 0.005* 0.005*
0.004 0.003 0.003 0.003
Polity 20000.017
0.022
Natural Resources(-)0.006 (-)0.007
0.006 0.007
Public SectorEmployment
0.021
0.087
Constant(-)6.77*** (-)12.2*** (-)8.93*** (-)8.33***
1.22 3.47 2.004 2.46N 104 107 79 68
R-square 0.8 0.75 0.84 0.83
(*), (**) and (***) denote significance at 10%, 5% and 1%. Robust Standard Error are in braces
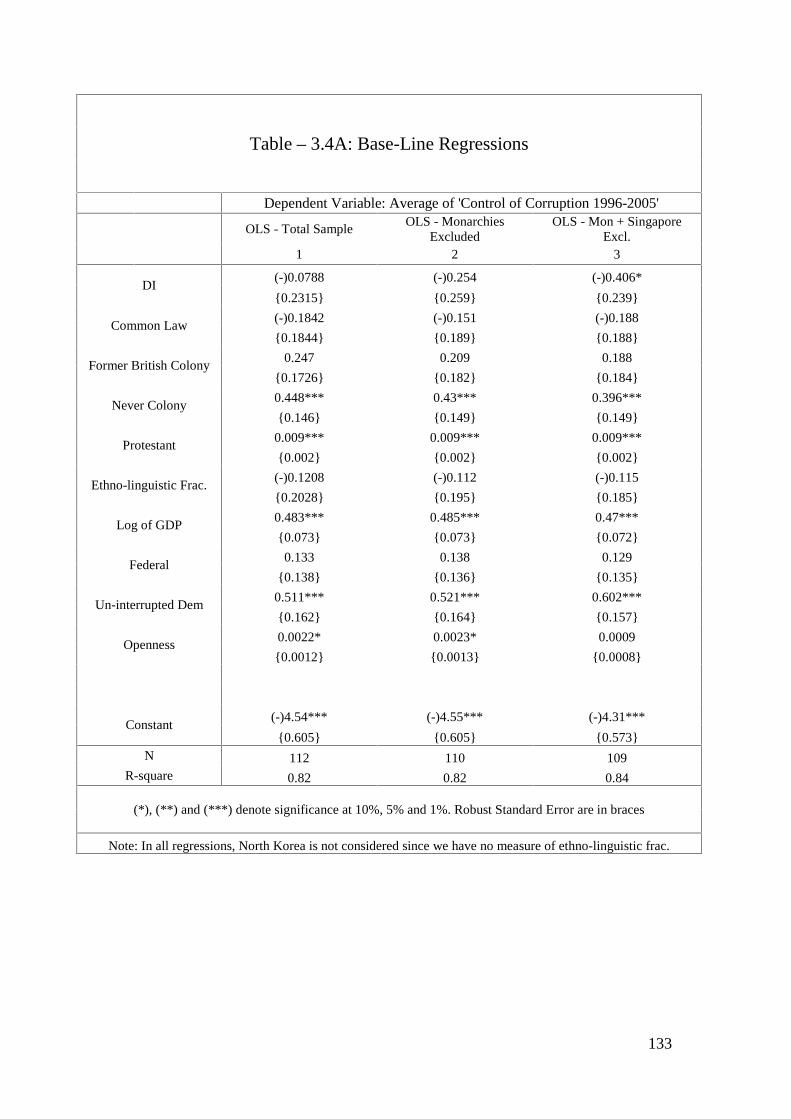
133
Table – 3.4A: Base-Line Regressions
Dependent Variable: Average of 'Control of Corruption 1996-2005'
OLS - Total SampleOLS - Monarchies
ExcludedOLS - Mon + Singapore
Excl.1 2 3
DI(-)0.0788 (-)0.254 (-)0.406*
0.2315 0.259 0.239
Common Law(-)0.1842 (-)0.151 (-)0.188
0.1844 0.189 0.188
Former British Colony0.247 0.209 0.188
0.1726 0.182 0.184
Never Colony0.448*** 0.43*** 0.396***
0.146 0.149 0.149
Protestant0.009*** 0.009*** 0.009***
0.002 0.002 0.002
Ethno-linguistic Frac.(-)0.1208 (-)0.112 (-)0.115
0.2028 0.195 0.185
Log of GDP0.483*** 0.485*** 0.47***
0.073 0.073 0.072
Federal0.133 0.138 0.129
0.138 0.136 0.135
Un-interrupted Dem0.511*** 0.521*** 0.602***
0.162 0.164 0.157
Openness0.0022* 0.0023* 0.0009
0.0012 0.0013 0.0008
Constant(-)4.54*** (-)4.55*** (-)4.31***
0.605 0.605 0.573N 112 110 109
R-square 0.82 0.82 0.84
(*), (**) and (***) denote significance at 10%, 5% and 1%. Robust Standard Error are in braces
Note: In all regressions, North Korea is not considered since we have no measure of ethno-linguistic frac.
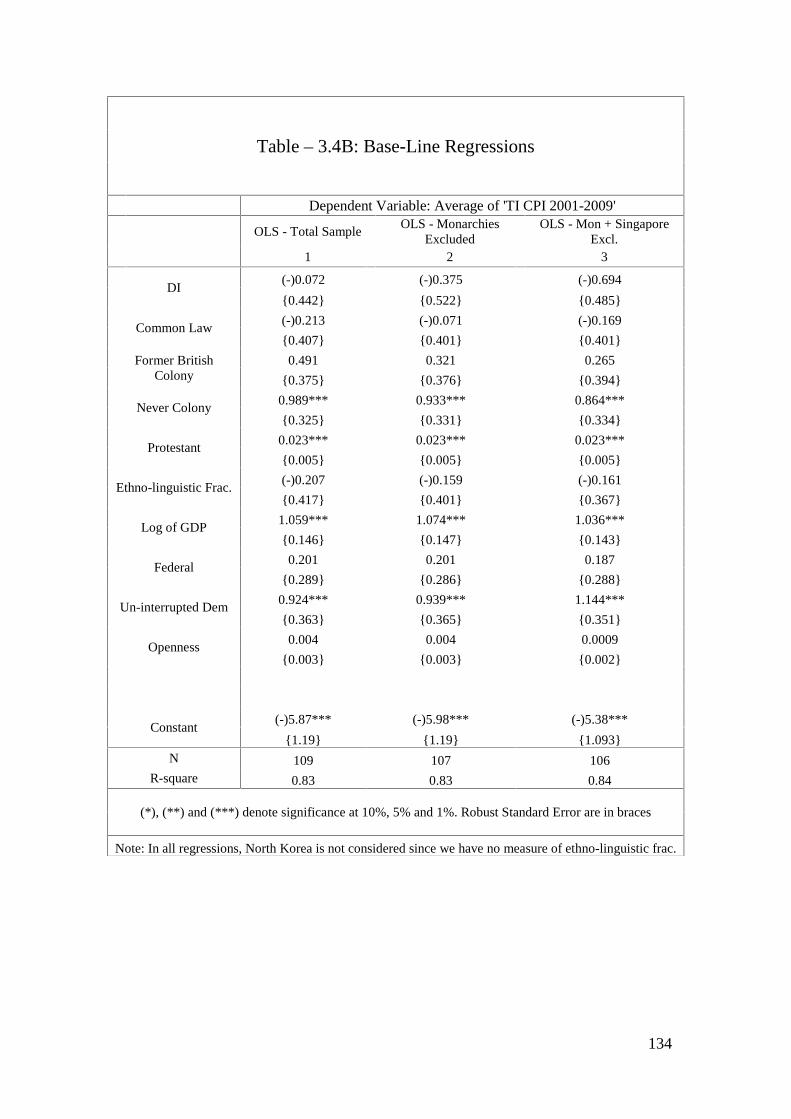
134
Table – 3.4B: Base-Line Regressions
Dependent Variable: Average of 'TI CPI 2001-2009'
OLS - Total SampleOLS - Monarchies
ExcludedOLS - Mon + Singapore
Excl.1 2 3
DI(-)0.072 (-)0.375 (-)0.694
0.442 0.522 0.485
Common Law(-)0.213 (-)0.071 (-)0.169
0.407 0.401 0.401
Former BritishColony
0.491 0.321 0.265
0.375 0.376 0.394
Never Colony0.989*** 0.933*** 0.864***
0.325 0.331 0.334
Protestant0.023*** 0.023*** 0.023***
0.005 0.005 0.005
Ethno-linguistic Frac.(-)0.207 (-)0.159 (-)0.161
0.417 0.401 0.367
Log of GDP1.059*** 1.074*** 1.036***
0.146 0.147 0.143
Federal0.201 0.201 0.187
0.289 0.286 0.288
Un-interrupted Dem0.924*** 0.939*** 1.144***
0.363 0.365 0.351
Openness0.004 0.004 0.0009
0.003 0.003 0.002
Constant(-)5.87*** (-)5.98*** (-)5.38***
1.19 1.19 1.093N 109 107 106
R-square 0.83 0.83 0.84
(*), (**) and (***) denote significance at 10%, 5% and 1%. Robust Standard Error are in braces
Note: In all regressions, North Korea is not considered since we have no measure of ethno-linguistic frac.
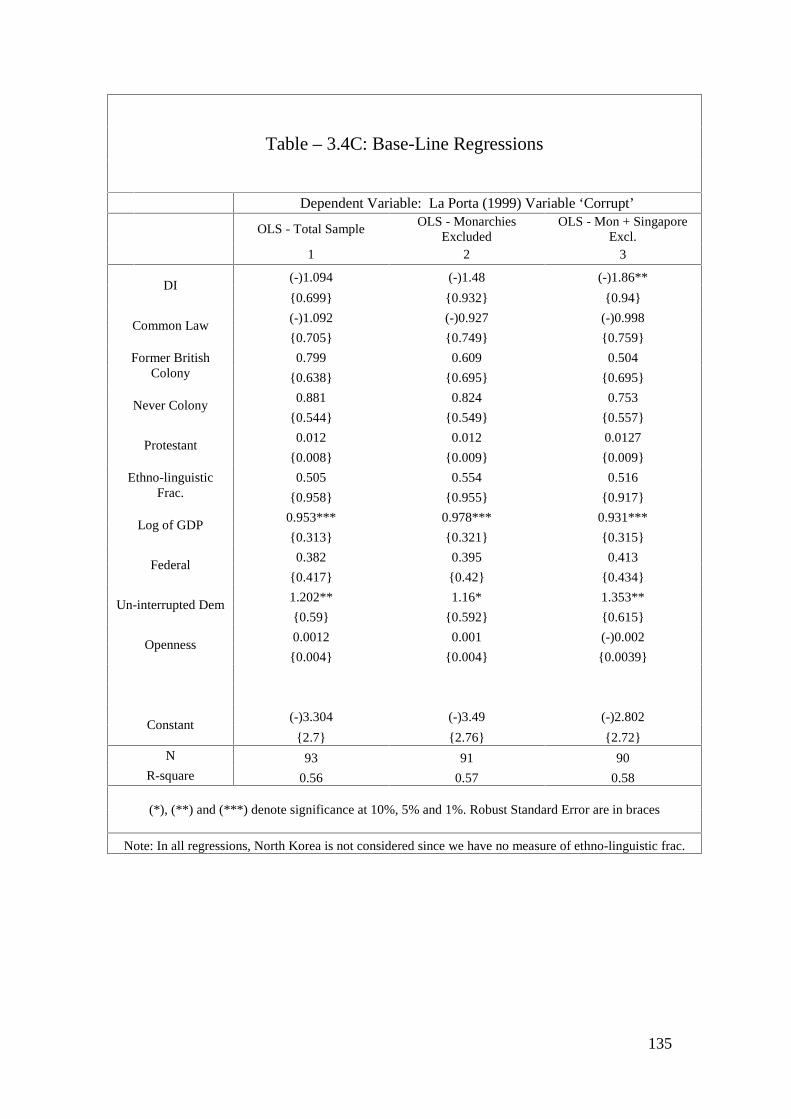
135
Table – 3.4C: Base-Line Regressions
Dependent Variable: La Porta (1999) Variable ‘Corrupt’
OLS - Total SampleOLS - Monarchies
ExcludedOLS - Mon + Singapore
Excl.1 2 3
DI(-)1.094 (-)1.48 (-)1.86**
0.699 0.932 0.94
Common Law(-)1.092 (-)0.927 (-)0.998
0.705 0.749 0.759
Former BritishColony
0.799 0.609 0.504
0.638 0.695 0.695
Never Colony0.881 0.824 0.753
0.544 0.549 0.557
Protestant0.012 0.012 0.0127
0.008 0.009 0.009
Ethno-linguisticFrac.
0.505 0.554 0.516
0.958 0.955 0.917
Log of GDP0.953*** 0.978*** 0.931***
0.313 0.321 0.315
Federal0.382 0.395 0.413
0.417 0.42 0.434
Un-interrupted Dem1.202** 1.16* 1.353**
0.59 0.592 0.615
Openness0.0012 0.001 (-)0.002
0.004 0.004 0.0039
Constant(-)3.304 (-)3.49 (-)2.802
2.7 2.76 2.72N 93 91 90
R-square 0.56 0.57 0.58
(*), (**) and (***) denote significance at 10%, 5% and 1%. Robust Standard Error are in braces
Note: In all regressions, North Korea is not considered since we have no measure of ethno-linguistic frac.
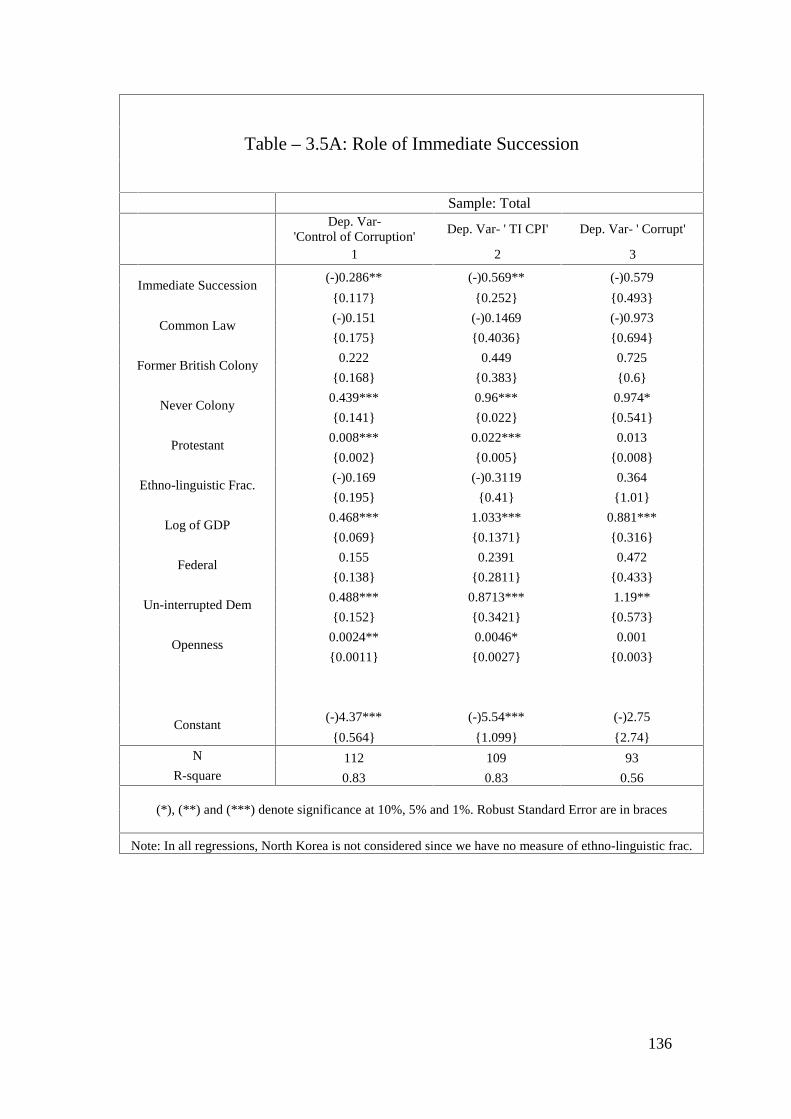
136
Table – 3.5A: Role of Immediate Succession
Sample: TotalDep. Var-
'Control of Corruption'Dep. Var- ' TI CPI' Dep. Var- ' Corrupt'
1 2 3
Immediate Succession(-)0.286** (-)0.569** (-)0.579
0.117 0.252 0.493
Common Law(-)0.151 (-)0.1469 (-)0.973
0.175 0.4036 0.694
Former British Colony0.222 0.449 0.725
0.168 0.383 0.6
Never Colony0.439*** 0.96*** 0.974*
0.141 0.022 0.541
Protestant0.008*** 0.022*** 0.013
0.002 0.005 0.008
Ethno-linguistic Frac.(-)0.169 (-)0.3119 0.364
0.195 0.41 1.01
Log of GDP0.468*** 1.033*** 0.881***
0.069 0.1371 0.316
Federal0.155 0.2391 0.472
0.138 0.2811 0.433
Un-interrupted Dem0.488*** 0.8713*** 1.19**
0.152 0.3421 0.573
Openness0.0024** 0.0046* 0.001
0.0011 0.0027 0.003
Constant(-)4.37*** (-)5.54*** (-)2.75
0.564 1.099 2.74N 112 109 93
R-square 0.83 0.83 0.56
(*), (**) and (***) denote significance at 10%, 5% and 1%. Robust Standard Error are in braces
Note: In all regressions, North Korea is not considered since we have no measure of ethno-linguistic frac.
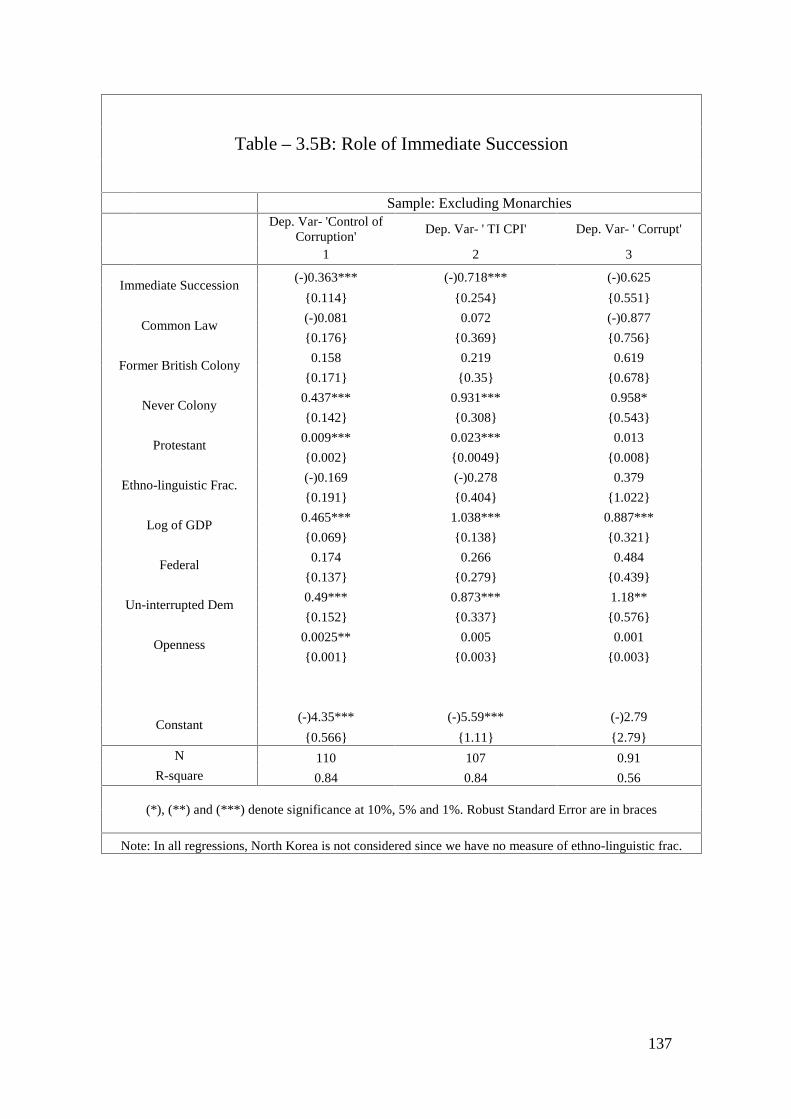
137
Table – 3.5B: Role of Immediate Succession
Sample: Excluding MonarchiesDep. Var- 'Control of
Corruption'Dep. Var- ' TI CPI' Dep. Var- ' Corrupt'
1 2 3
Immediate Succession(-)0.363*** (-)0.718*** (-)0.625
0.114 0.254 0.551
Common Law(-)0.081 0.072 (-)0.877
0.176 0.369 0.756
Former British Colony0.158 0.219 0.619
0.171 0.35 0.678
Never Colony0.437*** 0.931*** 0.958*
0.142 0.308 0.543
Protestant0.009*** 0.023*** 0.013
0.002 0.0049 0.008
Ethno-linguistic Frac.(-)0.169 (-)0.278 0.379
0.191 0.404 1.022
Log of GDP0.465*** 1.038*** 0.887***
0.069 0.138 0.321
Federal0.174 0.266 0.484
0.137 0.279 0.439
Un-interrupted Dem0.49*** 0.873*** 1.18**
0.152 0.337 0.576
Openness0.0025** 0.005 0.001
0.001 0.003 0.003
Constant(-)4.35*** (-)5.59*** (-)2.79
0.566 1.11 2.79N 110 107 0.91
R-square 0.84 0.84 0.56
(*), (**) and (***) denote significance at 10%, 5% and 1%. Robust Standard Error are in braces
Note: In all regressions, North Korea is not considered since we have no measure of ethno-linguistic frac.
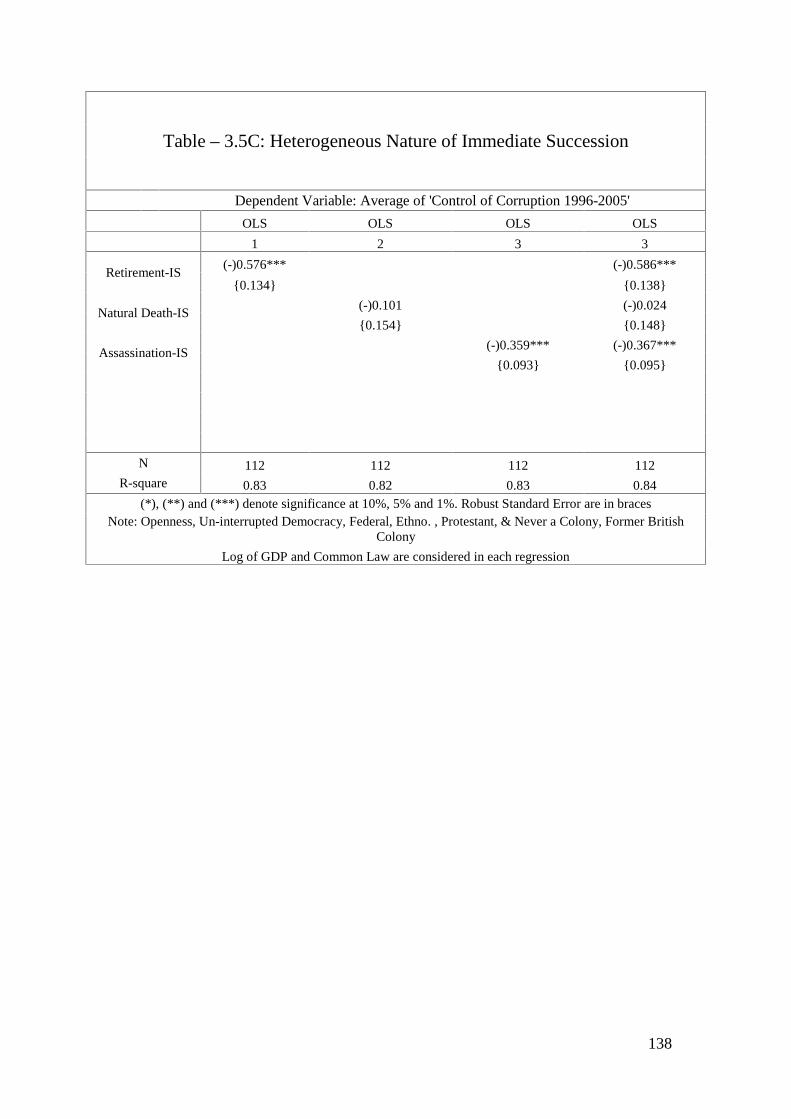
138
Table – 3.5C: Heterogeneous Nature of Immediate Succession
Dependent Variable: Average of 'Control of Corruption 1996-2005'
OLS OLS OLS OLS
1 2 3 3
Retirement-IS(-)0.576*** (-)0.586***
0.134 0.138
Natural Death-IS(-)0.101 (-)0.024
0.154 0.148
Assassination-IS(-)0.359*** (-)0.367***
0.093 0.095
N 112 112 112 112R-square 0.83 0.82 0.83 0.84
(*), (**) and (***) denote significance at 10%, 5% and 1%. Robust Standard Error are in bracesNote: Openness, Un-interrupted Democracy, Federal, Ethno. , Protestant, & Never a Colony, Former British
Colony
Log of GDP and Common Law are considered in each regression
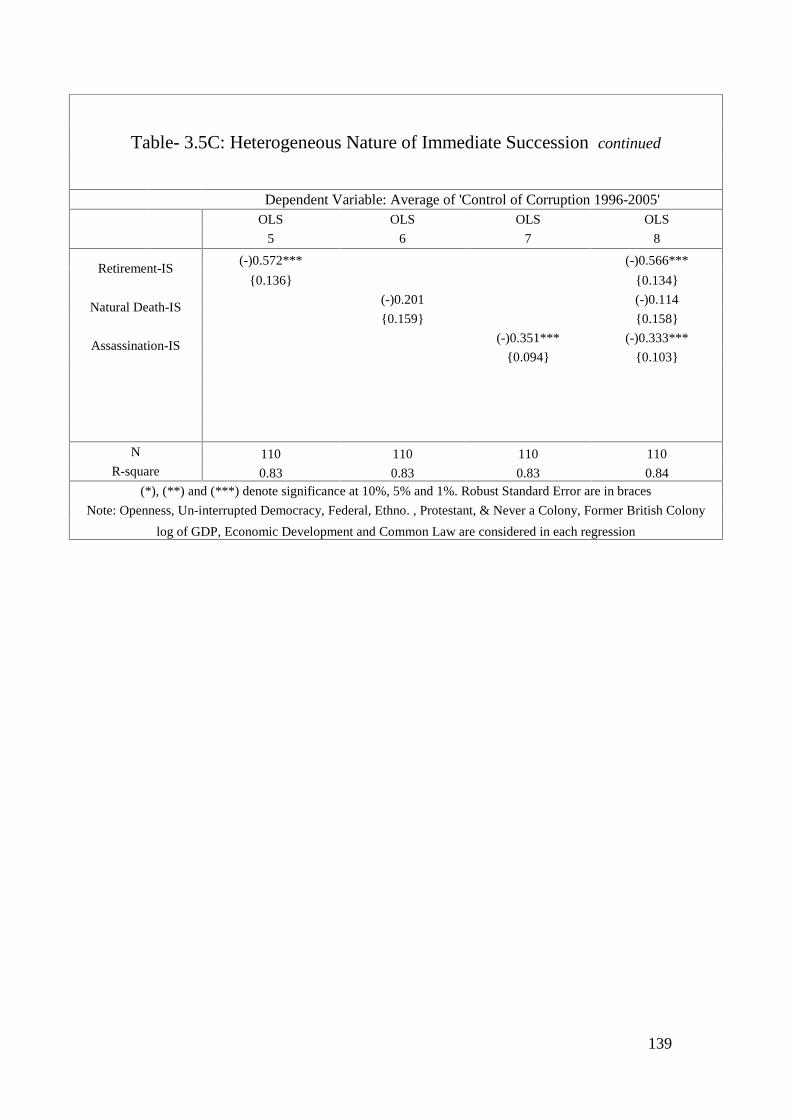
139
Table- 3.5C: Heterogeneous Nature of Immediate Succession continued
Dependent Variable: Average of 'Control of Corruption 1996-2005'OLS OLS OLS OLS
5 6 7 8
Retirement-IS(-)0.572*** (-)0.566***
0.136 0.134
Natural Death-IS(-)0.201 (-)0.114
0.159 0.158
Assassination-IS(-)0.351*** (-)0.333***
0.094 0.103
N 110 110 110 110R-square 0.83 0.83 0.83 0.84
(*), (**) and (***) denote significance at 10%, 5% and 1%. Robust Standard Error are in braces
Note: Openness, Un-interrupted Democracy, Federal, Ethno. , Protestant, & Never a Colony, Former British Colony
log of GDP, Economic Development and Common Law are considered in each regression
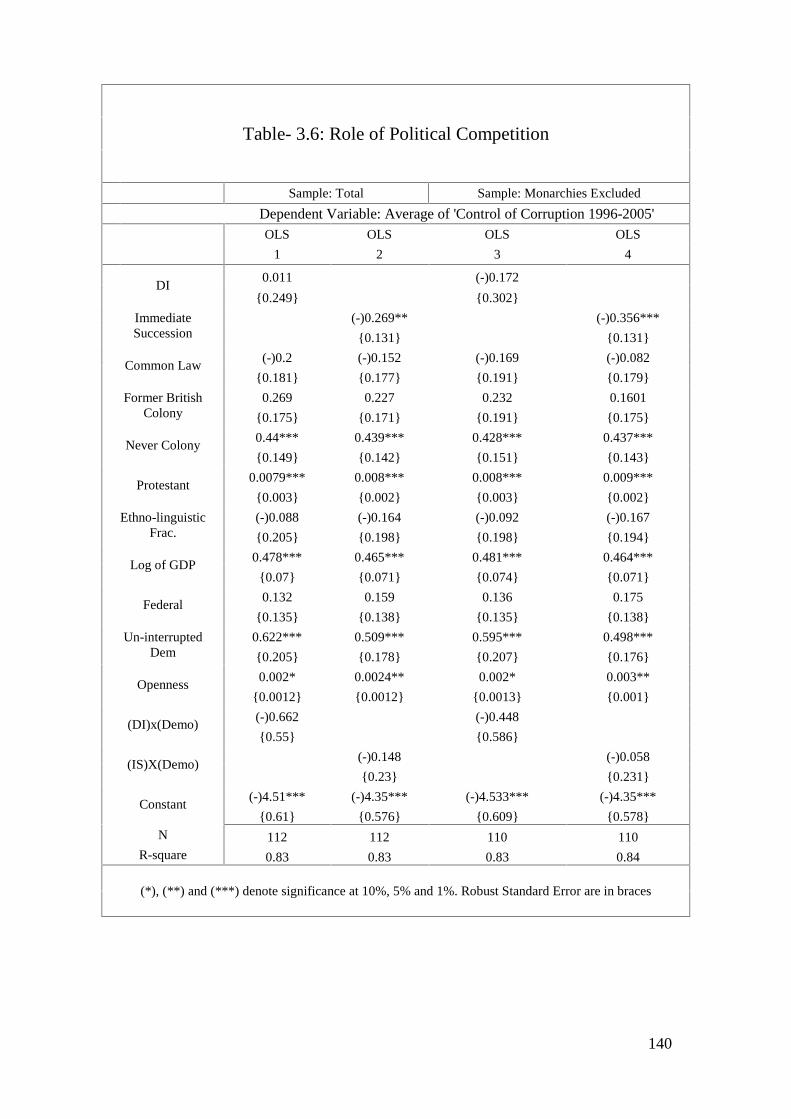
140
Table- 3.6: Role of Political Competition
Sample: Total Sample: Monarchies Excluded
Dependent Variable: Average of 'Control of Corruption 1996-2005'OLS OLS OLS OLS
1 2 3 4
DI0.011 (-)0.172
0.249 0.302
ImmediateSuccession
(-)0.269** (-)0.356***
0.131 0.131
Common Law(-)0.2 (-)0.152 (-)0.169 (-)0.082
0.181 0.177 0.191 0.179
Former BritishColony
0.269 0.227 0.232 0.1601
0.175 0.171 0.191 0.175
Never Colony0.44*** 0.439*** 0.428*** 0.437***
0.149 0.142 0.151 0.143
Protestant0.0079*** 0.008*** 0.008*** 0.009***
0.003 0.002 0.003 0.002
Ethno-linguisticFrac.
(-)0.088 (-)0.164 (-)0.092 (-)0.167
0.205 0.198 0.198 0.194
Log of GDP0.478*** 0.465*** 0.481*** 0.464***
0.07 0.071 0.074 0.071
Federal0.132 0.159 0.136 0.175
0.135 0.138 0.135 0.138
Un-interruptedDem
0.622*** 0.509*** 0.595*** 0.498***
0.205 0.178 0.207 0.176
Openness0.002* 0.0024** 0.002* 0.003**
0.0012 0.0012 0.0013 0.001
(DI)x(Demo)(-)0.662 (-)0.448
0.55 0.586
(IS)X(Demo)(-)0.148 (-)0.058
0.23 0.231
Constant(-)4.51*** (-)4.35*** (-)4.533*** (-)4.35***
0.61 0.576 0.609 0.578N 112 112 110 110
R-square 0.83 0.83 0.83 0.84
(*), (**) and (***) denote significance at 10%, 5% and 1%. Robust Standard Error are in braces
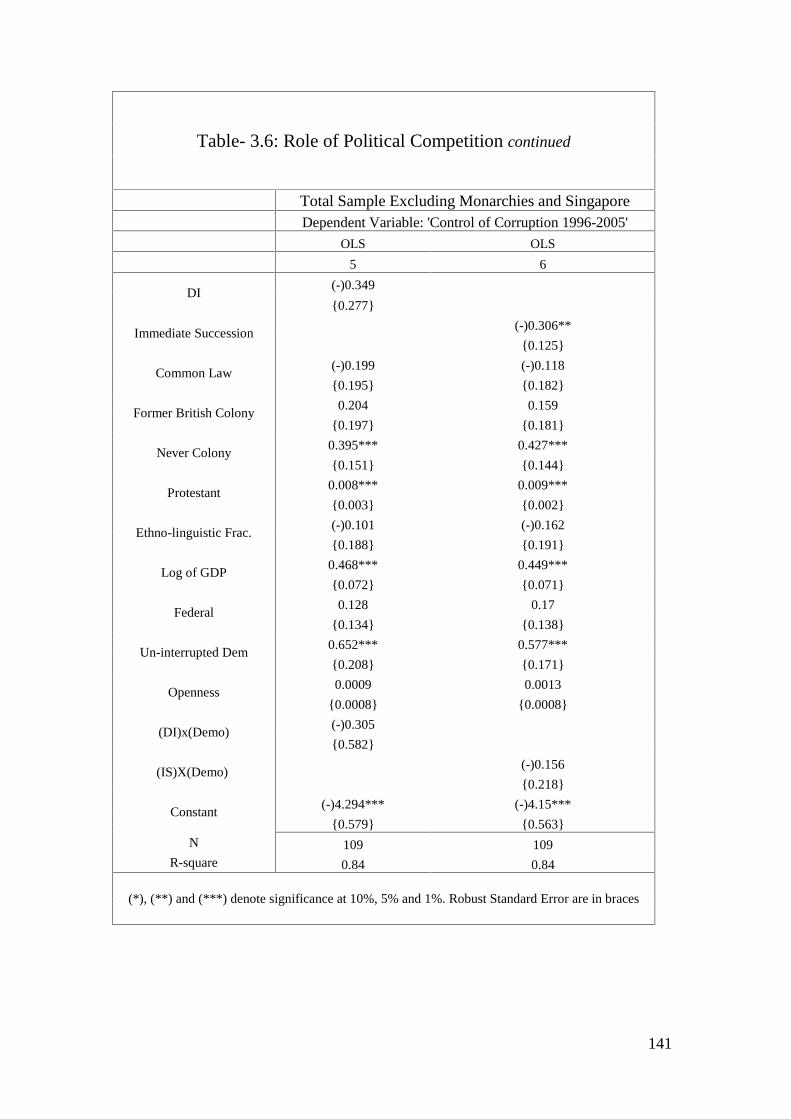
141
Table- 3.6: Role of Political Competition continued
Total Sample Excluding Monarchies and SingaporeDependent Variable: 'Control of Corruption 1996-2005'
OLS OLS
5 6
DI(-)0.349
0.277
Immediate Succession(-)0.306**
0.125
Common Law(-)0.199 (-)0.118
0.195 0.182
Former British Colony0.204 0.159
0.197 0.181
Never Colony0.395*** 0.427***
0.151 0.144
Protestant0.008*** 0.009***
0.003 0.002
Ethno-linguistic Frac.(-)0.101 (-)0.162
0.188 0.191
Log of GDP0.468*** 0.449***
0.072 0.071
Federal0.128 0.17
0.134 0.138
Un-interrupted Dem0.652*** 0.577***
0.208 0.171
Openness0.0009 0.0013
0.0008 0.0008
(DI)x(Demo)(-)0.305
0.582
(IS)X(Demo)(-)0.156
0.218
Constant(-)4.294*** (-)4.15***
0.579 0.563N 109 109
R-square 0.84 0.84
(*), (**) and (***) denote significance at 10%, 5% and 1%. Robust Standard Error are in braces
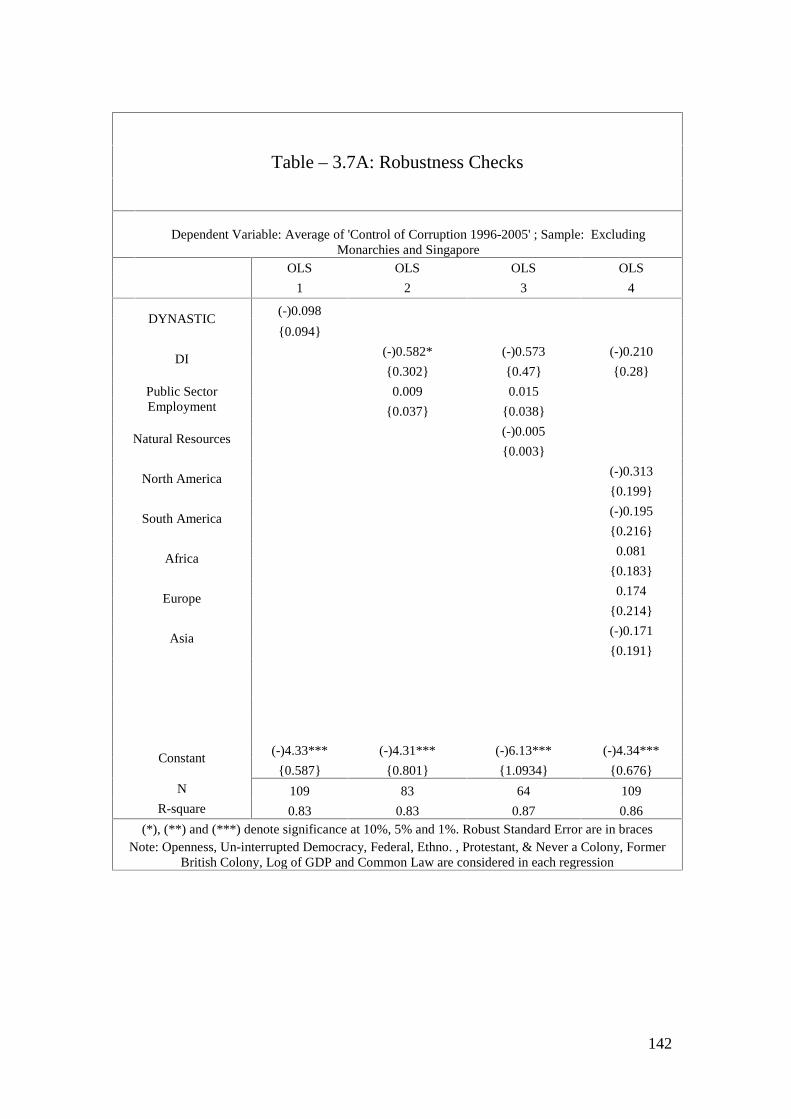
142
Table – 3.7A: Robustness Checks
Dependent Variable: Average of 'Control of Corruption 1996-2005' ; Sample: ExcludingMonarchies and Singapore
OLS OLS OLS OLS
1 2 3 4
DYNASTIC(-)0.098
0.094
DI(-)0.582* (-)0.573 (-)0.210
0.302 0.47 0.28
Public SectorEmployment
0.009 0.015
0.037 0.038
Natural Resources(-)0.005
0.003
North America(-)0.313
0.199
South America(-)0.195
0.216
Africa0.081
0.183
Europe0.174
0.214
Asia(-)0.171
0.191
Constant(-)4.33*** (-)4.31*** (-)6.13*** (-)4.34***
0.587 0.801 1.0934 0.676N 109 83 64 109
R-square 0.83 0.83 0.87 0.86(*), (**) and (***) denote significance at 10%, 5% and 1%. Robust Standard Error are in braces
Note: Openness, Un-interrupted Democracy, Federal, Ethno. , Protestant, & Never a Colony, FormerBritish Colony, Log of GDP and Common Law are considered in each regression
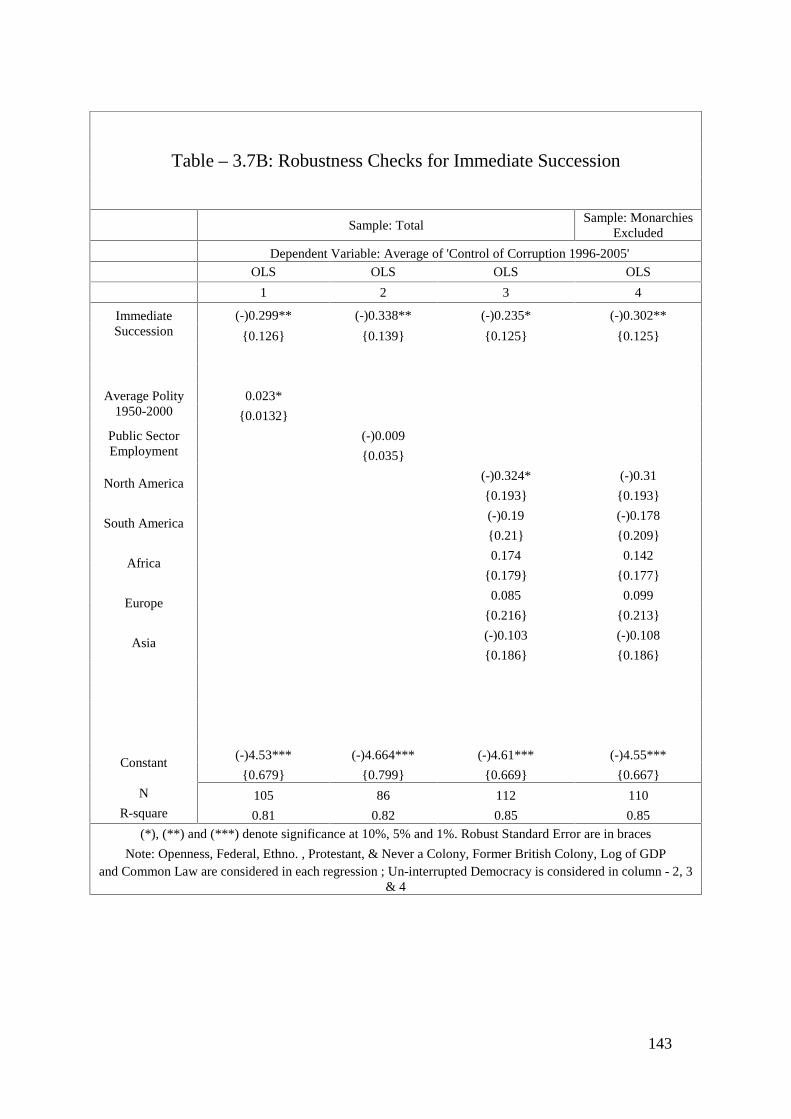
143
Table – 3.7B: Robustness Checks for Immediate Succession
Sample: TotalSample: Monarchies
Excluded
Dependent Variable: Average of 'Control of Corruption 1996-2005'OLS OLS OLS OLS
1 2 3 4
ImmediateSuccession
(-)0.299** (-)0.338** (-)0.235* (-)0.302**
0.126 0.139 0.125 0.125
Average Polity1950-2000
0.023*
0.0132
Public SectorEmployment
(-)0.009
0.035
North America(-)0.324* (-)0.31
0.193 0.193
South America(-)0.19 (-)0.178
0.21 0.209
Africa0.174 0.142
0.179 0.177
Europe0.085 0.099
0.216 0.213
Asia(-)0.103 (-)0.108
0.186 0.186
Constant(-)4.53*** (-)4.664*** (-)4.61*** (-)4.55***
0.679 0.799 0.669 0.667N 105 86 112 110
R-square 0.81 0.82 0.85 0.85(*), (**) and (***) denote significance at 10%, 5% and 1%. Robust Standard Error are in braces
Note: Openness, Federal, Ethno. , Protestant, & Never a Colony, Former British Colony, Log of GDPand Common Law are considered in each regression ; Un-interrupted Democracy is considered in column - 2, 3
& 4
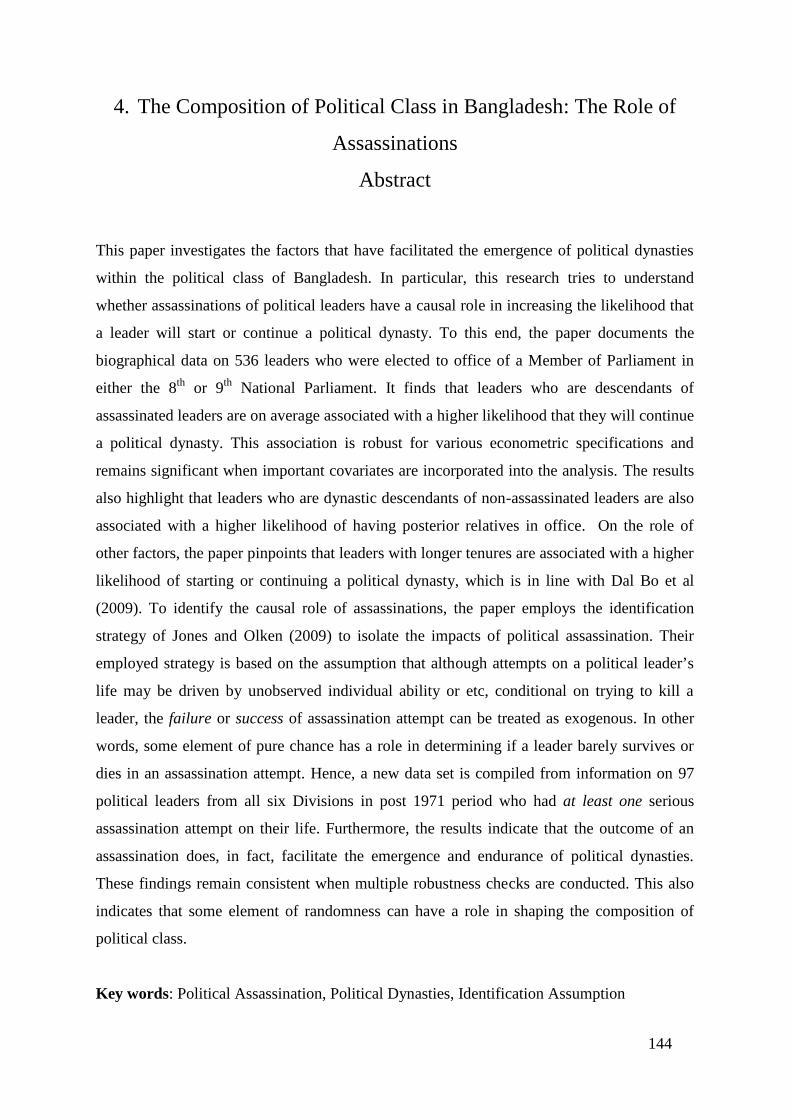
144
4. The Composition of Political Class in Bangladesh: The Role of
Assassinations
Abstract
This paper investigates the factors that have facilitated the emergence of political dynasties
within the political class of Bangladesh. In particular, this research tries to understand
whether assassinations of political leaders have a causal role in increasing the likelihood that
a leader will start or continue a political dynasty. To this end, the paper documents the
biographical data on 536 leaders who were elected to office of a Member of Parliament in
either the 8th or 9th National Parliament. It finds that leaders who are descendants of
assassinated leaders are on average associated with a higher likelihood that they will continue
a political dynasty. This association is robust for various econometric specifications and
remains significant when important covariates are incorporated into the analysis. The results
also highlight that leaders who are dynastic descendants of non-assassinated leaders are also
associated with a higher likelihood of having posterior relatives in office. On the role of
other factors, the paper pinpoints that leaders with longer tenures are associated with a higher
likelihood of starting or continuing a political dynasty, which is in line with Dal Bo et al
(2009). To identify the causal role of assassinations, the paper employs the identification
strategy of Jones and Olken (2009) to isolate the impacts of political assassination. Their
employed strategy is based on the assumption that although attempts on a political leader’s
life may be driven by unobserved individual ability or etc, conditional on trying to kill a
leader, the failure or success of assassination attempt can be treated as exogenous. In other
words, some element of pure chance has a role in determining if a leader barely survives or
dies in an assassination attempt. Hence, a new data set is compiled from information on 97
political leaders from all six Divisions in post 1971 period who had at least one serious
assassination attempt on their life. Furthermore, the results indicate that the outcome of an
assassination does, in fact, facilitate the emergence and endurance of political dynasties.
These findings remain consistent when multiple robustness checks are conducted. This also
indicates that some element of randomness can have a role in shaping the composition of
political class.
Key words: Political Assassination, Political Dynasties, Identification Assumption
145
4.1 Introduction: Can assassinations determine the composition of the
political class?
The political class is, by far, the most important segment of a society. This political class is
composed of various groups, as it includes leaders from established political dynasties,
business groups, military etc. The composition can also be categorized in terms of gender-
male and female. Besides, in some abstract sense, the political class can also be viewed by
categorizing leaders into two sets-‘good’ and ‘bad’ politicians (Caselli et al, 2004). Thus,
while examining important factors that shape the composition of the political class, it is
necessary to specify the particular segment of the political class that is under investigation.
So, this paper aims to identify the factors that have facilitated the emergence and endurance
of political dynasties153 in Bangladesh. This is crucial since after its independence in 1971,
representatives from the Sheikh and Zia dynasties, during different time spans154, have led
the country for approximately 25 years. At present, out of the eight political parties that have
representation in the current parliament of Bangladesh, four are led by dynastic leaders.155
Consequently, given the importance of political dynasties in the political landscape of
Bangladesh, it is interesting to ask: what conditions and factors have facilitated their
emergence and endurance? More specifically, since the two major political dynasties of
Bangladesh- Sheikhs and Zias- only came into existence after the assassinations of
Bangabandhu156 and Zia157, it is crucial to see if such events have a causal role in promoting
the emergence of political dynasties.
153 The main concern over political dynasties is that it leads to inequality in the distribution of politicalpower. It also reflects imperfections in modern democratic representations. The classic elite theoristsPareto, Mosca, and Michels noted, on the other hand, that the domination of large societies by a groupof elites in inevitable (SeeMosca 1966 [1896];Michels 1999 [1911] Ch 6.2; Putnam, 1976). Accordingto Mosca, the rule of elites can be beneficial because the concentration of political power in a smallgroup of elites may simply reflect inequality in the distribution of abilities. Likewise, Michels (1999[1911]) stated that even under democratic institutions forces operate thatnecessarily lead to oligarchy.
154 Sheikh Mujibur Rahman was in power from 1971-1975 & Sheikh Hasina was in power from 1996-2001 and 2009-present; Ziaur Rahman was in power from 1975-1981 & Khaleda Zia was in powerfrom 1991-1996 & 2001-2006 (see: http://rulers.org/rulb1.html#bangladesh)
155 See Table-2.1 in chapter-2.
156 Sheikh Mujibur Rahman is popularly known as ‘Bangabandhu’ – ‘Friend of Bengal’. He was thefirst President of Bangladesh. In 2004, he was by the listeners of BBC’s Bengali radio service as the‘greatest’ Bengali of all time beating Rabindranath Tagore and many others.Please see: http://news.bbc.co.uk/2/hi/south_asia/3623345.stm
146
Consequently, in this paper, I seek to point out if assassination of a political leader increases
the likelihood that a leader will start or continue a political dynasty. Stated otherwise, can
such events facilitate the de facto inheritance of political power? This is an essential question
since qualitative analysis of assassinations argues that they have played a significant role in
promoting dynastic leaders in Asia. For examples, Mark R. Thompson (2002) highlights the
role of assassinations in promoting female leadership in Asia by stating, “…the starting point
for the women’s leadership was the martyrdom of their fathers or husband, who were
assassinated…martyrdom freed politicians from ambivalent political pasts, elevating them
into powerful symbols of opposition struggle”. As a result, to address this issue, I compile a
data set on all leaders who were elected to the office of a Member of Parliament in the 8th or
9th National Parliament. This helps to empirically examine if their relation to past
assassinated parliamentarians is associated with the likelihood that they will continue a
political dynasty. The identification of a potential causal relationship, however, between
political assassination and the emergence and endurance of political dynasties remains
problematic. This is because political leaders with influential family connections, great
charisma or authority (i.e. traits that can be conducive to dynasty formation) can attract
assassination attempts. That is, the results might be driven by unobserved family or
individual heterogeneity.
To overcome this identification problem, the paper adopts a unique empirical strategy
employed by Jones and Olken (2009) to isolate the potential impact of political
assassinations. More precisely, the paper exploits the inherent randomness in the success or
failure of assassination attempts to identify the effects of assassination. Moreover, the
identification assumption is that, although attempts on a leader’s life may be driven by
unobserved individual or family characteristics, conditional on trying to kill a leader, the
failure or success of assassination attempt can be treated as plausibly exogenous. In other
words, the identification assumption suggests that ‘chance’ has a role in determining whether
an assassination attempt is successful or not. For example, Idi Amin survived an attack in
1976, when a thrown grenade bounced of his chest and killed several bystanders. However,
John F Kennedy did not escape the bullet which was fired from 265 feet away and the
157 General Ziaur Rahman was the seventh President of Bangladesh.Please see; http://rulers.org/indexr1.html#rahmaz
147
president was in a moving car (Warren et al. 1964). To this end, the paper looks into the
political arena of Bangladesh in post independence period, and it compiles an alternative data
set of leaders with at least one publicly reported assassination attempt on them. The idea here
is to find whether or not the outcome of the assassination attempt (which is assumed to be a
product of chance) partially determines the likelihood that a leader will start or continue a
political dynasty.
The remainder of the paper is structured as follows. The next section will give an overview
of the literature on the composition of political class. In particular, I will reflect on studies
surrounding political dynasties and leadership successions. The section will also reflect on
the literature on the consequences of political assassinations. Section 4.3 provides a short
history of assassinations and political dynasties in Bangladesh. It also provides sources of the
data and results from multivariate regressions. Section 4.4 will discuss the employed
identification strategy, and will interpret the main findings of the paper. Finally, section 4.5
concludes and provides direction for future research.
4.2 Literature Review.
In his analysis of the factors that shape political selection, Besley (2005) argues that almost
every major episode of economic change over the past 200 years of political history has been
associated with key personalities coming to power with a commitment to these changes. Yet,
political scientists have paid rather more attention on attaining the institutions for getting the
incentive right for politicians, than emphasizing on the factors that facilitates the emergence
of honest and competent and visionary leaders within a political class. Any inquiry on this
subject attempts to shed light on a rather controversial question: how can we explain the
cross-national variation in composition of the political class? To be more elaborative, why
some political landscapes have more educated leaders than others? Why higher female
participation is higher in certain political arena? Why military leaders have a greater say in
certain political landscapes than in others? And lastly, a query that is addressed in this essay
is- what exact combination of factors facilitates the emergence and endurance of political
dynasties? All these questions, in essence, attempt to explain the diversity that exists among
political classes across the globe.

148
On this topic, some quantitative, qualitative and theoretical works exist, which inquire why
certain groups emerge and endure in different political arenas. Starting with a few theoretical
scrutiny, Caselli and Morelli (2004) envisage a scenario where political process is captured
by a group of ‘bad’ politicians. That is, they categorize the political class with two sets of
leaders-good and bad politicians. Moreover, the term ‘bad’ politician refers to the set of
politicians who lack talent. Hence, the authors analyse conditions under which politicians
with different attributes run for office, and in doing so they produce three key insights. First,
low-quality citizens have a ‘comparative advantage’ in pursuing office, because their market
wages are lower than those of high-quality citizens. So, the voters may find themselves
supply-constrained of ‘good’ candidates. Second, bad politicians generate negative
externalities for good ones, making their returns from office increasing in the average quality
of office holders. This leads to multiple equilibria in quality. And finally, incumbent
policymakers can determine the rents for future policy makers, leading to path dependence in
quality; bad governments sow seeds for more bad government.
On a slightly different note, Dal Bo and Di Tella (2003) show that even if good politicians
receive sufficient representation within a political class, it is not necessary that they will be
able to align themselves with public interest. The authors argue that even presidents with
high morals are incapable of pursuing good policies158 due to threats from interest groups.
Since good policies are detrimental to the rents of the interest group, they are willing to
punish a policy maker for implementing such policy. Accordingly, such punishments may
offset any returns that a politician derives from re-election. Furthermore, to counter this
effect, a political party may offer some protection to the president from the interest group.
Nonetheless, punishments will be observed in equilibrium since it never pays a party to offer
full protection. Taken together, these papers offer an important corrective to the conventional
and sanguine view that democratic competition allows citizens to weed out politicians of
inferior caliber only when good leaders are available to replace them. Caselli and Morelli
show that we cannot accept it as a rule of thumb. Additionally, Dal Bo and Di Tella point out
that even if political class is composed of honest and benevolent political leaders, it is not
necessary that good policies will be adopted or implemented by them due to threats from
interest groups.
158 In their model, pursuing good policies increases the probability of re-election.

149
Moving away form such abstract categorizations of the political class, specific qualitative studies
also exist which attempt to shed light on the dynamics that facilitates the emergence of specific
groups within a particular political arena. To be more specific, Ritcher (1990) and Mark R.
Thompson (2002) provide a comparative analysis so that the factors facilitating female dynastic
leaderships in South and Southeast Asia are identified. The authors argue that ‘martyrdom’ of
their male counterpart (father or husband) has played a significant role in making them a symbol
of opposition struggle159, and thereby promoting their rise in their respective political landscape.
On the role of specific political precedents and conditions, Brownlee (2007)provides an
interesting scrutiny of hereditary successions in modern autocracies. The research shows that
whether elites will abet dynastic succession depends on the precedent for leadership selection.
That is, where rulers are predated by parties, surrounding political elites will defer to the party as
the recognized arbiter of succession. Alternatively, where rulers predate their parties and political
elites lack an established precedent for an orderly transfer of power, hereditary succession offers
a focal point for reducing uncertainty, achieving consensus, and forestalling a power vacuum.
Political dynasties are also noted as an outcome of the interaction between local government
structure and leader behaviour. For instance, Sidel (2004) in his comparative analysis of
‘bossism” argue that, in Philippines, when the structure of the state apparatus allows political
leaders to enjoy monopolistic control over a state’s resources, and when such monopolistic
control is used by the leader to construct a solid base in propriety wealth outside the realm of the
state intervention, then a dynastic succession in local leadership is easier to implement.
Some descriptive studies also exist which note the evolution of political dynasties in certain
regions. For example, Camp (1982) documents that high percentage of Mexican politicians
between 1935 and 1980 belonged to established political families. Likewise, Clubok, Wilensky,
and Berghorn (1969) use biographical data of US legislators to see the ratio of congressman
belonging to politically connected families. The authors describe the evolution of that magnitude
over time and across regions of the US until 1961, and point out that the observed decrease
cannot simply be explained by population growth. In their opinion, the decrease is a product of
modernization. Similarly, Hess (1997) provides a detailed history of sixteen American political
dynasty.Brandes, Crook and Hibbing (1997), on the other hand, analyse the impact of election
mode of Senators on a number of dimensions, including the percentage of Senators coming from
159 Since most of these countries were facing autocratic regimes during such political climax. Forexample: Aquino was trying to topple Marcos in Philippines; Sheikh Hasina and Khaleda Zia weretrying to overthrow the military strong man HM Ershad.
150
political families that had earlier placed a legislator in the Senate before. This work also bears
some resemblance to the recent progress on the theory and evidence of legislative careers
(Snyder et al. 2006; Mattozi et al. 2007; Diermeier et al. 2005).
Empirical investigations also examine the role of ‘leader-identity’ in political representation. For
example, Pande (2003) finds that reservation of scheduled tribes and castes at the state level in
India affected policies aimed towards these groups. Additionally, Cattopadhyay and Duflo
(2004) examine the importance of female representation by analyzing the outcomes in two Indian
states- Rajasthan and West Bengal- and pin point that issues preferred by women get more
attention when women politicians are selected. On hereditary politics, Dal Bo et al. (2009)
recently examined the evolution of political dynasties in the United States Congress after its
inception in 1789. With many other interesting finding, the analysis shows that legislators who
serve long tenures are significantly more likely to have relatives entering Congress later. The
authors also argue that various channels could contribute to this self-perpetuating effect. That is,
a longer tenure in office may affect the preferences of a legislator’s family. An alternate
possibility is that a longer tenure allows a legislator to accumulate assets-financial, human,
political capital- which he can later use for supporting dynastic successions. Nonetheless, the
primary message that comes from the empirical investigation is that tenure in office matters for
assisting dynastic self-perpetuations, and existing democratic process allows for the de facto
inheritance of political power.
On a broader note, this paper contributes to the growing empirical literature on the
consequence of political assassination. Asaf Zussman and Noah Zussman (2006), for
example, find evidence that assassination of senior members of Palestinian organizations
affect the returns from Israeli capital markets. Zaryab Iqbal and Christopher Zorn (2008) also
analyse all assassinations of heads of state between 1952 and 1997 states that assassinations’
effects on political stability are greatest in systems in which the process of leadership
succession is informal and unregulated. In addition to this, Benjamin F. Jones and Benjamin
A. Olken (2009) used a new data set of assassination attempt on all national leaders from
1875 to 2004 to identify the effect of assassinations on institutions and war. Their paper finds
that, on average, successful assassinations of autocrats results in a sustained move towards
democracy, and it also affect the intensity of small-scale conflicts. Other systematic social-
scientific analysis on the causal effect of political assassination also exists, which tends to
examine the social impact of assassination on public opinion (Greenberg, 1964; Hartnett and

151
Libby, 1972; Angermeyer and Matschinger, 1995;Esaiasson and Granberg, 1996;Yuchtman-
Yaar and Hermann, 1998;Raviv et al, 1998;Peri, 2000;Kilingman, 2001), crime (Berkowitz
and Macauley, 1971) and political socialization (Orren and Peterson, 1967; Siegel, 1977).
Lastly, this paper is related to literature on the impacts of political conflict (Collier and
Hoeffler, 2002;Alesina and Perotti, 1996; Alesina et al, 1996;Mauro, 1995; Barro, 1991).
4.3 The composition of political class in Bangladesh.
4.3.1 A short history of key political assassinations and martyrdom in
Bangladesh
Before embarking on our empirical analysis, it is worth illuminating the context surrounding
political dynasties and assassinations in Bangladesh. Since its inception in 1971, political
assassinations became a constant feature of the political arena in Bangladesh. Bangabandhu
Sheikh Mujibur Rahman, who was the first President of Bangladesh, became the first
prominent victim of political assassinations on the 15th of August 1975 (Karim, 2005). He,
along with other members of his family (except two daughters), were assassinated in a
military coup when a group of disgruntled junior army officers raided the presidential
residence to overthrow his government. This opened a flood gate of coups and counter coups
given that ‘assassination’ became a useful tool for plotters who intended to over throw a
particular person or a regime. Moreover, immediately after the assassination of Bangabandhu
the conspirators attempted to consolidate power by killing his four key cabinet colleagues on
the 3rd of November 1975. These leaders were Syed Nazrul Islam, Tajuddin160 Ahmed, AHM
Quamruzzaman161 and Captain Mansur Ali162, and this event is subsequently remembered as
the ‘Jail Killing Day’ as these leaders were initially imprisoned and later executed within the
territories of the Dhaka Central Jail (Talukder, 1976). Furthermore, between the 3rd and 7th
November, multiple coups and counter coup trebled the political structure of Bangladesh,
and, finally, Lieutenant Genral Ziaur Rahman (Zia)163 emerged as the de facto military ruler
160 Tajjudin Ahmed is the first Prime Minister of Bangladesh. Besides, Syed Nazrul Islam was the firstacting President of the Government in exile of Bangladesh.Please see: http://rulers.org/rulb1.html#bangladesh).
161 For a brief sketch of AHM Quamruzzaman’s life,please see: http://fourleaders.webs.com/ahmquamruzzaman.htm
162For a brief sketch of Mansur Ali’s life, please see http://fourleaders.webs.com/mmansurali.htm
163Zia was the deputy chief of army staff under Bangabandhu’s administration from 1971 to 1975, andbecame the chief of army staff when Bangabandhu was assassinated.
152
who continued to maintain a strong grip over both the civil and the military administration
till his assassination in 1981 (Islam, 1984). Till now, Bangabandhu, Tajjudin, Nazrul, Mansur
Ali and Zia are the only five statesmen who have fallen victims to conspiracies that have
resulted in their assassinations.
In above backdrop, it is interesting to point out that the assassinations of the two dominant
figures of Bangladeshi politics (particularly Bangabandhu and Zia) have failed to dilute their
influence in the political landscape of the country. Few years later, Bangabandhu’s daughter
Sheikh Hasina Wajed, who was in Germany with her younger sister Sheikh Rehana Siddique
during the military coups of 1975, eventually returned to Bangladesh in 1981, and was
elected as the president of Bangladesh Awami League (AL)164-a post that she continues to
hold to this present date.165 In addition, she led her party to an electoral victory in 1996,
which marked the return of AL to state power after 21 years. She is also, at present, the
Prime Minister of Bangladesh after attaining a landslide victory in the ninth parliamentary
election held on the 29th December 2009166Conversely, Khaleda Zia167, the widow of Ziaur
Rahman succeeded the chair of BNP, which was founded by her husband in 1979. Mrs Zia
became the first female Prime Minister of Bangladesh in 1991, and she was elected again for
a second tenure between 2001 and 2006.
These two dynasties- Sheikhs and Zias - remain the most influential political segment of the
country since representatives from these two dynasties have maintained AL and BNP’s
leadership for more than two decades. It is also important to note that these two dynasties
only came into existence after the assassinations of Bangabandhu and Zia, and political
scientists have argued that the martyrdom of Bangabandhu and Zia has facilitated their rise in
the political hierarchy of Bangladesh (Ritcher, 1990; Thompson, 2002).In particular, the
authors argue that martyrdom of Bangabandhu and Zia (in the context of Bangladesh) has
Please see: http://rulers.org/indexr1.html#rahmaz).
164 Bangladesh Awami League (AL) is the oldest political party in Bangladesh. It was formed in 1949by Maulana Bhashani, HS Suhrawardy and Shamsul Huq. Awami League played a pivotal role infacilitating the emergence of Bangladesh, and Mujib was its president from 1963 to 1975. See:Choudhury (1972).
165See: www.albd.org
166See: ibid.
167 For more information on Begum Khaleda Zia, please see http://www.rulers.org/indexz.html#zia

153
allowed these leaders to transcend their past, and evolve into symbols of popular protest
against the incumbent military regimes. In essence, their martyrdom turned them into saints
and their graves into pilgrimage sites. A dynastic succession within the party hierarchy only
allowed them to attain unity within the support base, and continue with martyr’s ‘cause’.
Hence, a key question that remains to be answered is: would these political dynasties emerge
if there were no assassinations? Or, can we ignore the possibility that both Bangabandhu and
Zia had an inherent ability (such as charisma, loyalty of important political groups and, etc)
which facilitates possible dynastic succession and also attracts assassination attempts?168
This is a difficult question to answer since a historical narrative within the scope of this paper
will not be able to account for all other possible explanations of such dynastic emergence.
Nonetheless, it is possible to state that assassinations are neither a necessary nor sufficient169
condition for the emergence of political dynasties in a global or local context. For example,
Nehru-Gandhi dynasty of India emerged without any contribution from political
assassinations, since Mrs Indira Gandhi170 succeeded her father’s successor Lal Bahadur
Shastri to become the first female Prime Minister of India in 1966 (Frank, 2002). On the
other hand, Mahatma Gandhi who was the undisputed leader of Indian National Congress
and the father of nation of India failed to have a political dynasty even though he was
assassinated on the 30th January 1948. Meanwhile, domestic cases (i.e. political
assassinations of leaders from Bangladesh) also point out similar phenomenon. For instance,
Shah AMS Kibria171 - the former finance of Bangladesh- failed to have his own dynasty even
though he was assassinated on the 27th January 2005. This, to an extent, shows that political
assassinations per se do not result in dynastic succession. Even so, this paper inquires if
political assassination of leaders increases the chance that a leader will start or continue a
political dynasty. In the subsequent sections, the analysis will attempt to identify empirically
168 Box - 4.2 provides a list of politicians from the Sheikh Dynasty and their encounters withassassination attempts.
169 A necessary for some state of affair S is a condition that must be satisfied in order for S to beobtained. Moreover, a sufficient condition for some state of affair S is a condition that, if satisfied,guarantees that S is obtained. For more information,please see http://www.sfu.ca/~swartz/conditions1.htm
170 Indira Gandhi and her son Rajiv, however, fell victim to assassination attempts in 1984 and 1991.The Nehru-Gandhi dynasty, however, came into existence before any one faced such attempts. See.www.congress.org.in
171 The Daily Star, 28th January 2005. www.thedailystar.net/2005/01/28/index.htm
154
whether political assassinations have a causal role in facilitating the emergence of various
dynasties across the political landscape of Bangladesh.
4.3.2 Data on political dynasties
The data for this research comes from various sources. I document the biographies of 536
members of parliament who are either elected in the 8th or 9th National Parliamentary. I use
information provided by individual MPs in their personal affidavits to the Bangladesh
Election Commission [BEC] before they participated in the ninth parliamentary elections
held on the 29th of December 2008. The Member Directory on the 9th National Parliament
produced by NDI172 also provided useful information on the individual characteristics of
MPs. I also use the biographical profiles of all parliamentarians in the 8th National Parliament
in the Documentary on the Parliament by Rashid and Feroz (2002). Other details on
individual characteristics and political events faced by these leaders during their lifetime are
taken from a wide range interviews, newspapers archives and e-sources.173 The interviewees
are mostly existing dynastic parliamentarians, relatives of politicians, reporters etc. List of
newspapers that were useful in noting dynastic linkages of parliamentarians is also provided
in Appendix- Box-2. Given that dynastic leaders often receive substantial media attention
within the political domain of Bangladesh, newspapers provide a very useful medium for
collecting biographical information on such leaders. The biographical information also helps
the analysis to map any family relation of leaders in the data set to any assassinated leaders in
the past. In addition, before each national parliamentary election, biographical profiles of
important parliamentary candidates for each parliamentary constituency are reported in the
major newspapers. As a result, I have examined all such coverage on each parliamentary
constituency that preceded the 9th Parliamentary election.174 This exercise (along with the
information available in Rashid and Feroz (2002)) allowed the data set to have a
comprehensive biological profile of almost all MPs in both 8th and 9th National Parliament.
As noted earlier, Sheikhs and Zias are the two important political families who dominate
political life in Bangladesh. Sheikhs hail from the District of Gopalganj where Bangabandhu
172National Democratic Institute for International Affairs (NDI). For more information, please seehttp://www.ndi.org/
173 See Appendix-2A & 2B.
174The 9th Parliamentary election that took place on 29th December 2008.
155
Sheikh Mujibur Rahman was born. In the current national parliament, both Prime Minister
Sheikh Hasina and her cousin Sheikh FK Selim are MPs from Gopalganj-2 and Gopalganj-3
respectively. Sheikhs also have a stronghold on the District of Madaripur175 (which is
adjacent to the District of Gopalganj), where Sheikh Hasina’s nephew Noor-E-Alam
Chowdhury is an MP. Zias, on the other hand, have strong holds in two non-adjacent
districts- Feni176 and Bogura.177 More precisely, Begum Khaleda Zia is from the District of
Feni, where she is a MP from the constituency Feni-1. Her deceased husband Late President
Ziaur Rahman is from the District of Bogura. In terms of political dynasties with longest
endurance, there are five dynasties which have produced three generation of political leaders.
These are Mollahs from the District of Kushtia, Osmans from the District of Narayanganj,
Mansur Ali’s family from the District of Sirajganj, Chowdhury’s from the District of
Munshiganj, and the Sheikh dynasty of Gopalganj. Among them, only the Sheikhs and
Mansur Ali’s family have members who have been victims of assassination, and Professor B
Chowdhury (a member of the Chowdhury dynasty) survived an assassination attempt in 1981
in which President Ziaur Rahman was killed (See Box-4.1).
To characterize MPs from political dynasties, two indicator variables are created. Pre-
relativeand Post-relative. The former is equal to one whenever a parliamentarian had a
relative178 entering office before he or she did, and zero otherwise. These politicians are
termed as dynastic politicians.179 The latter is equal to one if a parliamentarian has a relative
who, after him, entered office, and zero otherwise.180 Likewise, to pinpoint the role of
assassination, there is an indicator variable Pre-Relative-Assassinated which is equal to one
if MP is related to a former lawmaker who was assassinated, and zero otherwise. In contrast,
175 Both the districts (Gopalganj and Madaripur) are within Dhaka Division.
176 District of Feni is within Chittagong Division.
177 District of Bogura is within Rajshahi Division.
178 Anyone with a biological or social connection to the leader is considered a relative. For example-Husband/Wife, Brother/ Sister, Son/Daughter, Nephew, Niece, Cousin , Grandson/Granddaughter,Son-in-Law/Daughter-in-law, etc
179 In other words, these are lawmakers from a family that had previously placed a member in theNational Parliament.
180 This means, in essence, that an MP in the national parliament will have Post-Relative = 1 if and onlyif his date of his first entry to the parliament precedes the date of entry of relative who is presently anMP (or were an MP in the 8th National Parliament). This very same procedure was used by Dal Bo et al(2009) to analyse political dynasties in the United States.
156
Pre-Relative-Not-Assassinated is dummy variable equal to one if an MP in the sample is
related to lawmaker who did not fall victim to an assassination. To study other
characteristics, the following indicator variables are used. Female is an indicator variable
equal to one is the leader public office experience in his life time. Num. of Time MP is the
total number of times a leader is elected to the office of an MP. Minister is an indicator
variable equal to one if the leader ever occupied the position of minister during the present
government. Military is an indicator variable equal to one if a leader had a military career at
some point in his or her career. Lawyer is an indicator variable equal to one if the leader had
a law degree from university. Businessman is an indicator variable equal to one if the leader
is or was businessman by profession. Distance-from-Dhaka is measure of distance in
kilometres of a leader’s constituency from the district of Dhaka. This is used as a crude proxy
to measure how far a constituency is from the parliament.181 Lastly, INTEGRATED is a
dummy variable which is equal to one if a leader’s constituency is geographically contiguous
to either Dhaka or Chittagong metropolitan areas (and zero otherwise).
From Table-4.1 one can see some descriptive statistics on Members of Parliament (MPs) in
the data set. At present, out of the 536 directly elected members of parliaments (MPs), ninety
one have relatives who had tenure(s) as MP before them. The spatial distribution of dynastic
leaders across the various divisions of Bangladesh is shown in Figure-4.1. Moreover, it is
shown that Dhaka Division (which has the highest number of parliamentary seats) exhibits
the largest proportion of dynastic leaders. Thisalso reflects the influence that dynastic
leaders exert in the national political arena of Bangladesh since Dhaka is also the capital of
Bangladesh. Besides, as pointed out earlier, out of the eight political parties which have some
representation in the current national parliament, four are chaired by dynastic descendants.182
More importantly,both the office of the Prime Minister and the Leader of the Opposition are
occupied by dynastic leaders (Sheikh Hasina and Khaleda Zia) who are the descendants of
the two most towering figures of Bangladeshi politics-Bangabandhu Sheikh Mujibur Rahman
and General Ziaur Rahman. In terms of MPs with assassinated relative, seventeen leaders in
the mentioned data are descendants of assassinated leaders (a little more than 3% of the
leaders in data). Table-2 also summarizes the professional affiliation of the MPs.
Businessmen constitute more than 55% of the parliamentarians. This is followed by lawyers
181 This information is collected from the Office of the Ministry of Communication, Government ofBangladesh.
182 See Box 2.1 in Chapter-2.
157
with 13.7% representation. The descriptive statistics also show that the main political parties
(AL and BNP) are (to an extent) evenly represented in the data as both have roughly (or more
than) 40% representatives.
4.3.3 Methodology and Results
4.3.3.1 Methodology
This paper aims to identify the factors that have facilitated the emergence and endurance of
political dynasties within the political class of Bangladesh. In particular, the analysis
examinesa possible casual role of assassinations in facilitating the emergence and endurance
of political dynasties. To this end, I regress a base-line econometric specification which
models the variation in dynastic linkages on multiple covariates. The idea here is to see
whether current MPs who are descendants of assassinated political leaders or descendant of
non-assassinated politicians are associated with higher/lower likelihood that they will
continue a political dynasty. Nonetheless, it is important to mention here that given the data
sets included MPs in the 8th or 9th National Parliament (who are mostly alive), the empirical
model will not isolate the effects of assassination on dynasty formation. Rather, the
employed empirical model will help see if political descendants of assassinated leaders are
more likely to continue the dynasty than others.
Post-Relativei = α+ δPre-Relative-Assassinatedi+ πPre-Relative-Not-
Assassinated +βXi+γp+ζD+έi(1)
As stated earlier,Post-Relativeiis a dummy variableequal to one if a legislator i has a relative
who entered Parliament after him or her.Pre-Relative-Assassinated is equal to one if MP is
related to a former lawmaker who was assassinated, and zero otherwise. Similarly, Pre-
Relative-Not-Assassinated is dummy variable equal to one if an MP in the sample is related
to lawmaker who did not fall victim to an assassination. Thevector Xiconsists of a set of
individual characteristics.183Additionally, γpand ζDcontrols for party and divisional184fixed
183 The vector mostly includes variables that are controlled by Dal Bo et al (2009)
184 Bangladesh is divided into six divisions- Rajshahi, Barisal, Sylhet, Khulna, Dhaka. These sixdivisions have in total 64 districts. And each district have at least two parliamentary seats (except threedistricts –Khagrachchari; Rangamati and Bandarban which have one seat). The largest division isDhaka with 94 parliamentary seats and smallest is Sylhet with 19 parliamentary seats.
158
effects, and εi is the random error term. Nonetheless, our key parameter of interest is δ which
links assassinations with dynastic endurance. Hence, if δ is significantly different from zero,
then we can assert that there is a strong association between being a descendant of an
assassinated politician and dynastic endurance within the political landscape of Bangladesh.
Additionally, if π is significantly different from zero, then it is possible to suggest that being
a descendant of a politician who was not assassinated is also associated with the likelihood
that a lawmaker will have a posterior relative in office in comparison to a lawmaker who is
not a dynastic successor. Thus, any modifying role of assassination in facilitating dynastic
endurance can only be observed if and only ifδ is significantly differentfrom π.185
Besides,it is imperative to mention that any significant relationship between the variables of
interest must be interpreted as a correlation because the OLS (or Probit/ Logit) estimates
might suffer unobserved family heterogeneity. More specifically, if certain political families
entertain higher ability, then such family traits might allow them to endure within the
political landscape of Bangladesh. Likewise, such traits can also make the families victims of
assassination attempts from their rivals. As a result, if such unobserved family heterogeneity
exists, then a spurious relationship might emerge between the variables of interest. Even so,
any significant association between political assassination and dynastic endurance will
provide motivation for investigatingan underlying causal relationship.In the following
section, the results are displayed and discussed.
4.3.3.2 Results: Role of Assassination
From column-1 in Table-4.2, we can see that being a descendant of a past or present law
maker is associated with a higher likelihood of having a relative later in office. That is, the
coefficient for Pre-relative is positive and significant at 1%.In column-2, I estimate the base-
line which checks whether this result is driven by the presence of any particular type of
dynastic leader (i.e. being a descendant of an assassinated politician orbeing a descendant of
a non- assassinated politician). As shown, the coefficient for Pre-Relative-Assassinated and
Pre-Relative-Not-Assassinated are both positive and significant at 5% and 1%. The
magnitude of the coefficient for Pre-Relative-Assassinated suggests that being descendant of
185 The estimations derived from employing this empirical model can suffer from omitted variable biasif assassination of non-political relative has any role in facilitating self-perpetuation among politicaldynasties. However, given no concrete theoretical relationship exist between assassination of a non-political relative and dynastic endurance, the employed model is useful in addressing the principleinquiry of this analysis.
159
an assassinated lawmaker is associated with a 27% higher probability of a having a posterior
relative in office in comparison to those with no family connections to other present or past
lawmakers. Additionally, the coefficient for Pre-Relative-Not-Assassinated highlights that
descendant of non-assassinated lawmaker is associated with a 12% higher probability of
continuing the dynasty. In column-3, I control for other personal characteristics like gender,
professional affiliation of lawmakers, the number of times one has been elected to the office,
and whether the lawmakers ever held a position in the cabinet. The results remain
qualitatively similar even though the magnitude of the coefficient for Pre-Relative-
Assassinated marginally decreases in size.Column-4 introduces two constituency level
characteristics. As mentioned above, Distance-from-Dhaka measures the distance of a
leader’s constituency from the capital of Dhaka.186The indicator variable INTEGRATED is
equal to one if a leader’s constituency is geographically contiguous to either Dhaka or
Chittagong metropolitan areas (and zero otherwise).187 The resultsshow that both these
variables fail to explain endurance of dynastic leaders. On the other hand, the coefficient
relating political assassination and dynastic endurance is positive and significant at 5%.
Finally, in column-4, I fit in dummy variables for the two prime political parties to see
whether party effects can explain dynastic endurance within the parliament of Bangladesh.
Yet, the estimations show that the party effects are not significant. In contrast, the relevant
coefficient δ remains positive and significant.
On the role of other factors, the coefficient for Num. of Times MP is positive and significant
at 1% in columns 2-4. This is consistent with self-perpetuation hypothesis that argues -
holding power for longer increases the chance that one will facilitate a dynastic succession,
and is in line with the findings of Dal Bo et al (2009), which point out that US legislators
with a longer tenure in U.S senate are more likely to start or continue a political
dynasty.188The estimations also show that lawmakers who are descendants of past or present
lawmakers are also associated with a higher likelihood of continuing the political dynasty.
186As noted earlier, it is crude proxy to measure how far a constituency is from the parliament
187 Some empirical studies have suggested that areas which are geographically contiguous the two mosteconomically important cities (Dhaka and Chittagong) entertain households with better observedcharacteristics (see- Shilpi, 2008; Ravillion and Wodon, 1999 )
188 The positive association between a leader’s tenure and the likelihood that he or she will start orcontinue a political dynasty is also reflected in the cross sectional work of Rahman (2011):“Assassination and Political Dynasties” which is a key component of the thesis.

160
This finding is also echoed in the results of Dal Bo et al (2009). The regressions also points
out that lawmaker with a previous career in military are associated with a lower likelihood of
facilitating a dynastic succession. The coefficient for Military is negative and significant at
5% in all columns.
In Table-4.3, I conduct some robustness checks to see the strength of the computed
estimations. Colmun-1 incorporates five divisional dummies with the Division Dhaka as the
reference category.189 This is done to control for factors that are common to all leaders from
the same division but varies for leaders from different divisions. Nevertheless, the key
finding remains robust. Column-2 introduces district fixed effects with the District of Dhaka
as the reference category.190 This is likely to account for unobserved district specific time
invariant effects that varies for lawmakers from different districts, but is similar for leaders
from the same district. The results point out that δcontinues to be positive but is no longer
significant (even at 10%). In column-3, lawmakers who are no longer alive are omitted to
make the sample more comparable. Similarly, in column-4, leaders who are born after 1965
are excluded to account for the possibility that younger legislators have less time to establish
dynasties. From both the columns, however, the primary message remains consistent that
lawmakers who are descendants of assassinated lawmakers are on average associated with a
higher likelihood of having posterior relative in office in comparison to leaders who are not
dynastic descendants.
Lastly, in both Table-4.2 and Table-4.3, I check for the possibility that δ is significantly
different than π, since in all columns in Table-4.2 and Table-4.3, δ is greater than π in
absolute magnitude.Besides, checking for differences in the coefficients is insightful as this
will hint a heterogeneous relationship between political assassinations and dynastic
endurance. More precisely, if δ is significantly different than π, then only one can assert that
there is a significant modifying role of assassination in facilitating the endurance of dynastic
leaders, and the estimation is not solely picking up the possible effect of being a descendant
189The results remain similar when the reference category is chosen randomly or when Probitregressions are estimated. See Appendix Table - A3
190Bangladesh is a unitary parliamentary republic consisting of three hundred parliamentary seats.These seats are located in six administrative Divisions, which in turn are subdivided in sixty-fourDistricts. This means that each District constitutes one or more seat, and each Division has more thanone District. Now, since Divisions are aggregate of Districts, I drop divisional effects when controllingfor district fixed effects. For more information,please see: http://www.discoverybangladesh.com/meetbangladesh/the_admin.html

161
of dynastic leader. In this regard, the results provide some indication (even though very
weak)that δ is significantlydifferent from π, becauseδ is greater than π in absolute magnitude
in all columns in Table-4.2 and Table -4.3.Besides, this difference is significantly different at
10% in column-4 of Table-4.3.
Overall, the estimations highlight that both types of dynastic politicians (those who are
related to assassinated lawmakers & those who are related to non-assassinated past or present
lawmakers) are associated with a higher likelihood of continuing the dynasty. This is
interpreted as a correlation since the results might be driven by unobserved family
heterogeneity. Nonetheless, the finding does provide some motivation for investigating
whether assassinations have a causal role in facilitating the emergence and endurance of
political dynasties within the political landscape of Bangladesh. This will help shed light on
the question: do political assassinations back fire in the sense that it imposes the moral
authority of the leader by creating a martyr out of him, which ultimately assist the endurance
of the leader’s family in the country’s political arena? Hence, with this question at sight, the
remaining analysis proceeds.
4.4. Identification Strategy and Results.
4.4.1 Empirical Approach and Data.
The econometric identification of a potential causal relationship between political
assassination and the likelihood that a leader will start or continue a political dynasty is not
straightforward. This is because while some assassinations may have correlations with
political turning points, the direction of causation is difficult to establish particularly since
political leaders with influential family connections, great charisma and authority can attract
assassination attempts. This makes it difficult to identify empirically if there is a causal
impact of assassination on the emergence and endurance of political dynasties. To overcome
this problem, the paper here adopts a simple identification strategy employed by Jones and
Olken (2009) to find out the potential impact of assassination of national leaders on
institution and war. In other words, the paper exploits the inherent randomness in the success
or failure of assassination attempts to identify the effects of assassination.
To be more elaborate, the employed identification assumption notes that although
assassination attempts on a leader’s life may be driven by historical circumstances, personal
162
ability or family heterogeneity, conditional on trying to kill a leader, the failure or success of
the assassination attempt can be treated as plausibly exogenous.For example, Ronal Reagan
only survived the assassination attempt on him in 1981 because the bullet, which was fired at
him within a range of twenty feet, missed his heart by less than one inch (Reeves, 2005).
Then again, John FKennedy was unfortunate to die in an assassination attempt from a bullet
which was fired at him from 265 feet away (Warren et al. 1964). Some examples from the
Bangladeshi political arena also convey the same message. For example, Sheikh Helal191
survived the bomb blast, which took eight lives, during his election campaign in 2001.192 In
contrast, former Finance Minister of Bangladesh, Shah AMS Kibria was unlucky enough to
die in a grenade attack on him during a rally in his homedistrict Habiganj in 2005.193 Hence,
if pure luck has a role in determining whether a leader survives an assassination attempt or
not, then one can test the impact of successful assassinations on various socio-political
phenomenon related to the leader while controlling for its other key determinants.
To this end, this paper uses data on a large number of publicly reported assassination
attempts on political leaders in Bangladesh post during the period 1971 - 2010, and it tries to
isolate that conditional on an attempt taking place, whether or not the outcome of the attempt
partially determines the likelihood that a political leader will later have a relative enter office
of a Member of Parliament. At this point, it is essential to mention that for this part of the
analysis, I do not restrict my sample to MPs or ex-MPs.194 The unit of observation is re-
coded to a ‘Political Leader’ who was a member of the Central Committee or District
Committee195 of any major political party196, and has faced at least one serious assassination
191 Sheikh Helal is an MP in the current national parliament from the constituency Bagerhat-1. He isalso a cousin of the current Prime Minister Sheikh Hasina, and father-in-law to Barrister AndaleeveRahman Partho MP.
192 See: www.encyclopedia.com/doc/1P2-18393632.html
193 See: The Daily Star, 28th January 2005. www.thedailystar.net/2005/01/28/index.htm
194 The findings, however, remain consistent when I do so.
195 The political party system in Bangladesh provides considerable political power in the members ofthe District Committee or Central Committee of any major party. The members of the DistrictCommittees essentially determine how political strategies are implemented at the district level. Inaddition, District Committee members also play a vital role while electoral candidates are competing inNational elections, given they often form the organizational roots on which election campaigns arecompeted. The Central Committee, on the other hand, is the core organizational body of a party at thenational level. They are endowed with the responsibility of both formulating and implementing thepolitical strategies and campaigns that a party adopts at the national level.
163
attempt in hisor her life time. This has threeprinciple rationales. First, if I solely restrict my
sample to MPs with one assassination attempt, then sample size will be forty-four. This is a
relatively small data-set, and thus undermines the chances that enough variation will exist for
the estimations to identify a strong relationship between the variables of interest. Second, by
focusing on leaders who were members of theCentral Committee or District Committee of
any major political party but were not necessarily elected to the office of a Member of
Parliament, the regressions shed some light on how political families emerge at the
parliamentary level. Third, given thatI study leaders who held a position in the Central
Committee or District Committee of any major political party, any assassination attempt on
them is going to receive substantial media coverage due the importance of their political
portfolio. As a result, the data set is unlikely to suffer from any major missing information.
The data set on assassination attempts was constructed after consulting the archives of three
major English newspapers: The Daily Star, The New Age,and The lndependent. Bengali
newspapers like DainikIttefaq197 and DainikJugantor were also used.198In addition, numerous
e-sources, interviews with reporters, politicians and other civil society members are also
conducted to compile the mentioned data set. This data set is restricted to leaders who have
faced a “serious attempts” which is defined as those cases in which the weapon (gun, bomb,
etc) was actually discharged, as opposed to cases where the attempt was thwarted prior to the
weapon being used.199 The new data set has 97 political leaders from all six Divisions, and
each leader faced at least one serious assassination attempt on their life during the period
1971 - 2010. There is a dummy variable SUCCESSiwhich equals to one if the leader (i) died
from the assassination attempt and is zero otherwise. Moreover, from Table-4.4, we can see
196 A major political party is defined as political party which at least had on member in the NationalParliament of Bangladesh in post 1971 period.
197Dainik Ittefak was first published in 1953 as a weekly newspaper. It played a pivotal role duringmovement for national independence, and was often dubbed as the ‘voice of East Pakistan’. This is theonly newspaper which has uninterrupted publication from 1971 till present date. Thus, this newspaperwas instrumental for compiling the data set.
198 See Appendix-2A and 2B for information on the interviews and newspapers. Please also reviewAppendix Box 4A, which discusses the data collection methodology.
199 This is done, in particular, to strengthen the robustness of our identification assumption that pureluck determines whether a leader survives or dies in an assassination attempt. Furthermore, given thatthe analysis sole depends on ‘serious’ assassination attempt – where the bomb actually exploded/or thegun shot took place – as opposed to thwarted assassination attempt, the analysis is likely to have acomplete coverage of all assassination attempts in the political arena in Bangladesh.
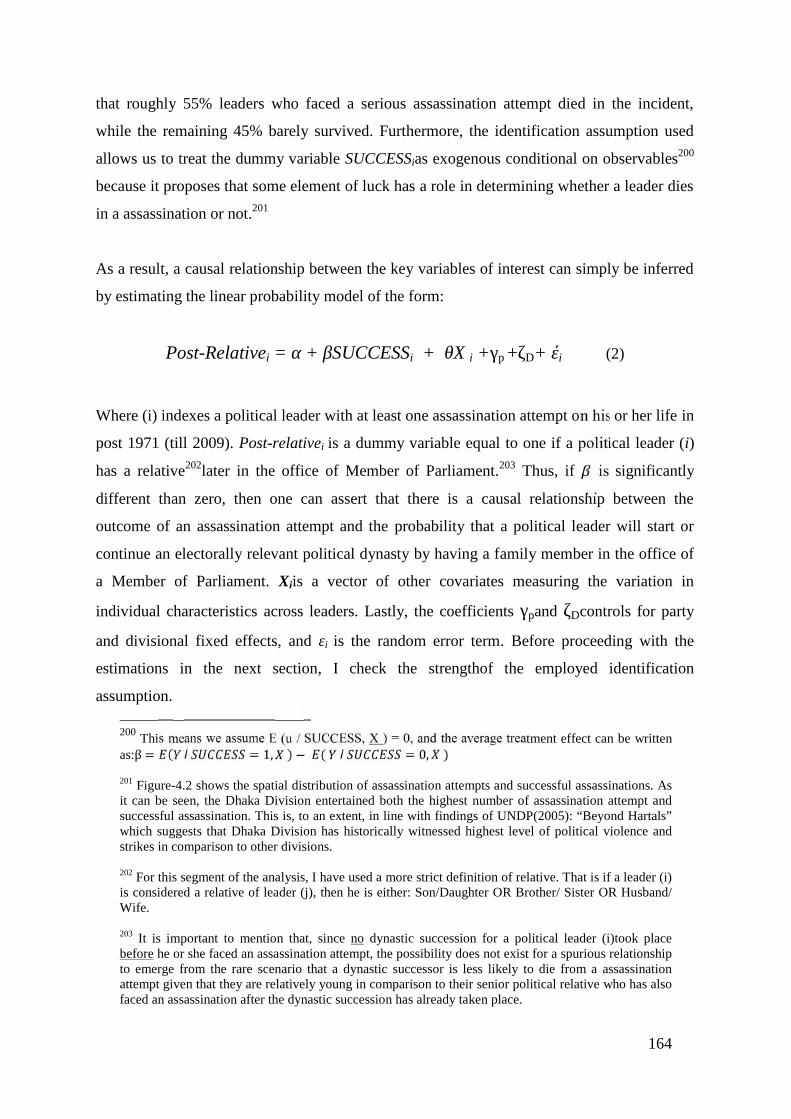
164
that roughly 55% leaders who faced a serious assassination attempt died in the incident,
while the remaining 45% barely survived. Furthermore, the identification assumption used
allows us to treat the dummy variable SUCCESSias exogenous conditional on observables200
because it proposes that some element of luck has a role in determining whether a leader dies
in a assassination or not.201
As a result, a causal relationship between the key variables of interest can simply be inferred
by estimating the linear probability model of the form:
Post-Relativei = α + βSUCCESSi + θX i +γp +ζD+ έi (2)
Where (i) indexes a political leader with at least one assassination attempt on his or her life in
post 1971 (till 2009). Post-relativei is a dummy variable equal to one if a political leader (i)
has a relative202later in the office of Member of Parliament.203 Thus, if is significantly
different than zero, then one can assert that there is a causal relationship between the
outcome of an assassination attempt and the probability that a political leader will start or
continue an electorally relevant political dynasty by having a family member in the office of
a Member of Parliament. Xiis a vector of other covariates measuring the variation in
individual characteristics across leaders. Lastly, the coefficients γpand ζDcontrols for party
and divisional fixed effects, and εi is the random error term. Before proceeding with the
estimations in the next section, I check the strengthof the employed identification
assumption.
200 This means we assume E (u / SUCCESS, X ) = 0, and the average treatment effect can be writtenas:β = ( = 1, ) − ( = 0, )201 Figure-4.2 shows the spatial distribution of assassination attempts and successful assassinations. Asit can be seen, the Dhaka Division entertained both the highest number of assassination attempt andsuccessful assassination. This is, to an extent, in line with findings of UNDP(2005): “Beyond Hartals”which suggests that Dhaka Division has historically witnessed highest level of political violence andstrikes in comparison to other divisions.
202 For this segment of the analysis, I have used a more strict definition of relative. That is if a leader (i)is considered a relative of leader (j), then he is either: Son/Daughter OR Brother/ Sister OR Husband/Wife.
203 It is important to mention that, since no dynastic succession for a political leader (i)took placebefore he or she faced an assassination attempt, the possibility does not exist for a spurious relationshipto emerge from the rare scenario that a dynastic successor is less likely to die from a assassinationattempt given that they are relatively young in comparison to their senior political relative who has alsofaced an assassination after the dynastic succession has already taken place.

165
4.4.2. Is Success exogenous conditional on attempt?
The identification assumption suggests that conditional on an attempt taking place, the failure
or success of the assassination attempt can be treated as plausible exogenous. Thus, in Table-
4.5, I examine if individual characteristics predict successful assassination by comparing the
mean of individual characteristics of political leaders who barely survived with those who
died. Across the eight explanatory characteristics that I have examined, the differences
between success and failure are only significant for Pre-Relative and MP at 1%. To be more
elaborative, the results suggest that a significantly greater proportion of political leaders who
are descendants of lawmakers or political leaders who were themselves lawmakers have
barely survived an assassination attempt. In Table-4.6, the results from the linear probability
model are presented that considers all these factors simultaneously. Accordingly, I regress
the following equation:
SUCCESSi, = α + βXi + δAgricultureWaged,t + γp +ζD + έi(3)
Where Xiis a set of individual characteristics for leader (i), and SUCCESSi,t is a indicator
variable equal to one if a leader (i) died in a assassination attempt in period (t). The variable
AgricultureWage204d,tis the average daily wage (without food) of agricultural labour in a
given division (d) in period (t). This is incorporated to see if economic characteristics in a
division (d) and period (t) predict successful assassinations in the same district (d) in the
period (t). Additionally, γp andζDcontrols for party and division fixed effects, and εi is the
random error term. From all six columns, it can be seen that being a member of the
parliament (MP) appears to lower one’s chances of dying in an assassination attempt as the
coefficient for MP is negative and significant at 1% or 5%. A possible rationale underlying
this phenomenon is that members of parliament are more likely to enjoy higher level of
securities. This, however, fails to explain the insignificant coefficients for Minister and
positive coefficients for PM-President, which is significant at 10% in all columns except
column-2.205 On the importance of being a dynastic leader, it is shown in column-3 that the
204A rational for focusing on Divisional level data is provided in Appendix- 4B
205 This hints the possibility that the intensity of the assassination attempt faced by political leaders whowere Prime Ministers or Presidents might be different from the intensity of assassination attempt facedby political leaders who never attained such portfolios in the political landscape of Bangladesh. The

166
relevant coefficient fails to attain significance once party and divisional fixed effects are
introduced. This also remains true when I control for common political shocks to all
assassination attempt in a given year by incorporating the POLITY2 score of Bangladesh in
column-4.206 Finally, in line with the cross-national findings of Jones and Olken (2009), the
results do suggest that the choice of weapon can predict whether an assassination attempt will
be successful or not.207
Therefore, the principal message that one can derive from the results in Table-4.6 is that the
identification assumption employed by Jones and Olken (2009) holds (to an extent) in our
sub-national data set. More specifically, in line with findings of Jones and Olken (2009), the
results do indicate that assassination attempts, which depends on guns for execution are more
likely to be successful than attempts depending on any other means. Yet, in contrast to Jones
and Olken (2009), few other variables (such as being a MP or PM-President) do in fact
predict SUCCESS. This, in some degree, undermines the identification assumption that the
variation between success and failure of an assassination attempt is a product of pure chance.
Nonetheless, to address this issue, I control for these factors while regressing the base-line
specifications. On the other hand, given that a leader’s dynastic identity fails to predict
successful assassination, it reduces the risk that members of political families face
assassination attempt of different intensity. In the following section, I perform some
additional tests to see if successful assassination attempts are mutually exclusive, and thus I
further scrutinize the identification assumption.
4.4.3 Are assassination attempts mutually exclusive?
So far, I have examined whether various observable individual and divisional characteristics
predict the variation in success with sufficient precision. In this section, I conduct some
additional tests to examine the strengths of the employed identification assumption. More
specifically, the identification strategy is heavily dependent on the assumption that for a
given assassination attempt, the failure or success of the attempt is determined by an element
of chance. Consequently, in an ideal scenario, all assassination attempts must take place on
issues, however, is addressed while I perform some robustness checks for the mentioned base-linespecifications.
206The POLITY2 variable is taken from the Polity IV DATA set. (See: Marshalland Jaggers, 2004)
207 To address this issue while estimating the base-line specifications, the robustness checks usesweapon fixed effects.

167
all the leaders at the same point in time to avoid any possible spill-over effects. In other
words, an assassination attempt in period (t) in a given country can determine the likelihood
whether an assassination attempt in period (t+1) in the same Division will succeed or not by
changing security concerns. If this is true, then it will fundamentally undermine the capacity
of the employed identification strategy to pinpoint causality. Hence, to see if such spill-over
effects exist, I estimate the two linear probability models (detailed out below) in panel A and
B of Table-8.
SUCCESSi, d = α + µPrecedingAssassinationAttemptIj,d+ βXi + γP+ζD + έi(4)
SUCCESSi, d = α + µPrecedingSuccessfulAssassinationj,d+ βXi + γR+ζD + έi (5)
The first equation (equation-4) attempts to identify if assassination attempt on a leader (j) in
period t in a given division (d) predicts successful assassination attempts on any other leader
(i) in future periods in the same division (d). The second equation (equation-5) also addresses
a similar question by investigating whether successful assassination attempts in a given
period (t) on leader (j) in division (d) predicts successful assassination in future periods in
division (d) on any leader (j).
The results from Table-4.7, however, provide limited evidence in support of any such
spillover effects. That is, from Panel-A one can see that preceding assassination attempt on a
leader (j) in a division (d) fails to predict SUCCESS for leader (i) in division (d) for future
period (up to 4) years). This finding remains consistent even when I control for division
effects, party effects, common political shocks, and weapon fixed effects. In Panel-B, the
results remain qualitatively similar when I check if preceding successful assassination of
leader (i) in division (d) explains SUCCESS for future assassination attempt on leader (j) in
division (d). Moreover, this finding to an extent strengthens the reliability of the adopted
empirical strategy by showing that there is almost no evidence of such spill-over effects of
assassination attempts. To sum up, results from table 4.6 & 4.7 do direct us towards the
possibility that an element of luck is present in determining whether a leader dies in
assassination attempt or not once an assassination attempt takes place. As a result, I now turn
to estimating the effects of political assassinations on the emergence and endurance of
political dynasties.
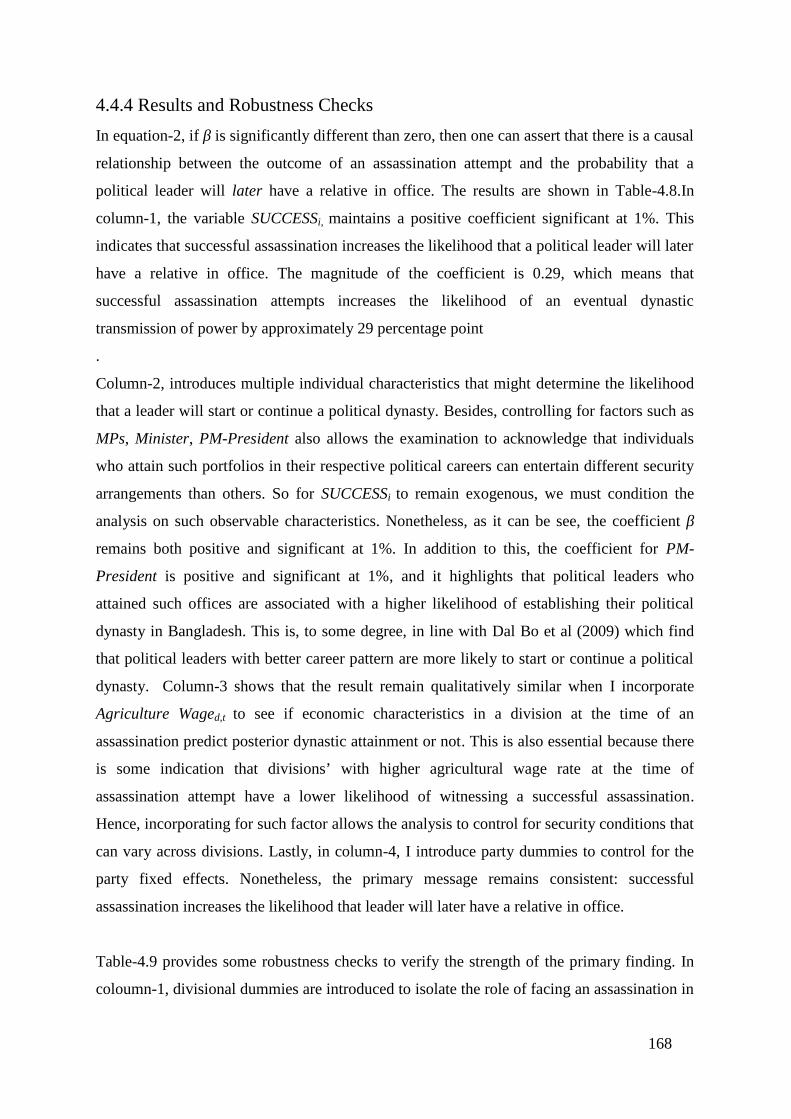
168
4.4.4 Results and Robustness Checks
In equation-2, if β is significantly different than zero, then one can assert that there is a causal
relationship between the outcome of an assassination attempt and the probability that a
political leader will later have a relative in office. The results are shown in Table-4.8.In
column-1, the variable SUCCESSi, maintains a positive coefficient significant at 1%. This
indicates that successful assassination increases the likelihood that a political leader will later
have a relative in office. The magnitude of the coefficient is 0.29, which means that
successful assassination attempts increases the likelihood of an eventual dynastic
transmission of power by approximately 29 percentage point
.
Column-2, introduces multiple individual characteristics that might determine the likelihood
that a leader will start or continue a political dynasty. Besides, controlling for factors such as
MPs, Minister, PM-President also allows the examination to acknowledge that individuals
who attain such portfolios in their respective political careers can entertain different security
arrangements than others. So for SUCCESSi to remain exogenous, we must condition the
analysis on such observable characteristics. Nonetheless, as it can be see, the coefficient β
remains both positive and significant at 1%. In addition to this, the coefficient for PM-
President is positive and significant at 1%, and it highlights that political leaders who
attained such offices are associated with a higher likelihood of establishing their political
dynasty in Bangladesh. This is, to some degree, in line with Dal Bo et al (2009) which find
that political leaders with better career pattern are more likely to start or continue a political
dynasty. Column-3 shows that the result remain qualitatively similar when I incorporate
Agriculture Waged,t to see if economic characteristics in a division at the time of an
assassination predict posterior dynastic attainment or not. This is also essential because there
is some indication that divisions’ with higher agricultural wage rate at the time of
assassination attempt have a lower likelihood of witnessing a successful assassination.
Hence, incorporating for such factor allows the analysis to control for security conditions that
can vary across divisions. Lastly, in column-4, I introduce party dummies to control for the
party fixed effects. Nonetheless, the primary message remains consistent: successful
assassination increases the likelihood that leader will later have a relative in office.
Table-4.9 provides some robustness checks to verify the strength of the primary finding. In
coloumn-1, divisional dummies are introduced to isolate the role of facing an assassination in
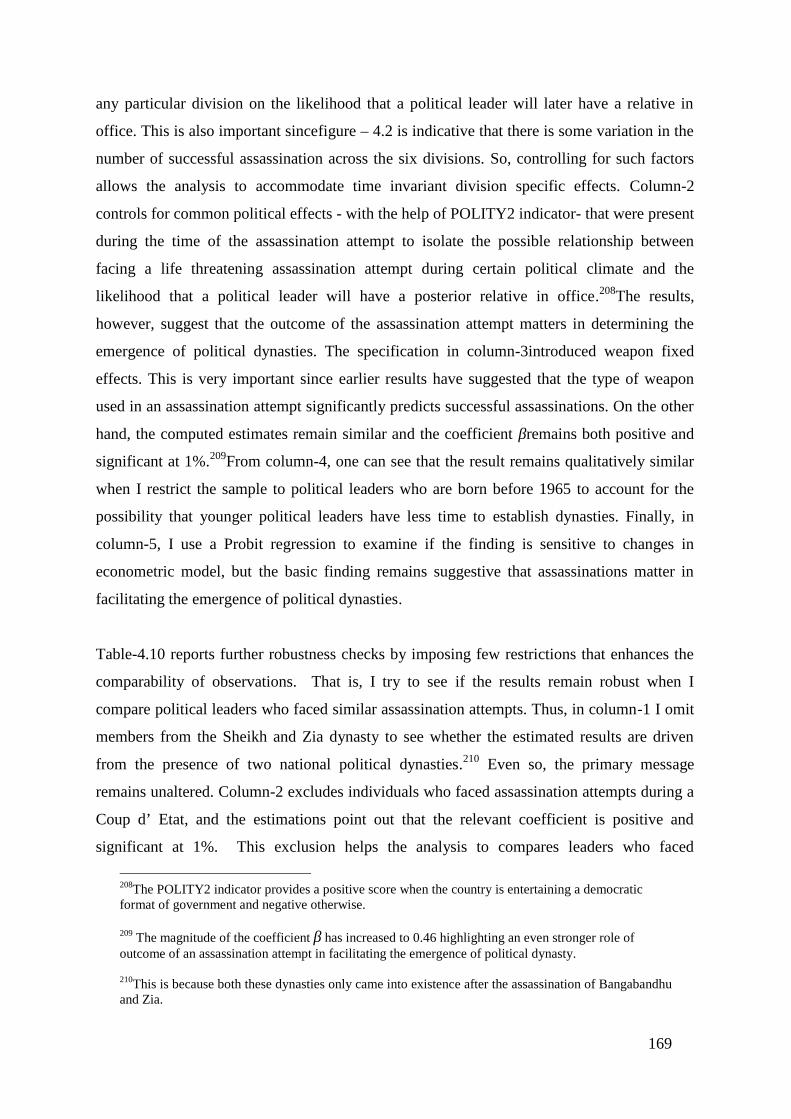
169
any particular division on the likelihood that a political leader will later have a relative in
office. This is also important sincefigure – 4.2 is indicative that there is some variation in the
number of successful assassination across the six divisions. So, controlling for such factors
allows the analysis to accommodate time invariant division specific effects. Column-2
controls for common political effects - with the help of POLITY2 indicator- that were present
during the time of the assassination attempt to isolate the possible relationship between
facing a life threatening assassination attempt during certain political climate and the
likelihood that a political leader will have a posterior relative in office.208The results,
however, suggest that the outcome of the assassination attempt matters in determining the
emergence of political dynasties. The specification in column-3introduced weapon fixed
effects. This is very important since earlier results have suggested that the type of weapon
used in an assassination attempt significantly predicts successful assassinations. On the other
hand, the computed estimates remain similar and the coefficient βremains both positive and
significant at 1%.209From column-4, one can see that the result remains qualitatively similar
when I restrict the sample to political leaders who are born before 1965 to account for the
possibility that younger political leaders have less time to establish dynasties. Finally, in
column-5, I use a Probit regression to examine if the finding is sensitive to changes in
econometric model, but the basic finding remains suggestive that assassinations matter in
facilitating the emergence of political dynasties.
Table-4.10 reports further robustness checks by imposing few restrictions that enhances the
comparability of observations. That is, I try to see if the results remain robust when I
compare political leaders who faced similar assassination attempts. Thus, in column-1 I omit
members from the Sheikh and Zia dynasty to see whether the estimated results are driven
from the presence of two national political dynasties.210 Even so, the primary message
remains unaltered. Column-2 excludes individuals who faced assassination attempts during a
Coup d’ Etat, and the estimations point out that the relevant coefficient is positive and
significant at 1%. This exclusion helps the analysis to compares leaders who faced
208The POLITY2 indicator provides a positive score when the country is entertaining a democraticformat of government and negative otherwise.
209 The magnitude of the coefficient β has increased to 0.46 highlighting an even stronger role ofoutcome of an assassination attempt in facilitating the emergence of political dynasty.
210This is because both these dynasties only came into existence after the assassination of Bangabandhuand Zia.
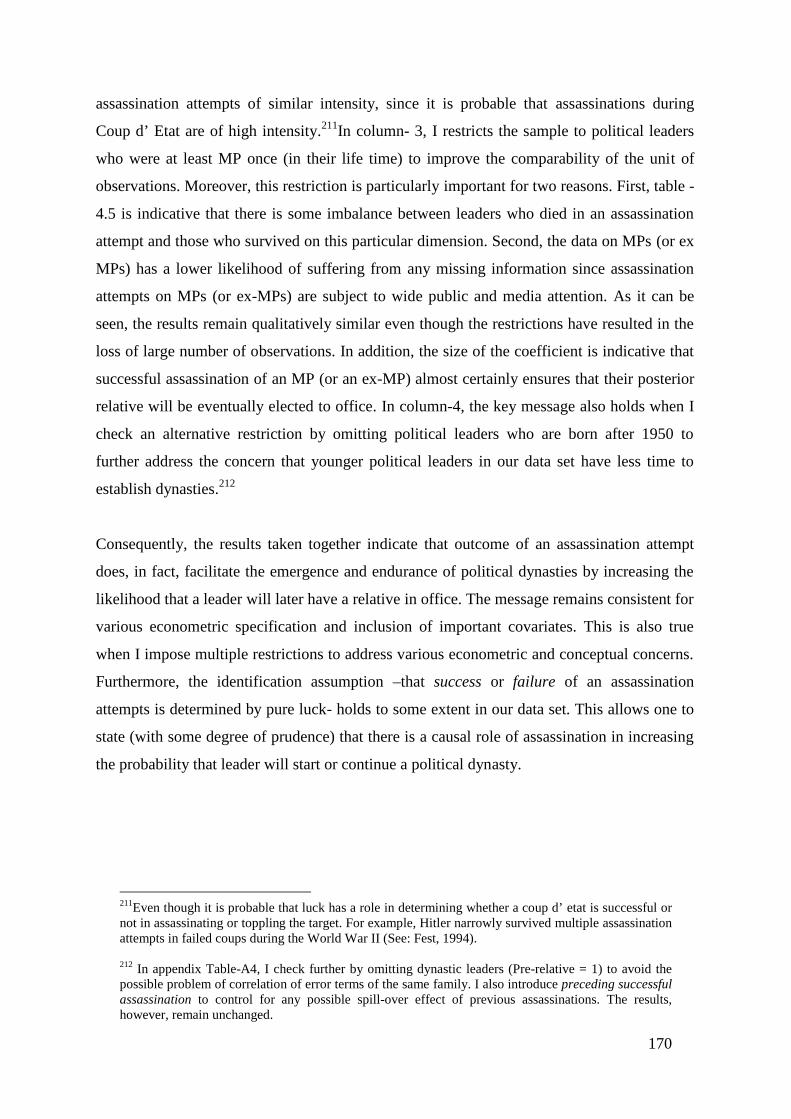
170
assassination attempts of similar intensity, since it is probable that assassinations during
Coup d’ Etat are of high intensity.211In column- 3, I restricts the sample to political leaders
who were at least MP once (in their life time) to improve the comparability of the unit of
observations. Moreover, this restriction is particularly important for two reasons. First, table -
4.5 is indicative that there is some imbalance between leaders who died in an assassination
attempt and those who survived on this particular dimension. Second, the data on MPs (or ex
MPs) has a lower likelihood of suffering from any missing information since assassination
attempts on MPs (or ex-MPs) are subject to wide public and media attention. As it can be
seen, the results remain qualitatively similar even though the restrictions have resulted in the
loss of large number of observations. In addition, the size of the coefficient is indicative that
successful assassination of an MP (or an ex-MP) almost certainly ensures that their posterior
relative will be eventually elected to office. In column-4, the key message also holds when I
check an alternative restriction by omitting political leaders who are born after 1950 to
further address the concern that younger political leaders in our data set have less time to
establish dynasties.212
Consequently, the results taken together indicate that outcome of an assassination attempt
does, in fact, facilitate the emergence and endurance of political dynasties by increasing the
likelihood that a leader will later have a relative in office. The message remains consistent for
various econometric specification and inclusion of important covariates. This is also true
when I impose multiple restrictions to address various econometric and conceptual concerns.
Furthermore, the identification assumption –that success or failure of an assassination
attempts is determined by pure luck- holds to some extent in our data set. This allows one to
state (with some degree of prudence) that there is a causal role of assassination in increasing
the probability that leader will start or continue a political dynasty.
211Even though it is probable that luck has a role in determining whether a coup d’ etat is successful ornot in assassinating or toppling the target. For example, Hitler narrowly survived multiple assassinationattempts in failed coups during the World War II (See: Fest, 1994).
212 In appendix Table-A4, I check further by omitting dynastic leaders (Pre-relative = 1) to avoid thepossible problem of correlation of error terms of the same family. I also introduce preceding successfulassassination to control for any possible spill-over effect of previous assassinations. The results,however, remain unchanged.
171
4.5 Conclusion and Caveats
This paper presents empirical evidence on the possible role of political assassinations in
aiding dynastic transmission of political power within the political class of Bangladesh. This
is interesting since political dynasties reflect considerable inequality in the distribution of
political power, and their presence is felt strongly at the local and national levels. Besides,
the factors that guide ‘dynastic inheritance of political power’ are of interest to those who are
concerned with the legitimacy of the process by which democratic representation is obtained.
Hence, to empirically examine if assassinations facilitate de facto inheritance of political
power, two broad steps are taken. First, the paper documents the biographies of 536 leaders
who were elected to the office of a Member of Parliament either in the 8th or 9th National
Parliament. Additionally, it finds that leaders who are descendants of assassinated leaders are
associated with a higher likelihood of continuing the political dynasty. The results also show
that being a descendant of a non-assassinated politician is also associated with a higher
likelihood of having a posterior relative in office. In terms of the modifying role of
assassination, there are some indications (even though very weak) that the relationship is
stronger for descendants of assassinated lawmakers. I interpret these estimations as
correlation because it is possible that these results are driven by unobserved family or
individual heterogeneity.
To isolate a possible causal role of assassination in dynasty formation, the paper adopts the
identification strategy employed by Jones and Olken (2009). More specifically, the
mentioned paper studies the effects of political assassination by employing an identification
assumption that although attempts on a political leader’s life may be driven by historical
circumstances, unobserved individual ability or etc, conditional on trying to kill a leader, the
failure or success of assassination attempt can be treated as exogenous. That is, pure chance
has role in determining whether a leader barely survives or dies when a bomb explodes or a
gun is shot to assassinate him or her. Thus, if this holds true, then by comparing political
leaders who barely survived with those who died, one can identify the possible effects of
assassination. Therefore, to execute this estimation technique, a historical data set on
assassination attempts is compiled for post 1971 Bangladesh. This new data set has
information on 97 political leaders from all six Divisions in post 1971 period who had at
least one serious assassination attempt on their life. Furthermore, the aim here is to check if a
leader who died in an assassination attempt in comparison to a leader who barely survived an
172
assassination attempt is on average more or less likely to start or continue a political dynasty.
That is, whether the outcome of an assassination attempt determines the likelihood that
political dynasty will emerge or not.
Overall, the results show that assassinations do in fact matter. More specifically, the
estimations are indicative that successful assassinations can increase the likelihood of
dynastic succession by approximately 30% to 45%.213 Likewise, the estimations remain
significant after multiple robustness check. This finding also has numerous important
implications. First, it shows that political events can have persistent effects in determining
the composition of political class. Second, it suggests that dynastic leaders are not necessarily
a product of superior genetic endowment of individual leaders. Rather, the evidence is
indicative that political shocks in the form of successful assassinations can facilitate such de
fact inheritance of political power. Third, while Dal Bo et al (2009) identifies that positive
exogenous shocks to a leader’s political power (in the form of winning re-election) matter in
facilitating future dynastic succession, the present study notes that negative exogenous
shocks to a leader’s life (in the form of death in an assassination attempt) can too increase the
likelihood that a leader will start or continue a political dynasty. This highlights that the
context of the shock is fundamental in shaping posterior dynastic attainment. In terms of its
resemblance with earlier empirical work on political dynasties, the paper complements the
findings of Dal Bo et al (2009) by showing that tenure in public office is associated
positively with the likelihood that a leader will start or continue a political dynasty. The data
set on political leaders with at least one assassination attempt also shows that political leaders
with better career pattern are associated with a higher likelihood that a political leader will
start or continue a political dynasty, which is also echoed in the analysis of Dal Bo et al
(2009).
In terms of caveats, the study relies on a smaller sample size in comparison to Jones and
Olken (2009). Nonetheless, given that the study uses a sub-national data set, it enjoys a better
comparability of data across different unit of observations. Another key limitation of the
present study is that it fails to distinguish separately between the impact of successes and
failures of assassination attempt. That is, it might be natural to presume that the successes-
213This range is, coincidently, within the estimates of Chapter-5: “Assassination and PoliticalDynasties” which addresses the same question on a cross national data set. Hence, taken together, theresults from these two inquiries of the same intellectual question do make it pragmatic to argue thatpolitical assassinations do in fact facilitate the emergence of political dynasties.
173
where a leader dies- are more important drivers of the result, but one can argue that failing to
die in an assassination attempt can have important implications if such phenomenon is
associated with lowering the likelihood that leader will later have a relative in office.
Although the present analysis has not rigorously dealt with this issue but it is plausible to
intuitively infer that successful assassinations attempts are the major drivers of the computed
results. This is because the primary message has support from both the data sets used in this
work. Besides, the mentioned brief historical narrative and existing qualitative studies on
political assassinations (Ritcher, 1990; Thompson, 2002) do hint that martyrdom of the
assassinated leaders might have played an instrumental role in facilitating dynastic
successions.
Lastly, the structure and the empirical methodology of the overall analysis provide limited
scope for pinpointing the exact causal mechanisms underlying the relationship between
political assassinations and the existence of political families. Stated otherwise, are there
conditions that make an assassination a triggering event for facilitating a dynastic
succession? That is, do political leaders need to posses political capital above certain
threshold for their assassinations to matter? More importantly, what is the exact role of
political parties in aiding dynastic successions after an act of assassination? Thus, future
work can shed further insights on the political process that guides dynastic transmission of
political power in the event of an assassination, so that a better understanding of the topic is
achieved.
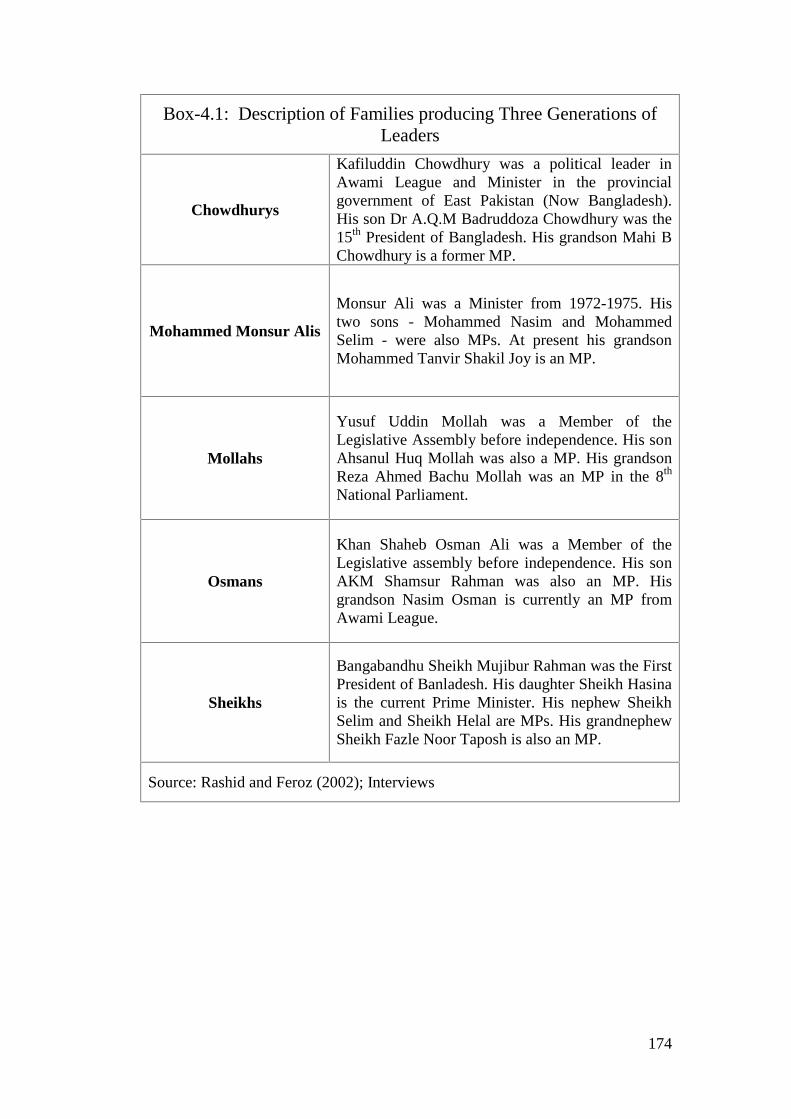
174
Box-4.1: Description of Families producing Three Generations ofLeaders
Chowdhurys
Kafiluddin Chowdhury was a political leader inAwami League and Minister in the provincialgovernment of East Pakistan (Now Bangladesh).His son Dr A.Q.M Badruddoza Chowdhury was the15th President of Bangladesh. His grandson Mahi BChowdhury is a former MP.
Mohammed Monsur Alis
Monsur Ali was a Minister from 1972-1975. Histwo sons - Mohammed Nasim and MohammedSelim - were also MPs. At present his grandsonMohammed Tanvir Shakil Joy is an MP.
Mollahs
Yusuf Uddin Mollah was a Member of theLegislative Assembly before independence. His sonAhsanul Huq Mollah was also a MP. His grandsonReza Ahmed Bachu Mollah was an MP in the 8th
National Parliament.
Osmans
Khan Shaheb Osman Ali was a Member of theLegislative assembly before independence. His sonAKM Shamsur Rahman was also an MP. Hisgrandson Nasim Osman is currently an MP fromAwami League.
Sheikhs
Bangabandhu Sheikh Mujibur Rahman was the FirstPresident of Banladesh. His daughter Sheikh Hasinais the current Prime Minister. His nephew SheikhSelim and Sheikh Helal are MPs. His grandnephewSheikh Fazle Noor Taposh is also an MP.
Source: Rashid and Feroz (2002); Interviews
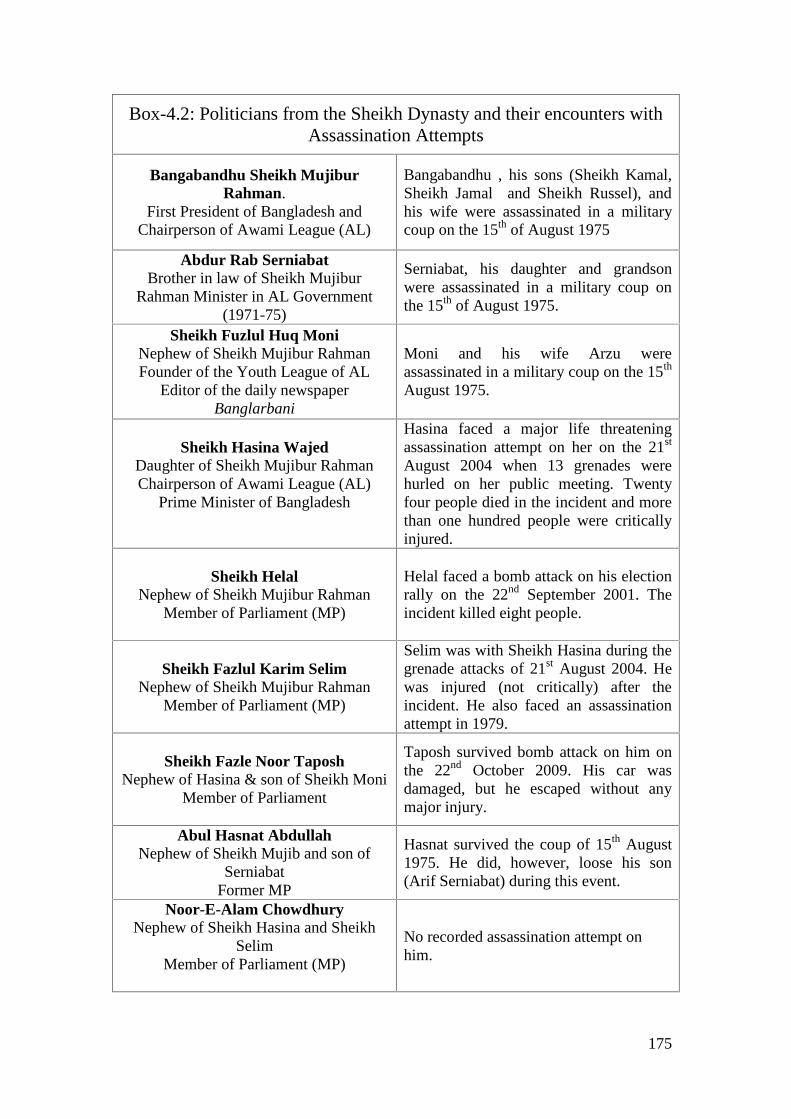
175
Box-4.2: Politicians from the Sheikh Dynasty and their encounters withAssassination Attempts
Bangabandhu Sheikh MujiburRahman.
First President of Bangladesh andChairperson of Awami League (AL)
Bangabandhu , his sons (Sheikh Kamal,Sheikh Jamal and Sheikh Russel), andhis wife were assassinated in a militarycoup on the 15th of August 1975
Abdur Rab SerniabatBrother in law of Sheikh Mujibur
Rahman Minister in AL Government(1971-75)
Serniabat, his daughter and grandsonwere assassinated in a military coup onthe 15th of August 1975.
Sheikh Fuzlul Huq MoniNephew of Sheikh Mujibur RahmanFounder of the Youth League of AL
Editor of the daily newspaperBanglarbani
Moni and his wife Arzu wereassassinated in a military coup on the 15th
August 1975.
Sheikh Hasina WajedDaughter of Sheikh Mujibur RahmanChairperson of Awami League (AL)
Prime Minister of Bangladesh
Hasina faced a major life threateningassassination attempt on her on the 21st
August 2004 when 13 grenades werehurled on her public meeting. Twentyfour people died in the incident and morethan one hundred people were criticallyinjured.
Sheikh HelalNephew of Sheikh Mujibur Rahman
Member of Parliament (MP)
Helal faced a bomb attack on his electionrally on the 22nd September 2001. Theincident killed eight people.
Sheikh Fazlul Karim SelimNephew of Sheikh Mujibur Rahman
Member of Parliament (MP)
Selim was with Sheikh Hasina during thegrenade attacks of 21st August 2004. Hewas injured (not critically) after theincident. He also faced an assassinationattempt in 1979.
Sheikh Fazle Noor TaposhNephew of Hasina & son of Sheikh Moni
Member of Parliament
Taposh survived bomb attack on him onthe 22nd October 2009. His car wasdamaged, but he escaped without anymajor injury.
Abul Hasnat AbdullahNephew of Sheikh Mujib and son of
SerniabatFormer MP
Hasnat survived the coup of 15th August1975. He did, however, loose his son(Arif Serniabat) during this event.
Noor-E-Alam ChowdhuryNephew of Sheikh Hasina and Sheikh
SelimMember of Parliament (MP)
No recorded assassination attempt onhim.
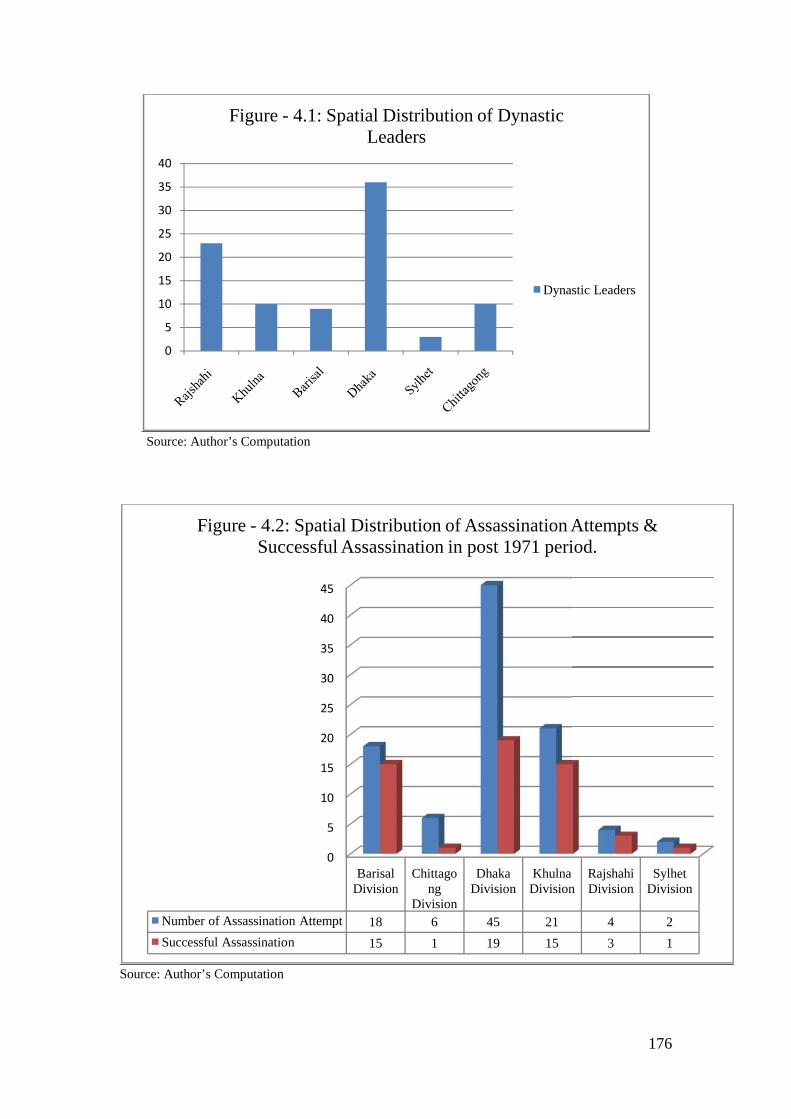
176
Source: Author’s Computation
Source: Author’s Computation
0
5
10
15
20
25
30
35
40
Figure - 4.1: Spatial Distribution of DynasticLeaders
Number of Assassination Attempt
Successful Assassination
Figure - 4.2: Spatial Distribution of Assassination Attempts &Successful Assassination in post 1971 period.
176
Source: Author’s Computation
Source: Author’s Computation
Figure - 4.1: Spatial Distribution of DynasticLeaders
Dynastic Leaders
0
5
10
15
20
25
30
35
40
45
BarisalDivision
Chittagong
Division
DhakaDivision
KhulnaDivision
Number of Assassination Attempt 18 6 45 21
Successful Assassination 15 1 19 15
Figure - 4.2: Spatial Distribution of Assassination Attempts &Successful Assassination in post 1971 period.
176
Source: Author’s Computation
Source: Author’s Computation
Figure - 4.1: Spatial Distribution of DynasticLeaders
Dynastic Leaders
KhulnaDivision
RajshahiDivision
SylhetDivision
4 2
3 1
Figure - 4.2: Spatial Distribution of Assassination Attempts &Successful Assassination in post 1971 period.
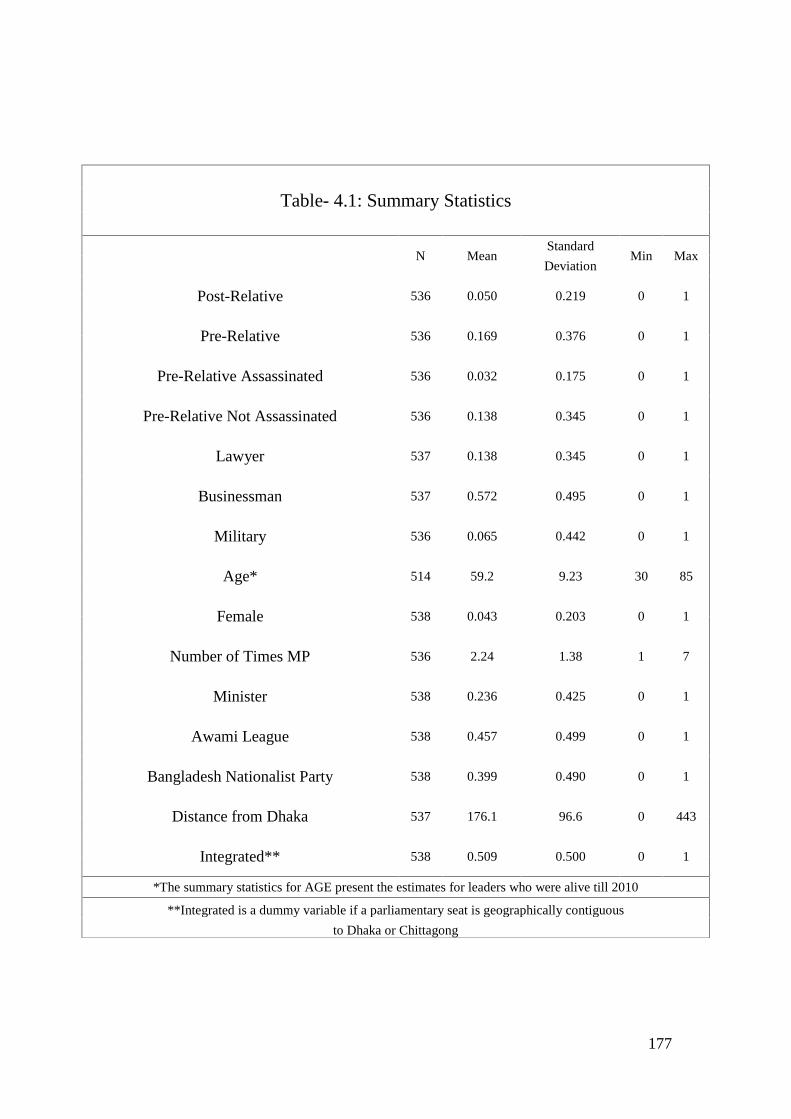
177
Table- 4.1: Summary Statistics
N MeanStandard
Min MaxDeviation
Post-Relative 536 0.050 0.219 0 1
Pre-Relative 536 0.169 0.376 0 1
Pre-Relative Assassinated 536 0.032 0.175 0 1
Pre-Relative Not Assassinated 536 0.138 0.345 0 1
Lawyer 537 0.138 0.345 0 1
Businessman 537 0.572 0.495 0 1
Military 536 0.065 0.442 0 1
Age* 514 59.2 9.23 30 85
Female 538 0.043 0.203 0 1
Number of Times MP 536 2.24 1.38 1 7
Minister 538 0.236 0.425 0 1
Awami League 538 0.457 0.499 0 1
Bangladesh Nationalist Party 538 0.399 0.490 0 1
Distance from Dhaka 537 176.1 96.6 0 443
Integrated** 538 0.509 0.500 0 1
*The summary statistics for AGE present the estimates for leaders who were alive till 2010
**Integrated is a dummy variable if a parliamentary seat is geographically contiguous
to Dhaka or Chittagong
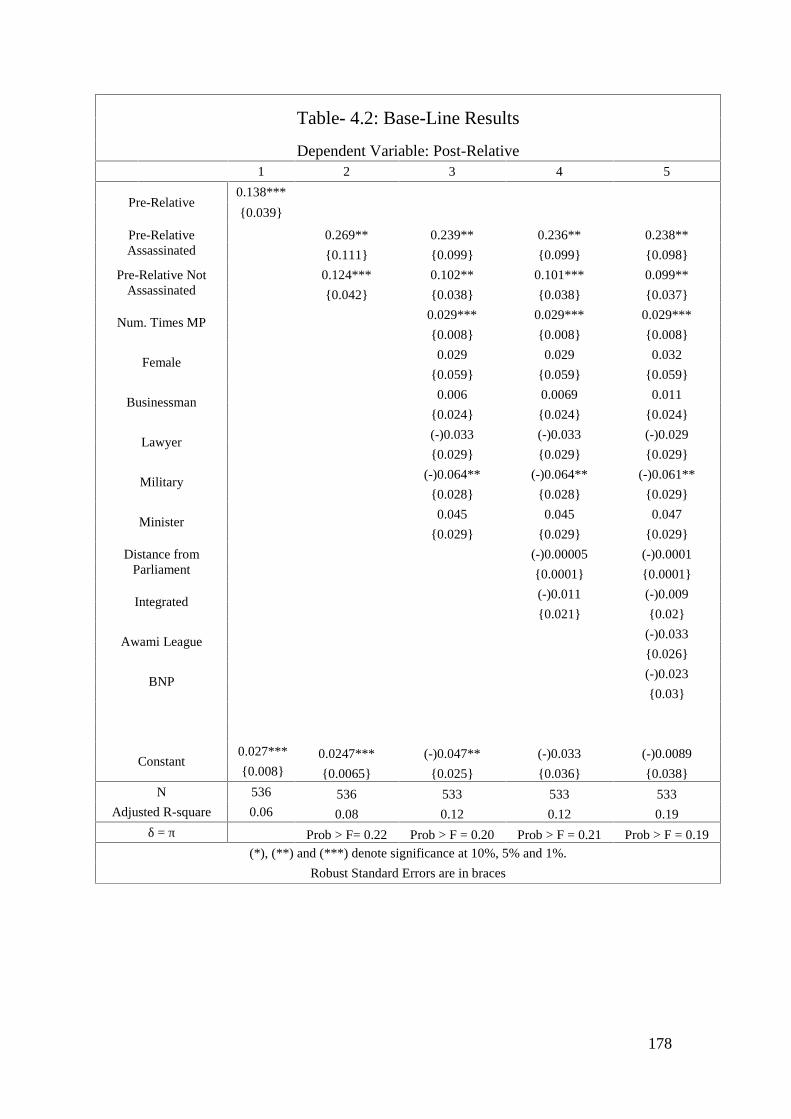
178
Table- 4.2: Base-Line Results
Dependent Variable: Post-Relative1 2 3 4 5
Pre-Relative0.138***
0.039
Pre-RelativeAssassinated
0.269** 0.239** 0.236** 0.238**
0.111 0.099 0.099 0.098
Pre-Relative NotAssassinated
0.124*** 0.102** 0.101*** 0.099**
0.042 0.038 0.038 0.037
Num. Times MP0.029*** 0.029*** 0.029***
0.008 0.008 0.008
Female0.029 0.029 0.032
0.059 0.059 0.059
Businessman0.006 0.0069 0.011
0.024 0.024 0.024
Lawyer(-)0.033 (-)0.033 (-)0.029
0.029 0.029 0.029
Military(-)0.064** (-)0.064** (-)0.061**
0.028 0.028 0.029
Minister0.045 0.045 0.047
0.029 0.029 0.029
Distance fromParliament
(-)0.00005 (-)0.0001
0.0001 0.0001
Integrated(-)0.011 (-)0.009
0.021 0.02
Awami League(-)0.033
0.026
BNP(-)0.023
0.03
Constant0.027*** 0.0247*** (-)0.047** (-)0.033 (-)0.00890.008 0.0065 0.025 0.036 0.038
N 536 536 533 533 533Adjusted R-square 0.06 0.08 0.12 0.12 0.19
δ = π Prob > F= 0.22 Prob > F = 0.20 Prob > F = 0.21 Prob > F = 0.19(*), (**) and (***) denote significance at 10%, 5% and 1%.
Robust Standard Errors are in braces

179
Table- 4.3: Robustness Checks
Dependent Variable: Post-Relative1 2 3 4
Pre-RelativeAssassinated
0.231** 0.179* 0.237** 0.323***
0.097 0.097 0.094 0.116
Pre-Relative NotAssassinated
0.097*** 0.098** 0.092** 0.113***
0.037 0.037 0.036 0.045
Num. Times MP0.027*** 0.028*** 0.025*** 0.023***
0.008 0.009 0.009 0.009
Female0.023 (-)0.011 0.013 0.002
0.059 0.062 0.062 0.068
Businessman0.008 0.004 0.016 0.017
0.023 0.025 0.021 0.023
Lawyer(-)0.023 (-)0.021 0.003 0.011
0.03 0.031 0.028 0.0318
Military(-)0.064** (-)0.088** (-)0.072** (-)0.078**
0.029 0.035 0.035 0.037
Minister0.046 0.031 0.04 0.0398
0.03 0.031 0.029 0.031
Distance fromParliament
0.000016 (-)0.0007*** (-)0.0007*** (-)0.0007
0.0001 0.0001 0.0001 0.0008
Integrated(-)0.116** (-)0.268*** (-)0.266*** (-)0.258
0.074 0.341 0.344 0.339
Awami League(-)0.037* (-)0.017 (-)0.023 (-)0.026
0.026 0.029 0.029 0.031
BNP(-)0.022 (-)0.0007 (-)0.023 (-)0.027
0.03 0.034 0.033 0.035
Constant0.091 0.223*** 0.22*** 0.225
0.076 0.342 0.345 0.339Division Effect YES NO NO NODistrict Effect NO YES YES YESDead Excluded NO NO YES YESBorn after 1965
Excluded NO NO NO YESN 533 533 513 471
Adjusted R-square 0.12 0.12 0.18 0.19δ = π Prob > F = 0.20 Prob > F = 0.43 Prob > F = 0.15 Prob > F = 0.09*
(*), (**) and (***) denote significance at 10%, 5% and 1%.
Robust Standard Errors are in braces

180
Table – 4.4: Summary Statistics for Leaders with at leastone Assassination Attempt
N MeanStandard
Min MaxDeviation
Post-Relative 97 0.278 0.450 0 1
SUCCESS 97 0.557 0.499 0 1
Pre-Relative 97 0.144 0.353 0 1
Female 97 0.031 0.174 0 1
Lawyer 97 0.113 0.319 0 1
Military 97 0.031 0.174 0 1
MP 97 0.454 0.5004 0 1
Minister 97 0.206 0.407 0 1
PM-President 97 0.082 0.277 0 1
NOTE: A ‘leader’ is defined as someone who was either a member of a ‘Central Committee’ or‘District Committee’ of a Political Party.
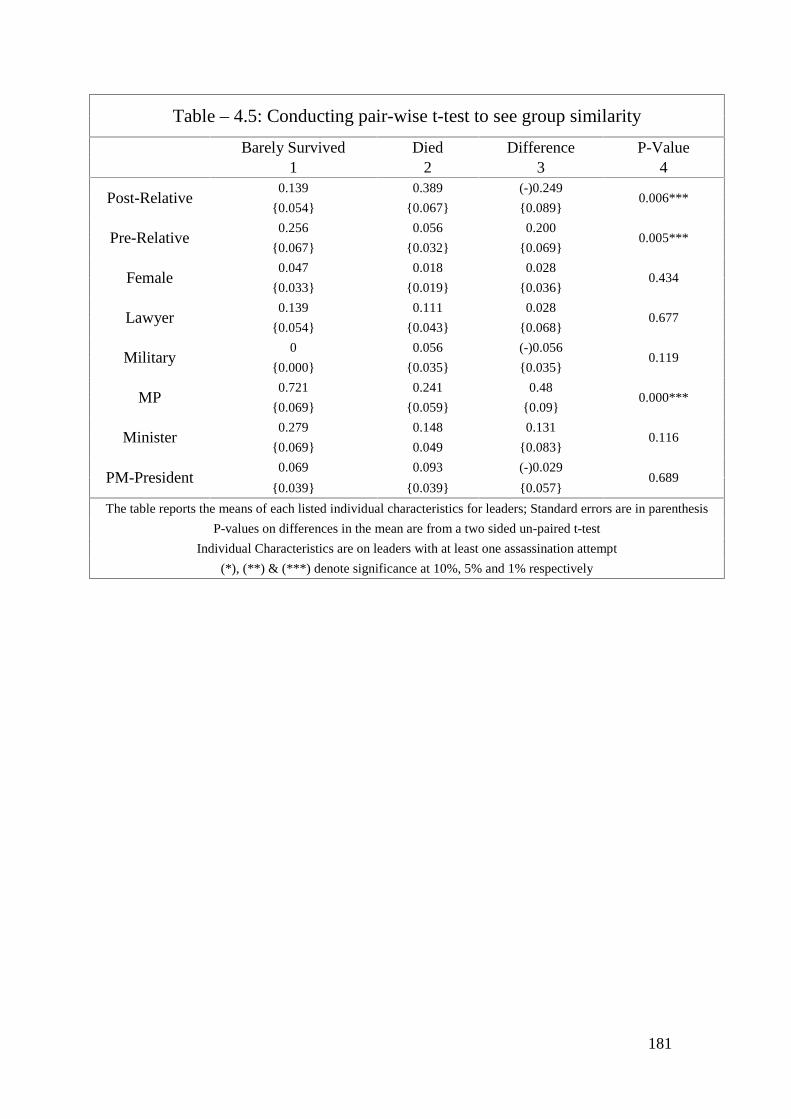
181
Table – 4.5: Conducting pair-wise t-test to see group similarity
Barely Survived Died Difference P-Value1 2 3 4
Post-Relative0.139 0.389 (-)0.249
0.006***0.054 0.067 0.089
Pre-Relative0.256 0.056 0.200
0.005***0.067 0.032 0.069
Female0.047 0.018 0.028
0.4340.033 0.019 0.036
Lawyer0.139 0.111 0.028
0.6770.054 0.043 0.068
Military0 0.056 (-)0.056
0.1190.000 0.035 0.035
MP0.721 0.241 0.48
0.000***0.069 0.059 0.09
Minister0.279 0.148 0.131
0.1160.069 0.049 0.083
PM-President0.069 0.093 (-)0.029
0.6890.039 0.039 0.057
The table reports the means of each listed individual characteristics for leaders; Standard errors are in parenthesis
P-values on differences in the mean are from a two sided un-paired t-test
Individual Characteristics are on leaders with at least one assassination attempt
(*), (**) & (***) denote significance at 10%, 5% and 1% respectively
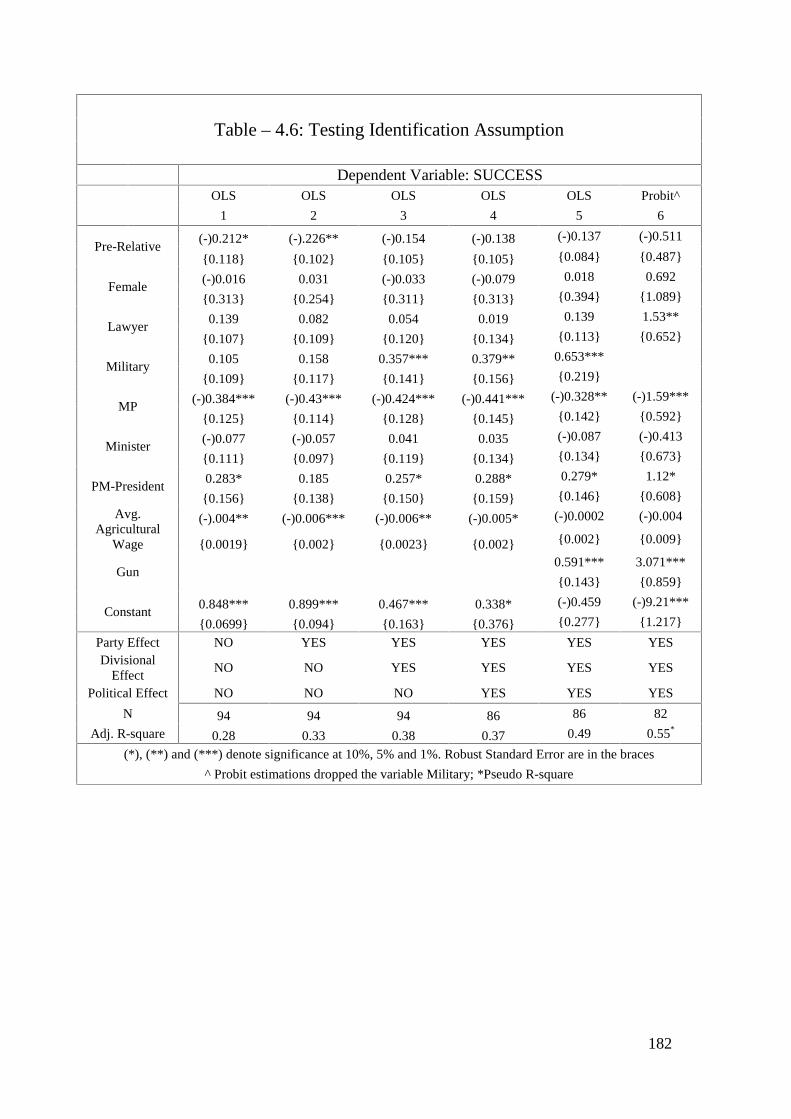
182
Table – 4.6: Testing Identification Assumption
Dependent Variable: SUCCESSOLS OLS OLS OLS OLS Probit^
1 2 3 4 5 6
Pre-Relative(-)0.212* (-).226** (-)0.154 (-)0.138 (-)0.137 (-)0.511
0.118 0.102 0.105 0.105 0.084 0.487
Female(-)0.016 0.031 (-)0.033 (-)0.079 0.018 0.692
0.313 0.254 0.311 0.313 0.394 1.089
Lawyer0.139 0.082 0.054 0.019 0.139 1.53**
0.107 0.109 0.120 0.134 0.113 0.652
Military0.105 0.158 0.357*** 0.379** 0.653***
0.109 0.117 0.141 0.156 0.219
MP(-)0.384*** (-)0.43*** (-)0.424*** (-)0.441*** (-)0.328** (-)1.59***
0.125 0.114 0.128 0.145 0.142 0.592
Minister(-)0.077 (-)0.057 0.041 0.035 (-)0.087 (-)0.413
0.111 0.097 0.119 0.134 0.134 0.673
PM-President0.283* 0.185 0.257* 0.288* 0.279* 1.12*
0.156 0.138 0.150 0.159 0.146 0.608Avg.
AgriculturalWage
(-).004** (-)0.006*** (-)0.006** (-)0.005* (-)0.0002 (-)0.004
0.0019 0.002 0.0023 0.002 0.002 0.009
Gun0.591*** 3.071***
0.143 0.859
Constant0.848*** 0.899*** 0.467*** 0.338* (-)0.459 (-)9.21***
0.0699 0.094 0.163 0.376 0.277 1.217
Party Effect NO YES YES YES YES YESDivisional
EffectNO NO YES YES YES YES
Political Effect NO NO NO YES YES YES
N 94 94 94 86 86 82
Adj. R-square 0.28 0.33 0.38 0.37 0.49 0.55*
(*), (**) and (***) denote significance at 10%, 5% and 1%. Robust Standard Error are in the braces
^ Probit estimations dropped the variable Military; *Pseudo R-square

183
Table – 4.7: Are Assassination attempts mutually exclusive?
Panel-ADependent Variable: SUCCESS
1 2 3 4
Prec. Assassination Attempt T-1(-)0.074
0.138
Prec. Assassination Attempt T-20.084
0.123
Prec. Assassination Attempt T-30.002
0.145]
Prec. Assassination Attempt T-4(-)0.239
0.171
Party Effect Y Y Y YDivisional Effect Y Y Y YPolitical Effect Y Y Y YWeapon Effect Y Y Y Y
N 83 83 79 79(*), (**)& (***) denote significance at 10%, 5% and 1%. Robust Standard Errors are in the parenthesis.
Individual and Divisional Characteristics are controlled for in all columns
Panel-BDependent Variable: SUCCESS
1 2 3 4
Prec. Successful Assassination T-1(-)0.075
0.156
Prec. Successful Assassination T-20.047
0.122
Prec. Successful Assassination T-3(-)0.048
0.14
Prec. Successful Assassination T-4(-)0.119
0.159
Party Effect Y Y Y YDivisional Effect Y Y Y YPolitical Effect Y Y Y YWeapon Effect Y Y Y Y
N 83 83 79 79(*), (**)& (***) denote significance at 10%, 5% and 1%. Robust Standard Errors are in the braces.
Individual and Divisional Characteristics are controlled for in all columns
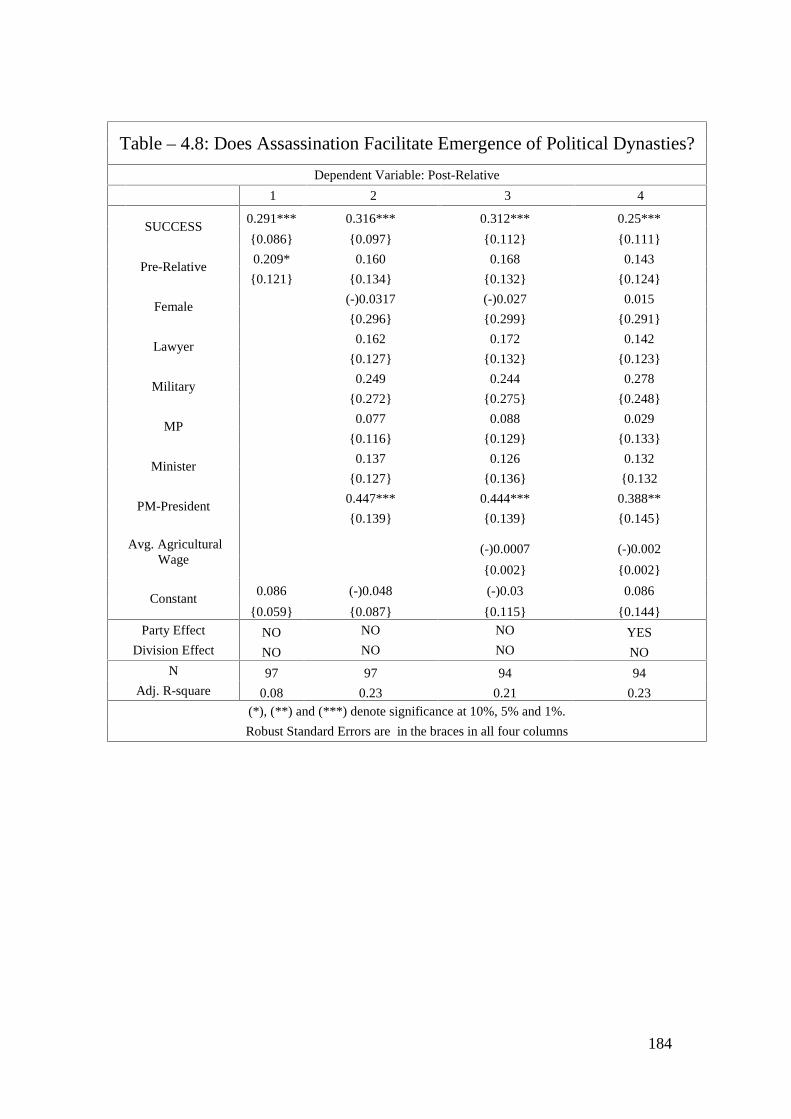
184
Table – 4.8: Does Assassination Facilitate Emergence of Political Dynasties?
Dependent Variable: Post-Relative
1 2 3 4
SUCCESS0.291*** 0.316*** 0.312*** 0.25***
0.086 0.097 0.112 0.111
Pre-Relative0.209* 0.160 0.168 0.143
0.121 0.134 0.132 0.124
Female(-)0.0317 (-)0.027 0.015
0.296 0.299 0.291
Lawyer0.162 0.172 0.142
0.127 0.132 0.123
Military0.249 0.244 0.278
0.272 0.275 0.248
MP0.077 0.088 0.029
0.116 0.129 0.133
Minister0.137 0.126 0.132
0.127 0.136 0.132
PM-President0.447*** 0.444*** 0.388**
0.139 0.139 0.145
Avg. AgriculturalWage
(-)0.0007 (-)0.002
0.002 0.002
Constant0.086 (-)0.048 (-)0.03 0.086
0.059 0.087 0.115 0.144Party Effect NO NO NO YES
Division Effect NO NO NO NON 97 97 94 94
Adj. R-square 0.08 0.23 0.21 0.23(*), (**) and (***) denote significance at 10%, 5% and 1%.
Robust Standard Errors are in the braces in all four columns
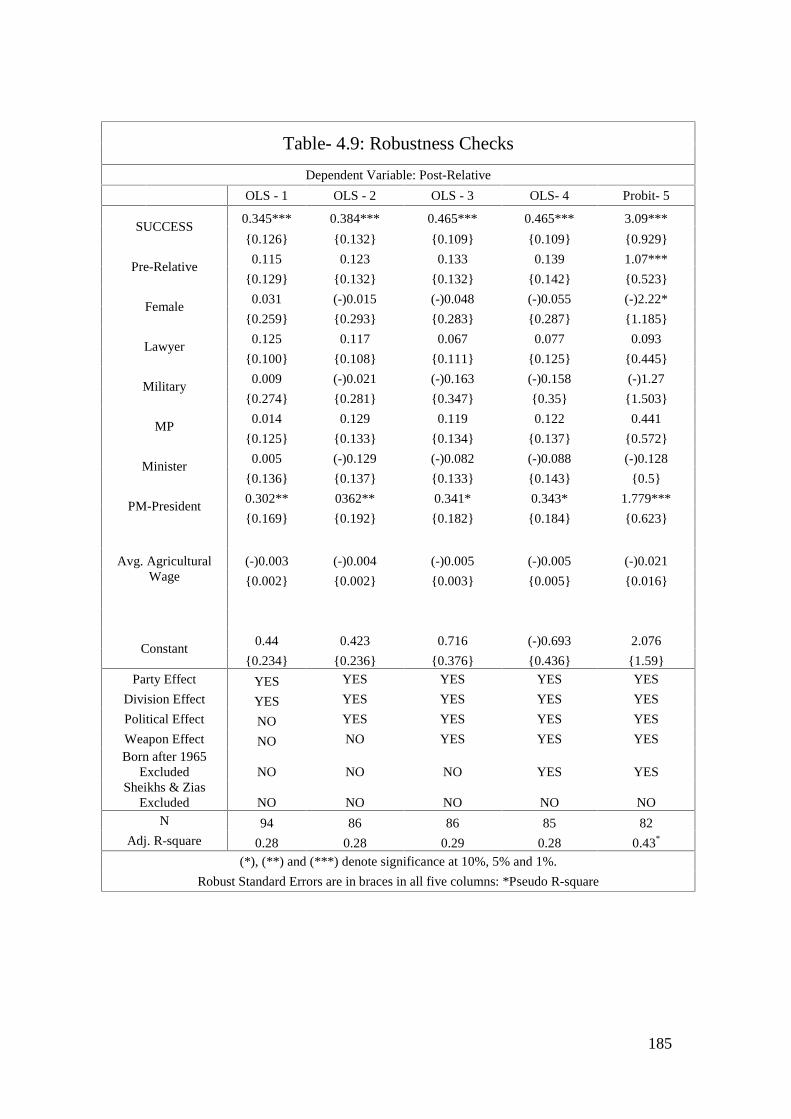
185
Table- 4.9: Robustness Checks
Dependent Variable: Post-Relative
OLS - 1 OLS - 2 OLS - 3 OLS- 4 Probit- 5
SUCCESS0.345*** 0.384*** 0.465*** 0.465*** 3.09***
0.126 0.132 0.109 0.109 0.929
Pre-Relative0.115 0.123 0.133 0.139 1.07***
0.129 0.132 0.132 0.142 0.523
Female0.031 (-)0.015 (-)0.048 (-)0.055 (-)2.22*
0.259 0.293 0.283 0.287 1.185
Lawyer0.125 0.117 0.067 0.077 0.093
0.100 0.108 0.111 0.125 0.445
Military0.009 (-)0.021 (-)0.163 (-)0.158 (-)1.27
0.274 0.281 0.347 0.35 1.503
MP0.014 0.129 0.119 0.122 0.441
0.125 0.133 0.134 0.137 0.572
Minister0.005 (-)0.129 (-)0.082 (-)0.088 (-)0.128
0.136 0.137 0.133 0.143 0.5
PM-President0.302** 0362** 0.341* 0.343* 1.779***
0.169 0.192 0.182 0.184 0.623
Avg. AgriculturalWage
(-)0.003 (-)0.004 (-)0.005 (-)0.005 (-)0.021
0.002 0.002 0.003 0.005 0.016
Constant0.44 0.423 0.716 (-)0.693 2.076
0.234 0.236 0.376 0.436 1.59Party Effect YES YES YES YES YES
Division Effect YES YES YES YES YES
Political Effect NO YES YES YES YES
Weapon Effect NO NO YES YES YESBorn after 1965
Excluded NO NO NO YES YESSheikhs & Zias
Excluded NO NO NO NO NON 94 86 86 85 82
Adj. R-square 0.28 0.28 0.29 0.28 0.43*
(*), (**) and (***) denote significance at 10%, 5% and 1%.
Robust Standard Errors are in braces in all five columns: *Pseudo R-square
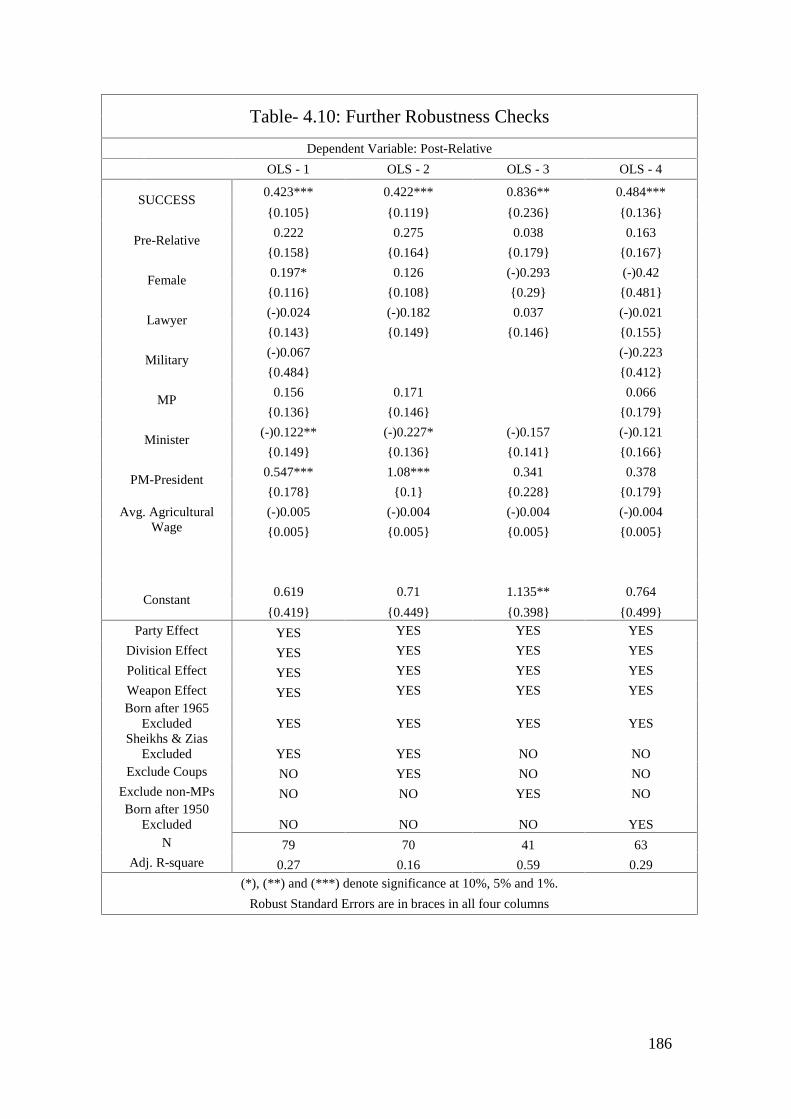
186
Table- 4.10: Further Robustness Checks
Dependent Variable: Post-Relative
OLS - 1 OLS - 2 OLS - 3 OLS - 4
SUCCESS0.423*** 0.422*** 0.836** 0.484***
0.105 0.119 0.236 0.136
Pre-Relative0.222 0.275 0.038 0.163
0.158 0.164 0.179 0.167
Female0.197* 0.126 (-)0.293 (-)0.42
0.116 0.108 0.29 0.481
Lawyer(-)0.024 (-)0.182 0.037 (-)0.021
0.143 0.149 0.146 0.155
Military(-)0.067 (-)0.223
0.484 0.412
MP0.156 0.171 0.066
0.136 0.146 0.179
Minister(-)0.122** (-)0.227* (-)0.157 (-)0.121
0.149 0.136 0.141 0.166
PM-President0.547*** 1.08*** 0.341 0.378
0.178 0.1 0.228 0.179
Avg. AgriculturalWage
(-)0.005 (-)0.004 (-)0.004 (-)0.004
0.005 0.005 0.005 0.005
Constant0.619 0.71 1.135** 0.764
0.419 0.449 0.398 0.499Party Effect YES YES YES YES
Division Effect YES YES YES YES
Political Effect YES YES YES YES
Weapon Effect YES YES YES YESBorn after 1965
Excluded YES YES YES YESSheikhs & Zias
Excluded YES YES NO NOExclude Coups NO YES NO NO
Exclude non-MPs NO NO YES NOBorn after 1950
Excluded NO NO NO YESN 79 70 41 63
Adj. R-square 0.27 0.16 0.59 0.29(*), (**) and (***) denote significance at 10%, 5% and 1%.
Robust Standard Errors are in braces in all four columns
187
5. Assassination and Political Dynasties
Abstract
This paper investigates whether political assassination of national leaders facilitates the
emergence and endurance of political dynasties. To this end, the paper uses biographical data on
442 national leaders from 65 countries who have ruled (at least once) as an executive head of
their respective country in post 1950 to 2005 period. Moreover, the base-line results suggest that
assassinated leaders are on average associated with a higher likelihood that they will later have a
relative enter office. This association is robust for various changes in the econometric
specifications. Furthermore, in order to identify causality, the paper employs the data set of
Jones and Olken (2009) which has information on more than 190 national leaders from 93
countries in post 1875 to 2003 period who had at least one serious assassination attempt on their
life. I use their identification assumption, that although attempts on a national leader’s life may
be driven by historical circumstances, conditional on trying to kill a national leader, the failure
or success of assassination attempt can be treated as exogenous. Consequently, the results
indicate that successful assassinations do in fact facilitate the emergence of political dynasties
by increasing the likelihood that a leader will later have a relative in office. These findings
remain consistent when multiple robustness checks are conducted. I also check for the
possibility that successful assassination facilitates certain kind of dynastic successions. The
estimations suggest that assassinations strongly explain immediate dynastic succession at the
highest political office. Lastly, in line with Dal Bo et al, 2009, the results provide some support
for the self-perpetuation hypothesis: that is, leaders with a longer tenure are on average
associated with higher likelihood of having a relative later in office.
Key words: Assassination, Immediate Dynastic Succession, Martyrdom.
188
5.1 Introduction: Does political assassination matter?
“On the street of New Delhi a women wails that they have killed mother India…why not kill us
too” reports a journalist while capturing the aftermath of Mrs. Indira Gandhi’s assassination- the
first female Prime Minister of India. Indira Gandhi and members of her family (her father and
son) not only ruled India for 36 years, but two members of this family have been unfortunate
enough to have a violent end. Political assassination, brutal it maybe, is an event that has shaped
the political history of various countries. From Julius Caesar to John F Kennedy, from Abraham
Lincoln to Mahatma Gandhi - statesman of great influence and power have often fallen victim
to conspiracies that have resulted in their assassination, and many others have survived
assassination attempts narrowly. In fact, it is shown that a national leader has been assassinated
in nearly two out of every three years since 1950, and its impact on institution and intensity of
war is significant (Jones and Olken, 2009).
Despite these facts, what remains little understood in political economy is how such political
phenomenon shapes the composition of the political class. This is because a political segment
masterminding such an act often intends to induce a shift in power by terminating the ruler.
However, whether bringing an end to the King’s life ultimately delivers the plotter their desired
outcome depends on various unforeseen factors. To be more specific, it is observed on various
occasions that the impact of assassination is often neutralized by implementing a dynastic
succession which provides continuity to the ruling coalition. For example, after the
assassination of Mrs. Gandhi, her son Rajiv was immediately sworn in as the Prime Minister of
India making him the youngest person ever to occupy the post (Katherine, 2001). Similarly,
heirs of assassinated leaders are playing a pivotal role in the political decision making process
of various countries. Hence, this makes it interesting to investigate if political assassinations
contribute toward the emergence and endurance of political dynasties by allowing de facto
inheritance of political power.
It is relevant to mention that, identifying the effects of political assassination on the likelihood
that a leader will start or continue a political dynasty is both theoretically and empirically
difficult. More specifically, the relationship between political assassination and political
dynasties is ambiguous. That is, a political assassination may either facilitate or hinder the
chances that political dynasty will emerge. As a result, the overall impact of political
189
assassination (if there is any at all) depends on two opposing forces. I call this the martyrdom-
effect and the disruption-effect. The martyrdom-effect suggests that assassination can often
create a martyr out of the assassinated leader. This, in effect, can evolve into a political asset for
the victim’s family as it can facilitate a dynastic succession by drawing sympathy from key
political groups (such as voters) and etc. Conversely, political assassination can also hinder the
emergence of political dynasties if the overall force is dominated by the disruption-effect. This
effect notes that political assassination of a national leader might disrupt the potential dynastic
heir’s entry to political stream through inducing fear of a career in public life. Thus, as these
forces (martyrdom-effect & disruption-effect) are likely to trigger different behavioral pattern,
the overall relationship between political assassination and the emergence of political dynasties
remains a subject of empirical examination.
Consequently, in this paper, I compile a core data set on 442 leaders in 65 countries who held
office214 at least once between 1950 and 2005.To pinpoint a baseline list of national leader for
each country in post 1950 period, I use the Archigos dataset, v2.5 (Goemans et al, 2007), which
identifies the primary national leader for each country at each point in time from 1950 to 2004.
The purpose here is to see if leaders who died in assassination are associated with a higher
likelihood of starting a political dynasty. This strategy, however, fails to pinpoint a causal link
between the variables of interest. This is because the relationship between assassination and the
probability that a leader will start a political dynasty might suffer from unobserved individual or
family heterogeneity, since political leaders with influential family connections and charisma
(i.e. traits that can be conducive to dynasty building) can attract assassination attempts. This
makes it difficult to isolate empirically whether there is a casual impact of assassination on the
emergence of political dynasties or the results display a mere correlation.
To overcome this problem, the paper employs the empirical strategy and the data used by Jones
and Olken (2009) to identify the potential impact of assassination on institution and war. That
is, the paper exploits the inherent randomness in the success or failure of assassination attempts
to identify the effects of assassination. Moreover, the identification assumption is that, although
attempts on a national leader’s life may be driven by political circumstances or individual
ability, conditional on trying to kill a national leader, the failure or success of an assassination
214 By leaders I am referring to (I) Prime Ministers in Parliamentary regimes, (II) Presidents inPresidential system, (III) Chairman of the Party in communists states (IV) Kings in Monarchies, (V) Defacto leaders in special circumstances (Example- Omar Torrijos of Panama)

190
attempt can be treated as exogenous.215 In other words, pure chance has a role in determining if
a leader barely survived or died in an assassination attempt. To this end, this work uses data
from Jones and Olken (2009) on more than 190 national leaders with at least one assassination
attempt between 1875 and 2003, and it tries to pinpoint that conditional on an attempt taking
place, whether or not the outcome of the attempt (which is a product of chance) partially
determines the likelihood that a leader will start or continue a political dynasty. In that sense, it
examines (to an extent) if a negative exogenous shock to national leaders’ political life has
persistent effects by shaping posterior dynastic attainments.
The remainder of the paper is organized as follows. The next section gives an overview of the
literature on the causes and consequences of political assassination, and some studies
surrounding political dynasties. It also provides a brief discussion of the possible mechanisms
through which assassination can influence the prevalence of political dynasties. Section 5.3
discusses data and the empirical model that I have used initially for the analysis plus some base-
line results. Section 5.4 will present the identification strategy, results from the regressions, and
conduct robustness checks. In section 5.5, I explore some insightful extension to the overall
analysis. Lastly, section 5.6 concludes and provides direction for future work.
215 For Example, Hitler’s early departure from the beer hall in 1939, which may have saved his lifefrom the waiting bomb, came only because bad weather prevented him from flying back to Berlin,forcing him to leave early for a train (See Jones and Olken (2009) for more examples).
191
5.2 Literature Review and Theory
5.2.1 Literature Review
In 1957, Anthony Downs wrote a path-breaking book titledAn Economic Theory of Democracy
in which he argued that two parties competing in a perfectly competitive democracy will end up
proposing same policies in order to attain the highest prize of politics- the office. The outcome
is not only the Nash Equilibrium216 of the two-party game in a right-left policy world, but it
essentially means that if the incumbent party fails to form a government by winning an electoral
majority, the contending party will pursue the same program in the median of citizens’
preference distribution. If this proposition holds, then one can assert that there is no real
incentive for a killer to undertake an act of assassination if the sole purpose is to induce a shift
in policy by implementing the violent measure. This notion, however, merits little
acknowledgement if one carefully analyses important historical events where political
assassinations of national leaders have a fair share of representation. For example, famous
instances of assassination in ancient Europe are the murder of Athenian ruler Hipparox (514
BC), Great Phillip II of Macedonia (336 BC), Julius Caesar (44 BC), and a large number of
Roman Emperors.217 In more recent times, we witnessed the assassinations of four American
presidents (Abraham Lincoln 1865, James A. Garfield 1881, William McKinley 1901, and John
F. Kennedy 1963). Other notable political assassinations include the Spanish Prime Minister
Luis C. Blanco in 1973, the Egyptian president Anwar al-Sadat in 1981, the Indian PM Indira
Gandhi in 1984, the Swedish PM Olof Palme in 1986, former Indian PM Rajiv Gandhi 1991,
the Israeli Prime Minister Yitzhak Rabin in 1995, the Serbian PM ZoranDjindjic in 2003, and
former Pakistani PM Benazir Bhutto in 2007.218 Hence, the mentioned list of assassinated
216 Nash Equilibrium is a solution concept in game theory. A game is at Nash Equilibrium when eachplayer is choosing the strategy that maximizes her return, given the strategies of the other player in thegame. For a better understanding of the concept, please see: Nash (1951).
217 Just to name a few: Caligula (41 AD), Claudius (54 AD), Vitellius (69 AD), Galba (69 AD),Domitian (96 AD), Commodus (192 AD), Didius Julianus (193 AD), Geta (212), Caracalla (217 AD).For more information,please see http://www.allempires.com/article/index.php?q=fate_of_roman_emperors
218 This list does not include several other significant assassinations such as Mahatma Gandhi (1948),Martin Luther King (1968), Robert Kennedy (1968), Aldo Moro (1978) and Piet Fortuyn (2002).
192
leaders display that political assassinations219 of national leaders have occurred across space and
time.220Even so, in empirical literature very few systematic social-scientific analysis of political
assassination exists.
On the causes of political assassinations, few studies have emerged which examine the role of
domestic political systems. That is, the likelihood of political assassination can be explained in
part by the manner in which an executive rises to and remains in office, the amount of power he
or she wields, and the level of repressiveness with which he or she rules. In particular, weak
leaders with repressive nature in nondemocratic systems are at greater risk of assassination
(Iqbal and Zorn, 2006). In addition to this, it is also noted that extended institutional and
government quality significantly lowers the probability of politicians being killed (Frey and
Torgler, 2008). In contrast, assassinations are also explained by some scholars as a random act
of violence (Freedman, 1965; Slominich and Kantor, 1969; Wilkinson, 1970).
This paper, on the other hand, belongs to the stream in the literature that aims to understand the
political consequences of assassinations. But, before this is done it is important to understand
whether national leaders221 at all influence the course of events in a country’s political arena. On
this topic, professional historians and political thinkers have emerged with diverging opinions.
For example, Tolstoy’s historical theory perceives leaders as an insignificant entity, making the
historical figures look like mere ex-post justifications for events wholly beyond any individual’s
influence (Berlin, 1978). Karl Marx, in a relatively less dismissive approach, argues that leaders
must choose from a historically determined set of choices, which implies that they have much
less freedom to act than they think they do (Marx, 1852).
The “Great Man” hypothesis, alternatively, points out that the evolution of history is largely
determined by the idiosyncratic, causative influences of certain individuals. To be more
specific, Thomas Carlye coined this terminology while studying the French Revolution (Caryle,
219 Political Assassination is generally defined as the killing of a public figure for political reasons;although it is an assault against an individual, the motives surrounding an act of assassination arenecessarily of a political nature (Khatchadourian 1974).
220 The first significant noted assassination victim was probably the Egyptian pharaoh Amenemhet I,who founded the Twelfth Egyptian Dynasty in 1986 B.C. Amenemhet gained his power by an act ofusurpation, thus perhaps setting an example for a group of courtiers who conspired in his killing. Formore information, please see http://www.reshafim.org.il/ad/egypt/history12-17.htm
221 Throughout this article, the term national leader is used to refer to the individual in whomexecutive power rests; this might in actuality be a King, president, prime minister (in a parliamentarysystem), or other effective chief executive. This definition is thus similar to other contemporary studies(e.g., Jones and Olken 2009; Goemans, Gleditsch, and Chiozza 2007; Iqbal and Zorn 2006).
193
1837, 1859). Weber, along similar lines, saw a role for ‘charismatic’ leaders in specific
circumstances (Weber, 1947). That is, leaders can matter when national bureaucracy or social
norms allows them to make a difference.222
Hence, if leaders matter, then their assassination can contribute to important changes in a
country’s political sphere, and historical analysis of individual cases has often suggested that it
very much does. For example, the murder of Archduke Ferdinand in 1914 by a Serbian
nationalist is often described as the triggering event of World War I. Besides, the assassination
of President Habyarimana may have unleashed the Rwandan genocide, and historians have
argued that the Vietnam War was prolonged by the assassination of President John F Kennedy
(Halberstam, 1972; Jones, 2003). However, empirical analysis of this respective topic is still in
its embryonic form. This is not to say that political assassinations have gone unnoticed by social
scientists; in fact existing work on assassination of politicians takes on a wide range of form.
That is, in addition to historical analysis of the events themselves (Haykal1983; Posner 1993;
Raj 2001; De Witte 2001), systematic social-scientific analysis on the causal effect of political
assassination has tended to examine the social impact of assassination on public opinion
(Greenberg, 1964; Hartnett and Libby, 1972; Angermeyer and Matschinger, 1995; Esaiasson
and Granberg, 1996; Yuchtman-Yaar and Hermann, 1998; Raviv et al, 1998; Peri, 2000;
Kilingman, 2001), crime (Berkowitz and Macauley, 1971) and political socialization (Orren and
Peterson, 1967; Siegel, 1977).
In terms of empirical work, AsafZussman and Noah Zussman (2006) find evidence that
assassinations of senior members of Palestinian organizations affect the returns from Israeli
capital markets. Likewise, ZaryabIqbal and Christopher Zorn (2008) analyse all assassinations
of heads of state between 1952 and 1997, and state that assassinations’ effects on political
stability are greatest in systems in which the process of leadership succession is informal and
unregulated. Similarly, Benjamin F. Jones and Benjamin A. Olken (2009) used a new data set
of assassination attempt on all national leaders from 1875 to 2004 to identify the effect of
assassinations on institutions and war. Thus, this work belongs to the empirical literature on the
consequences of political assassination as it complements existing literature by trying to
understand whether such events contribute in shaping the composition of the political class by
222Some contemporary studies also allow national leaders to matter for facilitating economic growth(Jones and Olken 2005), but their actions are perceived to be constrained by institutions and electoralpressure (see, for example, Lee et al, 2004; Levitt, 1996; Poole and Rosenthal, 1984; Kalt and Zupan,1984).
194
facilitating the rise of political dynasties (Casseli and Morelli, 2004; Dal Bo and Di Tella 2003;
Dal Bo et al. 2009; Besley, 2005). On a broader note, this paper also speaks about the literature
investigating the consequences of political conflict (Collier and Hoeffler, 2002; Alesina and
Perotti, 1996; Alesina et al, 1996; Mauro, 1995; Barro, 1991).
The paper is also related to the literature on hereditary succession in political arena (Brownlee,
2007; Schatz, 2004; Thomson, 2002; Richter, 1990), and the self perpetuation of political
dynasties (Dal Bo et al, 2009; Hess, 1997; Brandes et al, 1997; Camp 1982). Besides, since
econometric analysis has primarily focused on the role of institutions and an individual
characteristics in explaining the variation in the endurance of political dynasties, the possible
influence of political events (such as assassination) in determining dynastic transmission of
political power is probably absorbed by the error term. Therefore, this studycontributes to the
existing literature on political dynasties by scrutinizing the role of political assassination of
national leaders in determining their emergence and continuing existence. Finally, the paper
also speaks about the role of chance in history. That is, in wide historical assessment, an idea
has emerged that small element of luck may have the capacity to change national political
system, and contribute to other outcomes (Merriman, 1985; Boorstin, 1995; Ferguson, 1999).
This paper also shares some resemblance with earlier work that points out the role of historical
chance in the initial shaping of institutions, whether it is the wind pattern (Feyrer and Sacerdote,
2006) or disease environment (Acemoglu et al. 2001).
5.2.2 Theory: Political Assassination or Political Asset?
Assassinations of national leaders have occurred throughout time in diverse political
landscapes. This makes it interesting to inquire how such events shape composition of the
political class, and what consequences it bears for the victim’s family. This is because it is
observed on numerous occasions that dynastic heirs of assassinated national leaders often play a
pivotal role in their country’s political arena. Besides, the impact of a political assassination is
also often neutralized by implementing an immediate dynastic succession so that the incumbent
coalition prevails.223 In contrary to these outcomes, successful assassinations of national leaders
have also sealed off the political life of many families.224
223 After the assassination Mrs Indira Gandhi, her son Mr Rajiv Gandhi was immediately sworn in asthe Prime Minister of India-making him the youngest person ever to occupy such post. This is also truefor Laurent Kabila of DR Congo, whose assassination also triggered an immediate dynastic succession.
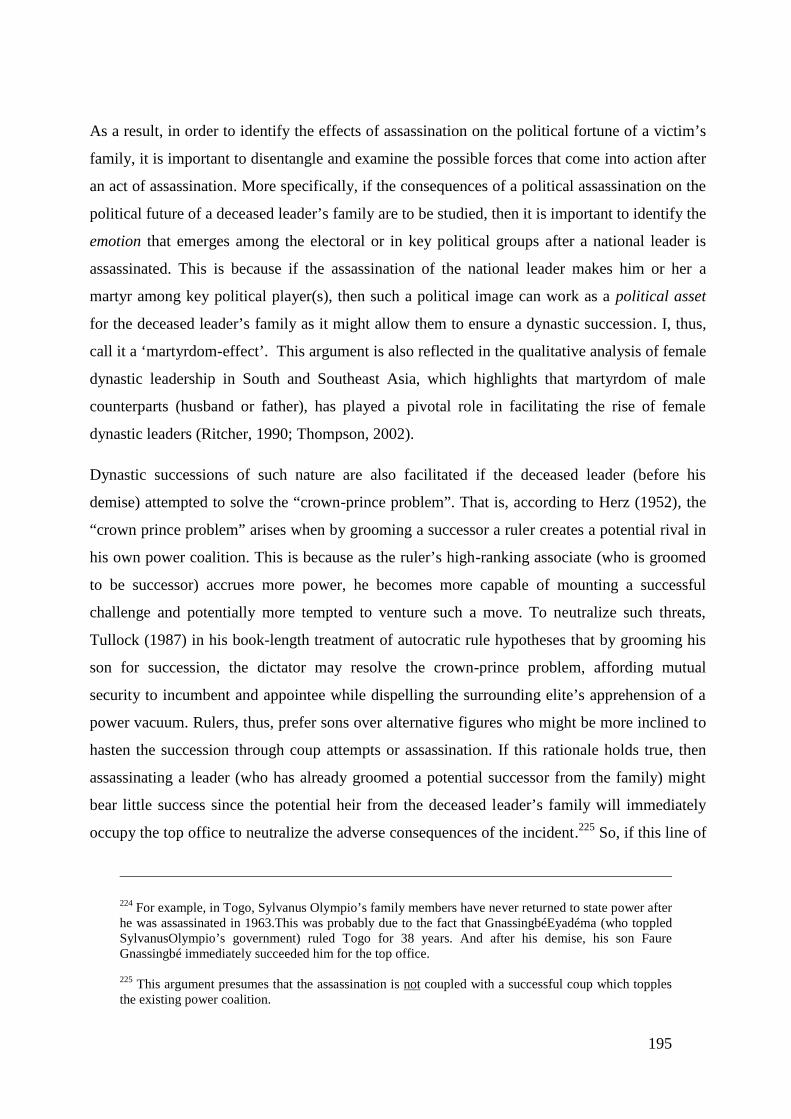
195
As a result, in order to identify the effects of assassination on the political fortune of a victim’s
family, it is important to disentangle and examine the possible forces that come into action after
an act of assassination. More specifically, if the consequences of a political assassination on the
political future of a deceased leader’s family are to be studied, then it is important to identify the
emotion that emerges among the electoral or in key political groups after a national leader is
assassinated. This is because if the assassination of the national leader makes him or her a
martyr among key political player(s), then such a political image can work as a political asset
for the deceased leader’s family as it might allow them to ensure a dynastic succession. I, thus,
call it a ‘martyrdom-effect’. This argument is also reflected in the qualitative analysis of female
dynastic leadership in South and Southeast Asia, which highlights that martyrdom of male
counterparts (husband or father), has played a pivotal role in facilitating the rise of female
dynastic leaders (Ritcher, 1990; Thompson, 2002).
Dynastic successions of such nature are also facilitated if the deceased leader (before his
demise) attempted to solve the “crown-prince problem”. That is, according to Herz (1952), the
“crown prince problem” arises when by grooming a successor a ruler creates a potential rival in
his own power coalition. This is because as the ruler’s high-ranking associate (who is groomed
to be successor) accrues more power, he becomes more capable of mounting a successful
challenge and potentially more tempted to venture such a move. To neutralize such threats,
Tullock (1987) in his book-length treatment of autocratic rule hypotheses that by grooming his
son for succession, the dictator may resolve the crown-prince problem, affording mutual
security to incumbent and appointee while dispelling the surrounding elite’s apprehension of a
power vacuum. Rulers, thus, prefer sons over alternative figures who might be more inclined to
hasten the succession through coup attempts or assassination. If this rationale holds true, then
assassinating a leader (who has already groomed a potential successor from the family) might
bear little success since the potential heir from the deceased leader’s family will immediately
occupy the top office to neutralize the adverse consequences of the incident.225 So, if this line of
224 For example, in Togo, Sylvanus Olympio’s family members have never returned to state power afterhe was assassinated in 1963.This was probably due to the fact that GnassingbéEyadéma (who toppledSylvanusOlympio’s government) ruled Togo for 38 years. And after his demise, his son FaureGnassingbé immediately succeeded him for the top office.
225 This argument presumes that the assassination is not coupled with a successful coup which topplesthe existing power coalition.
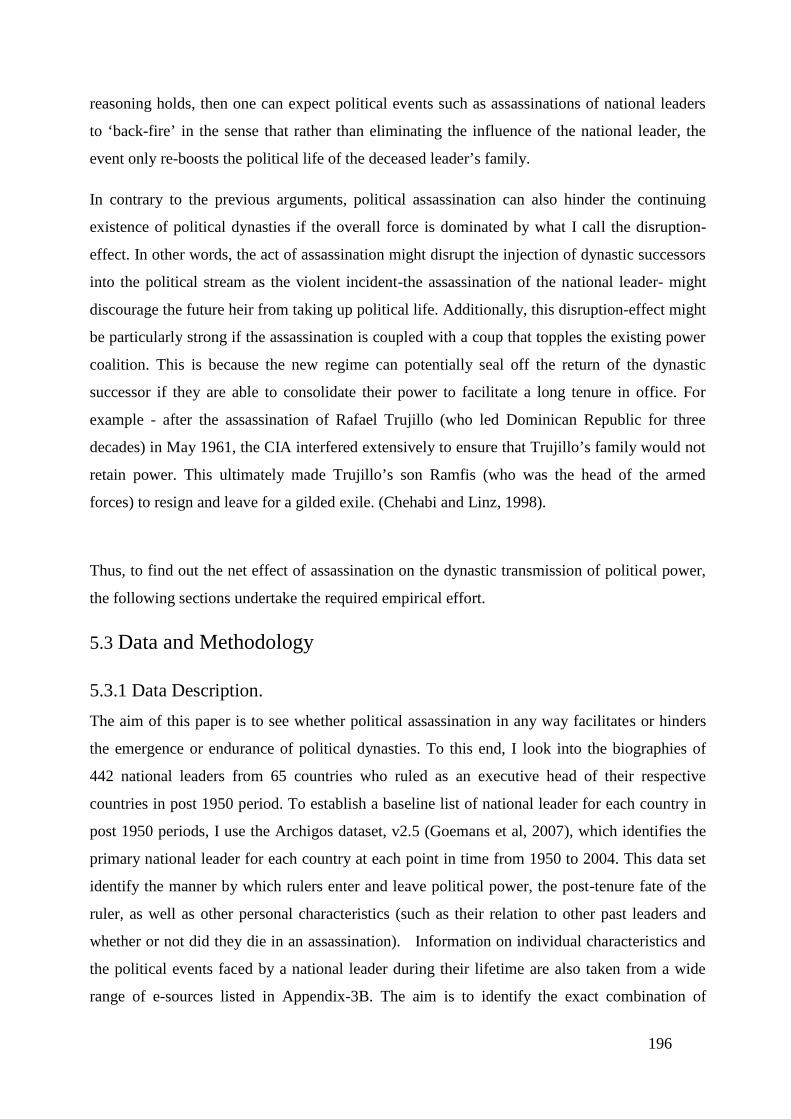
196
reasoning holds, then one can expect political events such as assassinations of national leaders
to ‘back-fire’ in the sense that rather than eliminating the influence of the national leader, the
event only re-boosts the political life of the deceased leader’s family.
In contrary to the previous arguments, political assassination can also hinder the continuing
existence of political dynasties if the overall force is dominated by what I call the disruption-
effect. In other words, the act of assassination might disrupt the injection of dynastic successors
into the political stream as the violent incident-the assassination of the national leader- might
discourage the future heir from taking up political life. Additionally, this disruption-effect might
be particularly strong if the assassination is coupled with a coup that topples the existing power
coalition. This is because the new regime can potentially seal off the return of the dynastic
successor if they are able to consolidate their power to facilitate a long tenure in office. For
example - after the assassination of Rafael Trujillo (who led Dominican Republic for three
decades) in May 1961, the CIA interfered extensively to ensure that Trujillo’s family would not
retain power. This ultimately made Trujillo’s son Ramfis (who was the head of the armed
forces) to resign and leave for a gilded exile. (Chehabi and Linz, 1998).
Thus, to find out the net effect of assassination on the dynastic transmission of political power,
the following sections undertake the required empirical effort.
5.3 Data and Methodology
5.3.1 Data Description.
The aim of this paper is to see whether political assassination in any way facilitates or hinders
the emergence or endurance of political dynasties. To this end, I look into the biographies of
442 national leaders from 65 countries who ruled as an executive head of their respective
countries in post 1950 period. To establish a baseline list of national leader for each country in
post 1950 periods, I use the Archigos dataset, v2.5 (Goemans et al, 2007), which identifies the
primary national leader for each country at each point in time from 1950 to 2004. This data set
identify the manner by which rulers enter and leave political power, the post-tenure fate of the
ruler, as well as other personal characteristics (such as their relation to other past leaders and
whether or not did they die in an assassination). Information on individual characteristics and
the political events faced by a national leader during their lifetime are also taken from a wide
range of e-sources listed in Appendix-3B. The aim is to identify the exact combination of

197
individual characteristics and political events faced by a national leader during their lifetime that
facilitates the emergence of political dynasties. Figure-5.1 presents the spatial distribution of
dynastic226 leaders across various regions. It can be seen that most dynastic leaders are from
Asia (both South Asia and Rest of Asia), and no dynastic leaders are from the continent of
Australia. This is also true for the number of assassinated leaders, with the exception that no
national leaders (covered in the sample) from the region of Rest of Asia were assassinated.
To characterize political dynasties, two indicator variables are created. Pre-Relative and Post-
Relative.227 The former is equal to one whenever a national leader had a relative228 entering
office before he or she did, and zero otherwise. The latter is equal to one whenever a national
leader has a relative entering office afters he or she did, and zero otherwise. From Appendix
Table-A5, we can see roughly 13.5 % percentage of national leaders had a previous relative in
office (Pre-Relative=1), and 14.2 % had a posterior relative in office (Post-Relative =1). This
table also shows that approximately 6% of national leaders in the sample were assassinated,
which is measured by a dummy variable Assassinated.229 This variable is equal to one if the
leader (i) died in an assassination an zero, otherwise. To study other characteristics, the
following indicator variables are used. Long-Term is a dummy variable equal to one if a leader
cumulatively stayed in power for more than 10 years, and zero otherwise. Authoritarian is an
indicator variable equal to one if the national leader was a military dictator or a civilian premier
who ruled as a de facto ruler. Female is an indicator variable equal to one is the national leader
is a woman. First-President/PM is an indicator variable equal to one if the national leader is the
first president/prime-minister of his or her country. Toppled in Coup is an indicator variable
equal to one if the national leader was toppled in coup d’etat during his or her tenure.230War
226 A dynastic leader is an individual who belongs to a family which has at least two members whooccupied the office of the executive head of the state.
227 This method was previously employed by Dal Bo et al (2009) to see empirically whether selfperpetuation exists among political dynasties of United States Congress.
228 Anyone with a biological or social connection to the leader is considered a relative, For example-Wife, Brother, Son, Daughter, Cousin, Grandson, Son-in-Law, Brother-in-law, etc
229 A list of all assassinated leaders is provided in Box-5.1. Moreover, a list of all natural deaths oraccidents in office is displayed in Box-5.2 Note that the case of President Zia-ul-Huq of Pakistan iscoded as an accident, even though his death in a plane crash has raised suspicions of a possibleassassination. Furthermore, Jones and Olken (2005) also classified Zia-ul-Huq’s death as an accident intheir analysis of the question: do leader matter?
230 Information on coups are taken from the following source: http://www.jonathanmpowell.com/coup-detat-dataset.html
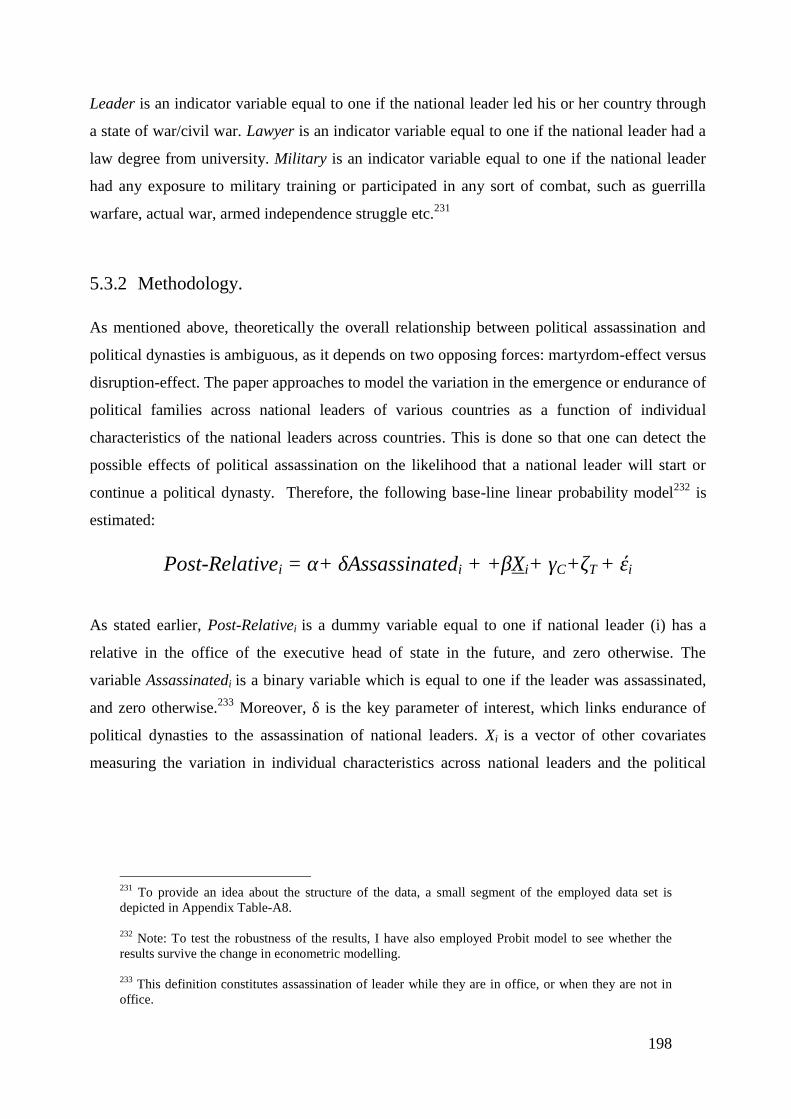
198
Leader is an indicator variable equal to one if the national leader led his or her country through
a state of war/civil war. Lawyer is an indicator variable equal to one if the national leader had a
law degree from university. Military is an indicator variable equal to one if the national leader
had any exposure to military training or participated in any sort of combat, such as guerrilla
warfare, actual war, armed independence struggle etc.231
5.3.2 Methodology.
As mentioned above, theoretically the overall relationship between political assassination and
political dynasties is ambiguous, as it depends on two opposing forces: martyrdom-effect versus
disruption-effect. The paper approaches to model the variation in the emergence or endurance of
political families across national leaders of various countries as a function of individual
characteristics of the national leaders across countries. This is done so that one can detect the
possible effects of political assassination on the likelihood that a national leader will start or
continue a political dynasty. Therefore, the following base-line linear probability model232 is
estimated:
Post-Relativei = α+ δAssassinatedi + +βXi+ γC+ζT + έi
As stated earlier, Post-Relativei is a dummy variable equal to one if national leader (i) has a
relative in the office of the executive head of state in the future, and zero otherwise. The
variable Assassinatedi is a binary variable which is equal to one if the leader was assassinated,
and zero otherwise.233 Moreover, δ is the key parameter of interest, which links endurance of
political dynasties to the assassination of national leaders. Xi is a vector of other covariates
measuring the variation in individual characteristics across national leaders and the political
231 To provide an idea about the structure of the data, a small segment of the employed data set isdepicted in Appendix Table-A8.
232 Note: To test the robustness of the results, I have also employed Probit model to see whether theresults survive the change in econometric modelling.
233 This definition constitutes assassination of leader while they are in office, or when they are not inoffice.
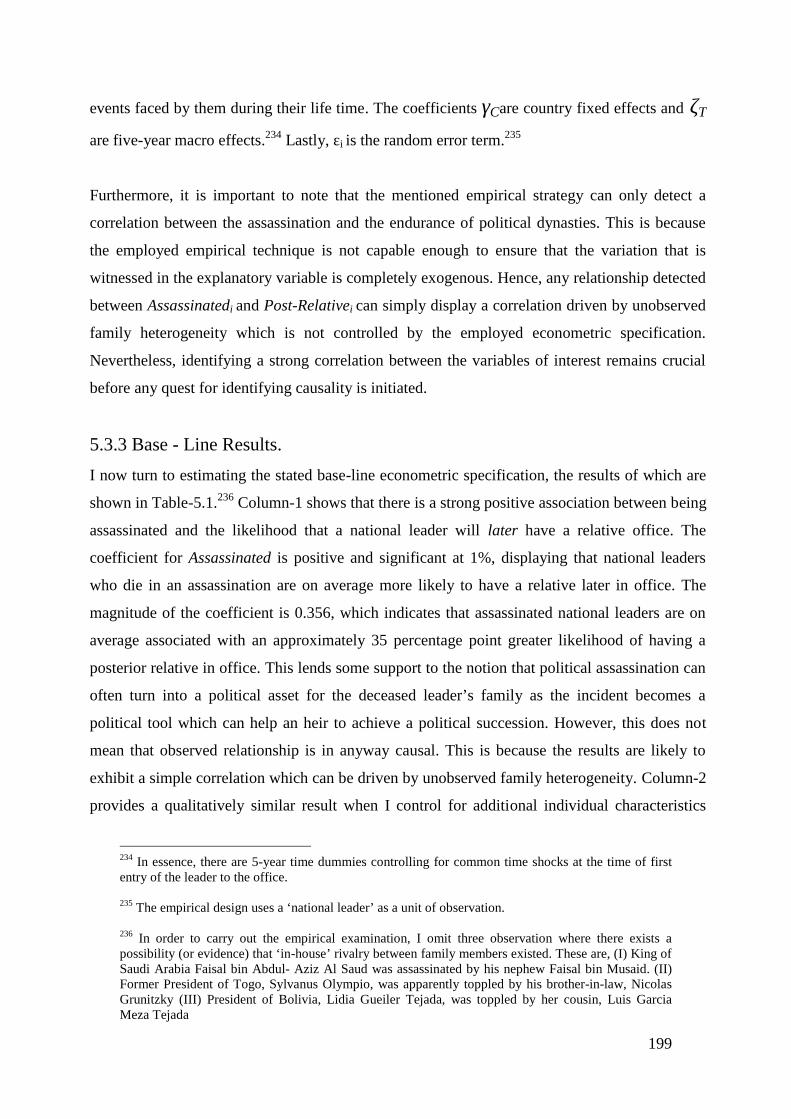
199
events faced by them during their life time. The coefficients γCare country fixed effects and ζT
are five-year macro effects.234 Lastly, εi is the random error term.235
Furthermore, it is important to note that the mentioned empirical strategy can only detect a
correlation between the assassination and the endurance of political dynasties. This is because
the employed empirical technique is not capable enough to ensure that the variation that is
witnessed in the explanatory variable is completely exogenous. Hence, any relationship detected
between Assassinatedi and Post-Relativei can simply display a correlation driven by unobserved
family heterogeneity which is not controlled by the employed econometric specification.
Nevertheless, identifying a strong correlation between the variables of interest remains crucial
before any quest for identifying causality is initiated.
5.3.3 Base - Line Results.
I now turn to estimating the stated base-line econometric specification, the results of which are
shown in Table-5.1.236 Column-1 shows that there is a strong positive association between being
assassinated and the likelihood that a national leader will later have a relative office. The
coefficient for Assassinated is positive and significant at 1%, displaying that national leaders
who die in an assassination are on average more likely to have a relative later in office. The
magnitude of the coefficient is 0.356, which indicates that assassinated national leaders are on
average associated with an approximately 35 percentage point greater likelihood of having a
posterior relative in office. This lends some support to the notion that political assassination can
often turn into a political asset for the deceased leader’s family as the incident becomes a
political tool which can help an heir to achieve a political succession. However, this does not
mean that observed relationship is in anyway causal. This is because the results are likely to
exhibit a simple correlation which can be driven by unobserved family heterogeneity. Column-2
provides a qualitatively similar result when I control for additional individual characteristics
234 In essence, there are 5-year time dummies controlling for common time shocks at the time of firstentry of the leader to the office.
235 The empirical design uses a ‘national leader’ as a unit of observation.
236 In order to carry out the empirical examination, I omit three observation where there exists apossibility (or evidence) that ‘in-house’ rivalry between family members existed. These are, (I) King ofSaudi Arabia Faisal bin Abdul- Aziz Al Saud was assassinated by his nephew Faisal bin Musaid. (II)Former President of Togo, Sylvanus Olympio, was apparently toppled by his brother-in-law, NicolasGrunitzky (III) President of Bolivia, Lidia Gueiler Tejada, was toppled by her cousin, Luis GarciaMeza Tejada
200
like age at entry, gender, first-President/PM, authoritarian etc. In column-3, the regression
incorporates 5-year specific time effects, which controls for common macro shocks to all
leaders entering office for the first time during each five year interval since 1950. Additionally,
in column-4, I control for country specific effects, and the coefficient for Assassinated remains
positive and significant at 1%,
On the role of other factors, the coefficient for Long-Term is positive and significant at 1% in
column-1 & 2, and 5% in column-3. This provides some support to earlier findings of Dal Bo et
al (2009), which suggests that holding power longer increases the possibility of having a relative
later in office. This result, however, fails to find significance in column-4 when I incorporate
country specific effects. A similar pattern also exists for dynastic descendants of national
leaders, indicating that dynastic national leaders (i.e Pre-Relative=1) are associated with a
higher likelihood of having a relative later in office. This finding is also in line with Dal Bo et al
(2009) which views that dynastic congressmen in U.S are more likely of continuing the political
dynasty by having a posterior relative in office.
In Table-5.2, I conduct some robustness checks to see the strength of the computed estimations.
In all regressions in Table-5.2, I limit the sample by only focusing on leaders with a cumulative
tenure of less than 10 years. This has two rationales. First, it helps address (to an extent) a
possible mechanical relationship between Assassinated and Long-Term, since it is conceptually
clear that assassinations will restrict the total tenure a leader might have availed.237Second, it
allows better comparability of the unit of observations as the regressions use data on leaders
with similar exposure to state power. From column-1, one can see that the coefficient for
Assassinated remains positive and significant at 1%. In column-2, I omit national leaders born
after 1930 to account for the censoring that occurs because national leaders at the end of the
sample period have less time to form their own political dynasties. With this changethe
coefficient for Assassinated remains positive, but it is no longer significant at 10%. Column-3
further addresses this concern by omitting leaders who are alive (as of 2010), since dynastic
successions at the highest political office are (by convention) more likely for leader who
237 In practice, however, this concern is mitigated by the fact that some national leaders are assassinatedwhen they are no longer in state power. For example, former President of Argentina Pedro Aramburuwas assassinated in 1970, even though his political career was virtually over after his de facto rule ofArgentina between 1955-1958. Besides, Appendix Table-A6 also shows that the simple correlationbetween Long-Term and Assassinated is not significant at 5%.
201
ceasesto exist.238 The relationship between the variables of interest is now significant as the
relevant coefficient is positive and significant at 5%. To address problems surrounding possible
correlation of error terms of national leaders from the same family, in column-4 I omit national
leaders who are dynastic descendants of past national leaders.239 The results, however, remain
qualitatively unchanged. Column-5 shows that similar estimations arises from a probit
specification. Lastly, in column-6, I control for additional individual characteristics like
professional affiliation (lawyer & military), previous public office experience, and war
leader.240 The results, nonetheless, remain similar.
Hence, a key message that one can infer from the base-line results is that leaders who are
assassinated are on average associated with a higher likelihood that they will have a posterior
relative in office. This message remains consistent for various econometric specification and
inclusion of important covariates, and it provides some support to the notion that assassinations
matter in shaping dynastic outcomes. As argued above, the computed results can be driven by
unobserved family or individual heterogeneity. To address this, the paperin the following
section uses the data set and the identification strategy of Jones and Olken (2009) to isolate the
possible causal role of assassination in determining dynastic attainments in political domain.
4. Identification Strategy.
4.1 Empirical Approach and Data
The econometric identification of a causal relationship between political assassination and the
likelihood that a national leader will have a posterior relative in office is complex. This is
because individual leaders with the qualities (or abilities) conducive to dynasty formation can
attract assassination attempts. This makes it difficult to find out empirically if there is a causal
impact of assassination on the emergence of political dynasties since the results may simply
display a mere correlation which can be driven by the unobserved family heterogeneity. To
overcome this problem, the paper adopts a simple empirical strategy employed by Jones and
238 This statement however is violated in many instances. For example, President George Bushendorsed his son’s George W Bush’s campaign for office. This is also true for President NestorKirchner who moved aside to pave way for his wife Cristina Kirchner, which ultimately resulted in animmediate dynastic succession at the highest political office of Argentina. For more information see:http://www.globalpost.com/dispatch/argentina/101027/nestor-kirchner-dies).
239 In some cases both are covered in the sample.
240 These variables are constructed after reviewing multiple e-sources listed in Appendix- 3B

202
Olken (2009) to identify the potential impact of assassination of national leaders on institution
and war. In other words, the paper exploits the inherent randomness in the success or failure of
assassination attempts to identify the effects of assassination on the probability that a leader will
start or continue a political dynasty.
Moreover, the identification assumption is that, although assassination attempts on a national
leader’s life may be an outcome of unobserved individual traits, conditional on trying to kill a
national leader, the failure or success of assassination attempt can be treated as plausibly
exogenous. For example, Jones and Olken (2009) argued that Hitler’s early departure from the
beer hall in 1939, which may have saved his life from the waiting bomb, came only because bad
weather prevented him from flying back to Berlin, forcing him to leave early for a train.
Similarly, Ronald Reagan only survived the assassination attempt on him in 1981 because the
bullet missed his heart by less than one inch (Reeves, 2005).Hence, if pure luck has some role
determining if a leader survives an assassination attempt or not, then one can test the impact of
dying in an assassination attempt in comparison to barely surviving an assassination attempt on
various socio-political phenomenon while controlling for relevant covariates. To this end, this
work uses data241 on a large number of publicly reported assassination attempts on national
leaders (previously used by Jones and Olken (2009)).More precisely, it tries to identify that
conditional on an attempt taking place, whether or not the outcome of the attempt partially
determines the likelihood that a national leader will later have a relative enter office. This new
data set has information on more than 190 national leaders from 93 countries in post 1875
period who had at least one serious assassination attempt on their life. Therefore, in the main
specification, I estimate an OLS regression of the form:242
= + + + +241 This data set on assassination attempts was constructed after consulting the archives of three majornewspaper: The New York Times, The Washington Post, and The Wall Street Journal. Excluded casesare coup d’etat in which the murder or attempted murder of the leader was conducted by an individualand or group in an attempt to seize power for themselves. ‘Uncovered plots” to assassinate nationalleaders are also excluded, limiting the data set to cases in which the would-be actually undertook theattempt. Furthermore, the Data set is also restricted to only “serious attempts” which is defined as thosecases in which the weapon (gun, bomb) was actually discharged, as opposed to cases where the attemptwas thwarted prior to the weapon being used. For more information on the data see Jones and Olken(2009).
242 To provide an idea about the structure of the data, a small segmented of the employed data set isdepicted in Appendix Table-A9.
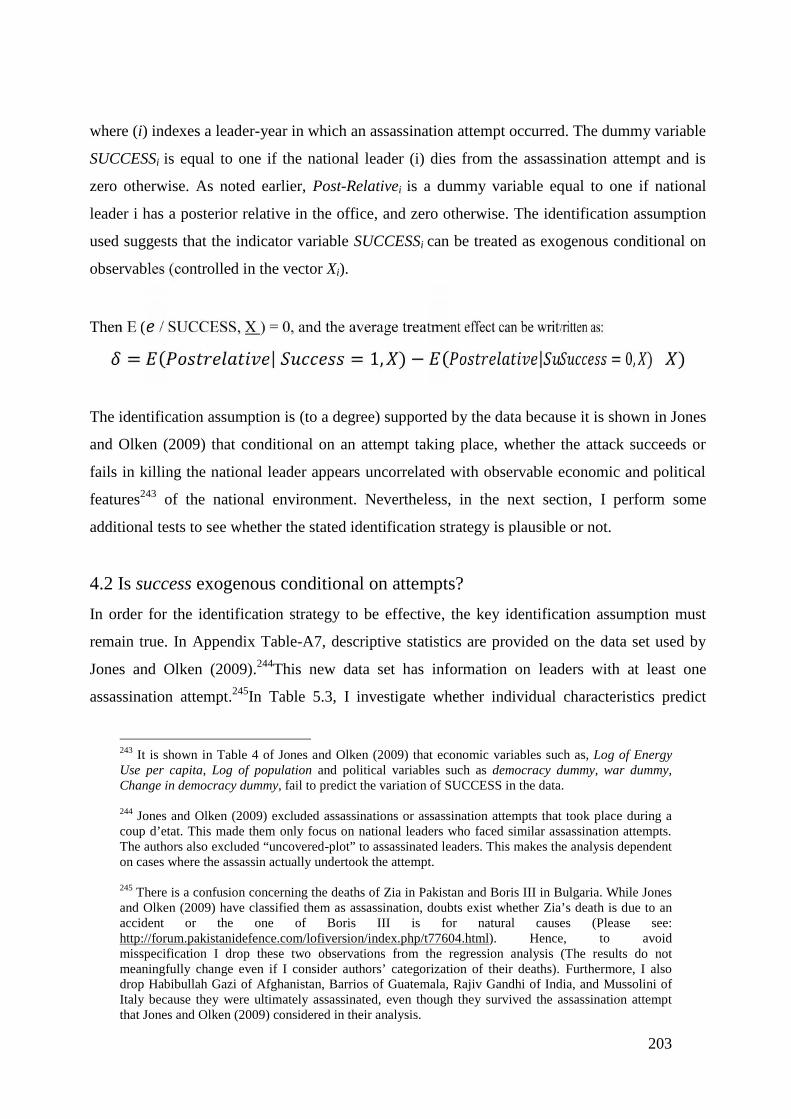
203
where (i) indexes a leader-year in which an assassination attempt occurred. The dummy variable
SUCCESSi is equal to one if the national leader (i) dies from the assassination attempt and is
zero otherwise. As noted earlier, Post-Relativei is a dummy variable equal to one if national
leader i has a posterior relative in the office, and zero otherwise. The identification assumption
used suggests that the indicator variable SUCCESSi can be treated as exogenous conditional on
observables (controlled in the vector Xi).
Then E ( / SUCCESS, X ) = 0, and the average treatment effect can be written as:= ( | = 1, ) − ( | = 0, )The identification assumption is (to a degree) supported by the data because it is shown in Jones
and Olken (2009) that conditional on an attempt taking place, whether the attack succeeds or
fails in killing the national leader appears uncorrelated with observable economic and political
features243 of the national environment. Nevertheless, in the next section, I perform some
additional tests to see whether the stated identification strategy is plausible or not.
4.2 Is success exogenous conditional on attempts?
In order for the identification strategy to be effective, the key identification assumption must
remain true. In Appendix Table-A7, descriptive statistics are provided on the data set used by
Jones and Olken (2009).244This new data set has information on leaders with at least one
assassination attempt.245In Table 5.3, I investigate whether individual characteristics predict
243 It is shown in Table 4 of Jones and Olken (2009) that economic variables such as, Log of EnergyUse per capita, Log of population and political variables such as democracy dummy, war dummy,Change in democracy dummy, fail to predict the variation of SUCCESS in the data.
244 Jones and Olken (2009) excluded assassinations or assassination attempts that took place during acoup d’etat. This made them only focus on national leaders who faced similar assassination attempts.The authors also excluded “uncovered-plot” to assassinated leaders. This makes the analysis dependenton cases where the assassin actually undertook the attempt.
245 There is a confusion concerning the deaths of Zia in Pakistan and Boris III in Bulgaria. While Jonesand Olken (2009) have classified them as assassination, doubts exist whether Zia’s death is due to anaccident or the one of Boris III is for natural causes (Please see:http://forum.pakistanidefence.com/lofiversion/index.php/t77604.html). Hence, to avoidmisspecification I drop these two observations from the regression analysis (The results do notmeaningfully change even if I consider authors’ categorization of their deaths). Furthermore, I alsodrop Habibullah Gazi of Afghanistan, Barrios of Guatemala, Rajiv Gandhi of India, and Mussolini ofItaly because they were ultimately assassinated, even though they survived the assassination attemptthat Jones and Olken (2009) considered in their analysis.

204
successful assassinations by comparing the mean of individual characteristics across leaders
who barely survived with those who barely died. The results show that the data is fairly
balanced between the two groups. More specifically, across the eleven individual
characteristics that I examined, the difference between successes and failures is statistically
significant for four variables. That is, leaders who have died in assassination attempt have a
significantly higher proportion of national leaders with a posterior relative in office. This
provides motivation for the principle question of the paper: does assassination of national
leaders facilitate the emergence of political dynasty? On the relative predictive capacity of other
factors, three other individual characteristics seem to matter (at 10%) in explaining success.
First, on average leaders who died in assassination attempts enter office relatively young. This
raises concern that veteran politicians (who enter the highest office relatively late in the career)
are more capable in handling their security. Second, national leaders who have led their
respective nations in times of war (i.e war leaders) are significantly less likely to die in an
assassination attempt. Third, leaders who have barely survived assassination attempts also
display a significantly greater number of cases where leaders are ultimately removed through a
coup de’etat.246 In table-5.4, the results from a linear probability model are presented that
considers all these variables simultaneously. Hence, I estimate the following equation:
SUCCESSi = α + βXi + δCi + γR+ζD + έi
where Xi is a vector that consists of a set of individual characteristics and Ci incorporates
country characteristics at the time of assassination attempts. Additionally, γR and ζD controls
for region and decade fixed effects, and εi is the random error term. Besides, from all four
columns one can see that Pre-Relativei has failed to attain significance at even 10%. This, to an
extent, suggests that dynastic relationship with previous leaders fails to explain the variation of
SUCCESSi in the data set, and it strengthens the idea that dying an assassination attempt is not
predicted by one’s dynastic heritage. In terms of individual characteristics, the variable WAR-
LEADER maintains a negative and significant coefficient (at 10%) in all four columns. This can
reflect that national leaders providing leadership during a state of war are better equipped to
survive assassination attempts through enhanced security measures. This makes the following
analysis control for this individual trait in all base-line specifications. On the role of other
246 There is a chance that this relationship (to an extent) is mechanical since leaders who surviveassassination attempts have a higher chance of facing coup d’etat.
205
individual characteristics, none of them attain significance in all four columns. It is important to
note, however, that the coefficient for LONG-TERM is negative and is significant at 10% in
column-4 (when I control for the type of weapon used in the assassination attempt). This
reflects our earlier concern that successful assassination in office has a mechanical relationship
with a leaders’ tenure in office. That is leader’s who die in assassination attempt are less likely
to have a cumulative tenure of 10 years or more. To address this issue in the basic specification,
I show results from restricted sample for leaders with different overall tenure length. Table-5.4
also shows that a country’s political climate at the time of the assassination attempt (reflected by
the Polity score of a country in the year of the assassination attempt) fails to predict successful
assassination. This is also true for economic conditions at time of the assassination attempt
(captured by the ENERGY variable) on a national leader from a given country.247In terms of the
usefulness of the overall model, in all four columns, the R- square varies from 0.10 to 0.28
which shows that the overall model weakly explains the variation of SUCCESSi in the
mentioned data set. This relative lack of predictability of SUCCESSi combined with the
comparability of leaders across two group helps suggest that the identification assumption
employed might be reasonable.
5.4.3 Are assassination attempts mutually exclusive?
So far, the paper presented results from multiple econometric specifications to see if various
observable individual and country characteristics predict the variation in success with sufficient
precision. The results, taken together, do pinpoint towards an element of luck in determining
whether assassination attempts fails or succeeds. In this section, I conduct some further test to
examine the strength of the employed identification assumption. To be more elaborative, the
identification strategy is dependent on the assumption that for a given assassination attempt –the
failure or success of the attempt is determined by an element of chance. Hence, in an ideal
scenario all assassination attempts must take place on all the leaders at the same point of time to
avoid any possible spillover effects. That is, an assassination attempt in period (t) in a given
country can determine the likelihood whether an assassination attempt in period (t+1) in the
same country will succeed or not by changing security concerns. If this is true, then it will
undermine the capacity of the employed identification strategy to find out causality. As a result,
247 To proxy this, Jones and Olken (2009) use energy consumption measure which comes fromCorrelates of War National Material Capabilities data set version 3.02 (J. David Singer et al 1979,1987). The authors use this measure because data on per capita income is not available for countriesprior to 1950.
206
to test if such spillover effects exist, I estimate the two linear probability model (detailed out
below) in panel A and B of Table-5.6.
SUCCESSi, c = α + µPrecedingAssassinationAttemptIj,c+ βXi + γR+ζD + έi
SUCCESSi, c = α + µPrecedingSuccessfulAssassinationj,c+ βXi + γR+ζD + έi
The first equation attempts to identify whether assassination attempt on a leader (j) in period t in
a given country (c) predicts successful assassination attempts on any other leader (i) in future
periods in the same country (c). The second equation also addresses a similar question by
investigating whether successful assassination attempts in a given period (t) on leader (j) in
country (c) predicts successful assassination in future periods in country (c) on any leader (j).
The results from table-5.5, however, provide limited evidence in support of any such spillover
effects. That is, from Panel-A we can see that preceding assassination attempt on a leader (j) in
a country (c) fails to predict SUCCESS for leader (i) in country (c) for future period (up to 10
years). Likewise, this finding remains consistent even when I control for region, decade and
weapon fixed effects. In Panel-B, the coefficient for PrecedingSuccessfulAssassinationj,c
remains negative in all four columns indicating that previous successful assassination attempts
in a given country is associated with a lower likelihood that future assassination attempts in the
same country will be successful. Even so, the coefficient for the variable of interest is only
significant for column-3 &4 at 5% and 1% when time period is lagged by five and ten years.
This makes me incorporate these factors in the regressions when I conduct robustness checks
for the base-line specifications.248To sum up, results from table 5.4 & 5.5 do direct us towards
the possibility that an element of luck is present in determining whether a leader dies in
assassination attempt or not once an assassination attempt takes place. Hence, in the next
section I address our key research question: does assassination determine de facto inheritance of
political power?
248 In Appendix Table-A10, I also check for the possibility whether the total number of assassinationattempt faced by a leader predicts success of the final assassination attempt on the respective leader.The results, however, do not suggest that a national leader’s overall experience with assassinationsattempts determines the success of the final assassination attempt on him or her. It is important tomention, nonetheless, that these regressions use the assumption that Jones and Olken (2009) produceall known assassination attempts on all national leaders in their data set.
207
5.4.4 Results and Robustness Checks
Till now, the paper examined the identification assumption that an element of luck is involved
in determining if a leader barely survives or dies in an assassination attempt. And, the
estimation is suggestive that conditional on trying to kill a national leader, the failure or success
of assassination attempt can be treated as plausibly exogenous. Hence, a causal relationship
between the key variables of interest can simply be inferred by estimating the linear probability
model of the form:
= + + + +If is significantly different than zero, then one can assert that there is a causal relationship
between the outcome of an assassination attempt and the probability that a leader will later have
a relative in office. The results are shown in Table-5.6. In column-1, we can see the variable
SUCCESSi, which is an indicator variable equal to one if the leader died in an assassination
attempt, has positive coefficient significant at 1%. This indicates that successful assassination
increases the likelihood that a national leader will later have a relative in office. The magnitude
of the coefficient is 0.16, which means that successful assassination attempts increase the
likelihood of an eventual dynastic transmission of power by 16 percentage point. In addition to
this, indicator variables Long-Term and Pre-relative have a significant positive coefficient
suggesting that leaders with a previous relative in office or a long tenure (more than 10 years)
are associated with a higher likelihood that they will later have a relative in office.
In column-2, variables proxying for various individual characteristics and political events faced
by a national leader are incorporated into the econometric model. It also controls for political
climate and economic conditions at the time of the assassination attempt (with the help of the
POLITY and ENERGY249variable). Moreover, we can see that the coefficient for SUCCESSi, is
both positive and significant at 1%. Besides, in line with the base-line results from Table-2,
being Authoritarian is significantly associated with a lower likelihood of having a posterior
relative in office. This is also true for national leaders with previous public office experience.
Column-3 tests this finding further by introducing decade fixed effects, and in column-4, I also
249 I have used energy consumption to proxy for per-capita income because data on per- capita incomeis not available for world sample prior to 1950. The energy consumption measure comes from theCorrelates of War National Material Capabilities data set version 3.02 (J. David Singer et al. 1972,1987). Jones and Olken (2009) have used the same variable to capture the role of economic conditions.
208
incorporate region fixed effects. Overall, the results provide support for the claim that
assassinations do, in fact, facilitate the emergence of political dynasties.
In Table-5.7, I undertake more robustness checks. Hence, in column-1, I omit national leaders
who are born after 1930 or are alive (as of 2010). This is done to account for the censoring that
occurs since national leaders at the end of the sample period have less time start their political
dynasties. I also include weapon fixed effects because the type of weapon used is an important
predictor of successful assassination attempt. The results, however, remain qualitatively similar.
Column-2, introduces additional restrictions by only focusing on national leader who had a
cumulative tenure of more than ten years. As noted earlier, this is done to minimize the
mechanical relationship that can appear between a national leader’s tenure in office and whether
or not he died or not in an assassination attempt. Plus the results show that the coefficient
increases in size, and is significant at 1%. On the other hand, the results from column-3 suggest
that this relationship is not significant at 10%, when I look at national leaders with less than 10
years of cumulative tenure.250 This, to an extent, might hint at the possibility that the outcome
of an assassination has a significantly higher marginal effect on the likelihood of dynastic
succession for national leaders with long-term exposure to political power.
In column-4, I limit the data set to leaders who have faced serious attempts (where the weapon
was actually used in the attempt to assassinate the leader). This is done to further strengthen the
identification assumption-that pure luck determines whether a national leader survives an
assassination attempt or not. Additionally, we can see that the results remain qualitatively
similar, even though the coefficient reduces in absolute size. Column-5 further factors in the
phenomenon that a national leader in the data had leaders before him assassinated. This is
analysed because the only factor that predicts SUCCESS strongly is preceding successful
assassinations (as noted in Table-5 (Panel B). Nonetheless, the coefficient for SUCCESS
remains positive and significant at 5%. Lastly, in column-6, I exclude national leaders with
previous relatives in office to avoid a possible correlation of error term for national leader from
the same family. This results in the loss of some observations, and the relevant coefficient
remains positive but not significant at 10%.251
250 This, however, is not in line with the findings that emerge from the base-line data set in Table-5.2.
251 In Appendix Table A11, I have conducted further robustness check by excluding leaders who arenot alive at present (and also since 1990). This however has no material effect on the result. Besides,
209
To conclude, the results from Table-5.6 and Table -5.7 do highlight that the outcome of an
assassination attempt matters for the emergence of political dynasties. Furthermore, when these
results are compared with the original base-line results from Table-5.1 &5.2 (which is based on
an alternative data set), it makes it prudent to suggest that there is a causal role of assassination
in increasing the likelihood that a national leader will start or continue a political
dynasty.Hence, in the following section, I extend this analysis to improve our understanding of
the process in which assassination can help shape the rise of political dynasties.
5.5 Extending the Analysis.
5.5.1 Heterogeneous nature of dynastic succession
So far, the paper investigated if political assassination determines the likelihood that a leader
will later have a relative in office. The results point out that assassination facilitates the
possibility that a national leader will start a political dynasty. In this section, the analysis
acknowledges that there is considerable heterogeneity in the political process that guides
dynastic successions in political realms. To be more elaborative, a close scrutiny of political
dynasties across countries suggests that namely two types of ‘dynastic-successions’ are possible
for dynastic leaders to emerge at the top political office. One, there can be an ‘immediate-
dynastic successions’ at the top political office. This is certainly true for Indira Gandhi and
Rajiv Gandhi in India. In more recent times, this also happened in Argentina, when Nestor
Kirchner voluntarily stepped aside to make way for his wife Cristina Kirchner. Two, dynastic
successions at the highest political office can also be ‘non-immediate’ in nature. For example,
Megawati Sukarnoputri became Indonesia’s first female President in 2001, which was
approximately three decades after her father’s (Sukarno) government was overthrown in a
military coup in 1970.
As a result, to account for this heterogeneity in the process that guides dynastic succession, I
introduce two dependent variables to see if successful assassinations drive certain kind of
dynastic political successions. In other words, I construct a binary dependent variable
‘immediate-dynastic-succession’, which is equal to one if a national leader (i) is succeeded in
office by his relative within a time span of one year, and zero otherwise. I also construct an
I have also dropped observations from India, Pakistan, Sri Lanka & Nepal to avoid the possibility thatthe results are driven by a ‘South-Asia’ phenomenon. The results, nonetheless, stay qualitativelysimilar.
210
alternative binary dependent variable ‘non-immediate succession’, which is equal to one if a
national leader (i) had a posterior relative in office but the succession took place after a time
interval of more than one year (and zero otherwise). I run separate regressions on these two
different dependent variables to see if successful assassinations drive any particular type of
dynastic successions. Moreover, from Table-5.8 (column-1 &2), it can be seen that outcome of
an assassination attempt particularly matters for explaining the frequencies of immediate
dynastic succession. In particular, the results from column-2 suggest that the outcome of an
assassination attempt is particularly strong for sample restricted to leaders with at least ten year
exposure to state power. On the other hand, the coefficients for SUCCESS in regressions in
column-3-6 are negative but not significant.
Consequently, when the results from column-1 to column-6 are taken together, it is then
pragmatic to suggest that the outcome of an assassination attempt influences the emergence of
political dynasties by increasing the likelihood of an immediate dynastic succession.252 This
also makes the result difficult to square with the ‘disruption-effect’ hypothesis that highlights
that potential successors of national leaders will opt out of political career when their political
family member is assassinated.
5.5.2 Is it a ‘Dying in Office’ Phenomenon?An important concern that still remains with the overall analysis is that the results are picking
up a ‘dying in office’ effect (which in most cases assassinations in office are associated with).
In other words, it is difficult to empirically verify whether the estimation strategy is isolating the
effects of successful assassination or is it simply highlighting the overall effect of dying in
office. Thus, to address this concern, I augment the used specification by adding an additional
control , which is an indicator variable if a national leader (i) in the
data set died in office due to natural causes, and zero otherwise. So, Table-5.9 reports the results
from the following regression:
= + + Ω + + +252 This conclusion is particularly true for national leaders in the data set used by Jones and Olken(2009). Note, given that this data set only focuses on national leaders with at least one assassinationattempt and it avoids leaders who faced assassination during coup d’ etat, it makes it difficult togeneralize this conclusion for all types of assassination.

211
If Ω is significantly not different from zero, then one can argue (to an extent) that results so far
pinpoint that assassination increases the likelihood that a leader will start or continue a political
dynasty (and not the general effect of dying in office). Unfortunately, the estimations from
column-1 and column-2 show that both & Ω are positive and significant at 1%, even though it
fails to attain significance when the sample is restricted to national leaders with less than ten
year exposure to state office. Hence, the results fail to rule out the possible influence of the
‘dying in office’ phenomenon. It must be stated, however, that this empirical concern is
somewhat mitigated if we acknowledge that the data set from Jones and Olken (2009) do not
consider assassination attempt on national leaders who are not in office. This limits the capacity
of the analysis to check the effect of assassination of national leaders, who are not in office, on
the possibility of them starting a political dynasty. Focusing on this is important because there
are numerous historical accounts of children or partners of slain opposition leaders who later
emerge as important political actors within their respective political domain, and often rise to
state power.253 Unfortunately, the nature of the data set does not allow us to pursue this issue
empirically, and with this caveat in sight, I proceed to the concluding remarks.
5.6 Conclusion and Caveats
This paper scrutinizes if political assassinations allows for the de facto inheritance of political
power by facilitating the likelihood that national leader will start a political dynasty. In
particular, the paper aims to see whether negative exogenous shocks to a national leader’s life
can have persistent effects by shaping posterior dynastic attainments. The study starts off by
acknowledging that the net effects of assassinations depend on two opposing forces:
martyrdom-effect versus the disruption-effect. This makes an empirical analysis instrumental in
understanding the consequences of political assassinations. To this end, the paper uses
biographical data on 442 national leaders across 65 countries who held office at least once in
post 1950 period. Moreover, the key message that emerges from our base-line data set is that
assassinated leaders are on average associated with a higher likelihood of starting or continuing
a political dynasty. This association is robust for multiple econometric specifications and
remains significant when various important covariates are controlled in the econometric model.
Hence, the initial results are difficult to reconcile with the ‘disruption-effect’ story, but provides
motivation for investigating if political assassinations are, in fact, a political asset for the
253For example, Corazon Aquino came to public life after her husband Senator Benigno Aquino Jr. wasassassinated in 1983, and later become the symbol of opposition struggle against the authoritarianregime of Marcos in Philippines. She subsequently became the first female President of Philippines.

212
deceased leader’s family as it facilitates their endurance in their country’ political landscape.
These results, however, merit no causal interpretation as the relationship may display a mere
correlation which can be driven by unobserved family heterogeneity.
Consequently, to identify whether there is a causal relationship between these two political
phenomena the paper borrows the data set of Jones and Olken (2009), which contains
information on more than 190 national leaders in post 1875 period who had at least one
assassination attempt on them. Furthermore, the identification assumption is that although
attempts on a national leader’s life may be driven by historical circumstances, conditional on
trying to kill a national leader, the failure or success of assassination attempts can be treated as
plausibly exogenous. This, therefore, helps to point out whether the outcome of an assassination
attempt (which is determined by pure luck) partially determines the likelihood that a national
leader will later have a relative in office. The results suggest that the identification assumption
finds some support from the data.
In addition to this, the estimations from table-5.6 &5.7 suggest that the outcome of an
assassination attempt facilitates the likelihood that national leader will start or continue a
political dynasty. Plus, this primary message remains consistent even when we control for
multiple covariates, and for multiple econometric specification (including the factors that
predict SUCCESS). The magnitude of the coefficient ranges between 0.12 and 0.17254 which
means successful assassination attempts increases the likelihood of an eventual dynastic
transmission of power by (at least 12) percentage points. In addition, the fact that the estimates
from both the data sets provides non-contradictory results, it makes it pragmatic to argue that
there is a causal role of assassination in facilitating posterior dynastic attainment of national
leaders. This paper also investigates if successful assassinations drive certain types of dynastic
succession, given that there is considerable heterogeneity in the process that guides political
dynasties. The findings show that successful assassination primarily increases the likelihood
that a national leader will be immediately succeeded by his or her relative. Apart from this, the
paper also point out that those national leaders with longer tenure is associated with a higher
likelihood that they will later have a relative in office. Besides, this is in line with the hypothesis
that political dynasties self-perpetuate, and empirical investigation of this issue on a sub-
national data does, in fact, support this claim (Dal Bo et al, 2009). The significance of factors –
254 This range is true for sample which is not restricted by a national leader’s cumulative tenure.
213
such as being authoritarian or first president- is sensitive to the econometric specification I
employ, or other covariates which are incorporated into the analysis.
In terms of limitations, the present study provides little effort to distinguish separately between
the impact of successes and failures of assassination attempt. That is, it might be natural to
presume that the successes- where the national leader dies- are more important drivers of the
result, but one can argue that failing to die in an assassination attempt can have important
implications if such phenomenon is associated with a lower likelihood that leader will later have
a relative in office. Although the present analysis has not rigorously dealt with this issue but it is
not unwise to intuitively infer that it is more likely that successful assassination attempts are the
major drivers of the computed results. This is because the primary message has support from
both the data set.255 Another important caveat is that the analysis has failed to rule out the
possibility that the overall results simply reflect a ‘dying in office’ phenomenon. This issue,
nonetheless, is somewhat mitigated if one observes the insights from qualitative literature which
notes that political assassination has been a triggering factor for the rise of female dynastic
leaders in Asia (Ritcher, 1990; Thompson, 2002).
Lastly, the structure and the empirical methodology of the overall analysis provide limited
scope for pinpointing the causal mechanisms underlying the relationship between political
assassinations and the existence of political families, and also shed no light on special cases
where relatives plot to kill a leader to achieve a transmission of power. More specifically,
future studies can examine the exact role of political parties in facilitating dynastic successions
at the highest political office, with a specific attention to the intra party norms and precedents
that are instrumental in guiding leadership succession. In addition, the results that assassinations
perpetuate dynastic rule is counterintuitive and it provokes deeper thought on the effectiveness
of violent strategies of displacing leaders
255 Note: The base line data set is not constrained by national leader with at least one assassinationattempt. Therefore, the strong correlation we witness in table-2 provides indication that assassinationmatters, and the likelihood that successful assassinations are the major driver of the results is higher.

214
0
5
10
15
20
25
Europe NorthAmerica
Dynastic 7
Assassinated 2
Figure- 5.1Spatial Distribution of Dynastic Leaders and Assassinated Leaders for 65
countries
214
NorthAmerica
SouthAmerica
SouthAsia
Rest ofAsia
MiddleEast
Rest ofAfrica
18 16 15 22 14
5 2 9 0 3
Figure- 5.1Spatial Distribution of Dynastic Leaders and Assassinated Leaders for 65
countries
214
Rest ofAfrica
Australia
13 0
6 0
Figure- 5.1Spatial Distribution of Dynastic Leaders and Assassinated Leaders for 65
countries
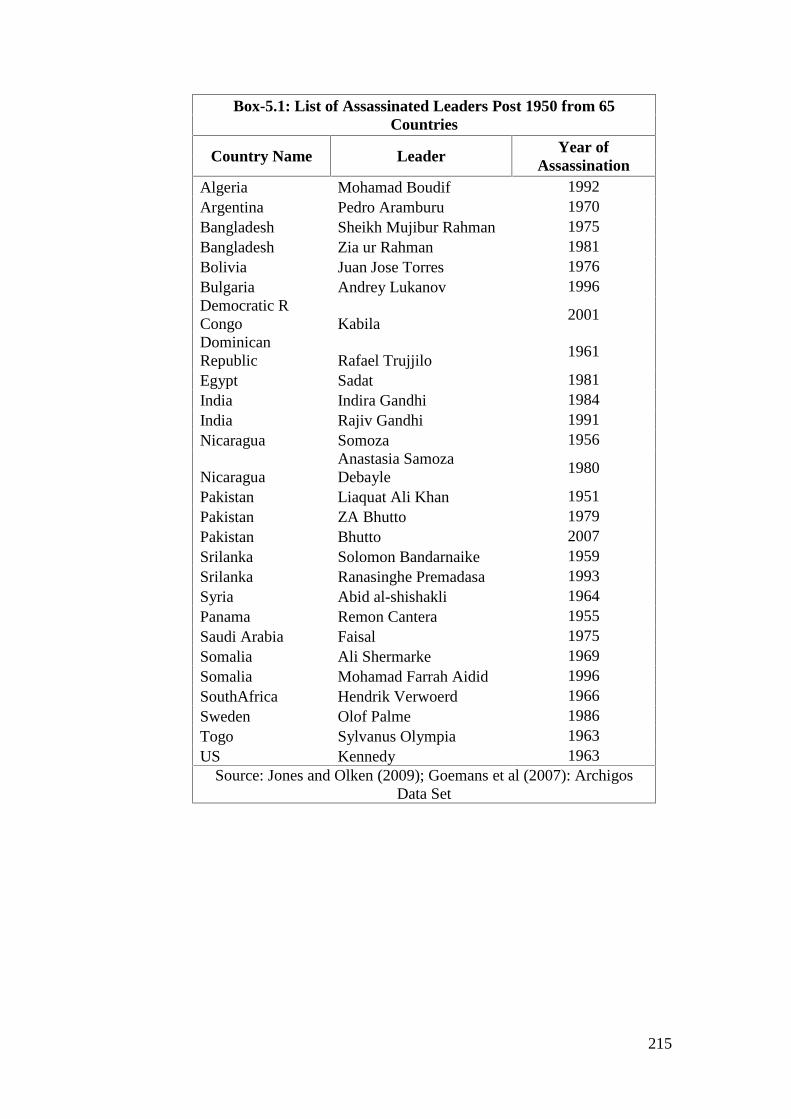
215
Box-5.1: List of Assassinated Leaders Post 1950 from 65Countries
Country Name Leader Year ofAssassination
Algeria Mohamad Boudif 1992Argentina Pedro Aramburu 1970Bangladesh Sheikh Mujibur Rahman 1975Bangladesh Zia ur Rahman 1981Bolivia Juan Jose Torres 1976Bulgaria Andrey Lukanov 1996Democratic RCongo Kabila
2001
DominicanRepublic Rafael Trujjilo
1961
Egypt Sadat 1981India Indira Gandhi 1984India Rajiv Gandhi 1991Nicaragua Somoza 1956
NicaraguaAnastasia SamozaDebayle
1980
Pakistan Liaquat Ali Khan 1951Pakistan ZA Bhutto 1979Pakistan Bhutto 2007Srilanka Solomon Bandarnaike 1959Srilanka Ranasinghe Premadasa 1993Syria Abid al-shishakli 1964Panama Remon Cantera 1955Saudi Arabia Faisal 1975Somalia Ali Shermarke 1969Somalia Mohamad Farrah Aidid 1996SouthAfrica Hendrik Verwoerd 1966Sweden Olof Palme 1986Togo Sylvanus Olympia 1963US Kennedy 1963
Source: Jones and Olken (2009); Goemans et al (2007): ArchigosData Set

216
Box- 5.2 Death in Office of National Leaders due to Natural Causes or Accidents Post1950
CountryName
Leader Year ofDeath
Cause
Algeria Houari Boumedienne 1978 Blood DisorderAngola Agostinho Neto 1979 Cancer of the PancreasArgentina JD Peron 1974 Heart and Kidney FailureAustralia Harold Holt 1967 DrownedBarbados John Adams 1985 No Cause announcedBarbados Errol Barrow 1987 Heart AttackBolivia Rene Barrientos 1969 Helicopter CrashChina Mao 1976 Parkinson's AilmentChina Deng Xiaoping 1997 Parkinson's AilmentEgypt Nasser 1970 Heart AttackGabon Leon Mba 1967 CancerGabon Omar Bongo 2009 CancerGuyana Forbes Burnham 1985 During SurgeryGuyana Cheddi Jagan 1997 Heart AttackHaiti Francois Duvalier 1971 Heart DiseaseIndia J Nehru 1964 StrokeIndia Lalbahadur Shastri 1966 Heart AttackIran Khomeini 1989 Following SurgeryIraq Abdul Salam Arif 1966 Helicopter CrashJapan Masayoshi Ohiro 1980 Heart AttackJapan Keizo Obuchi 2000 StrokeJordan Hussein Ibn Talal El-Hashim 1999 Non-Hodgkin's lymphomaKuwait Abdullah III 1965 Heart AttackKuwait Sabah III 1977 CancerKuwait Jaber III As-Sabah 2006 StrokeMalaysia Tun Abdul Razak 1976 LeukemiaNew Zealand Norman Kirk 1975 Heart attackNicaragua Luis Somoza Debayle 1967 Unknown conditionNorth Korea Kim 11-sung 1994 Heart AttackPakistan Jinnah 1948 Heart FailurePakistan Zia-ul-Huq 1988 Plane CrashPanama Omar Torrijos 1981 Plane CrashPhilippines Ramon Magasay 1957 Plane Crash
Source: Jones and Olken (2005); Goemans et al (2007): Archigos Data Set
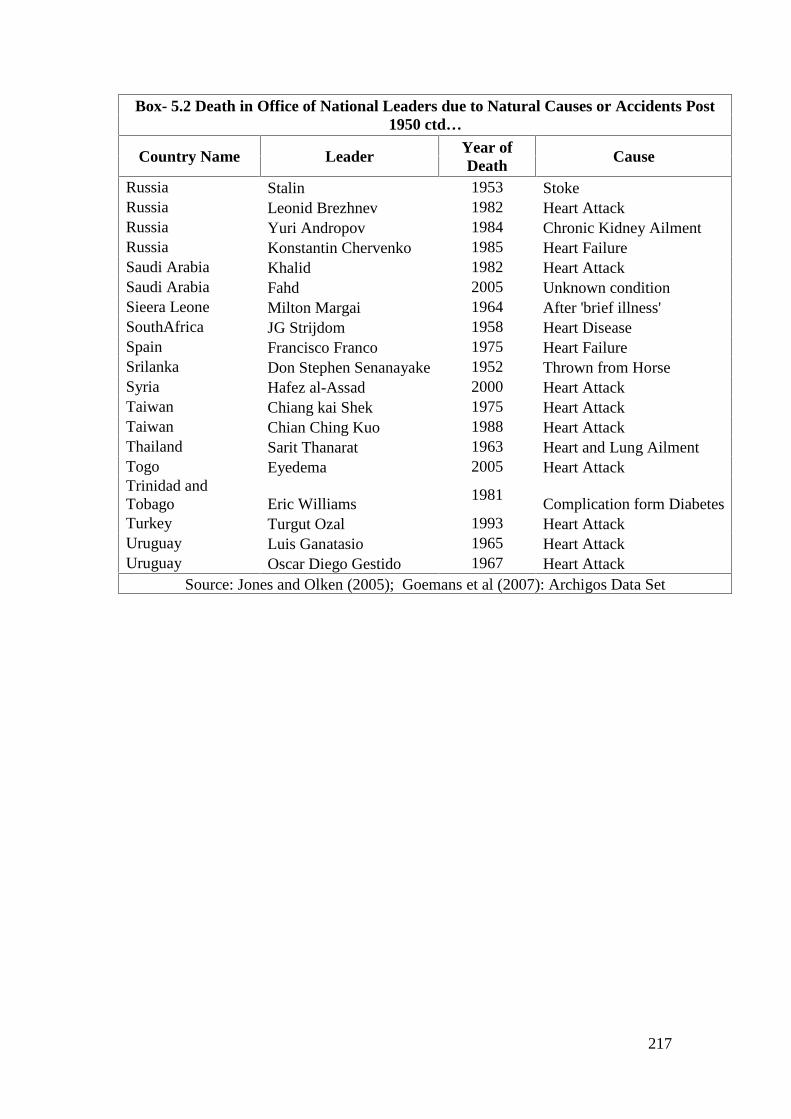
217
Box- 5.2 Death in Office of National Leaders due to Natural Causes or Accidents Post1950 ctd…
Country Name Leader Year ofDeath
Cause
Russia Stalin 1953 StokeRussia Leonid Brezhnev 1982 Heart AttackRussia Yuri Andropov 1984 Chronic Kidney AilmentRussia Konstantin Chervenko 1985 Heart FailureSaudi Arabia Khalid 1982 Heart AttackSaudi Arabia Fahd 2005 Unknown conditionSieera Leone Milton Margai 1964 After 'brief illness'SouthAfrica JG Strijdom 1958 Heart DiseaseSpain Francisco Franco 1975 Heart FailureSrilanka Don Stephen Senanayake 1952 Thrown from HorseSyria Hafez al-Assad 2000 Heart AttackTaiwan Chiang kai Shek 1975 Heart AttackTaiwan Chian Ching Kuo 1988 Heart AttackThailand Sarit Thanarat 1963 Heart and Lung AilmentTogo Eyedema 2005 Heart AttackTrinidad andTobago Eric Williams
1981Complication form Diabetes
Turkey Turgut Ozal 1993 Heart AttackUruguay Luis Ganatasio 1965 Heart AttackUruguay Oscar Diego Gestido 1967 Heart Attack
Source: Jones and Olken (2005); Goemans et al (2007): Archigos Data Set
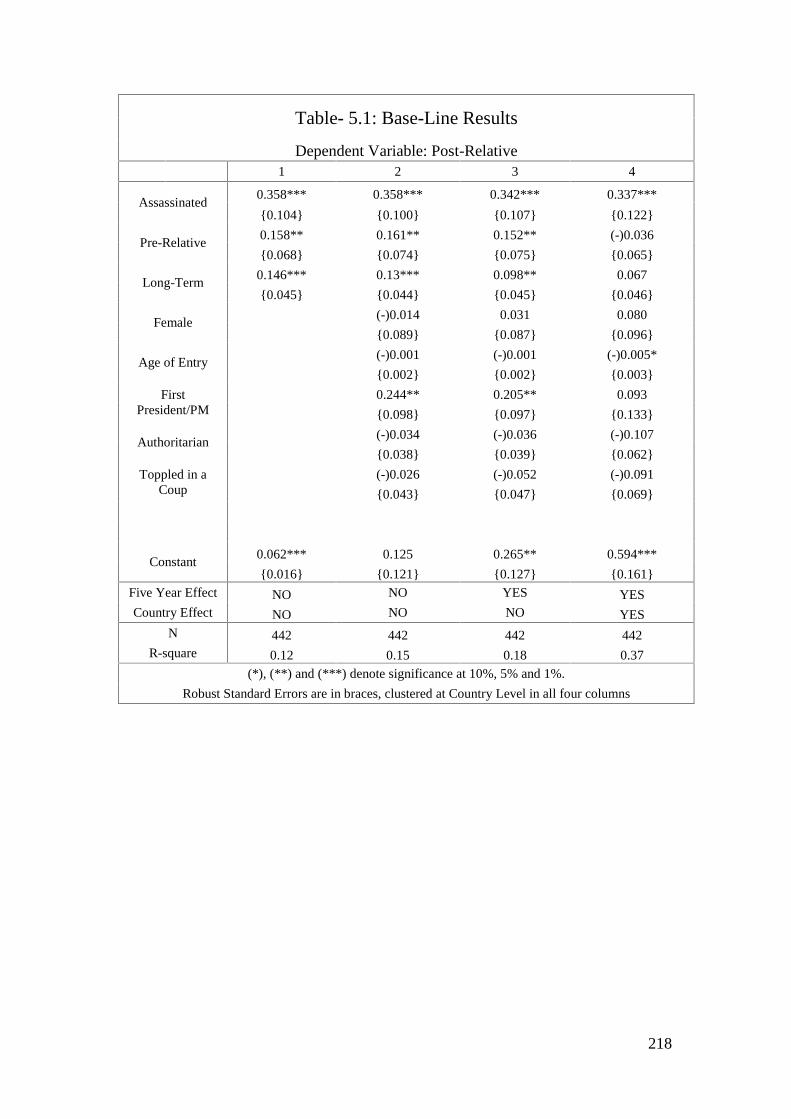
218
Table- 5.1: Base-Line Results
Dependent Variable: Post-Relative1 2 3 4
Assassinated0.358*** 0.358*** 0.342*** 0.337***
0.104 0.100 0.107 0.122
Pre-Relative0.158** 0.161** 0.152** (-)0.036
0.068 0.074 0.075 0.065
Long-Term0.146*** 0.13*** 0.098** 0.067
0.045 0.044 0.045 0.046
Female(-)0.014 0.031 0.080
0.089 0.087 0.096
Age of Entry(-)0.001 (-)0.001 (-)0.005*
0.002 0.002 0.003
FirstPresident/PM
0.244** 0.205** 0.093
0.098 0.097 0.133
Authoritarian(-)0.034 (-)0.036 (-)0.107
0.038 0.039 0.062
Toppled in aCoup
(-)0.026 (-)0.052 (-)0.091
0.043 0.047 0.069
Constant0.062*** 0.125 0.265** 0.594***
0.016 0.121 0.127 0.161Five Year Effect NO NO YES YESCountry Effect NO NO NO YES
N 442 442 442 442R-square 0.12 0.15 0.18 0.37
(*), (**) and (***) denote significance at 10%, 5% and 1%.
Robust Standard Errors are in braces, clustered at Country Level in all four columns
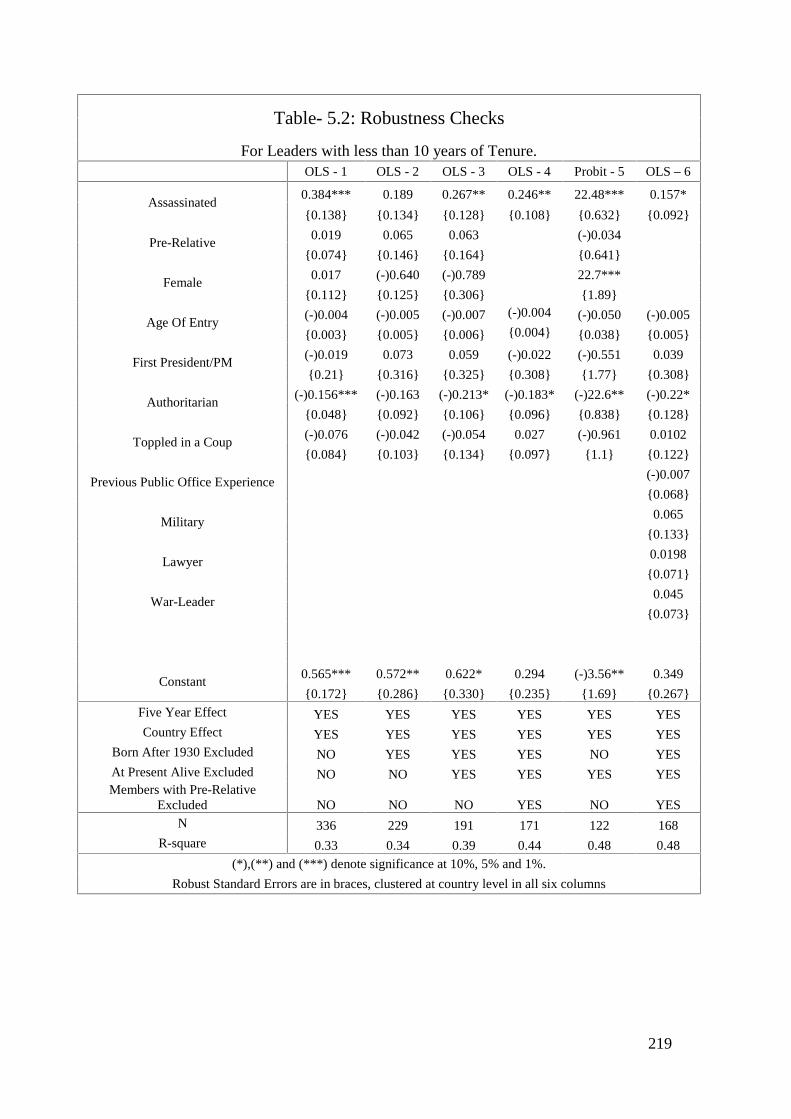
219
Table- 5.2: Robustness Checks
For Leaders with less than 10 years of Tenure.OLS - 1 OLS - 2 OLS - 3 OLS - 4 Probit - 5 OLS – 6
Assassinated0.384*** 0.189 0.267** 0.246** 22.48*** 0.157*
0.138 0.134 0.128 0.108 0.632 0.092
Pre-Relative0.019 0.065 0.063 (-)0.034
0.074 0.146 0.164 0.641
Female0.017 (-)0.640 (-)0.789 22.7***
0.112 0.125 0.306 1.89
Age Of Entry(-)0.004 (-)0.005 (-)0.007 (-)0.004 (-)0.050 (-)0.005
0.003 0.005 0.006 0.004 0.038 0.005
First President/PM(-)0.019 0.073 0.059 (-)0.022 (-)0.551 0.039
0.21 0.316 0.325 0.308 1.77 0.308
Authoritarian(-)0.156*** (-)0.163 (-)0.213* (-)0.183* (-)22.6** (-)0.22*
0.048 0.092 0.106 0.096 0.838 0.128
Toppled in a Coup(-)0.076 (-)0.042 (-)0.054 0.027 (-)0.961 0.0102
0.084 0.103 0.134 0.097 1.1 0.122
Previous Public Office Experience(-)0.007
0.068
Military0.065
0.133
Lawyer0.0198
0.071
War-Leader0.045
0.073
Constant0.565*** 0.572** 0.622* 0.294 (-)3.56** 0.349
0.172 0.286 0.330 0.235 1.69 0.267Five Year Effect YES YES YES YES YES YESCountry Effect YES YES YES YES YES YES
Born After 1930 Excluded NO YES YES YES NO YESAt Present Alive Excluded NO NO YES YES YES YESMembers with Pre-Relative
Excluded NO NO NO YES NO YESN 336 229 191 171 122 168
R-square 0.33 0.34 0.39 0.44 0.48 0.48(*),(**) and (***) denote significance at 10%, 5% and 1%.
Robust Standard Errors are in braces, clustered at country level in all six columns
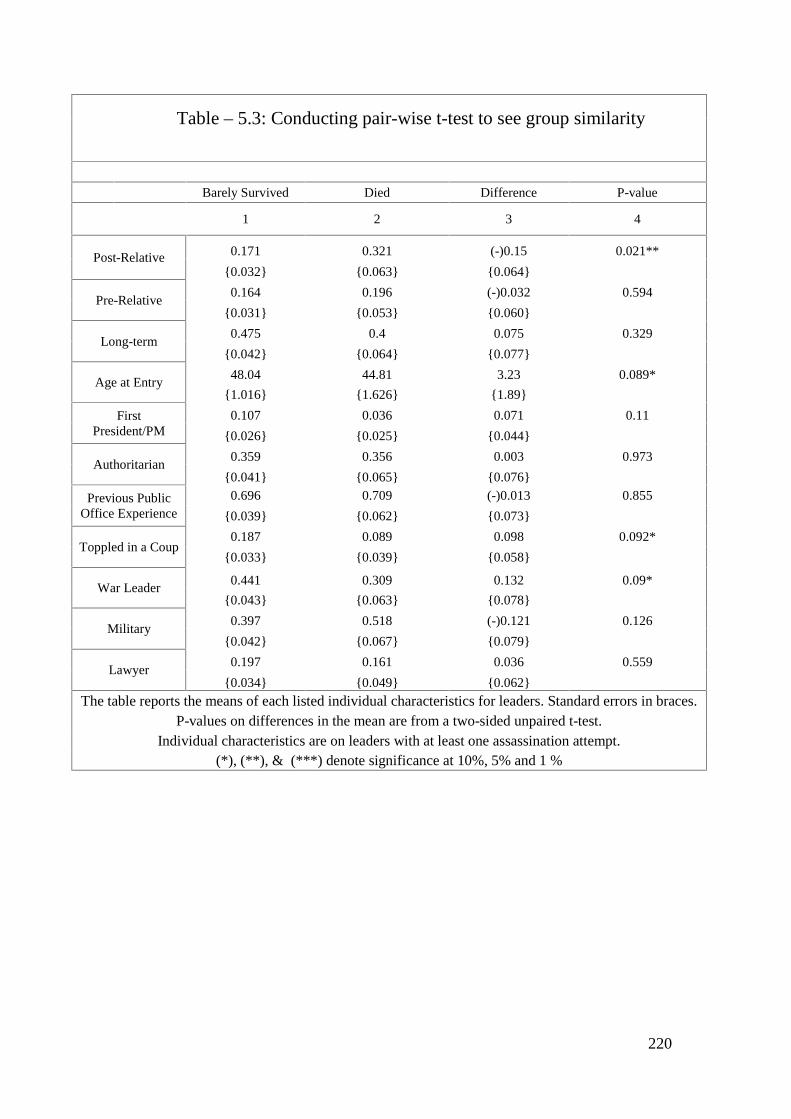
220
Table – 5.3: Conducting pair-wise t-test to see group similarity
Barely Survived Died Difference P-value
1 2 3 4
Post-Relative 0.171 0.321 (-)0.15 0.021**
0.032 0.063 0.064
Pre-Relative0.164 0.196 (-)0.032 0.594
0.031 0.053 0.060
Long-term0.475 0.4 0.075 0.329
0.042 0.064 0.077
Age at Entry48.04 44.81 3.23 0.089*
1.016 1.626 1.89
FirstPresident/PM
0.107 0.036 0.071 0.11
0.026 0.025 0.044
Authoritarian0.359 0.356 0.003 0.973
0.041 0.065 0.076
Previous PublicOffice Experience
0.696 0.709 (-)0.013 0.855
0.039 0.062 0.073
Toppled in a Coup0.187 0.089 0.098 0.092*
0.033 0.039 0.058
War Leader0.441 0.309 0.132 0.09*
0.043 0.063 0.078
Military0.397 0.518 (-)0.121 0.126
0.042 0.067 0.079
Lawyer0.197 0.161 0.036 0.559
0.034 0.049 0.062
The table reports the means of each listed individual characteristics for leaders. Standard errors in braces.P-values on differences in the mean are from a two-sided unpaired t-test.
Individual characteristics are on leaders with at least one assassination attempt.(*), (**), & (***) denote significance at 10%, 5% and 1 %
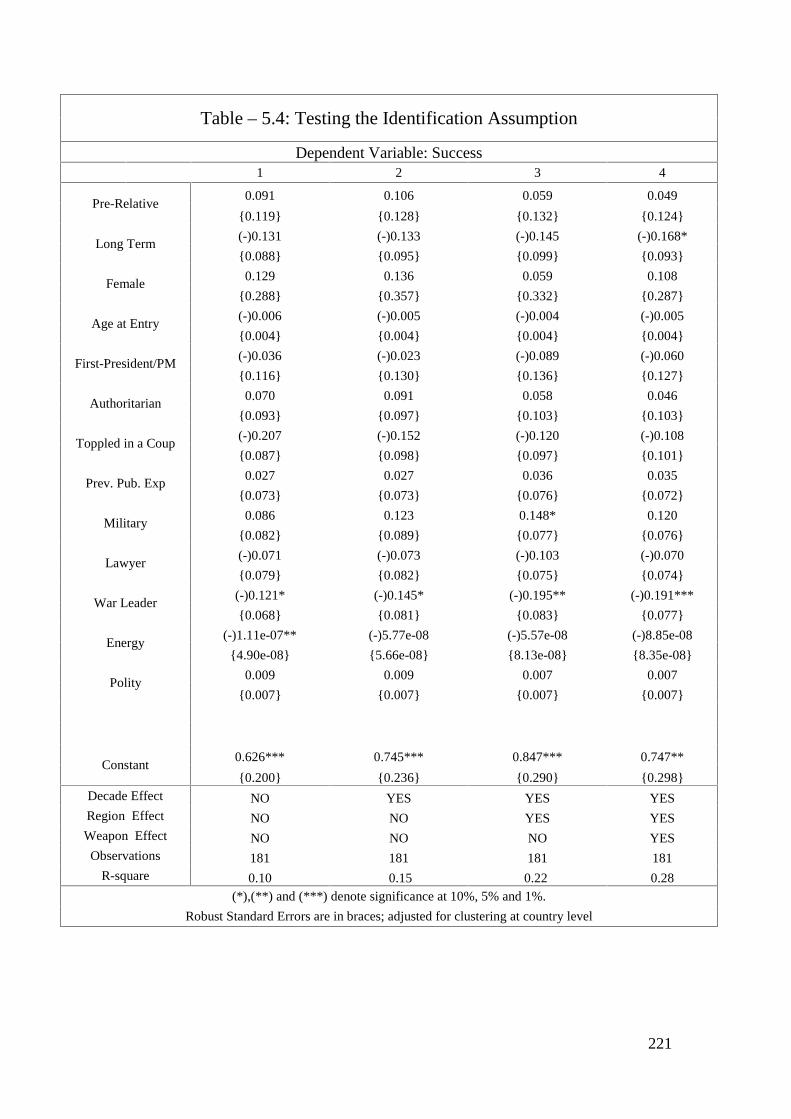
221
Table – 5.4: Testing the Identification Assumption
Dependent Variable: Success1 2 3 4
Pre-Relative0.091 0.106 0.059 0.049
0.119 0.128 0.132 0.124
Long Term(-)0.131 (-)0.133 (-)0.145 (-)0.168*
0.088 0.095 0.099 0.093
Female0.129 0.136 0.059 0.108
0.288 0.357 0.332 0.287
Age at Entry(-)0.006 (-)0.005 (-)0.004 (-)0.005
0.004 0.004 0.004 0.004
First-President/PM(-)0.036 (-)0.023 (-)0.089 (-)0.060
0.116 0.130 0.136 0.127
Authoritarian0.070 0.091 0.058 0.046
0.093 0.097 0.103 0.103
Toppled in a Coup(-)0.207 (-)0.152 (-)0.120 (-)0.108
0.087 0.098 0.097 0.101
Prev. Pub. Exp0.027 0.027 0.036 0.035
0.073 0.073 0.076 0.072
Military0.086 0.123 0.148* 0.120
0.082 0.089 0.077 0.076
Lawyer(-)0.071 (-)0.073 (-)0.103 (-)0.070
0.079 0.082 0.075 0.074
War Leader(-)0.121* (-)0.145* (-)0.195** (-)0.191***
0.068 0.081 0.083 0.077
Energy(-)1.11e-07** (-)5.77e-08 (-)5.57e-08 (-)8.85e-08
4.90e-08 5.66e-08 8.13e-08 8.35e-08
Polity0.009 0.009 0.007 0.007
0.007 0.007 0.007 0.007
Constant0.626*** 0.745*** 0.847*** 0.747**
0.200 0.236 0.290 0.298Decade Effect NO YES YES YESRegion Effect NO NO YES YESWeapon Effect NO NO NO YESObservations 181 181 181 181
R-square 0.10 0.15 0.22 0.28(*),(**) and (***) denote significance at 10%, 5% and 1%.
Robust Standard Errors are in braces; adjusted for clustering at country level
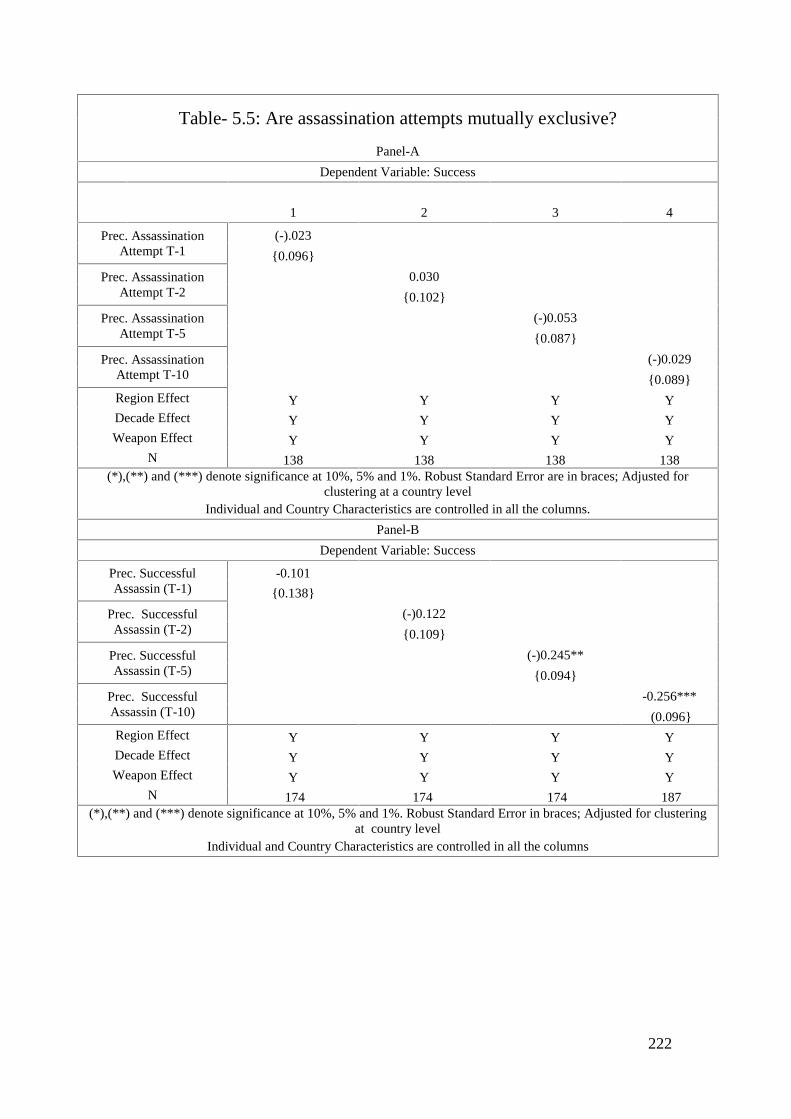
222
Table- 5.5: Are assassination attempts mutually exclusive?
Panel-A
Dependent Variable: Success
1 2 3 4
Prec. AssassinationAttempt T-1
(-).023
0.096
Prec. AssassinationAttempt T-2
0.030
0.102
Prec. AssassinationAttempt T-5
(-)0.053
0.087
Prec. AssassinationAttempt T-10
(-)0.029
0.089Region Effect Y Y Y YDecade Effect Y Y Y YWeapon Effect Y Y Y Y
N 138 138 138 138(*),(**) and (***) denote significance at 10%, 5% and 1%. Robust Standard Error are in braces; Adjusted for
clustering at a country levelIndividual and Country Characteristics are controlled in all the columns.
Panel-B
Dependent Variable: Success
Prec. SuccessfulAssassin (T-1)
-0.101
0.138
Prec. SuccessfulAssassin (T-2)
(-)0.122
0.109
Prec. SuccessfulAssassin (T-5)
(-)0.245**
0.094
Prec. SuccessfulAssassin (T-10)
-0.256***
(0.096Region Effect Y Y Y YDecade Effect Y Y Y YWeapon Effect Y Y Y Y
N 174 174 174 187(*),(**) and (***) denote significance at 10%, 5% and 1%. Robust Standard Error in braces; Adjusted for clustering
at country levelIndividual and Country Characteristics are controlled in all the columns
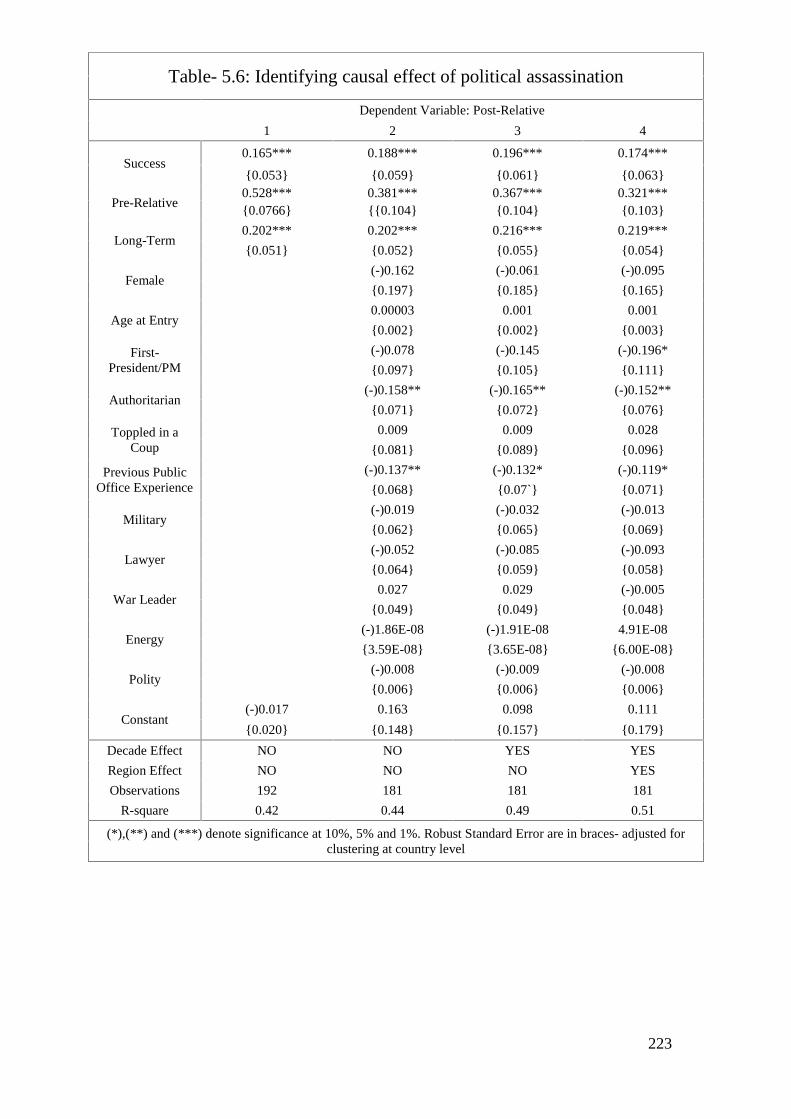
223
Table- 5.6: Identifying causal effect of political assassination
Dependent Variable: Post-Relative
1 2 3 4
Success0.165*** 0.188*** 0.196*** 0.174***
0.053 0.059 0.061 0.063
Pre-Relative0.528*** 0.381*** 0.367*** 0.321***0.0766 0.104 0.104 0.103
Long-Term0.202*** 0.202*** 0.216*** 0.219***
0.051 0.052 0.055 0.054
Female(-)0.162 (-)0.061 (-)0.095
0.197 0.185 0.165
Age at Entry0.00003 0.001 0.001
0.002 0.002 0.003
First-President/PM
(-)0.078 (-)0.145 (-)0.196*
0.097 0.105 0.111
Authoritarian(-)0.158** (-)0.165** (-)0.152**
0.071 0.072 0.076
Toppled in aCoup
0.009 0.009 0.028
0.081 0.089 0.096
Previous PublicOffice Experience
(-)0.137** (-)0.132* (-)0.119*
0.068 0.07` 0.071
Military(-)0.019 (-)0.032 (-)0.013
0.062 0.065 0.069
Lawyer(-)0.052 (-)0.085 (-)0.093
0.064 0.059 0.058
War Leader0.027 0.029 (-)0.005
0.049 0.049 0.048
Energy(-)1.86E-08 (-)1.91E-08 4.91E-08
3.59E-08 3.65E-08 6.00E-08
Polity(-)0.008 (-)0.009 (-)0.008
0.006 0.006 0.006
Constant(-)0.017 0.163 0.098 0.111
0.020 0.148 0.157 0.179
Decade Effect NO NO YES YES
Region Effect NO NO NO YES
Observations 192 181 181 181
R-square 0.42 0.44 0.49 0.51
(*),(**) and (***) denote significance at 10%, 5% and 1%. Robust Standard Error are in braces- adjusted forclustering at country level
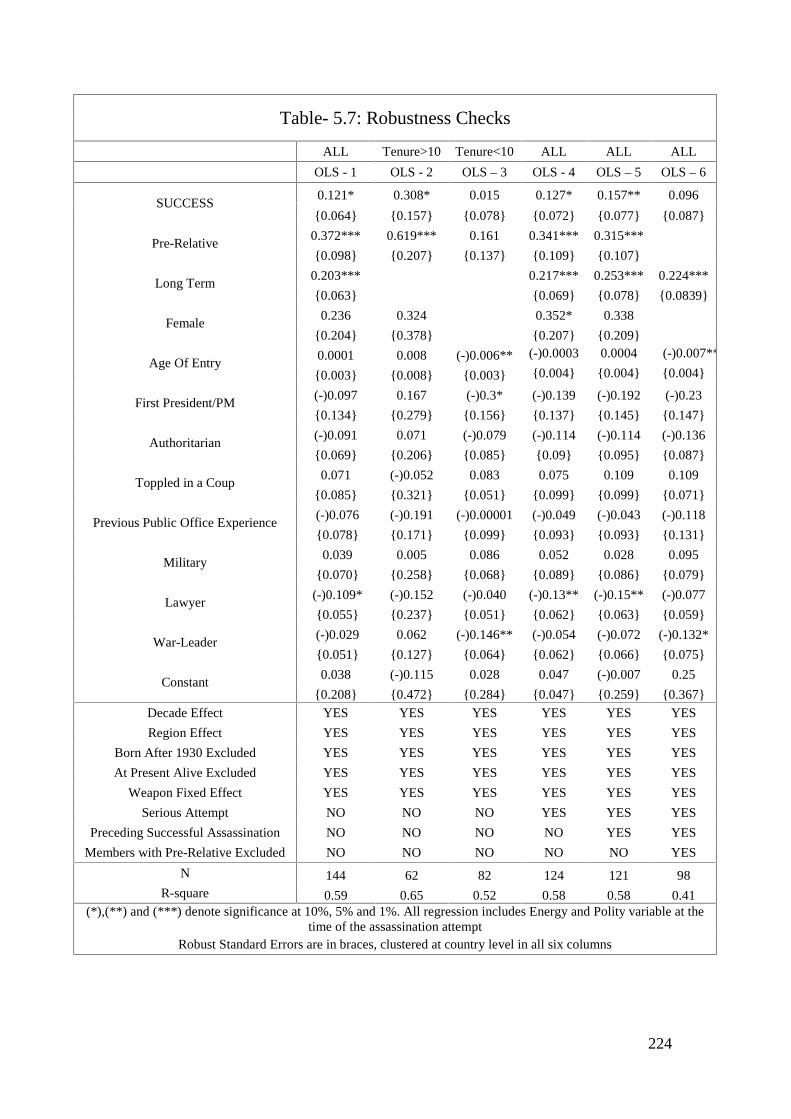
224
Table- 5.7: Robustness Checks
ALL Tenure>10 Tenure<10 ALL ALL ALL
OLS - 1 OLS - 2 OLS – 3 OLS - 4 OLS – 5 OLS – 6
SUCCESS0.121* 0.308* 0.015 0.127* 0.157** 0.096
0.064 0.157 0.078 0.072 0.077 0.087
Pre-Relative0.372*** 0.619*** 0.161 0.341*** 0.315***
0.098 0.207 0.137 0.109 0.107
Long Term0.203*** 0.217*** 0.253*** 0.224***
0.063 0.069 0.078 0.0839
Female0.236 0.324 0.352* 0.338
0.204 0.378 0.207 0.209
Age Of Entry0.0001 0.008 (-)0.006** (-)0.0003 0.0004 (-)0.007**
0.003 0.008 0.003 0.004 0.004 0.004
First President/PM(-)0.097 0.167 (-)0.3* (-)0.139 (-)0.192 (-)0.23
0.134 0.279 0.156 0.137 0.145 0.147
Authoritarian(-)0.091 0.071 (-)0.079 (-)0.114 (-)0.114 (-)0.136
0.069 0.206 0.085 0.09 0.095 0.087
Toppled in a Coup0.071 (-)0.052 0.083 0.075 0.109 0.109
0.085 0.321 0.051 0.099 0.099 0.071
Previous Public Office Experience(-)0.076 (-)0.191 (-)0.00001 (-)0.049 (-)0.043 (-)0.118
0.078 0.171 0.099 0.093 0.093 0.131
Military0.039 0.005 0.086 0.052 0.028 0.095
0.070 0.258 0.068 0.089 0.086 0.079
Lawyer(-)0.109* (-)0.152 (-)0.040 (-)0.13** (-)0.15** (-)0.077
0.055 0.237 0.051 0.062 0.063 0.059
War-Leader(-)0.029 0.062 (-)0.146** (-)0.054 (-)0.072 (-)0.132*
0.051 0.127 0.064 0.062 0.066 0.075
Constant0.038 (-)0.115 0.028 0.047 (-)0.007 0.25
0.208 0.472 0.284 0.047 0.259 0.367Decade Effect YES YES YES YES YES YES
Region Effect YES YES YES YES YES YES
Born After 1930 Excluded YES YES YES YES YES YES
At Present Alive Excluded YES YES YES YES YES YES
Weapon Fixed Effect YES YES YES YES YES YES
Serious Attempt NO NO NO YES YES YES
Preceding Successful Assassination NO NO NO NO YES YES
Members with Pre-Relative Excluded NO NO NO NO NO YES
N 144 62 82 124 121 98R-square 0.59 0.65 0.52 0.58 0.58 0.41
(*),(**) and (***) denote significance at 10%, 5% and 1%. All regression includes Energy and Polity variable at thetime of the assassination attempt
Robust Standard Errors are in braces, clustered at country level in all six columns
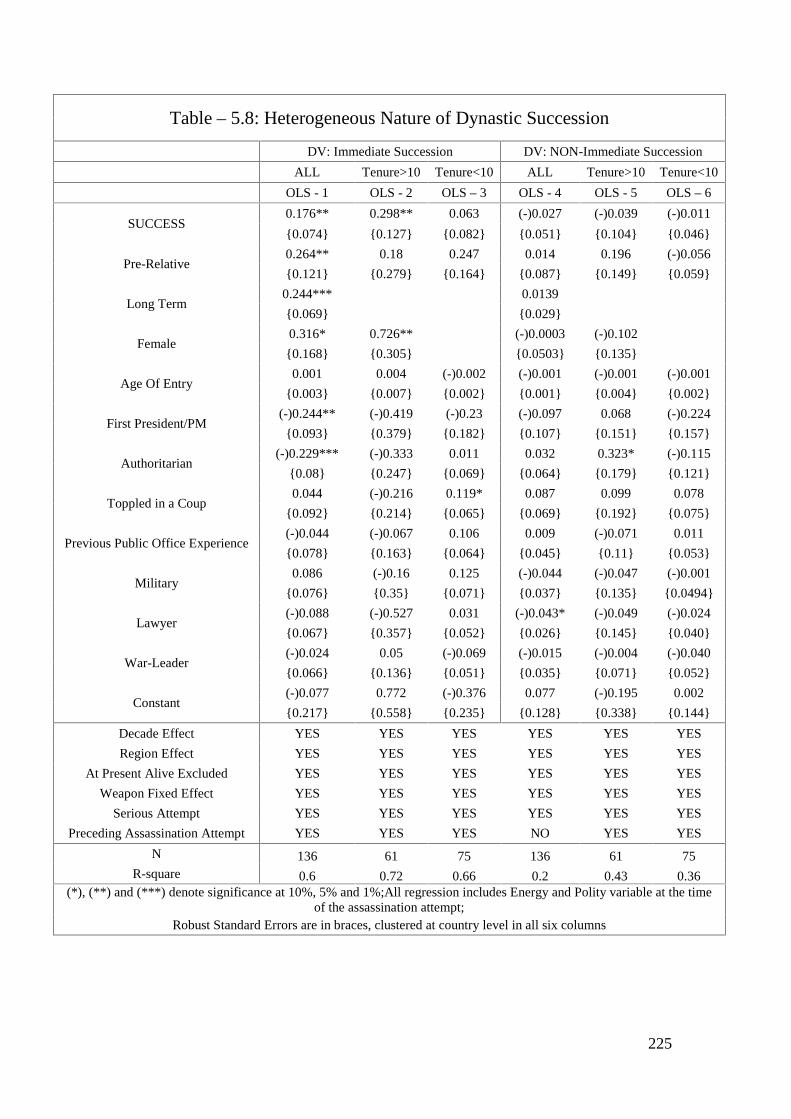
225
Table – 5.8: Heterogeneous Nature of Dynastic Succession
DV: Immediate Succession DV: NON-Immediate Succession
ALL Tenure>10 Tenure<10 ALL Tenure>10 Tenure<10
OLS - 1 OLS - 2 OLS – 3 OLS - 4 OLS - 5 OLS – 6
SUCCESS0.176** 0.298** 0.063 (-)0.027 (-)0.039 (-)0.011
0.074 0.127 0.082 0.051 0.104 0.046
Pre-Relative0.264** 0.18 0.247 0.014 0.196 (-)0.056
0.121 0.279 0.164 0.087 0.149 0.059
Long Term0.244*** 0.0139
0.069 0.029
Female0.316* 0.726** (-)0.0003 (-)0.102
0.168 0.305 0.0503 0.135
Age Of Entry0.001 0.004 (-)0.002 (-)0.001 (-)0.001 (-)0.001
0.003 0.007 0.002 0.001 0.004 0.002
First President/PM(-)0.244** (-)0.419 (-)0.23 (-)0.097 0.068 (-)0.224
0.093 0.379 0.182 0.107 0.151 0.157
Authoritarian(-)0.229*** (-)0.333 0.011 0.032 0.323* (-)0.115
0.08 0.247 0.069 0.064 0.179 0.121
Toppled in a Coup0.044 (-)0.216 0.119* 0.087 0.099 0.078
0.092 0.214 0.065 0.069 0.192 0.075
Previous Public Office Experience(-)0.044 (-)0.067 0.106 0.009 (-)0.071 0.011
0.078 0.163 0.064 0.045 0.11 0.053
Military0.086 (-)0.16 0.125 (-)0.044 (-)0.047 (-)0.001
0.076 0.35 0.071 0.037 0.135 0.0494
Lawyer(-)0.088 (-)0.527 0.031 (-)0.043* (-)0.049 (-)0.024
0.067 0.357 0.052 0.026 0.145 0.040
War-Leader(-)0.024 0.05 (-)0.069 (-)0.015 (-)0.004 (-)0.040
0.066 0.136 0.051 0.035 0.071 0.052
Constant(-)0.077 0.772 (-)0.376 0.077 (-)0.195 0.002
0.217 0.558 0.235 0.128 0.338 0.144
Decade Effect YES YES YES YES YES YES
Region Effect YES YES YES YES YES YES
At Present Alive Excluded YES YES YES YES YES YES
Weapon Fixed Effect YES YES YES YES YES YES
Serious Attempt YES YES YES YES YES YES
Preceding Assassination Attempt YES YES YES NO YES YES
N 136 61 75 136 61 75R-square 0.6 0.72 0.66 0.2 0.43 0.36
(*), (**) and (***) denote significance at 10%, 5% and 1%;All regression includes Energy and Polity variable at the timeof the assassination attempt;
Robust Standard Errors are in braces, clustered at country level in all six columns
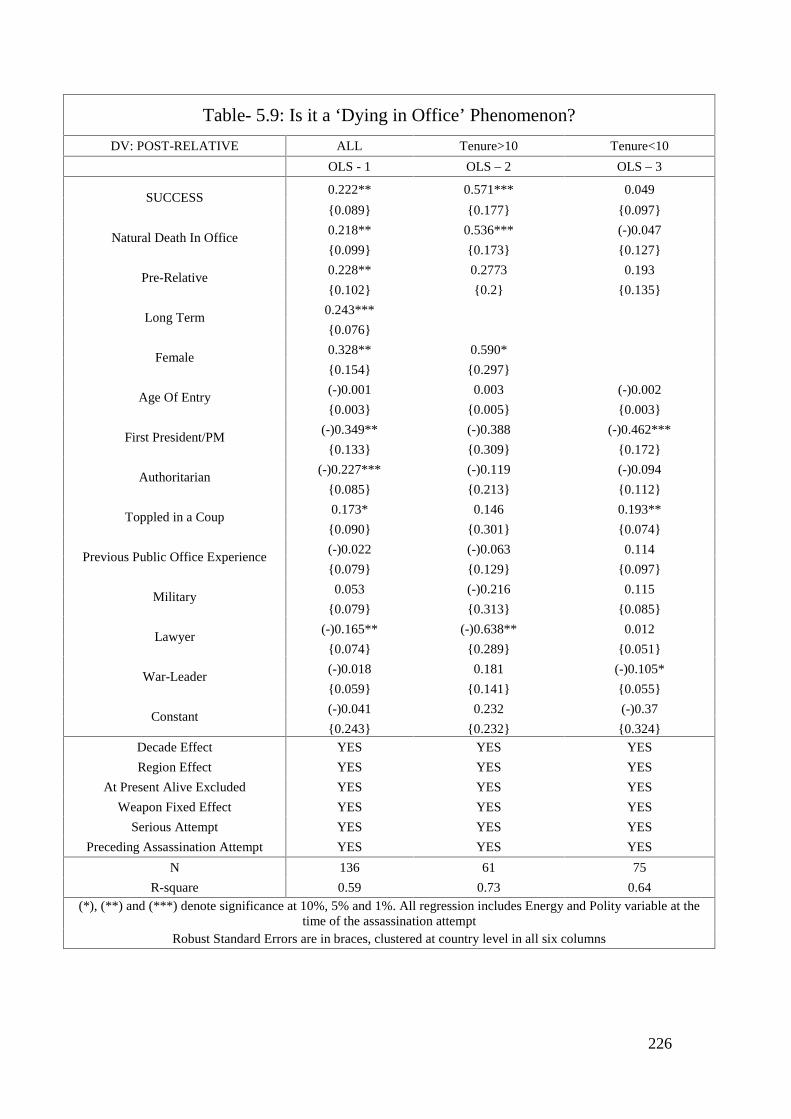
226
Table- 5.9: Is it a ‘Dying in Office’ Phenomenon?DV: POST-RELATIVE ALL Tenure>10 Tenure<10
OLS - 1 OLS – 2 OLS – 3
SUCCESS0.222** 0.571*** 0.049
0.089 0.177 0.097
Natural Death In Office0.218** 0.536*** (-)0.047
0.099 0.173 0.127
Pre-Relative0.228** 0.2773 0.193
0.102 0.2 0.135
Long Term0.243***
0.076
Female0.328** 0.590*
0.154 0.297
Age Of Entry(-)0.001 0.003 (-)0.002
0.003 0.005 0.003
First President/PM(-)0.349** (-)0.388 (-)0.462***
0.133 0.309 0.172
Authoritarian(-)0.227*** (-)0.119 (-)0.094
0.085 0.213 0.112
Toppled in a Coup0.173* 0.146 0.193**
0.090 0.301 0.074
Previous Public Office Experience(-)0.022 (-)0.063 0.114
0.079 0.129 0.097
Military0.053 (-)0.216 0.115
0.079 0.313 0.085
Lawyer(-)0.165** (-)0.638** 0.012
0.074 0.289 0.051
War-Leader(-)0.018 0.181 (-)0.105*
0.059 0.141 0.055
Constant(-)0.041 0.232 (-)0.37
0.243 0.232 0.324Decade Effect YES YES YES
Region Effect YES YES YES
At Present Alive Excluded YES YES YES
Weapon Fixed Effect YES YES YES
Serious Attempt YES YES YES
Preceding Assassination Attempt YES YES YES
N 136 61 75
R-square 0.59 0.73 0.64(*), (**) and (***) denote significance at 10%, 5% and 1%. All regression includes Energy and Polity variable at the
time of the assassination attemptRobust Standard Errors are in braces, clustered at country level in all six columns
227
6. Concluding Remarks
This thesis is a collection of four essays, each of which tries to understand issues concerning
political dynasties. In particular, the four papers collectively tried to offer insights on two
issues. One, the thesis provided empirical investigations on the role of ‘dynastic-identity’ in
influencing the behaviour of political actors. This, in essence, tried to recognize if dynastic
politicians behave any differently in comparison to non-dynastic politicians. Two, the
empirical examinations attempted to isolate whether political assassinations facilitate de facto
inheritance of political power by promoting dynastic successions. The aim, in this respect, was
to see if exogenous shocks to a leader’s political or physical fate can have persistent effects
through shaping the composition of political class. Overall, the papers that followed have
produced key insights on the two mentioned themes of the undertaken research. Hence, in the
following sections, I try to summarize the essential findings of the papers, and pinpoint the
manner in which they relate to general debate in the field.
6.1 Theme-1: What motivation governs the behaviour of dynastic
politicians?
The first two papers in chapter-2 and chapter-3 offered empirical investigations from both sub-
national and cross-country data sets. The principle aim here is to see whether dynastic identity
matters in influencing the behaviour of politicians. This is insightful for two main reasons.
First, in standard political economy analysis, there is an implicit assumption that politicians
behave in a similar manner under specific institutional arrangements, no matter who they are.
That is, most previous work overlooks the possibility that individual identity of politicians can
also determine their behaviour in democratic policy making process. In recent times, however,
some studies have emphasised on the role of leader-identity in explaining policy choices. For
example, Rehavi (2007) and Chattopadhyay and Duflo (2004) study how women
representation affects policy formulation in U.S and states in India. Similarly, Pande (2003)
notes that reservation for scheduled tribes and scheduled castes at the state level in India
influenced policies towards these groups. On the role of dynastic identity, Asaka et al (2010)
examine the behaviour of dynastic legislators in Japanese Diet between 1997 and 2007. It finds
that dynastic candidates enjoy a higher probability of winning and larger vote share in
comparison to non-dynastic candidates. Besides, it also pinpoints that fiscal transfers initiated
by dynastic politicians do not necessarily result in higher economic performance. Second,
political dynasties reflect inequality in the distribution of political power (Dal Bo et al, 2009).

228
This is because dynastic politicians inherit political capital in the form personal ties with a pre-
established donor network, important political figures, bureaucrats, military personalities from
their parents. Dynastic leaders are also likely to enjoy a “brand-name advantage”, which can
produce barriers to entry for potentially more competent entrants with no brand-names (Lott,
1987a & 1987b). Furthermore, such effects of brand-name were noted by Feinstein (2010),
which finds dynastic politicians receive an additional 4 percentage increase in the two-party
U.S congressional elections.
The mentioned literature raises multiple important queries, which will help improve our
understanding of political dynasties. Above all, the literature provides sufficient scope for
scrutinizing if dynasty-identity matters in determining the behaviour of politicians. It also
makes it insightful to investigate socio-economic phenomenon that are associated with the
prevalence of dynasty politics across different polities. Consequently, the first paper in chapter-
2 contributed to this general enquiry by focussing on the political profile of legislators
(dynastic and non-dynastic) in the 8th and 9th National Parliament of Bangladesh. The analysis
started off by discussing various incentives that can dominate the behaviour of dynastic
politicians. It stated that in order to understand the behaviour of dynastic leaders, it is useful to
assume that dynastic politicians have in their objective function an additional objective to
promote dynastic successions. This indicates that dynastic leaders entertain a desire that their
political dynasty endures in their respective political arenas. As a result, if this holds true, then
such concerns can trigger two opposing incentives: reputation-building versus stockpiling-
wealth.
In brief, reputation-building incentive implies that dynastic leaders will devote their career to
generate a positive reputation for their family, so that future dynastic successions have a
greater likelihood of being seen legitimate and acceptable due to their family's goodwill in the
political arena. In other words, if political positions are transferable from politicians to their
children, then the last period enforcement problem (i.e. how one restricts politicians from
shirking in the last period) is mitigated. Thus, if such mindset dominates the behaviour of
dynastic politicians, then it is likely that dynastic identity can influence relatively more benign
behaviour (or less shirking) from political actors. In contrast, stockpiling-wealth incentive
suggests that dynastic politicians will invest in generating financial and political capital so that
they can later use it to facilitate future dynastic successions. This means that dynastic
politicians will use their inherited political wealth to ensure that their dynasty endures, even if
229
they do not serve public interest. Subsequently, if this incentive determines the behaviour of
politicians to prominent dynasties, then one can expect dynastic leaders to shirk relatively more
in comparison to leaders with non-dynastic identity.
Therefore, to shed insights on the possible effects of these two opposing incentives, the paper
examined the parliamentary attendance records of legislators in the 8th and 9th National
Parliament of Bangladesh. It also studied the personal affidavits of all parliamentarians in the
9th National Parliament to note whether they have ever faced legal or corruption charges. The
idea here is to find out if a legislator’s dynastic identity had any explanatory power in
predicting the variation of such variables, once other relevant structural and individual
characteristics are controlled for. The base-line results indicate that dynastic parliamentarians
in 8th National Parliament on average have a lower level parliamentary attendance in
comparison to non-dynastic parliamentarians.256 Moreover, if the measure of attendance
reflects a legislator’s general involvement with everyday legislative business, then one can
argue that dynastic identity among parliamentarians in the 8th National Parliament is associated
with relatively more shirking. This also makes the finding difficult to square with the
reputation–building hypothesis, which suggests that dynastic legislators will devote their
professional life in generating a positive reputation for the family so that future dynastic
successions are seen legitimate.
On the other hand, the results from the regressions on the data set from 9th National Parliament
failed to find any significant relationship between a parliamentarian’s dynastic identity and his
or her attendance level.257 Additionally, no significant relationship was also detected between
a legislator’s dynastic identity and the likelihood that he or she had faced a legal or corruption
charge in their career. The factors that had some predictive capacity in explaining the variation
of such charges or attendance level are a legislator’s experience as a lawmaker or his or her
professional affiliation. To be more specific, the paper highlighted that legislators with more
experience (in both the 8th and the 9th National parliament) have lower levels of attendance.
This echoes the recent findings of Besley et al (2011) which finds a similar phenomenon in the
British House of Commons. The results also suggest that legislators of certain professions
256The relevant coefficient ranges between (-)0.066 to (-) 0.15, which suggests that dynasticparliamentarians on average have at least 6.5 percentage point lower attendance than non-dynasticparliamentarians.
257 The relevant coefficient does hint a negative relationship, which is in line with the results from thedata on the 9th National Parliament.
230
(military and lawyer) have a lower likelihood of having a criminal profile, even though
dynastic identity plays no role in explaining its variation.
Overall, the findings provide scope for making some important inferences. To start with, the
study offers some support to the notion that dynastic identity can matter in influencing the
behaviour of politicians. This is consistent with contemporary research that shows that the
types of politicians (or leader identity) play an instrumental role in the democratic political
process (Pande, 2003; Chattopadhyay and Duflo, 2004; Rehavi, 2007; Asaka et al, 2010;
Feinstein, 2010). The analysis also portrayed dynastic politicians as less-than altruistic
personalities, if they are only judged by their parliamentary attendance records. Asaka et al
(2010) also offer a similar view, since the study finds dynastic leaders in Japanese Diet are
related to inefficient fiscal transfers.
The results taken together, raise numerous important questions and implications for future
studies. First, the research offers sufficient inspiration for scrutinizing further the range of
'leader-identities' that matter in determining their respective behaviour. Second, given that
some support exists for the notion that dynastic identity matters, any future investigation of the
subject can attempt to isolate other behavioural patterns displayed by dynastic leaders. That is,
do dynastic leaders perform better in business sectors that are relatively more dependent on
government in comparison to non dynastic leaders? Are they relatively more acceptable to
special interest groups as lobbyist? These enquiries are likely to improve our understanding of
actions undertaken by dynastic politicians, and they will help pinpoint the factors that allow
political dynasties to endure. Lastly, the paper identified dynasty identity to trigger some
degree of shirking among legislators. This posits some unresolved issues. That is, do dynastic
politicians relatively shirk more because they enjoy a ‘brand-name advantage’ in the form of
greater electoral preference? Or, dynastic politicians behave in the mentioned manner since
they entertain greater ‘campaign advantage’, which makes electoral competition relatively less
costly for them due to their close links with pre-established donor networks and etc. There is
some evidence from Argentina indicating that performance of legislators does not necessarily
facilitate the chance that legislators will be able to facilitate future transfer of power to other
members of their family (Rossi, 2010). Hence, it might be probable that returns to shirking (or
asset accumulating while in office) are more effective for ensuring posterior dynastic
attainment. This, however, remains an avenue for future research to scrutinize. One the whole,
the discussed factors represent a demand and supply side phenomenon, and future studies

231
should attempt to isolate the possible role of such factors in shaping the behaviour of dynastic
politicians.
The paper in chapter-3 provides a more macro-outlook of the subject. The idea here is to see if
the prevalence of political dynasties in different degree explains partially the variation of
corruption across different countries. This relationship is interesting because some sub-national
studies reveal that dynastic identity among politicians can matter, and that such factors can
motivate shirking or inefficient economic policies (Asaka et al, 2010) Besides, political
dynasties also reflect inequality in the distribution of political power (Dal Bo et al, 2009), and
their access to greater political capital and state resources might hinder the state of governance
in their respective political landscapes. As a result, it remains essential to recognize whether
the mentioned relationship between political dynasties and corruption holds across polities.
Furthermore, given that corruption is detrimental for economic development (Mauro, 1995), it
is crucial to pinpoint the exact combination of factors that make some countries more corrupt
than others.
To this end, this work builds upon the date set of Treisman (2000), which studies the possible
determinants of corruption across a large sample of countries. In order to quantify the variation
in the degree of dynasty politics across political landscapes, the study constructs two measures.
The dynasty-index DI, which ranges between 0 and 1, and represents the time share that
political dynasties were in power for each country in post 1950-2010 period (or after
independence to 2010). Besides, a score of 1 reflects the absolute dominance of a political
family (or families) for the entire period.258 The base-line results are indicative of ‘weak’
correlation between dynasty-politics and corruption, which implies that higher degrees of
dynasty-politics are associated with higher levels of corruption. The paper stated that this
correlation is ‘weak’ because it only attains significance when I exclude Singapore and
monarchies from the estimations. This, however, only results in a loss of three observations.
The second measure quantifies a very special phenomenon associated with dynasty politics,
namely – immediate dynastic successions. To quantify this phenomenon, the paper uses a
binary variable Immediate Succession, which is equal to one if there has been a dynastic
succession at the top political office in one calendar year. In addition, the estimations point out
258For more clarity, please review Chapter-3.3.2 “Data: Sources of the variables and the Dynasty Index(DI)”
232
that countries which experienced immediate dynastic succession(s) at the highest political
office are on average associated with higher levels of corruption. This finding remains robust
for various measures of corruption and is significant when we control for important covariates.
The paper also offered a disaggregated scrutiny of the issue by focusing on role of different
types of ‘immediate succession’, since such political phenomenon can display considerable
heterogeneity. To be more specific, immediate dynastic-successions were categorized into
three broad types. First, the analysis introduced an indicator variable Retirement-IS, which is
equal to one when a leader voluntarily retires (or chooses not to stand for re-election) in
support of a member of the family for the top office. Second, it used a dummy variable
Natural Death-IS, which is equal to one for countries where an immediate dynastic occurred
after a leader died in office for natural causes. Lastly, a binary variable Assassination-IS is
constructed, which is equal to one when a country entertains an immediate dynastic succession
in the top political office after the assassination of its leader. Furthermore, the examination is
suggestive that countries which experienced retirement driven immediate succession or
assassination induced immediate dynastic succession are on average more corrupt. In contrast,
immediate dynastic successions that occurred after the death of national leader have no
substantive role in explaining cross-country variation in corruption. Hence, this opens up an
interesting avenue for more in depth quantitative and qualitative scrutiny to identify the
political norms and precedents that govern immediate dynastic succession, and how such
conditions (in turn) determine corruption.
On the whole, the central message from chapter-3 is in line with the earlier findings from the
sub-national study that political dynasties matter. The nature of the investigation, which studies
the influence of political dynasties at a country level, indicated that issues surrounding political
dynasties are serious, as the results highlight a significant correlation between dynasty-politics
and corruption. In addition to this, given that greater prevalence of dynasty politics is
associated with higher levels of corruption, the finding is not compatible with the reputation-
building incentive since it views dynastic politicians as relatively more altruistic entities who
will abstain from corruption or shirking to generate goodwill for their family. This also makes
the results consistent with the sub-national estimations discussed in chapter-2, which points out
that ‘dynasty-identity’ can influence higher levels of shirking among legislators. The evidence
from this cross-country set up does call attention to some imperative questions. To start with,
the cross-country evidence provides motivation for examining in future whether political
dynasties have any causal role in facilitating the levels of corruption a country exhibits. In
233
doing so, future analysis can try to pinpoint the exact channels through which political
dynasties can hinder the state of governance in a given political domain. Likewise, it is also
crucial to inquire: are there conditions that can make some dynastic leaders relatively more or
less benign than others? More specifically, can political competition play a role in determining
how dynastic leaders behave? On the role of political competition, Dal Bo et al (2009) shows
that political dynasties are less likely to emerge in places where political competition is high.
The authors argue that when a political party safely controls a state, the state and the national
leadership of the party can afford to favour “elite” candidates with whom they are related
through family or social ties. This, nonetheless, keeps it open for investigation whether
exogenous changes in the levels of political competition can shape the behavioural patterns of
political dynasties.
To conclude, the evidence from chapter-2 and chapter-3 offered an important corrective to the
common assumption that political actors will behave in a similar manner under common
institutional arrangement no matter who they are. Rather, it suggested that dynastic identity of
political actors can matter in influencing their behaviour. This allowed the thesis to
complement the recent studies that acknowledges a role of leader-identity in democratic
political process. The papers in chapter-2 and 3 also examined how politicians with inherited
political wealth behave. Otherwise stated, the results from both the sub-national and cross-
country studies presented no support for reputation-building hypothesis, which argues that
dynastic politicians will abstain from shirking or corruption to generate goodwill for their
respective families. In contrast, the papers are indicative that dynastic politicians are less
attentive in daily legislative business, and their prevalence is correlated with corruption across
countries.
6.2 Theme-II: What facilitates the emergence of political dynasties?
The papers in chapter- 4 and 5 examined factors that shaped the composition of political class
by facilitating the emergence and endurance of political dynasties. In doing so, the papers
primarily focused on the role of political assassinations in facilitating de facto inheritance of
political power by promoting dynastic attainment in political landscapes. This is interesting
because existing literature on political dynasties have mainly emphasised the importance of
structural factors in determining the likelihood that political leaders will start or continue a
political dynasty. For example, Sidel (2004) in his comparative analysis of ‘bossism” in
234
Philippines points out that when the structure of the state apparatus allows politicians to
entertain monopolistic control over a state’s resources, and when such monopolistic control is
used by them to construct a solid base in propriety wealth outside the realm of the state
intervention, then a dynasty formation becomes easier to implement. This, in essence,
highlights that what politicians are able to accumulate in terms of their personal and political
capital plays a crucial role in determining if a leader is likely to start a political dynasty. On a
more macro sale, qualitative studies have analysed political precedents and party norms to see
how such factors affect hereditary successions in modern autocracies. Brownlee (2007)
provides an insightful investigation which notes that whether elites will assist dynastic
succession depends on the precedent for leadership selection. To be exact, where rulers are
predated by parties surrounding political elites will defer to the party as the recognized arbiter
of succession. Then again, where rulers predate their parties and political elites lack an
established precedent for an orderly transfer of power, hereditary succession offers a focal
point for reducing uncertainty, achieving consensus, and forestalling a power vacuum. Some
studies have also scrutinized political assassination to understand the conditions that have
allowed the rise of female dynastic leaders in South and Southeast Asia. For instance, Ritcher
(1990) and Mark R. Thompson (2002) argue that ‘martyrdom’ of their male leaders (father or
husband) has played a pivotal role in making them a symbol of opposition struggle against
autocratic regimes, and thereby promoting their counterpart (wife or daughter) as national
leaders in their respective political landscapes.
Accordingly, the papers in this thesis contribute to this inquiry by empirically examining on
sub-national and cross-country data sets whether assassination can trigger hereditary
successions in political arenas. Also, given that there is a dearth of empirical work on the
factors facilitating the rise of dynastic leaders, the papers in chapter- 4 & 5 added fresh insights
to this growing pool of knowledge. The only notable empirical work on the factors determining
the rise of political dynasties is Dal Bo et al (2009). More precisely, the authors study the
evolution of political dynasties in U.S. Congress from 1789 to 1996, and it primarily identifies
that political power is self-perpetuating. That is, politicians who hold power for longer become
more likely to have relatives entering office in the future. In other words, the study finds that
positive exogenous shock to a leader’s political power has persistent effects through posterior
dynastic attainment. Therefore, the papers in theme-II, which focused on negative exogenous
shocks to a politician’s political power (in the form of randomness associated with

235
assassination attempts) complement this earlier enquiry through its analysis of a different
scenario.
The paper in chapter - 4, in particular, scrutinized if political assassinations aided the rise of
dynastic politicians across the political landscape of Bangladesh. This is appealing since
Bangladesh hosts numerous dynastic leaders, out of which some are descendants of
assassinated politicians. So, it provides an appropriate venue for carefully examining if
assassinations had a causal role in promoting the rise of dynastic politicians. Thus, the study
used biographical information of all political leaders who were elected to the office of a
Member of Parliament either in the 8th or 9th National Parliament. Moreover, it noted that
legislators who are descendants of assassinated leaders are associated with a higher likelihood
of continuing the political dynasty. The estimations also showed that being a descendant of a
non assassinated politician is also associated with a higher likelihood of having a posterior
relative in office. Besides, on the relative importance of being a descendant of an assassinated
leader, the analysis found some indications (even though the inference is very weak) that the
relationship is stronger for descendants of assassinated lawmakers. I interpret these results as
correlation because it is possible that these results are driven by unobserved family or
individual heterogeneity. This, nonetheless, provides motivation for investigating if there is
an underlying causal role of political assassination in triggering de facto inheritance of political
power.
Hence, to identify a possible contributory role of assassination, the paper employs the
identification strategy used by Jones and Olken (2009) to isolate the effects of political
assassinations. The authors argue that while attempts on a political leader’s life may be driven
by historical circumstances, unobserved individual ability or etc, conditional on trying to kill a
politician, the failure or success of an assassination attempt can be treated as exogenous. That
is, chance has role in determining if a leader survives the gun shot (or explosion from a bomb)
after the incident has occurred. Furthermore, if this rational holds true, then the effects of
political assassination can be studied by comparing dynastic outcomes for political leaders who
barely survived an assassination attempt in comparison to political leaders who died in an
assassination attempt after controlling for key covariates.
As a result, to employ this identification strategy, the paper constructed a historical data set on
assassination attempts in Bangladesh in post 1971 period. This new data set has information on
236
97 political leaders from all six Divisions in post 1971 period – who had at least one serious
assassination attempt on their life. Besides, this allows the paper to scrutinize if leader who
died in an assassination attempt in comparison to a leader who barely survived an assassination
attempt is on average more or less likely to start or continue a political dynasty. And, the base-
line estimations showed that political assassinations do, in fact, matter for facilitating dynastic
attainments. This finding remains consistent for multiple robustness checks, and the magnitude
of the relevant coefficient is suggestive that successful assassinations can increase the
likelihood of dynastic succession by approximately 30% to 45%. Additionally, this is in line
with the ‘martyrdom’ hypothesis, which argues that assassination facilitate dynastic succession
by enhancing the appeal of the slain leader among core political groups (Ritcher, 1990; Mark
R. Thompson, 2002). The results also provided some support to the notion that political leaders
with better career pattern are associated with a higher likelihood that they will start or continue
a political dynasty. This is also echoed in the analysis of Dal Bo et al (2009).
Taken as a whole, the results from both the data sets in Bangladesh convey a consistent
message that assassinations can have a modifying role in shaping the composition of political
class by triggering the rise of dynastic leaders to political office. This, to an extent, explains
why some political dynasties have emerged across the political arena of Bangladesh. Yet, the
issues that are not properly addressed are the causal channels or mechanisms that allow
political assassinations to matter for aiding the rise of political dynasties. This brings to
attention some important concerns about the process in which dynastic successions in political
office occur following political assassinations. To start with, it is imperative to recognise that
political assassinations are neither necessary nor sufficient for promoting the emergence of
political dynasties. As a result, certain conditions can exist that allow some assassinations to
trigger dynastic successions in political office. More specifically, do political leaders need
political capital above certain threshold for their assassination to produce a dynastic succession
in their political office/constituency? That is, do they need to be of any rank within the party
hierarchy? Or, must they dictate followership above certain critical level for their assassination
to bear any consequence?259 These are essential issues to which future studies must pay
consideration if one needs to understand the political machineries that are instrumental in
facilitating dynastic transmission of political power after an act of assassination.
259 Some studies have identified ‘leader-follower’ relationship as fundamental for understanding whycertain leaders can catalyze change and others do not. See: Majumdar and Mukand (2008).
237
In addition, specific concerns also exist on the possible role of political parties. For example, it
is crucial to examine if political parties accept a dynastic successor of an assassinated legislator
since this gives them the best chance to retain the constituency. That is, the ‘martyrdom’ of the
assassinated leader works as an important asset for political parties to maintain their authority
in a leader’s respective constituency. On the contrary, it is also probable that dynastic
successions following an assassination are only possible if a party safely controls a seat. In
other words, if political competition is low and a party has a strong control over a
parliamentary seat, then national leadership of the party can afford to favour a dynastic
successor of an assassinated leader260 with whom they are related through social ties. Thus
future work can delve into these specific explanations, and scrutinize the exact set of factors
that allows assassinations to facilitate de facto inheritance of political power by aiding
subsequent dynastic attainments.
The paper in chapter – 5, examined the same hypothesis on two cross country data sets. The
purpose is to see if political assassinations aided dynastic transmission of political power at the
highest political office across the globe. To this end, paper used biographical data on 442
national leaders across 65 countries who held office at least once in post 1950 period. The aim
is to note whether assassinations have any association with dynastic politicians who had a
posterior relative in office. Likewise, base-line results pinpoint that assassinated leaders are on
average associated with a higher likelihood that they will later have a relative enter office. This
inference remains robust for various changes in the econometric specifications and inclusion of
essential covariates. It is, nevertheless, important to note that the observed relationship is in no
respect causal. This is because charismatic national leaders (with traits that can be conducive to
dynasty formation) can also attract assassination attempt.
Consequently, the paper used an alternative data set from Jones and Olken (2009), which has
information on more than 190 national leaders from 93 countries in post 1875 period who had
at least one assassination attempt on their life.The idea is to exploit the inherent randomness in
the success or failure of assassination attempts to identify the effects of assassination on the
likelihood that a national leader will start a political dynasty. Thus, OLS regressions on this
260 A similar view is noted earlier, which is found in Dal Bo et al (2009). That is, the study also showsdynastic legislators are less common in more politically competitive states. This indicates that dynasticlegislators may rely on their familiarity with political machineries (in the form contacts with partyelites etc) to secure political positions in states that the party safely controls.
238
new data set confirmed that outcomes of assassination attempts have significant modifying role
in shaping dynastic existence and persistence. The range of the coefficients is indicative that
successful assassinations increase the probability of an eventual dynastic succession at the
highest political office by at least 12 percentage points.261 The analysis further examined if
political assassinations drive any specific type of dynastic succession, namely – immediate
dynastic succession or non-immediate dynastic succession. Moreover, the findings are
suggestive that political assassinations are relatively more instrumental in determining the
possibility of an immediate dynastic succession. This is interesting as it brings to attention an
important avenue for future studies that intends to shed light on the exact process that guides
dynastic transmission of political power after an act of assassination. In particular, future
analysis can scrutinize the role of party norms and the level of intra-party democracy in
facilitating such immediate succession.262
The results also show that the magnitude of the effect of political assassination on the
likelihood of posterior dynastic attainment is probably stronger for national leaders with longer
tenure in public office. This echoes a concern mentioned earlier. More specifically, if political
assassinations are relatively more effective in triggering dynastic successions for leaders with
at least ten or more years in office, then it is crucial to investigate why such exposure to
political power matters. Is it because the level of political capital a national leader accumulates
(while in power) has an important role in ensuring that assassinations of national leaders are
261 Note, the marginal effect of assassination is less strong in comparison to what is seen from the sub-national data sets.
262 Two cases are particularly worth noticing. One, after the assassination of President John F.Kennedy in 1963, he was immediately succeeded by Vice President Lyndon B Johnson. Moreover,even though Robert F Kennedy had aspiration to run for Presidency(See:http://bioguide.congress.gov/scripts/biodisplay.pl?index=k000114), the constitutional arrangementin United States dictates that Vice President is the first person in the presidential line of succession andwill rise to the Presidency upon the resignation, death, or removal of the President (See: United StatesConstitution ) Two, in India, when Prime Minister Indira Gandhi was assassinated in 1984, she wasimmediately succeeded by her eldest son Rajiv Gandhi –who was only a Member of Parliament – and itportrayed the level of influence that Gandhi family exerted on Indian National Congresses (Katherine,2001). Now, this simple comparison provokes some important questions. That is, while Robert FKennedy’s ambition to become President came to a closure when he was assassinated during hiselection campaign in 1968, what exactly stopped him from immediately succeeding his brother in1963? Is it the constitutional arrangement that demands the Vice President ascends to the post whensuch events occur? Or, did the level of intra-party democracy (that exists in U.S) create thisconstitutional arrangement? Furthermore, if the Indian political landscape had precise norms andprecedents that guide leadership succession, would the political elites in Indian National Congress stillgive into such form of power transfer? Likewise, with a higher level of intra-party democracy, wouldsuch succession have taken place? Thus, future qualitative and quantitative scrutiny of such form ofdynastic transmission of political power can attempt to isolate the exact role of such factors in aidingthe rise of dynastic leaders.
239
countered by facilitating immediate dynastic successions by the incumbent coalition of
political actors? Likewise, what is the exact nature of this ‘political capital’ that national
leaders accumulate? Is it goodwill or financial wealth? Or, is it key contacts with government
and political party machineries that one acquires from long exposure to political power?
Additionally, does this nature of political capital vary across different types of national leader?
To be more specific, do autocratic national leaders accumulate a different kind of political
capital in comparison to democratic national leaders? Lastly, does the death of a national leader
in an assassination attempt mean that the required level of political capital to start a political
dynasty is now lower, given that his or her potential dynastic successor now benefits from his
or her martyrdom? Thus, future research on political dynasties can offer more insights on
these individual questions through detailed empirical examination of sub-national data sets
from different polities.
Therefore, the data sets from the cross-country set up provide sufficient indication that political
events – in the form of assassination of national leaders – matter in facilitating the rise of
political dynasties. This assists in understanding why dynastic national leaders have emerged
across diverse political landscapes. In addition, the principle message fits well with the overall
results from the data sets in Bangladesh, and this consistency enhances the general confidence
in the finding that assassination of political leaders can have significant causative role in aiding
dynastic transmission of political power.
Taken together, the evidence from chapter-4 and chapter -5 provides an interesting outlook to
an established cause of political dynasties. That is, while Dal Bo et al (2009) find that positive
exogenous shocks to a leader’s political power (in the form of winning re-election) matter in
facilitating posterior dynastic attainment, the present thesis identifies that negative exogenous
shocks to a leader’s life (in the form of death in an assassination attempt) can too increase the
likelihood that a leader will start or continue a political dynasty. This highlights that the context
of the shock to political power is fundamental in shaping posterior dynastic attainment. Lastly,
both papers in chapter-4 and chapter -5 have mostly relied on an empirical strategy that
compares dynastic outcomes of political leaders who barely survived an assassination attempt
in comparison to political leaders who died in an assassination attempt. This makes it
suggestive that small elements of chance can have persistent effects in determining the
composition of political class.
240
6.3Final Thought
James Madison (1788[1961]), an architect of the U.S Constitution wrote in the Federalist
Papers (#57): “The aim of every constitution, or ought to be, first to obtain for rulers men who
possess most wisdom to discern, and most virtue to pursue, the common good of the society;
and in the next place, to take the most effectual precautions for keeping them virtuous whilst
they continue to hold public trust.” The first concern that the former U.S President indentifies –
that we need a political class that is competent and truthful enough to execute its duties – has
implicitly raised a demand for institutional arrangements that allows the most meritorious and
public service oriented individuals to find representation in modern democratic policy making
process. Yet, what the papers in Theme-II indicated that randomness associated with political
events (such as political assassination) can have persistent effects by shaping the composition
of political class. In particular, the papers showed that political assassinations can facilitate
dynastic transmission of political power, and that such dynastic successions are not always a
product of superior fixed endowments (leader gene, ability or merit etc).
The second concern – that we need to get institutional arrangements right so that the incentive
structure allows politician to act in public interest – has produced a vast body of literature in
political economy which focuses on the role of various institutional structure in determining
economic development, democratic consolidation and policy choice. Nonetheless, almost all
work in this stream of intellectual inquiry makes an implicit assumption that under a common
institutional set up, political actors behave in a similar manner no matter who they are. Thus,
the papers in Theme-I provided an essential corrective to this assumption by suggesting that
leader identity matters, and that there is a sufficient scope for ‘dynastic identity’ to trigger sub-
optimal behaviour among politicians. This contributed to the recent body of empirical work
that focuses on ‘leader-identity’ in explaining how such attributes determines political
behaviour or policymaking.
To end with, the essays in this thesis have not attempted to provide a grand theory of political
dynasties. Rather, their objective has been to undertake substantive empirical scrutiny, so that
we enhance our general understanding of the subject. In that sense, it has provided some key
insights on the potential causes and consequences of political dynasties, and has opened an
interesting avenue in political economy for future research endeavour.
241
Bibliography
Acemoglu, Daron, Egorov, G. and Sonin, K. 2008. “Political Selection and the
Persistence of Bad Governments” unpublished typescript.
Acemoglu, Daron, Maria Angelica Bautista, Pablo Querubin and James A. Robinson.
2008. “Economic and Political Inequality in Development: The Case of
Cundinamarca, Colombia”, in Institutions and Economic Performance, Ed.
Elhanan Helpman, Cambridge, MA: Harvard University Press.
Acemoglu, Daron, Simon Johnson and James A. Robinson. 2001. “The Colonial
Origins of Comparative Development: An empirical investigation.” American
Economic Review, 91, pp. 1369-1401
Acemoglu, Daron and James Robinson 2008. “Persistence of Power Elites and
Institutions” American Economic Review 98:1
Acemoglu, Daron and James Robinson 2005. “Economic Origins of Dictatorship and
Democracy” Cambridge: Cambridge University Press
Anti Corruption Commission of Bangladesh 2007-2008: Annual Report
Ades, Albert and Rafael Di Tella. 1999. “Rents, Competition, and Corruption.”
American Economic Review.89:4, pp. 982-993.
Aghion, P, Alesina, A. and Trebbi, F. 2008. “Democracy, Technology, and Growth”
in Elhanan Helpman (ed), Institutions and Economic Performance, Cambridge
MA: Harvard University Press.
Angermeyer, M. C. and Herbert Matschinger. 1995. “Violent attacks on public figures
by persons suffering from psychiatric disorders: The effect on the social
distance towards the mentally ill. European Archives of Psychiatry and
Clinical Neuroscience 245(May), pp. 159-64.
242
Alvarez, M, Cheibub, J.A, Limongi, F and Przeworski, A. 1996. “Classifying political
regimes.” Studies in Comparative International Development 31 (2), pp. 3-36
Alesina, A and R. Perotti. 1996: “Income Distribution, Political Instability, and
Investment.” European Economic Review (40), pp. 1203-28.
Alesona, A, Ozler, S, Nouriel, R and O, Swagel. 1996. “Political Instability and
Economic Growth” Journal of Economic Growth 1 (June), pp. 189-211.
Alamgir, J. 2009. “Bangladesh’s Fresh Start” Journal of Democracy 20(3), pp. 41-55
Asako, Y, Iida, T, Matasubayashi, T and Ueda, M. 2010. “Dynastic Legislators:
Theory and Evidence from Japan” Working Paper
Barro, R. 1996. “Democracy and Economic Growth” Journal of Growth 1(1), pp. 1-
27
Barr, Abigail and Serra, Danila. 2006. “Culture and Corruption”
Bates, Robert. 1981. “States and Markets in tropical Africa: The Political Basis for
Agricultural Policy.” Berkley: University of California Press
Baxter, C. and Rahman, S. 1991. “Bangladesh Votes-1991: Building Democratic
Institutions” Asian Survey31(8), pp. 683-693
Berkowitz, Leonard and Jacqueline Macauley. 1971. “The Contagion of Criminal
Violence.” Sociometry34(2), pp. 238-60.
Berlin, Isaiah. 1978. “Russian Thinker” London: Hogarth Press

243
Besley, Tinothy, Persson, Torsten and Daniel Sturm. 2010. "Political Competition,
Policy and Growth: Theory and Evidence from the United States,"Review of
Economic Studies, 77(4), pp. 1329-1352.
Besley, Timothy andValentino Larcinese. 2011. “Working or Shirking? A Closer
Look at MPs Expenses and Parliamentary Attendance” Public Choice 147,
pp.291-317
Besley, Timothy and Reynal-Querol, M. 2009. “Do Democracies Select More
Educated Leaders” mimeo LSE
Besley, Timothy and Anne Case. 1995. “Incumbent Behavior: Vote Seeking, Tax
Setting and Yardstick Competition" American Economic Review, 85(1), pp.
25-45.
Besley, Timothy. 2006. “Principled Agents? The Political Economy of Good
Government” New York: Oxford University Press
Besley, Timothy and Robin Burgess 2002. “The Political Economy of Government
Responsiveness: Theory and Evidence from India” Quarterly Journal of
Economic 117(4), pp. 1415-1452
Besley, Timothy. 2005. “Political Selection” Journal of Economic Perspective 19(3),
pp. 43-60.
Besley, Timothy. 2004. “Paying Politicians: Theory and Evidence” Journal of
European Economic Association 2(2-3), pp. 193-215
Boorstin, Daniel L 1995. “Cleopatra’s Nose” New York: Random House.
Brandes Crook, S. and Hibbing, J: 1997. “A Not-so-distant Mirror: the 17th
Amendment and Congressional Change”American Economic Review. 91(4),
pp. 845-853
244
Brenton, A. 1996. “Competitive Government: An Economic Theory of Politics and
Public Finance.” Cambridge University Press, Cambridge.
Brownlee, J 2007. “Hereditary Succession in Modern Autocracies” World Politics 59,
pp. 595-628.
Brunetti, Aymo and Beatrice Weder. 2003. “A free press is Bad News for
Corruption.” Journal of Public Economics. 87(7-8), pp. 1801-1824
Camp, R. 1982. Family Relationships in Mexican Family: A Preliminary View, The
Journal of Politics. 44(3), pp. 848-862
Caryle, Thomas. 1837.“The French Revolution: A History” London: Chapman and
Hall
Caryle, Thomas. 1859.“On Heroes, Hero Worship and the Heroic in History” New
York: Wiley and Halsted
Caselli, F. and M. Morelli. 2004. “Bad Politician.” Journal of Public Economics 88(3-
4), pp. 759-82.
Collier, Paul and Hoeffler, Anke 2002. “On the incidence of Civil War in Africa.”
Journal of Conflict Resolution 46(1), pp. 13-28.
Chattopadhyay, Raghabendra and Esther Duflo 2004. “Women as Policy Makers:
Evidence from India-Wide Randomized Policy Experiment” Econometrica
72(5), pp.1409-1444
Chehabi, H. E and Linz, J.J 1998. “Sultanistic Regimes” Published by Johns Hopkins
University Press, 1998.
Clubok, Alfred, Norman Wilensky and Forest Berghorn 1969. “Family Relationships,
Congressional Recruitments, and Political Modernization.” Journal of
Political Economy 31 (4), pp. 1035-62.
245
Dal Bo, Ernesta and Di Tella. R 2003. “Capture by Threat” Journal of Political
Economy 111(3), pp. 1123-54.
Dal Bo, Ernesta, Pedro Dal Bo and Jason Snyder 2009. “Political Dynasties”. Review
of Economic Studies 76, pp. 115-142
Dal Bo, Ernesto and Rossi, M. 2008. “Term Limit and Political Performance” NBER
working paper
De Soto, Hernando. 1989. “The Other Path” New York. Harper and Row
Demsetz, Harold. 1967. “Towards a Theory of Property Rights.” American Economic
Review. 57(2), pp. 61-70
De Witte, Ludo. 2001. “The Assassination of Lumumba, London:Verso Books.
Diermeier, D, Keane, M. and Merlo, A. 2005. “A Political Economy Model of
Congressional Careers” American Economic Review 95(1), pp. 347-373
Djankov, Simeon, Rafeal La Porta, Florencio Lopez-De-Silanes and Andrei Shleifer.
2002: “The Regulation of Entry.” Quarterly Journal of Economics. 117(1), pp.
1-37
Easterly, William and Levine, R. 1997. “Africa’s growth tragedy: policies and ethnic
division.” QuarterlyJournalofEconomics. 112(4), pp. 1203-1250
Eckstein, H. 1966: “Division and Cohesion in Democracy: Study of Norway.”
Princeton University Press, Princeton.
Edgeworth F. Y. 1881. “Mathematical Psychics: An Essay on the Application of
Mathematics to Moral Sciences” Philosophy of Public Affairs 6(4): pp. 317-
344

246
Eggers, A.C. and Hainmueller, J. 2009. “MPs for Sale? Returns to Office in Postwar
British Politics” American Political Science Review 103(4), pp. 513-533
Elazar, D. 1995. “From statism to federalism: a paradigm shift. Publius 25(2), pp.5-18
Esaiasson, Peter and Donald Granberg. 1996. “Attitude Towards a Fallen Leader:
Evaluation of Olaf Palme Before and After the Assassination.” British Journal
of Political Science 26 (July)pp.429-439.
Feinstein, Brian D. 2010. “The Dynasty Advantage: Family Ties in Congressional
Elections” Legislative Studies QuarterlyXXXV(4), pp. 571-598
Ferguson, Niall, ed. 1999. “Virtual History: Alternatives and Counterfactuals.” New
York: Basic Books.
Fest, Joachim 1994. “Plotting Hitler’s Death: The German Resistance to Hitler, 1933-
1945”
Fieldhouse, D.K 1982. The Colonial Empires: A Comparative Survey from the
Eighteenth Century. 2nd ed. Macmillan, London.
Ferraz, Claudio. and Finan, C. 2008. “Motivating Politicians: The Impacts of
Monetary Incentives on Quality and Performance IZA Discussion Paper 3411
Ferraz, Claudio and Finan, C. 2010. “Political Power Persistence and Economic
Development: Evidence from Brazil’s Regime Transition” mimeo
Frank, Katherine. 2002. “Indira: the life of Indira Gandhi”
Frey, B. S and Torgler, B. 2008. “Politicians: Be Killed or Survive” CESifo Working
Paper No. 2483
Freedom, Lawrence Z. 1965. “Assassinations: Psychopathology and Social
Pathology.” Post graduate Medicine 37(1)pp. 650-658.
247
Friedman, E, Johnson, S, Kaufmann, D and Pablo-Zoido-Labaton 2000. “Dodging
the Grabbing Hand: The Determinants of Unofficial Activity in 69 Countries”
Journal of Public Economics 83, pp. 325-45
Feyrer, J.D and Scerdote, B 2006. “Colonialism and Modern Income-Islands as
Natural Experiments.” NBER Working Paper 12546
Gagliarducci, S., Nannicini, T. and Naticchioni, P. 2008. “Outside Income and Moral
Hazard: The Elusive Quest for Good Politicians” 12A Working paper No.
3295.
Gagliarducci, S. and Nannicini, T. 2009. “Do Better Paid Politicians Perform Better?
Disentangling Incentives from Selection”
Ghesquiere, Henri 2006. “Singapore’s Success: Engineering Economic Growth”
Goemans, H.E, Gleditsch, K.S. and Chiozza, G. 2007. “ARCHIGOS: A data set on
leaders, 1875-2004”, version 2.8.
http://mail.rochester.edu/~hgoemans/Archigos.pdf
Greenberg, Bradley S. 1964. “Diffusion of News of the Kennedy Assassination.”
Public Opinion Quarterly 28 (Summer), pp. 225-32
Grier, R. 1995. “The effect of religion on economic development: a cross country
study of 63 former colonies.” Kyklos 50 (1), pp. 47-62
Glaeser, Edward, Rafael La Porta, Florencio Lopez de-Silanes and Andrei Shleifer
2004.“Do Institutions Cause Growth” Journal of Economic Growth 9(3) pp.
271-303
Hagerty, D.T. 2008, ‘Bangladesh In 2007’, Asian Survey, 48(1), January/February,
pp.177-183
248
Halberstam, David. 1972. “The Best and the Brightest” New York: Random House.
Hartnett, R.T and C. U. Libby. 1972. “Agreement with views of Martin Luther King,
Jr., before and after assassination.” Phylon 33(1), pp. 79-87
Haykal, Muhammad Hasanayn. 1983. “Autumn of Fury: The Assassination of Sadat”
London: Andre Deutsch
Herz, J. H. 1952. “The Problem of Successorship in Dictatorial Regimes; A Study in
Comparative Law and Institutions.” Journal of Politics
Hersh, Seymour. 1997. “The Dark Side of Camelot” Harper Collins Publishers.
Hess, S. 1997. America’s Political Dynasties. Transaction Publishers
Horrabin, J.F 1937. An Atlas of Empire. Knopf, New York
Huntington, Samuel P. 1968. Political Order in Changing Societies. New Haven:
Yale University Press
Islam, S. Serajul. 1984. “The State in Bangladesh under Zia (1975-1981)” Asian
Survey Vol. 24 No. 5 (May 1984), pp.556-573
Iqbal, Zaryab, and Zorn, Christopher. 2006. “Sic simper tyrannis? Power, repression,
and assassination since the Second World War.” The Journal of Politics 68
(August): pp. 489-502
Jahan, Rounaq. 1973. “Bangladesh in 1972: Nation Building in a New State” Asian
Survey 13(2): pp. 199-210
Jones, Howard 2003. “Death of a Generation: How the Assassination of Diem and
JFK Prolonged the Vietnam War. Oxford: Oxford University Press.
249
Jones, Benjamin F. and Olken, Benjamin A. 2005. “Do Leaders Matter? National
Leadership and Growth Since World War II Quarterly Journal of Economics
120 (3), pp. 835 -864
Jones, Benjamin F. and Olken, Benjamin A. (2009). “Hit or Miss? The Effect of
Assassinations on Institutions and War.”American Economic Journal:
Macroeconomics. 1(2): pp. 55-87
Kalt, Joseph P and Mark A. Zupan. 1984. “Capture and Ideology in the Economic
Theory of Politics LXXIV pp. 279-300
Karim, S.A. 2005. “Sheikh Mujib: Triumph and Tragedy” The University Press
Limited.
Khatchadourian, Haig. 1974. “Is political assassination ever morally justified? In
Assassination”edited by Harold Zellner, 41-56. Cambridge, MA: Schenkmann
Khan, Mushtaq H. 1999. “The Political Economy of Industrial Policy in Pakistan 1947-
1971.” SOAS Department of Economics Working Paper No. 98, School of
Oriental and African Studies, University of London.
Kaufmann, Daniel, Kraay, Aart and Mastruzzi, Massimo 2006. Governance Matters
V: Aggregate and individual governance indicators for 1996-2005, The World
Bank
Kaufmann, Daniel. 2003. “Rethinking Governance: Empirical Lessons Challenge
Orthodoxy.” Discussion Draft, World Bank, Washington DC.
Keane, M./ Merlo, A. 2007. “Money, Political Ambition and the Career Decisions of
Politicians” PIER Working Paper pp. 07-16
Klingman, Avigdor. 2001. “Israeli children’s reactions to the assassination of the
prime minister. Death Studies 25 (January-February) pp. 33-49.
250
Knack, S. 2006. “Measuring corruption in Eastern Europe and Central Asia: A
critique of the cross-country indicators” Washington, D.C., World Bank
Laband, D.N. and Lentz, B. F. 1985. “Favorite Sons: Intergenerational Wealth
Transfers Among Politicians” Economic Inquiry 23: pp. 395-414
La Porta, Rafael, Florencio Lopez-de-Silanes, Andrei Shleifer and Robert Vishny.
1999: “The Quality of Government.” Journal of Law, Economics and
Organization. 15(1), pp. 222-279.
La Porta, Rafael, Florencio Lopez-de-Silanes, Andrei Shleifer and Robert Vishny.
1997: “Legal determinants of external finance.” Journal of Finance 52(3), pp.
1131-1150
LaPalombara, Joseph 1994. “Structural and Institutional Aspect of Corruption.”
Social Research LXI (2): pp. 325-350.
Leff, Nathanial H. 1964: “Economic Development Through Bureaucratic
Corruption.” American Behavioural Scientist.82(2), pp. 337-341
Lee, David S., Enrico Moretti and Mathew J. Butler. 2004. “Do Voters Affect or Elect
Policies? Evidence from the U.S House” Quarterly Journal of Economic 119,
pp. 1383-1441
Levitt, Steven D. 1996. “How do Senators Vote? Disentangling the Role of Voter
Preferences, Party Affiliation and Senator Ideology” American Economic
Review LXXXVI pp. 425-441
Lott, John. R. Jr. 1986. “Brand names and barriers to entry in political markets”
Public Choice 51 (1): pp. 87-92
Lott, John. R. Jr. 1987a. “Political Cheating” Public Choice 52: pp. 169-187
251
Lott, John. R. Jr. 1987b. “The effect of non-transferable property rights on the
efficiency of political markets: Some Evidence” Journal of Public Economics
32: pp. 231-246
Lott, John. R. Jr. 1989. “Explaining challengers’ campaign expenditure: The
importance of sunk nontransferable brand name” Public Finance Quarterly
17(1): pp. 108-118
Lott, John. R. Jr. and Reed, R.W. 1989. Shirking and sorting in a political market with
finite-lived politicians” Public Choice 61: pp. 75-96
Lott, John. R. Jr. and Bronars, S. G. 1993. “Time Series Evidence on Shirking in the
U.S. House of Representatives” Public Choice 76: pp. 125-49
Lipset, S. M and Lenz, G.S. 1999: “Corruption, culture and markets.” Manuscript,
GeorgeMasonUniversity.
Lipset, Seymour M. 1960.Political man: The Social Basis of Modern Politics. New
York: Doubleday
Lui, rancis T. 1985. “An Equilibrium Queuing Model of Bribery” Journal of Political
Economy 93:4, pp760-81
Marshall, Monty G and Keith Jaggers. 2004. “POLITY IV project”. Integrated
Network for Social Conflict Research Program and Center for International
Development and Conflict Management. College Park: University of
Maryland
Marshal, P.J 2006. “Bengal: The British Bridgehead: Eastern India 1740-1828”
Cambridge University Press.
Martin, K. Bradely. 2004. “Under the Loving Care of the Fatherly Leader: North
Korea and the Kim Dynasty”
252
Marx, Karl. 1852. “The Eighteen Brumaire of Louis Napoleon” Die Revolution. New
York
Mattozzi, A. and Merlo, A. 2008: “Political Careers Or Career Politicians?” Journal
of Public Economics 92: pp. 597-608
Mauro, Paolo. 1995. “Corruption and Growth.” Quarterly Journal of Economics. 110,
pp.681-712
McArthur, J and Stephen V. M. 1988. “Constituent Interest vs. Legislator Ideology:
The Role of Political Opportunity Cost.” Economic Inquiry 26: pp. 461-70.
Metz, Helen Chapin. 1989. “Dominican Republic and Haiti : Country Studies”
Federal Research Division, Library of Congress Washington, DC December
Merriman, John 1985. “For Want of a Horse: Choice and Chance in History”
Lexington, MA: Stephen Greene Press.
Mosca, G. 1966 [1896]. “ La Classe Politica” Bari: Laterza Editori.
Moniruzzaman, 2009. “Party Politics and Political Violence in Bangladesh: Issues,
Manifestation and Consequences” South Asian Survey 16: pp. 81-99
Murphy, Kevin, Andrei Schleifer and Robert Vishny.1991. “The Allocation of Talent:
Implications For Growth.” Quarterly Journal of Economics 106, pp.503-530
Michels, R. 1999 [1911]. “Political Parties: A Sociological Study of the Oligarchical
Tendencies of Modern Democracy” New York: Macmillan
Myrdal, Gunnar. 1968. Asian Drama New York: Random House
Nash, John. 1951. “Non-Cooperative Games” The Annals of Mathematics 54(2): 286-
295.
253
Ngolet, Francois, 2000. “Ideological Manipulations and Political Longevity: The
Power of Omar Bongo in Gabon since1967” African Studies Review, 43 (2):
pp. 55-71
Orren, Karen / Paul Paterson. 1967. “Presidential Assassination: A Case Study in the
Dynamics of Political Socialization.” Journal of Politics 29 (May): 388-404
Papaioannou, E. and Siourounis, G. 2008. “Democratization and Growth” Economic
Journal 118(10): 1520-1551
Pande, Rohini, 2003. “Minority Representation and Policy Choices: The Significance
of Legislator Identity” American Economic Review 93(4), pp.1132-1151
Padro’ i. Miguel, G. and Snyder, J.M. 2006. “Legislative Effectiveness and
Legislative Career” Legislative Studies Quarterly 31(3): pp. 347-381
Persson, Torsten and Guido Tabellini. 2004. “Constitutions and Economic Policy”
Journal of Economic Perspectives 18(1): pp. 75-98
Peri, Yoram. 2000. “The assassination of Yitzhak Rabin.” Stanford, CA: Stanford
University Press.
Poole Keith T and Howard Rosenthal. 1984. “The Polarization of American Politics”
Journal of Politics XLVIpp. 1061-1079
Posner, Gerald L. 1993. “Case Closed: Lee Harvey Oswald and the Assassination of
JFK” New York Anchor.
Przeworski, Adam. And Limongi, F. 1993. “Political Regimes and Economic
Growth.” Journal of Economic Perspectives 7(3): pp. 51-69
Putnam, R.D. 1976. “The Comparative Study of Political Elites” Englewood Cliffs,
NJ: Prentice Hall.
254
Rahman, Md. Ataur. 1984. “Bangladesh in 1983: A Turning Point for the Military”
Asian Survey 24(2): pp. 240249
Ram, N. 1991. “An Independent Press and Anti-Hunger Strategies: The Indian
Experience” in Jean Dreze and Amarta Sen. (eds) The Political Economy of
Hunger Vol. I Oxford University Press.
Raj, Prakash A. 2001. “Kay Gardeko? The Royal Massacre in Nepal.” Calcutta: Rupa
& Co.
Ravillion, M and Q. Wodon. 1999: “Poor Areas or Poor People?” Journal of Regional
Sciences Vol 29(4): pp. 689-711
Raviv, A / A. Sadeh / O. Silberstein. 1998: “The reaction of the youth in Israel to the
assassination of Prime Minister Yitzhak Rabin. Political Psychology 19: pp.
255-78
Rashid and Feroz: 2002: Documentary on the Parliament
Reeves, Richard. 2005. “President Reagan: The Triumph of Imagination.” New York:
Simon & Schuster.
Rehavi, Marit. 2007. “Sex and Politics: Do Female Legislators Affect State
Spending?”
Richter, L.K. 1990. “Exploring Theories of Female Leadership in South and
Southeast Asia.” Pacific Affairs (Winter) 63(4): pp. 524-540
Riker, W. 1964. “Federalism: Origin, Operation, Significance.” Little Brown & Co,
Boston.
Rossi, Martin. 2010. “The Causes of Political Dynasties in Democratic Countries”
Universidad de San Andres, mimeo
255
Sachs, J.D and Warner A.M. 1997: “Fundamental Sources of Long Run Growth:
American Economic Review May 1997 pp.184-188
Schatz, E 2004. “Modern Clan Politics: The power of ‘Blood’ in Kazakhstan and
Beyond”.
Siegel, L. S. 1977. “Children and adolescents’ reactions to the assassination of Martin
Luther King: A Study of Political Socialization.” Development Psychology 13:
pp. 284-85
Sen, Amartya K. 1977. “Rational Fools: A Critique of the Behavioural Foundations
of Economic Theory.”Philosophy and Public Affairs. 6(4): pp. 317-344
Sen, Amartya K. 1981. “Poverty and Famines: An Essay on Entitlements and
Deprivation” Oxford University Press.
Sen, Amartya K. 1984: “Food Battles: Conflict in the access to food” Food and
Nutrition 10: pp. 81-89
Sen, Amartya. K, 2004. “The Argumentative Indian”London: Allen Lane
Sen, Rangalal. 1986. “Political Elites of Bangladesh” University Press Limited.
Shilpi, Forhad. 2008. “Migration, Sorting and Regional Inequality: Evidence from
Bangladesh” Policy Research Working Paper, The World Bank
Shleifer, Andrei and Robert Vishny. 1993. “Corruption.” Quarterly Journal of
Economics. 108:3, pp.599-617
Shleifer, Andrei and Robert Vishny. 1998. “The Grabbing Hand: Government
Pathologies and their Cure, Chapter 1”
Smart, M and Sturm, D. 2004. “Term Limits and Electoral Accountability” Working
Paper
256
Sidel, John. 2004. “Bossism and democracy in the Philippines, Thailand, and
Indonesia: towards an alternative framework for the study of 'local strongmen'.
In: Harriss, John and Stokke, Kristin and Tornquist, Olle, (eds.) Politicising
democracy: the new local politics of democratisation. Palgrave Macmillan,
Basingstoke, UK, pp. 51-74.
Singer, J. David, Stuart Bremer and John Stuckey. 1972. “Capability Distribution,
Uncertainty and Major Power War 1820-1965” In Peace, War and Numbers
Beverley Hills Sage
Singer, J. David 1987. “Reconstructing the Correlates of War Dataset on Material
Capabilities of States 1816-1965” International Interactions 14, pp. 115-32
Slominich, S. J and Kantor, R .E 1969. “Social Psychopathology of Political
Assassination.” Bulletin of Atomic Scientists 30: pp. 9-12
Svensson, Jakob 2005. “Eight Questions About Corruption” Journal of Economic
Perspective
Talukder, Maniruzzaman. 1976. “Bangladesh in 1975: The Fall of the Mujib Regime
and Its Aftermath” Asian Survey 16(2) pp-119-129
Treisman, Daniel. 2000. “The Causes of Corruption: A Cross-National Study.”
Journal of Public Economics
Thompson, M. R. 2002. “Female Leadership of Democratic Transitions in Asia.”
Pacific Affairs (Winter) 74(4): pp. 535-555
Titiunik, R: 2008. “Drawing Your Senator From a Jar: Term Length and Legislative
Behaviour” Working Paper
Tullock, G. 1987. “Autocracy” Boston: Kluwer Publishers.
257
Warren, Earl, et al. 1964. “The Warren Commission Report: Report of the Presidents
Commission on the Assassination of President John F. Kennedy” Washington:
United States Government Printing Office.
Weber, Max. 1947. “The Theory of Social and Economic Organization” New York:
Free Press.
Wei, S-J. 1998. “Corruption in economic development: economic grease, minor
annoyance, or major obstacle? Manuscript, HarvardUniversity.
Weingast, B.R, 1995: “The economic role of political institution: market-preserving
federalism and economic development.” Journal of Law, Economics and
Organization. 11(1), pp. 1-31
World Bank, 1997. “World Development Report: The Sate in a Changing World” Oxford
University Press, New York
Wilkinson, Doris Y. 1970. “Political Assassins and Status Incongruence: A
Sociological Interpretation.” The British Journal of Sociology 21(December):
pp. 400-12.
Wintle, Justin. 2007. “Perfect Hostage: A Life of Aung San Suu Kyi”
Zeckerhauser, R., and Schaefer, E. 1968. “Public Policy and Normative Economic Theory.”
In The Study of Policy Formation, edited by Raymond Bauer and Kenneth Gergen,
New York: Free Press.
Yuchtman-Yaar, Ephraim and Tamar Hermann. 1998. “The Latitude of Acceptance:
Israeli Attitudes towards Political Protest Before and After the Assassination
of Yitzhak Rabin.” Journal of Conflict Resolution 42 (December): pp. 721-43.
Zussman, A and Zissman, N 2006. “Assassinations: Evaluating the Effectiveness of
an Israeli Counterterrorism Policy Using Stock Market Data.” Journal of
Economic Perspectives, 20(2): pp. 193-206

258
Appendix
Chapter-2: Motivations of Dynastic Leaders
Definition of Variables and Sources
Dependent Variables
1. Parliamentary Attendance Ratio: For the 8th National Parliament, the attendance
ratio is computed by dividing the number of parliamentary days attended by the
number of days a legislator can attend in all 23 sessions. For the 9th National
Parliament, the ratio is computed by repeating the same procedure for first five
sessions since the parliament is still in progress. This information is collected from the
Legal Office of the National Parliament of Bangladesh
2. Legal Charges: It is binary dependent variable equal to one if a legislator in the 9th
National Parliament has a legal charge on his or her personal affidavit, or zero
otherwise. This information is compiled from reviewing all the affidavits which were
made available by the Bangladesh Election Commission [BEC] in June 2009.
3. Corruption Charges: It is binary dependent variable equal to one if a legislator in the
9th National Parliament has a corruption charge on his or her personal affidavit, or zero
otherwise. More specifically, two kinds of charges are categorized as corruption
charges. (I) political leaders charged under “Prevention of Corruption Act, 1947” (II)
political leaders charged under “Anti-Corruption Act 2004”. This information is
compiled from reviewing all the affidavits which were made available by the
Bangladesh Election Commission [BEC] in June 2009.
Explanatory Variables
1. Pre-relative: It is an indicator variable equal to one whenever a legislator as or had a
relative who was also a legislator. The definition of relative is for example- Wife,
Brother, Son, Daughter, Cousin, Grandson, Son-in-Law, Brother-in-law, etc. This
information is primarily taken from the Documentary on the Parliament by Rashid
and Feroz (2002) which provides detailed information on an MPs biological or social
link with other politicians. Interviews were also used to address any missing
information.
259
2. Son-Daughter: It is an indicator variable equal to one if a legislator is a son or
daughter of a current or past legislator. This information is primarily taken from the
Documentary on the Parliament by Rashid and Feroz (2002) which provides detailed
information on an MPs biological or social link with other politicians. Interviews were
also used to address any missing information.
3. Female: It is an indicator variable equal to one if the leader is not a male, and zero
otherwise.
4. Num. of Time MP: It is the total number of times a leader is elected to the office of
an MP. This information is taken from the Documentary on the Parliament by Rashid
and Feroz (2002) which provides detailed information on an MPs in the 8th National
Parliament. For the 9th National Parliament, I use the Member Directory on the 9th
National Parliament produced by National Democratic Institute for International
Affairs (NDI). For more information, see http://www.ndi.org/
5. Minister: It is an indicator variable equal to one if the leader is in the cabinet of the
present government (or was in the cabinet in last government). This information is
taken from the Documentary on the Parliament by Rashid and Feroz (2002) which
provides detailed information on an MPs in the 8th National Parliament. For the 9th
National Parliament, I use the Member Directory on the 9th National Parliament
produced by National Democratic Institute for International Affairs (NDI). For more
information, see http://www.ndi.org/
6. Businessman: It is an indicator variable equal to one if the leader is or was
businessman by profession, and zero otherwise. This information is taken from the
Documentary on the Parliament by Rashid and Feroz (2002) which provides detailed
information on an MPs in the 8th National Parliament. For the 9th National Parliament,
I use the Member Directory on the 9th National Parliament produced by National
Democratic Institute for International Affairs (NDI). For more information, see
http://www.ndi.org/
260
7. Non-Marginal Seat: It is a binary variable equal to one if the legislator won the
election by difference of more than twenty percentage points, and zero. This
information is taken from Bangladesh Election Commission [BEC]. For more
information see: http://www.ecs.gov.bd/English/index.php
8. Valid-Voter: It is a constituency characteristics, which represents the number of legal
votes a parliamentary seat had in elections for the 8th and 9th National Parliament. This
information is taken from Bangladesh Election Commission [BEC]. For more
information see: http://www.ecs.gov.bd/English/index.php
9. Distance-from-Dhaka: It is measure of distance in kilometres of constituencies from
the district of Dhaka. This is used as a crude proxy to measure how far a constituency
is from the parliament. This information is collected from the Office of the Ministry
of Communication, Government of Bangladesh.
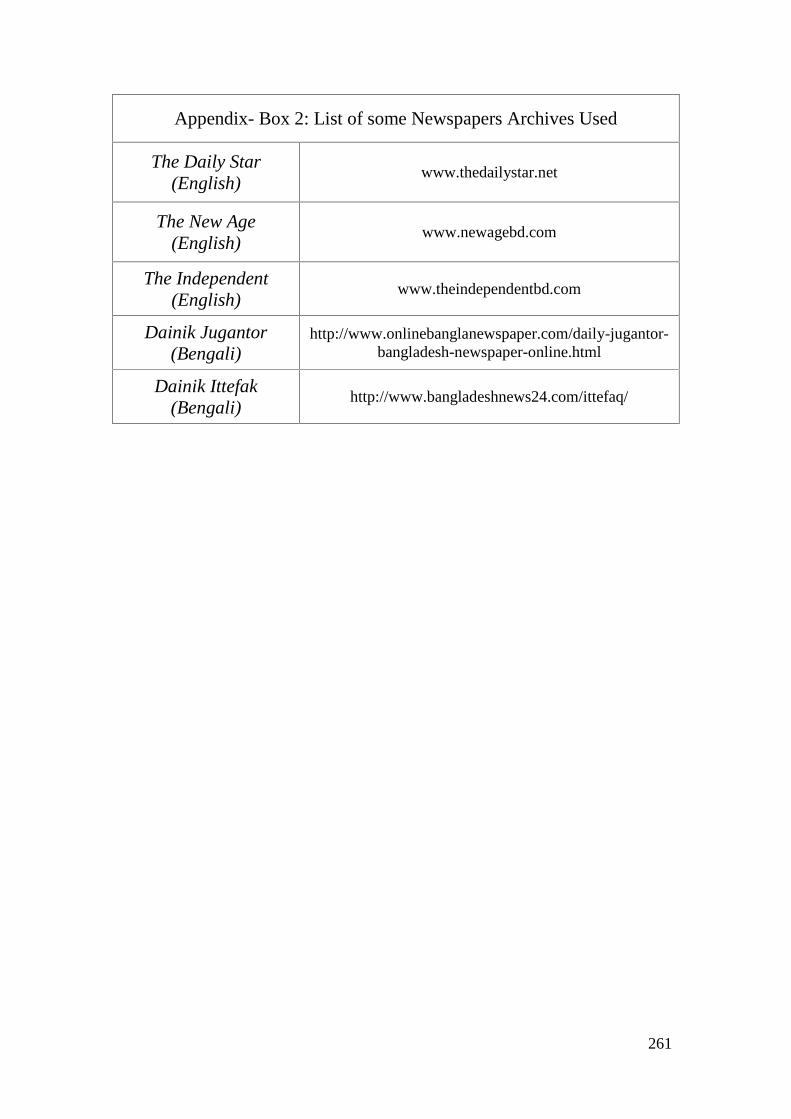
261
Appendix- Box 2: List of some Newspapers Archives Used
The Daily Star(English)
www.thedailystar.net
The New Age(English)
www.newagebd.com
The Independent(English)
www.theindependentbd.com
Dainik Jugantor(Bengali)
http://www.onlinebanglanewspaper.com/daily-jugantor-bangladesh-newspaper-online.html
Dainik Ittefak(Bengali)
http://www.bangladeshnews24.com/ittefaq/
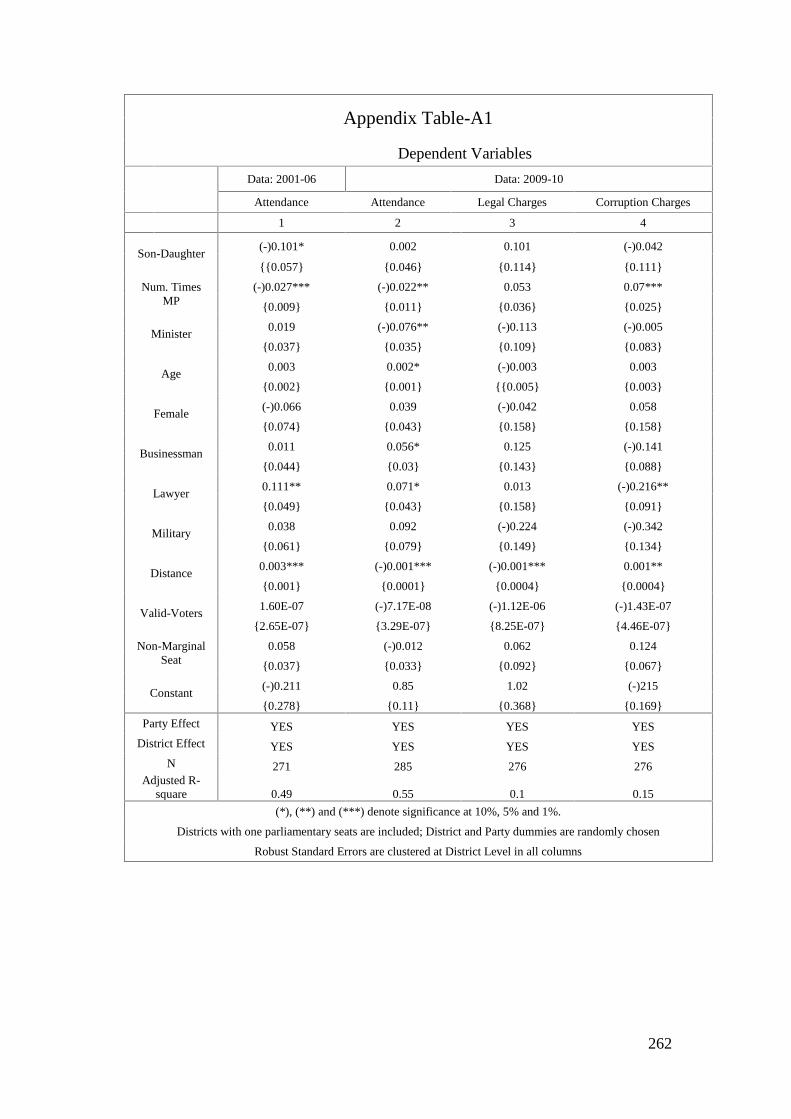
262
Appendix Table-A1
Dependent Variables
Data: 2001-06 Data: 2009-10
Attendance Attendance Legal Charges Corruption Charges
1 2 3 4
Son-Daughter(-)0.101* 0.002 0.101 (-)0.042
0.057 0.046 0.114 0.111
Num. TimesMP
(-)0.027*** (-)0.022** 0.053 0.07***
0.009 0.011 0.036 0.025
Minister0.019 (-)0.076** (-)0.113 (-)0.005
0.037 0.035 0.109 0.083
Age0.003 0.002* (-)0.003 0.003
0.002 0.001 0.005 0.003
Female(-)0.066 0.039 (-)0.042 0.058
0.074 0.043 0.158 0.158
Businessman0.011 0.056* 0.125 (-)0.141
0.044 0.03 0.143 0.088
Lawyer0.111** 0.071* 0.013 (-)0.216**
0.049 0.043 0.158 0.091
Military0.038 0.092 (-)0.224 (-)0.342
0.061 0.079 0.149 0.134
Distance0.003*** (-)0.001*** (-)0.001*** 0.001**
0.001 0.0001 0.0004 0.0004
Valid-Voters1.60E-07 (-)7.17E-08 (-)1.12E-06 (-)1.43E-07
2.65E-07 3.29E-07 8.25E-07 4.46E-07
Non-MarginalSeat
0.058 (-)0.012 0.062 0.124
0.037 0.033 0.092 0.067
Constant(-)0.211 0.85 1.02 (-)215
0.278 0.11 0.368 0.169
Party Effect YES YES YES YES
District Effect YES YES YES YES
N 271 285 276 276Adjusted R-
square 0.49 0.55 0.1 0.15
(*), (**) and (***) denote significance at 10%, 5% and 1%.
Districts with one parliamentary seats are included; District and Party dummies are randomly chosen
Robust Standard Errors are clustered at District Level in all columns
263
Chapter-3: Corruption and Dynasty Politics
Definition of Variables and Sources
Dependent Variables
1. Control of Corruption:This index is produced by the World Bank since 1996 in its
publication “Governance Indicators 1996-2005” (Kaufmann et al. 2006). It lies
between -2.5 and 2.5 for almost all countries, with highly corrupted countries scoring
towards -2.5. Please see: http://info.worldbank.org/governance/wgi/index.asp
2. Corruption Perception Index-CPI: This index is produced by Transparency
International.263 This index ranges from 10 (representing least corrupt) to 0
(representing most corrupt). Please see: www.transparency.org
3. Corrupt: This variable is taken from La Porta et al (1999). It ranges between 0 and 10,
where low scores indicate “senior government officials are likely to demand special
payments” and “illegal payments are generally expected in lower levels of
government” in the form of “bribes connected with imports and export licenses,
exchange controls, tax assessment, policy protection, or loans.
Explanatory Variables
1. Economic Development:I use the PPP GDP per capita in 2000 produced by the Penn
World Tables.
2. Openness: I use the measure ‘Openness’ to foreign trade in 2000 produced by the
Penn World Tables. Openness is measured by sum of export and import as a share of
GDP for the year 2000
3. Ethno-linguistic fractionalization: The variable ranges from (0) to (1), where (0)
reflects ethnically homogeneous regions. Ithas been taken from the Easterly and
Levine (1997).
263 For further information on Corruption Perception Index (CPI), visit the website:

264
4. Common Law: The variable identifies if the legal origin of Company Law or
Commercial Code of the country is Englishor not. Data on legal origin is taken from
La Porta et. al (1997, 1999).
5. Former British Colony: The variable identifies if a country has Britishcolonial
heritage. The information was collected fromLa Porta et. al (1997, 1999).
6. Federal: The variable identifies if a country has a federal structure. The definition of
Elazer (1995) is used in understanding if a country is federal or not. The data was
collected from Treisman (2000).
7. Uninterrupted Democracy: This variable measures if a country witnessed un-
interrupted democracy between 1950-2010 (or, since its independence if
independence is achieved after 1950). This measure is based on a classification that is
similar to the one provided by Alvarez et al. (1996), where they consider a country to
be democratic if: (i) the chief executive is elected, (ii) the legislature (at least the
lower house) is elected, (iii) [at least] two party contests election. The data was
collected from Treisman (2000).
8. POLITY: This variable is taken from the POLITY IV dataset. The POLITY variable
has 21 categories, ranging from -10 to +10, where -10 reflects extreme
autocracies.For more information, see:
http://www.systemicpeace.org/polity/polity4.htm

265
Appendix Box-3A: Summary Statistics for Independent Variables
N MeanStandard
Min MaxDeviation
Log GDP per Capita PPP 2000 132 8.54 1.178 6.16 10.78
Openness 132 84.25 53.8 2.02 377.68
Latitude 127 0.303 0.199 0.0111 0.7222
Protestant population as a % of130 12.73 21.36 0 97.8
total population
Roman Catholic population as % of130 32.83 36.29 0 97.3
total population
Muslim population as % of131 21.65 34.34 0 99.9
total population
Other population as % of130 33.22 31.66 0 100
total population
English Legal Origin 131 0.305 0.462 0 1
Socialist Legal Origin 131 0.176 0.382 0 1
French Legal Origin 131 0.435 0.498 0 1
German Legal Origin 131 0.0458 0.2099 0 1
Scandinavian Legal Origin 131 0.0382 0.192 0 1
Former British Colony 132 0.318 0.468 0 1
Never a Colony 127 0.173 0.379 0 1
Ethno-linguistic113 0.335 0.306 0 0.89
Fractionalization
Un-interrupted Democracy 131 0.252 0.436 0 1
Average Polity (1950-2000) 125 0.52 6.31 (-)10 10
Polity 2000 124 4.105 6.008 (-)10 10
GDP and Openness measures were taken from Penn World Tables 6.2
Legal Origin, Religious & Ethno-linguistic variables were taken from La Porta et al (1999)
Colonial and Democracy variables were taken from Treisman (2000)
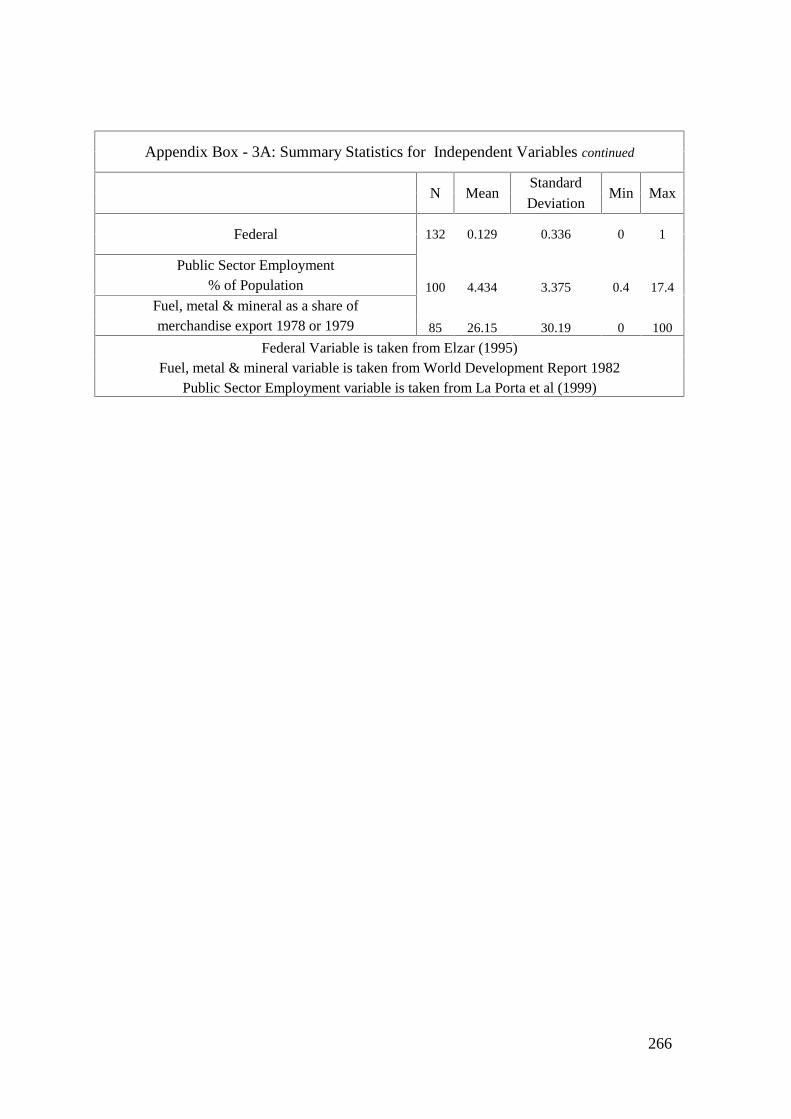
266
Appendix Box - 3A: Summary Statistics for Independent Variables continued
N MeanStandard
Min MaxDeviation
Federal 132 0.129 0.336 0 1
Public Sector Employment
100 4.434 3.375 0.4 17.4% of Population
Fuel, metal & mineral as a share of
85 26.15 30.19 0 100merchandise export 1978 or 1979
Federal Variable is taken from Elzar (1995)Fuel, metal & mineral variable is taken from World Development Report 1982
Public Sector Employment variable is taken from La Porta et al (1999)

267
Appendix-3B: List of e-sources
1. www.answer.com
2. www.bbc.co.uk
3. www.biographybase.com
4. www.brittanica.com
5. www.consortiumnews.com
6. www.cnn.com
7. www.datamass.net
8. www.europeanhistory.about.com
9. www.famousamericans.net
10. www.great-leaders.incredible-people.com/
11. www.guide2womenleaders.com/women_state_leaders.htm
12. www.infoplease.com
13. www.rulers.org
14. www.nationmaster.com
15. www.nytimes.com
16. www.thedailystar.net
17. www.timesofindia.com
18. www.timesherald.com
19. www.washintonpost.com
20. www.wordiq.com
21. www.worldbiography.net
22. www.worldpresidentsdb.com
23. www.worldstatesmen.org
24. Australian Dictionary of Biography(http://adbonline.anu.edu.au/adbonline.htm)
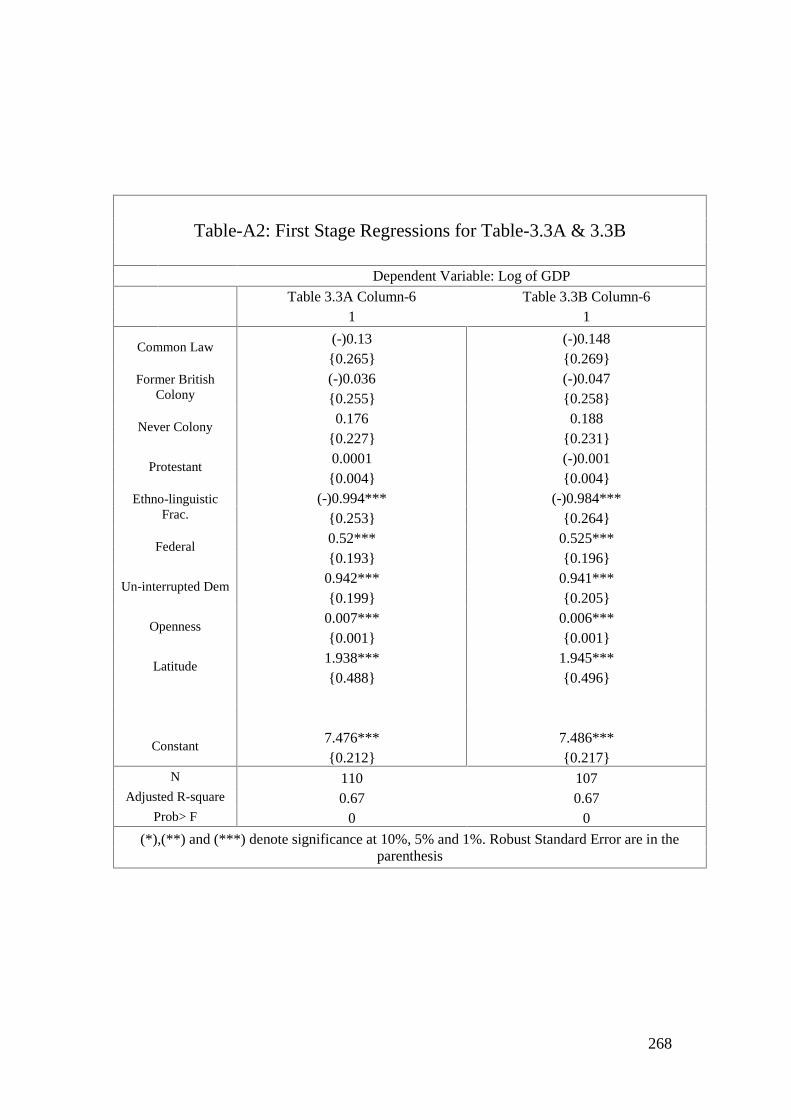
268
Table-A2: First Stage Regressions for Table-3.3A & 3.3B
Dependent Variable: Log of GDP
Table 3.3A Column-6 Table 3.3B Column-61 1
Common Law(-)0.13 (-)0.1480.265 0.269
Former BritishColony
(-)0.036 (-)0.0470.255 0.258
Never Colony0.176 0.188
0.227 0.231
Protestant0.0001 (-)0.0010.004 0.004
Ethno-linguisticFrac.
(-)0.994*** (-)0.984***0.253 0.264
Federal0.52*** 0.525***0.193 0.196
Un-interrupted Dem0.942*** 0.941***0.199 0.205
Openness0.007*** 0.006***0.001 0.001
Latitude1.938*** 1.945***0.488 0.496
Constant7.476*** 7.486***0.212 0.217
N 110 107Adjusted R-square 0.67 0.67
Prob> F 0 0
(*),(**) and (***) denote significance at 10%, 5% and 1%. Robust Standard Error are in theparenthesis

269
AlbaniaArmenia
Argentina
AustraliaAustria
Algeria
AngolaAzerbaijan
Botswana
Bangladesh
Bahamas
Brazil
Beluras
Belgium
BoliviaBurundi
Bulgaria
Barbados
Cameroon
Canada
Chile
China
Chad
Colombia
Congo, Democratic Republic
Costa Rica
Cote d'Ivoire
Croatia
Czech Republic
Cambodia
Denmark
Dominicam RepublicEgypt
Ecuador
Ethiopia
Estonia
El Salvador
France
Finland
Fiji
Germany
Gabon
Gambia
Georgia
Ghana
Greneda
GuineaGuinea-Bissau
Guyana
Guatemala
Haiti
Honduras
Hungary
Ireland
India
Indonesia
Iraq
Israel
Italy
Iran
Iceland
Jordan
Japan
Jamaica
KazakhstanKenya
Kuwait
Liberia
Latvia
Luxemberg
Lebanon
Lithuania
MadagascarMexicoMali
Mauritius
Malawi
Malaysia
Malta
Maldives
Mozambique
Morocco
NetherlandNewZealand
Nepal
North KoreaNiger
Norway
Nigeria
Nicaragua
Namibia
ParaguayPakistan
PanamaPeru
Philippines
Portugal
Poland
Russia
RwandaRomania
Saudi Arabia
Senegal
Sierra Leone
Singapore
South Africa
Syria
Sweden
Sri Lanka
Switzerland
Spain
Slovakia
Somalia
Sudan
South Korea
Taiwan
TanzaniaTogo
TurkeyThailand
Trinidad&TobagoTunisia
USA
Uganda
UK
Uruguay
UkraineUzbekistanVenezualaVietnamZambiaZimbabwe
-2
-1
0
1
2
3
0 .2 .4 .6 .8 1
Dynasty Index
95% CI Fitted values
Average Corruption WB
Appendix Figure – 3.1: Scatter All Countries in the Sample

270
AlbaniaArmenia
Argentina
AustraliaAustria
Algeria
AngolaAzerbaijan
Botswana
Bangladesh
Bahamas
Brazil
Beluras
Belgium
BoliviaBurundi
Bulgaria
Barbados
Cameroon
Canada
Chile
China
Chad
Colombia
Congo, Democratic Republic
Costa Rica
Cote d'Ivoire
Croatia
Czech Republic
Cambodia
Denmark
Dominicam RepublicEgypt
Ecuador
Ethiopia
Estonia
El Salvador
France
Finland
Fiji
Germany
Gabon
Gambia
Georgia
Ghana
Greneda
GuineaGuinea-Bissau
Guyana
Guatemala
Haiti
Honduras
Hungary
Ireland
India
Indonesia
Iraq
Israel
Italy
Iran
Iceland
Japan
Jamaica
KazakhstanKenya
Liberia
Latvia
Luxemberg
Lebanon
Lithuania
MadagascarMexicoMali
Mauritius
Malawi
Malaysia
Malta
Maldives
Mozambique
NetherlandNewZealand
Nepal
North KoreaNiger
Norway
Nigeria
Nicaragua
Namibia
ParaguayPakistan
PanamaPeruPhilippines
Portugal
Poland
Russia
RwandaRomaniaSenegal
Sierra Leone
Singapore
South Africa
Syria
Sweden
Sri Lanka
Switzerland
Spain
Slovakia
Somalia
Sudan
South Korea
Taiwan
TanzaniaTogo
TurkeyThailand
Trinidad&TobagoTunisia
USA
Uganda
UK
Uruguay
UkraineUzbekistanVenezualaVietnamZambiaZimbabwe
-2
-1
0
1
2
3
0 .2 .4 .6 .8 1
Dynasty Index
95% CI Fitted values
Average Corruption WB
Appendix Figure – 3.2: Scatter without Monarchies
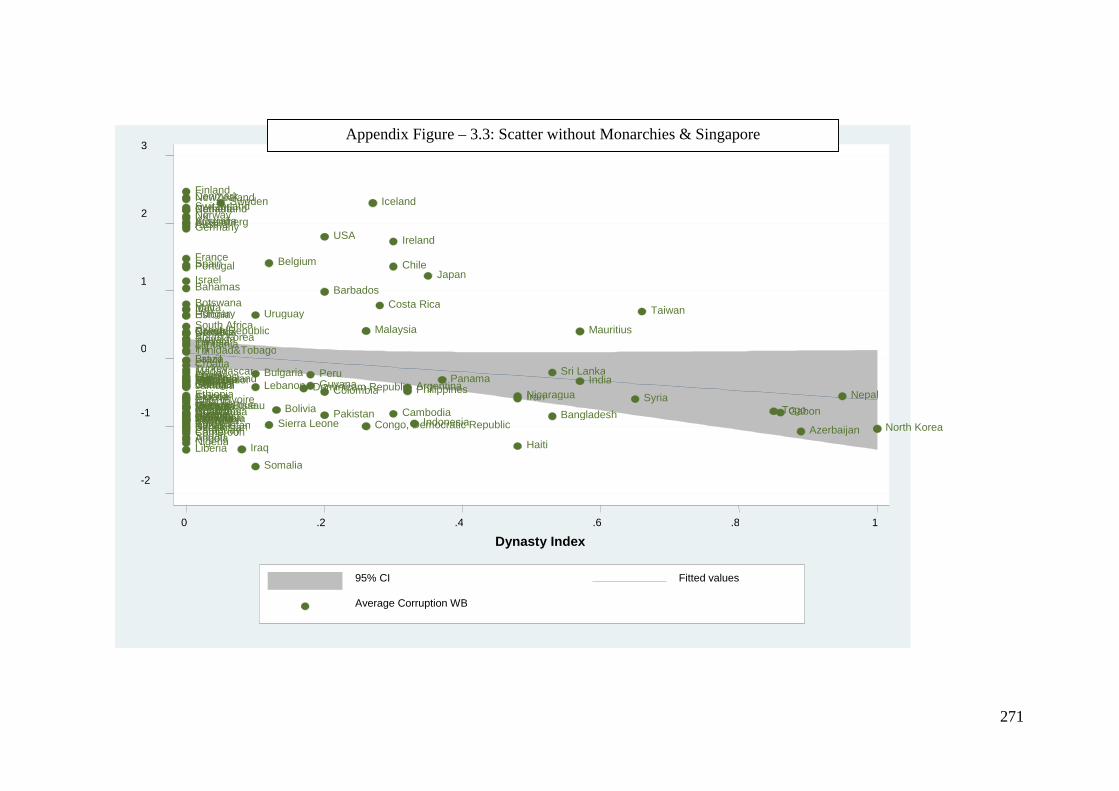
271
AlbaniaArmenia
Argentina
AustraliaAustria
Algeria
AngolaAzerbaijan
Botswana
Bangladesh
Bahamas
Brazil
Beluras
Belgium
BoliviaBurundi
Bulgaria
Barbados
Cameroon
Canada
Chile
China
Chad
Colombia
Congo, Democratic Republic
Costa Rica
Cote d'Ivoire
Croatia
Czech Republic
Cambodia
Denmark
Dominicam RepublicEgypt
Ecuador
Ethiopia
Estonia
El Salvador
France
Finland
Fiji
Germany
Gabon
Gambia
Georgia
Ghana
Greneda
GuineaGuinea-Bissau
Guyana
Guatemala
Haiti
Honduras
Hungary
Ireland
India
Indonesia
Iraq
Israel
Italy
Iran
Iceland
Japan
Jamaica
KazakhstanKenya
Liberia
Latvia
Luxemberg
Lebanon
Lithuania
MadagascarMexicoMali
Mauritius
Malawi
Malaysia
Malta
Maldives
Mozambique
NetherlandNewZealand
Nepal
North KoreaNiger
Norway
Nigeria
Nicaragua
Namibia
ParaguayPakistan
PanamaPeruPhilippines
Portugal
Poland
Russia
RwandaRomaniaSenegal
Sierra Leone
South Africa
Syria
Sweden
Sri Lanka
Switzerland
Spain
Slovakia
Somalia
Sudan
South Korea
Taiwan
TanzaniaTogo
TurkeyThailand
Trinidad&TobagoTunisia
USA
Uganda
UK
Uruguay
UkraineUzbekistanVenezualaVietnamZambiaZimbabwe
-2
-1
0
1
2
3
0 .2 .4 .6 .8 1
Dynasty Index
95% CI Fitted values
Average Corruption WB
Appendix Figure – 3.3: Scatter without Monarchies & Singapore
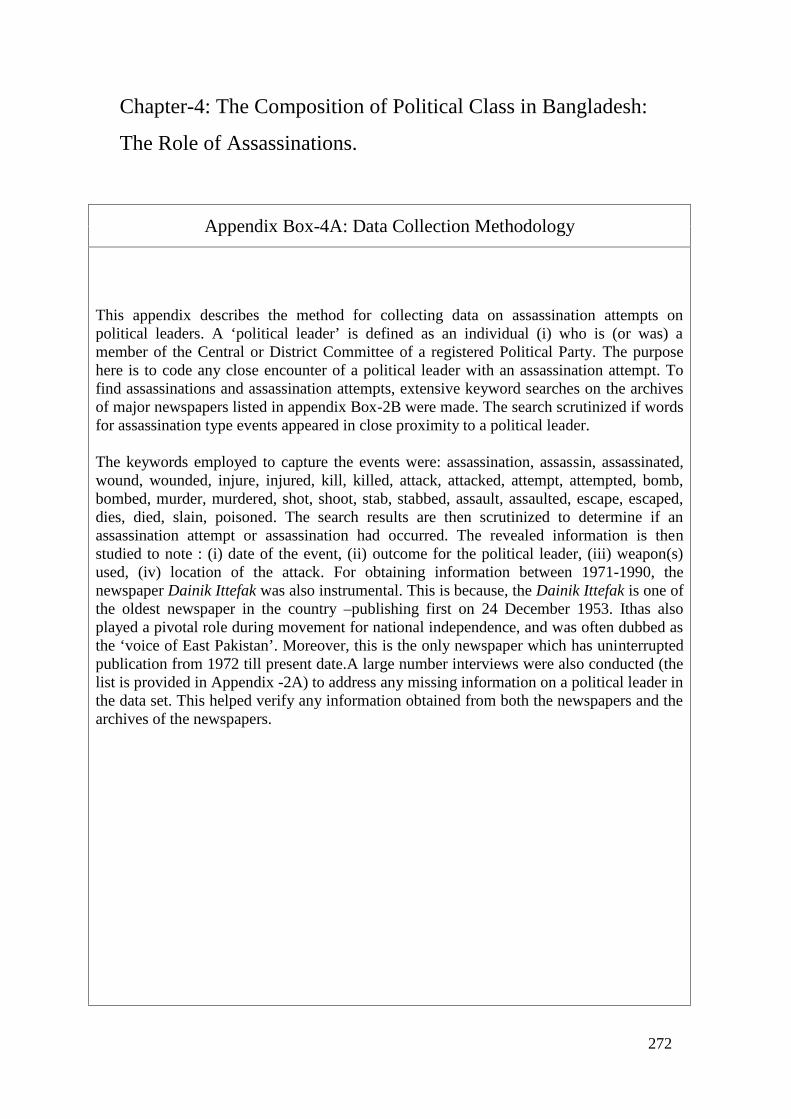
272
Chapter-4: The Composition of Political Class in Bangladesh:
The Role of Assassinations.
Appendix Box-4A: Data Collection Methodology
This appendix describes the method for collecting data on assassination attempts onpolitical leaders. A ‘political leader’ is defined as an individual (i) who is (or was) amember of the Central or District Committee of a registered Political Party. The purposehere is to code any close encounter of a political leader with an assassination attempt. Tofind assassinations and assassination attempts, extensive keyword searches on the archivesof major newspapers listed in appendix Box-2B were made. The search scrutinized if wordsfor assassination type events appeared in close proximity to a political leader.
The keywords employed to capture the events were: assassination, assassin, assassinated,wound, wounded, injure, injured, kill, killed, attack, attacked, attempt, attempted, bomb,bombed, murder, murdered, shot, shoot, stab, stabbed, assault, assaulted, escape, escaped,dies, died, slain, poisoned. The search results are then scrutinized to determine if anassassination attempt or assassination had occurred. The revealed information is thenstudied to note : (i) date of the event, (ii) outcome for the political leader, (iii) weapon(s)used, (iv) location of the attack. For obtaining information between 1971-1990, thenewspaper Dainik Ittefak was also instrumental. This is because, the Dainik Ittefak is one ofthe oldest newspaper in the country –publishing first on 24 December 1953. Ithas alsoplayed a pivotal role during movement for national independence, and was often dubbed asthe ‘voice of East Pakistan’. Moreover, this is the only newspaper which has uninterruptedpublication from 1972 till present date.A large number interviews were also conducted (thelist is provided in Appendix -2A) to address any missing information on a political leader inthe data set. This helped verify any information obtained from both the newspapers and thearchives of the newspapers.
273
Appendix-4B: Why Focus on Divisional Level Data?
After Independence in 1971, the country was divided into four administrativeDivisions. These four administrative divisions were: Dhaka, Rajshahi, Khulna andChittagong. These four administrative divisions were further subdivided into 20districts. At present there are six administrative Division since in 1993 Barisaldivision was created by splitting off Khulna, and in 1995 Sylhet division was createdby splitting it from Chittagong. Moreover, the number of districts has also risen from20 to 64. Now, according to the methodology of Bangladesh Bureau of Statistics,divisional parameters are formed from district parameters. This, in practice, allowsthe computation of economic characteristics (ex-agricultural wage rate) of Sylhet andBarisal Division for periods between 1971 and 1998 even though they did not exitofficially during the specified time span. On the other hand, due to the lack ofavailability of sufficient sub-district level data for periods between 1971 and 1981, thecomputation of economic characteristics of the 44 districts that did not exist between1971-1981is not possible. This has, to an extent, compelled the analysis to usedivisional level data and not district level data.
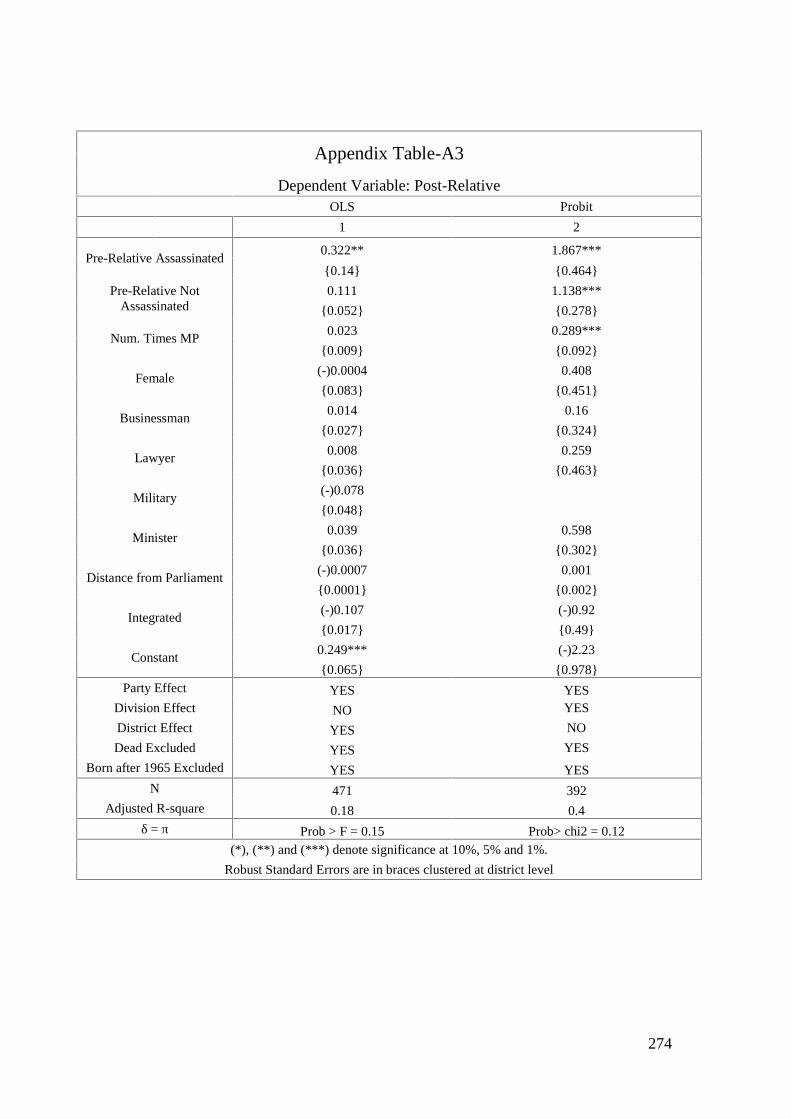
274
Appendix Table-A3
Dependent Variable: Post-RelativeOLS Probit
1 2
Pre-Relative Assassinated0.322** 1.867***
0.14 0.464
Pre-Relative NotAssassinated
0.111 1.138***
0.052 0.278
Num. Times MP0.023 0.289***
0.009 0.092
Female(-)0.0004 0.408
0.083 0.451
Businessman0.014 0.16
0.027 0.324
Lawyer0.008 0.259
0.036 0.463
Military(-)0.078
0.048
Minister0.039 0.598
0.036 0.302
Distance from Parliament(-)0.0007 0.001
0.0001 0.002
Integrated(-)0.107 (-)0.92
0.017 0.49
Constant0.249*** (-)2.23
0.065 0.978Party Effect YES YES
Division Effect NO YES
District Effect YES NO
Dead Excluded YES YES
Born after 1965 Excluded YES YESN 471 392
Adjusted R-square 0.18 0.4δ = π Prob > F = 0.15 Prob> chi2 = 0.12
(*), (**) and (***) denote significance at 10%, 5% and 1%.
Robust Standard Errors are in braces clustered at district level
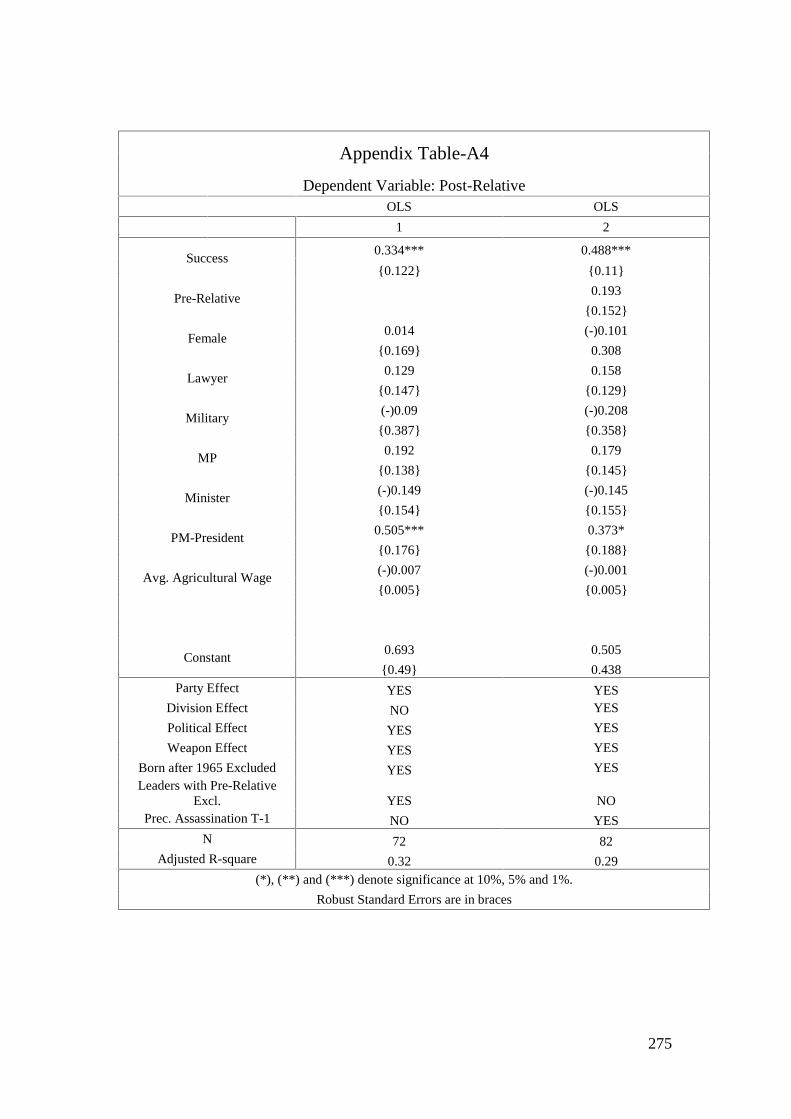
275
Appendix Table-A4
Dependent Variable: Post-RelativeOLS OLS
1 2
Success0.334*** 0.488***
0.122 0.11
Pre-Relative0.193
0.152
Female0.014 (-)0.101
0.169 0.308
Lawyer0.129 0.158
0.147 0.129
Military(-)0.09 (-)0.208
0.387 0.358
MP0.192 0.179
0.138 0.145
Minister(-)0.149 (-)0.145
0.154 0.155
PM-President0.505*** 0.373*
0.176 0.188
Avg. Agricultural Wage(-)0.007 (-)0.001
0.005 0.005
Constant0.693 0.505
0.49 0.438Party Effect YES YES
Division Effect NO YES
Political Effect YES YES
Weapon Effect YES YES
Born after 1965 Excluded YES YESLeaders with Pre-Relative
Excl. YES NOPrec. Assassination T-1 NO YES
N 72 82Adjusted R-square 0.32 0.29
(*), (**) and (***) denote significance at 10%, 5% and 1%.
Robust Standard Errors are in braces
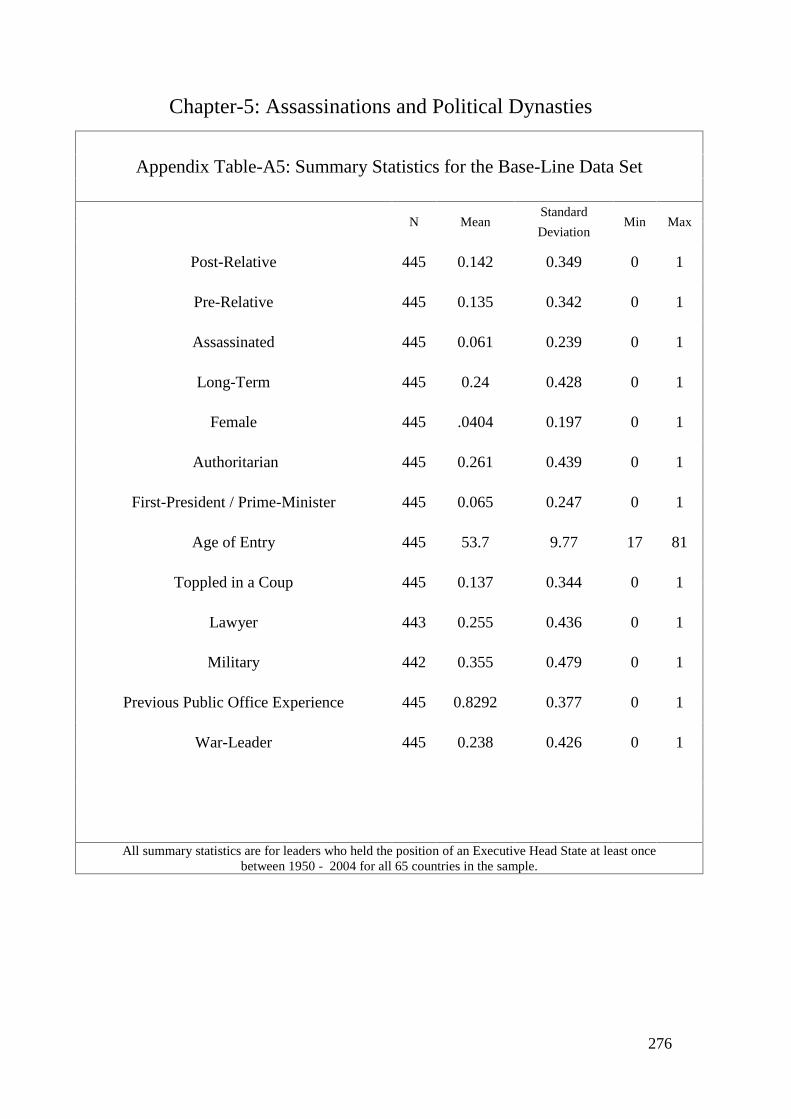
276
Chapter-5: Assassinations and Political Dynasties
Appendix Table-A5: Summary Statistics for the Base-Line Data Set
N MeanStandard
Min MaxDeviation
Post-Relative 445 0.142 0.349 0 1
Pre-Relative 445 0.135 0.342 0 1
Assassinated 445 0.061 0.239 0 1
Long-Term 445 0.24 0.428 0 1
Female 445 .0404 0.197 0 1
Authoritarian 445 0.261 0.439 0 1
First-President / Prime-Minister 445 0.065 0.247 0 1
Age of Entry 445 53.7 9.77 17 81
Toppled in a Coup 445 0.137 0.344 0 1
Lawyer 443 0.255 0.436 0 1
Military 442 0.355 0.479 0 1
Previous Public Office Experience 445 0.8292 0.377 0 1
War-Leader 445 0.238 0.426 0 1
All summary statistics are for leaders who held the position of an Executive Head State at least oncebetween 1950 - 2004 for all 65 countries in the sample.
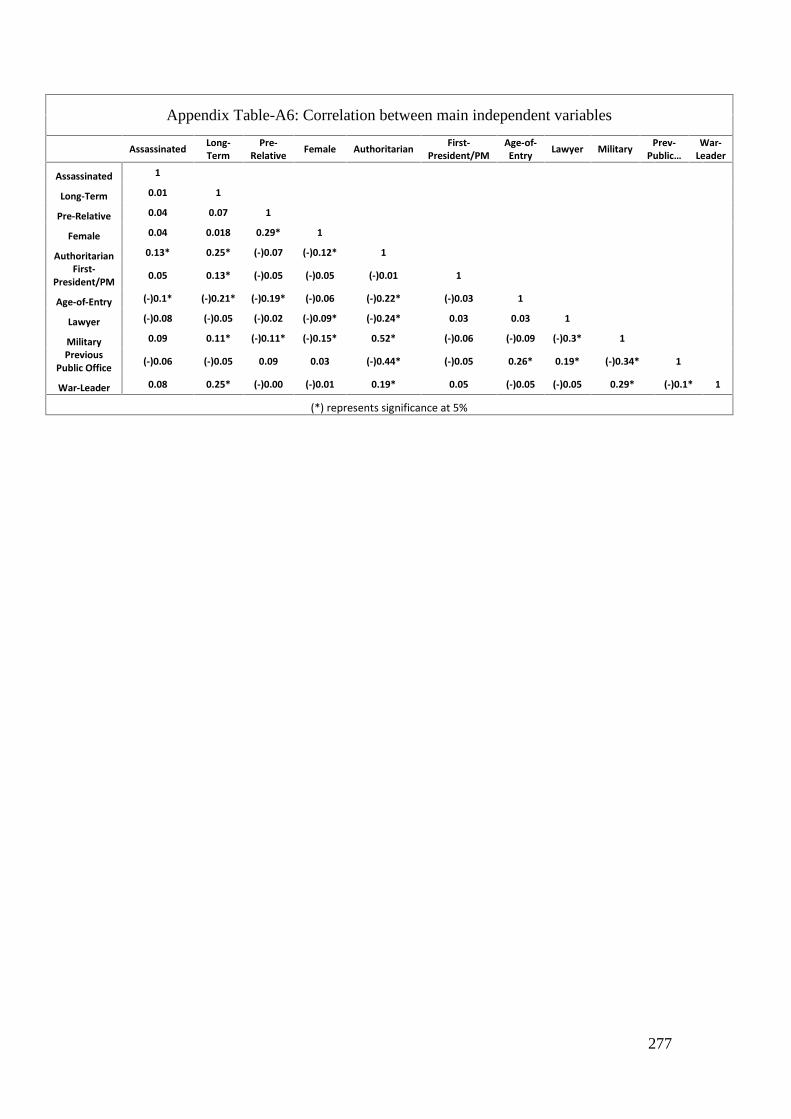
277
Appendix Table-A6: Correlation between main independent variables
Assassinated Long-Term
Pre-Relative Female Authoritarian First-
President/PMAge-of-Entry Lawyer Military Prev-
Public…War-
Leader
Assassinated 1
Long-Term 0.01 1
Pre-Relative 0.04 0.07 1
Female 0.04 0.018 0.29* 1
Authoritarian 0.13* 0.25* (-)0.07 (-)0.12* 1First-
President/PM 0.05 0.13* (-)0.05 (-)0.05 (-)0.01 1
Age-of-Entry (-)0.1* (-)0.21* (-)0.19* (-)0.06 (-)0.22* (-)0.03 1
Lawyer (-)0.08 (-)0.05 (-)0.02 (-)0.09* (-)0.24* 0.03 0.03 1
Military 0.09 0.11* (-)0.11* (-)0.15* 0.52* (-)0.06 (-)0.09 (-)0.3* 1Previous
Public Office (-)0.06 (-)0.05 0.09 0.03 (-)0.44* (-)0.05 0.26* 0.19* (-)0.34* 1
War-Leader 0.08 0.25* (-)0.00 (-)0.01 0.19* 0.05 (-)0.05 (-)0.05 0.29* (-)0.1* 1
(*) represents significance at 5%

278
Appendix Table-A7: Summary Statistics for Leaders in Jones and Olken (2009) - Data Set.
N MeanStandard
Min MaxDeviation
Post-Relative 196 0.2143 0.4114 0 1
Pre-Relative 196 0.1735 0.3796 0 1
SUCCESS 201 0.2985 0.4587 0 1
Long-Term 201 0.4527 0.499 0 1
Female 196 0.0153 0.1231 0 1
Authoritarian 195 0.3589 0.4809 0 1
First-President / Prime-Minister 196 0.0867 0.2822 0 1
Age of Entry 199 47.1 12.21 16 76
Toppled in a Coup 195 0.1589 0.3666 0 1
Lawyer 193 0.1865 0.3905 0 1
Military 192 0.4323 0.4967 0 1
Previous Public Office Experience 193 0.6995 0.4597 0 1
War-Leader 191 0.4031 0.4918 0 1
Personal information on all the National Leaders in Jones and Olken (2009) data set is collected from the e-sourceslisted in Appendix - 3B.
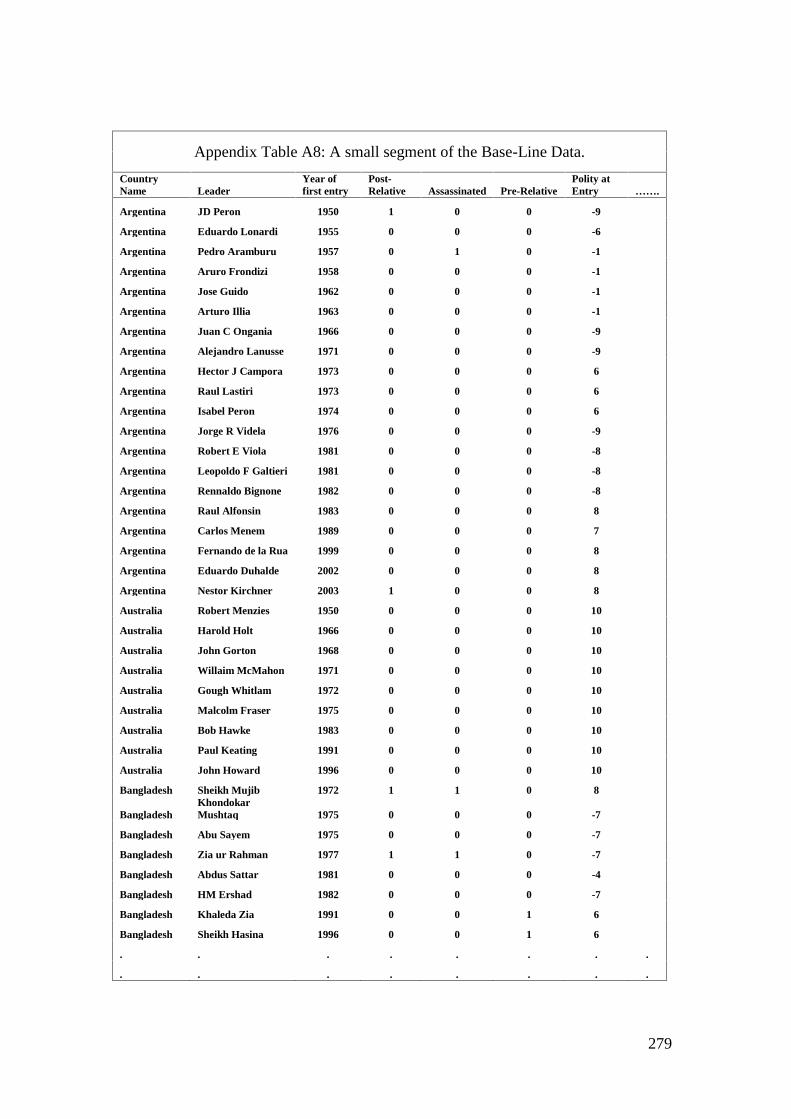
279
Appendix Table A8: A small segment of the Base-Line Data.
CountryName Leader
Year offirst entry
Post-Relative Assassinated Pre-Relative
Polity atEntry …….
Argentina JD Peron 1950 1 0 0 -9
Argentina Eduardo Lonardi 1955 0 0 0 -6
Argentina Pedro Aramburu 1957 0 1 0 -1
Argentina Aruro Frondizi 1958 0 0 0 -1
Argentina Jose Guido 1962 0 0 0 -1
Argentina Arturo Illia 1963 0 0 0 -1
Argentina Juan C Ongania 1966 0 0 0 -9
Argentina Alejandro Lanusse 1971 0 0 0 -9
Argentina Hector J Campora 1973 0 0 0 6
Argentina Raul Lastiri 1973 0 0 0 6
Argentina Isabel Peron 1974 0 0 0 6
Argentina Jorge R Videla 1976 0 0 0 -9
Argentina Robert E Viola 1981 0 0 0 -8
Argentina Leopoldo F Galtieri 1981 0 0 0 -8
Argentina Rennaldo Bignone 1982 0 0 0 -8
Argentina Raul Alfonsin 1983 0 0 0 8
Argentina Carlos Menem 1989 0 0 0 7
Argentina Fernando de la Rua 1999 0 0 0 8
Argentina Eduardo Duhalde 2002 0 0 0 8
Argentina Nestor Kirchner 2003 1 0 0 8
Australia Robert Menzies 1950 0 0 0 10
Australia Harold Holt 1966 0 0 0 10
Australia John Gorton 1968 0 0 0 10
Australia Willaim McMahon 1971 0 0 0 10
Australia Gough Whitlam 1972 0 0 0 10
Australia Malcolm Fraser 1975 0 0 0 10
Australia Bob Hawke 1983 0 0 0 10
Australia Paul Keating 1991 0 0 0 10
Australia John Howard 1996 0 0 0 10
Bangladesh Sheikh Mujib 1972 1 1 0 8
BangladeshKhondokarMushtaq 1975 0 0 0 -7
Bangladesh Abu Sayem 1975 0 0 0 -7
Bangladesh Zia ur Rahman 1977 1 1 0 -7
Bangladesh Abdus Sattar 1981 0 0 0 -4
Bangladesh HM Ershad 1982 0 0 0 -7
Bangladesh Khaleda Zia 1991 0 0 1 6
Bangladesh Sheikh Hasina 1996 0 0 1 6
. . . . . . . .
. . . . . . . .
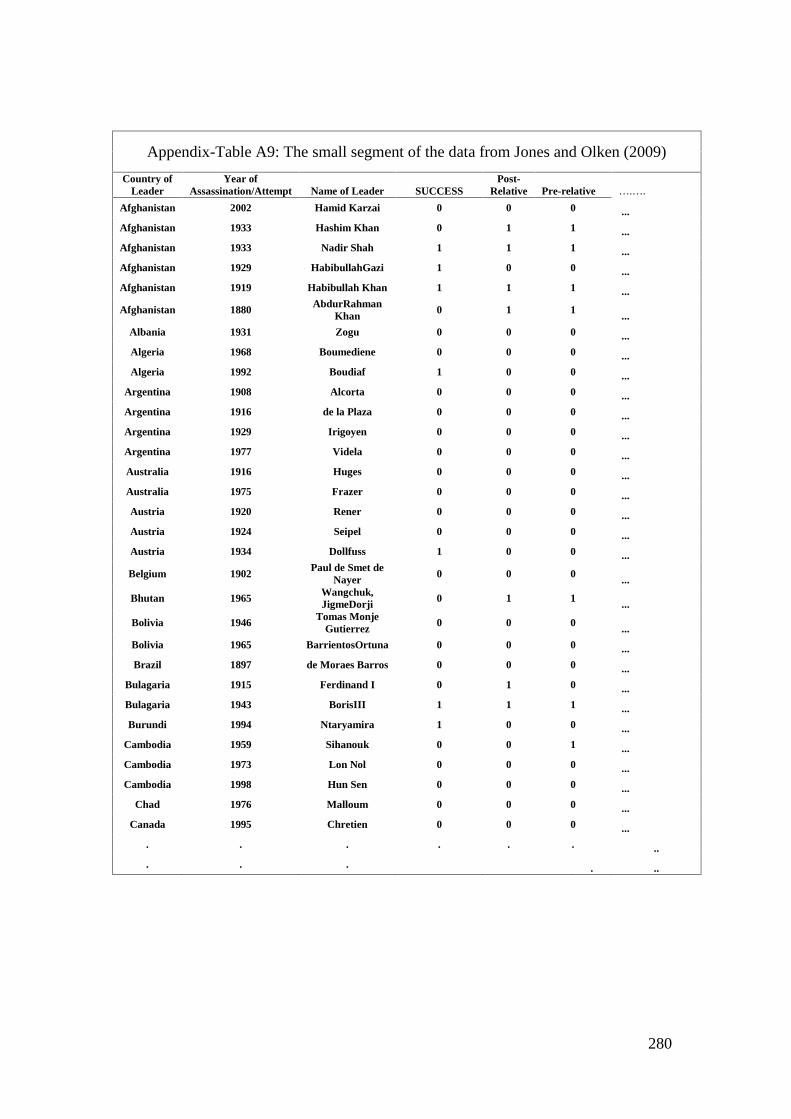
280
Appendix-Table A9: The small segment of the data from Jones and Olken (2009)
Country ofLeader
Year ofAssassination/Attempt Name of Leader SUCCESS
Post-Relative Pre-relative ….….
Afghanistan 2002 Hamid Karzai 0 0 0 ...
Afghanistan 1933 Hashim Khan 0 1 1 ...
Afghanistan 1933 Nadir Shah 1 1 1 ...
Afghanistan 1929 HabibullahGazi 1 0 0 ...
Afghanistan 1919 Habibullah Khan 1 1 1 ...
Afghanistan 1880 AbdurRahmanKhan
0 1 1...
Albania 1931 Zogu 0 0 0 ...
Algeria 1968 Boumediene 0 0 0 ...
Algeria 1992 Boudiaf 1 0 0 ...
Argentina 1908 Alcorta 0 0 0 ...
Argentina 1916 de la Plaza 0 0 0 ...
Argentina 1929 Irigoyen 0 0 0 ...
Argentina 1977 Videla 0 0 0 ...
Australia 1916 Huges 0 0 0 ...
Australia 1975 Frazer 0 0 0 ...
Austria 1920 Rener 0 0 0 ...
Austria 1924 Seipel 0 0 0 ...
Austria 1934 Dollfuss 1 0 0 ...
Belgium 1902Paul de Smet de
Nayer 0 0 0 ...
Bhutan 1965 Wangchuk,JigmeDorji 0 1 1 ...
Bolivia 1946 Tomas MonjeGutierrez
0 0 0...
Bolivia 1965 BarrientosOrtuna 0 0 0 ...
Brazil 1897 de Moraes Barros 0 0 0 ...
Bulagaria 1915 Ferdinand I 0 1 0 ...
Bulagaria 1943 BorisIII 1 1 1 ...
Burundi 1994 Ntaryamira 1 0 0 ...
Cambodia 1959 Sihanouk 0 0 1 ...
Cambodia 1973 Lon Nol 0 0 0 ...
Cambodia 1998 Hun Sen 0 0 0 ...
Chad 1976 Malloum 0 0 0 ...
Canada 1995 Chretien 0 0 0 ...
. . . . . . ..
. . . . ..
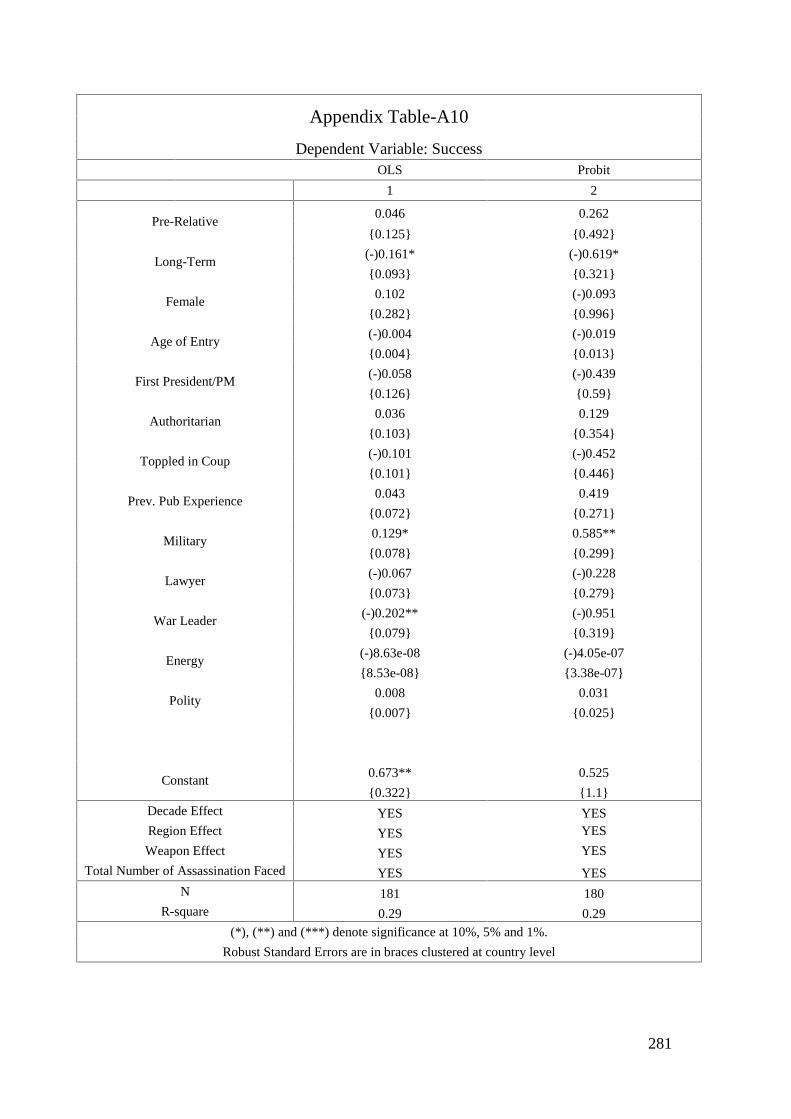
281
Appendix Table-A10
Dependent Variable: SuccessOLS Probit
1 2
Pre-Relative0.046 0.262
0.125 0.492
Long-Term(-)0.161* (-)0.619*
0.093 0.321
Female0.102 (-)0.093
0.282 0.996
Age of Entry(-)0.004 (-)0.019
0.004 0.013
First President/PM(-)0.058 (-)0.439
0.126 0.59
Authoritarian0.036 0.129
0.103 0.354
Toppled in Coup(-)0.101 (-)0.452
0.101 0.446
Prev. Pub Experience0.043 0.419
0.072 0.271
Military0.129* 0.585**
0.078 0.299
Lawyer(-)0.067 (-)0.228
0.073 0.279
War Leader(-)0.202** (-)0.951
0.079 0.319
Energy(-)8.63e-08 (-)4.05e-07
8.53e-08 3.38e-07
Polity0.008 0.031
0.007 0.025
Constant0.673** 0.525
0.322 1.1Decade Effect YES YESRegion Effect YES YES
Weapon Effect YES YES
Total Number of Assassination Faced YES YESN 181 180
R-square 0.29 0.29(*), (**) and (***) denote significance at 10%, 5% and 1%.
Robust Standard Errors are in braces clustered at country level
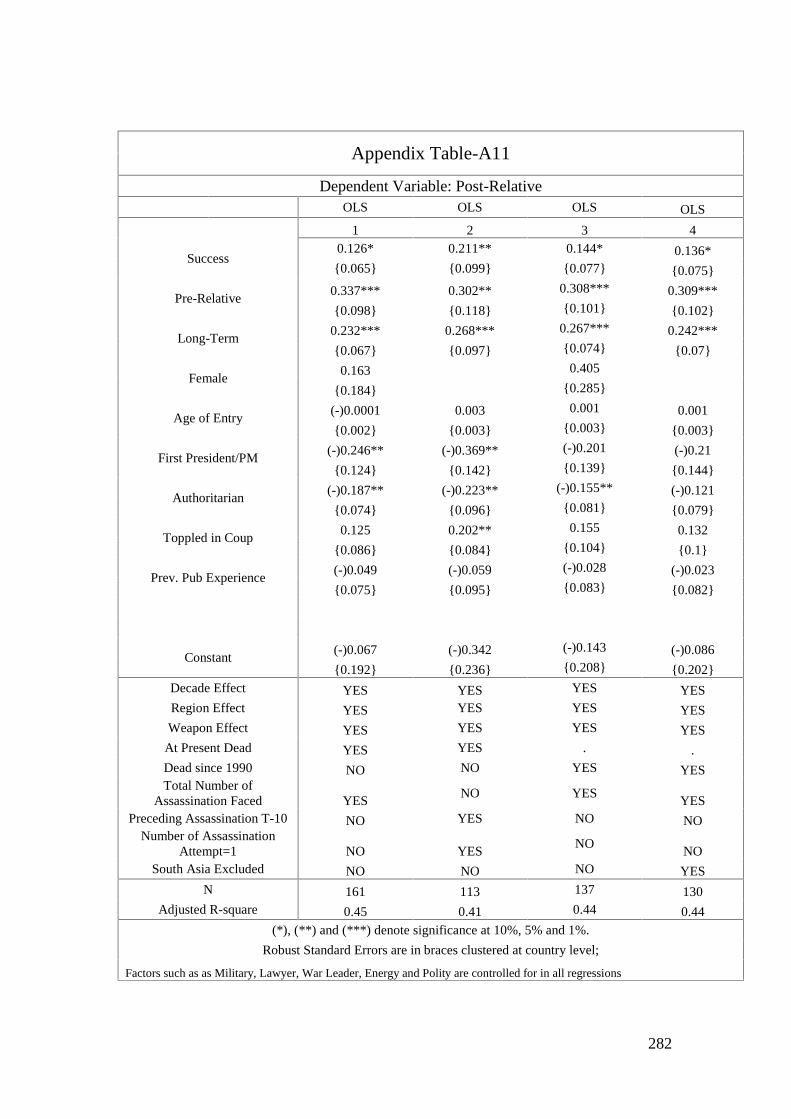
282
Appendix Table-A11
Dependent Variable: Post-RelativeOLS OLS OLS OLS
1 2 3 4
Success0.126* 0.211** 0.144* 0.136*0.065 0.099 0.077 0.075
Pre-Relative0.337*** 0.302** 0.308*** 0.309***
0.098 0.118 0.101 0.102
Long-Term0.232*** 0.268*** 0.267*** 0.242***
0.067 0.097 0.074 0.07
Female0.163 0.405
0.184 0.285
Age of Entry(-)0.0001 0.003 0.001 0.001
0.002 0.003 0.003 0.003
First President/PM(-)0.246** (-)0.369** (-)0.201 (-)0.21
0.124 0.142 0.139 0.144
Authoritarian(-)0.187** (-)0.223** (-)0.155** (-)0.121
0.074 0.096 0.081 0.079
Toppled in Coup0.125 0.202** 0.155 0.132
0.086 0.084 0.104 0.1
Prev. Pub Experience(-)0.049 (-)0.059 (-)0.028 (-)0.023
0.075 0.095 0.083 0.082
Constant(-)0.067 (-)0.342 (-)0.143 (-)0.086
0.192 0.236 0.208 0.202Decade Effect YES YES YES YESRegion Effect YES YES YES YESWeapon Effect YES YES YES YES
At Present Dead YES YES . .Dead since 1990 NO NO YES YESTotal Number of
Assassination Faced YESNO YES
YESPreceding Assassination T-10 NO YES NO NO
Number of AssassinationAttempt=1 NO YES
NONO
South Asia Excluded NO NO NO YESN 161 113 137 130
Adjusted R-square 0.45 0.41 0.44 0.44(*), (**) and (***) denote significance at 10%, 5% and 1%.
Robust Standard Errors are in braces clustered at country level;
Factors such as as Military, Lawyer, War Leader, Energy and Polity are controlled for in all regressions


![The Purana text of the dynasties of the Kali age [microform]](https://static.fdokumen.com/doc/165x107/6325923d051fac18490d53eb/the-purana-text-of-the-dynasties-of-the-kali-age-microform.jpg)