Essays in experimental and development economics
194
HAL Id: tel-03721170 https://tel.archives-ouvertes.fr/tel-03721170 Submitted on 12 Jul 2022 HAL is a multi-disciplinary open access archive for the deposit and dissemination of sci- entific research documents, whether they are pub- lished or not. The documents may come from teaching and research institutions in France or abroad, or from public or private research centers. L’archive ouverte pluridisciplinaire HAL, est destinée au dépôt et à la diffusion de documents scientifiques de niveau recherche, publiés ou non, émanant des établissements d’enseignement et de recherche français ou étrangers, des laboratoires publics ou privés. Essays in experimental and development economics Gwen-Jiro Clochard To cite this version: Gwen-Jiro Clochard. Essays in experimental and development economics. Economics and Finance. Institut Polytechnique de Paris, 2022. English. NNT: 2022IPPAX052. tel-03721170
-
Upload
khangminh22 -
Category
Documents
-
view
0 -
download
0
Transcript of Essays in experimental and development economics

HAL Id: tel-03721170https://tel.archives-ouvertes.fr/tel-03721170
Submitted on 12 Jul 2022
HAL is a multi-disciplinary open accessarchive for the deposit and dissemination of sci-entific research documents, whether they are pub-lished or not. The documents may come fromteaching and research institutions in France orabroad, or from public or private research centers.
L’archive ouverte pluridisciplinaire HAL, estdestinée au dépôt et à la diffusion de documentsscientifiques de niveau recherche, publiés ou non,émanant des établissements d’enseignement et derecherche français ou étrangers, des laboratoirespublics ou privés.
Essays in experimental and development economicsGwen-Jiro Clochard
To cite this version:Gwen-Jiro Clochard. Essays in experimental and development economics. Economics and Finance.Institut Polytechnique de Paris, 2022. English. �NNT : 2022IPPAX052�. �tel-03721170�

626
NN
T:2
022I
PPA
X05
2
Essays in Development andExperimental Economics
Thèse de doctorat de l’Institut Polytechnique de Parispréparée à l’École polytechnique
École doctorale n◦626 École doctorale de l’Institut Polytechnique de Paris (EDIPP)Spécialité de doctorat : Sciences économiques
Thèse présentée et soutenue à Palaiseau, le 05 Juillet 2022, par
GWEN-JIRO CLOCHARD
Composition du Jury :
Nobuyuki HanakiProfessor, Institute of Social and Economic Research, OsakaUniversity Président du jury
Lori A. BeamanAssociate Professor, Northwestern University Rapporteure
Andreas KotsadamProfessor, University of Oslo (Department of Psychology) Rapporteur
Pauline RossiProfesseure, Ecole polytechnique (CREST) Examinatrice
Guillaume HollardProfesseur, Ecole polytechnique - Directeur de recherche, CNRS Directeur de thèse


Acknowledgments - Remerciements
La premiere personne que je souhaite remercier est Guillaume Hollard, mon directeur
de these, pour son accompagnement tout au long de ce doctorat. Depuis notre premiere
rencontre a une soutenance de projet 3A, aux voyages au Senegal, conferences a Dijon ou
Abu Dhabi, retraites a Fontainebleau, et ces innombrables discussions dans son bureau a
parler de Ligue 1 et parfois de recherche, ses conseils precieux m’ont permis de grandir en
tant que chercheur mais aussi dans la vie. Je lui suis infiniment reconnaissant.
I thank Lori Beaman and Andreas Kotsadam for accepting to review my thesis, Pauline
Rossi and Nobuyuki Hanaki for being part of the jury. Their research truly inspired me
and it is an honor to have such esteemed reviewers and examiners of my dissertation. I
would add a special thank to Lori and Pauline for their incredibly valuable advice through
the job market. The period was not easy, but their advice and guidance helped me reach
my objectives.
I would like to thank my coauthors Julia Wirtz, Clement Mettling, Charlotte Faurie,
Michel Raymond and Marc Willinger for their help in my research projects. Je voudrais
en particulier remercier mes coauteurs et amis Aby Mbengue, Omar Sene et Birane Diouf.
I also thank all CREST researchers for their help, discussions and remarks. I am in
particular thankful to Pierre Boyer, Isabelle Mejean, Francis Kramarz, Emmanuelle Tau-
gourdeau, Julien Combe, Yukio Koriyama, Jean-Baptiste Michau and Benoit Schmutz.
J’aimerais remercier Wael Bousselmi pour son aide pour preparer les experiences qui
constituent cette these. Je suis egalement reconnaissant de l’aide dans les aspects lo-
gistiques et administratifs de Weronika Leduc, Teddy Arrif, Murielle Jules, Lyza Racon,
Eliane Madeleine, Fanda Traore et Edith Verger.
J’aimerais egalement remercier les doctorants du CREST pour tous les bons moments
passes ensemble. Je voudrais en particulier remercier Fabien Perez, mon collegue d’eco
expe et Ramos de mon Varane (ou l’inverse ?), Remi Avignon pour ses analyses tou-
jours fines sur l’avenir du Stade Rennais et son amour de la plus belle region du monde,
Etienne Guigue pour ses arguments, contre toute logique apparente, en faveur de l’OL,
Jules Depersin pour ses reflexions sur le bonheur, Berengere Patault pour son experience
de la vie et ses conseils pour le job market, Yannick Guyonvarch pour son enthousiasme,
Yuanzhe Tang pour son couscous royal et ses gateaux ainsi qu’Elia Perennes pour sa bonne
humeur. Je souhaite egalement adresser un remerciement particulier a mes co-bureau
i

ii Acknowledgments - Remerciements
Marion Brouard, Margarita Kinerva, Pauline Lesterquy et Alfonso Montes-Sanchez, ainsi
qu’a Pierre-Edouard Collignon et Julien Monardo, mes collegues de Job Market. Je veux
aussi remercier tous les doctorants avec qui j’ai eu la chance d’echanger au cours de ce
doctorat. La liste est longue et j’en oublie probablement - Reda Aboutajdine, Antoine
Bertheau, Guidogiorgio Bodrato, Lea Bou Sleiman, Pauline Carry, Badr-Eddine Cherief
Abdellatif, Geoffrey Chinot, Heloise Clolery, Maddalena Conte, Morgane Cure, Thomas
Delemotte, Lea Dubreuil, Antoine Ferey, Germain Gautier, Lucas Girard, Morgane Guig-
nard, Jeremy Hervelin, Morgane Hoffmann, Myriam Kassoul, Raphael Lafrogne-Joussier,
Alice Lapeyre, Alexis Larousse, Clemence Lenoir, Claire Leroy, Pauline Leveneur, Denys
Medee, Martin Mugnier, Elio Nimier-David, Ivan Ouss, Louis-Daniel Pape, Felix Pasquier,
Ines Picard, Anasuya Raj, Emilie Sartre, Clemence Tricaud, Jerome Trinh. Je voudrais
aussi remercier les assistants de recherche et stagiaires qui ont contribue a cette these :
Lucia Carai, Louis-Mael Jean, Annaelle Toure et Pedro Vergara Merino.
Je voudrais remercier mes amis de Bretagne et d’ailleurs, en particulier Bruna,
Maxime, Lisa, Lucie, Adele, Perrine, Annabelle, Manon et toute la clique, les footix
Hugo et Lou-Alan, ainsi que Paul, Marine, Daphne, Rami, Rafael, Remi, Vincent et les
autres copains de l’X. Je ne peux bien sur pas oublier mes B.Boys, Benj’ et Gus’, pour
tous ces moments passes et a venir.
Enfin, je tiens a remercier tout particulierement ma famille, mes parents Alain et
Izumi, ma grand-mere Noelle, mes freres et soeur Midoli, Yan-Taro et Kei-Saburo, mais
egalement les pieces rapportees Lea, Flo et Marie, et la future generation, qui n’ont jamais
cesse de me soutenir et de croire en moi. Je leur suis infiniement reconnaissant.
Je suis infiniment reconnaissant envers Victoire pour son soutien indefectible, dans les
hauts comme dans les bas. J’ai hate de vivre les prochaines etapes avec elle et avec Baya.

Summary
Experimental economics offers the possibility to study the behavior of economic agents
in ideal conditions, as it allows for the complete control of the environment of participants.
This thesis presents results from several field experiments, as well as their contributions
to the literature. This manuscript is composed of five chapters. The first three chap-
ters contribute to the literature on the contact theory, a methodology used to improve
intergroup relations. Chapters 1 and 2 present results from field experiments, in France
and in Senegal, while chapter 3 presents a meta-analysis of the experimental literature
on the topic. The last two chapters present results of various experiments. Chapter 4
investigates the influence of providing rankings on performance, depending on the nature
of the task to be performed. Chapter 5 talks about genetic adaptation to fishing risk in
Senegal.
Chapter 1 discusses a field experiment investigating the effects of a brief and controlled
discussion on trust between disadvantaged students in Paris’ suburbs, and police officers.
The contact protocol is adapted from the social psychology literature and aims at quickly
creating friendships. Results indicate that the contact intervention increases trust of
students toward the specific police officers met, but it does not increase trust in the police
in general.
Chapter 2 analyzes an experimental protocol closely related to that of chapter 1, but
applied in the context of inter-ethnic relations in Senegal. The short contact is effective
at increasing inter-ethnic trust with the specific individuals met, but does not increase
altruism toward the outgroup in general. Moreover, the effect at the individual level
evaporates within one month of the intervention. Machine learning techniques enable to
discover that contact is particularly effective for older and less educated participants.
Chapter 3 proposes a meta-analysis of the rapidly growing experimental literature
on the contact hypothesis. Based on 62 outcomes from 37 research papers, the analysis
revealed three main results. First, there exists a large heterogeneity in the definition
of a “contact”, making difficult the comparison of papers. Second, on average, contact
interventions are effective, by significantly improving the perception of the outgroup.
Third, machine learning algorithms enable the study of determinants of the most effective
contact interventions.
Chapter 4 investigates the effects of providing rankings on performance, depending
iii

iv Summary
on the nature of the task. The analysis is performed by analyzing the existing empirical
literature, proposing a novel theoretical framework and the empirical analysis of two
experiments. Results indicate that the main moderating factor of the effects of relative
performance feedback is the existence of room for technological improvement.
Chapter 5 investigates the interplay between the effects of the dopamine receptor gene
D4 and background risk on risk-aversion for fishermen in Northern Senegal. The analysis
consists in the genetic and behavioral comparison of two populations differing in their
main professional occupation. Results indicate that the 7R allele is associated with an
increased risk-tolerance, through an additive, rather than dominance, effect. Moreover,
the effects of the 7R allele are not driven by the background risk, as we do not observe
heterogeneous effects depending on the level of background risk.

Resume
L’economie experimentale offre la possibilite d’etudier le comportement des agents
economiques dans des conditions ideales, puisqu’elle permet le controle presque total sur
l’environnement des participants. Cette these presente les resultats de diverses experiences
menees sur le terrain, ainsi que des syntheses de la litterature. Ce manuscrit est compose
de cinq chapitres. Les trois premiers chapitres traitent de la theorie du contact, qui vise a
ameliorer les relations entre differents groupes. Les chapitres 1 et 2 presentent les resultats
de deux experiences de terrain, en France et au Senegal, tandis que le chapitre 3 presente
une meta-analyse de la litterature empirique. Les deux derniers chapitres presentent les
resultats d’experiences d’economie sur des sujets divers. Le chapitre 4 etudie l’effet de
donner le classement sur la performance des agents, en fonction de la nature de tache a
effectuer. Le chapitre 5 traite d’adaptation genetique au risque lie a la peche au Senegal.
Le chapitre 1 traite d’une experience de terrain etudiant les effets d’une discussion
courte et structuree sur la confiance entre des jeunes de lycees defavorisees de banlieue
parisienne et des policiers. La methodologie est adaptee de la litterature en psychologie
sociale et a pour but de creer des liens d’amitie rapidement. Les resultats indiquent que le
contact engendre une augmentation du niveau de confiance des lyceens envers les policiers
rencontres, mais ne permet pas d’augmenter la confiance envers les policiers et la police
en general.
Le chapitre 2 analyse un protocole experimental proche du chapitre 1, mais l’applique
dans le contexte des relations inter-ethniques au Senegal. Les discussions cadrees et
rapides ont un effet sur la confiance inter-ethnique avec les individus rencontres, mais
ne permettent pas l’amelioration de la generosite a l’egard des autres groupes ethniques
en general. De plus, les effets semblent dissipes seulement un mois apres le traitement.
Des methodes d’apprentissage statistique permettent de trouver que le traitement est
particulierement efficace pour les individus ages et peu eduques.
Le chapitre 3 offre une meta-analyse de la litterature empirique sur le contact, qui
s’est grandement developpee au cours des dernieres annees. Se basant sur 62 mesures,
issues de 37 articles, l’analyse revele trois resultats principaux. Tout d’abord, il existe
une tres grande heterogeneite dans la definition de « contact », ce qui rend difficile la
comparaison des differents articles. Ensuite, en moyenne, les interventions de contact
sont efficaces en permettant d’ameliorer significativement la perception de l’autre groupe.
v

vi Resume
Enfin, l’utilisation d’apprentissage statistique permet de de determiner les determinants
de l’efficacite des interventions.
Le chapitre 4 analyse l’effet de l’apport de classements sur la performance, en fonction
de la nature de la tache a effectuer. L’analyse est effectuee au regard d’une analyse de la
litterature, d’un modele theorique novateur et de l’etude empirique de deux experiences.
Les resultats indiquent que le facteur qui module grandement l’effet des classements est
l’existence, ou non, de possibilite d’amelioration de la technologie de production de la
performance.
Le chapitre 5 etudie le lien entre les effets du gene codant le recepteur a la dopamine D4
et du risque environnemental sur l’aversion au risque chez des pecheurs du nord du Senegal.
L’analyse consiste en la comparaison comportementale et genetique de deux populations
qui different selon leur activite professionnelle principale. Les resultats indiquent que
l’allele 7R est associe a une plus grande tolerance au risque, par un effet additif et non
de dominance. De plus, aucune heterogeneite n’a ete detectee en fonction du risque
environnemental.

Contents
Acknowledgments - Remerciements i
Summary iii
Resume v
General Introduction 1
1. Development and experimental economics . . . . . . . . . . . . . . . . . . 1
2. Economics of prejudice and discrimination . . . . . . . . . . . . . . . . . . 2
3. The contact hypothesis . . . . . . . . . . . . . . . . . . . . . . . . . . . . . 3
4. Other themes in this thesis . . . . . . . . . . . . . . . . . . . . . . . . . . . 4
5. Presentation of chapters . . . . . . . . . . . . . . . . . . . . . . . . . . . . 5
References . . . . . . . . . . . . . . . . . . . . . . . . . . . . . . . . . . . . . . . 9
1 Improving the Perception of the Police by the Youth 15
1. Introduction . . . . . . . . . . . . . . . . . . . . . . . . . . . . . . . . . . . 16
2. Literature review . . . . . . . . . . . . . . . . . . . . . . . . . . . . . . . . 17
2.1. Police-population relations . . . . . . . . . . . . . . . . . . . . . . . 18
2.2. Contact hypothesis . . . . . . . . . . . . . . . . . . . . . . . . . . . 19
3. Experimental Design and Data . . . . . . . . . . . . . . . . . . . . . . . . 20
4. Results . . . . . . . . . . . . . . . . . . . . . . . . . . . . . . . . . . . . . . 25
4.1. Primary results . . . . . . . . . . . . . . . . . . . . . . . . . . . . . 25
4.2. Theoretical framework and empirical test . . . . . . . . . . . . . . . 27
4.3. Exploratory results . . . . . . . . . . . . . . . . . . . . . . . . . . . 30
5. Conclusion . . . . . . . . . . . . . . . . . . . . . . . . . . . . . . . . . . . . 33
References . . . . . . . . . . . . . . . . . . . . . . . . . . . . . . . . . . . . . . . 35
Appendices . . . . . . . . . . . . . . . . . . . . . . . . . . . . . . . . . . . . . . 40
A Experiment location . . . . . . . . . . . . . . . . . . . . . . . . . . 40
B Questions for the Contact treatment . . . . . . . . . . . . . . . . . 41
C Descriptive statistics . . . . . . . . . . . . . . . . . . . . . . . . . . 43
D Balance across treatments . . . . . . . . . . . . . . . . . . . . . . . 44
vii

viii Contents
E Histograms of treatment effects . . . . . . . . . . . . . . . . . . . . 46
F Channels . . . . . . . . . . . . . . . . . . . . . . . . . . . . . . . . . 47
G Comparison of photo and contact treatments only . . . . . . . . . . 50
H Difference with the pre-analysis plan . . . . . . . . . . . . . . . . . 51
I Questionnaire . . . . . . . . . . . . . . . . . . . . . . . . . . . . . . 52
2 Low-Cost Contact Interventions Can Increase Inter-Ethnic Trust: Evi-
dence from Senegal 53
1. Introduction . . . . . . . . . . . . . . . . . . . . . . . . . . . . . . . . . . . 54
2. Experimental Design . . . . . . . . . . . . . . . . . . . . . . . . . . . . . . 56
2.1. Protocol . . . . . . . . . . . . . . . . . . . . . . . . . . . . . . . . . 56
2.2. Outcomes . . . . . . . . . . . . . . . . . . . . . . . . . . . . . . . . 57
2.3. Controls and dimensions of heterogeneity . . . . . . . . . . . . . . . 59
2.4. Setup . . . . . . . . . . . . . . . . . . . . . . . . . . . . . . . . . . 59
3. Results . . . . . . . . . . . . . . . . . . . . . . . . . . . . . . . . . . . . . . 60
3.1. Descriptive statistics and balance across treatments . . . . . . . . . 60
3.2. Short-term effect of contact on trust and prejudice . . . . . . . . . 60
3.3. Longer-term outcomes . . . . . . . . . . . . . . . . . . . . . . . . . 61
4. Heterogeneity analysis . . . . . . . . . . . . . . . . . . . . . . . . . . . . . 62
4.1. Heterogeneity based on prior interactions . . . . . . . . . . . . . . . 62
4.2. Generic Machine Learning for heterogeneity analysis . . . . . . . . 62
5. Discussion and conclusion . . . . . . . . . . . . . . . . . . . . . . . . . . . 63
References . . . . . . . . . . . . . . . . . . . . . . . . . . . . . . . . . . . . . . . 66
Appendices . . . . . . . . . . . . . . . . . . . . . . . . . . . . . . . . . . . . . . 68
A Questions for the Contact treatment . . . . . . . . . . . . . . . . . 68
B Descriptive statistics . . . . . . . . . . . . . . . . . . . . . . . . . . 70
C Balance across treatments . . . . . . . . . . . . . . . . . . . . . . . 72
D Treatment effect in the short and long run . . . . . . . . . . . . . . 74
E Comparison between the Contact and Photo treatments . . . . . . 75
F Heterogeneity analysis . . . . . . . . . . . . . . . . . . . . . . . . . 76
3 Contact Interventions: A Meta-Analysis 79
1. Introduction . . . . . . . . . . . . . . . . . . . . . . . . . . . . . . . . . . . 80
2. Method . . . . . . . . . . . . . . . . . . . . . . . . . . . . . . . . . . . . . 82
2.1. Paper selection . . . . . . . . . . . . . . . . . . . . . . . . . . . . . 82
2.2. Description of variables . . . . . . . . . . . . . . . . . . . . . . . . . 83
2.3. Analysis methodology . . . . . . . . . . . . . . . . . . . . . . . . . 85
3. Results . . . . . . . . . . . . . . . . . . . . . . . . . . . . . . . . . . . . . . 85
3.1. Descriptive statistics . . . . . . . . . . . . . . . . . . . . . . . . . . 85

Contents ix
3.2. Is contact effective? . . . . . . . . . . . . . . . . . . . . . . . . . . . 88
3.3. What characteristics matter for contact? . . . . . . . . . . . . . . . 88
4. Discussion . . . . . . . . . . . . . . . . . . . . . . . . . . . . . . . . . . . . 91
References . . . . . . . . . . . . . . . . . . . . . . . . . . . . . . . . . . . . . . . 94
Appendices . . . . . . . . . . . . . . . . . . . . . . . . . . . . . . . . . . . . . . 99
A List of all papers . . . . . . . . . . . . . . . . . . . . . . . . . . . . 99
B Effect size as a function of the sample size . . . . . . . . . . . . . . 101
C Effect size as a function of characteristics . . . . . . . . . . . . . . . 102
4 More Effort or Better Technologies? On the Effect of Relative Perfor-
mance Feedback 111
1. Introduction . . . . . . . . . . . . . . . . . . . . . . . . . . . . . . . . . . . 112
2. A review of the effect of RPF through the lens of the technology channel . 114
2.1. Paper selection . . . . . . . . . . . . . . . . . . . . . . . . . . . . . 114
2.2. Classification . . . . . . . . . . . . . . . . . . . . . . . . . . . . . . 115
2.3. Results . . . . . . . . . . . . . . . . . . . . . . . . . . . . . . . . . . 115
3. Theory: The effect of RPF on performance. . . . . . . . . . . . . . . . . . 119
3.1. Related theoretical literature . . . . . . . . . . . . . . . . . . . . . . 119
3.2. Effort choice . . . . . . . . . . . . . . . . . . . . . . . . . . . . . . . 120
3.3. Technology choice . . . . . . . . . . . . . . . . . . . . . . . . . . . . 125
3.4. Comparison . . . . . . . . . . . . . . . . . . . . . . . . . . . . . . . 132
4. Empirics . . . . . . . . . . . . . . . . . . . . . . . . . . . . . . . . . . . . . 132
4.1. Experiment 1: No room for improvement . . . . . . . . . . . . . . . 133
4.2. Experiment 2: Large room for improvement . . . . . . . . . . . . . 136
4.3. Comparison between the two experiments . . . . . . . . . . . . . . 138
5. Conclusion . . . . . . . . . . . . . . . . . . . . . . . . . . . . . . . . . . . . 142
References . . . . . . . . . . . . . . . . . . . . . . . . . . . . . . . . . . . . . . . 144
Appendices . . . . . . . . . . . . . . . . . . . . . . . . . . . . . . . . . . . . . . 149
A Description of the papers included in the empirical literature review 149
B Instructions given to participants . . . . . . . . . . . . . . . . . . . 155
5 Effect of the 7R allele on the DRD4 locus on risk-tolerance does not
depend on background risk: Evidence from Senegal 161
1. Introduction . . . . . . . . . . . . . . . . . . . . . . . . . . . . . . . . . . . 162
2. Results . . . . . . . . . . . . . . . . . . . . . . . . . . . . . . . . . . . . . . 162
2.1. Risk-tolerance by zone . . . . . . . . . . . . . . . . . . . . . . . . . 162
2.2. Genotypes by zone . . . . . . . . . . . . . . . . . . . . . . . . . . . 163
2.3. Risk-tolerance by genotype . . . . . . . . . . . . . . . . . . . . . . . 164
3. Discussion . . . . . . . . . . . . . . . . . . . . . . . . . . . . . . . . . . . . 167

x Contents
4. Methods . . . . . . . . . . . . . . . . . . . . . . . . . . . . . . . . . . . . . 167
References . . . . . . . . . . . . . . . . . . . . . . . . . . . . . . . . . . . . . . . 169
Supplementary Materials . . . . . . . . . . . . . . . . . . . . . . . . . . . . . . . 172
General Conclusion 179
References . . . . . . . . . . . . . . . . . . . . . . . . . . . . . . . . . . . . . . . 180

General Introduction
This thesis is at the intersection of two vast areas of research: experimental economics
and development economics. In this introduction, I first give general insights about the
two fields, and present the themes to which the thesis contributes, in particular the field
of research devoted to the contact hypothesis. Lastly, I detail the contributions of the five
chapters of this thesis.
1. Development and experimental economics
In 1980, it was estimated that nearly 40% of the world population lived with less
than $ 1.90 per day. This figure was unevenly distributed, with more than 60% of the
population in Sub-Saharan Africa or South Asia living below the international extreme
poverty line, and less than 5% in Western Europe or North America (World Bank, 2022).
The field of development economics, historically, aimed at understanding the causes
of differences in wealth between countries (Lewis, 1954). The ideas of structural change,
poverty traps and the role of human and physical capital have had a profound effect on
policies implemented to reduce global poverty. Most of the empirical research focused on
comparing countries with different policies, and trying to identify links between policies
and levels of wealth (Easterly, 2001).
The introduction of randomized controlled trials, pioneered by Esther Duflo and Ab-
hijit Banerjee, came more recently to development economics. They have enabled the
analysis of interventions at the individual level. The concept of RCTs comes from the
medicine literature and investigates the effect of an intervention by randomly allocating
units (individuals, villages) to either a treatment or control groups. The underlying prin-
ciple, called the Rubin Causal Model (Rubin, 1974) is that because of randomization, the
control group would have behaved identically to the treatment group, had they received
the treatment. The introduction of RCTs enabled a great increase in the credibility of
results of development policies, and shifted the focus of development economics research,
from evaluating the sources of poverty, to the careful evaluation of policies. Evaluations
have enabled the wide implementation of policies, in fields such as education (Duflo et al.,
2011), health (Dupas, 2014) or labor markets (Imbert and Papp, 2015).
1

2 General Introduction
Contrary to development economics, the use of experiments in a controlled environ-
ment has been at the core of the field of experimental economics since its inception (Kah-
neman et al., 1990; Thaler et al., 1997). In experiments, experimenters typically do not
have to worry about attrition, compliance or other factors which are cause of worry for
field experiments. The use of carefully designed experiments can therefore be useful to
test theories and to identify mechanisms of interventions.
Another strand of literature in experimental economics has been the attempts at mea-
suring economics concepts, such as risk-aversion (Binswanger, 1980; Gneezy and Potters,
1997), time preferences (Frederick et al., 2002) or concepts which are difficult to measure
with open survey questions, such as intimate partner violence (Aguero and Frisancho,
2022) or lying (Fischbacher and Follmi-Heusi, 2013).
The use of laboratory, or lab-in-the-field, experiments can help design better policies,
which can be then evaluated by field experiments. I am glad that this thesis is at the
intersection of these two fields.
2. Economics of prejudice and discrimination
The theme of the three first chapters of this dissertation is the use of contact inter-
ventions as a tool to reduce prejudice and increase trust. Before detailing what is the
contact hypothesis, I introduce the topic of research on prejudice.
Prejudice has been a focus of research in economics, psychology and sociology for many
decades. It can be defined as a feeling directed against a particular individual or a group
based on a distinct characteristic.
To summarize very quickly the history of the literature on prejudice in economics,
three main phases can be identified.1 Of course, the three phases are not at all exclusive,
but the distinction is interesting for illustrative purposes. The first phase, starting as far
back as the 1950s (Becker, 1957) and until the early 2000s, aimed at identifying preju-
dice and discrimination. The debate of the time was to establish whether the source of
observed differences between groups were due to animus against specific groups (Becker,
1957) or due to statistical discrimination, under which groups are signals about the true
value of individuals (Arrow, 1973). This literature has used different tools, from audit
studies (Ayres and Siegelman, 1995; Cain, 1996), correspondence studies (Bertrand and
Mullainathan, 2004), implicit association tests (Greenwald et al., 1998), to list randomiza-
tion (Kuklinski et al., 1997) and willingness to pay for working with outgroup members
(Mobius and Rosenblat, 2006; Hedegaard and Tyran, 2018). The identification of the
sources of discrimination has been in particular studied in the case of the labor market
(List, 2004).
1For a detailed analysis of the use of experiments to study discrimination, see Bertrand and Duflo(2017).

General Introduction 3
The second phase of the literature on prejudice lasted approximately from the early
2000s to the mid-2010s. The main focus of the literature then was to identify the con-
sequences of discrimination. These consequences include stereotype threat (Steele and
Aronson, 1995; Aronson et al., 2002), self-identification Benjamin et al. (2010) or Pyg-
malion effects (Jussim and Harber, 2005) as self-fulfilling prophecies (i.e. a individual
afraid of being stereotyped will reduce his or her effort and therefore perpetuate group
differences). The lack of representation of minority groups has also been shown to have
negative effects on policies implemented (Beaman et al., 2009).
The third phase of the literature started very early (some papers date back as far at
the 1950s) but only really took off around 2010, and its aim is to find solutions to mitigate
prejudice and discrimination. Many solutions have been implemented, such as increasing
the diversity in leadership positions (Beaman et al., 2009; Bagues et al., 2017), presenting
role models (Cheryan et al., 2011) or implementing of debiasing strategies (Banerjee et al.,
2013; Madva, 2017). However, the literature which has, by far, received the most attention
by academics is the implementation of intergroup contact interventions. This topic is at
the center of this thesis, and is explained below.
3. The contact hypothesis
The contact hypothesis is probably the solution to reduce prejudice which has been
the most extensively studied by scholars (Bertrand and Duflo, 2017). The idea that
intergroup contact can reduce prejudice dates back at least since the 1950s, with Allport
(1954) stating that prejudice “may be reduced by equal status contact between majority
and minority groups in the pursuit of common goals. The effect is greatly enhanced if this
contact is sanctioned by institutional supports (i.e., by law, custom, or local atmosphere),
and provided it is of a sort that leads to the perception of common interests and common
humanity between members of the two groups.” (p.281).
A lot of research has been devoted to the investigation of the effects of contact. In a
seminal meta-analysis, Pettigrew and Tropp (2006) famously review 515 studies testing
the effects of contact on prejudice. Their overwhelming conclusion was that contact is
effective at reducing prejudice, as the more people are in contact with outgroup members,
the less prejudiced they are.
However, with only a few exceptions at the time, the literature they surveyed was
correlational. Typically, papers compared people who are in contact, or are friends with,
outgroup members, and people who are not. They then evaluated prejudice using different
methodologies, and found that the more outgroup friends, the less prejudiced. However,
it is impossible to positively conclude on the effect of contact from such studies, as they
could suffer from selection bias and thus, in fact, reverse causality: it is not the fact of
having more encounters with outgroup members that causes a reduction in prejudice, but

4 General Introduction
the fact of being less prejudiced which will make people interact more with other groups,
choose a neighborhoods with more diversity, etc.
With the turn of the 21st century, more and more experimental, or quasi-experimental,
protocols have been developed. Contact interventions have been tested in the military with
new recruits (Carrell et al., 2019; Finseraas et al., 2016; Caceres-Delpiano et al., 2021),
in school programs (Scacco and Warren, 2018; Clunies-Ross and O’meara, 1989; Freddi
et al., 2022; Rao, 2019), through door-to-door canvassing and other forms of scripted
discussions (Broockman and Kalla, 2016; Kalla and Broockman, 2020; Page-Gould et al.,
2008), for outgroup roommates for university students (Boisjoly et al., 2006; Corno et al.,
2019; Van Laar et al., 2005) or in sports leagues (Mousa, 2020; Lowe, 2021). In a recent
review of the growing experimental literature, Paluck et al. (2019) find the same results
as Pettigrew and Tropp (2006) that contact does reduce prejudice, but the results are less
strong and more heterogeneous.
The first two chapters of this thesis contribute to the literature by improving the
replicability and comparability of contact protocols, by implementing the same type of
protocol, based on the “fast-friend” procedure (Aron et al., 1997), and evaluating the
effects of contact on the same outcomes, specifically the trust game (Berg et al., 1995).
The two chapters also contribute to the scalability of contact interventions, with a much
shorter and cheaper protocols.
The third chapter of this thesis is a meta-analysis exercise of the literature of contact,
updating previous meta-analytic work (Paluck et al., 2019) by adding new, more recent,
papers, and testing for predictors of the efficacy of contact interventions.
The field of research of contact interventions is really vibrant, and it is a great pleasure
to modestly contribute to it with these three chapters.
4. Other themes in this thesis
During the course of my doctoral studies, I also had the opportunity to work on two
unrelated subjects, which are presented in the last two chapters of this thesis.
The first additional theme is at the center of the fourth chapter, and looks at the effects
of providing relative performance feedback (RPF), such as rankings, on performance.
Providing such information is ubiquitous in the society (TripAdvisor provides a ranking
of the best ranked hotels in a region, academics are able to compare themselves using
rankings based on citation indices, employers provide information on workers’ relative
productivity, etc). While countless papers have investigated the different forms of RPF
in a lot of different contexts, there seems to be a large part of heterogeneity in results
(Villeval, 2020). I found working on this topic for the chapter very interesting, as it
enabled me to discover how to really run an experiment based on theoretical predictions,
rather than developing a theoretical framework to match empirical findings.

General Introduction 5
The second additional theme of this thesis is the link between genetics and human
behavior. The relative importance of nature and nurture, or what share of behavior
can be explained by genetic factors, and what is due to the environment or idiosyncratic
characteristics, has been a cause of a huge debate in social, as well as “hard”, sciences for a
very long time (Haldane, 1946). There is also a large debate in the experimental economics
literature about the influence of the environment on attitudes. This debate is particularly
strong in the case of risk attitudes. Competing theories have been developed to investigate
whether, in a risky environment, people should be more risk-averse in accordance to the
risk vulnerability hypothesis (Gollier and Pratt, 1996). The fifth and final chapter of this
thesis investigates the interplay between nature and nurture in the case of a specific gene,
the dopamine receptor D4 gene, in a field experiment in Senegal. The chapter required a
collaboration with more researchers than standard in economics. In addition, it involved
working with an inter-disciplinary team and preparing a chapter which is in a different
format, standard in hard sciences, but not in economics.
5. Presentation of chapters
Chapter 1
Presentation Chapter 1 presents the results of a lab-in-the-field experiment to test the
effects of a brief contact on trust toward police officers. The chapter starts from three ob-
servations: trust in the police is low for parts of the French population; trust in the police
can improve well-being in the community; and trust has been found to be malleable due
to outside events. I design an experiment involving a brief and very controlled contact in-
tervention in two high-schools in poor suburbs of Paris, with discussions of approximately
ten minutes between students and police officers. A placebo group involving young uni-
versity students from the area is used to distinguish the effects of a simple discussion from
the effects of a contact with a police officer, specifically. I also investigate who is more
influenced by the treatment, in particular evaluating the role of previous encounters with
the police.
Results I find that the contact intervention is effective at increasing trust toward the
specific police officers that the students met. The magnitude of the effect is relatively
important with approximately 0.4 standard deviation, especially when considering that
the discussions were extremely short. However, trust in the police in general is not signifi-
cantly improved by the intervention. To make sense of this fact, I developed a theoretical
framework which indicates that previous interactions should moderate the effects of con-
tact. The model is supported by the finding that all the effect at the individual level is
driven by students who have never been subject to identity controls by the police, used

6 General Introduction
as a proxy for negative interactions with the police. This chapter has implications for
the most widely used policy to improve the perception of the police, namely community
policing.
Note: This chapter circulates as a working paper (Clochard, 2021).
Chapter 2
Presentation Chapter 2 analyzes a similar protocol as the one used in Chapter 1, but
the context is completely different. In the case of Chapter 2, the source of prejudice is
ethnic, and is investigated in the context of Senegal. In addition to the replication of
the protocol of the previous chapter, which enhances comprehension of the “fast-friend
procedure”, this paper further contributes to the literature by analyzing the duration of
effects, through a follow-up survey one month after the intervention, and by analyzing the
heterogeneity of findings using machine learning algorithms (Chernozhukov et al., 2018).
Results We find that the contact protocol is only effective at increasing trust toward
the specific individuals met during the intervention. Contact is found to have no effect on
generosity toward the outgroup in general. Moreover, the effects completely vanish merely
one month after the intervention. Using generic machine learning techniques enable us
to identify that the effect is stronger for older and less educated participants. We discuss
the implications of our findings and of the protocol for future contact interventions.
Note: This chapter circulates as a working paper (Clochard et al., 2022).
Chapter 3
Presentation Chapter 3 is a meta-analysis of the experimental literature on the contact
hypothesis. Following G.W. Allport’s book (Allport, 1954), a large stream of research
aimed at testing the contact hypothesis. In a seminal work, Pettigrew and Tropp (2006)
identified 515 studies and found that contact is, on average, effective at reducing prejudice.
However, only a small fraction of the studies identified involved an experimental variation
of contact, thus inducing potential selection biases - i.e. less prejudiced individuals tend
to have more outgroup friends. In this chapter, I further the work of previous meta-
analyses of the experimental contact literature (Paluck et al., 2019) by addid more recent
papers, and I investigate the moderating effects of paper contexts and characteristics of the
contact. I conclude by discussing potential paths for the future of the contact literature.
Results The main results from the meta-analysis are threefold. First, I confirm results
from previous meta-analyses (Pettigrew and Tropp, 2006; Lemmer and Wagner, 2015;
Paluck et al., 2019) by showing that, on average, contact interventions are effective at
reducing prejudice. The typical intervention will have an effect of approximately 0.3

General Introduction 7
standard deviation, which is a small to moderate effect, according to Cohen (1969)’s rule
of thumb. Second, there exists a large heterogeneity in what can be called a contact
intervention, rendering the comparison of studies difficult. Third, conditions identified by
Allport (1954), Pettigrew and Tropp (2006) or Lemmer and Wagner (2015) as moderators
of the efficacy of contact do not seem to play a role, as none are selected as predictors of
the treatment effect in the estimations.
Note: This chapter circulates as a working paper (Clochard, 2022).
Chapter 4
Presentation Chapter 4 investigates the effects of providing relative performance feed-
back (RPF) on performance. The chapter starts from one puzzle: while many experiments
have implemented and tested the effects of providing RPF to participants (Azmat and
Iriberri, 2010; Barankay, 2011), there is no consensus about whether RPF has positive,
null or negative effects on performance (Villeval, 2020). Chapter 4 aims at analyzing this
puzzle, in particular by introducing the notion of room for technological improvement.
The analysis is performed in three ways. First, we review the empirical literature on
RPF. Second, we propose two novel theoretical frameworks to explain the effects of pro-
viding RPF on performance, depending on the nature of the task. Third, we design and
implement two experiments in which the content of RPF is similar, but the task different.
Results Our result illustrate that the effect of RPF is greatly moderated by the presence,
or lack thereof, of room for technological improvement. First, the treatment effects for
papers from the literature where room for improvement was present were significantly
more positive. Second, our theoretical framework finds that all the distribution improves
under the room for improvement, while only part of the distribution (especially at the top)
improves for without room for improvement. Third, our experimental results confirm our
findings, with effects all along the distribution of performances in the presence of room
for improvement, and no improvement being detected without it.
Note: This chapter circulates as a working paper (Clochard et al., 2021).
Chapter 5
Presentation Chapter 5 investigates the interplay between genetics and background
risk. Risk tolerance has been found to be partly explained by genetics (Cesarini et al.,
2009). The dopamine receptor gene D4 (DRD4 ) has been in particular identified as
influencing risk-tolerance, the 7R allele increasing risk-tolerance (Dreber et al., 2009;
Kuhnen and Chiao, 2009). Moreover, background, or environmental risk, has also been
shown to influence risk attitudes (Lee, 2008). Much less is known, however, about the
interplay between the genetic and background risk factors in risk attitudes. We conduct

8 General Introduction
a field experiments in Northern Senegal to test the differential effect of the 7R allele on
risk attitudes, depending on the exposure to the serious risk of fishing.
Results We find that, in accordance with the risk vulnerability hypothesis, individuals
living in the risky area are more risk-averse than the individuals living in the non-risky
area. Moreover, we corroborate the literature finding that, in both areas, the 7R allele on
the DRD4 gene reduces risk-aversion, and contribute by showing that this effect comes
from an additive effect, not a dominance one. Importantly, we do not find evidence
of heterogeneity of the effect of the 7R allele on risk attitudes depending on the level
of background risk, indicating that the effects of the DRD4 gene are independent of
environmental risk. This work contributes to the emerging literature on the interplay
between environmental and genetic forces in shaping human behavior.
Note: This chapter circulates as a working paper (Clochard et al., 2022).
Note
The five chapters of this dissertation are independent research articles. This is why
some information may be redundant and why the term article is sometimes used instead
of chapter. Chapter 1 is solo-authored. Chapter 2 is co-authored with Guillaume Hollard
and Omar Sene. Chapter 3 is solo-authored. Chapter 4 is co-authored with Guillaume
Hollard and Julia Wirtz. Chapter 5 is co-authored with Aby Mbengue, Clement Mettling,
Birane Diouf, Charlotte Faurie, Omar Sene, Emilie Chancerel, Zoe Delporte, Guillaume
Hollard, Michel Raymond and Marc Willinger.

General Introduction 9
References
Aguero, J. and V. Frisancho (2022). Measuring violence against women with experimental
methods. Economic Development and Cultural Change 70 (3), ...
Allport, G. W. (1954). The nature of prejudice. Addison-wesley Reading, MA.
Aron, A., E. Melinat, E. N. Aron, R. D. Vallone, and R. J. Bator (1997). The experimen-
tal generation of interpersonal closeness: A procedure and some preliminary findings.
Personality and Social Psychology Bulletin 23 (4), 363–377.
Aronson, J., C. B. Fried, and C. Good (2002). Reducing the effects of stereotype threat
on african american college students by shaping theories of intelligence. Journal of
experimental social psychology 38 (2), 113–125.
Arrow, K. (1973). The theory of discrimination. Discrimination Labor Markets 3 (10),
3–33.
Ayres, I. and P. Siegelman (1995). Race and gender discrimination in bargaining for a
new car. The American Economic Review , 304–321.
Azmat, G. and N. Iriberri (2010). The importance of relative performance feedback
information: Evidence from a natural experiment using high school students. Journal
of Public Economics 94 (7), 435–452.
Bagues, M., M. Sylos-Labini, and N. Zinovyeva (2017). Does the gender composition of
scientific committees matter? American Economic Review 107 (4), 1207–38.
Banerjee, A. V., C. Imbert, and R. Pande (2013). Entry, exit and candidate selection:
evidence from india. Technical report.
Barankay, I. (2011). Rankings and social tournaments: Evidence from a crowd-sourcing
experiment. University of Pennsylvania Working Paper .
Beaman, L., R. Chattopadhyay, E. Duflo, R. Pande, and P. Topalova (2009). Powerful
women: does exposure reduce bias? The Quarterly journal of economics 124 (4), 1497–
1540.
Becker, G. S. (1957). The economics of discrimination. University of Chicago press.
Benjamin, D. J., J. J. Choi, and A. J. Strickland (2010). Social identity and preferences.
American Economic Review 100 (4), 1913–28.
Berg, J., J. Dickhaut, and K. McCabe (1995). Trust, reciprocity, and social history. Games
and economic behavior 10 (1), 122–142.

10 General Introduction
Bertrand, M. and E. Duflo (2017). Field experiments on discrimination. In Handbook of
economic field experiments, Volume 1, pp. 309–393. Elsevier.
Bertrand, M. and S. Mullainathan (2004). Are emily and greg more employable than lak-
isha and jamal? a field experiment on labor market discrimination. American economic
review 94 (4), 991–1013.
Binswanger, H. P. (1980). Attitudes toward risk: Experimental measurement in rural
india. American Journal of Agricultural Economics 62 (3), 395–407.
Boisjoly, J., G. J. Duncan, M. Kremer, D. M. Levy, and J. Eccles (2006). Empathy or
antipathy? the impact of diversity. American Economic Review 96 (5), 1890–1905.
Broockman, D. and J. Kalla (2016). Durably reducing transphobia: A field experiment
on door-to-door canvassing. Science 352 (6282), 220–224.
Caceres-Delpiano, J., A.-I. De Moragas, G. Facchini, and I. Gonzalez (2021). Intergroup
contact and nation building: Evidence from military service in spain. Journal of Public
Economics 201, 104477.
Cain, G. G. (1996). Clear and convincing evidence: Measurement of discrimination in
america.
Carrell, S. E., M. Hoekstra, and J. E. West (2019). The impact of college diversity on
behavior toward minorities. American Economic Journal: Economic Policy 11 (4),
159–82.
Cesarini, D., C. T. Dawes, M. Johannesson, P. Lichtenstein, and B. Wallace (2009).
Genetic variation in preferences for giving and risk taking. The Quarterly Journal of
Economics 124 (2), 809–842.
Chernozhukov, V., M. Demirer, E. Duflo, and I. Fernandez-Val (2018). Generic machine
learning inference on heterogeneous treatment effects in randomized experiments, with
an application to immunization in india. Technical report, National Bureau of Economic
Research.
Cheryan, S., J. O. Siy, M. Vichayapai, B. J. Drury, and S. Kim (2011). Do female and
male role models who embody stem stereotypes hinder women’s anticipated success in
stem? Social psychological and personality science 2 (6), 656–664.
Clochard, G.-J. (2021). Improving the perception of the police by the youth. Technical
report, CREST Working Paper.
Clochard, G.-J. (2022). Contact interventions: A meta-analysis. Technical report, CREST
Working Paper.
General Introduction 11
Clochard, G.-J., G. Hollard, and O. Sene (2022). Low-cost contact interventions can
increase inter-ethnic trust when previous contact are scarce: Evidence from senegal.
Technical report, CREST Working Paper.
Clochard, G.-J., G. Hollard, and J. Wirtz (2021). More effort or better technologies? on
the effect of relative performance feedback. Technical report, CREST Working Paper.
Clochard, G.-J., A. Mbengue, C. Mettling, C. Faurie, O. Sene, E. Chancerel, Z. Delporte,
G. Hollard, M. Raymond, and M. Willinger (2022). Effect of the 7r allele on the drd4
locus on risk-aversion does not depend on background risk: Evidence from senegal.
Technical report, CREST Working Paper.
Clunies-Ross, G. and K. O’meara (1989). Changing the attitudes of students towards
peers with disabilities. Australian Psychologist 24 (2), 273–284.
Cohen, J. (1969). Statistical power analysis for tibe behavioral sciences.
Corno, L., E. La Ferrara, and J. Burns (2019). Interaction, stereotypes and performance:
Evidence from south africa. Technical report, IFS Working Papers.
Dreber, A., C. L. Apicella, D. T. Eisenberg, J. R. Garcia, R. S. Zamore, J. K. Lum, and
B. Campbell (2009). The 7r polymorphism in the dopamine receptor d4 gene (drd4)
is associated with financial risk taking in men. Evolution and Human Behavior 30 (2),
85–92.
Duflo, E., P. Dupas, and M. Kremer (2011). Peer effects, teacher incentives, and the im-
pact of tracking: Evidence from a randomized evaluation in kenya. American economic
review 101 (5), 1739–74.
Dupas, P. (2014). Getting essential health products to their end users: Subsidize, but
how much? Science 345 (6202), 1279–1281.
Easterly, W. (2001). The lost decades: developing countries’ stagnation in spite of policy
reform 1980–1998. Journal of Economic growth 6 (2), 135–157.
Finseraas, H., A. A. Johnsen, A. Kotsadam, and G. Torsvik (2016). Exposure to fe-
male colleagues breaks the glass ceiling—evidence from a combined vignette and field
experiment. European Economic Review 90, 363–374.
Fischbacher, U. and F. Follmi-Heusi (2013). Lies in disguise—an experimental study on
cheating. Journal of the European Economic Association 11 (3), 525–547.
Freddi, E., J. J. J. Potters, and S. Suetens (2022). Brief cooperative contact with eth-
nic minorities reduces discrimination. Technical report, CEPR Discussion Paper No.
DP17098.

12 General Introduction
Frederick, S., G. Loewenstein, and T. O’donoghue (2002). Time discounting and time
preference: A critical review. Journal of economic literature 40 (2), 351–401.
Gneezy, U. and J. Potters (1997). An experiment on risk taking and evaluation periods.
The Quarterly Journal of Economics 112 (2), 631–645.
Gollier, C. and J. W. Pratt (1996). Risk vulnerability and the tempering effect of back-
ground risk. Econometrica: Journal of the Econometric Society , 1109–1123.
Greenwald, A. G., D. E. McGhee, and J. L. Schwartz (1998). Measuring individual
differences in implicit cognition: the implicit association test. Journal of personality
and social psychology 74 (6), 1464.
Haldane, J. B. S. (1946). The interaction of nature and nurture. Annals of eugenics 13 (1),
197–205.
Hedegaard, M. S. and J.-R. Tyran (2018). The price of prejudice. American Economic
Journal: Applied Economics 10 (1), 40–63.
Imbert, C. and J. Papp (2015). Labor market effects of social programs: Evidence from
india’s employment guarantee. American Economic Journal: Applied Economics 7 (2),
233–63.
Jussim, L. and K. D. Harber (2005). Teacher expectations and self-fulfilling prophecies:
Knowns and unknowns, resolved and unresolved controversies. Personality and social
psychology review 9 (2), 131–155.
Kahneman, D., J. L. Knetsch, and R. H. Thaler (1990). Experimental tests of the endow-
ment effect and the coase theorem. Journal of political Economy 98 (6), 1325–1348.
Kalla, J. L. and D. E. Broockman (2020). Reducing exclusionary attitudes through in-
terpersonal conversation: Evidence from three field experiments. American Political
Science Review 114 (2), 410–425.
Kuhnen, C. M. and J. Y. Chiao (2009). Genetic determinants of financial risk taking.
PloS one 4 (2), e4362.
Kuklinski, J. H., M. D. Cobb, and M. Gilens (1997). Racial attitudes and the”new south”.
The Journal of Politics 59 (2), 323–349.
Lee, J. (2008). The effect of the background risk in a simple chance improving decision
model. Journal of risk and uncertainty 36 (1), 19–41.
Lemmer, G. and U. Wagner (2015). Can we really reduce ethnic prejudice outside the
lab? a meta-analysis of direct and indirect contact interventions. European Journal of
Social Psychology 45 (2), 152–168.

General Introduction 13
Lewis, W. A. (1954). Economic development with unlimited supplies of labour. Bobbs-
Merrill Company, College Division.
List, J. A. (2004). The nature and extent of discrimination in the marketplace: Evidence
from the field. The Quarterly Journal of Economics 119 (1), 49–89.
Lowe, M. (2021). Types of contact: A field experiment on collaborative and adversarial
caste integration. American Economic Review 111 (6), 1807–44.
Madva, A. (2017). Biased against debiasing: On the role of (institutionally sponsored)
self-transformation in the struggle against prejudice. Ergo: An Open Access Journal of
Philosophy 4.
Mobius, M. M. and T. S. Rosenblat (2006). Why beauty matters. American Economic
Review 96 (1), 222–235.
Mousa, S. (2020). Building social cohesion between christians and muslims through soccer
in post-isis iraq. Science 369 (6505), 866–870.
Page-Gould, E., R. Mendoza-Denton, and L. R. Tropp (2008). With a little help from
my cross-group friend: Reducing anxiety in intergroup contexts through cross-group
friendship. Journal of personality and social psychology 95 (5), 1080.
Paluck, E. L., S. A. Green, and D. P. Green (2019). The contact hypothesis re-evaluated.
Behavioural Public Policy 3 (2), 129–158.
Pettigrew, T. F. and L. R. Tropp (2006). A meta-analytic test of intergroup contact
theory. Journal of personality and social psychology 90 (5), 751.
Rao, G. (2019). Familiarity does not breed contempt: Generosity, discrimination, and
diversity in delhi schools. American Economic Review 109 (3), 774–809.
Rubin, D. B. (1974). Estimating causal effects of treatments in randomized and nonran-
domized studies. Journal of educational Psychology 66 (5), 688.
Scacco, A. and S. S. Warren (2018). Can social contact reduce prejudice and discrimi-
nation? evidence from a field experiment in nigeria. American Political Science Re-
view 112 (3), 654–677.
Steele, C. M. and J. Aronson (1995). Stereotype threat and the intellectual test perfor-
mance of african americans. Journal of personality and social psychology 69 (5), 797.
Thaler, R. H., A. Tversky, D. Kahneman, and A. Schwartz (1997). The effect of my-
opia and loss aversion on risk taking: An experimental test. The quarterly journal of
economics 112 (2), 647–661.

14 General Introduction
Van Laar, C., S. Levin, S. Sinclair, and J. Sidanius (2005). The effect of university
roommate contact on ethnic attitudes and behavior. Journal of Experimental Social
Psychology 41 (4), 329–345.
Villeval, M. C. (2020). Performance feedback and peer effects. Technical report, GLO
Discussion Paper.
The World Bank (2022). Poverty and inequality platform. data retrieved from https:
//data.worldbank.org/indicator/SI.POV.DDAY.

Chapter 1 - Contact Police 15
Chapter 1
Improving the Perception of the
Police by the Youth
Abstract
While previous research has highlighted the positive consequences of a high trust in
the police, parts of the French population exhibit a lack of trust toward the police. In this
paper, I use a lab-in-the-field experiment in two high-schools in France to investigate the
effect of a brief and controlled discussion - contact - between police officers and students
on trust. Results indicate a positive effect of contact on trust at the individual level,
i.e. toward the specific police officer met. The magnitude corresponds to an increase of
approximately 0.4 standard deviation. However, the effect fails to translate to an increase
in trust in the police in general. A theoretical model of belief formation can shed light on
why a single contact cannot be sufficient in case of prior - negative - interactions. This
paper has implications for the most widely used policy to improve the perception of the
police, namely community policing.
JEL Codes: C93, C92
Keywords: Contact hypothesis, Trust, Police, Lab-in-the-field1
1I am grateful to Guillaume Hollard for his help in setting up the experiment and for his invaluableadvice. I also greatly thank Ines Picard for her excellent research assistantship and Wael Bousselmi,Damien Bradelle, Jean-Eudes Rascoussier and Alhussein Jamil for their help in running the experiments.I also want to thank the teachers and administrations of high-schools for their help in organizing theexperiment. I am grateful to Lori Beaman, Salma Mousa, Alex Scacco, Marie-Claire Villeval, Pedro Bor-dalo, Pierre Boyer, Pauline Rossi, Francis Kramarz, Isabelle Mejean, Benoit Schmutz, Yves Le Yaouanq,Nikhil Agrawal, Alexis Belianin, Sophie Hatte, Modibo Sidibe, Radu Vranceanu, as well as participantsof seminars at GRIPS, Osaka-ISER, UChicago/UCEMA JILAEE, CREM-Universite Rennes 1, as well asparticipants of the ESA 2021 Global Online Conference, ESA Job Market Seminar Series 2021, ESA AP2022 Meeting, EAYE Workshop on “Field Experiments and Experiments with Non-Standard Subjects”,RExCon 2021, ASFEE 2021 and ADRES 2022 conferences, as well as internal seminars for their com-ments and remarks. I gratefully acknowledge the Investissements d’Avenir (ANR-11-IDEX-0003/LabexEcodec/ANR-11-LABX-0047) for financial support.

16 Chapter 1 - Contact Police
1. Introduction
The relationship between the police and parts of the population is tense in many coun-
tries, with demonstrations explicitly against the behavior of the police regularly making
news headlines, sometimes even escalating to violence. Previous research has shown that
trust in the police is particularly low for some segments of the population, especially the
less well-off and minority citizens (Eurostat, 2015). The situation is particularly tense
in France, ranking among the countries with the lowest trust in the police in Europe
(Eurostat, 2015), and especially in the suburbs around Paris - banlieues (Roux, 2017).
Yet, trust in the police is an essential part of well-functioning societies, as higher trust in
the police has been associated with higher legitimacy and effectiveness of police actions
(Lyons, 2002; Sunshine and Tyler, 2003; Goldsmith, 2005; Carr et al., 2007) and better
capacity of the state to provide basic citizen security (Goldsmith, 2002; Desmond et al.,
2016). Moreover, the literature has highlighted the possibility for the perception of the
police to change, due to exogenous events. This change can be either positive (Jobard,
2016) or negative (Katz, 2014; Adam-Troian et al., 2020).
The three facts combined - low trust in the police for parts of the population, trust in
the police is a public good and trust in the police can be modified - highlight the possibility
to look for policy tools to improve the perception of the police. In the literature, one of
the main policy tools identified to increase trust is to create personal contact (Allport,
1954; Bertrand and Duflo, 2017). The idea behind the contact hypothesis is that direct
interactions (or contacts) improve the perception of individuals met from an out-group
(here, the police) and, in turn, can increase trust toward the out-group in general. Contact
is also a central component of community policing, the most common policy applied by
central and local governments to improve the perception of the police.1
In the present paper, I present the results from a pre-registered experiment2 in which
I use the methodology from the social psychology literature (Aron et al., 1997) to inves-
tigate whether face-to-face discussions between police officers and high-school students in
relatively poor towns near Paris can increase trust.
In the experiment, subjects are randomly paired with either a police officer or a Bach-
elor student from the area (representing the in-group) and are randomly assigned to one
of three treatments: a control group in which subjects are not told any information about
the person they are paired with; a photo treatment, in which subjects are presented the
photo of their pair; and a contact treatment, in which students talk for 10 minutes with
their pair. The treatment is an adaptation of the “fast-friend” procedure (Aron et al.,
1997) for quickly generating closeness: we ask pairs to alternately answer questions which
1See for instance the New York Police Department’s “Neighborhood Policing Initiative”, the LondonPolice’s “Community Policing”, the “Police de Proximite” in France.
2https://www.socialscienceregistry.org/trials/7116

Chapter 1 - Contact Police 17
become more and more intimate.
I find that the contact protocol has a positive effect on the amount sent in a trust
game with the specific police officer met. The effect is statistically significant and the
magnitude is relatively large - corresponding to an increase of approximately 0.4 standard
deviations. However, I find no effect at the collective level: subjects in the control group
do not send more tokens in a trust game played with a randomly-selected police officer,
nor do they show less bias against the police in a novel Implicit Association Test.
This paper contributes to two strands of literature. First, it contributes to the litera-
ture on methods to improve police-population relations. For instance, Peyton et al. (2019)
find that a brief visit of a police officer to citizens’ doors to discuss methods of improve-
ment of policing in their neighborhoods improves the perception of the police. The fact
that no effect is found at the collective level could be an indication that discussions about
policing are necessary to translate the effect towards the out-group in general, although
this result would need to be confirmed by future research. Regarding the recurring polit-
ical debate about proximity or community policing, results from the present paper imply
that the contact can improve relations at the individual level, and might be an argument
in favor of having officers patrolling the same neighborhoods regularly.
Second, I contribute to the literature on the contact hypothesis. I show that even
a brief, cheap and easy to replicate contact can have a positive effect on trust at the
individual level, which is an advantage relative to previous protocols which were much
longer in time, and therefore potentially difficult to scale-up (Scacco and Warren, 2018;
Mousa, 2020; Lowe, 2021). This paper is also one of the first attempts to illustrate
theoretically why the effect at the individual level does not translate to the out-group,
in particular if participants have had several (potentially negative) interactions with out-
group members (Page-Gould et al., 2008; Clochard et al., 2022).
The remainder of the paper is organized as follows. In Section 2., I review the relevant
literature in police-population relations and the contact hypothesis. In Section 3., I present
the experimental design of the experiment I conducted and the data. I present empirical
results, as well as a theoretical framework which can explain some findings in Section 4..
Section 5. concludes.
2. Literature review
This paper is linked to two main strands of literature: the first is the literature on trust
in the police by the population, the second is the literature on the contact hypothesis.

18 Chapter 1 - Contact Police
2.1. Police-population relations
While the economic literature on police-population relations is relatively scarce,3 a
relatively large number of papers tackle this issue in the sociology and social psychology
literature - see for instance Brown and Benedict (2002); Hagan et al. (2005) or Bolger et al.
(2021) for a detailed meta-analysis. In general, this literature focuses on finding factors,
such as socioeconomic status, age or race which correlate with trust or satisfaction in the
police. In particular, the literature has found that trust in the police tends to be lower
for individuals who are younger, economically disadvantaged and from minority groups
(Roux, 2017; Roche et al., 2020). The (experimental) literature on how to improve trust
in the police, however, is scarce.
Moreover, it has been shown using exogenous events that trust in the police is not
constant over time. For instance, in the French context, Jobard (2016) highlighted that
following the Paris terrorist attacks of 2015, trust in the police increased significantly, while
Adam-Troian et al. (2020) found that after incidents involving the police during demon-
strations of the Yellow Vests movement, trust in the police had decreased for demonstra-
tors. Similar results have been found for negative events involving police officers in other
parts of the world.4 Moreover, Simpson (2021) shows that simply displaying pictures of
smiling police officers improves the perceptions of these officers, relative to neutral faces.
The fact that trust in the police is malleable represents an opportunity for policy, as it
implies that it might be possible to find policy tools to increase trust in the police. In this
paper, I contribute by showing that trust in police officers can be purposefully changed.
In this regard, using contact is relevant for two reasons. First, contact has been widely
viewed in the discrimination and prejudice literature as the main policy tool to reduce
prejudice and increase trust (Bertrand and Duflo, 2017; Paluck et al., 2019). Second,
meetings with the population outside the “standard” interactions with the police - e.g.
investigations and arrests - are a central piece of a policy which has been implemented in
many parts of the world, namely community policing. However, little experimental evi-
dence exists about the effect of community policing policies on citizens’ trust in the police,
with two main exceptions. The first exception is Peyton et al. (2019) who investigate the
effect of an intervention by the New Haven, CT police department, in which patrol officers
went door-to-door to gather information from the public about how they felt the image
of the police could be improved. They found that this intervention significantly improved
the views of the population. The second exception is Blair et al. (2020) who investigate
several community policing initiatives in the Global South, and find very limited effects on
public perceptions of the police, measured through surveys. The present paper contributes
3The economic literature on the police force in general is not scarce, see for instance Ba et al. (2021);Ang (2021) or Fryer Jr (2019).
4For instance, Katz (2014) highlights a deteriorated trust in the police for African-Americans followingthe deaths of Michael Brown and Eric Garner.

Chapter 1 - Contact Police 19
to this literature by directly investigating the effects of a discussion between high-school
students and police officers on the perceptions of the police officers in question, and of the
police force in general. In particular, this paper shows that it is possible to voluntarily
change the perception of police officers.
2.2. Contact hypothesis
The second strand of literature the present paper contributes to is the literature on the
contact hypothesis. The hypothesis was first coined by Gregory Allport in 1964, stating
that “Under specific conditions, personal contact can reduce prejudice and increase trust”
(Allport, 1954). The following decades saw a lot of descriptive papers trying to assess
the validity of the hypothesis, but until the late 2010s, this literature lacked experimental
evidence and therefore suffers from potential significant biases (Pettigrew and Tropp,
2006; Paluck et al., 2019).
Since then, a growing number of experiments or quasi-experiments have been ana-
lyzed and have highlighted the potential of contact interventions to improve cross-group
relations in different contexts. In the context of education, Rao (2019) showed that an
intervention to increase the share of poor pupils in primary schools in Delhi improved their
perception by better-off children; Scacco and Warren (2018) found that having students
perform tasks with members of another religion in Nigeria reduced discrimination and
increased generosity towards the out-group; Boisjoly et al. (2006) and Corno et al. (2019)
found that having a Black roommate reduces White students’ prejudice in an American
and South African University, respectively. Another context in which the contact hypoth-
esis has been studied is through army recruits: Carrell et al. (2015) found that White
recruits of the US Air Force Academy are more likely to choose a Black roommate for
the second year if they had a Black recruit in their squadron; Finseraas et al. (2019)
found an increase in trust for a generic minority after having a minority roommate during
training; Caceres-Delpiano et al. (2021) find that Spanish men born in regions with a
weak Spanish identity who served their military service in another region have increased
identification as Spanish. The last main context in which contact interventions have been
applied is sports, with Mousa (2020) finding that after playing in mixed-religious teams,
Iraqi Christians are more tolerant towards the Muslim players of their teams, although
the effect, as in the present paper, does not translate to the out-group in general. Lowe
(2021) found that playing in mixed-caste teams increases cross-caste friendships and trade
efficiency, but adversarial contact (playing against other-caste teams) reduces these ef-
fects. Meta-analytic work (Paluck et al., 2019) has shown that on average, contact seems
to be effective at reducing prejudice and discrimination, at least towards members of the
out-group participants specifically met. In the broader discrimination and prejudice lit-
erature, contact has therefore started to be seen as one of the best (if not only) tools to
20 Chapter 1 - Contact Police
increase inter-group cooperation and trust (Bertrand and Duflo, 2017).
However, as highlighted in a recent review (Paluck et al., 2021), the literature on
contact suffers from four main limitations. The first limitation of the literature is the
small sample sizes in most interventions. My sample consists of more than 360 students,
thus putting the present paper in the top fifth of sample sizes as counted by the review. A
second limitation of the literature is to focus on survey measures, with no repercussion for
dishonest answers, and therefore potentially suffering from experimenter-demand effect
(Zizzo, 2010). In this paper, I use an incentivized outcome - specifically the trust game
(Berg et al., 1995) - and an Implicit Association Test (Greenwald et al., 1998), in which
participants are primed to answer as quickly as possible, not on the outcome of the test
(which would be subject to experimenter demand effect). The third and perhaps most
significant limitation of the literature is the difficulty to replicate the setups in which the
studies were conducted. For instance, the sports league conducted by Mousa (2020) and
Lowe (2021) lasted for several weeks, it might be complicated to have entire populations
joining the military as in Carrell et al. (2015) or Finseraas et al. (2019). The protocol
presented in the present paper, which is an adaptation of Aron et al. (1997), is more
replicable as it is much shorter, and does not require elaborate settings. The fourth
and final limitation of the literature on the contact hypothesis is the lack of a general
theoretical framework of why contact may have an effect. This paper contributes to this
in proposing a model of belief formation which can explain why contact can have an effect
at the individual level, which, however, fails to translate to the out-group in general, a
result that has been found in the literature (Mousa, 2020; Clochard et al., 2022).
3. Experimental Design and Data
Context The experiment took place in March 2021 in two high-schools in the Paris
region, in the towns of Saint-Denis and Corbeil-Essonnes (see a map in Appendix A).
The high-schools were selected because they are located in towns which are relatively im-
poverished (37% and 26%, respectively, of the population live below the national poverty
rate, relative to 15% nationwide), with a large share of immigrants5 (39% and 27%, re-
spectively, relative to 9.6% nationwide) and have a population which is relatively younger
than the rest of the country (about 45% of residents are below 29 years old in both towns,
relative to 30% for the whole country). According to the literature, the population of
these towns is therefore likely to distrust police more than the country average (Roux,
2017; Roche et al., 2020). Indeed, clashes between parts of the population and police
5Under French law, it is illegal to ask individuals about their ethnicity or race. The only distinctionallowed in France regards the nationality and place of birth. The figures presented here represent theshare of immigrants, which are defined as individuals born outside of France, whose nationality of birthis not French and who currently resides in France.

Chapter 1 - Contact Police 21
officers have occurred in the past in both towns.6
Setup With approval from high-school administrations, participation was mandatory
for students (provided the teacher had given their approval), and sessions were conducted
during school time. The sample consisted in 366 high-school students, which were on
average 17 years old and were selected from all curricula (general, technological and pro-
fessional). Participants, being minors, were not financially compensated, but they were
incentivized using grades. At the end of the experiment, one game was selected at random
and determined the number of tokens earned by each participant. The higher the number
of tokens, the higher the grade. Participants were guaranteed a show-up grade of 10 out
of 20. For each additional token, half a point was awarded.
The data was collected on tablets using the o-Tree software (Chen et al., 2016).
Treatments Upon arrival, students were randomly allocated to one of three treatment
arms. The first treatment arm (N=92 ) is a control, the second (N=145 ) is the Photo
treatment, and the third (N = 129 ) is the Contact treatment. In the Photo and Contact
treatment arms, subjects were paired either with a police officer or with a first-year uni-
versity student who grew up in Paris’ suburbs. Treatments are summarized in Figure 1.1.
The treatments resemble the protocol set up in a previous paper (Clochard et al., 2022).
Figure 1.1 – Treatment arms
In the Control group, participants are not told who they are going to play with - they
are told that they are not playing with someone from the class. The Control condition is
used to have a measure of average trust in the specific group.
In the Photo treatment, participants are shown the photo of their pair, and told
whether their pair is a police officer or a student. The Photo treatment is assumed not to
6See for instance this article in Corbeil-Essonnes or this article in Saint-Denis.

22 Chapter 1 - Contact Police
have any effect on the outcomes of interest (i.e. one is not to trust more or less the police
simply by being shown a photo of a police officer), but to test for pre-existing differences
of trust between police officers and students, thus testing whether participants exhibit a
form of in-group (or out-group) bias.
In the Contact treatment, participants met their pair face to face, and both alter-
nately answer progressively more personal questions. The questions are drawn from the
methodology used by Aron et al. (1997), which has been proven to create friendships very
quickly. The original protocol is adapted so that discussions last 10 minutes. In details,
each pair has to answer one question from each of the three sets of questions from Aron
et al. (1997). In the first set (“light closeness”), an example of question drawn is “Would
you like to be famous? In what way?”, while in the last set (“intense closeness”), the
questions are much more intimate, e.g. “Of all the people in your family, whose death
would you find most disturbing? Why?”. All questions are presented in Appendix B, and
the questions they had to answer were drawn at random within each set.
Outcomes As stipulated in the pre-analysis plan, the analysis focuses on three primary
outcomes. The first outcome is a standard Trust Game (Berg et al., 1995). In the trust
game, participants - playing the role of the truster are endowed with 10 tokens. They
choose a number of tokens to be sent to the other player. Each token is then multiplied
by 3, and the other player - the trustee - chooses how many tokens to send back to the
truster. The measure of trust used is the share of tokens sent by the truster, with an
increase associated with a higher degree of trust. The first outcome - Trust Pair - is the
result of the game played with the pair. This outcome captures the effect of contact on
trust towards the individual met.
The second outcome - Trust Police - is again measured via a Trust Game, with a
random policeman. Specifically, they were told that a group of police officers from the
Paris region - Ile-de-France - have played the trust game with high-school students from
Paris’ suburbs and have declared how many tokens they are willing to send back for each
possible amount of tokens sent. One of their answers has been randomly selected and will
be used to determine the participant’s gains. This outcome is used to test the effect of
contact on the police as a whole, not specifically on the individual met.
The third outcome is the result of a novel version of the Implicit Association Test
(Greenwald et al., 1998) - a measure commonly used in social psychology to measure
implicit stereotypes, regarding ethnicity, race, gender, sexual identity or disability - in
which the two categories compared were the police and health services. Participants were
instructed to associate as fast as possible (but without mistakes) images of the police and
health services with either negative or positive words. First - after some training rounds
- participants were instructed to associate the police with negative words, and health
services with positive rounds. Second - after some more training rounds - the places for

Chapter 1 - Contact Police 23
the police and health services were reversed. The outcome used - IAT - is the difference
between the two response times, divided by the standard deviation of times from a pilot
study with a different class in the first high-school. The variable is coded so that a higher
IAT variable is associated to a stronger association between police images and positive
words.7. The variable is used to test the effect of contact on subconscious association of
the police to bad or good.
To summarize, the first outcome - Trust Pair - maps the effect of contact at the
individual level, while the two other outcomes - Trust Police and IAT map the effect of
contact at the collective level.
Estimation strategy I estimate a cross-treatment OLS regressions for each of the three
outcomes (Equation 1.1) . The dependent variables are the two treatments (Contact and
Photo) and an interaction of each treatment and a dummy equal to 1 if the participant
is paired with a police officer. Because in the control treatment, participants are not told
anything about the participants, the variable Police is by default set to 0. This means that
the β2 coefficient in Equation 1.1 identifies the interaction between the Photo treatment
and the Police variable. Standard errors are clustered at the class level.
Controls include age, education and whether the participant was victim of a set of
crimes and misdemeanors. I also included a question known as an instructional manip-
ulation check, typically used in online experiments (Hauser and Schwarz, 2016), used to
measure attention.8
Y = α + β1Contact+ β2Police+ β3Contact× Police
+β4Photo+ γX + ε (1.1)
The main coefficient of interest is β3. A positive β3 would indicate that participants
who met a police officer tend to exhibit more trust in their partner than average. A
negative β2 would indicate that police officers tend to be trusted less than average for
participants the Photo treatment (i.e. a negative out-group bias). β1 represents the
treatment effect of contact for individuals meeting a student, while β4 evaluates whether
there is a difference between the average level of trust (in the control group) and the level
of trust in students (or in-group bias).
7i.e. a shorter response time for the participant to associate the police with positive words thannegative words.
8The question was: “In high-school, it is very common for students to have a preferred subject. Wewould like to know what is your favorite subject, but also check that you read questions carefully. Toshow that you have read this question well, please disregard the following question and select Civicseducation. What is your favorite subject of study?”

24 Chapter 1 - Contact Police
Discussion of protocol There are several points which might need to be clarified re-
garding the implemented protocol. First, participating police officers are clearly a selected
sample and not representative of the police force. All participating officers are members
of an association which aims at improving the dialogue between the police and citizens,
meaning that it is relatively safe to assume that they have a more proactive attitude to
discussions than the average police officer. This fact can be a threat for the interpretation
of the results, in particular with respect to the external validity of the protocol. However,
it can also be a strength of the protocol, especially in regards to the theoretical framework
presented below, as we can assume that contacts will be positive.
The second point worth highlighting regards the race of police officers and students.
The relationship between the race/ethnicity of the population and/or police officers and
the perceptions of the police has been a focus of a large share of the police-population
relations literature - see for instance Antonopoulos (2003); Hasisi and Weitzer (2007);
Brunson and Weitzer (2009). The context of France is very specific compared to many
other countries, particularly the US, because ethnic/racial statistics are forbidden: I there-
fore do not have any individual information about ethnicity or race.9 As mentioned above,
it is possible to say though, that both high-schools are located in towns with a relatively
large share of immigrants.
The third and most significant issue with the present protocol is the fact that all
outcomes are measured right after the end of the intervention, and I do not have no
measure of outcomes months - or even weeks - after the intervention. The lack of evidence
of lasting effects of contact has been identified as a weakness of the contact interventions
(Paluck et al., 2021). I originally intended to collect information one month after the
intervention for one high-school. However, due to sanitary restrictions to tackle the spread
of COVID-19, high-schools in France were closed for the entire month of April 2021,10 and
data collection had to be canceled.
The fourth point worth mentioning about the paper is the effect of contact on trust of
police officers towards students. As with students, it is likely that trust by the police is
also affected by the protocol. However, I am not able to evaluate this effect for multiple
reasons. First, only a limited number of police officers (seven, to be precise) participates
in the experiment. I therefore would not have enough power to detect an effect. Second,
each police officer meets several students, therefore identifying the effect of each contact
would be tricky. Third, even if the effect of contact on trust of police officers was mea-
surable, participating police officers, as mentioned above, are selected, and the result of
the experiment could not easily be generalized to the police as a whole.
9The only question legally allowed to be asked relates to the nationality of parents. However, admin-istrations of the high-schools did not allow the collection of these sensitive data, as most students wereminor and they feared the questions could make some students nervous.
10https://www.education.gouv.fr/covid-19-les-mesures-en-vigueur-dans-les-ecoles-colleges-et-lycees-partir-du-5-avril-2021-322868

Chapter 1 - Contact Police 25
4. Results
Descriptive statistics are displayed in Appendix C. On average, participants were 17
years old, with a relative majority of girls (60%). About one third of participants (35%)
declared at least one negative past encounter with the police, and 21 percent declare that
they have been discriminated against.
The treatments are well balanced (Appendix D) across nearly all characteristics. The
only exception relates to the attention variable, with participants in the Contact treatment
paying relatively less attention than others.
4.1. Primary results
In Table 1.1, I display the results of the estimations for the three outcomes. In ac-
cordance with the pre-analysis plan, I corrected p-values for three one-sided tests, corre-
sponding to a modification of 2/3 of standard p-value thresholds. Normalized treatment
effects for all three outcomes are also displayed in Figure 1.2. Raw averages for the three
outcomes for all treatments are displayed in Appendix E.
Table 1.1 – Treatment effect on primary outcomes
(1) (2) (3)Trust Pair Trust Police IAT
Contact 0.031 -0.001 -0.274*(0.040) (0.032) (0.143)
Police -0.050 -0.008 0.061(0.033) (0.042) (0.167)
Contact × Police 0.086** 0.013 0.022(0.038) (0.062) (0.400)
Photo 0.023 -0.010 -0.134(0.034) (0.043) (0.166)
Constant 0.427 0.088 0.294(0.309) (0.289) (0.983)
Controls Yes Yes YesR2 0.091 0.071 0.077No. obs 359 359 359Mean Control 0.338 0.385 -0.665Std dev. Control 0.223 0.236 0.627
Corrected p-values for three one-tailed tests: * p<0.10, ** p<0.05, *** p<0.01. In column1, the outcome variable is the amount sent in the trust game with the individual met, incolumn 2, the outcome is the amount sent in a trust game with a random police officer.In column 3, the outcome is the result of the Implicit Association Test. Controls includegender, level of education, age, indicators of whether the participant was victim of certaincrimes and misdemeanors and the level of attention. Standard errors are clustered at theclass level.

26 Chapter 1 - Contact Police
-1-.5
0.5
1St
anda
rdiz
ed tr
eatm
ent e
ffect
Trust Pair Trust Police IAT
Photo x Student Photo x PoliceContact x Student Contact x Police
Figure 1.2 – Normalized treatment effects for the three outcomes
From column 1 and the left-hand panel of Figure 1.2, it appears that the contact
has an effect on the amount sent in the trust game played with the person met only if
participants met a police officer. The effect is significant at the 5 percent level (Corrected-
p = 0.044), and the magnitude is large - corresponding to an increase of 0.38 standard
deviations. Being presented a photo of a police officer has a relatively negative effect
on trust, although the difference is not significant (p = 0.14). The lower trust in the
Photo × Police treatment indicates a slight negative prior feeling toward police officers,
relative to the average level of trust in the control group.
The results therefore indicate that contact with a police officer has a positive effect on
trust at the individual level - i.e. towards the specific police officer met. The difference
between the Photo × Police and Contact × Police coefficients is highly significant (p <
0.01). Having a contact with a student appears not to have an effect on trust, indicating
that there is a differentiated effect of contact depending on the person met.
However, the positive individual-level results are not carried over to a change in trust
toward the police in general, as captured by the results presented in columns 2 and 3 of
Table 1.1. Column 2 and the middle panel of Figure 1.2 present treatment effects for the
trust game played with a “random” police officer, while column 3 and the right-hand panel
of Figure 1.2 present the treatment effects on the Implicit Association Test. The point
estimates of the effect of a contact with a police officer are in both cases positive, but the
effect is clearly insignificant.
The primary results therefore indicate that while contact with a police officer has an

Chapter 1 - Contact Police 27
effect on trust toward the specific police officer met, the effect fails to translate to an
increase in trust toward the police in general.
In the following Section, I present an exploratory theoretical framework to understand
how contact can have a positive effect at the individual level but this effect is not translated
at the collective level.
4.2. Theoretical framework and empirical test
In this Section, I develop a model of belief formation which could explain why contact
can have an effect at the individual level - an increase of trust toward the specific police
officers met - but the effect is not observed at the collective level - no increase of trust
toward the police in general. The main assumption of the model is that individuals have
received, prior to the contact, a limited number of signals from the other group.
Setup
I assume that an agent - in the experimental setup, a student - has to evaluate the
value - trustworthiness - of a police officer. The trustworthiness of the police officer is a
random variable denoted by x ∈ {0, 1}, which I assume to be a Bernoulli variable taking
the value 1 with a probability θ. I also assume that the parameter θ is unknown and that
it is drawn from a uniform distribution over [0, 1]. The agent updates her beliefs using
Bayes’ rule.11
Prior to the interaction we are focusing on, I assume that the agent has received n ∈ Ni.i.d. signals (previous interactions with police officers), denoted (x1, ..., xn).
The likelihood is
p(x|θ) = θ∑ni=1 xi × (1− θ)n−
∑ni=1 xi (1.2)
The prior for the value of θ is p(θ) = 1 (uniform distribution).
Using Bayes’ rule, the posterior is therefore
p(θ|x) ∝ θ(∑ni=1 xi+1)−1 × (1− θ)(n−
∑ni=1 xi+1)−1 (1.3)
The estimated value of θ thus follows a Beta distribution with parameters (∑n
i=1 xi +
1, n+ 1−∑n
i=1 xi) (Figure 1.3).
The expected value of θ is
θn =1 +
∑ni=1 xi
n+ 2(1.4)
11I therefore consider that all signals have the same weight, and no other factors - such as similarity(Bordalo et al., 2021) - enter into the beliefs.

28 Chapter 1 - Contact Police
0.2 0.4 0.6 0.8 1.0
1
2
3
n = 0
n = 2
n = 10
n = 20
Figure 1.3 – Densities of probability for θ, depending on the value of n (θ = 0.5 and∑xin
= 12)
Effect of contact
I assume that the contact works as a new, independent signal xn+1 (perfectly observed)
received.
Without contact, the expected trustworthiness of the police officer is the expected
value of the parameter θ, θn. At the individual level, after contact, the trustworthiness is
perfectly observed, therefore the treatment effect at the individual level should be
xn+1 − θn (1.5)
The new signal changes the estimated value of θ to a Beta distribution with parameters∑n+1i=1 xi + 1 and n + 2 −
∑n+1i=1 xi. The expected value of θ after receiving the n + 1-th
signal becomes
θn+1 =1 +
∑n+1i=1 xi
n+ 3(1.6)
The treatment effect at the collective level - i.e. the difference between estimations of
the expected trustworthiness of the group before and after the signal - is
θn+1 − θn =1 +
∑n+1i=1 xi
n+ 3− 1 +
∑ni=1 xi
n+ 2
=xn+1 − θnn+ 3
(1.7)
The treatment effect at the collective level is thus equal to the treatment effect at the
individual level, deflated by a factor n+ 3. The number of prior interactions is therefore
predicted to have a major influence on the treatment effect at the collective level (Figure
1.4).

Chapter 1 - Contact Police 29
0.2 0.4 0.6 0.8 1.0
0.5
1.0
1.5
2.0
2.5
Before contact, n = 2
After contact, n = 2
Before contact, n = 10
After contact, n = 10
Figure 1.4 – Difference of the effect of a positive contact (xn+1 = 1), depending on thevalue of n
Discussion of the model
There are three points worth highlighting regarding the present theoretical framework.
First, I assume that the trustworthiness of the police officer is a binary variable. This
assumption is a simplification, as the main result - the collective effect being of the same
size, but of a smaller magnitude than the individual effect - would hold for any distribution.
Second, I assume that the beliefs about the out-group is correct, given all received signals.
This assumption therefore excludes potential bias connected to incorrect beliefs (Bursztyn
and Yang, 2021) - although it is likely that the expected value of the trustworthiness θn
differs from the true value θ due to sampling issues. Third, I assume that all signals,
including the contact, are equally weighed by the agent, which is a standard consequence of
the Bayesian updating process. This means that I do not consider non-standard channels
which would be path-dependent, such as representativeness (Bordalo et al., 2016, 2021),
attention (Kohlhas and Walther, 2021) or overconfidence (Rabin and Schrag, 1999).
Empirical relevance of the model
The presented theoretical framework predicts that the effect of contact at the collective
level - trust towards the police - should be of the same sign as the treatment effect at the
individual level - trust towards the person met, and the magnitude should be lower.
Although it is difficult to observe directly the number of past interactions with police
officers (and especially whether they were positive or not), but in the questionnaire, par-
ticipants were asked to give the number of identity controls they were subjected to in the
past three years.12 In what follows, I use the number of identity controls as a lower bound
for the number of prior interactions with police officers (n in the model).
The distribution of answers (Figure 1.5) is heavily skewed, with approximately 60
percent of respondents declaring they have not been subjected to an identity check, and
12identity controls are widely used by the French police force to deter criminality. They have been thesource of a large political and societal debate, both about their effectiveness (Tiratelli et al., 2018) andabout the treatment of minority citizens (Beauchemin et al., 2016; Roche, 2016).

30 Chapter 1 - Contact Police
several participants declaring they had been subject to more than 20 checks. The average
value of the number of identity controls is 2.
0.2
.4.6
.8D
ensi
ty
0 1 2 3 4 5 6 7 8 9 10 >10Nb controls
Figure 1.5 – Distribution of the number of identity controls in the three years prior to theexperiment
The prediction of the model is that the effect of contact at the individual level should
be n+ 3 times as large as the effect at the collective level. Using n = 2 as a lower bound,
we should therefore observe an individual effect which is a little more than 5 times as
large as the collective effect. When comparing the two point estimates, we find that the
effect is approximately 6.6, which is not far from the theoretical prediction (although the
point estimates are very noisy).
An additional remark is that if the point estimate is correct, the statistical power of
the experiment is simply too small to detect it. Results from a quick sample calculation
indicate that in order to be able to detect an effect size of approximately 0.07 standard
deviation, the sample required to reach a power of 0.80 is approximately 5,000 observa-
tions, or more than 13 times the sample size of this experiment. This experiment in this
case is therefore clearly not powered enough to detect an effect on contact on trust at the
collective level.
4.3. Exploratory results
In this Section, I present results from estimations which were not included in the
pre-analysis plan, but which could be an avenue for future research.
Other measures of trust in the police In Table 1.2, I analyze the effect of contact
with a police officer on stated measures of trust in the police. In the first three columns,
participants were asked to state whether they agree with several statements. In column 1,
participants were asked whether, should they be victim of a crime, they would be certain

Chapter 1 - Contact Police 31
of reporting it to the police. In column 2, they were asked whether they believe the
career of police officer to be honorable. In column 3, they were asked whether they are
considering becoming a police officer in the future. In column 4, they were asked whether
they believe the police to be violent - the outcome in Table 1.2 is reversed so as to move
in the same direction as the other outcomes.
As can be seen in Table 1.2, results indicate that the treatment has no effect on these
measures of beliefs about police quality. This result is another indication that contact
does not appear to have an effect on the police in general.
Table 1.2 – Treatment effect on views of the police
(1) (2) (3) (4)Likelihood Police Police Policeto report honorable career non violent
Contact 0.003 0.179 0.101 -0.060(0.142) (0.114) (0.092) (0.096)
Police 0.121 0.102 0.032 0.087(0.169) (0.171) (0.086) (0.139)
Contact × Police -0.279 0.084 0.197 0.147(0.171) (0.197) (0.212) (0.153)
Photo -0.058 -0.033 0.017 -0.140(0.146) (0.128) (0.071) (0.103)
Constant 2.521** 4.470*** 1.009 3.461***(1.096) (0.838) (0.711) (1.009)
R2 0.109 0.080 0.108 0.101No. obs 359 359 359 359Mean Control 3.022 2.750 1.141 2.522Std dev. Control 0.877 0.721 0.434 0.718
* p<0.10, ** p<0.05, *** p<0.01. For columns 1 through 3, the outcome is a variablefrom 1 to 4 on whether participants agree with the statement. In column 1, the statementis: Imagine in the future you are victim of theft. You are certain to report it to thepolice. In column 2, the statement is: I believe that police officer is an honorable career.In column 3, the statement is: I am considering a career as a police officer for my future.In the last column, the statement was: I believe police officers are violent. The outcomepresented here is the opposite of the answer of participants (i.e. their disagreement withthe statement). Standard errors are clustered at the class level.
Heterogeneity analysis Results from an heterogeneity analysis, with respect to prior
police interactions and gender, are presented in Table 1.3. In the Table, the variables of
interest are the triple interactions of Contact, Police and the heterogeneous variable.
In column 1 the heterogeneity variable is gender. Results on the main treatment effect
become insignificant, and the treatment effect seem not to vary much on gender.

32 Chapter 1 - Contact Police
Results with police controls, presented in column 2, are more interesting. The vari-
able of heterogeneity is a dummy variable on whether participants have had any identity
controls over the past three years. Although insignificant, the indicate that the treat-
ment effect is reduced for participants subject to identity controls, with the coefficients
Contact× Police and Contact× Police×Controls almost canceling each other entirely.
Table 1.3 – Heterogeneous treatment effect
(1) (2)Gender Police interactions
Contact 0.036 0.006(0.062) (0.047)
Police -0.071 -0.058(0.063) (0.042)
Controls -0.041(0.042)
Police × Controls 0.014(0.060)
Contact × Police × Controls -0.102(0.111)
Contact × Police 0.101 0.124*(0.088) (0.063)
Female -0.082(0.051)
Police × Female 0.027(0.072)
Contact × Police × Female -0.018(0.127)
Photo 0.024 0.025(0.036) (0.033)
Constant 0.496 0.441(0.316) (0.305)
R2 0.083 0.088No. obs 359 359Mean Control 0.338 0.338Std dev. Control 0.223 0.223
* p<0.10, ** p<0.05, *** p<0.01. The outcome variable is the trust in the pair. Femaleis coded as 1 for girls, 0 for boys. Standard errors are clustered at the class level.
In Figure 1.6 are plotted the coefficients of the quantile regressions for the Contact×Police variable. The dependent variable is the share of tokens sent in the trust game
played with the pair. The estimations indicate that there is no significant difference
between deciles.

Chapter 1 - Contact Police 33
-.20
.2.4
Qua
ntile
trea
tmen
t effe
ct
0 .2 .4 .6 .8 1Quantile
Figure 1.6 – Coefficients of Contact × Police in quantile regressions. The dotted linesrepresent 95% confidence intervals.
5. Conclusion
In this paper, I test the effect of a brief contact, borrowing from the highly replicable
“fast-friend”procedure (Aron et al., 1997), between police officers and high-school students
in two French high-schools. I show that the level of trust toward the specific police officer
met (what I call in the paper the effect of contact at the individual level) is significantly
positive, and the magnitude of the effect is important (corresponding to a 0.39 deviation
increase).
However, the positive effect of contact at the individual level fails to translate at the
collective level, either using a measure of trust towards a random police officer, or with
a novel measure of an Implicit Association Test. The theoretical framework presented in
Section 4. can help understand this fact, with a decrease of contact effects due to prior
interactions with police officers.
The results presented above - contact having a positive effect at the individual level
but no effect at the collective level - point an avenue for future research on the contact
hypothesis. In particular, there is a lack of consistency of results regarding the effect of
contact at the collective level: in several contexts, contact has been found to have a posi-
tive effect towards the out-group in general (Carrell et al., 2015; Corno et al., 2019; Lowe,
2021) while in other contexts the positive effects of contact have been found only for the
out-group members specifically met (Mousa (2020); Clochard et al. (2022); the present pa-

34 Chapter 1 - Contact Police
per). Further efforts should be made to understand what factors (context, nature and/or
duration of contact, representativeness of met out-group members, etc) can translate the
positive effects of contact to out-group members in general. The theoretical framework
presented here, showing that a crucial factor seems to be pre-existing interactions with
the out-group, could be a first step in this direction. The question of whether meeting an
individual can change the perception of the entire out-group has been the focus of several
papers in social psychology, with for instance the work on person-positivity bias (Miller
and Felicio, 1990), but the literature does not offer a robust answer yet.
Another important avenue for future research is the literature on the contact hypoth-
esis is to further investigate how contact can change perceptions. As presented in Section
4.3., it does not appear that the change in behavior can be attributed to a change in the
beliefs about the quality of the police. In Appendix F, I present preliminary results from
estimations of a change in beliefs and altruism due to the treatment. Although the results
presented here are insignificant, it could be a first step to understand channels through
which contact is effective.
Moreover, taken at face value, the results presented in this paper also highlight a po-
tential benefit of community policing policies. Community policy typically entails having
specific police officers routinely patrolling the same neighborhoods and interacting with
citizens on issues outside the scope of standard law enforcement. If the results from the
present paper replicate to these situations, community policing policies have the potential
to increase trust toward the specific police officers patrolling given neighborhoods, which
in turn could be a potential benefit to local communities, as trust in police officers has
been shown to increase the probability to contact police when a crime has been committed
(Carr et al., 2007).

Chapter 1 - Contact Police 35
References
Adam-Troian, J., E. Celebi, and Y. Mahfud (2020). “return of the repressed”: Exposure to
police violence increases protest and self-sacrifice intentions for the yellow vests. Group
Processes & Intergroup Relations 23 (8), 1171–1186.
Allport, G. W. (1954). The nature of prejudice. Addison-wesley Reading, MA.
Ang, D. (2021). The effects of police violence on inner-city students. The Quarterly
Journal of Economics 136 (1), 115–168.
Antonopoulos, G. A. (2003). Ethnic and racial minorities and the police: A review of the
literature. The police journal 76 (3), 222–245.
Aron, A., E. Melinat, E. N. Aron, R. D. Vallone, and R. J. Bator (1997). The experimen-
tal generation of interpersonal closeness: A procedure and some preliminary findings.
Personality and Social Psychology Bulletin 23 (4), 363–377.
Ba, B. A., D. Knox, J. Mummolo, and R. Rivera (2021). The role of officer race and
gender in police-civilian interactions in chicago. Science 371 (6530), 696–702.
Beauchemin, C., C. Hamel, and P. Simon (2016). Trajectoires et origines: enquete sur la
diversite des populations en France. Ined editions.
Berg, J., J. Dickhaut, and K. McCabe (1995). Trust, reciprocity, and social history. Games
and economic behavior 10 (1), 122–142.
Bertrand, M. and E. Duflo (2017). Field experiments on discrimination. In Handbook of
economic field experiments, Volume 1, pp. 309–393. Elsevier.
Blair, G., J. Weinstein, F. Christia, E. Arias, E. Badran, R. A. Blair, A. Cheema, A. Fa-
rooqui, T. Fetzer, G. Grossman, et al. (2020). Does community policing build trust in
police and reduce crime? evidence from six coordinated field experiments in the global
south. Technical report, Working paper.
Boisjoly, J., G. J. Duncan, M. Kremer, D. M. Levy, and J. Eccles (2006). Empathy or
antipathy? the impact of diversity. American Economic Review 96 (5), 1890–1905.
Bolger, M. A., D. J. Lytle, and P. C. Bolger (2021). What matters in citizen satisfaction
with police: A meta-analysis. Journal of criminal justice 72, 101760.
Bordalo, P., K. Coffman, N. Gennaioli, F. Schwerter, and A. Shleifer (2021). Memory and
representativeness. Psychological Review 128 (1), 71–85.
Bordalo, P., K. Coffman, N. Gennaioli, and A. Shleifer (2016). Stereotypes. The Quarterly
Journal of Economics 131 (4), 1753–1794.

36 Chapter 1 - Contact Police
Brown, B. and W. R. Benedict (2002). Perceptions of the police: Past findings, method-
ological issues, conceptual issues and policy implications. Policing: an international
journal of police strategies & management 25 (3), 543–580.
Brunson, R. K. and R. Weitzer (2009). Police relations with black and white youths in
different urban neighborhoods. Urban Affairs Review 44 (6), 858–885.
Bursztyn, L. and D. Y. Yang (2021). Misperceptions about others. Technical report,
NBER Working Paper No. 29168.
Caceres-Delpiano, J., A.-I. De Moragas, G. Facchini, and I. Gonzalez (2021). Intergroup
contact and nation building: Evidence from military service in spain. Journal of Public
Economics 201, 104477.
Carr, P. J., L. Napolitano, and J. Keating (2007). We never call the cops and here is
why: A qualitative examination of legal cynicism in three philadelphia neighborhoods.
Criminology 45 (2), 445–480.
Carrell, S. E., M. Hoekstra, and J. E. West (2015). The impact of intergroup contact
on racial attitudes and revealed preferences. Technical report, National Bureau of
Economic Research.
Chen, D. L., M. Schonger, and C. Wickens (2016). otree—an open-source platform for
laboratory, online, and field experiments. Journal of Behavioral and Experimental Fi-
nance 9, 88–97.
Clochard, G.-J., G. Hollard, and O. Sene (2022). Low-cost contact interventions can
increase inter-ethnic trust when previous contact are scarce: Evidence from senegal.
Technical report, CREST Working Paper.
Corno, L., E. La Ferrara, and J. Burns (2019). Interaction, stereotypes and performance:
Evidence from south africa. Technical report, IFS Working Papers.
Desmond, M., A. V. Papachristos, and D. S. Kirk (2016). Police violence and citizen
crime reporting in the black community. American sociological review 81 (5), 857–876.
Eurostat (2015). Quality of life, Facts and views. Publications Office of the European
Union.
Finseraas, H., T. Hanson, A. A. Johnsen, A. Kotsadam, and G. Torsvik (2019). Trust,
ethnic diversity, and personal contact: A field experiment. Journal of Public Eco-
nomics 173, 72–84.
Fryer Jr, R. G. (2019). An empirical analysis of racial differences in police use of force.
Journal of Political Economy 127 (3), 1210–1261.

Chapter 1 - Contact Police 37
Goldsmith, A. (2002). Policing weak states: Citizen safety and state responsibility. Polic-
ing & Society 13 (1), 3–21.
Goldsmith, A. (2005). Police reform and the problem of trust. Theoretical criminol-
ogy 9 (4), 443–470.
Greenwald, A. G., D. E. McGhee, and J. L. Schwartz (1998). Measuring individual
differences in implicit cognition: the implicit association test. Journal of personality
and social psychology 74 (6), 1464.
Hagan, J., C. Shedd, and M. R. Payne (2005). Race, ethnicity, and youth perceptions of
criminal injustice. American sociological review 70 (3), 381–407.
Hasisi, B. and R. Weitzer (2007). Police relations with arabs and jews in israel. The
British Journal of Criminology 47 (5), 728–745.
Hauser, D. J. and N. Schwarz (2016). Attentive turkers: Mturk participants perform
better on online attention checks than do subject pool participants. Behavior research
methods 48 (1), 400–407.
Jobard, F. (2016). Police, du plebiscite a l’abandon. Grands Dossiers Des Sciences
Humaines 44, 22-23.
Kagel, J. H. and A. E. Roth (1995). The Handbook of Experimental Economics. Princeton
University Press.
Katz, W. (2014). Enhancing accountability and trust with independent investigations of
police lethal force. Harv. L. Rev. F. 128, 235.
Kohlhas, A. and A. Walther (2021). Asymmetric attention. American Economic Re-
view 111 (9), 2879—-2925.
List, J. A. (2020). Non est disputandum de generalizability? a glimpse into the external
validity trial. Technical report, National Bureau of Economic Research.
Lowe, M. (2021). Types of contact: A field experiment on collaborative and adversarial
caste integration. American Economic Review 111 (6), 1807–44.
Lyons, W. (2002). Partnerships, information and public safety: Community policing in
a time of terror. Policing: An International Journal of Police Strategies & Manage-
ment 25 (3), 530–542.
Miller, C. t. and D. M. Felicio (1990). Person-positivity bias: Are individuals liked better
than groups? Journal of Experimental Social Psychology 26 (5), 408–420.

38 Chapter 1 - Contact Police
Mousa, S. (2020). Building social cohesion between christians and muslims through soccer
in post-isis iraq. Science 369 (6505), 866–870.
Page-Gould, E., R. Mendoza-Denton, and L. R. Tropp (2008). With a little help from
my cross-group friend: Reducing anxiety in intergroup contexts through cross-group
friendship. Journal of personality and social psychology 95 (5), 1080.
Paluck, E. L., S. A. Green, and D. P. Green (2019). The contact hypothesis re-evaluated.
Behavioural Public Policy 3 (2), 129–158.
Paluck, E. L., R. Porat, C. S. Clark, and D. P. Green (2021). Prejudice reduction: Progress
and challenges. Annual review of psychology 72, 533–560.
Pettigrew, T. F. and L. R. Tropp (2006). A meta-analytic test of intergroup contact
theory. Journal of personality and social psychology 90 (5), 751.
Peyton, K., M. Sierra-Arevalo, and D. G. Rand (2019). A field experiment on com-
munity policing and police legitimacy. Proceedings of the National Academy of Sci-
ences 116 (40), 19894–19898.
Rabin, M. and J. L. Schrag (1999). First impressions matter: A model of confirmatory
bias. The quarterly journal of economics 114 (1), 37–82.
Rao, G. (2019). Familiarity does not breed contempt: Generosity, discrimination, and
diversity in delhi schools. American Economic Review 109 (3), 774–809.
Roche, S. (2016). De la police en democratie. Grasset.
Roche, S., J. de Maillard, G.-V. Carole, and M. Zagrodzki (2020). Les relations entre la
population et les forces de police. un etat des travaux en france.
Roux, G. (2017). Expliquer le rejet de la police en banlieue: discriminations,«ciblage des
quartiers» et racialisation. un etat de l’art. Droit et societe 97 (3), 555–568.
Scacco, A. and S. S. Warren (2018). Can social contact reduce prejudice and discrimi-
nation? evidence from a field experiment in nigeria. American Political Science Re-
view 112 (3), 654–677.
Simpson, R. (2021). When police smile: a two sample test of the effects of facial expressions
on perceptions of police. Journal of Police and Criminal Psychology 36, 170–182.
Sunshine, J. and T. R. Tyler (2003). The role of procedural justice and legitimacy in
shaping public support for policing. Law & society review 37 (3), 513–548.

Chapter 1 - Contact Police 39
Tiratelli, M., P. Quinton, and B. Bradford (2018). Does stop and search deter crime?
evidence from ten years of london-wide data. The British Journal of Criminology 58 (5),
1212–1231.
Zizzo, D. J. (2010). Experimenter demand effects in economic experiments. Experimental
Economics 13 (1), 75–98.

40 Chapter 1 - Contact Police
Appendices
A Experiment location
Figure A.1 – Locations of the two high-schools

Chapter 1 - Contact Police 41
B Questions for the Contact treatment
Set I (light closeness)
1. Given the choice of anyone in the world, whom would you want as a dinner guest?
2. Would you like to be famous? In what way?
3. Before making a telephone call, do you ever rehearse what you are going to say?
Why?
4. What would constitute a “perfect” day for you?
5. When did you last sing to yourself? To someone else?
6. If you were able to live to the age of 90 and retain either the mind or body of a
30-year-old for the last 60 years of your life, which would you want?
7. Do you have a secret hunch about how you will die?
8. Name three things you and your partner appear to have in common.
9. For what in your life do you feel the most grateful?
10. If you could change anything about the way you were raised, what would it be?
11. Take 4 minutes and tell your partner your life story in as much detail as possible.
12. If you could wake up tomorrow having gained any one quality or ability, what would
it be?
Set II (intermediate closeness)
13. If a crystal ball could tell you the truth about yourself, your life, the future, or
anything else, what would you want to know?
14. Is there something that you’ve dreamed of doing for a long time? Why haven’t you
done it?
15. What is the greatest accomplishment of your life?
16. What do you value most in a friendship?
17. What is your most treasured memory?
18. What is your most terrible memory?
19. If you knew that in one year you would die suddenly, would you change anything
about the way you are now living? Why?
20. What does friendship mean to you?
21. What roles do love and affection play in your life?
22. Alternate sharing something you consider a positive characteristic of your partner.
Share a total of 5 items.
23. How close and warm is your family? Do you feel your childhood was happier than
most other people’s?
24. How do you feel about your relationship with your mother?

42 Chapter 1 - Contact Police
Set III (intensive closeness)
25. Make three true “we” statements each. For instance, “We are both in this room
feeling...”
26. Complete this sentence: “I wish I had someone with whom I could share...”
27. If you were going to become a close friend with your partner, please share what
would be important for him or her to know.
28. Tell your partner what you like about them; be very honest this time saying things
that you might not say to someone you’ve just met.
29. Share with your partner an embarrassing moment in your life.
30. When did you last cry in front of another person? By yourself?
31. Tell your partner something that you like about them already.
32. What, if anything, is too serious to be joked about?
33. If you were to die this evening with no opportunity to communicate with anyone,
what would you most regret not having told someone? Why haven’t you told them
yet?
34. Your house, containing everything you own, catches fire. After saving your loved
ones and pets, you have time to safely make a final dash to save any one item. What
would it be? Why?
35. Of all the people in your family, whose death would you find most disturbing? Why?
36. Share a personal problem and ask your partner’s advice on how he or she might
handle it. Also, ask your partner to reflect back to you how you seem to be feeling
about the problem you have chosen.

Chapter 1 - Contact Police 43
C Descriptive statistics
Table C.1 – Descriptive statistics
Variable Mean Std. Dev. Min. Max. N
Panel A. Primary outcomesTrust Pair 0.351 0.226 0 1 366Trust Police 0.374 0.239 0 1 366Trust Youth 0.363 0.236 0 1 366Difference Trust Game -0.012 0.239 -1 0.700 366IAT -0.813 0.987 -7.48 2.79 366
Panel B. Secondary outcomesExpected amount sent back Pair 4.724 4.092 0 30 366Expected amount sent back Police 4.88 4.419 0 30 366Expected amount sent back Youth 4.197 3.801 0 25 366Difference Expected -0.683 4.389 -27 18 366Altruism Dictator 3.292 2.404 0 10 366Altruism police 0.661 0.474 0 1 366
Panel C. ControlsGender 0.596 0.491 0 1 359Age 17.112 0.781 15 20 366Vocational Training 0.123 0.329 0 1 366Technological Training 0.243 0.43 0 1 366General Training 0.634 0.482 0 1 366Education 5.522 2.077 1 8 366Victim theft with violence 0.107 0.309 0 1 366Victim theft without violence 0.131 0.338 0 1 366Victim violence 0.082 0.275 0 1 366Victim sexual violence 0.063 0.243 0 1 366Victim threats 0.161 0.368 0 1 366Victim insults 0.41 0.492 0 1 366Victim scam 0.167 0.373 0 1 366Victim discrimination 0.208 0.406 0 1 366Attention 0.536 0.499 0 1 366Nb controls 1.918 6.034 0 60 366

44 Chapter 1 - Contact Police
D Balance across treatments

Chapter 1 - Contact Police 45
Tab
leD
.1–
Bal
ance
acro
sstr
eatm
ents
Mea
nM
ean
Mea
nD
iffer
ence
SE
Diff
eren
ceSE
Diff
eren
ceSE
contr
olphot
oco
nta
ctco
ntr
olco
ntr
olphot
ophot
oco
nta
ctco
nta
ct
Gen
der
0.57
80.
601
0.60
30.
024
0.06
60.
025
0.06
80.
002
0.06
0A
ge17
.163
17.0
7617
.116
-0.0
870.
110
-0.0
470.
102
0.04
00.
094
Educa
tion
5.58
75.
407
5.60
5-0
.180
0.29
20.
018
0.28
20.
198
0.24
1N
egat
ive
pas
tex
per
ience
0.34
80.
331
0.36
4-0
.017
0.06
30.
017
0.06
60.
033
0.05
8w
ith
pol
ice
Vic
tim
thef
t0.
098
0.09
70.
124
-0.0
010.
040
0.02
60.
043
0.02
70.
038
wit
hvio
lence
Vic
tim
thef
t0.
109
0.11
00.
171
0.00
20.
042
0.06
20.
048
0.06
00.
042
wit
hou
tvio
lence
Vic
tim
vio
lence
0.05
40.
103
0.07
80.
049
0.03
70.
023
0.03
4-0
.026
0.03
5V
icti
mse
xual
0.07
60.
048
0.07
0-0
.028
0.03
2-0
.006
0.03
60.
021
0.02
8vio
lence
Vic
tim
thre
ats
0.13
00.
186
0.15
50.
056
0.04
90.
025
0.04
8-0
.031
0.04
6V
icti
min
sult
s0.
391
0.44
10.
388
0.05
00.
066
-0.0
040.
067
-0.0
540.
060
Vic
tim
scam
0.16
30.
193
0.14
00.
030
0.05
2-0
.024
0.04
9-0
.054
0.04
5V
icti
mdis
crim
inat
ion
0.21
70.
193
0.21
7-0
.024
0.05
4-0
.000
0.05
70.
024
0.04
9A
tten
tion
0.55
40.
586
0.46
50.
032
0.06
6-0
.089
0.06
8-0
.121
**0.
060
Pol
ice
contr
ols
1.09
81.
793
2.64
30.
695
0.68
31.
546*
0.80
00.
850
0.82
5
N92
145
129
*p<
0.10
,**
p<
0.05
,**
*p<
0.01

46 Chapter 1 - Contact Police
E Histograms of treatment effects
0.2
.4M
ean
shar
e se
nt in
Tru
st G
ame
ControlPhoto - No policePhoto - PoliceContact - No policeContact - Police
Figure E.1 – Average amounts sent in the trust game played with the pair
0.2
.4M
ean
shar
e se
nt in
Tru
st G
ame
ControlPhoto - No policePhoto - PoliceContact - No policeContact - Police
Figure E.2 – Average amounts sent in the trust game played with a random policeman

Chapter 1 - Contact Police 47
-2-1
0
ControlPhoto - No policePhoto - PoliceContact - No policeContact - Police
Figure E.3 – Average difference in response time of the Implicit Association Test. Anegative result means that participants took more time associating pictures of the policewith positive words than pictures of health services with the same positive words.
F Channels
In accordance with the PAP, I investigates the empirical channels through which con-
tact might affect trust. As stated in List (2020), standard economic theory would expect
that any change in actions must be attributed to a change in at least one of three param-
eters: incentives - how strategies are translated into payoffs-, beliefs - how other players
are likely to play and therefore influence the payoff of the agent’s own strategy - and/or
utility function - how material payoffs are translated into well-being. In this experiment,
there is no difference between treatment arms in terms of incentives, as they all play the
same games. The channels through which contact could influence behaviors are therefore
only either a change in beliefs, or a change in utility function.
Change in beliefs
To measure whether contact has an effect on beliefs, I use an incentivized elicitation
of the participants’ beliefs about how many tokens the other player will send in the trust
game. Specifically, I had participants answer a question about how many tokens they
believed the other would send back, and earned a bonus of 5 tokens if their answer falls
within two units of the actual answer of the other player.
I elicited participants’ beliefs for each Trust Game played, i.e. for the game played
with their individual partner - Expected pair -, as well as for that played with a random
police officer - Expected police.

48 Chapter 1 - Contact Police
Change in utility
As a measure of a change in the utility function, I use one parameter which is likely to
be affected through contact, namely altruism. To measure altruism at the individual level,
I use the standard Dictator Game (Kagel and Roth, 1995), in which each participant has
to decide on a split of an endowment of 10 tokens between herself and the other player.
The variable Altruism pair is then re-scaled to [0,1] to represent the share of endowment
sent to the other player.
To measure altruism at the collective level, I asked participants to choose one of two
charities to which to give 2e. The first charity is a charity called “L’Oeuvre des Orphelins
de la Prefecture de Police”, which works at providing help to children of police officers
who died on the job.
The choice of the second charity was done during a pilot in February 2021 and involved
16 subjects (which are not part of the final sample). For a number of candidate charities,
participants were asked if they prefer the given charity or the police charity. The results
of the survey is displayed in Table F.1. I decided to use the “Apprentis d’Auteuil” charity
in the final questionnaire because the share of respondents favoring this association was
the closest to 0.5. The charity helps struggling adolescents through training, mentoring
and help for their career path.
The variable Altruism police is thus a dummy variable with value 1 if the participant
chose the police charity, and 0 otherwise.
Table F.1 – Choice of charity
Charity Domain Percentage of respondents
Restos du Cœur Poverty and hunger 12.5Association pour la protection Wildlife protection 68.8des animaux sauvagesFondation Abbe Pierre Poverty and housing 0.0Apprentis d’Auteuil Social rehabilitation of youth 43.8Ordre de Malte Poverty and disability 12.5Association Prevention Road safety 75.0Routiere
The third column represents the percentage of respondents to the pilot who said theypreferred the police charity (Oeuvre des Orphelins de la Prefecture de Police) to thecharity in question. Source: Author, based on a pilot study involving 16 participants.

Chapter 1 - Contact Police 49
Results
In Table F.2, I present the results from estimations of the treatment effect of contact
on each of the secondary outcomes presented above. As can be clearly seen in the Table,
contact does not have an effect on any presented outcome, neither at the individual nor
collective level. This lack of result could come from two reasons: either the true effect is
0, in which case the channel through which contact affects behavior, or the sample is too
small to pick up an effect.
Table F.2 – Treatment effect on secondary outcomes to investigate channels
(1) (2) (3) (4)Expected Altruism Expected Altruism
pair pair police police
Contact -0.149 0.601 0.698 0.095(0.181) (0.663) (0.435) (0.494)
Police 0.164 0.223 0.663 0.512(0.173) (0.478) (0.476) (0.685)
Contact × Police -0.012 0.755 0.564 -0.636(0.314) (0.938) (0.631) (1.172)
Photo -0.210 0.169 0.086 -0.522(0.193) (0.565) (0.521) (0.652)
Constant 0.471 7.279 0.011 11.319**(1.789) (6.188) (3.189) (4.277)
R2 0.057 0.092 0.084 0.063†
No. obs 359 359 359 359Mean Control 0.685 4.315 2.750 5.022Std dev. Control 0.467 3.706 2.375 4.019
* p<0.10, ** p<0.05, *** p<0.01. In column 1, the outcome variable is the expectedshare of tokens sent back by the pair in a trust game. In column 2, the outcome is theamount sent in a dictator game to the pair. In column 3, the outcome is the differencebetween the expected share sent back by a random police officer or a random high-schoolstudent in a trust game. In column 4, the outcome is the probability to select the policeassociation. Controls include gender, level of education, age, indicators of whether theparticipant was victim of certain crimes and misdemeanors and the level of attention. †:Pseudo-R2

50 Chapter 1 - Contact Police
G Comparison of photo and contact treatments only
Table G.1 – Comparison of Photo and Contact treatments
Trust Pair Trust Police IAT
Contact 0.008 -0.007 -0.121(0.035) (0.045) (0.176)
Police -0.078 -0.114* 0.042(0.052) (0.057) (0.262)
Contact × Police 0.070* 0.018 0.009(0.040) (0.061) (0.411)
Constant 0.248 0.199 -0.422(0.422) (0.440) (1.251)
R2 0.125 0.086 0.083No. obs 269 269 269Mean Control 0.338 0.385 -0.665Std dev. Control 0.223 0.236 0.627
* p<0.10, ** p<0.05, *** p<0.01. In column 1, the outcome variable is the amount sentin the trust game with the individual met, in column 2, the outcome is the amount sentin a trust game with a random police officer. In column 3, the outcome is the result ofthe Implicit Association Test. Controls include gender, level of education, age, indicatorsof whether the participant was victim of certain crimes and misdemeanors and the levelof attention. Partner-fixed effects are included. Standard errors are clustered at the classlevel.

Chapter 1 - Contact Police 51
H Difference with the pre-analysis plan
The experiment was pre-registered on the registry for randomized controlled tri-
als in economics held by the American Economic Association (AEA RCT Registry)
on February 3, 2021, before the data collection began. The url for the archive is
https://www.socialscienceregistry.org/trials/7116.
The paper differs from the pre-analysis plan (PAP, click here) in a few dimensions.
Sample size The PAP was drafted before the administration of the second high-school
agreed to participate to the experiment. This enabled me to increase the sample size from
the initially-expected 200 to 366.
Removal of the socio-professional category of the parents In the PAP, I men-
tioned that I would use the socio-professional category of the parents as a control. In the
presented analysis, I decided to remove it, in accordance with the missing values Section.
Indeed, 134 (resp. 112) participants declared either that they did not know the socio-
professional category of their father (resp. mother), amounting to 37 (resp. 31) percent
of respondents.

52 Chapter 1 - Contact Police
I Questionnaire
If you wish to consult the questionnaire given to participants (with the English trans-
lation), please click on the following LINK.

Chapter 2
Low-Cost Contact Interventions Can
Increase Inter-Ethnic Trust:
Evidence from Senegal
Note: This chapter is co-authored with Guillaume Hollard and Omar Sene.
Abstract
Existing experimental evidence on the contact hypothesis has mainly used long and
unstructured interventions, with implications for the replicability and scalability of ex-
isting contact protocols. We here test the effect of a brief contact, using a structured
protocol that can be implemented in a wide range of situations at a reasonable cost. We
also evaluate the lasting effects one month after the intervention. Contact is only found
to be effective at increasing trust toward the specific individuals met, and only in the
short-run. Generic Machine Learning techniques enable us to identify characteristics of
the most and least affected groups.
JEL Classification: C92, C93
Keywords: contact hypothesis, trust, experiment1
1We are grateful to Lori Beaman, Pedro Bordalo, Pierre Boyer, Andrew Clark, Esther Duflo, PaulineRossi and Marc Willinger for helpful remarks. We also thank participants at the CSAE 2022, ICDE 2021,SEEDEC 2021 Conferences, the Senegalese Economists Meetings (Journee des Economistes du Senegal),the Public Goods, Trust and Ethnicity, CREST-DIAL Development Economics and the University ofEast Anglia Lab-in-the-Field 2019 Workshops, as well as at a seminar at the University of Montpellierand internal seminars. Louis-Mael Jean, Anaelle Toure, Pedro Vergara Merino and Clemence Allard pro-vided excellent research assistance. The authors gratefully acknowledge support from the Investissementsd’Avenir (ANR-11-IDEX-0003/Labex Ecodec/ANR-11-LABX-0047).
53

54 Chapter 2 - Contact Intervention Senegal
1. Introduction
Under the “contact hypothesis”, interpersonal contact across group lines can reduce
prejudice and discrimination (Allport, 1954). Recent causal evidence has corroborated the
contact hypothesis, finding that contact reduces prejudice and discrimination across group
lines (Scacco and Warren, 2018; Carrell et al., 2019; Corno et al., 2019). However, contact
interventions often use long and unstructured interventions - e.g. by having people from
different groups participating in long sports leagues (Mousa, 2020; Lowe, 2021). A recent
meta-analysis found no clear evidence that the number of encounters or the duration of
the intervention are primary factors to determine the effect of contact (Clochard, 2022).
In this paper, we implement a “light-touch” contact protocol, based on the “fast-friend”
procedure by Aron et al. (1997), which lasts only a few minutes. The protocol is easily
implementable in a wide variety of contexts, at a reasonable cost. We propose to measure
the effect of contact using two outcomes that are economically relevant and comparable
across contexts. We use the trust game, which is a standard measure of inter-personal
trust. We also use a simple question in which subjects are asked to divide a sum of money
between two individuals. These measures are easy to implement and can help shed light
on the nature of the discrimination: statistical or taste-based discrimination. Lastly,
using statistical tools proposed by Chernozhukov et al. (2018), we can ex-post identify
the characteristics of subjects who are the most affected by the treatment. Last, we run
a follow-up survey a month after the intervention to evaluate the duration of the effects.
We run our pre-registered experiment1 in the Saint-Louis region in Northern Senegal.
Saint-Louis is known for episodes of inter-ethnic tension.2 Our sample consists of 895
participants from a local fishing village, a farming village and the local university.
The proposed protocol consists in face-to-face encounters, with two individuals an-
swering a series of questions drawn from a pre-existing list, where the questions gradually
become more personal. The first questions are relatively trivial (e.g. “Would you like to
be famous? In what way?”) while questions in the end are very intense (e.g. “Of all the
people in your family, whose death would you find most disturbing? Why?”).3 In our
experiment, the subjects are paired with an assistant and discussions last approximately
10 minutes.
We also use a Photo treatment, in which participants are only presented with a photo
of the person they are paired with. This treatment enables us to cleanly distinguish the
effect of meeting, in person, a person (a contact) from simply having basic information
about the other person.
We show that brief, but intense, contact increases investment in the trust game by 0.4
1https://www.socialscienceregistry.org/trials/89642See for instance https://observers.france24.com/fr/20200207-senegal-saint-louis-guet-ndar-affrontements-pecheurs-mauritanie.3The list of of questions is presented in Appendix A

Chapter 2 - Contact Intervention Senegal 55
standard deviations at the individual level (with the specific individuals met during the
intervention). The effect is statistically significant and only appears for participants who
met an assistant from another ethnic group. However, the treatment in found to have no
effect on generosity toward the outgroup in general, as there is no treatment effect on our
money-splitting measure. Moreover, the treatment effects completely vanish - even at the
individual level - one month after the intervention.
Two non-mutually excluding reasons could drive our results. To a part, our results
could be due to the “light-tough” aspect of our contact protocol - as compared to longer
interventions which span over weeks or months. It is therefore possible that our protocol
is simply not sufficient to change perceptions of the entire outgroup. Another explanation
of our results is the studied population. Saint-Louis in Senegal, where our experiment
took place, is known for episodes of inter-ethnic violence but in most instances, ethnic
groups interact in their daily life, inter-ethnic marriages are frequent, etc. Effects could
be limited in magnitude because there is only little ethnic discrimination in Saint Louis.
This paper makes several contributions to the contact literature. First, we contribute
to the replicability of contact interventions. The “fast-friend” procedure used is replicable
to a wide-variety of contexts4. Second, we contribute to the representativeness of contact
interventions. Our experiment is run in the field, with the general population and in
a developing country, for which there is a lack of evidence of the effect of contact -
Clochard (2022) found that most experiments, especially light-touch ones, tend to be
run on university students in the US. Third, we contribute to the comparability of contact
interventions, by using outcome measures which can be easily replicated in widely different
settings. Fourth, we contribute to the open question on the durability of the effects
of contact. We show that the effects of an intervention as light-touch as ours are not
lasting over the long-run, something which was hinted but not conclusively found in the
recent literature review by Paluck et al. (2021). Fifth, we contribute to the question of
heterogeneity of contact interventions, by using machine learning algorithms to identify
characteristics of the most and least affected groups. Our results illustrate that the most
affected individuals appear to be the most distant from their partners. This has potential
implications for the implementations of future contact interventions, and in particular for
the choice of people who might be put in contact.
The remainder of the paper is organized as follows. We describe the experimental de-
sign in Section 2.. Results from the primary estimations are presented in Section 3., while
results from heterogeneity tests are presented in Section 4.. Last, Section 5. concludes.
4See for instance Page-Gould et al. (2008) and Clochard (2021).

56 Chapter 2 - Contact Intervention Senegal
2. Experimental Design
2.1. Protocol
Upon arrival, subjects were randomly assigned to one of three treatments: Contact,
Photo or Control. The treatment arms are summarized in Figure 2.1.
Figure 2.1 – Treatment arms
The Contact treatment is an adaptation from the protocol developed by Aron et al.
(1997): subjects are paired with an assistant, and take turns in answering a series of
questions. The questions, directly drawn from the “Closeness-Generating Procedure” in
Aron et al. (1997), gradually become more self-disclosing and relationship-building. The
first questions are fairly neutral, to get the procedure started (e.g. “Before making a
telephone call, do you ever rehearse what you are going to say? Why?”). The second set
of questions then aims to reveal more personal details (e.g. “What do you value most in
a friendship?”, “How do you feel about your relationship with your mother?”). Last, the
third set covers very personal topics, to create a strong link between the two individuals
(e.g. “If you were going to become a close friend with your partner, please share what
would be important for him or her to know”). The subject and the assistant were both
asked to answer one question from each of these three sets (without any supervision from
experimenters).
In the Photo treatment, subjects are again paired with one of the assistants from
the Contact treatment. However, they do not meet them, but are only shown their
photo with their names - which in Senegal include significant information about ethnicity
(Madubuike, 1976). The Photo treatment is not expected to have any effect on trust itself.
The comparison between the Contact and Photo treatments enables us to distinguish the
effect of a contact from the mere provision of information about the other person.
In both the Contact and the Photo treatments, subjects were explicitly told that the
games played during the experiment will be with the person presented (either in person
or in the photo).

Chapter 2 - Contact Intervention Senegal 57
In the Control treatment, subjects are not presented the person with whom they will
play, but are rather told that they are going to play with “someone selected at random
among participants”. The Control treatment is used to measure a form of average level
of trust in our sample.
Participants were matched with assistants, rather than with other participants. This
matching procedure allowed us to introduce individual assistant fixed effects in the Contact
and Photo treatments. Using assistants was also more convenient, as it ensured that at
least one person in the pair was literate - and therefore did not require a third person
to supervise the discussions (which could have influenced the results) - and because we
used a paper format for the photos in the Photo treatment and so required photos in
advance. Last, having assistants as pairs allowed us to randomize meetings with respect
to ethnicity, which would have been much more difficult otherwise, especially in the fishing
village which is almost entirely ethnically-homogeneous. Assistants were explicitly asked
to behave similarly with all the participants they met.
In total, five assistants were selected from the local university, with three of them
from the main ethnic group in Senegal (Wolof ) and two of them from the second largest
group (Pulaar). After being randomly matched with an assistant, participants were asked
whether they know the assistant. If the answer was yes, then we randomly re-matched
the participant with another assistant.
2.2. Outcomes
After the treatment phase of the experiment, subjects played a standard trust game
(Berg et al., 1995) with the person they had just met (or, in the case of the Control
treatment, with someone “drawn at random”). Our Trust variable is the share of the
endowment sent. The subjects earnings are the real outcomes of this one-shot trust
game. The assistant could play the trust game however he/she wished, and in the Control
treatment the recipient’s behavior was drawn at random. The Trust measure captures
the effect of contact at the individual level.
To see whether the contact interaction affects attitudes towards entire ethnic groups,
we developed a measure of prejudice as follows. We designed two “standard” drawings
of a Pulaar man and a Wolof man (the two main ethnic groups in Senegal), shown in
Figure 2.2, inspired by Blouin and Mukand (2019). Subjects were asked the following
hypothetical question: “Here are two fictional individuals, Ibrahima Ba (on the left) and
Mamadou Ndiaye (on the right). Ibrahima Ba owns two sheep and Mamadou Ndiaye has
three brothers and one sister. Imagine you have 10 000 Francs to split between these two
individuals, how much would you like to send to Ibrahima Ba?”. The names Ba and Ndiaye
are typical of the two ethnic groups (Pulaar and Wolof, respectively). The information
about sheep and siblings is necessary so as to provide an excuse for giving more to one

58 Chapter 2 - Contact Intervention Senegal
individual or the other, without explicitly involving ethnicity (Blouin and Mukand, 2019).
In order to be able to measure the absolute level of prejudice, the information between
the two would have been randomly varied, but for practical reasons (in particular due to
the pen and paper data collection), this was not done, and we can only compare relative
levels of prejudice between groups.
Figure 2.2 – Drawings of“standard”individuals from the two main ethnic groups in Senegal
For the longer-term survey, we modified the names and characteristics of the individ-
uals of question: “Here are two individuals. Oumar Sow has three children, one son and
two daughters, and Abdoulaye Dieng owns a red motorcycle. Imagine you have 10 000
Francs to split between Oumar Sow and Abdoulaye Dieng, how much would you like to
give to Oumar Sow?”. Again, Sow is a typical Pulaar name and Dieng is a typical Wolof
name.
The variable Prejudice is then defined as the share of the endowment sent to the
member of the participant’s own ethnic group. The variable is defined as missing for
participants not belonging to the two main ethnic groups (which represent 83% of our
sample).
While several factors might influence the absolute levels of the Trust and Prejudice
variables - the characteristics of the imaginary individuals, for instance, or the absolute
level of trust of the individuals - the identifying assumption is the fact that these deter-
minants are independent of treatment.
There was no feedback until the end of the experiment. In particular, subjects were
not aware of the outcome of the trust game when answering subsequent questions.

Chapter 2 - Contact Intervention Senegal 59
2.3. Controls and dimensions of heterogeneity
We control for subject age, education, gender and ethnicity. When comparing the
Photo and Contact treatments, we also include metrics of proximity with partners (same
age, ethnicity, gender, etc.).
As indicated in the pre-analysis plan, the main dimension of heterogeneity of the effect
of contact we focused on is the prior exposure to other ethnic groups. Previous papers
have used different methods to identify the interactions with outgroup members: Clochard
(2021) uses the number of police identity controls as a proxy for previous interactions,
Freddi et al. (2022) use whether the students have minority peers in their class. Because
such measures are irrelevant to our setting, in this paper we defined outgroup exposure
using the following method. We asked participants to give the last names of the five
persons with whom they interact the most on a daily basis, outside of their families.
After the data collection phase, we computed the list of all names given by participants.
This gave us a list of 161 different names. We then asked a group of 20 students from the
local university to state which ethnicity they most associate with each name. We assigned
the mode of the answers as the ethnicity of each name.5
After we assigned an ethnicity to each name in our data base, we constructed a vari-
able of exposure to out-group people, Exposure, as a dummy variable of whether the
participant declared more than the median number of friends belonging to ethnic groups
other than her own.
2.4. Setup
The experiment took place between February and March 2022 in the Saint-Louis region
of Northern Senegal. A total of N = 895 people participated in the experiment. Three
sites were selected for the experiment, in order to have a diverse set of populations: a
fishing village called Guet Ndar (N = 327), a farming village called Mouit (N = 212)
and the local university (Universite Gaston Berger, N = 356). On average, participants
earned approximately XOF 2 400 (e3.65) for a session which lasted approximately one
hour.6
To measure the effect of contact in a longer time scope, we ran a phone survey one
month after the intervention with participants from the Contact and Photo treatments.
N = 208 participants (67% of participants who initially provided their phone number)
were successfully identified and agreed to answer the enumerators. No difference in at-
trition was found between the Contact and Photo treatments (31 and 34%, respectively,
t-test p = 0.53).
5This measure of ethnicity is relatively precise, as we can correctly guess 75% of the ethnicities of ourparticipants, using their names.
68 subjects decided to drop out of the experiment before completion, and were excluded from theanalysis.

60 Chapter 2 - Contact Intervention Senegal
3. Results
3.1. Descriptive statistics and balance across treatments
The descriptive statistics are displayed in Table B.1. Our sample is comprised of
adults who are on average 32 years old, with approximately 59% of women. The fact that
the sample is not only comprised of students or children is a contribution to the contact
literature, as there currently exists a gap in evidence of the effects of contact among
adults (Paluck et al., 2021). Most of our sample has received several years of education,
but with a lot of discrepancy (at the university, most participants have graduated high
school, whereas 60% of the sample from the fishing village never went to school).
Compared to the national average, we have a slight over-representation of Wolofs (the
main ethnic group in Senegal), with 65%, compared to approximately 50% nationwide.
This difference is mainly due to the fact that the experiment took place in the Saint-Louis
region with a higher share of this group, and because almost all fishers belong to the
ethnic group.
Treatments are relatively well balanced (Table C.1).
3.2. Short-term effect of contact on trust and prejudice
To estimate the effect of contact on trust and prejudice, we estimate Equation 2.1.
Results are displayed in Table 2.1.
Yi = β0 + β1Contacti + β2Contacti × Same Ethnicityi (2.1)
+β3Photoi + β4Photoi × Same Ethnicityi + γXi + εi
We find that contact has a positive and significant effect on trust at the individual level,
i.e. when looking at the trust game played with the person participants are paired with
(Column 1). The effect is statistically significant and is relatively large, as it corresponds to
0.38 standard deviations. There is no significant difference between contact with someone
from the participants’ own ethnic group or another.
However, the positive effect of contact at the individual level fails to replicate to a
change in the perception of the out-group in general, as we find no significant effect on
our prejudice measure (Column 2).7 The contact then had no effect on the out-group as
a whole, but only on the specific individual who subjects met.8
7Note that the number of observations is lower relative to the previous column for two reasons: first,results from two waves are included in the Trust measure but not the prejudice one, and second, subjectswhich do not belong to one of the two main ethnic groups had to be removed, as the prejudice variableis not defined in their case (see Section 2.).
8Another possibility is that the measure of prejudice is not perfect, especially as the decision here is
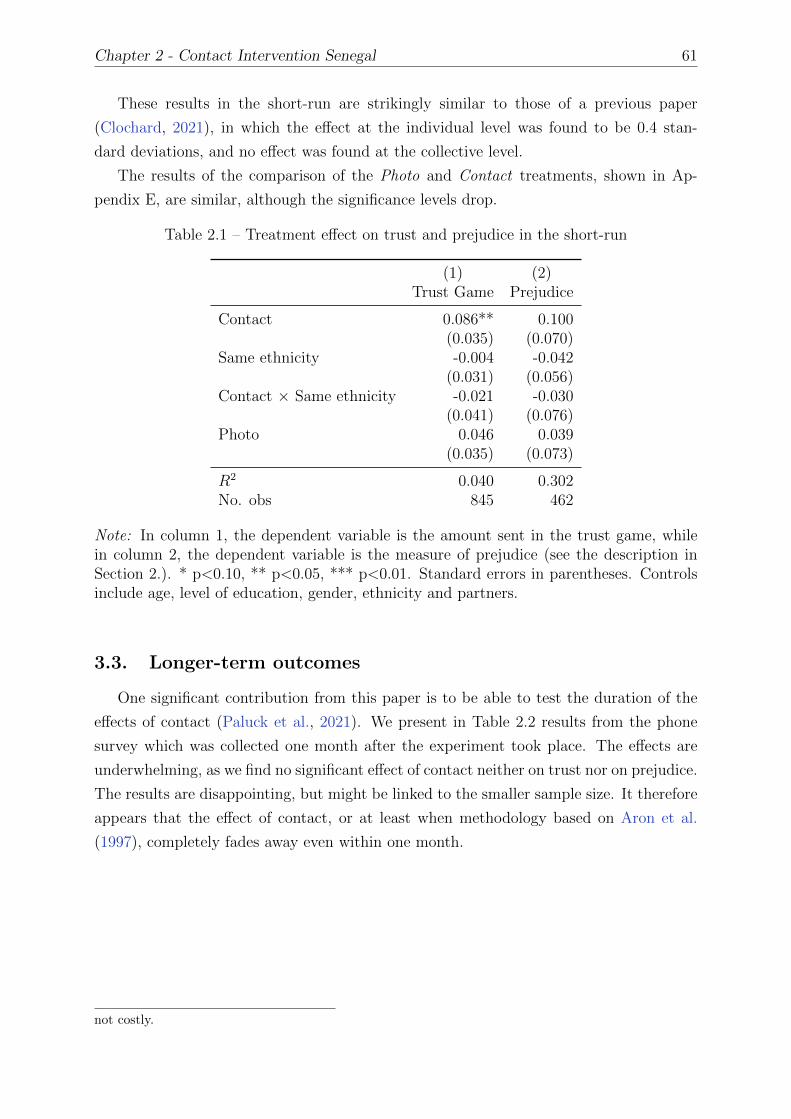
Chapter 2 - Contact Intervention Senegal 61
These results in the short-run are strikingly similar to those of a previous paper
(Clochard, 2021), in which the effect at the individual level was found to be 0.4 stan-
dard deviations, and no effect was found at the collective level.
The results of the comparison of the Photo and Contact treatments, shown in Ap-
pendix E, are similar, although the significance levels drop.
Table 2.1 – Treatment effect on trust and prejudice in the short-run
(1) (2)Trust Game Prejudice
Contact 0.086** 0.100(0.035) (0.070)
Same ethnicity -0.004 -0.042(0.031) (0.056)
Contact × Same ethnicity -0.021 -0.030(0.041) (0.076)
Photo 0.046 0.039(0.035) (0.073)
R2 0.040 0.302No. obs 845 462
Note: In column 1, the dependent variable is the amount sent in the trust game, whilein column 2, the dependent variable is the measure of prejudice (see the description inSection 2.). * p<0.10, ** p<0.05, *** p<0.01. Standard errors in parentheses. Controlsinclude age, level of education, gender, ethnicity and partners.
3.3. Longer-term outcomes
One significant contribution from this paper is to be able to test the duration of the
effects of contact (Paluck et al., 2021). We present in Table 2.2 results from the phone
survey which was collected one month after the experiment took place. The effects are
underwhelming, as we find no significant effect of contact neither on trust nor on prejudice.
The results are disappointing, but might be linked to the smaller sample size. It therefore
appears that the effect of contact, or at least when methodology based on Aron et al.
(1997), completely fades away even within one month.
not costly.

62 Chapter 2 - Contact Intervention Senegal
Table 2.2 – Treatment effect on trust and prejudice in the long-run
(1) (2)Stated trust Prejudice
Contact -0.367 0.049(0.396) (0.070)
Same ethnicity 0.070 -0.028(0.458) (0.070)
Contact × Same ethnicity 0.199 -0.011(0.606) (0.095)
R2 0.101 0.562No. obs 208 163
Note: In column 1, the dependent variable is the declared trust in the person participantsmet, while in column 2, the dependent variable is the measure of prejudice (see the de-scription in Section 2.). * p<0.10, ** p<0.05, *** p<0.01. Standard errors in parentheses.Controls include age, level of education, gender, ethnicity and partners.
4. Heterogeneity analysis
4.1. Heterogeneity based on prior interactions
The main dimension identified in the literature (Page-Gould et al., 2008; Freddi et al.,
2022; Clochard, 2021) as a potential source of heterogeneity in the effect of contact on
trust is the level of interactions outside the intervention with outgroup members. In a
nutshell, the more previous interactions with the outgroup in the everyday life, the less
effective the contact. The variables of interest are defined in Section 2..
Results are displayed in Table F.1, and highlight that across the three measures of
exposure to outgroup members, there appears to be no heterogeneity in the effect of
contact based on prior interactions. This result could be the consequence of the fact that
most participants declare to have at least 1 person outside of their family belonging to
another ethnic group (only 108 participants stated no friend from another ethnic group).
4.2. Generic Machine Learning for heterogeneity analysis
After analyzing the heterogeneity of the treatment effect based on previous interactions
(an identified dimension of heterogeneity), we used the Generic Machine Learning (Generic
ML) approach from Chernozhukov et al. (2018). The principle of the Generic ML is to
estimate and infer parameters based on repeated data splitting, and taking medians of p-
values and confidence intervals. The method estimates the most and least affected groups,
and then computes averages for a selected set of variables.
The characteristics of the least and most affected groups are displayed in Table 2.3.
They indicate that the treatment is most effective for individuals who were paired with

Chapter 2 - Contact Intervention Senegal 63
someone from another ethnic group (as in the primary results, p = 0.04), are older (p <
0.01) and less educated (p < 0.01). The treatment is also less effective on students
(p < 0.01). Interestingly, there is no gender difference between the most and least affected
groups.
In Figure F.1, we display the treatment effects for the different groups. While the
differences between the treatment effects are not significant, the effect is important and
significantly positive for the most affected group. The effect for the least affected group
appears to be a relatively precise zero.
Table 2.3 – Differences in characteristics
Most Affected Least Affected Difference
Same Ethnicity 0.225 0.475 -0.225(0.084,0.371) (0.327,0.620) (-0.426,-0.029)
- - [0.041]**Age 35.58 23.38 12.150
(31.96,39.09) (19.90,26.87) (7.239,17.13)- - [0.000]***
Gender 0.425 0.525 -0.063(0.271,0.581) (0.372,0.678) (-0.286,0.160)
- - [1.000]Education 5.407 8.188 -2.545
(4.348,6.570) (7.049,9.357) (-4.198,-0.988)- - [0.004]***
Student 0.350 0.725 -0.375(0.199,0.498) (0.586,0.874) (-0.578,-0.172)
- - [0.001]***
Using the methodology from Chernozhukov et al. (2018). This table displays the averagecharacteristics in the most and least affected quintiles. * p<0.10, ** p<0.05, *** p<0.01.Standard errors display the median standard errors in each quintile.
5. Discussion and conclusion
The existing literature on the Contact Hypothesis has focused on long interventions,
which are thus potentially difficult to scale-up. We here present the results of a short,
but intense, contact intervention, borrowing from the method in Aron et al. (1997). The
proposed protocol is designed to create closeness between two individuals, irrespective of
their characteristics (e.g. gender, age, social position and ethnicity) by appealing to their
emotions. This protocol is therefore more likely to be replicable in different contexts than
existing interventions in the literature. Furthermore, since the questions in the protocol
are freely-available and relevant for virtually any individual, the protocol is much more

64 Chapter 2 - Contact Intervention Senegal
structured than those currently used and allows for replication. We find a positive effect
of contact on inter-ethnic trust, at the individual level and for individuals who are paired
with partners very different from them. The effects of our protocol, however, completely
fade away one month after the experiment.
The use of a light-touch contact intervention can be viewed as a solution to reveal the
nature of the prejudice in a given society. By nature, we here mean characteristics such
as (1) the dimensions along which prejudice occurs, (2) the origin of the prejudice (e.g.
statistical or taste-based) and (3) the extent to which the prejudice is important. As we
explain below, our intervention allows to gain insights on these three questions at a rather
low cost.
Dimensions of prejudice Prejudice can occur along several dimensions (ethnicity,
gender, age, education, disability, etc.). In general, researchers come up with an assump-
tion about a particular dimension along which some discrimination is expected. In the
case of this paper, our premise was that the ethnic dimension was the main driver of
prejudice. A direct consequence of our focus on ethnicity is the choice of the pool of as-
sistants. Remember that assistants are the individuals that participants will meet during
contacts or see on photo. The main dimension of variation between assistants was their
ethnicity, and on other dimensions, assistants were relatively similar (they were young
and educated, for instance). In the measure of prejudice, with the “money-splitting” task,
we also highlighted primarily ethnic cues. If the dimension which matters for prejudice
was different than ethnicity, the broad design could have remained the same (i.e. contact
vs photo vs control), but some characteristics would have been different.
However, the use of the methoology of Chernozhukov et al. (2018) can provide insights
on which characteristics make participants more affected by the treatment, and thus can
provide information on which dimensions are likely to matter for prejudice. For future
contact interventions, and in particular for RCTs with pre-post comparisons, our cheap
and quick intervention can help identify which characteristics are important, and can help
in the design of the interventions themselves, e.g. if the dimension of prejudice appears
to be age, then there should be some variation in the age of partners.
Source of prejudice A large fraction of the prejudice and discrimination literature has
been devoted to understanding the source of prejudice, broadly categorized as taste-based
(Becker, 1957) or statistical (Arrow, 1971). Our design is able to identify which is at play
in our sample, and which is affected by the treatment. In the design, the Photo treatment
allows for the measure of differences in the amount sent to assistants in the trust game.
The difference in average amount sent between, say, subjects shown a photo of an assistant
from another ethnicity and those shown a photo of an assistant from their ethnic group
can give a sense of the level of statistical discrimination at play. In our case, we observe

Chapter 2 - Contact Intervention Senegal 65
no difference across ethnicities of assistants, indicating that statistical discrimination is
limited in our sample. However, the fact that the treatment has an effect on the amount
sent in the trust game for those who have met someone from another ethnicity indicates
that our treatment can affect the belief about others.
Subjects in our experiment are also asked to split an amount of money between two
individuals who differ on two dimensions, one being ethnicity.9 Because chosen splits do
not differ according to participants’ ethnicity, we can conclude that there is little taste-
based discrimination based on ethnicity in the considered group.
To conclude, it is possible to speculate a little about a potential theory that could
encompass all of our results. We here appeal to a series of papers looking for the root of
prejudice in biases in the human memory system (Bordalo et al., 2021). The key finding
is that beliefs are distorted in favor of the first instance of the group that comes to mind.
So, what comes to mind first has a profound impact on beliefs.10 When previous contacts
were scarce, the individual met during the intervention is likely to be the first to come
to mind when thinking about the other group, in which case our light-touch intervention
might be sufficient to reduce prejudice. If, on the other hand, encounters with out-group
members are plentiful, a more-significant intervention may be necessary, which will help
saturate the image of the out-group with memories from the experiment, as in Mousa
(2020).
9As explained in Section 2., the other dimension is important as it allows subjects to “hide” theirpossible taste-based motivation behind another dimension than ethnicity.
10The classic example of this theory of recall is given in Bordalo et al. (2020): when asking aboutwhite items in a kitchen, people state significantly different words when cued with the word “milk” or“plate”.

66 Chapter 2 - Contact Intervention Senegal
References
Allport, G. W. (1954). The nature of prejudice. Addison-wesley Reading, MA.
Aron, A., E. Melinat, E. N. Aron, R. D. Vallone, and R. J. Bator (1997). The experimen-
tal generation of interpersonal closeness: A procedure and some preliminary findings.
Personality and Social Psychology Bulletin 23 (4), 363–377.
Arrow, K. (1971). The theory of discrimination. Working Papers 403, Princeton Univer-
sity, Department of Economics, Industrial Relations Section.
Becker, G. S. (1957). The economics of discrimination. University of Chicago press.
Berg, J., J. Dickhaut, and K. McCabe (1995). Trust, reciprocity, and social history. Games
and economic behavior 10 (1), 122–142.
Blouin, A. and S. W. Mukand (2019). Erasing ethnicity? propaganda, nation building,
and identity in rwanda. Journal of Political Economy 127 (3), 1008–1062.
Bordalo, P., K. Coffman, N. Gennaioli, F. Schwerter, and A. Shleifer (2021). Memory and
representativeness. Psychological Review 128 (1), 71–85.
Bordalo, P., N. Gennaioli, and A. Shleifer (2020). Memory, attention, and choice. The
Quarterly Journal of Economics 135 (3), 1399–1442.
Carrell, S. E., M. Hoekstra, and J. E. West (2019). The impact of college diversity on
behavior toward minorities. American Economic Journal: Economic Policy 11 (4),
159–82.
Chernozhukov, V., M. Demirer, E. Duflo, and I. Fernandez-Val (2018). Generic machine
learning inference on heterogeneous treatment effects in randomized experiments, with
an application to immunization in india. Technical report, National Bureau of Economic
Research.
Clochard, G.-J. (2021). Improving the perception of the police by the youth. Technical
report, CREST Working Paper.
Clochard, G.-J. (2022). Contact interventions: A meta-analysis. Technical report, CREST
Working Paper.
Corno, L., E. La Ferrara, and J. Burns (2019). Interaction, stereotypes and performance:
Evidence from south africa. Technical report, IFS Working Papers.
Freddi, E., J. J. J. Potters, and S. Suetens (2022). Brief cooperative contact with eth-
nic minorities reduces discrimination. Technical report, CEPR Discussion Paper No.
DP17098.

Chapter 2 - Contact Intervention Senegal 67
Lowe, M. (2021). Types of contact: A field experiment on collaborative and adversarial
caste integration. American Economic Review 111 (6), 1807–44.
Madubuike, I. (1976). A handbook of African names. Three Continents.
Mousa, S. (2020). Building social cohesion between christians and muslims through soccer
in post-isis iraq. Science 369 (6505), 866–870.
Page-Gould, E., R. Mendoza-Denton, and L. R. Tropp (2008). With a little help from
my cross-group friend: Reducing anxiety in intergroup contexts through cross-group
friendship. Journal of personality and social psychology 95 (5), 1080.
Paluck, E. L., R. Porat, C. S. Clark, and D. P. Green (2021). Prejudice reduction: Progress
and challenges. Annual review of psychology 72, 533–560.
Scacco, A. and S. S. Warren (2018). Can social contact reduce prejudice and discrimi-
nation? evidence from a field experiment in nigeria. American Political Science Re-
view 112 (3), 654–677.

68 Chapter 2 - Contact Intervention Senegal
Appendices
A Questions for the Contact treatment
Set I (light closeness)
1. Given the choice of anyone in the world, whom would you want as a dinner guest?
2. Would you like to be famous? In what way?
3. Before making a telephone call, do you ever rehearse what you are going to say?
Why?
4. What would constitute a “perfect” day for you?
5. When did you last sing to yourself? To someone else?
6. If you were able to live to the age of 90 and retain either the mind or body of a
30-year-old for the last 60 years of your life, which would you want?
7. Do you have a secret hunch about how you will die?
8. Name three things you and your partner appear to have in common.
9. For what in your life do you feel the most grateful?
10. If you could change anything about the way you were raised, what would it be?
11. Take 4 minutes and tell your partner your life story in as much detail as possible.
12. If you could wake up tomorrow having gained any one quality or ability, what would
it be?
Set II (intermediate closeness)
13. If a crystal ball could tell you the truth about yourself, your life, the future, or
anything else, what would you want to know?
14. Is there something that you’ve dreamed of doing for a long time? Why haven’t you
done it?
15. What is the greatest accomplishment of your life?
16. What do you value most in a friendship?
17. What is your most treasured memory?
18. What is your most terrible memory?
19. If you knew that in one year you would die suddenly, would you change anything
about the way you are now living? Why?
20. What does friendship mean to you?
21. What roles do love and affection play in your life?
22. Alternate sharing something you consider a positive characteristic of your partner.
Share a total of 5 items.
23. How close and warm is your family? Do you feel your childhood was happier than
most other people’s?
24. How do you feel about your relationship with your mother?

Chapter 2 - Contact Intervention Senegal 69
Set III (intensive closeness)
25. Make three true “we” statements each. For instance, “We are both in this room
feeling...”
26. Complete this sentence: “I wish I had someone with whom I could share...”
27. If you were going to become a close friend with your partner, please share what
would be important for him or her to know.
28. Tell your partner what you like about them; be very honest this time saying things
that you might not say to someone you’ve just met.
29. Share with your partner an embarrassing moment in your life.
30. When did you last cry in front of another person? By yourself?
31. Tell your partner something that you like about them already.
32. What, if anything, is too serious to be joked about?
33. If you were to die this evening with no opportunity to communicate with anyone,
what would you most regret not having told someone? Why haven’t you told them
yet?
34. Your house, containing everything you own, catches fire. After saving your loved
ones and pets, you have time to safely make a final dash to save any one item. What
would it be? Why?
35. Of all the people in your family, whose death would you find most disturbing? Why?
36. Share a personal problem and ask your partner’s advice on how he or she might
handle it. Also, ask your partner to reflect back to you how you seem to be feeling
about the problem you have chosen.

70 Chapter 2 - Contact Intervention Senegal
B Descriptive statistics

Chapter 2 - Contact Intervention Senegal 71
Table B.1 – Descriptive statistics
Variable Mean (Std. Dev.) N
Panel A. Short-term outcomesTrust game 0.452 (0.248) 885In-group bias 0.211 (0.407) 482
Panel B. Long-term outcomesLong-term stated trust 0.628 (0.291) 211Long-term in-group bias 0.336 (0.21) 166
Panel C. TreatmentsContact 0.381 (0.486) 895Photo 0.335 (0.472) 895Control 0.284 (0.451) 895Same ethnicity 0.308 (0.462) 895
Panel D. ControlsAge 31.798 (13.719) 872Student 0.415 (0.493) 895Education 5.79 (4.017) 879Gender 0.593 (0.491) 888EthnicitiesWolof 0.649 (0.477) 895Pulaar/Toucouleur 0.136 (0.343) 895Serer 0.064 (0.244) 895Diola 0.019 (0.137) 895Mandinka 0.027 (0.162) 895Soninke 0.006 (0.075) 895Manjack 0.003 (0.058) 895Bainouk 0 (0) 895Lebou 0.047 (0.212) 895Only Senegalese 0.001 (0.033) 895Other ethnicities 0.036 (0.186) 895
Panel E. Exposure to other ethnic groupsNumber of friends from a different ethnicity 2.308 (1.759) 552More out-group friends than median 0.489 (0.5) 603Any out-group friend 0.821 (0.384) 603Outgroup exposure 3.256 (1.062) 885

72 Chapter 2 - Contact Intervention Senegal
C Balance across treatments

Chapter 2 - Contact Intervention Senegal 73
Tab
leC
.1–
Bal
ance
acro
sstr
eatm
ents
Mea
nM
ean
Mea
nD
iffSE
pD
iffSE
pD
iffSE
pco
ntr
olphot
oco
nta
ctco
ntr
olco
ntr
olphot
ophot
oco
nta
ctco
nta
ct
Age
30.8
5032
.969
31.4
732.
120
1.21
10.
081*
0.62
31.
086
0.56
6-1
.496
1.13
50.
188
Stu
den
t0.
472
0.41
70.
370
-0.0
560.
042
0.18
8-0
.103
0.04
10.
012*
*-0
.047
0.03
90.
223
Educa
tion
6.22
65.
736
5.51
5-0
.490
0.35
10.
164
-0.7
110.
332
0.03
3**
-0.2
210.
319
0.48
9O
utg
roup
exp
osure
3.32
03.
226
3.23
7-0
.094
0.09
10.
301
-0.0
830.
087
0.33
70.
011
0.08
60.
898
Num
ber
of2.
602
2.18
92.
235
-0.4
120.
203
0.04
3**
-0.3
660.
190
0.05
5*0.
046
0.17
10.
788
outg
roup
frie
nds
Mor
eou
tgro
up
0.56
80.
481
0.45
0-0
.088
0.05
40.
104
-0.1
180.
052
0.02
3**
-0.0
300.
047
0.51
8fr
iends
than
med
ian
Any
outg
roup
frie
nd
0.84
90.
801
0.82
1-0
.048
0.04
20.
245
-0.0
290.
039
0.46
40.
020
0.03
70.
592
Wol
of0.
614
0.64
00.
683
0.02
60.
041
0.53
20.
069
0.03
90.
080*
0.04
30.
037
0.24
8P
ula
ar/
Tou
coule
ur
0.15
40.
150
0.11
1-0
.004
0.03
10.
908
-0.0
420.
028
0.13
1-0
.039
0.02
70.
147
Ser
er0.
059
0.07
00.
062
0.01
10.
021
0.60
30.
003
0.02
00.
898
-0.0
080.
020
0.66
8D
iola
0.02
40.
017
0.01
8-0
.007
0.01
20.
560
-0.0
060.
012
0.60
60.
001
0.01
00.
928
Man
din
ka0.
035
0.02
70.
021
-0.0
090.
015
0.55
2-0
.015
0.01
30.
267
-0.0
060.
012
0.60
9Son
inke
0.01
20.
003
0.00
3-0
.008
0.00
70.
241
-0.0
090.
007
0.19
1-0
.000
0.00
40.
928
Man
dja
ck0.
008
0.00
00.
003
-0.0
080.
005
0.12
4-0
.005
0.00
60.
401
0.00
30.
003
0.34
9B
ainou
k0.
000
0.00
00.
000
0.00
00.
000
.0.
000
0.00
0.
0.00
00.
000
.L
ebou
0.04
30.
040
0.05
6-0
.003
0.01
70.
846
0.01
20.
018
0.49
50.
016
0.01
70.
355
Only
Sen
egal
ese
0.00
00.
000
0.00
30.
000
0.00
0.
0.00
30.
003
0.38
90.
003
0.00
30.
349
Oth
eret
hnic
ity
0.03
90.
037
0.03
2-0
.003
0.01
60.
868
-0.0
070.
015
0.64
3-0
.004
0.01
40.
760
N25
430
034
1
*p<
0.10
,**
p<
0.05
,**
*p<
0.01
.

74 Chapter 2 - Contact Intervention Senegal
D Treatment effect in the short and long run0
.2.4
.6.8
Aver
age
shar
e se
nt in
the
trust
gam
e
ControlPhoto - Same ethnicityPhoto - Different ethnicityContact - Same ethnicityContact - Different ethnicity
(a) Average share of endowment sent in thetrust game
0.2
.4.6
.8Av
erag
e pr
ejud
ice
ControlPhoto - Same ethnicityPhoto - Different ethnicityContact - Same ethnicityContact - Different ethnicity
(b) Average level of prejudice
Figure D.1 – Treatment effect in the short term
0.2
.4.6
.8Av
erag
e st
ated
trus
t
Photo - Same ethnicityPhoto - Different ethnicityContact - Same ethnicityContact - Different ethnicity
(a) Average stated trust
-.5-.3
-.1.1
.3.5
Aver
age
prej
udic
e
Photo - Same ethnicityPhoto - Different ethnicityContact - Same ethnicityContact - Different ethnicity
(b) Average level of prejudice
Figure D.2 – Treatment effect in the long term

Chapter 2 - Contact Intervention Senegal 75
E Comparison between the Contact and Photo treatments
Table E.1 – Treatment effect on trust and prejudice in the short-run, comparing only theContact and Photo treatments
(1) (2)Trust Game Prejudice
Contact 0.039 0.058(0.028) (0.055)
Same ethnicity 0.003 -0.043(0.033) (0.055)
Contact × Same ethnicity -0.021 -0.026(0.042) (0.074)
R2 0.037 0.275No. obs 605 355
Note: In column 1, the dependent variable is the amount sent in the trust game, whilein column 2, the dependent variable is the measure of prejudice (see the description inSection 2.). * p<0.10, ** p<0.05, *** p<0.01. Standard errors in parentheses. Controlsinclude age, level of education, gender, ethnicity and partners.

76 Chapter 2 - Contact Intervention Senegal
F Heterogeneity analysis
Prior interactions

Chapter 2 - Contact Intervention Senegal 77
Table F.1 – Heterogeneous treatment effect on trust based on interactions with otherethnic groups.
(1) (2) (3)More outgroup Any Exposure
friends than outgroup tomedian friend outgroup
Contact 0.050 0.024 0.052(0.039) (0.060) (0.038)
Same ethnic 0.004 0.025 0.018(0.039) (0.065) (0.041)
Contact × Same ethnic -0.035 0.084 -0.072(0.058) (0.105) (0.060)
Friends Median -0.035(0.036)
Contact × Friends Median -0.015(0.050)
Same ethnic × Friends Median 0.043(0.061)
Contact × Same ethnic × Friends Median 0.029(0.087)
Any friend -0.040(0.045)
Contact × Any friend 0.023(0.065)
Same ethnic × Any friend -0.008(0.073)
Contact × Same ethnic × Any friend -0.116(0.114)
Exposure -0.015(0.026)
Contact × Exposure -0.001(0.045)
Same ethnic × Exposure -0.013(0.051)
Contact × Same ethnic × Exposure 0.080(0.076)
R2 0.046 0.051 0.041No. obs 574 574 838
Note: In all three columns, the dependent variable is the share of the endowment sent in thetrust game. In column 1, the the Contact and Same ethnicity variables are interacted with adummy variable equal to 1 if the participant declared more outgroup friends than the median.In column 2, the variable interacted is a dummy variable equal to 1 if the participant declaredany outgroup friend. In column 3, the variable interacted is a dummy variable equal to 1 if theparticipant completely agreed to the question “I often spend time with people from other ethnicgroups”. * p<0.10, ** p<0.05, *** p<0.01. Standard errors in parentheses. Controls includeage, level of education, gender, ethnicity and partners.

78 Chapter 2 - Contact Intervention Senegal
Generic Machine Learning
●
●
●
●
●
−0.1
0.0
0.1
0.2
1 2 3 4 5Group by Het Score
Trea
tmen
t Effe
ct
●
ATE 90% CB(ATE)
GATES 90% CB(GATES)
Elastic Net
●
●
●
●
●
−0.1
0.0
0.1
0.2
1 2 3 4 5Group by Het Score
Trea
tmen
t Effe
ct
●
ATE 90% CB(ATE)
GATES 90% CB(GATES)
Random Forest
Figure F.1 – Heterogeneity in treatment effects

Chapter 3
Contact Interventions: A
Meta-Analysis
Abstract
For decades, intergroup contact has been viewed as one of the main tools to reduce
prejudice and improve intergroup relations. This paper reviews the experimental literature
on the contact hypothesis. Based on an analysis of 62 measures from 37 papers, the
conclusions are threefold. First, contact interventions are, on average, effective at reducing
prejudice. Second, there exists a very large heterogeneity in the type of interventions
labelled as contact. Third, characteristics of the experimental context, rather than the
intervention itself, seem to matter for the efficacy of contact. Implications for the future
of the contact literature are discussed.
JEL Codes: C93, C12, C83
Keywords: contact hypothesis, meta-analysis, prejudice reduction, field experiments
79

80 Chapter 3 - Contact Meta-Analysis
1. Introduction
Because of its consequences on social inequality (Durante and Fiske, 2017), xenopho-
bia (Kumar et al., 2011) or reduced economic output (Hjort, 2014), solutions to reduce
prejudice have been studied in psychology, sociology and economics for decades. Among
candidate solutions, contact interventions have received the most attention (Bertrand and
Duflo, 2017).
The so-called contact hypothesis was first coined by Allport (1954), who posited that
prejudice “may be reduced by equal status contact between majority and minority groups
in the pursuit of common goals. The effect is greatly enhanced if this contact is sanctioned
by institutional supports (i.e., by law, custom, or local atmosphere), and provided it is of
a sort that leads to the perception of common interests and common humanity between
members of the two groups.” (p.281). Since Allport, interventions promoting contact
between groups have been seen as one of the main tools to reduce prejudice (Bertrand
and Duflo, 2017; Paluck et al., 2021).
The literature devoted to the investigation of the contact hypothesis developed dra-
matically after Allport’s book, with the seminal meta-analysis by Pettigrew and Tropp
(2006) identifying no less than 515 studies, covering more than 250,000 people from 38
countries, over a period ranging from the 1940s to the year 2000. The overwhelming
conclusion was that contact is effective at reducing prejudice, noting that “Results from
the meta-analysis conclusively show that intergroup contact can promote reductions in
intergroup prejudice” (p.751).
However, only a small fraction analyzed in the meta-analysis employed an experimental
design, with a clear definition of a treated and control group. After the removal of non-
experimental protocols - and the addition of more recent papers investigating contact,
Paluck et al. (2019) are left with 27 studies investigating contact. Of these, the largest
share (33%) investigated the effect of contact on racial and ethnic prejudice for university
students or young adults (18-25 years old), and only two were conducted in developing
countries - Scacco and Warren (2018) in Nigeria and Corno et al. (2019) in South Africa.
In this paper, I update the analysis by Paluck et al. (2019) by adding new papers on
the expanding field of contact interventions. I identified 62 measures from 37 papers. I
also deepen the analysis by investigating which characteristics of interventions appear to
be associated with a larger impact. Allport (1954) identified four necessary conditions of
effectiveness of contact interventions - equal status among groups, common coals, positive
contact and the support of authorities. Subsequent work (Pettigrew and Tropp, 2006;
Lemmer and Wagner, 2015) also identified friendship potential and scriptedness of en-
counter as potential mediators of the effect of contact. Importantly, no formal test of the
relevant hypotheses has, to the best of my knowledge, ever been performed. I therefore
estimate the relevance of characteristics of the interventions, as well as variables indicative

Chapter 3 - Contact Meta-Analysis 81
of the context of the paper (e.g. prejudice on race/ethnicity or caste), for the efficacy of
contact interventions.
My main results are threefold. The first result is confirming that of Paluck et al. (2019)
by showing that contact interventions are effective at reducing prejudice and improving
measures of intergroup cohesion. The typical intervention will have an effect of approx-
imately 0.33 standard deviations. According to Cohen (1969)’s rule of thumb, contact
interventions therefore typically have a small to moderate effect on prejudice.1 There
exist, however, a large heterogeneity between studies and measures.
The second result is that there exists a lack of consistency in use of the term “contact”.
Just like there exists some debate about what falls under the umbrella of intergroup
conflict (Lee and Salvatore, 2022), the term contact has been used to describe very different
protocols, ranging from short face-to-face discussions with very scripted protocols (Page-
Gould et al., 2008; Clochard, 2021; Clochard et al., 2022), sports leagues lasting several
months (Mousa, 2020; Lowe, 2021), education programs (Sorensen, 2010; Scacco and
Warren, 2018) to interactions between army recruits over boot camps (Carrell et al.,
2015; Finseraas et al., 2016). The variety of protocols renders difficult the exercise of
understanding the determinants of efficacy of contact interventions.
The third result is on the characteristics of the most effective contact interventions.
The analysis consisted of a Lasso and post-lasso OLS estimation, with the effect size as
the dependent variable, and all characteristics of the papers as regressors. Results indicate
that the largest effects are found for studies investigating prejudice against older people
and people with disabilities. The effect is lower when no physical encounter with a person
was run, and when the outcome is measured 1 to 30 days after the end of the intervention.
Interestingly, no condition identified by Allport (1954), Pettigrew and Tropp (2006) or
Lemmer and Wagner (2015) are found to be strong predictors of the effect. Although
these conditions are almost never explicitly randomized,2 these results indicate that these
conditions are neither necessary nor sufficient for an effective contact.
After the presentation of the results, I discuss the implications of this meta-analysis
for the future on the research on the contact hypothesis.
The remainder of the paper is organized as follows. Section 2. presents the method
of selection of the papers in this analysis, describes the variables of interest and presents
the methodology of analysis. Section 3. presents the results. Section 4. discusses the
implications of the findings and concludes on future for research on the contact hypothesis.
1Cohen (1969) identifies effects with d = 0.2 as small, d = 0.5 as moderate, d = 0.8 as large.2One significant exception is Lowe (2021) who randomizes the common goal condition.

82 Chapter 3 - Contact Meta-Analysis
2. Method
2.1. Paper selection
The aim of this paper is to investigate the effect of contact interventions on intergroup
prejudice. In order to be included in the present analysis, studies had to involve 1) an
experimental induction of 2) in-person contact, with clearly defined, 3) existing groups.
The experimental criterion was one of the main reason for excluding papers from
the analysis. It implies that studies involving quasi-experimental variations (Vertier and
Viskanic, 2018; Rao, 2019; Steinmayr, 2021) were not included in the analysis. Studies
with no random assignment at all (Alesina et al., 2003; Danckert et al., 2017) were also
excluded from the analysis.
The second criterion for inclusion was in-person contact. A second group of excluded
studies, which is rapidly growing in quantity (in particular since the COVID-19 pandemic),
regroups studies involving online encounters, such as Lenz and Mittlaender (2022).3
The third criterion was the application of an intervention on real groups, therefore
excluding studies involving artificial groups. These typically include many laboratory
experiments, as for instance Whitt et al. (2021), which induce conflict between groups
formed during the experiment.
The papers were selected from recent meta-analyses (Lemmer and Wagner, 2015;
Paluck et al., 2019), and from Google Scholar searches. For Scholar searches, all pa-
pers citing the meta-analyses or Allport’s book (after 2015) were searched, as well as a
word search for contact and prejudice. After the application of the three criteria of inclu-
sion, I was left with 37 papers, with publications between 1972 and 2022, spanning nearly
all continents and covering, in total, more than 17,000 individuals. The full list of papers
is presented in Table A.1.
Importantly, for all selected papers, I included the main outcome variables included
from the articles. For instance, in Mousa (2020), I used whether participants attended
an event with Muslim players, whether they voted for a Muslim to receive an award and
whether they trained with a Muslim six months after the experiment. This distinction
was made because some papers have outcomes measuring different things: in Clochard
(2021), I investigate the effect of contact separately on trust the specific police officers
met, but also toward the police in general. Other papers reported measures separate in
time, and were also included. In total, this left 62 measures from the 37 papers.
3For a meta-analysis of contact in online contexts, see Imperato et al. (2021), who find a positiveeffect of online contact with outgroup members.

Chapter 3 - Contact Meta-Analysis 83
2.2. Description of variables
There are two broad sets of variables used in this analysis: variables related to the
contexts of the paper, and variables related to the contact intervention itself. Descriptive
statistics are presented in the following Section.
Variables on contexts For the variables on papers and their contexts, I define six
variables of interest, which I categorize as follows.
Publication year : I split the sample in three categories: before 2000, between 2001
and 2010 and after 2011.
Sample size: I used four categories: [0,50], [51,100], [101,500] and 501+.
Average age: The variable uses the average age of participants provided by the paper.
Three main categories were identified, 0-18 years old, 18-25 and 25+. These categories can
be broadly thought of as corresponding to “Children to high-school students”, “University
students or young adults” and “General adult population”.
Zone: I divided papers according to geographical areas. This category includes Asia,
Middle-East and Northern Africa, North America, Oceania, Sub-Saharan Africa and West-
ern Europe.
Type of prejudice: This variable captures the main dimension of prejudice targeted
by the contact intervention in the paper.4 The variable is divided in ten categories: age,
caste, disabilities, gender, immigrants, LGBTQ+, police, prisoners, race / ethnicity and
religion.
Type of outcome: This variable defines the type of outcome used in the paper. This
variable is divided into three categories. The first category is behavior (or actions), cor-
responding to observed actions by participants toward the outgroup. This category can
range from experimental games (Finseraas et al., 2019; Clochard, 2021) to the number of
friends from another group (DeVries et al., 1977) and the number of emails exchanged
with outgroup members (Marmaros and Sacerdote, 2006). The second type of outcome
is explicit beliefs or attitudes about the other group. This typically involves participants
to declare whether they agree with a pre-defined set of statements explicitly about the
other group, e.g. “Affirmative action in college admissions should be abolished” (Boisjoly
et al., 2006), “Disabled people are often grumpy and moan about everything” (Krahe and
Altwasser, 2006). The last outcome category is implicit behavior. The main outcome used
in this case is some version of the Implicit Association Test (Greenwald et al., 1998), for
which participants have to click as fast as possible to associate positive or negative words
between the different groups. I also defined a dummy variable called Measure for the
entire group to distinguish measures involving the specific individuals met by participants
and the entire outgroup.
4For instance, in Clochard et al. (2022) the contact appears to be more effective for older individualsand people with lower education, but the main prejudice dimension studied is inter-ethnic trust.

84 Chapter 3 - Contact Meta-Analysis
Variables on contact intervention The contact interventions are widely heteroge-
neous. I identified several characteristics, which were coded as the following.
Type of contact intervention: The variable consists in broad categories of contact
interventions. Seven categories are defined: army recruits, classmates (or participation in a
similar course), participation in a collaborative task, discussions (from scripted discussions
as in Page-Gould et al. (2008) to door-to-door canvassing in Kalla and Broockman (2020)),
lectures, roommates/neighbors and sports teams.
The second broad set of intervention variables are used to characterize the interven-
tions with respect to Allport (1954)’s conditions. The first is equal status among groups,
with typically members of sports teams or classmates considered equal, but canvassing
operations considered as non-equal. The second condition is the clear objective of a com-
mon goal between participants. For instance, playing with someone from another caste in
one’s own team in Lowe (2021) is considered as having a common goal, but when the other
caste member is on the other team, the common goal condition is not satisfied. The third
condition is a positive contact. This condition is satisfied if the individual met during the
intervention counters the initial stereotype. For instance, in Carrell et al. (2019), African
American peers with excellent academic records are considered as inducing a positive con-
tact, but peers with low high-school grades are not. The fourth category is the support
of authorities. The support of authorities was typically coded as 0 if the focus of the
exchange was explicitly not framed as involving the prejudice, e.g. the focus of the course
in Scacco and Warren (2018) is to improve computer skills, not inter-religious relations.
The third set of variables relate to other characteristics of the interventions which
have been found in the literature to potentially moderate the influence of contact. The
first variable from this set is Personal interaction, which is equal to zero, for instance,
if participants are presented with individuals from the outgroup but do not personally
interact with them, as in Grutzeck and Gidycz (1997). The second characteristic is the
friendship potential, typically defined for members of the same sports teams (Mousa,
2020) but not for teachers (Dessel, 2010). The third variable is the scriptedness of the
interactions between members. The intervention was considered as scripted when there
is a clear detail of what the participants needed to discuss (Broockman and Kalla, 2016;
Freddi et al., 2022), and not scripted if the interaction was more free-form (Barnhardt,
2009; Finseraas et al., 2016). Variables for Allport’s conditions, personal interaction,
friendship potential and scriptedness were all coded as dummy variables.
Several variables related to the repetition of contacts were also defined as follows. The
number of encounters with people from the other group was divided into four categories, 0,
1, 2-10 and 10+. The duration of the contact (in days) intervention was also categorized as
1 (typically one shot intervention), 2-30 and 30+. The length of time between intervention
and measure was also coded as 0 (immediately after the intervention, including the end
of the year for year-long interventions), 1-30 and 30+ days.

Chapter 3 - Contact Meta-Analysis 85
2.3. Analysis methodology
For all papers in the analysis, the effect size was normalized using Cohen (1969)’s d
statistic (d = Effect SizeStandard Deviation
). The variable was coded so that the effect is positive if
contact improves intergroup perceptions (increased trust, more outgroup friends, etc).
The average effects, as well as the heterogeneity measures were performed using the
methodology by Deeks et al. (2001): the average effect θIV is calculated as the weighted
average of all treatment effects θIV =∑wiθi∑wi
, with reciprocals of the standard errors as
weights. The heterogeneity metric is Cochran (1950)’s Q =∑wi(θi − θIV )2.
To investigate which characteristics of the contact matter most for efficacy, a Lasso
estimation was performed with the standardized effect as the dependent variable, and all
the characteristics presented above as regressors. A post-lasso OLS estimation was then
performed.
3. Results
3.1. Descriptive statistics
In Tables 3.1 and 3.2 are presented the descriptive statistics of the papers used in
the paper. While a significant number of papers were published before 2000, the bulk of
the experimental contact literature has been done since 2010, with almost half of papers
considered published between 2011 and 2022.
As was highlighted in previous analyses (Lemmer and Wagner, 2015; Paluck et al.,
2019), a very large fraction of contact interventions were ran in North America and West-
ern Europe, and no paper was run in Latin America, for instance. A very large fraction
of the interventions were also conducted on young samples, from children to university
students, although more recent papers focused more on general adult populations. The
three modal prejudices studied are race or ethnicity, LGBTQ+ and religion.
One interesting fact is that almost all measures focus on the effects of contact on
the entire outgroup, and not the outgroup members specifically concerned. We discuss
potential implications in the last section.
One clear result is that there exists a lot of heterogeneity in the type of contact
interventions used. The most common form of intervention typically involves scripted
discussions (Broockman and Kalla, 2016; Clochard, 2021). The army, sports teams and
roommates also provide special contexts which have been studied a lot. Contacts can last
for a long time - e.g. roommates sharing a room for the entire first year of university
(Boisjoly et al., 2006; Corno et al., 2019) - or be very short (Page-Gould et al., 2008; Boag
and Wilson, 2014).
Contrary to what was found in the broader prejudice-reduction literature (Paluck et al.,

86 Chapter 3 - Contact Meta-Analysis
Table 3.1 – Descriptive statistics of contexts of papers
Variable N
Publication year≤ 2000 112001-2010 172011-2022 34
Sample size[0,50] 8[51,100] 6[101,500] 26501+ 22
Average age0-18 1618-25 2825+ 18
ZoneAsia 3Middle-East and Northern Africa 4North America 35Oceania 4Sub-Saharan Africa 5Western Europe 11
Type of prejudiceAge 1Caste 2Disabilities 6Gender 2Immigrants 7LGBTQ+ 10Police 2Prisoners 1Race or ethnicity 25Religion 6
Type of outcomeBehavior 21Explicit beliefs or attitudes 37Implicit behavior 4Measure for the entire outgroup 54

Chapter 3 - Contact Meta-Analysis 87
Table 3.2 – Descriptive statistics of contact interventions
Variable N
Army recruits 6Classmates 9Collaborative task 2Discussions 28Lecture 1Roommates / neighbors 9Sports team 7
Allport’s conditionsEqual status 41Common goal 42Positive contact 56Support of authorities 49Personal interaction 58
Other conditionsFriendship potential 42Scriptedness 31
Number of encounters0 21 162-10 1610+ 28
Duration of the contact (in days)1 202-30 1230+ 30Length between contact and measure (in days)0 321-30 1930+ 11

88 Chapter 3 - Contact Meta-Analysis
2021), the samples for the papers are relatively large, with the median sample consisting
of approximately 350 subjects, and while a large fraction of the literature investigated the
immediate effects of contact, 11 studies provide tests of enduring effects of contact after
one month, with Camargo et al. (2010) measuring the effects of being randomly assigned
a Black roommate two years after the end of the first year of university.
3.2. Is contact effective?
The forest plot of effects and standard errors are plotted in Figure 3.1. We can see
that contact is not found to significantly increase prejudice for any paper, and that for the
majority of papers, contact induces a significant reduction of prejudice (positive effect).
Meta-analytic results indicate that the average estimated effect of contact is 0.329 (SE
= 0.007). This measure is highly significant (p < 0.01). This result means, that, on
average, contact is effective at reducing prejudice. The magnitude is very similar to that
found Paluck et al. (2019), and can place, on average, contact as having small to moderate
effects, as categorized by Cohen (1969)’s rule of thumb.
There also exists a large heterogeneity between effects (Q = 4243, p < 0.01). Figure
3.2 displays the funnel plot of the sample. While we cannot reject a systematic bias,
for instance due to publication bias, I do not replicate Paluck et al. (2019)’s result of
correlation between effect size and standard error (p = 0.825). However, there exists
a correlation between the standardized effect and the sample size (Appendix B), which
could be a sign of bias. On the other hand, the funnel plot is relatively symmetric, with 30
outcomes lower than the weighted average, and 32 higher. It is therefore arguable that the
heterogeneity of observed effects is due to heterogeneity in contexts and methodologies.
3.3. What characteristics matter for contact?
Differences by characteristic In Appendix C are presented effect sizes as a function
of the different variables presented in Section 2..
Age: It appears that studies involving the general population (age 25+) tend to have a
lower average effect (Table C.1), and also tend to be have more precise estimates (Figure
C.1). This result could be the mere consequence of the fact that studies involving the
general adult population tend to be better powered, and therefore provide more accu-
rate estimates, but could also indicate that contact intervention are less effective among
adults (although this result would contradict the heterogeneous treatment effects found
in Clochard et al. (2022)).
Type of prejudice: No clear pattern emerges as a function of the type of prejudice
studied. Most prejudices have a wide range of variation, and although the average effect
is higher for papers about prisoners or for race/ethnicity, the number of papers by category
is too small to be definitive about significant differences (Table C.2, Figure C.2).

Chapter 3 - Contact Meta-Analysis 89
Figure 3.1 – Forest plot of estimated treatment effects. Papers are ordered by their pointestimates, with the lowest at the top, and the largest treatment effects at the bottom.The overall estimated effect of contact is displayed at the bottom of the graph.

90 Chapter 3 - Contact Meta-Analysis
0.00
0.50
1.00
1.50
2.00
Stan
dard
ized
SE
-4.00 -2.00 0.00 2.00 4.00Standardized effect
Figure 3.2 – Funnel plot
Type of intervention: As for the type of prejudice, no clear pattern emerges from the
comparison of the type of contact intervention, in large part due to the low number of
observations for the majority of categories (Table C.4, Figure C.4).
Number of encounters : Figure C.5 shows that the average effect is significantly higher
for studies with more than 10 encounters. It would thus appear that the higher the
number of signals received, the higher the effect.
Duration of contact : The pattern which seems to appear from Figure C.6 and Table
C.6 is that the longer the contact, the stronger its effect. This would, as for the number
of encounters, point to the result that the more signals received, the more effective the
contact.
Time between end of intervention and measurement : No clear pattern emerges from
Figure C.7 and Table C.7. One thing clear is that there exist some protocols for which
the effect of contact lasts a long time, up to two years following the intervention.
Measure for the entire group: As we can see from Table C.8, and although the sample
of measures of the effect of contact toward specific outgroup members is relatively small
(N = 8), it seems that the effect of contact appears to be larger for the specific individuals
met than for the entire outgroup. While the average effect of contact on prejudice is still
significantly positive for measures on the effect toward the entire outgroup, it would appear
to be only 10% of that of individuals. This can be relatively easily understood as coming
from a weaker signal for the entire outgroup than for the specific individuals met.
Lasso In order to understand which characteristic matter more to the magnitude of the
effect of contact on prejudice, I performed a Lasso estimation, using the standardized
effect size as the outcome, with all the variables described above as regressors. After
the estimation, for the selected variables, I performed an OLS estimation to observe the

Chapter 3 - Contact Meta-Analysis 91
unbiased effect of these variables on the effect. For the estimations, sample sizes were
used as analytical weights.
Results are presented in Table 3.3. They indicate that the effect of contact on prejudice
is stronger if the prejudice considered is Age or Disabilities, and if there is a strictly positive
number of encounters.
Interestingly, the algorithm selected neither the characteristics proposed by Allport
(1954) nor those proposed by later reviews (Pettigrew and Tropp, 2006; Lemmer and
Wagner, 2015; Paluck et al., 2019). It therefore appears that these conditions are neither
necessary nor sufficient for effective contact interventions. Of course, this analysis is de-
scriptive, as the conditions are rarely randomly allocated among participating individuals
(Lowe (2021) being the exception).
The implications of this meta-analytic work, and hypothetical paths for the future of
the contact literature are discussed in the following section.
Table 3.3 – Lasso coefficients and Post-Lasso OLS estimation
Lasso Post-Lasso OLS
Prejudice = Age 0.408 0.577***(0.179)
Prejudice = Disabilities 0.072 0.293(0.179)
Number of encounters = 0 -0.070 -0.301*(0.179)
Days after end of contact 1-30 -0.016 -0.232(0.210)
Constant 0.341 0.588***(0.110)
R2 0.077No. obs 62Average dependent variable 0.545Standard deviation dependent variable 0.644
In column 1 are displayed the Lasso coefficients for the selected variables. Results of theOLS estimation with only the selected coefficients are presented in column 2. * p<0.10,** p<0.05, *** p<0.01. Standard errors in parentheses.
4. Discussion
In this paper, I conduct a meta-analysis of the literature on the contact hypothesis.
While the sample of the initial meta-analysis by Pettigrew and Tropp (2006) consisted
almost entirely on descriptive, non-experimental evidence on the effect of contact, the
number of experiments using contact is rapidly growing, with the added bonus of widening

92 Chapter 3 - Contact Meta-Analysis
the geographic origins of samples. While the bulk of the research still takes place in the
US, there is now a growing number of studies from other parts of the world, and in
particular developing countries.
Moreover, the experimental literature on contact is also becoming more credible, with
the use of relatively large sample sizes. Nearly all papers published after 2010 in this
analysis would be considered a “large study”, using the taxonomy by Paluck et al. (2021),
with an average contact group of more than 75 individuals.5 All papers after 2015 have
also made use of a pre-analysis plan, reinforcing the credibility of findings.
The present meta-analytic exercise, however, has highlighted three main limitations
of the current literature on contact. The first main limitation of the contact literature
is the lack of discussion about pre-experimental prejudice. In the typical literature, the
absolute level of prejudice is computed from a survey at baseline (before treatment), but
no discussion is had about the meaning of observed levels. Moreover, there typically lacks
the counterfactual exercise of a comparison group. For instance, White participants are
asked whether they agree with the statement“Do you think Black people can be trusted?”,
but never “Do you think White people can be trusted?”. This lack of comparison group
forbids much of the literature to identify prejudiced behavior at baseline.
Furthermore, whenever papers do identify pre-experimental levels of discrimination,
such as Finseraas et al. (2016), they rarely identify the underlying source of prejudice
(i.e. taste-based vs statistical). There also often is a lack of explicit discussion about the
absolute levels of prejudice.
The second main limitation of the literature is the lack of consistency in use of the
term “contact”, as was described in Section 2.. The wide variety of protocols falling un-
der the umbrella of contact – from sports leagues to canvassing to interactions between
classmates or army recruits – makes difficult the comparison of different interventions.
In my opinion, future experiments should put more emphasis on the exact content of
the contact interventions, not merely the context in which they occur. Now that several
meta-analytical works have been carried out, all highlighting the benefits of contact in-
terventions, the focus of the literature should be shifting from the question of whether
contact interventions are effective, but on the how they work. On the note of understand-
ing the mechanisms through which contact can impact prejudice, more effort should be
devoted to randomly allocating contact conditions within an experimental sample - a la
Lowe (2021). This would enable the field to understand which characteristics of proto-
cols are effective at improving intergroup relations. This exercise could help confirm, or
disprove, the descriptive results from the lasso analysis above.
The third limitation of the literature is the lack of a theoretical framework which
could explain the effects of contact. Of all the papers analyzed in the present paper, only
5The only exception would be the sub-group without minority peers in Freddi et al. (2022).

Chapter 3 - Contact Meta-Analysis 93
two (Lowe, 2021; Clochard, 2021) make attempts at designing a theoretical framework to
explain the effects of contact on prejudice. The literature should work hand in hand with
the literature on belief updating. One potential solution could be to integrate a form of
updating in the literature on stereotyping (Bordalo et al., 2020). In this regard, analyzing
a clear distinction between the effects of contact on the specific individuals met, and the
effects of contact on the entire outgroup, could prove useful.
To conclude, the results of the present analysis point to a potential hope for the future
of contact interventions. One of the main consistency in the existing literature is the fact
that the more interactions participants have with members of the outgroup, the more
effective the contact (Page-Gould et al., 2008; Clochard, 2021). This result could mean
that a contact functions as a signal about the outgroup, and the higher the number of
signals, the larger the shift of the distribution. Because more contacts induce stronger
responses, this means that contact can be more suited to reducing statistical discrimi-
nation than taste-based discrimination. This could mean that contact is a particularly
interesting tool to reduce prejudice in the labor market, as it has been found that the
main source of prejudice in this domain is statistical (List, 2004). Now that we know
contact interventions can reduce prejudice, efforts should be made to investigate whether
contact interventions can also reduce the pernicious effects of prejudice on society and the
economy.

94 Chapter 3 - Contact Meta-Analysis
References
Alesina, A., A. Devleeschauwer, W. Easterly, S. Kurlat, and R. Wacziarg (2003). Frac-
tionalization. Journal of Economic growth 8 (2), 155–194.
Alimo, C. J. (2012). From dialogue to action: The impact of cross-race intergroup dialogue
on the development of white college students as racial allies. Equity & Excellence in
Education 45 (1), 36–59.
Allport, G. W. (1954). The nature of prejudice. Addison-wesley Reading, MA.
Barnhardt, S. (2009). Near and dear? evaluating the impact of neighbor diversity on
inter-religious attitudes. Technical report, Harvard Working Papers.
Bertrand, M. and E. Duflo (2017). Field experiments on discrimination. In Handbook of
economic field experiments, Volume 1, pp. 309–393. Elsevier.
Boag, E. M. and D. Wilson (2014). Inside experience: Engagement empathy and prejudice
towards prisoners. Journal of Criminal Psychology 4 (1), 33–43.
Boisjoly, J., G. J. Duncan, M. Kremer, D. M. Levy, and J. Eccles (2006). Empathy or
antipathy? the impact of diversity. American Economic Review 96 (5), 1890–1905.
Bordalo, P., N. Gennaioli, and A. Shleifer (2020). Memory, attention, and choice. The
Quarterly Journal of Economics 135 (3), 1399–1442.
Broockman, D. and J. Kalla (2016). Durably reducing transphobia: A field experiment
on door-to-door canvassing. Science 352 (6282), 220–224.
Camargo, B., R. Stinebrickner, and T. Stinebrickner (2010). Interracial friendships in
college. Journal of Labor Economics 28 (4), 861–892.
Carrell, S. E., M. Hoekstra, and J. E. West (2015). The impact of intergroup contact
on racial attitudes and revealed preferences. Technical report, National Bureau of
Economic Research.
Carrell, S. E., M. Hoekstra, and J. E. West (2019). The impact of college diversity on
behavior toward minorities. American Economic Journal: Economic Policy 11 (4),
159–82.
Clochard, G.-J. (2021). Improving the perception of the police by the youth. Technical
report, CREST Working Paper.
Clochard, G.-J., G. Hollard, and O. Sene (2022). Low-cost contact interventions can
increase inter-ethnic trust when previous contact are scarce: Evidence from senegal.
Technical report, CREST Working Paper.

Chapter 3 - Contact Meta-Analysis 95
Clunies-Ross, G. and K. O’meara (1989). Changing the attitudes of students towards
peers with disabilities. Australian Psychologist 24 (2), 273–284.
Cochran, W. G. (1950). The comparison of percentages in matched samples.
Biometrika 37 (3/4), 256–266.
Cohen, J. (1969). Statistical power analysis for tibe behavioral sciences.
Corno, L., E. La Ferrara, and J. Burns (2019). Interaction, stereotypes and performance:
Evidence from south africa. Technical report, IFS Working Papers.
Dahl, G. B., A. Kotsadam, and D.-O. Rooth (2021). Does integration change gender
attitudes? the effect of randomly assigning women to traditionally male teams. The
Quarterly Journal of Economics 136 (2), 987–1030.
Danckert, B., P. T. Dinesen, R. Klemmensen, A. S. Nørgaard, D. Stolle, and K. M.
Sønderskov (2017). With an open mind: Openness to experience moderates the effect of
interethnic encounters on support for immigration. European Sociological Review 33 (5),
721–733.
Deeks, J. J., D. G. Altman, and M. J. Bradburn (2001). Statistical Methods for Ex-
amining Heterogeneity and Combining Results from Several Studies in Meta-Analysis,
Chapter 15, pp. 285–312. John Wiley & Sons, Ltd.
Deeks, J. J., D. G. Altman, and M. J. Bradburn (2009). Tolerance and the contact
hypothesis: A field experiment, Chapter 10, pp. 1–23. New York: Oxford University
Press.
Dessel, A. B. (2010). Effects of intergroup dialogue: Public school teachers and sexual
orientation prejudice. Small Group Research 41 (5), 556–592.
DeVries, D. L., K. J. Edwards, and R. E. Slavin (1977). Biracial learning teams and race
relations in the classroom: four field experiments on teams-games-tounament. Technical
report, Baltimore: John Hopkins University.
Durante, F. and S. T. Fiske (2017). How social-class stereotypes maintain inequality.
Current opinion in psychology 18, 43–48.
Finseraas, H., T. Hanson, A. A. Johnsen, A. Kotsadam, and G. Torsvik (2019). Trust,
ethnic diversity, and personal contact: A field experiment. Journal of Public Eco-
nomics 173, 72–84.
Finseraas, H., A. A. Johnsen, A. Kotsadam, and G. Torsvik (2016). Exposure to fe-
male colleagues breaks the glass ceiling—evidence from a combined vignette and field
experiment. European Economic Review 90, 363–374.

96 Chapter 3 - Contact Meta-Analysis
Finseraas, H. and A. Kotsadam (2017). Does personal contact with ethnic minorities
affect anti-immigrant sentiments? evidence from a field experiment. European Journal
of Political Research 56 (3), 703–722.
Freddi, E., J. J. J. Potters, and S. Suetens (2022). Brief cooperative contact with eth-
nic minorities reduces discrimination. Technical report, CEPR Discussion Paper No.
DP17098.
Furuto, S. B. and D. M. Furuto (1983). The effects of affective and cognitive treatment on
attitude change toward ethnic minority groups. International Journal of Intercultural
Relations 7 (2), 149–165.
Greenwald, A. G., D. E. McGhee, and J. L. Schwartz (1998). Measuring individual
differences in implicit cognition: the implicit association test. Journal of personality
and social psychology 74 (6), 1464.
Grutzeck, S. and C. A. Gidycz (1997). The effects of a gay and lesbian speaker panel on
college students’ attitudes and behaviors: The importance of context effects. Imagina-
tion, Cognition and Personality 17 (1), 65–81.
Hjort, J. (2014). Ethnic divisions and production in firms. The Quarterly Journal of
Economics 129 (4), 1899–1946.
Hull IV, W. F. (1972). Ii. changes in world-mindedness after a cross-cultural sensitivity
group experience. The Journal of Applied Behavioral Science 8 (1), 115–121.
Imperato, C., B. H. Schneider, L. Caricati, Y. Amichai-Hamburger, and T. Mancini
(2021). Allport meets internet: A meta-analytical investigation of online intergroup
contact and prejudice reduction. International Journal of Intercultural Relations 81,
131–141.
Kalla, J. L. and D. E. Broockman (2020). Reducing exclusionary attitudes through in-
terpersonal conversation: Evidence from three field experiments. American Political
Science Review 114 (2), 410–425.
Krahe, B. and C. Altwasser (2006). Changing negative attitudes towards persons with
physical disabilities: An experimental intervention. Journal of Community & Applied
Social Psychology 16 (1), 59–69.
Kumar, R., N. Seay, and S. Karabenick (2011). Shades of white: Identity status, stereo-
types, prejudice, and xenophobia. Educational studies 47 (4), 347–378.
Lee, D. and J. Salvatore (2022). Special issue editorial integrating cross-field views on
intergroup conflict.

Chapter 3 - Contact Meta-Analysis 97
Lemmer, G. and U. Wagner (2015). Can we really reduce ethnic prejudice outside the
lab? a meta-analysis of direct and indirect contact interventions. European Journal of
Social Psychology 45 (2), 152–168.
Lenz, L. and S. Mittlaender (2022). The effect of inter-group contact on discrimination.
Journal of Economic Psychology 89, 102483.
List, J. A. (2004). The nature and extent of discrimination in the marketplace: Evidence
from the field. The Quarterly Journal of Economics 119 (1), 49–89.
Lowe, M. (2021). Types of contact: A field experiment on collaborative and adversarial
caste integration. American Economic Review 111 (6), 1807–44.
Markowicz, J. A. (2009). Intergroup contact experience in dialogues on race groups: Does
empathy and an informational identity style help explain prejudice reduction? The
Pennsylvania State University.
Marmaros, D. and B. Sacerdote (2006). How do friendships form? The Quarterly Journal
of Economics 121 (1), 79–119.
Meshel, D. S. and R. P. MCGlynn (2004). Intergenerational contact, attitudes, and
stereotypes of adolescents and older people. Educational Gerontology 30 (6), 457–479.
Mousa, S. (2020). Building social cohesion between christians and muslims through soccer
in post-isis iraq. Science 369 (6505), 866–870.
Page-Gould, E., R. Mendoza-Denton, and L. R. Tropp (2008). With a little help from
my cross-group friend: Reducing anxiety in intergroup contexts through cross-group
friendship. Journal of personality and social psychology 95 (5), 1080.
Paluck, E. L., S. A. Green, and D. P. Green (2019). The contact hypothesis re-evaluated.
Behavioural Public Policy 3 (2), 129–158.
Paluck, E. L., R. Porat, C. S. Clark, and D. P. Green (2021). Prejudice reduction: Progress
and challenges. Annual review of psychology 72, 533–560.
Pettigrew, T. F. and L. R. Tropp (2006). A meta-analytic test of intergroup contact
theory. Journal of personality and social psychology 90 (5), 751.
Rao, G. (2019). Familiarity does not breed contempt: Generosity, discrimination, and
diversity in delhi schools. American Economic Review 109 (3), 774–809.
Scacco, A. and S. S. Warren (2018). Can social contact reduce prejudice and discrimi-
nation? evidence from a field experiment in nigeria. American Political Science Re-
view 112 (3), 654–677.

98 Chapter 3 - Contact Meta-Analysis
Sorensen, N. A. (2010). The road to empathy: Dialogic pathways for engaging diversity
and improving intergroup relations. University of Michigan.
Steinmayr, A. (2021). Contact versus exposure: Refugee presence and voting for the far
right. Review of Economics and Statistics 103 (2), 310–327.
Van Laar, C., S. Levin, S. Sinclair, and J. Sidanius (2005). The effect of university
roommate contact on ethnic attitudes and behavior. Journal of Experimental Social
Psychology 41 (4), 329–345.
Vertier, P. and M. Viskanic (2018). Dismantling the ’jungle’: Migrant relocation and ex-
treme voting in france. Technical report, Center for Economic Studies and ifo Institute.
Whitt, S., R. K. Wilson, and V. Mironova (2021). Inter-group contact and out-group
altruism after violence. Journal of Economic Psychology 86, 102420.
Yablon, Y. B. (2012). Are we preaching to the converted? the role of motivation in under-
standing the contribution of intergroup encounters. Journal of Peace Education 9 (3),
249–263.

Chapter 3 - Contact Meta-Analysis 99
Appendices
A List of all papers
The description of all the papers with all the variables used in the present paper can
be found here.
The list of papers is detailed in Table A.1.

100 Chapter 3 - Contact Meta-Analysis
Table A.1 – List of all papers used in the analysis
Paper
Alimo (2012)Barnhardt (2009)Boag and Wilson (2014)Boisjoly et al. (2006)Broockman and Kalla (2016)Camargo et al. (2010)Carrell et al. (2019)Clochard (2021)Clochard et al. (2022)Clunies-Ross and O’meara (1989)Corno et al. (2019)Dahl et al. (2021)Dessel (2010)DeVries et al. (1977)Finseraas et al. (2016)Finseraas et al. (2019)Finseraas and Kotsadam (2017)Freddi et al. (2022)Furuto and Furuto (1983)Deeks et al. (2009)Grutzeck and Gidycz (1997)Hull IV (1972)Kalla and Broockman (2020)Krahe and Altwasser (2006)Lowe (2021)Markowicz (2009)Marmaros and Sacerdote (2006)Meshel and MCGlynn (2004)Mousa (2020)Page-Gould et al. (2008)Scacco and Warren (2018)Sorensen (2010)Van Laar et al. (2005)Yablon (2012)

Chapter 3 - Contact Meta-Analysis 101
B Effect size as a function of the sample size
-10
12
3Ef
fect
siz
es
0 500 1000 1500 2000N
Effect sizeFitted values
Figure B.1 – Effect size as a function of the sample size
Table B.1 – Effect size as a function of the sample size
Effect by sample size
N -0.0004***(0.000)
Constant 0.7718***(0.111)
R2 0.120No. obs 62
The dependent variable is the standardized effect size. * p<0.10, ** p<0.05, *** p<0.01.Standard errors in parentheses.

102 Chapter 3 - Contact Meta-Analysis
C Effect size as a function of characteristics
-4-2
02
4Ef
fect
siz
es
Children (0-18)University students or young adults (18-25)Adults (26+)
Figure C.1 – Effect size as a function of age category of the sample
Table C.1 – Average effect size per age category
Age category Average effect Standard error Number of measures
0-18 0.492 0.057 1618-25 0.953 0.014 2825+ 0.084 0.008 18
This table represents average effect sizes and standard errors, from a meta-analysis of all papers in thesame age category.

Chapter 3 - Contact Meta-Analysis 103
-4-2
02
4Ef
fect
siz
es
Race / EthnicityCasteDisabilitiesGenderImmigrantsLGBTQ+PolicePrisonersAgeReligion
Figure C.2 – Effect size as a function of the type of prejudice
Table C.2 – Average effect size per prejudice
Type of prejudice Average effect Standard error Number of measures
Age 0.933 0.387 1Caste 0.130 0.041 2Disabilities 0.860 0.126 6Gender 0.525 0.166 2Immigrants 0.094 0.015 7LGBTQ+ 0.078 0.010 10Police 0.288 0.143 2Prisoners 1.760 0.140 1Race / ethnicity 1.051 0.014 25Religion 0.508 0.094 6
This table represents average effect sizes and standard errors, from a meta-analysis of all papers in thesame category of prejudice.
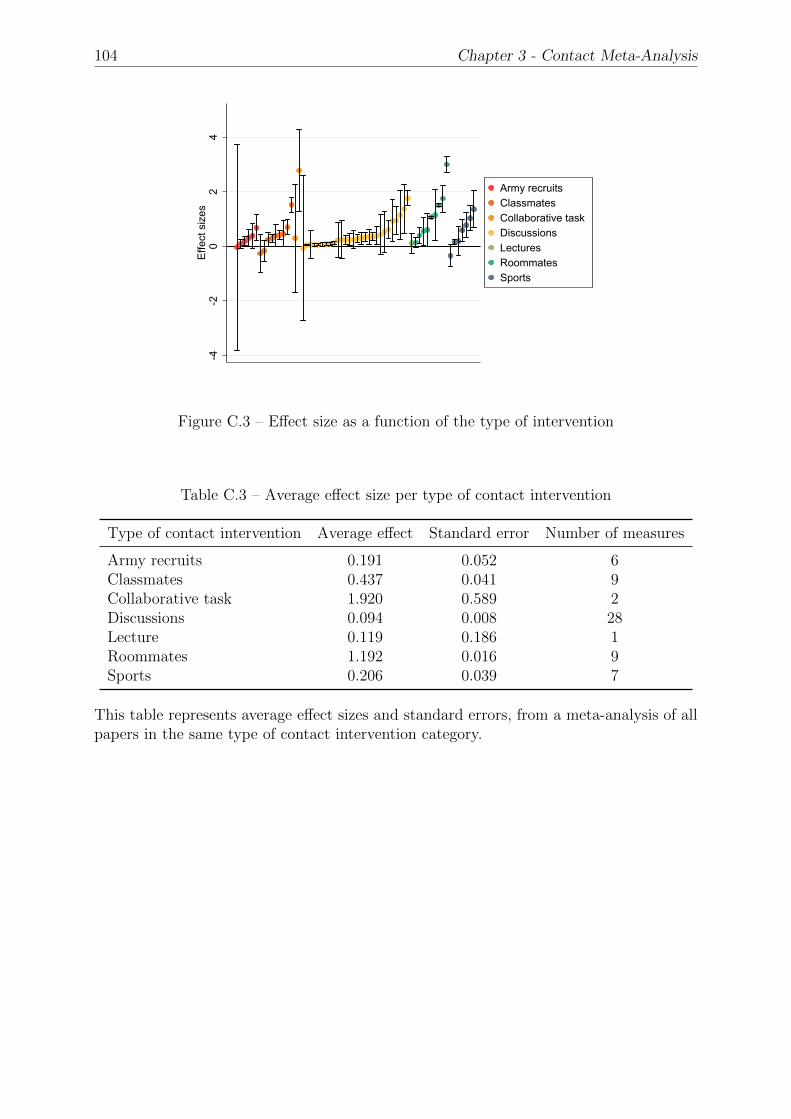
104 Chapter 3 - Contact Meta-Analysis
-4-2
02
4Ef
fect
siz
es
Army recruitsClassmatesCollaborative taskDiscussionsLecturesRoommatesSports
Figure C.3 – Effect size as a function of the type of intervention
Table C.3 – Average effect size per type of contact intervention
Type of contact intervention Average effect Standard error Number of measures
Army recruits 0.191 0.052 6Classmates 0.437 0.041 9Collaborative task 1.920 0.589 2Discussions 0.094 0.008 28Lecture 0.119 0.186 1Roommates 1.192 0.016 9Sports 0.206 0.039 7
This table represents average effect sizes and standard errors, from a meta-analysis of allpapers in the same type of contact intervention category.

Chapter 3 - Contact Meta-Analysis 105
-4-2
02
4Ef
fect
siz
es
BehaviorExplicit attitudesImplicit behavior
Figure C.4 – Effect size as a function of the type of outcome
Table C.4 – Average effect size per type of outcome
Type of outcome Average effect Standard error Number of measures
Behavior 1.129 0.015 21Explicit attitudes or beliefs 0.104 0.008 37Implicit behavior 0.365 0.052 4
This table represents average effect sizes and standard errors, from a meta-analysis of all papers in thesame type of outcome category.

106 Chapter 3 - Contact Meta-Analysis
-4-2
02
4Ef
fect
siz
es
012-1010+
Figure C.5 – Effect size as a function of the number of encounters
Table C.5 – Average effect size per number of encounters
Number of encounters Average effect Standard error Number of measures
0 0.054 0.012 21 0.121 0.012 162-10 0.238 0.034 1610+ 1.020 0.014 28
This table represents average effect sizes and standard errors, from a meta-analysis of allpapers in the same category of number of encounters.

Chapter 3 - Contact Meta-Analysis 107
-4-2
02
4Ef
fect
siz
es
12-3030+
Figure C.6 – Effect size as a function of the duration of the contact
Table C.6 – Average effect size per duration of the contact intervention
Duration of the contact (days) Average effect Standard error Number of measures
1 0.088 0.008 202-30 0.541 0.054 1230+ 0.930 0.013 30
This table represents average effect sizes and standard errors, from a meta-analysis of allpapers in the same category intervention duration.

108 Chapter 3 - Contact Meta-Analysis
-4-2
02
4Ef
fect
siz
es
11-3030+
Figure C.7 – Effect size as a function of the time between the end of the intervention andthe measure
Table C.7 – Average effect size per length between the intervention and measure
Length between end of Average effect Standard error Number of measuresintervention and measure(in days)
1 0.952 0.020 322-30 0.078 0.009 1930+ 0.719 0.015 11
This table represents average effect sizes and standard errors, from a meta-analysis of allpapers in the same category length of outcome.

Chapter 3 - Contact Meta-Analysis 109
-4-2
02
4Ef
fect
siz
es
Specific members metEntire outgroup
Figure C.8 – Effect size as a function of whether the outcome measures prejudice againstspecific individuals met or the entire outgroup
Table C.8 – Average effect size on whether the outcome measures prejudice agains specificindividuals met or the entire group
Measure Average effect Standard error Number of measures
Specific members met 1.048 0.015 8Entire outgroup 0.123 0.008 54
This table represents average effect sizes and standard errors, from a meta-analysis ofpapers by whether the measure was for the entire outgroup.

110 Chapter 3 - Contact Meta-Analysis

Chapter 4
More Effort or Better Technologies?
On the Effect of Relative
Performance Feedback
Note: This chapter is co-authored with Guillaume Hollard and Julia Wirtz.
Abstract
Relative performance feedback (RPF) allows agents to compare their performance to
that of others. Current theory assumes that RPF affects performance by changing the
optimal level of effort. We introduce a technology channel in which agents use RPF to
improve their technologies. We compare the effort and technology channels by combining
three elements: an extensive review, an original model and two field experiments. Under
the technology channel, we highlight that RPF increases performance even at the bottom
of the distribution and has a cumulative effect across periods. We draw implications for
education and social norms.
JEL Codes: D83, D84, D91
Keywords: Relative performance feedback, rankings, technology improve-
ment, Education, Social Norms1
1We thank Nagore Iriberri, George Loewenstein, Phil Reny, Pierre Boyer, Alfonso Montes Sanchez,Matias Nunez, Fabien Perez, Remi Avignon, Yannick Guyonvarch, Bertrand Garbinti, Benoit Schmutzand Omar Sene for useful comments and discussions. We are also grateful to participants at a seminarat AMSE in Marseille, the 2019 ESA Europe Meeting, the 2019 ASFEE conference, the 2019 ESA APMeeting, the 2019 International Workshop on Applied Economics of Education, the Contests: Theoryand Evidence 2019 conference, and the Bristol Workshop on Assessment and Feedback, as well as internalseminars. Data for one experiment were collected by Mahmoud Farrokhi-Kashani during the course ofhis PhD thesis. For more details, see Farrokhi (2012). This research is supported by a grant of the FrenchNational Research Agency (ANR), “Investissements d’Avenir” (LabEx Ecodec/ANR-11-LABX-0047).
111

112 Chapter 4 - On the Effect of Relative Performance Feedback
1. Introduction
Relative performance feedback (RPF henceforth) consists of information, such as rank-
ings, that enables individuals to compare their own performance to that of others. RPF
is ubiquitous in the economy: employers provide information on workers’ relative produc-
tivity, academics are able to compare themselves using publicly-available citation indices,
the TripAdvisor website publishes rankings of hotels, students are sometimes told their
rank as well as their grades, and so on. The effect of RPF on performance is, however,
still open to debate.
We are specifically interested in what agents can learn from RPF in order to take
optimal decisions. To date, the effect of RPF on performance has always been examined
with the assumption that the only choice variable affecting performance is effort. We
refer to this as the effort channel. The novel approach of this paper is to introduce the
possibility that RPF may also trigger a change in technology by helping to identify better
technologies. We refer to this as the technology channel.
Consider the example of a student competing in a selective University-entrance exam
which takes place over several rounds. On the one hand, RPF gives her information about
the payoff of her effort. If she learns that she is close to making the cut, she may work
harder; if she instead learns that she ranks poorly, she may scale back her effort. On
the other hand, RPF provides information about the quality of her (learning) technology.
If she ranks badly, she may realize that there exist better technologies and change the
way in which she prepares for the exams (e.g. studying in a group rather than alone),
which may produce substantially better performance. The introduction of a technology
channel in the analysis of the effect of RPF brings about a significant departure from
the predictions of the effort channel, which should be particularly notable in situations
in which technology likely has a large effect on performance. In what follows, we refer to
these situations, in which agents can change to a better technology (and have the time
necessary to do so), as having large room for improvement.
To assess the economic relevance of the technology channel, we combine three ele-
ments. First, we systematically re-evaluate existing evidence on the effect of RPF to es-
tablish whether the specific setting in each study has any scope for technological change,
considering the task and the timing of feedback. We find that controlling for room for
improvement allows us to make sense of otherwise conflicting evidence on the effect of
RPF on performance. For instance, all of the analyses involving a task with room for
improvement find a positive performance effect for low performers (while this effect is
mixed when there is no room for improvement). Second, we propose an original model
of technology improvement and contrast its predictions regarding the effect of RPF to
those from a standard model of effort choice under tournament incentives. Last, since few
experiments have been designed to compare the effect of RPF with and without room for

Chapter 4 - On the Effect of Relative Performance Feedback 113
improvement, we consider the results from two experiments : one in which the technology
channel is shut down, so as to leave effort as the only active channel for performance
improvement, and the other in which there is clear room for improvement. The first
experiment uses a task (counting numbers) in which little technological improvement is
expected. In contrast, the second experiment involves pupils who have to perform several
math tests. The experiment took place over several weeks so as to allow improvement
over time. Both experiments consist in comparing performance with and without RPF
under tournament incentives.
Our main finding is that the three elements (review, model and experiments) comple-
ment each other and underline two important differences between the effort and technology
channels. (1) The effect of RPF on low performers is strikingly different when there is
room for technological improvement (while there are only small differences for top or av-
erage performers): in general, low performers benefit from exposure to RPF when there
is room for improvement. On the contrary, the effect of RPF is expected to be zero or
negative when technological change is not an option. The effect of RPF thus depends cru-
cially on the availability of alternative technologies to carry out the task. (2) Repeated
exposure to RPF produces a cumulative effect over time when there is room for improve-
ment; In contrast, when effort is the only source of performance improvement the RPF
effect is expected to be constant over time. The effect of repeated exposure has rarely
been analyzed to date and, to the best of our knowledge, the present work is the first to
explain why the effect of repeated exposure may depend on the room for improvement.
While a complete analysis of the effect of repeated exposure to RPF is beyond the scope
of the present paper, we nonetheless emphasize the dynamic aspect of feedback as a blind
spot in the literature.
When should RPF be provided? Considering a technology channel, in addition to the
traditional effort channel, suggests that the answer to this question should depend on the
nature of the task to be performed (i.e. the possibility of technological improvement), an
element that is so far absent from analysis. A clear argument can be made for the use
of RPF in tasks with room for improvement. Our approach can explain the large per-
formance improvement of low-ability students that is often documented in the empirical
RPF literature. Rank feedback may indeed help students to improve their learning tech-
nology, and in particular those who initially rank poorly.1 It is noteworthy that providing
(private) RPF, for instance to students, entails a negligible cost.
The remainder of this paper is organized as follows. In Section 2. we review the
empirical evidence on the effect of RPF on performance and show that we are able to
organize this literature neatly by controlling for the room for improvement. Section 3. then
reviews the existing theoretical models of the effect of RPF on performance, and presents
1The results presented do not require that feedback be public. In particular, the feedback can be sentprivately so as to avoid the effect of public shaming.

114 Chapter 4 - On the Effect of Relative Performance Feedback
our own model of technological change. In Section 4. we present the two experiments
we carried out, which differ in their scope for technological innovation - i.e. the room for
improvement. Section 5. concludes.
2. A review of the effect of RPF through the lens of
the technology channel
In this section we review the empirical evidence on the performance effect of RPF. The
novelty of this review is to distinguish between tasks with little room for improvement and
those with greater scope for technological innovation. We show that the effort channel
to be dominant when there is little room for improvement, while the technology channel
becomes relevant when there is more room for improvement. We will present forest plots
separating high and low performers, and show that RPF has strikingly different effects
towards the bottom of the distribution.
2.1. Paper selection
We consider all references in the extensive and very-recent review of Villeval (2020)
on performance feedback. We select all of the contributions in this review that satisfy the
following three conditions:
(1) The experiment includes a control group that does not receive any
RPF. For instance, Genakos and Pagliero (2012) is not included as all subjects received
an interim ranking, so that there is no control group without ranking.2
(2) There is a clear measure of performance. For example, Wozniak et al. (2014);
Banerjee et al. (2018); Danz (2020) focus on the effect of RPF on competitiveness, rather
than performance per se. We also exclude Ertac (2011); Mobius et al. (2011); Ertac et al.
(2016); Zimmermann (2018), which focus on beliefs about performance. Jalava et al.
(2015) is also excluded, as they look at the effect on performance of making rankings
public and not the effect of receiving ranking information itself.
(3) The same incentive scheme is used in the control and treatment groups.
We only include papers comparing the effect of RPF while holding the incentive scheme
constant. Incentive schemes include tournaments, piece-rate, flat-rate, and so on. We ex-
clude for example Casas-Arce and Martınez-Jerez (2009), who provide flat-rate incentives
to the control group while the treatment group with RPF takes part in a tournament.
We are left with 42 papers after excluding those that do not satisfy all three criteria. As
some of these include multiple treatments, our final analysis is of 66 different treatments,
which are summarized in Tables A.1 to A.5.
2Other papers excluded for the same reason are Gill and Prowse (2012); Buser et al. (2018); Haenni(2019).

Chapter 4 - On the Effect of Relative Performance Feedback 115
2.2. Classification
(1) Incentive scheme. We sort the treatments according to the four incentive
schemes subjects may face: piece rate, flat-rate, tournament, and grades.3
(2) Room for improvement We separate the treatments into two categories: little
and large room for improvement. This depends both on the timing of feedback and the
nature of the task that subjects carry out. While there is some degree of subjectivity
in this classification, it is straightforward in most cases: it is unlikely that subjects can
quickly change their technology to improve their performance when feedback is given with
little or no time for adjustment. This is the case for subjects who see their competitors
while running (Fershtman and Gneezy, 2011) or the scores of other participants while
adding or multiplying numbers (Eriksson et al., 2009; Kuhnen and Tymula, 2012). On
the other hand, there is greater room for improvement in tasks that are new to subjects,
where there exist a number of potential technologies to complete the task, and when
subjects have sufficient time to revise their technology (Azmat and Iriberri, 2010; Blanes i
Vidal and Nossol, 2011; Tran and Zeckhauser, 2012).
We consider three outcome variables: the average effect, and the effect at the top and
the bottom of the performance distribution. To enable comparisons across studies, results
are normalized using Cohen’s d-statistic. “Top” and “Bottom” are roughly defined, as it
is not always possible to obtain information for the exact same sub-group (like, say, the
top and bottom quartiles). Despite our best efforts, the definition of ”top” and ”bottom”
does then vary across papers.
2.3. Results
We present three graphs that summarize the existing empirical evidence on the effect of
RPF. A first result is that for top performers the effect is positive in most treatments. As
can be seen in Figure 4.1, only two treatments find a significant negative effect with little
room for improvement and one with large room for improvement. The incentive scheme
does not appear to play a clear role. In contrast, room for improvement is associated with
a larger and more-frequently positive effect of RPF.
An even sharper difference can been seen when we consider the bottom of the distri-
bution in Figure 4.2. Intuition suggests that poor performers may be harmed by RPF,
becoming discouraged and dropping out when they realize that they are performing poorly.
This intuition may well hold when there is little room for improvement, and we see a sig-
nificant share of experiments in which the effect is negative. In sharp contrast, when
3We consider grades separately, as the associated incentives are ambiguous. Grades may be equivalentto piece-rate incentives (when the individual’s payoff increases proportionally to the grade), but may havea tournament aspect (when rank matters for future opportunities) or could work like a flat rate (whenthe student attaches little importance to them).

116 Chapter 4 - On the Effect of Relative Performance Feedback
Figure 4.1 – Forest plot of the effect of RPF at the top of the distribution
Note: Each square represents an effect size at the top of the performance distribution for eachof the treatments, and the bars the confidence intervals. The colors represent the incentiveschemes: flat (red), grades (green), piece-rate (blue) and tournament (black). There is littleroom for improvement in the treatments above the first dashed line, and large room for im-provement below. The treatments are ranked by effect size in each category (room vs. no roomfor improvement). The grade treatments appear separately below the second dashed line. Forvisibility, the effect sizes are truncated to lie within the [-1,1] range.

Chapter 4 - On the Effect of Relative Performance Feedback 117
there is more room for improvement, the effect is always positive. We suggest that sub-
jects benefit from RPF as they realize that there exist better technologies, which they can
use to improve their performance. Again, while room for improvement appears to play a
role, the incentive scheme does not have a clear and predictable effect.
Figure 4.2 – Forest plot of the effect of RPF at the bottom of the performance distribution
Note: Each triangle represents the effect sizes at the bottom of the performance distributionfor each of the treatments, and the bars the confidence intervals. The colors represent theincentive schemes: flat (red), grades (green), piece-rate (blue) and tournament (black). Thereis little room for improvement in the treatments above the first dashed line, and large room forimprovement below. The treatments are ranked by effect size in each category (room vs. noroom for improvement). The grade treatments appear separately below the second dashed line.For visibility, the effect sizes are truncated to lie within the [-1,1] range.
We now consider the average effect of RPF on performance.4 We observe, as in the
previous figures, that the incentive scheme does not have a univocal performance effect.
We also confirm that the RPF performance effect can be negative. The effect is more
4The overall distribution of performance is not simply the sum of the top and bottom effects in theprevious figures, as we now include performance close to the median.

118 Chapter 4 - On the Effect of Relative Performance Feedback
often positive when there is more as opposed to less room for improvement, although this
gap is less marked for the average than for the top or bottom of the distribution.
Figure 4.3 – Forest plot of the average RPF effect
Note: Each circle represents the average RPF effect size, and the bars the confidence intervals.The colors represent the incentive schemes: flat (red), grades (green), piece-rate (blue) andtournament (black). There is little room for improvement in the treatments above the firstdashed line, and large room for improvement below. The treatments are ranked by effect sizein each category (room vs. no room for improvement). The grade treatments appear separatelybelow the second dashed line. For visibility, the effect sizes are truncated to lie within the [-1,1]range.
Unfortunately, the existing evidence on the effect of RPF over a number of periods is
too scarce to provide a clean picture. We contribute to the discussion about the cumulative
effect of RPF, with or without room for improvement, in the Sections below.

Chapter 4 - On the Effect of Relative Performance Feedback 119
3. Theory: The effect of RPF on performance.
This section provides a theoretical analysis of the effect of RPF on performance. After
briefly reviewing the literature, we present a theoretical model of the effect of RPF on per-
formance. In our setting, RPF improves the agent’s information about their performance
in the presence of aggregate uncertainty.
In subsection 3.2. we consider the effect of RPF when the only choice variable is
effort. In subsection 3.3. we contrast this with the case when there is room for improve-
ment through technological innovation. This is a novel contribution, and introduces the
possibility of RPF allowing agents to identify better technologies. The two models can be
understood as polar cases. The effort model, at one extreme, assumes that all agents have
the same technology and only decide on the effort to exert; the technology model, at the
other extreme, assumes that all agents exert the same effort but choose which technologies
to use.
There are two major differences between the effort and technology approaches. The
first regards the influence of performance from one period to the next. Under the effort
channel, performance in one period does depend on the level of effort in previous periods.5
By way of contrast, technological change is persistent. The second difference relates to
the cost: we assume that effort is costly but that technological change is costless.
3.1. Related theoretical literature
There is a small theoretical literature on the effect of RPF on performance in two-player
tournament settings: Ederer (2010); Aoyagi (2010); Goltsman and Mukherjee (2011); Ger-
shkov and Perry (2009). These contributions consider how RPF information affects effort
incentives, and do not predict that this is unambiguously positive: if subjects increase their
effort for some feedback values, they necessarily must reduce it for other values, in line
with the law of total expectation. Feedback will discourage effort when the agent learns
that this effort is unlikely to improve their chance of winning. For individual incentives,
Fuchs (2007) analyzes a principal-agent setting where the principal privately observes out-
put and may have an incentive to give dishonest feedback to reduce the agent’s pay. When
agents have the option to choose and discard technologies, the riskiness of their output
changes. This connects our work to the literature on risk-taking in contests (Hvide, 2002;
Anderson and Cabral, 2007; Seel and Strack, 2013), who point out that agents who lag
behind in a contest tend to benefit from increased risk-taking.
The idea that agents learn over time about the quality of the technology they use,
and may learn from the performance of others appears in the strategic-experimentation
literature. The closest paper to ours is Halac et al. (2017), who consider the optimal
5However, the outcome of previous periods may affect the nature of the incentives in subsequentperiods, and thus moderating the optimal effort (see below).

120 Chapter 4 - On the Effect of Relative Performance Feedback
feedback and prize structure in an innovation contest. As in our model, feedback allows
agents to learn about the quality of the technology they use, and their chance of winning
the contest. However, there is only one technology which all agents use and about which
they become increasingly pessimistic. The agent only has the choice of how much and for
how long to invest in the technology, but cannot switch to a different one. The possibility
of RPF allowing agents to improve the technology they use has rarely been analyzed .
One exception is Wirtz (2016), who focuses on the strategic interaction of two agents.
The technology model in section 3.3. applies this idea to a linear incentives and a stylized
tournament with many participants.
For simplicity, we consider a stylized model with a continuum of agents. This has
two effects: Fist, rank feedback allows the agents to infer their individual performance
precisely. Second, tournament incentives are reduced to a non-strategic setting, where an
individual agent knows precisely the performance necessary to obtain a reward. While
it significantly simplifies the analysis, the results would not change qualitatively if this
assumption was relaxed. Moreover, our analysis is more applicable to real world settings
in education where there are typically many competitors than a two-person setting which
is often studied in the theoretical literature.
3.2. Effort choice
In this section we consider a model where agents choose effort to maximize their payoff.
There is a continuum of identical agents.6 Each agent is assigned to one of two groups:
the control or treatment (RPF) group. In each period t = 1, . . . , T , an agent produces
output
xt = et + bt + εt.
where et denotes effort, which is provided at cost c(et) =e2t2
. bt denotes a common shock,
which affects all agents in a group in the same way, and is independently and identically
distributed (iid) across periods, according to the cumulative density function (CDF) Fb(·)and the density fb(·). εt denotes an individual error term, which is iid across agents and
periods, with CDF Fε(·) and density fε(·). Both densities are unimodal at 0 and twice
continuously-differentiable. We denote the sequence of common shocks and individual
errors up to period t as bt ≡ b1, . . . , bt and εt ≡ ε1, . . . , εt.
The agent’s payment g(x) depends on her aggregate output x ≡∑T
t=1 xt. We assume
6In our model, we abstract away from differences in ability between agents. Ederer (2010) finds that,when ability is unknown and affects the productivity of effort, relative performance feedback increaseseffort for the leader and decreases effort for the follower. This aligns with empirical (non experimental)evidence for a positive effect of rank information at the top of the distribution and a negative or no effectat the bottom (Goulas and Megalokonomou, 2021; Elsner et al., 2021; Murphy and Weinhardt, 2020). Incontrast, if ability is known or does not affect the efficacy of effort there should be no effect of relativeperformance feedback on effort provision.

Chapter 4 - On the Effect of Relative Performance Feedback 121
g′(·) ≥ 0 and E[g′′(·)] < 1.7 In each period, the agent chooses effort to maximize her
expected payoff, which is given by the expected payment minus the cost of effort:
U = E
[g(x)−
T∑t=1
c(et)
]
After each period, the agent receives feedback about her performance. Both the RPF
and the control group learn their individual performance xt after each period. At the
beginning of period t the agent thus knows her performance in all previous periods, sum-
marized as xt−1 ≡ x1, . . . , xt−1. If the agent is in the RPF group, she additionally learns
her rank rt for each period, where the highest rank is 1 and the lowest rank 0. We assume
that there is no information spillover between groups. The information the agent derives
from all past rankings at the beginning of period t is denoted by rt−1 ≡ r1, . . . , rt−1.
Average effects
Lemma 4.1. The agent can infer the values of bt and εt from her rank rt.
Proof of Lemma 4.1. In period 1, all agents exert the same effort, since they have no
prior information. In addition, the common shock b1 affects all agents in the same way.
Differences in performance are then entirely due to the respective draws of the individual
error term ε1. The agent’s rank is given by: r1 = Fε(ε1). The agent can thus derive
ε1 = F−1ε (r1) and b1 = x1 − e1 − ε1. For subsequent periods, let output net of the
aggregate shock in period t be given by: yt ≡ xt − bt = et + εt. All agents exert optimum
effort, given the information they have received. The agent can therefore predict the
equilibrium distribution of yt for all agents across the continuum: Fyt . Rank is given by:
rt = Fyt(et + εt). We have εt = F−1yt (rt)− et and bt = xt − et − εt.
Proposition 4.1. When the choice variable is effort, there is no effect of RPF on expected
average performance.
Proof of Proposition 4.1. We define total output net of effort in period t as x−t ≡ x− et.The optimal effort in period t then satisfies:
e∗t = E [g′(x−t + e∗t )] .
A control-group agent knows her previous performances xt−1. Her optimal effort in period
t is thus:
eCt = E[g′(x−t + eCt )
∣∣∣xt−1].
7The first assumption excludes that payment falls in output; the second ensures that the first-ordercondition identifies the maximum.

122 Chapter 4 - On the Effect of Relative Performance Feedback
A RPF-group agent additionally knows her previous rankings rt−1. Her optimal effort in
period t is then:
eRt = E[g′(x−t + eRt )
∣∣∣xt−1, rt−1].
According to the law of total expectation, we have
E[eCt]
= E[E[g′(x−t + et)
∣∣∣xt−1]]
= E [g′(x−t + et)]
= E[E[g′(x−t + et)
∣∣∣xt−1, rt−1]]
= E[eRt].
Average effort in the RPF and treatment groups is then identical in expectation.8
Preferences for rank. While theory predicts no effect of RPF on expected average
performance if agents care only about their payment, a number of contributions find
evidence of this effect. Some papers have addressed this by introducing an ad hoc term
into the payoff function, to reflect a taste for rank. The idea is that, when agents receive
RPF, they start caring about rank per se in addition to the payment.9 The expected
payoff function takes the following form:
E
[g(x) + 1RPF
T∑1
h(rt)−T∑1
c(et),
](4.1)
where the taste for rank in period t is denoted by h(rt) and only enters the payoff function
once RPF is received. We assume that the payoff weakly increases in rank (h′(·) ≥ 0),10
and that rank weakly increases in effort (r′t(et) ≥ 0).
Lemma 4.2. With a taste for rank there is a positive effect of RPF on average perfor-
mance in expectation.
Proof of Lemma 4.2. With a taste for rank, the optimal effort eRt of an RPF-group agent
in period t is:
eRt = E[g′(x−t + eRt ) + h′(rt)r
′t(e
Rt )∣∣∣xt−1, rt−1
].
As the additional term is positive, the optimal effort of an RPF-group agent rises with
the taste for rank:
eRt = E[g′(x−t + eRt ) + h′(rt)r
′t(e
Rt )∣∣∣xt−1, rt−1
]≥ E
[g′(x−t + eRt )
∣∣∣xt−1, rt−1]
= eRt .
8This holds as long as c′′′(·) = 0. For c′′′(·) > 0 (< 0), the average effort in the RPF group is lower(higher) in expectation. This is analogous to Proposition 1 in Ederer (2010).
9In an alternative specification, the agent also cares about rank when she does not receive RPF, butthe payoff increases in the precision of the information. The results are qualitatively identical.
10Recall that rt ∈ [0, 1], where 1 is the highest rank.

Chapter 4 - On the Effect of Relative Performance Feedback 123
Meanwhile, the optimal effort of a control-group agent eCt is unchanged by a taste for
rank, as she does not receive information about her rank: eCt = eCt . We thus have
E[eCt∣∣xt−1
]= E
[eCt∣∣xt−1
]= eRt ≤ eRt ,
which proves the result. Taste for rank increases the marginal return of effort for the RPF
group relative to the control group.
Distribution effects
While RPF is predicted to have no effect on average performance without the taste
for rank, we are interested in the effect of RPF along the performance distribution. The
prediction here will depend on the shape of the payment function g(·). We consider
examples of individual and tournament incentives, as these are the most common incentive
schemes in the empirical literature. We first consider individual incentives in the form of
a linear payment scheme, where g(x) ≡ ax, with a > 0.
Proposition 4.2. With a linear payment scheme, RPF has no effect on expected future
performance anywhere in the distribution.
Proof. In this case, the optimal effort is et = a, independent of feedback and everywhere
on the performance distribution.
Second, we consider a stylized model of tournament incentives with T = 2 periods. We
denote the aggregate output net of the aggregate shock by: y ≡∑T
t=1 yt ≡∑T
t=1 xt − bt.The agent receives a prize of 1 if this value exceeds a threshold of s, with the payoff of
losing being normalized to zero. With a continuum of agents, this is equivalent to some
share s of agents with the highest total output winning the prize.11 We assume that the
threshold s is restrictive, i.e. it is high enough that the share s of agents that attain it is
under 12. The expected payoff function then takes the following form:
U = E [P(y > s)− c(e1)− c(e2)] = E[1− Fε(s− e1 − e2 − ε1)− 1
2
(e2
1 + e22
)],
where P(y > s) denotes the probability that the agent’s output reach the threshold.
Optimal effort in period t is
e∗t = E [fε(s− ε1 − e−t − e∗t )] ,11As the aggregate shock bt affects all agents, it is irrelevant for the outcome of the tournament. All
agents exert optimum effort, given the information they have received. The agent can therefore predictthe equilibrium distribution of output net of the aggregate shock yt for all agents across the continuum:Fyt . If the share s of agents with the highest total output wins the prize, the agent can derive thethreshold s she has to attain to win from: 1− Fy(s) = s.

124 Chapter 4 - On the Effect of Relative Performance Feedback
where e−t denotes the effort level in the other period. As shown in Lemma 4.1, a RPF
group agent can derive ε1 after receiving feedback on r1. Her optimal effort in period 2 is
thus:
eR2 (ε1) = fε(s− e1 − eR2 (ε1)− ε1).
Meanwhile, her optimal effort in period 1 is:
eR1 = E[fε(s− eR1 − eR2 (ε1)− ε1
)].
We therefore have eR1 = E[eR2]: A RPF-group agent’s first-period effort is equal to her
expected second-period effort. First-period effort is the same for all RPF-group agents,
as everyone has the same information at the start of period one.
A control-group agent only learns her output x1 after period 1. Her optimal effort in
period 2 is thus:
eC2 = E[fε(s− e1 − eC2 − ε1
) ∣∣∣x1
].
Meanwhile, her optimal effort in period 1 is:
eC1 = E[fε(s− eC1 − eC2 (ε1)− ε1
)].
We thus have eC1 = E[eC2]: A control-group agent’s first-period effort is equal to her ex-
pected second-period effort, and first-period effort is identical for all control-group agents.
In addition, first-period effort is equal for the control and RPF groups and second-period
effort is equal in expectation, as we have:
eC1 = E[E[fε (s− e1 − e2 − ε1)
∣∣∣x1
]]= E [fε (s− e1 − e2 − ε1)]
= E[E[fε (s− e1 − e2 − ε1)
∣∣∣x1, r1
]]= eR1 .
This confirms that expected average effort is equal for both groups with tournament
incentives, as stated generally in Proposition 4.1.
Proposition 4.3. For tournament incentives, RPF has a positive effect on expected future
performance at the top of the distribution and a negative effect at the bottom.
Proof. As all agents exert the same level of effort in period 1, the first-period error term
ε1 drives the differences in first-period performance and, consequently, in second-period
effort. We first consider second-period effort in the RPF group. As the mode of fε is at
0, maximal second-period effort is exerted when ε1 satisfies s− e1 − e2 − ε1 = 0. As ε2 is
distributed symmetrically around 0, this agent has a winning probability of 12. This would
be the case for the agent whose first-period error term is 1 − Fε(ε1) = s. Given that we
assume that the tournament is restrictive, i.e. s < 12, the highest effort is exerted by an
agent on the top half of the distribution. Second-period effort is monotonically decreasing

Chapter 4 - On the Effect of Relative Performance Feedback 125
both up and down the distribution starting from s. In the control group, maximal effort
is necessarily lower, as E[fε (s− e1 − e2 − ε1)
∣∣∣x1)]< fε (0) for all x1. Since expected
effort is equal for both groups, it is necessarily the case that, for ε1 low enough, expected
effort is higher for the control group. Thus, the expected treatment effect is positive at
the top and negative at the bottom of the distribution.
3.3. Technology choice
This section introduces a model in which RPF affects performance through the im-
proved identification of good technologies. Instead of choosing effort, agents have to make
decisions about the technologies they use. Technologies are ways of working that could
either improve or worsen performance. In the context of education, examples could be
taking notes on a computer, studying with classmates, drinking coffee, or studying late
the night before the exam. The impact of these technologies could be positive or nega-
tive, and is ex ante uncertain. As in Section 3.2., there is a continuum of identical agents
who carry out the same task over T periods. Agents draw technologies θ from a normal
distribution with mean zero and variance 1, with CDF Fθ(·) and density fθ(·). The tech-
nology drawn in period t is denoted by θt. Technologies are iid across agents and periods.
Output in period t is affected by a common shock Bt, which affects all agents in the same
way. This takes the form of a random walk with increments bt, which are iid according
to a normal distribution with mean zero and variance σ2, with CDF Fb(·) and density
fb(·).12 The agent makes two decisions in each period: dt ∈ {0, 1} and kt ∈ {0, 1}. At
the start of period t ∈ [1, T ], she decides whether to draw a new technology θt (dt = 1)
or not (dt = 0). At the end of the period t ∈ [1, (T − 1)], she decides whether to keep
the technology she just tried out for future periods (kt = 1) or to drop it (kt = 0).13 We
assume that this decision is final, and that the agent keeps the technology when she is
indifferent. Output in period t is determined by the technologies currently in use:
xt =t−1∑r=1
(θr · 1(kr=1)
)+ θt · 1(dt=1) +Bt.
Aggregate output is given by the sum of per-period outputs:
x =T∑t=1
xt =T∑t=1
θt[1(dt=1) + 1(kt=1)(T − t) +Bt
]12Modelling the common shock as a random walk is convenient, as the agent only updates her beliefs
about the value of the technology once, after the realization of xt. In the subsequent periods this beliefwill remain constant as long as the agent keeps the technology.
13For coherence, it must be the case that if (dt = 0) then (kt = 0). If the agent did not draw a newtechnology in period t, it cannot be used in future periods.

126 Chapter 4 - On the Effect of Relative Performance Feedback
In each period, the agent chooses kt and dt to maximize expected payoff, given by U =
E [g(x)] . As in Section 3.2., agents in the control group only learn their own output xt at
the end of period t, while RPF-group agents additionally learn their rank rt.
Lemma 4.3. The agent can infer the values of Bt and θt from her rank rt.
Proof of Lemma 4.3. In period 1, the common shock B1 affects all agents in the same
way. Differences in performance are therefore entirely due to the individual technology
draws θ1. The agent’s rank is then given by: r1 = Fx1(x1) = Fθ(θ1). The agent can
thus derive θ1 = F−1θ (r1) and B1 = x1 − θ1. In subsequent periods, let output net of the
aggregate shock in period t be given by:
yt ≡ xt −Bt =t−1∑
1
(θr · 1(kr=1)
)+ θt · 1(dt=1).
All agents drop technologies below a certain threshold θt. The agent can therefore predict
the equilibrium distribution of yt for all agents across the continuum: Fyt . Rank is given
by:
rt = Fyt
(t−1∑
1
(θr · 1(kr=1)
)+ θt · 1(dt=1)
).
The agent can thus derive
θt = F−1xt (rt)−
t−1∑1
(θr · 1(kr=1)
)and Bt = xt −
t−1∑1
(θr · 1(kr=1)
)− θt · 1(dt=1).
Lemma 4.4. For agents in the control group, the updated belief of the value of the technol-
ogy after observing output θt|xt is distributed normally with meanxt−x(t−1)
1+σ2 and varianceσ2
1+σ2 , where we define x0 = 0.
Proof. We denote ∆xt ≡ xt − x(t−1). According to Bayes Rule, we have:
fθ|∆xt(θt) =f∆x|θt(∆xt) · fθ(θt)
f∆x(∆xt)=fb(∆xt − θt) · fθ(θt)
f∆x(∆xt)
=
e− (∆x−θt)
2
2σ2√
2πσ2· e
−θ2t2√
2π
e− (∆x)2
2(1+σ2)√2π(1+σ2)
=e−
(θ− ∆xt1+σ2 )2
σ2
1+σ2√2π σ2
1+σ2
.
The updated distribution of the technology θt, given output xt, has the CDF Fθt|xt(·)and density fθt|xt(·). We next analyze the agent’s optimal technology decisions for the
cases of individual and tournament incentives.

Chapter 4 - On the Effect of Relative Performance Feedback 127
Individual incentives
We first consider individual incentives in the form of a linear payment scheme, where
g(x) ≡ ax, with a > 0.
Lemma 4.5. For agents in the RPF group, we have kt = 1 iff θt ≥ 0 and dt = 1 always.
Proof. As shown in Lemma 4.3, agents who receive RPF can deduce the value of θt.
Keeping a technology increases the expected payoff by aθt(T − t). The agent therefore
keeps any technology with a positive value (θt ≥ 0) and discards any technology with a
negative value. Taking a new draw in period t has no effect on the expected payoff in this
period, as E(θt) = 0. However, since the agent only keeps technologies with a positive
value, the effect on the expected aggregate payoff is positive:
a(T − t)E(θt|θt > 0) = a(T − t)√
2
π> 0.
The agent therefore always takes a new draw.
Lemma 4.6. For agents in the control group, we have kt = 1 iff xt ≥ x(t−1) and dt = 1
always.
Proof. Agents in the control group use the updated belief about technology θt given output
xt to make decisions. Keeping a technology increases increase expected payoff by
a(T − t)E(θt|xt) = a(T − t)xt − x(t−1)
1 + σ2.
The agent therefore keeps any technology with a positive expected value, which is the case
when the output increases over the previous period: xt ≥ x(t−1). Similarly to RPF-group
agents, control-group agents always draw new technologies. Taking a new draw in period
t has no effect on expected output in this period, as E(θt) = 0. However, since the agent
only keeps technologies with a positive expected value, the effect on aggregate output,
and thus the payoff, is positive:
a(T − t)E(θt|xt > x(t−1)) =
√2σ2
π(1 + σ2)> 0.
The agent therefore always takes a new draw.
Proposition 4.4. When the agent can explore new technologies and faces linear incen-
tives, there is a positive effect of RPF on expected performance. The treatment effect is
positive everywhere along the distribution of prior performance, and is symmetric around
the mean.

128 Chapter 4 - On the Effect of Relative Performance Feedback
Proof. Since both the RPF and the Control group draw a new technology in every period,
this decision should not affect the treatment effect. Due to the imprecise information
about the value of θt, some control-group agents will, however, take sub-optimal decisions
about keeping or dropping their technology when bt 6= 0. Consider first the case θt > 0.
For values of the common shock such that (θt + bt < 0), the agent’s output declines
(xt < x(t−1)) even though the technology has a positive value. Therefore, control-group
agents will not keep the technology (kt = 0) when the the common shock is low enough.
The expected output is reduced by θt relative to RPF-group agents in all (T − t) future
rounds. The probability of treatment is P (θt + bt < 0). The expected average treatment
effect over all future periods, given a technology θt > 0, is therefore therefore positive and
given by:
E (TE|θt > 0) = (T − t)θt · P (θt + bt < 0) = (T − t)θt · Fb (−θt) > 0.
Second, consider the case θt < 0. For values of the common shock such that (θt + bt > 0),
the agent’s output increases (xt > x(t−1)) even though the technology has a negative value.
Therefore, control-group agents will keep the technology (kt = 1) when the the common
shock is high enough. The expected output is reduced by −θt relative to RPF-group
agents in all (T − t) future rounds. The probability of treatment is P (θt + bt > 0). The
expected average treatment effect over all future periods, given a technology θt > 0, is
therefore therefore positive and given by:
E (TE|θt < 0) = (T − t)(−θt) · P (θt + bt > 0) = (T − t)(−θt) [1− Fb (−θt)]
= (T − t)|θt|Fb (θt) > 0.
In both cases, the average performance of control-group agents falls relative to the treat-
ment group. The expected treatment effect is equal for an agent with technology above
the median (θt > 0) and the corresponding agent with a technology which is equidistant
below the median θ′t = −θt < 0. The expected treatment effect must therefore be equal at
the top and the bottom of the distribution of prior performance. In summary, the treated
segment is θt ∈ (min{−bt, 0},max{−bt, 0}) and, if treated, the treatment effect for a given
technology θt is its absolute value. The only case when all agents agent make the optimal
decision k is when bt = 0. The expected treatment effect over the whole distribution of θt
is positive and given by:
E(TE) =T∑t=1
(T − t)∫ ∞−∞|θt|Fb (θt) dθ =
σ2
8T (T − 1) > 0.
Over time, the possibility of trying new technologies leads to an increase in expected
performance for both groups. However, the increase is greater for the RPF group since

Chapter 4 - On the Effect of Relative Performance Feedback 129
they are better able to distinguish productive from unproductive technologies than the
control group. Consequently, they only keep productive technologies, whose positive effect
persists for all future periods.
Tournament incentives
Second, we consider the stylized tournament incentives introduced in Section 3.2.. For
simplicity, we analyze the case of T = 2 periods. Aggregate output net of the aggregate
shock is given by:
y =2∑t=1
xt −Bt = θ1(1 + 1(k=1)) + 1(d=1)θ2.
The agent receives a prize of 1 if this value exceeds a threshold of s > 0, with the payoff
of losing being normalized to zero. The expected payoff function takes the following form:
U = P [y ≥ s] = 1− Φ
(s− E[y]√V ar[y]
).
Lemma 4.7. For agents in the RPF group, we have k = 1 iff θ1 ≥ 0 and d = 1 iff θ1 <s2.
Proof. As shown in Lemma 4.3, agents who receive RPF after period 1 can infer the value
of θ1. If the technology has a positive value (θ1 ≥ 0), keeping it clearly increases the
probability that total net output y will exceed the threshold s. Therefore, the agent keeps
any technology with a positive value and discards technologies with negative value.
Next, we consider the decision whether to take a new draw in period 2. When 2θ1 ≥ s,
the probability of reaching the threshold is 1 if the agent does not draw a new technol-
ogy. However, the probability drops to 1 − Fθ(s − 2θ1) if the agent takes another draw.
Therefore, the agent never takes a new draw when θ1 ≥ s2. When 2θ1 < s, the probability
of reaching the threshold is 0 if the agent does not draw a new technology. However, the
probability rises to Fθ(s− θ1
(1 + 1(k=1)
))if the agent takes another draw. Therefore,
the agent takes a new draw in period t when θ1 <s2.
We define x ≡ − s3
(σ2 +
√(1 + 2σ2) (1 + 5σ2)− 1
)and x ≡ s
2(1 + σ2).
Lemma 4.8. For agents in the control group, the optimal technology choices arek = 1, d = 0 for xt ≥ x
k = 1, d = 1 for x > xt ≥ x
k = 0, d = 1 for xt < x.
Proof. The probabilities that the agent attain the threshold given her first-period output

130 Chapter 4 - On the Effect of Relative Performance Feedback
x1 for all possible combinations of her decisions k and d are given by:
P (y > s|x1, k = 1, d = 0) = 1− Φ
s− 2x1
1+σ2√4 σ2
1+σ2
P (y > s|x1, k = 1, d = 1) = 1− Φ
s− 2x1
1+σ2√4 σ2
1+σ2 + 1
P (y > s|x1, k = 0, d = 1) = 1− Φ
s− x1
1+σ2√σ2
1+σ2 + 1
P (y > s|x1, k = 0, d = 0) = 1− Φ
s− x1
1+σ2√σ2
1+σ2
The maximum probability of reaching the threshold depending on first-period output x1
is: P (y > s|x1, k = 0, d = 1) for x1 < x
P (y > s|x1, k = 1, d = 1) for x ≤ x1 < x
P (y > s|x1, k = 1, d = 0) for x ≤ x1.
Note that x < 0: The threshold for keeping a technology is below zero. This means
that the agent will keep technologies with an expected value slightly below zero. The
reason is that the agent has a bias for more-variable output in the tournament setting.
She does not care about her expected output, but only about the probability of crossing a
high threshold. This probability increases when the output has a higher variance, which
is achieved by keeping the technology. The agent is willing to trade off a slight decrease
in expected output for a higher variance.
Proposition 4.5. When the agent can explore new technologies and faces tournament
incentives, there is a positive effect of RPF on expected performance. The treatment effect
is positive everywhere along the distribution of prior performance and larger at the bottom.
Proof. Due to imprecise information about the value of θ1, some control-group agents will
take sub-optimal decisions about keeping or dropping their first-period technology when
bt 6= x1. First, consider the case θ1 > 0. These agents performed above the median in
period 1. For values of the common shock such that (θ1 + b1 < x), the agent’s output is
below the threshold (x1 < x), even though, unbeknownst to the agent, the technology θ1
has a positive value. Therefore, control-group agents will not keep the technology (k = 0)
when the common shock is low enough. The expected output in all future rounds is
reduced by the value of θ1 relative to RPF-group agents. The probability of treatment is

Chapter 4 - On the Effect of Relative Performance Feedback 131
P (θ1 + b1 < x). Thus, the expected treatment effect for a technology θ1 > 0 is:
E(TE+
)= θ1 · P (θ1 + b1 < x) = θ1 · Fb (x− θ1) > 0.
Second, consider the case θ1 < 0. These agents performed below the median in period
1. For values of the common shock such that (θ1 + b1 ≥ x), the agent’s output is above
the threshold (x1 ≥ x), even though the technology θ1 has a negative value. Therefore,
control-group agents will keep the technology (k = 1) when the common shock is high
enough. The expected output in all future rounds is reduced by the value of −θ1 relative
to RPF-group agents. The probability of treatment is P (θ1 + b1 ≥ x). The expected
treatment effect, for a technology θ1 < 0 is thus:
E(TE−
)= (−θ1) · P (θ1 + b1 ≥ x) = (−θ1) [1− Fb (x− θ1)] > 0.
The expected performance of control-group agents is reduced relative to the treatment
group, both for agents who performed above the median in period 1 (θ1 > 0) and those
who performed below (θ1 < 0). Moreover, provided an agent is treated, the size of the
treatment effect is equal for agents with technology above the median (θ1 > 0) and agents
with a technology that is equidistant below the median θ′1 = −θ1. However, the probability
that the respective agents are treated is different. Since fb is symmetric around zero and
x ≤ 0, it is less likely that the agent above the median is treated.
P (θ′1 + b1 < x) = Fb (x− θ1) = 1− Fb (−x+ θ1)
≤ 1− Fb (x− θ′1) = P (θ′1 + b1 ≥ x)
It is more likely that a control-group agent keeps a technology with a negative value
(θ1 < 0) than that she discards a technology with a positive value (θ1 > 0). Therefore,
the expected treatment effect is larger at the bottom of the distribution.
In summary, the treated segment is θ1 ∈ (min{x−b1, 0},max{x−b1, 0}) and, if treated,
the treatment effect for a given technology θ1 is its absolute value. The only case when
all agents agent make the optimal decision k is when b1 = x. The expected treatment
effect is positive at the top and the bottom of the distribution of first-period performance
(θ1 > 0 and θ1 < 0). Thus, the expected treatment effect over the whole distribution is
also positive, and is given by:
E(TE) =
∫ 0
−∞(−θ1) [1− Fb (x− θ1)] dθ +
∫ ∞0
θ1 · Fb (x− θ1) dθ > 0.
The decision whether to draw a new technology in period 2 does not affect expected total
output in the two-period scenario, as the expected value of the new technology is zero.

132 Chapter 4 - On the Effect of Relative Performance Feedback
3.4. Comparison
In summary, our model predicts that when agents choose effort there is no effect of
relative performance feedback on expected average performance (Proposition 4.1), unless
an ad hoc preference for rank is introduced (Lemma 4.2). If agents face linear individual
incentives, no effect is expected anywhere on the distribution (Proposition 4.2). If agents
face tournament-style incentives, a positive effect of RPF is expected at the top of the
distribution, while that at the bottom of the distribution is expected to be negative
(Proposition 4.3).
Meanwhile, when agents can explore new technologies, RPF helps to distinguish good
and bad technologies and there is a positive treatment effect everywhere on the distribution
(Propositions 4.4 and 4.5). When agents face tournament-style incentives, the effect is
expected to be larger at the bottom of the distribution (Proposition 4.5). We can also
conclude that the specific incentive scheme makes little difference for the RPF effect on
average performance, in particular when there is little room for improvement.
Finally, the effort and technology channel differ in the influence of RPF on performance
over time. Under the effort channel, exerting effort in one period does not carry over to the
subsequent period. By contrast, technological change is persistent. For linear incentives,
we show that there is a cumulative treatment effect. RPF group agents are better able to
correctly identify a productive or unproductive technology, and the effect carries over to
all future periods.
4. Empirics
We now describe two field experiments in which the tasks to be performed differ
according to the possibility of improving performance by changing technology, i.e. in
terms of room for improvement. In the first experiment the task consists in counting 1’s
in a matrix over a short time period. In line with the theoretical predictions for the effort
channel, we find no particular effect of RPF, except perhaps at the top of the distribution.
In the second experiment the task consists in maths tests at one-week intervals. In sharp
contrast to the first experiment, this task leaves ample room for improving technology.
We find that RPF speeds up learning, and there is performance improvement all along the
distribution. As will be explained in more details, the two experiments provide similar
incentives and mainly differ in the nature of the task. However, we note that subject pools
differ (Students vs Turkers) between the two experiments. There is however no reason to
believe that differences between treatments would be qualitatively affected.

Chapter 4 - On the Effect of Relative Performance Feedback 133
4.1. Experiment 1: No room for improvement
Experimental design
The experiment was run on Amazon Mechanical Turk (AMT). The task consisted in
counting the number of 1’s in grids containing only 0’s and 1’s. Each grid had 6 rows
and 6 columns as in Figure 4.4. The experiment consisted of four rounds. In each round,
subjects had 180 seconds to count as many grids as they can. Remaining time is displayed
on the screen.
All participants received a flat payment of $2 and could receive an additional bonus
payment of $8, depending on their performance. Each correct answer is rewarded with
1 point, each incorrect answer costs 1/2 a point. The first round is an unincentivized
trial. If the total points from Rounds 2 to 4 is above a certain threshold, the participant
received the bonus payment. The threshold was set according to the score at the 5th
percentile of a previous trial group.14
Figure 4.4 – Screenshot of a typical grid used
All subjects received feedback about their performance between rounds. In the control
group, subjects were only told their individual score; in the treatment group, subjects were
told both their individual score and their rank in comparison to the trial group. A total
of 204 subjects participated in the experiment on AMT in March 2020, with 96 subjects
in the treatment and 108 in the control group. On average subjects received $2.3 for an
experiment that lasted no more than 20 minutes (which is relatively high compared to
standard earnings on AMT, Hara et al. (2018)).
Results
The distribution of scores by round is shown in Figure 4.5. In line with our expecta-
tions, RPF appears to have no significant effect on performance and the treatment effect
does not vary over time.
The evolution of average performance in the treatment and control groups over rounds
is shown in Figure 4.6. Note that Round 1 is a trial round that does not count towards
14The trial group consisted of 50 participants on AMT. Their performance was recorded prior to theexperiment, with subjects receiving a piece rate. This procedure was followed as it is not feasible tostipulate simultaneous participation on AMT.

134 Chapter 4 - On the Effect of Relative Performance Feedback
0.0
2.0
4.0
6.0
8kd
ensi
ty s
core
0 10 20 30Exam score
Control group Treatment group
(a) Round 1 (trial)
0.0
2.0
4.0
6.0
8kd
ensi
ty s
core
0 10 20 30Exam score
Control group Treatment group
(b) Round 2
0.0
2.0
4.0
6.0
8kd
ensi
ty s
core
0 10 20 30Exam score
Control group Treatment group
(c) Round 3
0.0
2.0
4.0
6.0
8kd
ensi
ty s
core
0 10 20 30Exam score
Control group Treatment group
(d) Round 4
Figure 4.5 – The change in the densities of performance over time for the control (blue)and treatment (red) groups

Chapter 4 - On the Effect of Relative Performance Feedback 135
the aggregate score. This figure illustrates that (1) RPF has no effect on performance,
and (2) the effect does not vary over time. The absence of a significant difference between
the RPF and control group is even more striking in column 1 of Table 4.1, in which we
show the results from a difference-in-difference estimation (Equation 4.2).
Performanceit = α0 +β1Treatmenti+4∑t=2
γtPeriodt ∗Treatmenti+ δt+ηXi+εit (4.2)0
1020
30Sc
ore
1 2 3 4Round
Control group Treatment group
Figure 4.6 – Evolution of average performance across rounds
In line with the theoretical predictions, there might be, if anything, a slight effect of
RPF at the very top of the distribution, with slightly more subjects reaching the threshold
in the treatment group relative to the control group (4 out of 96 in the treatment group,
4.2%, vs. 3 out of 108 in the control group, 2.8%). The average performance of the
top 5% in Round 4 is also slightly higher in the treatment group (27.9 points vs. 26.8
points), although this difference is not statistically significant. The results from quantile
regressions in columns 2 and 3 of Table 4.1 show that RPF has no effect both at the first
and last quartile.
Overall, the results from this first experiment confirm our theoretical predictions: when
there is little room for improvement, RPF has a very small effect on performance, except
perhaps at the very top of the distribution, and the effect does not vary by round.

136 Chapter 4 - On the Effect of Relative Performance Feedback
4.2. Experiment 2: Large room for improvement
Experimental design
For the second experiment, subjects were eighth-grade students at two girls’ schools
in Iran, with an average age of 14.15 There were three classes per school and around 30
students per class. The students took a series of four weekly maths exams, which were
framed as part of the curriculum. The experiment was run with tournament incentives:
in each class, the two best performers received a significant prize of 1.000.000 Iranian
Rials.16 The students were ranked according to the sum of their scores over the last three
exams. The first exam was conceived as a trial-run and did not count for the final score.
In the control group, students only received feedback about their individual grade
after each exam. In the treatment group, students additionally received feedback about
their rank within the class. The total number of students in the control group was 91,
with 83 in the treatment group. In order to prevent spillovers of information, all students
from one school were allocated to the control group while all students from the second
school were allocated to the treatment group. As there was a significant distance between
the schools, there was little chance of the students realizing that a similar (but different)
tournament was being organized in another school. To ensure comparability, we ran a
pilot study to identify schools that were sufficiently similar.
Each exam consisted of 40 multiple-choice questions. The difficulty of the questions
was evaluated using a pilot study, to ensure that the grades across the tests were compara-
ble. Any improvement across rounds should therefore be attributed to better performance
rather than changes in difficulty. For each question there were four answer options, with
only one correct choice. Four points were awarded for a correct answer, while one point
was subtracted for an incorrect answer. Unanswered questions were not penalized. There
was a one-week gap between each exam, and students received feedback the day after each
exam, to ensure that they had time to react.
Results
Figure 4.7 shows the histograms of student scores in the treatment and control groups.
These show that (1) there is a strong positive effect of RPF on average exam scores and
(2) students who receive RPF continually improve, as the treatment effect rises over time.
Moreover, as indicated in Figure 4.8, RPF appears to shift the entire distribution
upwards.
We confirm these observations via a standard difference-in-differences regression
(Equation 4.2: the coefficients of interest are the γt’s). The results in column 4 of Table
15The experiment was run as part of Mahmoud Farrokhi-Kashani’s PhD thesis (Farrokhi-Kashani,2012).
16At the time roughly equivalent to 50 euro, about one week’s wages for a low-skilled worker.

Chapter 4 - On the Effect of Relative Performance Feedback 137
020
4060
Exam
sco
re
1 2 3 4Exam
Control group Treatment group
Figure 4.7 – The evolution of average exam scores over time for the control and treatmentgroups.
0.0
05.0
1.0
15.0
2kd
ensi
ty s
core
0 20 40 60 80Exam score
Control group Treatment group
(a) Exam 1
.005
.01
.015
.02
.025
kden
sity
sco
re
0 20 40 60 80Exam score
Control group Treatment group
(b) Exam 2
0.0
05.0
1.0
15.0
2kd
ensi
ty s
core
0 20 40 60 80Exam score
Control group Treatment group
(c) Exam 3
0.0
05.0
1.0
15.0
2kd
ensi
ty s
core
0 20 40 60 80Exam score
Control group Treatment group
(d) Exam 4
Figure 4.8 – The change in the densities of exam scores over time for the control (blue)and treatment (red) groups

138 Chapter 4 - On the Effect of Relative Performance Feedback
4.1 confirm that the size of the RPF effect is large (in exam 4 approximately 10 points
out of a maximum score of 160 points, corresponding to an increase of 0.56 standard
deviations) and robust to the introduction of the available controls (parents’ education
and number of siblings).
The performance of low-performing students deserves particular attention. It is often
assumed that RPF will harm weaker students. Across rounds, some students are less and
less likely to have a chance to win any prize. However, we observe that the score at the
bottom of the distribution does improve (see Figure 4.9). Figure 4.9 also suggests that
RPF has a homogeneous effect across the performance distribution.
To test the homogeneity of the RPF performance effect, we run quantile regressions at
the 25th, 50th and 75th percentile. The results in columns 5 and 6 of Table 4.1 indicate
that the effect is statistically significant over the entire distribution. The effect is not
statistically different between the first and the last quartile, although the coefficient is
slightly larger in the former.
Overall, our empirical findings fit the predictions of the technology channel well: the
treatment effect increases across periods. This feature is hard to explain through the effort
channel alone. The fact that the treatment effect is found over the whole performance
distribution matches the predictions of the technology model. Since there obviously is
room for improvement in this experiment, we conjecture that students improved their
performance by gradually improving their learning technology.
4.3. Comparison between the two experiments
Table 4.1 shows the results from both experiments, which allows us to draw three
conclusions.
Average effect Without room for improvement, there does not seem to be an average
performance effect. When there is considerable room for improvement, however, there is
a substantial and significant positive average effect of RPF on performance.
Distribution effect Comparing the effects at the bottom of the distribution (the first
quartile in columns 2 and 5 in Table 4.1), we can see that there is, after a few rounds,
a substantial difference between the results of the two experiments. There is no effect in
the experiment without room for improvement, but a positive significant effect with room
for improvement. At the top of the distribution (the top quartile in columns 3 and 6 of
Table 4.1), we see a similar pattern of a positive effect with room for improvement and
no effect without room for improvement.

Chapter 4 - On the Effect of Relative Performance Feedback 139
010
2030
0 10 20 30Mean score round 2 and round 3
Control group 45° lineLinear Regression
(a) Control group without room for im-provement
010
2030
0 10 20 30Mean score round 2 and round 3
Treatment group 45° lineLinear Regression
(b) Treatment group without room for improve-ment
025
5075
100
0 25 50 75 100Mean score Period 2 and Period 3
Control group 45° lineLinear Regression
(c) Control group with room for improve-ment
025
5075
100
0 25 50 75 100Mean score Period 2 and Period 3
Treatment group 45° lineLinear Regression
(d) Treatment group with room for improvement
Figure 4.9 – Comparison of the score in Round 4 (Y-axis) to that in Rounds 2 and 3(X-axis). Each dot represents a subject. Figures 4.9a and 4.9b show performance in theexperiment without room for improvement, and Figures 4.9c and 4.9d performance in theexperiment with room for improvement.

140 Chapter 4 - On the Effect of Relative Performance Feedback
Cumulative effect The third and final empirical difference between the two experi-
ments concerns the difference in the provision of RPF over several rounds. There does
not seem to be a performance effect after providing the information just once. However,
after a number of RPF a significant difference between the two experiments appears, with
a clear positive effect all along the performance distribution in the experiment with large
room for improvement, but none in the experiment without room for improvement.

Chapter 4 - On the Effect of Relative Performance Feedback 141
Table 4.1 – Effect of RPF on performance without (columns 1 to 3) or with (columns 4to 6) room for improvement
No Room for Improvement Large Room for ImprovementATE Bottom Top ATE Bottom Top(1) (2) (3) (4) (5) (6)
Round 2 3.259*** 2.827*** 2.839*** 1.385 5.256** -3.833(.448) (.668) (.762) (1.508) (2.470) (2.479)
Round 3 3.231*** 3.837*** 2.455*** 4.014** 6.282** 2.167(.621) (.781) (.696) (1.580) (2.782) (2.520)
Round 4 3.269*** 3.431*** 3.514*** 8.681*** 9.936*** 6.000**(.510) (.689) (.749) (1.806) (2.660) (2.525)
Treatment -.459 -.634 -.398 -4.301 1.474 -7.833**(.813) (1.467) (.866) (2.800) (3.303) (3.344)
Round 2 x .006 .931 .054 -1.256 -4.231 -.500Treatment (.665) (1.330) (1.070) (2.127) (3.350) (3.153)
Round 3 x .482 .188 .729 5.223** 3.269 7.500**Treatment (.872) (1.823) (.965) (2.397) (3.438) (3.495)
Round 4 x -.394 .050 -.568 10.013*** 9.231** 11.333***Treatment (.835) (1.554) (1.053) (2.517) (3.657) (3.790)
Constant 14.515*** 11.139*** 18.018*** 29.579*** 12.051*** 42.333***(1.775) (2.091) (1.591) (4.779) (3.923) (6.093)
Controls Yes Yes Yes Yes Yes YesR2 .064 .060 .059 .174 .158 .161No. obs 816 816 816 641 641 641
* p<0.10 ** p<0.05 *** p<0.01. The dependent variable for columns 1 to 3 is performancein counting matrices, for columns 4 to 6 the dependent variable is exam scores. Standarderrors (in parentheses) are clustered at the individual level. The “bottom” and “top”columns represent quantile regressions at the bottom and top quartiles. In the first threecolumns, the controls are education and age; in the last three columns, controls areparents’ education and number of siblings.

142 Chapter 4 - On the Effect of Relative Performance Feedback
5. Conclusion
The main claim of this paper is that RPF provides information about peers’ per-
formance which helps to better - and faster - identify good technologies. In particular,
low performers can benefit from RPF, an effect that has been consistently observed but
poorly explained. A common explanation is that agents have an intrinsic taste for ranking
(e.g. self-image concerns). In this paper we propose a less ad hoc and more satisfactory
explanation based on technology improvement.
At a more general level, considering a technology channel suggests that for the assess-
ment of the RPF effect it is crucial to know whether the task at hand offers a possibility
of technological improvement, which we call room for improvement. Surprisingly enough,
the nature of the incentives (tournament, individual, etc) appear to be of lesser impor-
tance. Indeed, even when rank has no influence on payoffs, as with individual incentives,
agents may nonetheless use the feedback to improve their technology. Section 2. confirms
that the specific incentive scheme does not make a great difference to the RPF effect,
in particular when there is little room for improvement. RPF is provided in countless
situations, and the focus on the technological aspect of RPF makes it possible to shed
new light on two branches of the literature: education and social norms.
In education, teachers are often reluctant to provide rankings to young pupils, as RPF
is thought to affect poor performers negatively, for instance by lowering their self-image. A
better understanding of the role of RPF suggests, on the contrary, that providing private
rankings is likely to trigger technological improvement, while avoiding public shaming.
This is indeed what some work has concluded: Hannan et al. (2013) and Gerhards and
Siemer (2016) find a positive effect of (private) ranking on performance, even for low
performers. Differently from previous work, this paper does not rely on an ad hoc “taste
for ranking” to account for this improvement.
Social norms are usually thought to influence behavior by specifying what is accept-
able and what is not in a society or a group. Informing agents that a large fraction of
their peers respect a particular norm is often taken as a way of increasing compliance.
It is usually assumed that agents have a preference for compliance, or that they try to
avoid the possible costs of deviating from the norm. Our work here suggests an alterna-
tive interpretation. Informing agents about compliance to a given social norm provides
information about the behavior of others. This information is a form of feedback which
may, in fact, trigger learning about new technologies. One good example is electricity
consumption. Electricity consumers have been found to reduce their consumption when
provided with information about their consumption relative to that of similar households
in their neighborhoods (Goldstein et al., 2008; Schultz et al., 2007). Agents who consume
more than their neighbors may realize, thanks to RPF, that it is possible to use electricity
in a more efficient way. Agents may thus comply with the norm (i.e. reduce their con-

Chapter 4 - On the Effect of Relative Performance Feedback 143
sumption), not (only) because they wish to comply per se or to avoid costs imposed on
deviators, but because they learn about better technologies.

144 Chapter 4 - On the Effect of Relative Performance Feedback
References
Ager, P., L. Bursztyn, and H.-J. Voth (2016). Killer incentives: Status competition and
pilot performance during world war ii. Technical report, National Bureau of Economic
Research.
Anderson, A. and L. M. Cabral (2007). Go for broke or play it safe? Dynamic competition
with choice of variance. The RAND Journal of Economics 38 (3), 593–609.
Andrabi, T., J. Das, and A. I. Khwaja (2017). Report cards. American Economic Re-
view 107, 1535–1563.
Aoyagi, M. (2010). Information feedback in a dynamic tournament. Games and Economic
Behavior 70 (2), 242–260.
Ashraf, A. (2019). Do performance ranks increase productivity? Evidence from a field
experiment. Technical report, LMU Munich.
Azmat, G., M. Bagues, A. Cabrales, and N. Iriberri (2019). What you don’t know can’t
hurt you? A natural field experiment on relative performance feedback in Higher Edu-
cation. Management Science 65 (8), 3714–3736.
Azmat, G. and N. Iriberri (2010). The importance of relative performance feedback
information: Evidence from a natural experiment using high school students. Journal
of Public Economics 94 (7), 435–452.
Azmat, G. and N. Iriberri (2016). The provision of relative performance feedback: An
analysis of performance and satisfaction. Journal of Economics & Management Strat-
egy 25 (1), 77–110.
Bandiera, O., V. Larcinese, and I. Rasul (2015). Blissful ignorance? A natural experiment
on the effect of feedback on students’ performance. Labour Economics 34, 13–25.
Banerjee, R., N. D. Gupta, and M. C. Villeval (2018). The spillover effects of affirmative
action on competitiveness and unethical behavior. European Economic Review 101,
567–604.
Barankay, I. (2011). Rankings and social tournaments: Evidence from a crowd-sourcing
experiment. University of Pennsylvania Working Paper .
Barankay, I. (2012). Rank incentives: Evidence from a randomized workplace experiment.
University of Pennsylvania Working Paper .
Blanes i Vidal, J. and M. Nossol (2011). Tournaments without prizes: Evidence from
personnel records. Management Science 57 (10), 1721–1736.

Chapter 4 - On the Effect of Relative Performance Feedback 145
Brade, R., O. Himmler, and R. Jackle (2018). Normatively framed relative performance
feedback–field experiment and replication. Technical report, University of GA¶ttingen.
Buser, T., L. Gerhards, and J. Van Der Weele (2018). Responsiveness to feedback as a
personal trait. Journal of Risk and Uncertainty 56 (2), 165–192.
Cadsby, C. B., F. Song, J. Engle-Warnick, and T. Fang (2019). Invoking social compar-
ison to improve performance by ranking employees: The moderating effects of public
ranking, rank pay, and individual risk attitude. Journal of Economic Psychology 72,
64–79.
Casas-Arce, P. and F. A. Martınez-Jerez (2009). Relative performance compensation,
contests, and dynamic incentives. Management Science 55 (8), 1306–1320.
Celik Katreniak, D. (2018). Dark side of incentives: Evidence from a randomized con-
trol trial in Uganda. Retrieved from https://sites.google.com/site/dasacelik/
research-seminar.
Charness, G., D. Masclet, and M. C. Villeval (2014). The dark side of competition for
status. Management Science 60 (1), 38–55.
Danz, D. (2020). Never underestimate your opponent: Hindsight bias causes overplace-
ment and overentry into competition. Games and Economic Behavior .
Delfgaauw, J., R. Dur, J. Sol, and W. Verbeke (2013). Tournament incentives in the field:
Gender differences in the workplace. Journal of Labor Economics 31 (2), 305–326.
Dobrescu, L., M. Faravelli, R. Megalokonomou, and A. Motta (2019). Rank incentives and
social learning: evidence from a randomized controlled trial. UNSW Business School
Research Paper Forthcoming .
Drouvelis, M. and P. Paiardini (2019). Feedback quality and performance in organisations.
Technical report, Mimeo, University of Birmingham.
Ederer, F. (2010). Feedback and motivation in dynamic tournaments. Journal of Eco-
nomics & Management Strategy 19 (3), 733–769.
Elsner, B., I. E. Isphording, and U. Zolitz (2021). Achievement rank affects performance
and major choices in college. The Economic Journal .
Eriksson, T., A. Poulsen, and M. C. Villeval (2009). Feedback and incentives: Experi-
mental evidence. Labour Economics 16 (6), 679–688.
Ertac, S. (2011). Does self-relevance affect information processing? experimental evidence
on the response to performance and non-performance feedback. Journal of Economic
Behavior & Organization 80 (3), 532–545.

146 Chapter 4 - On the Effect of Relative Performance Feedback
Ertac, S., M. Gumren, and L. Kockesen (2019). Strategic feedback in teams: Theory and
experimental evidence. Journal of Economic Behavior & Organization 162, 1–23.
Ertac, S., L. Kockesen, and D. Ozdemir (2016). The role of verifiability and privacy in
the strategic provision of performance feedback: Theory and experimental evidence.
Games and Economic Behavior 100, 24–45.
Farrokhi-Kashani, M. (2012). Improving students’ performance via relative performance
feedback: Evidence from three field experiments. Ph. D. thesis, Universite Paris 1.
Fershtman, C. and U. Gneezy (2011). The tradeoff between performance and quitting in
high power tournaments. Journal of the European Economic Association 9 (2), 318–336.
Fischer, M. and V. Wagner (2018). Effects of timing and reference frame of feedback:
Evidence from a field experiment.
Freeman, R. B. and A. M. Gelber (2010). Prize structure and information in tournaments:
Experimental evidence. American Economic Journal: Applied Economics 2 (1), 149–64.
Fuchs, W. (2007). Contracting with repeated moral hazard and private evaluations. Amer-
ican Economic Review 97 (4), 1432–1448.
Genakos, C. and M. Pagliero (2012). Interim rank, risk taking, and performance in
dynamic tournaments. Journal of Political Economy 120 (4), 782–813.
Gerhards, L. and N. Siemer (2016). The impact of private and public feedback on worker
performance – Evidence from the lab. Economic Inquiry 54 (2), 1188–1201.
Gershkov, A. and M. Perry (2009). Tournaments with midterm reviews. Games and
Economic Behavior 66 (1), 162–190.
Gill, D., Z. Kissova, J. Lee, and V. Prowse (2018). First-place loving and last-place
loathing: How rank in the distribution of performance affects effort provision. Manage-
ment Science 65, 494–507.
Gill, D. and V. Prowse (2012). A structural analysis of disappointment aversion in a real
effort competition. American Economic Review 102 (1), 469–503.
Goldstein, N. J., R. B. Cialdini, and V. Griskevicius (2008). A room with a viewpoint:
Using social norms to motivate environmental conservation in hotels. Journal of Con-
sumer Research 35 (3), 472–482.
Goltsman, M. and A. Mukherjee (2011). Interim performance feedback in multistage
tournaments: The optimality of partial disclosure. Journal of Labor Economics 29 (2),
229–265.

Chapter 4 - On the Effect of Relative Performance Feedback 147
Goulas, S. and R. Megalokonomou (2015). Knowing who you are: The effect of feedback
information on exam placement. Technical report, University of Warwick.
Goulas, S. and R. Megalokonomou (2021). Knowing who you actually are: The effect of
feedback on short-and longer-term outcomes. Journal of Economic Behavior & Orga-
nization 183, 589–615.
Haenni, S. (2019). Ever tried. Ever failed. No matter? On the demotivational effect of
losing in repeated competitions. Games and Economic Behavior 115, 346–362.
Halac, M., N. Kartik, and Q. Liu (2017). Contests for experimentation. Journal of
Political Economy 125 (5), 1523–1569.
Hannan, R. L., R. Krishnan, and A. H. Newman (2008). The effects of disseminating
relative performance feedback in tournament and individual performance compensation
plans. The Accounting Review 83 (4), 893–913.
Hannan, R. L., G. P. McPhee, A. H. Newman, and I. D. Tafkov (2013). The effect of
relative performance information on performance and effort allocation in a multi-task
environment. The Accounting Review 88 (2), 553–575.
Hara, K., A. Adams, K. Milland, S. Savage, C. Callison-Burch, and J. P. Bigham (2018).
A data-driven analysis of workers’ earnings on amazon mechanical turk. In Proceedings
of the 2018 CHI conference on human factors in computing systems, pp. 1–14.
Hermes, H., M. Huschens, F. Rothlauf, and D. Schunk (2019). Motivating low-
achievers—relative performance feedback in primary schools. NHH Dept. of Economics
Discussion Paper (14).
Hvide, H. K. (2002). Tournament rewards and risk taking. Journal of Labor Eco-
nomics 20 (4), 877–898.
Jalava, N., J. S. Joensen, and E. Pellas (2015). Grades and rank: Impacts of non-financial
incentives on test performance. Journal of Economic Behavior & Organization 115,
161–196.
Kajitani, S., K. Morimoto, and S. Suzuki (2020). Information feedback in relative grading:
Evidence from a field experiment. PloS one 15 (4), e0231548.
Kosfeld, M. and S. Neckermann (2011). Getting more work for nothing? Symbolic awards
and worker performance. American Economic Journal: Microeconomics 3 (3), 86–99.
Kuhnen, C. M. and A. Tymula (2012). Feedback, self-esteem, and performance in orga-
nizations. Management Science 58 (1), 94–113.

148 Chapter 4 - On the Effect of Relative Performance Feedback
Ludwig, S. and G. K. Lunser (2012). Observing your competitor – The role of effort
information in two-stage tournaments. Journal of Economic Psychology 33 (1), 166–
182.
Mago, S. D., A. C. Samak, and R. M. Sheremeta (2016). Facing your opponents: So-
cial identification and information feedback in contests. Journal of Conflict Resolu-
tion 60 (3), 459–481.
Mobius, M. M., M. Niederle, P. Niehaus, and T. S. Rosenblat (2011). Managing self-
confidence: Theory and experimental evidence. Technical report, National Bureau of
Economic Research.
Murphy, R. and F. Weinhardt (2020). Top of the class: The importance of ordinal rank.
The Review of Economic Studies 87 (6), 2777–2826.
Newman, A. H. and I. D. Tafkov (2014). Relative performance information in tournaments
with different prize structures. Accounting, Organizations and Society 39 (5), 348–361.
Schultz, P. W., J. M. Nolan, R. B. Cialdini, N. J. Goldstein, and V. Griskevicius (2007).
The constructive, destructive, and reconstructive power of social norms. Psychological
Science 18 (5), 429–434.
Seel, C. and P. Strack (2013). Gambling in contests. Journal of Economic Theory 148 (5),
2033–2048.
So, T., P. Brown, A. Chaudhuri, D. Ryvkin, and L. Cameron (2017). Piece-rates and
tournaments: Implications for learning in a cognitively challenging task. Journal of
Economic Behavior & Organization 142, 11–23.
Tafkov, I. D. (2013). Private and public relative performance information under different
compensation contracts. The Accounting Review 88 (1), 327–350.
Tran, A. and R. Zeckhauser (2012). Rank as an inherent incentive: Evidence from a field
experiment. Journal of Public Economics 96 (9-10), 645–650.
Villeval, M. C. (2020). Performance feedback and peer effects. Technical report, GLO
Discussion Paper.
Wirtz, J. (2016). Feedback and learning in tournaments. mimeo.
Wozniak, D., W. T. Harbaugh, and U. Mayr (2014). The menstrual cycle and per-
formance feedback alter gender differences in competitive choices. Journal of Labor
Economics 32 (1), 161–198.
Zimmermann, F. (2018). The dynamics of motivated beliefs. American Economic Re-
view 110 (2), 337–361.

Chapter 4 - On the Effect of Relative Performance Feedback 149
Appendices
A Description of the papers included in the empirical literature
review

150 Chapter 4 - On the Effect of Relative Performance Feedback
Tab
leA
.1–
Pap
ers
incl
uded
inth
isre
vie
ww
ith
larg
ero
omfo
rim
pro
vem
ent
(1)
Pap
er
Task
Natu
reof
Ince
nti
ves
NA
vera
ge
Eff
ect
Eff
ect
Feedback
eff
ect
at
bott
om
at
top
Age
ret
al.
(201
6)P
ilot
figh
ters
Pra
ise
inA
rmed
Fla
t50
81+
++
For
ceB
ullet
inA
ndra
bi
etal
.(2
017)
Tes
tsQ
uin
tile
rank
+IG
1211
0+
+0
mea
nsc
ore
Azm
atan
dIr
iber
ri(2
010)
Tes
tsC
lass
aver
age
IG34
14+
++
Azm
atet
al.
(201
9)T
ests
Dec
ile
rank
IG97
7-
-0
ever
y6
mon
ths
Bla
der
etal
.(2
015)
Tra
nsp
ort
Ran
kin
gF
lat
5000
+0
+B
lanes
iV
idal
,N
osso
l(2
011)
Whol
esal
eR
ankin
gP
R63
++
+re
tail
Bra
de
etal
.(2
018)
Tes
tsD
ista
nce
med
ian
IG16
09+
0+
80th
per
centi
leC
elik
Kat
renia
k(2
018)
Tes
tsP
erfo
rman
cefe
wT
7150
+cl
assm
ates
+ra
nkin
g
This
table
list
spap
ers
inw
hic
hth
eta
skis
consi
der
edby
the
auth
ors
ashav
ing
larg
ero
omfo
rim
pro
vem
ent.
Pap
ers
are
ranke
dal
phab
et-
ical
ly.
PR
:P
iece
-rat
e;IG
:In
div
idual
grad
es;
T:
Tou
rnam
ent

Chapter 4 - On the Effect of Relative Performance Feedback 151
Tab
leA
.2–
Pap
ers
incl
uded
inth
isre
vie
ww
ith
larg
ero
omfo
rim
pro
vem
ent
(2)
Pap
er
Task
Natu
reof
Ince
nti
ves
NA
vera
ge
Eff
ect
Eff
ect
Feedback
eff
ect
at
bott
om
at
top
Dob
resc
uet
al.
(201
9)T
ests
Ran
kin
gIG
1101
++
+F
isch
eran
dW
agner
(201
8)T
ests
Ear
lyIG
123
+G
oula
san
dM
egal
okon
omou
(201
5)T
ests
Ran
kin
gIG
4574
6-
0+
Her
mes
etal
.(2
019)
Tes
tsC
lass
rankin
gP
R37
8+
+0
impro
vem
ent
Kaji
tani
etal
.(2
020)
Tes
tsR
ankin
gT
255
0+
-K
osfe
ldan
dN
ecke
rman
n(2
011)
Dat
aA
nnou
nce
Fla
t18
4+
0+
entr
yof
bes
tF
lat
This
pap
er(R
oom
)T
ests
Ran
kin
gT
172
++
+T
ran
and
Zec
khau
ser
(201
2)T
ests
Ran
kin
gT
124
+-
+
This
table
list
spap
ers
inw
hic
hth
eta
skis
consi
der
edby
the
auth
ors
ashav
ing
larg
ero
omfo
rim
pro
vem
ent.
Pap
ers
are
ranke
dal
phab
et-
ical
ly.
PR
:P
iece
-rat
e;IG
:In
div
idual
grad
es;
T:
Tou
rnam
ent

152 Chapter 4 - On the Effect of Relative Performance Feedback
Tab
leA
.3–
Pap
ers
incl
uded
inth
isre
vie
ww
ith
no
room
for
impro
vem
ent
(1)
Pap
er
Task
Natu
reof
Ince
nti
ves
NA
vera
ge
Eff
ect
Eff
ect
Feedback
eff
ect
at
bott
om
at
top
Ash
raf
(201
9)Sw
eate
rP
riva
teP
R36
60+
pro
duct
ion
rankin
gA
zmat
and
Irib
erri
(201
6)A
ddin
gA
vera
geF
lat
156
0num
ber
sP
R16
0+
Ban
die
raet
al.
(201
5)F
ruit
Tea
mP
R65
6-
-0
rankin
gB
aran
kay
(201
1)Im
age
clas
s.R
ankin
gP
R14
7-
-0
Am
azon
MT
Bar
anka
y(2
012)
Furn
iture
Ran
kin
gP
R17
54+
++
sale
smen
+D
istr
ib.
Ran
kin
gP
R17
54-
-0
Bra
dle
ret
al.
(201
6)D
ata
Bes
t1
Fla
t82
++
0en
try
Bes
t3
95+
+0
Cad
sby
etal
.(2
019)
Addin
gR
ankin
gF
lat
560
++
+num
ber
sT
560
+0
+C
har
nes
set
al.
(201
4)E
ncr
ypti
onD
istr
ib.
Fla
t58
5+
Del
fgaa
uw
etal
.(2
013)
Sal
esT
eam
T12
8+
rankin
gD
rouve
lis
and
Pai
ardin
i(2
019)
Encr
ypti
onN
oisy
Fla
t24
80
-0
Pre
cise
248
+0
+E
rikss
onet
al.
(200
9)A
ddin
gR
ankin
gP
R88
0-
0num
ber
sT
120
0-
0
This
table
list
spap
ers
inw
hic
hth
eta
skis
consi
der
edby
the
auth
ors
ashav
ing
litt
lero
omfo
rim
pro
vem
ent.
Pap
ers
are
ranke
dal
phab
et-
ical
ly.
PR
:P
iece
-rat
e;IG
:In
div
idual
grad
es;
T:
Tou
rnam
ent

Chapter 4 - On the Effect of Relative Performance Feedback 153
Tab
leA
.4–
Pap
ers
incl
uded
inth
isre
vie
ww
ith
no
room
for
impro
vem
ent
(2)
Pap
er
Task
Natu
reof
Ince
nti
ves
NA
vera
ge
Eff
ect
Eff
ect
Feedback
eff
ect
at
bott
om
at
top
Ert
acet
al.
(201
9)E
ffor
tta
skP
riva
teB
est
link
165
+W
eak
link
165
-P
ublic
Bes
tlink
165
+W
eak
link
165
0F
ersh
tman
and
Gnee
zy(2
011)
60m
race
sC
onti
nuou
sT
471
-+
feed
bac
kF
isch
eran
dW
agner
(201
8)T
ests
Lat
eIG
117
-F
reem
anan
dG
elb
er(2
010)
Maz
esF
lat
156
+T
156
+T
156
0G
erhar
ds
and
Sie
mer
(201
6)IQ
Pri
vate
Fla
t50
++
0P
ublic
Fla
t45
0-
+Slider
task
Pri
vate
Fla
t50
+0
+P
ublic
Fla
t45
00
+G
ill
etal
.(2
018)
Ver
bal
/F
lat
306
++
+m
aths
Han
nan
etal
.(2
008)
Pro
duct
ion
Noi
syP
R23
++
+ga
me
T22
0-
+P
reci
seP
R21
++
+T
22-
-+
This
table
list
spap
ers
inw
hic
hth
eta
skis
consi
der
edby
the
auth
ors
ashav
ing
litt
lero
omfo
rim
pro
vem
ent.
Pap
ers
are
ranke
dal
phab
et-
ical
ly.
PR
:P
iece
-rat
e;IG
:In
div
idual
grad
es;
T:
Tou
rnam
ent

154 Chapter 4 - On the Effect of Relative Performance Feedback
Tab
leA
.5–
Pap
ers
incl
uded
inth
isre
vie
ww
ith
no
room
for
impro
vem
ent
(3)
Pap
er
Task
Natu
reof
Ince
nti
ves
NA
vera
ge
Eff
ect
Eff
ect
Feedback
eff
ect
at
bott
om
at
top
Han
nan
etal
.(2
013)
Ver
bal
and
mat
hs
(choi
ce)
Pri
vate
rankin
gF
lat
15+
(no
choi
ce)
15+
(choi
ce)
Public
rankin
g15
+(n
oC
hoi
ce)
15+
Kuhnen
and
Tym
ula
(201
2)M
ult
iplica
tion
sR
ankin
gF
lat
54+
+-
Ludw
igan
dL
unse
r(2
012)
Eff
ort
task
Dis
trib
uti
onT
720
Mag
oet
al.
(201
6)E
ffor
tta
skD
istr
ibuti
onT
240
0+
-N
ewm
anan
dT
afko
v(2
014)
Pro
duct
ion
gam
eR
ankin
gT
40-
-+
T40
++
+So
etal
.(2
017)
Mult
iple
cue
Ran
kin
gP
R84
0le
arnin
gta
skT
760
Taf
kov
(201
3)M
ult
iplica
tion
sP
riva
tera
nkin
gF
lat
20+
+-
PR
20+
+0
Public
rankin
gF
lat
20+
+-
PR
20+
+0
This
pap
er(N
oR
oom
)C
ounti
ng
task
Ran
kin
gT
204
00
0
This
table
list
spap
ers
inw
hic
hth
eta
skis
consi
der
edby
the
auth
ors
ashav
ing
litt
lero
omfo
rim
pro
vem
ent.
Pap
ers
are
ranke
dal
phab
et-
ical
ly.
PR
:P
iece
-rat
e;IG
:In
div
idual
grad
es;
T:
Tou
rnam
ent

Chapter 4 - On the Effect of Relative Performance Feedback 155
B Instructions given to participants
No Room for Improvement (Experiment 1)

Thank you for taking part in this experiment.
To thank you for your participation, we give you $2, regardless of your performance in this
experiment. In addition to this amount, we give you the opportunity to earn more money.
Your task consists in counting the number of 1s in grids containing only 0s and 1s. Each grid has 6 rows
and 6 columns as in the example below.
This experiment will consist in 4 rounds. For each round, you will have 60 seconds to count as much
grids as you can.
The remaining time is displayed at the top left of the screen.
When you have counted the number of 1s in the grid, you will need to enter your answer in the box
next to the grid.
After entering your answer, you will have to click outside the input area to enable the “Next grid”
button.
In each round, you will be rewarded with 1 point for each correct answer. However, wrong answers
will be penalized.
For each incorrect answer, you will lose 1/2 point. It is therefore very important that you give your
best for every grid.

The first round will be a trial.
Your point totals for rounds 2, 3 and 4 will give you the grand total of points you have earned. This
grand total will be compared to that of 50 other persons, randomly chosen among those who have
already participated in the same experiment.
If your grand total (the sum of your points in round 2, 3 and 4) is higher than that of 95% of others
(i.e. you are in the top 3), you will earn an extra $8.
At the end of each round, we will display the number of points you have earned during the round and
all previous rounds.
At the end of each round, we will display the number of points you have earned during the round and
all previous rounds. We will also display your rank among the 50 others for this round.

158 Chapter 4 - On the Effect of Relative Performance Feedback
Room for Improvement (Experiment 2)

Answer sheet of Math Exam n°4
Seat Number: First Name – Last Name:
The duration of the test is 40’.
Please indicate the correct answer using an X.
For each correct answer, 1 point will be awarded. For each incorrect answer, 1/3 point will be removed.
1 1 2 3 4 21 1 2 3 4
2 22
3 23
4 24
5 25
6 26
7 27
8 28
9 29
10 30
11 31
12 32
13 33
14 34
15 35
16 36
17 37
18 38
19 39
20 40
Final grade: Number of unanswered questions:
Number of incorrect answers:
Number of correct answers:


Chapter 5
Effect of the 7R allele on the DRD4
locus on risk-tolerance does not
depend on background risk:
Evidence from Senegal
Note: This chapter is co-authored with Aby Mbengue, Clement Mettling, Birane
Diouf, Charlotte Faurie, Omar Sene, Emilie Chancerel, Zoe Delporte, Guillaume Hollard,
Michel Raymond and Marc Willinger.
Abstract
Previous research has highlighted the correlation between genotypes and risk attitudes,
in particular for the 7-repeat allele of the dopamine receptor locus D4 (DRD4). It has also
been shown that living in risky environments, as well as having a risky occupation, can
moderate risk-tolerance. Much less is known, however, about the interplay between the
7R allele and risky environments. We demonstrate that the increase of risk-tolerance due
to the 7R allele occurs through an additive, and not dominance effect, and is independent
of the environmental risk in two populations in Northern Senegal, one of which is exposed
to a very high risk of fishing.1
1The authors gratefully acknowledge financial support from GENES, the Key initiatives MUSE Sea& Coast and Investissements d’Avenir (ANR-11-IDEX-0003/Labex Ecodec/ANR-11-LABX-0047).
161

162 Chapter 5 - Genetic Adaptation DRD4 in Senegal
1. Introduction
Humans need to adapt their behavior as a result of risk. Previous research has shown
that risk behavior is partly heritable (Cesarini et al., 2009). Genes involved in the regu-
lation of the dopaminergic system are good candidates to explain the heritability of risk
behavior. Dopamine is a neurotransmitter that provides reinforcement for behaviors as-
sociated with the expectation of reward in the brain. The dopamine receptor gene D4 is a
highly polymorphic gene (Van Tol et al., 1991; Gong et al., 2003). Expressed in the pre-
frontal cortex, it shows an unusually large variable repeat region in the third cytoplasmic
loop, coding for 16 amino acids. While the 4 repeat (4R) variant is the ancestral, and
most common allele in all human populations (Chang et al., 1996), there exist variations
between 2 and 11 repeats (2R to 11R). In particular, the 7R allele has been shown to be
linked to more risk-tolerant attitudes (Dreber et al., 2009; Kuhnen and Chiao, 2009; Car-
penter et al., 2011) and novelty-seeking behavior (Ebstein et al. (1996); Benjamin et al.
(1996), although this is more controversial Kluger et al. (2002)).
Humans also adapt their risk attitudes as a response to the level of risk in their
environment (Lee, 2008). In particular, people have been found to be more risk-averse
in the presence of unfair background risk (Harrison et al., 2007; Malmendier and Nagel,
2011; Beaud and Willinger, 2015; Cameron and Shah, 2015), in accordance with the “risk-
vulnerability” hypothesis (Gollier and Pratt, 1996; Eeckhoudt et al., 1996).
Much less in known, however, about the interplay between genetic and environmental
risk factors in shaping risk attitudes. The aim of the present paper is to test the interaction
between the influence of the 7R allele on risk-tolerance and the level of risk to which people
are exposed.
2. Results
2.1. Risk-tolerance by zone
The village of Guet Ndar (Saint-Louis region in Northern Senegal) is famous for its
fisheries. Fishing in the area is very dangerous, with authorities reporting 25 deaths due
to fishing on average per year over the past 20 years. Given the demography of the
village, with 20 000 inhabitants, among which fishing represents the main occupation of
approximately 80% of the adult male workforce, this corresponds to approximately 5%
of the male population who died due to fishing in the last 20 years. The prevalence of
deaths is strongly linked to the intersection of strong currents coming from the Senegal
river and an upwelling current from the ocean (Laloe and Samba, 1989). However, these
currents attract a lot of fish, making fishing more profitable than other activities in the
region (fishermen in our sample declare income significantly higher than non-fishermen,

Chapter 5 - Genetic Adaptation DRD4 in Senegal 163
p < 0.01, Table S.1).
In this paper, we compared populations from the fishing village of Guet Ndar (N =
609 ), which is labelled as the risky area, and that of a farming village called Mouit, 23
kilometers away (N = 263 ), labelled the non-risky area. Importantly, the two populations
are mostly composed of the same ethnic group (the Wolofs, representing approximately
80% of the sample in both areas). Because fishing is an activity predominately performed
by men, our sample only consists of men.
Our experimental measure of risk-tolerance was based on a lottery task (Binswanger,
1980). A description of the task is provided in the Supplementary Materials. Results
indicate that risk-tolerance varied between the risky and non-risky areas. Participants
from the risky area tended to exhibit less risk-tolerance than participants from the non-
risky area (Figure 5.1, Student’s t-test p < 0.01). The difference remains significant after
controlling for age and education (Table S.2). Our data is consistent with field data and
laboratory experiments showing that people exposed to high background risk tend to
exhibit less risk-tolerance, in accordance with the “risk-vulnerability hypothesis” (Gollier
and Pratt, 1996; Eeckhoudt et al., 1996).
Figure 5.1 – Distribution of risk-tolerance by zone
***
0.2
.4.6
.81
Ris
k to
lera
nce
Zone
Mouit (Non-risky) Guet Ndar (Risky)
Note: The higher the risk-tolerance variable, the riskier the choice of participants. Segmentsrepresent 95% confidence intervals. Student’s t-test * p < 0.1, ** p < 0.05, *** p < 0.01.
2.2. Genotypes by zone
Genotypes at the DRD4 locus displayed two common alleles (4R and 7R, with 4
and 7 repeats, respectively), which was expected for populations in Africa (Chang et al.,
1996), and 5 minor alleles with negligible frequencies (2R, 3R, 5R, 6R and 8R) leading
to 21 different genotypes (Table 5.1). Within each area, populations were not at Hardy-

164 Chapter 5 - Genetic Adaptation DRD4 in Senegal
Weinberg equilibrium (p < 0.01 in the non-risky area, p = 0.02 in the risky area).
Because we are primarily interested in the effect of the 7R allele on risk-taking, we com-
bined all other alleles as an allele “X”. This combination yields three genotypes: XR/XR,
XR/7R and 7R/7R. Hardy-Weinberg equilibrium was rejected (p = 0.01) for the non-risky
area, but not for the risky area (p = 0.40), see Table 5.1).
2.3. Risk-tolerance by genotype
Risk-tolerance was not independent of genotype at the DRD4 locus (Figure 5.2 and
Table 5.2, Column 1). The 7R allele demonstrated a significant additive effect (p = 0.01),
and no dominance effect was found (p = 0.31). The 7R allele increases risk-tolerance.
Importantly, the result holds after controlling for age, education and the living area (Table
5.2, Column 2). Our results indicate that the 7R allele is associated with more risk-
tolerant attitudes than other genotypes, in line with previous literature (Dreber et al.,
2009; Kuhnen and Chiao, 2009).
Figure 5.2 – Distribution of risk-tolerance by genotype
**
*
0.2
.4.6
.81
Ris
k to
lera
nce
X/X X/7 7/7
Note: The higher the risk-tolerance variable, the riskier the choice of participants. X/X, X/7 and7/7 represent genotypes, with all alleles not 7R combined into the X allele. Segments represent95% confidence intervals. Student’s t-test * p < 0.1, ** p < 0.05, *** p < 0.01.
Moreover, environmental risk did not appear to significantly moderate the effect of
the 7R allele. First, its additive effect holds when analyzing both areas separately (Table
5.2, Columns 3 and 4, Figure S.1), although the significance levels drop slightly due to
sample limitations (p = 0.05 and p = 0.08 in the non-risky and risky area, respectively).
Second, the interaction between the additive effect and the area (Table 5.2, Column 5)
was not significant p = 0.25.

Chapter 5 - Genetic Adaptation DRD4 in Senegal 165
Table 5.1 – Genotypic composition at the DRD4 locus of populations from the Saint-Louisregion in the non-risky and risky areas.
Genotype Non-risky area Risky areaN % N %
Panel A. Without combination of genotypes22 3 1.4 3 0.624 7 3.3 14 2.825 1 0.5 - -27 - - 2 0.434 3 1.4 - -36 1 0.5 - -37 1 0.5 - -44 84 39.1 202 4045 19 8.8 34 6.746 14 6.5 18 3.647 48 22.3 149 29.548 5 2.3 12 2.455 4 1.9 3 0.656 - - 1 0.257 4 1.9 13 2.658 - - 2 0.466 2 0.9 1 0.267 1 0.5 12 2.477 15 7 34 6.778 3 1.4 4 0.888 - - 1 0.2
HW equilibriump <0.01 0.023
Panel B. Allele 7R versus other allelesXX 143 66.5 291 57.5X7 57 26.5 181 35.877 15 7.0 34 6.7
HW equilibriump 0.011 0.40
The measure of departure from Hardy-Weinberg (HW) equilibrium (LL − χ2) refers tothe estimated log-likelihood-ratio χ2 coefficient. The p-value (p) corresponds to an exacttest of departure from HW equilibrium with heterozygote deficiency as the alternativehypothesis. Genotype ij refers to the DRD4 genotype iR/jR. For Panel B, all alleles not7R are combined in the X allele.

166 Chapter 5 - Genetic Adaptation DRD4 in Senegal
Table 5.2 – Differences between genotypes in risk-tolerance
(1) (2) (3) (4) (5)Without With Non-risky Risky Interactioncontrols controls area area
only only
7R: additive effect 0.068** 0.064** 0.097* 0.056* 0.107**(0.027) (0.028) (0.049) (0.032) (0.042)
7R: dominance effect -0.037 -0.026 -0.003 -0.036 -0.027(0.036) (0.037) (0.042) (0.042) (0.036)
Age -0.002*(0.001)
Education -0.004(0.005)
Risky area -0.120*** -0.079**(0.032) (0.036)
Risky area × -0.0547R: additive effect (0.047)Constant 0.456*** 0.613*** 0.507*** 0.431*** 0.509***
(0.017) (0.053) (0.030) (0.021) (0.029)
R2 0.009 0.030 0.026 0.006 0.028No. obs 721 699 215 506 721
* p<0.10, ** p<0.05, *** p<0.01. The outcome variable is risk-tolerance. Standard errorsin parentheses.

Chapter 5 - Genetic Adaptation DRD4 in Senegal 167
3. Discussion
In this paper, we find that the 7R allele of DRD4 affects risk-attitudes by an additivity
effect, not a dominance effect. This is in contrast with Faurie et al. (2016) who found that
heterozygotes 2R/4R had lower risk tolerance. Moreover, we do not find evidence that the
7R allele is associated with novelty seeking, as found in Kluger et al. (2002). Interestingly,
we find no evidence of differential genetic selection at the DRD4 locus between areas.
While the sample would satisfy Kirkpatrick (1996)’s conditions for a genetic adaptation
to habitat (limited migration with 74% of grandparents of participants of the risky area
born in the same village, Table S.3, and a strong economic benefit to living in the area), we
find no specific genetic differentiation at DRD4 locus relative to 29 unlinked microsatellites
loci (Table S.4 and Figure S.2). Moreover, if there was genetic differentiation, it would
move in the opposite direction as the risk-vulnerability hypothesis found in previous work
for DRD4 (Faurie et al., 2016), as the 7R allele, favoring more risk-tolerant attitudes, is
more prevalent in the risky area. Altogether, our results indicate that there is no selection
at the DRD4 locus in our sample. Another point worth mentioning is that the observed
differences between zones could also be the reflect of the effects of occupation on risk
attitudes, because of a strong correlation between the living area and the probability of
being a fisherman (85% of the sample in the risky area declared their main activity as
fishing, vs. 4% in the non-risky area).
Further work should focus on genetic adaptation at other loci, for instance using the
work of Karlsson Linner et al. (2019). Moreover, identifying other solutions for people to
cope with risk in risky environments could also be further investigated.
4. Methods
A field study was conducted in the Saint-Louis region in Northern Senegal between
March 2018 and March 2020. All experiments were conducted in accordance with rele-
vant guidelines and regulations. The protocol (including genotyping) was approved by
the Senegalese National Ethics Committee (Comite National d’Ethique en Recherche en
Sante), and informed consent was obtained from all participants. Behavioral measures
were made at the same time as samples were collected for genotyping, so genotypes were
not established at the time of measure. Investigators were blind to the behavioral mea-
sures during the genotyping.
Measure of risk-tolerance We relied on a standard measure of risk-elicitation task
from the experimental economics literature (Binswanger, 1980). Instructions were dis-
played in French (the official written language of the country) and enumerators were
present to explain the instructions in Wolof, the vernacular language of Senegal. Par-

168 Chapter 5 - Genetic Adaptation DRD4 in Senegal
ticipants were invited to choose a card among five. On each card, two amounts were
displayed, with an associated color (red or black) and the corresponding amount in coins
of XOF 100, in order to have a more visual representation. At the end of the experiment,
one ball was randomly drawn by a local child and gains were calculated. The cards ranged
from completely risk-free (400 XOF for both balls) to extremely unequal (0 XOF if Red,
1200 XOF if Black). At each new card, the risk is increased, but so is the average amount
won. Cards used are displayed in Figure S.3.
Genotyping DRD4 genotyping was done as described in (Faurie et al., 2016). Briefly,
DNA was collected on FTA paper, and amplified with the appropriate primers. Relevant
allele was estimated by the size of the PCR product on a 2% agarose gel.
Microsatellite genotyping was based on high-throughput sequencing technology
(SSRseq). 30 microsatellite tests were designed according to a streamlined SSRseq de-
velopment workflow described in (Lepais et al., 2020), of which 29 gave differentiation
information (one had only one allele for all individuals). The genomic localisation of the
29 microsatellites and their corresponding Fst between the 2 populations is described in
Table S.4
Population genetics DRD4 locus was tested for conformity with Hardy-Weinberg
(HW) equilibrium using the exact probability test (Rousset and Raymond, 1995). Devia-
tions from HW equilibrium were measured using the Fis estimator (Weir and Cockerham,
1984). DRD4 and microsatellite loci genotypic differentiation between populations was
tested for by calculating an unbiased estimate of the P-value of a log-likelihood (G) based
exact test (Goudet et al., 1996), a global test over loci was calculated using Fisher’s
method. Population differentiation was measured using the Fst estimator (Weir and
Cockerham, 1984). Calculations were performed using Genepop R package (V. 1.1.7),
based on Raymond and Francois (1995).

Chapter 5 - Genetic Adaptation DRD4 in Senegal 169
References
Beaud, M. and M. Willinger (2015). Are people risk vulnerable? Management Sci-
ence 61 (3), 624–636.
Benjamin, J., L. Li, C. Patterson, B. D. Greenberg, D. L. Murphy, and D. H. Hamer
(1996). Population and familial association between the d4 dopamine receptor gene
and measures of novelty seeking. Nature genetics 12 (1), 81–84.
Binswanger, H. P. (1980). Attitudes toward risk: Experimental measurement in rural
india. American Journal of Agricultural Economics 62 (3), 395–407.
Cameron, L. and M. Shah (2015). Risk-taking behavior in the wake of natural disasters.
Journal of Human Resources 50 (2), 484–515.
Carpenter, J. P., J. R. Garcia, and J. K. Lum (2011). Dopamine receptor genes predict
risk preferences, time preferences, and related economic choices. Journal of Risk and
Uncertainty 42 (3), 233–261.
Cesarini, D., C. T. Dawes, M. Johannesson, P. Lichtenstein, and B. Wallace (2009).
Genetic variation in preferences for giving and risk taking. The Quarterly Journal of
Economics 124 (2), 809–842.
Chang, F.-M., J. R. Kidd, K. J. Livak, A. J. Pakstis, and K. K. Kidd (1996). The world-
wide distribution of allele frequencies at the human dopamine d4 receptor locus. Human
genetics 98 (1), 91–101.
Dreber, A., C. L. Apicella, D. T. Eisenberg, J. R. Garcia, R. S. Zamore, J. K. Lum, and
B. Campbell (2009). The 7r polymorphism in the dopamine receptor d4 gene (drd4)
is associated with financial risk taking in men. Evolution and Human Behavior 30 (2),
85–92.
Ebstein, R. P., O. Novick, R. Umansky, B. Priel, Y. Osher, D. Blaine, E. R. Bennett,
L. Nemanov, M. Katz, and R. H. Belmaker (1996). Dopamine d4 receptor (d4dr) exon
iii polymorphism associated with the human personality trait of novelty seeking. Nature
genetics 12 (1), 78–80.
Eeckhoudt, L., C. Gollier, and H. Schlesinger (1996). Changes in background risk and risk
taking behavior. Econometrica: Journal of the Econometric Society 64 (3), 683–689.
Faurie, C., C. Mettling, M. Ali Bchir, D. S. Hadmoko, C. Heitz, E. D. Lestari, M. Ray-
mond, and M. Willinger (2016). Evidence of genotypic adaptation to the exposure to
volcanic risk at the dopamine receptor drd4 locus. Scientific reports 6 (1), 1–7.

170 Chapter 5 - Genetic Adaptation DRD4 in Senegal
Gollier, C. and J. W. Pratt (1996). Risk vulnerability and the tempering effect of back-
ground risk. Econometrica: Journal of the Econometric Society , 1109–1123.
Gong, S., C. Zheng, M. L. Doughty, K. Losos, N. Didkovsky, U. B. Schambra, N. J. Nowak,
A. Joyner, G. Leblanc, M. E. Hatten, et al. (2003). A gene expression atlas of the central
nervous system based on bacterial artificial chromosomes. Nature 425 (6961), 917–925.
Goudet, J., M. Raymond, T. de Meeus, and F. Rousset (1996). Testing differentiation in
diploid populations. Genetics 144 (4), 1933–1940.
Harrison, G. W., J. A. List, and C. Towe (2007). Naturally occurring preferences and
exogenous laboratory experiments: A case study of risk aversion. Econometrica 75 (2),
433–458.
Karlsson Linner, R., P. Biroli, E. Kong, S. F. W. Meddens, R. Wedow, M. A. Fontana,
M. Lebreton, S. P. Tino, A. Abdellaoui, A. R. Hammerschlag, et al. (2019). Genome-
wide association analyses of risk tolerance and risky behaviors in over 1 million indi-
viduals identify hundreds of loci and shared genetic influences. Nature genetics 51 (2),
245–257.
Kirkpatrick, M. (1996). Genes and adaptation: a pocket guide. Adaptation. Academic
Press, San Deigo, CA, 125–146.
Kluger, A., Z. Siegfried, and R. Ebstein (2002). A meta-analysis of the association between
drd4 polymorphism and novelty seeking. Molecular psychiatry 7 (7), 712–717.
Kuhnen, C. M. and J. Y. Chiao (2009). Genetic determinants of financial risk taking.
PloS one 4 (2), e4362.
Laloe, F. and A. Samba (1989). La peche artisanale au Senegal: Ressource et strategie
de peche. Ph. D. thesis, Paris 11.
Lee, J. (2008). The effect of the background risk in a simple chance improving decision
model. Journal of risk and uncertainty 36 (1), 19–41.
Lepais, O., E. Chancerel, C. Boury, F. Salin, A. Manicki, L. Taillebois, C. Dutech, A. Aissi,
C. F. Bacles, F. Daverat, et al. (2020). Fast sequence-based microsatellite genotyping
development workflow. PeerJ 8, e9085.
Malmendier, U. and S. Nagel (2011). Depression babies: do macroeconomic experiences
affect risk taking? The quarterly journal of economics 126 (1), 373–416.
Raymond, M. and R. Francois (1995). Population genetics software for exact tests and
ecumenicism. Journal of Heredity 86, 248–249.

Chapter 5 - Genetic Adaptation DRD4 in Senegal 171
Rousset, F. and M. Raymond (1995). Testing heterozygote excess and deficiency. Genet-
ics 140 (4), 1413–1419.
Van Tol, H. H., J. R. Bunzow, H.-C. Guan, R. K. Sunahara, P. Seeman, H. B. Niznik,
and O. Civelli (1991). Cloning of the gene for a human dopamine d4 receptor with high
affinity for the antipsychotic clozapine. Nature 350 (6319), 610–614.
Weir, B. S. and C. C. Cockerham (1984). Estimating f-statistics for the analysis of
population structure. evolution, 1358–1370.

172 Chapter 5 - Genetic Adaptation DRD4 in Senegal
Supplementary Materials
Table S.1 – Differences in income for fishermen
(1)Income level
Fisherman 0.958***(0.138)
Constant 2.211***(0.109)
R2 0.073No. obs 616
* p<0.10, ** p<0.05, *** p<0.01. The outcome variable is the declared income level.Standard errors between parentheses. Both risky and non-risky areas were combined.

Chapter 5 - Genetic Adaptation DRD4 in Senegal 173
Table S.2 – Differences between zones in risk-tolerance
(1) (2)Without controls With controls
Risky area -0.099*** -0.105***(0.027) (0.029)
Age -0.002(0.001)
Education 0.000(0.005)
Constant 0.544*** 0.591***(0.022) (0.048)
R2 0.016 0.019No. obs 860 833
* p<0.10, ** p<0.05, *** p<0.01. The outcome variable is risk-tolerance. Standard errorsbetween parentheses.

174 Chapter 5 - Genetic Adaptation DRD4 in Senegal
Figure S.1 – Distribution of risk-tolerance by genotype by zone
*
*
*
0
.2.4
.6.8
1R
isk
tole
ranc
e
Mouit (non-risky area) Guet Ndar (risky area)Zone
X/X X/7 7/7
Note: The higher the risk-tolerance variable, the riskier the choice of participants. X/X, X/7 and7/7 represent genotypes, with all alleles not 7R combined into the X allele. Segments represent95% confidence intervals. * p < 0.1, ** p < 0.05, *** p < 0.01.

Chapter 5 - Genetic Adaptation DRD4 in Senegal 175
Table S.3 – Percentage of ancestors born in the same village as participants
(1) (2) (3)Risky area Non-risky area Total
Participants 81 67 77Total parents 72 58 68Mother 71 67 66Father 73 49 70Total grandparents 68 50 62Maternal grandfather 67 42 59Maternal grandmother 69 51 63Paternal grandfather 67 58 64Paternal grandmother 68 49 62

176 Chapter 5 - Genetic Adaptation DRD4 in Senegal
Figure S.2 – Distribution of genetic differentiation between the risky and non-risky areas
The figure displays F-statistics for genetic differentiation between the two areas, for DRD4without clustering, for DRD4 after clustering all alleles different from 7R into an “X” allele,and for the 29 micro-satellites selected. The yellow line represents the Fst for the DRD4 locuswithout clustering, the red line for DRD4 after clustering, and the blue line represents theaverage Fst for the micro-satellites.

Chapter 5 - Genetic Adaptation DRD4 in Senegal 177
Table S.4 – Genetic differentiation between the non-risky and risky areas on the DRD4locus and micro-satellites.
Loci FST p-value (S.E.)
Panel A. DRD4DRD4 0.0007 0.0096 (0.0013)DRD4 after clustering 0.0036 0.0941 (0.0038)
Panel B. Micro-satelliteNo. Chromosome: positionchr1 : 25140881-25140899 0.0053 0.1993 (0.0053)chr2 : 9753457-9753484 -0.0081 0.7238 (0.0029)chr2 : 16239536-16239584 0.0010 0.0285 (0.0017)chr2 : 44975447-44975477 0.0067 0.1032 (0.0030)chr21 : 15100302-15100333 0.0001 0.2965 (0.0033)chr3 : 13815554-13815575 0.0069 0.1144 (0.0034)chr3 : 28213984-28214005 -0.0015 0.6527 (0.0027)chr4 : 1467533-1467565 0.0067 0.1639 (0.0029)chr5 : 12484633-12484657 -0.0001 0.1842 (0.0047)chr6 : 12334400-12334425 -0.0024 0.7504 (0.0038)chr6 : 21033972-21033999 0.0199 0.0054 (0.0008)chr6 : 34463481-34463513 -0.0048 0.3117 (0.0035)chr8 : 37410868-37410898 -0.0023 0.6902 (0.0043)chr9 : 4357561-4357589 0.0033 0.2067 (0.0060)chr9 : 10942052-10942074 -0.0010 0.4405 (0.0031)chr9 : 23340635-23340654 0.0017 0.1651 (0.0020)chr10 : 7553026-7553045 0.0012 0.1980 (0.0044)chr11 : 2009564-2009584 0.0007 0.4635 (0.0007)chr12 : 607351-607380 0.0041 0.1359 (0.0013)chr12 : 41680046-41680064 -0.0033 0.8597 (0.0016)chr13 : 24648458-24648485 0.0027 0.14873 (0.0042)chr13 : 67656823-67656870 0.0079 0.2031 (0.0050)chr16 : 5398567-5398589 0.0226 0.2637 (0.0035)chr16 : 12462593-12462611 0.0150 0.0664 (0.0022)chr17 : 49684195-49684223 0.0008 0.3120 (0.0036)chr19 : 6517969-6517988 0.0165 0.1566 (0.0016)chr19 : 28667178-28667198 0.0022 0.5640 (0.0022)chr20 : 56130369-56130397 -0.0094 1 (0)chr21 : 5520201-5520225 0.0040 0.1951 (0.0048)Combined 0.0035 0.007798
FST The measure of differentiation FST refers to the estimate from Weir and Cockerham(1984). p refers to the p-value of a log-likelihood based exact test. The global test overmicro-satellite loci was calculated using Fisher’s method.

178 Chapter 5 - Genetic Adaptation DRD4 in Senegal
Boule RoseBoule VerteA
(400 Francs) (400 Francs)
(a)
(300 Francs) (600 Francs)
BBoule Verte
Boule Rose
(b)
(200 Francs) (800 Francs)
CBoule Verte
Boule Rose
(c)
(100 Francs) (1000 Francs)
DBoule Verte
Boule Rose
(d)
(0 Franc) (1200 Francs)
EBoule Verte
Boule Rose
(e)
Figure S.3 – Cards displayed in the risk-tolerance elicitation task.
Note: Participants were asked to choose a card among these five. The result is a variableChoice from 1 to 5. The variable Risk-tolerance was then computed using the followingformula: Risk − tolerance = Choice−1
4. The Risk-tolerance variable is therefore a vari-
able ranging from 0 (the participant chose the safest option, i.e. the card A) to 1 (theparticipant chose the riskiest option, i.e. the card E).

General Conclusion
This thesis contributes to the fields of experimental and development economics. In
particular, the three first chapters contribute to the literature on the contact hypothesis.
The first and second chapters present results from the implementation of similar protocols
in widely different contexts. The third chapter provides a meta analysis of the literature
and highlights potential avenues for future research. The other two chapters talk about
other topics. The fourth chapter sheds light on the use of rankings on performance in
different tasks, while the fifth chapter provides insights about the interplay of genetics
and environment in shaping risk attitudes.
I would like to end this dissertation by providing three open questions, which I consider
to be of prime interest. These questions focus on the contact literature, as it is the main
theme of this thesis.
The first open question relates to the consequences of prejudice, and the role contact
interventions can play on the topic. Now that the positive effect of contact has been
established, the focus should now turn to whether contact interventions are sufficient to
mitigate the negative consequences of prejudice. To give an example, it has been proven
that working under biased managers tend to decrease workers’ productivity (Glover et al.,
2017). Contact interventions can help reduce the level of prejudice of these managers. The
question then becomes: does this reduction in managers’ prejudice induce an increase in
productivity for the employees?
The second open question is linked to the comparison of studies involving contact
interventions. As was mentioned numerous times in this thesis, there exist a very large
heterogeneity of contact interventions and outcome measures used for contact interven-
tions. An interesting direction the literature could take would be to implement joint
interventions, with similar protocols, in different contexts (perhaps adapting protocols to
better fit some contexts). This effort, which has been undertaken in other fields such as
information and accountability of leaders (Dunning et al., 2019) or community policing
(Blair et al., 2021). Whether similar findings can be found in different contexts could
greatly help analyzing the determinants of effects of contact.
The third and final open questions, which I believe are a prime importance for the
future of the field of contact interventions is to understand which policies are the best in
terms of cost effectiveness. If contact interventions are effective, and if the answer to the
179

180 General Conclusion
first open question is yes - i.e. implementing contact can help reduce the consequences
of prejudice - then an effort should be made to understand the returns to investments in
these policies. If the costs of implementing contact protocols are high relative to their
benefits, perhaps interventions should be modified.
References
Blair, G., J. M. Weinstein, F. Christia, E. Arias, E. Badran, R. A. Blair, A. Cheema,
A. Farooqui, T. Fetzer, G. Grossman, et al. (2021). Community policing does not build
citizen trust in police or reduce crime in the global south. Science 374 (6571), eabd3446.
Dunning, T., G. Grossman, M. Humphreys, S. D. Hyde, C. McIntosh, and G. Nellis
(2019). Information, accountability, and cumulative learning: Lessons from Metaketa
I. Cambridge University Press.
Glover, D., A. Pallais, and W. Pariente (2017). Discrimination as a self-fulfilling prophecy:
Evidence from french grocery stores. The Quarterly Journal of Economics 132 (3),
1219–1260.

Titre : Essais en Economie Experimentale et du Developpement
Mots cles : Experiences, Confiance, Theorie du Contact, Developpement
Resume : L’economie experimentale offre la possibilite d’etudierle comportement des agents economiques dans des conditionsideales, puisqu’elle permet le controle presque total sur l’environ-nement des participants. Cette these presente les resultats de di-verses experiences menees sur le terrain, ainsi que des synthesesde la litterature. Ce manuscrit est compose de cinq chapitres. Lestrois premiers chapitres traitent de la theorie du contact, qui visea ameliorer les relations entre differents groupes. Les chapitres1 et 2 presentent les resultats de deux experiences de terrain,en France et au Senegal, tandis que le chapitre 3 presente unemeta-analyse de la litterature empirique. Les deux derniers cha-pitres presentent les resultats d’experiences d’economie sur dessujets divers. Le chapitre 4 etudie l’effet de donner le classementsur la performance des agents, en fonction de la nature de tachea effectuer. Le chapitre 5 traite du lien entre genetique et envi-ronnement dans l’adaptation au risque lie a la peche au Senegal.Le chapitre 1 traite d’une experience de terrain etudiant les effetsd’une discussion courte et structuree sur la confiance entre desjeunes de lycees defavorisees de banlieue parisienne et des po-liciers. La methodologie est adaptee de la litterature en psycholo-gie sociale et a pour but de creer des liens d’amitie rapidement.Les resultats indiquent que le contact engendre une augmenta-tion du niveau de confiance des lyceens envers les policiers ren-contres, mais ne permet pas d’augmenter la confiance envers lespoliciers et la police en general. Le chapitre 2 analyse un protocoleexperimental proche du chapitre 1, mais l’applique dans le contextedes relations inter-ethniques au Senegal. Les discussions cadreeset rapides ont un effet sur la confiance inter-ethnique avec les in-dividus rencontres, mais ne permettent pas l’amelioration de lagenerosite a l’egard des autres groupes ethniques en general. De
plus, les effets semblent dissipes seulement un mois apres le trai-tement. Des methodes d’apprentissage statistique permettent detrouver que le traitement est particulierement efficace pour les indi-vidus ages et peu eduques. Le chapitre 3 offre une meta-analysede la litterature empirique sur le contact, qui s’est grandementdeveloppee au cours des dernieres annees. Se basant sur 62 me-sures, issues de 37 articles, l’analyse revele trois resultats princi-paux. Tout d’abord, il existe une tres grande heterogeneite dansla definition de � contact �, ce qui rend difficile la comparaisondes differents articles. Ensuite, en moyenne, les interventions decontact sont efficaces en permettant d’ameliorer significativementla perception de l’autre groupe. Enfin, l’utilisation d’apprentissagestatistique permet de de determiner les determinants de l’efficacitedes interventions. Le chapitre 4 analyse l’effet de l’apport de clas-sements sur la performance, en fonction de la nature de la tachea effectuer. L’analyse est effectuee au regard d’une analyse dela litterature, d’un modele theorique novateur et de l’etude empi-rique de deux experiences. Les resultats indiquent que le facteurqui module grandement l’effet des classements est l’existence, ounon, de possibilite d’amelioration de la technologie de productionde la performance. Le chapitre 5 etudie le lien entre les effets dugene codant le recepteur a la dopamine D4 et du risque environ-nemental sur l’aversion au risque chez des pecheurs du nord duSenegal. L’analyse consiste en la comparaison comportementaleet genetique de deux populations qui different selon leur activiteprofessionnelle principale. Les resultats indiquent que l’allele 7Rest associe a une plus grande tolerance au risque, par un effet ad-ditif et non de dominance. De plus, aucune heterogeneite n’a etedetectee en fonction du risque environnemental.
Title : Essays in Development and Experimental Economics
Keywords : Experiments, Trust, Contact hypothesis, Development
Abstract : Experimental economics offers the possibility to studythe behavior of economic agents in ideal conditions, as it allowsfor the complete control of the environment of participants. Thisthesis presents results from several field experiments, as well astheir contributions to the literature. This manuscript is composed offive chapters. The first three chapters contribute to the literature onthe contact theory, a methodology used to improve intergroup rela-tions. Chapters 1 and 2 present results from field experiments, inFrance and in Senegal, while chapter 3 presents a meta-analysisof the experimental literature on the topic. The last two chapterspresent results of various experiments. Chapter 4 investigates theinfluence of providing rankings on performance, depending on thenature of the task to be performed. Chapter 5 talks about the inter-play between genetic and environmental factors in shaping risk at-titudes for fishermen in Senegal. Chapter 1 discusses a field expe-riment investigating the effects of a brief and controlled discussionon trust between disadvantaged students in Paris’ suburbs, and po-lice officers. The contact protocol is adapted from the social psy-chology literature and aims at quickly creating friendships. Resultsindicate that the contact intervention increases trust of students to-ward the specific police officers met, but it does not increase trustin the police in general. Chapter 2 analyzes an experimental pro-tocol closely related to that of chapter 1, but applied in the contextof inter-ethnic relations in Senegal. The short contact is effectiveat increasing inter-ethnic trust with the specific individuals met, butdoes not increase altruism toward the outgroup in general. Moreo-ver, the effect at the individual level evaporates within one month
of the intervention. Machine learning techniques enable to disco-ver that contact is particularly effective for older and less educa-ted participants. Chapter 3 proposes a meta-analysis of the rapidlygrowing experimental literature on the contact hypothesis. Basedon 62 outcomes from 37 research papers, the analysis revealedthree main results. First, there exists a large heterogeneity in thedefinition of a “contact”, making difficult the comparison of papers.Second, on average, contact interventions are effective, by signi-ficantly improving the perception of the outgroup. Third, machinelearning algorithms enable the study of determinants of the mosteffective contact interventions. Chapter 4 investigates the effects ofproviding rankings on performance, depending on the nature of thetask. The analysis is performed by analyzing the existing empiricalliterature, proposing a novel theoretical framework and the empiri-cal analysis of two experiments. Results indicate that the main mo-derating factor of the effects of relative performance feedback is theexistence of room for technological improvement. Chapter 5 inves-tigates the interplay between the effects of the dopamine receptorgene D4 and background risk on risk-aversion for fishermen in Nor-thern Senegal. The analysis consists in the genetic and behavioralcomparison of two populations differing in their main professionaloccupation. Results indicate that the 7R allele is associated withan increased risk-tolerance, through an additive, rather than domi-nance, effect. Moreover, the effects of the 7R allele are not driven bythe background risk, as we do not observe heterogeneous effectsdepending on the level of background risk.
Institut Polytechnique de Paris91120 Palaiseau, France